UNITED STATES
SECURITIES AND EXCHANGE COMMISSION
Washington, D.C. 20549
FORM 10-K
|
|
| ANNUAL REPORT PURSUANT TO SECTION 13 OR 15(d) |
| OF THE SECURITIES EXCHANGE ACT OF 1934. |
For the fiscal year ended December 31, 20162017
Commission File Number 001-36004
SPIRIT REALTY CAPITAL, INC.
SPIRIT REALTY, L.P.
(Exact name of registrant as specified in its charter)
|
| | | | |
| Spirit Realty Capital, Inc. | | Maryland | | 20-1676382 |
| Spirit Realty, L.P. | | Delaware | | 20-1127940 |
| | | (State or other jurisdiction of incorporation or organization) | | (I.R.S. Employer Identification Number) |
| | | 2727 North Harwood Street, Suite 300, Dallas, Texas 75201 | | (972) 476-1900 |
| | | (Address of principal executive offices; zip code) | | (Registrant’s telephone number, including area code) |
Securities registered pursuant to Section 12(b) of the Act:
|
| | | | |
| | | Title of each class: | | Name of exchange on which registered: |
| Spirit Realty Capital, Inc. | | Common Stock, $0.01 par value per share | | New York Stock Exchange |
| | 6.000% Series A Cumulative Redeemable Preferred Stock, $0.01 par value per share | | New York Stock Exchange |
| Spirit Realty, L.P. | | None | | None |
Securities registered pursuant to Section 12(g) of the Act:
|
| | |
| Spirit Realty Capital, Inc. | | None |
| Spirit Realty, L.P. | | None |
| | | |
Indicate by check mark if the registrant is a well-known seasoned issuer, as defined in Rule 405 of the Securities Act.
Spirit Realty Capital, Inc. Yes x No o Spirit Realty, L.P. Yes o No x
Indicate by check mark if the registrant is not required to file reports pursuant to Section 13 or Section 15(d) of the Act.
Spirit Realty Capital, Inc. Yes o No x Spirit Realty, L.P. Yes x No o
Indicate by check mark whether the registrant (1) has filed all reports required to be filed by Section 13 or 15(d) of the Securities Exchange Act of 1934 during the preceding 12 months (or such shorter period that the registrant was required to file such reports), and (2) has been subject to such filing requirements for the past 90 days.
Spirit Realty Capital, Inc. Yes x No o Spirit Realty, L.P. Yes o No x
Indicate by check mark whether the registrant has submitted electronically and posted on its corporate Web site, if any, every Interactive Data File required to be submitted and posted pursuant to Rule 405 of Regulation S-T (§ 232.405 of this chapter) during the preceding 12 months (or for such shorter period that the registrant was required to submit and post such files).
Spirit Realty Capital, Inc. Yes x No o Spirit Realty, L.P. Yes x No o
Indicate by check mark if disclosure of delinquent filers pursuant to Item 405 of Regulation S-K (§ 229.405 of this chapter) is not contained herein, and will not be contained, to the best of registrant’s knowledge, in definitive proxy or information statements incorporated by reference in Part III of this Form 10-K or any amendment to this Form 10-K. x
Indicate by check mark whether the registrant is a large accelerated filer, an accelerated filer, a non-accelerated filer or a smaller reporting company. See the definitions of “large accelerated filer,” “accelerated filer” and “smaller reporting company” in Rule 12b-2 of the Exchange Act.
Spirit Realty Capital, Inc.
|
| | | | | | | |
| Large accelerated filer | x | Accelerated filer | o | Non-accelerated filer | o | Smaller reporting company | o |
Spirit Realty, L.P.
|
| | | | | | | |
| Large accelerated filer | o | Accelerated filer | x | Non-accelerated filer | o | Smaller reporting company | o |
If an emerging growth company, indicate by check mark if the registrant has elected not to use the extended transition period for complying with any new or revised financial accounting standards provided pursuant to Section 13(a) of the Exchange Act.
Spirit Realty Capital, Inc. o Spirit Realty, L.P. o
Indicate by check mark whether the registrant is a shell company (as defined in Rule 12b-2 of the Exchange Act).
Spirit Realty Capital, Inc. Yes o No x Spirit Realty, L.P. Yes o No x
As of June 30, 20162017 (the last business day of the registrant’s most recently completed second fiscal quarter), the aggregate market value of the Registrant'sSpirit Realty Capital, Inc's shares of common stock, $0.01 par value, held by non-affiliates of the Registrant, was $6.1$3.4 billion based on the last reported sale price of $12.77$7.41 per share on the New York Stock Exchange on June 30, 2016.2017.
There is no public trading market for the common units of limited partnership interest of Spirit Realty, L.P. As a result, the aggregate market value of the common units of limited partnership interest held by non-affiliates of Spirit Realty, L.P. cannot be determined.
The number of outstanding shares of Spirit Realty Capital, Inc.'s common stock, $0.01 par value, as of February 21, 2017,20, 2018, was 483,599,385448,835,524 shares.
Documents Incorporated by Reference
Certain specific portions of the definitive Proxy Statement for Spirit Realty Capital, Inc.'s 20172018 Annual Meeting of Stockholders to be filed pursuant to Regulation 14A are incorporated by reference into Part III, Items 10, 11, 12, 13 and 14 of this Annual Report on Form 10-K. Only those portions of the Proxy Statement which are specifically incorporated by reference herein shall constitute a part of this Annual Report on Form 10-K.
Explanatory NotesNote
This report combines the annual reports on Form 10-K for the year ended December 31, 20162017 of Spirit Realty Capital, Inc., a Maryland corporation, and Spirit Realty, L.P., a Delaware limited partnership. Unless otherwise indicated or unless the context requires otherwise, all references in this report to “we,” “us,” “our,” or the “Company” refer to Spirit Realty Capital, Inc. together with its consolidated subsidiaries, including Spirit Realty, L.P. Unless otherwise indicated or unless the context requires otherwise, all references to the “Operating Partnership” refer to Spirit Realty, L.P. together with its consolidated subsidiaries.
Spirit General OP Holdings, LLC ("OP Holdings") is the sole general partner of the Operating Partnership. The Company is a real estate investment trust, or REIT, and the sole member of OP Holdings, as well as the special limited partner of the Operating Partnership. As sole member of the general partner of our Operating Partnership, our Company has the full, exclusive and complete responsibility for our Operating Partnership’s day-to-day management and control.
We believe combining the annual reports on Form 10-K of our Company and Operating Partnership into a single report results in the following benefits:
enhancing investors’ understanding of our Company and Operating Partnership by enabling investors to view the business as a whole, reflective of how management views and operates the business;
eliminating duplicative disclosure and providing a streamlined presentation as a substantial portion of the disclosures apply to both our Company and Operating Partnership; and
creating time and cost efficiencies by preparing one combined report in lieu of two separate reports.
There are a few differences between our Company and Operating Partnership, which are reflected in the disclosures in this report. We believe it is important to understand these differences in the context of how we operate as an interrelated, consolidated company. Our Company is a REIT, the only material assets of which are the partnership interests in our Operating Partnership. As a result, our Company does not conduct business itself, other than acting as the sole member of the general partner of our Operating Partnership, issuing equity from time to time and guaranteeing certain debt of our Operating Partnership. Our Operating Partnership holds substantially all the assets of our Company. Our Company issued convertible notes and guarantees some of the debt of our Operating Partnership, see footnoteNote 4 to the combined, consolidated financial statements herein for further discussion. Our Operating Partnership conducts the operations of the business and is structured as a partnership with no publicly traded equity. Except for net proceeds from issuance of convertible notes and equity issuances by our Company, which are generally contributed to our Operating Partnership in exchange for partnership units of our Operating Partnership, our Operating Partnership generates the capital required by our Company’s business through our Operating Partnership’s operations or our Operating Partnership’s incurrence of indebtedness.
The presentation of stockholders’ equity and partners’ capital are the main areas of difference between the consolidated financial statements of our Company and those of our Operating Partnership. The partnership units in our Operating Partnership are accounted for as partners’ capital in our Operating Partnership’s consolidated financial statements. There are no non-controlling interests in the Company or the Operating Partnership.
To help investors understand the significant differences between our Company and our Operating Partnership, this report presents the consolidated financial statements separately for our Company and our Operating Partnership. All other sections of this report, including “Selected Financial Data,” “Management’s Discussion and Analysis of Financial Condition and Results of Operations” and “Quantitative and Qualitative Disclosures About Market Risk,” are presented together for our Company and our Operating Partnership.
In order to establish that the Chief Executive Officer and the Chief Financial Officer of each entity have made the requisite certifications and that our Company and Operating Partnership are compliant with Rule 13a-15 or Rule 15d-15 of the Securities Exchange Act of 1934, or the Exchange Act, and 18 U.S.C. §1350, this report also includes separate “Item 9A. Controls and Procedures” sections and separate Exhibit 31 and 32 certifications for each of our Company and our Operating Partnership.
SPIRIT REALTY CAPITAL, INC. and SPIRIT REALTY, L.P.
INDEX
|
| | |
| PART I | | |
| Item 1. | Business | |
| Item 1A. | Risk Factors | |
| Item 1B. | Unresolved Staff Comments | |
| Item 2. | Properties | |
| Item 3. | Legal Proceedings | |
| Item 4. | Mine Safety Disclosure | |
| PART II | | |
| Item 5. | Market for Registrant’s Common Equity, Related Stockholder Matters and Issuer Purchases of Equity Securities | |
| Item 6. | Selected Financial Data | |
| Item 7. | Management’s Discussion and Analysis of Financial Condition and Results of Operations | |
| Item 7A. | Quantitative and Qualitative Disclosures About Market Risk | |
| Item 8. | Financial Statements and Supplementary Data | |
| Item 9. | Changes in and Disagreements with Accountants on Accounting and Financial Disclosure | |
| Item 9A. | Controls and Procedures As Restated | |
| Item 9B. | Other Information | |
| PART III | | |
| Item 10. | Directors, Executive Officers and Corporate Governance | |
| Item 11. | Executive Compensation | |
| Item 12. | Security Ownership of Certain Beneficial Owners and Management and Related Stockholder Matters | |
| Item 13. | Certain Relationships and Related Transactions, and Director Independence | |
| Item 14. | Principal Accountant Fees and Services | |
| PART IV | | |
| Item 15. | Exhibits, Financial Statement Schedules | |
| SIGNATURES | | |
GLOSSARY
|
| |
| Definitions: | |
| 1031 Exchange | Tax-deferred like-kind exchange of properties held for business or investment purposes, pursuant to Section 1031 of the Code |
| 2013 Credit Facility | $400.0 million secured credit facility pursuant to the credit agreement between the Operating Partnership and certain lenders dated July 17, 2013 |
2015 Credit Facility2017 Tax Legislation | $800.0 million unsecured credit facility pursuant to the Credit AgreementTax Cuts and Jobs Act |
| 2019 Notes | $402.5 million convertible notes of the Corporation due in 2019 |
| 2021 Notes | $345.0 million convertible notes of the Corporation due in 2021 |
401(k) Plan | Defined contribution retirement savings plan qualified under Section 401(k) of the Code |
| ACM | Asbestos-Containing Materials |
| ADA | Americans with Disabilities Act |
Additional Collateral Deposit | A cash reserve deposit or letter of credit in the amount of $8.0 million required pursuant to an amendment of a certain CMBS loan agreement |
| AFFO | Adjusted Funds From Operations |
| Amended Incentive Award Plan | Amended and Restated Spirit Realty Capital, Inc. and Spirit Realty, L.P. 2012 Incentive Award Plan |
| AOCL | Accumulated Other Comprehensive Loss |
| ASC | Accounting Standards Codification |
| ASU | Accounting Standards Update |
| ATM Program | At the Market equity distribution program, pursuant to which the Corporation may offer and sell registered shares of common stock from time to time |
| CMBS | Commercial Mortgage Backed Securities |
| Code | Internal Revenue Code of 1986, as amended |
| Cole II | Cole Credit Property Trust II, Inc. |
Cole II Merger | Acquisition on July 17, 2013 of Cole II by the Company, in which the Company merged with and into the Cole II legal entity |
| Collateral Pools | Pools of collateral assets that are pledged to the indenture trustee for the benefit of the noteholders and secure obligations of issuers under the Spirit Master Funding Program |
| Company | The Corporation and its consolidated subsidiaries |
| Contractual Rent | Monthly contractual cash rent and earned income from direct financing leases, excluding percentage rents, from our properties owned fee-simple or ground leased, recognized during the final month of the reporting period, adjusted to exclude amounts received from properties sold during that period and adjusted to include a full month of contractual rent for properties acquired during that period |
| Convertible Notes | The 2019 Notes and 2021 Notes, together |
| Corporation | Spirit Realty Capital, Inc., a Maryland corporation |
| CPI | Consumer Price Index |
| Credit Agreement | 2015Revolving credit facility agreement between the Operating Partnership and certain lenders dated March 31, 2015, as amended or otherwise modified from time to time |
| EBITDA | Earnings Before Interest, Taxes, Depreciation and Amortization |
| EBITDAR | Earnings Before Interest, Taxes, Depreciation, Amortization and Rent |
| EDF | Expected Default Frequency |
Excess Cash | Rent received in excess of debt service obligations |
| Exchange Act | Securities Exchange Act of 1934, as amended |
| Exchange Offer | The May 2014 exchange of the outstanding principal balance of three series of existing net-lease mortgage notes for three series of newly issued 2014 Notes |
| FASB | Financial Accounting Standards Board |
| FFO | Funds From Operations |
| Fitch | Fitch Ratings |
| GAAP | Generally Accepted Accounting Principles in the United States |
| IASB | International Accounting Standards Board |
| IFRS | International Financial Reporting Standards |
IPOIRS | Initial Public OfferingInternal Revenue Service |
| LIBOR | London Interbank Offered Rate |
|
| |
| Definitions: | |
IRS | Internal Revenue Service |
LIBOR | London Interbank Offered Rate |
Line of Credit | $40.0 million secured revolving credit facility pursuant to the loan agreement between an indirect wholly-owned subsidiary of the Corporation and a certain lender dated March 27, 2013, as amended |
| Master Trust 2013 | The net-lease mortgage securitization trust established in 2013 under the Spirit Master Funding Program |
| Master Trust 2014 | The net-lease mortgage securitization trust established in 2005 and amended and restated in 2014 under the Spirit Master Funding Program |
| Master Trust Exchange Costs | Legal, accounting and financial advisory services costs incurred in connection with the Exchange Offer |
| Master Trust Notes | The Master Trust 2013 and Master Trust 2014, together |
| Master Trust Release | Proceeds from the sale of assets securing the Master Trust Notes held in restricted accounts until a qualifying substitution is made or until used for principal reduction |
| Merger | The transactionAcquisition on July 17, 2013 of Cole II by the Company, in which the Corporation's prior legal entityCompany merged with and into the Cole II legal entity |
| Merger Exchange Ratio | Merger exchange ratio of 1.9048 |
| MGCL | Maryland General Corporation Law |
| Moody's | Moody's Investor Services |
| NAREIT | National Association of Real Estate Investment Trusts |
Normalized Rental Revenue | Total rental revenues and earned income from direct financing leases from our owned properties during the final month of the reporting period, adjusted to exclude amounts from properties sold during that period and to include a full month of rental revenues for properties acquired during that period. |
| NYSE | New York Stock Exchange |
| OP Holdings | Spirit General OP Holdings, LLC |
| Operating Partnership | Spirit Realty, L.P., a Delaware limited partnership |
PATH Act | Protecting Americans from Tax Hikes Act of 2015 |
| REIT | Real Estate Investment Trust |
Revolving Credit FacilitiesFacility | The 2013$800.0 million unsecured credit facility pursuant to the Credit Facility, the 2015 Credit Facility and Line of Credit, togetherAgreement |
| S&P | Standard & Poor's Rating Services |
| SEC | Securities and Exchange Commission |
| Securities Act | Securities Act of 1933, as amended |
| Senior Unsecured Notes | $300 million aggregate principal amount of senior notes issued in August 2016 |
| Series A Preferred Stock | 6,900,000 shares of 6.000% Cumulative Redeemable Preferred Stock issued October 3, 2017, with a liquidation preference of $25.00 per share. |
| Shopko | Specialty Retail Shops Holding Corp. and certain of its affiliates |
| SMTA | Spirit MTA REIT, a Maryland real estate investment trust |
| Spin-Off | Creation of an independent, publicly traded REIT, SMTA, through contribution of properties leased to Shopko, assets that collateralize Master Trust 2014 and potential additional assets |
| Spirit Master Funding Program | The Company's asset-backed securitization program that comprises Master Trust 2013 and Master Trust 2014 |
| Term Loan | $420.0 million senior unsecured term facility pursuant to the Term Loan Agreement |
| Term Loan Agreement | Term loan agreement between the Operating Partnership and certain lenders dated November 3, 2015, as amended or otherwise modified from time to time |
Total Debt | Principal debt outstanding before discounts, premiums or deferred financing costs |
| TRS | Taxable REIT SubsidiariesSubsidiary, a corporation, other than a REIT, in which a REIT directly or indirectly holds stock and that has made a joint election with such REIT to be treated as a taxable REIT subsidiary |
| TSR | Total Shareholder Return |
| U.S. | United States |
| Vacant | Owned properties which are not economically yielding |
Unless otherwise indicated or unless the context requires otherwise, all references to the "registrant," the "Company," "Spirit Realty Capital," "we," "us" or "our" refer to the Corporation and its consolidated subsidiaries, including the Operating Partnership. Unless otherwise indicated or unless the context requires otherwise, all references to the "Operating Partnership" refer to Spirit Realty, L.P. and its consolidated subsidiaries.
PART I
The following discussion relates to our consolidated financial statements and should be read in conjunction with the consolidated financial statements and notes thereto appearing elsewhere in this Annual Report on Form 10-K. Statements contained in Item 7. “Management’s Discussion and Analysis of Financial Condition and Results of Operations” that are not historical facts may be forward-looking statements. Such statements are subject to certain risks and uncertainties, which could cause actual results to differ materially from those projected. Some of the information presented is forward-looking in nature, including information concerning projected future occupancy rates, rental rate increases, property development timing and investment amounts. Although the information is based on our current expectations, actual results could vary from expectations stated in this report. Numerous factors will affect our actual results, some of which are beyond our control. These include the breadth and duration of the current economic environment and its impact on our tenants, the strength of commercial and industrial real estate markets, market conditions affecting tenants, competitive market conditions, interest rate levels, volatility in our stock price and capital market conditions. You are cautioned not to place undue reliance on this information, which speaks only as of the date of this report. We assume no obligation to update publicly any forward-looking information, whether as a result of new information, future events, or otherwise, except to the extent we are required to do so in connection with our ongoing requirements under federal securities laws to disclose material information. For a discussion of important risks related to our business, and related to investing in our securities, including risks that could cause actual results and events to differ materially from results and events referred to in the forward-looking information, see Item 1A. “Risk Factors - Special Note Regarding Forward-Looking Statements” and Item 7. “Management’s Discussion and Analysis of Financial Condition and Results of Operations - Liquidity and Capital Resources.” In light of these risks, uncertainties and assumptions, the forward-looking events discussed in this Annual Report on Form 10-K might not occur.
Available Information
The Corporation's principal executive offices are located at 2727 North Harwood Street, Suite 300, Dallas, Texas 75201. Our telephone number at that location is 972-476-1900. We maintain a website at www.spiritrealty.com. On the Investor Relations page of our website, we post the following filings as soon as reasonably practicable after they are electronically filed with or furnished to the SEC: our Annual Report on Form 10-K, our Quarterly Reports on Form 10-Q, our Current Reports on Form 8-K, and the Section 16 filings of our directors and officers, as well as any amendments to those reports filed or furnished pursuant to Section 13(a) or 15(d) of the Exchange Act. All such filings on our Investor Relations page of our website are available to be viewed free of charge. Also available on our website, free of charge, are our corporate governance guidelines, the charters of the nominating and corporate governance, audit and compensation committees of our boardBoard of directorsDirectors and our code of business conduct and ethics (which applies to all directors and employees, including our principal executive officer, principal financial officer and principal accounting officer).
Information contained on or hyperlinked from our website is not incorporated by reference into and should not be considered part of this Annual Report on Form 10-K or our other filings with the SEC. A copy of this Annual Report on Form 10-K is available without charge upon written request to: Investor Relations, Spirit Realty Capital, Inc., 2727 North Harwood Street, Suite 300, Dallas, Texas 75201. All reports we file with the SEC are available free of charge on the SEC's Web sitewebsite at www.sec.gov. In addition, the public may read and copy materials we file with the SEC at the SEC’s public reference room located at 100 F Street, N.E., Washington, D.C. 20549. Shares of our common stock are traded on the NYSE under the symbol “SRC.”
Item 1. Business
The CompanyTHE COMPANY
The Corporation is a NYSE listed company under the symbol "SRC." We are a self-administered and self-managed REIT with in-house capabilities, including acquisition, portfolio management, asset management, investment, credit, research, real estate research, legal, finance, IT and accounting and capital markets.functions. We primarily invest in single-tenant, operationally essential real estate throughout the U.S., which is generally acquired through strategic sale-leaseback transactions and subsequently leased on a long-term, triple-net basis to high-quality tenants with business operations within predominantly retail, but also office and industrial property types.
As of December 31, 2016,2017, our undepreciated gross investment in real estate and loans totaled approximately $8.2$7.9 billion, representing investments in 2,6152,480 properties, including properties securing our mortgage loans. Of this amount,
99.2% 99.0% consisted of our gross investment in real estate, representing ownership of 2,5412,392 properties, and the remaining 0.8%1.0% consisted primarily of commercial mortgage loans receivable secured by 7488 real properties.
As of December 31, 2016,2017, our owned properties were approximately 98.2%99.2% occupied (based on number of economically yielding properties), and our leases had a weighted average non-cancelable remaining lease term (based on Normalized Rental Revenue)Contractual Rent) of approximately 10.710.0 years. Our leases are generally long-term, with non-cancelable initial terms of 15 to 20 years and tenant renewal options for additional terms. As of December 31, 2016,2017, approximately 89% of our single-tenant leases (based on Normalized Rental Revenue)Contractual Rent) provided for increases in future annual base rent. See Item 2. "Properties - Our Real Estate Investment Portfolio" for further information on our properties and tenants.
Our operations are carried out through the Operating Partnership. OP Holdings, one of our wholly-owned subsidiaries, is the sole general partner and owns approximately 1.0%1% of the Operating Partnership. We and one of our wholly-owned subsidiaries are the only limited partners and together own the remaining 99.0%99% of the Operating Partnership.
Although the Operating Partnership is wholly-owned by us, in the future, we may issue partnership interests in the Operating Partnership to third parties in exchange for assets owned by such third parties. In general, any partnership interests of the Operating Partnership issued to third parties would be exchangeable for cash or, at our election, shares of our common stock at specified ratios set when partnership interests in the Operating Partnership are issued.
As of December 31, 2016,2017, we had 8487 employees, as compared to 7184 employees as of December 31, 2015.2016. None of these employees are represented by a labor union.
History
We began operations through a predecessor legal entity in 2003. We became a public company in December 2004 and were subsequently taken private in August 2007 by a consortium of private investors. On September 25, 2012, we completed our IPOinitial public offering of 33.35 million shares of common stock (including shares issued on October 1, 2012 pursuant to the underwriters’ option to purchase additional shares).
On July 17, 2013, we completed the acquisition of Cole II through the Merger. Our boardBoard of directorsDirectors (including two additional members designated by Cole II) and executive team managed the surviving entity, which was renamed Spirit Realty Capital, Inc. and began trading on the NYSE under the symbol "SRC." Cole II was the "legal acquirer" in the Merger for certain legal and regulatory matters and the Corporation was deemed the "accounting acquirer" in the Merger for accounting and financial reporting purposes, including the financial information set forth herein.
Business and Growth StrategiesBUSINESS AND GROWTH STRATEGIES
Our objective is to maximize stockholder value by seeking superior risk-adjusted returns with an emphasis on stable rental revenue, primarily by investing in and managing a portfolio of single-tenant, operationally essential retail real estate throughout the U.S. that is generally acquired through strategic sale-leaseback transactions and subsequently leased on a long-term, triple-net basis. We generate revenue primarily by leasing our properties to our tenants. See Item 2. "Properties" for property information and Item 6. "Selected Financial Data" for additional financial and asset information.
Single-tenant, operationally essential real estate consists of properties that are generally free-standing, commercial real estate facilities where our tenants conduct activities essential to the generation of their sales and profits. Under a triple-net lease, the tenant is typically responsible for all improvements and is contractually obligated to pay all property operating expenses, such as real estate taxes, insurance premiums and repair and maintenance costs. In support of our primary business of owning and leasing real estate, we have also strategically originated or acquired long-term, commercial mortgage and other loans. We view our operations as one reporting segment consisting of net leasing operations. We intend to pursue our objective through the following business and growth strategies:
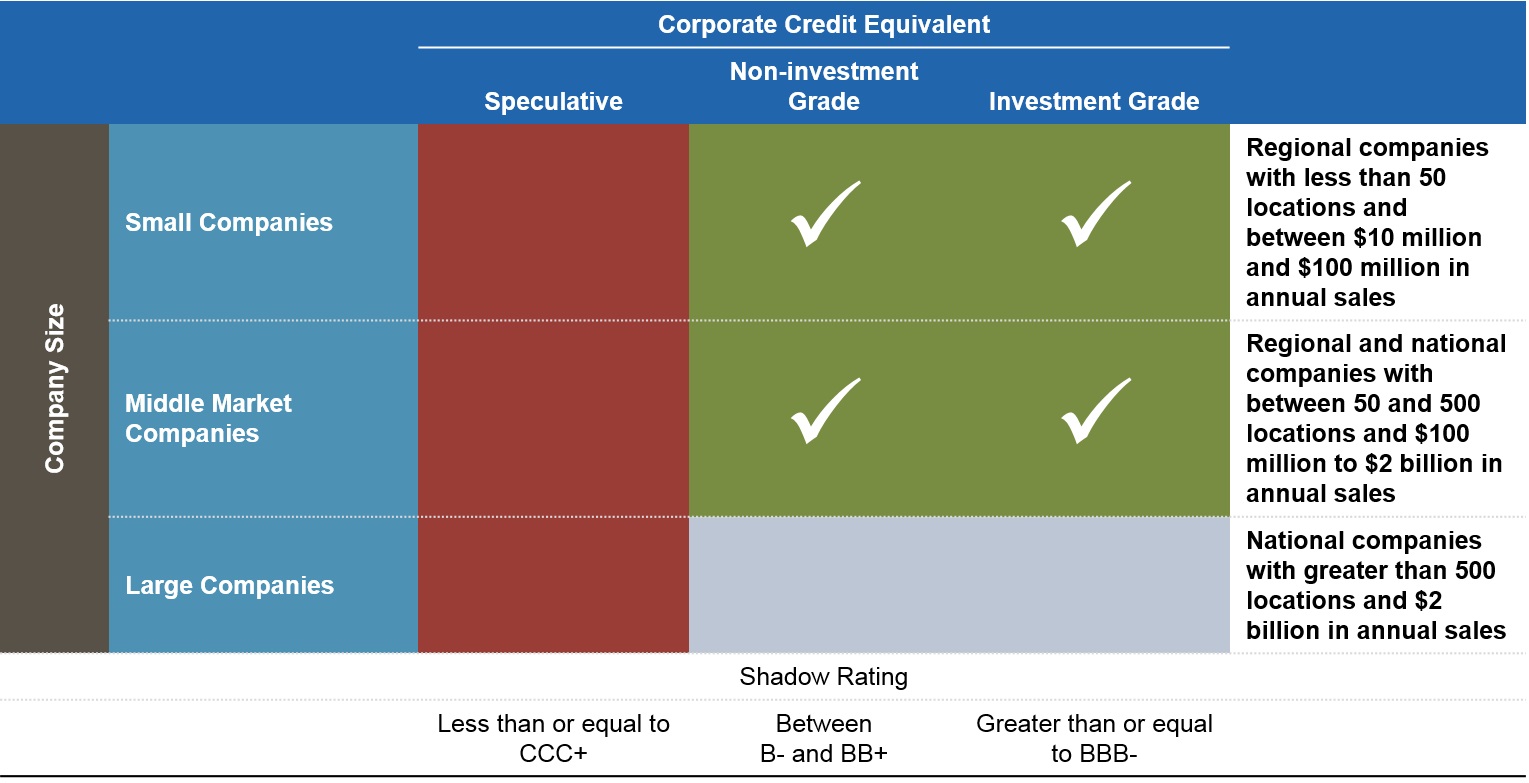
Focus on SmallIndustries Identified as Desirable in the Spirit Heat Map
Our investment strategy is based on increasing our exposure to industries we determine to be attractive based on our proprietary Spirit Heat Map. The Spirit Heat Map is used to analyze tenant industries across Porter’s Five Forces and Middle Market Companies. We primarily focus on investing in propertiespotential causes of technological disruption to identify tenant industries that we net leasebelieve to smallhave good fundamentals for future performance. The Spirit Heat Map is updated regularly to factor for changes in business and middle market companies withconditions, changes in technology and other trends. Desirable tenants have attractive credit characteristics and stable operating histories, but that may not carry a credit rating from a rating agency.histories. This strategy offers us the opportunity to achieve superior risk-adjusted returns when coupled with our intensive credit and real estate analysis, lease structuring and ongoing portfolio management. Small and middle market companies are often willing to enter into leases with structures and terms we consider attractive (such as master leases, leases with rental escalations and leases that require ongoing tenant financial reporting) and that we believe increase the security of rental payments. We may also
selectively acquire properties leased to large companies where we believe that we can achieve superior risk-adjusted returns.
The following chart highlights the tenants that we target based on company size and corporate credit equivalent:
Structure and Manage Our Portfolio Using Our Developed Underwriting and Risk Management Processes.Processes
We seek to maintain the stability of our rental revenue and the long-term return on our investments by using our developed underwriting and risk management processes to structure and manage our portfolio. In particular, our underwriting and risk management processes emphasize the following:
| |
| ◦ | Leases for Operationally Essential Real Estate with Relatively Long Terms. We seek to own properties that are operationally essential to our tenants, thereby reducing the risk that the tenant would choose not to renew an expiring lease or reject a lease in bankruptcy. In addition, we seek to enter into leases with relatively long terms, typically with non-cancelable initial terms of 15 to 20 years and tenant renewal options for additional terms with attractive rent escalation provisions. |
| |
| ◦ | Spirit Property Ranking Model. We use our proprietary ranking model annually to rank all properties in our portfolio, across twelve factors and weightings consisting of real estate quality scores, lease structure quality and credit underwriting criteria. The Spirit Property Rank Model is a key component of both the acquisition and disposition process as well as standard asset management activities. |
| |
| ◦ | Leases with a Master Lease Structure. Where appropriate, we seek to enter into master leases whereby we lease multiple properties to a single tenant on an “all or none” basis. In a master lease structure, a tenant is responsible for a single lease payment relating to the entire portfolio of leased properties, as opposed to separate lease payments relating to each individually leased properties.property. The master lease structure prevents a tenant from “cherry picking” locations, where it unilaterally gives up underperforming properties while maintaining its leasehold interest in well-performing properties. As of December 31, 2016,2017, we had 147131 active master leases with portfolios of leased properties ranging from 2 to 182172 and a weighted average non-cancelable remaining lease term (based on Normalized Rental Revenues)Contractual Rent) of 13.712.7 years. Master lease revenues contributed approximately 45% of our Normalized Rental Revenue.Contractual Rent. Our largest master lease, with Shopko, consisting of 2359 properties, contributed 2.9%6.8% of our Normalized Rental Revenue,Contractual Rent, and our smallest master lease, consisting of 5two properties, contributed less than 0.04%0.1% of our Normalized Rental RevenueContractual Rent for the month ended December 31, 2016.2017. As of December 31, 2016,2017, the majority of our master leases include between 2 and 10 properties. |
| |
| ◦ | Active Management and Monitoring of Risks Related to Our Investments. When monitoring existing investments or evaluating new investments, we typically consider two broad categories of risk: (1) tenant financial distress risk;risk and (2) lease renewal risk. We seek to measure these risks through various processes, including the use of a credit modeling product that we license from Moody’s Analytics that estimates the performance of the leased properties relative to rental payments due under the leases and a review of current market data and our historical recovery rates on re-leased properties and property dispositions. Our underwriting and risk management processes are designed to structure new investments and manage existing investments to address and mitigate each of the above risks and preserve the long-term return on our invested capital. Since our inception, our occupancy has never been below 96.1% (based on number of economically yielding properties), despite the economic downturn of 2008 through 2010. |
and manage existing investments to address and mitigate each of the above risks and preserve the long-term return on our invested capital. Since our inception, our occupancy has never been below 96.1% (based on number of properties), despite the economic downturn of 2008 through 2010.
| |
| ◦ | Portfolio Diversification. We monitor and manage the diversification of our real estate investment portfolio in order to reduce the risks associated with adverse developments affecting a particular tenant, property, industry or region. Our strategy emphasizes a portfolio that (1) derives no more than 10% of its annual rent from any single tenant and no more than 1.5%2.0% of its annual rent from any single property, (2) is leased to tenants operating in various industries and (3) is located across the U.S. without significant geographic concentration. While we consider the foregoing when making investments, we have made, and may make investments in the future that do not meet one or more of these criteria, and we may make additional investments that do not meet one or more of these criteria if we believe the opportunity is sufficiently attractive. |
Enhance Our Portfolio through Contractual Rental Growth.Growth
Approximately 89%89.2% of our single-tenant properties (based on Normalized Rental Revenue)Contractual Rent) contain contractual provisions that increase the rental revenue over the term of the lease. Generally, our rent escalators increase rent at specified
dates by: (1) a fixed amount; or (2) the lesser of (a) 1 to 1.252 times any increase in the CPI over a specified period, or (b) a fixed percentage, typically 1% to 2% per year.or (c) a fixed schedule.
Grow Our Portfolio through Selective Acquisitions.Acquisitions
We selectively make acquisitions that we believe will contribute to our business objective. We believe there will be ample acquisition opportunities in the single-tenant market fitting our underwriting and acquisition criteria, which may include improving our portfolio’s tenant, industry and geographic diversification, among other rationale. Acquisitions of such properties or portfolios may be subject to existing indebtedness or to new indebtedness which may be incurred in connection with acquiring or refinancing these investments.
Deleverage Our Portfolio.Portfolio
A significant amount of our secured debt is partially amortizing, and its principal amount will be reduced prior to the balloon payments due at maturity. Contractual amortization payments are scheduled to reduce our outstanding principal amount of indebtedness by $182.3$199.9 million prior to January 1, 2022.2023. We may selectively reduce our indebtedness using cash from operations in excess of our distributions or proceeds from asset dispositions and /or equity offerings. We may also strategically replace or refinance certain indebtedness with proceeds from new borrowings that represent a more attractive cost of capital. We believe contractual rent growth, selective growth through acquisitions and the ongoing deleveraging of our portfolio will contribute to our cash available for distributions.
Dispose of Select Assets.Assets
We typically retain and manage real estate assets that fit within our investment criteria, which criteria are subject to change without notice to or vote by our stockholders. Additionally, management may elect to dispose of assets when it believes appropriate in view of our business objective, considering criteria including, but not limited to, the Spirit Heat Map, the Spirit Property Rank, tenant concentration, tenant credit quality, unit financial performance, local market conditions and lease rates, associated indebtedness, asset location, tenant operation type (e.g., industry, sector, or concept/brand), and asset zoning, as well as potential capital appreciation, potential uses of proceeds and tax considerations, among others.
Financing StrategyFINANCING STRATEGY
Our long-term financing strategy is to maintain a leverage profile that creates operational flexibility and generates superior risk-adjusted returns for our stockholders. We finance our operations and investments using a variety of methods, including available unrestricted cash balances, property operating revenue, proceeds from property dispositions, available borrowings under our 2015Revolving Credit Facility and Term Loan, common and preferred stock issuances, and debt securities issuances, including mortgage indebtedness and senior unsecured debt. We determine the amount of equity and debt financing to be used when acquiring an asset by evaluating our cost of equity capital, terms available in the credit markets (such as interest rate, repayment provisions and maturity) and our assessment of the particular asset’s risk.
We may issue common stock when we believe that our share price is at a level that allows the offering proceeds to be accretively invested into additional properties, to permanently finance properties that were financed by our Revolving Credit FacilitiesFacility or Term Loan, or to repay outstanding debt at or before maturity.
In November 2016,September 2017, we filed a shelf registration statement with the SEC, which became immediately effective upon filing.filing and will remain effective for a term of three years with an expiration in September 2020. Under this shelf registration statement, we may offer shares of our common or preferred stock or debt securities from time to time in amounts,
at prices and on terms to be announced when and if such shares are offered. The specifics of any future offerings, along with the use of proceeds from any such offerings, will be described in detail in a prospectus supplement or other offering materials at the time of such offerings.
Historically, a significant portion of our debt has consisted of long-term borrowings secured by specific real estate assets or, more typically, pools of real estate assets. We have utilized our asset-backed securitization platform to raise capital through the issuance of non-recourse net-lease mortgage notes collateralized by commercial real estate, net-leases and mortgage loans under the Spirit Master Funding Program. In addition, we have issued senior unsecured debt securities and have obtained other senior unsecured debt at the Operating Partnership level. To the extent practicable, we expect to maintain a well-balanced debt profile with manageable and balanced maturities.
We expect to fund our operating expenses and other short-term liquidity requirements, including property acquisitions, payment of principal and interest on our outstanding indebtedness, property improvements, re-leasing costs, and cash distributions to common and preferred stockholders, primarily through cash provided by operating activities, borrowings under our available 2015Revolving Credit Facility and Term Loan and occasionallyperiodically through issuances of common stock and entering into secured and unsecured debt agreements.public securities.
We anticipate that we will continue to use a number of different sources to finance our acquisitions and operations going forward; however, we cannot assure you that we will have access to the capital and credit markets at times and at terms that are acceptable to us.
Recent DevelopmentsRECENT DEVELOPMENTS
Financing Activities
2015 Credit Facility
On April 27, 2016, the Company expanded the borrowing capacity under the 2015 Credit Facility from $600.0 million to $800.0 million by partially exercising the accordion feature under the terms of the Credit Agreement. The 2015 Credit Facility also includes a swing-line loan and letters of credit, which reduce availability under the 2015 Credit Facility on a dollar-for-dollar basis. In April 2016, the Corporation received a first time rating of BBB- from Fitch and was upgraded to a BBB- corporate issuer rating by S&P, allowing the Operating Partnership to elect to change the interest rate grid from leverage based pricing to credit based pricing. Under credit based pricing, the 2015 Credit Facility bears interest at a rate equal to LIBOR plus 0.875% to 1.55% per annum or a specified base rate plus 0.0% to 0.55% and requires a facility fee in an amount equal to the aggregate revolving credit commitments (whether or not utilized) multiplied by a rate equal to 0.125% to 0.30% per annum, in each case depending on the Corporation's credit rating.
Term Loan
In April 2016, the Corporation received a first time rating of BBB- from Fitch and was updated to a BBB- corporate issuer rating by S&P, allowing the Operating Partnership to elect to change the interest rate grid from leverage based pricing to credit based pricing. Under credit rating based pricing, borrowings bear interest at a rate equal to LIBOR plus 0.90% to 1.75% per annum or a specified base rate plus 0.0% to 0.75% per annum, in each case depending on the Corporation’s credit rating. On December 19, 2016, the Company increased the term facility from $370.0 million to $420.0 million.
Senior Unsecured Notes
In August 2016,The Company filed a registration statement with the Operating Partnership completed aSEC to exchange the private placement ofSenior Unsecured Notes for registered Senior Unsecured Notes with substantially identical terms, which became effective April 14, 2017. All $300.0 million aggregate principal amount of senior notes through a Rule 144A offering with registration rights, which are guaranteed by the Corporation. Theprivate Senior Unsecured Notes were issued at 99.378% of their principal amount, resultingtendered in net proceeds of $296.2 million, after deducting transaction fees and expenses. Thethe exchange for registered Senior Unsecured Notes accrue interest at a rate of 4.450% per year, payable on March 15 and September 15 of each year, until the maturity date of September 15, 2026.Notes.
Issuance of CommonPreferred Stock
In April 2016,October 2017, the CorporationCompany completed an underwritten public offering of 34.5 million6,900,000 shares of its common stock at $11.15 per share,6.000% Series A Preferred Stock, including 4.5 million900,000 shares issuedsold pursuant to the underwriter’sunderwriter's option to purchase additional shares. Gross proceeds raised were approximately $384.7 million and$172.5 million; net proceeds were approximately $368.9$166.2 million after deducting underwriter discounts and offering costs paid by the Corporation.Company. The net proceeds from the offering were initially used to reduce outstanding debt and for general operating purposes of the Company.
Master Trust 2014 Notes
In December 2017, the existing issuers under Master Trust 2014, collectively as co-issuers, completed the issuance of $674.4 million aggregate principal amount of net-lease mortgage notes comprised of $542.4 million of 4.36% amortizing notes and $132.0 million of 6.35% interest-only notes, both expected to be repaid in December 2022. The Operating Partnership retained $27.1 million in aggregate principal amount of Class A Notes and $6.6 million in aggregate principal amount of Class B Notes to satisfy its regulatory risk retention obligations. Net proceeds from the sale of the notes were initially used for general corporate purposes, including repayment of borrowings under its Revolving Credit Facility and Term Loan.
See Item 7. “Management’s Discussion and Analysis of Financial Condition and Results of Operations - Liquidity and Capital Resources - Description of Certain Debt” for further information on our debt and equity financings.
Company Spin-Off
On August 3, 2017, we announced a proposed Spin-Off of almost all of our interest in our properties leased to Shopko, assets that collateralize Master Trust 2014 and other additional assets into an independent, publicly traded REIT, Spirit MTA REIT, or SMTA. Pursuant to the plan, if the Spin-Off is completed, our stockholders would receive a distribution of common shares of beneficial interest issued by SMTA. The distribution will be treated as a taxable distribution to Spirit stockholders. The Spin-Off is subject to certain conditions, including declaration by the U.S. Securities and Exchange Commission that SMTA's registration statement on Form 10 is effective, customary third party consents, and final approval and declaration of the distribution by our Board of Directors. Such conditions and other unforeseen developments, including in the debt or equity markets or general market conditions, could delay or prevent the Spin-Off or cause the Spin-Off to occur on terms or conditions that are less favorable and/or different than those described herein. The transaction is expected to be completed in the first half of 2018. We may, at any time and for any reason until the proposed transaction is complete, abandon the Spin-Off or modify or change its terms, including the assets we plan to contribution to SMTA.
Real Estate Portfolio Activities
Tenant Concentration
Shopko is our most significant tenant, representing 7.7% and 8.2% of our Normalized Rental RevenueContractual Rent for the month ended December 31, 2016.2017and December 31, 2016, respectively. Shopko leases 11497 properties under 13three separate master
leases and two properties under individual groundsingle site leases with four indirect wholly-owned subsidiaries of ours. We took a number of steps during 2015 and 2014 to reduce the tenant concentration of Shopko assets below 10%, which we accomplished during the third quarter of 2015. We continue to take steps to decrease our concentration of Shopko assets as we grow our existing portfolio base and continue to effectthrough strategic dispositions.
During the month ended December 31, 2016,2017, no other tenant exceeded 3.0%5.0% of our Normalized Rental Revenue,Contractual Rent, and no one single property contributed more than 1.5%2.0% of our Normalized Rental Revenue.Contractual Rent. See Item 2. “Properties - Our Real Estate Investment Portfolio" for further information on our ten largest tenants and the composition of our tenant base.
AcquisitionAcquisitions and Dispositions
During the year ended December 31, 2016,2017, we purchased 26939 properties, representing an aggregate gross investment of $704.9$323.0 million, which includes $20.5$42.6 million in revenue producing follow-on investments in existing properties. The properties acquired had a weighted average lease term of 15.012.0 years. During the same period, we sold 213192 properties for $584.9$551.2 million in gross sales proceeds. See Note 3 to our Consolidated Financial Statementsconsolidated financial statements included in this Annual Report on Form 10-K for additional discussion of our investments.
Restatement and Remediation
In October 2016, we identified a deficiency in our internal control over financial reporting, which was considered to be a material weakness and led to the restatement of our audited consolidated financial statements for the year ended December 31, 2015 and our interim unaudited consolidated financial statements for the quarters ended March 31, 2015, June 30, 2015, September 30, 2015, March 31, 2016 and June 30, 2016. Management has concluded that the material weakness disclosed in the Company's Annual Report on Form 10-K/A, as amended, for the fiscal year ended December 31, 2015, has been fully remediated and that the Company's disclosure controls and procedures and internal control over financial reporting were effective at December 31, 2016, as discussed in detail in Item 9A. Controls and Procedures.
CompetitionCOMPETITION
We face competition for acquisitions from investors, including traded and non-traded public REITs, and private equity and institutional investment funds, some of which have greater financial resources than we do, a greater ability to borrow funds to acquire properties and the ability to accept more risk than we can prudently manage. This competition may increase the demand for the types of properties in which we typically invest and, therefore, reduce the number of suitable acquisition opportunities available to us and increase the prices paid for such. This competition will increase if investments in real estate become more attractive relative to other forms of investment.
As a landlord, we compete in the multi-billion dollar commercial real estate market with numerous developers and owners of properties, many of which own properties similar to ours in the same markets in which our properties are located. In operating and managing our portfolio, we compete for tenants based on a number of factors, including location, rental rates and flexibility. Some of our competitors have greater economies of scale, have lower cost of capital, have access to more resources and have greater name recognition than we do. If our competitors offer space at rental rates below current market rates or below the rental rates we currently charge our tenants, we may lose our tenants or prospective tenants and we may be pressured to reduce our rental rates or to offer substantial rent abatements, tenant improvement allowances, early termination rights or below-market renewal options in order to retain tenants when our leases expire.
RegulationREGULATION
General
Our properties are subject to various covenants, laws, ordinances and regulations, including regulations relating to common areas and fire and safety requirements. We believe that each of our properties has the necessary permits and approvals.
Americans With Disabilities Act
Pursuant to the ADA, our properties are required to meet federal requirements related to access and use by persons with disabilities. Compliance with the ADA, as well as a number of additional federal, state and local laws and regulations, may require modifications to properties we currently own and any properties we purchase, or may restrict renovations of those properties. Noncompliance with these laws or regulations could result in the imposition of fines or an award of damages to private litigants, as well as the incurrence of the costs of making modifications to attain compliance, and future legislation could impose additional financial obligations or restrictions on our properties. Although our tenants are generally responsible for all maintenance and repair costs pursuant to triple-net leases, including compliance with the ADA and other similar laws or regulations, we could be held liable as the owner of the property for a failure of one of our tenants to comply with such laws or regulations.
Environmental Matters
Federal, state and local environmental laws and regulations regulate, and impose liability for, releases of hazardous or toxic substances into the environment. Under various of these laws and regulations, a current or previous owner, operator or tenant of real estate may be required to investigate and clean up hazardous or toxic substances, hazardous wastes or petroleum product releases or threats of releases at the property, and may be held liable to a government entity or to third parties for property damage and for investigation, clean-up and monitoring costs incurred by those parties in connection with actual or threatened contamination. These laws typically impose clean-up responsibility and
liability without regard to fault, or whether or not the owner, operator or tenant knew of or caused the presence of the contamination. The liability under these laws may be joint and several for the full amount of the investigation, clean-up and monitoring costs incurred or to be incurred or actions to be undertaken, although a party held jointly and severally liable may seek contributions from other identified, solvent, responsible parties for their fair share toward these costs. These costs may be substantial, and can exceed the value of the property. The presence of contamination, or the failure to properly remediate contamination, on a property may adversely affect the ability of the owner, operator or tenant to sell or rent that property or to borrow using the property as collateral and may adversely impact our investment in that property.
Some of our properties contain, have contained, or are adjacent to or near other properties that have contained or currently contain storage tanks for the storage of petroleum products or other hazardous or toxic substances. Similarly, some of our properties are or were used for commercial or industrial purposes that involve or involved the use of petroleum products or other hazardous or toxic substances, or are adjacent to or near properties that have been or are used for similar commercial or industrial purposes. These operations create a potential for the release of petroleum products or other hazardous or toxic substances, and we could potentially be required to pay to clean up any contamination. In addition, strict environmental laws regulate a variety of activities that can occur on a property, including the storage of petroleum products or other hazardous or toxic substances, air emissions and water discharges. Such laws may impose fines or penalties for violations. As a result of the foregoing, we could be materially and adversely affected.
Environmental laws also govern the presence, maintenance and removal of ACM. Federal regulations require building owners and those exercising control over a building’s management to identify and warn, through signs and labels, of potential hazards posed by workplace exposure to installed ACM in their building. The regulations also have employee training, record keeping and due diligence requirements pertaining to ACM. Significant fines can be assessed for violation of these regulations. As a result of these regulations, building owners and those exercising control over a building’s management may be subject to an increased risk of personal injury lawsuits by workers and others exposed to ACM. The regulations may affect the value of a building containing ACM in which we have invested. Federal, state and local laws and regulations also govern the removal, encapsulation, disturbance, handling and/or disposal of ACM when those materials are in poor condition or in the event of construction, remodeling, renovation or demolition of a building. These laws may impose liability for improper handling or a release into the environment of ACM and may provide for fines to, and for third parties to seek recovery from, owners or operators of real properties for personal injury or improper work exposure associated with ACM.
When excessive moisture accumulates in buildings or on building materials, mold growth may occur, particularly if the moisture problem remains undiscovered or is not addressed over a period of time. Some molds may produce airborne toxins or irritants. Indoor air quality issues can also stem from inadequate ventilation, chemical contamination from indoor or outdoor sources, and other biological contaminants such as pollen, viruses and bacteria. Indoor exposure to airborne toxins or irritants above certain levels can be alleged to cause a variety of adverse health effects and symptoms, including allergic or other reactions. As a result, the presence of significant mold or other airborne contaminants at any of our properties could require us to undertake a costly remediation program to contain or remove the mold or other airborne contaminants from the affected property or increase indoor ventilation. In addition, the presence of significant mold or other airborne contaminants could expose us to liability from our tenants, employees of our tenants or others if property damage or personal injury occurs. We are not presently aware of any material adverse indoor air quality issues at our properties that have not been previously addressed or remediated by us.
Before completing any property acquisition, we obtain environmental assessments in order to identify potential environmental concerns at the property. These assessments are carried out in accordance with the Standard Practice for Environmental Site Assessments (ASTM Practice E 1527-05) as set by ASTM International, formerly known as the American Society for Testing and Materials, and generally include a physical site inspection, a review of relevant federal, state and local environmental and health agency database records, one or more interviews with appropriate site-related personnel, review of the property’s chain of title and review of historical aerial photographs and other information on past uses of the property. These assessments are limited in scope, however, if recommended in the initial assessments, we may undertake additional assessments such as soil and/or groundwater samplings or other limited subsurface investigations and ACM or mold surveys to test for substances of concern. A prior owner or operator of a property or historic operations at our properties may have created a material environmental condition that is not known to us or the independent consultants preparing the site assessments. Material environmental conditions may have arisen after the review was completed or may arise in the future, and future laws, ordinances or regulations may impose material additional environmental liability. If environmental concerns are not satisfactorily resolved in any initial or additional assessments, we may obtain environment insurance policies to insure against potential environmental risk or loss depending on the type of property, the availability and cost of the insurance and various other factors we
deem relevant (i.e., an environmental occurrence affects one of our properties where our lessee may not have the financial capability to honor its indemnification obligations to us).
Generally, our leases provide that the lessee will indemnify us for any loss or expense we incur as a result of the presence, use or release of hazardous materials on our property. However, our ultimate liability for environmental conditions may exceed the policy limits on any environmental insurance policies we obtain, if any. If we are unable to enforce the indemnification obligations of our lessees or if the amount of environmental insurance we carry is inadequate, our results of operations would be adversely affected.
InsuranceINSURANCE
Our tenants are generally required to maintain liability and property insurance coverage for the properties they lease from us pursuant to triple-net leases. Under such leases, our tenants are generally required to name us (and any of our lenders that have a mortgage on the property leased by the tenant) as additional insureds on their liability policies and additional named insured and/or loss payee (or mortgagee, in the case of our lenders) on their property policies. Tenants are required to maintain casualty coverage and most carry limits at 100% of replacement cost. Depending on the location of the property, losses of a catastrophic nature, such as those caused by earthquakes and floods, may be covered by insurance policies that are held by our tenant with limitations such as large deductibles or co-payments that a tenant may not be able to meet. In addition, losses of a catastrophic nature, such as those caused by wind/hail, hurricanes, terrorism or acts of war, may be uninsurable or not economically insurable. In the event there is damage to our properties that is not covered by insurance and such properties are subject to recourse indebtedness, we will continue to be liable for the indebtedness, even if these properties are irreparably damaged. See Item 1A. “Risk Factors - Risks Related to Our Business and Properties - Insurance on our properties may not adequately cover all losses and uninsured losses could materially and adversely affect us.”
In addition to being a co-insuredgenerally named as additional insureds on our tenants’ liability policies, we separately maintain commercial general liability coverage with per location limits of $1.0 million for each occurrence and $2.0 million general aggregate, and no policy maximum.aggregate. We also maintain primary property coverage on (i) all unleased properties, (ii) all properties for which such coverage is not required to be carried by a tenant and (iii) all properties for which we obtain such coverage but the costs of which are reimbursed by tenants. In addition, we maintain excess property coverage on all remaining properties and other property coverage as may be required by our lenders.
Item 1A. Risk Factors
Special Note Regarding Forward-Looking StatementsSPECIAL NOTE REGARDING FORWARD-LOOKING STATEMENTS
This Annual Report on Form 10-K contains forward-looking statements within the meaning of Section 27A of the federal securities laws. In particular, statements pertaining to our businessSecurities Act and growth strategies, investment, financing and leasing activities and trends in our business, including trends inSection 21E of the market for long-term, triple-net leases of freestanding, single-tenant properties, contain forward-looking statements.Exchange Act. When used in this Annual Report on Form 10-K, the words “estimate,” “anticipate,” “expect,” “believe,” “intend,” “may,” “will,” “should,” “seek,” “approximately” or “plan,” or the negative of these words and phrases or similar words or phrases whichthat are predictions of or indicate future events or trends and which do not relate solely to historical matters are intended to identify forward-looking statements. You can also identify forward-looking statements by discussions of strategy, plans or intentions of management.
Forward-looking statements involve numerous risks and uncertainties and you should not rely on them as predictions of future events. Forward-looking statements depend on assumptions, data or methods which may be incorrect or imprecise and we may not be able to realize them. We do not guarantee that the transactions and events described will happen as described (or that they will happen at all).
The following risks and uncertainties, among others, could cause actual results and future events to differ materially from those set forth or contemplated in the forward-looking statements:
industry and economic conditions;
volatility and uncertainty in the financial markets, including potential fluctuations in the CPI;
our success in implementing our business strategy and our ability to identify, underwrite, finance, consummate, integrate and manage diversifying acquisitions or investments;
the financial performance of our traditional retail tenants and the demand for traditional retail space, particularly with respect to challenges being experienced by general merchandise retailers;
our ability to diversify our tenant base and reduce the concentration of our significant tenant;
the nature and extent of future competition;
increases in our costs of borrowing as a result of changes in interest rates and other factors;
our ability to access debt and equity capital markets;
our ability to pay down, refinance, restructure and/or extend our indebtedness as it becomes due;
our ability and willingness to renew our leases upon expiration and to reposition our properties on the same or better terms upon expiration in the event such properties are not renewed by tenants or we exercise our rights to replace existing tenants upon default;
the impact of any financial, accounting, legal or regulatory issues or litigation that may affect us or our major tenants;
our ability to manage our expanded operations;
our ability and willingness to maintain our qualification as a REIT;
uncertainties as to the completion and timing of our proposed Spin-Off, and the impact of the Spin-Off on our business; and
other risks inherent in the real estate business, including tenant defaults, potential liability relating to environmental matters, illiquidity of real estate investments and potential damages from natural disasters.
You are cautioned not to place undue reliance on forward-looking statements, which speak only as of the date of this Annual Report on Form 10-K. While forward-looking statements reflect our good faith beliefs, they are not guarantees of future performance. We disclaim any obligation to publicly update or revise any forward-looking statement to reflect changes in underlying assumptions or factors, new information, data or methods, future events or other changes, except as required by law.
Set forth below are some (but not all) of the risk factors that could adversely affect our business and financial performance. Because we operate in a highly competitive and rapidly changing environment, new risk factors emerge from time to time, and it is not possible for management to predict all such risk factors, nor can management assess the impact of all such risk factors on our business or the extent to which any factor, or combination of factors, may cause actual results to differ materially from those contained in any forward-looking statements. Given these risks and uncertainties, investors should not place undue reliance on forward-looking statements as a prediction of actual results.
Risks Related to Our Business and PropertiesRISKS RELATED TO OUR BUSINESS AND PROPERTIES
Risks related to commercial real estate ownership could reduce the value of our properties.
Our core business is the ownership of real estate that is leased to retail, service and distribution companies on a triple-net basis. Accordingly, our performance is subject to risks inherent to the ownership of commercial real estate, including:
inability to collect rent from tenants due to financial hardship, including bankruptcy;
changes in local real estate markets resulting in the lack of availability or demand for single-tenant retail space;
changes in consumer trends and preferences that reduce the demand for products/services of our tenants;
inability to lease or sell properties upon expiration or termination of existing leases;
environmental risks related to the presence of hazardous or toxic substances or materials on our properties;
subjectivity of real estate valuations and changes in such valuations over time;
illiquid nature of real estate compared to most other financial assets;
changes in laws and regulations, including those governing real estate usage and zoning;
changes in interest rates and the availability of financing; and
changes in the general economic and business climate.
The occurrence of any of the risks described above may cause the value of our real estate to decline, which could materially and adversely affect us.
Credit and capital market conditions may adversely affect our access to and/or the cost of capital.
Periods of volatility in the credit and capital markets negatively affect the amounts, sources and cost of capital available to us. We primarily use external financing to fund acquisitions and to refinance indebtedness as it matures. If sufficient sources of external financing are not available to us on cost effective terms, we could be forced to limit our acquisition activity and/or to take other actions to fund our business activities and repayment of debt, such as selling assets. To the extent that we access capital at a higher cost (reflected in higher interest rates for debt financing or lower stock price for equity financing), our acquisition yields, earnings per share and cash flow could be adversely affected.
Our tenants may fail to successfully operate their businesses, which could adversely affect us.
The success of our investments is materially dependent on the financial stability of our tenants’ financial condition and leasing practices. Adverse economic conditions such as high unemployment levels, interest rates, tax rates and fuel and energy costs may have an impact on the results of operations and financial condition of our tenants and result in a decline in rent or an increased incidence of default under existing leases. Such adverse economic conditions may also reduce overall demand for rental space, which could adversely affect our ability to maintain our current tenants and attract new tenants.
At any given time, our tenants may experience a downturn in their business that may weaken the operating results and financial condition of individual properties or of their business as whole. As a result, a tenant may delay lease commencement, decline to extend a lease upon its expiration, fail to make rental payments when due, become insolvent or declare bankruptcy. We depend on our tenants to operate the properties we own in a manner which generates revenues sufficient to allow them to meet their obligations to us, including their obligations to pay rent, maintain certain insurance coverage and pay real estate taxes and maintain the properties in a manner so as not to jeopardize their operating licenses or regulatory status. The ability of our tenants to fulfill their obligations under our leases may depend, in part, upon the overall profitability of their operations. Cash flow generated by certain tenant businesses may not be sufficient for a tenant to meet its obligations to us. Although our occupied properties are generally operationally essential to our tenants, meaning the property is essential to the tenant’s generation of sales and profits, this does not guarantee that a tenant’s operations at a particular property will be successful or that the tenant will be able to meet all of its obligations to us. Our tenants’ failure to successfully operate their businesses could materially and adversely affect us.
Single-tenant leases involve particular and significant risks related to tenant default.
Our strategy focuses primarily on investing in single-tenant triple-net leased properties throughout the U.S. The financial failure of, or default in payment by, a single tenant under its lease is likely to cause a significant reduction in, or elimination of, our rental revenue from that property and a reduction in the value of the property. We may also experience difficulty or a significant delay in re-leasing or selling such property. This risk is magnified in situations where we lease
multiple properties to a single tenant under a master lease.lease, such as our three master leases with Shopko. The failure or default of a tenant under a master lease could reduce or eliminate rental revenue from multiple properties and reduce the value of such properties. Although the master lease structure may be beneficial to us because it restricts the ability of tenants to individually remove underperforming properties from the portfolio of properties leased from us, there is no guarantee that a tenant will not default in its obligations to us or decline to renew its master lease upon expiration. The default of a tenant that leases multiple properties from us could materially and adversely affect us.
A substantial number of our properties are leased to one tenant, Shopko, which may result in increased risk due to tenant and industry concentration.
As of December 31, 2017, Shopko represents our most significant tenant. Currently we lease 11699 properties to Shopko, primarily pursuant to 13three master leases.leases (relating to 59, 34 and 4 properties, respectively) and two single site leases, under which we received approximately $3.9 million in Contractual Rent per month. The Shopko leases are guaranteed by Specialty Retail Shops Holding Corp., the parent company of Shopko. Revenues generated from Shopko represented 8.2%7.7% of our Normalized Rental RevenueContractual Rent for the month ended December 31, 2016.2017. Because a significant portion of our revenues are derived from rental revenues received from Shopko, any default, breach or delay in the payment of rent by Shopko may materially and adversely affect us.
As a result of the significant number of properties leased to Shopko, our results of operations and financial condition are closely tiedsignificantly impacted to Shopko's performance under its leases, which is ultimately tied to the performance of its stores and the retail industry in which it operates. Shopko operates as a multi-department general merchandise retailer and retail health services provider primarily in mid-size and large communities in the Midwest, Pacific Northwest, North Central and Western Mountain states. Shopko is subject to the following risks, as well as other risks that we are not currently aware of, that could adversely affect its performance and thus its ability to pay rent to us:
The retail industry in which Shopko operates is highly competitive, which could impair its operations and liquidity, limit its growth opportunities and reduce profitability. Shopko competes with other discount retail merchants as well as mass merchants, catalog merchants, internet retailers and other general merchandise, apparel and household merchandise retailers. It faces strong competition from large national discount retailers, such as Walmart, Kmart and Target, and mid-tier merchants such as Kohl’s and J.C. Penney.
Shopko stores are geographically concentrated in the Midwest, Pacific Northwest, North Central and Western Mountain states. As a result, adverse economic conditions in these regions may materially and adversely affect its results of operations and retail sales.
The seasonality in retail operations may cause fluctuations in Shopko’s quarterly performance and results of operations and could adversely affect its cash flows.
Shopko stores are dependent on the efficient functioning of its distribution networks. Problems that cause delays or interruptions in the distribution networks could materially and adversely affect its results of operations.
Shopko stores depend on attracting and retaining quality employees. Many employees are entry-level or part-time with historically high rates of turnover.
IfBased on our monitoring of Shopko's financial information and recent liquidity events and other challenges, including bankruptcies, impacting the retail industry generally relative to recent years, we continue to be concerned about Shopko's ongoing ability to meet its obligations to us under its leases. Although Shopko is current on all of its obligations to us under its lease arrangements with us as of February 20, 2018, we can give you no assurance that this will continue to be the case, particularly if Shopko (not just the stores subject to leases with us) experiences a further decline in its business, financial condition orand results of operations itor loses access to liquidity. If such events were to occur, Shopko may request discounts or deferrals on the rents it pays to us, seek to terminate its master leases with us or close certain of its stores, or file for bankruptcy, all of which could significantly decrease the amount of revenue we receive from it.
While we seek to reduce the tenant concentration of Shopko, we may have difficulty in selling or leasing to other tenants the properties currently leased byto Shopko, due to, among other things, market demand or tax constraints. Furthermore, we can provide no assurance that we will deploy the proceeds from the disposition of any Shopko properties in a manner that would produce comparable or better yields.
A substantial portion of our properties are leased to unrated tenants and the tools we use to measure the credit quality of such tenants may not be accurate.
A substantial portion our properties are leased to unrated tenants whom we determine, through our internal underwriting and credit analysis, to be creditworthy.credit worthy. Many of our tenants are required to provide financial information, which includes balance sheet, income statement and cash flow statement data, on a quarterly and/or annual basis, and approximately 49.7%50.6% of our lease investment portfolio requires the tenant to provide property-level performance information, which includes income statement data on a quarterly and/or annual basis. To assist in our determination of a tenant’s credit quality, we license a product from Moody’s Analytics that provides an EDF and a “shadow rating,” and we evaluate a lease’s property-level rent coverage ratio. An EDF is only an estimate of default probability based, in part, on assumptions incorporated into the product. A shadow rating does not constitute a published credit rating and lacks the extensive company participation that is typically involved when a rating agency publishes a rating; accordingly, a shadow rating may not be as indicative of creditworthiness as a rating published by Moody’s, S&P, or another nationally
recognized statistical rating organization. Our calculations of EDFs, shadow ratings and rent coverage ratios are based on financial information provided to us by our tenants and prospective tenants without independent verification on our part, and we must assume the appropriateness of estimates and judgments that were made by the party preparing the financial information. If our measurement of credit quality proves to be inaccurate, we may be subject to defaults, and investors may view our cash flows as less stable.
Decrease in demand for traditional retail and restaurant space may materially and adversely affect us.
As of December 31, 2016,2017, leases representing approximately 69%34.1% and 17%16.6% of our Normalized Rental RevenueContractual Rent were with tenants in the traditional retail and restaurant industries, respectively, and we may acquire additional traditional retail and restaurant properties in the future. Accordingly, decreases in the demand for traditional retail and/or restaurant spaces adversely impact us. The market for traditional retail and restaurant space has previously been, and could continue to be, adversely affected by weakness in the national, regional and local economies, the adverse financial condition of some large traditional retail and restaurant companies, the ongoing consolidation in the traditional retail and restaurant industries, the excess amount of traditional retail and restaurant space in a number of markets and, in the case of the traditional retail industry, increasing consumer purchases through catalogs or over the Internet. To the extent that these conditions continue, they are likely to negatively affect market rents for traditional retail and restaurant space, which could materially and adversely affect us.
The proposed Spin-Off of almost all of our properties leased to Shopko, assets that collateralize Master Trust 2014 and certain other assets into an independent, publicly-traded REIT, SMTA, may not be completed on the currently contemplated timeline or terms, or at all, and may not achieve the intended benefits.
On August 3, 2017, we announced a plan to spin off our interests in almost all of our properties leased to Shopko, assets that collateralize Master Trust 2014 and certain other assets into an independent, publicly traded REIT. If we complete the Spin-Off, we expect we would make a distribution of stock issued by SMTA to our stockholders. We expect SMTA to elect to be treated and qualify for taxation as a REIT for U.S. federal income tax purposes. We currently expect we would complete the Spin-Off in the first half of 2018, although there can be no assurance as to whether or when the Spin-Off will occur, or the final structure of the Spin-Off. The completion of the Spin-Off will be subject to various conditions, including declaration by the SEC that SMTA's registration statement on Form 10 is effective, customary third-party consents and final approval and declaration of the distribution to our stockholders of SMTA stock by our Board of Directors. Such conditions and other unforeseen developments, including in the debt or equity markets or general market conditions, could delay or prevent the Spin-Off or cause the Spin-Off to occur on terms or conditions that are less favorable and/or different than anticipated. We also expect to incur significant expenses in connection with the Spin-Off
We may not be able to achieve the full strategic and financial benefits that we anticipate to result from the Spin-Off, or such benefits may be delayed or not occur at all. Additionally, we may experience negative reactions from financial markets if we do not complete the Spin-Off in a reasonable time period. Following the Spin-Off, the combined value of the common stock of the two publicly-traded companies may not be equal to or greater than what the value of our common stock would have been had the Spin-Off not occurred.
High geographic concentration of our properties could magnify the effects of adverse economic or regulatory developments in such geographic areas on our operations and financial condition.
As of December 31, 2016, 12.5%2017, 12.0% of our portfolio (as a percentage of Normalized Rental Revenue)Contractual Rent) was located in Texas, representing the highest concentration of our assets. Geographic concentration exposes us to greater economic or regulatory risks than if we owned a more geographically diverse portfolio. We are susceptible to adverse developments in the economic or regulatory environments of the geographic areas in which we concentrate (or in which we may develop a substantial concentration of assets in the future), such as business layoffs or downsizing, industry slowdowns, relocations of businesses, increases in real estate and other taxes or costs of complying with governmental regulations.
We may be unable to renew leases, lease vacant space or re-lease space as leases expire on favorable terms or at all.
Our results of operations depend on our ability to strategically lease space in our properties (by renewing or re-leasing expiring leases and leasing vacant space), optimize our tenant mix or lease properties on more economically favorable terms. As of December 31, 2016,2017, leases representing approximately 3.6%2.8% of our rental revenue will expire during 2017.2018. As of December 31, 2016, 462017, 19 of our properties, representing approximately 1.8%0.8% of our total number ofeconomically yielding owned properties, were vacant.Vacant. Current tenants may decline, or may not have the financial resources available, to renew current leases and we cannot guarantee that leases that are renewed will have terms that are as economically favorable to us as the expiring lease terms. If tenants do not renew the leases as they expire, we will have to find new tenants to lease our properties and there is no guarantee that we will be able to find new tenants or that our properties will be re-leased at rental rates equal to or above the current average rental rates or that substantial rent abatements, tenant improvement allowances, early termination rights, below-market renewal options or other lease incentive payments will not be offered to attract new tenants. We may experience significant costs in connection with renewing, leasing or re-leasing a significant number of our properties, which could materially and adversely affect us.
Our ability to realize future rent increases will vary depending on changes in the CPI.
Most of our leases contain rent escalators, or provisions that periodically increase the base rent payable by the tenant under the lease. Although some of our rent escalators increase rent at a fixed amount on fixed dates, mostas of December 31, 2017, approximately 89.2% of our rent escalators increase rent by the lesser of (a) 1 to 1.25 timesa multiple of any increase in the CPI over a specified period or (b) a fixed percentage. If the product of any increase in the CPI multiplied by the applicable factor is less than the fixed percentage, the increased rent we are entitled to receive will be less than what we otherwise would have been entitled to receive if the rent escalator was based solely on a fixed percentage. Therefore, during periods of low inflation or deflation, small increases or decreases in the CPI will subject us to the risk of receiving lower rental revenue than we otherwise would have been entitled to receive if our rent escalators were based solely on fixed percentages or amounts. Conversely, if the product of any increase in the CPI multiplied by the applicable factor is more than the fixed percentage, the increased rent we are entitled to receive will be less than what we otherwise would have been entitled to receive if the rent escalator was based solely on an increase in CPI. Therefore, periods of high inflation will subject us to the risk of receiving lower rental revenue than we otherwise would have been entitled to receive if our rent escalators were based solely on CPI increases.
The bankruptcy or insolvency of any of our tenants could result in the termination of such tenant’s lease and material losses to us.
The occurrence of a tenant bankruptcy or insolvency could diminish the income we receive from that tenant’s lease or leases. In particular, the traditional retail industry is facing reductions in sales revenues and increased bankruptcies throughout the United States, and revenues generated from traditional retail tenants represented 34.1% of our Contractual Rent for the month ended December 31, 2017. If a tenant becomes bankrupt or insolvent, federal law may prohibit us from evicting such tenant based solely upon such bankruptcy or insolvency. In addition, a bankrupt or insolvent tenant may be authorized to reject and terminate its lease or leases with us. Any claims against such bankrupt tenant for unpaid future rent would be subject to statutory limitations that would likely result in our receipt of rental revenues that are substantially less than the contractually specified rent we are owed under the lease or leases. In addition, any claim we have for unpaid past rent, if any, may not be paid in full. We may also be unable to re-lease a terminated or rejected space or to re-lease it on comparable or more favorable terms.
Moreover, tenants who are considering filing for bankruptcy protection may request that we agree to amendments of their master leases to remove certain of the properties they lease from us under such master leases. We cannot guarantee that we will be able to sell or re-lease such properties or that lease termination fees, if any, received in exchange for such releases will be sufficient to make up for the rental revenues lost as a result of such lease amendments. As a result, tenant bankruptcies may materially and adversely affect us.
Property vacancies could result in significant capital expenditures and illiquidity.
The loss of a tenant, either through lease expiration or tenant bankruptcy or insolvency, may require us to spend significant amounts of capital to renovate the property before it is suitable for a new tenant. Many of the leases we enter into or acquire are for properties that are specially suited to the particular business of our tenants. Because these properties have been designed or physically modified for a particular tenant, if the current lease is terminated or not renewed, we may be required to renovate the property at substantial costs, decrease the rent we charge or provide other concessions in order to lease the property to another tenant. In the event we are required to sell the property, we may have difficulty selling it to a party other than the tenant due to the special purpose for which the property may have been designed or modified. This potential illiquidity may limit our ability to quickly modify our portfolio in response to changes in economic or other conditions, including tenant demand. These limitations may materially and adversely affect us.
Our future results will suffer if we do not effectively manage our expanded operations.
We may continue to expand our operations through additional acquisitions and other strategic transactions, and modernize our information technology and management systems through new systems implementations, some of which may involve complex challenges. Our future success will depend, in part, upon our ability to manage our expansion opportunities, integrate new operations into our existing business in an efficient and timely manner, successfully monitor our operations, costs and regulatory compliance, and develop and maintain other necessary systems, processes and internal controls. We cannot guarantee that our expansion or acquisition opportunities will be successful or that we will realize their expected operating efficiencies, cost savings, revenue enhancements, synergies or other benefits.
We may be unable to identify and complete acquisitions of suitable properties, which may impede our growth, or our future acquisitions may not yield the returns we expect.
Our ability to expand through acquisitions requires us to identify and complete acquisitions or investment opportunities that are compatible with our growth strategy and to successfully integrate newly acquired properties into our portfolio. We continually evaluate investment opportunities and may acquire properties when strategic opportunities exist. Our ability to acquire properties on favorable terms and successfully operate them may be constrained by the following significant risks:
we face competition from other real estate investors with significant capital, including REITs and institutional investment funds, which may be able to accept more risk than we can prudently manage, including risks associated with paying higher acquisition prices;
we face competition from other potential acquirers which may significantly increase the purchase price for a property we acquire, which could reduce our growth prospects;
we may incur significant costs and divert management attention in connection with evaluating and negotiating potential acquisitions, including ones that we are subsequently unable to complete;
we may acquire properties that are not accretive to our results upon acquisition, and we may be unsuccessful in managing and leasing such properties in accordance with our expectations;
our cash flow from an acquired property may be insufficient to meet our required principal and interest payments with respect to debt used to finance the acquisition of such property;
we may discover unexpected items, such as unknown liabilities, during our due diligence investigation of a potential acquisition or other customary closing conditions may not be satisfied, causing us to abandon an acquisition opportunity after incurring expenses related thereto;
we may fail to obtain financing for an acquisition on favorable terms or at all;
we may spend more than budgeted amounts to make necessary improvements or renovations to acquired properties;
market conditions may result in higher than expected vacancy rates and lower than expected rental rates; or
we may acquire properties subject to liabilities and without any recourse, or with only limited recourse, with respect to unknown liabilities such as liabilities for clean-up of undisclosed environmental contamination, claims by tenants, vendors or other persons dealing with the former owners of the properties, liabilities incurred in the ordinary course of business and claims for indemnification by general partners, directors, officers and others indemnified by the former owners of the properties.
If any of these risks are realized, we may be materially and adversely affected.
Any material failure, weakness, interruption or breach in security of our information systems could prevent us from effectively operating our business.
We rely on information systems across our operations and corporate functions, including finance and accounting, and depend on such systems to ensure payment of obligations, collection of cash, data warehousing to support analytics, and other various processes and procedures. Our ability to efficiently manage our business depends significantly on the reliability and capacity of these systems. The failure of these systems to operate effectively, maintenance problems, upgrading or transitioning to new platforms, or a breach in security of these systems, such as in the event of cyber-attacks, could result in the theft of intellectual property, personal information or personal property, damage to our reputation and third-party claims, as well as reduced efficiency in our operations and in the accuracy in our internal and external financial reporting. The remediation of such problems could result in significant unplanned expenditures.
Illiquidity of real estate investments could significantly impede our ability to respond to adverse changes in the performance of our properties and harm our financial condition.
The real estate investments made, and expected to be made, by us are relatively difficult to sell quickly. As a result, our ability to promptly sell one or more properties in our portfolio in response to changing economic, financial or investment conditions is limited. Return of capital and realization of gains, if any, from an investment generally will occur upon disposition or refinancing of the underlying property. We may be unable to realize our investment objective by sale, other disposition or refinancing at attractive prices within any given period of time or may otherwise be unable to complete any exit strategy. In particular, these risks could arise from weakness in or even the lack of an established market for a property, changes in the financial condition or prospects of prospective purchasers, changes in national or international economic conditions and changes in laws, regulations or fiscal policies of the jurisdiction in which a property is located.
In addition, the Code imposes restrictions on a REIT’s ability to dispose of properties that are not applicable to other types of real estate companies. In particular, the tax laws applicable to REITs effectively require that we hold our properties for investment, rather than primarily for sale in the ordinary course of business, which may cause us to forgo or defer sales of properties that otherwise would be in our best interest. Therefore, we may not be able to vary our portfolio in response to economic or other conditions promptly or on favorable terms, which may materially and adversely affect us.
We face significant competition for tenants, which may decrease or prevent increases of the occupancy and rental rates of our properties, and competition for acquisitions may reduce the number of acquisitions we are able to complete and increase the costs of these acquisitions.
We compete with numerous developers, owners and operators of properties, many of which own properties similar to ours in the same markets in which our properties are located. If our competitors offer space at rental rates below current market rates or below the rental rates we currently charge our tenants, we may lose existing or potential tenants and we may be pressured to reduce our rental rates or to offer more substantial rent abatements, tenant improvements,
early termination rights, below-market renewal options or other lease incentive payments in order to retain tenants
when our leases expire. Competition for tenants could decrease or prevent increases of the occupancy and rental rates of our properties, which could materially and adversely affect us.
We also face competition for acquisitions of real property from investors, including traded and non-traded public REITs, private equity investors and institutional investment funds, some of which have greater financial resources than we do, a greater ability to borrow funds to acquire properties and the ability to accept more risk than we can prudently manage. This competition may increase the demand for the types of properties in which we typically invest and, therefore, reduce the number of suitable acquisition opportunities available to us and increase the prices paid for such acquisition properties. This competition will increase if investments in real estate become more attractive relative to other types of investment. Accordingly, competition for the acquisition of real property could materially and adversely affect us.
The loss of a borrower or the failure of a borrower to make loan payments on a timely basis will reduce our revenues, which could lead to losses on our investments and reduced returns to our stockholders.
We have originated or acquired long-term, commercial mortgage and other loans. The success of our loan investments is materially dependent on the financial stability of our borrowers. The success of our borrowers is dependent on each of their individual businesses and their industries, which could be affected by economic conditions in general, changes in consumer trends and preferences and other factors over which neither they nor we have control. A default of a borrower on its loan payments to us that would prevent us from earning interest or receiving a return of the principal of our loan could materially and adversely affect us. In the event of a default, we may also experience delays in enforcing our rights as lender and may incur substantial costs in collecting the amounts owed to us and in liquidating any collateral.
Foreclosure and other similar proceedings used to enforce payment of real estate loans are generally subject to principles of equity, which are designed to relieve the indebted party from the legal effect of that party’s default. Foreclosure and other similar laws may limit our right to obtain a deficiency judgment against the defaulting party after a foreclosure or sale. The application of any of these principles may lead to a loss or delay in the payment on loans we hold, which in turn could reduce the amounts we have available to make distributions. Further, in the event we have to foreclose on a property, the amount we receive from the foreclosure sale of the property may be inadequate to fully pay the amounts owed to us by the borrower and our costs incurred to foreclose, repossess and sell the property which could materially and adversely affect us.
Our investments in mortgage loans may be affected by unfavorable real estate market conditions, including interest rate fluctuations, which could decrease the value of those loans.
Our investments in mortgage loans are subject to risk of default by the borrowers and to interest rate risks. To the extent we incur delays in liquidating defaulted mortgage loans, we may not be able to obtain all amounts due to us under such loans. Further, we will not know whether the values of the properties securing the mortgage loans will remain at the levels existing on the dates of origination of those mortgage loans or the dates of our investment in the loans. If the values of the underlying properties decline, the value of the collateral securing our mortgage loans will also decline and if we were to foreclose on any of the properties securing the mortgage loans, we may not be able to sell or lease them for an amount equal to the unpaid amounts due to us under the mortgage loans. As such, defaults on mortgage loans in which we invest may materially and adversely affect us.
Inflation may materially and adversely affect us and our tenants.
Increased inflation could have a negative impact on variable-rate debt we currently have or that we may incur in the future. Our leases typically contain provisions designed to mitigate the adverse impact of inflation on our results of operations. Because tenants are typically required to pay all property operating expenses, increases in property-level expenses at our leased properties generally do not affect us. However, increased operating expenses at vacant properties and the limited number of properties that are not subject to full triple-net leases could cause us to incur additional operating expenses, which could increase our exposure to inflation. Additionally, the increases in rent provided by many of our leases may not keep up with the rate of inflation. Increased costs may also have an adverse impact on our tenants if increases in their operating expenses exceed increases in revenue, which may adversely affect the tenants’ ability to pay rent owed to us.
The market price and trading volume of our common stock may fluctuate or decline.
The market price and trading volume of our common stock may fluctuate widely due to various factors, including:
actual or anticipated variations in our or our competitors' quarterly operating results or distributions;
publication of research reports about us, our competitors or the real estate industry;
adverse market reaction to any additional indebtedness we incur or debt or equity securities we or the Operating Partnership issue in the future;
additions or departures of key management personnel;
changes in our credit ratings;
the financial condition, performance and prospects of our tenants; and
the realization of any of the other risk factors presented in this Annual Report on Form 10-K.
We may issue shares of our common stock or other securities without stockholder approval, including shares issued to satisfy REIT dividend distribution requirements. The Operating Partnership may issue partnership interests to third parties, and such partnership interests would be exchangeable for cash or, at our election, shares of our common stock at specified ratios set when partnership interests in the Operating Partnership are issued. Our existing stockholders have no preemptive rights to acquire any of these securities, and any issuance of equity securities by us or the Operating Partnership may dilute stockholder investment.
If we fail to maintain effective internal controls over financial reporting, we may not be able to accurately and timely report our financial results.
Effective internal controls over financial reporting are necessary for us to provide reliable financial reports, effectively prevent fraud and operate successfully as a public company. If we cannot provide reliable financial reports or prevent fraud, our reputation and operating results would be harmed. We are required to perform system and process evaluation and testing of our internal control over financial reporting to allow management to report on, and our independent registered public accounting firm to attest to, the effectiveness of our internal control over financial reporting, as required by Section 404 of the Sarbanes-Oxley Act of 2002.
In October 2016, we identified a deficiency in our internal control over financial reporting, which was considered to be a material weakness and led to the restatement of our audited consolidated financial statements for the year ended December 31, 2015 and our interim unaudited consolidated financial statements for the quarters ended March 31, 2015, June 30, 2015, September 30, 2015, March 31, 2016 and June 30, 2016. The Public Company Accounting Oversight Board’s Auditing Standard No. 5 defines a material weakness as a deficiency, or a combination of deficiencies, in internal control over financial reporting, such that there is a reasonable possibility that a material misstatement of annual or interim financial statements will not be prevented or detected on a timely basis. The identified material weakness related to our failure to maintain effective procedures and controls over the evaluation of and accounting for goodwill related to the disposal of assets and the allocation of goodwill to held for sale assets in determining impairment charges. To fully remediate the material weakness, we designed and implemented additional controls, including the performance of additional analyses and procedures. The Company has remediated the material weakness as-of December 31, 2016. However, there is no assurance that other deficiencies will not be identified in the future.
As a result of material weaknesses or significant deficiencies that may be identified in our internal control over financial reporting in the future, we may also identify certain deficiencies in some of our disclosure controls and procedures that we believe require remediation. If we or our independent registered public accounting firm discover any such weaknesses or deficiencies, we will make efforts to further improve our internal control over financial reporting controls. However, there is no assurance that we will be successful. Any failure to maintain effective controls or timely effect any necessary improvement of our internal control over financial reporting controls could harm operating results or cause us to fail to meet our reporting obligations, which could affect the listing of our common stock on the NYSE. Ineffective internal control over financial reporting and disclosure controls could also cause investors to lose confidence in our reported financial information, which would likely have a negative effect on the per share trading price of our common stock.
Changes in market interest rates may adversely impact the value of our common stock.
The market price of our common stock will generally be influenced by the dividend yield on our common stock (as a percentage of the price of our common stock) relative to market interest rates. An increase in market interest rates, which are currently at low levels relative to historical rates, may lead prospective purchasers of shares of our common
stock to expect a higher dividend yield. However, higher market interest rates would likely increase our borrowing costs and potentially decrease funds available for distribution. Thus, higher market interest rates could cause the market price of our common stock to decrease.
Our growth depends on external sources of capital that are outside of our control and may not be available to us on commercially reasonable terms or at all.
In order to maintain our qualification as a REIT, we are required under the Code to distribute annually at least 90% of our REIT taxable income, determined without regard to the dividends paid deduction and excluding any net capital gain. In addition, we will be subject to income tax at regular corporate rates to the extent that we distribute less than 100% of our REIT taxable income, determined without regard to the dividends paid deduction and including any net capital gain. Because of these distribution requirements, we may not be able to fund future capital needs, including any necessary acquisition financing, from operating cash flow. Consequently, we may rely on third-party sources to fund our capital needs. We may not be able to obtain the financing on favorable terms or at all. Any additional debt we
incur will increase our leverage and likelihood of default. Our access to third-party sources of capital depends, in part, on:
general market conditions;
the market’s perception of our growth potential;
our current debt levels;
our current and expected future earnings;
our cash flow and cash distributions; and
the market price per share of our common stock.
If we cannot obtain capital from third-party sources, we may not be able to acquire properties when strategic opportunities exist, meet the capital and operating needs of our existing properties, satisfy our debt service obligations or make the cash distributions to our stockholders necessary to maintain our qualification as a REIT.
Historically, we have raised a significant amount of debt capital through our Spirit Master Funding Program and the CMBS market. We have generally used the proceeds from these financings to repay debt and fund real estate acquisitions. As of December 31, 2016,2017, we had issued notes under our Spirit Master Funding Program in eightnine different classes over fivesix separate issuances with an aggregate outstanding principal balance of $1.67$2.25 billion. The Master Trust Notes had a weighted average maturity of 6.25.2 years as of December 31, 2016.2017. In addition, we had CMBS loans with an aggregate outstanding principal balance of $0.53$0.33 billion and an average maturity of 3.84.6 years as of December 31, 2016.2017. Our obligations under these loans are generally secured by liens on certain of our properties. In the case of our Spirit Master Funding Program, subject to certain conditions, we may substitute real estate collateral within our two securitization trusts from time to time. No assurance can be given that the CMBS market will be available to us in the future, whether to refinance existing debt or to raise additional debt capital. Moreover, we view our ability to substitute collateral under our Spirit Master Funding Program favorably, and no assurance can be given that financing facilities offering similar flexibility will be available to us in the future.
Dispositions of real estate assets could change the holding period assumption in our valuation analyses, which could result in material impairment losses and adversely affect our financial results.
We evaluate real estate assets for impairment based on the projected cash flow of the asset over our anticipated holding period. If we change our intended holding period due to our intention to sell or otherwise dispose of an asset, we must reevaluate whether that asset is impaired under GAAP. Depending on the carrying value of the property at the time we change our intention and the amount that we estimate we would receive on disposal, we may record an impairment loss that would adversely affect our financial results. This loss could be material to our assets in the period that it is recognized.
Loss of our key personnel with long-standing business relationships could materially impair our ability to operate successfully.
Our continued success and our ability to manage anticipated future growth depend, in large part, upon the efforts of key personnel, particularly our President and Chief Executive Officer, and Chairman of our board of directors, Thomas H. Nolan, Jr., our President and Chief Operating Officer, Jackson Hsieh, our Executive Vice President and Chief Financial Officer, Phillip D. Joseph, Jr., and our Executive Vice President and Chief Acquisitions Officer, Boyd Messmann, who havehas extensive market knowledge and relationships and exerciseexercises substantial influence over our operational, financing, acquisition and disposition activity. Among the reasons that they are important to our success is that each has a national
or regional industry reputation that attracts business and investment opportunities and assists us in negotiations with lenders, existing and potential tenants and industry personnel.
Many of our other key executive personnel, particularly our executive and senior vice presidents, also have extensive experience and strong reputations in the real estate industry and have been instrumental in setting our strategic direction, operating our business, identifying, recruiting and training key personnel and arranging necessary financing. In particular, the extent and nature of the relationships that these individuals have developed with financial institutions and existing and prospective tenants is critically important to the success of our business. The loss of services of one or more members of our senior management team, or our inability to attract and retain highly qualified personnel, could adversely affect our business, diminish our investment opportunities and weaken our relationships with lenders, business partners, existing and prospective tenants and industry personnel, which could materially and adversely affect us.
We may become subject to litigation, which could materially and adversely affect us.
In the ordinary course of business, we may become subject to litigation, including claims relating to our operations, security offerings and otherwise. Some of these claims may result in significant defense costs and potentially significant judgments against us, some of which are not, or cannot be, insured against. We generally intend to vigorously defend ourselves. However, we cannot be certain of the ultimate outcomes of any claims that may arise in the future. Resolution of these types of matters against us may result in our having to pay significant fines, judgments, or settlements, which, if uninsured, or if the fines, judgments, and settlements exceed insured levels, could adversely impact our earnings and cash flows, thereby materially and adversely affecting us. Certain litigation or the resolution of certain litigation may affect the availability or cost of some of our insurance coverage, which could materially and adversely impact us, expose us to increased risks that would be uninsured, and materially and adversely impact our ability to attract directors and officers.
Costs of compliance with, or liabilities related to, environmental laws may materially and adversely affect us.
The properties we own or have owned in the past may subject us to known and unknown environmental liabilities. Under various federal, state and local laws and regulations relating to the environment, as a current or former owner or operator of real property, we may be liable for costs and damages resulting from the presence or discharge of hazardous or toxic substances, waste or petroleum products at, on, in, under or migrating from such property, including costs to investigate, clean up such contamination and liability for harm to natural resources. We may face liability regardless of:
our knowledge of the contamination;
the timing of the contamination;
the cause of the contamination; or
the party responsible for the contamination of the property.
There may be environmental liabilities associated with our properties of which we are unaware. We obtain Phase I environmental site assessments on all properties we finance or acquire. The Phase I environmental site assessments are limited in scope and therefore may not reveal all environmental conditions affecting a property. Therefore, there could be undiscovered environmental liabilities on the properties we own. Some of our properties use, or may have used in the past, underground tanks for the storage of petroleum-based products or waste products that could create a potential for release of hazardous substances or penalties if tanks do not comply with legal standards. If environmental contamination exists on our properties, we could be subject to strict, joint and/or several liability for the contamination by virtue of our ownership interest. Some of our properties may contain ACM. Strict environmental laws govern the presence, maintenance and removal of ACM and such laws may impose fines and penalties for failure to comply with these requirements or expose us to third-party liability (e.g., liability for personal injury associated with exposure to asbestos). Strict environmental laws also apply to other activities that can occur on a property, such as air emissions and water discharges, and such laws may impose fines and penalties for violations.
The presence of hazardous substances on a property may adversely affect our ability to sell, lease or improve the property or to borrow using the property as collateral. In addition, environmental laws may create liens on contaminated properties in favor of the government for damages and costs it incurs to address such contamination. Moreover, if contamination is discovered on our properties, environmental laws may impose restrictions on the manner in which they may be used or businesses may be operated, and these restrictions may require substantial expenditures.
In addition, although our leases generally require our tenants to operate in compliance with all applicable laws and to indemnify us against any environmental liabilities arising from a tenant’s activities on the property, we could be subject to strict liability by virtue of our ownership interest. We cannot be sure that our tenants will, or will be able to, satisfy their indemnification obligations, if any, under our leases. Furthermore, the discovery of environmental liabilities on any of our properties could lead to significant remediation costs or to other liabilities or obligations attributable to the tenant of that property, which may affect such tenant’s ability to make payments to us, including rental payments and, where applicable, indemnification payments.
Our environmental liabilities may include property damage, personal injury, investigation and clean-up costs. These costs could be substantial. Although we may obtain insurance for environmental liability for certain properties that are deemed to warrant coverage, our insurance may be insufficient to address any particular environmental situation and we may be unable to continue to obtain insurance for environmental matters, at a reasonable cost or at all, in the future. If our environmental liability insurance is inadequate, we may become subject to material losses for environmental liabilities. Our ability to receive the benefits of any environmental liability insurance policy will depend on the financial stability of our insurance company and the position it takes with respect to our insurance policies. If we were to become subject to significant environmental liabilities, we could be materially and adversely affected.
Most of the environmental risks discussed above refer to properties that we own or may acquire in the future. However, each of the risks identified also applies to the owners (and potentially, the lessees) of the properties that secure each of the loans we have made and any loans we may acquire or make in the future. Therefore, the existence of environmental conditions could diminish the value of each of the loans and the abilities of the borrowers to repay the loans and could materially and adversely affect us.
Our properties may contain or develop harmful mold, which could lead to liability for adverse health effects and costs of remediation.
When excessive moisture accumulates in buildings or on building materials, mold growth may occur, particularly if the moisture problem remains undiscovered or is not addressed over a period of time. Some molds may produce airborne toxins or irritants. Concern about indoor exposure to mold has been increasing, as exposure to mold may cause a variety of adverse health effects and symptoms, including allergic or other reactions. As a result, should our tenants or their employees or customers be exposed to mold at any of our properties we could be required to undertake a costly remediation program to contain or remove the mold from the affected property. In addition, exposure to mold by our tenants or others could subject us to liability if property damage or health concerns arise. If we were to become subject to significant mold-related liabilities, we could be materially and adversely affected.
Insurance on our properties may not adequately cover all losses, which could materially and adversely affect us.
Our tenants are required to maintain liability and property insurance coverage for the properties they lease from us pursuant to triple-net leases. Pursuant to such leases, our tenants are generally required to name us (and any of our lenders that have a mortgage on the property leased by the tenant) as additional insureds on their liability policies and additional named insured and/or loss payee (or mortgagee, in the case of our lenders) on their property policies. All tenants are required to maintain casualty coverage and most carry limits at 100% of replacement cost. Depending on the location of the property, losses of a catastrophic nature, such as those caused by earthquakes and floods, may be covered by insurance policies that are held by our tenant with limitations such as large deductibles or co-payments that a tenant may not be able to meet. In addition, losses of a catastrophic nature, such as those caused by wind/hail, hurricanes, terrorism or acts of war, may be uninsurable or not economically insurable. In the event there is damage to our properties that is not covered by insurance and such properties are subject to recourse indebtedness, we will continue to be liable for the indebtedness, even if these properties are irreparably damaged.
Inflation, changes in building codes and ordinances, environmental considerations, and other factors, including terrorism or acts of war, may make any insurance proceeds we receive insufficient to repair or replace a property if it is damaged or destroyed. In that situation, the insurance proceeds received may not be adequate to restore our economic position with respect to the affected real property. Furthermore, in the event we experience a substantial or comprehensive loss of one of our properties, we may not be able to rebuild such property to its existing specifications without significant capital expenditures which may exceed any amounts received pursuant to insurance policies, as reconstruction or improvement of such a property would likely require significant upgrades to meet zoning and building code requirements. The loss of our capital investment in or anticipated future returns from our properties due to material uninsured losses could materially and adversely affect us.
Compliance with the ADA and fire, safety and other regulations may require us to make unanticipated expenditures that materially and adversely affect us.
Our properties are subject to the ADA. Under the ADA, all public accommodations must meet federal requirements related to access and use by disabled persons. Compliance with the ADA requirements could require removal of access barriers and non-compliance could result in imposition of fines by the U.S. government or an award of damages to private litigants, or both. While our tenants are obligated by law to comply with the ADA and typically obligated under our leases and financing agreements to cover costs associated with compliance, if required changes involve greater expenditures than anticipated or if the changes must be made on a more accelerated basis than anticipated, our tenants' ability to cover the costs could be adversely affected. We may be required to expend our own funds to comply with the provisions of the ADA, which could materially and adversely affect us.
In addition, we are required to operate our properties in compliance with fire and safety regulations, building codes and other land use regulations, as they may be adopted by governmental agencies and bodies and become applicable to our properties. We may be required to make substantial capital expenditures to comply with those requirements and may be required to obtain approvals from various authorities with respect to our properties, including prior to acquiring a property or when undertaking renovations of any of our existing properties. There can be no assurance that existing
laws and regulatory policies will not adversely affect us or the timing or cost of any future acquisitions or renovations, or that additional regulations will not be adopted that increase such delays or result in additional costs. Additionally, failure to comply with any of these requirements could result in the imposition of fines by governmental authorities or awards of damages to private litigants. While we intend to only acquire properties that we believe are currently in substantial compliance with all regulatory requirements, these requirements may change and new requirements may be imposed which would require significant unanticipated expenditures by us and could materially and adversely affect us.
As a result of acquiring C corporations in carry-over basis transactions, we may inherit material tax liabilities and other tax attributes from such acquired corporations, and we may be required to distribute earnings and profits.
From time to time, we have and may continue to acquire C corporations in transactions in which the basis of the corporations’ assets in our hands is determined by reference to the basis of the assets in the hands of the acquired corporations, or carry-over basis transactions.
If we acquire any asset from a corporation that is or has been a C corporation in a carry-over basis transaction, and we subsequently recognize gain on the disposition of the asset during the five-year period beginning on the date on which we acquired the asset, then we will be required to pay tax at the highest regular corporate tax rate on this gain to the extent of the excess of (1) the fair market value of the asset over (2) our adjusted basis in the asset, in each case determined as of the date on which we acquired the asset. Any taxes we pay as a result of such gain would reduce the amount available for distribution to our stockholders. The imposition of such tax may require us to forgo an otherwise attractive disposition of any assets we acquire from a C corporation in a carry-over basis transaction, and as a result may reduce the liquidity of our portfolio of investments. In addition, in such a carry-over basis transaction, we will succeed to any tax liabilities and earnings and profits of the acquired C corporation. To qualify as a REIT, we must distribute any non-REIT earnings and profits by the close of the taxable year in which such transaction occurs. Any adjustments to the acquired corporation’s income for taxable years ending on or before the date of the transaction, including as a result of an examination of the corporation’s tax returns by the IRS, could affect the calculation of the corporation’s earnings and profits. If the IRS were to determine that we acquired non-REIT earnings and profits from a corporation that we failed to distribute prior to the end of the taxable year in which the carry-over basis transaction occurred, we could avoid disqualification as a REIT by paying a “deficiency dividend.” Under these procedures, we generally would be required to distribute any such non-REIT earnings and profits to our stockholders within 90 days of the determination and pay a statutory interest charge at a specified rate to the IRS. Such a distribution would be in addition to the distribution of REIT taxable income necessary to satisfy the REIT distribution requirement and may require that we borrow funds to make the distribution even if the then-prevailing market conditions are not favorable for borrowings. In addition, payment of the statutory interest charge could materially and adversely affect us.
Changes in accounting standards may materially and adversely affect us.
From time to time the FASB, and the SEC, who create and interpret appropriate accounting standards, may change the financial accounting and reporting standards or their interpretation and application of these standards that will govern the preparation of our financial statements. These changes could materially and adversely affect our reported financial condition and results of operations. In some cases, we could be required to apply a new or revised standard
retroactively, resulting in restating prior period financial statements. Similarly, these changes could materially and adversely affect our tenants’ reported financial condition or results of operations and affect their preferences regarding leasing real estate.
The SEC is currently considering whether issuers in the U.S. should be required to prepare financial statements in accordance with IFRS instead of GAAP. IFRS is a comprehensive set of accounting standards promulgated by the IASB, which are rapidly gaining worldwide acceptance. The SEC currently has not finalized the timeframetime frame it expects that U.S. issuers would first report under the new standards. If IFRS is adopted, the potential issues associated with lease accounting, along with other potential changes associated with the adoption or convergence with IFRS, may materially and adversely affect us.
Additionally, the FASB is considering various changes to GAAP, some of which may be significant, as part of a joint effort with the IASB to converge accounting standards. In particular, FASB issued a new accounting standard that requires companies to capitalize all leases on their balance sheets by recognizing a lessee’s rights and obligations. For public companies, this new standard will be effective for fiscal years beginning after December 15, 2018, including interim periods within those fiscal years. Many companies that account for certain leases on an “off balance sheet” basis would be required to account for such leases “on balance sheet” upon adoption of this rule. This change removes many of the differences in the way companies account for owned property and leased property, and could have a
material effect on various aspects of our tenants’ businesses, including their credit quality and the factors they consider in deciding whether to own or lease properties. Additionally, it could cause companies that lease properties to prefer shorter lease terms in an effort to reduce the leasing liability required to be recorded on the balance sheet. This new standard could also make lease renewal options less attractive, because, under certain circumstances, the rule would require a tenant to assume that a renewal right will be exercised and accrue a liability relating to the longer lease term.
In the future, we may choose to acquire properties or portfolios of properties through tax deferred contribution transactions, which could result in stockholder dilution and limit our ability to sell such assets.
In the future we may acquire properties or portfolios of properties through tax deferred contribution transactions in exchange for partnership interests in the Operating Partnership, which may result in stockholder dilution. This acquisition structure may have the effect of, among other things, reducing the amount of tax depreciation we could deduct over the tax life of the acquired properties, and may require that we agree to protect the contributors’ ability to defer recognition of taxable gain through restrictions on our ability to dispose of the acquired properties and/or the allocation of partnership debt to the contributors to maintain their tax bases. These restrictions could limit our ability to sell an asset at a time, or on terms, that would be favorable absent such restrictions.
Risks Related to Our IndebtednessRISKS RELATED TO OUR INDEBTEDNESS
We have approximately $3.75$3.74 billion principal balance of indebtedness outstanding, which may expose us to the risk of default under our debt obligations, limit our ability to obtain additional financing or affect the market price of our common stock or debt securities.
As of December 31, 2016,2017, the total principal balance outstanding on our indebtedness was approximately $3.75$3.74 billion, of which $420.0the $112.0 million outstanding under the Term Loan and $86.0 million outstanding under the 2015Revolving Credit Facility incurincurs interest at a variable rate. We may also incur significant additional debt to finance future investment activities. Payments of principal and interest on borrowings may leave us with insufficient cash resources to meet our cash needs or make the distributions to our common stockholders necessary to maintain our REIT qualification. Our level of debt and the limitations imposed on us by our debt agreements could have significant adverse consequences, including the following:
our cash flow may be insufficient to meet our required principal and interest payments;
cash interest expense and financial covenants relating to our indebtedness may limit or eliminate our ability to make distributions to our common stockholders;
we may be unable to borrow additional funds as needed or on favorable terms, which could, among other things, adversely affect our ability to capitalize upon acquisition opportunities or meet operational needs;
we may be unable to refinance our indebtedness at maturity or the refinancing terms may be less favorable than the terms of our original indebtedness;
for our variable interest rate debt, increases in interest rates could increase our interest expense;
we may be unable to hedge floating rate debt, counterparties may fail to honor their obligations under any hedge agreements we enter into, such agreements may not effectively hedge interest rate fluctuation risk,
and, upon the expiration of any hedge agreements we enter into, we would be exposed to then-existing market rates of interest and future interest rate volatility;
we may be forced to dispose of properties, possibly on unfavorable terms or in violation of certain covenants to which we may be subject;
we may default on our obligations and the lenders or mortgagees may foreclose on our properties or our interests in the entities that own the properties that secure their loans and receive an assignment of rents and leases;
we may be restricted from accessing some of our excess cash flow after debt service if certain of our tenants fail to meet certain financial performance metric thresholds;
we may violate restrictive covenants in our loan documents, which would entitle the lenders to accelerate our debt obligations; and
our default under any loan with cross-default provisions could result in a default on other indebtedness.
Changes in our leverage ratios may also negatively impact the market price of our equity or debt securities. Furthermore, foreclosures could create taxable income without accompanying cash proceeds, which could hinder our ability to meet the REIT distribution requirements imposed by the Code.
Current market conditions could adversely affect our ability to refinance existing indebtedness or obtain additional financing for growth on acceptable terms or at all.
Over the last few years, the credit markets have experienced significant price volatility, displacement and liquidity disruptions, including the bankruptcy, insolvency or restructuring of certain financial institutions. These circumstances have materially impacted liquidity in the financial markets, making financing terms for borrowers less attractive, and in certain cases, have resulted in the unavailability of various types of debt financing. As a result, we may be unable to obtain debt financing on favorable terms or at all or fully refinance maturing indebtedness with new indebtedness. Reductions in our available borrowing capacity or inability to obtain credit when required or when business conditions warrant could materially and adversely affect us.
Furthermore, if prevailing interest rates or other factors at the time of refinancing result in higher interest rates upon refinancing, then the interest expense relating to that refinanced indebtedness would increase. Higher interest rates on newly incurred debt may negatively impact us as well. If interest rates increase, our interest costs and overall costs of capital will increase, which could materially and adversely affect us. Total debt service, including scheduled principal maturities and interest, for 20172018 and 20182019 is $372.7$401.4 million and $795.2$712.2 million, respectively. Debt service for 20172018 also includes $26.6$64.3 million for the acceleration of principal payable following an event of default under 26 separate CMBS loans with stated maturities in 2017.2018.
Some of our financing arrangements involve balloon payment obligations.
Some of our financings require us to make a lump-sum or “balloon” payment at maturity. Our ability to make any balloon payment is uncertain and may depend on our ability to obtain additional financing or our ability to sell our properties. At the time the balloon payment is due, we may or may not be able to refinance the balloon payment on terms as favorable as the original loan or sell our properties at a price sufficient to make the balloon payment, if at all. If the balloon payment is refinanced at a higher rate, it will reduce or eliminate any income from our properties. Our inability to meet a balloon payment obligation, through refinancing or sale proceeds, or refinancing on less attractive terms could materially and adversely affect us. We have balloon maturities, excluding debt extendible at our option, of $187.9$189.3 million and $182.8$514.5 million in 20172018 and 2018,2019, respectively, including $26.6$64.3 million on defaulted loans. If we are unable to refinance these maturities or otherwise retire the indebtedness by that time, we could be materially adversely affected, and could be forced to relinquish the related collateral.
The agreements governing our indebtedness contain restrictions and covenants which may limit our ability to enter into or obtain funding for certain transactions, operate our business or make distributions to our preferred and common stockholders.
The agreements governing our indebtedness contain restrictions and covenants that limit or will limit our ability to operate our business. These covenants, as well as any additional covenants to which we may be subject in the future because of additional indebtedness, could cause us to forgo investment opportunities, reduce or eliminate distributions to our preferred and common stockholders or obtain financing that is more expensive than financing we could obtain if we were not subject to the covenants. In addition, the agreements may have cross default provisions, which provide that a default under one of our financing agreements would lead to a default on some or all of our debt financing agreements.
If an event of default occurs under certain of our CMBS loans, if the master tenants at the properties that secure the CMBS loans fail to maintain certain EBITDAR ratios or if an uncured monetary default exists under the master leases, then a portion of or all of the cash which would otherwise be distributed to us may be restricted by the lenders and unavailable to us until the terms are cured or the debt refinanced. If the financial performance of the collateral for our indebtedness under our Spirit Master Funding Program fails to achieve certain financial performance criteria, cash from such collateral may be unavailable to us until the terms are cured or the debt refinanced. Such cash sweep triggering events have occurred previously and may be ongoing from time to time. The occurrence of these events limit the amount of cash available to us for use in our business and could limit or eliminate our ability to make distributions to our common stockholders.
The covenants and other restrictions under our debt agreements affect, among other things, our ability to:
incur indebtedness;
create liens on assets;
sell or substitute assets;
modify certain terms of our leases;
prepay debt with higher interest rates;
manage our cash flows; and
make distributions to equity holders.
Additionally, these restrictions may adversely affect our operating and financial flexibility and may limit our ability to respond to changes in our business or competitive environment, all of which may materially and adversely affect us.
Risks Related to Our Organizational StructureRISKS RELATED TO OUR ORGANIZATIONAL STRUCTURE
Our charter and bylaws and Maryland law contain provisions that may delay, defer or prevent a change of control transaction, even if such a change in control may be in the interest of our stockholders.
Our charter contains certain restrictions on ownership and transfer of our stock. Our charter contains various provisions that are intended to preserve our qualification as a REIT and, subject to certain exceptions, authorize our directors to take such actions as are necessary or appropriate to preserve our qualification as a REIT. For example, our charter prohibits the actual, beneficial or constructive ownership by any person of more than 9.8% in value or number of shares, whichever is more restrictive, of the outstanding shares of our common stock or more than 9.8% in value of the aggregate of the outstanding shares of all classes and series of our stock. Our boardBoard of directors,Directors, in its sole and absolute discretion, may exempt a person, prospectively or retroactively, from these ownership limits if certain conditions are satisfied. The restrictions on ownership and transfer of our stock may:
discourage a tender offer or other transactions or a change in management or of control that might involve a premium price for our common stock or that our stockholders otherwise believe to be in their best interests; or
result in the transfer of shares acquired in excess of the restrictions to a trust for the benefit of a charitable beneficiary and, as a result, the forfeiture by the acquirer of the benefits of owning the additional shares.
We could increase the number of authorized shares of stock, classify and reclassify unissuedun-issued stock and issue stock without stockholder approval. Our boardBoard of directors,Directors, without stockholder approval, has the power under our charter to amend our charter to increase the aggregate number of shares of stock or the number of shares of stock of any class or series that we are authorized to issue, to authorize us to issue authorized but unissuedun-issued shares of our common stock or preferred stock and to classify or reclassify any unissuedun-issued shares of our common stock or preferred stock into one or more classes or series of stock and to set the terms of such newly classified or reclassified shares. As a result, we may issue one or more series or classes of common stock or preferred stock with preferences, dividends, powers and rights, voting or otherwise, that are senior to, or otherwise conflict with, the rights of our common stockholders. Although our boardBoard of directorsDirectors has no such intention at the present time, it could establish a class or series of common stock or preferred stock that could, depending on the terms of such series, delay, defer or prevent a transaction or a change of control that might involve a premium price for our common stock or otherwise be in the best interest of our stockholders.
Certain provisions of Maryland law could inhibit changes in control, which may discourage third parties from conducting a tender offer or seeking other change of control transactions that could involve a premium price for our common stock or that our stockholders otherwise believe to be in their best interest. Certain provisions of the MGCL may have the effect of inhibiting a third party from making a proposal to acquire us or of impeding a change of control under
circumstances that otherwise could provide our common stockholders with the opportunity to realize a premium over the then-prevailing market price of such shares, including:
“business combination” provisions that, subject to certain limitations, prohibit certain business combinations between us and an “interested stockholder” (defined generally as any person who beneficially owns 10% or more of the voting power of our shares or of an affiliate of ours or an affiliate or associate of ours who was the beneficial owner, directly or indirectly, of 10% or more of the voting power of our then outstanding voting stock at any time within a two-year period immediately prior to the date in question) or any affiliate of an interested stockholder for five years after the most recent date on which the stockholder becomes an interested
stockholder, and thereafter impose fair price and/or supermajoritysuper-majority and stockholder voting requirements on these combinations; and
“control share” provisions that provide that a holder of “control shares” of our Company (defined as shares that, when aggregated with other shares controlled by the stockholder, entitle the stockholder to exercise one of three increasing ranges of voting power in electing directors) acquired in a “control share acquisition” (defined as the direct or indirect acquisition of ownership or control of outstanding “control shares”) has no voting rights with respect to those shares except to the extent approved by our stockholders by the affirmative vote of at least two-thirds of all the votes entitled to be cast on the matter, excluding all interested shares.
As permitted by the MGCL, we have elected, by resolution of our boardBoard of directors,Directors, to opt out of the business combination provisions of the MGCL and, pursuant to a provision in our bylaws, to exempt any acquisition of our stock from the control share provisions of the MGCL. However, our boardBoard of directorsDirectors may by resolution elect to repeal the exemption from the business combination provisions of the MGCL and may by amendment to our bylaws opt into the control share provisions of the MGCL at any time in the future, whether before or after an acquisition of control shares.
Certain provisions of the MGCL permit our boardBoard of directors,Directors, without stockholder approval and regardless of what is currently provided in our charter or bylaws, to implement certain corporate governance provisions, some of which (for example, a classified board) are not currently applicable to us. These provisions may have the effect of limiting or precluding a third party from making an unsolicited acquisition proposal for us or of delaying, deferring or preventing a change in control of us under circumstances that otherwise could be in the best interests of our stockholders. Our charter contains a provision whereby we elect, at such time as we become eligible to do so, to be subject to the provisions of Title 3, Subtitle 8 of the MGCL relating to the filling of vacancies on our boardBoard of directors.Directors.
Termination of the employment agreements with certain members of our senior management team could be costly and prevent a change in control of our company.
The employment agreements with certain members of our senior management team provide that if their employment with us terminates under certain circumstances (including in connection with a change in control of our company), we may be required to pay them significant amounts of severance compensation, thereby making it costly to terminate their employment. Furthermore, these provisions could delay or prevent a transaction or a change in control of our Company that might involve a premium paid for shares of our common stock or otherwise be in the best interests of our stockholders.
Our boardBoard of directorsDirectors may change our investment and financing policies without stockholder approval and we may become more highly leveraged, which may increase our risk of default under our debt obligations.
Our investment and financing policies are exclusively determined by our boardBoard of directors.Directors. Accordingly, our stockholders do not control these policies. Further, our organizational documents do not limit the amount or percentage of indebtedness, funded or otherwise, that we may incur. Our boardBoard of directorsDirectors may alter or eliminate our current policy on borrowing at any time without stockholder approval. If this policy changed, we could become more highly leveraged, which could result in an increase in our debt service. Higher leverage also increases the risk of default on our obligations. In addition, a change in our investment policies, including the manner in which we allocate our resources across our portfolio or the types of assets in which we seek to invest, may increase our exposure to interest rate risk, real estate market fluctuations and liquidity risk. Changes to our policies with regards to the foregoing could materially and adversely affect us.
Our rights and the rights of our stockholders to take action against our directors and officers are limited.
As permitted by Maryland law, our charter limits the liability of our directors and officers to us and our stockholders for money damages, except for liability resulting from:
actual receipt of an improper benefit or profit in money, property or services; or
active and deliberate dishonesty by the director or officer that was established by a final judgment as being material to the cause of action adjudicated.
As a result, we and our stockholders have rights against our directors and officers that are more limited than might otherwise exist. Accordingly, in the event that actions taken in good faith by any of our directors or officers impede the performance of our company, our stockholders' and our ability to recover damages from such director or officer will be limited. In addition, our charter authorizes us to obligate our company, and our bylaws require us, to indemnify our directors and officers for actions taken by them in those and certain other capacities to the maximum extent permitted by Maryland law.
We are a holding company with no direct operations and will rely on funds received from the Operating Partnership to pay liabilities.
We are a holding company and conduct substantially all of our operations through the Operating Partnership. We do not have, apart from an interest in the Operating Partnership, any independent operations. As a result, we rely on distributions from the Operating Partnership to pay any dividends we might declare on shares of our common stock. We also rely on distributions from the Operating Partnership to meet any of our obligations, including any tax liability on taxable income allocated to us from the Operating Partnership. In addition, because we are a holding company, stockholder claims will be structurally subordinated to all existing and future liabilities and obligations (whether or not for borrowed money) of the Operating Partnership and its subsidiaries. Therefore, in the event of our bankruptcy, liquidation or reorganization, our assets and those of the Operating Partnership and its subsidiaries will be able to satisfy the claims of our stockholders only after all of our and the Operating Partnership’s and its subsidiaries’ liabilities and obligations have been paid in full.
We own directly or indirectly 100% of the interests in the Operating Partnership. However, in connection with our future acquisition of properties or otherwise, we may issue partnership interests of the Operating Partnership to third parties. Such issuances would reduce our ownership in the Operating Partnership. Because our stockholders will not directly own partnership interests of the Operating Partnership, they will not have any voting rights with respect to any such issuances or other partnership level activities of the Operating Partnership.
Conflicts of interest could arise in the future between the interests of our stockholders and the interests of holders of partnership interests in the Operating Partnership, which may impede business decisions that could benefit our stockholders.
Conflicts of interest could arise in the future as a result of the relationships between us and our affiliates, on the one hand, and the Operating Partnership or any future partner thereof, on the other. Our directors and officers have duties to our company under applicable Maryland law in connection with the management of our company. At the same time, one of our wholly-owned subsidiaries, OP Holdings, as the general partner of the Operating Partnership, has fiduciary duties and obligations to the Operating Partnership and its future limited partners under Delaware law and the partnership agreement of the Operating Partnership in connection with the management of the Operating Partnership. The fiduciary duties and obligations of OP Holdings, as general partner of the Operating Partnership, and its future partners may come into conflict with the duties of the directors and officers of our company.
Under the terms of the partnership agreement of the Operating Partnership, if there is a conflict between the interests of our stockholders on one hand and any future limited partners on the other, we will endeavor in good faith to resolve the conflict in a manner not adverse to either our stockholders or any future limited partners; provided, however, that for so long as we own a controlling interest in the Operating Partnership, any conflict that cannot be resolved in a manner not adverse to either our stockholders or any future limited partners shall be resolved in favor of our stockholders.
The partnership agreement also provides that the general partner will not be liable to the Operating Partnership, its partners or any other person bound by the partnership agreement for monetary damages for losses sustained, liabilities incurred or benefits not derived by the Operating Partnership or any future limited partner, except for liability for the general partner’s intentional harm or gross negligence. Moreover, the partnership agreement provides that the Operating Partnership is required to indemnify the general partner and its members, managers, managing members, officers, employees, agents and designees from and against any and all claims that relate to the operations of the
Operating Partnership, except (1) if the act or omission of the person was material to the matter giving rise to the action and either was committed in bad faith or was the result of active or deliberate dishonesty, (2) for any transaction for which the indemnified party received an improper personal benefit, in money, property or services or otherwise in violation or breach of any provision of the partnership agreement or (3) in the case of a criminal proceeding, if the indemnified person had reasonable cause to believe that the act or omission was unlawful.
Risks Related to Taxes and Our Status as aRISKS RELATED TO TAXES AND OUR STATUS AS A REIT
Failure to qualify as a REIT would materially and adversely affect us and the value of our common stock.
We believe that we have been organized and have operated in a manner that has allowed us to qualify as a REIT for federal income tax purposes commencing with our taxable year ended December 31, 2005 and we intend to continue operating in such a manner. We have not requested and do not plan to request a ruling from the IRS that we qualify as a REIT and the statements in this Annual Report on Form 10-K are not binding on the IRS or any court. Therefore, we cannot guarantee that we have qualified as a REIT or that we will remain qualified as such in the future. If we lose
our REIT status, we will face significant tax consequences that would substantially reduce our cash available for distribution to our stockholders for each of the years involved because:
we would not be allowed a deduction for distributions to stockholders in computing our taxable income and would be subject to federal income tax at regular corporate rates;
we could be subject to the federal alternative minimum tax for tax years prior to 2018 and increased state and local taxes; and
unless we are entitled to relief under applicable statutory provisions, we could not elect to be taxed as a REIT for four taxable years following the year during which we were disqualified.
Any such corporate tax liability could be substantial and would reduce our cash available for, among other things, our operations and distributions to stockholders. In addition, if we fail to qualify as a REIT, we will not be required to make distributions to our stockholders. As a result of all these factors, our failure to qualify as a REIT also could impair our ability to expand our business and raise capital, and could materially and adversely affect the trading price of our common stock.
Qualification as a REIT involves the application of highly technical and complex Code provisions for which there are only limited judicial and administrative interpretations. The determination of various factual matters and circumstances not entirely within our control may affect our ability to qualify as a REIT. In order to qualify as a REIT, we must satisfy a number of requirements, including requirements regarding the ownership of our stock, requirements regarding the composition of our assets and a requirement that at least 95% of our gross income in any year must be derived from qualifying sources, such as “rents from real property.” Also, we must make distributions to stockholders aggregating annually at least 90% of our REIT taxable income, determined without regard to the dividends paid deduction and excluding any net capital gains. In addition, legislation, new regulations, administrative interpretations or court decisions may materially and adversely affect our investors, our ability to qualify as a REIT for federal income tax purposes or the desirability of an investment in a REIT relative to other investments.
Even if we qualify as a REIT for federal income tax purposes, we may be subject to some federal, state and local income, property and excise taxes on our income or property and, in certain cases, a 100% penalty tax, in the event we sell property as a dealer. In addition, our TRS will be subject to income tax as regular corporations in the jurisdictions in which they operate.
If the Operating Partnership fails to qualify as a partnership for federal income tax purposes, we would cease to qualify as a REIT and suffer other adverse consequences.
The Operating Partnership is currently treated as a partnership for federal income tax purposes and, therefore, is not subject to federal income tax on its income. Instead, each of its partners, including us, is allocated, and may be required to pay tax with respect to, such partner’s share of its income. We cannot assure you that the IRS will not challenge the status of the Operating Partnership or any other subsidiary partnership or limited liability company in which we own an interest as a disregarded entity or partnership for federal income tax purposes, or that a court would not sustain such a challenge. If the IRS were successful in treating the Operating Partnership or any such other subsidiary partnership or limited liability company as an entity taxable as a corporation for federal income tax purposes, we would fail to meet the gross income tests and certain of the asset tests applicable to REITs and, accordingly, we would likely cease to qualify as a REIT. Also, the failure of the Operating Partnership or any subsidiary partnerships or limited liability company to qualify as a disregarded entity or partnership for applicable income tax purposes could cause it to
become subject to federal and state corporate income tax, which would reduce significantly the amount of cash available for debt service and for distribution to its partners or members, including us.
Our ownership of taxable REIT subsidiariesTRSs is subject to certain restrictions, and we will be required to pay a 100% penalty tax on certain income or deductions if our transactions with our taxable REIT subsidiariesTRSs are not conducted on arm’s lengtharm’s-length terms.
Our TRSTRSs may acquire securities in additional taxable REIT subsidiariesTRSs in the future. A taxable REIT subsidiary is a corporation, other than a REIT, in which a REIT directly or indirectly holds stock and that has made a joint election with such REIT to be treated as a taxable REIT subsidiary. If a taxable REIT subsidiaryTRS owns more than 35% of the total voting power or value of the outstanding securities of another corporation, such other corporation will also be treated as a taxable REIT subsidiary.TRS. Other than some activities relating to lodging and health care facilities, a taxable REIT subsidiaryTRS may generally engage in any business, including the provision of customary or non-customary services to tenants of its parent REIT. A taxable REIT subsidiaryTRS is subject to federal income tax as a regular C corporation. In addition, a 100% excise tax will be imposed on certain transactions between a taxable REIT subsidiaryTRS and its parent REIT that are not conducted on an arm’s length basis.
A REIT’s ownership of securities of a taxable REIT subsidiaryTRS is not subject to the 5% or 10% asset tests applicable to REITs. Not more than 25% of the value of our total assets may be represented by securities (including securities of taxable REIT subsidiaries)TRSs), other than
those securities includable in the 75% asset test, and, for taxable years beginning after December 31, 2017, not more than 20% of the value of our total assets may be represented by securities of taxable REIT subsidiaries.TRSs. We anticipate that the aggregate value of the stock and securities of any TRS and other nonqualifying assets that we own will be less than 25% (or 20%, as applicable) of the value of our total assets, and we will monitor the value of these investments to ensure compliance with applicable ownership limitations. In addition, we intend to structure our transactions with any TRS that we own to ensure that they are entered into on arm’s length terms to avoid incurring the 100% excise tax described above. There can be no assurance, however, that we will be able to comply with the above limitations or to avoid application of the 100% excise tax discussed above.
We may be forced to borrow funds to maintain our REIT status, and the unavailability of such capital on favorable terms at the desired times, or at all, may cause us to curtail our investment activities and/or to dispose of assets at inopportune times, which could materially and adversely affect us.
To qualify as a REIT, we generally must distribute to our stockholders at least 90% of our REIT taxable income each year, determined without regard to the dividends paid deduction and excluding any net capital gains, and we will be subject to regular corporate income taxes on our undistributed taxable income to the extent that we distribute less than 100% of our REIT taxable income, determined without regard to the dividends paid deduction and including any net capital gains, each year. In addition, we will be subject to a 4% nondeductible excise tax on the amount, if any, by which distributions paid by us in any calendar year are less than the sum of 85% of our ordinary income, 95% of our capital gain net income and 100% of our undistributed income from prior years. In order to maintain our REIT status and avoid the payment of income and excise taxes, we may need to borrow funds to meet the REIT distribution requirements even if the then prevailing market conditions are not favorable for these borrowings. These borrowing needs could result from, among other things, differences in timing between the actual receipt of cash and recognition of income for federal income tax purposes, or the effect of non-deductible capital expenditures, the creation of reserves or required debt or amortization payments. These sources, however, may not be available on favorable terms or at all. Our access to third-party sources of capital depends on a number of factors, including the market’s perception of our growth potential, our current debt levels, the market price of our common stock, and our current and potential future earnings. We cannot assure you that we will have access to such capital on favorable terms at the desired times, or at all, which may cause us to curtail our investment activities and/or to dispose of assets at inopportune times, and could materially and adversely affect us.
The IRS may treat sale-leaseback transactions as loans, which could jeopardize our REIT status or require us to make an unexpected distribution.
The IRS may take the position that specific sale-leaseback transactions that we treat as leases are not true leases for federal income tax purposes but are, instead, financing arrangements or loans. If a sale-leaseback transaction were so re-characterized, we might fail to satisfy the REIT asset tests, the income tests or distribution requirements and consequently lose our REIT status effective with the year of re-characterization unless we elect to make an additional distribution to maintain our REIT status. The primary risk relates to our loss of previously incurred depreciation expenses, which could affect the calculation of our REIT taxable income and could cause us to fail the REIT distribution test that requires a REIT to distribute at least 90% of its REIT taxable income, determined without regard to the dividends paid
deduction and excluding any net capital gain. In this circumstance, we may elect to distribute an additional dividend of the increased taxable income so as not to fail the REIT distribution test. This distribution would be paid to all stockholders at the time of declaration rather than the stockholders existing in the taxable year affected by the re-characterization.
Dividends payable by REITs generally do not qualify for the reduced tax rates available for some dividends, which may negatively affect the value of our shares.
Income from “qualified dividends” payable to U.S. stockholders that are individuals, trusts and estates are generally subject to tax at preferential rates. Dividends payable by REITs, however, generally are not eligible for the preferential tax rates applicable to qualified dividend income. Under the 2017 Tax Legislation, however, U.S. stockholders that are individuals, trusts and estates generally may deduct up to 20% of the ordinary dividends (e.g., dividends not designated as capital gain dividends or qualified dividend income) received from a REIT for taxable years beginning after December 31, 2017 and before January 1, 2026. Although these rules do not adversely affect the taxation of REITs or dividends payable by REITs, this deduction reduces the effective tax rate applicable to certain dividends paid by REITs (generally to 29.6% assuming the shareholder is subject to the 37% maximum rate), such tax rate is still higher than the tax rate applicable to corporate dividends that constitute qualified dividend income. Accordingly, to the extent that the preferential rates continue to apply to regular corporate qualified dividends, investors who are individuals, trusts and estates may perceive investments in REITs to be relatively less attractive than investments in the stocks of non-REIT corporations
that pay dividends, which could materially and adversely affect the value of the shares of REITs, including the per share trading price of our common stock.
The tax imposed on REITs engaging in “prohibited transactions” may limit our ability to engage in transactions which would be treated as sales for federal income tax purposes.
A REIT’s net income from prohibited transactions is subject to a 100% penalty tax. In general, prohibited transactions are sales or other dispositions of property, other than foreclosure property, held primarily for sale to customers in the ordinary course of business. Although we do not intend to hold any properties that would be characterized as held for sale to customers in the ordinary course of our business, unless a sale or disposition qualifies under certain statutory safe harbors, such characterization is a factual determination and no guarantee can be given that the IRS would agree with our characterization of our properties or that we will always be able to make use of the available safe harbors.
Complying with REIT requirements may affect our profitability and may force us to liquidate or forgo otherwise attractive investments.
To qualify as a REIT, we must continually satisfy tests concerning, among other things, the nature and diversification of our assets, the sources of our income and the amounts we distribute to our stockholders. We may be required to liquidate or forgo otherwise attractive investments in order to satisfy the asset and income tests or to qualify under certain statutory relief provisions. We also may be required to make distributions to stockholders at disadvantageous times or when we do not have funds readily available for distribution. As a result, having to comply with the distribution requirement could cause us to: (1) sell assets in adverse market conditions; (2) borrow on unfavorable terms; or (3) distribute amounts that would otherwise be invested in future acquisitions, capital expenditures or repayment of debt. Accordingly, satisfying the REIT requirements could materially and adversely affect us. Moreover, if we are compelled to liquidate our investments to meet any of these asset, income or distribution tests, or to repay obligations to our lenders, we may be unable to comply with one or more of the requirements applicable to REITs or may be subject to a 100% tax on any resulting gain if such sales constitute prohibited transactions.
Legislative or other actions affecting REITs could have a negative effect on us.
The rules dealing with federal income taxation are constantly under review by persons involved in the legislative process and by the IRS and the U.S. Department of the Treasury. Changes to the tax laws, with or without retroactive application, could materially and adversely affect our investors or us. We cannot predict how changes in the tax laws might affect our investors or us. New legislation, Treasury Regulations, administrative interpretations or court decisions could significantly and negatively affect our ability to qualify as a REIT or the federal income tax consequences of such qualification, or the federal income tax consequences of an investment in us. Also, the law relating to the tax treatment of other entities, or an investment in other entities, could change, making an investment in such other entities more attractive relative to an investment in a REIT.
The 2017 Tax Legislation has significantly changed the U.S. federal income taxation of U.S. businesses and their owners, including REITs and their stockholders. Changes made by the 2017 Tax Legislation that could affect the Company and its stockholders include:
temporarily reducing individual U.S. federal income tax rates on ordinary income; the highest individual U.S. federal income tax rate has been reduced from 39.6% to 37% for taxable years beginning after December 31, 2017 and before January 1, 2026;
permanently eliminating the progressive corporate tax rate structure, which previously imposed a maximum corporate tax rate of 35%, and replacing it with a flat corporate tax rate of 21%;
permitting a deduction for certain pass-through business income, including dividends received by our stockholders from us that are not designated by us as capital gain dividends or qualified dividend income, which will allow individuals, trusts, and estates to deduct up to 20% of such amounts for taxable years beginning after December 31, 2017 and before January 1, 2026;
reducing the highest rate of withholding with respect to our distributions to non-U.S. stockholders that are treated as attributable to gains from the sale or exchange of U.S. real property interests from 35% to 21%;
limiting our deduction for net operating losses arising in taxable years beginning after December 31, 2017 to 80% of our REIT taxable income (prior to the application of the dividends paid deduction);
generally limiting the deduction for net business interest expense in excess of 30% of a business’s “adjusted taxable income,” except for taxpayers that engage in certain real estate businesses (including
most equity REITs) and elect out of this rule (provided that such electing taxpayers must use an alternative depreciation system with longer depreciation periods); and
eliminating the corporate alternative minimum tax.
Many of these changes are effective immediately, without any transition periods or grandfathering for existing transactions. The legislation is unclear in many respects and could be subject to potential amendments and technical corrections, as well as interpretations and implementing regulations by the Treasury and IRS, any of which could lessen or increase the impact of the legislation. In addition, it is unclear how these U.S. federal income tax changes will affect state and local taxation, which often uses federal taxable income as a starting point for computing state and local tax liabilities.
While some of the changes made by the tax legislation may adversely affect the Company in one or more reporting periods and prospectively, other changes may be beneficial on a going forward basis. The Company continues to work with its tax advisers and auditors to determine the full impact that the recent tax legislation as a whole will have on the Company.
Item 1B. Unresolved Staff Comments
None.
Item 2. Properties
Our Real Estate Investment PortfolioPROPERTY PORTFOLIO DIVERSIFICATION
As of December 31, 2016, our investment in real estate and loans totaled approximately $8.2 billion, representing investments in 2,615 properties. Of this amount, 99.2% consisted of our investment in real estate, representing ownership of 2,541 properties, and the remaining 0.8% consisted primarily of commercial mortgage loans receivable secured by 74 real properties. Over 84.0% of our leases (based on Normalized Rental Revenue) as of December 31, 2016 are triple-net, under which the tenant is typically responsible for all improvements and is contractually obligated to pay all property operating expenses, such as real estate taxes, insurance premiums and repair and maintenance costs. Due to the triple-net structure of our leases, we do not expect to incur significant capital expenditures relating to our triple-net leased properties, and the potential impact of inflation on our operating expenses is reduced.Property Portfolio Information |
| | | | |
| 2,392 | 99.2% | 49 | 419 | 30 |
| Properties | Occupancy | States | Tenants | Industries |
Our diverse real estate portfolio at December 31, 2016 consisted of 2,541 owned properties:
leased to 450 tenants;
located in 49 states, as well as in the U.S. Virgin Islands, with only 5 states each contributing 5% or more of our Normalized Rental Revenue;
operating in 28 different industries;
with an occupancy rate of 98.2%; and
with a weighted average remaining lease term of 10.7 years.
Property Portfolio Diversification
The following tables present the diversity of our properties owned at December 31, 2016. The portfolio metrics are calculated based on the percentage of Normalized Rental Revenue.
Diversification By Tenant
The following table sets forth information regardingTenant concentration represents the diversificationtenant's contribution to Contractual Rent of our owned real estate properties among different tenants as of December 31, 2016:2017:
| | Tenant (1) | Number of Properties | | Total Square Feet
(in thousands) | | Percent of Normalized Rental Revenue | Number of Properties | | Total Square Feet
(in thousands) | | Percent of Contractual Rent |
| Shopko | 116 |
| | 7,798 |
| | 8.2 | % | |
| | | | | | | |
| Specialty Retail Shops Holding Corp. | | 99 |
| | 6,701 |
| | 7.7 | % |
| AMC Entertainment, Inc | | 18 |
| | 917 |
| | 2.6 |
|
| Walgreen Company | 49 |
| | 722 |
| | 2.7 |
| 39 |
| | 578 |
| | 2.2 |
|
| AMC Entertainment, Inc. | 17 |
| | 862 |
| | 2.3 |
| |
| Cajun Global, LLC | 192 |
| | 271 |
| | 2.2 |
| |
| AB Acquisition, LLC | 23 |
| | 1,030 |
| | 2.1 |
| |
| Cajun Global LLC | | 182 |
| | 258 |
| | 2.2 |
|
| Academy, LTD. | | 6 |
| | 1,805 |
| | 2.0 |
|
| Alimentation Couche-Tard, Inc. | 83 |
| | 250 |
| | 1.9 |
| 82 |
| | 248 |
| | 1.9 |
|
| Academy, LTD | 6 |
| | 2,769 |
| | 1.9 |
| |
| The Home Depot, Inc. | | 7 |
| | 821 |
| | 1.8 |
|
| Regal Entertainment Group | 15 |
| | 656 |
| | 1.5 |
| 15 |
| | 656 |
| | 1.5 |
|
| GPM Investments, LLC | 105 |
| | 272 |
| | 1.5 |
| |
| Carmax, Inc | | 8 |
| | 356 |
| | 1.5 |
|
| CVS Caremark Corporation | 36 |
| | 405 |
| | 1.5 |
| 34 |
| | 383 |
| | 1.5 |
|
| Other | 1,853 |
| | 35,823 |
| | 74.2 |
| 1,883 |
| | 33,748 |
| | 75.1 |
|
| Vacant | 46 |
| | 2,029 |
| | — |
| 19 |
| | 1,734 |
| | — |
|
| Total | 2,541 |
| | 52,887 |
| | 100.0 | % | 2,392 |
| | 48,205 |
| | 100.0 | % |
(1) Tenants represent legal entities ultimately responsible for obligations under the lease agreements or affiliated entities. Other tenants may operate the same or similar business concepts or brands as those set forth above.
Diversification By Industry
The following table sets forth information regarding the diversification of our owned real estate properties among different industries as of December 31, 2016:
|
| | | | | | | | |
| Industry | Number of Properties | | Total Square Feet
(in thousands) | | Percent of Normalized Rental Revenue |
| General Merchandise | 156 |
| | 9,224 |
| | 9.9 | % |
| Restaurants - Casual Dining | 339 |
| | 2,041 |
| | 8.9 |
|
| Restaurants - Quick Service | 588 |
| | 1,359 |
| | 8.1 |
|
| Movie Theaters | 60 |
| | 3,012 |
| | 7.4 |
|
| Convenience Stores | 347 |
| | 1,100 |
| | 7.0 |
|
| Grocery | 66 |
| | 3,127 |
| | 6.2 |
|
| Drug Stores / Pharmacies | 111 |
| | 1,560 |
| | 5.3 |
|
| Medical / Other Office | 122 |
| | 1,293 |
| | 4.8 |
|
| Sporting Goods | 29 |
| | 4,209 |
| | 4.2 |
|
| Health and Fitness | 45 |
| | 1,800 |
| | 4.0 |
|
| Automotive Parts and Service | 185 |
| | 1,338 |
| | 3.7 |
|
| Entertainment | 23 |
| | 1,129 |
| | 2.9 |
|
| Home Furnishings | 33 |
| | 2,305 |
| | 2.8 |
|
| Education | 54 |
| | 821 |
| | 2.6 |
|
| Building Materials | 64 |
| | 2,291 |
| | 2.5 |
|
| Apparel | 13 |
| | 2,321 |
| | 2.5 |
|
| Specialty Retail | 30 |
| | 1,630 |
| | 2.4 |
|
| Automotive Dealers | 23 |
| | 665 |
| | 2.3 |
|
| Home Improvement | 13 |
| | 1,656 |
| | 2.0 |
|
| Distribution | 13 |
| | 1,372 |
| | 1.9 |
|
| Car Washes | 37 |
| | 217 |
| | 1.6 |
|
| Manufacturing | 19 |
| | 2,662 |
| | 1.4 |
|
| Dollar Stores | 83 |
| | 859 |
| | 1.3 |
|
| Consumer Electronics | 10 |
| | 529 |
| | 1.1 |
|
| Pet Supplies and Service | 4 |
| | 1,016 |
| | * |
|
| Wholesale Clubs | 4 |
| | 393 |
| | * |
|
| Office Supplies | 17 |
| | 400 |
| | * |
|
| Financial Services | 4 |
| | 372 |
| | * |
|
| Other | 3 |
| | 157 |
| | * |
|
| Vacant | 46 |
| | 2,029 |
| | — |
|
| Total | 2,541 |
| | 52,887 |
| | 100.0 | % |
* Less than 1%
Diversification By Asset Type
The following table sets forth information regardingAsset type concentration represents the diversificationtype of asset's contribution to Contractual Rent of our owned real estate properties among different asset types as of December 31, 2016:2017:
|
| | | | | | |
| Asset Type | Number of Properties | | Total Square Feet (in thousands) | |
| | | | | |
| Retail | 2,206 |
| | 36,421 |
| |
| Industrial | 68 |
| | 9,265 |
| |
| Office | 118 |
| | 2,519 |
| |
| Total | 2,392 |
| | 48,205 |
| |
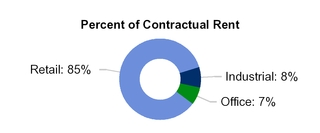
|
| | | | | | | | |
| Asset Type | Number of Properties | | Total Square Feet (in thousands) | | Percent of Normalized Rental Revenue |
| Retail | 2,345 |
| | 39,553 |
| | 86.0 | % |
| Industrial | 73 |
| | 11,069 |
| | 8.0 |
|
| Office | 123 |
| | 2,265 |
| | 6.0 |
|
| Total | 2,541 |
| | 52,887 |
| | 100.0 | % |
Diversification By GeographyIndustry
The following table sets forth information regardingIndustry concentration represents the geographic diversificationindustry's contribution to Contractual Rent of our owned real estate properties as of December 31, 2016:2017:
|
| | | | | | | | |
| Location | Number of Properties | | Total Square Feet
(in thousands) | | Percent of Normalized Rental Revenue |
| Texas | 313 |
| | 6,475 |
| | 12.5 | % |
| Georgia | 187 |
| | 3,378 |
| | 6.3 |
|
| Illinois | 118 |
| | 3,626 |
| | 5.8 |
|
| Florida | 151 |
| | 1,439 |
| | 5.3 |
|
| California | 59 |
| | 1,483 |
| | 5.2 |
|
| Ohio | 129 |
| | 2,417 |
| | 4.6 |
|
| Wisconsin | 52 |
| | 3,464 |
| | 4.1 |
|
| Minnesota | 56 |
| | 2,276 |
| | 3.4 |
|
| Michigan | 140 |
| | 1,921 |
| | 3.4 |
|
| Tennessee | 109 |
| | 1,403 |
| | 2.9 |
|
| Indiana | 81 |
| | 1,253 |
| | 2.7 |
|
| Missouri | 91 |
| | 1,389 |
| | 2.7 |
|
| North Carolina | 71 |
| | 1,408 |
| | 2.7 |
|
| Alabama | 110 |
| | 830 |
| | 2.5 |
|
| Arizona | 57 |
| | 753 |
| | 2.5 |
|
| South Carolina | 46 |
| | 962 |
| | 2.1 |
|
| Virginia | 61 |
| | 1,371 |
| | 2.0 |
|
| Colorado | 33 |
| | 1,040 |
| | 1.9 |
|
| Pennsylvania | 55 |
| | 1,119 |
| | 1.8 |
|
| Kansas | 40 |
| | 852 |
| | 1.7 |
|
| Nevada | 6 |
| | 1,039 |
| | 1.6 |
|
| New Mexico | 39 |
| | 548 |
| | 1.6 |
|
| Oklahoma | 68 |
| | 559 |
| | 1.5 |
|
| New York | 39 |
| | 738 |
| | 1.5 |
|
| Kentucky | 49 |
| | 635 |
| | 1.5 |
|
| Washington | 25 |
| | 726 |
| | 1.5 |
|
| Arkansas | 52 |
| | 618 |
| | 1.2 |
|
| New Jersey | 15 |
| | 895 |
| | 1.2 |
|
| Massachusetts | 4 |
| | 1,125 |
| | 1.1 |
|
| Oregon | 14 |
| | 453 |
| | 1.1 |
|
| Idaho | 16 |
| | 679 |
| | 1.1 |
|
|
| | | | | | | | |
| Industry | Number of Properties | | Total
Square Feet
(in thousands) | | Percent of Contractual Rent |
| | | | | | |
| General Merchandise | 111 |
| | 7,743 |
| | 8.9 | % |
| Restaurants - Casual Dining | 301 |
| | 1,797 |
| | 8.5 |
|
| Restaurants - Quick Service | 578 |
| | 1,349 |
| | 8.1 |
|
| Movie Theaters | 62 |
| | 3,115 |
| | 7.8 |
|
| Convenience Stores | 318 |
| | 1,026 |
| | 7.0 |
|
| Medical / Other Office | 120 |
| | 1,268 |
| | 4.9 |
|
| Grocery | 61 |
| | 2,968 |
| | 4.8 |
|
| Drug Stores / Pharmacies | 97 |
| | 1,372 |
| | 4.8 |
|
| Health and Fitness | 44 |
| | 1,775 |
| | 4.1 |
|
| Specialty Retail | 68 |
| | 2,442 |
| | 3.9 |
|
| Home Improvement | 38 |
| | 2,289 |
| | 3.7 |
|
| Sporting Goods | 18 |
| | 2,547 |
| | 3.4 |
|
| Entertainment | 26 |
| | 1,199 |
| | 3.1 |
|
| Education | 55 |
| | 821 |
| | 2.7 |
|
| Automotive Services | 128 |
| | 748 |
| | 2.7 |
|
| Home Furnishings | 26 |
| | 1,615 |
| | 2.4 |
|
| Automotive Dealers | 23 |
| | 664 |
| | 2.3 |
|
| Apparel | 13 |
| | 1,995 |
| | 2.3 |
|
| Car Washes | 41 |
| | 231 |
| | 1.9 |
|
| Other | 6 |
| | 978 |
| | 1.6 |
|
| Distribution | 11 |
| | 1,083 |
| | 1.6 |
|
| Building Materials | 38 |
| | 1,561 |
| | 1.4 |
|
| Manufacturing | 16 |
| | 2,050 |
| | 1.4 |
|
| Automotive Parts | 61 |
| | 523 |
| | 1.2 |
|
| Dollar Stores | 75 |
| | 770 |
| | 1.2 | % |
| Wholesale Clubs | 5 |
| | 513 |
| | 1.1 | % |
| Pet Supplies & Service | 6 |
| | 1,015 |
| | 1.0 | % |
| Financial Services | 4 |
| | 342 |
| | 1.0 | % |
| Office Supplies | 17 |
| | 448 |
| | 0.7 | % |
| Consumer Electronics | 6 |
| | 224 |
| | 0.5 | % |
| Vacant | 19 |
| | 1,734 |
| | — |
|
| Total | 2,392 |
| | 48,205 |
| | 100.0 | % |
Diversification By Geography
Geographic concentration represents the geographic region's contribution to Contractual Rent of our owned real estate properties as of December 31, 2017:
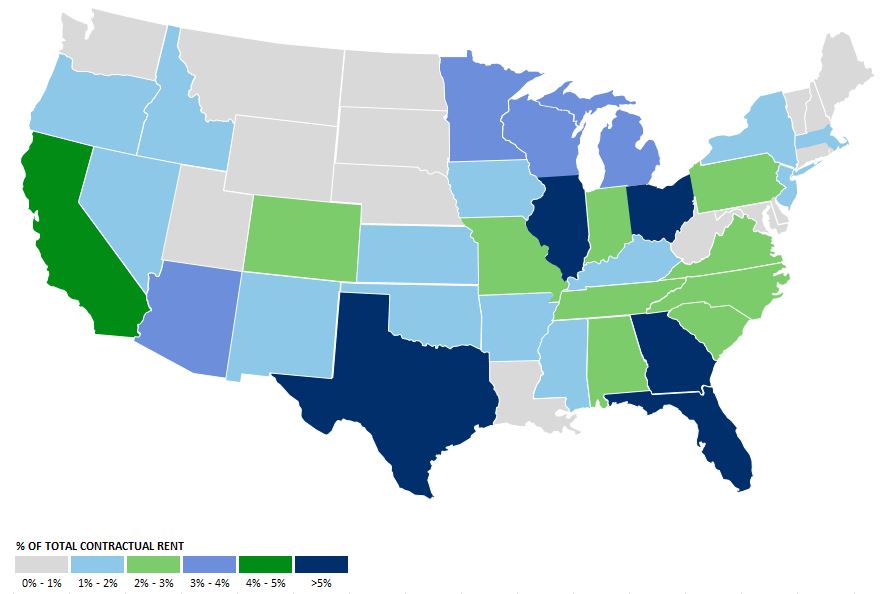
|
| | | | | | | | |
| Location | Number of Properties | | Total Square Feet
(in thousands) | | Percent of Normalized Rental Revenue |
| Iowa | 35 |
| | 638 |
| | 1.0 |
|
| Mississippi | 46 |
| | 422 |
| | 1.0 |
|
| New Hampshire | 16 |
| | 640 |
| | * |
|
| Louisiana | 28 |
| | 224 |
| | * |
|
| Maryland | 19 |
| | 242 |
| | * |
|
| Nebraska | 14 |
| | 521 |
| | * |
|
| Connecticut | 5 |
| | 686 |
| | * |
|
| South Dakota | 9 |
| | 395 |
| | * |
|
| Montana | 7 |
| | 430 |
| | * |
|
| West Virginia | 18 |
| | 297 |
| | * |
|
| Utah | 9 |
| | 806 |
| | * |
|
| North Dakota | 5 |
| | 236 |
| | * |
|
| Maine | 26 |
| | 79 |
| | * |
|
| Wyoming | 9 |
| | 185 |
| | * |
|
| Rhode Island | 4 |
| | 117 |
| | * |
|
| Alaska | 1 |
| | 38 |
| | * |
|
| Delaware | 1 |
| | 50 |
| | * |
|
| Virgin Islands | 1 |
| | 5 |
| | * |
|
| Vermont | 2 |
| | 2 |
| | * |
|
| Total | 2,541 |
| | 52,887 |
| | 100.0 | % |
|
| | | | | | | | | | | | | | | | | | | |
| Location | | Number of Properties | | Total Square Feet (in thousands) | | Percent of Contractual Rent | | Location (continued) | | Number of Properties | | Total Square Feet (in thousands) | | Percent of Contractual Rent |
| | | | | | | | | | | | | | | |
| Texas | | 299 |
| | 5,858 |
| | 12.0 | % | | Kansas | | 35 |
| | 644 |
| | 1.3 |
| Georgia | | 180 |
| | 2,064 |
| | 6.1 |
| | Massachusetts | | 3 |
| | 886 |
| | 1.2 |
| Florida | | 155 |
| | 1,579 |
| | 5.9 |
| | Iowa | | 31 |
| | 557 |
| | 1.1 |
| Illinois | | 109 |
| | 2,882 |
| | 5.8 |
| | Oregon | | 10 |
| | 444 |
| | 1.1 |
| Ohio | | 123 |
| | 2,209 |
| | 5.2 |
| | New Jersey | | 14 |
| | 883 |
| | 1.1 |
| California | | 36 |
| | 1,370 |
| | 4.2 |
| | Idaho | | 16 |
| | 679 |
| | 1.0 |
| Wisconsin | | 44 |
| | 2,978 |
| | 3.8 |
| | Mississippi | | 41 |
| | 360 |
| | 1.0 |
| Michigan | | 136 |
| | 2,097 |
| | 3.7 |
| | Washington | | 12 |
| | 462 |
| | 0.9 |
| Minnesota | | 49 |
| | 2,162 |
| | 3.5 |
| | New Hampshire | | 16 |
| | 640 |
| | 0.8 |
| Arizona | | 60 |
| | 940 |
| | 3.1 |
| | Maryland | | 19 |
| | 242 |
| | 0.7 |
| Missouri | | 91 |
| | 1,369 |
| | 2.9 |
| | Louisiana | | 24 |
| | 208 |
| | 0.7 |
| Tennessee | | 100 |
| | 1,367 |
| | 2.9 |
| | South Dakota | | 8 |
| | 390 |
| | 0.6 |
| Indiana | | 77 |
| | 1,175 |
| | 2.9 |
| | Montana | | 6 |
| | 406 |
| | 0.6 |
| South Carolina | | 44 |
| | 951 |
| | 2.7 |
| | Connecticut | | 5 |
| | 686 |
| | 0.6 |
| North Carolina | | 69 |
| | 1,250 |
| | 2.4 |
| | West Virginia | | 18 |
| | 297 |
| | 0.6 |
| Alabama | | 105 |
| | 712 |
| | 2.2 |
| | Utah | | 7 |
| | 548 |
| | 0.5 |
| Pennsylvania | | 55 |
| | 1,174 |
| | 2.0 |
| | North Dakota | | 5 |
| | 236 |
| | 0.4 |
| Virginia | | 60 |
| | 1,358 |
| | 2.0 |
| | Nebraska | | 12 |
| | 363 |
| | 0.4 |
| Colorado | | 29 |
| | 993 |
| | 2.0 |
| | Maine | | 25 |
| | 68 |
| | 0.4 |
| New York | | 37 |
| | 919 |
| | 1.7 |
| | Rhode Island | | 4 |
| | 117 |
| | 0.3 |
| New Mexico | | 37 |
| | 539 |
| | 1.7 |
| | Wyoming | | 8 |
| | 180 |
| | 0.2 |
| Oklahoma | | 66 |
| | 613 |
| | 1.5 |
| | Alaska | | 5 |
| | 63 |
| | 0.1 |
| Kentucky | | 46 |
| | 544 |
| | 1.4 |
| | U.S. V.I. | | 1 |
| | 38 |
| | 0.1 |
| Nevada | | 5 |
| | 1,099 |
| | 1.4 |
| | Delaware | | 1 |
| | 5 |
| | — |
| Arkansas | | 53 |
| | 599 |
| | 1.3 |
| | Vermont | | 1 |
| | 2 |
| | — |
* Less than 1%
Lease Expirations
The following table sets forth a summary schedule of expiration dates for leases in place as of December 31, 2016.2017. As of December 31, 2016,2017, the weighted average remaining non-cancelable initial term of our leases (based on Normalized Rental Revenue)Contractual Rent) was 10.710.0 years. The information set forth in the table assumes that tenants do not exercise renewal options and or any early termination rights:
| | | Leases Expiring In: | Number of Properties | | Normalized Rental Revenue Annualized
(in thousands) (1) | | Total Square Feet
(in thousands) | | Percent of Expiring Annual Rental Revenue | Number of Properties | | Contractual Rent Annualized
(in thousands) (1) | | Total Square Feet
(in thousands) | | Percent of Contractual Rent |
| 2017 | 69 |
| | $ | 3,052 |
| | 23,501 |
| | 3.6 | % | |
| | | | | | | | | |
| 2018 | 70 |
| | 1,885 |
| | 22,184 |
| | 3.4 |
| 50 |
| | $ | 17,026 |
| | 1,268 |
| | 2.8 | % |
| 2019 | 106 |
| | 1,920 |
| | 19,868 |
| | 3.1 |
| 101 |
| | 18,956 |
| | 1,636 |
| | 3.1 |
|
| 2020 | 74 |
| | 1,674 |
| | 20,669 |
| | 3.2 |
| 72 |
| | 18,797 |
| | 1,459 |
| | 3.1 |
|
| 2021 | 188 |
| | 3,905 |
| | 47,012 |
| | 7.3 |
| 178 |
| | 43,827 |
| | 3,630 |
| | 7.3 |
|
| 2022 | 97 |
| | 2,148 |
| | 26,296 |
| | 4.1 |
| 122 |
| | 34,010 |
| | 3,022 |
| | 5.7 |
|
| 2023 | 109 |
| | 3,440 |
| | 34,444 |
| | 5.3 |
| 122 |
| | 35,071 |
| | 3,757 |
| | 5.8 |
|
| 2024 | 58 |
| | 1,207 |
| | 21,106 |
| | 3.3 |
| 55 |
| | 22,293 |
| | 1,355 |
| | 3.7 |
|
| 2025 | 78 |
| | 2,116 |
| | 37,254 |
| | 5.8 |
| 77 |
| | 33,882 |
| | 2,039 |
| | 5.6 |
|
| 2026 | 200 |
| | 5,311 |
| | 47,094 |
| | 7.3 |
| 186 |
| | 41,529 |
| | 3,614 |
| | 6.9 |
|
| 2027 | | 209 |
| | 76,196 |
| | 6,009 |
| | 12.7 |
|
| Thereafter | 1,446 |
| | 24,200 |
| | 346,502 |
| | 53.6 |
| 1,201 |
| | 260,291 |
| | 18,682 |
| | 43.3 |
|
| Vacant | 46 |
| | 2,029 |
| | — |
| | — |
| 19 |
| | — |
| | 1,734 |
| | — |
|
| Total owned properties | 2,541 |
| | $ | 52,887 |
| | 645,930 |
| | 100.0 | % | 2,392 |
| | $ | 601,878 |
| | 48,205 |
| | 100.0 | % |
(1) Normalized Rental RevenueContractual Rent for the month ended December 31, 2017 for properties owned at December 31, 2017, multiplied by twelve.
Item 3. Legal Proceedings
From time-to-time, we may be subject to certain claims and lawsuits in the ordinary course of business, the outcome of which cannot be determined at this time. In the opinion of management, any liability we might incur upon the resolution of these claims and lawsuits will not, in the aggregate, have a material adverse effect on our consolidated financial position or results of operations.
Item 4. Mine Safety Disclosure
None.
PART II
Item 5.Market for Registrant’s Common Equity, Related Stockholder Matters and Issuer Purchases of Equity Securities
Market Information for Common Stock, Holders of Record and Dividend PolicyMARKET INFORMATION FOR COMMON STOCK, HOLDERS OF RECORD AND DIVIDEND POLICY
Spirit Realty Capital, Inc.
Our common stock is traded on the NYSE under the symbol “SRC.” The following table shows the high and low sales prices per share for our common stock as reported by the NYSE, and dividends declared per share of common stock, for the periods indicated.
| | | | Price Per Share of Common Stock | | Dividends | 2017 | | 2016 |
| | High | | Low | | Declared | Price Per Share of Common Stock | | Dividends Declared | | Price Per Share of Common Stock | | Dividends Declared |
| 2016 | | | | | | |
| | | High | | Low | | | | High | | Low | | |
| First quarter | $ | 11.25 |
| | $ | 9.10 |
| | $ | 0.17500 |
| $11.27 | | $9.99 | | $ | 0.18000 |
| | $11.25 | | $9.10 | | $ | 0.17500 |
|
| Second quarter | 12.77 |
| | 10.87 |
| | 0.17500 |
| $10.50 | | $6.71 | | 0.18000 |
| | $12.77 | | $10.87 | | 0.17500 |
|
| Third quarter | 13.88 |
| | 12.78 |
| | 0.17500 |
| $8.74 | | $7.32 | | 0.18000 |
| | $13.88 | | $12.78 | | 0.17500 |
|
| Fourth quarter | 13.10 |
| | 10.26 |
| | 0.18000 |
| $8.67 | | $7.95 | | 0.18000 |
| | $13.10 | | $10.26 | | 0.18000 |
|
| Total | | | | | $ | 0.70500 |
| | $ | 0.72000 |
| | $ | 0.70500 |
|
| | | | | | | |
| 2015 | | | | | | |
| First quarter | $ | 12.99 |
| | $ | 11.66 |
| | $ | 0.17000 |
| |
| Second quarter | 12.40 |
| | 9.67 |
| | 0.17000 |
| |
| Third quarter | 10.55 |
| | 9.04 |
| | 0.17000 |
| |
| Fourth quarter | 10.40 |
| | 9.33 |
| | 0.17500 |
| |
| Total | | | | | $ | 0.68500 |
| |
The closing sale price per share of our common stock on February 21, 2017, as reported by the NYSE, was $10.84. As of February 21, 2017,20, 2018, there were approximately 2,8272,574 stockholders of record of our common stock. Because many of our shares of common stock are held by brokers and other institutions on behalf of stockholders, we are unable to estimate the total number of stockholders represented by these record holders.
We intend to pay regular quarterly dividends to our stockholders, although all future distributions will be declared and paid at the discretion of the boardBoard of directorsDirectors and will depend upon cash generated by operating activities, our financial condition, capital requirements, annual distribution requirements under the REIT provisions of the Code and such other factors as the boardBoard of directorsDirectors deems relevant.
Spirit Realty, L.P.
Spirit Realty Capital, Inc. directly or indirectly owns all of Spirit Realty, L.P.'s partnership units. Therefore there is no established trading market for Spirit Realty, L.P.'s partnership units. The following table sets forth the distributions we declared with respect to Spirit Realty, L.P.'s partnership units for the periods indicated:
| | | | Distributions Declared | Distributions Declared |
| 2016 | | |
| | | 2017 | 2016 |
| First quarter | $ | 0.17500 |
| $ | 0.18000 |
| $ | 0.17500 |
|
| Second quarter | 0.17500 |
| 0.18000 |
| 0.17500 |
|
| Third quarter | 0.17500 |
| 0.18000 |
| 0.17500 |
|
| Fourth quarter | 0.18000 |
| 0.18000 |
| 0.18000 |
|
| Total | $ | 0.70500 |
| $ | 0.72000 |
| $ | 0.70500 |
|
| | | |
| 2015 | | |
| First quarter | $ | 0.17000 |
| |
| Second quarter | 0.17000 |
| |
| Third quarter | 0.17000 |
| |
| Fourth quarter | 0.17500 |
| |
| Total | $ | 0.68500 |
| |
Recent Sales of Unregistered Securities; Use of Proceeds From Registered SecuritiesRECENT SALES OF UNREGISTERED SECURITIES; USE OF PROCEEDS FROM REGISTERED SECURITIES
Spirit Realty Capital, Inc.
None.
Spirit Realty, L.P.
None.
Issuer Purchases
ISSUER PURCHASES OF EQUITY SECURITIES
The following table summarized the repurchases of Equity Securitiesthe Company's equity securities during the fourth quarter of 2017 :
|
| | | | | | | | | | | | | |
| | Total Number of Shares Purchased | | Average Price Paid Per Share | | Total Number of Shares Purchased as Part of Publicly Announced Plans or Programs | | Maximum Approximate Dollar Value of Shares That May Yet Be Purchased Under the Plans or Programs |
| Period | | | | | | | |
| October 1 - 31, 2017 | — |
| | — |
| | N/A | | N/A |
| November 1 - 30, 2017 | — |
| | — |
| | N/A | | N/A |
December 1 - 31, 2017 (1) | 7,020,100 |
| | $ | 8.64 |
| | 7,020,100 |
| | $ | 167,626,893 |
|
| Total | 7,020,100 |
| | $ | 8.64 |
| | 7,020,100 |
| | $ | 167,626,893 |
|
Spirit Realty Capital, Inc.(1) In August 2017, the Company's Board of Directors approved a new stock repurchase program, which authorizes the Company to repurchase up to $250.0 million of its common stock over the 18 month period following authorization. All repurchases during the fourth quarter of 2017 were made pursuant to this stock repurchase program. See Note 7 to the consolidated financial statements herein for further discussion. In accordance with the Operating Partnership's Second Amended and Restated Agreement of Limited Partnership, the Operating Partnership redeemed a number of units equal to the Company's shares repurchased.
None.
Spirit Realty, L.P.
None.
Equity Compensation Plan InformationEQUITY COMPENSATION PLAN INFORMATION
Our equity compensation plan information required by this item will be included in the Proxy Statement to be filed relating to our 20172018 Annual Meeting of Stockholders and is incorporated herein by reference.
Performance GraphPERFORMANCE GRAPH
The information below shall not be deemed to be “soliciting material” or to be “filed” with the SEC or subject to Regulation 14A or 14C, other than as provided in Item 201 of Regulation S-K, or to the liabilities of Section 18 of the Exchange Act, except to the extent we specifically request that such information be treated as soliciting material or specifically incorporate it by reference into a filing under the Securities Act or the Exchange Act.
The following graph shows our cumulative total stockholder return for the period beginning with the initial listing of our common stock on the NYSE on September 20, 2012 and ending on December 31, 2016,2017, with stock prices retroactively adjusted for the Merger Exchange Ratio. The graph assumes a $100 investment in each of the indices on September 20, 2012 and the reinvestment of all dividends. Our stock price performance shown in the following graph is not indicative of future stock price performance.
| | | | Period Ended | | Period Ended |
| Index: | 9/20/2012 |
| 12/31/2012 |
| 12/31/2013 |
| 12/31/2014 |
| 12/31/2015 |
| 12/31/2016 |
| 9/20/2012 | 12/31/2012 | 12/31/2013 | 12/31/2014 | 12/31/2015 | 12/31/2016 | 12/31/2017 |
| Spirit Realty Capital, Inc. | $ | 100 |
| $ | 121 |
| $ | 136 |
| $ | 175 |
| $ | 158 |
| $ | 181 |
| $ | 100 |
| $ | 121 |
| $ | 136 |
| $ | 175 |
| $ | 158 |
| $ | 181 |
| $ | 156 |
|
| S&P 500 | $ | 100 |
| $ | 98 |
| $ | 127 |
| $ | 141 |
| $ | 140 |
| $ | 153 |
| $ | 100 |
| $ | 98 |
| $ | 127 |
| $ | 141 |
| $ | 140 |
| $ | 153 |
| $ | 183 |
|
| NAREIT US Equity REIT Index | $ | 100 |
| $ | 101 |
| $ | 104 |
| $ | 135 |
| $ | 139 |
| $ | 151 |
| $ | 100 |
| $ | 101 |
| $ | 104 |
| $ | 135 |
| $ | 139 |
| $ | 151 |
| $ | 159 |
|
Item 6. Selected Financial Data
The following tables set forth, on a historical basis, selected financial and operating data for the Company. The following data should be read in conjunction with our financial statements and notes thereto and Item 7. "Management’s Discussion and Analysis of Financial Condition and Results of Operations” included in this Annual Report on Form 10-K.
| |
| Years Ended December 31, | Years Ended December 31, |
| 2016 (1) | | 2015 (1) | | 2014 (1) | | 2013 (1) | | 2012 | 2017 (1) | | 2016 (1) | | 2015 (1) | | 2014 (1) | | 2013 (1) |
| | (Dollars in thousands, except share and per share data) | (Dollars in thousands, except share and per share data) |
| Operating Data: | | | | | | | | | | | | | | | | | | |
| Revenues: | | | | | | | | | | | | | | | | | | |
| Rentals | $ | 648,363 |
| | $ | 634,151 |
| | $ | 574,456 |
| | $ | 404,402 |
| | $ | 266,567 |
| $ | 639,017 |
| | $ | 648,363 |
| | $ | 634,151 |
| | $ | 574,456 |
| | $ | 404,402 |
|
| Interest income on loans receivable | 5,253 |
| | 6,948 |
| | 7,239 |
| | 5,928 |
| | 5,696 |
| 3,791 |
| | 5,253 |
| | 6,948 |
| | 7,239 |
| | 5,928 |
|
| Earned income from direct financing leases | 2,742 |
| | 3,024 |
| | 3,343 |
| | 1,572 |
| | — |
| 2,078 |
| | 2,742 |
| | 3,024 |
| | 3,343 |
| | 1,572 |
|
| Tenant reimbursement income | 14,125 |
| | 15,952 |
| | 13,085 |
| | 5,637 |
| | — |
| 16,747 |
| | 14,125 |
| | 15,952 |
| | 13,085 |
| | 5,637 |
|
| Other income | 15,491 |
| | 7,260 |
| | 4,748 |
| | 1,928 |
| | 852 |
| 7,322 |
| | 15,491 |
| | 7,260 |
| | 4,748 |
| | 1,928 |
|
| Total revenues | 685,974 |
| | 667,335 |
| | 602,871 |
| | 419,467 |
| | 273,115 |
| 668,955 |
| | 685,974 |
| | 667,335 |
| | 602,871 |
| | 419,467 |
|
| Expenses: | | | | | | | | | | | | | | | | | | |
| General and administrative | 52,615 |
| | 47,730 |
| | 42,637 |
| | 35,146 |
| | 36,252 |
| 62,064 |
| | 52,615 |
| | 47,730 |
| | 42,637 |
| | 35,146 |
|
| Restructuring charges | 6,341 |
| | 7,056 |
| | — |
| | — |
| | — |
| — |
| | 6,341 |
| | 7,056 |
| | — |
| | — |
|
| Transaction costs | | 6,361 |
| | — |
| | — |
| | — |
| | — |
|
| Finance restructuring costs | — |
| | — |
| | 13,022 |
| | 717 |
| | — |
| — |
| | — |
| | — |
| | 13,022 |
| | 717 |
|
| Merger costs | — |
| | — |
| | — |
| | 56,644 |
| | — |
| — |
| | — |
| | — |
| | — |
| | 56,644 |
|
| Property costs | 30,839 |
| | 27,715 |
| | 23,383 |
| | 11,760 |
| | 5,176 |
| |
| Property costs (including reimbursable) | | 36,617 |
| | 30,839 |
| | 27,715 |
| | 23,383 |
| | 11,760 |
|
| Real estate acquisition costs | 3,229 |
| | 2,739 |
| | 3,631 |
| | 1,718 |
| | 1,054 |
| 1,356 |
| | 3,229 |
| | 2,739 |
| | 3,631 |
| | 1,718 |
|
| Interest | 196,586 |
| | 222,901 |
| | 220,070 |
| | 179,267 |
| | 156,220 |
| 190,127 |
| | 196,586 |
| | 222,901 |
| | 220,070 |
| | 179,267 |
|
| Depreciation and amortization | 262,276 |
| | 260,633 |
| | 247,966 |
| | 164,054 |
| | 104,984 |
| 256,019 |
| | 262,276 |
| | 260,633 |
| | 247,966 |
| | 164,054 |
|
| Impairments (recoveries) | 88,275 |
| | 70,695 |
| | 37,598 |
| | (185 | ) | | 8,918 |
| 102,330 |
| | 88,275 |
| | 70,695 |
| | 37,598 |
| | (185 | ) |
| Total expenses | 640,161 |
| | 639,469 |
| | 588,307 |
| | 449,121 |
| | 312,604 |
| 654,874 |
| | 640,161 |
| | 639,469 |
| | 588,307 |
| | 449,121 |
|
| Income (loss) from continuing operations before other expense and income tax expense | 45,813 |
| | 27,866 |
| | 14,564 |
| | (29,654 | ) | | (39,489 | ) | |
| Other expense: | | | | | | | | | | |
| Gain (loss) on debt extinguishment | 233 |
| | (3,162 | ) | | (64,750 | ) | | (2,405 | ) | | (32,522 | ) | |
| Total other income (expense) | 233 |
| | (3,162 | ) | | (64,750 | ) | | (2,405 | ) | | (32,522 | ) | |
| Income (loss) from continuing operations before other (expense) income and income tax expense | | 14,081 |
| | 45,813 |
| | 27,866 |
| | 14,564 |
| | (29,654 | ) |
| Other (expense) income: | | | | | | | | | | |
| (Loss) gain on debt extinguishment | | (1,645 | ) | | 233 |
| | (3,162 | ) | | (64,750 | ) | | (2,405 | ) |
| Total other (expense) income | | (1,645 | ) | | 233 |
| | (3,162 | ) | | (64,750 | ) | | (2,405 | ) |
| Income (loss) from continuing operations before income tax expense | 46,046 |
| | 24,704 |
| | (50,186 | ) | | (32,059 | ) | | (72,011 | ) | 12,436 |
| | 46,046 |
| | 24,704 |
| | (50,186 | ) | | (32,059 | ) |
| Income tax expense | (965 | ) | | (601 | ) | | (673 | ) | | (1,113 | ) | | (504 | ) | (394 | ) | | (965 | ) | | (601 | ) | | (673 | ) | | (1,113 | ) |
| Income (loss) from continuing operations | 45,081 |
| | 24,103 |
| | (50,859 | ) | | (33,172 | ) | | (72,515 | ) | 12,042 |
| | 45,081 |
| | 24,103 |
| | (50,859 | ) | | (33,172 | ) |
Discontinued operations: (2) | | | | | | | | | | | | | | | | | | |
| Income (loss) from discontinued operations | — |
| | 98 |
| | 3,368 |
| | (4,530 | ) | | (369 | ) | — |
| | — |
| | 98 |
| | 3,368 |
| | (4,530 | ) |
| Gain (loss) on disposition of assets | — |
| | 590 |
| | 325 |
| | 36,086 |
| | (3,349 | ) | |
| Income (loss) from discontinued operations | — |
| | 688 |
| | 3,693 |
| | 31,556 |
| | (3,718 | ) | |
| Gain on disposition of assets | | — |
| | — |
| | 590 |
| | 325 |
| | 36,086 |
|
| Income from discontinued operations | | — |
| | — |
| | 688 |
| | 3,693 |
| | 31,556 |
|
| Income (loss) before gain on disposition of assets | | 12,042 |
| | 45,081 |
| | 24,791 |
| | (47,166 | ) | | (1,616 | ) |
| Gain on disposition of assets | | 65,106 |
| | 52,365 |
| | 68,421 |
| | 10,221 |
| | — |
|
| Net income (loss) | | 77,148 |
| | 97,446 |
| | 93,212 |
| | (36,945 | ) | | (1,616 | ) |
| Less: preferred dividends | | (2,530 | ) | | — |
| | — |
| | — |
| | — |
|
| Net income (loss) attributable to common stockholders | | $ | 74,618 |
| | $ | 97,446 |
| | $ | 93,212 |
| | $ | (36,945 | ) | | $ | (1,616 | ) |
| | | Income (loss) before gain on disposition of assets | 45,081 |
| | 24,791 |
| | (47,166 | ) | | (1,616 | ) | | (76,233 | ) | |
| Gain on disposition of assets | 52,365 |
| | 68,421 |
| | 10,221 |
| | — |
| | — |
| |
| Net income (loss) | 97,446 |
| | 93,212 |
| | (36,945 | ) | | (1,616 | ) | | (76,233 | ) | |
| Less: preferred dividends | — |
| | — |
| | — |
| | — |
| | (63 | ) | |
| Net income (loss) attributable to common stockholders | $ | 97,446 |
| | $ | 93,212 |
| | $ | (36,945 | ) | | $ | (1,616 | ) | | $ | (76,296 | ) | |
| | | | | | | | | | | | | | | | | | | | | |
| Net income (loss) per share of common stock—basic: | | | | | | | | | | | | | | | | | | |
| Continuing operations | $ | 0.21 |
| | $ | 0.21 |
| | $ | (0.11 | ) | | $ | (0.14 | ) | | $ | (0.92 | ) | $ | 0.16 |
| | $ | 0.21 |
| | $ | 0.21 |
| | $ | (0.11 | ) | | $ | (0.14 | ) |
| Discontinued operations | — |
| | — |
| | 0.01 |
| | 0.13 |
| | (0.05 | ) | — |
| | — |
| | — |
| | 0.01 |
| | 0.13 |
|
| Net income (loss) per share attributable to common stockholders—basic | $ | 0.21 |
| | $ | 0.21 |
| | $ | (0.10 | ) | | $ | (0.01 | ) | | $ | (0.97 | ) | $ | 0.16 |
| | $ | 0.21 |
| | $ | 0.21 |
| | $ | (0.10 | ) | | $ | (0.01 | ) |
| Net income (loss) per share of common stock—diluted: | | | | | | | | | | | | | | | | | | |
| Continuing operations | $ | 0.21 |
| | $ | 0.21 |
| | $ | (0.11 | ) | | $ | (0.14 | ) | | $ | (0.92 | ) | $ | 0.16 |
| | $ | 0.21 |
| | $ | 0.21 |
| | $ | (0.11 | ) | | $ | (0.14 | ) |
| Discontinued operations | — |
| | — |
| | 0.01 |
| | 0.13 |
| | (0.05 | ) | — |
| | — |
| | — |
| | 0.01 |
| | 0.13 |
|
| Net income (loss) per share attributable to common stockholders—diluted | $ | 0.21 |
| | $ | 0.21 |
| | $ | (0.10 | ) | | $ | (0.01 | ) | | $ | (0.97 | ) | $ | 0.16 |
| | $ | 0.21 |
| | $ | 0.21 |
| | $ | (0.10 | ) | | $ | (0.01 | ) |
| Weighted average shares of common stock outstanding: | | | | | | | | | | | | | | | | | | |
Basic common shares (3) | 469,217,776 |
| | 432,222,953 |
| | 386,809,746 |
| | 255,020,565 |
| | 78,625,102 |
| 467,934,945 |
| | 469,217,776 |
| | 432,222,953 |
| | 386,809,746 |
| | 255,020,565 |
|
Diluted common shares (3) | 469,246,265 |
| | 432,545,625 |
| | 386,809,746 |
| | 255,020,565 |
| | 78,625,102 |
| 467,942,788 |
| | 469,246,265 |
| | 432,545,625 |
| | 386,809,746 |
| | 255,020,565 |
|
| | | | | | | | | | | | | | | | | | | |
Dividends declared per common share issued (4) | $ | 0.70500 |
| | $ | 0.68500 |
| | $ | 0.66875 |
| | $ | 0.65843 |
| | $ | 0.17480 |
| $ | 0.72000 |
| | $ | 0.70500 |
| | $ | 0.68500 |
| | $ | 0.66875 |
| | $ | 0.65843 |
|
| | | | | | | | | | | | | | | | | | | |
(1) As a result of the Merger completed on July 17, 2013, Operating Data includes the results of operations from the acquired properties for a full year in 2016, 2015 and 2014 and for less than half a year in 2013. | |
(1) As a result of the Merger completed on July 17, 2013, Operating Data includes the results of operations from the acquired properties for a full year in 2017, 2016, 2015 and 2014 and for less than half a year in 2013. | | (1) As a result of the Merger completed on July 17, 2013, Operating Data includes the results of operations from the acquired properties for a full year in 2017, 2016, 2015 and 2014 and for less than half a year in 2013. |
(2) Includes gains, losses and results of operations from all property dispositions and from properties classified as held for sale at the end of the period for all periods prior to 2014. During 2015 and 2014, only those properties classified as held for sale as of December 31, 2013 were reported as discontinued operations. | (2) Includes gains, losses and results of operations from all property dispositions and from properties classified as held for sale at the end of the period for all periods prior to 2014. During 2015 and 2014, only those properties classified as held for sale as of December 31, 2013 were reported as discontinued operations. | (2) Includes gains, losses and results of operations from all property dispositions and from properties classified as held for sale at the end of the period for all periods prior to 2014. During 2015 and 2014, only those properties classified as held for sale as of December 31, 2013 were reported as discontinued operations. |
(3) Historical weighted average number of shares of common stock outstanding (basic and diluted) have been adjusted for the Merger Exchange Ratio. No potentially dilutive securities were included as their effect would be anti-dilutive on results from continuing operations. | (3) Historical weighted average number of shares of common stock outstanding (basic and diluted) have been adjusted for the Merger Exchange Ratio. No potentially dilutive securities were included as their effect would be anti-dilutive on results from continuing operations. | (3) Historical weighted average number of shares of common stock outstanding (basic and diluted) have been adjusted for the Merger Exchange Ratio. No potentially dilutive securities were included as their effect would be anti-dilutive on results from continuing operations. |
(4) Dividends declared per common share issued for the years ended December 31, 2013 and 2012 have been adjusted for the Merger. | |
(4) Dividends declared per common share issued for the year ended December 31, 2013 have been adjusted for the Merger. | | (4) Dividends declared per common share issued for the year ended December 31, 2013 have been adjusted for the Merger. |
| | | | Years Ended December 31, | Years Ended December 31, |
| | 2016 (1) | | 2015 (1) | | 2014 (1) | | 2013 (1) | | 2012 | 2017 | | 2016 | | 2015 | | 2014 | | 2013 |
| | (Dollars in thousands) | (Dollars in thousands) |
| Balance Sheet Data (end of period): | | | | | | | | | | | | | | | | | | |
| Gross investments, including related lease intangibles | $ | 8,247,654 |
| | $ | 8,302,688 |
| | $ | 8,043,497 |
| | $ | 7,235,732 |
| | $ | 3,654,925 |
| $ | 7,903,025 |
| | $ | 8,247,654 |
| | $ | 8,302,688 |
| | $ | 8,043,497 |
| | $ | 7,235,732 |
|
| Net investments | 7,272,655 |
| | 7,425,719 |
| | 7,316,694 |
| | 6,743,439 |
| | 3,119,608 |
| 6,769,328 |
| | 7,090,335 |
| | 7,231,816 |
| | 7,110,726 |
| | 6,523,325 |
|
| Cash and cash equivalents | 10,059 |
| | 21,790 |
| | 176,181 |
| | 66,588 |
| | 73,568 |
| 8,798 |
| | 10,059 |
| | 21,790 |
| | 176,181 |
| | 66,588 |
|
Total assets (3)(1) | 7,677,971 |
| | 7,891,039 |
| | 7,964,230 |
| | 7,207,775 |
| | 3,245,938 |
| 7,263,511 |
| | 7,677,971 |
| | 7,891,039 |
| | 7,964,230 |
| | 7,207,775 |
|
Total debt, net (3)(1) | 3,664,628 |
| | 4,092,787 |
| | 4,323,302 |
| | 3,758,241 |
| | 1,893,139 |
| 3,639,680 |
| | 3,664,628 |
| | 4,092,787 |
| | 4,323,302 |
| | 3,758,241 |
|
Total liabilities (3)(1) | 3,995,863 |
| | 4,429,165 |
| | 4,652,568 |
| | 4,093,034 |
| | 1,992,495 |
| 3,943,902 |
| | 3,995,863 |
| | 4,429,165 |
| | 4,652,568 |
| | 4,093,034 |
|
Total stockholders' equity (2) | 3,682,108 |
| | 3,461,874 |
| | 3,311,662 |
| | 3,114,741 |
| | 1,253,443 |
| 3,319,609 |
| | 3,682,108 |
| | 3,461,874 |
| | 3,311,662 |
| | 3,114,741 |
|
| | | | | | | | | | | | | | | | | | | |
| Other Data: | | | | | | | | | | | | | | | | | | |
FFO (4)(2) | $ | 394,952 |
| | $ | 354,686 |
| | $ | 238,105 |
| | $ | 139,487 |
| | $ | 52,830 |
| $ | 367,296 |
| | $ | 394,952 |
| | $ | 354,686 |
| | $ | 238,105 |
| | $ | 139,487 |
|
AFFO (4)(2) | $ | 412,999 |
| | $ | 378,050 |
| | $ | 322,400 |
| | $ | 208,853 |
| | $ | 119,248 |
| $ | 398,148 |
| | $ | 412,999 |
| | $ | 378,050 |
| | $ | 322,400 |
| | $ | 208,853 |
|
| Number of properties in investment portfolio | 2,615 |
| | 2,629 |
| | 2,509 |
| | 2,186 |
| | 1,207 |
| 2,480 |
| | 2,615 |
| | 2,629 |
| | 2,509 |
| | 2,186 |
|
| Owned properties occupancy at period end (based on number of properties) | 98 | % | | 99 | % | | 98 | % | | 99 | % | | 99 | % | 99 | % | | 98 | % | | 99 | % | | 98 | % | | 99 | % |
(1) As a result of the Merger completed on July 17, 2013, Balance Sheet Data and Other Data include the impact of the acquired properties as of and for the years ended December 31, 2016, 2015, 2014 and 2013.
(2) Stockholders’ equity for the year ended December 31, 2012 includes the issuance of 33.35 million shares of our common stock in connection with the IPO.
(3) During 2015, we elected to early adopt ASU 2015-03, Simplifying the Presentation of Debt Issuance Costs, in which capitalized deferred financing costs, previously recorded in deferred costs and other assets on the consolidated balance sheets, are presented as a direct deduction from the carrying amount of the debt liability to which these costs relate, and this presentation is retrospectively applied to prior periods. Capitalized deferred financing costs incurred in connection with the 2013 Credit Facility and 2015Revolving Credit Facility continue to be presented in deferred costs and other assets, net on the consolidated balance sheets as amounts can be drawn and repaid periodically, which is in accordance with ASU 2015-15, Presentation and Subsequent Measurement of Debt Issuance Costs Associated with Line-of-Credit Arrangements.
(4)(2) We calculate FFO in accordance with the standards established by the NAREIT. FFO represents net income (loss) attributable to common stockholders (computed in accordance with GAAP), excluding real estate-related depreciation and amortization, impairment charges and net (gains) losses (gains) from property dispositions. FFO is a supplemental non-GAAP financial measure. We use FFO as a supplemental performance measure because we believe that FFO is beneficial to investors as a starting point in measuring our operational performance. Specifically, in excluding real estate-related depreciation and amortization, gains and losses from property dispositions and impairment charges, which do not relate to or are not indicative of operating performance, FFO provides a performance measure that, when compared year-over-year, captures trends in occupancy rates, rental rates and operating costs. We also believe that, as a widely recognized measure of the performance of equity REITs, FFO will be used by investors as a basis to compare our operating performance with that of other equity REITs. However, because FFO excludes depreciation and amortization and does not capture the changes in the value of our properties that result from use or market conditions, all of which have real economic effects and could materially impact our results from operations, the utility of FFO as a measure of our performance is limited. In addition, other equity REITs may not calculate FFO as we do, and, accordingly, our FFO may not be comparable to such other equity REITs’ FFO. Therefore, FFO should be considered only as a supplement to net income (loss) attributable to common stockholders as a measure of our performance.
AFFO is a non-GAAP financial measure of operating performance used by many companies in the REIT industry. Accordingly, AFFO should be considered only as a supplement to net income (loss) attributable to common stockholders as a measure of our performance. We adjust FFO to eliminate the impact of certain items that we believe are not indicative of our core operating performance, including merger, financerestructuring costs, other general and other restructuringadministrative costs associated with relocation of our headquarters, transaction costs associated with our proposed Spin-Off, default interest on non-recourse mortgage indebtedness, debt extinguishment gains (losses), transaction costs incurred in connection with the acquisition of real estate investments subject to existing leases and certain non-cash items. These certain non-cash items include non-cash revenues (comprised of straight-line rents, amortization of above and below market rent on our leases, amortization of lease incentives, amortization of net premium (discount) on loans receivable and amortization of capitalized lease transaction costs), non-cash interest expense (comprised of amortization of deferred financing costs and amortization of net debt discount/premium) and non-cash compensation expense (stock-based compensation expense). In addition, other equity REITs may not calculate AFFO as we do, and, accordingly, our AFFO may not be comparable to such other equity REITs' AFFO. AFFO does not represent cash generated from operating activities determined in accordance with GAAP, is not necessarily indicative of cash available to fund cash needs and should not be considered as an alternative to net income determined in accordance with GAAP as a performance measure. The following table sets forth aA reconciliation of our FFO and AFFO to net income (loss) attributable to common stockholders (computed in accordance with GAAP) foris included in the periods presented.financial information accompanying this report.
| | | | Years Ended December 31, | Years Ended December 31, |
| | 2016 | | 2015 | | 2014 | | 2013 | | 2012 | 2017 | | 2016 | | 2015 | | 2014 | | 2013 |
| | (Dollars in thousands) | (Dollars in thousands) |
Net income (loss) attributable to common stockholders (1) | $ | 97,446 |
| | $ | 93,212 |
| | $ | (36,945 | ) | | $ | (1,616 | ) | | $ | (76,296 | ) | $ | 74,618 |
| | $ | 97,446 |
| | $ | 93,212 |
| | $ | (36,945 | ) | | $ | (1,616 | ) |
| Add/(less): | | | | | | | | | | | | | | | | | | |
| Portfolio depreciation and amortization | | | | | | | | | | | | | | | | | | |
| Continuing operations | 261,799 |
| | 260,257 |
| | 247,587 |
| | 163,874 |
| | 104,929 |
| 255,454 |
| | 261,799 |
| | 260,257 |
| | 247,587 |
| | 163,874 |
|
| Discontinued operations | — |
| | — |
| | — |
| | 3,545 |
| | 7,116 |
| — |
| | — |
| | — |
| | — |
| | 3,545 |
|
| Portfolio impairments | | | | | | | | | | | | | | | | | | |
| Continuing operations | 88,072 |
| | 70,197 |
| | 37,592 |
| | 183 |
| | 9,098 |
| 102,330 |
| | 88,072 |
| | 70,197 |
| | 37,592 |
| | 183 |
|
| Discontinued operations | — |
| | 34 |
| | 417 |
| | 9,587 |
| | 4,634 |
| — |
| | — |
| | 34 |
| | 417 |
| | 9,587 |
|
Realized (gain) loss on sales of real estate (2) | (52,365 | ) | | (69,014 | ) | | (10,546 | ) | | (36,086 | ) | | 3,349 |
| |
Realized gain on sales of real estate (2) | | (65,106 | ) | | (52,365 | ) | | (69,014 | ) | | (10,546 | ) | | (36,086 | ) |
| Total adjustments | 297,506 |
| | 261,474 |
| | 275,050 |
| | 141,103 |
| | 129,126 |
| 292,678 |
| | 297,506 |
| | 261,474 |
| | 275,050 |
| | 141,103 |
|
| | | | | | | | | | | | | | | | | | | |
| FFO | $ | 394,952 |
| | $ | 354,686 |
| | $ | 238,105 |
| | $ | 139,487 |
| | $ | 52,830 |
| |
| FFO attributable to common stockholders | | $ | 367,296 |
| | $ | 394,952 |
| | $ | 354,686 |
| | $ | 238,105 |
| | $ | 139,487 |
|
| Add/(less): | | | | | | | | | | | | | | | | | | |
| (Gain) loss on debt extinguishment | | | | | | | | | | |
| Loss (gain) on debt extinguishment | | | | | | | | | | |
| Continuing operations | (233 | ) | | 3,162 |
| | 64,750 |
| | 2,405 |
| | 32,522 |
| 1,645 |
| | (233 | ) | | 3,162 |
| | 64,750 |
| | 2,405 |
|
| Discontinued operations | — |
| | — |
| | — |
| | (1,028 | ) | | — |
| — |
| | — |
| | — |
| | — |
| | (1,028 | ) |
| Restructuring charges | 6,341 |
| | 7,056 |
| | — |
| | — |
| | — |
| — |
| | 6,341 |
| | 7,056 |
| | — |
| | — |
|
| Loss on derivative instruments related to term note extinguishment | 3,629 |
| | — |
| | — |
| | — |
| | 8,688 |
| |
| Expenses incurred to secure lenders’ consents to the IPO | — |
| | — |
| | — |
| | — |
| | 4,743 |
| |
| Expenses incurred to amend term note | — |
| | — |
| | — |
| | — |
| | — |
| |
| Litigation | — |
| | — |
| | — |
| | — |
| | — |
| |
Cole II Merger related costs (3) | — |
| | — |
| | — |
| | 66,700 |
| | — |
| |
| Other costs in G&A associated with headquarter relocation | | — |
| | 3,629 |
| | — |
| | — |
| | — |
|
| Transaction costs | | 6,361 |
| | — |
| | — |
| | — |
| | — |
|
Merger costs (3) | | — |
| | — |
| | — |
| | — |
| | 66,700 |
|
| Master Trust Exchange Costs | — |
| | — |
| | 13,022 |
| | 717 |
| | — |
| — |
| | — |
| | — |
| | 13,022 |
| | 717 |
|
| Real estate acquisition costs | 3,229 |
| | 2,739 |
| | 3,631 |
| | 1,718 |
| | 1,054 |
| 1,356 |
| | 3,229 |
| | 2,739 |
| | 3,631 |
| | 1,718 |
|
| Non-cash interest expense | 15,380 |
| | 10,367 |
| | 5,175 |
| | 8,840 |
| | 16,495 |
| 23,469 |
| | 15,380 |
| | 10,367 |
| | 5,175 |
| | 8,840 |
|
| Non-cash revenues | (26,333 | ) | | (20,930 | ) | | (16,732 | ) | | (18,755 | ) | | (3,015 | ) | |
| Straight-line rent, net of related bad debt expense | | (19,474 | ) | | (23,496 | ) | | (19,291 | ) | | (12,191 | ) | | (6,162 | ) |
| Other amortization and non-cash charges | | (3,266 | ) | | (2,837 | ) | | (1,639 | ) | | (4,541 | ) | | (12,593 | ) |
| Accrued interest and fees on defaulted loans | 4,740 |
| | 7,649 |
| | 3,103 |
| | — |
| | — |
| 4,201 |
| | 4,740 |
| | 7,649 |
| | 3,103 |
| | — |
|
Swap termination costs (4) | 1,724 |
| | — |
| | — |
| | — |
| | — |
| — |
| | 1,724 |
| | — |
| | — |
| | — |
|
| Non-cash compensation expense | 9,570 |
| | 13,321 |
| | 11,346 |
| | 8,769 |
| | 5,931 |
| 16,560 |
| | 9,570 |
| | 13,321 |
| | 11,346 |
| | 8,769 |
|
| Total adjustments to FFO | 18,047 |
| | 23,364 |
| | 84,295 |
| | 69,366 |
| | 66,418 |
| 30,852 |
| | 18,047 |
| | 23,364 |
| | 84,295 |
| | 69,366 |
|
| | | | | | | | | | | | | | | | | | | |
AFFO (8) | $ | 412,999 |
| | $ | 378,050 |
| | $ | 322,400 |
| | $ | 208,853 |
| | $ | 119,248 |
| |
AFFO attributable to common stockholders(6) | | $ | 398,148 |
| | $ | 412,999 |
| | $ | 378,050 |
| | $ | 322,400 |
| | $ | 208,853 |
|
| | | | | | | | | | | | | | | | | | | |
| FFO per share of common stock | | | | | | | | | | | | | | | | | | |
Diluted (5) (6) | $ | 0.84 |
| | $ | 0.82 |
| | $ | 0.61 |
| | $ | 0.54 |
| | $ | 0.57 |
| |
Diluted (5) | | $ | 0.78 |
| | $ | 0.84 |
| | $ | 0.82 |
| | $ | 0.61 |
| | $ | 0.54 |
|
| AFFO per share of common stock | | | | | | | | | | | | | | | | | | |
Diluted (5) (7) | $ | 0.88 |
| | $ | 0.87 |
| | $ | 0.83 |
| | $ | 0.81 |
| | $ | 1.14 |
| |
Diluted (5) | | $ | 0.85 |
| | $ | 0.88 |
| | $ | 0.87 |
| | $ | 0.83 |
| | $ | 0.81 |
|
| Weighted average shares of common stock outstanding: | | | | | | | | | | | | | | | | | | |
| Basic | 469,217,776 |
| | 432,222,953 |
| | 386,809,746 |
| | 255,020,565 |
| | 78,625,102 |
| 467,934,945 |
| | 469,217,776 |
| | 432,222,953 |
| | 386,809,746 |
| | 255,020,565 |
|
| Diluted | 469,246,265 |
| | 432,545,625 |
| | 387,585,580 |
| | 255,210,757 |
| | 112,509,283 |
| 467,942,788 |
| | 469,246,265 |
| | 432,545,625 |
| | 387,585,580 |
| | 255,210,757 |
|
(1) Amount is net of distributions paid to preferred stockholders for the yearsyear ended December 31, 2012.2017.
(2) Includes amounts related to discontinued operations.
(3) Includes $10.1 million of interest expense charges related to the Merger.
(4) Included in general and administrative expenses.
(5) Assumes the issuance of potentially issuable shares unless the result would be anti-dilutive.
(6) FFO per share for the years ended December 31, 2016, 2015, 2014 and 2013 deducts dividends paid to participating stockholders of $614, $696, $1,099 and $1,291, respectively, in its computation. FFO per share for the year ended December 31, 2012 adds back cash and non-cash interest savings under the "if converted method" of $11,578 for assumed conversion of the term note in the computation of diluted FFO per share.
(7)AFFO per share for the years ended December 31, 2016, 2015, 2014 and 2013 deducts dividends paid to participating stockholders of $614, $696, $1,099 and $1,291, respectively, in its computation. AFFO per share for the year ended December 31, 2012 adds back cash interest savings under the "if converted method" of $9,020 for assumed conversion of the term note in the computation of diluted AFFO per share.
(8) For the year ended December 31, 2016, Net Income Attributablenet income attributable to Common Stockholderscommon stockholders includes compensation for lost rent received from the Haggen Holdings, LLC settlement for 6 rejected stores as follows (in millions):
| | | Contractual rent from date of rejection through either sale or December 31, 2016 | | $ | 1.3 |
| | $ | 1.3 |
|
| Three months of prepaid rent for the 3 stores subsequently sold | | 0.5 |
| |
| Three months of prepaid rent for the three stores subsequently sold | | | 0.5 |
|
| Total included in AFFO | | $ | 1.8 |
| | $ | 1.8 |
|
Adjusted Debt, Adjusted EBITDA and Annualized Adjusted EBITDA
| | | | December 31, | December 31, |
| | 2016 | | 2015 | 2017 | | 2016 |
| | (in thousands) | (in thousands) |
| Revolving credit facilities | $ | 86,000 |
| | $ | — |
| |
| Revolving credit facility | | $ | 112,000 |
| | $ | 86,000 |
|
| Term loan, net | 418,471 |
| | 322,902 |
| — |
| | 418,471 |
|
| Senior unsecured notes | 295,112 |
| | — |
| |
| Senior unsecured notes, net | | 295,321 |
| | 295,112 |
|
| Mortgages and notes payable, net | 2,162,403 |
| | 3,079,787 |
| 2,516,478 |
| | 2,162,403 |
|
| Convertible notes, net | 702,642 |
| | 690,098 |
| 715,881 |
| | 702,642 |
|
| | 3,664,628 |
| | 4,092,787 |
| 3,639,680 |
| | 3,664,628 |
|
| Add/(less): | | | | | | |
| Unamortized debt discount, net | 52,894 |
| | 52,203 |
| 61,399 |
| | 52,894 |
|
| Unamortized deferred financing costs | 37,111 |
| | 41,577 |
| 39,572 |
| | 37,111 |
|
| Cash and cash equivalents | (10,059 | ) | | (21,790 | ) | (8,798 | ) | | (10,059 | ) |
| Cash reserves on deposit with lenders as additional security classified as other assets | (11,757 | ) | | (24,660 | ) | |
| Restricted cash balances held for the benefit of lenders | | (105,909 | ) | | (26,839 | ) |
| Total adjustments | 68,189 |
| | 47,330 |
| (13,736 | ) | | 53,107 |
|
Adjusted Debt (1) | $ | 3,732,817 |
| | $ | 4,140,117 |
| $ | 3,625,944 |
| | $ | 3,717,735 |
|
| | | | | | | |
| | Three Months
Ended December 31, | Three Months
Ended December 31, |
| | 2016 | | 2015 | 2017 | | 2016 |
| | (Dollars in thousands) | (Dollars in thousands) |
| Net income attributable to common stockholders | $ | 988 |
| | $ | 6,301 |
| $ | 35,791 |
| | $ | 988 |
|
Add/(less): (2) | | | | | | |
| Interest | 46,744 |
| | 54,147 |
| 47,998 |
| | 46,744 |
|
| Depreciation and amortization | 68,049 |
| | 65,173 |
| 63,132 |
| | 68,049 |
|
| Income tax (benefit) expense | 33 |
| | (106 | ) | (25 | ) | | 33 |
|
| Total adjustments | 114,826 |
| | 119,214 |
| 111,105 |
| | 114,826 |
|
| EBITDA | $ | 115,814 |
| | $ | 125,515 |
| $ | 146,896 |
| | $ | 115,814 |
|
Add/(less): (2) | | | | |
| Restructuring charges | 615 |
| | 6,956 |
| — |
| | 615 |
|
| Other non-routine costs in G&A associated with headquarter relocation | 187 |
| | — |
| |
| Other costs in G&A associated with headquarter relocation | | — |
| | 187 |
|
| Transaction costs | | 3,216 |
| | — |
|
| Real estate acquisition costs | 1,137 |
| | 617 |
| 583 |
| | 1,137 |
|
| Impairments | 46,379 |
| | 13,691 |
| |
| Impairments on real estate assets | | 14,221 |
| | 46,379 |
|
| Realized gain on sales of real estate | (13,144 | ) | | (2,131 | ) | (24,909 | ) | | (13,144 | ) |
| Loss on debt extinguishment | 93 |
| | 5,651 |
| 3,415 |
| | 93 |
|
| Total adjustments to EBITDA | 35,267 |
| | 24,784 |
| (3,474 | ) | | 35,267 |
|
Adjusted EBITDA (3) | $ | 151,081 |
| | $ | 150,299 |
| $ | 143,422 |
| | $ | 151,081 |
|
Annualized Adjusted EBITDA (4) | $ | 604,324 |
| | $ | 601,196 |
| $ | 573,688 |
| | $ | 604,324 |
|
| | | | | |
Adjusted Debt / Annualized Adjusted EBITDA (5) | 6.2 |
| | 6.9 |
| 6.3 |
| | 6.2 |
|
(1) Adjusted Debt represents interest bearing debt (reported in accordance with GAAP) adjusted to exclude unamortized debt discount/premium and deferred financing costs, as further reduced by cash and cash equivalents and restricted cash reserves on deposit with lenders as additional security.balances held for the benefit of lenders. By excluding unamortized debt discount/premium and deferred financing costs, cash and cash equivalents, and restricted cash reserves on deposit withbalances held for the benefit of lenders, as additional security, the result provides an estimate of the contractual amount of borrowed capital to be repaid, net of cash available to repay it. We believe this calculation constitutes a beneficial supplemental non-GAAP financial disclosure to investors in understanding our financial condition.
(2) Adjustments include all amounts charged to continuing and discontinued operations.
(3) Adjusted EBITDA represents EBITDA modified to include other adjustments to GAAP net income (loss) attributable to common stockholders for restructuring charges, transaction costs, real estate acquisition costs, impairment losses, gains/losses from the sale of real estate and debt transactions and other items that we do not consider to be indicative of our on-going operating
performance. We focus our business plans to enable us to sustain increasing shareholder value. Accordingly, we believe that excluding these items, which are not key drivers of our investment decisions and may cause short-term fluctuations in net income, provides a useful supplemental measure to investors and analysts in assessing the net earnings contribution of our real estate portfolio. Because these measures do not represent net income (loss) that is computed in accordance with GAAP, they should not be considered alternatives to net income (loss) or as an indicator of financial performance. A reconciliation of net income (loss) attributable to common stockholders (computed in accordance with GAAP) to EBITDA and Adjusted EBITDA is included in the financial information in the above table.
(4) Adjusted EBITDA of the current quarter multiplied by four.
(5) Adjusted Debt to Annualized Adjusted EBITDA is a supplemental non-GAAP financial measure we use to evaluate the level of borrowed capital being used to increase the potential return of our real estate investments, and a proxy for a measure we believe is used by many lenders and ratings agencies to evaluate our ability to repay and service our debt obligations over time. We believe the ratio is a beneficial disclosure to investors as a supplemental means of evaluating our ability to meet obligations senior to those of our equity holders. Our computation of this ratio may differ from the methodology used by other equity REITs, and therefore, may not be comparable to such other REITs.
Item 7. Management’s Discussion and Analysis of Financial Condition and Results of Operations
Overview
Spirit Realty Capital, Inc. is a New York Stock Exchange listed company under the ticker symbol "SRC." We are a self-administered and self-managed REIT with in-house capabilities including acquisition, portfolio management, asset management, credit research, real estate research, legal, finance and accounting and capital markets. We primarily invest in single-tenant, operationally essential retail real estate assets throughout the U.S., which are generally acquired through strategic sale-leaseback transactions and subsequently leased on a long-term, triple-net basis to high-qualityhigh quality tenants with business operations within predominantly retail, but also office and industrial property types. Single-tenant,Single tenant, operationally essential real estate consists of properties that are generally free-standing, commercial real estate facilities where our tenants conduct activities that are essential to the generation of their sales and profits. In support of our primary business of owning and leasing real estate, we have also strategically originated or acquired long-term, commercial mortgage and other loans to provide a range of financing solutions to our tenants.
We generate our revenue primarily by leasing our properties to our tenants. As of December 31, 2016,2017, our undepreciated investment inowned real estate and loans totaled approximately $8.2 billion, representingrepresented investments in 2,6152,392 properties. Our properties includingare leased to 419 tenants across 49 states and 30 industries. As of December 31, 2017, our owned properties securing our mortgage loans. Of this amount,were approximately 99.2% consistedoccupied (based on number of economically yielding properties). In addition, our investment in real estate representing ownership of 2,541 properties, and the remaining 0.8% consisted ofincludes commercial mortgage and other loans receivable primarily secured by the remaining 74an additional 88 real estate properties or other related assets.
Our operations are carried out through the Operating Partnership. OP Holdings, one of our wholly-owned subsidiaries, is the sole general partner and owns approximately 1.0%1% of the Operating Partnership. We and one of our wholly-owned subsidiaries are the only limited partners, and together own the remaining 99.0%99% of the Operating Partnership. Although the Operating Partnership is wholly-owned by us, in the future, we may issue partnership interests in the Operating Partnership to third parties in exchange for property owned by such third parties. In general, any partnership interests in the Operating Partnership issued to third parties would be exchangeable for cash or, at our election, shares of our common stock at specified ratios set when such partnership interests in the Operating Partnership are issued.
We have elected to be taxed as a REIT for federal income tax purposes commencing with our taxable year ended December 31, 2005. We believe that we have been organized and have operated in a manner that has allowed us to qualify as a REIT for federal income tax purposes commencing with such taxable year, and we intend to continue operating in such a manner.
AsOn August 3, 2017, we announced a proposed Spin-Off of December 31, 2016, our owned properties were approximately 98.2% occupied (based on number of properties), and our leases had a weighted average non-cancelable remaining lease term (based on Normalized Rental Revenue) of approximately 10.7 years. As of December 31, 2016, approximately 89%almost all of our single-tenantinterests in our properties (basedleased to Shopko, assets that collateralize Master Trust 2014 and other additional assets into an independent, publicly traded REIT Spirit MTA REIT or SMTA. Pursuant to the plan, if the Spin-Off is completed, our stockholders would receive a distribution of common shares of beneficial interest issued by SMTA. The Spin-Off is subject to certain conditions, including declaration by the U.S. Securities and Exchange Commission that SMTA's registration statement on Normalized Rental Revenue) providedForm 10 is effective, customary third party consents, and final approval and declaration of the distribution by our Board of Directors. Such conditions and other unforeseen developments, including in the debt or equity markets or general market conditions, could delay or prevent the Spin-Off or cause the Spin-Off to occur on terms or conditions that are less favorable and/or different than those described herein. The transaction is expected to be completed in the first half of 2018. We may, at any time and for increases in future annual base contractual rent.any reason until the proposed transaction is complete, abandon the Spin-Off or modify or change its terms, including the assets we plan to contribute to SMTA.
20162017 Highlights
For the year ended December 31, 2016:
Total revenues grew 2.8% to $686.0 million compared to the prior year.2017:
Generated net income of $0.21$0.16 per diluted share, FFO of $0.78 per share and AFFO of $0.88$0.85 per diluted share and FFO of $0.84 per diluted share.
Closed 59 real estate transactions totaling $704.9 million, including revenue producing capital expenditures, adding 269 properties to our portfolio, earning an initial weighted average cash yield of 7.53%under leases with an average term of 15.0 years.
Sold 213 properties for $584.9 million in gross proceeds, including 108 income producing properties sold to 84 Properties, LLC for $205.7 million, with a weighted average capitalization rate of of 7.38% on 187 income producing properties. Excluding the sale to 84 Properties, LLC, we sold 105 properties for $379.2 million, with a weighted average capitalization rate of 6.65% on 79 income producing properties.
Reduced Shopko concentration to 8.2% at December 31, 2016 from 9.1% at December 31, 2015.
Strengthened our balance sheet:
| |
| ◦ | Issued 34.5 million sharesCompleted an underwritten public offering of common stock in a follow-on offering at $11.15 per share, including the underwriter’s option to purchase additional shares, raising6.0% Series A Cumulative Redeemable Preferred Stock for aggregate net proceeds of $368.9$166.2 million. |
| |
| ◦ | Sold 6.3Issued $674.4 million aggregate principal amount of net-lease mortgage notes under Master Trust 2014. |
| |
| ◦ | Repurchased 35.8 million shares of the Company's outstanding common stock under our ATM program, at a weighted average sharepurchase price of $12.47, generating aggregate net$7.88 per share. |
| |
| ◦ | Extinguished $238.5 million of secured debt that had a 5.5% weighted average interest rate. |
Actively managed our portfolio:
| |
| ◦ | Raised real estate portfolio occupancy to 99.2% as of December 31, 2017 from 98.2% as of December 31, 2016. |
| |
| ◦ | Closed 25 real estate transactions totaling $323.0 million, including revenue producing capital expenditures, adding 39 properties to our portfolio, earning an initial weighted average cash yield of 7.66%under leases with an average term of 12.0 years. |
| |
| ◦ | Sold 192 properties for $551.2 million in gross proceeds, including 105 vacant properties for gross proceeds of $77.7$153.7 million. |
| |
| ◦ | Increased the borrowing capacity under the 2015 Credit Facility from $600.0 millionReduced Shopko concentration to $800.0 million by partially exercising the accordion feature under the terms7.7% of the credit agreement. |
| |
◦ | Increased the borrowing capacity of the Term Loan from $370.0 million to $420.0 million by partially exercising the accordion feature under the terms of the credit agreement. |
| |
◦ | Sold $300.0 million aggregate principal amount of senior unsecured notes. The Senior Unsecured Notes accrue interest at a rate of 4.45% per year and mature in 2026. |
| |
◦ | Extinguished $883.0 million of high coupon debt that had a 6.01% weighted average rate. |
| |
◦ | Unencumbered assets totaled $4.8 billionContractual Rent at December 31, 2016, or approximately 58.8% of our gross real estate investments, an increase of $1.7 billion compared to2017 from 8.2% at December 31, 2015.2016. |
Factors that May Influence Our Operating Results
AcquisitionsACQUISITIONS AND LEASE STRUCTURE
Our principal line of business is acquiring commercial real estate properties, and leasing these propertiesgenerally leased to our tenants.tenants under triple-net leases. Our ability to grow revenue and produce superior risk adjusted returns will principally dependdepends on our ability to acquire additional properties that meet our investment criteria at a yield sufficiently in excess of our cost of capital. We primarily focus on opportunities to acquire attractive commercial real estate by providing capital to small and middle-market companies that we conclude have stable and proven operating histories and attractive credit characteristics, but lack the access to capital that large companies often have.characteristics. Small and middle-market companies are often willing to enter into leases with structures and terms that we consider appealing (such as master leases and leases that require ongoing tenant financial reporting) and that we believe increase the security of rental payments.
Portfolio Diversification
Our strategy emphasizes a portfolio that (1) derives no more than 10% of its Contractual Rent from any single tenant and no more than 2.0% of its Contractual Rent from any single property, (2) is leased to tenants operating in various industries and (3) is located across the U.S. without significant geographic concentration.
A core component of our business is investing in and managing a portfolio of single-tenant, operationally essential retail real estate throughout the U.S. Accordingly, our performance is substantially dependent on the performance of our retail tenants. The market for traditional retail space has previously been, and could continue to be, adversely affected by weakness in the national, regional and local economies, the adverse financial condition of some traditional retail companies, the ongoing consolidation in the retail industry, the excess amount of retail space in a number of markets and increasing consumer purchases through catalogs or over the internet.
In particular, we have experienced and expect to continue to experience challenges with some of our retailers through increased credit losses. These credit losses resulted in lower revenues from non-performing leases and certain charges for the year endedwrite-off of unrecoverable receivables. We expect the non-performance for certain of these leases to continue.
As of December 31, 2016,2017, Shopko represents our most significant tenant. Currently we acquired 269lease 99 properties for a gross investment of $704.9to Shopko, pursuant to three master leases and two single site leases, under which we receive approximately $3.9 million in 59 real estate transactions, including follow-on investmentsContractual Rent per month. We reduced our Shopko tenant concentration to 7.7% of $20.5 million, with a weighted average initial cash yield of 7.53% and a weighted average remaining lease term of 15.0 years. Of the 269 properties acquired during 2016, 59.2% of the gross investments were direct sale leasebacks and 72.0% of the gross investments were retail.Contractual Rent at December 31, 2017, compared to 8.2% at December 31, 2016. During the year ended December 31, 2015,2017, we acquired 232sold 12 Shopko properties for a gross investment of $889.2$71.4 million in 97 real estate transactions, including follow-on investments,gross proceeds as we continue our objective to reduce our exposure to Shopko.
As a result of the significant number of properties leased to Shopko, our results of operations and financial condition are significantly impacted by Shopko's performance under its leases. Shopko operates as a multi-department general merchandise retailer and retail health services provider primarily in mid-size and large communities in the Midwest, Pacific Northwest, North Central and Western Mountain states.
Based on our monitoring of Shopko's financial information and other challenges impacting the retail industry relative to recent years, we continue to evaluate Shopko's ongoing ability to meet its obligations to us under its leases. Although Shopko is current on all of its obligations to us under its lease arrangements with us as of December 31, 2017, we can give you no assurance that this will continue to be the case, particularly if Shopko (not just the stores subject to leases with us) experiences a weighted average initial cash yieldfurther decline in its business, financial condition and results of 7.68% and a weighted average remaining lease termoperations or loses access to liquidity. If such events were to occur, Shopko may request discounts or deferrals on the rents it pays to us,
seek to terminate its master leases with us or close certain of 16.4 years.its stores, or file for bankruptcy, all of which could significantly decrease the amount of revenue we receive from it.
Operationally Essential Real Estate with Long-Term Leases
We seek to own properties that are operationally essential to our tenants, thereby reducing the risk that our tenant
would choose not to renew an expiring lease or reject a lease in bankruptcy. In addition, weWe also seek to enter into leases with relatively long terms, typically with initial terms, oftypically 15 to 20 years, and tenant renewal options for additional terms, with attractive rent escalation provisions. As of both December 31, 2016 and December 31, 2015,2017, our leases hadhave a weighted average remaining lease term of approximately 10.710.0 years (based on Normalized Rental Revenue).Contractual Rent), compared to 10.8 years as of December 31, 2016. Approximately 20.6%22.0% of our leases (based on Normalized Rental Revenue)Contractual Rent) as of December 31, 20162017 will expire prior to January 1, 2022.2023.
Portfolio DiversificationRent Escalators
Our strategy emphasizes a portfolio that (1) derives no more than 10% of its annual rent from any single tenant and no more than 1.0% of its annual rent from any single property, (2) is leased to tenants operating in various industries and (3) is located across the U.S. without significant geographic concentration.
As of December 31, 2016, Shopko represents our most significant tenant. Following the 2014 restructuring of the Shopko master lease and defeasance of the related secured indebtedness, we have continued our objective to reduce the tenant concentration of Shopko. During the year ended December 31, 2016, we sold 14 Shopko properties having an investment value of $87.0 million. These sales, coupled with our increased rental revenue from real estate investments of $704.9 million during the past 12 months, have reduced our current Shopko tenant concentration to 8.2% compared to 9.1% at December 31, 2015.
84 Properties, LLC, with a 2.9% tenant concentration as of December 31, 2015, represented our third most significant tenant. There were 108 properties under a master lease subject to senior mortgage debt with $68.5 million of principal outstanding, which was repaid during the second quarter of 2016. The master lease agreement included a purchase option, which upon 180 days prior written notice, 84 Properties, LLC could elect to purchase all of the properties from us prior to the end of the 10th, 15th and 20th years of the lease. On October 5, 2016, an amendment to the master lease agreement was executed allowing 84 Properties, LLC to accelerate the exercise of the first purchase option date. On October 26, 2016, we completed the sale of all 108 properties to 84 Properties, LLC for total cash consideration of $205.7 million.
We believe that our experience, in-depth market knowledge and extensive network of long-standing relationships in the real estate industry will continue to provide us access to an ongoing pipeline of attractive acquisitions. However, because we primarily use external financing to fund acquisitions, periods of volatility in the credit and capital markets that may negatively affect the amounts, sources and cost of capital available to us could force us to limit our acquisition activity. Additionally, to the extent that we access capital at a higher cost (reflected in higher interest rates for debt financing or lower stock price for equity financing), our financial results could be adversely affected.
Our Leases
Rent Escalators
Generally, our single-tenant leases generally contain contractual provisions contractually increasing the rental revenue over the term of the lease at specified dates by:by (1) a fixed amount or (2) the lesser of (a) 1 to 1.252 times any increase in CPI over a specified period, or (b) a fixed percentage typically 1% to 2% per year.or (c) a fixed schedule. The percentage of our single-tenant properties (based on Normalized Rental Revenue) containing rent escalators increased slightly to approximately 89%remained consistent at 89.2% as of both December 31, 2017 and December 31, 2016, compared to approximately 88% as of December 31, 2015.respectively (based on Contractual Rent).
Master Lease Structure
Where appropriate, we seek to enter into master leases, pursuant to whichwhereby we lease multiple properties to a single tenant on an “all or none” basis. We seek to use theThe master lease structure to preventprevents a tenant from unilaterally giving up underperformingunder-performing properties while retaining well-performing properties. We had 147have 131 active master leases with property counts ranging from 2 to 172 and a weighted average non-cancelable remaining lease term (based on Contractual Rent) of 12.7 years as of December 31, 2017 compared to 129 active master leases with property counts ranging from 2 to 182 and a weighted average non-cancelable remaining lease term (based on Normalized Rental Revenue)Contractual Rent) of 13.713.9 years as of December 31, 2016 compared to 124 active master leases with property counts ranging from 2 to 189 and a weighted average non-cancelable remaining lease term (based on Normalized Rental Revenue) of 13.6 years as of December 31, 2015.2016.
Master lease revenue contributed approximately 45%44.7% of our Normalized Rental RevenueContractual Rent during the year ended December 31, 20162017, compared to approximately 46%46.2% for the same period in 2015.2016. The largest revenue producing master leases at December 31, 20162017 and 2015,2016, respectively, consisted of 2359 and 8172 properties and contributed 2.9%6.8% and 7.7%7.2% of our Normalized Rental Revenue.Contractual Rent. Our smallest revenue producing master leases, consisting of 5 and 2two properties, contributed less than 1%0.1% to our Normalized Rental RevenueContractual Rent in each of the years ended December 31,
2016 2017 and 2015,2016, respectively. As of December 31, 2016,2017, the majority of our master leases include between 2 and 10 properties.
Triple-Net Leases
Our leases are predominantly triple-net, which requirewhereby the tenant to paypays all property operating expenses, such asincluding but not limited to real estate taxes, insurance premiums and repair and maintenance costs. We occasionally enter into leases, or acquire properties with existing leases, pursuant to which we retain responsibility for the costs of structural repair, maintenance and certain other property costs. Although such leases have not historically resulted in significant costs to us, an increase in costs related to these responsibilities could negatively impact our operating results. Similarly, an increase in the vacancy rate of our portfolio would increase our costs, as we would be responsible for expenses that our tenants are currently required to pay. As of December 31, 2016,2017, approximately 84.0%82.8% of our properties (based on Normalized Rental Revenue)Contractual Rent) are subject to triple-net leases, compared to approximately 86.0%83.7% as of December 31, 2015.2016.
Impact of Inflation
Our leases typically contain provisions designed to mitigate the adverse impact of inflation on our results of operations. Since tenants are typically required to pay all property operating expenses, increases in property-level expenses at our leased properties generally do not adversely affect us. However, increased operating expenses at vacant properties and the limited number of properties that are not subject to full triple-net leases could cause us to incur additional operating expenses, which could increase our exposure to inflation. Additionally, our leases generally provide for rent escalators designed to mitigate the effects of inflation over a lease’s term. However, since some of our leases do not contain rent escalators and many that do limit the amount by which rent may increase, any increase in our rental revenue may not keep up with the rate of inflation.
Asset Management
ASSET MANAGEMENT
The stability of the rental revenue generated by our properties depends principally on our and our tenants’ ability to 1) pay rent and our ability to to:
collect rent due, 2)
renew expiring leases or re-lease space upon expiration or other termination, 3)
lease or dispose of currently vacant properties, and 4)
maintain or increase rental rates.
Each of these could be negatively impacted by adverse economic conditions, particularly those that affect the markets in which our properties are located, downturns in our tenants’ industries, increased competition for our tenants at our property locations, or the bankruptcy of one or more of our tenants. We seek to manage these risks by using our developed underwriting and risk management processes to structure and manage our portfolio.
On September 8, 2015, Haggen Holdings, LLC and a number of its affiliates, including Haggen Operations Holdings, LLC, (collectively, the "Debtors") filed petitions for bankruptcy protection under Chapter 11 of the U.S. Bankruptcy Code in the U.S. Bankruptcy Court for the District of Delaware. At the time of the filing, Haggen Operations Holdings, LLC leased 20 properties on a triple net basis from a subsidiary of ours under a master lease.
Our subsidiary and the Debtors have since entered into two separate settlement agreements, of which Albertson’s LLC was party to one of the settlements, totaling $27.4 million, of which $24.4 million relates to damages claims owed by the Debtors and $3.0 million relates to rent reduction for an amended lease with Albertson’s LLC. To date we have collected $5.5 million of the total claims and there is no guaranty that the remaining claims will be paid or otherwise satisfied in full. As a result of the settlements, the leases for seven locations were rejected and the leases for 13 locations were affirmed and assumed by the following tenants: five locations by Albertson’s LLC, five locations by Smart & Final, LLC, two locations by Gelson’s Markets and one location by Safeway Inc. As of December 31, 2016, we have sold five locations for total proceeds of $52.1 million, we have eleven locations with leases in-place with substantially the same terms and rent (inclusive of the $3.0 million payment for the rent reduction) and we have four locations that remain vacant.
Active Management and Monitoring of Risks Related to Our Investments
We seek to measure tenant financial distress risk and lease renewal risk through various processes. Many of our tenants are required to provide corporate-level and and/or unit-level financial information, which includes balance sheet, income statement and cash flow statement data on a quarterly and/or annual basis, and approximately 49.7%50.6% of our leases as of December 31, 20162017 require the tenant to provide property-level performance information, which includes income statement data on a quarterly and/or annual basis. To assist in our determination of a tenant’s credit quality, we license a product from Moody’s Analytics that provides an estimated default frequency and a “shadow rating,” and we evaluate a lease’s property-level rent coverage ratio. We also review current market data and our historical recovery rates on re-leased properties and property dispositions. Ourbasis.Our underwriting and risk management processes are designed
to structure new investments and manage existing investments to address and mitigate tenant credit quality risks and preserve the long-term return on our invested capital. We continuously monitor our underperforming and non-performing properties for potential re-lease or disposition which may trigger impairment charges when the expected future cash flows from these properties are less than their net book value. Since our inception, our occupancy based on economically yielding properties has never been below 96.1% (based on number of properties), despite the economic downturn of 2008 through 2010. The percentage of our properties (based on number of properties) that were occupied decreased slightlyeconomically yielding increased to approximately 99.2% as of December 31, 2017 from approximately 98.2% as of December 31, 20162016.
On September 8, 2015, Haggen Holdings, LLC and a number of its affiliates, including Haggen Operations Holdings, LLC, filed petitions for bankruptcy protection under Chapter 11 of the U.S. Bankruptcy Code. At the time of the filing, Haggen Operations Holdings, LLC leased 20 properties on a triple net basis from approximately 98.6% asa subsidiary of December 31, 2015.ours under a master lease. For discussion of the related settlement and current status of these properties, see Note 8 to the consolidated financial statements herein.
We monitor and manage the diversification of our real estate investment portfolio in order to reduce the risks associated with adverse developments affecting a particular tenant, property, industry or region. Excluding Shopko, no tenant exceeded 4.0% of our Normalized Rental Revenue and no one single property contributed more than 1.5% of our Normalized Rental Revenue for the months ended December 31, 2016 and December 31, 2015.
We lease 116 properties to Shopko, 114 of which are under 13 master leases that had a weighted average non-cancelable remaining lease term of approximately 16.1 years and 13.7 years as of December 31, 2016 and 2015, respectively. Because a significant portion of our revenue is derived from rental revenue received from Shopko, defaults, breaches or delays in rent payments by Shopko may materially and adversely affect us. During the year ended December 31, 2015, we sold 34 Shopko properties for gross sales proceeds of $300.7 million and relet four properties to a new tenant. During the year ended December 31, 2016, we sold 14 Shopko properties for gross sales proceeds of $78.8 million and relet two additional properties to new tenants.
Capital RecyclingCAPITAL RECYCLING
We continuously evaluate opportunities for the potential disposition of properties in our portfolio when we believe such disposition is appropriate in view of our business objectives, considering criteria including, but not limited to, tenant concentration, tenant credit quality, unit financial performance, local market conditions and lease rates, associated indebtedness, asset location and tenant operation type (e.g., industry, sector, or concept/brand), as well as potential uses of proceeds and tax considerations. As part of this strategy, we attempt at times tomay enter into 1031 Exchanges when possible, to defer some or all of the taxable gains on the dispositions, if any, for federal and state income tax purposes.
The timing of any potential dispositions will depend on market conditions and other factors, including but not limited to, our capital needs and ability to defer some or all of the taxable gains on the sales. We can provide no assurance that we will dispose of any additional properties or that future acquisitions and/or dispositions, if any, will qualify as 1031 Exchanges. Furthermore, we can provide no assurance that we will deploy the proceeds from future dispositions in a manner that produces comparable or better yields.
Capital FundingCAPITAL FUNDING
Our principal demands for funds are for property acquisitions, payment of principal and interest on our outstanding indebtedness, operating and property maintenance expenses and distributions to our stockholders. Generally, property acquisitions are temporarily funded through our Revolving Credit Facility, followed by permanent financing through asset level financing or issuance of debt or equity securities. Our remaining cash needs for payments of principal and interest, operating and property maintenance expenses and distributions to stockholders will be generated fromare typically met by cash flows from operations, which are primarily driven by the rental income received from our leased properties, interest income earned on loans receivable and interest income on our cash balances. We generally temporarily fund the acquisition of real estate utilizing our Revolving Credit Facilities, followed by permanent financing through asset level financing or by issuing debt or equity securities.
Debt Capital Structure
As of December 31, 2016,2017, we had an approximately $3.8$3.7 billion principal balance outstanding consisting of $2.2$2.6 billion of non-recourse mortgage indebtedness, $747.5 million of unsecured Convertible Notes, $300.0 million of Senior Unsecured Notes, $420.0and $112.0 million under our unsecured Term Loan and $86.0 million under our unsecured 2015Revolving Credit Facility. We have additional borrowing capacity of $714.0$688.0 million under the 2015Revolving Credit Facility.Facility and $420.0 million under our Term Loan. The 2015Revolving Credit Facility and Term Loan provide for financial flexibility to help fund future acquisitions and for general corporate
purposes. Our non-recourse mortgage indebtedness is comprised of $528.4$332.6 million of fixed-rate CMBS including $26.6 millionfrom acceleration of defaulted loans and $1.7$2.2 billion in securitized net-lease mortgage notes under our Spirit Master Funding Program. Approximately $1.7$2.1 billion of our outstanding principal indebtedness is fully or partially amortizing, providing for an ongoing reduction in principal prior to maturity. Prior to January 1, 2020,2021, contractual amortization payments are scheduled to reduce our outstanding principal amount of indebtedness by $112.6$134.9 million and balloon payments of $1.3$1.1 billion are due at maturity under a number of different loans. Included in these balloon payments is $26.6$64.3 million for
the acceleration of principal payable, including $9.5$13.2 million of capitalized interest, following an event of default under 26 separate CMBS loans.
Interest Costs
As of December 31, 2016,2017, the weighted average stated interest rate on our fixed rate debt under our CMBS and Master Trust Notes, excluding the amortization of deferred financing costs and debt discounts, was approximately 5.17%5.1%. The weighted average stated rate as of December 31, 20162017 of our unsecured Convertible Notes and Unsecured Senior Notes were 3.28% and 4.45%, respectively. Our fixed-rate debt structure provides us with a stable and predictable cash requirement related to our debt service. The stated rate of our unsecured variable-rate Term Loan as of December 31, 20162017 was 1.91%2.44%. We amortize on a non-cash basis the deferred financing costs and debt discounts/premiums associated with our fixed-rate debt to interest expense using the effective interest rate method over the terms of the related notes. For the year ended December 31, 2016,2017, non-cash interest expense recognized on our Revolving Credit Facilities, mortgages and notes payable, Senior Unsecured Notes, Convertible Notes and Term Loandebt totaled $15.4$23.5 million. Any changes to our debt structure, including borrowings under our 2015Revolving Credit Facility, Term Loan or debt financing associated with property acquisitions, could materially influence our operating results depending on the terms of any such indebtedness. A significant amount of our debt provides for scheduled principal payments. As principal is repaid, our interest expense decreases. Changing interest rates will increase or decrease the interest expense we incur on unhedged variable interest rate debt and may impact our ability to refinance maturing debt.
Critical Accounting Policies and Estimates
Our accounting policies are determined in accordance with GAAP. The preparation of our financial statements requires us to make estimates and assumptions that are subjective in nature and, as a result, our actual results could differ materially from our estimates. Estimates and assumptions include, among other things, subjective judgments regarding the fair values and useful lives of our properties for depreciation and lease classification purposes, the collectability of receivables and asset impairment analysis. Set forth below are the more critical accounting policies that require management judgment and estimates in the preparation of our consolidated financial statements. See Notes 2 and 9 to the consolidated financial statements for further details.
Real Estate Investments
Revenue Recognition
We lease real estate to our tenants under long-term, triple-net leases that are primarily classified as operating leases. Under a triple-net lease, the tenant is typically responsible for all improvements and is contractually obligated to pay all property operating expenses, such as real estate taxes, insurance premiums and repair and maintenance costs. Under certain leases, tenant reimbursement revenue, which is comprised of additional amounts recoverable from tenants for common area maintenance expenses and certain other recoverable expenses, is recognized as revenue in the period in which the related expenses are incurred. Tenant reimbursements are recorded on a gross basis, as we are generally the primary obligor with respect to purchasing goods and services from third-party suppliers.Tenant receivables are carried net of the allowances for uncollectible amounts.
Lease origination fees are deferred and amortized over the related lease term as an adjustment to rental revenue. Our leases generally provide for rent escalations throughout the lease terms. For leases that provide for specific contractual escalations, rental revenue is recognized on a straight-line basis so as to produce a constant periodic rent over the term of the lease. Accordingly, accrued rental revenue, calculated as the aggregate difference between the rental revenue recognized on a straight-line basis and scheduled rents, represents unbilled rent receivables that we will receive only if the tenants make all rent payments required through the expiration of the initial term of the leases. The accrued rental revenue representing this straight-line adjustment is subject to an evaluation for collectability, and we record a provision for losses against rental revenues if collectability of these future rents is not reasonably assured.
Leases that have contingent rent escalators indexed to future increases in the CPI may adjust over a one-year period or over multiple-year periods. Generally, these escalators increase rent at the lesser of (1) 1 to 1.25 times any increase in the CPI over a specified period or (2) a fixed percentage. Because of the volatility and uncertainty with respect to future changes in the CPI, our inability to determine the extent to which any specific future change in the CPI is probable at each rent adjustment date during the entire term of these leases and our view that the multiplier does not represent a significant leverage factor, rental revenue from leases with this type of escalator are recognized only after the changes in the rental rates have occurred.
Some of our leases also provide for contingent rent based on a percentage of the tenant’s gross sales. For contingent rentals that are based on a percentage of the tenant’s gross sales, we recognize contingent rental revenue when the change in the factor on which the contingent lease payment is based actually occurs.
We suspend revenue recognition if the collectability of amounts due pursuant to a lease is not reasonably assured or if the tenant’s monthly lease payments become more than 60 days past due, whichever is earlier.
Lease termination fees are recognized when there is a signed termination agreement and all of the conditions of the agreement have been met and are included in other income on our consolidated statements of operations.REAL ESTATE INVESTMENTS
Purchase Accounting and Acquisition of Real Estate; Property Held for SaleLease Intangibles
When acquiring a property, we allocate the purchase price (including acquisition and closing costs) to land, building, improvements and equipment based on their relative fair values. For properties acquired with in-place leases, we allocate the purchase price of real estate to the tangible and intangible assets and liabilities acquired based on their estimated fair values and acquisition costs are expensed as incurred. In making estimates of fair values for this purpose, weWe use a number of sources including independent appraisals and information obtained about each property as a result of our pre-acquisition due diligence and our marketing and leasing activities. Property classified as "held for sale" is not depreciated and is recorded at the lower of its carrying value or itsto estimate fair value less anticipated selling costs.
Lease Intangibles
of real estate acquisitions, including building age, building location, building condition, rent comparables from similar properties, and terms of in-place leases, if any. Lease intangibles, if any, acquired in conjunction with the purchase of real estate represent the value of in-place leases and above or below-market leases. For real estate acquired subject to existing lease agreements, in-placeIn-place lease intangibles are valued based on our estimates of costs related to tenant acquisition and the carrying costs that would be incurred during the time it would take to locate a tenant if the property were vacant, considering current market conditions and costs to execute similar leases at the time of the acquisition. We then allocate the purchase price (including acquisition and closing costs) to land, building, improvements and equipment based on their relative fair values. For properties acquired with in-place leases, we allocate the purchase price of real estate to the tangible and intangible assets and liabilities acquired based on their estimated fair values. Above and below-market lease intangibles are recorded based on the present value of the difference between the contractual amounts to be paid pursuant to the leases at the time of acquisition of the real estate and our estimate of current market lease rates for the property, measured over a period equal to the remaining initial term of the lease.
In-place lease intangibles are amortized on a straight-line basis over the remaining initial term of the related lease and included in depreciation and amortization expense. Above-market lease intangibles are amortized over the remaining initial terms of the respective leases as a decrease in rental revenue. Below market lease intangibles are generally amortized as an increase to rental revenue over the remaining initial term of the respective leases, but may be amortized over the renewal periods if we believe it is likely the tenant will exercise the renewal option. Should a lease terminate early, the unamortized portion of any related lease intangible is immediately recognized in impairment loss in our consolidated statements of operations.
Impairment
We review our real estate investments and related lease intangibles periodicallyquarterly for indicators of impairment, whenever events or changeswhich include the asset being held for sale, tenant bankruptcy, leases expiring in circumstances indicate that the carrying amount may not be recoverable. We consider factors such as expected future undiscounted cash flows, estimated residual value, market trends (such as the effectsless than 12 months and property vacancy. For assets with indicators of leasing demand and competition) and other factors in making this assessment. An asset is considered impairedimpairment, we then evaluate if its carrying value exceeds its estimated undiscounted cash flows, and the impairment is calculated as the amount byin which the carrying value ofcase the asset exceeds its estimated fair value.is considered impaired. Estimating future cash flows and fair values are highly subjective and such estimates could differ materially from actual results. Key assumptions used in estimating future cash flows and fair values include, but are not limited to, revenue growth rates, interest rates, discount rates, capitalization rates, lease renewal probabilities, tenant vacancy rates and other factors.
Provision
Impairment is then calculated as the amount by which the carrying value exceeds the estimated fair value. The fair values are estimated by using the following information, depending on availability, in order of preference: signed purchase and sale agreements or letters of intent; recently quoted bid or ask prices, or market prices for comparable properties; estimates of cash flow, which consider, among other things, contractual and forecasted rental revenues, leasing assumptions, and expenses based upon market conditions; and expectations for the use of the real estate.
Allowance for Doubtful Accounts
We review our rent receivables for collectability on a regular basis, taking into consideration changes in factors such as the tenant’s payment history, the financial condition of the tenant, business conditions in the industry in which the tenant operates and economic conditions in the area in which the property is located. In the event thatIf the collectability of a receivable with respect to any tenant is in doubt, a provision for uncollectible amounts will be established or a write-off of the specific receivable will be made. Uncollected accounts receivable are written off against the allowance when all possible means of collection have been exhausted. For deferred rental revenues related to the straight-line method of reporting rental revenue, we establish a provision for losses based on our estimate of uncollectible receivables
and our assessment of the risks inherent in our portfolio, giving consideration to historical experience and industry default rates for long-term receivables.
Income TaxesINCOME TAXES
REIT Status
We have elected to be taxed as a REIT for federal income tax purposes commencing with our taxable year ended December 31, 2005. We believe that we have been organized and have operated in a manner that has allowed us to qualify as a REIT for federal income tax purposes commencing with such taxable year, and we intend to continue operating in such a manner. To maintain our qualification as a REIT status, we are required to annually distribute to our stockholders at least 90% of our REIT taxable income, determined without regard to the dividends paid deduction and excluding any net capital gain, and meet the various other requirements imposed by the Code relating to such matters as operating results, asset holdings, distribution levels and diversity of stock ownership. Provided that we qualify for taxation as a REIT, we are generally not subject to corporate level federal income tax on the earnings distributed to our stockholders that we derive from our REIT qualifying activities. We are still subject to state and local income and franchise taxes and to federal income and excise tax on our undistributed income. If we fail to qualify as a REIT in any taxable year and are unable to avail ourselves of certain savings provisions set forth in the Code, all of our taxable income would be subject to federal income tax at regular corporate rates, including any applicable alternative minimum tax. Unless entitled to relief under specific statutory provisions, we would be ineligible to elect to be treated as a REIT for the four taxable years following the year for which we lose our qualification. It is not possible to state whether in all circumstances we would be entitled to this statutory relief.
TRS
We have elected, together with certain of our subsidiaries, to treat such subsidiaries as our TRS for federal income tax purposes. A taxable REIT subsidiary generally may provide both customary and non-customary services to tenants of its parent REIT and engage in other activities that the parent REIT may not engage in directly without adversely affecting its qualification as a REIT. Currently, our TRS do not provide any services to our tenants or conduct other material activities. However, one or more TRS of ours may in the future provide services to certain of our tenants. We may form additional taxable REIT subsidiaries in the future and we may contribute some or all of our interests in certain wholly-owned subsidiaries or their assets to a TRS of ours. Any income earned by our TRS will not be included in our taxable income for purposes of the 75% or 95% gross income tests, except to the extent such income is distributed to us as a dividend, in which case such dividend income will qualify under the 95%, but not the 75%, gross income test. Because a taxable REIT subsidiary is subject to federal income tax and state and local income tax (where applicable), as a regular C corporation, the income earned by our TRS generally will be subject to an additional level of tax as compared to the income earned by our other subsidiaries. Historically, we have not actively pursued or engaged in material activities that would require the use of our TRS.
Share-Based CompensationSHARE-BASED COMPENSATION
Under our Amended Incentive Award Plan, we may grant equity incentive awards to eligible employees, directors and other service providers. Awards under the Amended Incentive Award Plan may be in the form of stock options, restricted stock, dividend equivalents, restricted stock units, stock appreciation rights, performance awards, stock payment awards, performance share awards, LTIP units and other incentive awards. If an award under the Amended Incentive Award Plan is forfeited, expires or is settled for cash, any shares subject to such award may, to the extent of such forfeiture, expiration or cash settlement, be used again for new grants under the Amended Incentive Award Plan. Awards granted under theour Amended Incentive Award Plan may require service-based vesting over a period of years subsequent to the grant date and resulting equity-based compensation expense, measured at the fair value of the award on the date of grant, will be recognized as an expense in our consolidated financial statements over the vesting period. Grant date fair value is estimated using the Monte Carlo simulation model, which incorporates stock price correlation, projected dividend yields and other variables over the time horizons matching the performance periods.
Comparison of the Years Ended December 31, 2017 and 2016
The following discussion includes the results of our continuing operations as summarized in the table below:
|
| | | | | | | | | | | | | | |
| | Years Ended December 31, |
| (In Thousands) | 2017 | | 2016 | | Change | | % Change |
| Revenues: | | | | | | | |
| Rentals | $ | 639,017 |
| | $ | 648,363 |
| | $ | (9,346 | ) | | (1.4 | )% |
| Interest income on loans receivable | 3,791 |
| | 5,253 |
| | (1,462 | ) | | (27.8 | )% |
| Earned income from direct financing leases | 2,078 |
| | 2,742 |
| | (664 | ) | | (24.2 | )% |
| Tenant reimbursement income | 16,747 |
| | 14,125 |
| | 2,622 |
| | 18.6 | % |
| Other income | 7,322 |
| | 15,491 |
| | (8,169 | ) | | (52.7 | )% |
| Total revenues | 668,955 |
| | 685,974 |
| | (17,019 | ) | | (2.5 | )% |
| Expenses: | | | | | | | |
| General and administrative | 62,064 |
| | 52,615 |
| | 9,449 |
| | 18.0 | % |
| Restructuring charges | — |
| | 6,341 |
| | (6,341 | ) | | (100.0 | )% |
| Transaction costs | 6,361 |
| | — |
| | 6,361 |
| | 100.0 | % |
| Property costs (including reimbursable) | 36,617 |
| | 30,839 |
| | 5,778 |
| | 18.7 | % |
| Real estate acquisition costs | 1,356 |
| | 3,229 |
| | (1,873 | ) | | (58.0 | )% |
| Interest | 190,127 |
| | 196,586 |
| | (6,459 | ) | | (3.3 | )% |
| Depreciation and amortization | 256,019 |
| | 262,276 |
| | (6,257 | ) | | (2.4 | )% |
| Impairment | 102,330 |
| | 88,275 |
| | 14,055 |
| | 15.9 | % |
| Total expenses | 654,874 |
| | 640,161 |
| | 14,713 |
| | 2.3 | % |
| Income from continuing operations before other (expense) income and income tax expense | 14,081 |
| | 45,813 |
| | (31,732 | ) | | (69.3 | )% |
| Other (expense) income: | | | | | | | |
| (Loss) gain on debt extinguishment | (1,645 | ) | | 233 |
| | (1,878 | ) | | NM |
|
| Total other (expense) income | (1,645 | ) | | 233 |
| | (1,878 | ) | | NM |
|
| Income from continuing operations before income tax expense | 12,436 |
| | 46,046 |
| | (33,610 | ) | | (73.0 | )% |
| Income tax expense | (394 | ) | | (965 | ) | | 571 |
| | 59.2 | % |
| Income from continuing operations | $ | 12,042 |
| | $ | 45,081 |
| | $ | (33,039 | ) | | 73.3 | % |
| | | | | | | | |
| Gain on disposition of assets | $ | 65,106 |
| | $ | 52,365 |
| | $ | 12,741 |
| | 24.3 | % |
NM - Percentages over 100% are not displayed.
REVENUES
Rentals
For the year ended December 31, 2017, approximately 95.5% of our total revenues were generated from long-term leases of our owned properties. Our contractual rental revenues between periods decreased by 0.9% as we were a moderate disposer of income producing real estate during the year ended December 31, 2017. We acquired 39 properties with a real estate investment value of $323.0 million during the year ended December 31, 2017. This increase was offset by the sale of 192 properties during the same period for gross sales of $551.2 million, of which 87 were income producing properties for gross sales of $397.5 million. Additionally, we had tenant credit losses in the first quarter of 2017, where the majority of the increase in our nonperforming properties were in the convenience store and movie theater industries.
During both the years ended December 31, 2017 and 2016, non-cash rentals were $30.6 million, representing approximately 4.8% and 4.7%, respectively, of total rental revenue from continuing operations.
Interest income on loans receivable
While financed properties increased from 74 at December 31, 2016 to 88 at December 31, 2017, resulting in an increase of 20.1% in the related mortgage loans receivable balances for the comparative period, interest income on loans receivable decreased as a result of a timing of the change in financed properties. We held 144 financed properties at the beginning of 2016, of which 66 were paid off in mid-2016. Additionally, all 16 properties financed in 2017 were originated in the last four months of 2017.
Tenant reimbursement income
We have a number of leases that require our tenants to reimburse us for certain property costs we incur. Tenant reimbursement income is driven by the tenant reimbursable property costs described below.
Other income
The year-over-year decrease in other income is primarily due to $5.5 million in fee income associated with the prepayment of certain mortgage loans for the year ended December 31, 2016, and no comparable transaction for the year ended December 31, 2017. Additionally, lease termination fees collected for the year ended December 31, 2017 were $5.0 million, compared to $7.3 million for the year ended December 31, 2016.
EXPENSES
General and administrative
The year-over-year increase in general and administrative expenses is primarily due to $11.1 million in severance related costs, comprised of $4.2 million of cash compensation and $6.9 million of non-cash compensation, recorded in the year ended December 31, 2017 following the departure of our chief executive officer and an increase of $4.3 million in bad debt expense recorded year-over-year. The change in bad debt expense increased primarily as a result of certain entertainment, sporting goods and restaurant - casual dining properties for which the straight-line rent has been determined to be uncollectible for the year ended December 31, 2017, offset by a decrease in bad debt expenses related to convenience store properties of $1.1 million year-over-year. Finally, the period-over-period increase in general and administrative expenses was partially offset by the $1.7 million loss recognized in the comparable prior period related to termination fees on an interest rate swap.
Property costs
The increase in property costs is primarily due to an increase in non-reimbursable property taxes on operating properties of $2.4 million and an increase in reimbursable property taxes of $3.1 million. The increase in non-reimbursable property taxes on operating properties resulted from an increase in tenant credit issues year-over-year. Tenant reimbursable property costs for the year ended December 31, 2017 were $21.4 million, an increase from $18.0 million in 2016.
Transaction costs
On August 3, 2017, we announced a proposed Spin-Off of almost all of our interests in our properties leased to Shopko, assets that collateralize Master Trust 2014 and other additional assets into an independent, publicly traded REIT. Transaction costs associated with the Spin-Off for the year ended December 31, 2017 totaled $6.4 million.
Interest
The decrease in interest expense is primarily due to the extinguishment of $238.5 million of mortgage debt with a weighted average interest rate of 5.5% during the year ended December 31, 2017. This was partially offset by an increase in interest due to increased average borrowings year-over-year under our Revolving Credit Facility and Term Loan, as well as interest on our Senior Unsecured Notes, which were issued in August 2016.
The following table summarizes our interest expense on related borrowings:
|
| | | | | | | |
| | Years Ended December 31, |
| (In Thousands) | 2017 | | 2016 |
Interest expense – Revolving Credit Facilities (1) | $ | 7,957 |
| | $ | 3,314 |
|
| Interest expense – Term Loan | 9,793 |
| | 5,218 |
|
| Interest expense – mortgages and notes payable | 111,049 |
| | 143,233 |
|
| Interest expense – Convertible Notes | 24,509 |
| | 24,509 |
|
| Interest expense – Unsecured Senior Notes | 13,351 |
| | 4,932 |
|
| Non-cash interest expense: | | | |
| Amortization of deferred financing costs | 9,896 |
| | 9,070 |
|
| Amortization of net losses related to interest rate swaps | — |
| | 93 |
|
| Amortization of debt discount/(premium), net | 13,572 |
| | 6,217 |
|
| Total interest expense | $ | 190,127 |
| | $ | 196,586 |
|
(1) Includes non-utilization fees of approximately $2.1 million and $2.0 million for the years ended December 31, 2017 and 2016, respectively.
Depreciation and amortization
Depreciation and amortization expense relates primarily to depreciation on the commercial buildings and improvements we own and to amortization of the related lease intangibles. We were a net disposer during the year ended December 31, 2017 (based on depreciable real estate assets), which was the primary driver in the decrease year-over-year. During the year ended December 31, 2017, we acquired 39 properties with a depreciable basis of $323.0 million, while we sold 192 properties with a real estate investment value of $536.0 million. Our depreciable real estate balance was further reduced due to impairment charges recorded in 2017 on properties that remain in our portfolio. Finally, properties held for sale are no longer depreciated and there were more properties being held for sale this year than last year. The following table summarizes our depreciation and amortization expense:
|
| | | | | | | |
| | Years Ended December 31, |
| (In Thousands) | 2017 | | 2016 |
| Depreciation of real estate assets | $ | 212,112 |
| | $ | 215,443 |
|
| Other depreciation | 563 |
| | 475 |
|
| Amortization of lease intangibles | 43,344 |
| | 46,358 |
|
| Total depreciation and amortization | $ | 256,019 |
| | $ | 262,276 |
|
Impairment
Impairment charges for the year ended December 31, 2017 were $102.3 million. These charges included $24.8 million on properties held for sale, including $15.0 million on vacant held for sale properties and $6.4 million on four education properties held for sale. $77.2 million of impairment was recorded on properties held and used, including $55.9 million on vacant properties held and used, $10.0 million on eight underperforming properties within the drug store/pharmacy and consumer electronics industries, and $4.2 million on an underperforming property within the general merchandise industry. $0.3 million of impairment charges related to unrecoverable amounts from mortgage loans receivable.
During the year ended December 31, 2016, we recorded impairment losses of $88.3 million. These charges included $23.1 million on 28 properties that were held for sale, including $10.6 million on vacant held for sale properties, and $28.2 million on vacant properties that were not classified as held for sale. The impairment losses also include $26.3 million on 9 underperforming properties within the restaurant-casual dining, movie theater, general merchandise, drug store/pharmacy and distribution industries. In addition, during the year ended December 31, 2016, lease intangible write-offs were primarily due to the $6.6 million write-off of below market rent intangible liabilities for one tenant in the restaurant-casual dining industry.
(Loss) gain on debt extinguishment
During the year ended December 31, 2017, we extinguished $238.5 million of mortgage debt and recognized a loss on debt extinguishment of $1.6 million. The loss was primarily attributable to the $1.6 million pre-payment premium
paid in conjunction with our voluntary pre-payment of the full outstanding balance of Master Trust 2014 Series 2014-1 Class A1 note of $43.1 million in November 2017. During the same period in 2016, we extinguished $883.0 million of mortgage debt and recognized a gain on debt extinguishment of $0.2 million. The gain was primarily attributable to the extinguishment of four defaulted mortgage loans upon sale of the properties collateralizing these loans to third parties, offset by losses from the prepayment and defeasance fees on 408 properties.
Gain on disposition of assets
During the year ended December 31, 2017, we disposed of 192 properties and recorded gains totaling $65.1 million. Included in these amounts are a $16.2 million gain on the sales of 12 Shopko properties, a $9.5 million gain on the sales of 29 restaurant - casual dining and quick service properties, a $8.9 million gain on the sales of six grocery properties, a $7.9 million gain on the sale of a distribution property, a $7.8 million gain on the sales of 11 drug store/pharmacy properties, and a $7.6 million gain on the sales of five building materials properties. These gains were partially offset by a $6.9 million loss on the sales of 105 vacant properties during the year ended December 31, 2017.
During 2016, we disposed of 213 properties and recorded gains totaling $52.4 million. Included in these amounts are a $12.7 million gain for the sales of 14 Shopko properties, a $10.3 million gain for the sale of one grocery property, a $9.8 million gain on the sale of 30 properties within the restaurant-quick service industry and a $8.8 million gain on the sale of 19 properties with the restaurant-casual dining industry.
Results of Operations
Comparison of the Years Ended December 31, 2016 and 2015
The following discussion includes the results of our continuing operations as summarized in the table below:
| | | | Years Ended December 31, | Years Ended December 31, |
| | 2016 | | 2015 | | Change | | % Change | |
| | (in thousands) | | | |
| (In Thousands) | | 2016 | | 2015 | | Change | | % Change |
| Revenues: | | | | | | | | | | | | | | |
| Rentals | $ | 648,363 |
| | $ | 634,151 |
| | $ | 14,212 |
| | 2.2 | % | $ | 648,363 |
| | $ | 634,151 |
| | $ | 14,212 |
| | 2.2 | % |
| Interest income on loans receivable | 5,253 |
| | 6,948 |
| | (1,695 | ) | | (24.4 | )% | 5,253 |
| | 6,948 |
| | (1,695 | ) | | (24.4 | )% |
| Earned income from direct financing leases | 2,742 |
| | 3,024 |
| | (282 | ) | | (9.3 | )% | 2,742 |
| | 3,024 |
| | (282 | ) | | (9.3 | )% |
| Tenant reimbursement income | 14,125 |
| | 15,952 |
| | (1,827 | ) | | (11.5 | )% | 14,125 |
| | 15,952 |
| | (1,827 | ) | | (11.5 | )% |
| Other income | 15,491 |
| | 7,260 |
| | 8,231 |
| | NM |
| 15,491 |
| | 7,260 |
| | 8,231 |
| | NM |
|
| Total revenues | 685,974 |
| | 667,335 |
| | 18,639 |
| | 2.8 | % | 685,974 |
| | 667,335 |
| | 18,639 |
| | 2.8 | % |
| Expenses: | | | | | | | | | | | | | | |
| General and administrative | 52,615 |
| | 47,730 |
| | 4,885 |
| | 10.2 | % | 52,615 |
| | 47,730 |
| | 4,885 |
| | 10.2 | % |
| Restructuring charges | 6,341 |
| | 7,056 |
| | (715 | ) | | (10.1 | )% | 6,341 |
| | 7,056 |
| | (715 | ) | | (10.1 | )% |
| Property costs | 30,839 |
| | 27,715 |
| | 3,124 |
| | 11.3 | % | |
| Property costs (including reimbursable) | | 30,839 |
| | 27,715 |
| | 3,124 |
| | 11.3 | % |
| Real estate acquisition costs | 3,229 |
| | 2,739 |
| | 490 |
| | 17.9 | % | 3,229 |
| | 2,739 |
| | 490 |
| | 17.9 | % |
| Interest | 196,586 |
| | 222,901 |
| | (26,315 | ) | | (11.8 | )% | 196,586 |
| | 222,901 |
| | (26,315 | ) | | (11.8 | )% |
| Depreciation and amortization | 262,276 |
| | 260,633 |
| | 1,643 |
| | 0.6 | % | 262,276 |
| | 260,633 |
| | 1,643 |
| | 0.6 | % |
| Impairment | 88,275 |
| | 70,695 |
| | 17,580 |
| | 24.9 | % | 88,275 |
| | 70,695 |
| | 17,580 |
| | 24.9 | % |
| Total expenses | 640,161 |
| | 639,469 |
| | 692 |
| | 0.1 | % | 640,161 |
| | 639,469 |
| | 692 |
| | 0.1 | % |
| Income from continuing operations before other income (expense) and income tax expense | 45,813 |
| | 27,866 |
| | 17,947 |
| | 64.4 | % | 45,813 |
| | 27,866 |
| | 17,947 |
| | 64.4 | % |
| Other income (expense): | | | | | | | | | | | | | | |
| Gain (loss) on debt extinguishment | 233 |
| | (3,162 | ) | | 3,395 |
| | NM |
| 233 |
| | (3,162 | ) | | 3,395 |
| | NM |
|
| Total other income (expense) | 233 |
| | (3,162 | ) | | 3,395 |
| | NM |
| 233 |
| | (3,162 | ) | | 3,395 |
| | NM |
|
| Income from continuing operations before income tax expense | 46,046 |
| | 24,704 |
| | 21,342 |
| | NM |
| 46,046 |
| | 24,704 |
| | 21,342 |
| | NM |
|
| Income tax expense | (965 | ) | | (601 | ) | | (364 | ) | | (60.6 | )% | (965 | ) | | (601 | ) | | (364 | ) | | (60.6 | )% |
| Income from continuing operations | $ | 45,081 |
| | $ | 24,103 |
| | $ | 20,978 |
| | NM |
| $ | 45,081 |
| | $ | 24,103 |
| | $ | 20,978 |
| | (87.0 | )% |
| | | | | | | | | | | | | | | |
| Gain on disposition of assets | $ | 52,365 |
| | $ | 68,421 |
| | $ | (16,056 | ) | | (23.5 | )% | $ | 52,365 |
| | $ | 68,421 |
| | $ | (16,056 | ) | | 23.5 | % |
NM - Percentages over 100% are not displayed.
RevenuesREVENUES
For the year ended December 31, 2016, approximately 94.9% of our total revenues were generated from long-term leases of our owned properties. The year-over-year increase of 2.8% in total revenue was due primarily to an increase in base rental revenue resulting from real estate acquisitions subsequent to December 31, 2015, as well as recognition of other non-tenant income income and lease termination fees, both of which are recorded in other income.
Rentals
The year-over-year increase in rental revenue was primarily attributable to the acquisition of 269 properties with a gross investment in real estate of $704.9 million during the year ended December 31, 2016. This increase was partially offset by the sale of 213 properties during the same period having a real estate investment value of $598.7 million. During the year ended December 31, 2016 and 2015, non-cash rentals were $30.6 million and $23.4 million, respectively, representing approximately 4.7% and 3.7% of total rental revenue from continuing operations, respectively. Contractual rent escalations subsequent to December 31, 2015 also contributed to the increase.
As of December 31, 2016, 98.2% of our owned properties were occupied (based on number of properties). The majority of our nonperforming properties were in the convenience store and restaurants-casual dining industries. As of December 31, 2016 and 2015, respectively, 46 and 36 of our properties were vacant and not generating rent, representing approximately 1.8% and 1.4% of our owned properties. Of the 46 vacant properties, 10 were held for sale as of December 31, 2016.
Tenant reimbursement income
We have a number of leases that require our tenants to reimburse us for certain property costs we incur. Tenant reimbursement income is driven by the tenant reimbursable property costs described below.
Other income
The year-over-year increase in other income is primarily due to $5.5 million in fee income associated with the prepayment of certain mortgage loans receivable and $7.2 million in lease termination fees received from Haggen and three other properties for the year ended December 31, 2016. Comparatively, for the year ended December 31, 2015, there was only $5.8 million in lease termination fees related to three tenants.
ExpensesEXPENSES
General and administrative
The year-over-year increase in general and administrative expenses is primarily due to a $4.0 million increase in professional fees and office expenses, $2.0 million of bad debt expense recorded in relation to 34 convenience store properties for which the rent has been determined to be uncollectible and a $1.7 million charge for the termination of our interest rate swaps. Higher professional fees and office expenses include legal, consulting and temporary services attributable to our relocation to Dallas, Texas. These increases were partially offset by a decrease in compensation and related benefits of $3.9 million related to the forfeiture of previously recognized non-cash compensation following the departure of an executive officer in the current period.
Restructuring charges
During the quarter ended December 31, 2015, we made the strategic decision to relocate the Company's headquarters from Scottsdale, Arizona to Dallas, Texas. As a result, during the year ended December 31, 2015, the Company incurred $7.1 million of restructuring charges. Comprising the majority of this amount were estimated employee separation costs, which were based on the anticipated separation date of June 30, 2016 and recognized on the date the employee elected to separate in December 2015. Employee separation costs primarily consist of severance payments, retention bonuses and pro-rated 2016 annual bonuses. Costs associated with employees electing to relocate to Dallas were recognized as the liability was incurred. These costs include a transition bonus and reimbursements for certain relocation costs, including home sale costs, lease breakage penalties, moving costs and a miscellaneous allowance. Other restructuring charges, including placement fees and third-party consulting fees, were also recognized when incurred. As such, during the year ended December 31, 2016, we incurred $6.3 million in restructuring charges related to our relocation. Of this amount, $4.9 million related to professional fees, consulting services, employee severance costs, lease termination expense of our prior headquarters, while the balance was for employee relocation costs and other restructuring charges.
Property costs
For the year ended December 31, 2016, property costs were $30.8 million (including $14.1 million of tenant reimbursables) compared to $27.7 million (including $16.0 million of tenant reimbursables) for the same period in 2015. The increase was driven primarily by an increase in non-reimbursable property taxes on non-operating properties of $3.5 million, as well as increased costs to the Company due to the increased number of vacant properties.
Interest
Year-over-year decrease in interest expense is primarily due to the extinguishment of $883.0 million of mortgage debt with a weighted average interest rate of 6.01% during the year ended December 31, 2016. This decrease was partially offset by an increase in interest from our Term Loan, which was entered into during November 2015, and the issuance of our Senior Unsecured Notes in August 2016.
The following table summarizes our interest expense on related borrowings from continuing operations:
| | | | Years Ended December 31, | Years Ended December 31, |
| | 2016 | | 2015 | |
| | (in thousands) | |
| (In Thousands) | | 2016 | | 2015 |
| Interest expense – Revolving Credit Facilities (1) | $ | 3,314 |
| | $ | 2,698 |
| $ | 3,314 |
| | $ | 2,698 |
|
| Interest expense – Term Loan | 5,218 |
| | 888 |
| 5,218 |
| | 888 |
|
| Interest expense – mortgages and notes payable | 143,233 |
| | 184,439 |
| 143,233 |
| | 184,439 |
|
Interest expense – Convertible Notes (2) | 24,509 |
| | 24,509 |
| |
| Interest expense – Convertible Notes | | 24,509 |
| | 24,509 |
|
| Interest expense – Unsecured Senior Notes | 4,932 |
| | — |
| 4,932 |
| | — |
|
| Non-cash interest expense: | | | | | | |
| Amortization of deferred financing costs | 9,070 |
| | 7,937 |
| 9,070 |
| | 7,937 |
|
| Amortization of net losses related to interest rate swaps | 93 |
| | 108 |
| 93 |
| | 108 |
|
| Amortization of debt discount/(premium), net | 6,217 |
| | 2,322 |
| 6,217 |
| | 2,322 |
|
| Total interest expense | $ | 196,586 |
| | $ | 222,901 |
| $ | 196,586 |
| | $ | 222,901 |
|
(1) Includes non-utilization fees of approximately $2.0 million and $1.6 million for the years ended December 31, 2016 and 2015, respectively.
Depreciation and amortization
Depreciation and amortization expense relates primarily to depreciation on the commercial buildings and improvements we own and to amortization of the related lease intangibles. The year-over-year increase is primarily due to the acquisition of 269 properties, representing a gross investment in real estate of $704.9 million, during the year ended December 31, 2016. The increase was partially offset by dispositions of 213 properties during 2016 with a real estate investment value of $598.7 million. Our net acquisitions during the year were partially offset by a reduction in our real estate investment value due to impairment charges recorded in 2016 on properties that remain in our portfolio and a higher real estate value of properties held for sale compared to 2015. Properties held for sale are no longer depreciated.
The following table summarizes our depreciation and amortization expense from continuing operations:
| | | | Years Ended December 31, | Years Ended December 31, |
| | 2016 | | 2015 | |
| | (in thousands) | |
| (In Thousands) | | 2016 | | 2015 |
| Depreciation of real estate assets | $ | 215,443 |
| | $ | 210,395 |
| $ | 215,443 |
| | $ | 210,395 |
|
| Other depreciation | 475 |
| | 375 |
| 475 |
| | 375 |
|
| Amortization of lease intangibles | 46,358 |
| | 49,863 |
| 46,358 |
| | 49,863 |
|
| Total depreciation and amortization | $ | 262,276 |
| | $ | 260,633 |
| $ | 262,276 |
| | $ | 260,633 |
|
Impairments
During the year ended December 31, 2016, we recorded impairment losses of $88.3 million. These charges included $23.1 million of impairment on 28 properties that were held for sale, including $10.6 million of impairment on vacant held for sale properties, and $28.2 million on vacant properties that were not classified as held for sale. The impairment losses also include $26.3 million on 9 underperforming properties within the restaurant-casual dining, movie theater, general merchandise, drug store/pharmacy and distribution industries. In addition, during the year ended December 31, 2016, lease intangible write-offs were primarily due to the $6.6 million write-off of below market rent intangible liabilities for one tenant in the restaurant-casual dining industry. During the year ended December 31, 2015, we incurred impairment losses of $55.4 million from 22 vacant or underperforming properties within the education, restaurant-casual dining and sporting goods industries. In addition, 29 properties held for sale during the period incurred impairment losses of $15.0 million. The balance of the impairment loss included an allowance for loan loss on an unsecured note.
The following summarizes our impairment loss from continuing operations:
| | | | Years Ended December 31, | Years Ended December 31, |
| | 2016 | | 2015 | |
| | (in thousands) | |
| (In Thousands) | | 2016 | | 2015 |
| Real estate and intangible asset impairment | $ | 80,390 |
| | $ | 68,531 |
| $ | 80,390 |
| | $ | 68,531 |
|
| Write-off of lease intangibles due to lease terminations, net | 7,683 |
| | 1,666 |
| 7,683 |
| | 1,666 |
|
| Loans receivable impairment | 176 |
| | 324 |
| 176 |
| | 324 |
|
| Total impairments from real estate investment net assets | 88,249 |
| | 70,521 |
| 88,249 |
| | 70,521 |
|
| Other impairment | 26 |
| | 174 |
| 26 |
| | 174 |
|
| Total impairment loss | $ | 88,275 |
| | $ | 70,695 |
| $ | 88,275 |
| | $ | 70,695 |
|
Gain (loss) on debt extinguishment
During the year ended December 31, 2016, we extinguished $883.0 million of mortgage debt and recognized a gain on debt extinguishment of $0.2 million. The gain was primarily attributable to the extinguishment of four defaulted mortgage loans upon sale of the properties collateralizing these loans to third parties, offset by losses from the prepayment and defeasance fees on 408 properties. During the same period in 2015, we retired $536.6 million in high interest rate CMBS debt with a weighted average interest rate of 5.73%.
Gain on disposition of assets
During the year ended December 31, 2016, we disposed of 213 properties and recorded gains totaling $52.4 million from continuing operations. Included in these amounts are the sales of 14 Shopko properties for a $12.7 million gain, $10.3 million for the sale of one grocery property, a $9.8 million gain on the sale of 30 properties within the restaurant-quick service industry and a $8.8 million gain on the sale of 19 properties with the restaurant-casual dining industry. During 2015, we disposed of 110 properties and recorded gains totaling $68.4 million from continuing operations. These gains are primarily attributable to a $58.7 million gain from the sale of 34 Shopko properties. Additionally, we sold or disposed of 76 other properties, including 31 vacant properties and 5 multi-tenant properties.
Results of Operations
Comparison of the Years Ended December 31, 2015 and 2014
The following discussion includes the results of our continuing operations as summarized in the table below:
|
| | | | | | | | | | | | | | |
| | Years Ended December 31, |
| | 2015 | | 2014 | | Change | | % Change |
| | (in thousands) | | |
| Revenues: | | | | | | | |
| Rentals | $ | 634,151 |
| | $ | 574,456 |
| | $ | 59,695 |
| | 10.4 | % |
| Interest income on loans receivable | 6,948 |
| | 7,239 |
| | (291 | ) | | (4.0 | )% |
| Earned income from direct financing leases | 3,024 |
| | 3,343 |
| | (319 | ) | | (9.5 | )% |
| Tenant reimbursement income | 15,952 |
| | 13,085 |
| | 2,867 |
| | 21.9 | % |
| Other income | 7,260 |
| | 4,748 |
| | 2,512 |
| | 52.9 | % |
| Total revenues | 667,335 |
| | 602,871 |
| | 64,464 |
| | 10.7 | % |
| Expenses: | | | | | | | |
| General and administrative | 47,730 |
| | 42,637 |
| | 5,093 |
| | 11.9 | % |
| Restructuring charges | 7,056 |
| | — |
| | 7,056 |
| | NM |
|
| Finance restructuring costs | — |
| | 13,022 |
| | (13,022 | ) | | (100.0 | )% |
| Property costs | 27,715 |
| | 23,383 |
| | 4,332 |
| | 18.5 | % |
| Real estate acquisition costs | 2,739 |
| | 3,631 |
| | (892 | ) | | (24.6 | )% |
| Interest | 222,901 |
| | 220,070 |
| | 2,831 |
| | 1.3 | % |
| Depreciation and amortization | 260,633 |
| | 247,966 |
| | 12,667 |
| | 5.1 | % |
| Impairment | 70,695 |
| | 37,598 |
| | 33,097 |
| | 88.0 | % |
| Total expenses | 639,469 |
| | 588,307 |
| | 51,162 |
| | 8.7 | % |
| Income from continuing operations before other expense and income tax expense | 27,866 |
| | 14,564 |
| | 13,302 |
| | 91.3 | % |
| Other expense: | | | | | | | |
| Loss on debt extinguishment | (3,162 | ) | | (64,750 | ) | | 61,588 |
| �� | 95.1 | % |
| Total other expense | (3,162 | ) | | (64,750 | ) | | 61,588 |
| | 95.1 | % |
| Income (loss) from continuing operations before income tax expense | 24,704 |
| | (50,186 | ) | | 74,890 |
| | NM |
|
| Income tax expense | (601 | ) | | (673 | ) | | 72 |
| | 10.7 | % |
| Income (loss) from continuing operations | $ | 24,103 |
| | $ | (50,859 | ) | | $ | 74,962 |
| | NM |
|
| | | | | | | | |
| Gain on disposition of assets | $ | 68,421 |
| | $ | 10,221 |
| | $ | 58,200 |
| | NM |
|
NM - Percentages over 100% are not displayed.
Revenues
For the year ended December 31, 2015, 95.5% of our total revenues were generated from long-term leases of our owned properties. The year over year increase of 10.7% in total revenue was due primarily to an increase in base rental revenue resulting from real estate acquisitions subsequent to December 31, 2014.
Rentals
The year-over-year increase in rental revenue was primarily attributable to the acquisition of 232 properties with a gross investment in real estate of $889.2 million during the year ended December 31, 2015. This increase was partially offset by the sale of 110 properties during the same period having a real estate investment value of $541.0 million. During the year ended December 31, 2015 and 2014, non-cash rentals were $23.4 million and $19.3 million, respectively, representing approximately 3.7% and 3.4% of total rental revenue from continuing operations, respectively. Contractual rent escalations subsequent to December 31, 2014 also contributed to the increase.
As of December 31, 2015, 98.6% of our owned properties were occupied (based on number of properties). The majority of our nonperforming properties were in the restaurant, grocery and manufacturing industries. As of December 31, 2015 and 2014, respectively, 36 and 37 of our properties, representing approximately 1.4% and 1.6% of our owned properties, were vacant and not generating rent. Of the 36 vacant properties, 12 were held for sale as of December 31, 2015.
Tenant reimbursement income
We have a number of leases that require our tenants to reimburse us for certain property costs we incur. Tenant reimbursement income is driven by the tenant reimbursable property costs described below.
Other income and interest on real estate transactions
The net change is primarily attributable to lease settlement fees in 2015 of $5.8 million related to three tenants compared to income of $2.7 million from a legal settlement associated with the resolution of a dispute with a tenant during 2014.
Expenses
General and administrative
The year-over-year increase in general and administrative expenses is primarily due to higher compensation and related benefits of $4.8 million, which includes $1.7 million related to non-cash stock compensation. The increase in compensation and related benefits is primarily attributable to the acceleration of cash and non-cash stock compensation of approximately $2.2 million related to the departure of certain executive officers during the year ended December 31, 2015. The balance of the increase in compensation and related benefits is primarily attributable to an increase in employee headcount and salaries between the comparable periods.
Restructuring charges
During the three months ended December 31, 2015, we made the strategic decision to relocate the Company's headquarters from Scottsdale, Arizona to Dallas, Texas. As a result, during the year ended December 31, 2015, the Company incurred $7.1 million of restructuring charges. Comprising the majority of this amount were estimated employee separation costs, which were based on the anticipated separation date of June 30, 2016 and recognized on the date the employee elected to separate in December 2015. Employee separation costs primarily consist of severance payments, retention bonuses and pro-rated 2016 annual bonuses. Costs associated with employees electing to relocate to Dallas are recognized as the liability is incurred. These costs include a transition bonus and reimbursements for certain relocation costs, including home sale costs, lease breakage penalties, moving costs and a miscellaneous allowance. Other restructuring charges, including placement fees and third party consulting fees, will be recognized when incurred. There were no such costs incurred during the year ended December 31, 2014.
Finance restructuring costs
In connection with the Exchange Offer, we incurred costs of approximately $13.0 million during the year ended December 31, 2014, which included legal, accounting and financial advisory services, and other third-party expenses. No such costs were incurred during the year ended December 31, 2015.
Property costs
For the year ended December 31, 2015, property costs were $27.7 million (including $16.0 million of tenant reimbursables) compared to $23.4 million (including $13.1 million of tenant reimbursables) for the same period in 2014. The increase in property costs is primarily attributable to increases in operating costs, such as utilities and property taxes at certain vacant properties, and general operating costs at various properties that allow for reimbursement of such costs. The increase in tenant reimbursables represents the corresponding increase in general reimbursable operating costs.
Interest
Year-over-year interest was relatively unchanged. The higher Convertible Notes interest during the current period was due to the timing of our $747.5 million May 2014 offering. Total cash interest was reduced due to the retirement of high interest rate mortgage notes and maintaining a lower average outstanding principal balance under our Revolving Credit Facilities. During 2015, we extinguished $536.6 million of mortgage notes with a weighted average interest rate of 5.73%, and our average principal balance drawn on our Revolving Credit Facilities was $48.0 million during 2015
compared to $81.3 million during 2014. The reduction in cash interest was offset by an increase in interest incurred on our Term Loan, which closed in November 2015, and the timing of the $510.0 million Master Trust 2014 Notes offering, with a weighted average interest rate of 4.30%, in December 2014.
Non-cash interest increased $5.2 million resulting primarily from the amortization of capitalized deferred financing costs associated with the Master Trust 2014 Notes offering as well as the debt discount associated with our Convertible Notes offering.
The following table summarizes our interest expense on related borrowings from continuing operations:
|
| | | | | | | |
| | Years Ended December 31, |
| | 2015 | | 2014 |
| | (in thousands) |
| Interest expense – Revolving Credit Facilities (1) | $ | 2,698 |
| | $ | 3,597 |
|
| Interest expense – Term Loan | 888 |
| | — |
|
| Interest expense – mortgages and notes payable | 184,439 |
| | 196,246 |
|
Interest expense – Convertible Notes (2) | 24,509 |
| | 15,046 |
|
| Interest expense – other | — |
| | 6 |
|
| Non-cash interest expense: | | | |
| Amortization of deferred financing costs | 7,937 |
| | 5,899 |
|
| Amortization of net losses related to interest rate swaps | 108 |
| | 125 |
|
| Amortization of debt discount/(premium), net | 2,322 |
| | (849 | ) |
| Total interest expense | $ | 222,901 |
| | $ | 220,070 |
|
(1) Includes non-utilization fees of approximately $1.6 million and $1.2 million for the years ended December 31, 2015 and 2014, respectively.
Depreciation and amortization
Depreciation and amortization expense relates primarily to depreciation on the commercial buildings and improvements we own and to amortization of the related lease intangibles. The year-over-year increase is primarily due to the acquisition of 232 properties, representing a gross investment in real estate of $889.2 million, during the year ended December 31, 2015. The increase was partially offset by dispositions of 110 properties during 2015 with a real estate investment value of $541.0 million.
The following table summarizes our depreciation and amortization expense from continuing operations:
|
| | | | | | | |
| | Years Ended December 31, |
| | 2015 | | 2014 |
| | (in thousands) |
| Depreciation of real estate assets | $ | 210,395 |
| | $ | 194,383 |
|
| Other depreciation | 375 |
| | 379 |
|
| Amortization of lease intangibles | 49,863 |
| | 53,204 |
|
| Total depreciation and amortization | $ | 260,633 |
| | $ | 247,966 |
|
Impairments
During the year ended December 31, 2015, we incurred impairment losses of $55.4 million primarily from 22 vacant or underperforming properties within the education, restaurant-casual dining and sporting goods industries. In addition, 29 properties held for sale during the period incurred impairment losses of $15.0 million. The balance of the impairment loss included an allowance for loan loss on an unsecured note. During the year ended December 31, 2014, we recorded impairment losses of $37.6 million. These charges included $20.2 million on the impairment of 21 properties that were held for sale, including two multi-tenant properties, and $22.7 million of impairment on twelve properties which were underperforming. Of the twelve underperforming properties, seven were in the manufacturing industry relating to one original tenant, three were in the quick service restaurant industry, one in the home furnishings industry and one in the pharmaceutical industry. In addition during the year ended December 31, 2014, lease intangible write-offs resulted in
a net credit to impairment of $4.8 million primarily due to the write-off of below market rent intangible liabilities following the amendment to the Shopko master lease.
The following summarizes our impairment loss from continuing operations:
|
| | | | | | | |
| | Years Ended December 31, |
| | 2015 | | 2014 |
| | (in thousands) |
| Real estate and intangible asset impairment | $ | 68,531 |
| | $ | 41,890 |
|
| Write-off of lease intangibles due to lease terminations, net | 1,666 |
| | (4,820 | ) |
| Loans receivable impairment | 324 |
| | — |
|
| Total impairments from real estate investment net assets | 70,521 |
| | 37,070 |
|
| Other impairment | 174 |
| | 528 |
|
| Total impairment loss | $ | 70,695 |
| | $ | 37,598 |
|
Loss on debt extinguishment
During the year ended December 31, 2015, we recognized a loss on debt extinguishment of $3.2 million. The loss included approximately $8.1 million in defeasance costs and fees paid for the retirement of $536.6 million of debt. This amount was partially offset by an agreed upon reduction in principal to a portion of a defaulted CMBS note that exceeded the proceeds from the sale of four properties that secured the loan. During the year ended December 31, 2014, we recorded a loss on debt extinguishment of $64.8 million. The loss on debt extinguishment was related to the retirement of certain senior mortgage notes payable with an aggregate principal balance of $583.8 million. The loss on debt extinguishment was primarily the result of costs incurred related to the Shopko defeasance.
Gain on disposition of assets
During the year ended December 31, 2015, we recorded gains totaling $68.4 million from continuing operations on the disposition of certain real estate assets. These gains are primarily attributable to a $58.7 million gain from the sale of 34 Shopko properties. The Shopko property sales are consistent with management's strategic decision to reduce our Shopko tenant concentration while maximizing our investment value. Additionally, we sold or disposed of 76 other properties, including 31 vacant properties and 5 multi-tenant properties.During 2014, we disposed of 32 properties, and recorded gains totaling $10.2 million from continuing operations. An additional $0.3 million in gains were recorded in discontinued operations from the sale of six properties during 2014.
Liquidity and Capital Resources
Short-term Liquidity and Capital Resources
On a short-term basis, our principal demands for funds will be for operating expenses, including financing of acquisitions, distributions to stockholders and interest and principal on current and any future debt financings. We expect to fund our operating expenses and other short-term liquidity requirements, capital expenditures, payment of principal and interest on our outstanding indebtedness, property improvements, re-leasing costs and cash distributions to common and preferred stockholders, primarily through cash provided by operating activities and borrowings under the 2015Revolving Credit Facility and Term Loan. Our 2015Revolving Credit Facility and Term Loan increase our capacity to fund acquisitions, while continuing to meet our short-term working capital requirements. As of December 31, 2016, $714.02017, $688.0 million of borrowing capacity was available under the 2015 Credit Facility and the Term Loan was fully drawn.
During the third quarter of 2016, the Operating Partnership issued $300.0 million aggregate principal amount of senior notes. The Senior Unsecured Notes are fully and unconditionally guaranteed by the Corporation with a purchase price paid by the initial purchasers for the Senior Unsecured Notes of 99.378% of the principal amount. Net proceeds from this offering were used to initially repay amounts outstanding under the Company's Term Loan, Revolving Credit Facility and for general corporate purposes.$420.0 million was available under the Term Loan.
During 2016, we sold an aggregate total of 6.3 million shares under our ATM Program for net proceeds of $77.7 million after payment of commissions and other issuance costs of $1.3 million. The net proceeds were contributed to the Operating Partnership to fund acquisitions, repay borrowings and for general corporate purposes. In November, 2016, the Corporation's Board of Directors authorizedapproved a new $500$500.0 million ATM Program and the CorporationCompany terminated itsit's existing ATM Program.program. As of December 31, 2016, $500.0 million in gross proceeds capacity remained available2017, no shares had been sold under
the new ATM Program. In addition, during April 2016, we completed an underwritten public offering of 34.5 million shares of our common stock and raised net proceeds of $368.9 million. The net proceeds from the offering were used to reduce outstanding amounts under the Term Loan.
In February 2016, ourthe Company's Board of Directors approved a stock repurchase program, which authorizes the Company to repurchase up to $200.0 million of its common stock. During the year ended December 31, 2017, 26,337,295 shares of the Company's outstanding common stock were repurchased in open market transactions under this stock repurchase program, at a weighted average price of $7.59 per share, equivalent to the full $200.0 million authorized. Fees associated with the share repurchase of $0.5 million are included in retained earnings.
In August, 2017, our Board of Directors approved a new stock repurchase program, which authorizes us to purchase up to $200.0$250.0 million of our common stock in the open market or through private transactions from time to time over the next 18 months. Purchase activity will be dependent on various factors, including our capital position, operating results, funds generated by asset sales, dividends that may be required by those sales, and investment options that may be available, including acquiring new properties or retiring debt. The stock repurchase program does not obligate us to repurchase any specific number of shares and may be suspended at any time at our discretion. We intend to fund any repurchases with the net proceeds from asset sales, cash flows from operations, existing cash on the balance
sheet and other sources. We have notAs of December 31, 2017, the Company had repurchased 9,502,670 shares of its outstanding common stock under this new stock repurchase program.
In October, 2017, the Company completed an underwritten public offering of 6,900,000 shares of 6.00% Series A Cumulative Redeemable Preferred Stock, including 900,000 shares sold pursuant to this stock repurchase program.the underwriter's option to purchase additional shares. Gross proceeds raised were approximately $172.5 million; net proceeds were approximately $166.2 million after deducting underwriter discounts and offering costs paid by the Company. The net proceeds from the offering were initially used to reduce outstanding debt and for general operating purposes of the Company.
Long-term Liquidity and Capital Resources
We plan to meet our long-term capital needs, including long-term financing of property acquisitions, by issuing registered debt or equity securities, obtaining asset level financing and occasionally by issuing fixed rate secured or unsecured notes and bonds. We may continue to issue common stock when we believe that our share price is at a level that allows for the proceeds of any offering to be accretively invested into additional properties. In addition, we may issue common stock to permanently finance properties that were financed by our 2015Revolving Credit Facility, Term Loan or other indebtedness. In the future, some of our property acquisitions could be made by issuing partnership interests of our Operating Partnership in exchange for property owned by third parties. These partnership interests would be exchangeable for cash or, at our election, shares of our common stock.
We continually evaluate alternative financing and believe that we can obtain financing on reasonable terms. However, we cannot assure you that we will have access to the capital markets at times and on terms that are acceptable to us. We expect that our primary uses of capital will be for property and other asset acquisitions and the payment of tenant improvements, operating expenses, including debt service payments on any outstanding indebtedness, and distributions to our stockholders.
Description of Certain Debt
Spirit Master Funding Program
The Spirit Master Funding Program is an asset-backed securitization platform in which we raise capital through the issuance of non-recourse net lease mortgage notes collateralized by commercial real estate, net leases and mortgage loans. The Spirit Master Funding Program allows us to issue notes that are secured by the assets of the special purpose entity note issuers that are pledged to the indenture trustee for the benefit of the noteholders and managed by the Operating Partnership as property manager. These Collateral Pools consist primarily of commercial real estate properties, the issuers’ rights in the leases of such properties and commercial mortgage loans secured by commercial real estate properties. In general, monthly rental and mortgage receipts with respect to the leases and mortgage loans are deposited with the indenture trustee who will first utilize these funds to satisfy the debt service requirements on the notes and any fees and costs associated with the administration of the Spirit Master Funding Program.Program including property and asset management fees payable to Spirit. The remaining funds are remitted to the issuers monthly on the note payment date.
In addition, upon satisfaction of certain conditions, the issuers may, from time to time, sell or exchange real estate properties or mortgage loans from the Collateral Pools. Proceeds from the sale of assets within the Collateral Pools are held on deposit by the indenture trustee until a qualifying substitution is made or the amounts are distributed as an early repayment of principal. At December 31, 2016, $14.42017, $85.7 million was held on deposit and classified as restricted cash within deferred costs and other assets, net in our consolidated balance sheet included in this Annual Report on Form 10-K.
The Spirit Master Funding Program consists of two separate securitization trusts that have one or multiple bankruptcy-remote, special purpose entities as issuers of the Master Trust 2013 and Master Trust 2014 notes. Each issuer is an indirect wholly-owned subsidiary of ours. All outstanding series of Master Trust Notes were rated A+ by S&P as of December 31, 2016.
2017.
Master Trust 2013
In December 2013, an indirect wholly-owned subsidiary of ours issued $330.0 million aggregate principal amount of net-lease mortgage notes comprised of $125.0 million of 3.89% interest onlyinterest-only notes expected to be repaid in December 2018 and $205.0 million of 5.27% amortizing notes expected to be repaid in December 2023.
Master Trust 2014
In May 2014, we completed our Exchange Offer to exchange the outstanding principal balance of three series of existing net-lease mortgage notes for three series of newly issued Master Trust 2014 notes. The terms of the new notes remain generally similar to the old notes including the interest rate and anticipated final repayment dates; however, the new notes generally amortize more slowly than the old notes and have a legal final payment date that is 17 years later than the old notes (although the anticipated repayment date remains the same). The revisions to Master Trust 2014, in connection with the issuance of the new notes, generally provide the Operating Partnership more administrative flexibility as property manager and special servicer. In addition, there is no requirement that the new notes be insured by third party financial guaranty insurance as were the old notes and we no longer pay the associated insurance premium which approximated $0.2 million per month during the applicable periods of 2014. The Exchange Offer was accounted for as a debt modification and the related costs of $13.0 million for the year ended December 31, 2014 are classified as finance restructuring costs in our consolidated statements of operations included in this Annual Report on Form 10-K.
In November 2014, the existing issuers under Master Trust 2014 and two additional indirect wholly-owned subsidiaries of ours, collectively as co-issuers, completed the issuance of $510.0 million aggregate principal amount of net-lease mortgage notes comprised of $150.0 million of 3.50% interest onlyinterest-only notes expected to be repaid in January 2020 and $360.0 million of 4.63% amortizing notes (interest only(interest-only through November 2017) expected to be repaid in January 2030.
At the time of issuance, the Class A notes represented approximately 70% of the collateral appraised value and are currently rated A+ by S&P. The Class B notes are subordinate to the Class A notes as to principal repayment, represent approximately 5% of the collateral value, and are currently rated BBB by S&P.
In December 2017, the existing issuers under Master Trust 2014, collectively as co-issuers, completed the issuance of $674.4 million aggregate principal amount of net-lease mortgage notes comprised of $542.4 million of 4.36%, Class A, amortizing notes and $132.0 million of 6.35%, Class B, interest-only notes, each class of Notes have an anticipated repayment date in December 2022 and a legal final payment date in December 2047. (Refer to Note 17. Subsequent Events, regarding repricing of the Class B Notes). The Operating Partnership retained $27.1 million in aggregate principal amount of Class A Notes and $6.6 million in aggregate principal amount of Class B Notes to satisfy its regulatory risk retention obligations. In conjunction with the issuance, the Company pre-paid Series 2014-1 Class A1 of the 2014 notes.
The Master Trust Notes are summarized below:
| | | | Stated
Rates (1) | | Remaining Term | | December 31,
2016 | | December 31,
2015 | Stated
Rates (1) | | Remaining Term | | December 31,
2017 | | December 31,
2016 |
| | | | (in Years) | | (in Thousands) | | | (in Years) | | (in Thousands) |
| Series 2014-1 Class A1 | 5.1 | % | | 3.5 | | $ | 53,919 |
| | $ | 65,027 |
| — | % | | 0.0 | | $ | — |
| | $ | 53,919 |
|
| Series 2014-1 Class A2 | 5.4 | % | | 3.5 | | 253,300 |
| | 253,300 |
| 5.4 | % | | 2.5 | | 252,437 |
| | 253,300 |
|
| Series 2014-2 | 5.8 | % | | 4.2 | | 226,283 |
| | 229,674 |
| 5.8 | % | | 3.2 | | 222,683 |
| | 226,283 |
|
| Series 2014-3 | 5.7 | % | | 5.2 | | 311,820 |
| | 312,276 |
| 5.7 | % | | 4.2 | | 311,336 |
| | 311,820 |
|
| Series 2014-4 Class A1 | 3.5 | % | | 3.1 | | 150,000 |
| | 150,000 |
| 3.5 | % | | 2.1 | | 150,000 |
| | 150,000 |
|
Series 2017-1 Class A (2) | | 4.4 | % | | 5.0 | | 515,280 |
| | — |
|
Series 2017-1 Class B (2) | | 6.4 | % | | 5.0 | | 125,400 |
| | — |
|
| Series 2014-4 Class A2 | 4.6 | % | | 13.1 | | 360,000 |
| | 360,000 |
| 4.6 | % | | 12.1 | | 358,664 |
| | 360,000 |
|
| Total Master Trust 2014 notes | 5.1 | % | | 6.5 | | 1,355,322 |
| | 1,370,277 |
| 5.0 | % | | 5.4 | | 1,935,800 |
| | 1,355,322 |
|
| Series 2013-1 Class A | 3.9 | % | | 2.0 | | 125,000 |
| | 125,000 |
| 3.9 | % | | 1.0 | | 125,000 |
| | 125,000 |
|
| Series 2013-2 Class A | 5.3 | % | | 7.0 | | 192,384 |
| | 196,817 |
| 5.3 | % | | 6.0 | | 187,704 |
| | 192,384 |
|
| Total Master Trust 2013 notes | 4.7 | % | | 5.0 | | 317,384 |
| | 321,817 |
| 4.7 | % | | 4.0 | | 312,704 |
| | 317,384 |
|
| Total Master Trust Notes | | | 1,672,706 |
| | 1,692,094 |
| | | 2,248,504 |
| | 1,672,706 |
|
| Debt discount, net | | | (18,787 | ) | | (22,909 | ) | | | (36,188 | ) | | (18,787 | ) |
| Deferred financing costs, net | | | (16,376 | ) | | (19,345 | ) | | | (24,010 | ) | | (16,376 | ) |
| Total Master Trust Notes, net | | | $ | 1,637,543 |
| | $ | 1,649,840 |
| | | $ | 2,188,306 |
| | $ | 1,637,543 |
|
(1) Represents the individual series stated interest rate as of December 31, 20162017 and the weighted average stated rate of the total Master Trust Notes, based on the collective series outstanding principal balances as of December 31, 2016.2017.
(2) The Operating Partnership acquired $27.1 million in aggregate principal amount of Class A Notes and $6.6 million in aggregate principal amount of Class B Notes, which eliminate in consolidation, to satisfy its regulatory risk retention obligations.
As of December 31, 2016,2017, the Master Trust 2014 notes were secured by 855815 owned and financed properties issued by 5 indirect wholly-owned subsidiaries of the Corporation. The notes issued under Master Trust 2014 are cross-collateralized by the assets of all issuers within this trust. As of December 31, 2016,2017, the Master Trust 2013 notes were secured by 307296 owned and financed properties issued by a single indirect wholly-owned subsidiary of the Corporation.
Convertible Notes
The Convertible Notes are comprised of two series of notes with an aggregate principal amount of $747.5 million at both December 31, 20162017 and December 31, 2015.2016. Interest on the Convertible Notes is payable semiannually in arrears on May 15 and November 15 of each year. The 2019 Notes, aggregate principal amount $402.5 million, accrue interest at 2.875% and are scheduled to mature on May 15, 2019. The 2021 Notes, aggregate principal amount $345.0 million, accrue interest at 3.75% and are scheduled to mature on May 15, 2021. As of December 31, 2016,2017, the carrying amount of the Convertible Notes was $702.6$715.9 million, which is net of discounts (for the value of the embedded conversion feature) and unamortized deferred financing costs.
Holders may convert notes of either series prior to November 15, 2018, in the case of the 2019 Notes, or November 15, 2020, in the case of the 2021 Notes, only under the following circumstances: (1) if the closing price of our common stock for each of at least 20 trading days (whether or not consecutive) during the last 30 consecutive trading days in the quarter is greater than or equal to 130% of the conversion price for the Convertible Notes; (2) during the five business day period after any 10 consecutive trading day period in which the trading price per $1,000 principal amount of the Convertible Notes for each trading day of the measurement period was less than 98% of the product of the last closing price of our common stock and the conversion rate for the Convertible Notes; (3) if we call any or all of the Convertible Notes for redemption prior to the redemption date; or (4) upon the occurrence of specified corporate events as described in the Convertible Notes prospectus supplement. On or after November 15, 2018, in the case of the 2019 Notes, or November 15, 2020, in the case of the 2021 Notes, until the close of business on the second scheduled trading day immediately preceding the maturity date of the Convertible Notes, holders may convert the Convertible Notes of the applicable series at any time, regardless of the foregoing circumstances. Upon conversion, we will pay or deliver cash, shares of common stock or a combination of cash and shares of common stock, at our election.
The initial conversion rate for the Convertible Notes is 76.3636 shares of common stock per $1,000 principal amount of notes (equivalent to an initial conversion price of approximately $13.10 per share of common stock). The conversion rate for each series of the Convertible Notes is subject to adjustment for some events, including dividends paid in excess of threshold amounts stipulated in the agreement, but will not be adjusted for any accrued and unpaid interest. As of December 31, 2016,2017, the conversion rate was 76.810077.3144 per $1,000 principal note. If we undergo a fundamental change (as defined in the Convertible Notes supplemental indentures), holders may require us to repurchase all or any portion of their notes at a repurchase price equal to 100% of the principal amount of the notes to be repurchased, plus accrued and unpaid interest.
2015Revolving Credit Facility
On March 31, 2015, the Operating PartnershipCompany entered into the Credit Agreement, among the Operating Partnership as borrower and the Company as guarantor, that established a new $600.0 million unsecured credit facility and terminated its secured $400.0 million 2013 Credit Facility. The 2015Revolving Credit Facility was subsequently amended in November, 2016 and matures on March 31, 2019 (extendable(extendible at the Operating Partnership's option to March 31, 2020, subject to satisfaction of certain requirements). The amendment conformed certain of the terms and covenants to those in the Term Loan Agreement, including limiting the requirement of subsidiary guarantees to material subsidiaries (as defined) meeting certain conditions. The 2015 Credit Facility includes an accordion feature to increase the committed facility size to up to $1.0 billion, subject to satisfying certain requirements and obtaining additional lender commitments. On April 27, 2016, the Company expanded the borrowing capacity under the 2015Revolving Credit Facility from $600.0 million to $800.0 million by partially exercising the accordion feature under the terms of the Credit Agreement. The 2015Revolving Credit Facility also includes a $50.050.0 million sub-limit for swinglineswing-line loans and up to $60.0 million available for issuancesissuance of letters of credit. SwinglineSwing-line loans and letters of credit reduce availability under the 2015Revolving Credit Facility on a dollar-for-dollar basis.
At On November 3, 2015, the electionCompany entered into a first amendment to the Credit Agreement. The amendment conforms certain of the Operating Partnership, the 2015 Credit Facility initially bears interest at our current leverage grid pricing equalterms and covenants to either LIBOR plus 1.40% to 1.90% per annum, or a specified base rate plus 0.40% to 0.90% per annum. In each case, the applicable rates depend on our leverage ratio. The Operating Partnership is initially required to pay a fee on the unused portion of the 2015 Credit Facility at a rate equal to either 0.15% or 0.25% per annum, based on percentage thresholds for the average daily amount by which the aggregate amount of the revolving credit commitment exceeds the aggregate principal amount of advances during a fiscal quarter. Per the amendment, the Operating Partnership’s election to change the grid pricing from leverage based to credit rating based pricing initially requires at least two credit ratings of BBB- or better from S&P or Fitch or Baa3 or better from Moody’s. In April 2016, the Corporation received a first time rating of BBB- from Fitch and was upgraded to a BBB- corporate issuer rating by S&P. As a result, the Operating Partnership elected to change the interest rate grid from leverage based pricing to credit rating based pricingthose in the second quarterTerm Loan Agreement, including limiting the requirement of 2016. Under credit rating based pricing,subsidiary guaranties to material subsidiaries (as defined in the 2015Credit Agreement) meeting certain conditions. At December 31, 2017, there were no subsidiaries meeting this requirement.
The Revolving Credit Facility bears interest at a rate equal to LIBOR plus 0.875% to 1.55% per annum or a specified base rate plus 0.0% to 0.55%
and requires a facility fee in an amount equal to the aggregate revolving credit commitments (whether or not utilized) multiplied by a rate equal to 0.125% to 0.30% per annum, in each case depending
on the Corporation's credit rating. As of December 31, 2016,2017, the 2015Revolving Credit Facility bore interest at LIBOR plus 1.25% based on ourthe Company's credit rating and incurred a facility fee of 0.25% per annum.
The Operating Partnership may voluntarily prepay the 2015Revolving Credit Facility, in whole or in part, at any time, without premium or penalty, but subject to applicable LIBOR breakage fees, if any. Payment of the 2015Revolving Credit Facility is unconditionally guaranteed by the Corporation and material subsidiaries that meet certain conditions (as defined in the Credit Agreement). As of December 31, 2016,2017, there were no subsidiaries that met this requirement.
As of December 31, 2016, $86.02017, $112.0 million in borrowings were outstanding and $714.0$688.0 million of borrowing capacity was available under the 2015Revolving Credit Facility. Amounts available for borrowing under the 2015Revolving Credit Facility remain subject to compliance with certain customary restrictive covenants including:
Maximum leverage ratio (defined as consolidated total indebtedness plus the Corporation’s pro rata share of indebtedness of unconsolidated affiliates, net of certain cash and cash equivalents, to total asset value) of 0.60:1.00, which may be increased to 0.65:1.00 for four consecutive quarters after certain material acquisitions;
Minimum fixed charge coverage ratio (defined as EBITDA plus the Corporation’s pro rata share of EBITDA of unconsolidated affiliates, to fixed charges) of 1.50:1.00;
Maximum secured indebtedness leverage ratio (defined as consolidated secured indebtedness plus the Corporation’s pro rata share of secured indebtedness of unconsolidated affiliates, net of certain cash and cash equivalents, to total asset value) of 0.50:1:00;
Minimum unsecured interest coverage ratio (defined as consolidated net operating income from unencumbered properties, to unsecured interest expense) of 1.75:1.00;
Maximum unencumbered leverage ratio (defined as consolidated unsecured indebtedness plus the Corporation’s pro rata share of unsecured indebtedness of unconsolidated affiliates, net of certain cash and cash equivalents, to total unencumbered asset value) of 0.60:1:00, which may be increased to 0.65:1.00 for four consecutive quarters after certain material acquisitions; and
Minimum tangible net worth of at least $3.01 billion plus 75% of the net proceeds of equity issuances by the Corporation or the Operating Partnership after December 31, 2014.
In addition to these covenants, the Credit Agreement also includes other customary affirmative and negative covenants, such as (i) limitation on liens and negative pledges; (ii) transactions with affiliates; (iii) limitation on mergers, consolidations and sales of all or substantially all assets; (iv) maintenance of status as a REIT and listing on any national securities exchange; and (v) material modifications to organizational documents.
As of December 31, 2016,2017, the Corporation and the Operating Partnership were in compliance with these covenants.
Line of Credit
A special purpose entity indirectly owned by the Corporation had access to a $40.0 million secured revolving line of credit which expired on March 27, 2016.
Term Loan
On November 3, 2015, we entered into a Term Loan Agreement among the Operating Partnership as borrower, the Corporation as guarantor and the lenders that are parties thereto. The Term Loan Agreement provides for a $325.0 million senior unsecured term facility that has an initial maturity date of November 2, 2018, which may be extended at our option pursuant to two one-year extension options, subject to the satisfaction of certain conditions and payment of an extension fee. In addition, an accordion feature allows the facility to be increased to up to $600.0 million, subject to obtaining additional lender commitments. In December 2015, upon obtaining additional lender commitments, we increased the term facility from $325.0 million to $370.0 million. On December 19, 2016, we increased the term facility from $370.0 million to $420.0 million.
The Term Loan Agreement provides that borrowings bear interest at either LIBOR plus 1.35% to 1.80% per annum or a specified base rate plus 0.35% to 0.80% per annum, at the Operating Partnership's election. In each case, the applicable margin is determined based upon the Corporation’s leverage ratio. If the Corporation obtains at least two credit ratings on its senior unsecured long-term indebtedness of BBB- from S&P or Fitch, Inc. or Baa3 from Moody's, the Operating Partnership may make an irrevocable election to have the margin based upon the Corporation's credit ratings. In April 2016, the Corporation received a first time rating of BBB- from Fitch and was upgraded to a BBB- corporate issuer rating by S&P. As a result, the Operating Partnership elected to change the interest rate grid from
leverage based pricing to credit rating based pricing in the second quarter of 2016. Under credit rating based pricing, borrowings will bear interest at either LIBOR plus 0.90% to 1.75% per annum or a specified base rate plus 0.0% to 0.75% per annum, in each case depending on the Corporation’s credit ratings. As of December 31, 2016,2017, the Term Loan bore interest at LIBOR plus 1.35% based on our credit rating.
The Operating Partnership may voluntarily prepay the Term Loan, in whole or in part, at any time, without premium or penalty, but subject to applicable LIBOR breakage fees. Amounts prepaid may be subsequently re-borrowed within 30 days. Payment of the Term Loan is unconditionally guaranteed by the Corporation and, under certain circumstances, by one or more material subsidiaries (as defined in the Term Loan Agreement) of the Corporation. The obligations of the Operating Partnership and any guarantor under the Term Loan are full recourse to the Corporation and each guarantor.
As of December 31, 2016,2017, the Term Loan was fully drawn.provided $420.0 million of borrowing capacity. Amounts available for borrowing under the Term Loan remain subject to compliance with certain customary restrictive covenants including:
Maximum leverage ratio (defined as consolidated total indebtedness plus the Corporation’s pro rata share of indebtedness of unconsolidated affiliates, net of certain cash and cash equivalents, to total asset value) of 0.60:1.00, which may be increased to 0.65:1.00 for four consecutive quarters after certain material acquisitions;
Minimum fixed charge coverage ratio (defined as consolidated EBITDA plus the Corporation’s pro rata share of EBITDA of unconsolidated affiliates to fixed charges) of 1.50:1.00;
Maximum secured indebtedness leverage ratio (defined as consolidated secured indebtedness plus the Corporation’s pro rata share of secured indebtedness of unconsolidated affiliates, net of certain cash and cash equivalents to total asset value) of 0.50:1:00;
Minimum unsecured interest coverage ratio (defined as consolidated net operating income from unencumbered properties to unsecured interest expense) of 1.75:1.00;
Maximum unencumbered leverage ratio (defined as consolidated unsecured indebtedness plus the Corporation’s pro rata share of unsecured indebtedness of unconsolidated affiliates, net of certain cash and cash equivalents, to total unencumbered asset value) of 0.60:1:00, which may be increased to 0.65:1.00 for four consecutive quarters after certain material acquisitions; and
Minimum tangible net worth of at least $3.01 billion plus 75% of the net proceeds of equity issuances by the Corporation or the Operating Partnership after December 31, 2014.
In addition, the Term Loan Agreement includes other customary affirmative and negative covenants, including (i) limitation on liens and negative pledges; (ii) transactions with affiliates; (iii) limitation on mergers, consolidations and sales of all or substantially all assets; (iv) maintenance of status as a REIT and listing on a national securities exchange; and (v) material modifications to organizational documents. The ability to borrow under the Term Loan Agreement is subject to continued compliance with all of the covenants described above.
As of December 31, 2016,2017, the Corporation and the Operating Partnership were in compliance with these financial covenants.
Senior Unsecured Notes
On August 18, 2016, the Operating Partnership completed a private placement of $300.0 million aggregate principal amount senior notes through a Rule 144A offering with registration rights, which are guaranteed by the Corporation. The Senior Unsecured Notes were issued at 99.378% of their principal amount, resulting in net proceeds of $296.2 million after deducting transaction fees and expenses. The Senior Unsecured Notes accrue interest at a rate of 4.450% per year, payable on March 15 and September 15 of each year, until the maturity date of September 15, 2026. We have agreed to fileThe Company filed a registration statement with the SEC and cause to become effective a registration statement pursuant to which we will offer to exchange the private Senior Unsecured Notes for registered Senior Unsecured Notes with substantially similaridentical terms, which became effective April 14, 2017. All $300.0 million aggregate principal amount of private Senior Unsecured Notes were tendered in the exchange for registered notes.Senior Unsecured Notes.
The Senior Unsecured Notes are redeemable in whole at any time or in part from time to time, at the Operating Partnership’s option, at a redemption price equal to the sum of: an amount equal to 100% of the principal amount of the Senior Unsecured Notes to be redeemed plus accrued and unpaid interest and liquidated damages, if any, up to, but not including, the redemption date; and a make-whole premium calculated in accordance with the indenture. Notwithstanding the foregoing, if any of the Senior Unsecured Notes are redeemed on or after June 15, 2026 (three months prior to the maturity date of the Senior Unsecured Notes), the redemption price will not include a make-whole premium.
In connection with the issuance of the Senior Unsecured Notes, the Corporation and Operating Partnership remain subject to compliance with certain customary restrictive covenants including:
Maximum leverage ratio (defined as consolidated total indebtedness, to total consolidated undepreciated real estate assets plus the Company’s other assets, excluding accounts receivable and non-real estate intangibles) of 0.60:1.00;
Minimum unencumbered asset coverage ratio (defined as total consolidated undepreciated real estate assets plus the Company’s other assets, excluding accounts receivable and non-real estate intangibles, to consolidated total unsecured indebtedness) of 1.50:1:00;
Maximum secured indebtedness leverage ratio (defined as consolidated total secured indebtedness, to total consolidated undepreciated real estate assets plus the Company’s other assets, excluding accounts receivable and non-real estate intangibles) of 0.40:1.00; and
Minimum fixed charge coverage ratio (defined as consolidated income available for debt service, to the annual service charge) of 1.50:1.0.
In addition, the Senior Unsecured Notes Agreement includes other customary affirmative and negative covenants, including (i) maintenance of status as a REIT; (ii) payment of all taxes, assessments and governmental charges levied on the REIT; (iii) reporting on financial information; and (iv) maintenance of properties and property insurance.
As of December 31, 2016,2017, the Corporation and the Operating Partnership were in compliance with these financial covenants.
CMBS
We may use long-term, fixed-rate debt to finance our properties on a “match-funded” basis.properties. In such events, we generally seek to use asset level financing that bears annual interest less than the annual rent on the related lease(s) and that matures prior to the expiration of such lease(s). In general, the obligor of our asset level debt is a special purpose entity that holds the real estate and other collateral securing the indebtedness. Each special purpose entity is a bankruptcy remote separate legal entity, and is the sole owner of its assets and solely responsible for its liabilities other than typical non-recurring covenants.
As of December 31, 2016,2017, we had 3112 loans with approximately $528.4$332.6 million of outstanding principal balances under our fixed rate CMBS loans, with a weighted average contractual interest rate of 5.70%5.81% and a weighted average maturity of 3.84.6 years. Approximately one-third of this debt is partially amortizing and requires a balloon payment at maturity. These balances include twosix separate fixed-rate CMBS loans that are in default due to the underperformance of the foureight properties that secure them. As of December 31, 2016,2017, the aggregate principal balance under the defaulted CMBS loans was $26.6$64.3 million, including $9.5$13.2 million of default interest added to principal, and is discussed further below. Excluding these twosix loans, the outstanding principal obligations under our CMBS fixed-rate loans as of December 31, 20162017 was $501.9$268.3 million.
The table below shows the outstanding principal obligations, including amortization, of these CMBS fixed rate loans as of December 31, 20162017 and the year in which the loans mature (dollars in thousands). The information displayed in the table excludes amounts and interest rates related to the defaulted loans and the foureight properties securing them.
| | | Year of Maturity | Number of Loans | | Number of Properties | | Stated Interest Rate Range | | Weighted Average Stated Rate | | Scheduled Principal | | Balloon | | Total | Number of Loans | | Number of Properties | | Stated Interest Rate Range | | Weighted Average Stated Rate | | Scheduled Principal | | Balloon | | Total |
| 2017 | 18 |
| | 15 |
| | 5.51%-6.52% | | 5.72 | % | | $ | 4,222 |
| | $ | 161,373 |
| | $ | 165,595 |
| |
| | | | | | | | | | | | | |
| 2018 | 4 |
| | 10 |
| | 3.90%-4.65% | | 4.03 | % | | 3,853 |
| | 57,779 |
| | 61,632 |
| — |
| | — |
| | 0 | | — | % | | $ | 3,692 |
| | $ | — |
| | $ | 3,692 |
|
| 2019 | 1 |
| | 5 |
| | 4.61%-4.61% | | 3.32 | % | | 3,905 |
| | 10,000 |
| | 13,905 |
| — |
| | — |
| | — | | — |
| | 3,905 |
| | — |
| | 3,905 |
|
| 2020 | — |
| | — |
| | — | | — |
| | 4,100 |
| | — |
| | 4,100 |
| — |
| | — |
| | — | | — |
| | 4,100 |
| | — |
| | 4,100 |
|
| 2021 | — |
| | — |
| | — | | — |
| | 4,365 |
| | — |
| | 4,365 |
| — |
| | — |
| | — | | — |
| | 4,365 |
| | — |
| | 4,365 |
|
| 2022 | | 1 |
| | 12 |
| | 4.67% | | 4.67 |
| | 4,617 |
| | 42,400 |
| | 47,017 |
|
| Thereafter | 6 |
| | 100 |
| | 4.67%-6.00% | | 5.77 | % | | 11,891 |
| | 240,380 |
| | 252,271 |
| 5 |
| | 88 |
| | 5.23%-6.00% | | 5.48 |
| | 7,276 |
| | 197,980 |
| | 205,256 |
|
| Total | 29 |
| | 130 |
| |
| | 5.37 | % | | 32,336 |
| | 469,532 |
| | 501,868 |
| 6 |
| | 100 |
| | 5.35 | % | | $ | 27,955 |
| | $ | 240,380 |
| | $ | 268,335 |
|
CMBS Liquidity Matters
During the year ended December 31, 2016, we transferred seven properties to lenders with a net book value of $34.7 million and extinguished defaulted principal and accrued interest outstanding of $64.1 million. As of December 31, 2016,2017, we are in default on twosix separate CMBS loans due to the underperformance of the properties securing these loans. The wholly-owned special purpose entities subject to these mortgage loans are separate legal entities and the sole owner of their assets and responsible for their liabilities. The aggregate outstanding principal balance of these loans, including capitalized interest, totaled $26.6$64.3 million. We believe the value of these properties is less than the related debt. As a result, we have notified the lenders of each special purpose entity that we anticipate either surrendering these properties to the lenders or selling them in certain instances in exchange for relieving the indebtedness, including any accrued interest and accrued or unpaid property expenses, encumbering them.
The following table provides key elements of the defaulted mortgage loans (dollars in thousands):
| | | Industry | Properties | | Net Book Value | | Monthly Base Rent | | Pre-Default Outstanding Principal | | Capitalized Interest (1) | | Total Debt Outstanding | | Restricted Cash (2) | | Stated Rate | | Default Rate | | Accrued Interest (1) | Properties | | Net Book Value | | Monthly Base Rent | | Pre-Default Outstanding Principal | | Capitalized Interest (1) | | Total Debt Outstanding | | Restricted Cash (2) | | Stated Rate | | Default Rate | | Accrued Interest (1) |
| | | | | | | | | | | | | | | | | | | | |
| Manufacturing | | 2 | | $ | 3,618 |
| | $ | 16 |
| | $ | 5,460 |
| | $ | 11,354 |
| | $ | 16,814 |
| | $ | — |
| | 5.85 | % | | 9.85 | % | | $ | 143 |
|
| Sporting Goods | 1 |
| | $ | 6,351 |
| | $ | — |
| | $ | 6,321 |
| | $ | 30 |
| | $ | 6,351 |
| | $ | 376 |
| | 5.62 | % | | 10.62 | % | | $ | 58 |
| 1 | | 3,070 |
| | — |
| | 6,321 |
| | 429 |
| | 6,750 |
| | 453 |
| | 5.62 |
| | 10.62 |
| | 80 |
|
| Manufacturing | 3 |
| | 20,206 |
| | — |
| | 10,730 |
| | 9,476 |
| | 20,206 |
| | — |
| | 5.85 | % | | 9.85 | % | | 216 |
| |
| Consumer Electronics | | 1 | | 3,021 |
| | — |
| | 8,592 |
| | 592 |
| | 9,184 |
| | 286 |
| | 5.87 |
| | 9.87 |
| | 62 |
|
| Multi-Tenant Retail | | 1 | | 12,580 |
| | 95 |
| | 17,250 |
| | 398 |
| | 17,648 |
| | 575 |
| | 5.53 |
| | 7.53 |
| | 78 |
|
| Sporting Goods | | 2 | | 3,457 |
| | — |
| | 9,625 |
| | 310 |
| | 9,935 |
| | — |
| | 4.39 |
| | 9.39 |
| | 78 |
|
| Sporting Goods | | 1 | | 2,010 |
| | — |
| | 3,853 |
| | 128 |
| | 3,981 |
| | 169 |
| | 4.65 |
| | 9.65 |
| | 33 |
|
| 4 |
| | $ | 26,557 |
| | $ | — |
| | $ | 17,051 |
| | $ | 9,506 |
| | $ | 26,557 |
| | $ | 376 |
| | 5.80 | % | | 10.04 | % | | $ | 274 |
| 8 | | $ | 27,756 |
| | $ | 111 |
| | $ | 51,101 |
| | $ | 13,211 |
| | $ | 64,312 |
| | $ | 1,483 |
| | 5.44 | % | | 9.21 | % | | $ | 474 |
|
(1) Interest capitalized to principal that remains unpaid.
(2) Represents restricted cash controlled by the lender that may be applied to reduce the outstanding principal balance.
Debt Maturities
Future principal payments due on our various types of debt outstanding as of December 31, 20162017 (in thousands):
| | | | Total | | 2017 | | 2018 | | 2019 | | 2020 | | 2021 | | Thereafter | Total | | 2018 | | 2019 | | 2020 | | 2021 | | 2022 | | Thereafter |
| Term Loan | $ | 420,000 |
| | $ | — |
| | $ | 420,000 |
| | $ | — |
| | $ | — |
| | $ | — |
| | $ | — |
| |
| 2015 Credit Facility | 86,000 |
| | — |
| | — |
| | 86,000 |
| | — |
| | — |
| | — |
| |
| | | | | | | | | | | | | | | |
| Revolving Credit Facility | | 112,000 |
| | — |
| | 112,000 |
| | — |
| | — |
| | — |
| | — |
|
| Master Trust Notes | 1,672,706 |
| | 21,893 |
| | 163,262 |
| | 40,420 |
| | 448,202 |
| | 236,046 |
| | 762,883 |
| 2,248,504 |
| | 163,185 |
| | 40,230 |
| | 410,713 |
| | 237,790 |
| | 969,020 |
| | 427,566 |
|
CMBS - fixed-rate (1) | 528,427 |
| | 192,154 |
| | 61,632 |
| | 13,905 |
| | 4,100 |
| | 4,365 |
| | 252,271 |
| 332,647 |
| | 68,004 |
| | 3,905 |
| | 4,100 |
| | 4,365 |
| | 47,017 |
| | 205,256 |
|
| Convertible Notes | 747,500 |
| | — |
| | — |
| | 402,500 |
| | — |
| | 345,000 |
| | — |
| 747,500 |
| | — |
| | 402,500 |
| | — |
| | 345,000 |
| | — |
| | — |
|
| Unsecured Senior Notes | 300,000 |
| | — |
| | — |
| | — |
| | — |
| | — |
| | 300,000 |
| 300,000 |
| | — |
| | — |
| | — |
| | — |
| | — |
| | 300,000 |
|
| | $ | 3,754,633 |
| | $ | 214,047 |
| | $ | 644,894 |
| | $ | 542,825 |
| | $ | 452,302 |
| | $ | 585,411 |
| | $ | 1,315,154 |
| $ | 3,740,651 |
| | $ | 231,189 |
| | $ | 558,635 |
| | $ | 414,813 |
| | $ | 587,155 |
| | $ | 1,016,037 |
| | $ | 932,822 |
|
(1)The CMBS - fixed-rate payment balance in 20162018 includes $26.6$64.3 million, including $9.5$13.2 million of capitalized interest, for the acceleration of principal payable following an event of default under 26 separate CMBS loans with stated maturities in 2017.2018.
Contractual Obligations
The following table provides information with respect to our commitments as well as potential acquisitions under contract as of December 31, 2016,2017, the table does not reflect available debt extensions (in thousands):
| | | | | Payment due by period | | Payment due by period |
| | | | | | | | | | | More than | | | | | | | | | | More than |
| | | | | Less than 1 | | 1-3 years | | 3-5 years | | 5 years | | | | Less than 1 | | 1-3 years | | 3-5 years | | 5 years |
| Contractual Obligations | | Total | | Year (2017) | | (2018-2019) | | (2020-2021) | | (after 2021) | | Total | | Year (2018) | | (2019-2020) | | (2021-2022) | | (after 2022) |
| | | | | | | | | | | | |
| Debt - Principal | | $ | 3,754,633 |
| | $ | 214,047 |
| | $ | 1,187,719 |
| | $ | 1,037,713 |
| | $ | 1,315,154 |
| | $ | 3,740,651 |
| | $ | 231,189 |
| | $ | 973,448 |
| | $ | 1,603,192 |
| | $ | 932,822 |
|
Debt - Interest (1) (3) | | 796,059 |
| | 158,651 |
| | 273,111 |
| | 180,096 |
| | 184,201 |
| | 795,950 |
| | 170,252 |
| | 288,219 |
| | 192,452 |
| | 145,027 |
|
Acquisitions Under Contract (2) | | 45,598 |
| | 45,598 |
| | — |
| | — |
| | — |
| | 29,281 |
| | 29,281 |
| | — |
| | — |
| | — |
|
| Capital Improvements | | 53,085 |
| | 52,759 |
| | 326 |
| | — |
| | — |
| | 34,128 |
| | 30,203 |
| | 2,525 |
| | 1,400 |
| | — |
|
| Operating Lease Obligations | | 38,918 |
| | 2,912 |
| | 6,047 |
| | 6,009 |
| | 23,950 |
| | 43,842 |
| | 3,157 |
| | 6,356 |
| | 6,312 |
| | 28,017 |
|
| Total | | $ | 4,688,293 |
| | $ | 473,967 |
| | $ | 1,467,203 |
| | $ | 1,223,818 |
| | $ | 1,523,305 |
| | $ | 4,643,852 |
| | $ | 464,082 |
| | $ | 1,270,548 |
| | $ | 1,803,356 |
| | $ | 1,105,866 |
|
(1) Excludes interest on defaulted mortgage loans.
(2) Contracts contain standard cancellation clauses contingent on results of due diligence.
(3) Debt - Interest has been calculated based on outstanding balances as of December 31, 20162017 through their respective maturity dates and includes the impact of interest rates swaps executed to fix floating rate indebtedness and excludes unamortized non-cash deferred financing costs of $37.1$39.6 million, unamortized debt discount of $52.9$61.4 million and any interest due on defaulted mortgage loans, including $0.3$0.5 million accrued as of December 31, 2016.2017.
Distribution Policy
Distributions from our current or accumulated earnings are generally classified as ordinary income, whereas distributions in excess of our current and accumulated earnings, to the extent of a stockholder’s federal income tax basis in our common stock, are generally classified as a return of capital. Under the 2017 Tax Legislation, U.S. stockholders that are individuals, trusts and estates generally may deduct up to 20% of the ordinary dividends (e.g., dividends not designated as capital gain dividends or qualified dividend income) received from a REIT for taxable years beginning after December 31, 2017 and before January 1, 2026. Distributions in excess of a stockholder’s federal income tax basis in our common stock are generally characterized as capital gain.
We are required to distribute 90% of our taxable income (subject to certain adjustments and excluding net capital gain) on an annual basis to maintain qualification as a REIT for federal income tax purposes and are required to pay federal income tax at regular corporate rates to the extent we distribute less than 100% of our taxable income (including capital gains).
We intend to make distributions that will enable us to meet the distribution requirements applicable to REITs and to eliminate or minimize our obligation to pay corporate-level federal income and excise taxes.
Any distributions will be at the sole discretion of our boardBoard of directors,Directors, and their form, timing and amount, if any, will depend upon a number of factors, including our actual and projected results of operations, FFO, liquidity, cash flows and financial condition, the revenue we actually receive from our properties, our operating expenses, our debt service requirements, our capital expenditures, prohibitions and other limitations under our financing arrangements, our REIT taxable income, the annual REIT distribution requirements, applicable law and such other factors as our boardBoard of directorsDirectors deems relevant.
Cash Flows
Comparison of Years Ended December 31, 2017 and 2016
The following table presents a summary of our cash flows for the years ended December 31, 2017 and 2016 (in thousands):
|
| | | | | | | | | | | |
| | Years Ended |
| | December 31, |
| | 2017 | | 2016 | | Change |
| Net cash provided by operating activities | $ | 386,393 |
| | $ | 361,409 |
| | $ | 24,984 |
|
| Net cash provided by (used in) investing activities | 82,942 |
| | (117,251 | ) | | 200,193 |
|
| Net cash used in financing activities | (470,596 | ) | | (255,889 | ) | | (214,707 | ) |
| Net (decrease) increase in cash and cash equivalents | $ | (1,261 | ) | | $ | (11,731 | ) | | $ | 10,470 |
|
As of December 31, 2017, we had $8.8 million of unrestricted cash and cash equivalents as compared to $10.1 million as of December 31, 2016.
Operating Activities
Our cash flows from operating activities are primarily dependent upon the occupancy level of our portfolio, the rental rates specified in our leases, the collectability of rent and the level of our operating expenses and other general and administrative costs.
The increase in net cash provided by operating activities was primarily attributable to a decrease in costs associated with debt extinguishment of $22.9 million due to a lower volume of mortgage debt being extinguished, a decrease in cash paid for interest of $18.4 million related to the lower level of outstanding mortgage debt, and reduced restructuring charge payments of $11.3 million as restructuring activities were finalized in 2016, offset by a decrease in cash revenue of $19.1 million and increases in property costs of $5.8 million related to reimbursable and non-reimbursable property taxes, and G&A costs of $3.6 million.
The decrease in revenue was primarily attributable to the disposition of 192 properties, representing a gross investment in real estate during the year ended December 31, 2017 of $510.9 million, partially offset by the acquisition of 39 properties, during the same period, with a real estate investment value totaling $323.0 million.
Investing Activities
Cash provided by (used in) investing activities is generally used to fund property acquisitions, for investments in loans receivable and, to a limited extent, for capital expenditures. Cash provided by investing activities generally relates to the disposition of real estate and other assets.
Net cash provided by investing activities during 2017 included cash proceeds of $472.5 million from the disposition of 192 properties, offset by $279.9 million to fund the acquisition of 39 properties and capitalized real estate expenditures of $46.1 million and the transfer of sales proceeds to restricted cash accounts of $71.3 million . Net cash provided by investing activities also included collections of principal on loans receivable and real estate assets under direct financing leases totaling $12.8 million and the investment in notes receivable of $5.0 million.
During the same period in 2016, net cash used in investing activities included $655.8 million to fund the acquisition of 269 properties and capitalized real estate expenditures of $27.1 million partially offset by cash proceeds of $524.8 million from the disposition of 213 properties. Net cash used in investing activities also included collections of principal on loans receivable and real estate assets under direct financing leases totaling $8.4 million, offset by the release of sales proceeds from restricted cash accounts of $2.3 million.
Financing Activities
Generally, our net cash used in financing activities is impacted by our common and preferred stock offerings and activity, including repurchases of our common stock under our Stock Repurchase Program, borrowings under our Revolving Credit Facilities and Term Loan, and issuances of net-lease mortgage notes under our Spirit Master Funding Program.
Net cash used in financing activities during 2017 was primarily attributable to the repayment of the $420.0 million Term Loan, the payment of dividends to common and preferred equity owners of $341.7 million, the repurchase of 35,839,965 shares of the Company's outstanding common stock for $286.6 million and repayments of $221.3 million in mortgages and notes payable, offset by the issuance of 6.9 million shares of Class A Preferred Stock for net proceeds of $166.2 million, and debt issuances under our Spirit Master Funding Program of $618.6 million.
Net cash used in financing activities during 2016 was primarily attributable to the repayment of our indebtedness of $863.8 million and the payment of dividends to equity owners of $323.6 million, both of which were primarily funded from our operating cash flows, net borrowings under our Revolving Credit Facility and Term Loan of $86.0 million and $95.0 million, respectively, net proceeds of $298.1 million from the issuance of $300.0 million aggregate principal Senior Unsecured Notes and the sale of an aggregate 40.8 million shares of our common stock in an underwritten public offering and under our ATM Program, generating net proceeds of $368.9 million and $77.7 million, respectively.
Comparison of Years Ended December 31, 2016 and 2015
The following table presents a summary of our cash flows for the years ended December 31, 2016 and 2015 (in thousands):
| | | | Years Ended | Years Ended |
| | December 31, | December 31, |
| | 2016 | | 2015 | | Change | 2016 | | 2015 | | Change |
| Net cash provided by operating activities | $ | 361,409 |
| | $ | 371,986 |
| | $ | (10,577 | ) | $ | 361,409 |
| | $ | 371,986 |
| | $ | (10,577 | ) |
| Net cash used in investing activities | (117,251 | ) | | (385,696 | ) | | 268,445 |
| (117,251 | ) | | (385,696 | ) | | 268,445 |
|
| Net cash used in financing activities | (255,889 | ) | | (140,681 | ) | | (115,208 | ) | |
| Net (decrease) increase in cash and cash equivalents | $ | (11,731 | ) | | $ | (154,391 | ) | | $ | 142,660 |
| |
| Net cash provided by financing activities | | (255,889 | ) | | (140,681 | ) | | (115,208 | ) |
| Net increase (decrease) in cash and cash equivalents | | $ | (11,731 | ) | | $ | (154,391 | ) | | $ | 142,660 |
|
As of December 31, 2016, we had $10.1 million of unrestricted cash and cash equivalents as compared to $21.8 million as of December 31, 2015.
Operating Activities
Our cash flows from operating activities are primarily dependent upon the occupancy level of our portfolio, the rental rates specified in our leases, the collectability of rent and the level of our operating expenses and other general and administrative costs.
The decrease in net cash provided by operating activities was primarily attributable to an increase in debt extinguishment costs of $18.1 million, restructuring charge payments of $10.2 million, G&A costs of $6.9 million, payments to terminate interest rate swap agreements of $1.7 million and net changes in operating assets and liabilities of $7.2 million, partially offset by an increase in cash revenue of $12.9 million and a decrease in cash paid for interest of $27.4 million.
The increase in revenue was primarily attributable to the acquisition of 269 properties, representing a gross investment in real estate during the year ended December 31, 2016 totaling $704.9 million partially offset by the disposition of 213 properties during the same period with a real estate investment value of $598.7 million.
Investing Activities
Cash used in investing activities is generally used to fund property acquisitions, for investments in loans receivable and, to a limited extent, for capital expenditures. Cash provided by investing activities generally relates to the disposition of real estate and other assets.
Net cash used in investing activities during 2016 included $655.8 million to fund the acquisition of 269 properties (34 of which were acquired through a $85.1 million non-cash 1031 Exchange) and capitalized real estate expenditures of $27.1 million partially offset by cash proceeds of $524.8 million from the disposition of 213 properties (8 of which were disposed of through a $45.3 million non-cash 1031 Exchange).properties. Net cash used in investing activities also included collections of principal on loans receivable and real estate assets under direct financing leases totaling $8.4 million, offset by the release of sales proceeds from restricted cash accounts of $2.3 million.
During the same period in 2015, net cash used in investing activities included $876.0 million to fund the acquisition of 232 properties (114 of which were acquired through a $276.1 million non-cash 1031 Exchange) and capitalized real estate expenditures of $10.3 million partially offset by cash proceeds of $496.6 million from the disposition of 110 properties (44 of which were disposed of through a $315.9 million non-cash 1031 Exchange).properties. Net cash used in investing activities also included investment in loans
receivable of $4.0 million, partially offset by the release of sales proceeds from restricted cash accounts of $41.0 million and collections of principal on loans receivable and real estate assets under direct financing leases totaling $6.8 million.
Financing Activities
Generally, our net cash (used in) provided by financing activities is impacted by our net borrowings and common stock offerings, including sales of our common stock under our ATM Program, common stock offerings, borrowings under our Revolving Credit Facilities and Term Loan, and issuances of net-lease mortgage notes under our Spirit Master Funding Program.
Net cash used in financing activities during 2016 was primarily attributable to the repayment of our indebtedness of $863.8 million and the payment of dividends to equity owners of $323.6 million, both of which were primarily funded from our operating cash flows, net borrowings under our Revolving Credit Facility and Term Loan of $86.0 million and $95.0 million, respectively, net proceeds of $298.1 million from the issuance of $300$300.0 million aggregate principal Senior Unsecured Notes and the sale of an aggregate 40.8 million shares of our common stock in an underwritten public offering and under our ATM Program, generating net proceeds of $368.9 million and $77.7 million, respectively.
Net cash used in financing activities during 2015 was primarily attributable to the repayment of our indebtedness of $512.5 million, the payment of dividends to equity owners of $292.3 million, both of which were paid primarily through sources from our operating cash flows, and net repayments under our Revolving Credit Facilities of $15.2 million. These amounts were partially offset by the issuance and sale of 23.0 million shares of our common stock in an underwritten public offering and the sale of 6.6 million shares of our common stock under our ATM Program for aggregate net proceeds of $347.2 million and borrowings under our Term Loan of $325.0 million.
Comparison of Years Ended December 31, 2015 and 2014
The following table presents a summary of our cash flows for the years ended December 31, 2015 and 2014 (in thousands):
|
| | | | | | | | | | | |
| | Years Ended |
| | December 31, |
| | 2015 | | 2014 | | Change |
| Net cash provided by operating activities | $ | 371,986 |
| | $ | 218,571 |
| | $ | 153,415 |
|
| Net cash used in investing activities | (385,696 | ) | | (878,030 | ) | | 492,334 |
|
| Net cash provided by financing activities | (140,681 | ) | | 769,052 |
| | (909,733 | ) |
| Net increase (decrease) in cash and cash equivalents | $ | (154,391 | ) | | $ | 109,593 |
| | $ | (263,984 | ) |
As of December 31, 2015, we had $21.8 million of cash and cash equivalents as compared to $176.2 million as of December 31, 2014.
Operating Activities
Our cash flows from operating activities are primarily dependent upon the occupancy level of our portfolio, the rental rates specified in our leases, the collectability of rent and the level of our operating expenses and other general and administrative costs.
The increase in net cash provided by operating activities was primarily attributable to an increase in cash revenue of $56.5 million, a decrease in debt extinguishment costs of $51.5 million, net changes in operating assets and liabilities of $35.8 million and prior year restructuring charges related to our Exchange Offer of $13.0 million.
The increase in revenue was primarily attributable to the acquisition of 232 properties, representing a gross investment in real estate during the year ended December 31, 2015 totaling $889.2 million partially offset by the disposition of 110 properties during the same period with a real estate investment value of $541.0 million.
Investing Activities
Cash used in investing activities is generally used to fund property acquisitions, for investments in loans receivable and, to a limited extent, for capital expenditures. Cash provided by investing activities generally relates to the disposition of real estate and other assets.
Net cash used in investing activities during 2015 included $876.0 million to fund the acquisition of 232 properties (114 of which were acquired through a $276.1 million non-cash 1031 Exchange) and capitalized real estate expenditures of $10.3 million, partially offset by cash proceeds of $496.6 million from the disposition of 110 properties (44 of which were disposed of through a $315.9 million non-cash 1031 Exchange). Net cash used in investing activities also included investment in loans receivable of $4.0 million partially offset by the release of sales proceeds from restricted cash accounts of $41.0 million and collections of principal on loans receivable and real estate assets under direct financing leases totaling $6.8 million.
During the same period in 2014, net cash used in investing activities included $958.0 million to fund the acquisition of 361 properties (16 of which were acquired through a $26.7 million non-cash 1031 Exchange) and capitalized real estate expenditures of $5.1 million partially offset by cash proceeds of $110.2 million from the disposition of 38 properties (2 of which were disposed of through a $5.9 million non-cash 1031 Exchange). Net cash used in investing activities also included transfers of sales proceeds to restricted cash accounts of $52.0 million, partially offset by collections of principal on loans receivable and real estate assets under direct financing leases totaling $6.1 million.
Financing Activities
Generally, our net cash (used in) provided by financing activities is impacted by our net borrowings and common stock offerings, including sales of our common stock under our ATM Program, common stock offerings, borrowings under our Revolving Credit Facilities and Term Loan, and issuances of net-lease mortgage notes under our Spirit Master Funding Program.
Net cash used in financing activities during 2015 was primarily attributable to repayment of our indebtedness of $512.5 million, the payment of dividends to equity owners of $292.3 million, both of which were paid primarily through sources from our operating cash flows, and net repayments under our Revolving Credit Facilities of $15.2 million. These amounts
were partially offset by the issuance and sale of 23.0 million shares of our common stock in an underwritten public offering and the sale of 6.6 million shares of our common stock under our ATM Program for aggregate net proceeds of $347.2 million and borrowings under our Term Loan of $325.0 million.
Net cash provided by financing activities during 2014 was attributable to our concurrent Convertible Notes and common stock offerings, sales of our common stock under our ATM Program and the net-lease mortgage notes issuance under our Spirit Master Funding Program in November 2014. Collectively these transactions raised approximately $1.7 billion in gross proceeds, net of common stock offering costs. The capital raised was used mostly to extinguish $583.8 million of our indebtedness, repay the amounts drawn against the 2013 Credit Facility and to fund certain acquisitions. Our net borrowings and proceeds from the issuance of common stock during the period were partially offset by $255.8 million for the payment of dividends to equity owners, which was paid primarily through sources from our operating cash flows.
Item 7A. Quantitative and Qualitative Disclosures About Market Risk
We are exposed to financial market risks, especially interest rate risk. Interest rates and other factors, such as occupancy, rental rates and the financial condition of our tenants, influence our performance more so than does inflation. Changes in interest rates do not necessarily correlate with inflation rates or changes in inflation rates. As described above, we generally offer leases that provide for payments of base rent with scheduled increases based on a fixed amount or the lesser of a multiple of the increase in the CPI over a specified period term or fixed percentage and, to a lesser extent, contingent rent based on a percentage of the tenant’s gross sales to help mitigate the effect of inflation. Because the properties in our portfolio are generally leased to tenants under triple-net leases, where the tenant is responsible for property operating costs and expenses, our exposure to rising property operating costs due to inflation is mitigated.
Interest rates are highly sensitive to many factors, including governmental monetary policies and domestic and global economic and political conditions, and other factors which are beyond our control. Our operating results will depend heavily on the difference between the revenue from our assets and the interest expense incurred on our borrowings. We may incur additional variable rate debt in the future, including amounts that we may borrow under our 2015Revolving Credit Facility and Term Loan. In addition, decreases in interest rates may lead to additional competition for the acquisition of real estate due to a reduction in desirable alternative income-producing investments. Increased competition for the acquisition of real estateinvestments, which may lead to a decrease in the yields on real estate we have targeted for acquisition. In such circumstances, if we are not able to offset the decrease in yields by obtaining lower interest costs on our borrowings, our results of operations will be adversely affected. Significant increases in interest rates may also have an adverse impact on our earnings if we are unable to acquire real estate with rental rates high enough to offset the increase in interest rates on our borrowings.
In the event interest rates rise significantly or there is an economic downturn, defaults may increase and result in credit losses, which may adversely affect our liquidity and operating results. In a decreasing interest rate environment, borrowers are generally more likely to prepay their loans in order to obtain financing at lower interest rates. However, the vast majority of our mortgage notes payable have prepayment clauses that make refinancing during a decreasing interest rate environment uneconomical. Investments in our mortgage loans receivable, however, have significant prepayment protection in the form of yield maintenance provisions, which provide us with substantial yield protection in a decreasing interest rate environment with respect to this portion of our investment portfolio.
The objective of our interest rate risk management policy is to match fund fixed-rate assets with fixed-rate liabilities. As of December 31, 2016,2017, our assets were primarily long-term, fixed-rate leases (though most have scheduled rental increases during the terms of the leases). As of December 31, 2016, approximately $3.252017, $3.6 billion of our indebtedness consisted of long-term,was fixed-rate, obligations, consisting primarily of our Master Trust Notes, fixed-rate CMBS loans, Senior Unsecured Notes and Convertible Notes. As of December 31, 2016, theNotes, with a weighted average stated interest rate of fixed-rate obligations,4.67%, excluding amortization of deferred financing costs and debt discounts/premiums, was approximately 4.67%.premiums. As of December 31, 2016, approximately $506.02017, $112.0 million of our indebtedness consisted ofwas variable-rate, obligations, consisting of our Term Loan and 2015Revolving Credit Facility. As of December 31, 2016, theFacility, with a weighted average stated interest rate of our variable-rate obligations,2.74%, excluding amortization of deferred financing
costs and debt discounts/premiums, was approximately 1.93%.premiums. If one-month LIBOR as of December 31, 20162017 increased by 10012.5 basis points, or 1.0%0.125%, the resulting increase in annual interest expense with respect to the $506.0$112.0 million outstanding under the variable-rate obligations would impact our future earnings and cash flows by $5.1 million.
$140.0 thousand.
The estimated fair values of our 2015 Credit Facility, Term Loan, fixed-rate mortgages and notes payable and Convertible Notesdebt instruments have been derived based on market quotes for comparable instruments or discounted cash flow analysis using estimates of the amount and timing of future cash flows, market rates and credit spreads.
The following table discloses the fair value information for these financial instrumentsdebt instrument balances as of December 31, 20162017 are as follows (in thousands):
| | | | Carrying
Value | | Estimated
Fair Value | Carrying
Value | | Estimated
Fair Value |
| 2015 Credit Facility | $ | 86,000 |
| | $ | 87,718 |
| |
| | | | | |
| Revolving Credit Facility | | $ | 112,000 |
| | $ | 111,997 |
|
Term Loan, net (1) | 418,471 |
| | 428,441 |
| — |
| | — |
|
Senior Unsecured Notes, net (1) | 295,112 |
| | 283,473 |
| 295,321 |
| | 299,049 |
|
Mortgages and notes payable, net (1) | 2,162,403 |
| | 2,282,142 |
| 2,516,478 |
| | 2,657,599 |
|
Convertible Notes, net (1) | 702,642 |
| | 784,175 |
| 715,881 |
| | 761,440 |
|
(1) The carrying value of the debt instruments are net of unamortized deferred financing costs and certain debt discounts/premiums.
Item 8. Financial Statements and Supplementary Data
INDEX TO CONSOLIDATED FINANCIAL STATEMENTS
|
| |
| Item 8. Financial Statements and Supplemental Data | |
| Reports of Independent Registered Public Accounting Firms | |
| Consolidated Balance Sheets of Spirit Realty Capital, Inc. as of December 31, 2017 and 2016 | |
| Consolidated Statements of Operations of Spirit Realty Capital, Inc. for the Years Ended December 31, 2017, 2016 and 2015 | |
| Consolidated Statements of Comprehensive Income of Spirit Realty Capital, Inc. for the Years Ended December 31, 2017, 2016 and 2015 | |
| Consolidated Statements of Stockholders' Equity of Spirit Realty Capital, Inc. for the Years Ended December 31, 2017, 2016 and 2015 | |
| Consolidated Statements of Cash Flows of Spirit Realty Capital, Inc. for the Years Ended December 31, 2017, 2016 and 2015 | |
| Consolidated Balance Sheets of Spirit Realty, L.P. as of December 31, 2017 and 2016 | |
| Consolidated Statements of Operations of Spirit Realty, L.P. for the Years Ended December 31, 2017, 2016 and 2015 | |
| Consolidated Statements of Comprehensive Income of Spirit Realty, L.P. for the Years Ended December 31, 2017, 2016 and 2015 | |
| Consolidated Statements of Partners' Capital of Spirit Realty, L.P. for the Years Ended December 31, 2017, 2016 and 2015 | |
| Consolidated Statements of Cash Flows of Spirit Realty, L.P. for the Years Ended December 31, 2017, 2016 and 2015 | |
| Notes to Consolidated Financial Statements | |
Report of Independent Registered Public Accounting Firm
TheTo the Stockholders and the Board of Directors and Stockholders of
Spirit Realty Capital, Inc.
Opinion on Internal Control over Financial Reporting
We have audited Spirit Realty Capital, Inc.’s internal control over financial reporting as of December 31, 2016,2017, based on criteria established in Internal Control-Integrated Framework issued by the Committee of Sponsoring Organizations of the Treadway Commission (2013 framework) (the COSO criteria). In our opinion, Spirit Realty Capital, Inc.’s (the Company) maintained, in all material respects, effective internal control over financial reporting as of December 31, 2017, based on the COSO criteria.
We also have audited, in accordance with the standards of the Public Company Accounting Oversight Board (United States) (PCAOB), the 2017 consolidated financial statements of the Company and our report dated February 22, 2018 expressed an unqualified opinion thereon.
Basis for Opinion
The Company’s management is responsible for maintaining effective internal control over financial reporting and for its assessment of the effectiveness of internal control over financial reporting included in the accompanying Management’s Report on Internal Control over Financial Reporting. Our responsibility is to express an opinion on the company’sCompany’s internal control over financial reporting based on our audit. We are a public accounting firm registered with the PCAOB and are required to be independent with respect to the Company in accordance with the U.S. federal securities laws and the applicable rules and regulations of the Securities and Exchange Commission and the PCAOB.
We conducted our audit in accordance with the standards of the Public Company Accounting Oversight Board (United States).PCAOB. Those standards require that we plan and perform the audit to obtain reasonable assurance about whether effective internal control over financial reporting was maintained in all material respects.
Our audit included obtaining an understanding of internal control over financial reporting, assessing the risk that a material weakness exists, testing and evaluating the design and operating effectiveness of internal control based on the assessed risk, and performing such other procedures as we considered necessary in the circumstances. We believe that our audit provides a reasonable basis for our opinion.
Definition and Limitations of Internal Control Over Financial Reporting
A company’s internal control over financial reporting is a process designed to provide reasonable assurance regarding the reliability of financial reporting and the preparation of financial statements for external purposes in accordance with generally accepted accounting principles. A company’s internal control over financial reporting includes those policies and procedures that (1) pertain to the maintenance of records that, in reasonable detail, accurately and fairly reflect the transactions and dispositions of the assets of the company; (2) provide reasonable assurance that transactions are recorded as necessary to permit preparation of financial statements in accordance with generally accepted accounting principles, and that receipts and expenditures of the company are being made only in accordance with authorizations of management and directors of the company; and (3) provide reasonable assurance regarding prevention or timely detection of unauthorized acquisition, use, or disposition of the company’s assets that could have a material effect on the financial statements.
Because of its inherent limitations, internal control over financial reporting may not prevent or detect misstatements. Also, projections of any evaluation of effectiveness to future periods are subject to the risk that controls may become inadequate because of changes in conditions, or that the degree of compliance with the policies or procedures may deteriorate.
In our opinion, /s/ Ernst & Young LLP
Dallas, Texas
February 22, 2018
Report of Independent Registered Public Accounting Firm
To the Stockholders and the Board of Directors of
Spirit Realty Capital, Inc. maintained, in all material respects, effective internal control over financial reporting as of December 31, 2016, based
Opinion on the COSO criteria.Financial Statements
We also have audited in accordance with the standards of the Public Company Accounting Oversight Board (United States), theaccompanying consolidated balance sheets of Spirit Realty Capital, Inc. (the Company) as of December 31, 20162017 and 2015, and2016, the related consolidated statements of operations, comprehensive income, (loss), stockholders’ equity and cash flows for each of the three years in the period ended December 31, 2016 of Spirit Realty Capital, Inc. and our report dated February 23, 2017, expressed an unqualified opinion thereon.
/s/ Ernst & Young LLP
Dallas, TX
February 23, 2017
Report of Independent Registered Public Accounting Firm
The Board of Directors and Stockholders of
Spirit Realty Capital, Inc.
We have audited the accompanying consolidated balance sheets of Spirit Realty Capital, Inc. as of December 31, 2016 and 2015, and the related consolidated statements of operations, comprehensive income (loss), stockholders' equitynotes and cash flows for each of the three years in the period ended December 31, 2016. Our audits also included the financial statement schedules listed in the Index at Item 15(a) (collectively referred to as the consolidated financial statements). These financial statements and schedules are the responsibility of the Company's management. Our responsibility is to express an opinion on these financial statements and schedules based on our audits.
We conducted our audits in accordance with the standards of the Public Company Accounting Oversight Board (United States). Those standards require that we plan and perform the audit to obtain reasonable assurance about whether the financial statements are free of material misstatement. An audit includes examining, on a test basis, evidence supporting the amounts and disclosures in the financial statements. An audit also includes assessing the accounting principles used and significant estimates made by management, as well as evaluating the overall financial statement presentation. We believe that our audits provide a reasonable basis for our opinion.
In our opinion, the consolidated financial statements referred to above present fairly, in all material respects, the consolidated financial position of Spirit Realty Capital, Inc.the Company at December 31, 2017 and 2016, and 2015, and the consolidated results of its operations and its cash flows for each of the three years in the period ended December 31, 2016,2017, in conformity with U.S. generally accepted accounting principles. Also, in our opinion, the related financial statement schedules, when considered in relation to the basic consolidated financial statements taken as a whole present fairly, in all material respects, the information set forth therein.
We also have audited, in accordance with the standards of the Public Company Accounting Oversight Board (United States) (PCAOB), Spirit Realty Capital Inc.’sthe Company’s internal control over financial reporting as of December 31, 2016,2017, based on criteria established in Internal Control-Integrated Framework issued by the Committee of Sponsoring Organizations of the Treadway Commission (2013 framework) and our report dated February 23, 201722, 2018 expressed an unqualified opinion thereon.
Basis for Opinion
/s/ Ernst & Young LLP
Dallas, TX
February 23, 2017
Report of Independent Registered Public Accounting Firm
The Board of Directors and Stockholders of Spirit Realty Capital, Inc.
and the Partners of Spirit Realty, L.P.
We have audited the accompanying consolidated balance sheets of Spirit Realty, L.P. as of December 31, 2016 and 2015, and the related consolidated statements of operations, comprehensive income (loss), partners’ capital and cash flows for each of the three years in the period ended December 31, 2016. Our audits also included the financial statement schedules listed in the Index at Item 15(a). These financial statements and schedules are the responsibility of the Company’sCompany‘s management. Our responsibility is to express an opinion on thesethe Company‘s financial statements and schedules based on our audits.
We are a public accounting firm registered with the PCAOB and are required to be independent with respect to the Company in accordance with the US federal securities laws and the applicable rules and regulations of the Securities and Exchange Commission and the PCAOB.
We conducted our audits in accordance with the standards of the Public Company Accounting Oversight Board (United States) and in accordance with auditing standards generally accepted in the United States of America.PCAOB. Those standards require that we plan and perform the audit to obtain reasonable assurance about whether the financial statements are free of material misstatement. An audit includesmisstatement, whether due to error or fraud. Our audits included performing procedures to assess the risks of material misstatement of the financial statements, whether due to error or fraud, and performing procedures that respond to those risks. Such procedures included examining, on a test basis, evidence supportingregarding the amounts and disclosures in the financial statements. An auditOur audits also includes assessingincluded evaluating the accounting principles used and significant estimates made by management, as well as evaluating the overall presentation of the financial statement presentation.statements. We believe that our audits provide a reasonable basis for our opinion.
/s/ Ernst & Young LLP
We have served as the Company’s auditor since 2003.
Dallas, Texas
February 22, 2018
Report of Independent Registered Public Accounting Firm
To the Partners of Spirit Realty, L.P. and the Board of Directors of
Spirit Realty Capital, Inc.
Opinion on the Financial Statements
We have audited the accompanying consolidated balance sheets of Spirit Realty, L.P. (the Operating Partnership) as of December 31, 2017 and 2016, the related consolidated statements of operations, comprehensive income, partners’ capital and cash flows for each of the three years in the period ended December 31, 2017, and the related notes and financial statement schedules listed in the Index at Item 15(a) (collectively referred to as the consolidated financial statements). In our opinion, the consolidated financial statements referred to above present fairly, in all material respects, the consolidated financial position of Spirit Realty, L.P.the Operating Partnership at December 31, 2017 and 2016, and 2015, and the consolidated results of its operations and its cash flows for each of the three years in the period then ended December 31, 2017, in conformity with U.S. generally accepted accounting principles. Also, in
Basis for Opinion
These financial statements are the responsibility of the Operating Partnership's management. Our responsibility is to express an opinion on the Operating Partnership’s financial statements based on our opinion,audits. We are a public accounting firm registered with the related financial statement schedules, when considered in relationPCAOB and are required to be independent with respect to the basic consolidatedOperating Partnership in accordance with the U.S. federal securities laws and the applicable rules and regulations of the Securities and Exchange Commission and the PCAOB.
We conducted our audits in accordance with the standards of the PCAOB. Those standards require that we plan and perform the audit to obtain reasonable assurance about whether the financial statements takenare free of material misstatement, whether due to error or fraud. Our audits included performing procedures to assess the risks of material misstatement of the financial statements, whether due to error or fraud, and performing procedures that respond to those risks. Such procedures included examining, on a test basis, evidence regarding the amounts and disclosures in the financial statements. Our audits also included evaluating the accounting principles used and significant estimates made by management, as well as evaluating the overall presentation of the financial statements. We believe that our audits provide a whole, present fairly in all material respects the information set forth therein.
reasonable basis for our opinion.
/s/ Ernst & Young LLP
We have served as the Operating Partnership’s auditor since 2016.
Dallas, TXTexas
February 23, 201722, 2018
SPIRIT REALTY CAPITAL, INC.
Consolidated Balance Sheets
(In Thousands, Except Share and Per Share Data)
| | | | December 31,
2016 | | December 31,
2015 | December 31,
2017 | | December 31,
2016 |
| Assets |
|
|
|
|
|
|
| Investments: |
|
|
|
|
|
|
| Real estate investments: |
|
|
|
|
|
|
| Land and improvements | $ | 2,704,010 |
|
| $ | 2,710,888 |
| $ | 2,588,930 |
|
| $ | 2,704,010 |
|
| Buildings and improvements | 4,775,221 |
|
| 4,816,481 |
| 4,692,377 |
|
| 4,775,221 |
|
| Total real estate investments | 7,479,231 |
|
| 7,527,369 |
| 7,281,307 |
|
| 7,479,231 |
|
| Less: accumulated depreciation | (940,005 | ) |
| (860,954 | ) | (1,075,643 | ) |
| (940,005 | ) |
| 6,539,226 |
|
| 6,666,415 |
| 6,205,664 |
|
| 6,539,226 |
|
| Loans receivable, net | 66,578 |
|
| 104,003 |
| 79,967 |
|
| 66,578 |
|
| Intangible lease assets, net | 470,276 |
|
| 526,718 |
| 409,903 |
|
| 470,276 |
|
| Real estate assets under direct financing leases, net | 36,005 |
|
| 44,324 |
| 24,865 |
|
| 36,005 |
|
| Real estate assets held for sale, net | 160,570 |
|
| 84,259 |
| 48,929 |
|
| 160,570 |
|
| Net investments | 7,272,655 |
|
| 7,425,719 |
| 6,769,328 |
|
| 7,272,655 |
|
| Cash and cash equivalents | 10,059 |
|
| 21,790 |
| 8,798 |
|
| 10,059 |
|
| Deferred costs and other assets, net | 140,917 |
|
| 179,180 |
| 231,045 |
|
| 140,917 |
|
| Goodwill | 254,340 |
|
| 264,350 |
| 254,340 |
|
| 254,340 |
|
| Total assets | $ | 7,677,971 |
|
| $ | 7,891,039 |
| $ | 7,263,511 |
|
| $ | 7,677,971 |
|
| | Liabilities and stockholders’ equity |
|
|
|
|
|
|
| Liabilities: |
|
|
|
|
|
|
| Revolving credit facilities | $ | 86,000 |
|
| $ | — |
| |
| Term loan, net | 418,471 |
|
| 322,902 |
| |
| Senior unsecured notes | 295,112 |
| | — |
| |
| Revolving Credit Facility | | $ | 112,000 |
|
| $ | 86,000 |
|
| Term Loan, net | | — |
|
| 418,471 |
|
| Senior Unsecured Notes, net | | 295,321 |
| | 295,112 |
|
| Mortgages and notes payable, net | 2,162,403 |
|
| 3,079,787 |
| 2,516,478 |
|
| 2,162,403 |
|
| Convertible notes, net | 702,642 |
|
| 690,098 |
| |
| Convertible Notes, net | | 715,881 |
|
| 702,642 |
|
| Total debt, net | 3,664,628 |
|
| 4,092,787 |
| 3,639,680 |
|
| 3,664,628 |
|
| Intangible lease liabilities, net | 182,320 |
|
| 193,903 |
| 155,303 |
|
| 182,320 |
|
| Accounts payable, accrued expenses and other liabilities | 148,915 |
|
| 142,475 |
| 148,919 |
|
| 148,915 |
|
| Total liabilities | 3,995,863 |
|
| 4,429,165 |
| 3,943,902 |
|
| 3,995,863 |
|
| Commitments and contingencies (see Note 8) |
|
|
|
|
|
|
|
|
|
|
| Stockholders’ equity: |
|
|
|
|
|
|
| Common stock, $0.01 par value, 750,000,000 shares authorized: 483,624,120 shares and 441,819,964 shares issued and outstanding at December 31, 2016 and December 31, 2015, respectively | 4,836 |
|
| 4,418 |
| |
| Capital in excess of par value | 5,177,086 |
|
| 4,721,323 |
| |
| Preferred stock and paid in capital, $0.01 par value, 20,000,000 shares authorized: 6,900,000 shares and no shares issued and outstanding at December 31, 2017 and December 31, 2016, respectively, liquidation preference of $25.00 per share | | 166,193 |
| | — |
|
| Common stock, $0.01 par value, 750,000,000 shares authorized: 448,868,269 shares and 483,624,120 shares issued and outstanding at December 31, 2017 and December 31, 2016, respectively | | 4,489 |
|
| 4,836 |
|
| Capital in excess of common stock par value | | 5,193,631 |
|
| 5,177,086 |
|
| Accumulated deficit | (1,499,814 | ) |
| (1,262,839 | ) | (2,044,704 | ) |
| (1,499,814 | ) |
| Accumulated other comprehensive loss | — |
|
| (1,028 | ) | |
| Total stockholders’ equity | 3,682,108 |
|
| 3,461,874 |
| 3,319,609 |
|
| 3,682,108 |
|
| Total liabilities and stockholders’ equity | $ | 7,677,971 |
|
| $ | 7,891,039 |
| $ | 7,263,511 |
|
| $ | 7,677,971 |
|
See accompanying notes.
SPIRIT REALTY CAPITAL, INC.
Consolidated Statements of Operations
(In Thousands, Except Share and Per Share Data)
| | | | Years Ended December 31, | | Years Ended December 31, |
| | 2016 | | 2015 | | 2014 | | 2017 | | 2016 | | 2015 |
| Revenues: | | | | | | | | | | | |
| Rentals | $ | 648,363 |
| | $ | 634,151 |
| | $ | 574,456 |
| | $ | 639,017 |
| | $ | 648,363 |
| | $ | 634,151 |
|
| Interest income on loans receivable | 5,253 |
| | 6,948 |
| | 7,239 |
| | 3,791 |
| | 5,253 |
| | 6,948 |
|
| Earned income from direct financing leases | 2,742 |
| | 3,024 |
| | 3,343 |
| | 2,078 |
| | 2,742 |
| | 3,024 |
|
| Tenant reimbursement income | 14,125 |
| | 15,952 |
| | 13,085 |
| | 16,747 |
| | 14,125 |
| | 15,952 |
|
| Other income | 15,491 |
| | 7,260 |
| | 4,748 |
| | 7,322 |
| | 15,491 |
| | 7,260 |
|
| Total revenues | 685,974 |
| | 667,335 |
| | 602,871 |
| | 668,955 |
| | 685,974 |
| | 667,335 |
|
| Expenses: | | | | | �� | | | | | | |
| General and administrative | 52,615 |
| | 47,730 |
| | 42,637 |
| | 62,064 |
| | 52,615 |
| | 47,730 |
|
| Restructuring charges | 6,341 |
| | 7,056 |
| | — |
| | — |
| | 6,341 |
| | 7,056 |
|
| Finance restructuring costs | — |
| | — |
| | 13,022 |
| |
| Property costs | 30,839 |
| | 27,715 |
| | 23,383 |
| |
| Transaction costs | | | 6,361 |
| | — |
| | — |
|
| Property costs (including reimbursable) | | | 36,617 |
| | 30,839 |
| | 27,715 |
|
| Real estate acquisition costs | 3,229 |
| | 2,739 |
| | 3,631 |
| | 1,356 |
| | 3,229 |
| | 2,739 |
|
| Interest | 196,586 |
| | 222,901 |
| | 220,070 |
| | 190,127 |
| | 196,586 |
| | 222,901 |
|
| Depreciation and amortization | 262,276 |
| | 260,633 |
| | 247,966 |
| | 256,019 |
| | 262,276 |
| | 260,633 |
|
| Impairments | 88,275 |
| | 70,695 |
| | 37,598 |
| | 102,330 |
| | 88,275 |
| | 70,695 |
|
| Total expenses | 640,161 |
| | 639,469 |
| | 588,307 |
| | 654,874 |
| | 640,161 |
| | 639,469 |
|
| Income from continuing operations before other income (expense) and income tax expense | 45,813 |
| | 27,866 |
| | 14,564 |
| |
| Other income (expense): | | | | | | |
| Gain (loss) on debt extinguishment | 233 |
| | (3,162 | ) | | (64,750 | ) | |
| Total other income (expense) | 233 |
| | (3,162 | ) | | (64,750 | ) | |
| Income (loss) from continuing operations before income tax expense | 46,046 |
| | 24,704 |
| | (50,186 | ) | |
| Income from continuing operations before other (expense) income and income tax expense | | | 14,081 |
| | 45,813 |
| | 27,866 |
|
| Other (expense) income: | | | | | | | |
| (Loss) gain on debt extinguishment | | | (1,645 | ) | | 233 |
| | (3,162 | ) |
| Total other (expense) income | | | (1,645 | ) | | 233 |
| | (3,162 | ) |
| Income from continuing operations before income tax expense | | | 12,436 |
| | 46,046 |
| | 24,704 |
|
| Income tax expense | (965 | ) | | (601 | ) | | (673 | ) | | (394 | ) | | (965 | ) | | (601 | ) |
| Income (loss) from continuing operations | 45,081 |
| | 24,103 |
| | (50,859 | ) | |
| Income from continuing operations | | | 12,042 |
| | 45,081 |
| | 24,103 |
|
| Discontinued operations: | | | | | | | | | | | |
| Income from discontinued operations | — |
| | 98 |
| | 3,368 |
| | — |
| | — |
| | 98 |
|
| Gain on disposition of assets | — |
| | 590 |
| | 325 |
| | — |
| | — |
| | 590 |
|
| Income from discontinued operations | — |
| | 688 |
| | 3,693 |
| | — |
| | — |
| | 688 |
|
| Income (loss) before gain on disposition of assets | 45,081 |
| | 24,791 |
| | (47,166 | ) | |
| Income before gain on disposition of assets | | | 12,042 |
| | 45,081 |
| | 24,791 |
|
| Gain on disposition of assets | 52,365 |
| | 68,421 |
| | 10,221 |
| | 65,106 |
| | 52,365 |
| | 68,421 |
|
| Net income (loss) attributable to common stockholders | $ | 97,446 |
| | $ | 93,212 |
| | $ | (36,945 | ) | |
| Net income (loss) per share of common stock—basic: | | | | | | |
| Continuing operations | $ | 0.21 |
| | $ | 0.21 |
| | $ | (0.11 | ) | |
| Discontinued operations | — |
| | — |
| | 0.01 |
| |
| Net income (loss) per share attributable to common stockholders—basic | $ | 0.21 |
| | $ | 0.21 |
| | $ | (0.10 | ) | |
| Net income (loss) per share of common stock—diluted: | | | | | | |
| Continuing operations | $ | 0.21 |
| | $ | 0.21 |
| | $ | (0.11 | ) | |
| Discontinued operations | — |
| | — |
| | 0.01 |
| |
| Net income (loss) per share attributable to common stockholders—diluted | $ | 0.21 |
| | $ | 0.21 |
| | $ | (0.10 | ) | |
| Net Income | | | 77,148 |
| | 97,446 |
| | 93,212 |
|
| Dividends paid to preferred stockholders | | | (2,530 | ) | | — |
| | — |
|
| Net income attributable to common stockholders | | | $ | 74,618 |
| | $ | 97,446 |
| | $ | 93,212 |
|
| | | | | | | | |
| Net income per share attributable to common stockholders—basic | | | $ | 0.16 |
| | $ | 0.21 |
| | $ | 0.21 |
|
| | | | | | | | |
| Net income per share attributable to common stockholders—diluted | | | $ | 0.16 |
| | $ | 0.21 |
| | $ | 0.21 |
|
| Weighted average shares of common stock outstanding: | | | | | | | | | | | |
| Basic | 469,217,776 |
| | 432,222,953 |
| | 386,809,746 |
| | 467,934,945 |
| | 469,217,776 |
| | 432,222,953 |
|
| Diluted | 469,246,265 |
| | 432,545,625 |
| | 386,809,746 |
| | 467,942,788 |
| | 469,246,265 |
| | 432,545,625 |
|
See accompanying notes.
SPIRIT REALTY CAPITAL, INC.
Consolidated Statements of Comprehensive Income (Loss)
(In Thousands)
|
| | | | | | | | | | | |
| | Years Ended December 31, |
| | 2016 | | 2015 | | 2014 |
| Net income (loss) attributable to common stockholders | $ | 97,446 |
| | $ | 93,212 |
| | $ | (36,945 | ) |
| Other comprehensive income (loss): | | | | | |
| Change in net unrealized losses on cash flow hedges | (1,137 | ) | | (1,190 | ) | | (1,760 | ) |
| Net cash flow hedge losses reclassified to operations | 2,165 |
| | 1,245 |
| | 1,315 |
|
| Total comprehensive income (loss) | $ | 98,474 |
| | $ | 93,267 |
| | $ | (37,390 | ) |
|
| | | | | | | | | | | |
| | Years Ended December 31, |
| | 2017 | | 2016 | | 2015 |
| Net income attributable to common stockholders | $ | 74,618 |
| | $ | 97,446 |
| | $ | 93,212 |
|
| Other comprehensive income: | | | | | |
| Change in net unrealized losses on cash flow hedges | — |
| | (1,137 | ) | | (1,190 | ) |
| Net cash flow hedge losses reclassified to operations | — |
| | 2,165 |
| | 1,245 |
|
| Total comprehensive income | $ | 74,618 |
| | $ | 98,474 |
| | $ | 93,267 |
|
See accompanying notes.
SPIRIT REALTY CAPITAL, INC.
Consolidated Statements of Stockholders’ Equity
(In Thousands, Except Share Data)
| | | | Common Stock | | Accumulated Deficit | | | | Total Stockholders’ Equity | | Preferred Stock | | Common Stock | | Accumulated Deficit | | | | Total Stockholders’ Equity |
| | Shares | | Par
Value | | Capital in Excess of Par Value | | AOCL | | | Shares | | Par
Value and Capital in Excess of Par Value | | Shares | | Par
Value | | Capital in Excess of Par Value | | AOCL | |
| Balances, December 31, 2013 | 370,363,803 |
| | $ | 3,704 |
| | $ | 3,859,823 |
| | $ | (748,148 | ) | | $ | (638 | ) | | $ | 3,114,741 |
| |
| Net loss | — |
| | — |
| | — |
| | (36,945 | ) | | — |
| | (36,945 | ) | |
| Other comprehensive loss | — |
| | — |
| | — |
| | — |
| | (445 | ) | | (445 | ) | |
| Dividends declared on common stock | — |
| | — |
| | — |
| | (264,113 | ) | | — |
| | (264,113 | ) | |
| Tax withholdings related to net stock settlements | (266,837 | ) | | (3 | ) | | — |
| | (2,917 | ) | | — |
| | (2,920 | ) | |
| Issuance of shares of common stock, net | 40,808,577 |
| | 408 |
| | 434,576 |
| | — |
| | — |
| | 434,984 |
| |
| Embedded conversion premium of Convertible Notes, net | — |
| | — |
| | 55,131 |
| | — |
| | — |
| | 55,131 |
| |
| Exercise of stock options | 20,000 |
| | — |
| | 183 |
| | — |
| | — |
| | 183 |
| |
| Stock-based compensation, net | 424,897 |
| | 4 |
| | 11,607 |
| | (565 | ) | | — |
| | 11,046 |
| |
| Balances, December 31, 2014 | 411,350,440 |
| | 4,113 |
| | 4,361,320 |
| | (1,052,688 | ) | | (1,083 | ) | | 3,311,662 |
| | — |
| | $ | — |
| | 411,350,440 |
| | $ | 4,113 |
| | $ | 4,361,320 |
| | $ | (1,052,688 | ) | | $ | (1,083 | ) | | $ | 3,311,662 |
|
| Net income | — |
| | — |
| | — |
| | 93,212 |
| | — |
| | 93,212 |
| | — |
| | — |
| | — |
| | — |
| | — |
| | 93,212 |
| | — |
| | 93,212 |
|
| Other comprehensive income | — |
| | — |
| | — |
| | — |
| | 55 |
| | 55 |
| | — |
| | — |
| | — |
| | — |
| | — |
| | — |
| | 55 |
| | 55 |
|
| Dividends declared on common stock | — |
| | — |
| | — |
| | (298,531 | ) | | — |
| | (298,531 | ) | | — |
| | — |
| | — |
| | — |
| | — |
| | (298,531 | ) | | — |
| | (298,531 | ) |
| Tax withholdings related to net stock settlements | (426,158 | ) | | (4 | ) | | — |
| | (4,268 | ) | | — |
| | (4,272 | ) | | — |
| | — |
| | (426,158 | ) | | (4 | ) | | — |
| | (4,268 | ) | | — |
| | (4,272 | ) |
| Issuance of shares of common stock, net | 29,610,100 |
| | 296 |
| | 346,915 |
| | — |
| | — |
| | 347,211 |
| | — |
| | — |
| | 29,610,100 |
| | 296 |
| | 346,915 |
| | — |
| | — |
| | 347,211 |
|
| Exercise of stock options | 5,000 |
| | — |
| | 46 |
| | — |
| | — |
| | 46 |
| | — |
| | — |
| | 5,000 |
| | — |
| | 46 |
| | — |
| | — |
| | 46 |
|
| Stock-based compensation, net | 1,280,582 |
| | 13 |
| | 13,042 |
| | (564 | ) | | — |
| | 12,491 |
| | — |
| | — |
| | 1,280,582 |
| | 13 |
| | 13,042 |
| | (564 | ) | | — |
| | 12,491 |
|
| Balances, December 31, 2015 | 441,819,964 |
| | 4,418 |
| | 4,721,323 |
| | (1,262,839 | ) | | (1,028 | ) | | 3,461,874 |
| | — |
| | $ | — |
| | 441,819,964 |
| | $ | 4,418 |
| | $ | 4,721,323 |
| | $ | (1,262,839 | ) | | $ | (1,028 | ) | | $ | 3,461,874 |
|
| Net income | — |
| | — |
| | — |
| | 97,446 |
| | — |
| | 97,446 |
| | — |
| | — |
| | — |
| | — |
| | — |
| | 97,446 |
| | — |
| | 97,446 |
|
| Other comprehensive income | — |
| | — |
| | — |
| | — |
| | 1,028 |
| | 1,028 |
| | — |
| | — |
| | — |
| | — |
| | — |
| | — |
| | 1,028 |
| | 1,028 |
|
| Dividends declared on common stock | — |
| | — |
| | — |
| | (333,180 | ) | | — |
| | (333,180 | ) | | — |
| | — |
| | — |
| | — |
| | — |
| | (333,180 | ) | | — |
| | (333,180 | ) |
| Tax withholdings related to net stock settlements | (72,835 | ) | | (1 | ) | | — |
| | (752 | ) | | — |
| | (753 | ) | | — |
| | — |
| | (72,835 | ) | | (1 | ) | | — |
| | (752 | ) | | — |
| | (753 | ) |
| Issuance of shares of common stock, net | 40,835,360 |
| | 408 |
| | 446,205 |
| | — |
| | — |
| | 446,613 |
| | — |
| | — |
| | 40,835,360 |
| | 408 |
| | 446,205 |
| | — |
| | — |
| | 446,613 |
|
| Stock-based compensation, net | 1,041,631 |
| | 11 |
| | 9,558 |
| | (489 | ) | | — |
| | 9,080 |
| | — |
| | — |
| | 1,041,631 |
| | 11 |
| | 9,558 |
| | (489 | ) | | — |
| | 9,080 |
|
| Balances, December 31, 2016 | 483,624,120 |
| | $ | 4,836 |
| | $ | 5,177,086 |
| | $ | (1,499,814 | ) | | $ | — |
| | $ | 3,682,108 |
| | — |
| | $ | — |
| | 483,624,120 |
| | $ | 4,836 |
| | $ | 5,177,086 |
| | $ | (1,499,814 | ) | | $ | — |
| | $ | 3,682,108 |
|
| Net income | | | — |
| | — |
| | — |
| | — |
| | — |
| | 77,148 |
| | — |
| | 77,148 |
|
| Dividends declared on preferred stock | | | — |
| | — |
| | — |
| | — |
| | — |
| | (2,530 | ) | | — |
| | (2,530 | ) |
| Net income available to common stockholders | | | — |
| | — |
| | — |
| | — |
| | — |
| | 74,618 |
| | — |
| | 74,618 |
|
| Issuance of preferred stock | | | 6,900,000 |
| | 166,193 |
| | — |
| | — |
| | — |
| | — |
| | — |
| | 166,193 |
|
| Dividends declared on common stock | | | — |
| | — |
| | — |
| | — |
| | — |
| | (332,402 | ) | | — |
| | (332,402 | ) |
| Tax withholdings related to net stock settlements | | | — |
| | — |
| | (440,312 | ) | | (4 | ) | | — |
| | (3,538 | ) | | — |
| | (3,542 | ) |
| Repurchase of common shares | | | — |
| | — |
| | (35,839,965 | ) | | (358 | ) | | — |
| | (282,731 | ) | | — |
| | (283,089 | ) |
| Stock-based compensation, net | | | — |
| | — |
| | 1,524,426 |
| | 15 |
| | 16,545 |
| | (837 | ) | | — |
| | 15,723 |
|
| Balances, December 31, 2017 | | | 6,900,000 |
| | $ | 166,193 |
| | 448,868,269 |
| | $ | 4,489 |
| | $ | 5,193,631 |
| | $ | (2,044,704 | ) | | $ | — |
| | $ | 3,319,609 |
|
See accompanying notes.
SPIRIT REALTY CAPITAL, INC.
Consolidated Statements of Cash Flows
(In Thousands)
| | | | Years Ended December 31, | | Years Ended December 31, |
| | 2016 | | 2015 | | 2014 | | 2017 | | 2016 | | 2015 |
| Operating activities | | | | | | | | | | | |
| Net income (loss) attributable to common stockholders | $ | 97,446 |
| | $ | 93,212 |
| | $ | (36,945 | ) | |
| Adjustments to reconcile net income (loss) attributable to common stockholders to net cash provided by operating activities: | | | | | | |
| Net Income | | | $ | 77,148 |
| | $ | 97,446 |
| | $ | 93,212 |
|
| Adjustments to reconcile net income to net cash provided by operating activities: | | | | | | | |
| Depreciation and amortization | 262,276 |
| | 260,633 |
| | 247,966 |
| | 256,019 |
| | 262,276 |
| | 260,633 |
|
| Impairments | 88,275 |
| | 70,729 |
| | 38,015 |
| | 102,330 |
| | 88,275 |
| | 70,729 |
|
| Amortization of deferred financing costs | 9,070 |
| | 7,937 |
| | 5,899 |
| | 9,896 |
| | 9,070 |
| | 7,937 |
|
| Payments to terminate interest rate swap | (1,724 | ) | | — |
| | — |
| | — |
| | (1,724 | ) | | — |
|
| Derivative net settlements, amortization and terminations | 1,811 |
| | (132 | ) | | (114 | ) | | — |
| | 1,811 |
| | (132 | ) |
| Amortization of debt discounts (premium) | 6,217 |
| | 2,322 |
| | (849 | ) | |
| Amortization of debt discounts | | | 13,572 |
| | 6,217 |
| | 2,322 |
|
| Stock-based compensation expense | 9,570 |
| | 13,321 |
| | 11,346 |
| | 16,560 |
| | 9,570 |
| | 13,321 |
|
| (Gain) loss on debt extinguishment, net | (233 | ) | | 3,162 |
| | 64,750 |
| |
| Loss (gain) on debt extinguishment | | | 1,645 |
| | (233 | ) | | 3,162 |
|
| Debt extinguishment costs | (26,219 | ) | | (8,112 | ) | | (59,576 | ) | | (3,305 | ) | | (26,219 | ) | | (8,112 | ) |
| Gains on dispositions of real estate and other assets, net | (52,365 | ) | | (69,011 | ) | | (10,546 | ) | |
| Gains on dispositions of real estate and other assets | | | (65,106 | ) | | (52,365 | ) | | (69,011 | ) |
| Non-cash revenue | (26,333 | ) | | (20,930 | ) | | (16,732 | ) | | (28,439 | ) | | (26,333 | ) | | (20,930 | ) |
| Other | (594 | ) | | 151 |
| | (1,355 | ) | |
| Bad debt expense and other | | | 5,913 |
| | (594 | ) | | 151 |
|
| Changes in operating assets and liabilities: | | | | | | | | | | | |
| Deferred costs and other assets, net | (6,561 | ) | | (604 | ) | | (25,466 | ) | | (1,418 | ) | | (6,561 | ) | | (604 | ) |
| Accounts payable, accrued expenses and other liabilities | 6,308 |
| | 13,382 |
| | 2,178 |
| | 1,578 |
| | 6,308 |
| | 13,382 |
|
| Accrued restructuring charges | (5,535 | ) | | 5,926 |
| | — |
| | — |
| | (5,535 | ) | | 5,926 |
|
| Net cash provided by operating activities | 361,409 |
| | 371,986 |
| | 218,571 |
| | 386,393 |
| | 361,409 |
| | 371,986 |
|
| Investing activities | | | | | | | | | | | |
| Acquisitions of real estate | (655,835 | ) | | (875,983 | ) | | (958,038 | ) | | (279,934 | ) | | (655,835 | ) | | (875,983 | ) |
| Capitalized real estate expenditures | (27,078 | ) | | (10,269 | ) | | (5,087 | ) | | (46,100 | ) | | (27,078 | ) | | (10,269 | ) |
| Investments in loans receivable | (5,073 | ) | | (4,020 | ) | | — |
| | (4,995 | ) | | (5,073 | ) | | (4,020 | ) |
| Collections of principal on loans receivable and real estate assets under direct financing leases | 8,410 |
| | 6,822 |
| | 6,085 |
| | 12,769 |
| | 8,410 |
| | 6,822 |
|
| Proceeds from dispositions of real estate and other assets | 524,776 |
| | 496,646 |
| | 110,185 |
| | 472,496 |
| | 524,776 |
| | 496,646 |
|
| Transfers of net sales proceeds from (to) restricted accounts pursuant to 1031 Exchanges | 39,869 |
| | (39,869 | ) | | 20,784 |
| | — |
| | 39,869 |
| | (39,869 | ) |
| Transfers of net sales proceeds (to) from Master Trust Release | (2,320 | ) | | 40,977 |
| | (51,959 | ) | | (71,294 | ) | | (2,320 | ) | | 40,977 |
|
| Net cash used in investing activities | (117,251 | ) | | (385,696 | ) | | (878,030 | ) | |
| Net cash provided by (used in) investing activities | | | 82,942 |
| | (117,251 | ) | | (385,696 | ) |
SPIRIT REALTY CAPITAL, INC.
Consolidated Statements of Cash Flows
(In Thousands)
| | | | Years Ended December 31, | | Years Ended December 31, |
| | 2016 | | 2015 | | 2014 | | 2017 | | 2016 | | 2015 |
| Financing activities | | | | | | | | | | | |
| Borrowings under Revolving Credit Facilities | 1,080,000 |
| | 798,000 |
| | 875,722 |
| | 940,200 |
| | 1,080,000 |
| | 798,000 |
|
| Repayments under Revolving Credit Facilities | (994,000 | ) | | (813,181 | ) | | (895,661 | ) | | (914,200 | ) | | (994,000 | ) | | (813,181 | ) |
| Borrowings under mortgages and notes payable | — |
| | — |
| | 518,846 |
| | 618,603 |
| | — |
| | — |
|
| Repayments under mortgages and notes payable | (863,836 | ) | | (512,486 | ) | | (610,973 | ) | | (221,310 | ) | | (863,836 | ) | | (512,486 | ) |
| Borrowings under Convertible Notes | — |
| | — |
| | 747,500 |
| |
| Borrowings under Term Loan | 796,000 |
| | 325,000 |
| | — |
| | — |
| | 796,000 |
| | 325,000 |
|
| Repayments under Term Loan | (701,000 | ) | | — |
| | — |
| | (420,000 | ) | | (701,000 | ) | | — |
|
| Borrowings under Senior Unsecured Notes | 298,134 |
| | — |
| | — |
| | — |
| | 298,134 |
| | — |
|
| Deferred financing costs | (4,352 | ) | | (6,150 | ) | | (30,772 | ) | | (8,255 | ) | | (4,352 | ) | | (6,150 | ) |
| Proceeds from issuance of common stock, net of offering costs | 446,613 |
| | 347,211 |
| | 434,984 |
| | — |
| | 446,613 |
| | 347,211 |
|
| Offering costs paid on equity component of Convertible Notes | — |
| | — |
| | (1,609 | ) | |
| Proceeds from issuance of preferred stock, net of offering costs | | | 166,193 |
| | — |
| | — |
|
| Repurchase of shares of common stock | (753 | ) | | (4,272 | ) | | (2,920 | ) | | (286,631 | ) | | (753 | ) | | (4,272 | ) |
| Proceeds from exercise of stock options | — |
| | 46 |
| | 183 |
| | — |
| | — |
| | 46 |
|
| Distributions paid | (323,640 | ) | | (292,262 | ) | | (255,771 | ) | |
| Transfers to (from) reserve/escrow deposits with lenders | 10,945 |
| | 17,413 |
| | (10,477 | ) | |
| Net cash (used in) provided by financing activities | (255,889 | ) | | (140,681 | ) | | 769,052 |
| |
| Net (decrease) increase in cash and cash equivalents | (11,731 | ) | | (154,391 | ) | | 109,593 |
| |
| Preferred stock dividends paid | | | (2,530 | ) | | — |
| | — |
|
| Common stock dividends paid | | | (339,174 | ) | | (323,640 | ) | | (292,262 | ) |
| Transfers (from) to reserve/escrow deposits with lenders, net | | | (3,492 | ) | | 10,945 |
| | 17,413 |
|
| Net cash used in financing activities | | | (470,596 | ) | | (255,889 | ) | | (140,681 | ) |
| Net decrease in cash and cash equivalents | | | (1,261 | ) | | (11,731 | ) | | (154,391 | ) |
| Cash and cash equivalents, beginning of year | 21,790 |
| | 176,181 |
| | 66,588 |
| | 10,059 |
| | 21,790 |
| | 176,181 |
|
| Cash and cash equivalents, end of year | $ | 10,059 |
| | $ | 21,790 |
| | $ | 176,181 |
| | $ | 8,798 |
| | $ | 10,059 |
| | $ | 21,790 |
|
See accompanying notes.
SPIRIT REALTY, L.P.
Consolidated Balance Sheets
(In Thousands, Except Unit and Per Unit Data)
| | | | December 31,
2016 | | December 31,
2015 | December 31,
2017 | | December 31,
2016 |
| Assets | | | | | | |
| Investments: | | | | | | |
| Real estate investments: | | | | | | |
| Land and improvements | $ | 2,704,010 |
| | $ | 2,710,888 |
| $ | 2,588,930 |
| | $ | 2,704,010 |
|
| Buildings and improvements | 4,775,221 |
| | 4,816,481 |
| 4,692,377 |
| | 4,775,221 |
|
| Total real estate investments | 7,479,231 |
| | 7,527,369 |
| 7,281,307 |
| | 7,479,231 |
|
| Less: accumulated depreciation | (940,005 | ) | | (860,954 | ) | (1,075,643 | ) | | (940,005 | ) |
| | 6,539,226 |
| | 6,666,415 |
| 6,205,664 |
| | 6,539,226 |
|
| Loans receivable, net | 66,578 |
| | 104,003 |
| 79,967 |
| | 66,578 |
|
| Intangible lease assets, net | 470,276 |
| | 526,718 |
| 409,903 |
| | 470,276 |
|
| Real estate assets under direct financing leases, net | 36,005 |
| | 44,324 |
| 24,865 |
| | 36,005 |
|
| Real estate assets held for sale, net | 160,570 |
| | 84,259 |
| 48,929 |
| | 160,570 |
|
| Net investments | 7,272,655 |
| | 7,425,719 |
| 6,769,328 |
| | 7,272,655 |
|
| Cash and cash equivalents | 10,059 |
| | 21,790 |
| 8,798 |
| | 10,059 |
|
| Deferred costs and other assets, net | 140,917 |
| | 179,180 |
| 231,045 |
| | 140,917 |
|
| Goodwill | 254,340 |
| | 264,350 |
| 254,340 |
| | 254,340 |
|
| Total assets | $ | 7,677,971 |
| | $ | 7,891,039 |
| $ | 7,263,511 |
| | $ | 7,677,971 |
|
| Liabilities and stockholders’ equity | | | | | | |
| Liabilities: | | | | | | |
| Revolving credit facilities | $ | 86,000 |
| | $ | — |
| |
| Term loan, net | 418,471 |
| | 322,902 |
| |
| Senior unsecured notes | 295,112 |
| | — |
| |
| Revolving Credit Facility | | $ | 112,000 |
| | $ | 86,000 |
|
| Term Loan, net | | — |
| | 418,471 |
|
| Senior Unsecured Notes, net | | 295,321 |
| | 295,112 |
|
| Mortgages and notes payable, net | 2,162,403 |
| | 3,079,787 |
| 2,516,478 |
| | 2,162,403 |
|
| Notes payable to Spirit Realty Capital, Inc., net | 702,642 |
| | 690,098 |
| 715,881 |
| | 702,642 |
|
| Total debt, net | 3,664,628 |
| | 4,092,787 |
| 3,639,680 |
| | 3,664,628 |
|
| Intangible lease liabilities, net | 182,320 |
| | 193,903 |
| 155,303 |
| | 182,320 |
|
| Accounts payable, accrued expenses and other liabilities | 148,915 |
| | 142,475 |
| 148,919 |
| | 148,915 |
|
| Total liabilities | 3,995,863 |
| | 4,429,165 |
| 3,943,902 |
| | 3,995,863 |
|
| Commitments and contingencies (see Note 8) |
|
| |
|
|
|
| |
|
|
| Partners' Capital | | | | | | |
| Partnership units | | | | | | |
| General partner's capital, 3,988,218 units issued and outstanding as of both December 31, 2016 and December 31, 2015 | 26,586 |
| | 28,574 |
| |
| Limited partners' capital, 479,635,902 and 437,831,746 units issued and outstanding as of December 31, 2016 and December 31, 2015, respectively | 3,655,522 |
| | 3,433,300 |
| |
| General partner's common capital, 3,988,218 units issued and outstanding as of both December 31, 2017 and December 31, 2016 | | 24,426 |
| | 26,586 |
|
| Limited partners' preferred capital: 6,900,000 and no units issued and outstanding as of December 31, 2017 and December 31, 2016, respectively | | 166,193 |
| | — |
|
| Limited partners' common capital, 444,880,051 and 479,635,902 units issued and outstanding as of December 31, 2017 and December 31, 2016, respectively | | 3,128,990 |
| | 3,655,522 |
|
| Total partners' capital | 3,682,108 |
| | 3,461,874 |
| 3,319,609 |
| | 3,682,108 |
|
| Total liabilities and partners' capital | $ | 7,677,971 |
| | $ | 7,891,039 |
| $ | 7,263,511 |
| | $ | 7,677,971 |
|
See accompanying notes.
SPIRIT REALTY, L.P.
Consolidated Statements of Operations
(In Thousands, Except Unit and Per Unit Data)
| | | | Years Ended December 31, | | Years Ended December 31, |
| | 2016 | | 2015 | | 2014 | | 2017 | | 2016 | | 2015 |
| Revenues: | | | | | | | | | | | |
| Rentals | $ | 648,363 |
| | $ | 634,151 |
| | $ | 574,456 |
| | $ | 639,017 |
| | $ | 648,363 |
| | $ | 634,151 |
|
| Interest income on loans receivable | 5,253 |
| | 6,948 |
| | 7,239 |
| | 3,791 |
| | 5,253 |
| | 6,948 |
|
| Earned income from direct financing leases | 2,742 |
| | 3,024 |
| | 3,343 |
| | 2,078 |
| | 2,742 |
| | 3,024 |
|
| Tenant reimbursement income | 14,125 |
| | 15,952 |
| | 13,085 |
| | 16,747 |
| | 14,125 |
| | 15,952 |
|
| Other income | 15,491 |
| | 7,260 |
| | 4,748 |
| | 7,322 |
| | 15,491 |
| | 7,260 |
|
| Total revenues | 685,974 |
| | 667,335 |
| | 602,871 |
| | 668,955 |
| | 685,974 |
| | 667,335 |
|
| Expenses: | | | | | | | | | | | |
| General and administrative | 52,615 |
| | 47,730 |
| | 42,637 |
| | 62,064 |
| | 52,615 |
| | 47,730 |
|
| Restructuring charges | 6,341 |
| | 7,056 |
| | — |
| | — |
| | 6,341 |
| | 7,056 |
|
| Finance restructuring costs | — |
| | — |
| | 13,022 |
| |
| Property costs | 30,839 |
| | 27,715 |
| | 23,383 |
| |
| Transaction costs | | | 6,361 |
| | — |
| | — |
|
| Property costs (including reimbursable) | | | 36,617 |
| | 30,839 |
| | 27,715 |
|
| Real estate acquisition costs | 3,229 |
| | 2,739 |
| | 3,631 |
| | 1,356 |
| | 3,229 |
| | 2,739 |
|
| Interest | 196,586 |
| | 222,901 |
| | 220,070 |
| | 190,127 |
| | 196,586 |
| | 222,901 |
|
| Depreciation and amortization | 262,276 |
| | 260,633 |
| | 247,966 |
| | 256,019 |
| | 262,276 |
| | 260,633 |
|
| Impairments | 88,275 |
| | 70,695 |
| | 37,598 |
| | 102,330 |
| | 88,275 |
| | 70,695 |
|
| Total expenses | 640,161 |
| | 639,469 |
| | 588,307 |
| | 654,874 |
| | 640,161 |
| | 639,469 |
|
| Income from continuing operations before other income (expense) and income tax expense | 45,813 |
| | 27,866 |
| | 14,564 |
| |
| Other income (expense): | | | | | | |
| Gain (loss) on debt extinguishment | 233 |
| | (3,162 | ) | | (64,750 | ) | |
| Total other income (expense) | 233 |
| | (3,162 | ) | | (64,750 | ) | |
| Income (loss) from continuing operations before income tax expense | 46,046 |
| | 24,704 |
| | (50,186 | ) | |
| Income from continuing operations before other (expense) income and income tax expense | | | 14,081 |
| | 45,813 |
| | 27,866 |
|
| Other (expense) income: | | | | | | | |
| (Loss) gain on debt extinguishment | | | (1,645 | ) | | 233 |
| | (3,162 | ) |
| Total other (expense) income | | | (1,645 | ) | | 233 |
| | (3,162 | ) |
| Income from continuing operations before income tax expense | | | 12,436 |
| | 46,046 |
| | 24,704 |
|
| Income tax expense | (965 | ) | | (601 | ) | | (673 | ) | | (394 | ) | | (965 | ) | | (601 | ) |
| Income (loss) from continuing operations | 45,081 |
| | 24,103 |
| | (50,859 | ) | |
| Income from continuing operations | | | 12,042 |
| | 45,081 |
| | 24,103 |
|
| Discontinued operations: | | | | | | | | | | | |
| Income from discontinued operations | — |
| | 98 |
| | 3,368 |
| | — |
| | — |
| | 98 |
|
| Gain on disposition of assets | — |
| | 590 |
| | 325 |
| | — |
| | — |
| | 590 |
|
| Income from discontinued operations | — |
| | 688 |
| | 3,693 |
| | — |
| | — |
| | 688 |
|
| Income (loss) before gain on disposition of assets | 45,081 |
| | 24,791 |
| | (47,166 | ) | |
| Income before gain on disposition of assets | | | 12,042 |
| | 45,081 |
| | 24,791 |
|
| Gain on disposition of assets | 52,365 |
| | 68,421 |
| | 10,221 |
| | 65,106 |
| | 52,365 |
| | 68,421 |
|
| Net income (loss) | $ | 97,446 |
| | $ | 93,212 |
| | $ | (36,945 | ) | |
| Net income (loss) attributable to the general partner | 825 |
| | 855 |
| | (378 | ) | |
| Net income (loss) attributable to the limited partners | 96,621 |
| | 92,357 |
| | (36,567 | ) | |
| Net income | | | $ | 77,148 |
| | $ | 97,446 |
| | $ | 93,212 |
|
| Preferred distributions | | | (2,530 | ) | | — |
| | — |
|
| Net income after preferred distributions | | | 74,618 |
| | 97,446 |
| | 93,212 |
|
| | | | | | | | | | | | |
| Net income (loss) per partnership unit - basic: | | | | | | |
| Continuing operations | $ | 0.21 |
| | $ | 0.21 |
| | $ | (0.11 | ) | |
| Discontinued operations | — |
| | — |
| | 0.01 |
| |
| Net income (loss) per partnership unit - basic | $ | 0.21 |
| | $ | 0.21 |
| | $ | (0.10 | ) | |
| Net income (loss) per partnership unit - diluted: | | | | | | |
| Continuing operations | $ | 0.21 |
| | $ | 0.21 |
| | $ | (0.11 | ) | |
| Discontinued operations | — |
| | — |
| | 0.01 |
| |
| Net income (loss) per partnership unit —diluted | $ | 0.21 |
| | $ | 0.21 |
| | $ | (0.10 | ) | |
| Weighted average partnership units outstanding: | | | | | | |
| Net income attributable to general partners | | | 657 |
| | 825 |
| | 855 |
|
| Net income attributable to limited partners | | | 76,491 |
| | 96,621 |
| | 92,357 |
|
| | | | | | | | |
| Net income per common partnership unit - basic | | | $ | 0.16 |
| | $ | 0.21 |
| | $ | 0.21 |
|
| | | | | | | | |
| Net income per common partnership unit —diluted | | | $ | 0.16 |
| | $ | 0.21 |
| | $ | 0.21 |
|
| Weighted average common partnership units outstanding: | | | | | | | |
| Basic | 469,217,776 |
| | 432,222,953 |
| | 386,809,746 |
| | 467,934,945 |
| | 469,217,776 |
| | 432,222,953 |
|
| Diluted | 469,246,265 |
| | 432,545,625 |
| | 386,809,746 |
| | 467,942,788 |
| | 469,246,265 |
| | 432,545,625 |
|
See accompanying notes.
SPIRIT REALTY, L.P.
Consolidated Statements of Comprehensive Income (Loss)
(In Thousands)
|
| | | | | | | | | | | |
| | Years Ended December 31, |
| | 2016 | | 2015 | | 2014 |
| Net income (loss) | $ | 97,446 |
| | $ | 93,212 |
| | $ | (36,945 | ) |
| Other comprehensive income (loss): | | | | | |
| Change in net unrealized losses on cash flow hedges | (1,137 | ) | | (1,190 | ) | | (1,760 | ) |
| Net cash flow hedge losses reclassified to operations | 2,165 |
| | 1,245 |
| | 1,315 |
|
| Total comprehensive income (loss) | $ | 98,474 |
| | $ | 93,267 |
| | $ | (37,390 | ) |
|
| | | | | | | | | | | |
| | Years Ended December 31, |
| | 2017 | | 2016 | | 2015 |
| Net income | $ | 77,148 |
| | $ | 97,446 |
| | $ | 93,212 |
|
| Other comprehensive income: | | | | | |
| Change in net unrealized losses on cash flow hedges | — |
| | (1,137 | ) | | (1,190 | ) |
| Net cash flow hedge losses reclassified to operations | — |
| | 2,165 |
| | 1,245 |
|
| Total comprehensive income | $ | 77,148 |
| | $ | 98,474 |
| | $ | 93,267 |
|
See accompanying notes.
SPIRIT REALTY, L.P.
Consolidated Statements of Partners' Capital
(In Thousands, Except Unit Data)
| | | | General Partner's Capital (1) | | Limited Partners' Capital (2) | | Total Partnership Capital | Preferred Units | | Common Units | | Total Partnership Capital |
| | | | Limited Partners' Capital (2) | | General Partner's Capital (1) | | Limited Partners' Capital (2) | |
| | Units | | Amount | | Units | | Amount | | | Units | | Amount | | Units | | Amount | | Units | | Amount | |
| Balances, December 31, 2013 | 3,988,218 |
| | $ | 33,541 |
| | 366,375,585 |
| | $ | 3,081,200 |
| | $ | 3,114,741 |
| |
| Net loss | — |
| | (378 | ) | | — |
| | (36,567 | ) | | (36,945 | ) | |
| Other comprehensive loss | — |
| | (5 | ) | | — |
| | (440 | ) | | (445 | ) | |
| Partnership distributions declared | — |
| | (2,702 | ) | | — |
| | (261,411 | ) | | (264,113 | ) | |
| Tax withholdings related to net partnership unit settlements | — |
| | — |
| | (266,837 | ) | | (2,920 | ) | | (2,920 | ) | |
| Contributions from partners | — |
| | — |
| | 40,808,577 |
| | 434,984 |
| | 434,984 |
| |
| Embedded conversion premium of Convertible Notes, net | — |
| | — |
| | — |
| | 55,131 |
| | 55,131 |
| |
| Exercise of partnership units | — |
| | — |
| | 20,000 |
| | 183 |
| | 183 |
| |
| Stock-based compensation | — |
| | — |
| | 424,897 |
| | 11,046 |
| | 11,046 |
| |
| Balances, December 31, 2014 | 3,988,218 |
| | $ | 30,456 |
| | 407,362,222 |
| | $ | 3,281,206 |
| | $ | 3,311,662 |
| | — |
| | $ | — |
| | 3,988,218 |
| | $ | 30,456 |
| | 407,362,222 |
| | $ | 3,281,206 |
| | $ | 3,311,662 |
|
| Net income | — |
| | 855 |
| | — |
| | 92,357 |
| | 93,212 |
| | — |
| | — |
| | — |
| | 855 |
| | — |
| | 92,357 |
| | 93,212 |
|
| Other comprehensive income | — |
| | 1 |
| | — |
| | 54 |
| | 55 |
| | — |
| | — |
| | — |
| | 1 |
| | — |
| | 54 |
| | 55 |
|
| Partnership distributions declared | — |
| | (2,738 | ) | | — |
| | (295,793 | ) | | (298,531 | ) | | — |
| | — |
| | — |
| | (2,738 | ) | | — |
| | (295,793 | ) | | (298,531 | ) |
| Tax withholdings related to net partnership unit settlements | — |
| | — |
| | (426,158 | ) | | (4,272 | ) | | (4,272 | ) | |
| Contributions from partners | — |
| | — |
| | 29,610,100 |
| | 347,211 |
| | 347,211 |
| |
| Exercise of stock options | — |
| | — |
| | 5,000 |
| | 46 |
| | 46 |
| |
| Stock-based compensation | — |
| | — |
| | 1,280,582 |
| | 12,491 |
| | 12,491 |
| |
| Tax withholdings related to net settlement of partnership units | | | — |
| | — |
| | — |
| | — |
| | (426,158 | ) | | (4,272 | ) | | (4,272 | ) |
| Issuance of partnership units, net | | | — |
| | — |
| | — |
| | — |
| | 29,610,100 |
| | 347,211 |
| | 347,211 |
|
| Exercise of partnership units | | | — |
| | — |
| | — |
| | — |
| | 5,000 |
| | 46 |
| | 46 |
|
| Stock-based compensation, net | | | — |
| | — |
| | — |
| | — |
| | 1,280,582 |
| | 12,491 |
| | 12,491 |
|
| Balances, December 31, 2015 | 3,988,218 |
| | $ | 28,574 |
| | 437,831,746 |
| | $ | 3,433,300 |
| | $ | 3,461,874 |
| | — |
| | $ | — |
| | 3,988,218 |
| | $ | 28,574 |
| | 437,831,746 |
| | $ | 3,433,300 |
| | $ | 3,461,874 |
|
| Net income | — |
| | 825 |
| | — |
| | 96,621 |
| | 97,446 |
| | — |
| | — |
| | — |
| | 825 |
| | — |
| | 96,621 |
| | 97,446 |
|
| Other comprehensive income | — |
| | 9 |
| | — |
| | 1,019 |
| | 1,028 |
| | — |
| | — |
| | — |
| | 9 |
| | — |
| | 1,019 |
| | 1,028 |
|
| Partnership distributions declared | — |
| | (2,822 | ) | | — |
| | (330,358 | ) | | (333,180 | ) | | — |
| | — |
| | — |
| | (2,822 | ) | | — |
| | (330,358 | ) | | (333,180 | ) |
| Tax withholdings related to net settlement of partnership units | | | — |
| | — |
| | — |
| | — |
| | (72,835 | ) | | (753 | ) | | (753 | ) |
| Issuance of partnership units, net | | | — |
| | — |
| | — |
| | — |
| | 40,835,360 |
| | 446,613 |
| | 446,613 |
|
| Stock-based compensation, net | | | — |
| | — |
| | — |
| | — |
| | 1,041,631 |
| | 9,080 |
| | 9,080 |
|
| Balances, December 31, 2016 | | | — |
| | $ | — |
| | 3,988,218 |
| | $ | 26,586 |
| | 479,635,902 |
| | $ | 3,655,522 |
| | $ | 3,682,108 |
|
| Net income | | | — |
| | — |
| | — |
| | $ | 657 |
| | — |
| | $ | 76,491 |
| | $ | 77,148 |
|
| Partnership distributions declared on preferred units | | | — |
| | — |
| | — |
| | — |
| | — |
| | (2,530 | ) | | (2,530 | ) |
| Net income after preferred distributions | | | | | — |
| | | | 657 |
| | — |
| | 73,961 |
| | 74,618 |
|
| Issuance of preferred partnership units | | | 6,900,000 |
| | 166,193 |
| | — |
| | — |
| | — |
| | — |
| | 166,193 |
|
| Partnership distributions declared on common units | | | — |
| | — |
| | — |
| | (2,817 | ) | | — |
| | (329,585 | ) | | (332,402 | ) |
| Tax withholdings related to net partnership unit settlements | — |
| | — |
| | (72,835 | ) | | (753 | ) | | (753 | ) | | — |
| | — |
| | — |
| | — |
| | (440,312 | ) | | (3,542 | ) | | (3,542 | ) |
| Contributions from partners | — |
| | — |
| | 40,835,360 |
| | 446,613 |
| | 446,613 |
| |
| Repurchase of partnership units | | | — |
| | — |
| | — |
| | — |
| | (35,839,965 | ) | | (283,089 | ) | | (283,089 | ) |
| Stock-based compensation | — |
| | — |
| | 1,041,631 |
| | 9,080 |
| | 9,080 |
| | — |
| | — |
| | — |
| | — |
| | 1,524,426 |
| | 15,723 |
| | 15,723 |
|
| Balances, December 31, 2016 | 3,988,218 |
| | $ | 26,586 |
| | 479,635,902 |
| | $ | 3,655,522 |
| | $ | 3,682,108 |
| |
| Balances, December 31, 2017 | | | 6,900,000 |
| | $ | 166,193 |
| | 3,988,218 |
| | $ | 24,426 |
| | 444,880,051 |
| | $ | 3,128,990 |
| | $ | 3,319,609 |
|
(1) Consists of general partnership interests held by Spirit General OP Holdings, LLC.
(2) Consists of limited partnership interests held by Spirit Realty Capital, Inc. and Spirit Notes Partner, LLC.
See accompanying notes.
SPIRIT REALTY, L.P.
Consolidated Statements of Cash Flows
(In Thousands)
| | | | Years Ended December 31, | Years Ended December 31, |
| | 2016 | | 2015 | | 2014 | 2017 | | 2016 | | 2015 |
| Operating activities | | | | | | | | | | |
| Net income (loss) | $ | 97,446 |
| | $ | 93,212 |
| | $ | (36,945 | ) | |
| Adjustments to reconcile net income (loss) to net cash provided by operating activities: | | | | | | |
| Net Income | | $ | 77,148 |
| | $ | 97,446 |
| | $ | 93,212 |
|
| Adjustments to reconcile net income to net cash provided by operating activities: | | | | | | |
| Depreciation and amortization | 262,276 |
| | 260,633 |
| | 247,966 |
| 256,019 |
| | 262,276 |
| | 260,633 |
|
| Impairments | 88,275 |
| | 70,729 |
| | 38,015 |
| 102,330 |
| | 88,275 |
| | 70,729 |
|
| Amortization of deferred financing costs | 9,070 |
| | 7,937 |
| | 5,899 |
| 9,896 |
| | 9,070 |
| | 7,937 |
|
| Payments to terminate interest rate swap | (1,724 | ) | | — |
| | — |
| — |
| | (1,724 | ) | | — |
|
| Derivative net settlements, amortization and terminations | 1,811 |
| | (132 | ) | | (114 | ) | — |
| | 1,811 |
| | (132 | ) |
| Amortization of debt discounts (premium) | 6,217 |
| | 2,322 |
| | (849 | ) | |
| Amortization of debt discounts | | 13,572 |
| | 6,217 |
| | 2,322 |
|
| Stock-based compensation expense | 9,570 |
| | 13,321 |
| | 11,346 |
| 16,560 |
| | 9,570 |
| | 13,321 |
|
| (Gain) loss on debt extinguishment, net | (233 | ) | | 3,162 |
| | 64,750 |
| |
| Loss (gain) on debt extinguishment | | 1,645 |
| | (233 | ) | | 3,162 |
|
| Debt extinguishment costs | (26,219 | ) | | (8,112 | ) | | (59,576 | ) | (3,305 | ) | | (26,219 | ) | | (8,112 | ) |
| Gains on dispositions of real estate and other assets, net | (52,365 | ) | | (69,011 | ) | | (10,546 | ) | |
| Gains on dispositions of real estate and other assets | | (65,106 | ) | | (52,365 | ) | | (69,011 | ) |
| Non-cash revenue | (26,333 | ) | | (20,930 | ) | | (16,732 | ) | (28,439 | ) | | (26,333 | ) | | (20,930 | ) |
| Other | (594 | ) | | 151 |
| | (1,355 | ) | |
| Bad debt expense and other | | 5,913 |
| | (594 | ) | | 151 |
|
| Changes in operating assets and liabilities: | | | | | | | | | | |
| Deferred costs and other assets, net | (6,561 | ) | | (604 | ) | | (25,466 | ) | (1,418 | ) | | (6,561 | ) | | (604 | ) |
| Accounts payable, accrued expenses and other liabilities | 6,308 |
| | 13,382 |
| | 2,178 |
| 1,578 |
| | 6,308 |
| | 13,382 |
|
| Accrued restructuring charges | (5,535 | ) | | 5,926 |
| | — |
| — |
| | (5,535 | ) | | 5,926 |
|
| Net cash provided by operating activities | 361,409 |
| | 371,986 |
| | 218,571 |
| 386,393 |
| | 361,409 |
| | 371,986 |
|
| Investing activities | | | | | | | | | | |
| Acquisitions of real estate | (655,835 | ) | | (875,983 | ) | | (958,038 | ) | (279,934 | ) | | (655,835 | ) | | (875,983 | ) |
| Capitalized real estate expenditures | (27,078 | ) | | (10,269 | ) | | (5,087 | ) | (46,100 | ) | | (27,078 | ) | | (10,269 | ) |
| Investments in loans receivable | (5,073 | ) | | (4,020 | ) | | — |
| (4,995 | ) | | (5,073 | ) | | (4,020 | ) |
| Collections of principal on loans receivable and real estate assets under direct financing leases | 8,410 |
| | 6,822 |
| | 6,085 |
| 12,769 |
| | 8,410 |
| | 6,822 |
|
| Proceeds from dispositions of real estate and other assets | 524,776 |
| | 496,646 |
| | 110,185 |
| 472,496 |
| | 524,776 |
| | 496,646 |
|
| Transfers of net sales proceeds from (to) restricted accounts pursuant to 1031 Exchanges | 39,869 |
| | (39,869 | ) | | 20,784 |
| — |
| | 39,869 |
| | (39,869 | ) |
| Transfers of net sales proceeds (to) from Master Trust Release | (2,320 | ) | | 40,977 |
| | (51,959 | ) | (71,294 | ) | | (2,320 | ) | | 40,977 |
|
| Net cash used in investing activities | (117,251 | ) | | (385,696 | ) | | (878,030 | ) | |
| Net cash provided by (used in) investing activities | | 82,942 |
| | (117,251 | ) | | (385,696 | ) |
| | | | Years Ended December 31, | Years Ended December 31, |
| | 2016 | | 2015 | | 2014 | 2017 | | 2016 | | 2015 |
| Financing activities |
|
| |
|
| |
|
|
|
| |
|
| |
|
|
| Borrowings under Revolving Credit Facilities | 1,080,000 |
| | 798,000 |
| | 875,722 |
| 940,200 |
| | 1,080,000 |
| | 798,000 |
|
| Repayments under Revolving Credit Facilities | (994,000 | ) | | (813,181 | ) | | (895,661 | ) | (914,200 | ) | | (994,000 | ) | | (813,181 | ) |
| Borrowings under mortgages and notes payable | — |
| | — |
| | 518,846 |
| 618,603 |
| | — |
| | — |
|
| Repayments under mortgages and notes payable | (863,836 | ) | | (512,486 | ) | | (610,973 | ) | (221,310 | ) | | (863,836 | ) | | (512,486 | ) |
| Borrowings under notes payable to affiliate | — |
| | — |
| | 747,500 |
| |
| Borrowings under Term Loan | 796,000 |
| | 325,000 |
| | — |
| — |
| | 796,000 |
| | 325,000 |
|
| Repayments under Term Loan | (701,000 | ) | | — |
| | — |
| (420,000 | ) | | (701,000 | ) | | — |
|
| Borrowings under Senior Unsecured Notes | 298,134 |
| | — |
| | — |
| — |
| | 298,134 |
| | — |
|
| Deferred financing costs | (4,352 | ) | | (6,150 | ) | | (30,772 | ) | (8,255 | ) | | (4,352 | ) | | (6,150 | ) |
| Proceeds from issuance of common stock, net of offering costs | 446,613 |
| | 347,211 |
| | 434,984 |
| — |
| | 446,613 |
| | 347,211 |
|
| Offering costs paid on equity component of notes payable to affiliate | — |
| | — |
| | (1,609 | ) | |
| Proceeds from issuance of preferred stock, net of offering costs | | 166,193 |
| | — |
| | — |
|
| Repurchase of partnership units | (753 | ) | | (4,272 | ) | | (2,920 | ) | (286,631 | ) | | (753 | ) | | (4,272 | ) |
| Proceeds from exercise of partnership units | — |
| | 46 |
| | 183 |
| — |
| | — |
| | 46 |
|
| Distributions paid | (323,640 | ) | | (292,262 | ) | | (255,771 | ) | |
| Transfers to (from) reserve/escrow deposits with lenders | 10,945 |
| | 17,413 |
| | (10,477 | ) | |
| Net cash (used in) provided by financing activities | (255,889 | ) | | (140,681 | ) | | 769,052 |
| |
| Net (decrease) increase in cash and cash equivalents | (11,731 | ) | | (154,391 | ) | | 109,593 |
| |
| Preferred distributions paid | | (2,530 | ) | | — |
| | — |
|
| Common distributions paid | | (339,174 | ) | | (323,640 | ) | | (292,262 | ) |
| Transfers (from) to reserve/escrow deposits with lenders, net | | (3,492 | ) | | 10,945 |
| | 17,413 |
|
| Net cash used in financing activities | | (470,596 | ) | | (255,889 | ) | | (140,681 | ) |
| Net decrease in cash and cash equivalents | | (1,261 | ) | | (11,731 | ) | | (154,391 | ) |
| Cash and cash equivalents, beginning of year | 21,790 |
| | 176,181 |
| | 66,588 |
| 10,059 |
| | 21,790 |
| | 176,181 |
|
| Cash and cash equivalents, end of year | $ | 10,059 |
| | $ | 21,790 |
| | $ | 176,181 |
| $ | 8,798 |
| | $ | 10,059 |
| | $ | 21,790 |
|
SPIRIT REALTY CAPITAL, INC. and SPIRIT REALTY, L.P.
Notes to Consolidated Financial Statements
December 31, 20162017
Note 1. Organization
Organization and Operations
Spirit Realty Capital, Inc. (the "Corporation" or, with its consolidated subsidiaries, the "Company") operates as a self-administered and self-managed REIT that seeks to generate and deliver sustainable and attractive returns for stockholders by investing primarily in and managing a portfolio of single-tenant, operationally essential real estate throughout the U.S. that is generally leased on a long-term, triple-net basis to tenants operating within predominantly retail, but also office and industrial property types. Single tenant, operationally essential real estate generally refers to free-standing, commercial real estate facilities where tenants conduct activities that are essential to the generation of their sales and profits.The Company began operations through a predecessor legal entity in 2003.
The Company became a public company in December 2004 and was subsequently taken private in August 2007 by a consortium of private investors. On September 25, 2012, the Company completed an IPO of 33.35 million shares of common stock (including shares issued on October 1, 2012 pursuant to the underwriters’ option to purchase additional shares).
The Company’s operations are generally carried out through Spirit Realty, L.P. (the "Operating Partnership"). and its subsidiaries. Spirit General OP Holdings, LLC ("OP Holdings"), one of the Corporation's wholly-owned subsidiaries, is the sole general partner and owns approximately 1.0%1% of the Operating Partnership. The Corporation and a wholly-owned subsidiary ("Spirit Notes Partner, LLC") are the only limited partners and together own the remaining 99.0%99% of the Operating Partnership.
On August 3, 2017, the Company announced a proposed Spin-Off of almost all of its interests in properties leased to Shopko, assets that collateralize Master Trust 2014 and other additional assets into an independent, publicly traded REIT, Spirit MTA REIT, or SMTA. Transaction costs associated with the spin off for the year ended December 31, 2017 totaled $6.4 million, and are included within transaction costs on the accompanying consolidated statements of operations.
Note 2. Summary of Significant Accounting Policies
BasisAllowance for Doubtful Accounts
We review our rent receivables for collectability on a regular basis, taking into consideration factors such as the tenant’s payment history, the financial condition of Accountingthe tenant, business conditions in the industry in which the tenant operates and Principleseconomic conditions in the area in which the property is located. If the collectability of Consolidationa receivable with respect to any tenant is in doubt, a provision for uncollectible amounts will be established or a write-off of the specific receivable will be made. Uncollected accounts receivable are written off against the allowance when all possible means of collection have been exhausted. For deferred rental revenues related to the straight-line method of reporting rental revenue, we establish a provision for losses based on our estimate of uncollectible receivables and our assessment of the risks inherent in our portfolio, giving consideration to historical experience and industry default rates for long-term receivables.
The accompanyingINCOME TAXES
REIT Status
We elected to be taxed as a REIT for federal income tax purposes commencing with our taxable year ended December 31, 2005. We believe that we have been organized and have operated in a manner that has allowed us to qualify as a REIT commencing with such taxable year, and we intend to continue operating in such a manner. To maintain our REIT status, we are required to annually distribute to our stockholders at least 90% of our REIT taxable income, determined without regard to the dividends paid deduction and excluding any net capital gain, and meet the various other requirements imposed by the Code relating to such matters as operating results, asset holdings, distribution levels and diversity of stock ownership. Provided that we qualify for taxation as a REIT, we are generally not subject to corporate level federal income tax on the earnings distributed to our stockholders that we derive from our REIT qualifying activities. We are still subject to state and local income and franchise taxes and to federal income and excise tax on our undistributed income. If we fail to qualify as a REIT in any taxable year and are unable to avail ourselves of certain savings provisions set forth in the Code, all of our taxable income would be subject to federal income tax at regular corporate rates, including any applicable alternative minimum tax. Unless entitled to relief under specific statutory provisions, we would be ineligible to elect to be treated as a REIT for the four taxable years following the year for which we lose our qualification. It is not possible to state whether in all circumstances we would be entitled to this statutory relief.
TRS
We have elected, together with certain of our subsidiaries, to treat such subsidiaries as our TRS for federal income tax purposes. A taxable REIT subsidiary generally may provide both customary and non-customary services to tenants of its parent REIT and engage in other activities that the parent REIT may not engage in directly without adversely affecting its qualification as a REIT. Currently, our TRS do not provide any services to our tenants or conduct other material activities. However, one or more TRS of ours may in the future provide services to certain of our tenants. We may form additional taxable REIT subsidiaries in the future and we may contribute some or all of our interests in certain wholly-owned subsidiaries or their assets to a TRS of ours. Any income earned by our TRS will not be included in our taxable income for purposes of the 75% or 95% gross income tests, except to the extent such income is distributed to us as a dividend, in which case such dividend income will qualify under the 95%, but not the 75%, gross income test. Because a taxable REIT subsidiary is subject to federal income tax and state and local income tax (where applicable), as a regular C corporation, the income earned by our TRS generally will be subject to an additional level of tax as compared to the income earned by our other subsidiaries. Historically, we have not actively pursued or engaged in material activities that would require the use of our TRS.
SHARE-BASED COMPENSATION
Awards granted under our Amended Incentive Award Plan may require service-based vesting over a period of years subsequent to the grant date and resulting equity-based compensation expense, measured at the fair value of the award on the date of grant, will be recognized as an expense in our consolidated financial statements over the vesting period. Grant date fair value is estimated using the Monte Carlo simulation model, which incorporates stock price correlation, projected dividend yields and other variables over the time horizons matching the performance periods.
Results of Operations
Comparison of the CompanyYears Ended December 31, 2017 and 2016
The following discussion includes the Operating Partnershipresults of our continuing operations as summarized in the table below:
|
| | | | | | | | | | | | | | |
| | Years Ended December 31, |
| (In Thousands) | 2017 | | 2016 | | Change | | % Change |
| Revenues: | | | | | | | |
| Rentals | $ | 639,017 |
| | $ | 648,363 |
| | $ | (9,346 | ) | | (1.4 | )% |
| Interest income on loans receivable | 3,791 |
| | 5,253 |
| | (1,462 | ) | | (27.8 | )% |
| Earned income from direct financing leases | 2,078 |
| | 2,742 |
| | (664 | ) | | (24.2 | )% |
| Tenant reimbursement income | 16,747 |
| | 14,125 |
| | 2,622 |
| | 18.6 | % |
| Other income | 7,322 |
| | 15,491 |
| | (8,169 | ) | | (52.7 | )% |
| Total revenues | 668,955 |
| | 685,974 |
| | (17,019 | ) | | (2.5 | )% |
| Expenses: | | | | | | | |
| General and administrative | 62,064 |
| | 52,615 |
| | 9,449 |
| | 18.0 | % |
| Restructuring charges | — |
| | 6,341 |
| | (6,341 | ) | | (100.0 | )% |
| Transaction costs | 6,361 |
| | — |
| | 6,361 |
| | 100.0 | % |
| Property costs (including reimbursable) | 36,617 |
| | 30,839 |
| | 5,778 |
| | 18.7 | % |
| Real estate acquisition costs | 1,356 |
| | 3,229 |
| | (1,873 | ) | | (58.0 | )% |
| Interest | 190,127 |
| | 196,586 |
| | (6,459 | ) | | (3.3 | )% |
| Depreciation and amortization | 256,019 |
| | 262,276 |
| | (6,257 | ) | | (2.4 | )% |
| Impairment | 102,330 |
| | 88,275 |
| | 14,055 |
| | 15.9 | % |
| Total expenses | 654,874 |
| | 640,161 |
| | 14,713 |
| | 2.3 | % |
| Income from continuing operations before other (expense) income and income tax expense | 14,081 |
| | 45,813 |
| | (31,732 | ) | | (69.3 | )% |
| Other (expense) income: | | | | | | | |
| (Loss) gain on debt extinguishment | (1,645 | ) | | 233 |
| | (1,878 | ) | | NM |
|
| Total other (expense) income | (1,645 | ) | | 233 |
| | (1,878 | ) | | NM |
|
| Income from continuing operations before income tax expense | 12,436 |
| | 46,046 |
| | (33,610 | ) | | (73.0 | )% |
| Income tax expense | (394 | ) | | (965 | ) | | 571 |
| | 59.2 | % |
| Income from continuing operations | $ | 12,042 |
| | $ | 45,081 |
| | $ | (33,039 | ) | | 73.3 | % |
| | | | | | | | |
| Gain on disposition of assets | $ | 65,106 |
| | $ | 52,365 |
| | $ | 12,741 |
| | 24.3 | % |
NM - Percentages over 100% are not displayed.
REVENUES
Rentals
For the year ended December 31, 2017, approximately 95.5% of our total revenues were generated from long-term leases of our owned properties. Our contractual rental revenues between periods decreased by 0.9% as we were a moderate disposer of income producing real estate during the year ended December 31, 2017. We acquired 39 properties with a real estate investment value of $323.0 million during the year ended December 31, 2017. This increase was offset by the sale of 192 properties during the same period for gross sales of $551.2 million, of which 87 were income producing properties for gross sales of $397.5 million. Additionally, we had tenant credit losses in the first quarter of 2017, where the majority of the increase in our nonperforming properties were in the convenience store and movie theater industries.
During both the years ended December 31, 2017 and 2016, non-cash rentals were $30.6 million, representing approximately 4.8% and 4.7%, respectively, of total rental revenue from continuing operations.
Interest income on loans receivable
While financed properties increased from 74 at December 31, 2016 to 88 at December 31, 2017, resulting in an increase of 20.1% in the related mortgage loans receivable balances for the comparative period, interest income on loans receivable decreased as a result of a timing of the change in financed properties. We held 144 financed properties at the beginning of 2016, of which 66 were paid off in mid-2016. Additionally, all 16 properties financed in 2017 were originated in the last four months of 2017.
Tenant reimbursement income
We have a number of leases that require our tenants to reimburse us for certain property costs we incur. Tenant reimbursement income is driven by the tenant reimbursable property costs described below.
Other income
The year-over-year decrease in other income is primarily due to $5.5 million in fee income associated with the prepayment of certain mortgage loans for the year ended December 31, 2016, and no comparable transaction for the year ended December 31, 2017. Additionally, lease termination fees collected for the year ended December 31, 2017 were $5.0 million, compared to $7.3 million for the year ended December 31, 2016.
EXPENSES
General and administrative
The year-over-year increase in general and administrative expenses is primarily due to $11.1 million in severance related costs, comprised of $4.2 million of cash compensation and $6.9 million of non-cash compensation, recorded in the year ended December 31, 2017 following the departure of our chief executive officer and an increase of $4.3 million in bad debt expense recorded year-over-year. The change in bad debt expense increased primarily as a result of certain entertainment, sporting goods and restaurant - casual dining properties for which the straight-line rent has been prepareddetermined to be uncollectible for the year ended December 31, 2017, offset by a decrease in bad debt expenses related to convenience store properties of $1.1 million year-over-year. Finally, the period-over-period increase in general and administrative expenses was partially offset by the $1.7 million loss recognized in the comparable prior period related to termination fees on an interest rate swap.
Property costs
The increase in property costs is primarily due to an increase in non-reimbursable property taxes on operating properties of $2.4 million and an increase in reimbursable property taxes of $3.1 million. The increase in non-reimbursable property taxes on operating properties resulted from an increase in tenant credit issues year-over-year. Tenant reimbursable property costs for the year ended December 31, 2017 were $21.4 million, an increase from $18.0 million in 2016.
Transaction costs
On August 3, 2017, we announced a proposed Spin-Off of almost all of our interests in our properties leased to Shopko, assets that collateralize Master Trust 2014 and other additional assets into an independent, publicly traded REIT. Transaction costs associated with the Spin-Off for the year ended December 31, 2017 totaled $6.4 million.
Interest
The decrease in interest expense is primarily due to the extinguishment of $238.5 million of mortgage debt with a weighted average interest rate of 5.5% during the year ended December 31, 2017. This was partially offset by an increase in interest due to increased average borrowings year-over-year under our Revolving Credit Facility and Term Loan, as well as interest on our Senior Unsecured Notes, which were issued in August 2016.
The following table summarizes our interest expense on related borrowings:
|
| | | | | | | |
| | Years Ended December 31, |
| (In Thousands) | 2017 | | 2016 |
Interest expense – Revolving Credit Facilities (1) | $ | 7,957 |
| | $ | 3,314 |
|
| Interest expense – Term Loan | 9,793 |
| | 5,218 |
|
| Interest expense – mortgages and notes payable | 111,049 |
| | 143,233 |
|
| Interest expense – Convertible Notes | 24,509 |
| | 24,509 |
|
| Interest expense – Unsecured Senior Notes | 13,351 |
| | 4,932 |
|
| Non-cash interest expense: | | | |
| Amortization of deferred financing costs | 9,896 |
| | 9,070 |
|
| Amortization of net losses related to interest rate swaps | — |
| | 93 |
|
| Amortization of debt discount/(premium), net | 13,572 |
| | 6,217 |
|
| Total interest expense | $ | 190,127 |
| | $ | 196,586 |
|
(1) Includes non-utilization fees of approximately $2.1 million and $2.0 million for the years ended December 31, 2017 and 2016, respectively.
Depreciation and amortization
Depreciation and amortization expense relates primarily to depreciation on the accrualcommercial buildings and improvements we own and to amortization of the related lease intangibles. We were a net disposer during the year ended December 31, 2017 (based on depreciable real estate assets), which was the primary driver in the decrease year-over-year. During the year ended December 31, 2017, we acquired 39 properties with a depreciable basis of accounting,$323.0 million, while we sold 192 properties with a real estate investment value of $536.0 million. Our depreciable real estate balance was further reduced due to impairment charges recorded in accordance2017 on properties that remain in our portfolio. Finally, properties held for sale are no longer depreciated and there were more properties being held for sale this year than last year. The following table summarizes our depreciation and amortization expense:
|
| | | | | | | |
| | Years Ended December 31, |
| (In Thousands) | 2017 | | 2016 |
| Depreciation of real estate assets | $ | 212,112 |
| | $ | 215,443 |
|
| Other depreciation | 563 |
| | 475 |
|
| Amortization of lease intangibles | 43,344 |
| | 46,358 |
|
| Total depreciation and amortization | $ | 256,019 |
| | $ | 262,276 |
|
Impairment
Impairment charges for the year ended December 31, 2017 were $102.3 million. These charges included $24.8 million on properties held for sale, including $15.0 million on vacant held for sale properties and $6.4 million on four education properties held for sale. $77.2 million of impairment was recorded on properties held and used, including $55.9 million on vacant properties held and used, $10.0 million on eight underperforming properties within the drug store/pharmacy and consumer electronics industries, and $4.2 million on an underperforming property within the general merchandise industry. $0.3 million of impairment charges related to unrecoverable amounts from mortgage loans receivable.
During the year ended December 31, 2016, we recorded impairment losses of $88.3 million. These charges included $23.1 million on 28 properties that were held for sale, including $10.6 million on vacant held for sale properties, and $28.2 million on vacant properties that were not classified as held for sale. The impairment losses also include $26.3 million on 9 underperforming properties within the restaurant-casual dining, movie theater, general merchandise, drug store/pharmacy and distribution industries. In addition, during the year ended December 31, 2016, lease intangible write-offs were primarily due to the $6.6 million write-off of below market rent intangible liabilities for one tenant in the restaurant-casual dining industry.
(Loss) gain on debt extinguishment
During the year ended December 31, 2017, we extinguished $238.5 million of mortgage debt and recognized a loss on debt extinguishment of $1.6 million. The loss was primarily attributable to the $1.6 million pre-payment premium
paid in conjunction with GAAP. The consolidated financial statementsour voluntary pre-payment of the Company includefull outstanding balance of Master Trust 2014 Series 2014-1 Class A1 note of $43.1 million in November 2017. During the accountssame period in 2016, we extinguished $883.0 million of mortgage debt and recognized a gain on debt extinguishment of $0.2 million. The gain was primarily attributable to the extinguishment of four defaulted mortgage loans upon sale of the Corporationproperties collateralizing these loans to third parties, offset by losses from the prepayment and its wholly-owned subsidiaries. The consolidated financial statementsdefeasance fees on 408 properties.
Gain on disposition of assets
During the year ended December 31, 2017, we disposed of 192 properties and recorded gains totaling $65.1 million. Included in these amounts are a $16.2 million gain on the sales of 12 Shopko properties, a $9.5 million gain on the sales of 29 restaurant - casual dining and quick service properties, a $8.9 million gain on the sales of six grocery properties, a $7.9 million gain on the sale of a distribution property, a $7.8 million gain on the sales of 11 drug store/pharmacy properties, and a $7.6 million gain on the sales of five building materials properties. These gains were partially offset by a $6.9 million loss on the sales of 105 vacant properties during the year ended December 31, 2017.
During 2016, we disposed of 213 properties and recorded gains totaling $52.4 million. Included in these amounts are a $12.7 million gain for the sales of 14 Shopko properties, a $10.3 million gain for the sale of one grocery property, a $9.8 million gain on the sale of 30 properties within the restaurant-quick service industry and a $8.8 million gain on the sale of 19 properties with the restaurant-casual dining industry.
Results of Operations
Comparison of the Operating Partnership includeYears Ended December 31, 2016 and 2015
The following discussion includes the accountsresults of our continuing operations as summarized in the Operating Partnershiptable below:
|
| | | | | | | | | | | | | | |
| | Years Ended December 31, |
| (In Thousands) | 2016 | | 2015 | | Change | | % Change |
| Revenues: | | | | | | | |
| Rentals | $ | 648,363 |
| | $ | 634,151 |
| | $ | 14,212 |
| | 2.2 | % |
| Interest income on loans receivable | 5,253 |
| | 6,948 |
| | (1,695 | ) | | (24.4 | )% |
| Earned income from direct financing leases | 2,742 |
| | 3,024 |
| | (282 | ) | | (9.3 | )% |
| Tenant reimbursement income | 14,125 |
| | 15,952 |
| | (1,827 | ) | | (11.5 | )% |
| Other income | 15,491 |
| | 7,260 |
| | 8,231 |
| | NM |
|
| Total revenues | 685,974 |
| | 667,335 |
| | 18,639 |
| | 2.8 | % |
| Expenses: | | | | | | | |
| General and administrative | 52,615 |
| | 47,730 |
| | 4,885 |
| | 10.2 | % |
| Restructuring charges | 6,341 |
| | 7,056 |
| | (715 | ) | | (10.1 | )% |
| Property costs (including reimbursable) | 30,839 |
| | 27,715 |
| | 3,124 |
| | 11.3 | % |
| Real estate acquisition costs | 3,229 |
| | 2,739 |
| | 490 |
| | 17.9 | % |
| Interest | 196,586 |
| | 222,901 |
| | (26,315 | ) | | (11.8 | )% |
| Depreciation and amortization | 262,276 |
| | 260,633 |
| | 1,643 |
| | 0.6 | % |
| Impairment | 88,275 |
| | 70,695 |
| | 17,580 |
| | 24.9 | % |
| Total expenses | 640,161 |
| | 639,469 |
| | 692 |
| | 0.1 | % |
| Income from continuing operations before other income (expense) and income tax expense | 45,813 |
| | 27,866 |
| | 17,947 |
| | 64.4 | % |
| Other income (expense): | | | | | | | |
| Gain (loss) on debt extinguishment | 233 |
| | (3,162 | ) | | 3,395 |
| | NM |
|
| Total other income (expense) | 233 |
| | (3,162 | ) | | 3,395 |
| | NM |
|
| Income from continuing operations before income tax expense | 46,046 |
| | 24,704 |
| | 21,342 |
| | NM |
|
| Income tax expense | (965 | ) | | (601 | ) | | (364 | ) | | (60.6 | )% |
| Income from continuing operations | $ | 45,081 |
| | $ | 24,103 |
| | $ | 20,978 |
| | (87.0 | )% |
| | | | | | | | |
| Gain on disposition of assets | $ | 52,365 |
| | $ | 68,421 |
| | $ | (16,056 | ) | | 23.5 | % |
NM - Percentages over 100% are not displayed.
REVENUES
For the year ended December 31, 2016, approximately 94.9% of our total revenues were generated from long-term leases of our owned properties. The year-over-year increase of 2.8% in total revenue was due primarily to an increase in base rental revenue resulting from real estate acquisitions subsequent to December 31, 2015, as well as recognition of other non-tenant income income and its wholly-owned subsidiaries. All significant intercompany balanceslease termination fees, both of which are recorded in other income.
Rentals
The year-over-year increase in rental revenue was primarily attributable to the acquisition of 269 properties with a gross investment in real estate of $704.9 million during the year ended December 31, 2016. This increase was partially offset by the sale of 213 properties during the same period having a real estate investment value of $598.7 million. During the year ended December 31, 2016 and transactions have been eliminated2015, non-cash rentals were $30.6 million and $23.4 million, respectively, representing approximately 4.7% and 3.7% of total rental revenue from continuing operations, respectively. Contractual rent escalations subsequent to December 31, 2015 also contributed to the increase.
As of December 31, 2016, 98.2% of our owned properties were occupied (based on number of properties). The majority of our nonperforming properties were in consolidation. Properties thatthe convenience store and restaurants-casual dining industries. As of December 31, 2016 and 2015, respectively, 46 and 36 of our properties were reported asvacant and not generating rent, representing approximately 1.8% and 1.4% of our owned properties. Of the 46 vacant properties, 10 were held for sale as of December 31, 2013, are presented in discontinued operations until their disposal.2016.
All expenses incurredTenant reimbursement income
We have a number of leases that require our tenants to reimburse us for certain property costs we incur. Tenant reimbursement income is driven by the Company havetenant reimbursable property costs described below.
Other income
The year-over-year increase in other income is primarily due to $5.5 million in fee income associated with the prepayment of certain mortgage loans receivable and $7.2 million in lease termination fees received from Haggen and three other properties for the year ended December 31, 2016. Comparatively, for the year ended December 31, 2015, there was only $5.8 million in lease termination fees related to three tenants.
EXPENSES
General and administrative
The year-over-year increase in general and administrative expenses is primarily due to a $4.0 million increase in professional fees and office expenses, $2.0 million of bad debt expense recorded in relation to 34 convenience store properties for which the rent has been allocateddetermined to be uncollectible and a $1.7 million charge for the termination of our interest rate swaps. Higher professional fees and office expenses include legal, consulting and temporary services attributable to our relocation to Dallas, Texas. These increases were partially offset by a decrease in compensation and related benefits of $3.9 million related to the forfeiture of previously recognized non-cash compensation following the departure of an executive officer in the current period.
Restructuring charges
During the quarter ended December 31, 2015, we made the strategic decision to relocate the Company's headquarters from Scottsdale, Arizona to Dallas, Texas. As a result, during the year ended December 31, 2015, the Company incurred $7.1 million of restructuring charges. Comprising the majority of this amount were estimated employee separation costs, which were based on the anticipated separation date of June 30, 2016 and recognized on the date the employee elected to separate in December 2015. Employee separation costs primarily consist of severance payments, retention bonuses and pro-rated 2016 annual bonuses. Costs associated with employees electing to relocate to Dallas were recognized as the liability was incurred. These costs include a transition bonus and reimbursements for certain relocation costs, including home sale costs, lease breakage penalties, moving costs and a miscellaneous allowance. Other restructuring charges, including placement fees and third-party consulting fees, were also recognized when incurred. As such, during the year ended December 31, 2016, we incurred $6.3 million in restructuring charges related to our relocation. Of this amount, $4.9 million related to professional fees, consulting services, employee severance costs, lease termination expense of our prior headquarters, while the balance was for employee relocation costs and other restructuring charges.
Property costs
For the year ended December 31, 2016, property costs were $30.8 million (including $14.1 million of tenant reimbursables) compared to $27.7 million (including $16.0 million of tenant reimbursables) for the same period in 2015. The increase was driven primarily by an increase in non-reimbursable property taxes on non-operating properties of $3.5 million, as well as increased costs to the Company due to the increased number of vacant properties.
Interest
Year-over-year decrease in interest expense is primarily due to the extinguishment of $883.0 million of mortgage debt with a weighted average interest rate of 6.01% during the year ended December 31, 2016. This decrease was partially offset by an increase in interest from our Term Loan, which was entered into during November 2015, and the issuance of our Senior Unsecured Notes in August 2016.
The following table summarizes our interest expense on related borrowings from continuing operations:
|
| | | | | | | |
| | Years Ended December 31, |
| (In Thousands) | 2016 | | 2015 |
Interest expense – Revolving Credit Facilities (1) | $ | 3,314 |
| | $ | 2,698 |
|
| Interest expense – Term Loan | 5,218 |
| | 888 |
|
| Interest expense – mortgages and notes payable | 143,233 |
| | 184,439 |
|
| Interest expense – Convertible Notes | 24,509 |
| | 24,509 |
|
| Interest expense – Unsecured Senior Notes | 4,932 |
| | — |
|
| Non-cash interest expense: | | | |
| Amortization of deferred financing costs | 9,070 |
| | 7,937 |
|
| Amortization of net losses related to interest rate swaps | 93 |
| | 108 |
|
| Amortization of debt discount/(premium), net | 6,217 |
| | 2,322 |
|
| Total interest expense | $ | 196,586 |
| | $ | 222,901 |
|
(1) Includes non-utilization fees of approximately $2.0 million and $1.6 million for the years ended December 31, 2016 and 2015, respectively.
Depreciation and amortization
Depreciation and amortization expense relates primarily to depreciation on the commercial buildings and improvements we own and to amortization of the related lease intangibles. The year-over-year increase is primarily due to the acquisition of 269 properties, representing a gross investment in real estate of $704.9 million, during the year ended December 31, 2016. The increase was partially offset by dispositions of 213 properties during 2016 with a real estate investment value of $598.7 million. Our net acquisitions during the year were partially offset by a reduction in our real estate investment value due to impairment charges recorded in 2016 on properties that remain in our portfolio and a higher real estate value of properties held for sale compared to 2015. Properties held for sale are no longer depreciated.
The following table summarizes our depreciation and amortization expense from continuing operations:
|
| | | | | | | |
| | Years Ended December 31, |
| (In Thousands) | 2016 | | 2015 |
| Depreciation of real estate assets | $ | 215,443 |
| | $ | 210,395 |
|
| Other depreciation | 475 |
| | 375 |
|
| Amortization of lease intangibles | 46,358 |
| | 49,863 |
|
| Total depreciation and amortization | $ | 262,276 |
| | $ | 260,633 |
|
Impairments
During the year ended December 31, 2016, we recorded impairment losses of $88.3 million. These charges included $23.1 million of impairment on 28 properties that were held for sale, including $10.6 million of impairment on vacant held for sale properties, and $28.2 million on vacant properties that were not classified as held for sale. The impairment losses also include $26.3 million on 9 underperforming properties within the restaurant-casual dining, movie theater, general merchandise, drug store/pharmacy and distribution industries. In addition, during the year ended December 31, 2016, lease intangible write-offs were primarily due to the $6.6 million write-off of below market rent intangible liabilities for one tenant in the restaurant-casual dining industry. During the year ended December 31, 2015, we incurred impairment losses of $55.4 million from 22 vacant or underperforming properties within the education, restaurant-casual dining and sporting goods industries. In addition, 29 properties held for sale during the period incurred impairment losses of $15.0 million. The balance of the impairment loss included an allowance for loan loss on an unsecured note.
The following summarizes our impairment loss from continuing operations:
|
| | | | | | | |
| | Years Ended December 31, |
| (In Thousands) | 2016 | | 2015 |
| Real estate and intangible asset impairment | $ | 80,390 |
| | $ | 68,531 |
|
| Write-off of lease intangibles due to lease terminations, net | 7,683 |
| | 1,666 |
|
| Loans receivable impairment | 176 |
| | 324 |
|
| Total impairments from real estate investment net assets | 88,249 |
| | 70,521 |
|
| Other impairment | 26 |
| | 174 |
|
| Total impairment loss | $ | 88,275 |
| | $ | 70,695 |
|
Gain (loss) on debt extinguishment
During the year ended December 31, 2016, we extinguished $883.0 million of mortgage debt and recognized a gain on debt extinguishment of $0.2 million. The gain was primarily attributable to the extinguishment of four defaulted mortgage loans upon sale of the properties collateralizing these loans to third parties, offset by losses from the prepayment and defeasance fees on 408 properties. During the same period in 2015, we retired $536.6 million in high interest rate CMBS debt with a weighted average interest rate of 5.73%.
Gain on disposition of assets
During the year ended December 31, 2016, we disposed of 213 properties and recorded gains totaling $52.4 million from continuing operations. Included in these amounts are the sales of 14 Shopko properties for a $12.7 million gain, $10.3 million for the sale of one grocery property, a $9.8 million gain on the sale of 30 properties within the restaurant-quick service industry and a $8.8 million gain on the sale of 19 properties with the restaurant-casual dining industry. During 2015, we disposed of 110 properties and recorded gains totaling $68.4 million from continuing operations. These gains are primarily attributable to a $58.7 million gain from the sale of 34 Shopko properties. Additionally, we sold or disposed of 76 other properties, including 31 vacant properties and 5 multi-tenant properties.
Liquidity and Capital Resources
Short-term Liquidity and Capital Resources
On a short-term basis, our principal demands for funds will be for operating expenses, including financing of acquisitions, distributions to stockholders and interest and principal on current and any future debt financings. We expect to fund our operating expenses and other short-term liquidity requirements, capital expenditures, payment of principal and interest on our outstanding indebtedness, property improvements, re-leasing costs and cash distributions to common and preferred stockholders, primarily through cash provided by operating activities and borrowings under the Revolving Credit Facility and Term Loan. Our Revolving Credit Facility and Term Loan increase our capacity to fund acquisitions, while continuing to meet our short-term working capital requirements. As of December 31, 2017, $688.0 million of borrowing capacity was available under the Revolving Credit Facility and $420.0 million was available under the Term Loan.
In November, 2016, the Board of Directors approved a new $500.0 million ATM Program and the Company terminated it's existing program. As of December 31, 2017, no shares had been sold under the new ATM Program.
In February 2016, the Company's Board of Directors approved a stock repurchase program, which authorizes the Company to repurchase up to $200.0 million of its common stock. During the year ended December 31, 2017, 26,337,295 shares of the Company's outstanding common stock were repurchased in open market transactions under this stock repurchase program, at a weighted average price of $7.59 per share, equivalent to the full $200.0 million authorized. Fees associated with the share repurchase of $0.5 million are included in retained earnings.
In August, 2017, our Board of Directors approved a new stock repurchase program, which authorizes us to purchase up to $250.0 million of our common stock in the open market or through private transactions from time to time over the next 18 months. Purchase activity will be dependent on various factors, including our capital position, operating results, funds generated by asset sales, dividends that may be required by those sales, and investment options that may be available, including acquiring new properties or retiring debt. The stock repurchase program does not obligate us to repurchase any specific number of shares and may be suspended at any time at our discretion. We intend to fund any repurchases with the net proceeds from asset sales, cash flows from operations, existing cash on the balance
sheet and other sources. As of December 31, 2017, the Company had repurchased 9,502,670 shares of its outstanding common stock under this new stock repurchase program.
In October, 2017, the Company completed an underwritten public offering of 6,900,000 shares of 6.00% Series A Cumulative Redeemable Preferred Stock, including 900,000 shares sold pursuant to the underwriter's option to purchase additional shares. Gross proceeds raised were approximately $172.5 million; net proceeds were approximately $166.2 million after deducting underwriter discounts and offering costs paid by the Company. The net proceeds from the offering were initially used to reduce outstanding debt and for general operating purposes of the Company.
Long-term Liquidity and Capital Resources
We plan to meet our long-term capital needs, including long-term financing of property acquisitions, by issuing registered debt or equity securities, obtaining asset level financing and occasionally by issuing fixed rate secured or unsecured notes and bonds. We may continue to issue common stock when we believe that our share price is at a level that allows for the proceeds of any offering to be accretively invested into additional properties. In addition, we may issue common stock to permanently finance properties that were financed by our Revolving Credit Facility, Term Loan or other indebtedness. In the future, some of our property acquisitions could be made by issuing partnership interests of our Operating Partnership in exchange for property owned by third parties. These partnership interests would be exchangeable for cash or, at our election, shares of our common stock.
We continually evaluate alternative financing and believe that we can obtain financing on reasonable terms. However, we cannot assure you that we will have access to the capital markets at times and on terms that are acceptable to us. We expect that our primary uses of capital will be for property and other asset acquisitions and the payment of tenant improvements, operating expenses, including debt service payments on any outstanding indebtedness, and distributions to our stockholders.
Description of Certain Debt
Spirit Master Funding Program
The Spirit Master Funding Program is an asset-backed securitization platform in which we raise capital through the issuance of non-recourse net lease mortgage notes collateralized by commercial real estate, net leases and mortgage loans. The Spirit Master Funding Program allows us to issue notes that are secured by the assets of the special purpose entity note issuers that are pledged to the indenture trustee for the benefit of the noteholders and managed by the Operating Partnership as property manager. These Collateral Pools consist primarily of commercial real estate properties, the issuers’ rights in the leases of such properties and commercial mortgage loans secured by commercial real estate properties. In general, monthly rental and mortgage receipts with respect to the leases and mortgage loans are deposited with the indenture trustee who will first utilize these funds to satisfy the debt service requirements on the notes and any fees and costs associated with the administration of the Spirit Master Funding Program including property and asset management fees payable to Spirit. The remaining funds are remitted to the issuers monthly on the note payment date.
In addition, upon satisfaction of certain conditions, the issuers may, from time to time, sell or exchange real estate properties or mortgage loans from the Collateral Pools. Proceeds from the sale of assets within the Collateral Pools are held on deposit by the indenture trustee until a qualifying substitution is made or the amounts are distributed as an early repayment of principal. At December 31, 2017, $85.7 million was held on deposit and classified as restricted cash within deferred costs and other assets, net in our consolidated balance sheet included in this Annual Report on Form 10-K.
The Spirit Master Funding Program consists of two separate securitization trusts that have one or multiple bankruptcy-remote, special purpose entities as issuers of the Master Trust 2013 and Master Trust 2014 notes. Each issuer is an indirect wholly-owned subsidiary of ours. All outstanding series of Master Trust Notes were rated A+ by S&P as of December 31, 2017.
Master Trust 2013
In December 2013, an indirect wholly-owned subsidiary of ours issued $330.0 million aggregate principal amount of net-lease mortgage notes comprised of $125.0 million of 3.89% interest-only notes expected to be repaid in December 2018 and $205.0 million of 5.27% amortizing notes expected to be repaid in December 2023.
Master Trust 2014
In May 2014, we completed our Exchange Offer to exchange the outstanding principal balance of three series of existing net-lease mortgage notes for three series of newly issued Master Trust 2014 notes. The terms of the new notes remain generally similar to the old notes including the interest rate and anticipated final repayment dates; however, the new notes generally amortize more slowly than the old notes and have a legal final payment date that is 17 years later than the old notes (although the anticipated repayment date remains the same). The revisions to Master Trust 2014, in connection with the issuance of the new notes, generally provide the Operating Partnership more administrative flexibility as property manager and special servicer.
In November 2014, the existing issuers under Master Trust 2014 and two additional indirect wholly-owned subsidiaries of ours, collectively as co-issuers, completed the issuance of $510.0 million aggregate principal amount of net-lease mortgage notes comprised of $150.0 million of 3.50% interest-only notes expected to be repaid in January 2020 and $360.0 million of 4.63% amortizing notes (interest-only through November 2017) expected to be repaid in January 2030.
At the time of issuance, the Class A notes represented approximately 70% of the collateral appraised value and are currently rated A+ by S&P. The Class B notes are subordinate to the Class A notes as to principal repayment, represent approximately 5% of the collateral value, and are currently rated BBB by S&P.
In December 2017, the existing issuers under Master Trust 2014, collectively as co-issuers, completed the issuance of $674.4 million aggregate principal amount of net-lease mortgage notes comprised of $542.4 million of 4.36%, Class A, amortizing notes and $132.0 million of 6.35%, Class B, interest-only notes, each class of Notes have an anticipated repayment date in December 2022 and a legal final payment date in December 2047. (Refer to Note 17. Subsequent Events, regarding repricing of the Class B Notes). The Operating Partnership retained $27.1 million in aggregate principal amount of Class A Notes and $6.6 million in aggregate principal amount of Class B Notes to satisfy its regulatory risk retention obligations. In conjunction with the issuance, the Company pre-paid Series 2014-1 Class A1 of the 2014 notes.
The Master Trust Notes are summarized below:
|
| | | | | | | | | | | | |
| | Stated
Rates (1) | | Remaining Term | | December 31,
2017 | | December 31,
2016 |
| | | | (in Years) | | (in Thousands) |
| Series 2014-1 Class A1 | — | % | | 0.0 | | $ | — |
| | $ | 53,919 |
|
| Series 2014-1 Class A2 | 5.4 | % | | 2.5 | | 252,437 |
| | 253,300 |
|
| Series 2014-2 | 5.8 | % | | 3.2 | | 222,683 |
| | 226,283 |
|
| Series 2014-3 | 5.7 | % | | 4.2 | | 311,336 |
| | 311,820 |
|
| Series 2014-4 Class A1 | 3.5 | % | | 2.1 | | 150,000 |
| | 150,000 |
|
Series 2017-1 Class A (2) | 4.4 | % | | 5.0 | | 515,280 |
| | — |
|
Series 2017-1 Class B (2) | 6.4 | % | | 5.0 | | 125,400 |
| | — |
|
| Series 2014-4 Class A2 | 4.6 | % | | 12.1 | | 358,664 |
| | 360,000 |
|
| Total Master Trust 2014 notes | 5.0 | % | | 5.4 | | 1,935,800 |
| | 1,355,322 |
|
| Series 2013-1 Class A | 3.9 | % | | 1.0 | | 125,000 |
| | 125,000 |
|
| Series 2013-2 Class A | 5.3 | % | | 6.0 | | 187,704 |
| | 192,384 |
|
| Total Master Trust 2013 notes | 4.7 | % | | 4.0 | | 312,704 |
| | 317,384 |
|
| Total Master Trust Notes | | | | | 2,248,504 |
| | 1,672,706 |
|
| Debt discount, net | | | | | (36,188 | ) | | (18,787 | ) |
| Deferred financing costs, net | | | | | (24,010 | ) | | (16,376 | ) |
| Total Master Trust Notes, net | | | | | $ | 2,188,306 |
| | $ | 1,637,543 |
|
(1) Represents the individual series stated interest rate as of December 31, 2017 and the weighted average stated rate of the total Master Trust Notes, based on the collective series outstanding principal balances as of December 31, 2017.
(2) The Operating Partnership acquired $27.1 million in aggregate principal amount of Class A Notes and $6.6 million in aggregate principal amount of Class B Notes, which eliminate in consolidation, to satisfy its regulatory risk retention obligations.
As of December 31, 2017, the Master Trust 2014 notes were secured by 815 owned and financed properties issued by 5 indirect wholly-owned subsidiaries of the Corporation. The notes issued under Master Trust 2014 are cross-collateralized by the assets of all issuers within this trust. As of December 31, 2017, the Master Trust 2013 notes were secured by 296 owned and financed properties issued by a single indirect wholly-owned subsidiary of the Corporation.
Convertible Notes
The Convertible Notes are comprised of two series of notes with an aggregate principal amount of $747.5 million at both December 31, 2017 and December 31, 2016. Interest on the Convertible Notes is payable semiannually in arrears on May 15 and November 15 of each year. The 2019 Notes, aggregate principal amount $402.5 million, accrue interest at 2.875% and are scheduled to mature on May 15, 2019. The 2021 Notes, aggregate principal amount $345.0 million, accrue interest at 3.75% and are scheduled to mature on May 15, 2021. As of December 31, 2017, the carrying amount of the Convertible Notes was $715.9 million, which is net of discounts (for the value of the embedded conversion feature) and unamortized deferred financing costs.
Holders may convert notes of either series prior to November 15, 2018, in the case of the 2019 Notes, or November 15, 2020, in the case of the 2021 Notes, only under the following circumstances: (1) if the closing price of our common stock for each of at least 20 trading days (whether or not consecutive) during the last 30 consecutive trading days in the quarter is greater than or equal to 130% of the conversion price for the Convertible Notes; (2) during the five business day period after any 10 consecutive trading day period in which the trading price per $1,000 principal amount of the Convertible Notes for each trading day of the measurement period was less than 98% of the product of the last closing price of our common stock and the conversion rate for the Convertible Notes; (3) if we call any or all of the Convertible Notes for redemption prior to the redemption date; or (4) upon the occurrence of specified corporate events as described in the Convertible Notes prospectus supplement. On or after November 15, 2018, in the case of the 2019 Notes, or November 15, 2020, in the case of the 2021 Notes, until the close of business on the second scheduled trading day immediately preceding the maturity date of the Convertible Notes, holders may convert the Convertible Notes of the applicable series at any time, regardless of the foregoing circumstances. Upon conversion, we will pay or deliver cash, shares of common stock or a combination of cash and shares of common stock, at our election.
The initial conversion rate for the Convertible Notes is 76.3636 shares of common stock per $1,000 principal amount of notes (equivalent to an initial conversion price of approximately $13.10 per share of common stock). The conversion rate for each series of the Convertible Notes is subject to adjustment for some events, including dividends paid in excess of threshold amounts stipulated in the agreement, but will not be adjusted for any accrued and unpaid interest. As of December 31, 2017, the conversion rate was 77.3144 per $1,000 principal note. If we undergo a fundamental change (as defined in the Convertible Notes supplemental indentures), holders may require us to repurchase all or any portion of their notes at a repurchase price equal to 100% of the principal amount of the notes to be repurchased, plusaccrued and unpaid interest.
Revolving Credit Facility
On March 31, 2015, the Company entered into the Credit Agreement, among the Operating Partnership as borrower and the Company as guarantor, that established a new $600.0 million unsecured credit facility and terminated its secured $400.0 million 2013 Credit Facility. The Revolving Credit Facility matures on March 31, 2019 (extendible at the Operating Partnership's option to March 31, 2020, subject to satisfaction of certain requirements) and includes an accordion feature to increase the committed facility size up to $1.0 billion, subject to satisfying certain requirements and obtaining additional lender commitments. On April 27, 2016, the Company expanded the borrowing capacity under the Revolving Credit Facility from $600.0 million to $800.0 million by partially exercising the accordion feature under the terms of the Credit Agreement. The Revolving Credit Facility also includes a 50.0 million sub-limit for swing-line loans and up to $60.0 million available for issuance of letters of credit. Swing-line loans and letters of credit reduce availability under the Revolving Credit Facility on a dollar-for-dollar basis. On November 3, 2015, the Company entered into a first amendment to the Credit Agreement. The amendment conforms certain of the terms and covenants to those in the Term Loan Agreement, including limiting the requirement of subsidiary guaranties to material subsidiaries (as defined in the Credit Agreement) meeting certain conditions. At December 31, 2017, there were no subsidiaries meeting this requirement.
The Revolving Credit Facility bears interest at a rate equal to LIBOR plus 0.875% to 1.55% per annum or a specified base rate plus 0.0% to 0.55% and requires a facility fee in an amount equal to the aggregate revolving credit commitments (whether or not utilized) multiplied by a rate equal to 0.125% to 0.30% per annum, in each case depending
on the Corporation's credit rating. As of December 31, 2017, the Revolving Credit Facility bore interest at LIBOR plus 1.25% based on the Company's credit rating and incurred a facility fee of 0.25% per annum.
The Operating Partnership may voluntarily prepay the Revolving Credit Facility, in whole or in part, at any time, without premium or penalty, but subject to applicable LIBOR breakage fees, if any. Payment of the Revolving Credit Facility is unconditionally guaranteed by the Corporation and material subsidiaries that meet certain conditions (as defined in the Credit Agreement). As of December 31, 2017, there were no subsidiaries that met this requirement.
As of December 31, 2017, $112.0 million in borrowings were outstanding and $688.0 million of borrowing capacity was available under the Revolving Credit Facility. Amounts available for borrowing under the Revolving Credit Facility remain subject to compliance with certain customary restrictive covenants including:
Maximum leverage ratio (defined as consolidated total indebtedness plus the Corporation’s pro rata share of indebtedness of unconsolidated affiliates, net of certain cash and cash equivalents, to total asset value) of 0.60:1.00, which may be increased to 0.65:1.00 for four consecutive quarters after certain material acquisitions;
Minimum fixed charge coverage ratio (defined as EBITDA plus the Corporation’s pro rata share of EBITDA of unconsolidated affiliates, to fixed charges) of 1.50:1.00;
Maximum secured indebtedness leverage ratio (defined as consolidated secured indebtedness plus the Corporation’s pro rata share of secured indebtedness of unconsolidated affiliates, net of certain cash and cash equivalents, to total asset value) of 0.50:1:00;
Minimum unsecured interest coverage ratio (defined as consolidated net operating income from unencumbered properties, to unsecured interest expense) of 1.75:1.00;
Maximum unencumbered leverage ratio (defined as consolidated unsecured indebtedness plus the Corporation’s pro rata share of unsecured indebtedness of unconsolidated affiliates, net of certain cash and cash equivalents, to total unencumbered asset value) of 0.60:1:00, which may be increased to 0.65:1.00 for four consecutive quarters after certain material acquisitions; and
Minimum tangible net worth of at least $3.01 billion plus 75% of the net proceeds of equity issuances by the Corporation or the Operating Partnership after December 31, 2014.
In addition to these covenants, the Credit Agreement also includes other customary affirmative and negative covenants, such as (i) limitation on liens and negative pledges; (ii) transactions with affiliates; (iii) limitation on mergers, consolidations and sales of all or substantially all assets; (iv) maintenance of status as a REIT and listing on any national securities exchange; and (v) material modifications to organizational documents.
As of December 31, 2017, the Corporation and the Operating Partnership were in compliance with these covenants.
Term Loan
On November 3, 2015, we entered into a Term Loan Agreement among the Operating Partnership as borrower, the Corporation as guarantor and the lenders that are parties thereto. The Term Loan Agreement provides for a $325.0 million senior unsecured term facility that has an initial maturity date of November 2, 2018, which may be extended at our option pursuant to two one-year extension options, subject to the satisfaction of certain conditions and payment of an extension fee. In addition, an accordion feature allows the facility to be increased to up to $600.0 million, subject to obtaining additional lender commitments. In December 2015, upon obtaining additional lender commitments, we increased the term facility from $325.0 million to $370.0 million. On December 19, 2016, we increased the term facility from $370.0 million to $420.0 million.
The Term Loan Agreement provides that borrowings bear interest at either LIBOR plus 1.35% to 1.80% per annum or a specified base rate plus 0.35% to 0.80% per annum, at the Operating Partnership's election. In each case, the applicable margin is determined based upon the Corporation’s leverage ratio. If the Corporation obtains at least two credit ratings on its senior unsecured long-term indebtedness of BBB- from S&P or Fitch, Inc. or Baa3 from Moody's, the Operating Partnership may make an irrevocable election to have the margin based upon the Corporation's credit ratings. In April 2016, the Corporation received a first time rating of BBB- from Fitch and was upgraded to a BBB- corporate issuer rating by S&P. As a result, the Operating Partnership elected to change the interest rate grid from leverage based pricing to credit rating based pricing in the second quarter of 2016. Under credit rating based pricing, borrowings will bear interest at either LIBOR plus 0.90% to 1.75% per annum or a specified base rate plus 0.0% to 0.75% per annum, in each case depending on the Corporation’s credit ratings. As of December 31, 2017, the Term Loan bore interest at LIBOR plus 1.35% based on our credit rating.
The Operating Partnership may voluntarily prepay the Term Loan, in whole or in part, at any time, without premium or penalty, but subject to applicable LIBOR breakage fees. Amounts prepaid may be subsequently re-borrowed within 30 days. Payment of the Term Loan is unconditionally guaranteed by the Corporation and, under certain circumstances, by one or more material subsidiaries (as defined in the Term Loan Agreement) of the Corporation. The obligations of the Operating Partnership and any guarantor under the Term Loan are full recourse to the Corporation and each guarantor.
As of December 31, 2017, the Term Loan provided $420.0 million of borrowing capacity. Amounts available for borrowing under the Term Loan remain subject to compliance with certain customary restrictive covenants including:
Maximum leverage ratio (defined as consolidated total indebtedness plus the Corporation’s pro rata share of indebtedness of unconsolidated affiliates, net of certain cash and cash equivalents, to total asset value) of 0.60:1.00, which may be increased to 0.65:1.00 for four consecutive quarters after certain material acquisitions;
Minimum fixed charge coverage ratio (defined as consolidated EBITDA plus the Corporation’s pro rata share of EBITDA of unconsolidated affiliates to fixed charges) of 1.50:1.00;
Maximum secured indebtedness leverage ratio (defined as consolidated secured indebtedness plus the Corporation’s pro rata share of secured indebtedness of unconsolidated affiliates, net of certain cash and cash equivalents to total asset value) of 0.50:1:00;
Minimum unsecured interest coverage ratio (defined as consolidated net operating income from unencumbered properties to unsecured interest expense) of 1.75:1.00;
Maximum unencumbered leverage ratio (defined as consolidated unsecured indebtedness plus the Corporation’s pro rata share of unsecured indebtedness of unconsolidated affiliates, net of certain cash and cash equivalents, to total unencumbered asset value) of 0.60:1:00, which may be increased to 0.65:1.00 for four consecutive quarters after certain material acquisitions; and
Minimum tangible net worth of at least $3.01 billion plus 75% of the net proceeds of equity issuances by the Corporation or the Operating Partnership after December 31, 2014.
In addition, the Term Loan Agreement includes other customary affirmative and negative covenants, including (i) limitation on liens and negative pledges; (ii) transactions with affiliates; (iii) limitation on mergers, consolidations and sales of all or substantially all assets; (iv) maintenance of status as a REIT and listing on a national securities exchange; and (v) material modifications to organizational documents. The ability to borrow under the Term Loan Agreement is subject to continued compliance with all of the covenants described above.
As of December 31, 2017, the Corporation and the Operating Partnership were in compliance with these financial covenants.
Senior Unsecured Notes
On August 18, 2016, the Operating Partnership completed a private placement of $300.0 million aggregate principal amount senior notes through a Rule 144A offering with registration rights, which are guaranteed by the Corporation. The Senior Unsecured Notes were issued at 99.378% of their principal amount, resulting in net proceeds of $296.2 million after deducting transaction fees and expenses. The Senior Unsecured Notes accrue interest at a rate of 4.450% per year, payable on March 15 and September 15 of each year, until the maturity date of September 15, 2026. The Company filed a registration statement with the SEC to exchange the private Senior Unsecured Notes for registered Senior Unsecured Notes with substantially identical terms, which became effective April 14, 2017. All $300.0 million aggregate principal amount of private Senior Unsecured Notes were tendered in the exchange for registered Senior Unsecured Notes.
The Senior Unsecured Notes are redeemable in whole at any time or in part from time to time, at the Operating Partnership’s option, at a redemption price equal to the sum of: an amount equal to 100% of the principal amount of the Senior Unsecured Notes to be redeemed plus accrued and unpaid interest and liquidated damages, if any, up to, but not including, the redemption date; and a make-whole premium calculated in accordance with the indenture. Notwithstanding the foregoing, if any of the Senior Unsecured Notes are redeemed on or after June 15, 2026 (three months prior to the maturity date of the Senior Unsecured Notes), the redemption price will not include a make-whole premium.
In connection with the issuance of the Senior Unsecured Notes, the Corporation and Operating Partnership's first amendedPartnership remain subject to compliance with certain customary restrictive covenants including:
Maximum leverage ratio (defined as consolidated total indebtedness, to total consolidated undepreciated real estate assets plus the Company’s other assets, excluding accounts receivable and restated agreementnon-real estate intangibles) of limited partnership, which management determined0.60:1.00;
Minimum unencumbered asset coverage ratio (defined as total consolidated undepreciated real estate assets plus the Company’s other assets, excluding accounts receivable and non-real estate intangibles, to beconsolidated total unsecured indebtedness) of 1.50:1:00;
Maximum secured indebtedness leverage ratio (defined as consolidated total secured indebtedness, to total consolidated undepreciated real estate assets plus the Company’s other assets, excluding accounts receivable and non-real estate intangibles) of 0.40:1.00; and
Minimum fixed charge coverage ratio (defined as consolidated income available for debt service, to the annual service charge) of 1.50:1.0.
In addition, the Senior Unsecured Notes Agreement includes other customary affirmative and negative covenants, including (i) maintenance of status as a reasonable methodREIT; (ii) payment of allocation. Therefore, expenses incurred would not be materially different ifall taxes, assessments and governmental charges levied on the REIT; (iii) reporting on financial information; and (iv) maintenance of properties and property insurance.
As of December 31, 2017, the Corporation and the Operating Partnership had operated as an unaffiliated entity.were in compliance with these financial covenants.
The Company has formed numerousCMBS
We may use long-term, fixed-rate debt to finance our properties. In such events, we generally seek to use asset level financing that bears annual interest less than the annual rent on the related lease(s) and that matures prior to the expiration of such lease(s). In general, the obligor of our asset level debt is a special purpose entities to acquire and holdentity that holds the real estate encumbered by indebtedness (see Note 4).and other collateral securing the indebtedness. Each special purpose entity is a bankruptcy remote separate legal entity, and is the sole owner of its assets and solely responsible for its liabilities. liabilities other than typical non-recurring covenants.
As of December 31, 2017, we had 12 loans with approximately $332.6 million of outstanding principal balances under our fixed rate CMBS loans, with a weighted average contractual interest rate of 5.81% and a weighted average maturity of 4.6 years. Approximately one-third of this debt is partially amortizing and requires a balloon payment at maturity. These balances include six separate fixed-rate CMBS loans that are in default due to the underperformance of the eight properties that secure them. As of December 31, 2017, the aggregate principal balance under the defaulted CMBS loans was $64.3 million, including $13.2 million of default interest added to principal, and is discussed further below. Excluding these six loans, the outstanding principal obligations under our CMBS fixed-rate loans as of December 31, 2017 was $268.3 million.
The assetstable below shows the outstanding principal obligations, including amortization, of these CMBS fixed rate loans as of December 31, 2017 and the year in which the loans mature (dollars in thousands). The information displayed in the table excludes amounts and interest rates related to the defaulted loans and the eight properties securing them.
|
| | | | | | | | | | | | | | | | | | | | | | |
| Year of Maturity | Number of Loans | | Number of Properties | | Stated Interest Rate Range | | Weighted Average Stated Rate | | Scheduled Principal | | Balloon | | Total |
| | | | | | | | | | | | | | |
| 2018 | — |
| | — |
| | 0 | | — | % | | $ | 3,692 |
| | $ | — |
| | $ | 3,692 |
|
| 2019 | — |
| | — |
| | — | | — |
| | 3,905 |
| | — |
| | 3,905 |
|
| 2020 | — |
| | — |
| | — | | — |
| | 4,100 |
| | — |
| | 4,100 |
|
| 2021 | — |
| | — |
| | — | | — |
| | 4,365 |
| | — |
| | 4,365 |
|
| 2022 | 1 |
| | 12 |
| | 4.67% | | 4.67 |
| | 4,617 |
| | 42,400 |
| | 47,017 |
|
| Thereafter | 5 |
| | 88 |
| | 5.23%-6.00% | | 5.48 |
| | 7,276 |
| | 197,980 |
| | 205,256 |
|
| Total | 6 |
| | 100 |
| | | | 5.35 | % | | $ | 27,955 |
| | $ | 240,380 |
| | $ | 268,335 |
|
CMBS Liquidity Matters
As of December 31, 2017, we are in default on six separate CMBS loans due to the underperformance of the properties securing these loans. The wholly-owned special purpose entities subject to these mortgage loans are separate legal entities and the sole owner of their assets and responsible for their liabilities. The aggregate outstanding principal balance of these loans, including capitalized interest, totaled $64.3 million. We believe the value of these properties is less than the related debt. As a result, we have notified the lenders of each special purpose entity that we anticipate either surrendering these properties to the lenders or selling them in certain instances in exchange for relieving the indebtedness, including any accrued interest and accrued or unpaid property expenses, encumbering them.
The following table provides key elements of the defaulted mortgage loans (dollars in thousands):
|
| | | | | | | | | | | | | | | | | | | | | | | | | | | | | | | | | | | |
| Industry | Properties | | Net Book Value | | Monthly Base Rent | | Pre-Default Outstanding Principal | | Capitalized Interest (1) | | Total Debt Outstanding | | Restricted Cash (2) | | Stated Rate | | Default Rate | | Accrued Interest (1) |
| | | | | | | | | | | | | | | | | | | | |
| Manufacturing | 2 | | $ | 3,618 |
| | $ | 16 |
| | $ | 5,460 |
| | $ | 11,354 |
| | $ | 16,814 |
| | $ | — |
| | 5.85 | % | | 9.85 | % | | $ | 143 |
|
| Sporting Goods | 1 | | 3,070 |
| | — |
| | 6,321 |
| | 429 |
| | 6,750 |
| | 453 |
| | 5.62 |
| | 10.62 |
| | 80 |
|
| Consumer Electronics | 1 | | 3,021 |
| | — |
| | 8,592 |
| | 592 |
| | 9,184 |
| | 286 |
| | 5.87 |
| | 9.87 |
| | 62 |
|
| Multi-Tenant Retail | 1 | | 12,580 |
| | 95 |
| | 17,250 |
| | 398 |
| | 17,648 |
| | 575 |
| | 5.53 |
| | 7.53 |
| | 78 |
|
| Sporting Goods | 2 | | 3,457 |
| | — |
| | 9,625 |
| | 310 |
| | 9,935 |
| | — |
| | 4.39 |
| | 9.39 |
| | 78 |
|
| Sporting Goods | 1 | | 2,010 |
| | — |
| | 3,853 |
| | 128 |
| | 3,981 |
| | 169 |
| | 4.65 |
| | 9.65 |
| | 33 |
|
| 8 | | $ | 27,756 |
| | $ | 111 |
| | $ | 51,101 |
| | $ | 13,211 |
| | $ | 64,312 |
| | $ | 1,483 |
| | 5.44 | % | | 9.21 | % | | $ | 474 |
|
(1) Interest capitalized to principal that remains unpaid.
(2) Represents restricted cash controlled by the lender that may be applied to reduce the outstanding principal balance.
Debt Maturities
Future principal payments due on our various types of debt outstanding as of December 31, 2017 (in thousands):
|
| | | | | | | | | | | | | | | | | | | | | | | | | | | |
| | Total | | 2018 | | 2019 | | 2020 | | 2021 | | 2022 | | Thereafter |
| | | | | | | | | | | | | | |
| Revolving Credit Facility | 112,000 |
| | — |
| | 112,000 |
| | — |
| | — |
| | — |
| | — |
|
| Master Trust Notes | 2,248,504 |
| | 163,185 |
| | 40,230 |
| | 410,713 |
| | 237,790 |
| | 969,020 |
| | 427,566 |
|
CMBS - fixed-rate (1) | 332,647 |
| | 68,004 |
| | 3,905 |
| | 4,100 |
| | 4,365 |
| | 47,017 |
| | 205,256 |
|
| Convertible Notes | 747,500 |
| | — |
| | 402,500 |
| | — |
| | 345,000 |
| | — |
| | — |
|
| Unsecured Senior Notes | 300,000 |
| | — |
| | — |
| | — |
| | — |
| | — |
| | 300,000 |
|
| | $ | 3,740,651 |
| | $ | 231,189 |
| | $ | 558,635 |
| | $ | 414,813 |
| | $ | 587,155 |
| | $ | 1,016,037 |
| | $ | 932,822 |
|
(1) The CMBS - fixed-rate payment balance in 2018 includes $64.3 million, including $13.2 million of capitalized interest, for the acceleration of principal payable following an event of default under 6 separate CMBS loans with stated maturities in 2018.
Contractual Obligations
The following table provides information with respect to our commitments as well as potential acquisitions under contract as of December 31, 2017, the table does not reflect available debt extensions (in thousands):
|
| | | | | | | | | | | | | | | | | | | | |
| | | Payment due by period |
| | | | | | | | | | | More than |
| | | | | Less than 1 | | 1-3 years | | 3-5 years | | 5 years |
| Contractual Obligations | | Total | | Year (2018) | | (2019-2020) | | (2021-2022) | | (after 2022) |
| | | | | | | | | | | |
| Debt - Principal | | $ | 3,740,651 |
| | $ | 231,189 |
| | $ | 973,448 |
| | $ | 1,603,192 |
| | $ | 932,822 |
|
Debt - Interest (1) (3) | | 795,950 |
| | 170,252 |
| | 288,219 |
| | 192,452 |
| | 145,027 |
|
Acquisitions Under Contract (2) | | 29,281 |
| | 29,281 |
| | — |
| | — |
| | — |
|
| Capital Improvements | | 34,128 |
| | 30,203 |
| | 2,525 |
| | 1,400 |
| | — |
|
| Operating Lease Obligations | | 43,842 |
| | 3,157 |
| | 6,356 |
| | 6,312 |
| | 28,017 |
|
| Total | | $ | 4,643,852 |
| | $ | 464,082 |
| | $ | 1,270,548 |
| | $ | 1,803,356 |
| | $ | 1,105,866 |
|
(1) Excludes interest on defaulted mortgage loans.
(2) Contracts contain standard cancellation clauses contingent on results of due diligence.
(3) Debt - Interest has been calculated based on outstanding balances as of December 31, 2017 through their respective maturity dates and excludes unamortized non-cash deferred financing costs of $39.6 million, unamortized debt discount of $61.4 million and any interest due on defaulted mortgage loans, including $0.5 million accrued as of December 31, 2017.
Distribution Policy
Distributions from our current or accumulated earnings are generally classified as ordinary income, whereas distributions in excess of our current and accumulated earnings, to the extent of a stockholder’s federal income tax basis in our common stock, are generally classified as a return of capital. Under the 2017 Tax Legislation, U.S. stockholders that are individuals, trusts and estates generally may deduct up to 20% of the ordinary dividends (e.g., dividends not designated as capital gain dividends or qualified dividend income) received from a REIT for taxable years beginning after December 31, 2017 and before January 1, 2026. Distributions in excess of a stockholder’s federal income tax basis in our common stock are generally characterized as capital gain.
We are required to distribute 90% of our taxable income (subject to certain adjustments and excluding net capital gain) on an annual basis to maintain qualification as a REIT for federal income tax purposes and are required to pay or otherwise satisfy obligationsfederal income tax at regular corporate rates to the creditorsextent we distribute less than 100% of our taxable income (including capital gains).
We intend to make distributions that will enable us to meet the distribution requirements applicable to REITs and to eliminate or minimize our obligation to pay corporate-level federal income and excise taxes.
Any distributions will be at the sole discretion of our Board of Directors, and their form, timing and amount, if any, affiliate or ownerwill depend upon a number of another entity unlessfactors, including our actual and projected results of operations, FFO, liquidity, cash flows and financial condition, the special purpose entities have expressly agreedrevenue we actually receive from our properties, our operating expenses, our debt service requirements, our capital expenditures, prohibitions and other limitations under our financing arrangements, our REIT taxable income, the annual REIT distribution requirements, applicable law and such other factors as our Board of Directors deems relevant.
Cash Flows
Comparison of Years Ended December 31, 2017 and 2016
The following table presents a summary of our cash flows for the years ended December 31, 2017 and 2016 (in thousands):
|
| | | | | | | | | | | |
| | Years Ended |
| | December 31, |
| | 2017 | | 2016 | | Change |
| Net cash provided by operating activities | $ | 386,393 |
| | $ | 361,409 |
| | $ | 24,984 |
|
| Net cash provided by (used in) investing activities | 82,942 |
| | (117,251 | ) | | 200,193 |
|
| Net cash used in financing activities | (470,596 | ) | | (255,889 | ) | | (214,707 | ) |
| Net (decrease) increase in cash and cash equivalents | $ | (1,261 | ) | | $ | (11,731 | ) | | $ | 10,470 |
|
As of December 31, 2017, we had $8.8 million of unrestricted cash and cash equivalents as compared to $10.1 million as of December 31, 2016.
Operating Activities
Our cash flows from operating activities are permittedprimarily dependent upon the occupancy level of our portfolio, the rental rates specified in our leases, the collectability of rent and the level of our operating expenses and other general and administrative costs.
The increase in net cash provided by operating activities was primarily attributable to a decrease in costs associated with debt extinguishment of $22.9 million due to a lower volume of mortgage debt being extinguished, a decrease in cash paid for interest of $18.4 million related to the lower level of outstanding mortgage debt, and reduced restructuring charge payments of $11.3 million as restructuring activities were finalized in 2016, offset by a decrease in cash revenue of $19.1 million and increases in property costs of $5.8 million related to reimbursable and non-reimbursable property taxes, and G&A costs of $3.6 million.
The decrease in revenue was primarily attributable to the disposition of 192 properties, representing a gross investment in real estate during the year ended December 31, 2017 of $510.9 million, partially offset by the acquisition of 39 properties, during the same period, with a real estate investment value totaling $323.0 million.
Investing Activities
Cash provided by (used in) investing activities is generally used to fund property acquisitions, for investments in loans receivable and, to a limited extent, for capital expenditures. Cash provided by investing activities generally relates to the disposition of real estate and other assets.
Net cash provided by investing activities during 2017 included cash proceeds of $472.5 million from the disposition of 192 properties, offset by $279.9 million to fund the acquisition of 39 properties and capitalized real estate expenditures of $46.1 million and the transfer of sales proceeds to restricted cash accounts of $71.3 million . Net cash provided by investing activities also included collections of principal on loans receivable and real estate assets under their governing documents. direct financing leases totaling $12.8 million and the investment in notes receivable of $5.0 million.
During the same period in 2016, net cash used in investing activities included $655.8 million to fund the acquisition of 269 properties and capitalized real estate expenditures of $27.1 million partially offset by cash proceeds of $524.8 million from the disposition of 213 properties. Net cash used in investing activities also included collections of principal on loans receivable and real estate assets under direct financing leases totaling $8.4 million, offset by the release of sales proceeds from restricted cash accounts of $2.3 million.
Financing Activities
Generally, our net cash used in financing activities is impacted by our common and preferred stock offerings and activity, including repurchases of our common stock under our Stock Repurchase Program, borrowings under our Revolving Credit Facilities and Term Loan, and issuances of net-lease mortgage notes under our Spirit Master Funding Program.
Net cash used in financing activities during 2017 was primarily attributable to the repayment of the $420.0 million Term Loan, the payment of dividends to common and preferred equity owners of $341.7 million, the repurchase of 35,839,965 shares of the Company's outstanding common stock for $286.6 million and repayments of $221.3 million in mortgages and notes payable, offset by the issuance of 6.9 million shares of Class A Preferred Stock for net proceeds of $166.2 million, and debt issuances under our Spirit Master Funding Program of $618.6 million.
Net cash used in financing activities during 2016 was primarily attributable to the repayment of our indebtedness of $863.8 million and the payment of dividends to equity owners of $323.6 million, both of which were primarily funded from our operating cash flows, net borrowings under our Revolving Credit Facility and Term Loan of $86.0 million and $95.0 million, respectively, net proceeds of $298.1 million from the issuance of $300.0 million aggregate principal Senior Unsecured Notes and the sale of an aggregate 40.8 million shares of our common stock in an underwritten public offering and under our ATM Program, generating net proceeds of $368.9 million and $77.7 million, respectively.
Comparison of Years Ended December 31, 2016 and 2015
The following table presents a summary of our cash flows for the years ended December 31, 2016 and 2015 (in thousands):
|
| | | | | | | | | | | |
| | Years Ended |
| | December 31, |
| | 2016 | | 2015 | | Change |
| Net cash provided by operating activities | $ | 361,409 |
| | $ | 371,986 |
| | $ | (10,577 | ) |
| Net cash used in investing activities | (117,251 | ) | | (385,696 | ) | | 268,445 |
|
| Net cash provided by financing activities | (255,889 | ) | | (140,681 | ) | | (115,208 | ) |
| Net increase (decrease) in cash and cash equivalents | $ | (11,731 | ) | | $ | (154,391 | ) | | $ | 142,660 |
|
As of December 31, 2016, we had $10.1 million of cash and cash equivalents as compared to $21.8 million as of December 31, 2015.
Operating Activities
Our cash flows from operating activities are primarily dependent upon the occupancy level of our portfolio, the rental rates specified in our leases, the collectability of rent and the level of our operating expenses and other general and administrative costs.
The decrease in net cash provided by operating activities was primarily attributable to an increase in debt extinguishment costs of $18.1 million, restructuring charge payments of $10.2 million, G&A costs of $6.9 million, payments to terminate interest rate swap agreements of $1.7 million and net changes in operating assets and liabilities of $7.2 million, partially offset by an increase in cash revenue of $12.9 million and a decrease in cash paid for interest of $27.4 million.
The increase in revenue was primarily attributable to the acquisition of 269 properties, representing a gross investment in real estate during the year ended December 31, 2016 totaling $704.9 million partially offset by the disposition of 213 properties during the same period with a real estate investment value of $598.7 million.
Investing Activities
Cash used in investing activities is generally used to fund property acquisitions, for investments in loans receivable and, to a limited extent, for capital expenditures. Cash provided by investing activities generally relates to the disposition of real estate and other assets.
Net cash used in investing activities during 2016 included $655.8 million to fund the acquisition of 269 properties and capitalized real estate expenditures of $27.1 million partially offset by cash proceeds of $524.8 million from the disposition of 213 properties. Net cash used in investing activities also included collections of principal on loans receivable and real estate assets under direct financing leases totaling $8.4 million, offset by the release of sales proceeds from restricted cash accounts of $2.3 million.
During the same period in 2015, net cash used in investing activities included $876.0 million to fund the acquisition of 232 properties and capitalized real estate expenditures of $10.3 million partially offset by cash proceeds of $496.6 million from the disposition of 110 properties. Net cash used in investing activities also included investment in loans
receivable of $4.0 million, partially offset by the release of sales proceeds from restricted cash accounts of $41.0 million and collections of principal on loans receivable and real estate assets under direct financing leases totaling $2.95 billion$6.8 million.
Financing Activities
Generally, our net cash (used in) provided by financing activities is impacted by our net borrowings and $4.57 billion,common stock offerings, including sales of our common stock under our ATM Program, common stock offerings, borrowings under our Revolving Credit Facilities and Term Loan, and issuances of net-lease mortgage notes under our Spirit Master Funding Program.
Net cash used in financing activities during 2016 was primarily attributable to the repayment of our indebtedness of $863.8 million and the payment of dividends to equity owners of $323.6 million, both of which were primarily funded from our operating cash flows, net borrowings under our Revolving Credit Facility and Term Loan of $86.0 million and $95.0 million, respectively, net proceeds of $298.1 million from the issuance of $300.0 million aggregate principal Senior Unsecured Notes and the sale of an aggregate 40.8 million shares of our common stock in an underwritten public offering and under our ATM Program, generating net proceeds of $368.9 million and $77.7 million, respectively.
Net cash used in financing activities during 2015 was primarily attributable to the repayment of our indebtedness of $512.5 million, the payment of dividends to equity owners of $292.3 million, both of which were held,paid primarily through sources from our operating cash flows, and net liabilities totaling $2.26repayments under our Revolving Credit Facilities of $15.2 million. These amounts were partially offset by the issuance and sale of 23.0 million shares of our common stock in an underwritten public offering and the sale of 6.6 million shares of our common stock under our ATM Program for aggregate net proceeds of $347.2 million and borrowings under our Term Loan of $325.0 million.
Item 7A. Quantitative and Qualitative Disclosures About Market Risk
We are exposed to financial market risks, especially interest rate risk. Interest rates and other factors, such as occupancy, rental rates and the financial condition of our tenants, influence our performance more so than does inflation. Changes in interest rates do not necessarily correlate with inflation rates or changes in inflation rates. As described above, we generally offer leases that provide for payments of base rent with scheduled increases and, to a lesser extent, contingent rent based on a percentage of the tenant’s gross sales to help mitigate the effect of inflation. Because the properties in our portfolio are generally leased to tenants under triple-net leases, our exposure to rising property operating costs due to inflation is mitigated.
Interest rates are highly sensitive to many factors, including governmental monetary policies and domestic and global economic and political conditions, which are beyond our control. Our operating results depend heavily on the difference between the revenue from our assets and the interest expense incurred on our borrowings. We may incur additional variable rate debt in the future, including amounts that we may borrow under our Revolving Credit Facility and Term Loan. In addition, decreases in interest rates may lead to additional competition for the acquisition of real estate due to a reduction in desirable alternative income-producing investments, which may lead to a decrease in the yields on real estate we have targeted for acquisition. In such circumstances, if we are not able to offset the decrease in yields by obtaining lower interest costs on our borrowings, our results of operations will be adversely affected. Significant increases in interest rates may also have an adverse impact on our earnings if we are unable to acquire real estate with rental rates high enough to offset the increase in interest rates on our borrowings.
In the event interest rates rise significantly or there is an economic downturn, defaults may increase and result in credit losses, which may adversely affect our liquidity and operating results. In a decreasing interest rate environment, borrowers are generally more likely to prepay their loans in order to obtain financing at lower interest rates. However, the vast majority of our mortgage notes payable have prepayment clauses that make refinancing during a decreasing interest rate environment uneconomical. Investments in our mortgage loans receivable, however, have significant prepayment protection in the form of yield maintenance provisions, which provide us with substantial yield protection in a decreasing interest rate environment with respect to this portion of our investment portfolio.
The objective of our interest rate risk management policy is to match fund fixed-rate assets with fixed-rate liabilities. As of December 31, 2017, our assets were primarily long-term, fixed-rate leases (though most have scheduled rental increases during the terms of the leases). As of December 31, 2017, $3.6 billion of our indebtedness was fixed-rate, consisting of our Master Trust Notes, fixed-rate CMBS loans, Senior Unsecured Notes and $3.19 billion, respectively, were owedConvertible Notes, with a weighted average stated interest rate of 4.67%, excluding amortization of deferred financing costs and debt discounts/premiums. As of December 31, 2017, $112.0 million of our indebtedness was variable-rate, consisting of our Revolving Credit Facility, with a weighted average stated interest rate of 2.74%, excluding amortization of deferred financing
costs and debt discounts/premiums. If one-month LIBOR as of December 31, 2017 increased by these encumbered special purpose entities12.5 basis points, or 0.125%, the resulting increase in annual interest expense with respect to the $112.0 million outstanding under the variable-rate obligations would impact our future earnings and cash flows by $140.0 thousand.
The estimated fair values of our debt instruments have been derived based on market quotes for comparable instruments or discounted cash flow analysis using estimates of the amount and timing of future cash flows, market rates and credit spreads. The debt instrument balances as of December 31, 2017 are as follows (in thousands):
|
| | | | | | | |
| | Carrying
Value | | Estimated
Fair Value |
| | | | |
| Revolving Credit Facility | $ | 112,000 |
| | $ | 111,997 |
|
Term Loan, net (1) | — |
| | — |
|
Senior Unsecured Notes, net (1) | 295,321 |
| | 299,049 |
|
Mortgages and notes payable, net (1) | 2,516,478 |
| | 2,657,599 |
|
Convertible Notes, net (1) | 715,881 |
| | 761,440 |
|
(1) The carrying value of the debt instruments are net of unamortized deferred financing costs and certain debt discounts/premiums.
Item 8. Financial Statements and Supplementary Data
INDEX TO CONSOLIDATED FINANCIAL STATEMENTS
|
| |
| Item 8. Financial Statements and Supplemental Data | |
| Reports of Independent Registered Public Accounting Firms | |
| Consolidated Balance Sheets of Spirit Realty Capital, Inc. as of December 31, 2017 and 2016 | |
| Consolidated Statements of Operations of Spirit Realty Capital, Inc. for the Years Ended December 31, 2017, 2016 and 2015 | |
| Consolidated Statements of Comprehensive Income of Spirit Realty Capital, Inc. for the Years Ended December 31, 2017, 2016 and 2015 | |
| Consolidated Statements of Stockholders' Equity of Spirit Realty Capital, Inc. for the Years Ended December 31, 2017, 2016 and 2015 | |
| Consolidated Statements of Cash Flows of Spirit Realty Capital, Inc. for the Years Ended December 31, 2017, 2016 and 2015 | |
| Consolidated Balance Sheets of Spirit Realty, L.P. as of December 31, 2017 and 2016 | |
| Consolidated Statements of Operations of Spirit Realty, L.P. for the Years Ended December 31, 2017, 2016 and 2015 | |
| Consolidated Statements of Comprehensive Income of Spirit Realty, L.P. for the Years Ended December 31, 2017, 2016 and 2015 | |
| Consolidated Statements of Partners' Capital of Spirit Realty, L.P. for the Years Ended December 31, 2017, 2016 and 2015 | |
| Consolidated Statements of Cash Flows of Spirit Realty, L.P. for the Years Ended December 31, 2017, 2016 and 2015 | |
| Notes to Consolidated Financial Statements | |
Report of Independent Registered Public Accounting Firm
To the Stockholders and the Board of Directors of
Spirit Realty Capital, Inc.
Opinion on Internal Control over Financial Reporting
We have audited Spirit Realty Capital, Inc.’s internal control over financial reporting as of December 31, 2017, based on criteria established in Internal Control-Integrated Framework issued by the Committee of Sponsoring Organizations of the Treadway Commission (2013 framework) (the COSO criteria). In our opinion, Spirit Realty Capital, Inc. (the Company) maintained, in all material respects, effective internal control over financial reporting as of December 31, 2017, based on the COSO criteria.
We also have audited, in accordance with the standards of the Public Company Accounting Oversight Board (United States) (PCAOB), the 2017 consolidated financial statements of the Company and our report dated February 22, 2018 expressed an unqualified opinion thereon.
Basis for Opinion
The Company’s management is responsible for maintaining effective internal control over financial reporting and for its assessment of the effectiveness of internal control over financial reporting included in the accompanying consolidated balance sheets.Management’s Report on Internal Control over Financial Reporting. Our responsibility is to express an opinion on the Company’s internal control over financial reporting based on our audit. We are a public accounting firm registered with the PCAOB and are required to be independent with respect to the Company in accordance with the U.S. federal securities laws and the applicable rules and regulations of the Securities and Exchange Commission and the PCAOB.
UseWe conducted our audit in accordance with the standards of Estimatesthe PCAOB. Those standards require that we plan and perform the audit to obtain reasonable assurance about whether effective internal control over financial reporting was maintained in all material respects.
TheOur audit included obtaining an understanding of internal control over financial reporting, assessing the risk that a material weakness exists, testing and evaluating the design and operating effectiveness of internal control based on the assessed risk, and performing such other procedures as we considered necessary in the circumstances. We believe that our audit provides a reasonable basis for our opinion.
Definition and Limitations of Internal Control Over Financial Reporting
A company’s internal control over financial reporting is a process designed to provide reasonable assurance regarding the reliability of financial reporting and the preparation of financial statements for external purposes in accordance with generally accepted accounting principles. A company’s internal control over financial reporting includes those policies and procedures that (1) pertain to the maintenance of records that, in reasonable detail, accurately and fairly reflect the transactions and dispositions of the assets of the company; (2) provide reasonable assurance that transactions are recorded as necessary to permit preparation of financial statements in accordance with generally accepted accounting principles, and that receipts and expenditures of the company are being made only in accordance with authorizations of management and directors of the company; and (3) provide reasonable assurance regarding prevention or timely detection of unauthorized acquisition, use, or disposition of the company’s assets that could have a material effect on the financial statements.
Because of its inherent limitations, internal control over financial reporting may not prevent or detect misstatements. Also, projections of any evaluation of effectiveness to future periods are subject to the risk that controls may become inadequate because of changes in conditions, or that the degree of compliance with the policies or procedures may deteriorate.
/s/ Ernst & Young LLP
Dallas, Texas
February 22, 2018
Report of Independent Registered Public Accounting Firm
To the Stockholders and the Board of Directors of
Spirit Realty Capital, Inc.
Opinion on the Financial Statements
We have audited the accompanying consolidated balance sheets of Spirit Realty Capital, Inc. (the Company) as of December 31, 2017 and 2016, the related consolidated statements of operations, comprehensive income, stockholders’ equity and cash flows for each of the three years in the period ended December 31, 2017, and the related notes and financial statement schedules listed in the Index at Item 15(a) (collectively referred to as the consolidated financial statements). In our opinion, the consolidated financial statements present fairly, in all material respects, the financial position of the Company at December 31, 2017 and 2016, and the results of its operations and its cash flows for each of the three years in the period ended December 31, 2017, in conformity with GAAP requires managementU.S. generally accepted accounting principles.
We also have audited, in accordance with the standards of the Public Company Accounting Oversight Board (United States) (PCAOB), the Company’s internal control over financial reporting as of December 31, 2017, based on criteria established in Internal Control-Integrated Framework issued by the Committee of Sponsoring Organizations of the Treadway Commission (2013 framework) and our report dated February 22, 2018 expressed an unqualified opinion thereon.
Basis for Opinion
These financial statements are the responsibility of the Company‘s management. Our responsibility is to make estimatesexpress an opinion on the Company‘s financial statements based on our audits. We are a public accounting firm registered with the PCAOB and assumptionsare required to be independent with respect to the Company in accordance with the US federal securities laws and the applicable rules and regulations of the Securities and Exchange Commission and the PCAOB.
We conducted our audits in accordance with the standards of the PCAOB. Those standards require that affectwe plan and perform the reported amountsaudit to obtain reasonable assurance about whether the financial statements are free of assets and liabilities atmaterial misstatement, whether due to error or fraud. Our audits included performing procedures to assess the daterisks of material misstatement of the financial statements, whether due to error or fraud, and performing procedures that respond to those risks. Such procedures included examining, on a test basis, evidence regarding the amounts and disclosures in the financial statements. Our audits also included evaluating the accounting principles used and significant estimates made by management, as well as evaluating the overall presentation of the financial statements. We believe that our audits provide a reasonable basis for our opinion.
/s/ Ernst & Young LLP
We have served as the Company’s auditor since 2003.
Dallas, Texas
February 22, 2018
Report of Independent Registered Public Accounting Firm
To the Partners of Spirit Realty, L.P. and the reportedBoard of Directors of
Spirit Realty Capital, Inc.
Opinion on the Financial Statements
We have audited the accompanying consolidated balance sheets of Spirit Realty, L.P. (the Operating Partnership) as of December 31, 2017 and 2016, the related consolidated statements of operations, comprehensive income, partners’ capital and cash flows for each of the three years in the period ended December 31, 2017, and the related notes and financial statement schedules listed in the Index at Item 15(a) (collectively referred to as the consolidated financial statements). In our opinion, the consolidated financial statements present fairly, in all material respects, the financial position of the Operating Partnership at December 31, 2017 and 2016, and the results of its operations and its cash flows for each of the three years in the period ended December 31, 2017, in conformity with U.S. generally accepted accounting principles.
Basis for Opinion
These financial statements are the responsibility of the Operating Partnership's management. Our responsibility is to express an opinion on the Operating Partnership’s financial statements based on our audits. We are a public accounting firm registered with the PCAOB and are required to be independent with respect to the Operating Partnership in accordance with the U.S. federal securities laws and the applicable rules and regulations of the Securities and Exchange Commission and the PCAOB.
We conducted our audits in accordance with the standards of the PCAOB. Those standards require that we plan and perform the audit to obtain reasonable assurance about whether the financial statements are free of material misstatement, whether due to error or fraud. Our audits included performing procedures to assess the risks of material misstatement of the financial statements, whether due to error or fraud, and performing procedures that respond to those risks. Such procedures included examining, on a test basis, evidence regarding the amounts and disclosures in the financial statements. Our audits also included evaluating the accounting principles used and significant estimates made by management, as well as evaluating the overall presentation of revenuesthe financial statements. We believe that our audits provide a reasonable basis for our opinion.
/s/ Ernst & Young LLP
We have served as the Operating Partnership’s auditor since 2016.
Dallas, Texas
February 22, 2018
SPIRIT REALTY CAPITAL, INC.
Consolidated Balance Sheets
(In Thousands, Except Share and expenses during the reporting period. Although management believes its estimates are reasonable, actual results could differ from those estimates.Per Share Data)
|
| | | | | | | |
| | December 31,
2017 | | December 31,
2016 |
| Assets |
|
|
|
| Investments: |
|
|
|
| Real estate investments: |
|
|
|
| Land and improvements | $ | 2,588,930 |
|
| $ | 2,704,010 |
|
| Buildings and improvements | 4,692,377 |
|
| 4,775,221 |
|
| Total real estate investments | 7,281,307 |
|
| 7,479,231 |
|
| Less: accumulated depreciation | (1,075,643 | ) |
| (940,005 | ) |
| 6,205,664 |
|
| 6,539,226 |
|
| Loans receivable, net | 79,967 |
|
| 66,578 |
|
| Intangible lease assets, net | 409,903 |
|
| 470,276 |
|
| Real estate assets under direct financing leases, net | 24,865 |
|
| 36,005 |
|
| Real estate assets held for sale, net | 48,929 |
|
| 160,570 |
|
| Net investments | 6,769,328 |
|
| 7,272,655 |
|
| Cash and cash equivalents | 8,798 |
|
| 10,059 |
|
| Deferred costs and other assets, net | 231,045 |
|
| 140,917 |
|
| Goodwill | 254,340 |
|
| 254,340 |
|
| Total assets | $ | 7,263,511 |
|
| $ | 7,677,971 |
|
|
|
|
|
| Liabilities and stockholders’ equity |
|
|
|
| Liabilities: |
|
|
|
| Revolving Credit Facility | $ | 112,000 |
|
| $ | 86,000 |
|
| Term Loan, net | — |
|
| 418,471 |
|
| Senior Unsecured Notes, net | 295,321 |
| | 295,112 |
|
| Mortgages and notes payable, net | 2,516,478 |
|
| 2,162,403 |
|
| Convertible Notes, net | 715,881 |
|
| 702,642 |
|
| Total debt, net | 3,639,680 |
|
| 3,664,628 |
|
| Intangible lease liabilities, net | 155,303 |
|
| 182,320 |
|
| Accounts payable, accrued expenses and other liabilities | 148,919 |
|
| 148,915 |
|
| Total liabilities | 3,943,902 |
|
| 3,995,863 |
|
| Commitments and contingencies (see Note 8) |
|
|
|
|
|
| Stockholders’ equity: |
|
|
|
| Preferred stock and paid in capital, $0.01 par value, 20,000,000 shares authorized: 6,900,000 shares and no shares issued and outstanding at December 31, 2017 and December 31, 2016, respectively, liquidation preference of $25.00 per share | 166,193 |
| | — |
|
| Common stock, $0.01 par value, 750,000,000 shares authorized: 448,868,269 shares and 483,624,120 shares issued and outstanding at December 31, 2017 and December 31, 2016, respectively | 4,489 |
|
| 4,836 |
|
| Capital in excess of common stock par value | 5,193,631 |
|
| 5,177,086 |
|
| Accumulated deficit | (2,044,704 | ) |
| (1,499,814 | ) |
| Total stockholders’ equity | 3,319,609 |
|
| 3,682,108 |
|
| Total liabilities and stockholders’ equity | $ | 7,263,511 |
|
| $ | 7,677,971 |
|
See accompanying notes.
SPIRIT REALTY CAPITAL, INC.
Consolidated Statements of Operations
(In Thousands, Except Share and Per Share Data)
|
| | | | | | | | | | | | |
| | | Years Ended December 31, |
| | | 2017 | | 2016 | | 2015 |
| Revenues: | | | | | | |
| Rentals | | $ | 639,017 |
| | $ | 648,363 |
| | $ | 634,151 |
|
| Interest income on loans receivable | | 3,791 |
| | 5,253 |
| | 6,948 |
|
| Earned income from direct financing leases | | 2,078 |
| | 2,742 |
| | 3,024 |
|
| Tenant reimbursement income | | 16,747 |
| | 14,125 |
| | 15,952 |
|
| Other income | | 7,322 |
| | 15,491 |
| | 7,260 |
|
| Total revenues | | 668,955 |
| | 685,974 |
| | 667,335 |
|
| Expenses: | | | | | | |
| General and administrative | | 62,064 |
| | 52,615 |
| | 47,730 |
|
| Restructuring charges | | — |
| | 6,341 |
| | 7,056 |
|
| Transaction costs | | 6,361 |
| | — |
| | — |
|
| Property costs (including reimbursable) | | 36,617 |
| | 30,839 |
| | 27,715 |
|
| Real estate acquisition costs | | 1,356 |
| | 3,229 |
| | 2,739 |
|
| Interest | | 190,127 |
| | 196,586 |
| | 222,901 |
|
| Depreciation and amortization | | 256,019 |
| | 262,276 |
| | 260,633 |
|
| Impairments | | 102,330 |
| | 88,275 |
| | 70,695 |
|
| Total expenses | | 654,874 |
| | 640,161 |
| | 639,469 |
|
| Income from continuing operations before other (expense) income and income tax expense | | 14,081 |
| | 45,813 |
| | 27,866 |
|
| Other (expense) income: | | | | | | |
| (Loss) gain on debt extinguishment | | (1,645 | ) | | 233 |
| | (3,162 | ) |
| Total other (expense) income | | (1,645 | ) | | 233 |
| | (3,162 | ) |
| Income from continuing operations before income tax expense | | 12,436 |
| | 46,046 |
| | 24,704 |
|
| Income tax expense | | (394 | ) | | (965 | ) | | (601 | ) |
| Income from continuing operations | | 12,042 |
| | 45,081 |
| | 24,103 |
|
| Discontinued operations: | | | | | | |
| Income from discontinued operations | | — |
| | — |
| | 98 |
|
| Gain on disposition of assets | | — |
| | — |
| | 590 |
|
| Income from discontinued operations | | — |
| | — |
| | 688 |
|
| Income before gain on disposition of assets | | 12,042 |
| | 45,081 |
| | 24,791 |
|
| Gain on disposition of assets | | 65,106 |
| | 52,365 |
| | 68,421 |
|
| Net Income | | 77,148 |
| | 97,446 |
| | 93,212 |
|
| Dividends paid to preferred stockholders | | (2,530 | ) | | — |
| | — |
|
| Net income attributable to common stockholders | | $ | 74,618 |
| | $ | 97,446 |
| | $ | 93,212 |
|
| | | | | | | |
| Net income per share attributable to common stockholders—basic | | $ | 0.16 |
| | $ | 0.21 |
| | $ | 0.21 |
|
| | | | | | | |
| Net income per share attributable to common stockholders—diluted | | $ | 0.16 |
| | $ | 0.21 |
| | $ | 0.21 |
|
| Weighted average shares of common stock outstanding: | | | | | | |
| Basic | | 467,934,945 |
| | 469,217,776 |
| | 432,222,953 |
|
| Diluted | | 467,942,788 |
| | 469,246,265 |
| | 432,545,625 |
|
See accompanying notes.
SPIRIT REALTY CAPITAL, INC.
Consolidated Statements of Comprehensive Income
(In Thousands)
|
| | | | | | | | | | | |
| | Years Ended December 31, |
| | 2017 | | 2016 | | 2015 |
| Net income attributable to common stockholders | $ | 74,618 |
| | $ | 97,446 |
| | $ | 93,212 |
|
| Other comprehensive income: | | | | | |
| Change in net unrealized losses on cash flow hedges | — |
| | (1,137 | ) | | (1,190 | ) |
| Net cash flow hedge losses reclassified to operations | — |
| | 2,165 |
| | 1,245 |
|
| Total comprehensive income | $ | 74,618 |
| | $ | 98,474 |
| | $ | 93,267 |
|
See accompanying notes.
SPIRIT REALTY CAPITAL, INC.
Consolidated Statements of Stockholders’ Equity
(In Thousands, Except Share Data)
|
| | | | | | | | | | | | | | | | | | | | | | | | | | | | | | |
| | | Preferred Stock | | Common Stock | | Accumulated Deficit | | | | Total Stockholders’ Equity |
| | | Shares | | Par
Value and Capital in Excess of Par Value | | Shares | | Par
Value | | Capital in Excess of Par Value | | | AOCL | |
| Balances, December 31, 2014 | | — |
| | $ | — |
| | 411,350,440 |
| | $ | 4,113 |
| | $ | 4,361,320 |
| | $ | (1,052,688 | ) | | $ | (1,083 | ) | | $ | 3,311,662 |
|
| Net income | | — |
| | — |
| | — |
| | — |
| | — |
| | 93,212 |
| | — |
| | 93,212 |
|
| Other comprehensive income | | — |
| | — |
| | — |
| | — |
| | — |
| | — |
| | 55 |
| | 55 |
|
| Dividends declared on common stock | | — |
| | — |
| | — |
| | — |
| | — |
| | (298,531 | ) | | — |
| | (298,531 | ) |
| Tax withholdings related to net stock settlements | | — |
| | — |
| | (426,158 | ) | | (4 | ) | | — |
| | (4,268 | ) | | — |
| | (4,272 | ) |
| Issuance of shares of common stock, net | | — |
| | — |
| | 29,610,100 |
| | 296 |
| | 346,915 |
| | — |
| | — |
| | 347,211 |
|
| Exercise of stock options | | — |
| | — |
| | 5,000 |
| | — |
| | 46 |
| | — |
| | — |
| | 46 |
|
| Stock-based compensation, net | | — |
| | — |
| | 1,280,582 |
| | 13 |
| | 13,042 |
| | (564 | ) | | — |
| | 12,491 |
|
| Balances, December 31, 2015 | | — |
| | $ | — |
| | 441,819,964 |
| | $ | 4,418 |
| | $ | 4,721,323 |
| | $ | (1,262,839 | ) | | $ | (1,028 | ) | | $ | 3,461,874 |
|
| Net income | | — |
| | — |
| | — |
| | — |
| | — |
| | 97,446 |
| | — |
| | 97,446 |
|
| Other comprehensive income | | — |
| | — |
| | — |
| | — |
| | — |
| | — |
| | 1,028 |
| | 1,028 |
|
| Dividends declared on common stock | | — |
| | — |
| | — |
| | — |
| | — |
| | (333,180 | ) | | — |
| | (333,180 | ) |
| Tax withholdings related to net stock settlements | | — |
| | — |
| | (72,835 | ) | | (1 | ) | | — |
| | (752 | ) | | — |
| | (753 | ) |
| Issuance of shares of common stock, net | | — |
| | — |
| | 40,835,360 |
| | 408 |
| | 446,205 |
| | — |
| | — |
| | 446,613 |
|
| Stock-based compensation, net | | — |
| | — |
| | 1,041,631 |
| | 11 |
| | 9,558 |
| | (489 | ) | | — |
| | 9,080 |
|
| Balances, December 31, 2016 | | — |
| | $ | — |
| | 483,624,120 |
| | $ | 4,836 |
| | $ | 5,177,086 |
| | $ | (1,499,814 | ) | | $ | — |
| | $ | 3,682,108 |
|
| Net income | | — |
| | — |
| | — |
| | — |
| | — |
| | 77,148 |
| | — |
| | 77,148 |
|
| Dividends declared on preferred stock | | — |
| | — |
| | — |
| | — |
| | — |
| | (2,530 | ) | | — |
| | (2,530 | ) |
| Net income available to common stockholders | | — |
| | — |
| | — |
| | — |
| | — |
| | 74,618 |
| | — |
| | 74,618 |
|
| Issuance of preferred stock | | 6,900,000 |
| | 166,193 |
| | — |
| | — |
| | — |
| | — |
| | — |
| | 166,193 |
|
| Dividends declared on common stock | | — |
| | — |
| | — |
| | — |
| | — |
| | (332,402 | ) | | — |
| | (332,402 | ) |
| Tax withholdings related to net stock settlements | | — |
| | — |
| | (440,312 | ) | | (4 | ) | | — |
| | (3,538 | ) | | — |
| | (3,542 | ) |
| Repurchase of common shares | | — |
| | — |
| | (35,839,965 | ) | | (358 | ) | | — |
| | (282,731 | ) | | — |
| | (283,089 | ) |
| Stock-based compensation, net | | — |
| | — |
| | 1,524,426 |
| | 15 |
| | 16,545 |
| | (837 | ) | | — |
| | 15,723 |
|
| Balances, December 31, 2017 | | 6,900,000 |
| | $ | 166,193 |
| | 448,868,269 |
| | $ | 4,489 |
| | $ | 5,193,631 |
| | $ | (2,044,704 | ) | | $ | — |
| | $ | 3,319,609 |
|
See accompanying notes.
SPIRIT REALTY CAPITAL, INC.
Consolidated Statements of Cash Flows
(In Thousands)
|
| | | | | | | | | | | | |
| | | Years Ended December 31, |
| | | 2017 | | 2016 | | 2015 |
| Operating activities | | | | | | |
| Net Income | | $ | 77,148 |
| | $ | 97,446 |
| | $ | 93,212 |
|
| Adjustments to reconcile net income to net cash provided by operating activities: | | | | | | |
| Depreciation and amortization | | 256,019 |
| | 262,276 |
| | 260,633 |
|
| Impairments | | 102,330 |
| | 88,275 |
| | 70,729 |
|
| Amortization of deferred financing costs | | 9,896 |
| | 9,070 |
| | 7,937 |
|
| Payments to terminate interest rate swap | | — |
| | (1,724 | ) | | — |
|
| Derivative net settlements, amortization and terminations | | — |
| | 1,811 |
| | (132 | ) |
| Amortization of debt discounts | | 13,572 |
| | 6,217 |
| | 2,322 |
|
| Stock-based compensation expense | | 16,560 |
| | 9,570 |
| | 13,321 |
|
| Loss (gain) on debt extinguishment | | 1,645 |
| | (233 | ) | | 3,162 |
|
| Debt extinguishment costs | | (3,305 | ) | | (26,219 | ) | | (8,112 | ) |
| Gains on dispositions of real estate and other assets | | (65,106 | ) | | (52,365 | ) | | (69,011 | ) |
| Non-cash revenue | | (28,439 | ) | | (26,333 | ) | | (20,930 | ) |
| Bad debt expense and other | | 5,913 |
| | (594 | ) | | 151 |
|
| Changes in operating assets and liabilities: | | | | | | |
| Deferred costs and other assets, net | | (1,418 | ) | | (6,561 | ) | | (604 | ) |
| Accounts payable, accrued expenses and other liabilities | | 1,578 |
| | 6,308 |
| | 13,382 |
|
| Accrued restructuring charges | | — |
| | (5,535 | ) | | 5,926 |
|
| Net cash provided by operating activities | | 386,393 |
| | 361,409 |
| | 371,986 |
|
| Investing activities | | | | | | |
| Acquisitions of real estate | | (279,934 | ) | | (655,835 | ) | | (875,983 | ) |
| Capitalized real estate expenditures | | (46,100 | ) | | (27,078 | ) | | (10,269 | ) |
| Investments in loans receivable | | (4,995 | ) | | (5,073 | ) | | (4,020 | ) |
| Collections of principal on loans receivable and real estate assets under direct financing leases | | 12,769 |
| | 8,410 |
| | 6,822 |
|
| Proceeds from dispositions of real estate and other assets | | 472,496 |
| | 524,776 |
| | 496,646 |
|
| Transfers of net sales proceeds from (to) restricted accounts pursuant to 1031 Exchanges | | — |
| | 39,869 |
| | (39,869 | ) |
| Transfers of net sales proceeds (to) from Master Trust Release | | (71,294 | ) | | (2,320 | ) | | 40,977 |
|
| Net cash provided by (used in) investing activities | | 82,942 |
| | (117,251 | ) | | (385,696 | ) |
SPIRIT REALTY CAPITAL, INC.
Consolidated Statements of Cash Flows
(In Thousands)
|
| | | | | | | | | | | | |
| | | Years Ended December 31, |
| | | 2017 | | 2016 | | 2015 |
| Financing activities | | | | | | |
| Borrowings under Revolving Credit Facilities | | 940,200 |
| | 1,080,000 |
| | 798,000 |
|
| Repayments under Revolving Credit Facilities | | (914,200 | ) | | (994,000 | ) | | (813,181 | ) |
| Borrowings under mortgages and notes payable | | 618,603 |
| | — |
| | — |
|
| Repayments under mortgages and notes payable | | (221,310 | ) | | (863,836 | ) | | (512,486 | ) |
| Borrowings under Term Loan | | — |
| | 796,000 |
| | 325,000 |
|
| Repayments under Term Loan | | (420,000 | ) | | (701,000 | ) | | — |
|
| Borrowings under Senior Unsecured Notes | | — |
| | 298,134 |
| | — |
|
| Deferred financing costs | | (8,255 | ) | | (4,352 | ) | | (6,150 | ) |
| Proceeds from issuance of common stock, net of offering costs | | — |
| | 446,613 |
| | 347,211 |
|
| Proceeds from issuance of preferred stock, net of offering costs | | 166,193 |
| | — |
| | — |
|
| Repurchase of shares of common stock | | (286,631 | ) | | (753 | ) | | (4,272 | ) |
| Proceeds from exercise of stock options | | — |
| | — |
| | 46 |
|
| Preferred stock dividends paid | | (2,530 | ) | | — |
| | — |
|
| Common stock dividends paid | | (339,174 | ) | | (323,640 | ) | | (292,262 | ) |
| Transfers (from) to reserve/escrow deposits with lenders, net | | (3,492 | ) | | 10,945 |
| | 17,413 |
|
| Net cash used in financing activities | | (470,596 | ) | | (255,889 | ) | | (140,681 | ) |
| Net decrease in cash and cash equivalents | | (1,261 | ) | | (11,731 | ) | | (154,391 | ) |
| Cash and cash equivalents, beginning of year | | 10,059 |
| | 21,790 |
| | 176,181 |
|
| Cash and cash equivalents, end of year | | $ | 8,798 |
| | $ | 10,059 |
| | $ | 21,790 |
|
See accompanying notes.
SPIRIT REALTY, L.P.
Consolidated Balance Sheets
(In Thousands, Except Unit and Per Unit Data)
|
| | | | | | | |
| | December 31,
2017 | | December 31,
2016 |
| Assets | | | |
| Investments: | | | |
| Real estate investments: | | | |
| Land and improvements | $ | 2,588,930 |
| | $ | 2,704,010 |
|
| Buildings and improvements | 4,692,377 |
| | 4,775,221 |
|
| Total real estate investments | 7,281,307 |
| | 7,479,231 |
|
| Less: accumulated depreciation | (1,075,643 | ) | | (940,005 | ) |
| | 6,205,664 |
| | 6,539,226 |
|
| Loans receivable, net | 79,967 |
| | 66,578 |
|
| Intangible lease assets, net | 409,903 |
| | 470,276 |
|
| Real estate assets under direct financing leases, net | 24,865 |
| | 36,005 |
|
| Real estate assets held for sale, net | 48,929 |
| | 160,570 |
|
| Net investments | 6,769,328 |
| | 7,272,655 |
|
| Cash and cash equivalents | 8,798 |
| | 10,059 |
|
| Deferred costs and other assets, net | 231,045 |
| | 140,917 |
|
| Goodwill | 254,340 |
| | 254,340 |
|
| Total assets | $ | 7,263,511 |
| | $ | 7,677,971 |
|
| Liabilities and stockholders’ equity | | | |
| Liabilities: | | | |
| Revolving Credit Facility | $ | 112,000 |
| | $ | 86,000 |
|
| Term Loan, net | — |
| | 418,471 |
|
| Senior Unsecured Notes, net | 295,321 |
| | 295,112 |
|
| Mortgages and notes payable, net | 2,516,478 |
| | 2,162,403 |
|
| Notes payable to Spirit Realty Capital, Inc., net | 715,881 |
| | 702,642 |
|
| Total debt, net | 3,639,680 |
| | 3,664,628 |
|
| Intangible lease liabilities, net | 155,303 |
| | 182,320 |
|
| Accounts payable, accrued expenses and other liabilities | 148,919 |
| | 148,915 |
|
| Total liabilities | 3,943,902 |
| | 3,995,863 |
|
| Commitments and contingencies (see Note 8) |
|
| |
|
|
| Partners' Capital | | | |
| Partnership units | | | |
| General partner's common capital, 3,988,218 units issued and outstanding as of both December 31, 2017 and December 31, 2016 | 24,426 |
| | 26,586 |
|
| Limited partners' preferred capital: 6,900,000 and no units issued and outstanding as of December 31, 2017 and December 31, 2016, respectively | 166,193 |
| | — |
|
| Limited partners' common capital, 444,880,051 and 479,635,902 units issued and outstanding as of December 31, 2017 and December 31, 2016, respectively | 3,128,990 |
| | 3,655,522 |
|
| Total partners' capital | 3,319,609 |
| | 3,682,108 |
|
| Total liabilities and partners' capital | $ | 7,263,511 |
| | $ | 7,677,971 |
|
See accompanying notes.
SPIRIT REALTY, L.P.
Consolidated Statements of Operations
(In Thousands, Except Unit and Per Unit Data)
|
| | | | | | | | | | | | |
| | | Years Ended December 31, |
| | | 2017 | | 2016 | | 2015 |
| Revenues: | | | | | | |
| Rentals | | $ | 639,017 |
| | $ | 648,363 |
| | $ | 634,151 |
|
| Interest income on loans receivable | | 3,791 |
| | 5,253 |
| | 6,948 |
|
| Earned income from direct financing leases | | 2,078 |
| | 2,742 |
| | 3,024 |
|
| Tenant reimbursement income | | 16,747 |
| | 14,125 |
| | 15,952 |
|
| Other income | | 7,322 |
| | 15,491 |
| | 7,260 |
|
| Total revenues | | 668,955 |
| | 685,974 |
| | 667,335 |
|
| Expenses: | | | | | | |
| General and administrative | | 62,064 |
| | 52,615 |
| | 47,730 |
|
| Restructuring charges | | — |
| | 6,341 |
| | 7,056 |
|
| Transaction costs | | 6,361 |
| | — |
| | — |
|
| Property costs (including reimbursable) | | 36,617 |
| | 30,839 |
| | 27,715 |
|
| Real estate acquisition costs | | 1,356 |
| | 3,229 |
| | 2,739 |
|
| Interest | | 190,127 |
| | 196,586 |
| | 222,901 |
|
| Depreciation and amortization | | 256,019 |
| | 262,276 |
| | 260,633 |
|
| Impairments | | 102,330 |
| | 88,275 |
| | 70,695 |
|
| Total expenses | | 654,874 |
| | 640,161 |
| | 639,469 |
|
| Income from continuing operations before other (expense) income and income tax expense | | 14,081 |
| | 45,813 |
| | 27,866 |
|
| Other (expense) income: | | | | | | |
| (Loss) gain on debt extinguishment | | (1,645 | ) | | 233 |
| | (3,162 | ) |
| Total other (expense) income | | (1,645 | ) | | 233 |
| | (3,162 | ) |
| Income from continuing operations before income tax expense | | 12,436 |
| | 46,046 |
| | 24,704 |
|
| Income tax expense | | (394 | ) | | (965 | ) | | (601 | ) |
| Income from continuing operations | | 12,042 |
| | 45,081 |
| | 24,103 |
|
| Discontinued operations: | | | | | | |
| Income from discontinued operations | | — |
| | — |
| | 98 |
|
| Gain on disposition of assets | | — |
| | — |
| | 590 |
|
| Income from discontinued operations | | — |
| | — |
| | 688 |
|
| Income before gain on disposition of assets | | 12,042 |
| | 45,081 |
| | 24,791 |
|
| Gain on disposition of assets | | 65,106 |
| | 52,365 |
| | 68,421 |
|
| Net income | | $ | 77,148 |
| | $ | 97,446 |
| | $ | 93,212 |
|
| Preferred distributions | | (2,530 | ) | | — |
| | — |
|
| Net income after preferred distributions | | 74,618 |
| | 97,446 |
| | 93,212 |
|
| | | | | | | |
| Net income attributable to general partners | | 657 |
| | 825 |
| | 855 |
|
| Net income attributable to limited partners | | 76,491 |
| | 96,621 |
| | 92,357 |
|
| | | | | | | |
| Net income per common partnership unit - basic | | $ | 0.16 |
| | $ | 0.21 |
| | $ | 0.21 |
|
| | | | | | | |
| Net income per common partnership unit —diluted | | $ | 0.16 |
| | $ | 0.21 |
| | $ | 0.21 |
|
| Weighted average common partnership units outstanding: | | | | | | |
| Basic | | 467,934,945 |
| | 469,217,776 |
| | 432,222,953 |
|
| Diluted | | 467,942,788 |
| | 469,246,265 |
| | 432,545,625 |
|
See accompanying notes.
SPIRIT REALTY, L.P.
Consolidated Statements of Comprehensive Income
(In Thousands)
|
| | | | | | | | | | | |
| | Years Ended December 31, |
| | 2017 | | 2016 | | 2015 |
| Net income | $ | 77,148 |
| | $ | 97,446 |
| | $ | 93,212 |
|
| Other comprehensive income: | | | | | |
| Change in net unrealized losses on cash flow hedges | — |
| | (1,137 | ) | | (1,190 | ) |
| Net cash flow hedge losses reclassified to operations | — |
| | 2,165 |
| | 1,245 |
|
| Total comprehensive income | $ | 77,148 |
| | $ | 98,474 |
| | $ | 93,267 |
|
See accompanying notes.
SPIRIT REALTY, L.P.
Consolidated Statements of Partners' Capital
(In Thousands, Except Unit Data)
|
| | | | | | | | | | | | | | | | | | | | | | | | | |
| | Preferred Units | | Common Units | | Total Partnership Capital |
| | | Limited Partners' Capital (2) | | General Partner's Capital (1) | | Limited Partners' Capital (2) | |
| | | Units | | Amount | | Units | | Amount | | Units | | Amount | |
| Balances, December 31, 2014 | | — |
| | $ | — |
| | 3,988,218 |
| | $ | 30,456 |
| | 407,362,222 |
| | $ | 3,281,206 |
| | $ | 3,311,662 |
|
| Net income | | — |
| | — |
| | — |
| | 855 |
| | — |
| | 92,357 |
| | 93,212 |
|
| Other comprehensive income | | — |
| | — |
| | — |
| | 1 |
| | — |
| | 54 |
| | 55 |
|
| Partnership distributions declared | | — |
| | — |
| | — |
| | (2,738 | ) | | — |
| | (295,793 | ) | | (298,531 | ) |
| Tax withholdings related to net settlement of partnership units | | — |
| | — |
| | — |
| | — |
| | (426,158 | ) | | (4,272 | ) | | (4,272 | ) |
| Issuance of partnership units, net | | — |
| | — |
| | — |
| | — |
| | 29,610,100 |
| | 347,211 |
| | 347,211 |
|
| Exercise of partnership units | | — |
| | — |
| | — |
| | — |
| | 5,000 |
| | 46 |
| | 46 |
|
| Stock-based compensation, net | | — |
| | — |
| | — |
| | — |
| | 1,280,582 |
| | 12,491 |
| | 12,491 |
|
| Balances, December 31, 2015 | | — |
| | $ | — |
| | 3,988,218 |
| | $ | 28,574 |
| | 437,831,746 |
| | $ | 3,433,300 |
| | $ | 3,461,874 |
|
| Net income | | — |
| | — |
| | — |
| | 825 |
| | — |
| | 96,621 |
| | 97,446 |
|
| Other comprehensive income | | — |
| | — |
| | — |
| | 9 |
| | — |
| | 1,019 |
| | 1,028 |
|
| Partnership distributions declared | | — |
| | — |
| | — |
| | (2,822 | ) | | — |
| | (330,358 | ) | | (333,180 | ) |
| Tax withholdings related to net settlement of partnership units | | — |
| | — |
| | — |
| | — |
| | (72,835 | ) | | (753 | ) | | (753 | ) |
| Issuance of partnership units, net | | — |
| | — |
| | — |
| | — |
| | 40,835,360 |
| | 446,613 |
| | 446,613 |
|
| Stock-based compensation, net | | — |
| | — |
| | — |
| | — |
| | 1,041,631 |
| | 9,080 |
| | 9,080 |
|
| Balances, December 31, 2016 | | — |
| | $ | — |
| | 3,988,218 |
| | $ | 26,586 |
| | 479,635,902 |
| | $ | 3,655,522 |
| | $ | 3,682,108 |
|
| Net income | | — |
| | — |
| | — |
| | $ | 657 |
| | — |
| | $ | 76,491 |
| | $ | 77,148 |
|
| Partnership distributions declared on preferred units | | — |
| | — |
| | — |
| | — |
| | — |
| | (2,530 | ) | | (2,530 | ) |
| Net income after preferred distributions | | | | — |
| | | | 657 |
| | — |
| | 73,961 |
| | 74,618 |
|
| Issuance of preferred partnership units | | 6,900,000 |
| | 166,193 |
| | — |
| | — |
| | — |
| | — |
| | 166,193 |
|
| Partnership distributions declared on common units | | — |
| | — |
| | — |
| | (2,817 | ) | | — |
| | (329,585 | ) | | (332,402 | ) |
| Tax withholdings related to net partnership unit settlements | | — |
| | — |
| | — |
| | — |
| | (440,312 | ) | | (3,542 | ) | | (3,542 | ) |
| Repurchase of partnership units | | — |
| | — |
| | — |
| | — |
| | (35,839,965 | ) | | (283,089 | ) | | (283,089 | ) |
| Stock-based compensation | | — |
| | — |
| | — |
| | — |
| | 1,524,426 |
| | 15,723 |
| | 15,723 |
|
| Balances, December 31, 2017 | | 6,900,000 |
| | $ | 166,193 |
| | 3,988,218 |
| | $ | 24,426 |
| | 444,880,051 |
| | $ | 3,128,990 |
| | $ | 3,319,609 |
|
(1) Consists of general partnership interests held by Spirit General OP Holdings, LLC.
(2) Consists of limited partnership interests held by Spirit Realty Capital, Inc. and Spirit Notes Partner, LLC.
See accompanying notes.
SPIRIT REALTY, L.P.
Consolidated Statements of Cash Flows
(In Thousands)
|
| | | | | | | | | | | |
| | Years Ended December 31, |
| | 2017 | | 2016 | | 2015 |
| Operating activities | | | | | |
| Net Income | $ | 77,148 |
| | $ | 97,446 |
| | $ | 93,212 |
|
| Adjustments to reconcile net income to net cash provided by operating activities: | | | | | |
| Depreciation and amortization | 256,019 |
| | 262,276 |
| | 260,633 |
|
| Impairments | 102,330 |
| | 88,275 |
| | 70,729 |
|
| Amortization of deferred financing costs | 9,896 |
| | 9,070 |
| | 7,937 |
|
| Payments to terminate interest rate swap | — |
| | (1,724 | ) | | — |
|
| Derivative net settlements, amortization and terminations | — |
| | 1,811 |
| | (132 | ) |
| Amortization of debt discounts | 13,572 |
| | 6,217 |
| | 2,322 |
|
| Stock-based compensation expense | 16,560 |
| | 9,570 |
| | 13,321 |
|
| Loss (gain) on debt extinguishment | 1,645 |
| | (233 | ) | | 3,162 |
|
| Debt extinguishment costs | (3,305 | ) | | (26,219 | ) | | (8,112 | ) |
| Gains on dispositions of real estate and other assets | (65,106 | ) | | (52,365 | ) | | (69,011 | ) |
| Non-cash revenue | (28,439 | ) | | (26,333 | ) | | (20,930 | ) |
| Bad debt expense and other | 5,913 |
| | (594 | ) | | 151 |
|
| Changes in operating assets and liabilities: | | | | | |
| Deferred costs and other assets, net | (1,418 | ) | | (6,561 | ) | | (604 | ) |
| Accounts payable, accrued expenses and other liabilities | 1,578 |
| | 6,308 |
| | 13,382 |
|
| Accrued restructuring charges | — |
| | (5,535 | ) | | 5,926 |
|
| Net cash provided by operating activities | 386,393 |
| | 361,409 |
| | 371,986 |
|
| Investing activities | | | | | |
| Acquisitions of real estate | (279,934 | ) | | (655,835 | ) | | (875,983 | ) |
| Capitalized real estate expenditures | (46,100 | ) | | (27,078 | ) | | (10,269 | ) |
| Investments in loans receivable | (4,995 | ) | | (5,073 | ) | | (4,020 | ) |
| Collections of principal on loans receivable and real estate assets under direct financing leases | 12,769 |
| | 8,410 |
| | 6,822 |
|
| Proceeds from dispositions of real estate and other assets | 472,496 |
| | 524,776 |
| | 496,646 |
|
| Transfers of net sales proceeds from (to) restricted accounts pursuant to 1031 Exchanges | — |
| | 39,869 |
| | (39,869 | ) |
| Transfers of net sales proceeds (to) from Master Trust Release | (71,294 | ) | | (2,320 | ) | | 40,977 |
|
| Net cash provided by (used in) investing activities | 82,942 |
| | (117,251 | ) | | (385,696 | ) |
|
| | | | | | | | | | | |
| | Years Ended December 31, |
| | 2017 | | 2016 | | 2015 |
| Financing activities |
|
| |
|
| |
|
|
| Borrowings under Revolving Credit Facilities | 940,200 |
| | 1,080,000 |
| | 798,000 |
|
| Repayments under Revolving Credit Facilities | (914,200 | ) | | (994,000 | ) | | (813,181 | ) |
| Borrowings under mortgages and notes payable | 618,603 |
| | — |
| | — |
|
| Repayments under mortgages and notes payable | (221,310 | ) | | (863,836 | ) | | (512,486 | ) |
| Borrowings under Term Loan | — |
| | 796,000 |
| | 325,000 |
|
| Repayments under Term Loan | (420,000 | ) | | (701,000 | ) | | — |
|
| Borrowings under Senior Unsecured Notes | — |
| | 298,134 |
| | — |
|
| Deferred financing costs | (8,255 | ) | | (4,352 | ) | | (6,150 | ) |
| Proceeds from issuance of common stock, net of offering costs | — |
| | 446,613 |
| | 347,211 |
|
| Proceeds from issuance of preferred stock, net of offering costs | 166,193 |
| | — |
| | — |
|
| Repurchase of partnership units | (286,631 | ) | | (753 | ) | | (4,272 | ) |
| Proceeds from exercise of partnership units | — |
| | — |
| | 46 |
|
| Preferred distributions paid | (2,530 | ) | | — |
| | — |
|
| Common distributions paid | (339,174 | ) | | (323,640 | ) | | (292,262 | ) |
| Transfers (from) to reserve/escrow deposits with lenders, net | (3,492 | ) | | 10,945 |
| | 17,413 |
|
| Net cash used in financing activities | (470,596 | ) | | (255,889 | ) | | (140,681 | ) |
| Net decrease in cash and cash equivalents | (1,261 | ) | | (11,731 | ) | | (154,391 | ) |
| Cash and cash equivalents, beginning of year | 10,059 |
| | 21,790 |
| | 176,181 |
|
| Cash and cash equivalents, end of year | $ | 8,798 |
| | $ | 10,059 |
| | $ | 21,790 |
|
SPIRIT REALTY CAPITAL, INC. and SPIRIT REALTY, L.P.
Notes to Consolidated Financial Statements - (continued)
December 31, 20162017
Segment Reporting
Note 1. Organization
Organization and Operations
Spirit Realty Capital, Inc. (the "Corporation" or, with its consolidated subsidiaries, the "Company") operates as a self-administered and self-managed REIT that seeks to generate and deliver sustainable and attractive returns for stockholders by investing primarily in and managing a portfolio of single-tenant, operationally essential real estate throughout the U.S. that is generally leased on a long-term, triple-net basis to tenants operating within predominantly retail, but also office and industrial property types. Single tenant, operationally essential real estate generally refers to free-standing, commercial real estate facilities where tenants conduct activities that are essential to the generation of their sales and profits.The Company began operations through a predecessor legal entity in 2003.
The Company viewsCompany’s operations are generally carried out through Spirit Realty, L.P. (the "Operating Partnership") and its operations assubsidiaries. Spirit General OP Holdings, LLC ("OP Holdings"), one segment, which consists of net leasing operations. The Company has no other reportable segments.
Real Estate Investments
Carrying Value of Real Estate Investments
The Company’s real estate properties are recorded at cost and depreciated using the straight-line method over the estimated remaining useful lives of the properties, which generally range from 20 to 50 years for buildingsCorporation's wholly-owned subsidiaries, is the sole general partner and improvementsowns approximately 1% of the Operating Partnership. The Corporation and from 5 to 20 years for land improvements. Portfolio assets classified as “held for sale”a wholly-owned subsidiary ("Spirit Notes Partner, LLC") are not depreciated. Properties classified as “held for sale” are recorded at the loweronly limited partners and together own the remaining 99% of their carrying value or their fair value, less anticipated selling costs.the Operating Partnership.
Purchase Accounting and Acquisition of Real Estate
When acquiring a property for investment purposes,On August 3, 2017, the Company allocates the purchase price (including acquisition and closing costs) to land, building, improvements, and equipment based on their relative fair values. For properties acquired with in-place leases, the Company allocates the purchase priceannounced a proposed Spin-Off of real estate to the tangible and intangible assets and liabilities acquired based on their estimated fair values, and acquisition costs are expensed as incurred. In making estimates of fair values for this purpose, the Company uses a number of sources, including independent appraisals and information obtained about each property as a resultalmost all of its pre-acquisition due diligenceinterests in properties leased to Shopko, assets that collateralize Master Trust 2014 and its marketing and leasing activities.
Lease Intangibles
Lease intangibles, if any, acquired in conjunctionother additional assets into an independent, publicly traded REIT, Spirit MTA REIT, or SMTA. Transaction costs associated with the purchase of real estate representspin off for the value of in-place leasesyear ended December 31, 2017 totaled $6.4 million, and above or below-market leases. For real estate acquired subject to existing lease agreements, in-place lease intangibles are valued basedincluded within transaction costs on the Company’s estimate of costs related to acquiring a tenant and the carrying costs that would be incurred during the time it would take to locate a tenant if the property were vacant, considering current market conditions and costs to execute similar leases at the time of the acquisition. Above and below-market lease intangibles are recorded based on the present value of the difference between the contractual amounts to be paid pursuant to the leases at the time of acquisition of the real estate and the Company’s estimate of current market lease rates for the property, measured over a period equal to the remaining initial term of the lease.
In-place lease intangibles are amortized on a straight-line basis over the remaining initial term of the related lease and included in depreciation and amortization expense. Above-market lease intangibles are amortized over the remaining initial terms of the respective leases as a decrease in rental revenue. Below market lease intangibles are amortized as an increase to rental revenue over the remaining initial term of the respective leases, but may be amortized over the renewal periods if the Company believes it is likely the tenant will exercise the renewal option. Should a lease terminate early, the unamortized portion of any related lease intangible is immediately recognized in impairment loss in the Company’saccompanying consolidated statements of operations.
Investment in Direct Financing LeasesFor real estate property leases classified as direct financing leases, the building portionNote 2. Summary of the lease is accounted for as a direct financing lease, while the land portion is accounted for as operating leases when certain criteria are met. For direct financing leases, the Company records an asset which represents the net investment that is determined by using the aggregate of the total amount of future minimum lease payments, the estimated residual value of the leased property and deferred incremental direct costs less unearned income. Income is recognized over the life of the lease to approximate a level rate of return on the net investment. Residual values, which are reviewed quarterly, represent the estimated amount the Company expects to receive at lease termination from the disposition of the leased property. Actual residual values realized could differ from these estimates. The Company evaluates the collectability of future minimum lease payments on each direct financing lease primarily through the evaluation of payment history and the underlying creditworthiness of the tenant. There were no amounts past due as of December 31, 2016 and 2015. The Company’s direct financing leases are evaluated individually for the purpose of determining if an allowance is needed.Significant Accounting Policies
SPIRIT REALTY CAPITAL, INC. and SPIRIT REALTY, L.P.
Notes to Consolidated Financial Statements - (continued)
December 31, 2016
Any write-down of an estimated residual value is recognized as an impairment loss in the current period and earned income adjusted prospectively. The Company's direct financing leases were acquired in connection with the Merger. There were no impairment losses on direct financing lease during the year ended December 31, 2016. There were $4.8 million in impairment losses related to two direct financing leases during the year ended December 31, 2015. There were no impairment losses or allowances recorded related to direct financing leases during the year ended December 31, 2014.
Goodwill
Goodwill arises from business combinations and represents the excess of the cost of an acquired entity over the net fair value amounts that were assigned to the identifiable assets acquired and the liabilities assumed. Goodwill is tested for impairment at the reporting unit level on an annual basis and between annual tests if an event occurs or circumstances change that would more likely than not reduce the fair value of the reporting unit below its carrying value. The Company did not record any impairment on its existing goodwill for the years ended December 31, 2016, 2015 and 2014.
When the Company classifies a real estate asset that constitutes a business under GAAP as held for sale, the proportionate amount of goodwill attributable to the real estate asset should be considered in determining the amount of impairment, if any. The portion of goodwill attributed is derived from the proportionate fair value of the real estate asset considered to be a business to the fair value of the Company’s reporting unit. Goodwill of $6.5 million and $2.0 million relates to real estate assets held for sale as of December 31, 2016 and 2015, respectively.
When the Company disposes of a real estate asset that constitutes a business under GAAP, a portion of goodwill is allocated to the carrying value of the real estate asset considered to be a business to determine the gain/loss on the disposal. The portion of goodwill allocated is derived from the proportionate fair value of the business to the fair value of the Company’s reporting unit. Goodwill related to real estate assets not previously classified as held for sale of $6.3 million, $12.7 million and $2.3 million, was written off during the years ended December 31, 2016, 2015 and 2014, respectively.
The following table presents a reconciliation of the Company’s goodwill from January 1, 2014 to December 31, 2016 (in thousands):
|
| | | |
| | Consolidated |
| Balance as of December 31, 2013 | 288,128 |
|
| Goodwill allocated to disposition of real estate assets | (2,280 | ) |
| Balance as of December 31, 2014 | 285,848 |
|
| Goodwill allocated to disposition of real estate assets | (21,498 | ) |
| Balance as of December 31, 2015 | 264,350 |
|
| Goodwill allocated to disposition of real estate assets | (10,010 | ) |
| Balance as of December 31, 2016 | $ | 254,340 |
|
Impairment
The Company reviews its real estate investments and related lease intangibles periodically for impairment whenever events or changes in circumstances indicate that the carrying amount may not be recoverable. The Company considers factors such as expected future undiscounted cash flows, estimated residual value, market trends (such as the effects of leasing demand and competition) and other factors in making this assessment. An asset is considered impaired if its carrying value exceeds its estimated undiscounted cash flows and the impairment is calculated as the amount by which the carrying value of the asset exceeds its estimated fair value. Estimating future cash flows and fair values are highly subjective and such estimates could differ materially from actual results. Key assumptions used in estimating future cash flows and fair values include, but are not limited to, revenue growth rates, interest rates, discount rates, capitalization rates, lease renewal probabilities, tenant vacancy rates and other factors.
SPIRIT REALTY CAPITAL, INC. and SPIRIT REALTY, L.P.
Notes to Consolidated Financial Statements - (continued)
December 31, 2016
Revenue Recognition
The Company primarily leases real estate to its tenants under long-term, triple-net leases that are classified as operating leases. Lease origination fees are deferred and amortized over the related lease term as an adjustment to rental revenue. Under a triple-net lease, the tenant is typically responsible for all improvements and is contractually obligated to pay all property operating expenses, such as real estate taxes, insurance premiums and repair and maintenance costs. Under certain leases, tenant reimbursement revenue, which is comprised of additional amounts recoverable from tenants for common area maintenance expenses and certain other recoverable expenses, is recognized as revenue in the period in which the related expenses are incurred. Tenant reimbursements are recorded on a gross basis, as the Company is generally the primary obligor with respect to purchasing goods and services from third-party suppliers.Tenant receivables are carried net of the allowances for uncollectible amounts.
The Company’s leases generally provide for rent escalations throughout the lease terms. For leases that provide for specific contractual escalations, rental revenue is recognized on a straight-line basis so as to produce a constant periodic rent over the term of the lease. Accordingly, accrued rental revenue, calculated as the aggregate difference between the rental revenue recognized on a straight-line basis and scheduled rents, represents unbilled rent receivables that the Company will receive only if the tenants make all rent payments required through the expiration of the initial term of the leases. The accrued rental revenue representing this straight-line adjustment is subject to an evaluation for collectability, and the Company records a provision for losses against rental revenues if collectability of these future rents is not reasonably assured. Leases that have contingent rent escalators indexed to future increases in the CPI may adjust over a one-year period or over multiple-year periods. Generally, these escalators increase rent at the lesser of (a) 1 to 1.25 times the increase in the CPI over a specified period or (b) a fixed percentage. Because of the volatility and uncertainty with respect to future changes in the CPI, the Company’s inability to determine the extent to which any specific future change in the CPI is probable at each rent adjustment date during the entire term of these leases and the Company’s view that the multiplier does not represent a significant leverage factor, rental revenue from leases with this type of escalator are recognized only after the changes in the rental rates have occurred.
Some of the Company’s leases also provide for contingent rent based on a percentage of the tenant’s gross sales. For contingent rentals that are based on a percentage of the tenant’s gross sales, the Company recognizes contingent rental revenue when the change in the factor on which the contingent lease payment is based actually occurs.
The Company suspends revenue recognition if the collectability of amounts due pursuant to a lease is not reasonably assured or if the tenant’s monthly lease payments become more than 60 days past due, whichever is earlier.
Lease termination fees are included in other income on the Company’s consolidated statements of operations and are recognized when there is a signed termination agreement and all of the conditions of the agreement have been met. The Company recorded lease termination fees of $7.3 million, $5.8 million and $3.4 million during the years ended December 31, 2016, 2015 and 2014, respectively.
Allowance for Doubtful Accounts
We review our rent receivables for collectability on a regular basis, taking into consideration factors such as the tenant’s payment history, the financial condition of the tenant, business conditions in the industry in which the tenant operates and economic conditions in the area in which the property is located. If the collectability of a receivable with respect to any tenant is in doubt, a provision for uncollectible amounts will be established or a write-off of the specific receivable will be made. Uncollected accounts receivable are written off against the allowance when all possible means of collection have been exhausted. For deferred rental revenues related to the straight-line method of reporting rental revenue, we establish a provision for losses based on our estimate of uncollectible receivables and our assessment of the risks inherent in our portfolio, giving consideration to historical experience and industry default rates for long-term receivables.
INCOME TAXES
REIT Status
We elected to be taxed as a REIT for federal income tax purposes commencing with our taxable year ended December 31, 2005. We believe that we have been organized and have operated in a manner that has allowed us to qualify as a REIT commencing with such taxable year, and we intend to continue operating in such a manner. To maintain our REIT status, we are required to annually distribute to our stockholders at least 90% of our REIT taxable income, determined without regard to the dividends paid deduction and excluding any net capital gain, and meet the various other requirements imposed by the Code relating to such matters as operating results, asset holdings, distribution levels and diversity of stock ownership. Provided that we qualify for taxation as a REIT, we are generally not subject to corporate level federal income tax on the earnings distributed to our stockholders that we derive from our REIT qualifying activities. We are still subject to state and local income and franchise taxes and to federal income and excise tax on our undistributed income. If we fail to qualify as a REIT in any taxable year and are unable to avail ourselves of certain savings provisions set forth in the Code, all of our taxable income would be subject to federal income tax at regular corporate rates, including any applicable alternative minimum tax. Unless entitled to relief under specific statutory provisions, we would be ineligible to elect to be treated as a REIT for the four taxable years following the year for which we lose our qualification. It is not possible to state whether in all circumstances we would be entitled to this statutory relief.
TRS
We have elected, together with certain of our subsidiaries, to treat such subsidiaries as our TRS for federal income tax purposes. A taxable REIT subsidiary generally may provide both customary and non-customary services to tenants of its parent REIT and engage in other activities that the parent REIT may not engage in directly without adversely affecting its qualification as a REIT. Currently, our TRS do not provide any services to our tenants or conduct other material activities. However, one or more TRS of ours may in the future provide services to certain of our tenants. We may form additional taxable REIT subsidiaries in the future and we may contribute some or all of our interests in certain wholly-owned subsidiaries or their assets to a TRS of ours. Any income earned by our TRS will not be included in our taxable income for purposes of the 75% or 95% gross income tests, except to the extent such income is distributed to us as a dividend, in which case such dividend income will qualify under the 95%, but not the 75%, gross income test. Because a taxable REIT subsidiary is subject to federal income tax and state and local income tax (where applicable), as a regular C corporation, the income earned by our TRS generally will be subject to an additional level of tax as compared to the income earned by our other subsidiaries. Historically, we have not actively pursued or engaged in material activities that would require the use of our TRS.
SHARE-BASED COMPENSATION
Awards granted under our Amended Incentive Award Plan may require service-based vesting over a period of years subsequent to the grant date and resulting equity-based compensation expense, measured at the fair value of the award on the date of grant, will be recognized as an expense in our consolidated financial statements over the vesting period. Grant date fair value is estimated using the Monte Carlo simulation model, which incorporates stock price correlation, projected dividend yields and other variables over the time horizons matching the performance periods.
Results of Operations
Comparison of the Years Ended December 31, 2017 and 2016
The following discussion includes the results of our continuing operations as summarized in the table below:
|
| | | | | | | | | | | | | | |
| | Years Ended December 31, |
| (In Thousands) | 2017 | | 2016 | | Change | | % Change |
| Revenues: | | | | | | | |
| Rentals | $ | 639,017 |
| | $ | 648,363 |
| | $ | (9,346 | ) | | (1.4 | )% |
| Interest income on loans receivable | 3,791 |
| | 5,253 |
| | (1,462 | ) | | (27.8 | )% |
| Earned income from direct financing leases | 2,078 |
| | 2,742 |
| | (664 | ) | | (24.2 | )% |
| Tenant reimbursement income | 16,747 |
| | 14,125 |
| | 2,622 |
| | 18.6 | % |
| Other income | 7,322 |
| | 15,491 |
| | (8,169 | ) | | (52.7 | )% |
| Total revenues | 668,955 |
| | 685,974 |
| | (17,019 | ) | | (2.5 | )% |
| Expenses: | | | | | | | |
| General and administrative | 62,064 |
| | 52,615 |
| | 9,449 |
| | 18.0 | % |
| Restructuring charges | — |
| | 6,341 |
| | (6,341 | ) | | (100.0 | )% |
| Transaction costs | 6,361 |
| | — |
| | 6,361 |
| | 100.0 | % |
| Property costs (including reimbursable) | 36,617 |
| | 30,839 |
| | 5,778 |
| | 18.7 | % |
| Real estate acquisition costs | 1,356 |
| | 3,229 |
| | (1,873 | ) | | (58.0 | )% |
| Interest | 190,127 |
| | 196,586 |
| | (6,459 | ) | | (3.3 | )% |
| Depreciation and amortization | 256,019 |
| | 262,276 |
| | (6,257 | ) | | (2.4 | )% |
| Impairment | 102,330 |
| | 88,275 |
| | 14,055 |
| | 15.9 | % |
| Total expenses | 654,874 |
| | 640,161 |
| | 14,713 |
| | 2.3 | % |
| Income from continuing operations before other (expense) income and income tax expense | 14,081 |
| | 45,813 |
| | (31,732 | ) | | (69.3 | )% |
| Other (expense) income: | | | | | | | |
| (Loss) gain on debt extinguishment | (1,645 | ) | | 233 |
| | (1,878 | ) | | NM |
|
| Total other (expense) income | (1,645 | ) | | 233 |
| | (1,878 | ) | | NM |
|
| Income from continuing operations before income tax expense | 12,436 |
| | 46,046 |
| | (33,610 | ) | | (73.0 | )% |
| Income tax expense | (394 | ) | | (965 | ) | | 571 |
| | 59.2 | % |
| Income from continuing operations | $ | 12,042 |
| | $ | 45,081 |
| | $ | (33,039 | ) | | 73.3 | % |
| | | | | | | | |
| Gain on disposition of assets | $ | 65,106 |
| | $ | 52,365 |
| | $ | 12,741 |
| | 24.3 | % |
NM - Percentages over 100% are not displayed.
REVENUES
Rentals
For the year ended December 31, 2017, approximately 95.5% of our total revenues were generated from long-term leases of our owned properties. Our contractual rental revenues between periods decreased by 0.9% as we were a moderate disposer of income producing real estate during the year ended December 31, 2017. We acquired 39 properties with a real estate investment value of $323.0 million during the year ended December 31, 2017. This increase was offset by the sale of 192 properties during the same period for gross sales of $551.2 million, of which 87 were income producing properties for gross sales of $397.5 million. Additionally, we had tenant credit losses in the first quarter of 2017, where the majority of the increase in our nonperforming properties were in the convenience store and movie theater industries.
During both the years ended December 31, 2017 and 2016, non-cash rentals were $30.6 million, representing approximately 4.8% and 4.7%, respectively, of total rental revenue from continuing operations.
Interest income on loans receivable
While financed properties increased from 74 at December 31, 2016 to 88 at December 31, 2017, resulting in an increase of 20.1% in the related mortgage loans receivable balances for the comparative period, interest income on loans receivable decreased as a result of a timing of the change in financed properties. We held 144 financed properties at the beginning of 2016, of which 66 were paid off in mid-2016. Additionally, all 16 properties financed in 2017 were originated in the last four months of 2017.
Tenant reimbursement income
We have a number of leases that require our tenants to reimburse us for certain property costs we incur. Tenant reimbursement income is driven by the tenant reimbursable property costs described below.
Other income
The year-over-year decrease in other income is primarily due to $5.5 million in fee income associated with the prepayment of certain mortgage loans for the year ended December 31, 2016, and no comparable transaction for the year ended December 31, 2017. Additionally, lease termination fees collected for the year ended December 31, 2017 were $5.0 million, compared to $7.3 million for the year ended December 31, 2016.
EXPENSES
General and administrative
The year-over-year increase in general and administrative expenses is primarily due to $11.1 million in severance related costs, comprised of $4.2 million of cash compensation and $6.9 million of non-cash compensation, recorded in the year ended December 31, 2017 following the departure of our chief executive officer and an increase of $4.3 million in bad debt expense recorded year-over-year. The change in bad debt expense increased primarily as a result of certain entertainment, sporting goods and restaurant - casual dining properties for which the straight-line rent has been determined to be uncollectible for the year ended December 31, 2017, offset by a decrease in bad debt expenses related to convenience store properties of $1.1 million year-over-year. Finally, the period-over-period increase in general and administrative expenses was partially offset by the $1.7 million loss recognized in the comparable prior period related to termination fees on an interest rate swap.
Property costs
The increase in property costs is primarily due to an increase in non-reimbursable property taxes on operating properties of $2.4 million and an increase in reimbursable property taxes of $3.1 million. The increase in non-reimbursable property taxes on operating properties resulted from an increase in tenant credit issues year-over-year. Tenant reimbursable property costs for the year ended December 31, 2017 were $21.4 million, an increase from $18.0 million in 2016.
Transaction costs
On August 3, 2017, we announced a proposed Spin-Off of almost all of our interests in our properties leased to Shopko, assets that collateralize Master Trust 2014 and other additional assets into an independent, publicly traded REIT. Transaction costs associated with the Spin-Off for the year ended December 31, 2017 totaled $6.4 million.
Interest
The decrease in interest expense is primarily due to the extinguishment of $238.5 million of mortgage debt with a weighted average interest rate of 5.5% during the year ended December 31, 2017. This was partially offset by an increase in interest due to increased average borrowings year-over-year under our Revolving Credit Facility and Term Loan, as well as interest on our Senior Unsecured Notes, which were issued in August 2016.
The following table summarizes our interest expense on related borrowings:
|
| | | | | | | |
| | Years Ended December 31, |
| (In Thousands) | 2017 | | 2016 |
Interest expense – Revolving Credit Facilities (1) | $ | 7,957 |
| | $ | 3,314 |
|
| Interest expense – Term Loan | 9,793 |
| | 5,218 |
|
| Interest expense – mortgages and notes payable | 111,049 |
| | 143,233 |
|
| Interest expense – Convertible Notes | 24,509 |
| | 24,509 |
|
| Interest expense – Unsecured Senior Notes | 13,351 |
| | 4,932 |
|
| Non-cash interest expense: | | | |
| Amortization of deferred financing costs | 9,896 |
| | 9,070 |
|
| Amortization of net losses related to interest rate swaps | — |
| | 93 |
|
| Amortization of debt discount/(premium), net | 13,572 |
| | 6,217 |
|
| Total interest expense | $ | 190,127 |
| | $ | 196,586 |
|
(1) Includes non-utilization fees of approximately $2.1 million and $2.0 million for the years ended December 31, 2017 and 2016, respectively.
Depreciation and amortization
Depreciation and amortization expense relates primarily to depreciation on the commercial buildings and improvements we own and to amortization of the related lease intangibles. We were a net disposer during the year ended December 31, 2017 (based on depreciable real estate assets), which was the primary driver in the decrease year-over-year. During the year ended December 31, 2017, we acquired 39 properties with a depreciable basis of $323.0 million, while we sold 192 properties with a real estate investment value of $536.0 million. Our depreciable real estate balance was further reduced due to impairment charges recorded in 2017 on properties that remain in our portfolio. Finally, properties held for sale are no longer depreciated and there were more properties being held for sale this year than last year. The following table summarizes our depreciation and amortization expense:
|
| | | | | | | |
| | Years Ended December 31, |
| (In Thousands) | 2017 | | 2016 |
| Depreciation of real estate assets | $ | 212,112 |
| | $ | 215,443 |
|
| Other depreciation | 563 |
| | 475 |
|
| Amortization of lease intangibles | 43,344 |
| | 46,358 |
|
| Total depreciation and amortization | $ | 256,019 |
| | $ | 262,276 |
|
Impairment
Impairment charges for the year ended December 31, 2017 were $102.3 million. These charges included $24.8 million on properties held for sale, including $15.0 million on vacant held for sale properties and $6.4 million on four education properties held for sale. $77.2 million of impairment was recorded on properties held and used, including $55.9 million on vacant properties held and used, $10.0 million on eight underperforming properties within the drug store/pharmacy and consumer electronics industries, and $4.2 million on an underperforming property within the general merchandise industry. $0.3 million of impairment charges related to unrecoverable amounts from mortgage loans receivable.
During the year ended December 31, 2016, we recorded impairment losses of $88.3 million. These charges included $23.1 million on 28 properties that were held for sale, including $10.6 million on vacant held for sale properties, and $28.2 million on vacant properties that were not classified as held for sale. The impairment losses also include $26.3 million on 9 underperforming properties within the restaurant-casual dining, movie theater, general merchandise, drug store/pharmacy and distribution industries. In addition, during the year ended December 31, 2016, lease intangible write-offs were primarily due to the $6.6 million write-off of below market rent intangible liabilities for one tenant in the restaurant-casual dining industry.
(Loss) gain on debt extinguishment
During the year ended December 31, 2017, we extinguished $238.5 million of mortgage debt and recognized a loss on debt extinguishment of $1.6 million. The loss was primarily attributable to the $1.6 million pre-payment premium
paid in conjunction with our voluntary pre-payment of the full outstanding balance of Master Trust 2014 Series 2014-1 Class A1 note of $43.1 million in November 2017. During the same period in 2016, we extinguished $883.0 million of mortgage debt and recognized a gain on debt extinguishment of $0.2 million. The gain was primarily attributable to the extinguishment of four defaulted mortgage loans upon sale of the properties collateralizing these loans to third parties, offset by losses from the prepayment and defeasance fees on 408 properties.
Gain on disposition of assets
During the year ended December 31, 2017, we disposed of 192 properties and recorded gains totaling $65.1 million. Included in these amounts are a $16.2 million gain on the sales of 12 Shopko properties, a $9.5 million gain on the sales of 29 restaurant - casual dining and quick service properties, a $8.9 million gain on the sales of six grocery properties, a $7.9 million gain on the sale of a distribution property, a $7.8 million gain on the sales of 11 drug store/pharmacy properties, and a $7.6 million gain on the sales of five building materials properties. These gains were partially offset by a $6.9 million loss on the sales of 105 vacant properties during the year ended December 31, 2017.
During 2016, we disposed of 213 properties and recorded gains totaling $52.4 million. Included in these amounts are a $12.7 million gain for the sales of 14 Shopko properties, a $10.3 million gain for the sale of one grocery property, a $9.8 million gain on the sale of 30 properties within the restaurant-quick service industry and a $8.8 million gain on the sale of 19 properties with the restaurant-casual dining industry.
Results of Operations
Comparison of the Years Ended December 31, 2016 and 2015
The following discussion includes the results of our continuing operations as summarized in the table below:
|
| | | | | | | | | | | | | | |
| | Years Ended December 31, |
| (In Thousands) | 2016 | | 2015 | | Change | | % Change |
| Revenues: | | | | | | | |
| Rentals | $ | 648,363 |
| | $ | 634,151 |
| | $ | 14,212 |
| | 2.2 | % |
| Interest income on loans receivable | 5,253 |
| | 6,948 |
| | (1,695 | ) | | (24.4 | )% |
| Earned income from direct financing leases | 2,742 |
| | 3,024 |
| | (282 | ) | | (9.3 | )% |
| Tenant reimbursement income | 14,125 |
| | 15,952 |
| | (1,827 | ) | | (11.5 | )% |
| Other income | 15,491 |
| | 7,260 |
| | 8,231 |
| | NM |
|
| Total revenues | 685,974 |
| | 667,335 |
| | 18,639 |
| | 2.8 | % |
| Expenses: | | | | | | | |
| General and administrative | 52,615 |
| | 47,730 |
| | 4,885 |
| | 10.2 | % |
| Restructuring charges | 6,341 |
| | 7,056 |
| | (715 | ) | | (10.1 | )% |
| Property costs (including reimbursable) | 30,839 |
| | 27,715 |
| | 3,124 |
| | 11.3 | % |
| Real estate acquisition costs | 3,229 |
| | 2,739 |
| | 490 |
| | 17.9 | % |
| Interest | 196,586 |
| | 222,901 |
| | (26,315 | ) | | (11.8 | )% |
| Depreciation and amortization | 262,276 |
| | 260,633 |
| | 1,643 |
| | 0.6 | % |
| Impairment | 88,275 |
| | 70,695 |
| | 17,580 |
| | 24.9 | % |
| Total expenses | 640,161 |
| | 639,469 |
| | 692 |
| | 0.1 | % |
| Income from continuing operations before other income (expense) and income tax expense | 45,813 |
| | 27,866 |
| | 17,947 |
| | 64.4 | % |
| Other income (expense): | | | | | | | |
| Gain (loss) on debt extinguishment | 233 |
| | (3,162 | ) | | 3,395 |
| | NM |
|
| Total other income (expense) | 233 |
| | (3,162 | ) | | 3,395 |
| | NM |
|
| Income from continuing operations before income tax expense | 46,046 |
| | 24,704 |
| | 21,342 |
| | NM |
|
| Income tax expense | (965 | ) | | (601 | ) | | (364 | ) | | (60.6 | )% |
| Income from continuing operations | $ | 45,081 |
| | $ | 24,103 |
| | $ | 20,978 |
| | (87.0 | )% |
| | | | | | | | |
| Gain on disposition of assets | $ | 52,365 |
| | $ | 68,421 |
| | $ | (16,056 | ) | | 23.5 | % |
NM - Percentages over 100% are not displayed.
REVENUES
For the year ended December 31, 2016, approximately 94.9% of our total revenues were generated from long-term leases of our owned properties. The year-over-year increase of 2.8% in total revenue was due primarily to an increase in base rental revenue resulting from real estate acquisitions subsequent to December 31, 2015, as well as recognition of other non-tenant income income and lease termination fees, both of which are recorded in other income.
Rentals
The year-over-year increase in rental revenue was primarily attributable to the acquisition of 269 properties with a gross investment in real estate of $704.9 million during the year ended December 31, 2016. This increase was partially offset by the sale of 213 properties during the same period having a real estate investment value of $598.7 million. During the year ended December 31, 2016 and 2015, non-cash rentals were $30.6 million and $23.4 million, respectively, representing approximately 4.7% and 3.7% of total rental revenue from continuing operations, respectively. Contractual rent escalations subsequent to December 31, 2015 also contributed to the increase.
As of December 31, 2016, 98.2% of our owned properties were occupied (based on number of properties). The majority of our nonperforming properties were in the convenience store and restaurants-casual dining industries. As of December 31, 2016 and 2015, respectively, 46 and 36 of our properties were vacant and not generating rent, representing approximately 1.8% and 1.4% of our owned properties. Of the 46 vacant properties, 10 were held for sale as of December 31, 2016.
Tenant reimbursement income
We have a number of leases that require our tenants to reimburse us for certain property costs we incur. Tenant reimbursement income is driven by the tenant reimbursable property costs described below.
Other income
The year-over-year increase in other income is primarily due to $5.5 million in fee income associated with the prepayment of certain mortgage loans receivable and $7.2 million in lease termination fees received from Haggen and three other properties for the year ended December 31, 2016. Comparatively, for the year ended December 31, 2015, there was only $5.8 million in lease termination fees related to three tenants.
EXPENSES
General and administrative
The year-over-year increase in general and administrative expenses is primarily due to a $4.0 million increase in professional fees and office expenses, $2.0 million of bad debt expense recorded in relation to 34 convenience store properties for which the rent has been determined to be uncollectible and a $1.7 million charge for the termination of our interest rate swaps. Higher professional fees and office expenses include legal, consulting and temporary services attributable to our relocation to Dallas, Texas. These increases were partially offset by a decrease in compensation and related benefits of $3.9 million related to the forfeiture of previously recognized non-cash compensation following the departure of an executive officer in the current period.
Restructuring charges
During the quarter ended December 31, 2015, we made the strategic decision to relocate the Company's headquarters from Scottsdale, Arizona to Dallas, Texas. As a result, during the year ended December 31, 2015, the Company incurred $7.1 million of restructuring charges. Comprising the majority of this amount were estimated employee separation costs, which were based on the anticipated separation date of June 30, 2016 and recognized on the date the employee elected to separate in December 2015. Employee separation costs primarily consist of severance payments, retention bonuses and pro-rated 2016 annual bonuses. Costs associated with employees electing to relocate to Dallas were recognized as the liability was incurred. These costs include a transition bonus and reimbursements for certain relocation costs, including home sale costs, lease breakage penalties, moving costs and a miscellaneous allowance. Other restructuring charges, including placement fees and third-party consulting fees, were also recognized when incurred. As such, during the year ended December 31, 2016, we incurred $6.3 million in restructuring charges related to our relocation. Of this amount, $4.9 million related to professional fees, consulting services, employee severance costs, lease termination expense of our prior headquarters, while the balance was for employee relocation costs and other restructuring charges.
Property costs
For the year ended December 31, 2016, property costs were $30.8 million (including $14.1 million of tenant reimbursables) compared to $27.7 million (including $16.0 million of tenant reimbursables) for the same period in 2015. The increase was driven primarily by an increase in non-reimbursable property taxes on non-operating properties of $3.5 million, as well as increased costs to the Company due to the increased number of vacant properties.
Interest
Year-over-year decrease in interest expense is primarily due to the extinguishment of $883.0 million of mortgage debt with a weighted average interest rate of 6.01% during the year ended December 31, 2016. This decrease was partially offset by an increase in interest from our Term Loan, which was entered into during November 2015, and the issuance of our Senior Unsecured Notes in August 2016.
The following table summarizes our interest expense on related borrowings from continuing operations:
|
| | | | | | | |
| | Years Ended December 31, |
| (In Thousands) | 2016 | | 2015 |
Interest expense – Revolving Credit Facilities (1) | $ | 3,314 |
| | $ | 2,698 |
|
| Interest expense – Term Loan | 5,218 |
| | 888 |
|
| Interest expense – mortgages and notes payable | 143,233 |
| | 184,439 |
|
| Interest expense – Convertible Notes | 24,509 |
| | 24,509 |
|
| Interest expense – Unsecured Senior Notes | 4,932 |
| | — |
|
| Non-cash interest expense: | | | |
| Amortization of deferred financing costs | 9,070 |
| | 7,937 |
|
| Amortization of net losses related to interest rate swaps | 93 |
| | 108 |
|
| Amortization of debt discount/(premium), net | 6,217 |
| | 2,322 |
|
| Total interest expense | $ | 196,586 |
| | $ | 222,901 |
|
(1) Includes non-utilization fees of approximately $2.0 million and $1.6 million for the years ended December 31, 2016 and 2015, respectively.
Depreciation and amortization
Depreciation and amortization expense relates primarily to depreciation on the commercial buildings and improvements we own and to amortization of the related lease intangibles. The year-over-year increase is primarily due to the acquisition of 269 properties, representing a gross investment in real estate of $704.9 million, during the year ended December 31, 2016. The increase was partially offset by dispositions of 213 properties during 2016 with a real estate investment value of $598.7 million. Our net acquisitions during the year were partially offset by a reduction in our real estate investment value due to impairment charges recorded in 2016 on properties that remain in our portfolio and a higher real estate value of properties held for sale compared to 2015. Properties held for sale are no longer depreciated.
The following table summarizes our depreciation and amortization expense from continuing operations:
|
| | | | | | | |
| | Years Ended December 31, |
| (In Thousands) | 2016 | | 2015 |
| Depreciation of real estate assets | $ | 215,443 |
| | $ | 210,395 |
|
| Other depreciation | 475 |
| | 375 |
|
| Amortization of lease intangibles | 46,358 |
| | 49,863 |
|
| Total depreciation and amortization | $ | 262,276 |
| | $ | 260,633 |
|
Impairments
During the year ended December 31, 2016, we recorded impairment losses of $88.3 million. These charges included $23.1 million of impairment on 28 properties that were held for sale, including $10.6 million of impairment on vacant held for sale properties, and $28.2 million on vacant properties that were not classified as held for sale. The impairment losses also include $26.3 million on 9 underperforming properties within the restaurant-casual dining, movie theater, general merchandise, drug store/pharmacy and distribution industries. In addition, during the year ended December 31, 2016, lease intangible write-offs were primarily due to the $6.6 million write-off of below market rent intangible liabilities for one tenant in the restaurant-casual dining industry. During the year ended December 31, 2015, we incurred impairment losses of $55.4 million from 22 vacant or underperforming properties within the education, restaurant-casual dining and sporting goods industries. In addition, 29 properties held for sale during the period incurred impairment losses of $15.0 million. The balance of the impairment loss included an allowance for loan loss on an unsecured note.
The following summarizes our impairment loss from continuing operations:
|
| | | | | | | |
| | Years Ended December 31, |
| (In Thousands) | 2016 | | 2015 |
| Real estate and intangible asset impairment | $ | 80,390 |
| | $ | 68,531 |
|
| Write-off of lease intangibles due to lease terminations, net | 7,683 |
| | 1,666 |
|
| Loans receivable impairment | 176 |
| | 324 |
|
| Total impairments from real estate investment net assets | 88,249 |
| | 70,521 |
|
| Other impairment | 26 |
| | 174 |
|
| Total impairment loss | $ | 88,275 |
| | $ | 70,695 |
|
Gain (loss) on debt extinguishment
During the year ended December 31, 2016, we extinguished $883.0 million of mortgage debt and recognized a gain on debt extinguishment of $0.2 million. The gain was primarily attributable to the extinguishment of four defaulted mortgage loans upon sale of the properties collateralizing these loans to third parties, offset by losses from the prepayment and defeasance fees on 408 properties. During the same period in 2015, we retired $536.6 million in high interest rate CMBS debt with a weighted average interest rate of 5.73%.
Gain on disposition of assets
During the year ended December 31, 2016, we disposed of 213 properties and recorded gains totaling $52.4 million from continuing operations. Included in these amounts are the sales of 14 Shopko properties for a $12.7 million gain, $10.3 million for the sale of one grocery property, a $9.8 million gain on the sale of 30 properties within the restaurant-quick service industry and a $8.8 million gain on the sale of 19 properties with the restaurant-casual dining industry. During 2015, we disposed of 110 properties and recorded gains totaling $68.4 million from continuing operations. These gains are primarily attributable to a $58.7 million gain from the sale of 34 Shopko properties. Additionally, we sold or disposed of 76 other properties, including 31 vacant properties and 5 multi-tenant properties.
Liquidity and Capital Resources
Short-term Liquidity and Capital Resources
On a short-term basis, our principal demands for funds will be for operating expenses, including financing of acquisitions, distributions to stockholders and interest and principal on current and any future debt financings. We expect to fund our operating expenses and other short-term liquidity requirements, capital expenditures, payment of principal and interest on our outstanding indebtedness, property improvements, re-leasing costs and cash distributions to common and preferred stockholders, primarily through cash provided by operating activities and borrowings under the Revolving Credit Facility and Term Loan. Our Revolving Credit Facility and Term Loan increase our capacity to fund acquisitions, while continuing to meet our short-term working capital requirements. As of December 31, 2017, $688.0 million of borrowing capacity was available under the Revolving Credit Facility and $420.0 million was available under the Term Loan.
In November, 2016, the Board of Directors approved a new $500.0 million ATM Program and the Company terminated it's existing program. As of December 31, 2017, no shares had been sold under the new ATM Program.
In February 2016, the Company's Board of Directors approved a stock repurchase program, which authorizes the Company to repurchase up to $200.0 million of its common stock. During the year ended December 31, 2017, 26,337,295 shares of the Company's outstanding common stock were repurchased in open market transactions under this stock repurchase program, at a weighted average price of $7.59 per share, equivalent to the full $200.0 million authorized. Fees associated with the share repurchase of $0.5 million are included in retained earnings.
In August, 2017, our Board of Directors approved a new stock repurchase program, which authorizes us to purchase up to $250.0 million of our common stock in the open market or through private transactions from time to time over the next 18 months. Purchase activity will be dependent on various factors, including our capital position, operating results, funds generated by asset sales, dividends that may be required by those sales, and investment options that may be available, including acquiring new properties or retiring debt. The stock repurchase program does not obligate us to repurchase any specific number of shares and may be suspended at any time at our discretion. We intend to fund any repurchases with the net proceeds from asset sales, cash flows from operations, existing cash on the balance
sheet and other sources. As of December 31, 2017, the Company had repurchased 9,502,670 shares of its outstanding common stock under this new stock repurchase program.
In October, 2017, the Company completed an underwritten public offering of 6,900,000 shares of 6.00% Series A Cumulative Redeemable Preferred Stock, including 900,000 shares sold pursuant to the underwriter's option to purchase additional shares. Gross proceeds raised were approximately $172.5 million; net proceeds were approximately $166.2 million after deducting underwriter discounts and offering costs paid by the Company. The net proceeds from the offering were initially used to reduce outstanding debt and for general operating purposes of the Company.
Long-term Liquidity and Capital Resources
We plan to meet our long-term capital needs, including long-term financing of property acquisitions, by issuing registered debt or equity securities, obtaining asset level financing and occasionally by issuing fixed rate secured or unsecured notes and bonds. We may continue to issue common stock when we believe that our share price is at a level that allows for the proceeds of any offering to be accretively invested into additional properties. In addition, we may issue common stock to permanently finance properties that were financed by our Revolving Credit Facility, Term Loan or other indebtedness. In the future, some of our property acquisitions could be made by issuing partnership interests of our Operating Partnership in exchange for property owned by third parties. These partnership interests would be exchangeable for cash or, at our election, shares of our common stock.
We continually evaluate alternative financing and believe that we can obtain financing on reasonable terms. However, we cannot assure you that we will have access to the capital markets at times and on terms that are acceptable to us. We expect that our primary uses of capital will be for property and other asset acquisitions and the payment of tenant improvements, operating expenses, including debt service payments on any outstanding indebtedness, and distributions to our stockholders.
Description of Certain Debt
Spirit Master Funding Program
The Spirit Master Funding Program is an asset-backed securitization platform in which we raise capital through the issuance of non-recourse net lease mortgage notes collateralized by commercial real estate, net leases and mortgage loans. The Spirit Master Funding Program allows us to issue notes that are secured by the assets of the special purpose entity note issuers that are pledged to the indenture trustee for the benefit of the noteholders and managed by the Operating Partnership as property manager. These Collateral Pools consist primarily of commercial real estate properties, the issuers’ rights in the leases of such properties and commercial mortgage loans secured by commercial real estate properties. In general, monthly rental and mortgage receipts with respect to the leases and mortgage loans are deposited with the indenture trustee who will first utilize these funds to satisfy the debt service requirements on the notes and any fees and costs associated with the administration of the Spirit Master Funding Program including property and asset management fees payable to Spirit. The remaining funds are remitted to the issuers monthly on the note payment date.
In addition, upon satisfaction of certain conditions, the issuers may, from time to time, sell or exchange real estate properties or mortgage loans from the Collateral Pools. Proceeds from the sale of assets within the Collateral Pools are held on deposit by the indenture trustee until a qualifying substitution is made or the amounts are distributed as an early repayment of principal. At December 31, 2017, $85.7 million was held on deposit and classified as restricted cash within deferred costs and other assets, net in our consolidated balance sheet included in this Annual Report on Form 10-K.
The Spirit Master Funding Program consists of two separate securitization trusts that have one or multiple bankruptcy-remote, special purpose entities as issuers of the Master Trust 2013 and Master Trust 2014 notes. Each issuer is an indirect wholly-owned subsidiary of ours. All outstanding series of Master Trust Notes were rated A+ by S&P as of December 31, 2017.
Master Trust 2013
In December 2013, an indirect wholly-owned subsidiary of ours issued $330.0 million aggregate principal amount of net-lease mortgage notes comprised of $125.0 million of 3.89% interest-only notes expected to be repaid in December 2018 and $205.0 million of 5.27% amortizing notes expected to be repaid in December 2023.
Master Trust 2014
In May 2014, we completed our Exchange Offer to exchange the outstanding principal balance of three series of existing net-lease mortgage notes for three series of newly issued Master Trust 2014 notes. The terms of the new notes remain generally similar to the old notes including the interest rate and anticipated final repayment dates; however, the new notes generally amortize more slowly than the old notes and have a legal final payment date that is 17 years later than the old notes (although the anticipated repayment date remains the same). The revisions to Master Trust 2014, in connection with the issuance of the new notes, generally provide the Operating Partnership more administrative flexibility as property manager and special servicer.
In November 2014, the existing issuers under Master Trust 2014 and two additional indirect wholly-owned subsidiaries of ours, collectively as co-issuers, completed the issuance of $510.0 million aggregate principal amount of net-lease mortgage notes comprised of $150.0 million of 3.50% interest-only notes expected to be repaid in January 2020 and $360.0 million of 4.63% amortizing notes (interest-only through November 2017) expected to be repaid in January 2030.
At the time of issuance, the Class A notes represented approximately 70% of the collateral appraised value and are currently rated A+ by S&P. The Class B notes are subordinate to the Class A notes as to principal repayment, represent approximately 5% of the collateral value, and are currently rated BBB by S&P.
In December 2017, the existing issuers under Master Trust 2014, collectively as co-issuers, completed the issuance of $674.4 million aggregate principal amount of net-lease mortgage notes comprised of $542.4 million of 4.36%, Class A, amortizing notes and $132.0 million of 6.35%, Class B, interest-only notes, each class of Notes have an anticipated repayment date in December 2022 and a legal final payment date in December 2047. (Refer to Note 17. Subsequent Events, regarding repricing of the Class B Notes). The Operating Partnership retained $27.1 million in aggregate principal amount of Class A Notes and $6.6 million in aggregate principal amount of Class B Notes to satisfy its regulatory risk retention obligations. In conjunction with the issuance, the Company pre-paid Series 2014-1 Class A1 of the 2014 notes.
The Master Trust Notes are summarized below:
|
| | | | | | | | | | | | |
| | Stated
Rates (1) | | Remaining Term | | December 31,
2017 | | December 31,
2016 |
| | | | (in Years) | | (in Thousands) |
| Series 2014-1 Class A1 | — | % | | 0.0 | | $ | — |
| | $ | 53,919 |
|
| Series 2014-1 Class A2 | 5.4 | % | | 2.5 | | 252,437 |
| | 253,300 |
|
| Series 2014-2 | 5.8 | % | | 3.2 | | 222,683 |
| | 226,283 |
|
| Series 2014-3 | 5.7 | % | | 4.2 | | 311,336 |
| | 311,820 |
|
| Series 2014-4 Class A1 | 3.5 | % | | 2.1 | | 150,000 |
| | 150,000 |
|
Series 2017-1 Class A (2) | 4.4 | % | | 5.0 | | 515,280 |
| | — |
|
Series 2017-1 Class B (2) | 6.4 | % | | 5.0 | | 125,400 |
| | — |
|
| Series 2014-4 Class A2 | 4.6 | % | | 12.1 | | 358,664 |
| | 360,000 |
|
| Total Master Trust 2014 notes | 5.0 | % | | 5.4 | | 1,935,800 |
| | 1,355,322 |
|
| Series 2013-1 Class A | 3.9 | % | | 1.0 | | 125,000 |
| | 125,000 |
|
| Series 2013-2 Class A | 5.3 | % | | 6.0 | | 187,704 |
| | 192,384 |
|
| Total Master Trust 2013 notes | 4.7 | % | | 4.0 | | 312,704 |
| | 317,384 |
|
| Total Master Trust Notes | | | | | 2,248,504 |
| | 1,672,706 |
|
| Debt discount, net | | | | | (36,188 | ) | | (18,787 | ) |
| Deferred financing costs, net | | | | | (24,010 | ) | | (16,376 | ) |
| Total Master Trust Notes, net | | | | | $ | 2,188,306 |
| | $ | 1,637,543 |
|
(1) Represents the individual series stated interest rate as of December 31, 2017 and the weighted average stated rate of the total Master Trust Notes, based on the collective series outstanding principal balances as of December 31, 2017.
(2) The Operating Partnership acquired $27.1 million in aggregate principal amount of Class A Notes and $6.6 million in aggregate principal amount of Class B Notes, which eliminate in consolidation, to satisfy its regulatory risk retention obligations.
As of December 31, 2017, the Master Trust 2014 notes were secured by 815 owned and financed properties issued by 5 indirect wholly-owned subsidiaries of the Corporation. The notes issued under Master Trust 2014 are cross-collateralized by the assets of all issuers within this trust. As of December 31, 2017, the Master Trust 2013 notes were secured by 296 owned and financed properties issued by a single indirect wholly-owned subsidiary of the Corporation.
Convertible Notes
The Convertible Notes are comprised of two series of notes with an aggregate principal amount of $747.5 million at both December 31, 2017 and December 31, 2016. Interest on the Convertible Notes is payable semiannually in arrears on May 15 and November 15 of each year. The 2019 Notes, aggregate principal amount $402.5 million, accrue interest at 2.875% and are scheduled to mature on May 15, 2019. The 2021 Notes, aggregate principal amount $345.0 million, accrue interest at 3.75% and are scheduled to mature on May 15, 2021. As of December 31, 2017, the carrying amount of the Convertible Notes was $715.9 million, which is net of discounts (for the value of the embedded conversion feature) and unamortized deferred financing costs.
Holders may convert notes of either series prior to November 15, 2018, in the case of the 2019 Notes, or November 15, 2020, in the case of the 2021 Notes, only under the following circumstances: (1) if the closing price of our common stock for each of at least 20 trading days (whether or not consecutive) during the last 30 consecutive trading days in the quarter is greater than or equal to 130% of the conversion price for the Convertible Notes; (2) during the five business day period after any 10 consecutive trading day period in which the trading price per $1,000 principal amount of the Convertible Notes for each trading day of the measurement period was less than 98% of the product of the last closing price of our common stock and the conversion rate for the Convertible Notes; (3) if we call any or all of the Convertible Notes for redemption prior to the redemption date; or (4) upon the occurrence of specified corporate events as described in the Convertible Notes prospectus supplement. On or after November 15, 2018, in the case of the 2019 Notes, or November 15, 2020, in the case of the 2021 Notes, until the close of business on the second scheduled trading day immediately preceding the maturity date of the Convertible Notes, holders may convert the Convertible Notes of the applicable series at any time, regardless of the foregoing circumstances. Upon conversion, we will pay or deliver cash, shares of common stock or a combination of cash and shares of common stock, at our election.
The initial conversion rate for the Convertible Notes is 76.3636 shares of common stock per $1,000 principal amount of notes (equivalent to an initial conversion price of approximately $13.10 per share of common stock). The conversion rate for each series of the Convertible Notes is subject to adjustment for some events, including dividends paid in excess of threshold amounts stipulated in the agreement, but will not be adjusted for any accrued and unpaid interest. As of December 31, 2017, the conversion rate was 77.3144 per $1,000 principal note. If we undergo a fundamental change (as defined in the Convertible Notes supplemental indentures), holders may require us to repurchase all or any portion of their notes at a repurchase price equal to 100% of the principal amount of the notes to be repurchased, plusaccrued and unpaid interest.
Revolving Credit Facility
On March 31, 2015, the Company entered into the Credit Agreement, among the Operating Partnership as borrower and the Company as guarantor, that established a new $600.0 million unsecured credit facility and terminated its secured $400.0 million 2013 Credit Facility. The Revolving Credit Facility matures on March 31, 2019 (extendible at the Operating Partnership's option to March 31, 2020, subject to satisfaction of certain requirements) and includes an accordion feature to increase the committed facility size up to $1.0 billion, subject to satisfying certain requirements and obtaining additional lender commitments. On April 27, 2016, the Company expanded the borrowing capacity under the Revolving Credit Facility from $600.0 million to $800.0 million by partially exercising the accordion feature under the terms of the Credit Agreement. The Revolving Credit Facility also includes a 50.0 million sub-limit for swing-line loans and up to $60.0 million available for issuance of letters of credit. Swing-line loans and letters of credit reduce availability under the Revolving Credit Facility on a dollar-for-dollar basis. On November 3, 2015, the Company entered into a first amendment to the Credit Agreement. The amendment conforms certain of the terms and covenants to those in the Term Loan Agreement, including limiting the requirement of subsidiary guaranties to material subsidiaries (as defined in the Credit Agreement) meeting certain conditions. At December 31, 2017, there were no subsidiaries meeting this requirement.
The Revolving Credit Facility bears interest at a rate equal to LIBOR plus 0.875% to 1.55% per annum or a specified base rate plus 0.0% to 0.55% and requires a facility fee in an amount equal to the aggregate revolving credit commitments (whether or not utilized) multiplied by a rate equal to 0.125% to 0.30% per annum, in each case depending
on the Corporation's credit rating. As of December 31, 2017, the Revolving Credit Facility bore interest at LIBOR plus 1.25% based on the Company's credit rating and incurred a facility fee of 0.25% per annum.
The Operating Partnership may voluntarily prepay the Revolving Credit Facility, in whole or in part, at any time, without premium or penalty, but subject to applicable LIBOR breakage fees, if any. Payment of the Revolving Credit Facility is unconditionally guaranteed by the Corporation and material subsidiaries that meet certain conditions (as defined in the Credit Agreement). As of December 31, 2017, there were no subsidiaries that met this requirement.
As of December 31, 2017, $112.0 million in borrowings were outstanding and $688.0 million of borrowing capacity was available under the Revolving Credit Facility. Amounts available for borrowing under the Revolving Credit Facility remain subject to compliance with certain customary restrictive covenants including:
Maximum leverage ratio (defined as consolidated total indebtedness plus the Corporation’s pro rata share of indebtedness of unconsolidated affiliates, net of certain cash and cash equivalents, to total asset value) of 0.60:1.00, which may be increased to 0.65:1.00 for four consecutive quarters after certain material acquisitions;
Minimum fixed charge coverage ratio (defined as EBITDA plus the Corporation’s pro rata share of EBITDA of unconsolidated affiliates, to fixed charges) of 1.50:1.00;
Maximum secured indebtedness leverage ratio (defined as consolidated secured indebtedness plus the Corporation’s pro rata share of secured indebtedness of unconsolidated affiliates, net of certain cash and cash equivalents, to total asset value) of 0.50:1:00;
Minimum unsecured interest coverage ratio (defined as consolidated net operating income from unencumbered properties, to unsecured interest expense) of 1.75:1.00;
Maximum unencumbered leverage ratio (defined as consolidated unsecured indebtedness plus the Corporation’s pro rata share of unsecured indebtedness of unconsolidated affiliates, net of certain cash and cash equivalents, to total unencumbered asset value) of 0.60:1:00, which may be increased to 0.65:1.00 for four consecutive quarters after certain material acquisitions; and
Minimum tangible net worth of at least $3.01 billion plus 75% of the net proceeds of equity issuances by the Corporation or the Operating Partnership after December 31, 2014.
In addition to these covenants, the Credit Agreement also includes other customary affirmative and negative covenants, such as (i) limitation on liens and negative pledges; (ii) transactions with affiliates; (iii) limitation on mergers, consolidations and sales of all or substantially all assets; (iv) maintenance of status as a REIT and listing on any national securities exchange; and (v) material modifications to organizational documents.
As of December 31, 2017, the Corporation and the Operating Partnership were in compliance with these covenants.
Term Loan
On November 3, 2015, we entered into a Term Loan Agreement among the Operating Partnership as borrower, the Corporation as guarantor and the lenders that are parties thereto. The Term Loan Agreement provides for a $325.0 million senior unsecured term facility that has an initial maturity date of November 2, 2018, which may be extended at our option pursuant to two one-year extension options, subject to the satisfaction of certain conditions and payment of an extension fee. In addition, an accordion feature allows the facility to be increased to up to $600.0 million, subject to obtaining additional lender commitments. In December 2015, upon obtaining additional lender commitments, we increased the term facility from $325.0 million to $370.0 million. On December 19, 2016, we increased the term facility from $370.0 million to $420.0 million.
The Term Loan Agreement provides that borrowings bear interest at either LIBOR plus 1.35% to 1.80% per annum or a specified base rate plus 0.35% to 0.80% per annum, at the Operating Partnership's election. In each case, the applicable margin is determined based upon the Corporation’s leverage ratio. If the Corporation obtains at least two credit ratings on its senior unsecured long-term indebtedness of BBB- from S&P or Fitch, Inc. or Baa3 from Moody's, the Operating Partnership may make an irrevocable election to have the margin based upon the Corporation's credit ratings. In April 2016, the Corporation received a first time rating of BBB- from Fitch and was upgraded to a BBB- corporate issuer rating by S&P. As a result, the Operating Partnership elected to change the interest rate grid from leverage based pricing to credit rating based pricing in the second quarter of 2016. Under credit rating based pricing, borrowings will bear interest at either LIBOR plus 0.90% to 1.75% per annum or a specified base rate plus 0.0% to 0.75% per annum, in each case depending on the Corporation’s credit ratings. As of December 31, 2017, the Term Loan bore interest at LIBOR plus 1.35% based on our credit rating.
The Operating Partnership may voluntarily prepay the Term Loan, in whole or in part, at any time, without premium or penalty, but subject to applicable LIBOR breakage fees. Amounts prepaid may be subsequently re-borrowed within 30 days. Payment of the Term Loan is unconditionally guaranteed by the Corporation and, under certain circumstances, by one or more material subsidiaries (as defined in the Term Loan Agreement) of the Corporation. The obligations of the Operating Partnership and any guarantor under the Term Loan are full recourse to the Corporation and each guarantor.
As of December 31, 2017, the Term Loan provided $420.0 million of borrowing capacity. Amounts available for borrowing under the Term Loan remain subject to compliance with certain customary restrictive covenants including:
Maximum leverage ratio (defined as consolidated total indebtedness plus the Corporation’s pro rata share of indebtedness of unconsolidated affiliates, net of certain cash and cash equivalents, to total asset value) of 0.60:1.00, which may be increased to 0.65:1.00 for four consecutive quarters after certain material acquisitions;
Minimum fixed charge coverage ratio (defined as consolidated EBITDA plus the Corporation’s pro rata share of EBITDA of unconsolidated affiliates to fixed charges) of 1.50:1.00;
Maximum secured indebtedness leverage ratio (defined as consolidated secured indebtedness plus the Corporation’s pro rata share of secured indebtedness of unconsolidated affiliates, net of certain cash and cash equivalents to total asset value) of 0.50:1:00;
Minimum unsecured interest coverage ratio (defined as consolidated net operating income from unencumbered properties to unsecured interest expense) of 1.75:1.00;
Maximum unencumbered leverage ratio (defined as consolidated unsecured indebtedness plus the Corporation’s pro rata share of unsecured indebtedness of unconsolidated affiliates, net of certain cash and cash equivalents, to total unencumbered asset value) of 0.60:1:00, which may be increased to 0.65:1.00 for four consecutive quarters after certain material acquisitions; and
Minimum tangible net worth of at least $3.01 billion plus 75% of the net proceeds of equity issuances by the Corporation or the Operating Partnership after December 31, 2014.
In addition, the Term Loan Agreement includes other customary affirmative and negative covenants, including (i) limitation on liens and negative pledges; (ii) transactions with affiliates; (iii) limitation on mergers, consolidations and sales of all or substantially all assets; (iv) maintenance of status as a REIT and listing on a national securities exchange; and (v) material modifications to organizational documents. The ability to borrow under the Term Loan Agreement is subject to continued compliance with all of the covenants described above.
As of December 31, 2017, the Corporation and the Operating Partnership were in compliance with these financial covenants.
Senior Unsecured Notes
On August 18, 2016, the Operating Partnership completed a private placement of $300.0 million aggregate principal amount senior notes through a Rule 144A offering with registration rights, which are guaranteed by the Corporation. The Senior Unsecured Notes were issued at 99.378% of their principal amount, resulting in net proceeds of $296.2 million after deducting transaction fees and expenses. The Senior Unsecured Notes accrue interest at a rate of 4.450% per year, payable on March 15 and September 15 of each year, until the maturity date of September 15, 2026. The Company filed a registration statement with the SEC to exchange the private Senior Unsecured Notes for registered Senior Unsecured Notes with substantially identical terms, which became effective April 14, 2017. All $300.0 million aggregate principal amount of private Senior Unsecured Notes were tendered in the exchange for registered Senior Unsecured Notes.
The Senior Unsecured Notes are redeemable in whole at any time or in part from time to time, at the Operating Partnership’s option, at a redemption price equal to the sum of: an amount equal to 100% of the principal amount of the Senior Unsecured Notes to be redeemed plus accrued and unpaid interest and liquidated damages, if any, up to, but not including, the redemption date; and a make-whole premium calculated in accordance with the indenture. Notwithstanding the foregoing, if any of the Senior Unsecured Notes are redeemed on or after June 15, 2026 (three months prior to the maturity date of the Senior Unsecured Notes), the redemption price will not include a make-whole premium.
In connection with the issuance of the Senior Unsecured Notes, the Corporation and Operating Partnership remain subject to compliance with certain customary restrictive covenants including:
Maximum leverage ratio (defined as consolidated total indebtedness, to total consolidated undepreciated real estate assets plus the Company’s other assets, excluding accounts receivable and non-real estate intangibles) of 0.60:1.00;
Minimum unencumbered asset coverage ratio (defined as total consolidated undepreciated real estate assets plus the Company’s other assets, excluding accounts receivable and non-real estate intangibles, to consolidated total unsecured indebtedness) of 1.50:1:00;
Maximum secured indebtedness leverage ratio (defined as consolidated total secured indebtedness, to total consolidated undepreciated real estate assets plus the Company’s other assets, excluding accounts receivable and non-real estate intangibles) of 0.40:1.00; and
Minimum fixed charge coverage ratio (defined as consolidated income available for debt service, to the annual service charge) of 1.50:1.0.
In addition, the Senior Unsecured Notes Agreement includes other customary affirmative and negative covenants, including (i) maintenance of status as a REIT; (ii) payment of all taxes, assessments and governmental charges levied on the REIT; (iii) reporting on financial information; and (iv) maintenance of properties and property insurance.
As of December 31, 2017, the Corporation and the Operating Partnership were in compliance with these financial covenants.
CMBS
We may use long-term, fixed-rate debt to finance our properties. In such events, we generally seek to use asset level financing that bears annual interest less than the annual rent on the related lease(s) and that matures prior to the expiration of such lease(s). In general, the obligor of our asset level debt is a special purpose entity that holds the real estate and other collateral securing the indebtedness. Each special purpose entity is a bankruptcy remote separate legal entity, and is the sole owner of its assets and solely responsible for its liabilities other than typical non-recurring covenants.
As of December 31, 2017, we had 12 loans with approximately $332.6 million of outstanding principal balances under our fixed rate CMBS loans, with a weighted average contractual interest rate of 5.81% and a weighted average maturity of 4.6 years. Approximately one-third of this debt is partially amortizing and requires a balloon payment at maturity. These balances include six separate fixed-rate CMBS loans that are in default due to the underperformance of the eight properties that secure them. As of December 31, 2017, the aggregate principal balance under the defaulted CMBS loans was $64.3 million, including $13.2 million of default interest added to principal, and is discussed further below. Excluding these six loans, the outstanding principal obligations under our CMBS fixed-rate loans as of December 31, 2017 was $268.3 million.
The table below shows the outstanding principal obligations, including amortization, of these CMBS fixed rate loans as of December 31, 2017 and the year in which the loans mature (dollars in thousands). The information displayed in the table excludes amounts and interest rates related to the defaulted loans and the eight properties securing them.
|
| | | | | | | | | | | | | | | | | | | | | | |
| Year of Maturity | Number of Loans | | Number of Properties | | Stated Interest Rate Range | | Weighted Average Stated Rate | | Scheduled Principal | | Balloon | | Total |
| | | | | | | | | | | | | | |
| 2018 | — |
| | — |
| | 0 | | — | % | | $ | 3,692 |
| | $ | — |
| | $ | 3,692 |
|
| 2019 | — |
| | — |
| | — | | — |
| | 3,905 |
| | — |
| | 3,905 |
|
| 2020 | — |
| | — |
| | — | | — |
| | 4,100 |
| | — |
| | 4,100 |
|
| 2021 | — |
| | — |
| | — | | — |
| | 4,365 |
| | — |
| | 4,365 |
|
| 2022 | 1 |
| | 12 |
| | 4.67% | | 4.67 |
| | 4,617 |
| | 42,400 |
| | 47,017 |
|
| Thereafter | 5 |
| | 88 |
| | 5.23%-6.00% | | 5.48 |
| | 7,276 |
| | 197,980 |
| | 205,256 |
|
| Total | 6 |
| | 100 |
| | | | 5.35 | % | | $ | 27,955 |
| | $ | 240,380 |
| | $ | 268,335 |
|
CMBS Liquidity Matters
As of December 31, 2017, we are in default on six separate CMBS loans due to the underperformance of the properties securing these loans. The wholly-owned special purpose entities subject to these mortgage loans are separate legal entities and the sole owner of their assets and responsible for their liabilities. The aggregate outstanding principal balance of these loans, including capitalized interest, totaled $64.3 million. We believe the value of these properties is less than the related debt. As a result, we have notified the lenders of each special purpose entity that we anticipate either surrendering these properties to the lenders or selling them in certain instances in exchange for relieving the indebtedness, including any accrued interest and accrued or unpaid property expenses, encumbering them.
The following table provides key elements of the defaulted mortgage loans (dollars in thousands):
|
| | | | | | | | | | | | | | | | | | | | | | | | | | | | | | | | | | | |
| Industry | Properties | | Net Book Value | | Monthly Base Rent | | Pre-Default Outstanding Principal | | Capitalized Interest (1) | | Total Debt Outstanding | | Restricted Cash (2) | | Stated Rate | | Default Rate | | Accrued Interest (1) |
| | | | | | | | | | | | | | | | | | | | |
| Manufacturing | 2 | | $ | 3,618 |
| | $ | 16 |
| | $ | 5,460 |
| | $ | 11,354 |
| | $ | 16,814 |
| | $ | — |
| | 5.85 | % | | 9.85 | % | | $ | 143 |
|
| Sporting Goods | 1 | | 3,070 |
| | — |
| | 6,321 |
| | 429 |
| | 6,750 |
| | 453 |
| | 5.62 |
| | 10.62 |
| | 80 |
|
| Consumer Electronics | 1 | | 3,021 |
| | — |
| | 8,592 |
| | 592 |
| | 9,184 |
| | 286 |
| | 5.87 |
| | 9.87 |
| | 62 |
|
| Multi-Tenant Retail | 1 | | 12,580 |
| | 95 |
| | 17,250 |
| | 398 |
| | 17,648 |
| | 575 |
| | 5.53 |
| | 7.53 |
| | 78 |
|
| Sporting Goods | 2 | | 3,457 |
| | — |
| | 9,625 |
| | 310 |
| | 9,935 |
| | — |
| | 4.39 |
| | 9.39 |
| | 78 |
|
| Sporting Goods | 1 | | 2,010 |
| | — |
| | 3,853 |
| | 128 |
| | 3,981 |
| | 169 |
| | 4.65 |
| | 9.65 |
| | 33 |
|
| 8 | | $ | 27,756 |
| | $ | 111 |
| | $ | 51,101 |
| | $ | 13,211 |
| | $ | 64,312 |
| | $ | 1,483 |
| | 5.44 | % | | 9.21 | % | | $ | 474 |
|
(1) Interest capitalized to principal that remains unpaid.
(2) Represents restricted cash controlled by the lender that may be applied to reduce the outstanding principal balance.
Debt Maturities
Future principal payments due on our various types of debt outstanding as of December 31, 2017 (in thousands):
|
| | | | | | | | | | | | | | | | | | | | | | | | | | | |
| | Total | | 2018 | | 2019 | | 2020 | | 2021 | | 2022 | | Thereafter |
| | | | | | | | | | | | | | |
| Revolving Credit Facility | 112,000 |
| | — |
| | 112,000 |
| | — |
| | — |
| | — |
| | — |
|
| Master Trust Notes | 2,248,504 |
| | 163,185 |
| | 40,230 |
| | 410,713 |
| | 237,790 |
| | 969,020 |
| | 427,566 |
|
CMBS - fixed-rate (1) | 332,647 |
| | 68,004 |
| | 3,905 |
| | 4,100 |
| | 4,365 |
| | 47,017 |
| | 205,256 |
|
| Convertible Notes | 747,500 |
| | — |
| | 402,500 |
| | — |
| | 345,000 |
| | — |
| | — |
|
| Unsecured Senior Notes | 300,000 |
| | — |
| | — |
| | — |
| | — |
| | — |
| | 300,000 |
|
| | $ | 3,740,651 |
| | $ | 231,189 |
| | $ | 558,635 |
| | $ | 414,813 |
| | $ | 587,155 |
| | $ | 1,016,037 |
| | $ | 932,822 |
|
(1) The CMBS - fixed-rate payment balance in 2018 includes $64.3 million, including $13.2 million of capitalized interest, for the acceleration of principal payable following an event of default under 6 separate CMBS loans with stated maturities in 2018.
Contractual Obligations
The following table provides information with respect to our commitments as well as potential acquisitions under contract as of December 31, 2017, the table does not reflect available debt extensions (in thousands):
|
| | | | | | | | | | | | | | | | | | | | |
| | | Payment due by period |
| | | | | | | | | | | More than |
| | | | | Less than 1 | | 1-3 years | | 3-5 years | | 5 years |
| Contractual Obligations | | Total | | Year (2018) | | (2019-2020) | | (2021-2022) | | (after 2022) |
| | | | | | | | | | | |
| Debt - Principal | | $ | 3,740,651 |
| | $ | 231,189 |
| | $ | 973,448 |
| | $ | 1,603,192 |
| | $ | 932,822 |
|
Debt - Interest (1) (3) | | 795,950 |
| | 170,252 |
| | 288,219 |
| | 192,452 |
| | 145,027 |
|
Acquisitions Under Contract (2) | | 29,281 |
| | 29,281 |
| | — |
| | — |
| | — |
|
| Capital Improvements | | 34,128 |
| | 30,203 |
| | 2,525 |
| | 1,400 |
| | — |
|
| Operating Lease Obligations | | 43,842 |
| | 3,157 |
| | 6,356 |
| | 6,312 |
| | 28,017 |
|
| Total | | $ | 4,643,852 |
| | $ | 464,082 |
| | $ | 1,270,548 |
| | $ | 1,803,356 |
| | $ | 1,105,866 |
|
(1) Excludes interest on defaulted mortgage loans.
(2) Contracts contain standard cancellation clauses contingent on results of due diligence.
(3) Debt - Interest has been calculated based on outstanding balances as of December 31, 2017 through their respective maturity dates and excludes unamortized non-cash deferred financing costs of $39.6 million, unamortized debt discount of $61.4 million and any interest due on defaulted mortgage loans, including $0.5 million accrued as of December 31, 2017.
Distribution Policy
Distributions from our current or accumulated earnings are generally classified as ordinary income, whereas distributions in excess of our current and accumulated earnings, to the extent of a stockholder’s federal income tax basis in our common stock, are generally classified as a return of capital. Under the 2017 Tax Legislation, U.S. stockholders that are individuals, trusts and estates generally may deduct up to 20% of the ordinary dividends (e.g., dividends not designated as capital gain dividends or qualified dividend income) received from a REIT for taxable years beginning after December 31, 2017 and before January 1, 2026. Distributions in excess of a stockholder’s federal income tax basis in our common stock are generally characterized as capital gain.
We are required to distribute 90% of our taxable income (subject to certain adjustments and excluding net capital gain) on an annual basis to maintain qualification as a REIT for federal income tax purposes and are required to pay federal income tax at regular corporate rates to the extent we distribute less than 100% of our taxable income (including capital gains).
We intend to make distributions that will enable us to meet the distribution requirements applicable to REITs and to eliminate or minimize our obligation to pay corporate-level federal income and excise taxes.
Any distributions will be at the sole discretion of our Board of Directors, and their form, timing and amount, if any, will depend upon a number of factors, including our actual and projected results of operations, FFO, liquidity, cash flows and financial condition, the revenue we actually receive from our properties, our operating expenses, our debt service requirements, our capital expenditures, prohibitions and other limitations under our financing arrangements, our REIT taxable income, the annual REIT distribution requirements, applicable law and such other factors as our Board of Directors deems relevant.
Cash Flows
Comparison of Years Ended December 31, 2017 and 2016
The following table presents a summary of our cash flows for the years ended December 31, 2017 and 2016 (in thousands):
|
| | | | | | | | | | | |
| | Years Ended |
| | December 31, |
| | 2017 | | 2016 | | Change |
| Net cash provided by operating activities | $ | 386,393 |
| | $ | 361,409 |
| | $ | 24,984 |
|
| Net cash provided by (used in) investing activities | 82,942 |
| | (117,251 | ) | | 200,193 |
|
| Net cash used in financing activities | (470,596 | ) | | (255,889 | ) | | (214,707 | ) |
| Net (decrease) increase in cash and cash equivalents | $ | (1,261 | ) | | $ | (11,731 | ) | | $ | 10,470 |
|
As of December 31, 2017, we had $8.8 million of unrestricted cash and cash equivalents as compared to $10.1 million as of December 31, 2016.
Operating Activities
Our cash flows from operating activities are primarily dependent upon the occupancy level of our portfolio, the rental rates specified in our leases, the collectability of rent and the level of our operating expenses and other general and administrative costs.
The increase in net cash provided by operating activities was primarily attributable to a decrease in costs associated with debt extinguishment of $22.9 million due to a lower volume of mortgage debt being extinguished, a decrease in cash paid for interest of $18.4 million related to the lower level of outstanding mortgage debt, and reduced restructuring charge payments of $11.3 million as restructuring activities were finalized in 2016, offset by a decrease in cash revenue of $19.1 million and increases in property costs of $5.8 million related to reimbursable and non-reimbursable property taxes, and G&A costs of $3.6 million.
The decrease in revenue was primarily attributable to the disposition of 192 properties, representing a gross investment in real estate during the year ended December 31, 2017 of $510.9 million, partially offset by the acquisition of 39 properties, during the same period, with a real estate investment value totaling $323.0 million.
Investing Activities
Cash provided by (used in) investing activities is generally used to fund property acquisitions, for investments in loans receivable and, to a limited extent, for capital expenditures. Cash provided by investing activities generally relates to the disposition of real estate and other assets.
Net cash provided by investing activities during 2017 included cash proceeds of $472.5 million from the disposition of 192 properties, offset by $279.9 million to fund the acquisition of 39 properties and capitalized real estate expenditures of $46.1 million and the transfer of sales proceeds to restricted cash accounts of $71.3 million . Net cash provided by investing activities also included collections of principal on loans receivable and real estate assets under direct financing leases totaling $12.8 million and the investment in notes receivable of $5.0 million.
During the same period in 2016, net cash used in investing activities included $655.8 million to fund the acquisition of 269 properties and capitalized real estate expenditures of $27.1 million partially offset by cash proceeds of $524.8 million from the disposition of 213 properties. Net cash used in investing activities also included collections of principal on loans receivable and real estate assets under direct financing leases totaling $8.4 million, offset by the release of sales proceeds from restricted cash accounts of $2.3 million.
Financing Activities
Generally, our net cash used in financing activities is impacted by our common and preferred stock offerings and activity, including repurchases of our common stock under our Stock Repurchase Program, borrowings under our Revolving Credit Facilities and Term Loan, and issuances of net-lease mortgage notes under our Spirit Master Funding Program.
Net cash used in financing activities during 2017 was primarily attributable to the repayment of the $420.0 million Term Loan, the payment of dividends to common and preferred equity owners of $341.7 million, the repurchase of 35,839,965 shares of the Company's outstanding common stock for $286.6 million and repayments of $221.3 million in mortgages and notes payable, offset by the issuance of 6.9 million shares of Class A Preferred Stock for net proceeds of $166.2 million, and debt issuances under our Spirit Master Funding Program of $618.6 million.
Net cash used in financing activities during 2016 was primarily attributable to the repayment of our indebtedness of $863.8 million and the payment of dividends to equity owners of $323.6 million, both of which were primarily funded from our operating cash flows, net borrowings under our Revolving Credit Facility and Term Loan of $86.0 million and $95.0 million, respectively, net proceeds of $298.1 million from the issuance of $300.0 million aggregate principal Senior Unsecured Notes and the sale of an aggregate 40.8 million shares of our common stock in an underwritten public offering and under our ATM Program, generating net proceeds of $368.9 million and $77.7 million, respectively.
Comparison of Years Ended December 31, 2016 and 2015
The following table presents a summary of our cash flows for the years ended December 31, 2016 and 2015 (in thousands):
|
| | | | | | | | | | | |
| | Years Ended |
| | December 31, |
| | 2016 | | 2015 | | Change |
| Net cash provided by operating activities | $ | 361,409 |
| | $ | 371,986 |
| | $ | (10,577 | ) |
| Net cash used in investing activities | (117,251 | ) | | (385,696 | ) | | 268,445 |
|
| Net cash provided by financing activities | (255,889 | ) | | (140,681 | ) | | (115,208 | ) |
| Net increase (decrease) in cash and cash equivalents | $ | (11,731 | ) | | $ | (154,391 | ) | | $ | 142,660 |
|
As of December 31, 2016, we had $10.1 million of cash and cash equivalents as compared to $21.8 million as of December 31, 2015.
Operating Activities
Our cash flows from operating activities are primarily dependent upon the occupancy level of our portfolio, the rental rates specified in our leases, the collectability of rent and the level of our operating expenses and other general and administrative costs.
The decrease in net cash provided by operating activities was primarily attributable to an increase in debt extinguishment costs of $18.1 million, restructuring charge payments of $10.2 million, G&A costs of $6.9 million, payments to terminate interest rate swap agreements of $1.7 million and net changes in operating assets and liabilities of $7.2 million, partially offset by an increase in cash revenue of $12.9 million and a decrease in cash paid for interest of $27.4 million.
The increase in revenue was primarily attributable to the acquisition of 269 properties, representing a gross investment in real estate during the year ended December 31, 2016 totaling $704.9 million partially offset by the disposition of 213 properties during the same period with a real estate investment value of $598.7 million.
Investing Activities
Cash used in investing activities is generally used to fund property acquisitions, for investments in loans receivable and, to a limited extent, for capital expenditures. Cash provided by investing activities generally relates to the disposition of real estate and other assets.
Net cash used in investing activities during 2016 included $655.8 million to fund the acquisition of 269 properties and capitalized real estate expenditures of $27.1 million partially offset by cash proceeds of $524.8 million from the disposition of 213 properties. Net cash used in investing activities also included collections of principal on loans receivable and real estate assets under direct financing leases totaling $8.4 million, offset by the release of sales proceeds from restricted cash accounts of $2.3 million.
During the same period in 2015, net cash used in investing activities included $876.0 million to fund the acquisition of 232 properties and capitalized real estate expenditures of $10.3 million partially offset by cash proceeds of $496.6 million from the disposition of 110 properties. Net cash used in investing activities also included investment in loans
receivable of $4.0 million, partially offset by the release of sales proceeds from restricted cash accounts of $41.0 million and collections of principal on loans receivable and real estate assets under direct financing leases totaling $6.8 million.
Financing Activities
Generally, our net cash (used in) provided by financing activities is impacted by our net borrowings and common stock offerings, including sales of our common stock under our ATM Program, common stock offerings, borrowings under our Revolving Credit Facilities and Term Loan, and issuances of net-lease mortgage notes under our Spirit Master Funding Program.
Net cash used in financing activities during 2016 was primarily attributable to the repayment of our indebtedness of $863.8 million and the payment of dividends to equity owners of $323.6 million, both of which were primarily funded from our operating cash flows, net borrowings under our Revolving Credit Facility and Term Loan of $86.0 million and $95.0 million, respectively, net proceeds of $298.1 million from the issuance of $300.0 million aggregate principal Senior Unsecured Notes and the sale of an aggregate 40.8 million shares of our common stock in an underwritten public offering and under our ATM Program, generating net proceeds of $368.9 million and $77.7 million, respectively.
Net cash used in financing activities during 2015 was primarily attributable to the repayment of our indebtedness of $512.5 million, the payment of dividends to equity owners of $292.3 million, both of which were paid primarily through sources from our operating cash flows, and net repayments under our Revolving Credit Facilities of $15.2 million. These amounts were partially offset by the issuance and sale of 23.0 million shares of our common stock in an underwritten public offering and the sale of 6.6 million shares of our common stock under our ATM Program for aggregate net proceeds of $347.2 million and borrowings under our Term Loan of $325.0 million.
Item 7A. Quantitative and Qualitative Disclosures About Market Risk
We are exposed to financial market risks, especially interest rate risk. Interest rates and other factors, such as occupancy, rental rates and the financial condition of our tenants, influence our performance more so than does inflation. Changes in interest rates do not necessarily correlate with inflation rates or changes in inflation rates. As described above, we generally offer leases that provide for payments of base rent with scheduled increases and, to a lesser extent, contingent rent based on a percentage of the tenant’s gross sales to help mitigate the effect of inflation. Because the properties in our portfolio are generally leased to tenants under triple-net leases, our exposure to rising property operating costs due to inflation is mitigated.
Interest rates are highly sensitive to many factors, including governmental monetary policies and domestic and global economic and political conditions, which are beyond our control. Our operating results depend heavily on the difference between the revenue from our assets and the interest expense incurred on our borrowings. We may incur additional variable rate debt in the future, including amounts that we may borrow under our Revolving Credit Facility and Term Loan. In addition, decreases in interest rates may lead to additional competition for the acquisition of real estate due to a reduction in desirable alternative income-producing investments, which may lead to a decrease in the yields on real estate we have targeted for acquisition. In such circumstances, if we are not able to offset the decrease in yields by obtaining lower interest costs on our borrowings, our results of operations will be adversely affected. Significant increases in interest rates may also have an adverse impact on our earnings if we are unable to acquire real estate with rental rates high enough to offset the increase in interest rates on our borrowings.
In the event interest rates rise significantly or there is an economic downturn, defaults may increase and result in credit losses, which may adversely affect our liquidity and operating results. In a decreasing interest rate environment, borrowers are generally more likely to prepay their loans in order to obtain financing at lower interest rates. However, the vast majority of our mortgage notes payable have prepayment clauses that make refinancing during a decreasing interest rate environment uneconomical. Investments in our mortgage loans receivable, however, have significant prepayment protection in the form of yield maintenance provisions, which provide us with substantial yield protection in a decreasing interest rate environment with respect to this portion of our investment portfolio.
The objective of our interest rate risk management policy is to match fund fixed-rate assets with fixed-rate liabilities. As of December 31, 2017, our assets were primarily long-term, fixed-rate leases (though most have scheduled rental increases during the terms of the leases). As of December 31, 2017, $3.6 billion of our indebtedness was fixed-rate, consisting of our Master Trust Notes, fixed-rate CMBS loans, Senior Unsecured Notes and Convertible Notes, with a weighted average stated interest rate of 4.67%, excluding amortization of deferred financing costs and debt discounts/premiums. As of December 31, 2017, $112.0 million of our indebtedness was variable-rate, consisting of our Revolving Credit Facility, with a weighted average stated interest rate of 2.74%, excluding amortization of deferred financing
costs and debt discounts/premiums. If one-month LIBOR as of December 31, 2017 increased by 12.5 basis points, or 0.125%, the resulting increase in annual interest expense with respect to the $112.0 million outstanding under the variable-rate obligations would impact our future earnings and cash flows by $140.0 thousand.
The estimated fair values of our debt instruments have been derived based on market quotes for comparable instruments or discounted cash flow analysis using estimates of the amount and timing of future cash flows, market rates and credit spreads. The debt instrument balances as of December 31, 2017 are as follows (in thousands):
|
| | | | | | | |
| | Carrying
Value | | Estimated
Fair Value |
| | | | |
| Revolving Credit Facility | $ | 112,000 |
| | $ | 111,997 |
|
Term Loan, net (1) | — |
| | — |
|
Senior Unsecured Notes, net (1) | 295,321 |
| | 299,049 |
|
Mortgages and notes payable, net (1) | 2,516,478 |
| | 2,657,599 |
|
Convertible Notes, net (1) | 715,881 |
| | 761,440 |
|
(1) The carrying value of the debt instruments are net of unamortized deferred financing costs and certain debt discounts/premiums.
Item 8. Financial Statements and Supplementary Data
INDEX TO CONSOLIDATED FINANCIAL STATEMENTS
|
| |
| Item 8. Financial Statements and Supplemental Data | |
| Reports of Independent Registered Public Accounting Firms | |
| Consolidated Balance Sheets of Spirit Realty Capital, Inc. as of December 31, 2017 and 2016 | |
| Consolidated Statements of Operations of Spirit Realty Capital, Inc. for the Years Ended December 31, 2017, 2016 and 2015 | |
| Consolidated Statements of Comprehensive Income of Spirit Realty Capital, Inc. for the Years Ended December 31, 2017, 2016 and 2015 | |
| Consolidated Statements of Stockholders' Equity of Spirit Realty Capital, Inc. for the Years Ended December 31, 2017, 2016 and 2015 | |
| Consolidated Statements of Cash Flows of Spirit Realty Capital, Inc. for the Years Ended December 31, 2017, 2016 and 2015 | |
| Consolidated Balance Sheets of Spirit Realty, L.P. as of December 31, 2017 and 2016 | |
| Consolidated Statements of Operations of Spirit Realty, L.P. for the Years Ended December 31, 2017, 2016 and 2015 | |
| Consolidated Statements of Comprehensive Income of Spirit Realty, L.P. for the Years Ended December 31, 2017, 2016 and 2015 | |
| Consolidated Statements of Partners' Capital of Spirit Realty, L.P. for the Years Ended December 31, 2017, 2016 and 2015 | |
| Consolidated Statements of Cash Flows of Spirit Realty, L.P. for the Years Ended December 31, 2017, 2016 and 2015 | |
| Notes to Consolidated Financial Statements | |
Report of Independent Registered Public Accounting Firm
To the Stockholders and the Board of Directors of
Spirit Realty Capital, Inc.
Opinion on Internal Control over Financial Reporting
We have audited Spirit Realty Capital, Inc.’s internal control over financial reporting as of December 31, 2017, based on criteria established in Internal Control-Integrated Framework issued by the Committee of Sponsoring Organizations of the Treadway Commission (2013 framework) (the COSO criteria). In our opinion, Spirit Realty Capital, Inc. (the Company) maintained, in all material respects, effective internal control over financial reporting as of December 31, 2017, based on the COSO criteria.
We also have audited, in accordance with the standards of the Public Company Accounting Oversight Board (United States) (PCAOB), the 2017 consolidated financial statements of the Company and our report dated February 22, 2018 expressed an unqualified opinion thereon.
Basis for Opinion
The Company’s management is responsible for maintaining effective internal control over financial reporting and for its assessment of the effectiveness of internal control over financial reporting included in the accompanying Management’s Report on Internal Control over Financial Reporting. Our responsibility is to express an opinion on the Company’s internal control over financial reporting based on our audit. We are a public accounting firm registered with the PCAOB and are required to be independent with respect to the Company in accordance with the U.S. federal securities laws and the applicable rules and regulations of the Securities and Exchange Commission and the PCAOB.
We conducted our audit in accordance with the standards of the PCAOB. Those standards require that we plan and perform the audit to obtain reasonable assurance about whether effective internal control over financial reporting was maintained in all material respects.
Our audit included obtaining an understanding of internal control over financial reporting, assessing the risk that a material weakness exists, testing and evaluating the design and operating effectiveness of internal control based on the assessed risk, and performing such other procedures as we considered necessary in the circumstances. We believe that our audit provides a reasonable basis for our opinion.
Definition and Limitations of Internal Control Over Financial Reporting
A company’s internal control over financial reporting is a process designed to provide reasonable assurance regarding the reliability of financial reporting and the preparation of financial statements for external purposes in accordance with generally accepted accounting principles. A company’s internal control over financial reporting includes those policies and procedures that (1) pertain to the maintenance of records that, in reasonable detail, accurately and fairly reflect the transactions and dispositions of the assets of the company; (2) provide reasonable assurance that transactions are recorded as necessary to permit preparation of financial statements in accordance with generally accepted accounting principles, and that receipts and expenditures of the company are being made only in accordance with authorizations of management and directors of the company; and (3) provide reasonable assurance regarding prevention or timely detection of unauthorized acquisition, use, or disposition of the company’s assets that could have a material effect on the financial statements.
Because of its inherent limitations, internal control over financial reporting may not prevent or detect misstatements. Also, projections of any evaluation of effectiveness to future periods are subject to the risk that controls may become inadequate because of changes in conditions, or that the degree of compliance with the policies or procedures may deteriorate.
/s/ Ernst & Young LLP
Dallas, Texas
February 22, 2018
Report of Independent Registered Public Accounting Firm
To the Stockholders and the Board of Directors of
Spirit Realty Capital, Inc.
Opinion on the Financial Statements
We have audited the accompanying consolidated balance sheets of Spirit Realty Capital, Inc. (the Company) as of December 31, 2017 and 2016, the related consolidated statements of operations, comprehensive income, stockholders’ equity and cash flows for each of the three years in the period ended December 31, 2017, and the related notes and financial statement schedules listed in the Index at Item 15(a) (collectively referred to as the consolidated financial statements). In our opinion, the consolidated financial statements present fairly, in all material respects, the financial position of the Company at December 31, 2017 and 2016, and the results of its operations and its cash flows for each of the three years in the period ended December 31, 2017, in conformity with U.S. generally accepted accounting principles.
We also have audited, in accordance with the standards of the Public Company Accounting Oversight Board (United States) (PCAOB), the Company’s internal control over financial reporting as of December 31, 2017, based on criteria established in Internal Control-Integrated Framework issued by the Committee of Sponsoring Organizations of the Treadway Commission (2013 framework) and our report dated February 22, 2018 expressed an unqualified opinion thereon.
Basis for Opinion
These financial statements are the responsibility of the Company‘s management. Our responsibility is to express an opinion on the Company‘s financial statements based on our audits. We are a public accounting firm registered with the PCAOB and are required to be independent with respect to the Company in accordance with the US federal securities laws and the applicable rules and regulations of the Securities and Exchange Commission and the PCAOB.
We conducted our audits in accordance with the standards of the PCAOB. Those standards require that we plan and perform the audit to obtain reasonable assurance about whether the financial statements are free of material misstatement, whether due to error or fraud. Our audits included performing procedures to assess the risks of material misstatement of the financial statements, whether due to error or fraud, and performing procedures that respond to those risks. Such procedures included examining, on a test basis, evidence regarding the amounts and disclosures in the financial statements. Our audits also included evaluating the accounting principles used and significant estimates made by management, as well as evaluating the overall presentation of the financial statements. We believe that our audits provide a reasonable basis for our opinion.
/s/ Ernst & Young LLP
We have served as the Company’s auditor since 2003.
Dallas, Texas
February 22, 2018
Report of Independent Registered Public Accounting Firm
To the Partners of Spirit Realty, L.P. and the Board of Directors of
Spirit Realty Capital, Inc.
Opinion on the Financial Statements
We have audited the accompanying consolidated balance sheets of Spirit Realty, L.P. (the Operating Partnership) as of December 31, 2017 and 2016, the related consolidated statements of operations, comprehensive income, partners’ capital and cash flows for each of the three years in the period ended December 31, 2017, and the related notes and financial statement schedules listed in the Index at Item 15(a) (collectively referred to as the consolidated financial statements). In our opinion, the consolidated financial statements present fairly, in all material respects, the financial position of the Operating Partnership at December 31, 2017 and 2016, and the results of its operations and its cash flows for each of the three years in the period ended December 31, 2017, in conformity with U.S. generally accepted accounting principles.
Basis for Opinion
These financial statements are the responsibility of the Operating Partnership's management. Our responsibility is to express an opinion on the Operating Partnership’s financial statements based on our audits. We are a public accounting firm registered with the PCAOB and are required to be independent with respect to the Operating Partnership in accordance with the U.S. federal securities laws and the applicable rules and regulations of the Securities and Exchange Commission and the PCAOB.
We conducted our audits in accordance with the standards of the PCAOB. Those standards require that we plan and perform the audit to obtain reasonable assurance about whether the financial statements are free of material misstatement, whether due to error or fraud. Our audits included performing procedures to assess the risks of material misstatement of the financial statements, whether due to error or fraud, and performing procedures that respond to those risks. Such procedures included examining, on a test basis, evidence regarding the amounts and disclosures in the financial statements. Our audits also included evaluating the accounting principles used and significant estimates made by management, as well as evaluating the overall presentation of the financial statements. We believe that our audits provide a reasonable basis for our opinion.
/s/ Ernst & Young LLP
We have served as the Operating Partnership’s auditor since 2016.
Dallas, Texas
February 22, 2018
SPIRIT REALTY CAPITAL, INC.
Consolidated Balance Sheets
(In Thousands, Except Share and Per Share Data)
|
| | | | | | | |
| | December 31,
2017 | | December 31,
2016 |
| Assets |
|
|
|
| Investments: |
|
|
|
| Real estate investments: |
|
|
|
| Land and improvements | $ | 2,588,930 |
|
| $ | 2,704,010 |
|
| Buildings and improvements | 4,692,377 |
|
| 4,775,221 |
|
| Total real estate investments | 7,281,307 |
|
| 7,479,231 |
|
| Less: accumulated depreciation | (1,075,643 | ) |
| (940,005 | ) |
| 6,205,664 |
|
| 6,539,226 |
|
| Loans receivable, net | 79,967 |
|
| 66,578 |
|
| Intangible lease assets, net | 409,903 |
|
| 470,276 |
|
| Real estate assets under direct financing leases, net | 24,865 |
|
| 36,005 |
|
| Real estate assets held for sale, net | 48,929 |
|
| 160,570 |
|
| Net investments | 6,769,328 |
|
| 7,272,655 |
|
| Cash and cash equivalents | 8,798 |
|
| 10,059 |
|
| Deferred costs and other assets, net | 231,045 |
|
| 140,917 |
|
| Goodwill | 254,340 |
|
| 254,340 |
|
| Total assets | $ | 7,263,511 |
|
| $ | 7,677,971 |
|
|
|
|
|
| Liabilities and stockholders’ equity |
|
|
|
| Liabilities: |
|
|
|
| Revolving Credit Facility | $ | 112,000 |
|
| $ | 86,000 |
|
| Term Loan, net | — |
|
| 418,471 |
|
| Senior Unsecured Notes, net | 295,321 |
| | 295,112 |
|
| Mortgages and notes payable, net | 2,516,478 |
|
| 2,162,403 |
|
| Convertible Notes, net | 715,881 |
|
| 702,642 |
|
| Total debt, net | 3,639,680 |
|
| 3,664,628 |
|
| Intangible lease liabilities, net | 155,303 |
|
| 182,320 |
|
| Accounts payable, accrued expenses and other liabilities | 148,919 |
|
| 148,915 |
|
| Total liabilities | 3,943,902 |
|
| 3,995,863 |
|
| Commitments and contingencies (see Note 8) |
|
|
|
|
|
| Stockholders’ equity: |
|
|
|
| Preferred stock and paid in capital, $0.01 par value, 20,000,000 shares authorized: 6,900,000 shares and no shares issued and outstanding at December 31, 2017 and December 31, 2016, respectively, liquidation preference of $25.00 per share | 166,193 |
| | — |
|
| Common stock, $0.01 par value, 750,000,000 shares authorized: 448,868,269 shares and 483,624,120 shares issued and outstanding at December 31, 2017 and December 31, 2016, respectively | 4,489 |
|
| 4,836 |
|
| Capital in excess of common stock par value | 5,193,631 |
|
| 5,177,086 |
|
| Accumulated deficit | (2,044,704 | ) |
| (1,499,814 | ) |
| Total stockholders’ equity | 3,319,609 |
|
| 3,682,108 |
|
| Total liabilities and stockholders’ equity | $ | 7,263,511 |
|
| $ | 7,677,971 |
|
See accompanying notes.
SPIRIT REALTY CAPITAL, INC.
Consolidated Statements of Operations
(In Thousands, Except Share and Per Share Data)
|
| | | | | | | | | | | | |
| | | Years Ended December 31, |
| | | 2017 | | 2016 | | 2015 |
| Revenues: | | | | | | |
| Rentals | | $ | 639,017 |
| | $ | 648,363 |
| | $ | 634,151 |
|
| Interest income on loans receivable | | 3,791 |
| | 5,253 |
| | 6,948 |
|
| Earned income from direct financing leases | | 2,078 |
| | 2,742 |
| | 3,024 |
|
| Tenant reimbursement income | | 16,747 |
| | 14,125 |
| | 15,952 |
|
| Other income | | 7,322 |
| | 15,491 |
| | 7,260 |
|
| Total revenues | | 668,955 |
| | 685,974 |
| | 667,335 |
|
| Expenses: | | | | | | |
| General and administrative | | 62,064 |
| | 52,615 |
| | 47,730 |
|
| Restructuring charges | | — |
| | 6,341 |
| | 7,056 |
|
| Transaction costs | | 6,361 |
| | — |
| | — |
|
| Property costs (including reimbursable) | | 36,617 |
| | 30,839 |
| | 27,715 |
|
| Real estate acquisition costs | | 1,356 |
| | 3,229 |
| | 2,739 |
|
| Interest | | 190,127 |
| | 196,586 |
| | 222,901 |
|
| Depreciation and amortization | | 256,019 |
| | 262,276 |
| | 260,633 |
|
| Impairments | | 102,330 |
| | 88,275 |
| | 70,695 |
|
| Total expenses | | 654,874 |
| | 640,161 |
| | 639,469 |
|
| Income from continuing operations before other (expense) income and income tax expense | | 14,081 |
| | 45,813 |
| | 27,866 |
|
| Other (expense) income: | | | | | | |
| (Loss) gain on debt extinguishment | | (1,645 | ) | | 233 |
| | (3,162 | ) |
| Total other (expense) income | | (1,645 | ) | | 233 |
| | (3,162 | ) |
| Income from continuing operations before income tax expense | | 12,436 |
| | 46,046 |
| | 24,704 |
|
| Income tax expense | | (394 | ) | | (965 | ) | | (601 | ) |
| Income from continuing operations | | 12,042 |
| | 45,081 |
| | 24,103 |
|
| Discontinued operations: | | | | | | |
| Income from discontinued operations | | — |
| | — |
| | 98 |
|
| Gain on disposition of assets | | — |
| | — |
| | 590 |
|
| Income from discontinued operations | | — |
| | — |
| | 688 |
|
| Income before gain on disposition of assets | | 12,042 |
| | 45,081 |
| | 24,791 |
|
| Gain on disposition of assets | | 65,106 |
| | 52,365 |
| | 68,421 |
|
| Net Income | | 77,148 |
| | 97,446 |
| | 93,212 |
|
| Dividends paid to preferred stockholders | | (2,530 | ) | | — |
| | — |
|
| Net income attributable to common stockholders | | $ | 74,618 |
| | $ | 97,446 |
| | $ | 93,212 |
|
| | | | | | | |
| Net income per share attributable to common stockholders—basic | | $ | 0.16 |
| | $ | 0.21 |
| | $ | 0.21 |
|
| | | | | | | |
| Net income per share attributable to common stockholders—diluted | | $ | 0.16 |
| | $ | 0.21 |
| | $ | 0.21 |
|
| Weighted average shares of common stock outstanding: | | | | | | |
| Basic | | 467,934,945 |
| | 469,217,776 |
| | 432,222,953 |
|
| Diluted | | 467,942,788 |
| | 469,246,265 |
| | 432,545,625 |
|
See accompanying notes.
SPIRIT REALTY CAPITAL, INC.
Consolidated Statements of Comprehensive Income
(In Thousands)
|
| | | | | | | | | | | |
| | Years Ended December 31, |
| | 2017 | | 2016 | | 2015 |
| Net income attributable to common stockholders | $ | 74,618 |
| | $ | 97,446 |
| | $ | 93,212 |
|
| Other comprehensive income: | | | | | |
| Change in net unrealized losses on cash flow hedges | — |
| | (1,137 | ) | | (1,190 | ) |
| Net cash flow hedge losses reclassified to operations | — |
| | 2,165 |
| | 1,245 |
|
| Total comprehensive income | $ | 74,618 |
| | $ | 98,474 |
| | $ | 93,267 |
|
See accompanying notes.
SPIRIT REALTY CAPITAL, INC.
Consolidated Statements of Stockholders’ Equity
(In Thousands, Except Share Data)
|
| | | | | | | | | | | | | | | | | | | | | | | | | | | | | | |
| | | Preferred Stock | | Common Stock | | Accumulated Deficit | | | | Total Stockholders’ Equity |
| | | Shares | | Par
Value and Capital in Excess of Par Value | | Shares | | Par
Value | | Capital in Excess of Par Value | | | AOCL | |
| Balances, December 31, 2014 | | — |
| | $ | — |
| | 411,350,440 |
| | $ | 4,113 |
| | $ | 4,361,320 |
| | $ | (1,052,688 | ) | | $ | (1,083 | ) | | $ | 3,311,662 |
|
| Net income | | — |
| | — |
| | — |
| | — |
| | — |
| | 93,212 |
| | — |
| | 93,212 |
|
| Other comprehensive income | | — |
| | — |
| | — |
| | — |
| | — |
| | — |
| | 55 |
| | 55 |
|
| Dividends declared on common stock | | — |
| | — |
| | — |
| | — |
| | — |
| | (298,531 | ) | | — |
| | (298,531 | ) |
| Tax withholdings related to net stock settlements | | — |
| | — |
| | (426,158 | ) | | (4 | ) | | — |
| | (4,268 | ) | | — |
| | (4,272 | ) |
| Issuance of shares of common stock, net | | — |
| | — |
| | 29,610,100 |
| | 296 |
| | 346,915 |
| | — |
| | — |
| | 347,211 |
|
| Exercise of stock options | | — |
| | — |
| | 5,000 |
| | — |
| | 46 |
| | — |
| | — |
| | 46 |
|
| Stock-based compensation, net | | — |
| | — |
| | 1,280,582 |
| | 13 |
| | 13,042 |
| | (564 | ) | | — |
| | 12,491 |
|
| Balances, December 31, 2015 | | — |
| | $ | — |
| | 441,819,964 |
| | $ | 4,418 |
| | $ | 4,721,323 |
| | $ | (1,262,839 | ) | | $ | (1,028 | ) | | $ | 3,461,874 |
|
| Net income | | — |
| | — |
| | — |
| | — |
| | — |
| | 97,446 |
| | — |
| | 97,446 |
|
| Other comprehensive income | | — |
| | — |
| | — |
| | — |
| | — |
| | — |
| | 1,028 |
| | 1,028 |
|
| Dividends declared on common stock | | — |
| | — |
| | — |
| | — |
| | — |
| | (333,180 | ) | | — |
| | (333,180 | ) |
| Tax withholdings related to net stock settlements | | — |
| | — |
| | (72,835 | ) | | (1 | ) | | — |
| | (752 | ) | | — |
| | (753 | ) |
| Issuance of shares of common stock, net | | — |
| | — |
| | 40,835,360 |
| | 408 |
| | 446,205 |
| | — |
| | — |
| | 446,613 |
|
| Stock-based compensation, net | | — |
| | — |
| | 1,041,631 |
| | 11 |
| | 9,558 |
| | (489 | ) | | — |
| | 9,080 |
|
| Balances, December 31, 2016 | | — |
| | $ | — |
| | 483,624,120 |
| | $ | 4,836 |
| | $ | 5,177,086 |
| | $ | (1,499,814 | ) | | $ | — |
| | $ | 3,682,108 |
|
| Net income | | — |
| | — |
| | — |
| | — |
| | — |
| | 77,148 |
| | — |
| | 77,148 |
|
| Dividends declared on preferred stock | | — |
| | — |
| | — |
| | — |
| | — |
| | (2,530 | ) | | — |
| | (2,530 | ) |
| Net income available to common stockholders | | — |
| | — |
| | — |
| | — |
| | — |
| | 74,618 |
| | — |
| | 74,618 |
|
| Issuance of preferred stock | | 6,900,000 |
| | 166,193 |
| | — |
| | — |
| | — |
| | — |
| | — |
| | 166,193 |
|
| Dividends declared on common stock | | — |
| | — |
| | — |
| | — |
| | — |
| | (332,402 | ) | | — |
| | (332,402 | ) |
| Tax withholdings related to net stock settlements | | — |
| | — |
| | (440,312 | ) | | (4 | ) | | — |
| | (3,538 | ) | | — |
| | (3,542 | ) |
| Repurchase of common shares | | — |
| | — |
| | (35,839,965 | ) | | (358 | ) | | — |
| | (282,731 | ) | | — |
| | (283,089 | ) |
| Stock-based compensation, net | | — |
| | — |
| | 1,524,426 |
| | 15 |
| | 16,545 |
| | (837 | ) | | — |
| | 15,723 |
|
| Balances, December 31, 2017 | | 6,900,000 |
| | $ | 166,193 |
| | 448,868,269 |
| | $ | 4,489 |
| | $ | 5,193,631 |
| | $ | (2,044,704 | ) | | $ | — |
| | $ | 3,319,609 |
|
See accompanying notes.
SPIRIT REALTY CAPITAL, INC.
Consolidated Statements of Cash Flows
(In Thousands)
|
| | | | | | | | | | | | |
| | | Years Ended December 31, |
| | | 2017 | | 2016 | | 2015 |
| Operating activities | | | | | | |
| Net Income | | $ | 77,148 |
| | $ | 97,446 |
| | $ | 93,212 |
|
| Adjustments to reconcile net income to net cash provided by operating activities: | | | | | | |
| Depreciation and amortization | | 256,019 |
| | 262,276 |
| | 260,633 |
|
| Impairments | | 102,330 |
| | 88,275 |
| | 70,729 |
|
| Amortization of deferred financing costs | | 9,896 |
| | 9,070 |
| | 7,937 |
|
| Payments to terminate interest rate swap | | — |
| | (1,724 | ) | | — |
|
| Derivative net settlements, amortization and terminations | | — |
| | 1,811 |
| | (132 | ) |
| Amortization of debt discounts | | 13,572 |
| | 6,217 |
| | 2,322 |
|
| Stock-based compensation expense | | 16,560 |
| | 9,570 |
| | 13,321 |
|
| Loss (gain) on debt extinguishment | | 1,645 |
| | (233 | ) | | 3,162 |
|
| Debt extinguishment costs | | (3,305 | ) | | (26,219 | ) | | (8,112 | ) |
| Gains on dispositions of real estate and other assets | | (65,106 | ) | | (52,365 | ) | | (69,011 | ) |
| Non-cash revenue | | (28,439 | ) | | (26,333 | ) | | (20,930 | ) |
| Bad debt expense and other | | 5,913 |
| | (594 | ) | | 151 |
|
| Changes in operating assets and liabilities: | | | | | | |
| Deferred costs and other assets, net | | (1,418 | ) | | (6,561 | ) | | (604 | ) |
| Accounts payable, accrued expenses and other liabilities | | 1,578 |
| | 6,308 |
| | 13,382 |
|
| Accrued restructuring charges | | — |
| | (5,535 | ) | | 5,926 |
|
| Net cash provided by operating activities | | 386,393 |
| | 361,409 |
| | 371,986 |
|
| Investing activities | | | | | | |
| Acquisitions of real estate | | (279,934 | ) | | (655,835 | ) | | (875,983 | ) |
| Capitalized real estate expenditures | | (46,100 | ) | | (27,078 | ) | | (10,269 | ) |
| Investments in loans receivable | | (4,995 | ) | | (5,073 | ) | | (4,020 | ) |
| Collections of principal on loans receivable and real estate assets under direct financing leases | | 12,769 |
| | 8,410 |
| | 6,822 |
|
| Proceeds from dispositions of real estate and other assets | | 472,496 |
| | 524,776 |
| | 496,646 |
|
| Transfers of net sales proceeds from (to) restricted accounts pursuant to 1031 Exchanges | | — |
| | 39,869 |
| | (39,869 | ) |
| Transfers of net sales proceeds (to) from Master Trust Release | | (71,294 | ) | | (2,320 | ) | | 40,977 |
|
| Net cash provided by (used in) investing activities | | 82,942 |
| | (117,251 | ) | | (385,696 | ) |
SPIRIT REALTY CAPITAL, INC.
Consolidated Statements of Cash Flows
(In Thousands)
|
| | | | | | | | | | | | |
| | | Years Ended December 31, |
| | | 2017 | | 2016 | | 2015 |
| Financing activities | | | | | | |
| Borrowings under Revolving Credit Facilities | | 940,200 |
| | 1,080,000 |
| | 798,000 |
|
| Repayments under Revolving Credit Facilities | | (914,200 | ) | | (994,000 | ) | | (813,181 | ) |
| Borrowings under mortgages and notes payable | | 618,603 |
| | — |
| | — |
|
| Repayments under mortgages and notes payable | | (221,310 | ) | | (863,836 | ) | | (512,486 | ) |
| Borrowings under Term Loan | | — |
| | 796,000 |
| | 325,000 |
|
| Repayments under Term Loan | | (420,000 | ) | | (701,000 | ) | | — |
|
| Borrowings under Senior Unsecured Notes | | — |
| | 298,134 |
| | — |
|
| Deferred financing costs | | (8,255 | ) | | (4,352 | ) | | (6,150 | ) |
| Proceeds from issuance of common stock, net of offering costs | | — |
| | 446,613 |
| | 347,211 |
|
| Proceeds from issuance of preferred stock, net of offering costs | | 166,193 |
| | — |
| | — |
|
| Repurchase of shares of common stock | | (286,631 | ) | | (753 | ) | | (4,272 | ) |
| Proceeds from exercise of stock options | | — |
| | — |
| | 46 |
|
| Preferred stock dividends paid | | (2,530 | ) | | — |
| | — |
|
| Common stock dividends paid | | (339,174 | ) | | (323,640 | ) | | (292,262 | ) |
| Transfers (from) to reserve/escrow deposits with lenders, net | | (3,492 | ) | | 10,945 |
| | 17,413 |
|
| Net cash used in financing activities | | (470,596 | ) | | (255,889 | ) | | (140,681 | ) |
| Net decrease in cash and cash equivalents | | (1,261 | ) | | (11,731 | ) | | (154,391 | ) |
| Cash and cash equivalents, beginning of year | | 10,059 |
| | 21,790 |
| | 176,181 |
|
| Cash and cash equivalents, end of year | | $ | 8,798 |
| | $ | 10,059 |
| | $ | 21,790 |
|
See accompanying notes.
SPIRIT REALTY, L.P.
Consolidated Balance Sheets
(In Thousands, Except Unit and Per Unit Data)
|
| | | | | | | |
| | December 31,
2017 | | December 31,
2016 |
| Assets | | | |
| Investments: | | | |
| Real estate investments: | | | |
| Land and improvements | $ | 2,588,930 |
| | $ | 2,704,010 |
|
| Buildings and improvements | 4,692,377 |
| | 4,775,221 |
|
| Total real estate investments | 7,281,307 |
| | 7,479,231 |
|
| Less: accumulated depreciation | (1,075,643 | ) | | (940,005 | ) |
| | 6,205,664 |
| | 6,539,226 |
|
| Loans receivable, net | 79,967 |
| | 66,578 |
|
| Intangible lease assets, net | 409,903 |
| | 470,276 |
|
| Real estate assets under direct financing leases, net | 24,865 |
| | 36,005 |
|
| Real estate assets held for sale, net | 48,929 |
| | 160,570 |
|
| Net investments | 6,769,328 |
| | 7,272,655 |
|
| Cash and cash equivalents | 8,798 |
| | 10,059 |
|
| Deferred costs and other assets, net | 231,045 |
| | 140,917 |
|
| Goodwill | 254,340 |
| | 254,340 |
|
| Total assets | $ | 7,263,511 |
| | $ | 7,677,971 |
|
| Liabilities and stockholders’ equity | | | |
| Liabilities: | | | |
| Revolving Credit Facility | $ | 112,000 |
| | $ | 86,000 |
|
| Term Loan, net | — |
| | 418,471 |
|
| Senior Unsecured Notes, net | 295,321 |
| | 295,112 |
|
| Mortgages and notes payable, net | 2,516,478 |
| | 2,162,403 |
|
| Notes payable to Spirit Realty Capital, Inc., net | 715,881 |
| | 702,642 |
|
| Total debt, net | 3,639,680 |
| | 3,664,628 |
|
| Intangible lease liabilities, net | 155,303 |
| | 182,320 |
|
| Accounts payable, accrued expenses and other liabilities | 148,919 |
| | 148,915 |
|
| Total liabilities | 3,943,902 |
| | 3,995,863 |
|
| Commitments and contingencies (see Note 8) |
|
| |
|
|
| Partners' Capital | | | |
| Partnership units | | | |
| General partner's common capital, 3,988,218 units issued and outstanding as of both December 31, 2017 and December 31, 2016 | 24,426 |
| | 26,586 |
|
| Limited partners' preferred capital: 6,900,000 and no units issued and outstanding as of December 31, 2017 and December 31, 2016, respectively | 166,193 |
| | — |
|
| Limited partners' common capital, 444,880,051 and 479,635,902 units issued and outstanding as of December 31, 2017 and December 31, 2016, respectively | 3,128,990 |
| | 3,655,522 |
|
| Total partners' capital | 3,319,609 |
| | 3,682,108 |
|
| Total liabilities and partners' capital | $ | 7,263,511 |
| | $ | 7,677,971 |
|
See accompanying notes.
SPIRIT REALTY, L.P.
Consolidated Statements of Operations
(In Thousands, Except Unit and Per Unit Data)
|
| | | | | | | | | | | | |
| | | Years Ended December 31, |
| | | 2017 | | 2016 | | 2015 |
| Revenues: | | | | | | |
| Rentals | | $ | 639,017 |
| | $ | 648,363 |
| | $ | 634,151 |
|
| Interest income on loans receivable | | 3,791 |
| | 5,253 |
| | 6,948 |
|
| Earned income from direct financing leases | | 2,078 |
| | 2,742 |
| | 3,024 |
|
| Tenant reimbursement income | | 16,747 |
| | 14,125 |
| | 15,952 |
|
| Other income | | 7,322 |
| | 15,491 |
| | 7,260 |
|
| Total revenues | | 668,955 |
| | 685,974 |
| | 667,335 |
|
| Expenses: | | | | | | |
| General and administrative | | 62,064 |
| | 52,615 |
| | 47,730 |
|
| Restructuring charges | | — |
| | 6,341 |
| | 7,056 |
|
| Transaction costs | | 6,361 |
| | — |
| | — |
|
| Property costs (including reimbursable) | | 36,617 |
| | 30,839 |
| | 27,715 |
|
| Real estate acquisition costs | | 1,356 |
| | 3,229 |
| | 2,739 |
|
| Interest | | 190,127 |
| | 196,586 |
| | 222,901 |
|
| Depreciation and amortization | | 256,019 |
| | 262,276 |
| | 260,633 |
|
| Impairments | | 102,330 |
| | 88,275 |
| | 70,695 |
|
| Total expenses | | 654,874 |
| | 640,161 |
| | 639,469 |
|
| Income from continuing operations before other (expense) income and income tax expense | | 14,081 |
| | 45,813 |
| | 27,866 |
|
| Other (expense) income: | | | | | | |
| (Loss) gain on debt extinguishment | | (1,645 | ) | | 233 |
| | (3,162 | ) |
| Total other (expense) income | | (1,645 | ) | | 233 |
| | (3,162 | ) |
| Income from continuing operations before income tax expense | | 12,436 |
| | 46,046 |
| | 24,704 |
|
| Income tax expense | | (394 | ) | | (965 | ) | | (601 | ) |
| Income from continuing operations | | 12,042 |
| | 45,081 |
| | 24,103 |
|
| Discontinued operations: | | | | | | |
| Income from discontinued operations | | — |
| | — |
| | 98 |
|
| Gain on disposition of assets | | — |
| | — |
| | 590 |
|
| Income from discontinued operations | | — |
| | — |
| | 688 |
|
| Income before gain on disposition of assets | | 12,042 |
| | 45,081 |
| | 24,791 |
|
| Gain on disposition of assets | | 65,106 |
| | 52,365 |
| | 68,421 |
|
| Net income | | $ | 77,148 |
| | $ | 97,446 |
| | $ | 93,212 |
|
| Preferred distributions | | (2,530 | ) | | — |
| | — |
|
| Net income after preferred distributions | | 74,618 |
| | 97,446 |
| | 93,212 |
|
| | | | | | | |
| Net income attributable to general partners | | 657 |
| | 825 |
| | 855 |
|
| Net income attributable to limited partners | | 76,491 |
| | 96,621 |
| | 92,357 |
|
| | | | | | | |
| Net income per common partnership unit - basic | | $ | 0.16 |
| | $ | 0.21 |
| | $ | 0.21 |
|
| | | | | | | |
| Net income per common partnership unit —diluted | | $ | 0.16 |
| | $ | 0.21 |
| | $ | 0.21 |
|
| Weighted average common partnership units outstanding: | | | | | | |
| Basic | | 467,934,945 |
| | 469,217,776 |
| | 432,222,953 |
|
| Diluted | | 467,942,788 |
| | 469,246,265 |
| | 432,545,625 |
|
See accompanying notes.
SPIRIT REALTY, L.P.
Consolidated Statements of Comprehensive Income
(In Thousands)
|
| | | | | | | | | | | |
| | Years Ended December 31, |
| | 2017 | | 2016 | | 2015 |
| Net income | $ | 77,148 |
| | $ | 97,446 |
| | $ | 93,212 |
|
| Other comprehensive income: | | | | | |
| Change in net unrealized losses on cash flow hedges | — |
| | (1,137 | ) | | (1,190 | ) |
| Net cash flow hedge losses reclassified to operations | — |
| | 2,165 |
| | 1,245 |
|
| Total comprehensive income | $ | 77,148 |
| | $ | 98,474 |
| | $ | 93,267 |
|
See accompanying notes.
SPIRIT REALTY, L.P.
Consolidated Statements of Partners' Capital
(In Thousands, Except Unit Data)
|
| | | | | | | | | | | | | | | | | | | | | | | | | |
| | Preferred Units | | Common Units | | Total Partnership Capital |
| | | Limited Partners' Capital (2) | | General Partner's Capital (1) | | Limited Partners' Capital (2) | |
| | | Units | | Amount | | Units | | Amount | | Units | | Amount | |
| Balances, December 31, 2014 | | — |
| | $ | — |
| | 3,988,218 |
| | $ | 30,456 |
| | 407,362,222 |
| | $ | 3,281,206 |
| | $ | 3,311,662 |
|
| Net income | | — |
| | — |
| | — |
| | 855 |
| | — |
| | 92,357 |
| | 93,212 |
|
| Other comprehensive income | | — |
| | — |
| | — |
| | 1 |
| | — |
| | 54 |
| | 55 |
|
| Partnership distributions declared | | — |
| | — |
| | — |
| | (2,738 | ) | | — |
| | (295,793 | ) | | (298,531 | ) |
| Tax withholdings related to net settlement of partnership units | | — |
| | — |
| | — |
| | — |
| | (426,158 | ) | | (4,272 | ) | | (4,272 | ) |
| Issuance of partnership units, net | | — |
| | — |
| | — |
| | — |
| | 29,610,100 |
| | 347,211 |
| | 347,211 |
|
| Exercise of partnership units | | — |
| | — |
| | — |
| | — |
| | 5,000 |
| | 46 |
| | 46 |
|
| Stock-based compensation, net | | — |
| | — |
| | — |
| | — |
| | 1,280,582 |
| | 12,491 |
| | 12,491 |
|
| Balances, December 31, 2015 | | — |
| | $ | — |
| | 3,988,218 |
| | $ | 28,574 |
| | 437,831,746 |
| | $ | 3,433,300 |
| | $ | 3,461,874 |
|
| Net income | | — |
| | — |
| | — |
| | 825 |
| | — |
| | 96,621 |
| | 97,446 |
|
| Other comprehensive income | | — |
| | — |
| | — |
| | 9 |
| | — |
| | 1,019 |
| | 1,028 |
|
| Partnership distributions declared | | — |
| | — |
| | — |
| | (2,822 | ) | | — |
| | (330,358 | ) | | (333,180 | ) |
| Tax withholdings related to net settlement of partnership units | | — |
| | — |
| | — |
| | — |
| | (72,835 | ) | | (753 | ) | | (753 | ) |
| Issuance of partnership units, net | | — |
| | — |
| | — |
| | — |
| | 40,835,360 |
| | 446,613 |
| | 446,613 |
|
| Stock-based compensation, net | | — |
| | — |
| | — |
| | — |
| | 1,041,631 |
| | 9,080 |
| | 9,080 |
|
| Balances, December 31, 2016 | | — |
| | $ | — |
| | 3,988,218 |
| | $ | 26,586 |
| | 479,635,902 |
| | $ | 3,655,522 |
| | $ | 3,682,108 |
|
| Net income | | — |
| | — |
| | — |
| | $ | 657 |
| | — |
| | $ | 76,491 |
| | $ | 77,148 |
|
| Partnership distributions declared on preferred units | | — |
| | — |
| | — |
| | — |
| | — |
| | (2,530 | ) | | (2,530 | ) |
| Net income after preferred distributions | | | | — |
| | | | 657 |
| | — |
| | 73,961 |
| | 74,618 |
|
| Issuance of preferred partnership units | | 6,900,000 |
| | 166,193 |
| | — |
| | — |
| | — |
| | — |
| | 166,193 |
|
| Partnership distributions declared on common units | | — |
| | — |
| | — |
| | (2,817 | ) | | — |
| | (329,585 | ) | | (332,402 | ) |
| Tax withholdings related to net partnership unit settlements | | — |
| | — |
| | — |
| | — |
| | (440,312 | ) | | (3,542 | ) | | (3,542 | ) |
| Repurchase of partnership units | | — |
| | — |
| | — |
| | — |
| | (35,839,965 | ) | | (283,089 | ) | | (283,089 | ) |
| Stock-based compensation | | — |
| | — |
| | — |
| | — |
| | 1,524,426 |
| | 15,723 |
| | 15,723 |
|
| Balances, December 31, 2017 | | 6,900,000 |
| | $ | 166,193 |
| | 3,988,218 |
| | $ | 24,426 |
| | 444,880,051 |
| | $ | 3,128,990 |
| | $ | 3,319,609 |
|
(1) Consists of general partnership interests held by Spirit General OP Holdings, LLC.
(2) Consists of limited partnership interests held by Spirit Realty Capital, Inc. and Spirit Notes Partner, LLC.
See accompanying notes.
SPIRIT REALTY, L.P.
Consolidated Statements of Cash Flows
(In Thousands)
|
| | | | | | | | | | | |
| | Years Ended December 31, |
| | 2017 | | 2016 | | 2015 |
| Operating activities | | | | | |
| Net Income | $ | 77,148 |
| | $ | 97,446 |
| | $ | 93,212 |
|
| Adjustments to reconcile net income to net cash provided by operating activities: | | | | | |
| Depreciation and amortization | 256,019 |
| | 262,276 |
| | 260,633 |
|
| Impairments | 102,330 |
| | 88,275 |
| | 70,729 |
|
| Amortization of deferred financing costs | 9,896 |
| | 9,070 |
| | 7,937 |
|
| Payments to terminate interest rate swap | — |
| | (1,724 | ) | | — |
|
| Derivative net settlements, amortization and terminations | — |
| | 1,811 |
| | (132 | ) |
| Amortization of debt discounts | 13,572 |
| | 6,217 |
| | 2,322 |
|
| Stock-based compensation expense | 16,560 |
| | 9,570 |
| | 13,321 |
|
| Loss (gain) on debt extinguishment | 1,645 |
| | (233 | ) | | 3,162 |
|
| Debt extinguishment costs | (3,305 | ) | | (26,219 | ) | | (8,112 | ) |
| Gains on dispositions of real estate and other assets | (65,106 | ) | | (52,365 | ) | | (69,011 | ) |
| Non-cash revenue | (28,439 | ) | | (26,333 | ) | | (20,930 | ) |
| Bad debt expense and other | 5,913 |
| | (594 | ) | | 151 |
|
| Changes in operating assets and liabilities: | | | | | |
| Deferred costs and other assets, net | (1,418 | ) | | (6,561 | ) | | (604 | ) |
| Accounts payable, accrued expenses and other liabilities | 1,578 |
| | 6,308 |
| | 13,382 |
|
| Accrued restructuring charges | — |
| | (5,535 | ) | | 5,926 |
|
| Net cash provided by operating activities | 386,393 |
| | 361,409 |
| | 371,986 |
|
| Investing activities | | | | | |
| Acquisitions of real estate | (279,934 | ) | | (655,835 | ) | | (875,983 | ) |
| Capitalized real estate expenditures | (46,100 | ) | | (27,078 | ) | | (10,269 | ) |
| Investments in loans receivable | (4,995 | ) | | (5,073 | ) | | (4,020 | ) |
| Collections of principal on loans receivable and real estate assets under direct financing leases | 12,769 |
| | 8,410 |
| | 6,822 |
|
| Proceeds from dispositions of real estate and other assets | 472,496 |
| | 524,776 |
| | 496,646 |
|
| Transfers of net sales proceeds from (to) restricted accounts pursuant to 1031 Exchanges | — |
| | 39,869 |
| | (39,869 | ) |
| Transfers of net sales proceeds (to) from Master Trust Release | (71,294 | ) | | (2,320 | ) | | 40,977 |
|
| Net cash provided by (used in) investing activities | 82,942 |
| | (117,251 | ) | | (385,696 | ) |
|
| | | | | | | | | | | |
| | Years Ended December 31, |
| | 2017 | | 2016 | | 2015 |
| Financing activities |
|
| |
|
| |
|
|
| Borrowings under Revolving Credit Facilities | 940,200 |
| | 1,080,000 |
| | 798,000 |
|
| Repayments under Revolving Credit Facilities | (914,200 | ) | | (994,000 | ) | | (813,181 | ) |
| Borrowings under mortgages and notes payable | 618,603 |
| | — |
| | — |
|
| Repayments under mortgages and notes payable | (221,310 | ) | | (863,836 | ) | | (512,486 | ) |
| Borrowings under Term Loan | — |
| | 796,000 |
| | 325,000 |
|
| Repayments under Term Loan | (420,000 | ) | | (701,000 | ) | | — |
|
| Borrowings under Senior Unsecured Notes | — |
| | 298,134 |
| | — |
|
| Deferred financing costs | (8,255 | ) | | (4,352 | ) | | (6,150 | ) |
| Proceeds from issuance of common stock, net of offering costs | — |
| | 446,613 |
| | 347,211 |
|
| Proceeds from issuance of preferred stock, net of offering costs | 166,193 |
| | — |
| | — |
|
| Repurchase of partnership units | (286,631 | ) | | (753 | ) | | (4,272 | ) |
| Proceeds from exercise of partnership units | — |
| | — |
| | 46 |
|
| Preferred distributions paid | (2,530 | ) | | — |
| | — |
|
| Common distributions paid | (339,174 | ) | | (323,640 | ) | | (292,262 | ) |
| Transfers (from) to reserve/escrow deposits with lenders, net | (3,492 | ) | | 10,945 |
| | 17,413 |
|
| Net cash used in financing activities | (470,596 | ) | | (255,889 | ) | | (140,681 | ) |
| Net decrease in cash and cash equivalents | (1,261 | ) | | (11,731 | ) | | (154,391 | ) |
| Cash and cash equivalents, beginning of year | 10,059 |
| | 21,790 |
| | 176,181 |
|
| Cash and cash equivalents, end of year | $ | 8,798 |
| | $ | 10,059 |
| | $ | 21,790 |
|
SPIRIT REALTY CAPITAL, INC. and SPIRIT REALTY, L.P.
Notes to Consolidated Financial Statements
December 31, 2017
Note 1. Organization
Organization and Operations
Spirit Realty Capital, Inc. (the "Corporation" or, with its consolidated subsidiaries, the "Company") operates as a self-administered and self-managed REIT that seeks to generate and deliver sustainable and attractive returns for stockholders by investing primarily in and managing a portfolio of single-tenant, operationally essential real estate throughout the U.S. that is generally leased on a long-term, triple-net basis to tenants operating within predominantly retail, but also office and industrial property types. Single tenant, operationally essential real estate generally refers to free-standing, commercial real estate facilities where tenants conduct activities that are essential to the generation of their sales and profits.The Company began operations through a predecessor legal entity in 2003.
The Company’s operations are generally carried out through Spirit Realty, L.P. (the "Operating Partnership") and its subsidiaries. Spirit General OP Holdings, LLC ("OP Holdings"), one of the Corporation's wholly-owned subsidiaries, is the sole general partner and owns approximately 1% of the Operating Partnership. The Corporation and a wholly-owned subsidiary ("Spirit Notes Partner, LLC") are the only limited partners and together own the remaining 99% of the Operating Partnership.
On August 3, 2017, the Company announced a proposed Spin-Off of almost all of its interests in properties leased to Shopko, assets that collateralize Master Trust 2014 and other additional assets into an independent, publicly traded REIT, Spirit MTA REIT, or SMTA. Transaction costs associated with the spin off for the year ended December 31, 2017 totaled $6.4 million, and are included within transaction costs on the accompanying consolidated statements of operations.
Note 2. Summary of Significant Accounting Policies
Basis of Accounting and Principles of Consolidation
The accompanying consolidated financial statements of the Company and the Operating Partnership have been prepared on the accrual basis of accounting, in accordance with GAAP. The consolidated financial statements of the Company include the accounts of the Corporation and its wholly-owned subsidiaries. The consolidated financial statements of the Operating Partnership include the accounts of the Operating Partnership and its wholly-owned subsidiaries. All significant intercompany balances and transactions have been eliminated in consolidation.
All expenses incurred by the Company have been allocated to the Operating Partnership in accordance with the Operating Partnership's first amended and restated agreement of limited partnership, which management determined to be a reasonable method of allocation. Therefore, expenses incurred would not be materially different if the Operating Partnership had operated as an unaffiliated entity.
The Company has formed numerous special purpose entities to acquire and hold real estate encumbered by indebtedness (see Note 4). Each special purpose entity is a separate legal entity and is the sole owner of its assets and responsible for its liabilities. The assets of these special purpose entities are not available to pay, or otherwise satisfy obligations to, the creditors of any affiliate or owner of another entity unless the special purpose entities have expressly agreed and are permitted under their governing documents. As of December 31, 2017 and 2016, net assets totaling $2.78 billion and $2.95 billion, respectively, were held, and net liabilities totaling $2.63 billion and $2.26 billion, respectively, were owed by these encumbered special purpose entities and are included in the accompanying consolidated balance sheets.
Use of Estimates
The preparation of financial statements in conformity with GAAP requires management to make estimates and assumptions that affect the reported amounts of assets and liabilities at the date of the financial statements and the reported amounts of revenues and expenses during the reporting period. Although management believes its estimates are reasonable, actual results could differ from those estimates.
SPIRIT REALTY CAPITAL, INC. and SPIRIT REALTY, L.P.
Notes to Consolidated Financial Statements - (continued)
December 31, 2017
Segment Reporting
The Company views its operations as one segment, which consists of net leasing operations. The Company has no other reportable segments.
Real Estate Investments
Carrying Value of Real Estate Investments
The Company’s real estate properties are recorded at cost and depreciated using the straight-line method over the estimated remaining useful lives of the properties, which generally range from 20 to 50 years for buildings and improvements and from 5 to 20 years for land improvements. Portfolio assets classified as “held for sale” are not depreciated. Properties classified as “held for sale” are recorded at the lower of their carrying value or their fair value, less anticipated selling costs.
Purchase Accounting and Acquisition of Real Estate
When acquiring a property, the purchase price (including acquisition and closing costs) is allocated to land, building, improvements and equipment based on their relative fair values. For properties acquired with in-place leases, the purchase price of real estate is allocated to the tangible and intangible assets and liabilities acquired based on their estimated fair values. In making estimates of fair values for this purpose, a number of sources are used, including independent appraisals and information obtained about each property as a result of pre-acquisition due diligence and marketing and leasing activities.
Lease Intangibles
Lease intangibles, if any, acquired in conjunction with the purchase of real estate represent the value of in-place leases and above or below-market leases. For real estate acquired subject to existing lease agreements, in-place lease intangibles are valued based on the Company’s estimate of costs related to acquiring a tenant and the carrying costs that would be incurred during the time it would take to locate a tenant if the property were vacant, considering current market conditions and costs to execute similar leases at the time of the acquisition. Above and below-market lease intangibles are recorded based on the present value of the difference between the contractual amounts to be paid pursuant to the leases at the time of acquisition of the real estate and the Company’s estimate of current market lease rates for the property, measured over a period equal to the remaining initial term of the lease.
In-place lease intangibles are amortized on a straight-line basis over the remaining initial term of the related lease and included in depreciation and amortization expense. Above-market lease intangibles are amortized over the remaining initial terms of the respective leases as a decrease in rental revenue. Below market lease intangibles are amortized as an increase to rental revenue over the remaining initial term of the respective leases, but may be amortized over the renewal periods if the Company believes it is likely the tenant will exercise the renewal option. If the Company believes it is likely a lease will terminate early, the unamortized portion of any related lease intangible is immediately recognized in impairment loss in the Company’s consolidated statements of operations.
Investment in Direct Financing Leases
For real estate property leases classified as direct financing leases, the building portion of the lease is accounted for as a direct financing lease, while the land portion is accounted for as operating leases when certain criteria are met. For direct financing leases, the Company records an asset which represents the net investment that is determined by using the aggregate of the total amount of future minimum lease payments, the estimated residual value of the leased property and deferred incremental direct costs less unearned income. Income is recognized over the life of the lease to approximate a level rate of return on the net investment. Residual values, which are reviewed annually, represent the estimated amount the Company expects to receive at lease termination from the disposition of the leased property. Actual residual values realized could differ from these estimates. The Company evaluates the collectability of future minimum lease payments on each direct financing lease primarily through the evaluation of payment history and the underlying creditworthiness of the tenant. There were no amounts past due as of December 31, 2017 and 2016. The Company’s direct financing leases are evaluated individually for the purpose of determining if an allowance is needed. Any write-down of an estimated residual value is recognized as an impairment loss in the current period and earned
SPIRIT REALTY CAPITAL, INC. and SPIRIT REALTY, L.P.
Notes to Consolidated Financial Statements - (continued)
December 31, 2017
income adjusted prospectively. The Company's direct financing leases were acquired in connection with the Merger. There were no impairment losses on direct financing leases during the years ended December 31, 2017 and 2016. There were $4.8 million in impairment losses related to two direct financing leases during the year ended December 31, 2015.
Impairment
The Company reviews its real estate investments and related lease intangibles periodically for impairment whenever events or changes in circumstances indicate that the carrying amount may not be recoverable. The Company considers factors such as expected future undiscounted cash flows, estimated residual value, market trends (such as the effects of leasing demand and competition) and other factors in making this assessment. An asset is considered impaired if its carrying value exceeds its estimated undiscounted cash flows and the impairment is calculated as the amount by which the carrying value of the asset exceeds its estimated fair value. Estimating future cash flows and fair values are highly subjective and such estimates could differ materially from actual results. Key assumptions used in estimating future cash flows and fair values include, but are not limited to, revenue growth rates, interest rates, discount rates, capitalization rates, lease renewal probabilities, tenant vacancy rates and other factors.
Revenue Recognition
The Company primarily leases real estate to its tenants under long-term, triple-net leases that are classified as operating leases. Lease origination fees are deferred and amortized over the related lease term as an adjustment to rental revenue. Under a triple-net lease, the tenant is typically responsible for all improvements and is contractually obligated to pay all property operating expenses, such as real estate taxes, insurance premiums and repair and maintenance costs. Under certain leases, tenant reimbursement revenue, which is comprised of additional amounts recoverable from tenants for common area maintenance expenses and certain other recoverable expenses, is recognized as revenue in the period in which the related expenses are incurred. Tenant reimbursements are recorded on a gross basis in instances when our tenants reimburse us for property costs which we incur.Tenant receivables are carried net of the allowances for uncollectible amounts.
The Company’s leases generally provide for rent escalations throughout the lease terms. For leases that provide for specific contractual escalations, rental revenue is recognized on a straight-line basis so as to produce a constant periodic rent over the term of the lease. Accordingly, accrued rental revenue, calculated as the aggregate difference between the rental revenue recognized on a straight-line basis and scheduled rents, represents unbilled rent receivables that the Company will receive only if the tenants make all rent payments required through the expiration of the initial term of the leases. The accrued rental revenue representing this straight-line adjustment is subject to an evaluation for collectability, and the Company records a provision for losses against rental revenues if collectability of these future rents is not reasonably assured. Leases that have contingent rent escalators indexed to future increases in the CPI may adjust over a one-year period or over multiple-year periods. Generally, these escalators increase rent at the lesser of (a) 1 to 2 times CPI over a specified period, (b) a fixed percentage, or (c) a fixed schedule. Because of the volatility and uncertainty with respect to future changes in the CPI, the Company’s inability to determine the extent to which any specific future change in the CPI is probable at each rent adjustment date during the entire term of these leases and the Company’s view that the multiplier does not represent a significant leverage factor, rental revenue from leases with this type of escalator are recognized only after the changes in the rental rates have occurred.
Some of the Company’s leases also provide for contingent rent based on a percentage of the tenant’s gross sales. For contingent rentals that are based on a percentage of the tenant’s gross sales, the Company recognizes contingent rental revenue when the change in the factor on which the contingent lease payment is based actually occurs.
The Company suspends revenue recognition if the collectability of amounts due pursuant to a lease is not reasonably assured or if the tenant’s monthly lease payments become more than 60 days past due, whichever is earlier.
Lease termination fees are included in other income on the Company’s consolidated statements of operations and are recognized when there is a signed termination agreement and all of the conditions of the agreement have been met. The Company recorded lease termination fees of $5.0 million, $7.3 million and $5.8 million during the years ended December 31, 2017, 2016 and 2015, respectively.
SPIRIT REALTY CAPITAL, INC. and SPIRIT REALTY, L.P.
Notes to Consolidated Financial Statements - (continued)
December 31, 2017
Goodwill
Goodwill arises from business combinations and represents the excess of the cost of an acquired entity over the net fair value amounts that were assigned to the identifiable assets acquired and the liabilities assumed. Goodwill is tested for impairment at the reporting unit level on an annual basis and between annual tests if an event occurs or circumstances change that would more likely than not reduce the fair value of the reporting unit below its carrying value. The Company did not record any impairment on its existing goodwill for the years ended December 31, 2017, 2016 and 2015.
Prior to the Company's adoption of ASU 2017-01, Business Combinations (Topic 805): Clarifying the Definition of a Business, on January 1, 2017 on a prospective basis, when the Company disposed of a real estate asset that constituted a business under GAAP, a portion of goodwill was allocated to the carrying value of the real estate asset considered to be a business to determine the gain or loss on the disposal. The portion of goodwill allocated was derived from the proportionate fair value of the business to the fair value of the Company’s reporting unit. Goodwill related to real estate assets not previously classified as held for sale of $6.3 million and $12.7 million was written off during the years ended December 31, 2016 and 2015, respectively. Under the new guidance, the dispositions of properties generally no longer qualify as a disposition of a business and therefore no allocation of goodwill occurs when determining gain or loss on sale.
The following table presents a reconciliation of the Company’s goodwill from January 1, 2015 to December 31, 2017 (in thousands):
|
| | | |
| | Consolidated |
| Balance as of December 31, 2014 | $ | 285,848 |
|
| Goodwill allocated to dispositions of a business | (21,498 | ) |
| Balance as of December 31, 2015 | 264,350 |
|
| Goodwill allocated to dispositions of a business | (10,010 | ) |
| Balance as of December 31, 2016 | 254,340 |
|
| Goodwill allocated to dispositions of a business | — |
|
| Balance as of December 31, 2017 | $ | 254,340 |
|
Allowance for Doubtful Accounts
The Company reviews its rent and other tenant receivables for collectability on a regular basis, taking into consideration changes in factors such as the tenant’s payment history, the financial condition of the tenant, business conditions in the industry in which the tenant operates, and economic conditions in the area in which the tenant operates. In the event that the collectability of a receivable with respect to any tenant is in doubt, a provision for uncollectible amounts will be established or a direct write-off of the specific receivable will be made. The Company provided for reserves for uncollectible amounts totaling $6.4$12.4 million and $11.5$6.4 million at December 31, 20162017 and 2015,2016, respectively, against accounts receivable balances of $25.3$27.2 million and $26.3$25.3 million, respectively. Receivables are recorded within deferred cost and other assets, net in the accompanying consolidated balance sheets. Receivables are written off against the reserves for uncollectible amounts when all possible means of collection have been exhausted.
SPIRIT REALTY CAPITAL, INC. and SPIRIT REALTY, L.P.
Notes to Consolidated Financial Statements - (continued)
December 31, 2016
For deferred rental revenues related to the straight-line method of reporting rental revenue, the collectability review includes management’s estimates of amounts that will not be realized and an assessment of the risks inherent in the portfolio, giving consideration to historical experience and industry default rates for long-term receivables.experience. The Company established a reserve for losses of $7.7$1.8 million and $12.2$7.7 million at December 31, 20162017 and 2015,2016, respectively, against deferred rental revenue receivables of $71.1$81.6 million and $68.0$71.1 million, respectively. Deferred rental revenue receivables are recorded within deferred costs and other assets, net in the accompanying consolidated balance sheets.
Loans Receivable
Loans receivable consists of mortgage loans, net of premium, and notes receivables. Interest on loans receivable is recognized using the effective interest rate method.
SPIRIT REALTY CAPITAL, INC. and SPIRIT REALTY, L.P.
Notes to Consolidated Financial Statements - (continued)
December 31, 2017
Impairment and Allowance for Loan Losses
The Company periodically evaluates the collectability of its loans receivable, including accrued interest, by analyzing the underlying property-level economics and trends, collateral value and quality, and other relevant factors in determining the adequacy of its allowance for loan losses. A loan is determined to be impaired when, in management’s judgment based on current information and events, it is probable that the Company will be unable to collect all amounts due according to the contractual terms of the loan agreement. Specific allowances for loan losses are provided for impaired loans on an individual loan basis in the amount by which the carrying value exceeds the estimated fair value of the underlying collateral less disposition costs. Delinquent loans receivable are written off against the allowance when all possible means of collection have been exhausted. As of December 31, 2016,2017, there was an allowance for loan losses on an unsecured noteloans receivable of $0.5$0.4 million compared toand a $0.3$0.5 million allowance for loan losses as of December 31, 2015.2016.
A loan is placed on non-accrual status when the loan has become 60 days past due, or earlier if management determines that full recovery of the contractually specified payments of principal and interest is doubtful. While on non-accrual status, interest income is recognized only when received. OneFive mortgage loans were on non-accrual status with a balance of $1.5 million as of December 31, 2017, compared to none as of December 31, 2016. No notes receivable were on non-accrual status as of December 31, 2017, compared to one note receivable was on non-accrual status with a balance of $0.5 million and $0.3 million as of December 31, 2016 and December 31, 2015, respectively, and no mortgage loans were on non-accrual status as of December 31, 2016 and December 31, 2015.2016.
Cash and Cash Equivalents
Cash and cash equivalents include cash and highly liquid investment securities with maturities at acquisition of three months or less. The Company invests cash primarily in money market funds of major financial institutions with fund investments consisting of highly-rated money market instruments and other short-term instruments.
SPIRIT REALTY CAPITAL, INC. and SPIRIT REALTY, L.P.
Notes to Consolidated Financial Statements - (continued)
December 31, 2016
Restricted Cash and Escrow Deposits
Restricted cash and deposits in escrow, classified within deferred costs and other assets, net in the accompanying consolidated balance sheets consisted of the following (in thousands): | | | | December 31, 2016 | | December 31, 2015 | December 31, 2017 | | December 31, 2016 |
Collateral deposits (1) | $ | 1,374 |
| | $ | 14,475 |
| $ | 1,751 |
| | $ | 2,044 |
|
Tenant improvements, repairs, and leasing commissions (2) | 9,739 |
| | 8,362 |
| 8,257 |
| | 9,739 |
|
Master Trust Release (3) | 14,412 |
| | 12,091 |
| 85,703 |
| | 14,412 |
|
| 1031 Exchange proceeds, net | — |
| | 39,869 |
| |
Loan impounds (4) | 670 |
| | 1,025 |
| |
Liquidity reserve (4) | | 5,503 |
| | — |
|
Other (5) | 644 |
| | 1,823 |
| 4,695 |
| | 644 |
|
| | $ | 26,839 |
| | $ | 77,645 |
| $ | 105,909 |
| | $ | 26,839 |
|
(1) Funds held in reserve by lenders which can be applied at their discretionlender controlled accounts generally used to meet future debt service or certain property operating expenses. Balance changes are reflected in financing activities within the repaymentconsolidated statements of debt (any funds remaining on deposit after the debt is paid in full are released to the borrower).cash flows.
(2) Deposits held as additional collateral support by lenders to fund improvements, repairs and leasing commissions incurred to secure a new tenant. Balance changes are reflected in financing activities within the consolidated statements of cash flows.
(3) Proceeds from the sale of assets pledged as collateral under the Spirit Master Funding Program, which are held on deposit until a qualifying substitution is made or the funds are applied as prepayment of principal. Balance changes are reflected in investing activities within the consolidated statements of cash flows.
(4) FundsLiquidity reserve cash was placed on deposit in conjunction with issuance of additional series of notes under Master Trust 2014 in December 2017 and is held until there is a cashflow shortfall as defined in lender controlled accounts generally used to meet future debt servicethe Master Trust 2014 agreements or a liquidation of Master Trust 2014 occurs. Additionally, the liquidity reserve can be released upon achieving certain property operating expenses.performance criteria. Balance changes are reflected in financing activities within the consolidated statements of cash flows.
(5)Funds held in lender controlled accounts released after scheduled debt service requirements are met. Balance changes are reflected in operating activities within the consolidated statements of cash flows.
SPIRIT REALTY CAPITAL, INC. and SPIRIT REALTY, L.P.
Notes to Consolidated Financial Statements - (continued)
December 31, 2017
Accounting for Derivative Financial Instruments and Hedging Activities
The Company utilizes derivative instruments such as interest rate swaps and caps for purposes of hedging exposures to fluctuations in interest rates associated with certain of its financing transactions. At the inception of a hedge transaction, the Company enters into a contractual arrangement with the hedge counterparty and formally documents the relationship between the derivative instrument and the financing transaction being hedged, as well as its risk management objective and strategy for undertaking the hedge transaction. At inception and at least quarterly thereafter, a formal assessment is performed to determine whether the derivative instrument has been highly effective in offsetting changes in cash flows of the related financing transaction and whether it is expected to be highly effective in the future.
The fair value of the derivative instrument is recorded on the balance sheet as either an asset or liability. For derivatives designated as cash flow hedges, the effective portions of the corresponding change in fair value of the derivatives are recorded in AOCL within stockholders’ equity and partners' capital. Changes in fair value reported in other comprehensive income (loss) are reclassified to operations in the period in which operations are affected by the underlying hedged transaction. Any ineffective portions of the change in fair value are recognized immediately in general and administrative expense. The amounts paid or received on the hedge are recognized as adjustments to interest expense (see Note 5).
Income Taxes
The Company has elected to be taxed as a REIT under the Code. As a REIT, the Company generally will not be subject to federal income tax provided it continues to satisfy certain tests concerning the Company’s sources of income, the nature of its assets, the amounts distributed to its stockholders, and the ownership of Company stock. Management believes the Company has qualified and will continue to qualify as a REIT and therefore, no provision has been made for federal income taxes in the accompanying consolidated financial statements. Even if the Company qualifies for taxation as a REIT, it may be subject to state and local income and franchise taxes, and to federal income tax and excise tax on its undistributed income. Taxable income from non-REIT activities managed through any of the Company’s taxable REIT subsidiaries is subject to federal, state, and local taxes, which are not material.
The Operating Partnership is a partnership for federal income tax purposes. Partnerships are pass-through entities and are not subject to U.S. federal income taxes, therefore no provision has been made for federal income taxes in
SPIRIT REALTY CAPITAL, INC. and SPIRIT REALTY, L.P.
Notes to Consolidated Financial Statements - (continued)
December 31, 2016
the accompanying financial statements. Although most states and cities where the Operating Partnership operates follow the U.S. federal income tax treatment, there are certain jurisdictions such as Texas, Tennessee and Ohio that impose income or franchise taxes on a partnership.
Franchise taxes are included in general and administrative expenses on the accompanying consolidated statements of operations.
Earnings Per Share and UnitTerm Loan
The Company’s unvested restricted common stock, which contains non-forfeitable rights to receive dividends, are considered participating securities requiring the two-class method of computing earnings per share and unit. Under the two class method, earnings attributable to unvested restricted shares are deducted from income (loss) from continuing operations in the computation of net income (loss) attributable to common stockholders. Under the two-class method, earnings per common share are computed by dividing the sum of distributed earnings to common stockholders and undistributed earnings allocated to common stockholders by the weighted average number of common shares outstanding for the period. In applying the two-class method, undistributed earnings are allocated to both common shares and participating securities based on their respective weighted average shares outstanding during the period. Under the terms of the Amended Incentive Award Plan and the related restricted stock awards (see Note 13), losses are not allocated to participating securities including undistributed losses as a result of dividends declared exceeding net income. The Company uses income or loss from continuing operations as the basis for determining whether potential common shares are dilutive or anti-dilutive and undistributed net income or loss as the basis for determining whether undistributed earnings are allocable to participating securities.
Fair Value Measurements
The fair value measurement framework specifies a hierarchy of valuation inputs which was established to increase consistency, clarity and comparability in fair value measurements and related disclosures. The fair value hierarchy is based upon three levels of inputs that may be used to measure fair value, two of which are considered observable and one that is considered unobservable. The following describes the three levels:
Level 1 – Valuation is based upon quoted prices in active markets for identical assets or liabilities.
Level 2 – Valuation is based upon inputs other than Level 1 that are observable, either directly or indirectly, such as quoted prices for similar assets or liabilities, quoted prices in markets that are not active or other inputs that are observable or can be corroborated by observable market data for substantially the full term of the assets or liabilities.
LevelOn November 3, – Inputs that are unobservable and significant to the overall fair value measurement of the assets or liabilities. These types of inputs include the Company's own assumptions.
Unaudited Interim Information
The consolidated quarterly financial data in Note 16 is unaudited. In the opinion of management, this financial information reflects all adjustments necessary for a fair presentation of the respective interim periods. All such adjustments are of a normal recurring nature.
New Accounting Pronouncements
From time to time, new accounting pronouncements are issued by the FASB or the SEC that are adopted by the Company as of the specified effective date.
In May 2014, the FASB issued ASU 2014-09, Revenue from Contracts with Customers: Topic 606. This new guidance establishes a principles-based approach for accounting for revenue from contracts with customers and is effective for annual reporting periods beginning after December 15, 2017, with early application permitted for annual reporting periods beginning after December 15, 2016. In evaluating the impact of this new standard, the Company identified that lease contracts covered by Topic 840, Leases, are excluded from the scope of this new guidance. As such, while2015, we are still evaluating the effects of ASU 2014-09, we anticipate the most significant impact of the new guidance will relate to the Company's presentation of tenant reimbursement revenue, which will require evaluation to determine if there are non-lease components which should be accounted for under ASU 2014-09. Further, we do not expect a
SPIRIT REALTY CAPITAL, INC. and SPIRIT REALTY, L.P.
Notes to Consolidated Financial Statements - (continued)
December 31, 2016
significant impact on the accounting for sales of real estate assets under the new guidance. While the Company continues to assess all potential impacts of the new standard, we do not currently expect that the adoption of this guidance will have a material impact on our revenues, results of operations or financial position. The Company plans to adopt the new revenue recognition standard effective January 1, 2018 under the modified retrospective method.
In February 2016, the FASB issued ASU 2016-02, Leases (Topic 842), which supersedes the existing guidance for lease accounting Leases (Topic 840). ASU 2016-02 requires lessees to recognize leases on their balance sheets, and leaves lessor accounting largely unchanged. The amendments in this ASU are effective for the fiscal years beginning after December 15, 2018 and interim periods within those fiscal years. Early application is permitted for all entities. ASU 2016-02 requires a modified restrospective approach for all leases existing at, or entered into after, the date of initial application, with an option to elect to use certain transition relief. The Company is currently evaluating the impact of this ASU on its consolidated financial statements.
In March 2016, the FASB issued ASU 2016-09, Improvements to Employee Share-Based Payment Accounting, which simplifies many aspects of accounting for share-based payment transactions under ASC Topic 718, Compensation - Stock Compensation, including income tax consequences, classification of awards as either equity or liability, forfeiture rate calculations and classification on the statement of cash flows. ASU 2016-09 is effective for annual reporting periods beginning after December 15, 2016, and interim periods within those fiscal years. Early adoption is permitted for all entities. The Company plans to adopt this new guidance effected January 1, 2017 and will make an accounting policy election to recognize stock-based compensation forfeitures as they occur.
In June 2016, the FASB issued ASU 2016-13, Measurement of Credit Losses on Financial Instruments, which requires more timely recognition of credit losses associated with financial assets. ASU 2016-13 requires financial assets (or a group of financial assets) measured at an amortized cost basis to be presented at the net amount expected to be collected. ASU 2016-13 is effective for fiscal years beginning after December 15, 2019, including interim periods within those fiscal years. Early adoption is permitted for fiscal years beginning after December 15, 2018, including interim periods within those fiscal years. The Company is currently evaluating the impact of this ASU on its consolidated financial statements.
In August 2016, the FASB issued ASU 2016-15, Classification of Certain Cash Receipts and Cash Payments, which addresses specific cash flow issues with the objective of reducing the existing diversity in practice. ASU 2016-15 is effective for fiscal years beginning after December 15, 2017, including interim periods within those fiscal years. Early adoption is permitted for all entities. The Company is currently evaluating the impact of this ASU on its consolidated financial statements.
In November 2016, the FASB issued ASU 2016-18, Statement of Cash Flows (Topic 230): Restricted Cash. This guidance requires that a statement of cash flows explain the change during the period in the total of cash, cash equivalents, and restricted cash. As a result, restricted cash will be included with cash and cash equivalents when reconciling the beginning-of-period and end-of-period total amounts shown on the statement of cash flows. The new guidance is effective for fiscal years beginning after December 15, 2017, and interim periods within those fiscal years. Early adoption is permitted, and the new guidance is to be applied retrospectively. The Company is currently evaluating the impact of this ASU on its consolidated financial statements.
In January 2017, the FASB issued ASU 2017-01, Business Combinations (Topic 805): Clarifying the Definition of a Business, which narrows the definition of a business. The Company plans to early adopt the guidance effective January 1, 2017 and application will be on a prospective basis. Under the new guidance, acquisitions of a property with an in-place lease generally will no longer be accounted for as an acquisition of a business, but instead as an asset acquisition, meaning the transaction costs of these acquisitions will now be capitalized instead of expensed. Further, dispositions of properties generally no longer qualify as a disposition of a business and therefore will not be allocated goodwill.
Note 3. Investments
Real Estate Investments
As of December 31, 2016, the Company’s gross investment in real estate properties and loans totaled approximately $8.2 billion, representing investments in 2,615 properties, including 74 properties securing mortgage loans. The gross investment is comprised of land, buildings, lease intangible assets and lease intangible liabilities, as adjusted for any
SPIRIT REALTY CAPITAL, INC. and SPIRIT REALTY, L.P.
Notes to Consolidated Financial Statements - (continued)
December 31, 2016
impairment, and the carrying amount of loans receivable, real estate assets held under direct financing leases and real estate assets held for sale. The portfolio is geographically dispersed throughout 49 states with only one state, Texas, with a real estate investment of 12.4%, accounting for more than 10.0% of the total dollar amount of the Company’s real estate investment portfolio.
During the years ended December 31, 2016 and 2015, the Company had the following real estate and loan activity, net of accumulated depreciation and amortization:
|
| | | | | | | | | | | | | | | | | | | | |
| | Number of Properties | | Dollar Amount of Investments |
| | Owned | | Financed | | Total | | Owned | | Financed | | Total |
| | | | | | |
| | (In Thousands) |
| Gross balance, December 31, 2014 | 2,364 |
| | 145 |
| | 2,509 |
| | $ | 7,934,072 |
| | $ | 109,425 |
| | $ | 8,043,497 |
|
Acquisitions/improvements (1) | 232 |
| | — |
| | 232 |
| | 886,252 |
| | 4,020 |
| | 890,272 |
|
Dispositions of real estate (2) | (110 | ) | | — |
| | (110 | ) | | (543,935 | ) | | — |
| | (543,935 | ) |
| Principal payments and payoffs | — |
| | (1 | ) | | (1 | ) | | — |
| | (6,650 | ) | | (6,650 | ) |
| Impairments | — |
| | — |
| | — |
| | (70,231 | ) | | (324 | ) | | (70,555 | ) |
| Write-off of gross lease intangibles | — |
| | — |
| | — |
| | (7,302 | ) | | — |
| | (7,302 | ) |
| Loan premium amortization and other | (1 | ) | | — |
| | (1 | ) | | (171 | ) | | (2,468 | ) | | (2,639 | ) |
| Gross balance, December 31, 2015 | 2,485 |
| | 144 |
| | 2,629 |
| | 8,198,685 |
| | 104,003 |
| | 8,302,688 |
|
Acquisitions/improvements (1) | 269 |
| | — |
| | 269 |
| | 711,510 |
| | — |
| | 711,510 |
|
Dispositions of real estate (2) | (213 | ) | | — |
| | (213 | ) | | (598,662 | ) | | — |
| | (598,662 | ) |
| Principal payments and payoffs | — |
| | (70 | ) | | (70 | ) | | — |
| | (34,955 | ) | | (34,955 | ) |
| Impairments | — |
| | — |
| | — |
| | (88,073 | ) | | (176 | ) | | (88,249 | ) |
| Write-off of gross lease intangibles | — |
| | — |
| | — |
| | (42,307 | ) | | — |
| | (42,307 | ) |
| Loan premium amortization and other | — |
| | — |
| | — |
| | (77 | ) | | (2,294 | ) | | (2,371 | ) |
| Gross balance, December 31, 2016 | 2,541 |
| | 74 |
| | 2,615 |
| | $ | 8,181,076 |
| | $ | 66,578 |
| | $ | 8,247,654 |
|
| Accumulated depreciation and amortization | | | | | | | (1,158,608 | ) | | — |
| | (1,158,608 | ) |
| Other non-real estate assets held for sale | | | | | | | 1,289 |
| | — |
| | 1,289 |
|
| Net balance, December 31, 2016 | | | | | | | $ | 7,023,757 |
| | $ | 66,578 |
| | $ | 7,090,335 |
|
| |
(1)
| Includes investments of $20.5 million and $9.2 million, respectively, in revenue producing capitalized expenditures, as well as $6.6 million and $1.0 million, respectively, of non-revenue producing capitalized expenditures for the years ended December 31, 2016 and 2015. |
| |
(2)
| The total accumulated depreciation and amortization associated with dispositions of real estate was $126.4 million and $109.1 million, respectively, for the years ended December 31, 2016 and 2015. |
SPIRIT REALTY CAPITAL, INC. and SPIRIT REALTY, L.P.
Notes to Consolidated Financial Statements - (continued)
December 31, 2016
Scheduled minimum future contractual rent to be received under the remaining non-cancelable term of the operating leases (including realized rent increases occurring after January 1, 2017) are as follows (in thousands):
|
| | | |
| | December 31,
2016 |
| 2017 | $ | 617,717 |
|
| 2018 | 610,284 |
|
| 2019 | 590,490 |
|
| 2020 | 570,766 |
|
| 2021 | 541,961 |
|
| Thereafter | 4,183,771 |
|
| Total future minimum rentals | $ | 7,114,989 |
|
Because lease renewal periods are exercisable at the option of the lessee, the preceding table presents future minimum lease payments due during the initial lease term only. In addition, the future minimum rentals do not include any contingent rentals based on a percentage of the lessees’ gross sales or lease escalations based on future changes in the CPI or other stipulated reference rate.
Loans Receivable
The following table details loans receivable, net of premium and allowance for loan losses (in thousands):
|
| | | | | | | |
| | December 31,
2016 | | December 31,
2015 |
| Mortgage loans - principal | $ | 55,410 |
| | $ | 90,096 |
|
| Mortgage loans - premium, net of amortization | 7,194 |
| | 9,986 |
|
| Mortgages loans, net | 62,604 |
| | 100,082 |
|
| Other note receivables - principal | 4,474 |
| | 4,245 |
|
| Allowance for loan losses | (500 | ) | | (324 | ) |
| Other note receivables | 3,974 |
| | 3,921 |
|
| Total loans receivable, net | $ | 66,578 |
| | $ | 104,003 |
|
As of December 31, 2016 and 2015, the Company held a total of 8 and 78, respectively, first-priority mortgage loans (representing loans to 4 and 7 borrowers, respectively). These mortgage loans are secured by single-tenant commercial properties and generally have fixed interest rates over the term of the loans. There are 3 other notes receivable, one $3.7 million note is secured by tenant assets and stock and the other two are unsecured.
SPIRIT REALTY CAPITAL, INC. and SPIRIT REALTY, L.P.
Notes to Consolidated Financial Statements - (continued)
December 31, 2016
Lease Intangibles, Net
The following table details lease intangible assets and liabilities, net of accumulated amortization (in thousands): |
| | | | | | | |
| | December 31,
2016 | | December 31,
2015 |
| In-place leases | $ | 624,723 |
| | $ | 649,182 |
|
| Above-market leases | 88,873 |
| | 98,056 |
|
| Less: accumulated amortization | (243,320 | ) | | (220,520 | ) |
| Intangible lease assets, net | $ | 470,276 |
| | $ | 526,718 |
|
| | | | |
| Below-market leases | $ | 236,008 |
| | $ | 238,039 |
|
| Less: accumulated amortization | (53,688 | ) | | (44,136 | ) |
| Intangible lease liabilities, net | $ | 182,320 |
| | $ | 193,903 |
|
The amounts amortized as a net increase to rental revenue for capitalized above and below-market leases was $6.6 million, $5.8 million and $6.1 million for the years ended December 31, 2016, 2015 and 2014, respectively. The value of in-place leases amortized and included in depreciation and amortization expense was $46.4 million, $49.9 million and $53.2 million for the years ended December 31, 2016, 2015 and 2014, respectively. The remaining weighted average amortization period for in-place leases, above-market leases, below-market leases and in total was 14.6 years, 10.3 years, 18.5 years and 11.2 years, respectively, as of December 31, 2016. The remaining weighted average amortization period for in-place leases, above-market leases, below-market leases and in total was 15.1 years, 10.8 years, 19.7 years and 11.4 years, respectively, as of December 31, 2015. During the year ended December 31, 2016, the Company acquired in-place lease intangible assets of $38.8 million, above-market lease intangible assets of $1.0 million and below-market lease intangible liabilities of $14.1 million.
Based on the balance of intangible assets and liabilities at December 31, 2016, the net aggregate amortization expense for the next five years and thereafter is expected to be as follows (in thousands):
|
| | | |
| 2017 | $ | 32,860 |
|
| 2018 | 33,261 |
|
| 2019 | 30,998 |
|
| 2020 | 28,811 |
|
| 2021 | 26,261 |
|
| Thereafter | 135,765 |
|
| Total future minimum rentals | $ | 287,956 |
|
Real Estate Assets Under Direct Financing Leases
The components of real estate investments held under direct financing leases were as follows (in thousands):
|
| | | | | | | |
| | December 31,
2016 | | December 31, 2015 |
| Minimum lease payments receivable | $ | 9,456 |
| | $ | 12,702 |
|
| Estimated residual value of leased assets | 35,640 |
| | 43,789 |
|
| Unearned income | (9,091 | ) | | (12,167 | ) |
| Real estate assets under direct financing leases, net | $ | 36,005 |
| | $ | 44,324 |
|
SPIRIT REALTY CAPITAL, INC. and SPIRIT REALTY, L.P.
Notes to Consolidated Financial Statements - (continued)
December 31, 2016
Real Estate Assets Held for Sale
The Company is continually evaluating the portfolio of real estate assets and may elect to dispose of assets considering criteria including, but not limited to, tenant concentration, tenant credit quality, unit financial performance, local market conditions and lease rates, associated indebtedness, asset location, tenant operation type (e.g., industry, sector, or concept/brand). Real estate assets held for sale are expected to be sold to within twelve months. The following table shows the activity in real estate assets held for sale for the years ended December 31, 2016 and 2015:
|
| | | | | | |
| | Number of Properties | | Carrying Value |
| | (In Thousands) |
| Balance, December 31, 2014 | 24 |
| | $ | 119,046 |
|
| Transfers from real estate investments | 60 |
| | 192,311 |
|
| Sales | (48 | ) | | (227,098 | ) |
| Transfers to real estate investments held and used | — |
| | — |
|
| Balance, December 31, 2015 | 36 |
| | 84,259 |
|
| Transfers from real estate investments | 72 |
| | 223,457 |
|
| Sales | (59 | ) | | (126,100 | ) |
| Transfers to real estate investments held and used | (5 | ) | | (21,046 | ) |
| Balance, December 31, 2016 | 44 |
| | 160,570 |
|
Impairments
The following table summarizes total impairment losses recognized in continuing and discontinued operations on the accompanying consolidated statements of operations (in thousands):
|
| | | | | | | | | | | |
| | Years Ended December 31, |
| | 2016 | | 2015 | | 2014 |
| Real estate and intangible asset impairment | $ | 80,390 |
| | $ | 68,565 |
| | $ | 42,307 |
|
| Write-off of lease intangibles due to lease terminations, net | 7,683 |
| | 1,666 |
| | (4,820 | ) |
| Loans receivable impairment | 176 |
| | 324 |
| | — |
|
| Total impairments from real estate investment net assets | 88,249 |
| | 70,555 |
| | 37,487 |
|
| Other impairment | 26 |
| | 174 |
| | 528 |
|
| Total impairment loss in continuing and discontinued operations | $ | 88,275 |
| | $ | 70,729 |
| | $ | 38,015 |
|
Note 4. Debt
The debt of the Company andTerm Loan Agreement among the Operating Partnership areas borrower, the same, except for the presentation of the Convertible Notes. The Convertible Notes were issued by the Company. Subsequently, an intercompany note between the CompanyCorporation as guarantor and the Operating Partnership was executed with terms identicallenders that are parties thereto. The Term Loan Agreement provides for a $325.0 million senior unsecured term facility that has an initial maturity date of November 2, 2018, which may be extended at our option pursuant to those of the Convertible Notes. Therefore, in the consolidated balance sheet of the Operating Partnership, the amounts relatedtwo one-year extension options, subject to the Convertible Notes are reflected as notes payablesatisfaction of certain conditions and payment of an extension fee. In addition, an accordion feature allows the facility to Spirit Realty Capital, Inc., net. The Company's debt is summarized below:
|
| | | | | | | | | | | | | | | |
| | 2016
Weighted Average Effective
Interest Rates (1) | | 2016
Weighted Average Stated Rates (2) | | 2016
Weighted Average Maturity (3) | | December 31, 2016 | | December 31, 2015 |
| | | | | | | | (In Thousands) |
| 2015 Credit Facility | 4.17 | % | | 2.10 | % | | 2.2 | | $ | 86,000 |
| | $ | — |
|
| Term Loan | 2.25 | % | | 1.91 | % | | 1.8 | | 420,000 |
| | 325,000 |
|
| Master Trust Notes | 5.59 | % | | 5.03 | % | | 6.2 | | 1,672,706 |
| | 1,692,094 |
|
| CMBS - fixed-rate | 5.21 | % | | 5.70 | % | | 3.8 | | 528,427 |
| | 1,360,215 |
|
CMBS - variable-rate (4) | — |
| | — |
| | — | | — |
| | 61,758 |
|
| Convertible Notes | 5.31 | % | | 3.28 | % | | 3.3 | | 747,500 |
| | 747,500 |
|
| Unsecured Senior Notes | 4.60 | % | | 4.45 | % | | 9.7 | | 300,000 |
| | — |
|
| Total debt | 5.13 | % | | 4.46 | % | | 5.0 | | 3,754,633 |
| | 4,186,567 |
|
| Debt discount, net | | | | | | | (52,894 | ) | | (52,203 | ) |
Deferred financing costs, net (5) | | | | | | | (37,111 | ) | | (41,577 | ) |
| Total debt, net | | | | | | | $ | 3,664,628 |
| | $ | 4,092,787 |
|
(1)The effective interest rates include amortization of debt discount/premium, amortization of deferred financing costs, facility fees and non-utilization fees, where applicable, calculated for the year ended December 31, 2016.
(2) Represents the weighted average stated interest rate based on the outstanding principal balance as of December 31, 2016.
(3) Represents the weighted average maturity based on the outstanding principal balance as of December 31, 2016.
(4) Variable-rate notes were predominantly hedged with interest rate swaps (see Note 5).
(5) The Company records deferred financing costs for the 2015 Credit Facility in deferred costs and other assets, net on its consolidated balance sheets.
Revolving Credit Facilities
2015 Credit Facility
On March 31, 2015, the Operating Partnership entered into the Credit Agreement that established a newbe increased to up to $600.0 million, unsecured creditsubject to obtaining additional lender commitments. In December 2015, upon obtaining additional lender commitments, we increased the term facility and terminated its secured $400.0from $325.0 million 2013 Credit Facility. to $370.0 million. On December 19, 2016, we increased the term facility from $370.0 million to $420.0 million.
The 2015 Credit Facility matures on March 31, 2019 (extendibleTerm Loan Agreement provides that borrowings bear interest at either LIBOR plus 1.35% to 1.80% per annum or a specified base rate plus 0.35% to 0.80% per annum, at the Operating Partnership's option to March 31, 2020, subject to satisfaction of certain requirements) and includes an accordion feature to increaseelection. In each case, the committed facility size up to $1.0 billion, subject to satisfying certain requirements and obtaining additional lender commitments. On April 27, 2016, the Company expanded the borrowing capacity under the 2015 Credit Facility from $600.0 million to $800.0 million by partially exercising the accordion feature under the terms of the Credit Agreement. The 2015 Credit Facility also includes a $50.0 million sub-limit for swing-line loans and up to $60.0 million available for issuance of letters of credit. Swing-line loans and letters of credit reduce availability under the 2015 Credit Facility on a dollar-for-dollar basis. On November 3, 2015, the Company entered into a first amendment to the Credit Agreement. The amendment conforms certain of the terms and covenants to those in the Term Loan Agreement, including limiting the requirement of subsidiary guaranties to material subsidiaries (as defined) meeting certain conditions. At December 31, 2016, there were no subsidiaries meeting this requirement.
Borrowings bear interest at either a specified base rate of LIBOR plus an applicable margin atis determined based upon the Operating Partnership's option. PerCorporation’s leverage ratio. If the amendment, the Operating Partnership’s election to change the grid pricing from leverage based to credit rating based pricing initially requiredCorporation obtains at least two credit ratings on its senior unsecured long-term indebtedness of BBB- or better from S&P or Fitch, Inc. or Baa3 or better from Moody’s.Moody's, the Operating Partnership may make an irrevocable election to have the margin based upon the Corporation's credit ratings. In April 2016, the Corporation received a first time rating of BBB- from Fitch and was
SPIRIT REALTY CAPITAL, INC. and SPIRIT REALTY, L.P.
Notes to Consolidated Financial Statements - (continued)
December 31, 2016
updated upgraded to a BBB-corporateBBB- corporate issuer rating by S&P. As a result, the Operating Partnership elected to change the interest rate grid from leverage based pricing to credit rating based pricing in the second quarter of 2016. Under credit rating based pricing, the 2015 Credit Facility bearsborrowings will bear interest at a rate equal toeither LIBOR plus 0.875%0.90% to 1.55%1.75% per annum or a specified base rate plus 0.0% to 0.55% and requires a facility fee in an amount equal to the aggregate revolving credit commitments (whether or not utilized) multiplied by a rate equal to 0.125% to 0.30%0.75% per annum, in each case depending on the Corporation'sCorporation’s credit rating.ratings. As of December 31, 2016,2017, the 2015 Credit FacilityTerm Loan bore interest at LIBOR plus 1.25%1.35% based on the Company'sour credit rating and incurred a facility fee of 0.25% per annum.rating.
The Operating Partnership may voluntarily prepay the 2015 Credit Facility,Term Loan, in whole or in part, at any time, without premium or penalty, but subject to applicable LIBOR breakage fees, if any.fees. Amounts prepaid may be subsequently re-borrowed within 30 days. Payment of the 2015 Credit FacilityTerm Loan is unconditionally guaranteed by the Corporation and, under certain circumstances, by one or more material subsidiaries that meet certain conditions (as defined in the CreditTerm Loan Agreement). of the Corporation. The 2015 Credit Facility isobligations of the Operating Partnership and any guarantor under the Term Loan are full recourse to the Operating PartnershipCorporation and the aforementioned guarantors.
As a result of entering into the 2015 Credit Facility and expanding the borrowing capacity, the Company incurred origination costs of $4.8 million. These deferred financing costs are being amortized to interest expense over the remaining initial term of the 2015 Credit Facility. The unamortized deferred financing costs relating to the 2015 Credit Facility were $2.9 million and $3.2 million, at December 31, 2016 and 2015, respectively, and were recorded in deferred costs and other assets, net on the accompanying consolidated balance sheets.each guarantor.
As of December 31, 2016, $86.0 million was outstanding, there was $714.02017, the Term Loan provided $420.0 million of borrowing capacitycapacity. Amounts available for borrowing under the 2015 Credit FacilityTerm Loan remain subject to compliance with certain customary restrictive covenants including:
Maximum leverage ratio (defined as consolidated total indebtedness plus the Corporation’s pro rata share of indebtedness of unconsolidated affiliates, net of certain cash and no outstanding letterscash equivalents, to total asset value) of credit.0.60:1.00, which may be increased to 0.65:1.00 for four consecutive quarters after certain material acquisitions;
Minimum fixed charge coverage ratio (defined as consolidated EBITDA plus the Corporation’s pro rata share of EBITDA of unconsolidated affiliates to fixed charges) of 1.50:1.00;
Maximum secured indebtedness leverage ratio (defined as consolidated secured indebtedness plus the Corporation’s pro rata share of secured indebtedness of unconsolidated affiliates, net of certain cash and cash equivalents to total asset value) of 0.50:1:00;
Minimum unsecured interest coverage ratio (defined as consolidated net operating income from unencumbered properties to unsecured interest expense) of 1.75:1.00;
Maximum unencumbered leverage ratio (defined as consolidated unsecured indebtedness plus the Corporation’s pro rata share of unsecured indebtedness of unconsolidated affiliates, net of certain cash and cash equivalents, to total unencumbered asset value) of 0.60:1:00, which may be increased to 0.65:1.00 for four consecutive quarters after certain material acquisitions; and
Minimum tangible net worth of at least $3.01 billion plus 75% of the net proceeds of equity issuances by the Corporation or the Operating Partnership after December 31, 2014.
In addition, the Term Loan Agreement includes other customary affirmative and negative covenants, including (i) limitation on liens and negative pledges; (ii) transactions with affiliates; (iii) limitation on mergers, consolidations and sales of all or substantially all assets; (iv) maintenance of status as a REIT and listing on a national securities exchange; and (v) material modifications to organizational documents. The Operating Partnership's ability to borrow under the 2015 Credit FacilityTerm Loan Agreement is subject to ongoingcontinued compliance with a numberall of customary financialthe covenants and other customary affirmative and negative covenants. described above.
As of December 31, 2016,2017, the Corporation and the Operating Partnership were in compliance with these financial covenants.
2013 Credit FacilitySenior Unsecured Notes
On August 18, 2016, the Operating Partnership completed a private placement of $300.0 million aggregate principal amount senior notes through a Rule 144A offering with registration rights, which are guaranteed by the Corporation. The Senior Unsecured Notes were issued at 99.378% of their principal amount, resulting in net proceeds of $296.2 million after deducting transaction fees and expenses. The Senior Unsecured Notes accrue interest at a rate of 4.450% per year, payable on March 15 and September 15 of each year, until the maturity date of September 15, 2026. The Company filed a registration statement with the SEC to exchange the private Senior Unsecured Notes for registered Senior Unsecured Notes with substantially identical terms, which became effective April 14, 2017. All $300.0 million aggregate principal amount of private Senior Unsecured Notes were tendered in the exchange for registered Senior Unsecured Notes.
The Senior Unsecured Notes are redeemable in whole at any time or in part from time to time, at the Operating Partnership’s option, at a redemption price equal to the sum of: an amount equal to 100% of the principal amount of the Senior Unsecured Notes to be redeemed plus accrued and unpaid interest and liquidated damages, if any, up to, but not including, the redemption date; and a make-whole premium calculated in accordance with the indenture. Notwithstanding the foregoing, if any of the Senior Unsecured Notes are redeemed on or after June 15, 2026 (three months prior to the maturity date of the Senior Unsecured Notes), the redemption price will not include a make-whole premium.
In connection with the issuance of the Senior Unsecured Notes, the Corporation and Operating Partnership remain subject to compliance with certain customary restrictive covenants including:
Maximum leverage ratio (defined as consolidated total indebtedness, to total consolidated undepreciated real estate assets plus the Company’s other assets, excluding accounts receivable and non-real estate intangibles) of 0.60:1.00;
Minimum unencumbered asset coverage ratio (defined as total consolidated undepreciated real estate assets plus the Company’s other assets, excluding accounts receivable and non-real estate intangibles, to consolidated total unsecured indebtedness) of 1.50:1:00;
Maximum secured indebtedness leverage ratio (defined as consolidated total secured indebtedness, to total consolidated undepreciated real estate assets plus the Company’s other assets, excluding accounts receivable and non-real estate intangibles) of 0.40:1.00; and
Minimum fixed charge coverage ratio (defined as consolidated income available for debt service, to the annual service charge) of 1.50:1.0.
In addition, the Senior Unsecured Notes Agreement includes other customary affirmative and negative covenants, including (i) maintenance of status as a REIT; (ii) payment of all taxes, assessments and governmental charges levied on the REIT; (iii) reporting on financial information; and (iv) maintenance of properties and property insurance.
As of December 31, 2015,2017, the secured 2013Corporation and the Operating Partnership were in compliance with these financial covenants.
CMBS
We may use long-term, fixed-rate debt to finance our properties. In such events, we generally seek to use asset level financing that bears annual interest less than the annual rent on the related lease(s) and that matures prior to the expiration of such lease(s). In general, the obligor of our asset level debt is a special purpose entity that holds the real estate and other collateral securing the indebtedness. Each special purpose entity is a bankruptcy remote separate legal entity, and is the sole owner of its assets and solely responsible for its liabilities other than typical non-recurring covenants.
As of December 31, 2017, we had 12 loans with approximately $332.6 million of outstanding principal balances under our fixed rate CMBS loans, with a weighted average contractual interest rate of 5.81% and a weighted average maturity of 4.6 years. Approximately one-third of this debt is partially amortizing and requires a balloon payment at maturity. These balances include six separate fixed-rate CMBS loans that are in default due to the underperformance of the eight properties that secure them. As of December 31, 2017, the aggregate principal balance under the defaulted CMBS loans was $64.3 million, including $13.2 million of default interest added to principal, and is discussed further below. Excluding these six loans, the outstanding principal obligations under our CMBS fixed-rate loans as of December 31, 2017 was $268.3 million.
The table below shows the outstanding principal obligations, including amortization, of these CMBS fixed rate loans as of December 31, 2017 and the year in which the loans mature (dollars in thousands). The information displayed in the table excludes amounts and interest rates related to the defaulted loans and the eight properties securing them.
|
| | | | | | | | | | | | | | | | | | | | | | |
| Year of Maturity | Number of Loans | | Number of Properties | | Stated Interest Rate Range | | Weighted Average Stated Rate | | Scheduled Principal | | Balloon | | Total |
| | | | | | | | | | | | | | |
| 2018 | — |
| | — |
| | 0 | | — | % | | $ | 3,692 |
| | $ | — |
| | $ | 3,692 |
|
| 2019 | — |
| | — |
| | — | | — |
| | 3,905 |
| | — |
| | 3,905 |
|
| 2020 | — |
| | — |
| | — | | — |
| | 4,100 |
| | — |
| | 4,100 |
|
| 2021 | — |
| | — |
| | — | | — |
| | 4,365 |
| | — |
| | 4,365 |
|
| 2022 | 1 |
| | 12 |
| | 4.67% | | 4.67 |
| | 4,617 |
| | 42,400 |
| | 47,017 |
|
| Thereafter | 5 |
| | 88 |
| | 5.23%-6.00% | | 5.48 |
| | 7,276 |
| | 197,980 |
| | 205,256 |
|
| Total | 6 |
| | 100 |
| | | | 5.35 | % | | $ | 27,955 |
| | $ | 240,380 |
| | $ | 268,335 |
|
CMBS Liquidity Matters
As of December 31, 2017, we are in default on six separate CMBS loans due to the underperformance of the properties securing these loans. The wholly-owned special purpose entities subject to these mortgage loans are separate legal entities and the sole owner of their assets and responsible for their liabilities. The aggregate outstanding principal balance of these loans, including capitalized interest, totaled $64.3 million. We believe the value of these properties is less than the related debt. As a result, we have notified the lenders of each special purpose entity that we anticipate either surrendering these properties to the lenders or selling them in certain instances in exchange for relieving the indebtedness, including any accrued interest and accrued or unpaid property expenses, encumbering them.
The following table provides key elements of the defaulted mortgage loans (dollars in thousands):
|
| | | | | | | | | | | | | | | | | | | | | | | | | | | | | | | | | | | |
| Industry | Properties | | Net Book Value | | Monthly Base Rent | | Pre-Default Outstanding Principal | | Capitalized Interest (1) | | Total Debt Outstanding | | Restricted Cash (2) | | Stated Rate | | Default Rate | | Accrued Interest (1) |
| | | | | | | | | | | | | | | | | | | | |
| Manufacturing | 2 | | $ | 3,618 |
| | $ | 16 |
| | $ | 5,460 |
| | $ | 11,354 |
| | $ | 16,814 |
| | $ | — |
| | 5.85 | % | | 9.85 | % | | $ | 143 |
|
| Sporting Goods | 1 | | 3,070 |
| | — |
| | 6,321 |
| | 429 |
| | 6,750 |
| | 453 |
| | 5.62 |
| | 10.62 |
| | 80 |
|
| Consumer Electronics | 1 | | 3,021 |
| | — |
| | 8,592 |
| | 592 |
| | 9,184 |
| | 286 |
| | 5.87 |
| | 9.87 |
| | 62 |
|
| Multi-Tenant Retail | 1 | | 12,580 |
| | 95 |
| | 17,250 |
| | 398 |
| | 17,648 |
| | 575 |
| | 5.53 |
| | 7.53 |
| | 78 |
|
| Sporting Goods | 2 | | 3,457 |
| | — |
| | 9,625 |
| | 310 |
| | 9,935 |
| | — |
| | 4.39 |
| | 9.39 |
| | 78 |
|
| Sporting Goods | 1 | | 2,010 |
| | — |
| | 3,853 |
| | 128 |
| | 3,981 |
| | 169 |
| | 4.65 |
| | 9.65 |
| | 33 |
|
| 8 | | $ | 27,756 |
| | $ | 111 |
| | $ | 51,101 |
| | $ | 13,211 |
| | $ | 64,312 |
| | $ | 1,483 |
| | 5.44 | % | | 9.21 | % | | $ | 474 |
|
(1) Interest capitalized to principal that remains unpaid.
(2) Represents restricted cash controlled by the lender that may be applied to reduce the outstanding principal balance.
Debt Maturities
Future principal payments due on our various types of debt outstanding as of December 31, 2017 (in thousands):
|
| | | | | | | | | | | | | | | | | | | | | | | | | | | |
| | Total | | 2018 | | 2019 | | 2020 | | 2021 | | 2022 | | Thereafter |
| | | | | | | | | | | | | | |
| Revolving Credit Facility | 112,000 |
| | — |
| | 112,000 |
| | — |
| | — |
| | — |
| | — |
|
| Master Trust Notes | 2,248,504 |
| | 163,185 |
| | 40,230 |
| | 410,713 |
| | 237,790 |
| | 969,020 |
| | 427,566 |
|
CMBS - fixed-rate (1) | 332,647 |
| | 68,004 |
| | 3,905 |
| | 4,100 |
| | 4,365 |
| | 47,017 |
| | 205,256 |
|
| Convertible Notes | 747,500 |
| | — |
| | 402,500 |
| | — |
| | 345,000 |
| | — |
| | — |
|
| Unsecured Senior Notes | 300,000 |
| | — |
| | — |
| | — |
| | — |
| | — |
| | 300,000 |
|
| | $ | 3,740,651 |
| | $ | 231,189 |
| | $ | 558,635 |
| | $ | 414,813 |
| | $ | 587,155 |
| | $ | 1,016,037 |
| | $ | 932,822 |
|
(1) The CMBS - fixed-rate payment balance in 2018 includes $64.3 million, including $13.2 million of capitalized interest, for the acceleration of principal payable following an event of default under 6 separate CMBS loans with stated maturities in 2018.
Contractual Obligations
The following table provides information with respect to our commitments as well as potential acquisitions under contract as of December 31, 2017, the table does not reflect available debt extensions (in thousands):
|
| | | | | | | | | | | | | | | | | | | | |
| | | Payment due by period |
| | | | | | | | | | | More than |
| | | | | Less than 1 | | 1-3 years | | 3-5 years | | 5 years |
| Contractual Obligations | | Total | | Year (2018) | | (2019-2020) | | (2021-2022) | | (after 2022) |
| | | | | | | | | | | |
| Debt - Principal | | $ | 3,740,651 |
| | $ | 231,189 |
| | $ | 973,448 |
| | $ | 1,603,192 |
| | $ | 932,822 |
|
Debt - Interest (1) (3) | | 795,950 |
| | 170,252 |
| | 288,219 |
| | 192,452 |
| | 145,027 |
|
Acquisitions Under Contract (2) | | 29,281 |
| | 29,281 |
| | — |
| | — |
| | — |
|
| Capital Improvements | | 34,128 |
| | 30,203 |
| | 2,525 |
| | 1,400 |
| | — |
|
| Operating Lease Obligations | | 43,842 |
| | 3,157 |
| | 6,356 |
| | 6,312 |
| | 28,017 |
|
| Total | | $ | 4,643,852 |
| | $ | 464,082 |
| | $ | 1,270,548 |
| | $ | 1,803,356 |
| | $ | 1,105,866 |
|
(1) Excludes interest on defaulted mortgage loans.
(2) Contracts contain standard cancellation clauses contingent on results of due diligence.
(3) Debt - Interest has been calculated based on outstanding balances as of December 31, 2017 through their respective maturity dates and excludes unamortized non-cash deferred financing costs of $39.6 million, unamortized debt discount of $61.4 million and any interest due on defaulted mortgage loans, including $0.5 million accrued as of December 31, 2017.
Distribution Policy
Distributions from our current or accumulated earnings are generally classified as ordinary income, whereas distributions in excess of our current and accumulated earnings, to the extent of a stockholder’s federal income tax basis in our common stock, are generally classified as a return of capital. Under the 2017 Tax Legislation, U.S. stockholders that are individuals, trusts and estates generally may deduct up to 20% of the ordinary dividends (e.g., dividends not designated as capital gain dividends or qualified dividend income) received from a REIT for taxable years beginning after December 31, 2017 and before January 1, 2026. Distributions in excess of a stockholder’s federal income tax basis in our common stock are generally characterized as capital gain.
We are required to distribute 90% of our taxable income (subject to certain adjustments and excluding net capital gain) on an annual basis to maintain qualification as a REIT for federal income tax purposes and are required to pay federal income tax at regular corporate rates to the extent we distribute less than 100% of our taxable income (including capital gains).
We intend to make distributions that will enable us to meet the distribution requirements applicable to REITs and to eliminate or minimize our obligation to pay corporate-level federal income and excise taxes.
Any distributions will be at the sole discretion of our Board of Directors, and their form, timing and amount, if any, will depend upon a number of factors, including our actual and projected results of operations, FFO, liquidity, cash flows and financial condition, the revenue we actually receive from our properties, our operating expenses, our debt service requirements, our capital expenditures, prohibitions and other limitations under our financing arrangements, our REIT taxable income, the annual REIT distribution requirements, applicable law and such other factors as our Board of Directors deems relevant.
Cash Flows
Comparison of Years Ended December 31, 2017 and 2016
The following table presents a summary of our cash flows for the years ended December 31, 2017 and 2016 (in thousands):
|
| | | | | | | | | | | |
| | Years Ended |
| | December 31, |
| | 2017 | | 2016 | | Change |
| Net cash provided by operating activities | $ | 386,393 |
| | $ | 361,409 |
| | $ | 24,984 |
|
| Net cash provided by (used in) investing activities | 82,942 |
| | (117,251 | ) | | 200,193 |
|
| Net cash used in financing activities | (470,596 | ) | | (255,889 | ) | | (214,707 | ) |
| Net (decrease) increase in cash and cash equivalents | $ | (1,261 | ) | | $ | (11,731 | ) | | $ | 10,470 |
|
As of December 31, 2017, we had $8.8 million of unrestricted cash and cash equivalents as compared to $10.1 million as of December 31, 2016.
Operating Activities
Our cash flows from operating activities are primarily dependent upon the occupancy level of our portfolio, the rental rates specified in our leases, the collectability of rent and the level of our operating expenses and other general and administrative costs.
The increase in net cash provided by operating activities was primarily attributable to a decrease in costs associated with debt extinguishment of $22.9 million due to a lower volume of mortgage debt being extinguished, a decrease in cash paid for interest of $18.4 million related to the lower level of outstanding mortgage debt, and reduced restructuring charge payments of $11.3 million as restructuring activities were finalized in 2016, offset by a decrease in cash revenue of $19.1 million and increases in property costs of $5.8 million related to reimbursable and non-reimbursable property taxes, and G&A costs of $3.6 million.
The decrease in revenue was primarily attributable to the disposition of 192 properties, representing a gross investment in real estate during the year ended December 31, 2017 of $510.9 million, partially offset by the acquisition of 39 properties, during the same period, with a real estate investment value totaling $323.0 million.
Investing Activities
Cash provided by (used in) investing activities is generally used to fund property acquisitions, for investments in loans receivable and, to a limited extent, for capital expenditures. Cash provided by investing activities generally relates to the disposition of real estate and other assets.
Net cash provided by investing activities during 2017 included cash proceeds of $472.5 million from the disposition of 192 properties, offset by $279.9 million to fund the acquisition of 39 properties and capitalized real estate expenditures of $46.1 million and the transfer of sales proceeds to restricted cash accounts of $71.3 million . Net cash provided by investing activities also included collections of principal on loans receivable and real estate assets under direct financing leases totaling $12.8 million and the investment in notes receivable of $5.0 million.
During the same period in 2016, net cash used in investing activities included $655.8 million to fund the acquisition of 269 properties and capitalized real estate expenditures of $27.1 million partially offset by cash proceeds of $524.8 million from the disposition of 213 properties. Net cash used in investing activities also included collections of principal on loans receivable and real estate assets under direct financing leases totaling $8.4 million, offset by the release of sales proceeds from restricted cash accounts of $2.3 million.
Financing Activities
Generally, our net cash used in financing activities is impacted by our common and preferred stock offerings and activity, including repurchases of our common stock under our Stock Repurchase Program, borrowings under our Revolving Credit Facilities and Term Loan, and issuances of net-lease mortgage notes under our Spirit Master Funding Program.
Net cash used in financing activities during 2017 was primarily attributable to the repayment of the $420.0 million Term Loan, the payment of dividends to common and preferred equity owners of $341.7 million, the repurchase of 35,839,965 shares of the Company's outstanding common stock for $286.6 million and repayments of $221.3 million in mortgages and notes payable, offset by the issuance of 6.9 million shares of Class A Preferred Stock for net proceeds of $166.2 million, and debt issuances under our Spirit Master Funding Program of $618.6 million.
Net cash used in financing activities during 2016 was primarily attributable to the repayment of our indebtedness of $863.8 million and the payment of dividends to equity owners of $323.6 million, both of which were primarily funded from our operating cash flows, net borrowings under our Revolving Credit Facility was terminated and its outstanding borrowings were repaid withTerm Loan of $86.0 million and $95.0 million, respectively, net proceeds of $298.1 million from the issuance of $300.0 million aggregate principal Senior Unsecured Notes and the sale of an aggregate 40.8 million shares of our common stock in an underwritten public offering and under our ATM Program, generating net proceeds of $368.9 million and $77.7 million, respectively.
Comparison of Years Ended December 31, 2016 and 2015
The following table presents a summary of our cash flows for the years ended December 31, 2016 and 2015 Credit Facility. Properties securing this facility became unencumbered(in thousands):
|
| | | | | | | | | | | |
| | Years Ended |
| | December 31, |
| | 2016 | | 2015 | | Change |
| Net cash provided by operating activities | $ | 361,409 |
| | $ | 371,986 |
| | $ | (10,577 | ) |
| Net cash used in investing activities | (117,251 | ) | | (385,696 | ) | | 268,445 |
|
| Net cash provided by financing activities | (255,889 | ) | | (140,681 | ) | | (115,208 | ) |
| Net increase (decrease) in cash and cash equivalents | $ | (11,731 | ) | | $ | (154,391 | ) | | $ | 142,660 |
|
As of December 31, 2016, we had $10.1 million of cash and cash equivalents as compared to $21.8 million as of December 31, 2015.
Operating Activities
Our cash flows from operating activities are primarily dependent upon its termination. the occupancy level of our portfolio, the rental rates specified in our leases, the collectability of rent and the level of our operating expenses and other general and administrative costs.
The 2013 Credit Facility's borrowing margindecrease in net cash provided by operating activities was LIBOR plus 2.50% based on the Company's leverage, withprimarily attributable to an unused fee of 0.35%. Upon terminating the 2013 Credit Facility, the Company recognizedincrease in debt extinguishment costs of $2.0$18.1 million, resultingrestructuring charge payments of $10.2 million, G&A costs of $6.9 million, payments to terminate interest rate swap agreements of $1.7 million and net changes in operating assets and liabilities of $7.2 million, partially offset by an increase in cash revenue of $12.9 million and a decrease in cash paid for interest of $27.4 million.
The increase in revenue was primarily attributable to the acquisition of 269 properties, representing a gross investment in real estate during the year ended December 31, 2016 totaling $704.9 million partially offset by the disposition of 213 properties during the same period with a real estate investment value of $598.7 million.
Investing Activities
Cash used in investing activities is generally used to fund property acquisitions, for investments in loans receivable and, to a limited extent, for capital expenditures. Cash provided by investing activities generally relates to the disposition of real estate and other assets.
Net cash used in investing activities during 2016 included $655.8 million to fund the acquisition of 269 properties and capitalized real estate expenditures of $27.1 million partially offset by cash proceeds of $524.8 million from the write-offdisposition of 213 properties. Net cash used in investing activities also included collections of principal on loans receivable and real estate assets under direct financing leases totaling $8.4 million, offset by the release of sales proceeds from restricted cash accounts of $2.3 million.
During the same period in 2015, net cash used in investing activities included $876.0 million to fund the acquisition of 232 properties and capitalized real estate expenditures of $10.3 million partially offset by cash proceeds of $496.6 million from the disposition of 110 properties. Net cash used in investing activities also included investment in loans
receivable of $4.0 million, partially offset by the release of sales proceeds from restricted cash accounts of $41.0 million and collections of principal on loans receivable and real estate assets under direct financing leases totaling $6.8 million.
Financing Activities
Generally, our net cash (used in) provided by financing activities is impacted by our net borrowings and common stock offerings, including sales of our common stock under our ATM Program, common stock offerings, borrowings under our Revolving Credit Facilities and Term Loan, and issuances of net-lease mortgage notes under our Spirit Master Funding Program.
Net cash used in financing activities during 2016 was primarily attributable to the repayment of our indebtedness of $863.8 million and the payment of dividends to equity owners of $323.6 million, both of which were primarily funded from our operating cash flows, net borrowings under our Revolving Credit Facility and Term Loan of $86.0 million and $95.0 million, respectively, net proceeds of $298.1 million from the issuance of $300.0 million aggregate principal Senior Unsecured Notes and the sale of an aggregate 40.8 million shares of our common stock in an underwritten public offering and under our ATM Program, generating net proceeds of $368.9 million and $77.7 million, respectively.
Net cash used in financing activities during 2015 was primarily attributable to the repayment of our indebtedness of $512.5 million, the payment of dividends to equity owners of $292.3 million, both of which were paid primarily through sources from our operating cash flows, and net repayments under our Revolving Credit Facilities of $15.2 million. These amounts were partially offset by the issuance and sale of 23.0 million shares of our common stock in an underwritten public offering and the sale of 6.6 million shares of our common stock under our ATM Program for aggregate net proceeds of $347.2 million and borrowings under our Term Loan of $325.0 million.
Item 7A. Quantitative and Qualitative Disclosures About Market Risk
We are exposed to financial market risks, especially interest rate risk. Interest rates and other factors, such as occupancy, rental rates and the financial condition of our tenants, influence our performance more so than does inflation. Changes in interest rates do not necessarily correlate with inflation rates or changes in inflation rates. As described above, we generally offer leases that provide for payments of base rent with scheduled increases and, to a lesser extent, contingent rent based on a percentage of the tenant’s gross sales to help mitigate the effect of inflation. Because the properties in our portfolio are generally leased to tenants under triple-net leases, our exposure to rising property operating costs due to inflation is mitigated.
Interest rates are highly sensitive to many factors, including governmental monetary policies and domestic and global economic and political conditions, which are beyond our control. Our operating results depend heavily on the difference between the revenue from our assets and the interest expense incurred on our borrowings. We may incur additional variable rate debt in the future, including amounts that we may borrow under our Revolving Credit Facility and Term Loan. In addition, decreases in interest rates may lead to additional competition for the acquisition of real estate due to a reduction in desirable alternative income-producing investments, which may lead to a decrease in the yields on real estate we have targeted for acquisition. In such circumstances, if we are not able to offset the decrease in yields by obtaining lower interest costs on our borrowings, our results of operations will be adversely affected. Significant increases in interest rates may also have an adverse impact on our earnings if we are unable to acquire real estate with rental rates high enough to offset the increase in interest rates on our borrowings.
In the event interest rates rise significantly or there is an economic downturn, defaults may increase and result in credit losses, which may adversely affect our liquidity and operating results. In a decreasing interest rate environment, borrowers are generally more likely to prepay their loans in order to obtain financing at lower interest rates. However, the vast majority of our mortgage notes payable have prepayment clauses that make refinancing during a decreasing interest rate environment uneconomical. Investments in our mortgage loans receivable, however, have significant prepayment protection in the form of yield maintenance provisions, which provide us with substantial yield protection in a decreasing interest rate environment with respect to this portion of our investment portfolio.
The objective of our interest rate risk management policy is to match fund fixed-rate assets with fixed-rate liabilities. As of December 31, 2017, our assets were primarily long-term, fixed-rate leases (though most have scheduled rental increases during the terms of the leases). As of December 31, 2017, $3.6 billion of our indebtedness was fixed-rate, consisting of our Master Trust Notes, fixed-rate CMBS loans, Senior Unsecured Notes and Convertible Notes, with a weighted average stated interest rate of 4.67%, excluding amortization of deferred financing costs and debt discounts/premiums. As of December 31, 2017, $112.0 million of our indebtedness was variable-rate, consisting of our Revolving Credit Facility, with a weighted average stated interest rate of 2.74%, excluding amortization of deferred financing
costs and debt discounts/premiums. If one-month LIBOR as of December 31, 2017 increased by 12.5 basis points, or 0.125%, the resulting increase in annual interest expense with respect to the $112.0 million outstanding under the variable-rate obligations would impact our future earnings and cash flows by $140.0 thousand.
The estimated fair values of our debt instruments have been derived based on market quotes for comparable instruments or discounted cash flow analysis using estimates of the amount and timing of future cash flows, market rates and credit spreads. The debt instrument balances as of December 31, 2017 are as follows (in thousands):
|
| | | | | | | |
| | Carrying
Value | | Estimated
Fair Value |
| | | | |
| Revolving Credit Facility | $ | 112,000 |
| | $ | 111,997 |
|
Term Loan, net (1) | — |
| | — |
|
Senior Unsecured Notes, net (1) | 295,321 |
| | 299,049 |
|
Mortgages and notes payable, net (1) | 2,516,478 |
| | 2,657,599 |
|
Convertible Notes, net (1) | 715,881 |
| | 761,440 |
|
(1) The carrying value of the debt instruments are net of unamortized deferred financing costs.costs and certain debt discounts/premiums.
LineItem 8. Financial Statements and Supplementary Data
INDEX TO CONSOLIDATED FINANCIAL STATEMENTS
|
| |
| Item 8. Financial Statements and Supplemental Data | |
| Reports of Independent Registered Public Accounting Firms | |
| Consolidated Balance Sheets of Spirit Realty Capital, Inc. as of December 31, 2017 and 2016 | |
| Consolidated Statements of Operations of Spirit Realty Capital, Inc. for the Years Ended December 31, 2017, 2016 and 2015 | |
| Consolidated Statements of Comprehensive Income of Spirit Realty Capital, Inc. for the Years Ended December 31, 2017, 2016 and 2015 | |
| Consolidated Statements of Stockholders' Equity of Spirit Realty Capital, Inc. for the Years Ended December 31, 2017, 2016 and 2015 | |
| Consolidated Statements of Cash Flows of Spirit Realty Capital, Inc. for the Years Ended December 31, 2017, 2016 and 2015 | |
| Consolidated Balance Sheets of Spirit Realty, L.P. as of December 31, 2017 and 2016 | |
| Consolidated Statements of Operations of Spirit Realty, L.P. for the Years Ended December 31, 2017, 2016 and 2015 | |
| Consolidated Statements of Comprehensive Income of Spirit Realty, L.P. for the Years Ended December 31, 2017, 2016 and 2015 | |
| Consolidated Statements of Partners' Capital of Spirit Realty, L.P. for the Years Ended December 31, 2017, 2016 and 2015 | |
| Consolidated Statements of Cash Flows of Spirit Realty, L.P. for the Years Ended December 31, 2017, 2016 and 2015 | |
| Notes to Consolidated Financial Statements | |
Report of CreditIndependent Registered Public Accounting Firm
To the Stockholders and the Board of Directors of
Spirit Realty Capital, Inc.
Opinion on Internal Control over Financial Reporting
We have audited Spirit Realty Capital, Inc.’s internal control over financial reporting as of December 31, 2017, based on criteria established in Internal Control-Integrated Framework issued by the Committee of Sponsoring Organizations of the Treadway Commission (2013 framework) (the COSO criteria). In our opinion, Spirit Realty Capital, Inc. (the Company) maintained, in all material respects, effective internal control over financial reporting as of December 31, 2017, based on the COSO criteria.
We also have audited, in accordance with the standards of the Public Company Accounting Oversight Board (United States) (PCAOB), the 2017 consolidated financial statements of the Company and our report dated February 22, 2018 expressed an unqualified opinion thereon.
Basis for Opinion
The Company’s management is responsible for maintaining effective internal control over financial reporting and for its assessment of the effectiveness of internal control over financial reporting included in the accompanying Management’s Report on Internal Control over Financial Reporting. Our responsibility is to express an opinion on the Company’s internal control over financial reporting based on our audit. We are a public accounting firm registered with the PCAOB and are required to be independent with respect to the Company in accordance with the U.S. federal securities laws and the applicable rules and regulations of the Securities and Exchange Commission and the PCAOB.
We conducted our audit in accordance with the standards of the PCAOB. Those standards require that we plan and perform the audit to obtain reasonable assurance about whether effective internal control over financial reporting was maintained in all material respects.
Our audit included obtaining an understanding of internal control over financial reporting, assessing the risk that a material weakness exists, testing and evaluating the design and operating effectiveness of internal control based on the assessed risk, and performing such other procedures as we considered necessary in the circumstances. We believe that our audit provides a reasonable basis for our opinion.
Definition and Limitations of Internal Control Over Financial Reporting
A company’s internal control over financial reporting is a process designed to provide reasonable assurance regarding the reliability of financial reporting and the preparation of financial statements for external purposes in accordance with generally accepted accounting principles. A company’s internal control over financial reporting includes those policies and procedures that (1) pertain to the maintenance of records that, in reasonable detail, accurately and fairly reflect the transactions and dispositions of the assets of the company; (2) provide reasonable assurance that transactions are recorded as necessary to permit preparation of financial statements in accordance with generally accepted accounting principles, and that receipts and expenditures of the company are being made only in accordance with authorizations of management and directors of the company; and (3) provide reasonable assurance regarding prevention or timely detection of unauthorized acquisition, use, or disposition of the company’s assets that could have a material effect on the financial statements.
Because of its inherent limitations, internal control over financial reporting may not prevent or detect misstatements. Also, projections of any evaluation of effectiveness to future periods are subject to the risk that controls may become inadequate because of changes in conditions, or that the degree of compliance with the policies or procedures may deteriorate.
/s/ Ernst & Young LLP
Dallas, Texas
February 22, 2018
Report of Independent Registered Public Accounting Firm
To the Stockholders and the Board of Directors of
Spirit Realty Capital, Inc.
Opinion on the Financial Statements
We have audited the accompanying consolidated balance sheets of Spirit Realty Capital, Inc. (the Company) as of December 31, 2017 and 2016, the related consolidated statements of operations, comprehensive income, stockholders’ equity and cash flows for each of the three years in the period ended December 31, 2017, and the related notes and financial statement schedules listed in the Index at Item 15(a) (collectively referred to as the consolidated financial statements). In our opinion, the consolidated financial statements present fairly, in all material respects, the financial position of the Company at December 31, 2017 and 2016, and the results of its operations and its cash flows for each of the three years in the period ended December 31, 2017, in conformity with U.S. generally accepted accounting principles.
We also have audited, in accordance with the standards of the Public Company Accounting Oversight Board (United States) (PCAOB), the Company’s internal control over financial reporting as of December 31, 2017, based on criteria established in Internal Control-Integrated Framework issued by the Committee of Sponsoring Organizations of the Treadway Commission (2013 framework) and our report dated February 22, 2018 expressed an unqualified opinion thereon.
Basis for Opinion
These financial statements are the responsibility of the Company‘s management. Our responsibility is to express an opinion on the Company‘s financial statements based on our audits. We are a public accounting firm registered with the PCAOB and are required to be independent with respect to the Company in accordance with the US federal securities laws and the applicable rules and regulations of the Securities and Exchange Commission and the PCAOB.
We conducted our audits in accordance with the standards of the PCAOB. Those standards require that we plan and perform the audit to obtain reasonable assurance about whether the financial statements are free of material misstatement, whether due to error or fraud. Our audits included performing procedures to assess the risks of material misstatement of the financial statements, whether due to error or fraud, and performing procedures that respond to those risks. Such procedures included examining, on a test basis, evidence regarding the amounts and disclosures in the financial statements. Our audits also included evaluating the accounting principles used and significant estimates made by management, as well as evaluating the overall presentation of the financial statements. We believe that our audits provide a reasonable basis for our opinion.
/s/ Ernst & Young LLP
We have served as the Company’s auditor since 2003.
Dallas, Texas
February 22, 2018
Report of Independent Registered Public Accounting Firm
To the Partners of Spirit Realty, L.P. and the Board of Directors of
Spirit Realty Capital, Inc.
Opinion on the Financial Statements
We have audited the accompanying consolidated balance sheets of Spirit Realty, L.P. (the Operating Partnership) as of December 31, 2017 and 2016, the related consolidated statements of operations, comprehensive income, partners’ capital and cash flows for each of the three years in the period ended December 31, 2017, and the related notes and financial statement schedules listed in the Index at Item 15(a) (collectively referred to as the consolidated financial statements). In our opinion, the consolidated financial statements present fairly, in all material respects, the financial position of the Operating Partnership at December 31, 2017 and 2016, and the results of its operations and its cash flows for each of the three years in the period ended December 31, 2017, in conformity with U.S. generally accepted accounting principles.
Basis for Opinion
These financial statements are the responsibility of the Operating Partnership's management. Our responsibility is to express an opinion on the Operating Partnership’s financial statements based on our audits. We are a public accounting firm registered with the PCAOB and are required to be independent with respect to the Operating Partnership in accordance with the U.S. federal securities laws and the applicable rules and regulations of the Securities and Exchange Commission and the PCAOB.
We conducted our audits in accordance with the standards of the PCAOB. Those standards require that we plan and perform the audit to obtain reasonable assurance about whether the financial statements are free of material misstatement, whether due to error or fraud. Our audits included performing procedures to assess the risks of material misstatement of the financial statements, whether due to error or fraud, and performing procedures that respond to those risks. Such procedures included examining, on a test basis, evidence regarding the amounts and disclosures in the financial statements. Our audits also included evaluating the accounting principles used and significant estimates made by management, as well as evaluating the overall presentation of the financial statements. We believe that our audits provide a reasonable basis for our opinion.
/s/ Ernst & Young LLP
We have served as the Operating Partnership’s auditor since 2016.
Dallas, Texas
February 22, 2018
SPIRIT REALTY CAPITAL, INC.
Consolidated Balance Sheets
(In Thousands, Except Share and Per Share Data)
|
| | | | | | | |
| | December 31,
2017 | | December 31,
2016 |
| Assets |
|
|
|
| Investments: |
|
|
|
| Real estate investments: |
|
|
|
| Land and improvements | $ | 2,588,930 |
|
| $ | 2,704,010 |
|
| Buildings and improvements | 4,692,377 |
|
| 4,775,221 |
|
| Total real estate investments | 7,281,307 |
|
| 7,479,231 |
|
| Less: accumulated depreciation | (1,075,643 | ) |
| (940,005 | ) |
| 6,205,664 |
|
| 6,539,226 |
|
| Loans receivable, net | 79,967 |
|
| 66,578 |
|
| Intangible lease assets, net | 409,903 |
|
| 470,276 |
|
| Real estate assets under direct financing leases, net | 24,865 |
|
| 36,005 |
|
| Real estate assets held for sale, net | 48,929 |
|
| 160,570 |
|
| Net investments | 6,769,328 |
|
| 7,272,655 |
|
| Cash and cash equivalents | 8,798 |
|
| 10,059 |
|
| Deferred costs and other assets, net | 231,045 |
|
| 140,917 |
|
| Goodwill | 254,340 |
|
| 254,340 |
|
| Total assets | $ | 7,263,511 |
|
| $ | 7,677,971 |
|
|
|
|
|
| Liabilities and stockholders’ equity |
|
|
|
| Liabilities: |
|
|
|
| Revolving Credit Facility | $ | 112,000 |
|
| $ | 86,000 |
|
| Term Loan, net | — |
|
| 418,471 |
|
| Senior Unsecured Notes, net | 295,321 |
| | 295,112 |
|
| Mortgages and notes payable, net | 2,516,478 |
|
| 2,162,403 |
|
| Convertible Notes, net | 715,881 |
|
| 702,642 |
|
| Total debt, net | 3,639,680 |
|
| 3,664,628 |
|
| Intangible lease liabilities, net | 155,303 |
|
| 182,320 |
|
| Accounts payable, accrued expenses and other liabilities | 148,919 |
|
| 148,915 |
|
| Total liabilities | 3,943,902 |
|
| 3,995,863 |
|
| Commitments and contingencies (see Note 8) |
|
|
|
|
|
| Stockholders’ equity: |
|
|
|
| Preferred stock and paid in capital, $0.01 par value, 20,000,000 shares authorized: 6,900,000 shares and no shares issued and outstanding at December 31, 2017 and December 31, 2016, respectively, liquidation preference of $25.00 per share | 166,193 |
| | — |
|
| Common stock, $0.01 par value, 750,000,000 shares authorized: 448,868,269 shares and 483,624,120 shares issued and outstanding at December 31, 2017 and December 31, 2016, respectively | 4,489 |
|
| 4,836 |
|
| Capital in excess of common stock par value | 5,193,631 |
|
| 5,177,086 |
|
| Accumulated deficit | (2,044,704 | ) |
| (1,499,814 | ) |
| Total stockholders’ equity | 3,319,609 |
|
| 3,682,108 |
|
| Total liabilities and stockholders’ equity | $ | 7,263,511 |
|
| $ | 7,677,971 |
|
See accompanying notes.
SPIRIT REALTY CAPITAL, INC.
Consolidated Statements of Operations
(In Thousands, Except Share and Per Share Data)
|
| | | | | | | | | | | | |
| | | Years Ended December 31, |
| | | 2017 | | 2016 | | 2015 |
| Revenues: | | | | | | |
| Rentals | | $ | 639,017 |
| | $ | 648,363 |
| | $ | 634,151 |
|
| Interest income on loans receivable | | 3,791 |
| | 5,253 |
| | 6,948 |
|
| Earned income from direct financing leases | | 2,078 |
| | 2,742 |
| | 3,024 |
|
| Tenant reimbursement income | | 16,747 |
| | 14,125 |
| | 15,952 |
|
| Other income | | 7,322 |
| | 15,491 |
| | 7,260 |
|
| Total revenues | | 668,955 |
| | 685,974 |
| | 667,335 |
|
| Expenses: | | | | | | |
| General and administrative | | 62,064 |
| | 52,615 |
| | 47,730 |
|
| Restructuring charges | | — |
| | 6,341 |
| | 7,056 |
|
| Transaction costs | | 6,361 |
| | — |
| | — |
|
| Property costs (including reimbursable) | | 36,617 |
| | 30,839 |
| | 27,715 |
|
| Real estate acquisition costs | | 1,356 |
| | 3,229 |
| | 2,739 |
|
| Interest | | 190,127 |
| | 196,586 |
| | 222,901 |
|
| Depreciation and amortization | | 256,019 |
| | 262,276 |
| | 260,633 |
|
| Impairments | | 102,330 |
| | 88,275 |
| | 70,695 |
|
| Total expenses | | 654,874 |
| | 640,161 |
| | 639,469 |
|
| Income from continuing operations before other (expense) income and income tax expense | | 14,081 |
| | 45,813 |
| | 27,866 |
|
| Other (expense) income: | | | | | | |
| (Loss) gain on debt extinguishment | | (1,645 | ) | | 233 |
| | (3,162 | ) |
| Total other (expense) income | | (1,645 | ) | | 233 |
| | (3,162 | ) |
| Income from continuing operations before income tax expense | | 12,436 |
| | 46,046 |
| | 24,704 |
|
| Income tax expense | | (394 | ) | | (965 | ) | | (601 | ) |
| Income from continuing operations | | 12,042 |
| | 45,081 |
| | 24,103 |
|
| Discontinued operations: | | | | | | |
| Income from discontinued operations | | — |
| | — |
| | 98 |
|
| Gain on disposition of assets | | — |
| | — |
| | 590 |
|
| Income from discontinued operations | | — |
| | — |
| | 688 |
|
| Income before gain on disposition of assets | | 12,042 |
| | 45,081 |
| | 24,791 |
|
| Gain on disposition of assets | | 65,106 |
| | 52,365 |
| | 68,421 |
|
| Net Income | | 77,148 |
| | 97,446 |
| | 93,212 |
|
| Dividends paid to preferred stockholders | | (2,530 | ) | | — |
| | — |
|
| Net income attributable to common stockholders | | $ | 74,618 |
| | $ | 97,446 |
| | $ | 93,212 |
|
| | | | | | | |
| Net income per share attributable to common stockholders—basic | | $ | 0.16 |
| | $ | 0.21 |
| | $ | 0.21 |
|
| | | | | | | |
| Net income per share attributable to common stockholders—diluted | | $ | 0.16 |
| | $ | 0.21 |
| | $ | 0.21 |
|
| Weighted average shares of common stock outstanding: | | | | | | |
| Basic | | 467,934,945 |
| | 469,217,776 |
| | 432,222,953 |
|
| Diluted | | 467,942,788 |
| | 469,246,265 |
| | 432,545,625 |
|
See accompanying notes.
SPIRIT REALTY CAPITAL, INC.
Consolidated Statements of Comprehensive Income
(In Thousands)
|
| | | | | | | | | | | |
| | Years Ended December 31, |
| | 2017 | | 2016 | | 2015 |
| Net income attributable to common stockholders | $ | 74,618 |
| | $ | 97,446 |
| | $ | 93,212 |
|
| Other comprehensive income: | | | | | |
| Change in net unrealized losses on cash flow hedges | — |
| | (1,137 | ) | | (1,190 | ) |
| Net cash flow hedge losses reclassified to operations | — |
| | 2,165 |
| | 1,245 |
|
| Total comprehensive income | $ | 74,618 |
| | $ | 98,474 |
| | $ | 93,267 |
|
See accompanying notes.
SPIRIT REALTY CAPITAL, INC.
Consolidated Statements of Stockholders’ Equity
(In Thousands, Except Share Data)
|
| | | | | | | | | | | | | | | | | | | | | | | | | | | | | | |
| | | Preferred Stock | | Common Stock | | Accumulated Deficit | | | | Total Stockholders’ Equity |
| | | Shares | | Par
Value and Capital in Excess of Par Value | | Shares | | Par
Value | | Capital in Excess of Par Value | | | AOCL | |
| Balances, December 31, 2014 | | — |
| | $ | — |
| | 411,350,440 |
| | $ | 4,113 |
| | $ | 4,361,320 |
| | $ | (1,052,688 | ) | | $ | (1,083 | ) | | $ | 3,311,662 |
|
| Net income | | — |
| | — |
| | — |
| | — |
| | — |
| | 93,212 |
| | — |
| | 93,212 |
|
| Other comprehensive income | | — |
| | — |
| | — |
| | — |
| | — |
| | — |
| | 55 |
| | 55 |
|
| Dividends declared on common stock | | — |
| | — |
| | — |
| | — |
| | — |
| | (298,531 | ) | | — |
| | (298,531 | ) |
| Tax withholdings related to net stock settlements | | — |
| | — |
| | (426,158 | ) | | (4 | ) | | — |
| | (4,268 | ) | | — |
| | (4,272 | ) |
| Issuance of shares of common stock, net | | — |
| | — |
| | 29,610,100 |
| | 296 |
| | 346,915 |
| | — |
| | — |
| | 347,211 |
|
| Exercise of stock options | | — |
| | — |
| | 5,000 |
| | — |
| | 46 |
| | — |
| | — |
| | 46 |
|
| Stock-based compensation, net | | — |
| | — |
| | 1,280,582 |
| | 13 |
| | 13,042 |
| | (564 | ) | | — |
| | 12,491 |
|
| Balances, December 31, 2015 | | — |
| | $ | — |
| | 441,819,964 |
| | $ | 4,418 |
| | $ | 4,721,323 |
| | $ | (1,262,839 | ) | | $ | (1,028 | ) | | $ | 3,461,874 |
|
| Net income | | — |
| | — |
| | — |
| | — |
| | — |
| | 97,446 |
| | — |
| | 97,446 |
|
| Other comprehensive income | | — |
| | — |
| | — |
| | — |
| | — |
| | — |
| | 1,028 |
| | 1,028 |
|
| Dividends declared on common stock | | — |
| | — |
| | — |
| | — |
| | — |
| | (333,180 | ) | | — |
| | (333,180 | ) |
| Tax withholdings related to net stock settlements | | — |
| | — |
| | (72,835 | ) | | (1 | ) | | — |
| | (752 | ) | | — |
| | (753 | ) |
| Issuance of shares of common stock, net | | — |
| | — |
| | 40,835,360 |
| | 408 |
| | 446,205 |
| | — |
| | — |
| | 446,613 |
|
| Stock-based compensation, net | | — |
| | — |
| | 1,041,631 |
| | 11 |
| | 9,558 |
| | (489 | ) | | — |
| | 9,080 |
|
| Balances, December 31, 2016 | | — |
| | $ | — |
| | 483,624,120 |
| | $ | 4,836 |
| | $ | 5,177,086 |
| | $ | (1,499,814 | ) | | $ | — |
| | $ | 3,682,108 |
|
| Net income | | — |
| | — |
| | — |
| | — |
| | — |
| | 77,148 |
| | — |
| | 77,148 |
|
| Dividends declared on preferred stock | | — |
| | — |
| | — |
| | — |
| | — |
| | (2,530 | ) | | — |
| | (2,530 | ) |
| Net income available to common stockholders | | — |
| | — |
| | — |
| | — |
| | — |
| | 74,618 |
| | — |
| | 74,618 |
|
| Issuance of preferred stock | | 6,900,000 |
| | 166,193 |
| | — |
| | — |
| | — |
| | — |
| | — |
| | 166,193 |
|
| Dividends declared on common stock | | — |
| | — |
| | — |
| | — |
| | — |
| | (332,402 | ) | | — |
| | (332,402 | ) |
| Tax withholdings related to net stock settlements | | — |
| | — |
| | (440,312 | ) | | (4 | ) | | — |
| | (3,538 | ) | | — |
| | (3,542 | ) |
| Repurchase of common shares | | — |
| | — |
| | (35,839,965 | ) | | (358 | ) | | — |
| | (282,731 | ) | | — |
| | (283,089 | ) |
| Stock-based compensation, net | | — |
| | — |
| | 1,524,426 |
| | 15 |
| | 16,545 |
| | (837 | ) | | — |
| | 15,723 |
|
| Balances, December 31, 2017 | | 6,900,000 |
| | $ | 166,193 |
| | 448,868,269 |
| | $ | 4,489 |
| | $ | 5,193,631 |
| | $ | (2,044,704 | ) | | $ | — |
| | $ | 3,319,609 |
|
See accompanying notes.
SPIRIT REALTY CAPITAL, INC.
Consolidated Statements of Cash Flows
(In Thousands)
|
| | | | | | | | | | | | |
| | | Years Ended December 31, |
| | | 2017 | | 2016 | | 2015 |
| Operating activities | | | | | | |
| Net Income | | $ | 77,148 |
| | $ | 97,446 |
| | $ | 93,212 |
|
| Adjustments to reconcile net income to net cash provided by operating activities: | | | | | | |
| Depreciation and amortization | | 256,019 |
| | 262,276 |
| | 260,633 |
|
| Impairments | | 102,330 |
| | 88,275 |
| | 70,729 |
|
| Amortization of deferred financing costs | | 9,896 |
| | 9,070 |
| | 7,937 |
|
| Payments to terminate interest rate swap | | — |
| | (1,724 | ) | | — |
|
| Derivative net settlements, amortization and terminations | | — |
| | 1,811 |
| | (132 | ) |
| Amortization of debt discounts | | 13,572 |
| | 6,217 |
| | 2,322 |
|
| Stock-based compensation expense | | 16,560 |
| | 9,570 |
| | 13,321 |
|
| Loss (gain) on debt extinguishment | | 1,645 |
| | (233 | ) | | 3,162 |
|
| Debt extinguishment costs | | (3,305 | ) | | (26,219 | ) | | (8,112 | ) |
| Gains on dispositions of real estate and other assets | | (65,106 | ) | | (52,365 | ) | | (69,011 | ) |
| Non-cash revenue | | (28,439 | ) | | (26,333 | ) | | (20,930 | ) |
| Bad debt expense and other | | 5,913 |
| | (594 | ) | | 151 |
|
| Changes in operating assets and liabilities: | | | | | | |
| Deferred costs and other assets, net | | (1,418 | ) | | (6,561 | ) | | (604 | ) |
| Accounts payable, accrued expenses and other liabilities | | 1,578 |
| | 6,308 |
| | 13,382 |
|
| Accrued restructuring charges | | — |
| | (5,535 | ) | | 5,926 |
|
| Net cash provided by operating activities | | 386,393 |
| | 361,409 |
| | 371,986 |
|
| Investing activities | | | | | | |
| Acquisitions of real estate | | (279,934 | ) | | (655,835 | ) | | (875,983 | ) |
| Capitalized real estate expenditures | | (46,100 | ) | | (27,078 | ) | | (10,269 | ) |
| Investments in loans receivable | | (4,995 | ) | | (5,073 | ) | | (4,020 | ) |
| Collections of principal on loans receivable and real estate assets under direct financing leases | | 12,769 |
| | 8,410 |
| | 6,822 |
|
| Proceeds from dispositions of real estate and other assets | | 472,496 |
| | 524,776 |
| | 496,646 |
|
| Transfers of net sales proceeds from (to) restricted accounts pursuant to 1031 Exchanges | | — |
| | 39,869 |
| | (39,869 | ) |
| Transfers of net sales proceeds (to) from Master Trust Release | | (71,294 | ) | | (2,320 | ) | | 40,977 |
|
| Net cash provided by (used in) investing activities | | 82,942 |
| | (117,251 | ) | | (385,696 | ) |
SPIRIT REALTY CAPITAL, INC.
Consolidated Statements of Cash Flows
(In Thousands)
|
| | | | | | | | | | | | |
| | | Years Ended December 31, |
| | | 2017 | | 2016 | | 2015 |
| Financing activities | | | | | | |
| Borrowings under Revolving Credit Facilities | | 940,200 |
| | 1,080,000 |
| | 798,000 |
|
| Repayments under Revolving Credit Facilities | | (914,200 | ) | | (994,000 | ) | | (813,181 | ) |
| Borrowings under mortgages and notes payable | | 618,603 |
| | — |
| | — |
|
| Repayments under mortgages and notes payable | | (221,310 | ) | | (863,836 | ) | | (512,486 | ) |
| Borrowings under Term Loan | | — |
| | 796,000 |
| | 325,000 |
|
| Repayments under Term Loan | | (420,000 | ) | | (701,000 | ) | | — |
|
| Borrowings under Senior Unsecured Notes | | — |
| | 298,134 |
| | — |
|
| Deferred financing costs | | (8,255 | ) | | (4,352 | ) | | (6,150 | ) |
| Proceeds from issuance of common stock, net of offering costs | | — |
| | 446,613 |
| | 347,211 |
|
| Proceeds from issuance of preferred stock, net of offering costs | | 166,193 |
| | — |
| | — |
|
| Repurchase of shares of common stock | | (286,631 | ) | | (753 | ) | | (4,272 | ) |
| Proceeds from exercise of stock options | | — |
| | — |
| | 46 |
|
| Preferred stock dividends paid | | (2,530 | ) | | — |
| | — |
|
| Common stock dividends paid | | (339,174 | ) | | (323,640 | ) | | (292,262 | ) |
| Transfers (from) to reserve/escrow deposits with lenders, net | | (3,492 | ) | | 10,945 |
| | 17,413 |
|
| Net cash used in financing activities | | (470,596 | ) | | (255,889 | ) | | (140,681 | ) |
| Net decrease in cash and cash equivalents | | (1,261 | ) | | (11,731 | ) | | (154,391 | ) |
| Cash and cash equivalents, beginning of year | | 10,059 |
| | 21,790 |
| | 176,181 |
|
| Cash and cash equivalents, end of year | | $ | 8,798 |
| | $ | 10,059 |
| | $ | 21,790 |
|
See accompanying notes.
SPIRIT REALTY, L.P.
Consolidated Balance Sheets
(In Thousands, Except Unit and Per Unit Data)
|
| | | | | | | |
| | December 31,
2017 | | December 31,
2016 |
| Assets | | | |
| Investments: | | | |
| Real estate investments: | | | |
| Land and improvements | $ | 2,588,930 |
| | $ | 2,704,010 |
|
| Buildings and improvements | 4,692,377 |
| | 4,775,221 |
|
| Total real estate investments | 7,281,307 |
| | 7,479,231 |
|
| Less: accumulated depreciation | (1,075,643 | ) | | (940,005 | ) |
| | 6,205,664 |
| | 6,539,226 |
|
| Loans receivable, net | 79,967 |
| | 66,578 |
|
| Intangible lease assets, net | 409,903 |
| | 470,276 |
|
| Real estate assets under direct financing leases, net | 24,865 |
| | 36,005 |
|
| Real estate assets held for sale, net | 48,929 |
| | 160,570 |
|
| Net investments | 6,769,328 |
| | 7,272,655 |
|
| Cash and cash equivalents | 8,798 |
| | 10,059 |
|
| Deferred costs and other assets, net | 231,045 |
| | 140,917 |
|
| Goodwill | 254,340 |
| | 254,340 |
|
| Total assets | $ | 7,263,511 |
| | $ | 7,677,971 |
|
| Liabilities and stockholders’ equity | | | |
| Liabilities: | | | |
| Revolving Credit Facility | $ | 112,000 |
| | $ | 86,000 |
|
| Term Loan, net | — |
| | 418,471 |
|
| Senior Unsecured Notes, net | 295,321 |
| | 295,112 |
|
| Mortgages and notes payable, net | 2,516,478 |
| | 2,162,403 |
|
| Notes payable to Spirit Realty Capital, Inc., net | 715,881 |
| | 702,642 |
|
| Total debt, net | 3,639,680 |
| | 3,664,628 |
|
| Intangible lease liabilities, net | 155,303 |
| | 182,320 |
|
| Accounts payable, accrued expenses and other liabilities | 148,919 |
| | 148,915 |
|
| Total liabilities | 3,943,902 |
| | 3,995,863 |
|
| Commitments and contingencies (see Note 8) |
|
| |
|
|
| Partners' Capital | | | |
| Partnership units | | | |
| General partner's common capital, 3,988,218 units issued and outstanding as of both December 31, 2017 and December 31, 2016 | 24,426 |
| | 26,586 |
|
| Limited partners' preferred capital: 6,900,000 and no units issued and outstanding as of December 31, 2017 and December 31, 2016, respectively | 166,193 |
| | — |
|
| Limited partners' common capital, 444,880,051 and 479,635,902 units issued and outstanding as of December 31, 2017 and December 31, 2016, respectively | 3,128,990 |
| | 3,655,522 |
|
| Total partners' capital | 3,319,609 |
| | 3,682,108 |
|
| Total liabilities and partners' capital | $ | 7,263,511 |
| | $ | 7,677,971 |
|
See accompanying notes.
SPIRIT REALTY, L.P.
Consolidated Statements of Operations
(In Thousands, Except Unit and Per Unit Data)
|
| | | | | | | | | | | | |
| | | Years Ended December 31, |
| | | 2017 | | 2016 | | 2015 |
| Revenues: | | | | | | |
| Rentals | | $ | 639,017 |
| | $ | 648,363 |
| | $ | 634,151 |
|
| Interest income on loans receivable | | 3,791 |
| | 5,253 |
| | 6,948 |
|
| Earned income from direct financing leases | | 2,078 |
| | 2,742 |
| | 3,024 |
|
| Tenant reimbursement income | | 16,747 |
| | 14,125 |
| | 15,952 |
|
| Other income | | 7,322 |
| | 15,491 |
| | 7,260 |
|
| Total revenues | | 668,955 |
| | 685,974 |
| | 667,335 |
|
| Expenses: | | | | | | |
| General and administrative | | 62,064 |
| | 52,615 |
| | 47,730 |
|
| Restructuring charges | | — |
| | 6,341 |
| | 7,056 |
|
| Transaction costs | | 6,361 |
| | — |
| | — |
|
| Property costs (including reimbursable) | | 36,617 |
| | 30,839 |
| | 27,715 |
|
| Real estate acquisition costs | | 1,356 |
| | 3,229 |
| | 2,739 |
|
| Interest | | 190,127 |
| | 196,586 |
| | 222,901 |
|
| Depreciation and amortization | | 256,019 |
| | 262,276 |
| | 260,633 |
|
| Impairments | | 102,330 |
| | 88,275 |
| | 70,695 |
|
| Total expenses | | 654,874 |
| | 640,161 |
| | 639,469 |
|
| Income from continuing operations before other (expense) income and income tax expense | | 14,081 |
| | 45,813 |
| | 27,866 |
|
| Other (expense) income: | | | | | | |
| (Loss) gain on debt extinguishment | | (1,645 | ) | | 233 |
| | (3,162 | ) |
| Total other (expense) income | | (1,645 | ) | | 233 |
| | (3,162 | ) |
| Income from continuing operations before income tax expense | | 12,436 |
| | 46,046 |
| | 24,704 |
|
| Income tax expense | | (394 | ) | | (965 | ) | | (601 | ) |
| Income from continuing operations | | 12,042 |
| | 45,081 |
| | 24,103 |
|
| Discontinued operations: | | | | | | |
| Income from discontinued operations | | — |
| | — |
| | 98 |
|
| Gain on disposition of assets | | — |
| | — |
| | 590 |
|
| Income from discontinued operations | | — |
| | — |
| | 688 |
|
| Income before gain on disposition of assets | | 12,042 |
| | 45,081 |
| | 24,791 |
|
| Gain on disposition of assets | | 65,106 |
| | 52,365 |
| | 68,421 |
|
| Net income | | $ | 77,148 |
| | $ | 97,446 |
| | $ | 93,212 |
|
| Preferred distributions | | (2,530 | ) | | — |
| | — |
|
| Net income after preferred distributions | | 74,618 |
| | 97,446 |
| | 93,212 |
|
| | | | | | | |
| Net income attributable to general partners | | 657 |
| | 825 |
| | 855 |
|
| Net income attributable to limited partners | | 76,491 |
| | 96,621 |
| | 92,357 |
|
| | | | | | | |
| Net income per common partnership unit - basic | | $ | 0.16 |
| | $ | 0.21 |
| | $ | 0.21 |
|
| | | | | | | |
| Net income per common partnership unit —diluted | | $ | 0.16 |
| | $ | 0.21 |
| | $ | 0.21 |
|
| Weighted average common partnership units outstanding: | | | | | | |
| Basic | | 467,934,945 |
| | 469,217,776 |
| | 432,222,953 |
|
| Diluted | | 467,942,788 |
| | 469,246,265 |
| | 432,545,625 |
|
See accompanying notes.
SPIRIT REALTY, L.P.
Consolidated Statements of Comprehensive Income
(In Thousands)
|
| | | | | | | | | | | |
| | Years Ended December 31, |
| | 2017 | | 2016 | | 2015 |
| Net income | $ | 77,148 |
| | $ | 97,446 |
| | $ | 93,212 |
|
| Other comprehensive income: | | | | | |
| Change in net unrealized losses on cash flow hedges | — |
| | (1,137 | ) | | (1,190 | ) |
| Net cash flow hedge losses reclassified to operations | — |
| | 2,165 |
| | 1,245 |
|
| Total comprehensive income | $ | 77,148 |
| | $ | 98,474 |
| | $ | 93,267 |
|
See accompanying notes.
SPIRIT REALTY, L.P.
Consolidated Statements of Partners' Capital
(In Thousands, Except Unit Data)
|
| | | | | | | | | | | | | | | | | | | | | | | | | |
| | Preferred Units | | Common Units | | Total Partnership Capital |
| | | Limited Partners' Capital (2) | | General Partner's Capital (1) | | Limited Partners' Capital (2) | |
| | | Units | | Amount | | Units | | Amount | | Units | | Amount | |
| Balances, December 31, 2014 | | — |
| | $ | — |
| | 3,988,218 |
| | $ | 30,456 |
| | 407,362,222 |
| | $ | 3,281,206 |
| | $ | 3,311,662 |
|
| Net income | | — |
| | — |
| | — |
| | 855 |
| | — |
| | 92,357 |
| | 93,212 |
|
| Other comprehensive income | | — |
| | — |
| | — |
| | 1 |
| | — |
| | 54 |
| | 55 |
|
| Partnership distributions declared | | — |
| | — |
| | — |
| | (2,738 | ) | | — |
| | (295,793 | ) | | (298,531 | ) |
| Tax withholdings related to net settlement of partnership units | | — |
| | — |
| | — |
| | — |
| | (426,158 | ) | | (4,272 | ) | | (4,272 | ) |
| Issuance of partnership units, net | | — |
| | — |
| | — |
| | — |
| | 29,610,100 |
| | 347,211 |
| | 347,211 |
|
| Exercise of partnership units | | — |
| | — |
| | — |
| | — |
| | 5,000 |
| | 46 |
| | 46 |
|
| Stock-based compensation, net | | — |
| | — |
| | — |
| | — |
| | 1,280,582 |
| | 12,491 |
| | 12,491 |
|
| Balances, December 31, 2015 | | — |
| | $ | — |
| | 3,988,218 |
| | $ | 28,574 |
| | 437,831,746 |
| | $ | 3,433,300 |
| | $ | 3,461,874 |
|
| Net income | | — |
| | — |
| | — |
| | 825 |
| | — |
| | 96,621 |
| | 97,446 |
|
| Other comprehensive income | | — |
| | — |
| | — |
| | 9 |
| | — |
| | 1,019 |
| | 1,028 |
|
| Partnership distributions declared | | — |
| | — |
| | — |
| | (2,822 | ) | | — |
| | (330,358 | ) | | (333,180 | ) |
| Tax withholdings related to net settlement of partnership units | | — |
| | — |
| | — |
| | — |
| | (72,835 | ) | | (753 | ) | | (753 | ) |
| Issuance of partnership units, net | | — |
| | — |
| | — |
| | — |
| | 40,835,360 |
| | 446,613 |
| | 446,613 |
|
| Stock-based compensation, net | | — |
| | — |
| | — |
| | — |
| | 1,041,631 |
| | 9,080 |
| | 9,080 |
|
| Balances, December 31, 2016 | | — |
| | $ | — |
| | 3,988,218 |
| | $ | 26,586 |
| | 479,635,902 |
| | $ | 3,655,522 |
| | $ | 3,682,108 |
|
| Net income | | — |
| | — |
| | — |
| | $ | 657 |
| | — |
| | $ | 76,491 |
| | $ | 77,148 |
|
| Partnership distributions declared on preferred units | | — |
| | — |
| | — |
| | — |
| | — |
| | (2,530 | ) | | (2,530 | ) |
| Net income after preferred distributions | | | | — |
| | | | 657 |
| | — |
| | 73,961 |
| | 74,618 |
|
| Issuance of preferred partnership units | | 6,900,000 |
| | 166,193 |
| | — |
| | — |
| | — |
| | — |
| | 166,193 |
|
| Partnership distributions declared on common units | | — |
| | — |
| | — |
| | (2,817 | ) | | — |
| | (329,585 | ) | | (332,402 | ) |
| Tax withholdings related to net partnership unit settlements | | — |
| | — |
| | — |
| | — |
| | (440,312 | ) | | (3,542 | ) | | (3,542 | ) |
| Repurchase of partnership units | | — |
| | — |
| | — |
| | — |
| | (35,839,965 | ) | | (283,089 | ) | | (283,089 | ) |
| Stock-based compensation | | — |
| | — |
| | — |
| | — |
| | 1,524,426 |
| | 15,723 |
| | 15,723 |
|
| Balances, December 31, 2017 | | 6,900,000 |
| | $ | 166,193 |
| | 3,988,218 |
| | $ | 24,426 |
| | 444,880,051 |
| | $ | 3,128,990 |
| | $ | 3,319,609 |
|
(1) Consists of general partnership interests held by Spirit General OP Holdings, LLC.
(2) Consists of limited partnership interests held by Spirit Realty Capital, Inc. and Spirit Notes Partner, LLC.
See accompanying notes.
SPIRIT REALTY, L.P.
Consolidated Statements of Cash Flows
(In Thousands)
|
| | | | | | | | | | | |
| | Years Ended December 31, |
| | 2017 | | 2016 | | 2015 |
| Operating activities | | | | | |
| Net Income | $ | 77,148 |
| | $ | 97,446 |
| | $ | 93,212 |
|
| Adjustments to reconcile net income to net cash provided by operating activities: | | | | | |
| Depreciation and amortization | 256,019 |
| | 262,276 |
| | 260,633 |
|
| Impairments | 102,330 |
| | 88,275 |
| | 70,729 |
|
| Amortization of deferred financing costs | 9,896 |
| | 9,070 |
| | 7,937 |
|
| Payments to terminate interest rate swap | — |
| | (1,724 | ) | | — |
|
| Derivative net settlements, amortization and terminations | — |
| | 1,811 |
| | (132 | ) |
| Amortization of debt discounts | 13,572 |
| | 6,217 |
| | 2,322 |
|
| Stock-based compensation expense | 16,560 |
| | 9,570 |
| | 13,321 |
|
| Loss (gain) on debt extinguishment | 1,645 |
| | (233 | ) | | 3,162 |
|
| Debt extinguishment costs | (3,305 | ) | | (26,219 | ) | | (8,112 | ) |
| Gains on dispositions of real estate and other assets | (65,106 | ) | | (52,365 | ) | | (69,011 | ) |
| Non-cash revenue | (28,439 | ) | | (26,333 | ) | | (20,930 | ) |
| Bad debt expense and other | 5,913 |
| | (594 | ) | | 151 |
|
| Changes in operating assets and liabilities: | | | | | |
| Deferred costs and other assets, net | (1,418 | ) | | (6,561 | ) | | (604 | ) |
| Accounts payable, accrued expenses and other liabilities | 1,578 |
| | 6,308 |
| | 13,382 |
|
| Accrued restructuring charges | — |
| | (5,535 | ) | | 5,926 |
|
| Net cash provided by operating activities | 386,393 |
| | 361,409 |
| | 371,986 |
|
| Investing activities | | | | | |
| Acquisitions of real estate | (279,934 | ) | | (655,835 | ) | | (875,983 | ) |
| Capitalized real estate expenditures | (46,100 | ) | | (27,078 | ) | | (10,269 | ) |
| Investments in loans receivable | (4,995 | ) | | (5,073 | ) | | (4,020 | ) |
| Collections of principal on loans receivable and real estate assets under direct financing leases | 12,769 |
| | 8,410 |
| | 6,822 |
|
| Proceeds from dispositions of real estate and other assets | 472,496 |
| | 524,776 |
| | 496,646 |
|
| Transfers of net sales proceeds from (to) restricted accounts pursuant to 1031 Exchanges | — |
| | 39,869 |
| | (39,869 | ) |
| Transfers of net sales proceeds (to) from Master Trust Release | (71,294 | ) | | (2,320 | ) | | 40,977 |
|
| Net cash provided by (used in) investing activities | 82,942 |
| | (117,251 | ) | | (385,696 | ) |
|
| | | | | | | | | | | |
| | Years Ended December 31, |
| | 2017 | | 2016 | | 2015 |
| Financing activities |
|
| |
|
| |
|
|
| Borrowings under Revolving Credit Facilities | 940,200 |
| | 1,080,000 |
| | 798,000 |
|
| Repayments under Revolving Credit Facilities | (914,200 | ) | | (994,000 | ) | | (813,181 | ) |
| Borrowings under mortgages and notes payable | 618,603 |
| | — |
| | — |
|
| Repayments under mortgages and notes payable | (221,310 | ) | | (863,836 | ) | | (512,486 | ) |
| Borrowings under Term Loan | — |
| | 796,000 |
| | 325,000 |
|
| Repayments under Term Loan | (420,000 | ) | | (701,000 | ) | | — |
|
| Borrowings under Senior Unsecured Notes | — |
| | 298,134 |
| | — |
|
| Deferred financing costs | (8,255 | ) | | (4,352 | ) | | (6,150 | ) |
| Proceeds from issuance of common stock, net of offering costs | — |
| | 446,613 |
| | 347,211 |
|
| Proceeds from issuance of preferred stock, net of offering costs | 166,193 |
| | — |
| | — |
|
| Repurchase of partnership units | (286,631 | ) | | (753 | ) | | (4,272 | ) |
| Proceeds from exercise of partnership units | — |
| | — |
| | 46 |
|
| Preferred distributions paid | (2,530 | ) | | — |
| | — |
|
| Common distributions paid | (339,174 | ) | | (323,640 | ) | | (292,262 | ) |
| Transfers (from) to reserve/escrow deposits with lenders, net | (3,492 | ) | | 10,945 |
| | 17,413 |
|
| Net cash used in financing activities | (470,596 | ) | | (255,889 | ) | | (140,681 | ) |
| Net decrease in cash and cash equivalents | (1,261 | ) | | (11,731 | ) | | (154,391 | ) |
| Cash and cash equivalents, beginning of year | 10,059 |
| | 21,790 |
| | 176,181 |
|
| Cash and cash equivalents, end of year | $ | 8,798 |
| | $ | 10,059 |
| | $ | 21,790 |
|
SPIRIT REALTY CAPITAL, INC. and SPIRIT REALTY, L.P.
Notes to Consolidated Financial Statements
December 31, 2017
Note 1. Organization
Organization and Operations
Spirit Realty Capital, Inc. (the "Corporation" or, with its consolidated subsidiaries, the "Company") operates as a self-administered and self-managed REIT that seeks to generate and deliver sustainable and attractive returns for stockholders by investing primarily in and managing a portfolio of single-tenant, operationally essential real estate throughout the U.S. that is generally leased on a long-term, triple-net basis to tenants operating within predominantly retail, but also office and industrial property types. Single tenant, operationally essential real estate generally refers to free-standing, commercial real estate facilities where tenants conduct activities that are essential to the generation of their sales and profits.The Company began operations through a predecessor legal entity in 2003.
The Company’s operations are generally carried out through Spirit Realty, L.P. (the "Operating Partnership") and its subsidiaries. Spirit General OP Holdings, LLC ("OP Holdings"), one of the Corporation's wholly-owned subsidiaries, is the sole general partner and owns approximately 1% of the Operating Partnership. The Corporation and a wholly-owned subsidiary ("Spirit Notes Partner, LLC") are the only limited partners and together own the remaining 99% of the Operating Partnership.
On August 3, 2017, the Company announced a proposed Spin-Off of almost all of its interests in properties leased to Shopko, assets that collateralize Master Trust 2014 and other additional assets into an independent, publicly traded REIT, Spirit MTA REIT, or SMTA. Transaction costs associated with the spin off for the year ended December 31, 2017 totaled $6.4 million, and are included within transaction costs on the accompanying consolidated statements of operations.
Note 2. Summary of Significant Accounting Policies
Basis of Accounting and Principles of Consolidation
The accompanying consolidated financial statements of the Company and the Operating Partnership have been prepared on the accrual basis of accounting, in accordance with GAAP. The consolidated financial statements of the Company include the accounts of the Corporation and its wholly-owned subsidiaries. The consolidated financial statements of the Operating Partnership include the accounts of the Operating Partnership and its wholly-owned subsidiaries. All significant intercompany balances and transactions have been eliminated in consolidation.
All expenses incurred by the Company have been allocated to the Operating Partnership in accordance with the Operating Partnership's first amended and restated agreement of limited partnership, which management determined to be a reasonable method of allocation. Therefore, expenses incurred would not be materially different if the Operating Partnership had operated as an unaffiliated entity.
The Company has formed numerous special purpose entities to acquire and hold real estate encumbered by indebtedness (see Note 4). Each special purpose entity indirectly ownedis a separate legal entity and is the sole owner of its assets and responsible for its liabilities. The assets of these special purpose entities are not available to pay, or otherwise satisfy obligations to, the creditors of any affiliate or owner of another entity unless the special purpose entities have expressly agreed and are permitted under their governing documents. As of December 31, 2017 and 2016, net assets totaling $2.78 billion and $2.95 billion, respectively, were held, and net liabilities totaling $2.63 billion and $2.26 billion, respectively, were owed by these encumbered special purpose entities and are included in the accompanying consolidated balance sheets.
Use of Estimates
The preparation of financial statements in conformity with GAAP requires management to make estimates and assumptions that affect the reported amounts of assets and liabilities at the date of the financial statements and the reported amounts of revenues and expenses during the reporting period. Although management believes its estimates are reasonable, actual results could differ from those estimates.
SPIRIT REALTY CAPITAL, INC. and SPIRIT REALTY, L.P.
Notes to Consolidated Financial Statements - (continued)
December 31, 2017
Segment Reporting
The Company views its operations as one segment, which consists of net leasing operations. The Company has no other reportable segments.
Real Estate Investments
Carrying Value of Real Estate Investments
The Company’s real estate properties are recorded at cost and depreciated using the straight-line method over the estimated remaining useful lives of the properties, which generally range from 20 to 50 years for buildings and improvements and from 5 to 20 years for land improvements. Portfolio assets classified as “held for sale” are not depreciated. Properties classified as “held for sale” are recorded at the lower of their carrying value or their fair value, less anticipated selling costs.
Purchase Accounting and Acquisition of Real Estate
When acquiring a property, the purchase price (including acquisition and closing costs) is allocated to land, building, improvements and equipment based on their relative fair values. For properties acquired with in-place leases, the purchase price of real estate is allocated to the tangible and intangible assets and liabilities acquired based on their estimated fair values. In making estimates of fair values for this purpose, a number of sources are used, including independent appraisals and information obtained about each property as a result of pre-acquisition due diligence and marketing and leasing activities.
Lease Intangibles
Lease intangibles, if any, acquired in conjunction with the purchase of real estate represent the value of in-place leases and above or below-market leases. For real estate acquired subject to existing lease agreements, in-place lease intangibles are valued based on the Company’s estimate of costs related to acquiring a tenant and the carrying costs that would be incurred during the time it would take to locate a tenant if the property were vacant, considering current market conditions and costs to execute similar leases at the time of the acquisition. Above and below-market lease intangibles are recorded based on the present value of the difference between the contractual amounts to be paid pursuant to the leases at the time of acquisition of the real estate and the Company’s estimate of current market lease rates for the property, measured over a period equal to the remaining initial term of the lease.
In-place lease intangibles are amortized on a straight-line basis over the remaining initial term of the related lease and included in depreciation and amortization expense. Above-market lease intangibles are amortized over the remaining initial terms of the respective leases as a decrease in rental revenue. Below market lease intangibles are amortized as an increase to rental revenue over the remaining initial term of the respective leases, but may be amortized over the renewal periods if the Company believes it is likely the tenant will exercise the renewal option. If the Company believes it is likely a lease will terminate early, the unamortized portion of any related lease intangible is immediately recognized in impairment loss in the Company’s consolidated statements of operations.
Investment in Direct Financing Leases
For real estate property leases classified as direct financing leases, the building portion of the lease is accounted for as a direct financing lease, while the land portion is accounted for as operating leases when certain criteria are met. For direct financing leases, the Company records an asset which represents the net investment that is determined by using the aggregate of the total amount of future minimum lease payments, the estimated residual value of the leased property and deferred incremental direct costs less unearned income. Income is recognized over the life of the lease to approximate a level rate of return on the net investment. Residual values, which are reviewed annually, represent the estimated amount the Company expects to receive at lease termination from the disposition of the leased property. Actual residual values realized could differ from these estimates. The Company evaluates the collectability of future minimum lease payments on each direct financing lease primarily through the evaluation of payment history and the underlying creditworthiness of the tenant. There were no amounts past due as of December 31, 2017 and 2016. The Company’s direct financing leases are evaluated individually for the purpose of determining if an allowance is needed. Any write-down of an estimated residual value is recognized as an impairment loss in the current period and earned
SPIRIT REALTY CAPITAL, INC. and SPIRIT REALTY, L.P.
Notes to Consolidated Financial Statements - (continued)
December 31, 2017
income adjusted prospectively. The Company's direct financing leases were acquired in connection with the Merger. There were no impairment losses on direct financing leases during the years ended December 31, 2017 and 2016. There were $4.8 million in impairment losses related to two direct financing leases during the year ended December 31, 2015.
Impairment
The Company reviews its real estate investments and related lease intangibles periodically for impairment whenever events or changes in circumstances indicate that the carrying amount may not be recoverable. The Company considers factors such as expected future undiscounted cash flows, estimated residual value, market trends (such as the effects of leasing demand and competition) and other factors in making this assessment. An asset is considered impaired if its carrying value exceeds its estimated undiscounted cash flows and the impairment is calculated as the amount by which the carrying value of the asset exceeds its estimated fair value. Estimating future cash flows and fair values are highly subjective and such estimates could differ materially from actual results. Key assumptions used in estimating future cash flows and fair values include, but are not limited to, revenue growth rates, interest rates, discount rates, capitalization rates, lease renewal probabilities, tenant vacancy rates and other factors.
Revenue Recognition
The Company primarily leases real estate to its tenants under long-term, triple-net leases that are classified as operating leases. Lease origination fees are deferred and amortized over the related lease term as an adjustment to rental revenue. Under a triple-net lease, the tenant is typically responsible for all improvements and is contractually obligated to pay all property operating expenses, such as real estate taxes, insurance premiums and repair and maintenance costs. Under certain leases, tenant reimbursement revenue, which is comprised of additional amounts recoverable from tenants for common area maintenance expenses and certain other recoverable expenses, is recognized as revenue in the period in which the related expenses are incurred. Tenant reimbursements are recorded on a gross basis in instances when our tenants reimburse us for property costs which we incur.Tenant receivables are carried net of the allowances for uncollectible amounts.
The Company’s leases generally provide for rent escalations throughout the lease terms. For leases that provide for specific contractual escalations, rental revenue is recognized on a straight-line basis so as to produce a constant periodic rent over the term of the lease. Accordingly, accrued rental revenue, calculated as the aggregate difference between the rental revenue recognized on a straight-line basis and scheduled rents, represents unbilled rent receivables that the Company will receive only if the tenants make all rent payments required through the expiration of the initial term of the leases. The accrued rental revenue representing this straight-line adjustment is subject to an evaluation for collectability, and the Company records a provision for losses against rental revenues if collectability of these future rents is not reasonably assured. Leases that have contingent rent escalators indexed to future increases in the CPI may adjust over a one-year period or over multiple-year periods. Generally, these escalators increase rent at the lesser of (a) 1 to 2 times CPI over a specified period, (b) a fixed percentage, or (c) a fixed schedule. Because of the volatility and uncertainty with respect to future changes in the CPI, the Company’s inability to determine the extent to which any specific future change in the CPI is probable at each rent adjustment date during the entire term of these leases and the Company’s view that the multiplier does not represent a significant leverage factor, rental revenue from leases with this type of escalator are recognized only after the changes in the rental rates have occurred.
Some of the Company’s leases also provide for contingent rent based on a percentage of the tenant’s gross sales. For contingent rentals that are based on a percentage of the tenant’s gross sales, the Company recognizes contingent rental revenue when the change in the factor on which the contingent lease payment is based actually occurs.
The Company suspends revenue recognition if the collectability of amounts due pursuant to a lease is not reasonably assured or if the tenant’s monthly lease payments become more than 60 days past due, whichever is earlier.
Lease termination fees are included in other income on the Company’s consolidated statements of operations and are recognized when there is a signed termination agreement and all of the conditions of the agreement have been met. The Company recorded lease termination fees of $5.0 million, $7.3 million and $5.8 million during the years ended December 31, 2017, 2016 and 2015, respectively.
SPIRIT REALTY CAPITAL, INC. and SPIRIT REALTY, L.P.
Notes to Consolidated Financial Statements - (continued)
December 31, 2017
Goodwill
Goodwill arises from business combinations and represents the excess of the cost of an acquired entity over the net fair value amounts that were assigned to the identifiable assets acquired and the liabilities assumed. Goodwill is tested for impairment at the reporting unit level on an annual basis and between annual tests if an event occurs or circumstances change that would more likely than not reduce the fair value of the reporting unit below its carrying value. The Company did not record any impairment on its existing goodwill for the years ended December 31, 2017, 2016 and 2015.
Prior to the Company's adoption of ASU 2017-01, Business Combinations (Topic 805): Clarifying the Definition of a Business, on January 1, 2017 on a prospective basis, when the Company disposed of a real estate asset that constituted a business under GAAP, a portion of goodwill was allocated to the carrying value of the real estate asset considered to be a business to determine the gain or loss on the disposal. The portion of goodwill allocated was derived from the proportionate fair value of the business to the fair value of the Company’s reporting unit. Goodwill related to real estate assets not previously classified as held for sale of $6.3 million and $12.7 million was written off during the years ended December 31, 2016 and 2015, respectively. Under the new guidance, the dispositions of properties generally no longer qualify as a disposition of a business and therefore no allocation of goodwill occurs when determining gain or loss on sale.
The following table presents a reconciliation of the Company’s goodwill from January 1, 2015 to December 31, 2017 (in thousands):
|
| | | |
| | Consolidated |
| Balance as of December 31, 2014 | $ | 285,848 |
|
| Goodwill allocated to dispositions of a business | (21,498 | ) |
| Balance as of December 31, 2015 | 264,350 |
|
| Goodwill allocated to dispositions of a business | (10,010 | ) |
| Balance as of December 31, 2016 | 254,340 |
|
| Goodwill allocated to dispositions of a business | — |
|
| Balance as of December 31, 2017 | $ | 254,340 |
|
Allowance for Doubtful Accounts
The Company reviews its rent and other tenant receivables for collectability on a regular basis, taking into consideration changes in factors such as the tenant’s payment history, the financial condition of the tenant, business conditions in the industry in which the tenant operates, and economic conditions in the area in which the tenant operates. In the event that the collectability of a receivable with respect to any tenant is in doubt, a provision for uncollectible amounts will be established or a direct write-off of the specific receivable will be made. The Company provided for reserves for uncollectible amounts totaling $12.4 million and $6.4 million at December 31, 2017 and 2016, respectively, against accounts receivable balances of $27.2 million and $25.3 million, respectively. Receivables are recorded within deferred cost and other assets, net in the accompanying consolidated balance sheets. Receivables are written off against the reserves for uncollectible amounts when all possible means of collection have been exhausted.
For deferred rental revenues related to the straight-line method of reporting rental revenue, the collectability review includes management’s estimates of amounts that will not be realized and an assessment of the risks inherent in the portfolio, giving consideration to historical experience. The Company established a reserve for losses of $1.8 million and $7.7 million at December 31, 2017 and 2016, respectively, against deferred rental revenue receivables of $81.6 million and $71.1 million, respectively. Deferred rental revenue receivables are recorded within deferred costs and other assets, net in the accompanying consolidated balance sheets.
Loans Receivable
Loans receivable consists of mortgage loans, net of premium, and notes receivables. Interest on loans receivable is recognized using the effective interest rate method.
SPIRIT REALTY CAPITAL, INC. and SPIRIT REALTY, L.P.
Notes to Consolidated Financial Statements - (continued)
December 31, 2017
Impairment and Allowance for Loan Losses
The Company periodically evaluates the collectability of its loans receivable, including accrued interest, by analyzing the underlying property-level economics and trends, collateral value and quality, and other relevant factors in determining the adequacy of its allowance for loan losses. A loan is determined to be impaired when, in management’s judgment based on current information and events, it is probable that the Company will be unable to collect all amounts due according to the contractual terms of the loan agreement. Specific allowances for loan losses are provided for impaired loans on an individual loan basis in the amount by which the carrying value exceeds the estimated fair value of the underlying collateral less disposition costs. Delinquent loans receivable are written off against the allowance when all possible means of collection have been exhausted. As of December 31, 2017, there was an allowance for loan losses on loans receivable of $0.4 million and a $0.5 million allowance for loan losses as of December 31, 2016.
A loan is placed on non-accrual status when the loan has become 60 days past due, or earlier if management determines that full recovery of the contractually specified payments of principal and interest is doubtful. While on non-accrual status, interest income is recognized only when received. Five mortgage loans were on non-accrual status with a balance of $1.5 million as of December 31, 2017, compared to none as of December 31, 2016. No notes receivable were on non-accrual status as of December 31, 2017, compared to one note receivable on non-accrual status with a balance of $0.5 million as of December 31, 2016.
Cash and Cash Equivalents
Cash and cash equivalents include cash and highly liquid investment securities with maturities at acquisition of three months or less. The Company invests cash primarily in money market funds of major financial institutions with fund investments consisting of highly-rated money market instruments and other short-term instruments.
Restricted Cash and Escrow Deposits
Restricted cash and deposits in escrow, classified within deferred costs and other assets, net in the accompanying consolidated balance sheets consisted of the following (in thousands): |
| | | | | | | |
| | December 31, 2017 | | December 31, 2016 |
Collateral deposits (1) | $ | 1,751 |
| | $ | 2,044 |
|
Tenant improvements, repairs, and leasing commissions (2) | 8,257 |
| | 9,739 |
|
Master Trust Release (3) | 85,703 |
| | 14,412 |
|
Liquidity reserve (4) | 5,503 |
| | — |
|
Other (5) | 4,695 |
| | 644 |
|
| | $ | 105,909 |
| | $ | 26,839 |
|
(1) Funds held in lender controlled accounts generally used to meet future debt service or certain property operating expenses. Balance changes are reflected in financing activities within the consolidated statements of cash flows.
(2) Deposits held as additional collateral support by lenders to fund improvements, repairs and leasing commissions incurred to secure a new tenant. Balance changes are reflected in financing activities within the consolidated statements of cash flows.
(3) Proceeds from the sale of assets pledged as collateral under the Spirit Master Funding Program, which are held on deposit until a qualifying substitution is made or the funds are applied as prepayment of principal. Balance changes are reflected in investing activities within the consolidated statements of cash flows.
(4) Liquidity reserve cash was placed on deposit in conjunction with issuance of additional series of notes under Master Trust 2014 in December 2017 and is held until there is a cashflow shortfall as defined in the Master Trust 2014 agreements or a liquidation of Master Trust 2014 occurs. Additionally, the liquidity reserve can be released upon achieving certain performance criteria. Balance changes are reflected in financing activities within the consolidated statements of cash flows.
(5) Funds held in lender controlled accounts released after scheduled debt service requirements are met. Balance changes are reflected in operating activities within the consolidated statements of cash flows.
SPIRIT REALTY CAPITAL, INC. and SPIRIT REALTY, L.P.
Notes to Consolidated Financial Statements - (continued)
December 31, 2017
Accounting for Derivative Financial Instruments and Hedging Activities
The Company utilizes derivative instruments such as interest rate swaps and caps for purposes of hedging exposures to fluctuations in interest rates associated with certain of its financing transactions. At the inception of a hedge transaction, the Company enters into a contractual arrangement with the hedge counterparty and formally documents the relationship between the derivative instrument and the financing transaction being hedged, as well as its risk management objective and strategy for undertaking the hedge transaction. At inception and at least quarterly thereafter, a formal assessment is performed to determine whether the derivative instrument has been highly effective in offsetting changes in cash flows of the related financing transaction and whether it is expected to be highly effective in the future.
The fair value of the derivative instrument is recorded on the balance sheet as either an asset or liability. For derivatives designated as cash flow hedges, the effective portions of the corresponding change in fair value of the derivatives are recorded in AOCL within stockholders’ equity and partners' capital. Changes in fair value reported in other comprehensive income (loss) are reclassified to operations in the period in which operations are affected by the Corporation had accessunderlying hedged transaction. Any ineffective portions of the change in fair value are recognized immediately in general and administrative expense. The amounts paid or received on the hedge are recognized as adjustments to interest expense (see Note 5).
Income Taxes
The Company has elected to be taxed as a $40.0 million secured revolving lineREIT under the Code. As a REIT, the Company generally will not be subject to federal income tax provided it continues to satisfy certain tests concerning the Company’s sources of creditincome, the nature of its assets, the amounts distributed to its stockholders, and the ownership of Company stock. Management believes the Company has qualified and will continue to qualify as a REIT and therefore, no provision has been made for federal income taxes in the accompanying consolidated financial statements. Even if the Company qualifies for taxation as a REIT, it may be subject to state and local income and franchise taxes, and to federal income tax and excise tax on its undistributed income. Taxable income from non-REIT activities managed through any of the Company’s taxable REIT subsidiaries is subject to federal, state, and local taxes, which expiredare not material.
The Operating Partnership is a partnership for federal income tax purposes. Partnerships are pass-through entities and are not subject to U.S. federal income taxes, therefore no provision has been made for federal income taxes in the accompanying financial statements. Although most states and cities where the Operating Partnership operates follow the U.S. federal income tax treatment, there are certain jurisdictions such as Texas, Tennessee and Ohio that impose income or franchise taxes on March 27, 2016.a partnership.
Franchise taxes are included in general and administrative expenses on the accompanying consolidated statements of operations.
Term LoanConvertible Notes
The Convertible Notes are comprised of two series of notes with an aggregate principal amount of $747.5 million at both December 31, 2017 and December 31, 2016. Interest on the Convertible Notes is payable semiannually in arrears on May 15 and November 15 of each year. The 2019 Notes, aggregate principal amount $402.5 million, accrue interest at 2.875% and are scheduled to mature on May 15, 2019. The 2021 Notes, aggregate principal amount $345.0 million, accrue interest at 3.75% and are scheduled to mature on May 15, 2021. As of December 31, 2017, the carrying amount of the Convertible Notes was $715.9 million, which is net of discounts (for the value of the embedded conversion feature) and unamortized deferred financing costs.
Holders may convert notes of either series prior to November 15, 2018, in the case of the 2019 Notes, or November 15, 2020, in the case of the 2021 Notes, only under the following circumstances: (1) if the closing price of our common stock for each of at least 20 trading days (whether or not consecutive) during the last 30 consecutive trading days in the quarter is greater than or equal to 130% of the conversion price for the Convertible Notes; (2) during the five business day period after any 10 consecutive trading day period in which the trading price per $1,000 principal amount of the Convertible Notes for each trading day of the measurement period was less than 98% of the product of the last closing price of our common stock and the conversion rate for the Convertible Notes; (3) if we call any or all of the Convertible Notes for redemption prior to the redemption date; or (4) upon the occurrence of specified corporate events as described in the Convertible Notes prospectus supplement. On or after November 15, 2018, in the case of the 2019 Notes, or November 15, 2020, in the case of the 2021 Notes, until the close of business on the second scheduled trading day immediately preceding the maturity date of the Convertible Notes, holders may convert the Convertible Notes of the applicable series at any time, regardless of the foregoing circumstances. Upon conversion, we will pay or deliver cash, shares of common stock or a combination of cash and shares of common stock, at our election.
The initial conversion rate for the Convertible Notes is 76.3636 shares of common stock per $1,000 principal amount of notes (equivalent to an initial conversion price of approximately $13.10 per share of common stock). The conversion rate for each series of the Convertible Notes is subject to adjustment for some events, including dividends paid in excess of threshold amounts stipulated in the agreement, but will not be adjusted for any accrued and unpaid interest. As of December 31, 2017, the conversion rate was 77.3144 per $1,000 principal note. If we undergo a fundamental change (as defined in the Convertible Notes supplemental indentures), holders may require us to repurchase all or any portion of their notes at a repurchase price equal to 100% of the principal amount of the notes to be repurchased, plusaccrued and unpaid interest.
Revolving Credit Facility
On March 31, 2015, the Company entered into the Credit Agreement, among the Operating Partnership as borrower and the Company as guarantor, that established a new $600.0 million unsecured credit facility and terminated its secured $400.0 million 2013 Credit Facility. The Revolving Credit Facility matures on March 31, 2019 (extendible at the Operating Partnership's option to March 31, 2020, subject to satisfaction of certain requirements) and includes an accordion feature to increase the committed facility size up to $1.0 billion, subject to satisfying certain requirements and obtaining additional lender commitments. On April 27, 2016, the Company expanded the borrowing capacity under the Revolving Credit Facility from $600.0 million to $800.0 million by partially exercising the accordion feature under the terms of the Credit Agreement. The Revolving Credit Facility also includes a 50.0 million sub-limit for swing-line loans and up to $60.0 million available for issuance of letters of credit. Swing-line loans and letters of credit reduce availability under the Revolving Credit Facility on a dollar-for-dollar basis. On November 3, 2015, the Company entered into a first amendment to the Credit Agreement. The amendment conforms certain of the terms and covenants to those in the Term Loan Agreement, amongincluding limiting the Operating Partnership, as borrower, the Company as guarantor and the lenders that are parties thereto. The Term Loan Agreement provides for a $325.0 million senior unsecured term facility that has an initial maturity daterequirement of November 2, 2018, which may be extended at the Company's option pursuantsubsidiary guaranties to two one-year extension options, subject to the satisfaction of certain conditions and payment of an extension fee. In addition, an accordion feature allows the facility to be increased to up to $600.0 million, subject to obtaining additional lender commitments. During the fourth quarter of 2015 and 2016, the Company exercised the accordion feature permaterial subsidiaries (as defined in the Credit Agreement and increased the term facility borrowing capacity from $325.0 million to $370.0 million and $420.0 million, respectively.Agreement) meeting certain conditions. At December 31, 2017, there were no subsidiaries meeting this requirement.
The Term Loan Agreement provides that borrowings bearRevolving Credit Facility bears interest at eithera rate equal to LIBOR plus 1.35%0.875% to 1.80% per annum or a specified base rate plus 0.35% to 0.80% per annum, at the Operating Partnership's option. In each case, the applicable margin is determined based upon the Corporation's leverage ratio. If the Corporation obtains at least two credit ratings on its senior unsecured long-term indebtedness of BBB- from S&P or Fitch, Inc. or Baa3 from Moody's, the Operating Partnership may make an irrevocable election to have the margin based upon the Corporation's credit ratings. In April 2016, the Corporation received a first time rating of BBB- from Fitch and was upgraded to a BBB- corporate issuer rating by S&P. As a result, the Operating Partnership elected to change the interest rate grid from leveraged based
SPIRIT REALTY CAPITAL, INC. and SPIRIT REALTY, L.P.
Notes to Consolidated Financial Statements - (continued)
December 31, 2016
pricing to credit rating based pricing in the second quarter of 2016. Under credit rating based pricing, borrowings bear interest at either LIBOR plus 0.90% to 1.75%1.55% per annum or a specified base rate plus 0.0% to 0.75%0.55% and requires a facility fee in an amount equal to the aggregate revolving credit commitments (whether or not utilized) multiplied by a rate equal to 0.125% to 0.30% per annum, in each case depending
on the Corporation’sCorporation's credit ratings.rating. As of December 31, 2016,2017, the Term LoanRevolving Credit Facility bore interest at LIBOR plus 1.35%1.25% based on the Corporation'sCompany's credit rating.rating and incurred a facility fee of 0.25% per annum.
The Operating Partnership may voluntarily prepay the Term Loan,Revolving Credit Facility, in whole or in part, at any time, without premium or penalty, but subject to applicable LIBOR breakage fees. Borrowings may be repaid without premium or penalty, and may be re-borrowed within 30 days up to the then available loan commitment and subject to occurrence limitations within any twelve-month period.fees, if any. Payment of the Term LoanRevolving Credit Facility is unconditionally guaranteed by the Corporation and undermaterial subsidiaries that meet certain circumstances, by one or more material subsidiariesconditions (as defined in the Term LoanCredit Agreement) of the Corporation. The obligations of the Corporation and any guarantor under the Term Loan are full recourse to the Corporation and each guarantor.
As a result of entering into the Term Loan, the Company incurred origination costs of $2.3 million. These deferred financing costs are being amortized to interest expense over the remaining initial term of the Term Loan.. As of December 31, 2016 and 2015, the unamortized deferred financing costs relating to the Term Loan2017, there were $1.5 million and $2.1 million, respectively, and were recorded net against the principal balance of the Term Loan on the accompanying consolidated balance sheets.no subsidiaries that met this requirement.
As of December 31, 2016, the Term Loan2017, $112.0 million in borrowings were outstanding and $688.0 million of borrowing capacity was fully drawn. The Operating Partnership's ability to borrowavailable under the Term Loan isRevolving Credit Facility. Amounts available for borrowing under the Revolving Credit Facility remain subject to ongoing compliance with a numbercertain customary restrictive covenants including:
Maximum leverage ratio (defined as consolidated total indebtedness plus the Corporation’s pro rata share of customary financialindebtedness of unconsolidated affiliates, net of certain cash and cash equivalents, to total asset value) of 0.60:1.00, which may be increased to 0.65:1.00 for four consecutive quarters after certain material acquisitions;
Minimum fixed charge coverage ratio (defined as EBITDA plus the Corporation’s pro rata share of EBITDA of unconsolidated affiliates, to fixed charges) of 1.50:1.00;
Maximum secured indebtedness leverage ratio (defined as consolidated secured indebtedness plus the Corporation’s pro rata share of secured indebtedness of unconsolidated affiliates, net of certain cash and cash equivalents, to total asset value) of 0.50:1:00;
Minimum unsecured interest coverage ratio (defined as consolidated net operating income from unencumbered properties, to unsecured interest expense) of 1.75:1.00;
Maximum unencumbered leverage ratio (defined as consolidated unsecured indebtedness plus the Corporation’s pro rata share of unsecured indebtedness of unconsolidated affiliates, net of certain cash and cash equivalents, to total unencumbered asset value) of 0.60:1:00, which may be increased to 0.65:1.00 for four consecutive quarters after certain material acquisitions; and
Minimum tangible net worth of at least $3.01 billion plus 75% of the net proceeds of equity issuances by the Corporation or the Operating Partnership after December 31, 2014.
In addition to these covenants, andthe Credit Agreement also includes other customary affirmative and negative covenants. The Corporation has unconditionally guaranteedcovenants, such as (i) limitation on liens and negative pledges; (ii) transactions with affiliates; (iii) limitation on mergers, consolidations and sales of all obligationsor substantially all assets; (iv) maintenance of the Operating Partnership under the Term Loan Agreement. status as a REIT and listing on any national securities exchange; and (v) material modifications to organizational documents.
As of December 31, 2016,2017, the Corporation and the Operating Partnership were in compliance with these financial covenants.
Senior Unsecured Notes
On August 18, 2016, the Operating Partnership completed a private placement of $300.0 million aggregate principal amount of senior notes through a Rule 144A offering with registration rights, which are guaranteed by the Corporation. The Senior Unsecured Notes were issued at 99.378% of their principal amount, resulting in net proceeds of $296.2 million, after deducting transaction fees and expenses. The Senior Unsecured Notes accrue interest at a rate of 4.450% per year, payable on March 15 and September 15 of each year, until the maturity date of September 15, 2026. The Company has agreed to file with the SEC and cause to become effective a registration statement pursuant to which the Company will offer to exchange the Senior Unsecured Notes for substantially similar registered notes.
The Senior Unsecured Notes are redeemable in whole at any time or in part from time to time, at the Operating Partnership’s option, at a redemption price equal to the sum of: an amount equal to 100% of the principal amount of the Senior Unsecured Notes to be redeemed plus accrued and unpaid interest and liquidated damages, if any, up to, but not including, the redemption date; and a make-whole premium calculated in accordance with the indenture. Notwithstanding the foregoing, if any of the Senior Unsecured Notes are redeemed on or after June 15, 2026 (three months prior to the maturity date of the Senior Unsecured Notes), the redemption price will not include a make-whole premium.
In connection with the offering, the Operating Partnership incurred $3.2 million in deferred financing costs. This amount is being amortized to interest expense over the life of the Senior Unsecured Notes. As of December 31, 2016, the unamortized deferred financing costs relating to the Senior Unsecured Notes were $3.1 million and recorded net against the Senior Unsecured Notes principal balance on the accompanying consolidated balance sheets.
In connection with the issuance of the Senior Unsecured Notes, the Corporation and Operating Partnership are subject to ongoing compliance with a number of customary financial covenants and other customary affirmative and negative covenants. As of December 31, 2016, the Corporation and the Operating Partnership were in compliance with these financial covenants.
Master Trust Notes
The Company has access to an asset-backed securitization platform, the Spirit Master Funding Program, to raise capital through the issuance of non-recourse net-lease mortgage notes collateralized by commercial real estate, net-
SPIRIT REALTY CAPITAL, INC. and SPIRIT REALTY, L.P.
Notes to Consolidated Financial Statements - (continued)
December 31, 2016
leases and mortgage loans. The Spirit Master Funding Program consists of two separate securitization trusts, Master Trust 2013 and Master Trust 2014, each of which have one or multiple bankruptcy-remote, special purpose entities as issuers or co-issuers of the notes. Each issuer is an indirect wholly-owned special purpose entity of the Corporation and of the Operating Partnership.
Master Trust 2013
In December 2013, an indirect wholly-owned subsidiary of the Company issued $330.0 million aggregate principal amount of investment grade rated net-lease mortgage notes comprised of $125.0 million of 3.89% interest only notes expected to be repaid in December 2018 and $205.0 million of 5.27% amortizing notes expected to be repaid in December 2023.
Master Trust 2014
In May 2014, the Company completed its offer to exchange the outstanding principal balance of three series of existing net-lease mortgage notes for three series of newly issued 2014 Notes. The terms of the new notes remain generally similar to the old notes including the interest rate and anticipated final repayment dates; however, the new notes generally amortize more slowly than the old notes and have a legal final payment date that is 17 years later than the old notes (although the anticipated repayment date remains the same). The Exchange Offer was accounted for as a debt modification and the related costs of $13.0 million and $0.7 million for the years ended December 31, 2014 and 2013, respectively, are classified as finance restructuring costs in the accompanying consolidated statements of operations.
In November 2014, the existing issuers under Master Trust 2014 and two additional indirect wholly-owned subsidiaries of the Company, collectively as co-issuers, completed the issuance of $510.0 million aggregate principal amount of net-lease mortgage notes comprised of $150.0 million of 3.50% interest only notes expected to be repaid in January 2020 and $360.0 million of 4.63% amortizing notes (interest only through November 2017) expected to be repaid in January 2030.
The Master Trust Notes are summarized below:
|
| | | | | | | | | | | | |
| | Stated
Rates (1) | | Maturity | | December 31,
2016 | | December 31,
2015 |
| | | | (in Years) | | (in Thousands) |
| Series 2014-1 Class A1 | 5.1 | % | | 3.5 | | $ | 53,919 |
| | $ | 65,027 |
|
| Series 2014-1 Class A2 | 5.4 | % | | 3.5 | | 253,300 |
| | 253,300 |
|
| Series 2014-2 | 5.8 | % | | 4.2 | | 226,283 |
| | 229,674 |
|
| Series 2014-3 | 5.7 | % | | 5.2 | | 311,820 |
| | 312,276 |
|
| Series 2014-4 Class A1 | 3.5 | % | | 3.1 | | 150,000 |
| | 150,000 |
|
| Series 2014-4 Class A2 | 4.6 | % | | 13.1 | | 360,000 |
| | 360,000 |
|
| Total Master Trust 2014 notes | 5.1 | % | | 6.5 | | 1,355,322 |
| | 1,370,277 |
|
| Series 2013-1 Class A | 3.9 | % | | 2.0 | | 125,000 |
| | 125,000 |
|
| Series 2013-2 Class A | 5.3 | % | | 7.0 | | 192,384 |
| | 196,817 |
|
| Total Master Trust 2013 notes | 4.7 | % | | 5.0 | | 317,384 |
| | 321,817 |
|
| Total Master Trust Notes | | | | | 1,672,706 |
| | 1,692,094 |
|
| Debt discount, net | | | | | (18,787 | ) | | (22,909 | ) |
| Deferred financing costs, net | | | | | (16,376 | ) | | (19,345 | ) |
| Total Master Trust Notes, net | | | | | $ | 1,637,543 |
| | $ | 1,649,840 |
|
(1) Represents the individual series stated interest rate as of December 31, 2016 and the weighted average stated rate of the total Master Trust Notes, based on the collective series outstanding principal balances as of December 31, 2016.
SPIRIT REALTY CAPITAL, INC. and SPIRIT REALTY, L.P.
Notes to Consolidated Financial Statements - (continued)
December 31, 2016
As of December 31, 2016, the Master Trust 2014 notes were secured by 855 owned and financed properties issued by 5 indirect wholly-owned subsidiaries of the Corporation. The notes issued under Master Trust 2014 are cross-collateralized by the assets of all issuers within this trust. As of December 31, 2016, the Master Trust 2013 notes were secured by 307 owned and financed properties issued by a single indirect wholly-owned subsidiary of the Corporation.
CMBS
As of December 31, 2016, indirect wholly-owned special purpose entity subsidiaries of the Corporation were borrowers under 29 fixed-rate non-recourse loans, excluding two defaulted loans, which have been securitized into CMBS and are secured by the borrowers' respective leased properties and related assets. The stated interest rates as of December 31, 2016 for these fixed-rate notes ranged from 3.90% to 6.52% with a weighted average stated rate of 5.70%. As of December 31, 2016, these fixed-rate loans were secured by 130 properties. As of December 31, 2016 and December 31, 2015, the unamortized deferred financing costs associated with the CMBS loans were $4.7 million and $5.5 million, respectively, and recorded net against the principal balance of the mortgages and notes payable on the accompanying consolidated balance sheets. The deferred financing costs are being amortized to interest expense over the term of the respective loans. During June, 2016, the Company repaid the remaining eight CMBS variable-rate loans and terminated the related interest rate swap agreements.
As of December 31, 2016, certain borrowers were in default under the loan agreements relating to two separate CMBS fixed-rate loans where four properties securing the respective loans were no longer generating sufficient revenue to pay the scheduled debt service. The default interest rate on these loans was between 9.85% and 10.62%. Each defaulted borrower is a bankruptcy remote special purpose entity and the sole owner of the collateral securing the loan obligations. As of December 31, 2016, the aggregate principal balance under the defaulted CMBS loans was $26.6 million, which includes $9.5 million of interest added to principal. In addition, approximately $0.4 million of lender controlled restricted cash is being held in connection with these loans that may be applied to reduce amounts owed. During the year ended December 31, 2016, defaulted loan balances aggregating $64.1 million, were retired upon the disposition of seven properties with a net book value of $34.7 million. All seven properties were sold by the Company to third parties pursuant to an amendment to the loan agreements, which provided for a specified reduction in principal balance associated with the sale of those individual properties.
Convertible Notes
The Convertible Notes are comprised of two series of notes with an aggregate principal amount of $747.5 million at both December 31, 2017 and December 31, 2016. Interest on the Convertible Notes is payable semiannually in arrears on May 15 and November 15 of each year. The 2019 Notes, aggregate principal amount $402.5 million, accrue interest at 2.875% and are scheduled to mature on May 15, 2019. The 2021 Notes, aggregate principal amount $345.0 million, accrue interest at 3.75% and are scheduled to mature on May 15, 2021. As of December 31, 2017, the carrying amount of the Convertible Notes was $715.9 million, which is net of discounts (for the value of the embedded conversion feature) and unamortized deferred financing costs.
Holders may convert notes of either series prior to November 15, 2018, in the case of the 2019 Notes, or November 15, 2020, in the case of the 2021 Notes, only under the following circumstances: (1) if the closing price of our common stock for each of at least 20 trading days (whether or not consecutive) during the last 30 consecutive trading days in the quarter is greater than or equal to 130% of the conversion price for the Convertible Notes; (2) during the five business day period after any 10 consecutive trading day period in which the trading price per $1,000 principal amount of the Convertible Notes for each trading day of the measurement period was less than 98% of the product of the last closing price of our common stock and the conversion rate for the Convertible Notes; (3) if we call any or all of the Convertible Notes for redemption prior to the redemption date; or (4) upon the occurrence of specified corporate events as described in the Convertible Notes prospectus supplement. On or after November 15, 2018, in the case of the 2019 Notes, or November 15, 2020, in the case of the 2021 Notes, until the close of business on the second scheduled trading day immediately preceding the maturity date of the Convertible Notes, holders may convert the Convertible Notes of the applicable series at any time, regardless of the foregoing circumstances. Upon conversion, we will pay or deliver cash, shares of common stock or a combination of cash and shares of common stock, at our election.
The initial conversion rate for the Convertible Notes is 76.3636 shares of common stock per $1,000 principal amount of notes (equivalent to an initial conversion price of approximately $13.10 per share of common stock). The conversion rate for each series of the Convertible Notes is subject to adjustment for some events, including dividends paid in excess of threshold amounts stipulated in the agreement, but will not be adjusted for any accrued and unpaid interest. As of December 31, 2017, the conversion rate was 77.3144 per $1,000 principal note. If we undergo a fundamental change (as defined in the Convertible Notes supplemental indentures), holders may require us to repurchase all or any portion of their notes at a repurchase price equal to 100% of the principal amount of the notes to be repurchased, plusaccrued and unpaid interest.
Revolving Credit Facility
On March 31, 2015, the Company entered into the Credit Agreement, among the Operating Partnership as borrower and the Company as guarantor, that established a new $600.0 million unsecured credit facility and terminated its secured $400.0 million 2013 Credit Facility. The Revolving Credit Facility matures on March 31, 2019 (extendible at the Operating Partnership's option to March 31, 2020, subject to satisfaction of certain requirements) and includes an accordion feature to increase the committed facility size up to $1.0 billion, subject to satisfying certain requirements and obtaining additional lender commitments. On April 27, 2016, the Company expanded the borrowing capacity under the Revolving Credit Facility from $600.0 million to $800.0 million by partially exercising the accordion feature under the terms of the Credit Agreement. The Revolving Credit Facility also includes a 50.0 million sub-limit for swing-line loans and up to $60.0 million available for issuance of letters of credit. Swing-line loans and letters of credit reduce availability under the Revolving Credit Facility on a dollar-for-dollar basis. On November 3, 2015, the Company entered into a first amendment to the Credit Agreement. The amendment conforms certain of the terms and covenants to those in the Term Loan Agreement, including limiting the requirement of subsidiary guaranties to material subsidiaries (as defined in the Credit Agreement) meeting certain conditions. At December 31, 2017, there were no subsidiaries meeting this requirement.
The Revolving Credit Facility bears interest at a rate equal to LIBOR plus 0.875% to 1.55% per annum or a specified base rate plus 0.0% to 0.55% and requires a facility fee in an amount equal to the aggregate revolving credit commitments (whether or not utilized) multiplied by a rate equal to 0.125% to 0.30% per annum, in each case depending
on the Corporation's credit rating. As of December 31, 2017, the Revolving Credit Facility bore interest at LIBOR plus 1.25% based on the Company's credit rating and incurred a facility fee of 0.25% per annum.
The Operating Partnership may voluntarily prepay the Revolving Credit Facility, in whole or in part, at any time, without premium or penalty, but subject to applicable LIBOR breakage fees, if any. Payment of the Revolving Credit Facility is unconditionally guaranteed by the Corporation and material subsidiaries that meet certain conditions (as defined in the Credit Agreement). As of December 31, 2017, there were no subsidiaries that met this requirement.
As of December 31, 2017, $112.0 million in borrowings were outstanding and $688.0 million of borrowing capacity was available under the Revolving Credit Facility. Amounts available for borrowing under the Revolving Credit Facility remain subject to compliance with certain customary restrictive covenants including:
Maximum leverage ratio (defined as consolidated total indebtedness plus the Corporation’s pro rata share of indebtedness of unconsolidated affiliates, net of certain cash and cash equivalents, to total asset value) of 0.60:1.00, which may be increased to 0.65:1.00 for four consecutive quarters after certain material acquisitions;
Minimum fixed charge coverage ratio (defined as EBITDA plus the Corporation’s pro rata share of EBITDA of unconsolidated affiliates, to fixed charges) of 1.50:1.00;
Maximum secured indebtedness leverage ratio (defined as consolidated secured indebtedness plus the Corporation’s pro rata share of secured indebtedness of unconsolidated affiliates, net of certain cash and cash equivalents, to total asset value) of 0.50:1:00;
Minimum unsecured interest coverage ratio (defined as consolidated net operating income from unencumbered properties, to unsecured interest expense) of 1.75:1.00;
Maximum unencumbered leverage ratio (defined as consolidated unsecured indebtedness plus the Corporation’s pro rata share of unsecured indebtedness of unconsolidated affiliates, net of certain cash and cash equivalents, to total unencumbered asset value) of 0.60:1:00, which may be increased to 0.65:1.00 for four consecutive quarters after certain material acquisitions; and
Minimum tangible net worth of at least $3.01 billion plus 75% of the net proceeds of equity issuances by the Corporation or the Operating Partnership after December 31, 2014.
In addition to these covenants, the Credit Agreement also includes other customary affirmative and negative covenants, such as (i) limitation on liens and negative pledges; (ii) transactions with affiliates; (iii) limitation on mergers, consolidations and sales of all or substantially all assets; (iv) maintenance of status as a REIT and listing on any national securities exchange; and (v) material modifications to organizational documents.
As of December 31, 2017, the Corporation and the Operating Partnership were in compliance with these covenants.
Term Loan
On November 3, 2015, we entered into a Term Loan Agreement among the Operating Partnership as borrower, the Corporation as guarantor and the lenders that are parties thereto. The Term Loan Agreement provides for a $325.0 million senior unsecured term facility that has an initial maturity date of November 2, 2018, which may be extended at our option pursuant to two one-year extension options, subject to the satisfaction of certain conditions and payment of an extension fee. In addition, an accordion feature allows the facility to be increased to up to $600.0 million, subject to obtaining additional lender commitments. In December 2015, upon obtaining additional lender commitments, we increased the term facility from $325.0 million to $370.0 million. On December 19, 2016, we increased the term facility from $370.0 million to $420.0 million.
The Term Loan Agreement provides that borrowings bear interest at either LIBOR plus 1.35% to 1.80% per annum or a specified base rate plus 0.35% to 0.80% per annum, at the Operating Partnership's election. In each case, the applicable margin is determined based upon the Corporation’s leverage ratio. If the Corporation obtains at least two credit ratings on its senior unsecured long-term indebtedness of BBB- from S&P or Fitch, Inc. or Baa3 from Moody's, the Operating Partnership may make an irrevocable election to have the margin based upon the Corporation's credit ratings. In April 2016, the Corporation received a first time rating of BBB- from Fitch and was upgraded to a BBB- corporate issuer rating by S&P. As a result, the Operating Partnership elected to change the interest rate grid from leverage based pricing to credit rating based pricing in the second quarter of 2016. Under credit rating based pricing, borrowings will bear interest at either LIBOR plus 0.90% to 1.75% per annum or a specified base rate plus 0.0% to 0.75% per annum, in each case depending on the Corporation’s credit ratings. As of December 31, 2017, the Term Loan bore interest at LIBOR plus 1.35% based on our credit rating.
The Operating Partnership may voluntarily prepay the Term Loan, in whole or in part, at any time, without premium or penalty, but subject to applicable LIBOR breakage fees. Amounts prepaid may be subsequently re-borrowed within 30 days. Payment of the Term Loan is unconditionally guaranteed by the Corporation and, under certain circumstances, by one or more material subsidiaries (as defined in the Term Loan Agreement) of the Corporation. The obligations of the Operating Partnership and any guarantor under the Term Loan are full recourse to the Corporation and each guarantor.
As of December 31, 2017, the Term Loan provided $420.0 million of borrowing capacity. Amounts available for borrowing under the Term Loan remain subject to compliance with certain customary restrictive covenants including:
Maximum leverage ratio (defined as consolidated total indebtedness plus the Corporation’s pro rata share of indebtedness of unconsolidated affiliates, net of certain cash and cash equivalents, to total asset value) of 0.60:1.00, which may be increased to 0.65:1.00 for four consecutive quarters after certain material acquisitions;
Minimum fixed charge coverage ratio (defined as consolidated EBITDA plus the Corporation’s pro rata share of EBITDA of unconsolidated affiliates to fixed charges) of 1.50:1.00;
Maximum secured indebtedness leverage ratio (defined as consolidated secured indebtedness plus the Corporation’s pro rata share of secured indebtedness of unconsolidated affiliates, net of certain cash and cash equivalents to total asset value) of 0.50:1:00;
Minimum unsecured interest coverage ratio (defined as consolidated net operating income from unencumbered properties to unsecured interest expense) of 1.75:1.00;
Maximum unencumbered leverage ratio (defined as consolidated unsecured indebtedness plus the Corporation’s pro rata share of unsecured indebtedness of unconsolidated affiliates, net of certain cash and cash equivalents, to total unencumbered asset value) of 0.60:1:00, which may be increased to 0.65:1.00 for four consecutive quarters after certain material acquisitions; and
Minimum tangible net worth of at least $3.01 billion plus 75% of the net proceeds of equity issuances by the Corporation or the Operating Partnership after December 31, 2014.
In addition, the Term Loan Agreement includes other customary affirmative and negative covenants, including (i) limitation on liens and negative pledges; (ii) transactions with affiliates; (iii) limitation on mergers, consolidations and sales of all or substantially all assets; (iv) maintenance of status as a REIT and listing on a national securities exchange; and (v) material modifications to organizational documents. The ability to borrow under the Term Loan Agreement is subject to continued compliance with all of the covenants described above.
As of December 31, 2017, the Corporation and the Operating Partnership were in compliance with these financial covenants.
Senior Unsecured Notes
On August 18, 2016, the Operating Partnership completed a private placement of $300.0 million aggregate principal amount senior notes through a Rule 144A offering with registration rights, which are guaranteed by the Corporation. The Senior Unsecured Notes were issued at 99.378% of their principal amount, resulting in net proceeds of $296.2 million after deducting transaction fees and expenses. The Senior Unsecured Notes accrue interest at a rate of 4.450% per year, payable on March 15 and September 15 of each year, until the maturity date of September 15, 2026. The Company filed a registration statement with the SEC to exchange the private Senior Unsecured Notes for registered Senior Unsecured Notes with substantially identical terms, which became effective April 14, 2017. All $300.0 million aggregate principal amount of private Senior Unsecured Notes were tendered in the exchange for registered Senior Unsecured Notes.
The Senior Unsecured Notes are redeemable in whole at any time or in part from time to time, at the Operating Partnership’s option, at a redemption price equal to the sum of: an amount equal to 100% of the principal amount of the Senior Unsecured Notes to be redeemed plus accrued and unpaid interest and liquidated damages, if any, up to, but not including, the redemption date; and a make-whole premium calculated in accordance with the indenture. Notwithstanding the foregoing, if any of the Senior Unsecured Notes are redeemed on or after June 15, 2026 (three months prior to the maturity date of the Senior Unsecured Notes), the redemption price will not include a make-whole premium.
In connection with the issuance of the Senior Unsecured Notes, the Corporation and Operating Partnership remain subject to compliance with certain customary restrictive covenants including:
Maximum leverage ratio (defined as consolidated total indebtedness, to total consolidated undepreciated real estate assets plus the Company’s other assets, excluding accounts receivable and non-real estate intangibles) of 0.60:1.00;
Minimum unencumbered asset coverage ratio (defined as total consolidated undepreciated real estate assets plus the Company’s other assets, excluding accounts receivable and non-real estate intangibles, to consolidated total unsecured indebtedness) of 1.50:1:00;
Maximum secured indebtedness leverage ratio (defined as consolidated total secured indebtedness, to total consolidated undepreciated real estate assets plus the Company’s other assets, excluding accounts receivable and non-real estate intangibles) of 0.40:1.00; and
Minimum fixed charge coverage ratio (defined as consolidated income available for debt service, to the annual service charge) of 1.50:1.0.
In addition, the Senior Unsecured Notes Agreement includes other customary affirmative and negative covenants, including (i) maintenance of status as a REIT; (ii) payment of all taxes, assessments and governmental charges levied on the REIT; (iii) reporting on financial information; and (iv) maintenance of properties and property insurance.
As of December 31, 2017, the Corporation and the Operating Partnership were in compliance with these financial covenants.
CMBS
We may use long-term, fixed-rate debt to finance our properties. In such events, we generally seek to use asset level financing that bears annual interest less than the annual rent on the related lease(s) and that matures prior to the expiration of such lease(s). In general, the obligor of our asset level debt is a special purpose entity that holds the real estate and other collateral securing the indebtedness. Each special purpose entity is a bankruptcy remote separate legal entity, and is the sole owner of its assets and solely responsible for its liabilities other than typical non-recurring covenants.
As of December 31, 2017, we had 12 loans with approximately $332.6 million of outstanding principal balances under our fixed rate CMBS loans, with a weighted average contractual interest rate of 5.81% and a weighted average maturity of 4.6 years. Approximately one-third of this debt is partially amortizing and requires a balloon payment at maturity. These balances include six separate fixed-rate CMBS loans that are in default due to the underperformance of the eight properties that secure them. As of December 31, 2017, the aggregate principal balance under the defaulted CMBS loans was $64.3 million, including $13.2 million of default interest added to principal, and is discussed further below. Excluding these six loans, the outstanding principal obligations under our CMBS fixed-rate loans as of December 31, 2017 was $268.3 million.
The table below shows the outstanding principal obligations, including amortization, of these CMBS fixed rate loans as of December 31, 2017 and the year in which the loans mature (dollars in thousands). The information displayed in the table excludes amounts and interest rates related to the defaulted loans and the eight properties securing them.
|
| | | | | | | | | | | | | | | | | | | | | | |
| Year of Maturity | Number of Loans | | Number of Properties | | Stated Interest Rate Range | | Weighted Average Stated Rate | | Scheduled Principal | | Balloon | | Total |
| | | | | | | | | | | | | | |
| 2018 | — |
| | — |
| | 0 | | — | % | | $ | 3,692 |
| | $ | — |
| | $ | 3,692 |
|
| 2019 | — |
| | — |
| | — | | — |
| | 3,905 |
| | — |
| | 3,905 |
|
| 2020 | — |
| | — |
| | — | | — |
| | 4,100 |
| | — |
| | 4,100 |
|
| 2021 | — |
| | — |
| | — | | — |
| | 4,365 |
| | — |
| | 4,365 |
|
| 2022 | 1 |
| | 12 |
| | 4.67% | | 4.67 |
| | 4,617 |
| | 42,400 |
| | 47,017 |
|
| Thereafter | 5 |
| | 88 |
| | 5.23%-6.00% | | 5.48 |
| | 7,276 |
| | 197,980 |
| | 205,256 |
|
| Total | 6 |
| | 100 |
| | | | 5.35 | % | | $ | 27,955 |
| | $ | 240,380 |
| | $ | 268,335 |
|
CMBS Liquidity Matters
As of December 31, 2017, we are in default on six separate CMBS loans due to the underperformance of the properties securing these loans. The wholly-owned special purpose entities subject to these mortgage loans are separate legal entities and the sole owner of their assets and responsible for their liabilities. The aggregate outstanding principal balance of these loans, including capitalized interest, totaled $64.3 million. We believe the value of these properties is less than the related debt. As a result, we have notified the lenders of each special purpose entity that we anticipate either surrendering these properties to the lenders or selling them in certain instances in exchange for relieving the indebtedness, including any accrued interest and accrued or unpaid property expenses, encumbering them.
The following table provides key elements of the defaulted mortgage loans (dollars in thousands):
|
| | | | | | | | | | | | | | | | | | | | | | | | | | | | | | | | | | | |
| Industry | Properties | | Net Book Value | | Monthly Base Rent | | Pre-Default Outstanding Principal | | Capitalized Interest (1) | | Total Debt Outstanding | | Restricted Cash (2) | | Stated Rate | | Default Rate | | Accrued Interest (1) |
| | | | | | | | | | | | | | | | | | | | |
| Manufacturing | 2 | | $ | 3,618 |
| | $ | 16 |
| | $ | 5,460 |
| | $ | 11,354 |
| | $ | 16,814 |
| | $ | — |
| | 5.85 | % | | 9.85 | % | | $ | 143 |
|
| Sporting Goods | 1 | | 3,070 |
| | — |
| | 6,321 |
| | 429 |
| | 6,750 |
| | 453 |
| | 5.62 |
| | 10.62 |
| | 80 |
|
| Consumer Electronics | 1 | | 3,021 |
| | — |
| | 8,592 |
| | 592 |
| | 9,184 |
| | 286 |
| | 5.87 |
| | 9.87 |
| | 62 |
|
| Multi-Tenant Retail | 1 | | 12,580 |
| | 95 |
| | 17,250 |
| | 398 |
| | 17,648 |
| | 575 |
| | 5.53 |
| | 7.53 |
| | 78 |
|
| Sporting Goods | 2 | | 3,457 |
| | — |
| | 9,625 |
| | 310 |
| | 9,935 |
| | — |
| | 4.39 |
| | 9.39 |
| | 78 |
|
| Sporting Goods | 1 | | 2,010 |
| | — |
| | 3,853 |
| | 128 |
| | 3,981 |
| | 169 |
| | 4.65 |
| | 9.65 |
| | 33 |
|
| 8 | | $ | 27,756 |
| | $ | 111 |
| | $ | 51,101 |
| | $ | 13,211 |
| | $ | 64,312 |
| | $ | 1,483 |
| | 5.44 | % | | 9.21 | % | | $ | 474 |
|
(1) Interest capitalized to principal that remains unpaid.
(2) Represents restricted cash controlled by the lender that may be applied to reduce the outstanding principal balance.
Debt Maturities
Future principal payments due on our various types of debt outstanding as of December 31, 2017 (in thousands):
|
| | | | | | | | | | | | | | | | | | | | | | | | | | | |
| | Total | | 2018 | | 2019 | | 2020 | | 2021 | | 2022 | | Thereafter |
| | | | | | | | | | | | | | |
| Revolving Credit Facility | 112,000 |
| | — |
| | 112,000 |
| | — |
| | — |
| | — |
| | — |
|
| Master Trust Notes | 2,248,504 |
| | 163,185 |
| | 40,230 |
| | 410,713 |
| | 237,790 |
| | 969,020 |
| | 427,566 |
|
CMBS - fixed-rate (1) | 332,647 |
| | 68,004 |
| | 3,905 |
| | 4,100 |
| | 4,365 |
| | 47,017 |
| | 205,256 |
|
| Convertible Notes | 747,500 |
| | — |
| | 402,500 |
| | — |
| | 345,000 |
| | — |
| | — |
|
| Unsecured Senior Notes | 300,000 |
| | — |
| | — |
| | — |
| | — |
| | — |
| | 300,000 |
|
| | $ | 3,740,651 |
| | $ | 231,189 |
| | $ | 558,635 |
| | $ | 414,813 |
| | $ | 587,155 |
| | $ | 1,016,037 |
| | $ | 932,822 |
|
(1) The CMBS - fixed-rate payment balance in 2018 includes $64.3 million, including $13.2 million of capitalized interest, for the acceleration of principal payable following an event of default under 6 separate CMBS loans with stated maturities in 2018.
Contractual Obligations
The following table provides information with respect to our commitments as well as potential acquisitions under contract as of December 31, 2017, the table does not reflect available debt extensions (in thousands):
|
| | | | | | | | | | | | | | | | | | | | |
| | | Payment due by period |
| | | | | | | | | | | More than |
| | | | | Less than 1 | | 1-3 years | | 3-5 years | | 5 years |
| Contractual Obligations | | Total | | Year (2018) | | (2019-2020) | | (2021-2022) | | (after 2022) |
| | | | | | | | | | | |
| Debt - Principal | | $ | 3,740,651 |
| | $ | 231,189 |
| | $ | 973,448 |
| | $ | 1,603,192 |
| | $ | 932,822 |
|
Debt - Interest (1) (3) | | 795,950 |
| | 170,252 |
| | 288,219 |
| | 192,452 |
| | 145,027 |
|
Acquisitions Under Contract (2) | | 29,281 |
| | 29,281 |
| | — |
| | — |
| | — |
|
| Capital Improvements | | 34,128 |
| | 30,203 |
| | 2,525 |
| | 1,400 |
| | — |
|
| Operating Lease Obligations | | 43,842 |
| | 3,157 |
| | 6,356 |
| | 6,312 |
| | 28,017 |
|
| Total | | $ | 4,643,852 |
| | $ | 464,082 |
| | $ | 1,270,548 |
| | $ | 1,803,356 |
| | $ | 1,105,866 |
|
(1) Excludes interest on defaulted mortgage loans.
(2) Contracts contain standard cancellation clauses contingent on results of due diligence.
(3) Debt - Interest has been calculated based on outstanding balances as of December 31, 2017 through their respective maturity dates and excludes unamortized non-cash deferred financing costs of $39.6 million, unamortized debt discount of $61.4 million and any interest due on defaulted mortgage loans, including $0.5 million accrued as of December 31, 2017.
Distribution Policy
Distributions from our current or accumulated earnings are generally classified as ordinary income, whereas distributions in excess of our current and accumulated earnings, to the extent of a stockholder’s federal income tax basis in our common stock, are generally classified as a return of capital. Under the 2017 Tax Legislation, U.S. stockholders that are individuals, trusts and estates generally may deduct up to 20% of the ordinary dividends (e.g., dividends not designated as capital gain dividends or qualified dividend income) received from a REIT for taxable years beginning after December 31, 2017 and before January 1, 2026. Distributions in excess of a stockholder’s federal income tax basis in our common stock are generally characterized as capital gain.
We are required to distribute 90% of our taxable income (subject to certain adjustments and excluding net capital gain) on an annual basis to maintain qualification as a REIT for federal income tax purposes and are required to pay federal income tax at regular corporate rates to the extent we distribute less than 100% of our taxable income (including capital gains).
We intend to make distributions that will enable us to meet the distribution requirements applicable to REITs and to eliminate or minimize our obligation to pay corporate-level federal income and excise taxes.
Any distributions will be at the sole discretion of our Board of Directors, and their form, timing and amount, if any, will depend upon a number of factors, including our actual and projected results of operations, FFO, liquidity, cash flows and financial condition, the revenue we actually receive from our properties, our operating expenses, our debt service requirements, our capital expenditures, prohibitions and other limitations under our financing arrangements, our REIT taxable income, the annual REIT distribution requirements, applicable law and such other factors as our Board of Directors deems relevant.
Cash Flows
Comparison of Years Ended December 31, 2017 and 2016
The following table presents a summary of our cash flows for the years ended December 31, 2017 and 2016 (in thousands):
|
| | | | | | | | | | | |
| | Years Ended |
| | December 31, |
| | 2017 | | 2016 | | Change |
| Net cash provided by operating activities | $ | 386,393 |
| | $ | 361,409 |
| | $ | 24,984 |
|
| Net cash provided by (used in) investing activities | 82,942 |
| | (117,251 | ) | | 200,193 |
|
| Net cash used in financing activities | (470,596 | ) | | (255,889 | ) | | (214,707 | ) |
| Net (decrease) increase in cash and cash equivalents | $ | (1,261 | ) | | $ | (11,731 | ) | | $ | 10,470 |
|
As of December 31, 2017, we had $8.8 million of unrestricted cash and cash equivalents as compared to $10.1 million as of December 31, 2016.
Operating Activities
Our cash flows from operating activities are primarily dependent upon the occupancy level of our portfolio, the rental rates specified in our leases, the collectability of rent and the level of our operating expenses and other general and administrative costs.
The increase in net cash provided by operating activities was primarily attributable to a decrease in costs associated with debt extinguishment of $22.9 million due to a lower volume of mortgage debt being extinguished, a decrease in cash paid for interest of $18.4 million related to the lower level of outstanding mortgage debt, and reduced restructuring charge payments of $11.3 million as restructuring activities were finalized in 2016, offset by a decrease in cash revenue of $19.1 million and increases in property costs of $5.8 million related to reimbursable and non-reimbursable property taxes, and G&A costs of $3.6 million.
The decrease in revenue was primarily attributable to the disposition of 192 properties, representing a gross investment in real estate during the year ended December 31, 2017 of $510.9 million, partially offset by the acquisition of 39 properties, during the same period, with a real estate investment value totaling $323.0 million.
Investing Activities
Cash provided by (used in) investing activities is generally used to fund property acquisitions, for investments in loans receivable and, to a limited extent, for capital expenditures. Cash provided by investing activities generally relates to the disposition of real estate and other assets.
Net cash provided by investing activities during 2017 included cash proceeds of $472.5 million from the disposition of 192 properties, offset by $279.9 million to fund the acquisition of 39 properties and capitalized real estate expenditures of $46.1 million and the transfer of sales proceeds to restricted cash accounts of $71.3 million . Net cash provided by investing activities also included collections of principal on loans receivable and real estate assets under direct financing leases totaling $12.8 million and the investment in notes receivable of $5.0 million.
During the same period in 2016, net cash used in investing activities included $655.8 million to fund the acquisition of 269 properties and capitalized real estate expenditures of $27.1 million partially offset by cash proceeds of $524.8 million from the disposition of 213 properties. Net cash used in investing activities also included collections of principal on loans receivable and real estate assets under direct financing leases totaling $8.4 million, offset by the release of sales proceeds from restricted cash accounts of $2.3 million.
Financing Activities
Generally, our net cash used in financing activities is impacted by our common and preferred stock offerings and activity, including repurchases of our common stock under our Stock Repurchase Program, borrowings under our Revolving Credit Facilities and Term Loan, and issuances of net-lease mortgage notes under our Spirit Master Funding Program.
Net cash used in financing activities during 2017 was primarily attributable to the repayment of the $420.0 million Term Loan, the payment of dividends to common and preferred equity owners of $341.7 million, the repurchase of 35,839,965 shares of the Company's outstanding common stock for $286.6 million and repayments of $221.3 million in mortgages and notes payable, offset by the issuance of 6.9 million shares of Class A Preferred Stock for net proceeds of $166.2 million, and debt issuances under our Spirit Master Funding Program of $618.6 million.
Net cash used in financing activities during 2016 was primarily attributable to the repayment of our indebtedness of $863.8 million and the payment of dividends to equity owners of $323.6 million, both of which were primarily funded from our operating cash flows, net borrowings under our Revolving Credit Facility and Term Loan of $86.0 million and $95.0 million, respectively, net proceeds of $298.1 million from the issuance of $300.0 million aggregate principal Senior Unsecured Notes and the sale of an aggregate 40.8 million shares of our common stock in an underwritten public offering and under our ATM Program, generating net proceeds of $368.9 million and $77.7 million, respectively.
Comparison of Years Ended December 31, 2016 and 2015
The following table presents a summary of our cash flows for the years ended December 31, 2016 and 2015 (in thousands):
|
| | | | | | | | | | | |
| | Years Ended |
| | December 31, |
| | 2016 | | 2015 | | Change |
| Net cash provided by operating activities | $ | 361,409 |
| | $ | 371,986 |
| | $ | (10,577 | ) |
| Net cash used in investing activities | (117,251 | ) | | (385,696 | ) | | 268,445 |
|
| Net cash provided by financing activities | (255,889 | ) | | (140,681 | ) | | (115,208 | ) |
| Net increase (decrease) in cash and cash equivalents | $ | (11,731 | ) | | $ | (154,391 | ) | | $ | 142,660 |
|
As of December 31, 2016, we had $10.1 million of cash and cash equivalents as compared to $21.8 million as of December 31, 2015.
Operating Activities
Our cash flows from operating activities are primarily dependent upon the occupancy level of our portfolio, the rental rates specified in our leases, the collectability of rent and the level of our operating expenses and other general and administrative costs.
The decrease in net cash provided by operating activities was primarily attributable to an increase in debt extinguishment costs of $18.1 million, restructuring charge payments of $10.2 million, G&A costs of $6.9 million, payments to terminate interest rate swap agreements of $1.7 million and net changes in operating assets and liabilities of $7.2 million, partially offset by an increase in cash revenue of $12.9 million and a decrease in cash paid for interest of $27.4 million.
The increase in revenue was primarily attributable to the acquisition of 269 properties, representing a gross investment in real estate during the year ended December 31, 2016 totaling $704.9 million partially offset by the disposition of 213 properties during the same period with a real estate investment value of $598.7 million.
Investing Activities
Cash used in investing activities is generally used to fund property acquisitions, for investments in loans receivable and, to a limited extent, for capital expenditures. Cash provided by investing activities generally relates to the disposition of real estate and other assets.
Net cash used in investing activities during 2016 included $655.8 million to fund the acquisition of 269 properties and capitalized real estate expenditures of $27.1 million partially offset by cash proceeds of $524.8 million from the disposition of 213 properties. Net cash used in investing activities also included collections of principal on loans receivable and real estate assets under direct financing leases totaling $8.4 million, offset by the release of sales proceeds from restricted cash accounts of $2.3 million.
During the same period in 2015, net cash used in investing activities included $876.0 million to fund the acquisition of 232 properties and capitalized real estate expenditures of $10.3 million partially offset by cash proceeds of $496.6 million from the disposition of 110 properties. Net cash used in investing activities also included investment in loans
receivable of $4.0 million, partially offset by the release of sales proceeds from restricted cash accounts of $41.0 million and collections of principal on loans receivable and real estate assets under direct financing leases totaling $6.8 million.
Financing Activities
Generally, our net cash (used in) provided by financing activities is impacted by our net borrowings and common stock offerings, including sales of our common stock under our ATM Program, common stock offerings, borrowings under our Revolving Credit Facilities and Term Loan, and issuances of net-lease mortgage notes under our Spirit Master Funding Program.
Net cash used in financing activities during 2016 was primarily attributable to the repayment of our indebtedness of $863.8 million and the payment of dividends to equity owners of $323.6 million, both of which were primarily funded from our operating cash flows, net borrowings under our Revolving Credit Facility and Term Loan of $86.0 million and $95.0 million, respectively, net proceeds of $298.1 million from the issuance of $300.0 million aggregate principal Senior Unsecured Notes and the sale of an aggregate 40.8 million shares of our common stock in an underwritten public offering and under our ATM Program, generating net proceeds of $368.9 million and $77.7 million, respectively.
Net cash used in financing activities during 2015 was primarily attributable to the repayment of our indebtedness of $512.5 million, the payment of dividends to equity owners of $292.3 million, both of which were paid primarily through sources from our operating cash flows, and net repayments under our Revolving Credit Facilities of $15.2 million. These amounts were partially offset by the issuance and sale of 23.0 million shares of our common stock in an underwritten public offering and the sale of 6.6 million shares of our common stock under our ATM Program for aggregate net proceeds of $347.2 million and borrowings under our Term Loan of $325.0 million.
Item 7A. Quantitative and Qualitative Disclosures About Market Risk
We are exposed to financial market risks, especially interest rate risk. Interest rates and other factors, such as occupancy, rental rates and the financial condition of our tenants, influence our performance more so than does inflation. Changes in interest rates do not necessarily correlate with inflation rates or changes in inflation rates. As described above, we generally offer leases that provide for payments of base rent with scheduled increases and, to a lesser extent, contingent rent based on a percentage of the tenant’s gross sales to help mitigate the effect of inflation. Because the properties in our portfolio are generally leased to tenants under triple-net leases, our exposure to rising property operating costs due to inflation is mitigated.
Interest rates are highly sensitive to many factors, including governmental monetary policies and domestic and global economic and political conditions, which are beyond our control. Our operating results depend heavily on the difference between the revenue from our assets and the interest expense incurred on our borrowings. We may incur additional variable rate debt in the future, including amounts that we may borrow under our Revolving Credit Facility and Term Loan. In addition, decreases in interest rates may lead to additional competition for the acquisition of real estate due to a reduction in desirable alternative income-producing investments, which may lead to a decrease in the yields on real estate we have targeted for acquisition. In such circumstances, if we are not able to offset the decrease in yields by obtaining lower interest costs on our borrowings, our results of operations will be adversely affected. Significant increases in interest rates may also have an adverse impact on our earnings if we are unable to acquire real estate with rental rates high enough to offset the increase in interest rates on our borrowings.
In the event interest rates rise significantly or there is an economic downturn, defaults may increase and result in credit losses, which may adversely affect our liquidity and operating results. In a decreasing interest rate environment, borrowers are generally more likely to prepay their loans in order to obtain financing at lower interest rates. However, the vast majority of our mortgage notes payable have prepayment clauses that make refinancing during a decreasing interest rate environment uneconomical. Investments in our mortgage loans receivable, however, have significant prepayment protection in the form of yield maintenance provisions, which provide us with substantial yield protection in a decreasing interest rate environment with respect to this portion of our investment portfolio.
The objective of our interest rate risk management policy is to match fund fixed-rate assets with fixed-rate liabilities. As of December 31, 2017, our assets were primarily long-term, fixed-rate leases (though most have scheduled rental increases during the terms of the leases). As of December 31, 2017, $3.6 billion of our indebtedness was fixed-rate, consisting of our Master Trust Notes, fixed-rate CMBS loans, Senior Unsecured Notes and Convertible Notes, with a weighted average stated interest rate of 4.67%, excluding amortization of deferred financing costs and debt discounts/premiums. As of December 31, 2017, $112.0 million of our indebtedness was variable-rate, consisting of our Revolving Credit Facility, with a weighted average stated interest rate of 2.74%, excluding amortization of deferred financing
costs and debt discounts/premiums. If one-month LIBOR as of December 31, 2017 increased by 12.5 basis points, or 0.125%, the resulting increase in annual interest expense with respect to the $112.0 million outstanding under the variable-rate obligations would impact our future earnings and cash flows by $140.0 thousand.
The estimated fair values of our debt instruments have been derived based on market quotes for comparable instruments or discounted cash flow analysis using estimates of the amount and timing of future cash flows, market rates and credit spreads. The debt instrument balances as of December 31, 2017 are as follows (in thousands):
|
| | | | | | | |
| | Carrying
Value | | Estimated
Fair Value |
| | | | |
| Revolving Credit Facility | $ | 112,000 |
| | $ | 111,997 |
|
Term Loan, net (1) | — |
| | — |
|
Senior Unsecured Notes, net (1) | 295,321 |
| | 299,049 |
|
Mortgages and notes payable, net (1) | 2,516,478 |
| | 2,657,599 |
|
Convertible Notes, net (1) | 715,881 |
| | 761,440 |
|
(1) The carrying value of the debt instruments are net of unamortized deferred financing costs and certain debt discounts/premiums.
Item 8. Financial Statements and Supplementary Data
INDEX TO CONSOLIDATED FINANCIAL STATEMENTS
|
| |
| Item 8. Financial Statements and Supplemental Data | |
| Reports of Independent Registered Public Accounting Firms | |
| Consolidated Balance Sheets of Spirit Realty Capital, Inc. as of December 31, 2017 and 2016 | |
| Consolidated Statements of Operations of Spirit Realty Capital, Inc. for the Years Ended December 31, 2017, 2016 and 2015 | |
| Consolidated Statements of Comprehensive Income of Spirit Realty Capital, Inc. for the Years Ended December 31, 2017, 2016 and 2015 | |
| Consolidated Statements of Stockholders' Equity of Spirit Realty Capital, Inc. for the Years Ended December 31, 2017, 2016 and 2015 | |
| Consolidated Statements of Cash Flows of Spirit Realty Capital, Inc. for the Years Ended December 31, 2017, 2016 and 2015 | |
| Consolidated Balance Sheets of Spirit Realty, L.P. as of December 31, 2017 and 2016 | |
| Consolidated Statements of Operations of Spirit Realty, L.P. for the Years Ended December 31, 2017, 2016 and 2015 | |
| Consolidated Statements of Comprehensive Income of Spirit Realty, L.P. for the Years Ended December 31, 2017, 2016 and 2015 | |
| Consolidated Statements of Partners' Capital of Spirit Realty, L.P. for the Years Ended December 31, 2017, 2016 and 2015 | |
| Consolidated Statements of Cash Flows of Spirit Realty, L.P. for the Years Ended December 31, 2017, 2016 and 2015 | |
| Notes to Consolidated Financial Statements | |
Report of Independent Registered Public Accounting Firm
To the Stockholders and the Board of Directors of
Spirit Realty Capital, Inc.
Opinion on Internal Control over Financial Reporting
We have audited Spirit Realty Capital, Inc.’s internal control over financial reporting as of December 31, 2017, based on criteria established in Internal Control-Integrated Framework issued by the Committee of Sponsoring Organizations of the Treadway Commission (2013 framework) (the COSO criteria). In our opinion, Spirit Realty Capital, Inc. (the Company) maintained, in all material respects, effective internal control over financial reporting as of December 31, 2017, based on the COSO criteria.
We also have audited, in accordance with the standards of the Public Company Accounting Oversight Board (United States) (PCAOB), the 2017 consolidated financial statements of the Company and our report dated February 22, 2018 expressed an unqualified opinion thereon.
Basis for Opinion
The Company’s management is responsible for maintaining effective internal control over financial reporting and for its assessment of the effectiveness of internal control over financial reporting included in the accompanying Management’s Report on Internal Control over Financial Reporting. Our responsibility is to express an opinion on the Company’s internal control over financial reporting based on our audit. We are a public accounting firm registered with the PCAOB and are required to be independent with respect to the Company in accordance with the U.S. federal securities laws and the applicable rules and regulations of the Securities and Exchange Commission and the PCAOB.
We conducted our audit in accordance with the standards of the PCAOB. Those standards require that we plan and perform the audit to obtain reasonable assurance about whether effective internal control over financial reporting was maintained in all material respects.
Our audit included obtaining an understanding of internal control over financial reporting, assessing the risk that a material weakness exists, testing and evaluating the design and operating effectiveness of internal control based on the assessed risk, and performing such other procedures as we considered necessary in the circumstances. We believe that our audit provides a reasonable basis for our opinion.
Definition and Limitations of Internal Control Over Financial Reporting
A company’s internal control over financial reporting is a process designed to provide reasonable assurance regarding the reliability of financial reporting and the preparation of financial statements for external purposes in accordance with generally accepted accounting principles. A company’s internal control over financial reporting includes those policies and procedures that (1) pertain to the maintenance of records that, in reasonable detail, accurately and fairly reflect the transactions and dispositions of the assets of the company; (2) provide reasonable assurance that transactions are recorded as necessary to permit preparation of financial statements in accordance with generally accepted accounting principles, and that receipts and expenditures of the company are being made only in accordance with authorizations of management and directors of the company; and (3) provide reasonable assurance regarding prevention or timely detection of unauthorized acquisition, use, or disposition of the company’s assets that could have a material effect on the financial statements.
Because of its inherent limitations, internal control over financial reporting may not prevent or detect misstatements. Also, projections of any evaluation of effectiveness to future periods are subject to the risk that controls may become inadequate because of changes in conditions, or that the degree of compliance with the policies or procedures may deteriorate.
/s/ Ernst & Young LLP
Dallas, Texas
February 22, 2018
Report of Independent Registered Public Accounting Firm
To the Stockholders and the Board of Directors of
Spirit Realty Capital, Inc.
Opinion on the Financial Statements
We have audited the accompanying consolidated balance sheets of Spirit Realty Capital, Inc. (the Company) as of December 31, 2017 and 2016, the related consolidated statements of operations, comprehensive income, stockholders’ equity and cash flows for each of the three years in the period ended December 31, 2017, and the related notes and financial statement schedules listed in the Index at Item 15(a) (collectively referred to as the consolidated financial statements). In our opinion, the consolidated financial statements present fairly, in all material respects, the financial position of the Company at December 31, 2017 and 2016, and the results of its operations and its cash flows for each of the three years in the period ended December 31, 2017, in conformity with U.S. generally accepted accounting principles.
We also have audited, in accordance with the standards of the Public Company Accounting Oversight Board (United States) (PCAOB), the Company’s internal control over financial reporting as of December 31, 2017, based on criteria established in Internal Control-Integrated Framework issued by the Committee of Sponsoring Organizations of the Treadway Commission (2013 framework) and our report dated February 22, 2018 expressed an unqualified opinion thereon.
Basis for Opinion
These financial statements are the responsibility of the Company‘s management. Our responsibility is to express an opinion on the Company‘s financial statements based on our audits. We are a public accounting firm registered with the PCAOB and are required to be independent with respect to the Company in accordance with the US federal securities laws and the applicable rules and regulations of the Securities and Exchange Commission and the PCAOB.
We conducted our audits in accordance with the standards of the PCAOB. Those standards require that we plan and perform the audit to obtain reasonable assurance about whether the financial statements are free of material misstatement, whether due to error or fraud. Our audits included performing procedures to assess the risks of material misstatement of the financial statements, whether due to error or fraud, and performing procedures that respond to those risks. Such procedures included examining, on a test basis, evidence regarding the amounts and disclosures in the financial statements. Our audits also included evaluating the accounting principles used and significant estimates made by management, as well as evaluating the overall presentation of the financial statements. We believe that our audits provide a reasonable basis for our opinion.
/s/ Ernst & Young LLP
We have served as the Company’s auditor since 2003.
Dallas, Texas
February 22, 2018
Report of Independent Registered Public Accounting Firm
To the Partners of Spirit Realty, L.P. and the Board of Directors of
Spirit Realty Capital, Inc.
Opinion on the Financial Statements
We have audited the accompanying consolidated balance sheets of Spirit Realty, L.P. (the Operating Partnership) as of December 31, 2017 and 2016, the related consolidated statements of operations, comprehensive income, partners’ capital and cash flows for each of the three years in the period ended December 31, 2017, and the related notes and financial statement schedules listed in the Index at Item 15(a) (collectively referred to as the consolidated financial statements). In our opinion, the consolidated financial statements present fairly, in all material respects, the financial position of the Operating Partnership at December 31, 2017 and 2016, and the results of its operations and its cash flows for each of the three years in the period ended December 31, 2017, in conformity with U.S. generally accepted accounting principles.
Basis for Opinion
These financial statements are the responsibility of the Operating Partnership's management. Our responsibility is to express an opinion on the Operating Partnership’s financial statements based on our audits. We are a public accounting firm registered with the PCAOB and are required to be independent with respect to the Operating Partnership in accordance with the U.S. federal securities laws and the applicable rules and regulations of the Securities and Exchange Commission and the PCAOB.
We conducted our audits in accordance with the standards of the PCAOB. Those standards require that we plan and perform the audit to obtain reasonable assurance about whether the financial statements are free of material misstatement, whether due to error or fraud. Our audits included performing procedures to assess the risks of material misstatement of the financial statements, whether due to error or fraud, and performing procedures that respond to those risks. Such procedures included examining, on a test basis, evidence regarding the amounts and disclosures in the financial statements. Our audits also included evaluating the accounting principles used and significant estimates made by management, as well as evaluating the overall presentation of the financial statements. We believe that our audits provide a reasonable basis for our opinion.
/s/ Ernst & Young LLP
We have served as the Operating Partnership’s auditor since 2016.
Dallas, Texas
February 22, 2018
SPIRIT REALTY CAPITAL, INC.
Consolidated Balance Sheets
(In Thousands, Except Share and Per Share Data)
|
| | | | | | | |
| | December 31,
2017 | | December 31,
2016 |
| Assets |
|
|
|
| Investments: |
|
|
|
| Real estate investments: |
|
|
|
| Land and improvements | $ | 2,588,930 |
|
| $ | 2,704,010 |
|
| Buildings and improvements | 4,692,377 |
|
| 4,775,221 |
|
| Total real estate investments | 7,281,307 |
|
| 7,479,231 |
|
| Less: accumulated depreciation | (1,075,643 | ) |
| (940,005 | ) |
| 6,205,664 |
|
| 6,539,226 |
|
| Loans receivable, net | 79,967 |
|
| 66,578 |
|
| Intangible lease assets, net | 409,903 |
|
| 470,276 |
|
| Real estate assets under direct financing leases, net | 24,865 |
|
| 36,005 |
|
| Real estate assets held for sale, net | 48,929 |
|
| 160,570 |
|
| Net investments | 6,769,328 |
|
| 7,272,655 |
|
| Cash and cash equivalents | 8,798 |
|
| 10,059 |
|
| Deferred costs and other assets, net | 231,045 |
|
| 140,917 |
|
| Goodwill | 254,340 |
|
| 254,340 |
|
| Total assets | $ | 7,263,511 |
|
| $ | 7,677,971 |
|
|
|
|
|
| Liabilities and stockholders’ equity |
|
|
|
| Liabilities: |
|
|
|
| Revolving Credit Facility | $ | 112,000 |
|
| $ | 86,000 |
|
| Term Loan, net | — |
|
| 418,471 |
|
| Senior Unsecured Notes, net | 295,321 |
| | 295,112 |
|
| Mortgages and notes payable, net | 2,516,478 |
|
| 2,162,403 |
|
| Convertible Notes, net | 715,881 |
|
| 702,642 |
|
| Total debt, net | 3,639,680 |
|
| 3,664,628 |
|
| Intangible lease liabilities, net | 155,303 |
|
| 182,320 |
|
| Accounts payable, accrued expenses and other liabilities | 148,919 |
|
| 148,915 |
|
| Total liabilities | 3,943,902 |
|
| 3,995,863 |
|
| Commitments and contingencies (see Note 8) |
|
|
|
|
|
| Stockholders’ equity: |
|
|
|
| Preferred stock and paid in capital, $0.01 par value, 20,000,000 shares authorized: 6,900,000 shares and no shares issued and outstanding at December 31, 2017 and December 31, 2016, respectively, liquidation preference of $25.00 per share | 166,193 |
| | — |
|
| Common stock, $0.01 par value, 750,000,000 shares authorized: 448,868,269 shares and 483,624,120 shares issued and outstanding at December 31, 2017 and December 31, 2016, respectively | 4,489 |
|
| 4,836 |
|
| Capital in excess of common stock par value | 5,193,631 |
|
| 5,177,086 |
|
| Accumulated deficit | (2,044,704 | ) |
| (1,499,814 | ) |
| Total stockholders’ equity | 3,319,609 |
|
| 3,682,108 |
|
| Total liabilities and stockholders’ equity | $ | 7,263,511 |
|
| $ | 7,677,971 |
|
See accompanying notes.
SPIRIT REALTY CAPITAL, INC.
Consolidated Statements of Operations
(In Thousands, Except Share and Per Share Data)
|
| | | | | | | | | | | | |
| | | Years Ended December 31, |
| | | 2017 | | 2016 | | 2015 |
| Revenues: | | | | | | |
| Rentals | | $ | 639,017 |
| | $ | 648,363 |
| | $ | 634,151 |
|
| Interest income on loans receivable | | 3,791 |
| | 5,253 |
| | 6,948 |
|
| Earned income from direct financing leases | | 2,078 |
| | 2,742 |
| | 3,024 |
|
| Tenant reimbursement income | | 16,747 |
| | 14,125 |
| | 15,952 |
|
| Other income | | 7,322 |
| | 15,491 |
| | 7,260 |
|
| Total revenues | | 668,955 |
| | 685,974 |
| | 667,335 |
|
| Expenses: | | | | | | |
| General and administrative | | 62,064 |
| | 52,615 |
| | 47,730 |
|
| Restructuring charges | | — |
| | 6,341 |
| | 7,056 |
|
| Transaction costs | | 6,361 |
| | — |
| | — |
|
| Property costs (including reimbursable) | | 36,617 |
| | 30,839 |
| | 27,715 |
|
| Real estate acquisition costs | | 1,356 |
| | 3,229 |
| | 2,739 |
|
| Interest | | 190,127 |
| | 196,586 |
| | 222,901 |
|
| Depreciation and amortization | | 256,019 |
| | 262,276 |
| | 260,633 |
|
| Impairments | | 102,330 |
| | 88,275 |
| | 70,695 |
|
| Total expenses | | 654,874 |
| | 640,161 |
| | 639,469 |
|
| Income from continuing operations before other (expense) income and income tax expense | | 14,081 |
| | 45,813 |
| | 27,866 |
|
| Other (expense) income: | | | | | | |
| (Loss) gain on debt extinguishment | | (1,645 | ) | | 233 |
| | (3,162 | ) |
| Total other (expense) income | | (1,645 | ) | | 233 |
| | (3,162 | ) |
| Income from continuing operations before income tax expense | | 12,436 |
| | 46,046 |
| | 24,704 |
|
| Income tax expense | | (394 | ) | | (965 | ) | | (601 | ) |
| Income from continuing operations | | 12,042 |
| | 45,081 |
| | 24,103 |
|
| Discontinued operations: | | | | | | |
| Income from discontinued operations | | — |
| | — |
| | 98 |
|
| Gain on disposition of assets | | — |
| | — |
| | 590 |
|
| Income from discontinued operations | | — |
| | — |
| | 688 |
|
| Income before gain on disposition of assets | | 12,042 |
| | 45,081 |
| | 24,791 |
|
| Gain on disposition of assets | | 65,106 |
| | 52,365 |
| | 68,421 |
|
| Net Income | | 77,148 |
| | 97,446 |
| | 93,212 |
|
| Dividends paid to preferred stockholders | | (2,530 | ) | | — |
| | — |
|
| Net income attributable to common stockholders | | $ | 74,618 |
| | $ | 97,446 |
| | $ | 93,212 |
|
| | | | | | | |
| Net income per share attributable to common stockholders—basic | | $ | 0.16 |
| | $ | 0.21 |
| | $ | 0.21 |
|
| | | | | | | |
| Net income per share attributable to common stockholders—diluted | | $ | 0.16 |
| | $ | 0.21 |
| | $ | 0.21 |
|
| Weighted average shares of common stock outstanding: | | | | | | |
| Basic | | 467,934,945 |
| | 469,217,776 |
| | 432,222,953 |
|
| Diluted | | 467,942,788 |
| | 469,246,265 |
| | 432,545,625 |
|
See accompanying notes.
SPIRIT REALTY CAPITAL, INC.
Consolidated Statements of Comprehensive Income
(In Thousands)
|
| | | | | | | | | | | |
| | Years Ended December 31, |
| | 2017 | | 2016 | | 2015 |
| Net income attributable to common stockholders | $ | 74,618 |
| | $ | 97,446 |
| | $ | 93,212 |
|
| Other comprehensive income: | | | | | |
| Change in net unrealized losses on cash flow hedges | — |
| | (1,137 | ) | | (1,190 | ) |
| Net cash flow hedge losses reclassified to operations | — |
| | 2,165 |
| | 1,245 |
|
| Total comprehensive income | $ | 74,618 |
| | $ | 98,474 |
| | $ | 93,267 |
|
See accompanying notes.
SPIRIT REALTY CAPITAL, INC.
Consolidated Statements of Stockholders’ Equity
(In Thousands, Except Share Data)
|
| | | | | | | | | | | | | | | | | | | | | | | | | | | | | | |
| | | Preferred Stock | | Common Stock | | Accumulated Deficit | | | | Total Stockholders’ Equity |
| | | Shares | | Par
Value and Capital in Excess of Par Value | | Shares | | Par
Value | | Capital in Excess of Par Value | | | AOCL | |
| Balances, December 31, 2014 | | — |
| | $ | — |
| | 411,350,440 |
| | $ | 4,113 |
| | $ | 4,361,320 |
| | $ | (1,052,688 | ) | | $ | (1,083 | ) | | $ | 3,311,662 |
|
| Net income | | — |
| | — |
| | — |
| | — |
| | — |
| | 93,212 |
| | — |
| | 93,212 |
|
| Other comprehensive income | | — |
| | — |
| | — |
| | — |
| | — |
| | — |
| | 55 |
| | 55 |
|
| Dividends declared on common stock | | — |
| | — |
| | — |
| | — |
| | — |
| | (298,531 | ) | | — |
| | (298,531 | ) |
| Tax withholdings related to net stock settlements | | — |
| | — |
| | (426,158 | ) | | (4 | ) | | — |
| | (4,268 | ) | | — |
| | (4,272 | ) |
| Issuance of shares of common stock, net | | — |
| | — |
| | 29,610,100 |
| | 296 |
| | 346,915 |
| | — |
| | — |
| | 347,211 |
|
| Exercise of stock options | | — |
| | — |
| | 5,000 |
| | — |
| | 46 |
| | — |
| | — |
| | 46 |
|
| Stock-based compensation, net | | — |
| | — |
| | 1,280,582 |
| | 13 |
| | 13,042 |
| | (564 | ) | | — |
| | 12,491 |
|
| Balances, December 31, 2015 | | — |
| | $ | — |
| | 441,819,964 |
| | $ | 4,418 |
| | $ | 4,721,323 |
| | $ | (1,262,839 | ) | | $ | (1,028 | ) | | $ | 3,461,874 |
|
| Net income | | — |
| | — |
| | — |
| | — |
| | — |
| | 97,446 |
| | — |
| | 97,446 |
|
| Other comprehensive income | | — |
| | — |
| | — |
| | — |
| | — |
| | — |
| | 1,028 |
| | 1,028 |
|
| Dividends declared on common stock | | — |
| | — |
| | — |
| | — |
| | — |
| | (333,180 | ) | | — |
| | (333,180 | ) |
| Tax withholdings related to net stock settlements | | — |
| | — |
| | (72,835 | ) | | (1 | ) | | — |
| | (752 | ) | | — |
| | (753 | ) |
| Issuance of shares of common stock, net | | — |
| | — |
| | 40,835,360 |
| | 408 |
| | 446,205 |
| | — |
| | — |
| | 446,613 |
|
| Stock-based compensation, net | | — |
| | — |
| | 1,041,631 |
| | 11 |
| | 9,558 |
| | (489 | ) | | — |
| | 9,080 |
|
| Balances, December 31, 2016 | | — |
| | $ | — |
| | 483,624,120 |
| | $ | 4,836 |
| | $ | 5,177,086 |
| | $ | (1,499,814 | ) | | $ | — |
| | $ | 3,682,108 |
|
| Net income | | — |
| | — |
| | — |
| | — |
| | — |
| | 77,148 |
| | — |
| | 77,148 |
|
| Dividends declared on preferred stock | | — |
| | — |
| | — |
| | — |
| | — |
| | (2,530 | ) | | — |
| | (2,530 | ) |
| Net income available to common stockholders | | — |
| | — |
| | — |
| | — |
| | — |
| | 74,618 |
| | — |
| | 74,618 |
|
| Issuance of preferred stock | | 6,900,000 |
| | 166,193 |
| | — |
| | — |
| | — |
| | — |
| | — |
| | 166,193 |
|
| Dividends declared on common stock | | — |
| | — |
| | — |
| | — |
| | — |
| | (332,402 | ) | | — |
| | (332,402 | ) |
| Tax withholdings related to net stock settlements | | — |
| | — |
| | (440,312 | ) | | (4 | ) | | — |
| | (3,538 | ) | | — |
| | (3,542 | ) |
| Repurchase of common shares | | — |
| | — |
| | (35,839,965 | ) | | (358 | ) | | — |
| | (282,731 | ) | | — |
| | (283,089 | ) |
| Stock-based compensation, net | | — |
| | — |
| | 1,524,426 |
| | 15 |
| | 16,545 |
| | (837 | ) | | — |
| | 15,723 |
|
| Balances, December 31, 2017 | | 6,900,000 |
| | $ | 166,193 |
| | 448,868,269 |
| | $ | 4,489 |
| | $ | 5,193,631 |
| | $ | (2,044,704 | ) | | $ | — |
| | $ | 3,319,609 |
|
See accompanying notes.
SPIRIT REALTY CAPITAL, INC.
Consolidated Statements of Cash Flows
(In Thousands)
|
| | | | | | | | | | | | |
| | | Years Ended December 31, |
| | | 2017 | | 2016 | | 2015 |
| Operating activities | | | | | | |
| Net Income | | $ | 77,148 |
| | $ | 97,446 |
| | $ | 93,212 |
|
| Adjustments to reconcile net income to net cash provided by operating activities: | | | | | | |
| Depreciation and amortization | | 256,019 |
| | 262,276 |
| | 260,633 |
|
| Impairments | | 102,330 |
| | 88,275 |
| | 70,729 |
|
| Amortization of deferred financing costs | | 9,896 |
| | 9,070 |
| | 7,937 |
|
| Payments to terminate interest rate swap | | — |
| | (1,724 | ) | | — |
|
| Derivative net settlements, amortization and terminations | | — |
| | 1,811 |
| | (132 | ) |
| Amortization of debt discounts | | 13,572 |
| | 6,217 |
| | 2,322 |
|
| Stock-based compensation expense | | 16,560 |
| | 9,570 |
| | 13,321 |
|
| Loss (gain) on debt extinguishment | | 1,645 |
| | (233 | ) | | 3,162 |
|
| Debt extinguishment costs | | (3,305 | ) | | (26,219 | ) | | (8,112 | ) |
| Gains on dispositions of real estate and other assets | | (65,106 | ) | | (52,365 | ) | | (69,011 | ) |
| Non-cash revenue | | (28,439 | ) | | (26,333 | ) | | (20,930 | ) |
| Bad debt expense and other | | 5,913 |
| | (594 | ) | | 151 |
|
| Changes in operating assets and liabilities: | | | | | | |
| Deferred costs and other assets, net | | (1,418 | ) | | (6,561 | ) | | (604 | ) |
| Accounts payable, accrued expenses and other liabilities | | 1,578 |
| | 6,308 |
| | 13,382 |
|
| Accrued restructuring charges | | — |
| | (5,535 | ) | | 5,926 |
|
| Net cash provided by operating activities | | 386,393 |
| | 361,409 |
| | 371,986 |
|
| Investing activities | | | | | | |
| Acquisitions of real estate | | (279,934 | ) | | (655,835 | ) | | (875,983 | ) |
| Capitalized real estate expenditures | | (46,100 | ) | | (27,078 | ) | | (10,269 | ) |
| Investments in loans receivable | | (4,995 | ) | | (5,073 | ) | | (4,020 | ) |
| Collections of principal on loans receivable and real estate assets under direct financing leases | | 12,769 |
| | 8,410 |
| | 6,822 |
|
| Proceeds from dispositions of real estate and other assets | | 472,496 |
| | 524,776 |
| | 496,646 |
|
| Transfers of net sales proceeds from (to) restricted accounts pursuant to 1031 Exchanges | | — |
| | 39,869 |
| | (39,869 | ) |
| Transfers of net sales proceeds (to) from Master Trust Release | | (71,294 | ) | | (2,320 | ) | | 40,977 |
|
| Net cash provided by (used in) investing activities | | 82,942 |
| | (117,251 | ) | | (385,696 | ) |
SPIRIT REALTY CAPITAL, INC.
Consolidated Statements of Cash Flows
(In Thousands)
|
| | | | | | | | | | | | |
| | | Years Ended December 31, |
| | | 2017 | | 2016 | | 2015 |
| Financing activities | | | | | | |
| Borrowings under Revolving Credit Facilities | | 940,200 |
| | 1,080,000 |
| | 798,000 |
|
| Repayments under Revolving Credit Facilities | | (914,200 | ) | | (994,000 | ) | | (813,181 | ) |
| Borrowings under mortgages and notes payable | | 618,603 |
| | — |
| | — |
|
| Repayments under mortgages and notes payable | | (221,310 | ) | | (863,836 | ) | | (512,486 | ) |
| Borrowings under Term Loan | | — |
| | 796,000 |
| | 325,000 |
|
| Repayments under Term Loan | | (420,000 | ) | | (701,000 | ) | | — |
|
| Borrowings under Senior Unsecured Notes | | — |
| | 298,134 |
| | — |
|
| Deferred financing costs | | (8,255 | ) | | (4,352 | ) | | (6,150 | ) |
| Proceeds from issuance of common stock, net of offering costs | | — |
| | 446,613 |
| | 347,211 |
|
| Proceeds from issuance of preferred stock, net of offering costs | | 166,193 |
| | — |
| | — |
|
| Repurchase of shares of common stock | | (286,631 | ) | | (753 | ) | | (4,272 | ) |
| Proceeds from exercise of stock options | | — |
| | — |
| | 46 |
|
| Preferred stock dividends paid | | (2,530 | ) | | — |
| | — |
|
| Common stock dividends paid | | (339,174 | ) | | (323,640 | ) | | (292,262 | ) |
| Transfers (from) to reserve/escrow deposits with lenders, net | | (3,492 | ) | | 10,945 |
| | 17,413 |
|
| Net cash used in financing activities | | (470,596 | ) | | (255,889 | ) | | (140,681 | ) |
| Net decrease in cash and cash equivalents | | (1,261 | ) | | (11,731 | ) | | (154,391 | ) |
| Cash and cash equivalents, beginning of year | | 10,059 |
| | 21,790 |
| | 176,181 |
|
| Cash and cash equivalents, end of year | | $ | 8,798 |
| | $ | 10,059 |
| | $ | 21,790 |
|
See accompanying notes.
SPIRIT REALTY, L.P.
Consolidated Balance Sheets
(In Thousands, Except Unit and Per Unit Data)
|
| | | | | | | |
| | December 31,
2017 | | December 31,
2016 |
| Assets | | | |
| Investments: | | | |
| Real estate investments: | | | |
| Land and improvements | $ | 2,588,930 |
| | $ | 2,704,010 |
|
| Buildings and improvements | 4,692,377 |
| | 4,775,221 |
|
| Total real estate investments | 7,281,307 |
| | 7,479,231 |
|
| Less: accumulated depreciation | (1,075,643 | ) | | (940,005 | ) |
| | 6,205,664 |
| | 6,539,226 |
|
| Loans receivable, net | 79,967 |
| | 66,578 |
|
| Intangible lease assets, net | 409,903 |
| | 470,276 |
|
| Real estate assets under direct financing leases, net | 24,865 |
| | 36,005 |
|
| Real estate assets held for sale, net | 48,929 |
| | 160,570 |
|
| Net investments | 6,769,328 |
| | 7,272,655 |
|
| Cash and cash equivalents | 8,798 |
| | 10,059 |
|
| Deferred costs and other assets, net | 231,045 |
| | 140,917 |
|
| Goodwill | 254,340 |
| | 254,340 |
|
| Total assets | $ | 7,263,511 |
| | $ | 7,677,971 |
|
| Liabilities and stockholders’ equity | | | |
| Liabilities: | | | |
| Revolving Credit Facility | $ | 112,000 |
| | $ | 86,000 |
|
| Term Loan, net | — |
| | 418,471 |
|
| Senior Unsecured Notes, net | 295,321 |
| | 295,112 |
|
| Mortgages and notes payable, net | 2,516,478 |
| | 2,162,403 |
|
| Notes payable to Spirit Realty Capital, Inc., net | 715,881 |
| | 702,642 |
|
| Total debt, net | 3,639,680 |
| | 3,664,628 |
|
| Intangible lease liabilities, net | 155,303 |
| | 182,320 |
|
| Accounts payable, accrued expenses and other liabilities | 148,919 |
| | 148,915 |
|
| Total liabilities | 3,943,902 |
| | 3,995,863 |
|
| Commitments and contingencies (see Note 8) |
|
| |
|
|
| Partners' Capital | | | |
| Partnership units | | | |
| General partner's common capital, 3,988,218 units issued and outstanding as of both December 31, 2017 and December 31, 2016 | 24,426 |
| | 26,586 |
|
| Limited partners' preferred capital: 6,900,000 and no units issued and outstanding as of December 31, 2017 and December 31, 2016, respectively | 166,193 |
| | — |
|
| Limited partners' common capital, 444,880,051 and 479,635,902 units issued and outstanding as of December 31, 2017 and December 31, 2016, respectively | 3,128,990 |
| | 3,655,522 |
|
| Total partners' capital | 3,319,609 |
| | 3,682,108 |
|
| Total liabilities and partners' capital | $ | 7,263,511 |
| | $ | 7,677,971 |
|
See accompanying notes.
SPIRIT REALTY, L.P.
Consolidated Statements of Operations
(In Thousands, Except Unit and Per Unit Data)
|
| | | | | | | | | | | | |
| | | Years Ended December 31, |
| | | 2017 | | 2016 | | 2015 |
| Revenues: | | | | | | |
| Rentals | | $ | 639,017 |
| | $ | 648,363 |
| | $ | 634,151 |
|
| Interest income on loans receivable | | 3,791 |
| | 5,253 |
| | 6,948 |
|
| Earned income from direct financing leases | | 2,078 |
| | 2,742 |
| | 3,024 |
|
| Tenant reimbursement income | | 16,747 |
| | 14,125 |
| | 15,952 |
|
| Other income | | 7,322 |
| | 15,491 |
| | 7,260 |
|
| Total revenues | | 668,955 |
| | 685,974 |
| | 667,335 |
|
| Expenses: | | | | | | |
| General and administrative | | 62,064 |
| | 52,615 |
| | 47,730 |
|
| Restructuring charges | | — |
| | 6,341 |
| | 7,056 |
|
| Transaction costs | | 6,361 |
| | — |
| | — |
|
| Property costs (including reimbursable) | | 36,617 |
| | 30,839 |
| | 27,715 |
|
| Real estate acquisition costs | | 1,356 |
| | 3,229 |
| | 2,739 |
|
| Interest | | 190,127 |
| | 196,586 |
| | 222,901 |
|
| Depreciation and amortization | | 256,019 |
| | 262,276 |
| | 260,633 |
|
| Impairments | | 102,330 |
| | 88,275 |
| | 70,695 |
|
| Total expenses | | 654,874 |
| | 640,161 |
| | 639,469 |
|
| Income from continuing operations before other (expense) income and income tax expense | | 14,081 |
| | 45,813 |
| | 27,866 |
|
| Other (expense) income: | | | | | | |
| (Loss) gain on debt extinguishment | | (1,645 | ) | | 233 |
| | (3,162 | ) |
| Total other (expense) income | | (1,645 | ) | | 233 |
| | (3,162 | ) |
| Income from continuing operations before income tax expense | | 12,436 |
| | 46,046 |
| | 24,704 |
|
| Income tax expense | | (394 | ) | | (965 | ) | | (601 | ) |
| Income from continuing operations | | 12,042 |
| | 45,081 |
| | 24,103 |
|
| Discontinued operations: | | | | | | |
| Income from discontinued operations | | — |
| | — |
| | 98 |
|
| Gain on disposition of assets | | — |
| | — |
| | 590 |
|
| Income from discontinued operations | | — |
| | — |
| | 688 |
|
| Income before gain on disposition of assets | | 12,042 |
| | 45,081 |
| | 24,791 |
|
| Gain on disposition of assets | | 65,106 |
| | 52,365 |
| | 68,421 |
|
| Net income | | $ | 77,148 |
| | $ | 97,446 |
| | $ | 93,212 |
|
| Preferred distributions | | (2,530 | ) | | — |
| | — |
|
| Net income after preferred distributions | | 74,618 |
| | 97,446 |
| | 93,212 |
|
| | | | | | | |
| Net income attributable to general partners | | 657 |
| | 825 |
| | 855 |
|
| Net income attributable to limited partners | | 76,491 |
| | 96,621 |
| | 92,357 |
|
| | | | | | | |
| Net income per common partnership unit - basic | | $ | 0.16 |
| | $ | 0.21 |
| | $ | 0.21 |
|
| | | | | | | |
| Net income per common partnership unit —diluted | | $ | 0.16 |
| | $ | 0.21 |
| | $ | 0.21 |
|
| Weighted average common partnership units outstanding: | | | | | | |
| Basic | | 467,934,945 |
| | 469,217,776 |
| | 432,222,953 |
|
| Diluted | | 467,942,788 |
| | 469,246,265 |
| | 432,545,625 |
|
See accompanying notes.
SPIRIT REALTY, L.P.
Consolidated Statements of Comprehensive Income
(In Thousands)
|
| | | | | | | | | | | |
| | Years Ended December 31, |
| | 2017 | | 2016 | | 2015 |
| Net income | $ | 77,148 |
| | $ | 97,446 |
| | $ | 93,212 |
|
| Other comprehensive income: | | | | | |
| Change in net unrealized losses on cash flow hedges | — |
| | (1,137 | ) | | (1,190 | ) |
| Net cash flow hedge losses reclassified to operations | — |
| | 2,165 |
| | 1,245 |
|
| Total comprehensive income | $ | 77,148 |
| | $ | 98,474 |
| | $ | 93,267 |
|
See accompanying notes.
SPIRIT REALTY, L.P.
Consolidated Statements of Partners' Capital
(In Thousands, Except Unit Data)
|
| | | | | | | | | | | | | | | | | | | | | | | | | |
| | Preferred Units | | Common Units | | Total Partnership Capital |
| | | Limited Partners' Capital (2) | | General Partner's Capital (1) | | Limited Partners' Capital (2) | |
| | | Units | | Amount | | Units | | Amount | | Units | | Amount | |
| Balances, December 31, 2014 | | — |
| | $ | — |
| | 3,988,218 |
| | $ | 30,456 |
| | 407,362,222 |
| | $ | 3,281,206 |
| | $ | 3,311,662 |
|
| Net income | | — |
| | — |
| | — |
| | 855 |
| | — |
| | 92,357 |
| | 93,212 |
|
| Other comprehensive income | | — |
| | — |
| | — |
| | 1 |
| | — |
| | 54 |
| | 55 |
|
| Partnership distributions declared | | — |
| | — |
| | — |
| | (2,738 | ) | | — |
| | (295,793 | ) | | (298,531 | ) |
| Tax withholdings related to net settlement of partnership units | | — |
| | — |
| | — |
| | — |
| | (426,158 | ) | | (4,272 | ) | | (4,272 | ) |
| Issuance of partnership units, net | | — |
| | — |
| | — |
| | — |
| | 29,610,100 |
| | 347,211 |
| | 347,211 |
|
| Exercise of partnership units | | — |
| | — |
| | — |
| | — |
| | 5,000 |
| | 46 |
| | 46 |
|
| Stock-based compensation, net | | — |
| | — |
| | — |
| | — |
| | 1,280,582 |
| | 12,491 |
| | 12,491 |
|
| Balances, December 31, 2015 | | — |
| | $ | — |
| | 3,988,218 |
| | $ | 28,574 |
| | 437,831,746 |
| | $ | 3,433,300 |
| | $ | 3,461,874 |
|
| Net income | | — |
| | — |
| | — |
| | 825 |
| | — |
| | 96,621 |
| | 97,446 |
|
| Other comprehensive income | | — |
| | — |
| | — |
| | 9 |
| | — |
| | 1,019 |
| | 1,028 |
|
| Partnership distributions declared | | — |
| | — |
| | — |
| | (2,822 | ) | | — |
| | (330,358 | ) | | (333,180 | ) |
| Tax withholdings related to net settlement of partnership units | | — |
| | — |
| | — |
| | — |
| | (72,835 | ) | | (753 | ) | | (753 | ) |
| Issuance of partnership units, net | | — |
| | — |
| | — |
| | — |
| | 40,835,360 |
| | 446,613 |
| | 446,613 |
|
| Stock-based compensation, net | | — |
| | — |
| | — |
| | — |
| | 1,041,631 |
| | 9,080 |
| | 9,080 |
|
| Balances, December 31, 2016 | | — |
| | $ | — |
| | 3,988,218 |
| | $ | 26,586 |
| | 479,635,902 |
| | $ | 3,655,522 |
| | $ | 3,682,108 |
|
| Net income | | — |
| | — |
| | — |
| | $ | 657 |
| | — |
| | $ | 76,491 |
| | $ | 77,148 |
|
| Partnership distributions declared on preferred units | | — |
| | — |
| | — |
| | — |
| | — |
| | (2,530 | ) | | (2,530 | ) |
| Net income after preferred distributions | | | | — |
| | | | 657 |
| | — |
| | 73,961 |
| | 74,618 |
|
| Issuance of preferred partnership units | | 6,900,000 |
| | 166,193 |
| | — |
| | — |
| | — |
| | — |
| | 166,193 |
|
| Partnership distributions declared on common units | | — |
| | — |
| | — |
| | (2,817 | ) | | — |
| | (329,585 | ) | | (332,402 | ) |
| Tax withholdings related to net partnership unit settlements | | — |
| | — |
| | — |
| | — |
| | (440,312 | ) | | (3,542 | ) | | (3,542 | ) |
| Repurchase of partnership units | | — |
| | — |
| | — |
| | — |
| | (35,839,965 | ) | | (283,089 | ) | | (283,089 | ) |
| Stock-based compensation | | — |
| | — |
| | — |
| | — |
| | 1,524,426 |
| | 15,723 |
| | 15,723 |
|
| Balances, December 31, 2017 | | 6,900,000 |
| | $ | 166,193 |
| | 3,988,218 |
| | $ | 24,426 |
| | 444,880,051 |
| | $ | 3,128,990 |
| | $ | 3,319,609 |
|
(1) Consists of general partnership interests held by Spirit General OP Holdings, LLC.
(2) Consists of limited partnership interests held by Spirit Realty Capital, Inc. and Spirit Notes Partner, LLC.
See accompanying notes.
SPIRIT REALTY, L.P.
Consolidated Statements of Cash Flows
(In Thousands)
|
| | | | | | | | | | | |
| | Years Ended December 31, |
| | 2017 | | 2016 | | 2015 |
| Operating activities | | | | | |
| Net Income | $ | 77,148 |
| | $ | 97,446 |
| | $ | 93,212 |
|
| Adjustments to reconcile net income to net cash provided by operating activities: | | | | | |
| Depreciation and amortization | 256,019 |
| | 262,276 |
| | 260,633 |
|
| Impairments | 102,330 |
| | 88,275 |
| | 70,729 |
|
| Amortization of deferred financing costs | 9,896 |
| | 9,070 |
| | 7,937 |
|
| Payments to terminate interest rate swap | — |
| | (1,724 | ) | | — |
|
| Derivative net settlements, amortization and terminations | — |
| | 1,811 |
| | (132 | ) |
| Amortization of debt discounts | 13,572 |
| | 6,217 |
| | 2,322 |
|
| Stock-based compensation expense | 16,560 |
| | 9,570 |
| | 13,321 |
|
| Loss (gain) on debt extinguishment | 1,645 |
| | (233 | ) | | 3,162 |
|
| Debt extinguishment costs | (3,305 | ) | | (26,219 | ) | | (8,112 | ) |
| Gains on dispositions of real estate and other assets | (65,106 | ) | | (52,365 | ) | | (69,011 | ) |
| Non-cash revenue | (28,439 | ) | | (26,333 | ) | | (20,930 | ) |
| Bad debt expense and other | 5,913 |
| | (594 | ) | | 151 |
|
| Changes in operating assets and liabilities: | | | | | |
| Deferred costs and other assets, net | (1,418 | ) | | (6,561 | ) | | (604 | ) |
| Accounts payable, accrued expenses and other liabilities | 1,578 |
| | 6,308 |
| | 13,382 |
|
| Accrued restructuring charges | — |
| | (5,535 | ) | | 5,926 |
|
| Net cash provided by operating activities | 386,393 |
| | 361,409 |
| | 371,986 |
|
| Investing activities | | | | | |
| Acquisitions of real estate | (279,934 | ) | | (655,835 | ) | | (875,983 | ) |
| Capitalized real estate expenditures | (46,100 | ) | | (27,078 | ) | | (10,269 | ) |
| Investments in loans receivable | (4,995 | ) | | (5,073 | ) | | (4,020 | ) |
| Collections of principal on loans receivable and real estate assets under direct financing leases | 12,769 |
| | 8,410 |
| | 6,822 |
|
| Proceeds from dispositions of real estate and other assets | 472,496 |
| | 524,776 |
| | 496,646 |
|
| Transfers of net sales proceeds from (to) restricted accounts pursuant to 1031 Exchanges | — |
| | 39,869 |
| | (39,869 | ) |
| Transfers of net sales proceeds (to) from Master Trust Release | (71,294 | ) | | (2,320 | ) | | 40,977 |
|
| Net cash provided by (used in) investing activities | 82,942 |
| | (117,251 | ) | | (385,696 | ) |
|
| | | | | | | | | | | |
| | Years Ended December 31, |
| | 2017 | | 2016 | | 2015 |
| Financing activities |
|
| |
|
| |
|
|
| Borrowings under Revolving Credit Facilities | 940,200 |
| | 1,080,000 |
| | 798,000 |
|
| Repayments under Revolving Credit Facilities | (914,200 | ) | | (994,000 | ) | | (813,181 | ) |
| Borrowings under mortgages and notes payable | 618,603 |
| | — |
| | — |
|
| Repayments under mortgages and notes payable | (221,310 | ) | | (863,836 | ) | | (512,486 | ) |
| Borrowings under Term Loan | — |
| | 796,000 |
| | 325,000 |
|
| Repayments under Term Loan | (420,000 | ) | | (701,000 | ) | | — |
|
| Borrowings under Senior Unsecured Notes | — |
| | 298,134 |
| | — |
|
| Deferred financing costs | (8,255 | ) | | (4,352 | ) | | (6,150 | ) |
| Proceeds from issuance of common stock, net of offering costs | — |
| | 446,613 |
| | 347,211 |
|
| Proceeds from issuance of preferred stock, net of offering costs | 166,193 |
| | — |
| | — |
|
| Repurchase of partnership units | (286,631 | ) | | (753 | ) | | (4,272 | ) |
| Proceeds from exercise of partnership units | — |
| | — |
| | 46 |
|
| Preferred distributions paid | (2,530 | ) | | — |
| | — |
|
| Common distributions paid | (339,174 | ) | | (323,640 | ) | | (292,262 | ) |
| Transfers (from) to reserve/escrow deposits with lenders, net | (3,492 | ) | | 10,945 |
| | 17,413 |
|
| Net cash used in financing activities | (470,596 | ) | | (255,889 | ) | | (140,681 | ) |
| Net decrease in cash and cash equivalents | (1,261 | ) | | (11,731 | ) | | (154,391 | ) |
| Cash and cash equivalents, beginning of year | 10,059 |
| | 21,790 |
| | 176,181 |
|
| Cash and cash equivalents, end of year | $ | 8,798 |
| | $ | 10,059 |
| | $ | 21,790 |
|
SPIRIT REALTY CAPITAL, INC. and SPIRIT REALTY, L.P.
Notes to Consolidated Financial Statements
December 31, 2017
Note 1. Organization
Organization and Operations
Spirit Realty Capital, Inc. (the "Corporation" or, with its consolidated subsidiaries, the "Company") operates as a self-administered and self-managed REIT that seeks to generate and deliver sustainable and attractive returns for stockholders by investing primarily in and managing a portfolio of single-tenant, operationally essential real estate throughout the U.S. that is generally leased on a long-term, triple-net basis to tenants operating within predominantly retail, but also office and industrial property types. Single tenant, operationally essential real estate generally refers to free-standing, commercial real estate facilities where tenants conduct activities that are essential to the generation of their sales and profits.The Company began operations through a predecessor legal entity in 2003.
The Company’s operations are generally carried out through Spirit Realty, L.P. (the "Operating Partnership") and its subsidiaries. Spirit General OP Holdings, LLC ("OP Holdings"), one of the Corporation's wholly-owned subsidiaries, is the sole general partner and owns approximately 1% of the Operating Partnership. The Corporation and a wholly-owned subsidiary ("Spirit Notes Partner, LLC") are the only limited partners and together own the remaining 99% of the Operating Partnership.
On August 3, 2017, the Company announced a proposed Spin-Off of almost all of its interests in properties leased to Shopko, assets that collateralize Master Trust 2014 and other additional assets into an independent, publicly traded REIT, Spirit MTA REIT, or SMTA. Transaction costs associated with the spin off for the year ended December 31, 2017 totaled $6.4 million, and are included within transaction costs on the accompanying consolidated statements of operations.
Note 2. Summary of Significant Accounting Policies
Basis of Accounting and Principles of Consolidation
The accompanying consolidated financial statements of the Company and the Operating Partnership have been prepared on the accrual basis of accounting, in accordance with GAAP. The consolidated financial statements of the Company include the accounts of the Corporation and its wholly-owned subsidiaries. The consolidated financial statements of the Operating Partnership include the accounts of the Operating Partnership and its wholly-owned subsidiaries. All significant intercompany balances and transactions have been eliminated in consolidation.
All expenses incurred by the Company have been allocated to the Operating Partnership in accordance with the Operating Partnership's first amended and restated agreement of limited partnership, which management determined to be a reasonable method of allocation. Therefore, expenses incurred would not be materially different if the Operating Partnership had operated as an unaffiliated entity.
The Company has formed numerous special purpose entities to acquire and hold real estate encumbered by indebtedness (see Note 4). Each special purpose entity is a separate legal entity and is the sole owner of its assets and responsible for its liabilities. The assets of these special purpose entities are not available to pay, or otherwise satisfy obligations to, the creditors of any affiliate or owner of another entity unless the special purpose entities have expressly agreed and are permitted under their governing documents. As of December 31, 2017 and 2016, net assets totaling $2.78 billion and $2.95 billion, respectively, were held, and net liabilities totaling $2.63 billion and $2.26 billion, respectively, were owed by these encumbered special purpose entities and are included in the accompanying consolidated balance sheets.
Use of Estimates
The preparation of financial statements in conformity with GAAP requires management to make estimates and assumptions that affect the reported amounts of assets and liabilities at the date of the financial statements and the reported amounts of revenues and expenses during the reporting period. Although management believes its estimates are reasonable, actual results could differ from those estimates.
SPIRIT REALTY CAPITAL, INC. and SPIRIT REALTY, L.P.
Notes to Consolidated Financial Statements - (continued)
December 31, 2017
Segment Reporting
The Company views its operations as one segment, which consists of net leasing operations. The Company has no other reportable segments.
Real Estate Investments
Carrying Value of Real Estate Investments
The Company’s real estate properties are recorded at cost and depreciated using the straight-line method over the estimated remaining useful lives of the properties, which generally range from 20 to 50 years for buildings and improvements and from 5 to 20 years for land improvements. Portfolio assets classified as “held for sale” are not depreciated. Properties classified as “held for sale” are recorded at the lower of their carrying value or their fair value, less anticipated selling costs.
Purchase Accounting and Acquisition of Real Estate
When acquiring a property, the purchase price (including acquisition and closing costs) is allocated to land, building, improvements and equipment based on their relative fair values. For properties acquired with in-place leases, the purchase price of real estate is allocated to the tangible and intangible assets and liabilities acquired based on their estimated fair values. In making estimates of fair values for this purpose, a number of sources are used, including independent appraisals and information obtained about each property as a result of pre-acquisition due diligence and marketing and leasing activities.
Lease Intangibles
Lease intangibles, if any, acquired in conjunction with the purchase of real estate represent the value of in-place leases and above or below-market leases. For real estate acquired subject to existing lease agreements, in-place lease intangibles are valued based on the Company’s estimate of costs related to acquiring a tenant and the carrying costs that would be incurred during the time it would take to locate a tenant if the property were vacant, considering current market conditions and costs to execute similar leases at the time of the acquisition. Above and below-market lease intangibles are recorded based on the present value of the difference between the contractual amounts to be paid pursuant to the leases at the time of acquisition of the real estate and the Company’s estimate of current market lease rates for the property, measured over a period equal to the remaining initial term of the lease.
In-place lease intangibles are amortized on a straight-line basis over the remaining initial term of the related lease and included in depreciation and amortization expense. Above-market lease intangibles are amortized over the remaining initial terms of the respective leases as a decrease in rental revenue. Below market lease intangibles are amortized as an increase to rental revenue over the remaining initial term of the respective leases, but may be amortized over the renewal periods if the Company believes it is likely the tenant will exercise the renewal option. If the Company believes it is likely a lease will terminate early, the unamortized portion of any related lease intangible is immediately recognized in impairment loss in the Company’s consolidated statements of operations.
Investment in Direct Financing Leases
For real estate property leases classified as direct financing leases, the building portion of the lease is accounted for as a direct financing lease, while the land portion is accounted for as operating leases when certain criteria are met. For direct financing leases, the Company records an asset which represents the net investment that is determined by using the aggregate of the total amount of future minimum lease payments, the estimated residual value of the leased property and deferred incremental direct costs less unearned income. Income is recognized over the life of the lease to approximate a level rate of return on the net investment. Residual values, which are reviewed annually, represent the estimated amount the Company expects to receive at lease termination from the disposition of the leased property. Actual residual values realized could differ from these estimates. The Company evaluates the collectability of future minimum lease payments on each direct financing lease primarily through the evaluation of payment history and the underlying creditworthiness of the tenant. There were no amounts past due as of December 31, 2017 and 2016. The Company’s direct financing leases are evaluated individually for the purpose of determining if an allowance is needed. Any write-down of an estimated residual value is recognized as an impairment loss in the current period and earned
SPIRIT REALTY CAPITAL, INC. and SPIRIT REALTY, L.P.
Notes to Consolidated Financial Statements - (continued)
December 31, 2017
income adjusted prospectively. The Company's direct financing leases were acquired in connection with the Merger. There were no impairment losses on direct financing leases during the years ended December 31, 2017 and 2016. There were $4.8 million in impairment losses related to two direct financing leases during the year ended December 31, 2015.
Impairment
The Company reviews its real estate investments and related lease intangibles periodically for impairment whenever events or changes in circumstances indicate that the carrying amount may not be recoverable. The Company considers factors such as expected future undiscounted cash flows, estimated residual value, market trends (such as the effects of leasing demand and competition) and other factors in making this assessment. An asset is considered impaired if its carrying value exceeds its estimated undiscounted cash flows and the impairment is calculated as the amount by which the carrying value of the asset exceeds its estimated fair value. Estimating future cash flows and fair values are highly subjective and such estimates could differ materially from actual results. Key assumptions used in estimating future cash flows and fair values include, but are not limited to, revenue growth rates, interest rates, discount rates, capitalization rates, lease renewal probabilities, tenant vacancy rates and other factors.
Revenue Recognition
The Company primarily leases real estate to its tenants under long-term, triple-net leases that are classified as operating leases. Lease origination fees are deferred and amortized over the related lease term as an adjustment to rental revenue. Under a triple-net lease, the tenant is typically responsible for all improvements and is contractually obligated to pay all property operating expenses, such as real estate taxes, insurance premiums and repair and maintenance costs. Under certain leases, tenant reimbursement revenue, which is comprised of additional amounts recoverable from tenants for common area maintenance expenses and certain other recoverable expenses, is recognized as revenue in the period in which the related expenses are incurred. Tenant reimbursements are recorded on a gross basis in instances when our tenants reimburse us for property costs which we incur.Tenant receivables are carried net of the allowances for uncollectible amounts.
The Company’s leases generally provide for rent escalations throughout the lease terms. For leases that provide for specific contractual escalations, rental revenue is recognized on a straight-line basis so as to produce a constant periodic rent over the term of the lease. Accordingly, accrued rental revenue, calculated as the aggregate difference between the rental revenue recognized on a straight-line basis and scheduled rents, represents unbilled rent receivables that the Company will receive only if the tenants make all rent payments required through the expiration of the initial term of the leases. The accrued rental revenue representing this straight-line adjustment is subject to an evaluation for collectability, and the Company records a provision for losses against rental revenues if collectability of these future rents is not reasonably assured. Leases that have contingent rent escalators indexed to future increases in the CPI may adjust over a one-year period or over multiple-year periods. Generally, these escalators increase rent at the lesser of (a) 1 to 2 times CPI over a specified period, (b) a fixed percentage, or (c) a fixed schedule. Because of the volatility and uncertainty with respect to future changes in the CPI, the Company’s inability to determine the extent to which any specific future change in the CPI is probable at each rent adjustment date during the entire term of these leases and the Company’s view that the multiplier does not represent a significant leverage factor, rental revenue from leases with this type of escalator are recognized only after the changes in the rental rates have occurred.
Some of the Company’s leases also provide for contingent rent based on a percentage of the tenant’s gross sales. For contingent rentals that are based on a percentage of the tenant’s gross sales, the Company recognizes contingent rental revenue when the change in the factor on which the contingent lease payment is based actually occurs.
The Company suspends revenue recognition if the collectability of amounts due pursuant to a lease is not reasonably assured or if the tenant’s monthly lease payments become more than 60 days past due, whichever is earlier.
Lease termination fees are included in other income on the Company’s consolidated statements of operations and are recognized when there is a signed termination agreement and all of the conditions of the agreement have been met. The Company recorded lease termination fees of $5.0 million, $7.3 million and $5.8 million during the years ended December 31, 2017, 2016 and 2015, respectively.
SPIRIT REALTY CAPITAL, INC. and SPIRIT REALTY, L.P.
Notes to Consolidated Financial Statements - (continued)
December 31, 2017
Goodwill
Goodwill arises from business combinations and represents the excess of the cost of an acquired entity over the net fair value amounts that were assigned to the identifiable assets acquired and the liabilities assumed. Goodwill is tested for impairment at the reporting unit level on an annual basis and between annual tests if an event occurs or circumstances change that would more likely than not reduce the fair value of the reporting unit below its carrying value. The Company did not record any impairment on its existing goodwill for the years ended December 31, 2017, 2016 and 2015.
Prior to the Company's adoption of ASU 2017-01, Business Combinations (Topic 805): Clarifying the Definition of a Business, on January 1, 2017 on a prospective basis, when the Company disposed of a real estate asset that constituted a business under GAAP, a portion of goodwill was allocated to the carrying value of the real estate asset considered to be a business to determine the gain or loss on the disposal. The portion of goodwill allocated was derived from the proportionate fair value of the business to the fair value of the Company’s reporting unit. Goodwill related to real estate assets not previously classified as held for sale of $6.3 million and $12.7 million was written off during the years ended December 31, 2016 and 2015, respectively. Under the new guidance, the dispositions of properties generally no longer qualify as a disposition of a business and therefore no allocation of goodwill occurs when determining gain or loss on sale.
The following table presents a reconciliation of the Company’s goodwill from January 1, 2015 to December 31, 2017 (in thousands):
|
| | | |
| | Consolidated |
| Balance as of December 31, 2014 | $ | 285,848 |
|
| Goodwill allocated to dispositions of a business | (21,498 | ) |
| Balance as of December 31, 2015 | 264,350 |
|
| Goodwill allocated to dispositions of a business | (10,010 | ) |
| Balance as of December 31, 2016 | 254,340 |
|
| Goodwill allocated to dispositions of a business | — |
|
| Balance as of December 31, 2017 | $ | 254,340 |
|
Allowance for Doubtful Accounts
The Company reviews its rent and other tenant receivables for collectability on a regular basis, taking into consideration changes in factors such as the tenant’s payment history, the financial condition of the tenant, business conditions in the industry in which the tenant operates, and economic conditions in the area in which the tenant operates. In the event that the collectability of a receivable with respect to any tenant is in doubt, a provision for uncollectible amounts will be established or a direct write-off of the specific receivable will be made. The Company provided for reserves for uncollectible amounts totaling $12.4 million and $6.4 million at December 31, 2017 and 2016, respectively, against accounts receivable balances of $27.2 million and $25.3 million, respectively. Receivables are recorded within deferred cost and other assets, net in the accompanying consolidated balance sheets. Receivables are written off against the reserves for uncollectible amounts when all possible means of collection have been exhausted.
For deferred rental revenues related to the straight-line method of reporting rental revenue, the collectability review includes management’s estimates of amounts that will not be realized and an assessment of the risks inherent in the portfolio, giving consideration to historical experience. The Company established a reserve for losses of $1.8 million and $7.7 million at December 31, 2017 and 2016, respectively, against deferred rental revenue receivables of $81.6 million and $71.1 million, respectively. Deferred rental revenue receivables are recorded within deferred costs and other assets, net in the accompanying consolidated balance sheets.
Loans Receivable
Loans receivable consists of mortgage loans, net of premium, and notes receivables. Interest on loans receivable is recognized using the effective interest rate method.
SPIRIT REALTY CAPITAL, INC. and SPIRIT REALTY, L.P.
Notes to Consolidated Financial Statements - (continued)
December 31, 2017
Impairment and Allowance for Loan Losses
The Company periodically evaluates the collectability of its loans receivable, including accrued interest, by analyzing the underlying property-level economics and trends, collateral value and quality, and other relevant factors in determining the adequacy of its allowance for loan losses. A loan is determined to be impaired when, in management’s judgment based on current information and events, it is probable that the Company will be unable to collect all amounts due according to the contractual terms of the loan agreement. Specific allowances for loan losses are provided for impaired loans on an individual loan basis in the amount by which the carrying value exceeds the estimated fair value of the underlying collateral less disposition costs. Delinquent loans receivable are written off against the allowance when all possible means of collection have been exhausted. As of December 31, 2017, there was an allowance for loan losses on loans receivable of $0.4 million and a $0.5 million allowance for loan losses as of December 31, 2016.
A loan is placed on non-accrual status when the loan has become 60 days past due, or earlier if management determines that full recovery of the contractually specified payments of principal and interest is doubtful. While on non-accrual status, interest income is recognized only when received. Five mortgage loans were on non-accrual status with a balance of $1.5 million as of December 31, 2017, compared to none as of December 31, 2016. No notes receivable were on non-accrual status as of December 31, 2017, compared to one note receivable on non-accrual status with a balance of $0.5 million as of December 31, 2016.
Cash and Cash Equivalents
Cash and cash equivalents include cash and highly liquid investment securities with maturities at acquisition of three months or less. The Company invests cash primarily in money market funds of major financial institutions with fund investments consisting of highly-rated money market instruments and other short-term instruments.
Restricted Cash and Escrow Deposits
Restricted cash and deposits in escrow, classified within deferred costs and other assets, net in the accompanying consolidated balance sheets consisted of the following (in thousands): |
| | | | | | | |
| | December 31, 2017 | | December 31, 2016 |
Collateral deposits (1) | $ | 1,751 |
| | $ | 2,044 |
|
Tenant improvements, repairs, and leasing commissions (2) | 8,257 |
| | 9,739 |
|
Master Trust Release (3) | 85,703 |
| | 14,412 |
|
Liquidity reserve (4) | 5,503 |
| | — |
|
Other (5) | 4,695 |
| | 644 |
|
| | $ | 105,909 |
| | $ | 26,839 |
|
(1) Funds held in lender controlled accounts generally used to meet future debt service or certain property operating expenses. Balance changes are reflected in financing activities within the consolidated statements of cash flows.
(2) Deposits held as additional collateral support by lenders to fund improvements, repairs and leasing commissions incurred to secure a new tenant. Balance changes are reflected in financing activities within the consolidated statements of cash flows.
(3) Proceeds from the sale of assets pledged as collateral under the Spirit Master Funding Program, which are held on deposit until a qualifying substitution is made or the funds are applied as prepayment of principal. Balance changes are reflected in investing activities within the consolidated statements of cash flows.
(4) Liquidity reserve cash was placed on deposit in conjunction with issuance of additional series of notes under Master Trust 2014 in December 2017 and is held until there is a cashflow shortfall as defined in the Master Trust 2014 agreements or a liquidation of Master Trust 2014 occurs. Additionally, the liquidity reserve can be released upon achieving certain performance criteria. Balance changes are reflected in financing activities within the consolidated statements of cash flows.
(5) Funds held in lender controlled accounts released after scheduled debt service requirements are met. Balance changes are reflected in operating activities within the consolidated statements of cash flows.
SPIRIT REALTY CAPITAL, INC. and SPIRIT REALTY, L.P.
Notes to Consolidated Financial Statements - (continued)
December 31, 2017
Accounting for Derivative Financial Instruments and Hedging Activities
The Company utilizes derivative instruments such as interest rate swaps and caps for purposes of hedging exposures to fluctuations in interest rates associated with certain of its financing transactions. At the inception of a hedge transaction, the Company enters into a contractual arrangement with the hedge counterparty and formally documents the relationship between the derivative instrument and the financing transaction being hedged, as well as its risk management objective and strategy for undertaking the hedge transaction. At inception and at least quarterly thereafter, a formal assessment is performed to determine whether the derivative instrument has been highly effective in offsetting changes in cash flows of the related financing transaction and whether it is expected to be highly effective in the future.
The fair value of the derivative instrument is recorded on the balance sheet as either an asset or liability. For derivatives designated as cash flow hedges, the effective portions of the corresponding change in fair value of the derivatives are recorded in AOCL within stockholders’ equity and partners' capital. Changes in fair value reported in other comprehensive income (loss) are reclassified to operations in the period in which operations are affected by the underlying hedged transaction. Any ineffective portions of the change in fair value are recognized immediately in general and administrative expense. The amounts paid or received on the hedge are recognized as adjustments to interest expense (see Note 5).
Income Taxes
The Company has elected to be taxed as a REIT under the Code. As a REIT, the Company generally will not be subject to federal income tax provided it continues to satisfy certain tests concerning the Company’s sources of income, the nature of its assets, the amounts distributed to its stockholders, and the ownership of Company stock. Management believes the Company has qualified and will continue to qualify as a REIT and therefore, no provision has been made for federal income taxes in the accompanying consolidated financial statements. Even if the Company qualifies for taxation as a REIT, it may be subject to state and local income and franchise taxes, and to federal income tax and excise tax on its undistributed income. Taxable income from non-REIT activities managed through any of the Company’s taxable REIT subsidiaries is subject to federal, state, and local taxes, which are not material.
The Operating Partnership is a partnership for federal income tax purposes. Partnerships are pass-through entities and are not subject to U.S. federal income taxes, therefore no provision has been made for federal income taxes in the accompanying financial statements. Although most states and cities where the Operating Partnership operates follow the U.S. federal income tax treatment, there are certain jurisdictions such as Texas, Tennessee and Ohio that impose income or franchise taxes on a partnership.
Franchise taxes are included in general and administrative expenses on the accompanying consolidated statements of operations.
Earnings Per Share and Unit
The Company’s unvested restricted common stock, which contains non-forfeitable rights to receive dividends, are considered participating securities requiring the two-class method of computing earnings per share and unit. Under the two class method, earnings attributable to unvested restricted shares are deducted from income from continuing operations in the computation of net income attributable to common stockholders. Under the two-class method, earnings per common share are computed by dividing the sum of distributed earnings to common stockholders and undistributed earnings allocated to common stockholders by the weighted average number of common shares outstanding for the period. In applying the two-class method, undistributed earnings are allocated to both common shares and participating securities based on their respective weighted average shares outstanding during the period. Under the terms of the Amended Incentive Award Plan and the related restricted stock awards (see Note 13), losses are not allocated to participating securities including undistributed losses as a result of dividends declared exceeding net income. The Company uses income or loss from continuing operations as the basis for determining whether potential common shares are dilutive or anti-dilutive and undistributed net income or loss as the basis for determining whether undistributed earnings are allocable to participating securities.
SPIRIT REALTY CAPITAL, INC. and SPIRIT REALTY, L.P.
Notes to Consolidated Financial Statements - (continued)
December 31, 2017
Unaudited Interim Information
The consolidated quarterly financial data in Note 16 is unaudited. In the opinion of management, this financial information reflects all adjustments necessary for a fair presentation of the respective interim periods. All such adjustments are of a normal recurring nature.
New Accounting Pronouncements
In May 2014, the FASB issued ASU 2014-09, Revenue from Contracts with Customers: Topic 606. This new guidance establishes a principles-based approach for accounting for revenue from contracts with customers and is effective for annual reporting periods beginning after December 15, 2017, with early application permitted for annual reporting periods beginning after December 15, 2016. The Company plans to adopt the new revenue recognition standard effective January 1, 2018 under the modified retrospective method, and have elected to apply the standard only to contracts that are not completed as of the date of adoption (i.e. January 1, 2018). In evaluating the impact of this new standard, the Company identified that lease contracts covered by Topic 840, Leases, are excluded from the scope of this new guidance. As such, after the Company's evaluation of the new guidance, the Company has concluded that there will be no material impact of this ASU on its revenues, results of operations, financial position or disclosures.
In February 2016, the FASB issued ASU 2016-02, Leases (Topic 842), which supersedes the existing guidance for lease accounting Leases (Topic 840). ASU 2016-02 requires lessees to recognize leases on their balance sheets, and leaves lessor accounting largely unchanged. Leases pursuant to which the Company is the lessee primarily consist of its corporate office and equipment leases. The amendments in this ASU are effective for the fiscal years beginning after December 15, 2018 and interim periods within those fiscal years. Early application is permitted for all entities. ASU 2016-02 requires a modified restrospective approach for all leases existing at, or entered into after, the date of initial application, with an option to elect to use certain transition relief. Upon adoption, the Company will record certain expenses paid directly by its tenants that protect the Company's interests in its properties, such as insurance and real estate taxes, to property costs and the related tenant reimbursement income to revenue, with no impact on net income. The Company is currently evaluating the impact of this ASU on its consolidated financial statements.
In March 2016, the FASB issued ASU 2016-09, Improvements to Employee Share-Based Payment Accounting, which simplifies many aspects of accounting for share-based payment transactions under ASC Topic 718, Compensation - Stock Compensation, including income tax consequences, classification of awards as either equity or liability, forfeiture rate calculations and classification on the statement of cash flows. The Company adopted this new guidance effective January 1, 2017 and made an accounting policy election to recognize stock-based compensation forfeitures as they occur, whereas previously stock-based compensation forfeitures were estimated and recognized based on historical forfeiture rates. This change has been applied prospectively and had no material impact on the financial statements of the Company.
In June 2016, the FASB issued ASU 2016-13, Measurement of Credit Losses on Financial Instruments, which requires more timely recognition of credit losses associated with financial assets. ASU 2016-13 requires financial assets (or a group of financial assets) measured at an amortized cost basis to be presented at the net amount expected to be collected. ASU 2016-13 is effective for fiscal years beginning after December 15, 2019, including interim periods within those fiscal years. Early adoption is permitted for fiscal years beginning after December 15, 2018, including interim periods within those fiscal years. The Company is currently evaluating the impact of this ASU on its consolidated financial statements.
In August 2016, the FASB issued ASU 2016-15, Classification of Certain Cash Receipts and Cash Payments, which addresses specific cash flow issues with the objective of reducing the existing diversity in practice. ASU 2016-15 is effective for fiscal years beginning after December 15, 2017, including interim periods within those fiscal years, and requires retrospective adoption unless it is impracticable to apply, in which case it is to be applied prospectively as of the earliest date practicable. The Company plans to adopt ASU 2016-15 effective January 1, 2018 and has determined that this standard will result in debt prepayment and debt extinguishment costs being presented in the financing activities in the consolidated statement of cash flows. The Company currently does not expect there to be a material impact on its statement of cash flows for other types of transactions.
SPIRIT REALTY CAPITAL, INC. and SPIRIT REALTY, L.P.
Notes to Consolidated Financial Statements - (continued)
December 31, 2017
In November 2016, the FASB issued ASU 2016-18, Statement of Cash Flows (Topic 230): Restricted Cash. This guidance requires that a statement of cash flows explain the change during the period in the total of cash, cash equivalents, and restricted cash. As a result, restricted cash will be included with cash and cash equivalents when reconciling the beginning-of-period and end-of-period total amounts shown on the statement of cash flows. The new guidance is effective for fiscal years beginning after December 15, 2017, and interim periods within those fiscal years. Early adoption is permitted, and the new guidance is to be applied retrospectively. The Company currently plans to adopt ASU 2016-18 effective January 1, 2018 and does not expect the change in presentation to have a material impact on the consolidated financial statements.
In January 2017, the FASB issued ASU 2017-01, Business Combinations (Topic 805): Clarifying the Definition of a Business, which narrows the definition of a business. The Company early adopted the guidance effective January 1, 2017 and application is on a prospective basis. Under the new guidance, the acquisition of a property with an in-place lease generally is no longer accounted for as an acquisition of a business, but instead as an asset acquisition, meaning the transaction costs of such an acquisition are now capitalized instead of expensed. Further, dispositions of properties generally no longer qualify as a disposition of a business and therefore no allocation of goodwill occurs when determining gain or loss on sale.
Note 3. Investments
Real Estate Investments
As of December 31, 2017, the Company’s gross investment in real estate properties and loans totaled approximately $7.90 billion, representing investments in 2,480 properties, including 88 properties or other related assets securing mortgage loans. The gross investment is comprised of land, buildings, lease intangible assets and lease intangible liabilities, as adjusted for any impairment, and the carrying amount of loans receivable, real estate assets held under direct financing leases and real estate assets held for sale. The portfolio is geographically dispersed throughout 49 states with only one state, Texas, with a real estate investment of 12.2%, accounting for more than 10.0% of the total dollar amount of the Company’s real estate investment portfolio.
SPIRIT REALTY CAPITAL, INC. and SPIRIT REALTY, L.P.
Notes to Consolidated Financial Statements - (continued)
December 31, 2017
During the years ended December 31, 2017 and 2016, the Company had the following real estate and loan activity, net of accumulated depreciation and amortization:
|
| | | | | | | | | | | | | | | | | | | | |
| | Number of Properties | | Dollar Amount of Investments |
| | Owned | | Financed | | Total | | Owned | | Financed | | Total |
| | | | | | |
| | (In Thousands) |
| Gross balance, December 31, 2015 | 2,485 |
| | 144 |
| | 2,629 |
| | $ | 8,198,685 |
| | $ | 104,003 |
| | $ | 8,302,688 |
|
Acquisitions/improvements (1) | 269 |
| | — |
| | 269 |
| | 711,510 |
| | — |
| | 711,510 |
|
Dispositions of real estate (2)(3) | (213 | ) | | — |
| | (213 | ) | | (598,662 | ) | | — |
| | (598,662 | ) |
| Principal payments and payoffs | — |
| | (70 | ) | | (70 | ) | | — |
| | (34,955 | ) | | (34,955 | ) |
| Impairments | — |
| | — |
| | — |
| | (88,073 | ) | | (176 | ) | | (88,249 | ) |
| Write-off of gross lease intangibles | — |
| | — |
| | — |
| | (42,307 | ) | | — |
| | (42,307 | ) |
| Loan premium amortization and other | — |
| | — |
| | — |
| | (77 | ) | | (2,294 | ) | | (2,371 | ) |
| Gross balance, December 31, 2016 | 2,541 |
| | 74 |
| | 2,615 |
| | 8,181,076 |
| | 66,578 |
| | 8,247,654 |
|
Acquisitions/improvements (1) | 43 |
| | 16 |
| | 59 |
| | 326,766 |
| | 23,300 |
| | 350,066 |
|
Dispositions of real estate (2)(3) | (192 | ) | | — |
| | (192 | ) | | (510,863 | ) | | — |
| | (510,863 | ) |
| Principal payments and payoffs | — |
| | (2 | ) | | (2 | ) | | — |
| | (7,878 | ) | | (7,878 | ) |
| Impairments | — |
| | — |
| | — |
| | (101,941 | ) | | (389 | ) | | (102,330 | ) |
| Write-off of gross lease intangibles | — |
| | — |
| | — |
| | (67,139 | ) | | — |
| | (67,139 | ) |
| Loan premium amortization and other | — |
| | — |
| | — |
| | (4,841 | ) | | (1,644 | ) | | (6,485 | ) |
| Gross balance, December 31, 2017 | 2,392 |
| | 88 |
| | 2,480 |
| | $ | 7,823,058 |
| | $ | 79,967 |
| | $ | 7,903,025 |
|
| Accumulated depreciation and amortization | | | | | | | (1,289,304 | ) | | — |
| | (1,289,304 | ) |
| Other | | | | | | | 304 |
| | — |
| | 304 |
|
| Net balance, December 31, 2017 | | | | | | | $ | 6,534,058 |
| | $ | 79,967 |
| | $ | 6,614,025 |
|
| |
(1) | Includes investments of $42.6 million and $20.5 million, respectively, in revenue producing capitalized expenditures, as well as $3.5 million and $6.6 million, respectively, of non-revenue producing capitalized expenditures for the years ended December 31, 2017 and 2016. |
| |
(2) | The total accumulated depreciation and amortization associated with dispositions of real estate was $57.1 million and $126.4 million, respectively, for the years ended December 31, 2017 and 2016. |
| |
(3) | For the years ended December 31, 2017, 2016 and 2015 the total gain on disposal of assets for properties held in use and held for sale was $24.6 million and $40.5 million, $35.8 million and $16.6 million, and $34.5 million and $33.9 million, respectively. |
Scheduled minimum future contractual rent to be received under the remaining non-cancelable term of the operating leases (including realized rent increases occurring after January 1, 2018) are as follows (in thousands):
|
| | | |
| | December 31,
2017 |
| 2018 | $ | 599,194 |
|
| 2019 | 587,493 |
|
| 2020 | 570,820 |
|
| 2021 | 542,899 |
|
| 2022 | 507,936 |
|
| Thereafter | 3,637,342 |
|
| Total future minimum rentals | $ | 6,445,684 |
|
SPIRIT REALTY CAPITAL, INC. and SPIRIT REALTY, L.P.
Notes to Consolidated Financial Statements - (continued)
December 31, 2017
Because lease renewal periods are exercisable at the option of the lessee, the preceding table presents future minimum lease payments due during the initial lease term only. In addition, the future minimum rentals do not include any contingent rentals based on a percentage of the lessees’ gross sales or lease escalations based on future changes in the CPI or other stipulated reference rate.
Loans Receivable
The following table details loans receivable, net of premium and allowance for loan losses (in thousands):
|
| | | | | | | |
| | December 31,
2017 | | December 31,
2016 |
| Mortgage loans - principal | $ | 69,963 |
| | $ | 55,410 |
|
| Mortgage loans - premium, net of amortization | 5,038 |
| | 7,194 |
|
| Allowance for loan losses | (389 | ) | | — |
|
| Mortgages loans, net | 74,612 |
| | 62,604 |
|
| Other note receivables - principal | 5,355 |
| | 4,474 |
|
| Allowance for loan losses | — |
| | (500 | ) |
| Other note receivables | 5,355 |
| | 3,974 |
|
| Total loans receivable, net | $ | 79,967 |
| | $ | 66,578 |
|
As of December 31, 2017 and 2016, the Company held a total of 10 and 8, respectively, first-priority mortgage loans (representing loans to 6 and 4 borrowers, respectively). These mortgage loans are secured by single-tenant commercial properties and generally have fixed interest rates over the term of the loans. There are 3 other notes receivable, one $3.5 million note is secured by tenant assets and stock and the other two are unsecured.
Lease Intangibles, Net
The following table details lease intangible assets and liabilities, net of accumulated amortization (in thousands): |
| | | | | | | |
| | December 31,
2017 | | December 31,
2016 |
| In-place leases | $ | 591,551 |
| | $ | 624,723 |
|
| Above-market leases | 89,640 |
| | 88,873 |
|
| Less: accumulated amortization | (271,288 | ) | | (243,320 | ) |
| Intangible lease assets, net | $ | 409,903 |
| | $ | 470,276 |
|
| | | | |
| Below-market leases | $ | 216,642 |
| | $ | 236,008 |
|
| Less: accumulated amortization | (61,339 | ) | | (53,688 | ) |
| Intangible lease liabilities, net | $ | 155,303 |
| | $ | 182,320 |
|
The amounts amortized as a net increase to rental revenue for capitalized above and below-market leases was $6.5 million, $6.6 million and $5.8 million for the years ended December 31, 2017, 2016 and 2015, respectively. The value of in-place leases amortized and included in depreciation and amortization expense was $43.3 million, $46.4 million and $49.9 million for the years ended December 31, 2017, 2016 and 2015, respectively. The remaining weighted average amortization period for in-place leases, above-market leases, below-market leases and in total was 13.8 years 9.5 years, 17.5 years and 10.6 years, respectively, as of December 31, 2017. The remaining weighted average amortization period for in-place leases, above-market leases, below-market leases and in total was 14.6 years, 10.3 years, 18.5 years and 11.2 years, respectively, as of December 31, 2016. During the year ended December 31, 2017, the Company acquired in-place lease intangible assets of $18.7 million, above-market lease intangible assets of $6.5 million and below-market lease intangible liabilities of $2.0 million.
SPIRIT REALTY CAPITAL, INC. and SPIRIT REALTY, L.P.
Notes to Consolidated Financial Statements - (continued)
December 31, 2017
Based on the balance of intangible assets and liabilities at December 31, 2017, the net aggregate amortization expense for the next five years and thereafter is expected to be as follows (in thousands):
|
| | | |
| 2018 | $ | 32,343 |
|
| 2019 | 30,736 |
|
| 2020 | 28,717 |
|
| 2021 | 26,108 |
|
| 2022 | 22,838 |
|
| Thereafter | 113,858 |
|
| Total future minimum amortization | $ | 254,600 |
|
Real Estate Assets Under Direct Financing Leases
The components of real estate investments held under direct financing leases were as follows (in thousands):
|
| | | | | | | |
| | December 31,
2017 | | December 31, 2016 |
| Minimum lease payments receivable | $ | 7,325 |
| | $ | 9,456 |
|
| Estimated residual value of leased assets | 24,552 |
| | 35,640 |
|
| Unearned income | (7,012 | ) | | (9,091 | ) |
| Real estate assets under direct financing leases, net | $ | 24,865 |
| | $ | 36,005 |
|
Real Estate Assets Held for Sale
The Company is continually evaluating the portfolio of real estate assets and may elect to dispose of assets considering criteria including, but not limited to, tenant concentration, tenant credit quality, unit financial performance, local market conditions and lease rates, associated indebtedness, asset location, and tenant operation type (e.g., industry, sector, or concept/brand). Real estate assets held for sale are expected to be sold within twelve months. The following table shows the activity in real estate assets held for sale, net for the years ended December 31, 2017 and 2016:
|
| | | | | | |
| | Number of Properties | | Carrying Value |
| | (In Thousands) |
| Balance, December 31, 2015 | 36 |
| | $ | 84,259 |
|
| Transfers from real estate investments | 72 |
| | 246,730 |
|
| Sales | (59 | ) | | (126,100 | ) |
| Transfers to real estate investments held and used | (5 | ) | | (21,046 | ) |
| Impairments | | | (23,273 | ) |
| Balance, December 31, 2016 | 44 |
| | 160,570 |
|
| Transfers from real estate investments | 82 |
| | 216,502 |
|
| Sales | (91 | ) | | (208,029 | ) |
| Transfers to real estate investments held and used | (20 | ) | | (95,382 | ) |
| Impairments | | | (24,732 | ) |
| Balance, December 31, 2017 | 15 |
| | 48,929 |
|
SPIRIT REALTY CAPITAL, INC. and SPIRIT REALTY, L.P.
Notes to Consolidated Financial Statements - (continued)
December 31, 2017
Impairments
The following table summarizes total impairment losses recognized in continuing and discontinued operations on the accompanying consolidated statements of operations (in thousands):
|
| | | | | | | | | | | |
| | Years Ended December 31, |
| | 2017 | | 2016 | | 2015 |
| Real estate and intangible asset impairment | $ | 93,441 |
| | $ | 80,390 |
| | $ | 68,565 |
|
| Write-off of lease intangibles, net | 8,500 |
| | 7,683 |
| | 1,666 |
|
| Loans receivable impairment | 389 |
| | 176 |
| | 324 |
|
| Total impairments from real estate investment net assets | 102,330 |
| | 88,249 |
| | 70,555 |
|
| Other impairment | — |
| | 26 |
| | 174 |
|
| Total impairment loss in contuining and discontinued operations | $ | 102,330 |
| | $ | 88,275 |
| | $ | 70,729 |
|
Impairments for the twelve months ended December 31, 2017 were comprised of $24.8 million on properties classified as held for sale and $77.2 million properties classified a held and used. Impairments for the twelve months ended December 31, 2016 were comprised of $23.1 million on properties held for sale and $47.2 million on properties classified as held and used. Impairments for the twelve months ended December 31, 2015 were comprised of $15.0 million on properties held for sale and $55.4 million on properties classified as held and used.
Note 4. Debt
The debt of the Company and the Operating Partnership are the same, except for the presentation of the Convertible Notes. The Convertible Notes were issued by the Company. Subsequently, an intercompany note between the Company and the Operating Partnership was executed with terms identical to those of the Convertible Notes. Therefore, in the consolidated balance sheet of the Operating Partnership, the amounts related to the Convertible Notes are reflected as notes payable to Spirit Realty Capital, Inc., net. The Company's debt is summarized below:
|
| | | | | | | | | | | | | | | |
| | 2017
Weighted Average Effective
Interest Rates (1) | | 2017
Weighted Average Stated Rates (2) | | 2017
Weighted Average Maturity (3) | | December 31, 2017 | | December 31, 2016 |
| | | | | | | | (In Thousands) |
| Revolving Credit Facility | 3.88 | % | | 2.44 | % | | 1.2 | | $ | 112,000 |
| | $ | 86,000 |
|
| Term Loan | 2.68 | % | | 2.50 | % | | 0.8 | | — |
| | 420,000 |
|
| Master Trust Notes | 5.52 | % | | 5.01 | % | | 5.2 | | 2,248,504 |
| | 1,672,706 |
|
| CMBS - fixed-rate | 5.78 | % | | 5.81 | % | | 4.6 | | 332,647 |
| | 528,427 |
|
| Convertible Notes | 5.32 | % | | 3.28 | % | | 2.3 | | 747,500 |
| | 747,500 |
|
| Unsecured Senior Notes | 4.65 | % | | 4.45 | % | | 8.7 | | 300,000 |
| | 300,000 |
|
| Total debt | 5.04 | % | | 4.35 | % | | 4.7 | | 3,740,651 |
| | 3,754,633 |
|
| Debt discount, net | | | | | | | (61,399 | ) | | (52,894 | ) |
Deferred financing costs, net (4) | | | | | | | (39,572 | ) | | (37,111 | ) |
| Total debt, net | | | | | | | $ | 3,639,680 |
| | $ | 3,664,628 |
|
(1)The effective interest rates include amortization of debt discount/premium, amortization of deferred financing costs, facility fees and non-utilization fees, where applicable, calculated for the year ended December 31, 2017.
(2) Represents the weighted average stated interest rate based on the outstanding principal balance as of December 31, 2017.
(3) Represents the weighted average maturity based on the outstanding principal balance as of December 31, 2017.
(4) The Company records deferred financing costs for the Revolving Credit Facility in deferred costs and other assets, net on its consolidated balance sheets.
SPIRIT REALTY CAPITAL, INC. and SPIRIT REALTY, L.P.
Notes to Consolidated Financial Statements - (continued)
December 31, 2017
Revolving Credit Facility
On March 31, 2015, the Company, as guarantor, and the Operating Partnership, as borrower, entered into the Credit Agreement that established a new $600.0 million unsecured credit facility. The Revolving Credit Facility matures on March 31, 2019 (extendible at the Operating Partnership's option to March 31, 2020, subject to satisfaction of certain requirements) and includes an accordion feature to increase the committed facility size up to $1.0 billion, subject to satisfying certain requirements and obtaining additional lender commitments. On April 27, 2016, the Company expanded the borrowing capacity under the Revolving Credit Facility from $600.0 million to $800.0 million by partially exercising the accordion feature under the terms of the Credit Agreement. The Revolving Credit Facility also includes a $50.0 million sub-limit for swing-line loans and up to $60.0 million available for issuance of letters of credit. Swing-line loans and letters of credit reduce availability under the Revolving Credit Facility on a dollar-for-dollar basis. On November 3, 2015, the Company entered into a first amendment to the Credit Agreement. The amendment conforms certain of the terms and covenants to those in the Term Loan Agreement, including limiting the requirement of subsidiary guaranties to material subsidiaries (as defined in the Credit Agreement) meeting certain conditions. At December 31, 2017, there were no subsidiaries meeting this requirement.
The Revolving Credit Facility bears interest at a rate equal to LIBOR plus 0.875% to 1.55% per annum or a specified base rate plus 0.0% to 0.55% and requires a facility fee in an amount equal to the aggregate revolving credit commitments (whether or not utilized) multiplied by a rate equal to 0.125% to 0.30% per annum, in each case depending on the Corporation's credit rating. As of December 31, 2017, the Revolving Credit Facility bore interest at LIBOR plus 1.25% based on the Company's credit rating and incurred a facility fee of 0.25% per annum.
The Operating Partnership may voluntarily prepay the Revolving Credit Facility, in whole or in part, at any time, without premium or penalty, but subject to applicable LIBOR breakage fees, if any. Payment of the Revolving Credit Facility is unconditionally guaranteed by the Corporation and material subsidiaries that meet certain conditions (as defined in the Credit Agreement). The Revolving Credit Facility is full recourse to the Operating Partnership and the aforementioned guarantors.
As a result of entering into the Revolving Credit Facility and expanding the borrowing capacity, the Company incurred origination costs of $4.8 million. These deferred financing costs are being amortized to interest expense over the remaining initial term of the Revolving Credit Facility. The unamortized deferred financing costs relating to the Revolving Credit Facility were $1.6 million and $2.9 million, at December 31, 2017 and 2016, respectively, and were recorded in deferred costs and other assets, net on the accompanying consolidated balance sheets.
As of December 31, 2017, $112.0 million was outstanding, there was $688.0 million of borrowing capacity available under the Revolving Credit Facility and no outstanding letters of credit. The Operating Partnership's ability to borrow under the Revolving Credit Facility is subject to ongoing compliance with a number of customary financial covenants and other customary affirmative and negative covenants. As of December 31, 2017, the Corporation and the Operating Partnership were in compliance with these financial covenants.
Term Loan
On November 3, 2015, the Company entered into a Term Loan Agreement among the Operating Partnership, as borrower, the Company as guarantor and the lenders that are parties thereto. The Term Loan Agreement provides for a $325.0 million senior unsecured term facility that has an initial maturity date of November 2, 2018, which may be extended at the Company's option pursuant to two one-year extension options, subject to the satisfaction of certain conditions and payment of an extension fee. In addition, an accordion feature allows the facility to be increased up to $600.0 million, subject to obtaining additional lender commitments. During the fourth quarter of 2015 and 2016, the Company exercised the accordion feature per the Credit Agreement and increased the term facility borrowing capacity from $325.0 million to $370.0 million and $420.0 million, respectively.
The Term Loan Agreement provides that borrowings bear interest at either LIBOR plus 1.35% to 1.80% per annum or a specified base rate plus 0.35% to 0.80% per annum, at the Operating Partnership's option. In each case, the applicable margin is determined based upon the Corporation's leverage ratio. If the Corporation obtains at least two credit ratings on its senior unsecured long-term indebtedness of BBB- from S&P or Fitch, Inc. or Baa3 from Moody's, the Operating Partnership may make an irrevocable election to have the margin based upon the Corporation's credit ratings. In April
SPIRIT REALTY CAPITAL, INC. and SPIRIT REALTY, L.P.
Notes to Consolidated Financial Statements - (continued)
December 31, 2017
2016, the Corporation received a first time rating of BBB- from Fitch and was upgraded to a BBB- corporate issuer rating by S&P. As a result, the Operating Partnership elected to change the interest rate grid from leveraged based pricing to credit rating based pricing in the second quarter of 2016. Under credit rating based pricing, borrowings bear interest at either LIBOR plus 0.90% to 1.75% per annum or a specified base rate plus 0.0% to 0.75% per annum, in each case depending on the Corporation’s credit ratings.
The Operating Partnership may voluntarily prepay the Term Loan, in whole or in part, at any time, without premium or penalty, but subject to applicable LIBOR breakage fees. Borrowings may be repaid without premium or penalty, and may be re-borrowed within 30 days up to the then available loan commitment and subject to occurrence limitations within any twelve-month period. Payment of the Term Loan is unconditionally guaranteed by the Corporation and, under certain circumstances, by one or more material subsidiaries (as defined in the Term Loan Agreement) of the Corporation. The obligations of the Corporation and any guarantor under the Term Loan are full recourse to the Corporation and each guarantor.
As a result of entering into the Term Loan, the Company incurred origination costs of $2.4 million. These deferred financing costs are being amortized to interest expense over the remaining initial term of the Term Loan. As of December 31, 2017 and 2016, the unamortized deferred financing costs relating to the Term Loan were $0.7 million and $1.5 million, respectively, and were recorded net against the principal balance of mortgages and notes payable and the Term Loan for 2017 and 2016, respectively, on the accompanying consolidated balance sheets.
As of December 31, 2017, there was a zero outstanding balance and $420.0 million of borrowing capacity available under the Term Loan. The Operating Partnership's ability to borrow under the Term Loan is subject to ongoing compliance with a number of customary financial covenants and other customary affirmative and negative covenants. The Corporation has unconditionally guaranteed all obligations of the Operating Partnership under the Term Loan Agreement. As of December 31, 2017, the Corporation and the Operating Partnership were in compliance with these financial covenants.
Senior Unsecured Notes
On August 18, 2016, the Operating Partnership completed a private placement of $300.0 million aggregate principal amount of senior notes through a Rule 144A offering with registration rights, which are guaranteed by the Corporation. The Senior Unsecured Notes were issued at 99.378% of their principal amount, resulting in net proceeds of $296.2 million, after deducting transaction fees and expenses. The Senior Unsecured Notes accrue interest at a rate of 4.450% per year, payable on March 15 and September 15 of each year, until the maturity date of September 15, 2026. The Company filed a registration statement with the SEC to exchange the private Senior Unsecured Notes for registered Senior Unsecured Notes with substantially identical terms, which became effective April 14, 2017. All $300.0 million aggregate principal amount of private Senior Unsecured Notes were tendered in the exchange for registered Senior Unsecured Notes.
The Senior Unsecured Notes are redeemable in whole at any time or in part from time to time, at the Operating Partnership’s option, at a redemption price equal to the sum of: an amount equal to 100% of the principal amount of the Senior Unsecured Notes to be redeemed plus accrued and unpaid interest and liquidated damages, if any, up to, but not including, the redemption date; and a make-whole premium calculated in accordance with the indenture. Notwithstanding the foregoing, if any of the Senior Unsecured Notes are redeemed on or after June 15, 2026 (three months prior to the maturity date of the Senior Unsecured Notes), the redemption price will not include a make-whole premium.
In connection with the offering, the Operating Partnership incurred $3.4 million in deferred financing costs. This amount is being amortized to interest expense over the life of the Senior Unsecured Notes. The unamortized deferred financing costs relating to the Senior Unsecured Notes were $3.0 million and $3.1 million as of December 31, 2017 and 2016, respectively, and recorded net against the Senior Unsecured Notes principal balance on the accompanying consolidated balance sheets.
In connection with the issuance of the Senior Unsecured Notes, the Corporation and Operating Partnership are subject to ongoing compliance with a number of customary financial covenants and other customary affirmative and negative
SPIRIT REALTY CAPITAL, INC. and SPIRIT REALTY, L.P.
Notes to Consolidated Financial Statements - (continued)
December 31, 2017
covenants. As of December 31, 2017, the Corporation and the Operating Partnership were in compliance with these financial covenants.
Master Trust Notes
The Company has access to an asset-backed securitization platform, the Spirit Master Funding Program, to raise capital through the issuance of non-recourse net-lease mortgage notes collateralized by commercial real estate, net-leases and mortgage loans. The Spirit Master Funding Program consists of two separate securitization trusts, Master Trust 2013 and Master Trust 2014, each of which have one or multiple bankruptcy-remote, special purpose entities as issuers or co-issuers of the notes. Each issuer is an indirect wholly-owned special purpose entity of the Corporation and of the Operating Partnership.
Master Trust 2013
In December 2013, an indirect wholly-owned subsidiary of the Company issued $330.0 million aggregate principal amount of investment grade rated net-lease mortgage notes comprised of $125.0 million of 3.89% interest-only notes expected to be repaid in December 2018 and $205.0 million of 5.27% amortizing notes expected to be repaid in December 2023.
Master Trust 2014
In November 2014, the existing issuers under Master Trust 2014 and two additional indirect wholly-owned subsidiaries of the Company, collectively as co-issuers, completed the issuance of $510.0 million aggregate principal amount of net-lease mortgage notes comprised of $150.0 million of 3.50% interest-only notes expected to be repaid in January 2020 and $360.0 million of 4.63% amortizing notes (interest-only through November 2017) expected to be repaid in January 2030.
In December 2017, the existing issuers under Master Trust 2014, collectively as co-issuers, completed the issuance of $674.4 million aggregate principal amount of net-lease mortgage notes comprised of $542.4 million of 4.36%, Class A, amortizing notes and $132.0 million of 6.35%, Class B, interest-only notes, each class of Notes have an anticipated repayment date in December 2022 and a legal final payment date in December 2047. (Refer to Note 17. Subsequent Events, regarding repricing of the Class B Notes). Spirit Realty acquired $27.1 million in aggregate principal amount of Class A Notes and $6.6 million in aggregate principal amount of Class B Notes from the Issuer to satisfy its regulatory risk retention obligations. In conjunction with the issuance, the Company pre-paid Series 2014-1 Class A1 of the 2014 notes.
SPIRIT REALTY CAPITAL, INC. and SPIRIT REALTY, L.P.
Notes to Consolidated Financial Statements - (continued)
December 31, 2017
The Master Trust Notes are summarized below:
|
| | | | | | | | | | | | |
| | Stated
Rates (1) | | Maturity | | December 31,
2017 | | December 31,
2016 |
| | | | (in Years) | | (in Thousands) |
| Series 2014-1 Class A1 | — | % | | 0.0 | | $ | — |
| | $ | 53,919 |
|
| Series 2014-1 Class A2 | 5.4 | % | | 2.5 | | 252,437 |
| | 253,300 |
|
| Series 2014-2 | 5.8 | % | | 3.2 | | 222,683 |
| | 226,283 |
|
| Series 2014-3 | 5.7 | % | | 4.2 | | 311,336 |
| | 311,820 |
|
| Series 2014-4 Class A1 | 3.5 | % | | 2.1 | | 150,000 |
| | 150,000 |
|
| Series 2014-4 Class A2 | 4.6 | % | | 12.1 | | 358,664 |
| | 360,000 |
|
Series 2017-1 Class A (2) | 4.4 | % | | 5.0 | | 515,280 |
| | — |
|
Series 2017-1 Class B (2) | 6.4 | % | | 5.0 | | 125,400 |
| | — |
|
| Total Master Trust 2014 notes | 5.0 | % | | 5.4 | | 1,935,800 |
| | 1,355,322 |
|
| Series 2013-1 Class A | 3.9 | % | | 1.0 | | 125,000 |
| | 125,000 |
|
| Series 2013-2 Class A | 5.3 | % | | 6.0 | | 187,704 |
| | 192,384 |
|
| Total Master Trust 2013 notes | 4.7 | % | | 4.0 | | 312,704 |
| | 317,384 |
|
| Total Master Trust Notes | | | | | 2,248,504 |
| | 1,672,706 |
|
| Debt discount, net | | | | | (36,188 | ) | | (18,787 | ) |
| Deferred financing costs, net | | | | | (24,010 | ) | | (16,376 | ) |
| Total Master Trust Notes, net | | | | | $ | 2,188,306 |
| | $ | 1,637,543 |
|
(1) Represents the individual series stated interest rate as of December 31, 2017 and the weighted average stated rate of the total Master Trust Notes, based on the collective series outstanding principal balances as of December 31, 2017.
(2) The Operating Partnership acquired $27.1 million in aggregate principal amount of Class A Notes and $6.6 million in aggregate principal amount of Class B Notes to satisfy its regulatory risk retention obligations.
As of December 31, 2017, the Master Trust 2014 notes were secured by 815 owned and financed properties issued by 5 indirect wholly-owned subsidiaries of the Corporation. The notes issued under Master Trust 2014 are cross-collateralized by the assets of all issuers within this trust. As of December 31, 2017, the Master Trust 2013 notes were secured by 296 owned and financed properties issued by a single indirect wholly-owned subsidiary of the Corporation.
CMBS
As of December 31, 2017, indirect wholly-owned special purpose entity subsidiaries of the Corporation were borrowers under 6 fixed-rate non-recourse loans, excluding six defaulted loans, which have been securitized into CMBS and are secured by the borrowers' respective leased properties and related assets. The stated interest rates as of December 31, 2017 for these fixed-rate notes ranged from 4.67% to 6.00% with a weighted average stated rate of 5.35%. As of December 31, 2017, these fixed-rate loans were secured by 100 properties. As of December 31, 2017 and December 31, 2016, the unamortized deferred financing costs associated with the CMBS loans were $3.9 million and $4.7 million, respectively, and recorded net against the principal balance of the mortgages and notes payable on the accompanying consolidated balance sheets. The deferred financing costs are being amortized to interest expense over the term of the respective loans. During June, 2016, the Company repaid the remaining eight CMBS variable-rate loans and terminated the related interest rate swap agreements.
As of December 31, 2017, certain borrowers were in default under the loan agreements relating to six separate CMBS fixed-rate loans where eight properties securing the respective loans were no longer generating sufficient revenue to pay the scheduled debt service. The default interest rate on these loans was between 7.53% and 10.62%. Each defaulted borrower is a bankruptcy remote special purpose entity and the sole owner of the collateral securing the loan obligations. As of December 31, 2017, the aggregate principal balance under the defaulted CMBS loans was $64.3 million, which includes $13.2 million of interest added to principal. In addition, approximately $1.5 million of lender controlled restricted cash is being held in connection with these loans that may be applied to reduce amounts owed.
SPIRIT REALTY CAPITAL, INC. and SPIRIT REALTY, L.P.
Notes to Consolidated Financial Statements - (continued)
December 31, 2017
Convertible Notes
In May 20, 2014, the Company issued $402.5 million aggregate principal amount of 2.875% convertible notes due in 2019 and $345.0 million aggregate principal amount of 3.75% convertible notes due in 2021. Interest on the Convertible Notes is payable semiannually in arrears on May 15 and November 15 of each year. The 2019 Notes will mature on May 15, 2019 and the 2021 Notes will mature on May 15, 2021. Proceeds from the issuance were contributed to the Operating Partnership and are recorded as a note payable to Spirit Realty Capital, Inc., on the consolidated balance sheetsheets of the Operating Partnership.
The Convertible Notes are convertible only during certain periods and, subject to certain circumstances, into cash, shares of the Corporation's common stock, or a combination thereof. The initial conversion rate applicable to each series is 76.3636 per $1,000 principal note (equivalent to an initial conversion price of $13.10 per share of common stock, representing a 22.5% premium above the public offering price of the common stock offered concurrently at the time the Convertible Notes were issued). The conversion rate is subject to adjustment for certain anti-dilution events, including special distributions and regular quarterly cash dividends exceeding $0.16625 per share. As of December 31, 2016,2017, the conversion rate was 76.810077.3144 per $1,000 principal note. Earlier conversion may be triggered if shares of the Corporation's common stock trades higher than the established thresholds, if the Convertible Notes trade below established thresholds, or certain corporate events occur.
In connection with the issuance of the Convertible Notes, the Company recorded a discount of $56.7 million, which represents the estimated value of the embedded conversion feature for each of the Convertible Notes. The discount is being amortized to interest expense using the effective interest method over the term of each of the 2019 Notes and 2021 Notes. As of December 31, 20162017 and December 31, 2015,2016, the unamortized discount was $33.5$23.7 million and $42.7$33.5 million, respectively. The discount is shown net against the aggregate outstanding principal balance of the Convertible Notes on the accompanying consolidated balance sheets. The equity component of the conversion feature is recorded in capital in excess of par value in the accompanying consolidated balance sheets, net of financing transaction costs.
SPIRIT REALTY CAPITAL, INC. and SPIRIT REALTY, L.P.
Notes to Consolidated Financial Statements - (continued)
December 31, 2016
In connection with the offering, the Company also incurred $19.6 million in deferred financing costs. This amount has been allocated on a pro-rata basis to each of the Convertible Notes and is being amortized to interest expense over the term of each note. As of December 31, 20162017 and December 31, 2015,2016, the unamortized deferred financing costs relating to the Convertible Notes was $11.4$8.0 million and $14.7$11.4 million, respectively, and recorded net against the Convertible Notes principal balance on the accompanying consolidated balance sheets.
Debt Extinguishment
During the year ended December 31, 2017, the Company extinguished a total of $238.5 million aggregate principal amount of indebtedness with a weighted average contractual interest rate of 5.5%. As a result of these transactions, the Company recognized a net loss on debt extinguishment of approximately $1.6 million. The loss was primarily attributable to the lender make-whole payment associated with early payoff of one series of the Master Trust 2014 notes. The payment of the premium is included in debt extinguishment costs within operating activities in the consolidated statement of cash flows.
During the year ended December 31, 2016, the Company extinguished a total of $883.0 million aggregate principal amount of senior mortgage indebtedness with a weighted average contractual interest rate of 6.01%. As a result of these transactions, the Company recognized a net gain on debt extinguishment during the year ended December 31, 2016 of approximately $0.2 million. The gain was primarily attributable to the extinguishment of seven defaulted mortgage loans upon the sale of the related properties to third parties. The payment of the premium is included in debt extinguishment costs within operating activities in the consolidated statement of cash flows.
During the year ended
SPIRIT REALTY CAPITAL, INC. and SPIRIT REALTY, L.P.
Notes to Consolidated Financial Statements - (continued)
December 31, 2015, the Company extinguished a total of $536.6 million aggregate principal amount of senior mortgage indebtedness with a weighted average contractual interest rate of 5.73% and terminated the 2013 Credit Facility. As a result of these transactions, the Company recognized a loss on debt extinguishment during the year ended December 31, 2015 of approximately $3.2 million, primarily related to defeasance costs and fees paid for the retirement of debt.2017
Debt Maturities
As of December 31, 2016,2017, scheduled debt maturities of the Company’s Revolving Credit Facilities, Term Loan, mortgages and notes payable and Convertible Notes, including balloon payments, are as follows (in thousands):
| | | | Scheduled Principal | | Balloon Payment | | Total (2) | Scheduled Principal | | Balloon Payment | | Total |
2017 (1) | $ | 26,115 |
| | $ | 187,932 |
| | $ | 214,047 |
| |
| 2018 | 42,115 |
| | 602,779 |
| | 644,894 |
| |
2018 (1) | | $ | 41,877 |
| | $ | 189,312 |
| | $ | 231,189 |
|
| 2019 | 44,325 |
| | 498,500 |
| | 542,825 |
| 44,135 |
| | 514,500 |
| | 558,635 |
|
| 2020 | 39,096 |
| | 413,206 |
| | 452,302 |
| 48,910 |
| | 365,903 |
| | 414,813 |
|
| 2021 | 30,658 |
| | 554,753 |
| | 585,411 |
| 32,402 |
| | 554,753 |
| | 587,155 |
|
| 2022 | | 32,557 |
| | 983,480 |
| | 1,016,037 |
|
| Thereafter | 219,133 |
| | 1,096,021 |
| | 1,315,154 |
| 188,177 |
| | 744,645 |
| | 932,822 |
|
| Total | $ | 401,442 |
| | $ | 3,353,191 |
| | $ | 3,754,633 |
| $ | 388,058 |
| | $ | 3,352,593 |
| | $ | 3,740,651 |
|
(1) The balloon payment balance in 20172018 includes $26.6$64.3 million for the acceleration of principal payable, including $9.5$13.2 million of capitalized interest, following an event of default under 26 separate non-recourse CMBS loans with stated maturities in 2017 of $6.4 million and $20.2 million.loans.
(2) The Term Loan has a maturity date of November 2, 2018, which may be extended at the Company's option pursuant to two one-year extension options.
SPIRIT REALTY CAPITAL, INC. and SPIRIT REALTY, L.P.
Notes to Consolidated Financial Statements - (continued)
December 31, 2016
Interest Expense
The following table is a summary of the components of interest expense related to the Company's borrowings (in thousands):
| | | | Years Ended December 31, | Years Ended December 31, |
| | 2016 | | 2015 | | 2014 | 2017 | | 2016 | | 2015 |
Interest expense – Revolving Credit Facilities (1) | $ | 3,314 |
| | $ | 2,698 |
| | $ | 3,597 |
| $ | 7,957 |
| | $ | 3,314 |
| | $ | 2,698 |
|
| Interest expense – Term Loan | 5,218 |
|
| 888 |
| | — |
| 9,793 |
|
| 5,218 |
| | 888 |
|
| Interest expense – mortgages and notes payable | 143,233 |
| | 184,439 |
| | 196,246 |
| 111,049 |
| | 143,233 |
| | 184,439 |
|
Interest expense – Convertible Notes (2) | 24,509 |
| | 24,509 |
| | 15,046 |
| 24,509 |
| | 24,509 |
| | 24,509 |
|
| Interest expense – Unsecured Senior Notes | 4,932 |
| | — |
| | — |
| 13,351 |
| | 4,932 |
| | — |
|
| Interest expense – other | — |
| | — |
| | 6 |
| |
| Non-cash interest expense: | | | | | | | | | | |
| Amortization of deferred financing costs | 9,070 |
| | 7,937 |
| | 5,899 |
| 9,896 |
| | 9,070 |
| | 7,937 |
|
| Amortization of net losses related to interest rate swaps | 93 |
| | 108 |
| | 125 |
| — |
| | 93 |
| | 108 |
|
| Amortization of debt discount/(premium), net | 6,217 |
| | 2,322 |
| | (849 | ) | 13,572 |
| | 6,217 |
| | 2,322 |
|
| Total interest expense | $ | 196,586 |
| | $ | 222,901 |
| | $ | 220,070 |
| $ | 190,127 |
| | $ | 196,586 |
| | $ | 222,901 |
|
(1) Includes facility fees of approximately $2.1 million, $2.0 million $1.6 million and $1.2$1.6 million for the years ended December 31, 2017, 2016 2015 and 2014,2015, respectively.
(2) Included in interest expense on the Operating Partnership's consolidated statements of operations are amounts paid to the Corporation by the Operating Partnership related to the notes payable to Spirit Realty Capital, Inc.
Note 5. Derivative and Hedging Activities
The Company does not enter into derivative contracts for speculative or trading purposes, instead uses interest rate derivative contracts to manage its exposure to changes in interest rates on its variable rate debt. These derivatives are considered cash flow hedges and are recorded on a gross basis at fair value. These derivatives are considered cash flow hedges and are recorded on a gross basis at fair value. Assessments of hedge effectiveness are performed quarterly using regression analysis and the measurement of hedge ineffectiveness is based on the hypothetical derivative method. The effective portion of changes in fair value are recorded in AOCL and subsequently reclassified to earnings when the hedged transactions affect earnings. The ineffective portion is recorded immediately in earnings in general and administrative expenses. The Company does not enter into derivative contracts for speculative or trading purposes.
The Company is exposed to credit risk in the event of non-performance by its derivative counterparties. The Company evaluates counterparty credit risk through monitoring the creditworthiness of counterparties, which includes review of
SPIRIT REALTY CAPITAL, INC. and SPIRIT REALTY, L.P.
Notes to Consolidated Financial Statements - (continued)
December 31, 2017
debt ratings and financial performance. To mitigate its credit risk, the Company enters into agreements with counterparties it considers credit-worthy, such as large financial institutions with favorable credit ratings. As of December 31, 2016 and 2015, there were no termination events or events of default related to the interest rate swaps.
The following table summarizes the notional amount and fair value of the Company’s derivative instruments (dollars in thousands):
|
| | | | | | | | | | | | | | | | | | | | |
| | | | | | | | | | | | | Fair Value of Liability |
| Derivatives Designated as Hedging Instruments | | Balance Sheet Location | | Notional
Amount | | Fixed Interest
Rate | | Effective
Date | | Maturity
Date | | December 31,
2016 | | December 31,
2015 |
Interest Rate Swaps (1) | | Accounts payable, accrued expenses and other liabilities | | $ | 61,758 |
| | 5.14% | | 01/02/14 | | 12/13/18 | | — |
| | (934 | ) |
| | | | | | | | | | | | | $ | — |
| | $ | (934 | ) |
(1) Represents a tranche of 8 individual interest rate swap agreements with notional amounts ranging from $7.6 million to $7.9 million. The payment terms, stated interest rate, effective date, and maturity date of these swaps are consistent with the terms of the debt.
SPIRIT REALTY CAPITAL, INC. and SPIRIT REALTY, L.P.
Notes to Consolidated Financial Statements - (continued)
December 31, 2016
During June 2016, the Company terminated the remaining interest rate swap agreements upon the repayment of eight CMBS variable-rate loans. The Company paid $1.7 million to terminate these interest rate swap agreements and recognized a loss of $1.7 million, which is included in general and administrative expenses. The Company has not entered into any new derivative contracts as of December 31, 2017.
The following tables provide information about the amounts recorded in AOCL, as well as the (loss) or gainloss recorded in operations, when reclassified out of AOCL or recognized in earnings immediately, for the years ended December 31, 2017, 2016, 2015, and 2014,2015, respectively (in thousands):
| | | | | Amount of Loss Recognized in AOCL on Derivative (Effective Portion) | | Amount of Loss Recognized in AOCL on Derivative (Effective Portion) |
| | | Years Ended December 31, | | Years Ended December 31, |
| Derivatives in Cash Flow Hedging Relationships | | 2016 | | 2015 | | 2014 | | 2017 | | 2016 | | 2015 |
| Interest rate swaps | | $ | (1,137 | ) | | $ | (1,190 | ) | | $ | (1,760 | ) | | $ | — |
| | $ | (1,137 | ) | | $ | (1,190 | ) |
| | | Amount of Loss Reclassified from AOCL into Operations (Effective Portion) | | | | | | |
| | | Years Ended December 31, | | Amount of Loss Reclassified from AOCL into Operations (Effective Portion) |
| | | | Years Ended December 31, |
| Location of Loss Reclassified from AOCL into Operations | | 2016 | | 2015 | | 2014 | | 2017 | | 2016 | | 2015 |
| Interest expense | | $ | (459 | ) | | $ | (1,169 | ) | | $ | (1,315 | ) | | $ | — |
| | $ | (459 | ) | | $ | (1,169 | ) |
| | | Amount of Loss Recognized in Operations on Derivative (Ineffective Portion) | | | | | | |
| | | Years Ended December 31, | | Amount of Loss Recognized in Operations on Derivative (Ineffective Portion) |
| Location of (Loss) or Gain Recognized in Operations on Derivatives | | 2016 | | 2015 | | 2014 | |
| | | | Years Ended December 31, |
| Location of Loss or Recognized in Operations on Derivatives | | | 2017 | | 2016 | | 2015 |
General and administrative expense (1) | | $ | (1,706 | ) | | $ | (78 | ) | | $ | — |
| | $ | — |
| | $ | (1,706 | ) | | $ | (78 | ) |
| | | Amount of Loss Recognized in Operations on Derivative | | | | | | |
| Derivatives Not Designated as Hedging Instruments | | Years Ended December 31, | |
| | | | Derivatives Not Designated as Hedging Instruments |
| | | | Years Ended December 31, |
| Location of Loss Recognized in Operations on Derivatives | | 2016 | | 2015 | | 2014 | | 2017 | | 2016 | | 2015 |
| General and administrative expense | | $ | (18 | ) | | $ | — |
| | $ | — |
| | $ | — |
| | $ | (18 | ) | | $ | — |
|
(1) The year ended December 31, 2015 includes a loss of $76 thousand that was reclassified from accumulated other comprehensive lossAOCL in the balance sheet resulting from hedged transactions that were no longer probable of occurring as the swaps were terminated prior to their respective maturity dates.
Note 6. Income Taxes
The Company’s total income tax expense was as follows (in thousands):
| | | | Years Ended December 31, | Years Ended December 31, |
| | 2016 | | 2015 | | 2014 | 2017 | | 2016 | | 2015 |
| State income tax | $ | 899 |
| | $ | 601 |
| | $ | 673 |
| $ | 394 |
| | $ | 899 |
| | $ | 601 |
|
| REIT state built-in gain tax expense | 47 |
| | — |
| | — |
| — |
| | 47 |
| | — |
|
| Federal income tax | $ | 19 |
| | $ | — |
| | $ | — |
| $ | — |
| | $ | 19 |
| | $ | — |
|
| Total income tax expense | $ | 965 |
| | $ | 601 |
| | $ | 673 |
| $ | 394 |
| | $ | 965 |
| | $ | 601 |
|
The Company’s deferred income tax expense and its ending balance in deferred tax assets and liabilities, which are recorded within accounts payable, accrued expenses and other liabilities in the accompanying consolidated balance sheets, were immaterial at December 31, 2017, 2016 2015 and 2014.2015.
SPIRIT REALTY CAPITAL, INC. and SPIRIT REALTY, L.P.
Notes to Consolidated Financial Statements - (continued)
December 31, 2017
On December 22, 2017, the Tax Cuts and Jobs Act (the “Act”) was enacted, reducing the U.S. federal corporate income tax rate from 35% to 21%, among other changes. The SEC staff issued Staff Accounting Bulletin 118, which provides guidance on accounting for the tax effects of the Act for which the accounting under ASC 740, Income Taxes (“ASC 740”) is incomplete. To the extent that a company's accounting for certain income tax effects of the Act is incomplete but it is able to determine a reasonable estimate, it must record a provisional estimate in the financial statements. If a company cannot determine a provisional estimate to be included in the financial statements, it should continue to apply ASC 740 on the basis of the provisions of the tax laws that were in effect immediately before enactment of the Act. The Company believes the impact of the Act to its consolidated financial statements is immaterial; however, the Company is still analyzing certain aspects of the Act. Future regulatory and rulemaking interpretations or other guidance could affect the Company’s analysis and tax position.
To the extent that the Company acquires property that has been owned by a C corporation in a transaction in which the tax basis of the property carries over, and the Company recognizes a gain on the disposition of such property during the subsequent recognition period, it will be required to pay tax at the highest regular corporate tax rate to the extent of such built-in gain. During 2016, the Company sold a property that wasNo properties subject to state built-in gain tax of $47 thousand.
SPIRIT REALTY CAPITAL, INC. and SPIRIT REALTY, L.P.
Notes to Consolidated Financial Statements - (continued)
December 31, 2016
were sold during 2017.
The Corporation has federal net operating loss carry-forwards for income tax purposes totaling $66.1 million $66.1 million and $63.9 million atfor each of the years ended December 31, 2017, 2016 2015 and 2014, respectively.2015. These losses, which begin to expire in 20172027 through 2034, are available to reduce future taxable income or distribution requirements, subject to certain ownership change limitations.
The Company files federal, state and local income tax returns. All federal tax returns for years prior to 20132014 are no longer subject to examination. Additionally, state tax returns for years prior to 20122013 are generally no longer subject to examination. The Company’s policy is to recognize interest related to any underpayment of income taxes as interest expense and to recognize any penalties as operating expenses. There was no accrual for interest or penalties at December 31, 2017, 2016 2015 and 2014.2015. The Company believes that it has appropriate support for the income tax positions taken and to be taken on its tax returns and that its accruals for tax liabilities are adequate for all open years based on an assessment of many factors, including past experience and interpretations of tax law applied to the facts of each matter.
For the years ended December 31, 2017, 2016 2015 and 2014,2015, common stock dividends paid were characterized for tax as follows (per share):
| | | | Year Ended December 31, 2016 | | Year Ended December 31, 2015 | | Year Ended December 31, 2014 | Year Ended December 31, 2017 | | Year Ended December 31, 2016 | | Year Ended December 31, 2015 |
| Ordinary income | $ | 0.52 |
| | $ | 0.42 |
| | $ | — |
| $ | 0.49 |
| | $ | 0.52 |
| | $ | 0.42 |
|
| Return of capital | 0.15 |
| | 0.26 |
| | 0.58 |
| 0.16 |
| | 0.15 |
| | 0.26 |
|
| Capital gain | 0.03 |
| | — |
| | — |
| 0.07 |
| | 0.03 |
| | — |
|
| Total | $ | 0.70 |
| | $ | 0.68 |
| | $ | 0.58 |
| $ | 0.72 |
| | $ | 0.70 |
| | $ | 0.68 |
|
Note 7. Stockholders’ Equity and Partners' Capital
Issuance of CommonPreferred Stock
In May 2014,On October 3, 2017, the Company approvedcompleted an amendment to its charter to increase the numberunderwritten public offering of 6,900,000 shares of stock that it has6.000% Series A Cumulative Redeemable Preferred Stock, including 900,000 shares sold pursuant to the authorityunderwriter's option to issuepurchase additional shares. Gross proceeds raised from 490.0the issuance were $172.5 million; net proceeds were approximately $166.2 million after deducting underwriter discounts and offering costs paid by the Company.
The Series A Preferred Stock will pay cumulative cash dividends at the rate of 6.000% per annum on their liquidation preference of $25.00 per share (equivalent to 770.0 million. As$0.375 per share on a quarterly basis and $1.50 per share on an annual basis). Dividends are payable quarterly in arrears on or about the last day of March, June, September and December of each year, beginning on December 31, 2016,2017. The Series A Preferred Stock trades on the NYSE under the symbol “SRC-A”.
SPIRIT REALTY CAPITAL, INC. and SPIRIT REALTY, L.P.
Notes to Consolidated Financial Statements - (continued)
December 31, 2017
The Company may not redeem the Series A Preferred Stock prior to October 3, 2022, except in limited circumstances to preserve its status as a real estate investment trust, and pursuant to the special optional redemption provision described below. On and after October 3, 2022, the Company has authoritymay, at its option, redeem the Series A Preferred Stock, in whole or in part, at any time or from time to issue 770.0 million sharestime, for cash at a redemption price of stock, consisting of 750.0 million shares of common stock, $0.01 par value$25.00 per share, plus any accrued and 20.0 million sharesunpaid dividends up to but excluding the redemption date. In addition, upon the occurrence of a change of control, the Company may, at its option, exercise the special optional redemption provision and redeem the Series A Preferred Stock, in whole or in part within 120 days after the first date on which such change of control occurred, by paying $25.00 per share, plus any accrued and unpaid dividends up to, but not including, the date of redemption.
The preferred stock $0.01 par value per share. Asoffering resulted in the Operating Partnership concurrently issuing 6,900,000 Series A Preferred Units (“Limited Partner Series A Preferred Units”) that have substantially the same terms as the Series A Preferred Stock.
Issuance of December 31, 2016 and 2015, there were no outstanding shares of preferred stock.Common Stock
On April 15, 2016, the Company completed an underwritten public offering of 34.5 million shares of its common stock, at $11.15 per share, including 4.5 million shares sold pursuant to the underwriter’s option to purchase additional shares. Gross proceeds raised from the offering were approximately $384.7 million; net proceeds were approximately $368.9 million after deducting underwriter discounts and offering costs paid by the Company. The net proceeds from the offering were initially used to reduce amounts outstanding under the Term Loan.
In April 2015, the Company completed an underwritten public offering of 23.0 million shares of its common stock, at $11.85 per share, including 3.0 million shares sold pursuant to the underwriter’s option to purchase additional shares. Gross proceeds raised were approximately $272.6 million; net proceeds were approximately $268.7 million after deducting underwriter discounts and offering costs paid by the Company. The net proceeds from the offering were used to repay the outstanding balances under the 2015Revolving Credit Facility and Line of Credit. The remaining net proceeds were used to fund acquisitions and for general corporate purposes (including additional repayments of borrowings outstanding from time to time under the Revolving Credit Facilities).
ATM Program
In April 2014, the Corporation commenced a continuous equity offering under which the Corporation may sell up to an aggregate $350.0 million worth of shares of its common stock from time to time through broker-dealers in the ATM Program. The Corporation may sell the shares in amounts and at times to be determined by the Corporation, but has no obligation to sell any of the shares in the ATM Program.
SPIRIT REALTY CAPITAL, INC. and SPIRIT REALTY, L.P.
Notes to Consolidated Financial Statements - (continued)
December 31, 2016
Since inception of the ATM Program through December 31, 2016, the Corporation sold an aggregate total of 27.3 million shares of its common stock, at a weighted average share price of $11.92, for aggregate gross proceeds of $325.5 million and aggregate net proceeds of $320.0 million after payment of commissions and other issuance costs of $5.4 million.
During the year ended December 31, 2016, the Corporation sold 6.3 million shares of its common stock, at a weighted average share price of $12.47, for aggregate gross proceeds of $79.0 million and aggregate net proceeds of $77.7 million after payment of commissions and other issuance costs of $1.3 million. The net proceeds were used to fund acquisitions, repay borrowings under the Revolving Credit Facilities and for general corporate purposes.
In November, 2016, the Board of Directors approved a new $500.0 million ATM Program and the Company terminated it's existing program. As of December 31, 2016,2017, no shares had been sold under the new ATM Program.
Stock Repurchase ProgramPrograms
In February 2016, the Company's Board of Directors approved a stock repurchase program, which authorizesauthorized the Company to repurchase up to $200.0 million of its common stock over the 18 month time period following authorization. During the year ended December 31, 2017, a total of 26,337,295 shares of the Company's outstanding common stock were repurchased in open market transactions under the stock repurchase program, at a weighted average price of $7.59 per share, equivalent to the full $200.0 million authorized. Fees associated with the share repurchase of $0.5 million are included in retained earnings.
In August 2017, the Company's Board of Directors approved a new stock repurchase program, which authorizes the Company to repurchase up to $250.0 million of its common stock. These purchases can be made in the open market or through private transactions from time to time over the 18 monthsmonth time period following authorization, depending on prevailing market conditions and applicable legal and regulatory requirements. Purchase activity will be dependent on various factors, including the Company's capital position, operating results, funds generated by asset sales, dividends
SPIRIT REALTY CAPITAL, INC. and SPIRIT REALTY, L.P.
Notes to Consolidated Financial Statements - (continued)
December 31, 2017
that may be required by those sales, and investment options that may be available, including acquiring new properties or retiring debt. The stock repurchase program does not obligate the Company to repurchase any specific number of shares and may be suspended at any time at the Company's discretion. The Company intends to fund any repurchases with the net proceeds from asset sales, cash flows from operations, existing cash on the balance sheet and other sources. During the year endedAs of December 31, 2016, no2017, 9,502,670 shares of the Company's common stock washave been repurchased in open market transactions under the stock repurchase program.program, at a weighted average price of $8.67 per share, leaving $167.6 million in available capacity. Fees associated with the repurchases of $0.2 million, are included in retained earnings.
Dividends Declared
In fiscal years 20162017 and 2015,2016, the Company's boardBoard of directorsDirectors declared the following preferred and common stock dividends:
|
| | | | | | | | | | | | |
| Declaration Date | | Dividend Per Share | | Record Date | | Total Amount (1) | | Payment Date |
| | | | | | | (in Thousands) | | |
| 2016 | | | | | | | | |
| March 15, 2016 | | $ | 0.17500 |
| | March 31, 2016 | | $ | 77,596 |
| | April 15, 2016 |
| June 15, 2016 | | 0.17500 |
| | June 30, 2016 | | 83,940 |
| | July 15, 2016 |
| September 15, 2016 | | 0.17500 |
| | September 30, 2016 | | 84,604 |
| | October 14, 2016 |
| December 15, 2016 | | 0.18000 |
| | December 30, 2016 | | 87,040 |
| | January 13, 2017 |
| Total | | $ | 0.70500 |
| | | | $ | 333,180 |
| | |
| | | | | | | | | |
| 2015 | | | | | | | | |
| March 16, 2015 | | $ | 0.17000 |
| | March 31, 2015 | | $ | 71,123 |
| | April 15, 2015 |
| June 15, 2015 | | 0.17000 |
| | June 30, 2015 | | 75,054 |
| | July 15, 2015 |
| September 15, 2015 | | 0.17000 |
| | September 30, 2015 | | 75,039 |
| | October 15, 2015 |
| December 15, 2015 | | 0.17500 |
| | December 31, 2015 | | 77,315 |
| | January 15, 2016 |
| Total | | $ | 0.68500 |
| | | | $ | 298,531 |
| | |
|
| | | | | | | | | | | | |
| Declaration Date | | Dividend Per Share | | Record Date | | Total Amount (1) | | Payment Date |
| | | | | | | (in Thousands) | | |
| 2017 | | | | | | | | |
| Preferred Stock | | | | | | | | |
| December 8, 2017 | | $ | 0.36667 |
| | December 19, 2017 | | $ | 2,530 |
| | December 29, 2017 |
| Common Stock | | | | | | | | |
| March 15, 2017 | | $ | 0.18000 |
| | March 31, 2017 | | $ | 87,122 |
| | April 14, 2017 |
| June 15, 2017 | | 0.18000 |
| | June 30, 2017 | | 82,422 |
| | July 14, 2017 |
| September 15, 2017 | | 0.18000 |
| | September 29, 2017 | | 82,062 |
| | October 13, 2017 |
| December 8, 2017 | | 0.18000 |
| | December 29, 2017 | | 80,796 |
| | January 12, 2018 |
| Total Common Dividend | | $ | 0.72000 |
| | | | $ | 332,402 |
| | |
| | | | | | | | | |
| 2016 | | | | | | | | |
| Common Stock | | | | | | | | |
| March 15, 2016 | | $ | 0.17500 |
| | March 31, 2016 | | $ | 77,596 |
| | April 15, 2016 |
| June 15, 2016 | | 0.17500 |
| | June 30, 2016 | | 83,940 |
| | July 15, 2016 |
| September 15, 2016 | | 0.17500 |
| | September 30, 2016 | | 84,604 |
| | October 14, 2016 |
| December 15, 2016 | | 0.18000 |
| | December 30, 2016 | | 87,040 |
| | January 13, 2017 |
| Total Common Dividend | | $ | 0.70500 |
| | | | $ | 333,180 |
| | |
(1) Net of estimated forfeitures of approximately $3,300 and $12,000 for each of the years ended December 31, 20162017 and December 31, 2015,2016, respectively, for dividends declared on employee restricted stock awards that are reported in general and administrative on the accompanying consolidated statements of operations.
The dividends declared in December 20162017 were paid in January 2017,2018, and were included in accounts payable, accrued expenses and other liabilities in the consolidated balance sheets.
Note 8. Commitments and Contingencies
The Company is periodically subject to claims or litigation in the ordinary course of business, including claims generated from business conducted by tenants on real estate owned by the Company. In these instances, the Company is typically indemnified by the tenant against any losses that might be suffered, and the Company and/or the tenant are insured against such claims.
On September 8, 2015, Haggen Holdings, LLC and a number of its affiliates, including Haggen Operations Holdings, LLC, (collectively, the "Debtors") filed petitions for bankruptcy protection under Chapter 11 of the U.S. Bankruptcy Code in the U.S. Bankruptcy Court for the District of Delaware. At the time of the filing, Haggen Operations Holdings, LLC leased 20 properties on a triple net basis from a subsidiary of the Company under a master lease.
The Company's subsidiary
SPIRIT REALTY CAPITAL, INC. and SPIRIT REALTY, L.P.
Notes to Consolidated Financial Statements - (continued)
December 31, 2017
On November 25, 2015, Haggen and Spirit restructured the Debtors have sincemaster lease in an initial settlement agreement with approved claims of $21.0 million.
On April 1, 2016, Spirit entered into two separatea second settlement agreements, of which Albertson'sagreement with both Haggen and Albertsons, LLC was party to one of the settlements, totaling $27.4for $3.4 million of which $24.4 million relates to damages claims owed by the Debtors and $3.0 million, relates to rent reduction for an amended lease with Albertson's LLC. To date the Company has collected $5.5 million of the total claims and there is no guaranty that the remaining claims will be paid or otherwise satisfied in fill. respectively.
As a result of the settlements, the leases for seven locations were rejected and the leases for thirteen locations were affirmedassumed by the Debtors and assumed byassigned to the following tenants: five locations by Albertson'sto Albertsons, LLC, five locations byto Smart & Final, LLC, two locations byto Gelson's Markets and one location byto Safeway, Inc.
As of December 31, 2016,2017, the Company has sold five locationsten of the properties for total proceeds of $52.1$110.3 million, has elevenincluding six of the original seven rejected locations, resulting in nine locations with leases in-place withunder substantially the same terms and rent (inclusive of the$3.0the $3.0 million paymentsettlement related to rent reduction for the rent reduction)an amended lease with Albertsons, LLC) and we have four locationsone location that remainremains vacant.
At December 31, 2016,2017, there were no outstanding claims against the Company that are expected to have a material adverse effect on the Company’s financial position, results of operations or cash flows.
At December 31, 2016,2017, the Company had commitments totaling $98.7$63.4 million, of which $45.6$29.3 million relates to future acquisitions with the remainder to fund improvements on properties the Company currently owns. Commitments related to acquisitions contain standard cancellation clauses contingent on the results of due diligence. Of the $98.7$63.4 million of total commitments, $98.4$59.5 million is expected to be funded during fiscal year 2017.2018. In addition, the Company is contingently liable for $5.7 million of debt owed by one of its tenants until the maturity of the debt on March 15, 2022 and is indemnified by that tenant for any payments the Company may be required to make on such debt.
The Company estimates future costs for known environmental remediation requirements when it is probable that the Company has incurred a liability and the related costs can be reasonably estimated. The Company considers various factors when estimating its environmental liabilities, and adjustments are made when additional information becomes available that affects the estimated costs to study or remediate any environmental issues. When only a wide range of estimated amounts can be reasonably established and no other amount within the range is better than another, the low end of the range is recorded in the consolidated financial statements. As of December 31, 2017, no accruals have been made.
The Company leases its current corporate office space and certain operating equipment under non-cancelable agreements from unrelated third parties. Total rental expense included in general and administrative expense amounted to $1.5$0.9 million, $0.7$1.5 million and $0.7 million for the years ended December 31, 2017, 2016 2015 and 2014,2015, respectively. The Company's lease of its current corporate office space has an initial term that expires on January 31, 2027 and is renewable at the Company's option for two additional periods of five years each after the initial term. The Company is also a lessee under thirteen long-term, non-cancelable ground leases under which it is obligated to pay monthly rent as of December 31, 2016.2017. Total rental expense included in property costs amounted to $1.5 million, $1.4 million for the year ended December 31, 2016 and $1.2 million for each of the years ended December 31, 20152017, 2016 and 2014,2015, respectively. Certain ground lease rental expenses are reimbursed by unrelated third parties, and the corresponding rental revenue is recorded in rentals on the accompanying consolidated statements of operations.
SPIRIT REALTY CAPITAL, INC. and SPIRIT REALTY, L.P.
Notes to Consolidated Financial Statements - (continued)
December 31, 2016
The Company’s minimum aggregate rental commitments under all non-cancelable operating leases as of December 31, 20162017 are as follows (in thousands):
| | | | Ground Leases | | Office and Equipment Leases | | Total | Ground Leases | | Office and Equipment Leases | | Total |
| 2017 | $ | 1,515 |
| | $ | 1,397 |
| | $ | 2,912 |
| |
| 2018 | 1,521 |
| | 1,500 |
| | 3,021 |
| $ | 1,630 |
| | $ | 1,527 |
| | $ | 3,157 |
|
| 2019 | 1,521 |
| | 1,505 |
| | 3,026 |
| 1,646 |
| | 1,532 |
| | 3,178 |
|
| 2020 | 1,521 |
| | 1,516 |
| | 3,037 |
| 1,649 |
| | 1,529 |
| | 3,178 |
|
| 2021 | 1,441 |
| | 1,531 |
| | 2,972 |
| 1,655 |
| | 1,532 |
| | 3,187 |
|
| 2022 | | 1,578 |
| | 1,547 |
| | 3,125 |
|
| Thereafter | 15,929 |
| | 8,021 |
| | 23,950 |
| 21,543 |
| | 6,474 |
| | 28,017 |
|
| Total | $ | 23,448 |
| | $ | 15,470 |
| | $ | 38,918 |
| $ | 29,701 |
| | $ | 14,141 |
| | $ | 43,842 |
|
Note 9. Fair Value Measurements
Recurring Fair Value Measurements
The Company’s liabilities that are required to be measured at fair value in the accompanying consolidated financial statements are summarized below. The following table sets forth the Company’s financial liabilities that were accounted for at fair value on a recurring basis (in thousands):
|
| | | | | | | | | | | | | | | |
| | | | Fair Value Hierarchy Level |
| | Fair Value | | Level 1 | | Level 2 | | Level 3 |
| December 31, 2016 | | | | | | | |
| Derivatives: | | | | | | | |
| Interest rate swaps financial liabilities | $ | — |
| | $ | — |
| | $ | — |
| | $ | — |
|
| December 31, 2015 | | | | | | | |
| Derivatives: | | | | | | | |
| Interest rate swaps financial liabilities | $ | (934 | ) | | $ | — |
| | $ | (934 | ) | | $ | — |
|
The interest rate swaps are measured using a market approach, using prices obtained from a nationally recognized pricing service and pricing models with market observable inputs such as interest rates and volatilities. These measurements are classified as Level 2 of the fair value hierarchy.
SPIRIT REALTY CAPITAL, INC. and SPIRIT REALTY, L.P.
Notes to Consolidated Financial Statements - (continued)
December 31, 20162017
Note 9. Fair Value Measurements
Fair Value Measurements
The fair value measurement framework specifies a hierarchy of valuation inputs which was established to increase consistency, clarity and comparability in fair value measurements and related disclosures. The fair value hierarchy is based upon three levels of inputs that may be used to measure fair value, two of which are considered observable and one that is considered unobservable. The following describes the three levels:
Level 1 – Valuation is based upon quoted prices in active markets for identical assets or liabilities.
Level 2 – Valuation is based upon inputs other than Level 1 that are observable, either directly or indirectly, such as quoted prices for similar assets or liabilities, quoted prices in markets that are not active or other inputs that are observable or can be corroborated by observable market data for substantially the full term of the assets or liabilities.
Level 3 – Inputs that are unobservable and significant to the overall fair value measurement of the assets or liabilities. These types of inputs include the Company's own assumptions.
Recurring Fair Value Measurements
The Company did not have any assets or liabilities that are required to be measured at fair value on a recurring basis as of December 31, 2017 and December 31, 2016.
Nonrecurring Fair Value Measurements
Fair value measurement of an asset on a nonrecurring basis occurs when events or changes in circumstances related to an asset indicate that the carrying amount of the asset is no longer recoverable. The following table sets forth the Company’s assets that were accounted for at fair value on a nonrecurring basis as of December 31, 20162017 and 20152016 (in thousands):
| | | | | | | | Fair Value Hierarchy Level | | Impairment Charges | | | Fair Value Hierarchy Level | |
| Description | Fair Value | | Dispositions | | Level 1 | | Level 2 | | Level 3 | | Fair Value | | Level 1 | | Level 2 | | Level 3 | |
| December 31, 2017 | | | | | | | | | |
| Retail | | 21,598 |
| |
| |
| | 21,598 |
| |
| Industrial | | 750 |
| |
| |
| | 750 |
| |
| Office | | 5,964 |
| |
| |
| | 5,964 |
| |
| Long-lived assets held and used | | $ | 28,312 |
| | $ | — |
| | $ | — |
| | $ | 28,312 |
| |
| Long-lived assets held for sale | | 42,142 |
| | — |
| | — |
| | 42,142 |
| |
| | | | | | | | | | |
| December 31, 2016 | | | | | | | | | | | | | | | | | | | |
| Retail | 33,766 |
| | (4,168 | ) | |
| |
| | 37,934 |
| | (37,445 | ) | 33,766 |
| | — |
| | — |
| | 33,766 |
| |
| Industrial | 2,394 |
| | (1,347 | ) | |
| |
| | 3,741 |
| | (5,948 | ) | 2,394 |
| | — |
| | — |
| | 2,394 |
| |
| Office | 8,538 |
| |
| |
| |
| | 8,538 |
| | (10,121 | ) | 8,538 |
| | — |
| | — |
| | 8,538 |
| |
| Long-lived assets held and used | $ | 44,698 |
| | $ | (5,515 | ) | | $ | — |
| | $ | — |
| | $ | 50,213 |
| | $ | (53,514 | ) | $ | 44,698 |
| | $ | — |
| | $ | — |
| | $ | 44,698 |
| |
| Lease intangible assets | 6,384 |
| | — |
| | — |
| | — |
| | 6,384 |
| | (9,116 | ) | 6,384 |
| | — |
| | — |
| | 6,384 |
| |
| Other assets | 27 |
| |
|
| | — |
| | — |
| | 27 |
| | (198 | ) | 27 |
| | — |
| | — |
| | 27 |
| |
| Long-lived assets held for sale | 24,493 |
| | (36,907 | ) | | — |
| | — |
| | 61,400 |
| | (25,447 | ) | 24,493 |
| | — |
| | — |
| | 24,493 |
| |
| | | | | | | | | | | | (88,275 | ) | | | | | | | | |
| December 31, 2015 | | | | | | | | | | | | |
| Retail | 29,626 |
| | (3,207 | ) | | — |
| | — |
| | 32,833 |
| | (20,727 | ) | |
| Industrial | 9,598 |
| | — |
| | — |
| | — |
| | 9,598 |
| | (16,182 | ) | |
| Office | 21,074 |
| | — |
| | — |
| | — |
| | 21,074 |
| | (14,093 | ) | |
| Long-lived assets held and used | $ | 60,298 |
| | $ | (3,207 | ) | | $ | — |
| | $ | — |
| | $ | 63,505 |
| | $ | (51,002 | ) | |
| Lease intangible assets | 3,843 |
| | — |
| | — |
| | — |
| | 3,843 |
| | (3,825 | ) | |
| Other assets | — |
| | — |
| | — |
| | — |
| | — |
| | (324 | ) | |
| Long-lived assets held for sale | 15,957 |
| | (33,563 | ) | | — |
| | — |
| | 49,520 |
| | (15,578 | ) | |
| | | | | | | | | | | | $ | (70,729 | ) | |
Real estate assets and their related intangible assets are evaluated for impairment based on certain indicators including, but not limited to: the asset being held for sale, vacant, non-operating or the lease on the asset expiring in twelve months or less. The fair values of impaired real estate and intangible assets were determined by using the following information, depending on availability, in order of preference: signed purchase and sale agreements or letters of intent;
SPIRIT REALTY CAPITAL, INC. and SPIRIT REALTY, L.P.
Notes to Consolidated Financial Statements - (continued)
December 31, 2017
recently quoted bid or ask prices, or market prices for comparable properties; estimates of cash flow, which consider, among other things, contractual and forecasted rental revenues, leasing assumptions, and expenses based upon market conditions; and expectations for the use of the real estate. Based on these inputs, the Company determined that its valuation of the impaired real estate and intangible assets falls within Level 3 of the fair value hierarchy.
DuringFor the yearyears ended December 31, 20162017 and for the year ended December 31, 2015,2016, we determined that thirty-three18 and eighteen33 long-lived assets held and used, respectively, were impaired. The
For 17 of the held and used properties impaired during the year ended December 31, 2017 and 16 of the held and used properties impaired during the year ended December 31, 2016, the Company estimated theproperty fair value on sixteenusing price per square foot of comparable properties. The following table provides information about the impaired properties using the weighted average sales price per square foot of comparable properties inputs used:
|
| | | | | | | | | | | | | | | | | | |
| | | December 31, 2017 | | December 31, 2016 |
| Description | | Range | | Weighted Average | | Square Footage | | Range | | Weighted Average | | Square Footage |
| Long-lived assets held and used by asset type | | | | | | |
| Retail | | $13.66 - $305.05 | | $ | 55.68 |
| | 364,940 |
| | $17.17 - $502.23 | | $ | 58.78 |
| | 290,770 |
|
| Industrial | | $3.30 - $8.56 | | 5.35 |
| | 370,824 |
| | $26.43 | | $ | 26.43 |
| | 104,864 |
|
| Office | | $24.82 - $244.86 | | $ | 40.14 |
| | 161,346 |
| | $35.00 | | $ | 35.00 |
| | 135,675 |
|
For the remaining one held and used property impaired during the year ended December 31, 2017 and 17 held and used properties impaired during the year ended December 31, 2016, and on thirteenthe Company estimated property fair value using price per square foot of the eighteen impaired properties duringlisting price or a broker opinion of value. The following table provides information about the yearprice per square foot of listing price and broker opinion of value inputs used:
|
| | | | | | | | | | | | | | | | | | |
| | | December 31, 2017 | | December 31, 2016 |
| Description | | Range | | Weighted Average | | Square Footage | | Range | | Weighted Average | | Square Footage |
| Long-lived assets held and used by asset type | | | | | | |
| Retail | | $88.89 - $88.89 | | $ | 88.89 |
| | 22,500 |
| | $15.40 - $170.02 | | $ | 40.80 |
| | 516,916 |
|
| Industrial | | — | | $ | — |
| | — |
| | $9.09 | | $ | 9.09 |
| | 149,627 |
|
| Office | | — | | $ | — |
| | — |
| | $56.81 | | $ | 56.81 |
| | 34,992 |
|
For the years ended December 31, 2015.2017 and 2016, we determined that 8 and 9 long-lived assets held for sale, respectively, were impaired. The Company estimated property fair value of held for sale properties using price per square foot from the signed purchase and sale agreements. The following table provides information about the price per square foot from signed purchase and sale agreements used:
|
| | | | | | | | | | | | | | | | | | |
| | | December 31, 2017 | | December 31, 2016 |
| Description | | Range | | Weighted Average | | Square Footage | | Range | | Weighted Average | | Square Footage |
| Long-lived assets held for sale by asset type | | | | | | |
| Retail | | $55.30 - $346.23 | | $ | 230.52 |
| | 150,376 |
| | $19.66 - $393.02 | | $ | 95.11 |
| | 265,610 |
|
| Industrial | | $24.02 - $54.21 | | $ | 37.09 |
| | 223,747 |
| | | | | | |
SPIRIT REALTY CAPITAL, INC. and SPIRIT REALTY, L.P.
Notes to Consolidated Financial Statements - (continued)
December 31, 20162017
The following table provides information about the weighted average sales price per square foot of comparable properties used to estimate fair value (price per square foot in dollars):
|
| | | | | | | | | | | | | | | | | |
| | December 31, 2016 | | December 31, 2015 |
| | Range | | Weighted Average | | Square Footage | | Range | | Weighted Average | | Square Footage |
| Long-lived assets held and used by asset type | | | | | | |
| Retail | $17.17 - $502.23 | | $ | 58.78 |
| | 290,770 |
| | $41.21 - $168.30 | | $ | 79.90 |
| | 153,008 |
|
| Industrial | $26.43 | | $ | 26.43 |
| | 104,864 |
| | $17.77 - $22.00 | | $ | 19.40 |
| | 375,076 |
|
| Office | $35.00 | | $ | 35.00 |
| | 135,675 |
| | $58.17 - $133.61 | | $ | 104.53 |
| | 204,936 |
|
The Company estimated the fair value on the seventeen remaining impaired properties using the weighted average listing price or broker opinion of value per square foot during the year ended December 31, 2016 and on five of the eighteen impaired properties during the year ended December 31, 2015.
The following table provides information about the weighted average listing price and broker opinion of value per square foot of comparable properties used to estimate fair value (price per square foot in dollars):
|
| | | | | | | | | | | | | | | | | |
| | December 31, 2016 | | December 31, 2015 |
| | Range | | Weighted Average | | Square Footage | | Range | | Weighted Average | | Square Footage |
| Long-lived assets held and used by asset type | | | | | | |
| Retail | $15.40 - $170.02 | | $ | 40.80 |
| | 516,916 |
| | $65.85 - $161.61 | | $ | 114.12 |
| | 204,269 |
|
| Industrial | $9.09 | | $ | 9.09 |
| | 149,627 |
| | $12.17 | | $ | 12.17 |
| | 369,655 |
|
| Office | $56.81 | | $ | 56.81 |
| | 34,992 |
| | — | | $ | — |
| | — |
|
Estimated Fair Value of Financial Instruments
Financial assets and liabilities for which the carrying values approximate their fair values include cash and cash equivalents, restricted cash and escrow deposits, and accounts receivable and payable. Generally, these assets and liabilities are short-term in duration and are recorded at cost, which approximates fair value, on the accompanying consolidated balance sheets.
In addition to the disclosures for assets and liabilities required to be measured at fair value at the balance sheet date, companies are required to disclose the estimated fair values of all financial instruments, even if they are not carried at their fair values. The fair values of financial instruments are estimates based upon market conditions and perceived risks at December 31, 20162017 and 2015.2016. These estimates require management’s judgment and may not be indicative of the future fair values of the assets and liabilities.
SPIRIT REALTY CAPITAL, INC. and SPIRIT REALTY, L.P.
Notes to Consolidated Financial Statements - (continued)
December 31, 2016
The estimated fair values of the loans receivable, Revolving Credit Facilities,Facility, Term Loan, Senior Unsecured Notes, Convertible Notes and the fixed-rate mortgages and notes payable have been derived based on market quotes for comparable instruments or discounted cash flow analyses using estimates of the amount and timing of future cash flows, market rates and credit spreads. The loans receivable, Revolving Credit Facilities,Facility, Term Loan, Senior Unsecured Notes, Convertible Notes and the mortgages and notes payable were measured using a market approach from nationally recognized financial institutions with market observable inputs such as interest rates and credit analytics. These measurements are classified as Level 2 of the fair value hierarchy. The following table discloses fair value information for these financial instruments (in thousands):
| | | | December 31, 2016 | | December 31, 2015 | December 31, 2017 | | December 31, 2016 |
| | Carrying Value | | Estimated Fair Value | | Carrying Value | | Estimated Fair Value | Carrying Value | | Estimated Fair Value | | Carrying Value | | Estimated Fair Value |
| Loans receivable, net | $ | 66,578 |
| | $ | 71,895 |
| | $ | 104,003 |
| | $ | 110,019 |
| $ | 79,967 |
| | $ | 82,886 |
| | $ | 66,578 |
| | $ | 71,895 |
|
Revolving Credit Facilities, net (1) | 86,000 |
| | 87,718 |
| | — |
| | — |
| |
| Revolving Credit Facility, net | | 112,000 |
| | 111,997 |
| | 86,000 |
| | 87,718 |
|
Term Loan, net (2) | 418,471 |
|
| 428,441 |
| | 322,902 |
| | 338,366 |
| — |
|
| — |
| | 418,471 |
| | 428,441 |
|
Senior Unsecured Notes | 295,112 |
| | 283,473 |
| | — |
| | — |
| 295,321 |
| | 299,049 |
| | 295,112 |
| | 283,473 |
|
Convertible Notes, net (2)(1) | 702,642 |
| | 784,175 |
| | 690,098 |
| | 713,095 |
| 715,881 |
| | 761,440 |
| | 702,642 |
| | 784,175 |
|
Mortgages and notes payable, net (2)(1) | 2,162,403 |
| | 2,282,142 |
| | 3,079,787 |
| | 3,220,239 |
| 2,516,478 |
| | 2,657,599 |
| | 2,162,403 |
| | 2,282,142 |
|
(1) As of December 31, 2015, only amounts under the Line of Credit were outstanding and net of unamortized deferred financing costs.
(2) The carrying value of the debt instruments are net of unamortized deferred financing costs and certain debt discounts/premiums.
(2) The carrying value of the debt instrument as of December 31, 2016 is net of unamortized deferred financing costs .
Note 10. Significant Credit and Revenue Concentration
As of December 31, 20162017 and 20152016, the Company’s real estate investments are operated by 450419 and 438450 tenants, respectively, that operate within retail, office and industrial property types across various industries throughout the U.S. Shopko operates in the general merchandise industry and is the Company’s largest tenant.tenant as a percentage of rental revenue. Total rental revenues from properties leased to Shopko for the monthyears ended December 31, 20162017 and 20152016, contributed 8.2%7.7% and 9.1%9.0%, respectively, of the Company's Normalized Rental Revenue from continuing operations, respectively.rental revenue shown in the accompanying consolidated statements of operations. No other tenant contributed 4% or more of the Company’s Normalized Revenuerental revenue during any of the periods presented. As of December 31, 20162017 and 20152016, the Company's net investment in Shopko properties represents approximately 5.8%5.1% and 6.9%5.8%, respectively, of the Company's total assets andshown in the Company's real estate investment in Shopko represents approximately 7.7% and 9.0%, respectively, of the Company’s total real estate investment portfolio.accompanying consolidated balance sheets.
SPIRIT REALTY CAPITAL, INC. and SPIRIT REALTY, L.P.
Notes to Consolidated Financial Statements - (continued)
December 31, 20162017
Note 11. Discontinued Operations
Effective January 1, 2014, the Company adopted ASU No. 2014-08, Presentation of Financial Statements (Topic 205) and Property, Plant, and Equipment (Topic 360): Reporting Discontinued Operations and Disclosures of Disposals of Components of an Entity, under which only disposals representing a strategic shift in operations of the Company and that have (or will have) a major effect on the Company’s operations and financial results are to be presented as discontinued operations. PropertiesOnly properties that were reported as held for sale as of December 31, 2013, will bewere presented in discontinued operations until the properties are disposed of. As a result,and net gains or losses from the disposition of these properties as well as the current and prior period operations, will continue to bewere reclassified to discontinued operations. The following sets forth the results of discontinued operations, as of (dollars in thousands):
|
| | | | | | | | | | | |
| | Years Ended December 31, |
| | 2016 | | 2015 | | 2014 |
| Revenues: | | | | | |
| Rent | $ | — |
| | $ | 447 |
| | $ | 1,206 |
|
| Non-cash rent | — |
| | — |
| | (80 | ) |
| Other | — |
| | 17 |
| | 2,972 |
|
| Total revenues | — |
| | 464 |
| | 4,098 |
|
| Expenses: | | | | | |
| General and administrative | — |
| | 4 |
| | 15 |
|
| Property costs | — |
| | 328 |
| | 298 |
|
| Interest | — |
| | — |
| | — |
|
| Depreciation and amortization | — |
| | — |
| | — |
|
| Impairments | — |
| | 34 |
| | 417 |
|
| Total expenses | — |
| | 366 |
| | 730 |
|
| Gain (loss) from discontinued operations before other income | — |
| | 98 |
| | 3,368 |
|
| Other income: | | | | | |
| Gain on debt extinguishment | — |
| | — |
| | — |
|
| Other | — |
| | — |
| | — |
|
| Total other income | — |
| | — |
| | — |
|
| Income (loss) from discontinued operations | — |
| | 98 |
| | 3,368 |
|
| Gain on disposition of assets | — |
| | 590 |
| | 325 |
|
| Total discontinued operations | $ | — |
| | $ | 688 |
| | $ | 3,693 |
|
| Number of properties disposed of during period | — |
| | 2 |
| | 6 |
|
|
| | | | | | | | | | | |
| | Years Ended December 31, |
| | 2017 | | 2016 | | 2015 |
| Revenues: | | | | | |
| Rentals | $ | — |
| | $ | — |
| | $ | 447 |
|
| Other income | — |
| | — |
| | 17 |
|
| Total revenues | — |
| | — |
| | 464 |
|
| Expenses: | | | | | |
| General and administrative | — |
| | — |
| | 4 |
|
| Property costs (including reimbursable) | — |
| | — |
| | 328 |
|
| Impairments | — |
| | — |
| | 34 |
|
| Total expenses | — |
| | — |
| | 366 |
|
| Income from discontinued operations | — |
| | — |
| | 98 |
|
| Gain on disposition of assets | — |
| | — |
| | 590 |
|
| Total discontinued operations | $ | — |
| | $ | — |
| | $ | 688 |
|
SPIRIT REALTY CAPITAL, INC. and SPIRIT REALTY, L.P.
Notes to Consolidated Financial Statements - (continued)
December 31, 2016
Note 12. Supplemental Cash Flow Information
The following table presents the supplemental cash flow disclosures (in thousands): | | | | | Years Ended December 31, | | Years Ended December 31, |
| | | 2016 | | 2015 | | 2014 | | 2017 | | 2016 | | 2015 |
| Supplemental Disclosures of Non-Cash Investing and Financing Activities: | | | | | | | | | | | | |
| Reduction and assumption of debt through sale of certain real estate properties | | $ | 7,208 |
| | $ | 30,555 |
| | $ | 5,001 |
| | $ | 39,141 |
| | $ | 7,208 |
| | $ | 30,555 |
|
| Financing provided in connection with disposition of assets | | | 24,015 |
| | — |
| | — |
|
| Net real estate and other collateral assets surrendered to lender | | 30,381 |
| | 7,384 |
| | — |
| | 38,547 |
| | 30,381 |
| | 7,384 |
|
| Reduction of debt in exchange for collateral assets | | 47,025 |
| | 7,904 |
| | — |
| | — |
| | 47,025 |
| | 7,904 |
|
| Real estate acquired in exchange for loans receivable | | 26,609 |
| | — |
| | — |
| | — |
| | 26,609 |
| | — |
|
| Debt assumed through real estate property acquisition | | — |
| | — |
| | 10,528 |
| |
| Reclass of residual value on expired deferred financing lease to operating asset | | | 11,088 |
| | — |
| | — |
|
Accrued interest capitalized to principal (1) | | 4,332 |
| | 6,035 |
| | 2,598 |
| | 3,839 |
| | 4,332 |
| | 6,035 |
|
| Accrued performance share dividend rights | | 489 |
| | 564 |
| | 565 |
| | 817 |
| | 489 |
| | 564 |
|
| Distributions declared and unpaid | | | 80,792 |
| | 87,055 |
| | 76,940 |
|
| Supplemental Cash Flow Disclosures: | | | | | | | | | | | | |
| Interest paid | | $ | 182,105 |
| | $ | 206,115 |
| | $ | 209,032 |
| | $ | 163,623 |
| | $ | 182,105 |
| | $ | 206,115 |
|
| Taxes paid, net of refunds | | 914 |
| | 1,919 |
| | 2,416 |
| | 911 |
| | 914 |
| | 1,919 |
|
(1) Accrued and overdue interest on certain CMBS notes that have been intentionally placed in default.
Note 13. Incentive Award Plan and Employee Benefit Plan
Amended Incentive Award Plan
Under the Amended Incentive Award Plan, the Company may grant equity incentive awards to eligible employees, directors and other service providers. Awards under the Amended Incentive Award Plan may be in the form of stock options, restricted stock, dividend equivalents, restricted stock units, stock appreciation rights, performance awards, stock payment awards, performance share awards, LTIP units and other incentive awards. If an award under the Amended Incentive Award Plan is forfeited, expires or is settled for cash, any shares subject to such award may, to the extent of such forfeiture, expiration or cash settlement, be used again for new grants under the Amended Incentive Award Plan. As of December 31, 2016, 5.72017, 4.1 million shares remained available for award under the Amended Incentive Award Plan.
During the years ended December 31, 2017, 2016 2015 and 2014,2015, portions of awards of restricted common stock granted to certain of the Company’s officers and other employees vested. The vesting of these shares, granted pursuant to the Amended Incentive Award Plan, resulted in federal and state income tax liabilities for the recipients. As permitted by the terms of the Amended Incentive Award Plan and the award grants, certain executive officers and employees elected to surrender 0.4 million, 0.1 million 0.4 million and 0.30.4 million shares of common stock, respectively, valued at $3.5 million, $0.8 million $4.3 million and $2.9$4.3 million, respectively, solely to pay the associated minimum statutory tax withholdings during the years ended December 31, 2017, 2016 2015 and 2014. Shares2015. Common shares repurchased are considered retired under Maryland law and the cost of the stock repurchased is recorded as a reduction to common stock and accumulated deficit on the consolidated balance sheets.
Restricted Shares of Common Stock
During the year ended December 31, 2016,2017, the Company granted 0.91.1 million restricted shares under the Amended Incentive Award Plan to certain executive officers, employees and members of the Board of Directors. The fair value of the restricted stock grants was determined based on the Company's closing stock price on the date of grant. The Company recorded $11.7$9.9 million in deferred compensation associated with these grants, which will be recognized in
SPIRIT REALTY CAPITAL, INC. and SPIRIT REALTY, L.P.
Notes to Consolidated Financial Statements - (continued)
December 31, 2017
expense over the requisite service period, generally which is three years, with a remaining weighted average recognition period of 1.9 years.
SPIRIT REALTY CAPITAL, INC. and SPIRIT REALTY, L.P.
Notes to Consolidated Financial Statements - (continued)
December 31, 2016
The following table summarizes restricted share activity under the Amended Incentive Award Plan: | | | | 2016 | | 2015 | | 2014 | 2017 | | 2016 | | 2015 |
| | Number of Shares | | Weighted Average Price (1) (per share) | | Number of Shares | | Weighted Average Price (1) (per share) | | Number of Shares | | Weighted Average Price (1) (per share) | Number of Shares | | Weighted Average Price (1) (per share) | | Number of Shares | | Weighted Average Price (1) (per share) | | Number of Shares | | Weighted Average Price (1) (per share) |
| Outstanding non-vested shares, beginning of year | 771,003 |
| | $ | 11.29 |
| | 1,299,807 |
| | $ | 9.12 |
| | 1,777,652 |
| | $ | 8.41 |
| 1,034,615 |
| | $ | 12.55 |
| | 771,003 |
| | $ | 11.29 |
| | 1,299,807 |
| | $ | 9.12 |
|
| Shares granted | 948,793 |
| | 12.58 |
| | 495,688 |
| | 11.87 |
| | 372,974 |
| | 10.85 |
| 1,103,563 |
| | 9.23 |
| | 948,793 |
| | 12.58 |
| | 495,688 |
| | 11.87 |
|
| Shares vested | (562,581 | ) | | 11.10 |
| | (1,005,088 | ) | | 8.77 |
| | (846,102 | ) | | 8.37 |
| (657,671 | ) | | 11.30 |
| | (562,581 | ) | | 11.10 |
| | (1,005,088 | ) | | 8.77 |
|
| Shares forfeited | (122,600 | ) | | 11.56 |
| | (19,404 | ) | | 11.53 |
| | (4,717 | ) | | 10.60 |
| (45,804 | ) | | 11.66 |
| | (122,600 | ) | | 11.56 |
| | (19,404 | ) | | 11.53 |
|
| Outstanding non-vested shares, end of year | 1,034,615 |
| | $ | 12.55 |
| | 771,003 |
| | $ | 11.29 |
| | 1,299,807 |
| | $ | 9.12 |
| 1,434,703 |
| | $ | 10.60 |
| | 1,034,615 |
| | $ | 12.55 |
| | 771,003 |
| | $ | 11.29 |
|
(1) Based on grant date fair values.
Historical staff turnover rates are used by theThe Company adopted ASU 2016-09, Improvements to estimate the forfeiture rate for its non-vested shares. Accordingly, changes in actual forfeiture rates will affectEmployee Share-Based Payment Accounting, effective January 1, 2017 and made an accounting policy election to recognize stock-based compensation expense during the applicable period.forfeitures as they occur, whereas previously stock-based compensation forfeitures were estimated and recognized based on historical forfeiture rates.
Performance Share Awards
Since August 2013, performance share awards have been granted to executive officers upon approval from the Board of Directors or committee thereof. These awards are granted at a target number of units and represent shares that are potentially issuable in the future. The performance share awards vest based on the Company’s stock price and dividend performance, TSR, at the end of, generally, three-year periods relative to a group of industry peers. Potential shares of the Corporation's common stock that each participant is eligible to receive is based on the initial target number of shares granted multiplied by a percentage range between 0% and 250%. Grant date fair value of the performance share awards was calculated using the Monte Carlo simulation model, which incorporated stock price correlation, projected dividend yields and other variables over the time horizons matching the performance periods. Stock-based compensation expense associated with unvested performance share awards is recognized on a straight-line basis over the minimum required service period, with a remaining weighted average recognition period of 1.5 years.2.2 years as of December 31, 2017.
In addition, final shares issued under each performance share award entitle its holder to a cash payment equal to the aggregate declared dividends with record dates during the performance period, beginning on the grant date and ending the day before the awards are released. The projected shares to be awarded are not considered issued under the Amended Incentive Award Plan until the performance period has ended and the actual number of shares to be released is determined. The performance shares and dividend rights are subject to forfeiture in the event of a non-qualifying termination of a participant prior to the performance period end date.
SPIRIT REALTY CAPITAL, INC. and SPIRIT REALTY, L.P.
Notes to Consolidated Financial Statements - (continued)
December 31, 20162017
The following table summarizes performance share award activity under the Amended Incentive Award Plan:
| | | | 2016 | | 2015 | | 2014 | 2017 | | 2016 | | 2015 |
| | Number of Target Shares | | Weighted Average Fair Value
(per share) | | Number of Target Shares | | Weighted Average Fair Value
(per share) | | Number of Target Shares | | Weighted Average Fair Value
(per share) | Number of Target Shares | | Weighted Average Fair Value
(per share) | | Number of Target Shares | | Weighted Average Fair Value
(per share) | | Number of Target Shares | | Weighted Average Fair Value
(per share) |
| Outstanding non-vested awards, beginning of year | 472,725 |
| | $ | 14.28 |
| | 610,797 |
| | $ | 13.49 |
| | 367,914 |
| | $ | 13.45 |
| 494,300 |
| | $ | 15.56 |
| | 472,725 |
| | $ | 14.28 |
| | 610,797 |
| | $ | 13.49 |
|
Grants at target (1) | 400,800 |
| | 16.06 |
| | 279,199 |
| | 14.78 |
| | 242,883 |
| | 13.56 |
| 858,226 |
| | 11.88 |
| | 400,800 |
| | 16.06 |
| | 279,199 |
| | 14.78 |
|
Earned (below) above performance target (2) | (42,640 | ) | | 13.56 |
| | 387,027 |
| | 13.45 |
| | — |
| | — |
| — |
| | — |
| | (42,640 | ) | | 13.56 |
| | 387,027 |
| | 13.45 |
|
Vested (3) | (215,438 | ) | | 14.36 |
| | (804,298 | ) | | 13.46 |
| | — |
| | — |
| (466,667 | ) | | 14.48 |
| | (215,438 | ) | | 14.36 |
| | (804,298 | ) | | 13.46 |
|
| Forfeited | (121,147 | ) | | $ | 15.05 |
| | — |
| | $ | — |
| | — |
| | $ | — |
| (42,373 | ) | | $ | 14.78 |
| | (121,147 | ) | | $ | 15.05 |
| | — |
| | $ | — |
|
| Outstanding non-vested awards, end of year | 494,300 |
| | $ | 15.30 |
| | 472,725 |
| | $ | 14.28 |
| | 610,797 |
| | $ | 13.49 |
| 843,486 |
| | $ | 12.45 |
| | 494,300 |
| | $ | 15.56 |
| | 472,725 |
| | $ | 14.28 |
|
(1) The performance period for the 2017 performance awards began January 1, 2017 and continues through December 31, 2019, the performance period for the 2016 performance awards began January 1, 2016 and continues through December 31, 2018 and the performance period for the 2015 performance awards began January 1, 2015 and continues through December 31, 20172017.
(2) Represents shares that were earned below or in excess of target for the grants whose performance periods ended on December 31, 2017, 2016 and December 31, 2015.
(3) The number of shares that vested in 2017, 2016 and 2015 includes 466,667, 155,782, and 134,932 shares, respectively, released at target in connection with qualifying terminations. Dividend rights of $0.5 million, $0.2 million and $1.1 million associated with all shares released were paid in cash during 2016.2017, 2016 and 2015, respectively.
Approximately $0.5$0.8 million and $0.2$0.5 million in dividend rights have been accrued as of December 31, 20162017 and 2015,2016, respectively. For outstanding non-vested awards at December 31, 2016, 429,5442017, 1 million shares would have been released based on the Corporation's TSR relative to the specified peer groups through that date.
Stock-based Compensation Expense
For the years ended December 31, 2017, 2016 2015 and 2014,2015, the Company recognized $16.6 million, $9.6 million $13.3 million and $11.3$13.3 million, respectively, in stock-based compensation expense, which is included in general and administrative expenses in the accompanying consolidated statements of operations.
As of December 31, 2016,2017, the remaining unamortized stock-based compensation expense totaled $14.4$17.7 million, including $9.7$10.0 million related to restricted stock awards and $4.7$7.7 million related to performance share awards, which is recognized as the greater of the amount amortized on a straight-line basis over the service period of each applicable award or the amount vested over the vesting periods.
401(k) Plan
The Company has a 401(k) Plan, which is available to full-time employees who have completed at least three months of service with the Company. Currently, the Company provides a matching contribution in cash, up to a maximum of 4% of compensation, which vests immediately.
SPIRIT REALTY CAPITAL, INC. and SPIRIT REALTY, L.P.
Notes to Consolidated Financial Statements - (continued)
December 31, 2017
Note 14. Income (Loss) Per Share and Partnership Unit
Income per share has been determined using the two-class method which is computed by dividing the sum of distributed earnings to common stockholders and undistributed earnings allocated to common stockholders by the weighted average number of shares of common stock outstanding for the period. In applying the two-class method, undistributed earnings are allocated to both shares of common stock and participating securities based on the weighted average shares outstanding during the period. Classification of the Company's unvested restricted stock, which contain rights to receive non-forfeitable dividends, are deemed participating securities under the two-class method. Under the two-class method, earnings attributable to unvested restricted shares are deducted from income from continuing operations in the computation of net income attributable to common stockholders.
SPIRIT REALTY CAPITAL, INC. and SPIRIT REALTY, L.P.
Notes to Consolidated Financial Statements - (continued)
December 31, 20162017
The table below is a reconciliation of the numerator and denominator used in the computation of basic and diluted net income (loss) per share computed using the two-class method (dollars in thousands):
| | | | Years Ended December 31, | Years Ended December 31, |
| | 2016 | | 2015 | | 2014 | 2017 | | 2016 | | 2015 |
| Basic and diluted income (loss): | | | | | | |
| Income (loss) from continuing operations | $ | 45,081 |
| | $ | 24,103 |
| | $ | (50,859 | ) | |
| Basic and diluted income: | | | | | | |
| Net Income from continuing operations | | $ | 12,042 |
| | $ | 45,081 |
| | $ | 24,103 |
|
| Gain on disposition of assets | 52,365 |
| | 68,421 |
| | 10,221 |
| 65,106 |
| | 52,365 |
| | 68,421 |
|
| Less: income attributable to unvested restricted stock | (614 | ) | | (696 | ) | | (1,099 | ) | (940 | ) | | (614 | ) | | (696 | ) |
| Income (loss) used in basic and diluted income (loss) per share from continuing operations | 96,832 |
| | 91,828 |
| | (41,737 | ) | |
| Less: dividends paid to preferred stockholders | | (2,530 | ) | | — |
| | — |
|
| Income used in basic and diluted income per common share from continuing operations | | 73,678 |
| | 96,832 |
| | 91,828 |
|
| Income from discontinued operations | — |
| | 688 |
| | 3,693 |
| — |
| | — |
| | 688 |
|
| Net income (loss) attributable to common stockholders used in basic and diluted income (loss) per share | $ | 96,832 |
| | $ | 92,516 |
| | $ | (38,044 | ) | |
| Net income attributable to common stockholders used in basic and diluted income per share | | $ | 73,678 |
| | $ | 96,832 |
| | $ | 92,516 |
|
| | | | | | | | | | | |
| Basic weighted average shares of common stock outstanding: | | | | | | | | | | |
| Weighted average shares of common stock outstanding | 470,023,674 |
| | 433,361,726 |
| | 388,604,270 |
| 469,212,533 |
| | 470,023,674 |
| | 433,361,726 |
|
| Less: unvested weighted average shares of restricted stock | (805,898 | ) | | (1,138,773 | ) | | (1,794,524 | ) | (1,277,588 | ) | | (805,898 | ) | | (1,138,773 | ) |
| Weighted average number of shares outstanding used in basic income (loss) per share | 469,217,776 |
| | 432,222,953 |
| | 386,809,746 |
| |
| Net income (loss) per share attributable to common stockholders-basic | $ | 0.21 |
| | $ | 0.21 |
| | $ | (0.10 | ) | |
| Weighted average number of common shares outstanding used in basic income per share | | 467,934,945 |
| | 469,217,776 |
| | 432,222,953 |
|
| Net income per share attributable to common stockholders-basic | | $ | 0.16 |
| | $ | 0.21 |
| | $ | 0.21 |
|
| | | | | | | | | | | |
Diluted weighted average shares of common stock (1) | | | | | | | | | | |
| Stock options | 3,835 |
| | 3,384 |
| | — |
| — |
| | 3,835 |
| | 3,384 |
|
| Unvested performance shares | 24,654 |
| | 319,288 |
| | — |
| 7,843 |
| | 24,654 |
| | 319,288 |
|
| Weighted average number of shares of common stock used in diluted income (loss) per share | 469,246,265 |
| | 432,545,625 |
| | 386,809,746 |
| |
| Net income (loss) per share attributable to common stockholders-diluted | $ | 0.21 |
| | $ | 0.21 |
| | $ | (0.10 | ) | |
| Weighted average number of shares of common stock used in diluted income per share | | 467,942,788 |
| | 469,246,265 |
| | 432,545,625 |
|
| Net income per share attributable to common stockholders-diluted | | $ | 0.16 |
| | $ | 0.21 |
| | $ | 0.21 |
|
| | | | | | | | | | | |
| Potentially dilutive shares of common stock | | | | | | | | | | |
| Unvested shares of restricted stock | 119,633 |
| | 339,541 |
| | 731,444 |
| 65,480 |
| | 119,633 |
| | 339,541 |
|
| Unvested performance shares | — |
| | — |
| | 770,688 |
| — |
| | — |
| | — |
|
| Stock options | — |
| | — |
| | 5,146 |
| — |
| | — |
| | — |
|
| Total | 119,633 |
| | 339,541 |
| | 1,507,278 |
| 65,480 |
| | 119,633 |
| | 339,541 |
|
(1) Assumes the most dilutive issuance of potentially issuable shares between the two-class and treasury stock method unless the result would be anti-dilutive.
The Corporation intends to satisfy its exchange obligation for the principal amount of the Convertible Notes to the note holders entirely in cash, therefore, the "if-converted" method does not apply and the treasury stock method is being used. For the year ended December 31, 2016,2017, the Corporation's average stock price was below the conversion price, resulting in zero potentially dilutive shares related to the conversion spread of the Convertible Notes.
Note 15. Costs Associated With Restructuring Activities
On November 16, 2015, the Company’s Board of Directors approved the strategic decision to relocate its headquarters from Scottsdale, Arizona to Dallas, Texas. The Company began occupying temporary office space in the new headquarters in the spring of 2016, and finalized the move with the opening of the new office space in late September 2016. As a result of moving its corporate headquarters, the Company incurred various restructuring charges, including employee separation and relocation costs. Restructuring charges incurred for the years ended December 31, 2016 and December 31, 2015 totaled $6.3 million and $7.1 million, respectively, and are included within restructuring charges on the accompanying consolidated statements of operations.2017,
SPIRIT REALTY CAPITAL, INC. and SPIRIT REALTY, L.P.
Notes to Consolidated Financial Statements - (continued)
December 31, 20162017
The following table presents a reconciliation of the liability attributable to restructuring costs incurred as of December 31, 2016 whichand December 31, 2015 were none, $6.3 million and $7.1 million, respectively, and are recordedincluded within accounts payable, accrued expenses and other liabilities inrestructuring charges on the accompanying consolidated balance sheets (in thousands):statements of operations.
|
| | | | | | | | | | | |
| | Employee Separation/Relocation Costs | | Other Restructuring Costs | | Total |
| Beginning balance, as of December 31, 2015 | $ | 5,754 |
| | $ | 172 |
| | $ | 5,926 |
|
| Accruals | 2,701 |
| | 3,060 |
| | 5,761 |
|
| Payments | (8,085 | ) | | (3,211 | ) | | (11,296 | ) |
| Ending balance, as of December 31, 2016 | $ | 370 |
| | $ | 21 |
| | $ | 391 |
|
To date, theThe Company has incurred total relocation costs of $20.5 million, of which $13.4 million iswas for restructuring, $3.5 million iswas for capitalized costs related to tenant improvements and fixtures for the new corporate headquarters space and $3.6 million represents other relocation costs, primarily for redundant office space and employee salaries and benefits for departing employees, incurred in the transition phase. The Company doesdid not anticipateincur any additional costs to be incurred after December 31, 2016.
SPIRIT REALTY CAPITAL, INC. and SPIRIT REALTY, L.P.
Notes to Consolidated Financial Statements - (continued)
December 31, 20162017
Note 16. Consolidated Quarterly Financial Data
The following table sets forth certain unaudited consolidated financial information for each of the four quarters included in the years ended December 31, 20162017 and 20152016 (in thousands, except share and per share data):
| | | | | First | | Second | | Third | | Fourth | | |
| | | Quarter | | Quarter | | Quarter | | Quarter | | Year |
| 2017 | | (Unaudited) | | |
| Total revenues | | $ | 165,422 |
| | $ | 168,635 |
| | $ | 169,550 |
| | $ | 165,348 |
| | $ | 668,955 |
|
| Depreciation and amortization | | 64,994 |
| | 64,220 |
| | 63,673 |
| | 63,132 |
| | 256,019 |
|
| Interest | | 46,623 |
| | 46,826 |
| | 48,680 |
| | 47,998 |
| | 190,127 |
|
| Other expenses | | 57,163 |
| | 49,664 |
| | 62,374 |
| | 39,921 |
| | 209,122 |
|
| (Loss) gain on debt extinguishment | | (30 | ) | | 8 |
| | 1,792 |
| | (3,415 | ) | | (1,645 | ) |
| Income (loss) from continuing operations | | (3,388 | ) | | 7,933 |
| | (3,385 | ) | | 10,882 |
| | 12,042 |
|
| Gain on disposition of assets | | 16,217 |
| | 15,273 |
| | 8,707 |
| | 24,909 |
| | 65,106 |
|
| Dividends paid to preferred stockholders | | — |
| | — |
| | — |
| | 2,530 |
| | 2,530 |
|
| Net income attributable to common stockholders and partners | | 12,829 |
| | 23,206 |
| | 5,322 |
| | 33,261 |
| | 74,618 |
|
| Net income per share attributable to common stockholders and partners: | |
| |
| |
| |
| |
|
| Basic | | $ | 0.03 |
| | $ | 0.05 |
| | $ | 0.01 |
| | $ | 0.07 |
| | $ | 0.16 |
|
| Diluted | | $ | 0.03 |
| | $ | 0.05 |
| | $ | 0.01 |
| | $ | 0.07 |
| | $ | 0.16 |
|
| Dividends declared per common share and partnership unit | | $ | 0.18000 |
| | $ | 0.18000 |
| | $ | 0.18000 |
| | $ | 0.18000 |
| | $ | 0.72000 |
|
| | | | | | | | | | | | | | | | | | | | |
| | First | | Second | | Third | | Fourth | | | First | | Second | | Third | | Fourth | | |
| | Quarter | | Quarter | | Quarter | | Quarter | | Year | Quarter | | Quarter | | Quarter | | Quarter | | Year |
| 2016 | (Unaudited) | | | (Unaudited) | | |
| Total revenues | $ | 168,357 |
| | $ | 171,726 |
| | $ | 172,508 |
| | $ | 173,383 |
| | $ | 685,974 |
| $ | 168,357 |
| | $ | 171,726 |
| | $ | 172,508 |
| | $ | 173,383 |
| | $ | 685,974 |
|
| Depreciation and amortization | 64,664 |
| | 64,263 |
| | 65,300 |
| | 68,049 |
| | 262,276 |
| 64,664 |
| | 64,263 |
| | 65,300 |
| | 68,049 |
| | 262,276 |
|
| Interest | 53,017 |
| | 49,172 |
| | 47,653 |
| | 46,744 |
| | 196,586 |
| 53,017 |
| | 49,172 |
| | 47,653 |
| | 46,744 |
| | 196,586 |
|
| Other expenses | 32,381 |
| | 37,463 |
| | 41,767 |
| | 70,653 |
| | 182,264 |
| 32,381 |
| | 37,463 |
| | 41,767 |
| | 70,653 |
| | 182,264 |
|
| (Loss) gain on debt extinguishment | (5,341 | ) | | 14,016 |
| | (8,349 | ) | | (93 | ) | | 233 |
| (5,341 | ) | | 14,016 |
| | (8,349 | ) | | (93 | ) | | 233 |
|
| Income (loss) from continuing operations | 12,954 |
| | 34,844 |
| | 9,439 |
| | (12,156 | ) | | 45,081 |
| 12,954 |
| | 34,844 |
| | 9,439 |
| | (12,156 | ) | | 45,081 |
|
| Income (loss) from discontinued operations | — |
| | — |
| | — |
| | — |
| | — |
| |
| Gain on disposition of assets | 10,146 |
| | 11,115 |
| | 17,960 |
| | 13,144 |
| | 52,365 |
| 10,146 |
| | 11,115 |
| | 17,960 |
| | 13,144 |
| | 52,365 |
|
| Net income attributable to common stockholders and partners | 23,100 |
| | 45,959 |
| | 27,399 |
| | 988 |
| | 97,446 |
| 23,100 |
| | 45,959 |
| | 27,399 |
| | 988 |
| | 97,446 |
|
| Net income per share attributable to common stockholders and partners: |
| |
| |
| |
| |
| | | | | | | | | |
| Basic | $ | 0.05 |
| | $ | 0.10 |
| | $ | 0.06 |
| | $ | — |
| | $ | 0.21 |
| $ | 0.05 |
| | $ | 0.10 |
| | $ | 0.06 |
| | $ | — |
| | $ | 0.21 |
|
| Diluted | $ | 0.05 |
| | $ | 0.10 |
| | $ | 0.06 |
| | $ | — |
| | $ | 0.21 |
| $ | 0.05 |
| | $ | 0.10 |
| | $ | 0.06 |
| | $ | — |
| | $ | 0.21 |
|
| Dividends declared per common share and partnership unit | $ | 0.17500 |
| | $ | 0.17500 |
| | $ | 0.17500 |
| | $ | 0.18000 |
| | $ | 0.70500 |
| $ | 0.17500 |
| | $ | 0.17500 |
| | $ | 0.17500 |
| | $ | 0.18000 |
| | $ | 0.70500 |
|
| |
First | |
Second | |
Third | |
Fourth | | | |
| | Quarter | | Quarter | | Quarter | | Quarter | | Year | |
| 2015 | (Unaudited) | | | |
| Total revenues | $ | 162,287 |
| | $ | 167,934 |
| | $ | 168,425 |
| | $ | 168,689 |
| | $ | 667,335 |
| |
| Depreciation and amortization | 66,296 |
| | 64,671 |
| | 64,493 |
| | 65,173 |
| | 260,633 |
| |
| Interest | 57,914 |
| | 56,167 |
| | 54,673 |
| | 54,147 |
| | 222,901 |
| |
| Other expenses | 23,662 |
| | 52,771 |
| | 40,548 |
| | 39,555 |
| | 156,536 |
| |
| (Loss) gain on debt extinguishment | (1,230 | ) | | 3,377 |
| | 342 |
| | (5,651 | ) | | (3,162 | ) | |
| Income (loss) from continuing operations | 13,185 |
| | (2,298 | ) | | 9,053 |
| | 4,163 |
| | 24,103 |
| |
| Income (loss) from discontinued operations | 227 |
| | 494 |
| | (41 | ) | | 8 |
| | 688 |
| |
| Gain on disposition of assets | 9,151 |
| | 51,739 |
| | 5,991 |
| | 2,130 |
| | 69,011 |
| |
| Net income attributable to common stockholders and partners | 22,563 |
| | 49,345 |
| | 15,003 |
| | 6,301 |
| | 93,212 |
| |
| Net income per share attributable to common stockholders and partners: | | | | | | | | | | |
| Basic | $ | 0.05 |
| | $ | 0.11 |
| | $ | 0.03 |
| | $ | 0.02 |
| | $ | 0.21 |
| |
| Diluted | $ | 0.05 |
| | $ | 0.11 |
| | $ | 0.03 |
| | $ | 0.02 |
| | $ | 0.21 |
| |
| Dividends declared per common share and partnership unit | $ | 0.17000 |
| | $ | 0.17000 |
| | $ | 0.17000 |
| | $ | 0.17500 |
| | $ | 0.68500 |
| |
SPIRIT REALTY CAPITAL, INC. and SPIRIT REALTY, L.P.
Notes to Consolidated Financial Statements - (continued)
December 31, 2017
Note 17. Subsequent Events
Shopko Term Loan
On January 16, 2018, the Operating Partnership funded a $35.0 million B-1 Term Loan as part of a syndicated loan and security agreement with Shopko as borrower and several banks as lenders. The B-1 Term Loan bears interest at a rate of 12% per annum and matures on June 19, 2020. Principal will be repaid in quarterly installments of $0.6 million commencing on November 1, 2018, while interest will be paid monthly. The loan is secured by Shopko’s assets in its $784 million asset-backed lending facility and is subordinate to other loans made under the syndicated loan and security agreement. The Operating Partnership received a commitment fee equal to 3.00% of the B-1 Term Loan.
Amendment to Shopko Master Lease
On January 16, 2018, the Company, through two of its wholly-owned subsidiaries, entered into an amendment to its master lease with Shopko. The amendment requires Shopko to provide annual and quarterly financial statements to the Company that are compliant with SEC rules. Further, the amendment modifies certain other provisions of the master lease, including assignment by Shopko, subletting by Shopko, sale by the Company and rent payment date.
Subject to certain conditions, Shopko will have a one-time right, upon 60 days written notice, to defer payment of the monthly base rent for a period of up to three months, provided that such months are not consecutive. The deferred rent is subject to interest at the rate of 11% per annum, and is secured by a second priority lien on Shopko's interests in its assets.
CMBS Debt Issuance
On January 22, 2018, the Company entered into a new non-recourse loan agreement with Société Générale and Barclays Bank PLC as lenders, which is collateralized by a single distribution center property located in Katy, Texas. The loan has a term of 10 years to maturity with an interest rate based on the 10-year mid-market swap rate (or Treasury rate, whichever is greater) plus a spread of 245 basis points. As a result of the issuance, the Company received approximately $84 million in proceeds.
Master Trust 2014 Notes Re-Pricing
On January 23, 2018, the Company re-priced a private offering of the Master Trust 2014 Series 2017-1 Class B notes (the “Class B Notes”) with $132.0 million aggregate principal. As a result, the interest rate on the Class B Notes will be reduced from 6.35% to 5.49%, while the other terms of the Class B Notes will remain unchanged. The Master Trust 2014 Series 2017-1 Class A notes were unaffected by the re-pricing of the Class B Notes. In connection with the re-pricing of the Class B Notes, the Company received $8.2 million in additional proceeds, that reduced the discount on the underlying debt, which the Company expects to distribute to Spirit prior to the Spin-Off.
Resolution of Defaulted Loans
In January 2018, five underperforming properties with a net book value of $12.4 million were disposed of in foreclosure proceedings. In connection with the disposals $33.6 million in debt was resolved.
PART III
Item 9. Changes in and Disagreements with Accountants on Accounting and Financial Disclosure
None.
Item 9A. Controls and Procedures
Spirit Realty Capital, Inc.SPIRIT REALTY CAPITAL, INC.
Evaluation of Disclosure Controls and Procedures
An evaluation was performed under the supervision and with the participation of Spirit Realty Capital, Inc.'s management, including the Chief Executive Officer and Chief Financial Officer, of the effectiveness as of December 31, 20162017 of the design and operation of Spirit Realty Capital, Inc.'s disclosure controls and procedures as defined in Rule 13a-15(e) and 15d-15(e) under the Exchange Act. Based on that evaluation, the Chief Executive Officer and Chief Financial Officer concluded, as of December 31, 2016,2017, that the design and operation of these disclosure controls and procedures were effective at the reasonable assurance level.
Management's Report on Internal Control over Financial Reporting
Management, including the Chief Executive Officer and Chief Financial Officer, are responsible for establishing and maintaining adequate internal control over financial reporting for Spirit Realty Capital, Inc. Management used the criteria issued by the Committee of Sponsoring Organizations of the Treadway Commission in Internal Control - 2013 Integrated Framework to assess the effectiveness of Spirit Realty Capital, Inc.'s internal control over financial reporting. Based upon the assessments, the Chief Executive Officer and Chief Financial Officer have concluded that, as of December 31, 2016,2017, internal control over financial reporting was effective.
Ernst & Young LLP, Spirit Realty Capital, Inc.'s independent registered public accounting firm, audited Spirit Realty Capital, Inc.'s financial statements included in this Annual Report on Form 10-K and has issued an attestation report on Spirit Realty Capital, Inc.'s effectiveness of internal control over financial reporting, which appears in this Annual Report on Form 10-K.
Changes in Internal Control over Financial Reporting
As disclosed in Item 9A of Spirit Realty Capital, Inc.'s Annual Report on Form 10-K/A for the fiscal year ended December 31, 2015 filed on October 31, 2016, Spirit Realty Capital, Inc. failed to design controls over the review of the accounting for real estate dispositions; specifically, the allocation of a portion of Spirit Realty Capital, Inc.'s goodwill to the carrying amount of assets sold or held for sale when determining the gain or loss on sale to be recognized for sold assets or the amount, if any, of impairment losses to be recognized for assets held for sale.
Management became aware of this material weakness in the internal control over financial reporting and took immediate actions to remediate the material weakness. Management initiated controls over the proper application of GAAP in accounting for goodwill related to the disposal of assets and in allocating goodwill to held for sale assets to determine the amount, if any, for impairment charges. Management has fully remediated this material weakness as of December 31, 2016.
Except as noted in the preceding paragraph, thereThere were no changes to Spirit Realty Capital, Inc.'s internal control over financial reporting (as defined in Rule 13a-15(e) and 15d-15(e) under the Exchange Act) that occurred during the quarter ended December 31, 20162017 that have materially affected, or are reasonably likely to materially affect, Spirit Realty Capital, Inc.,'s internal control over financial reporting.
Spirit Realty,SPIRIT REALTY, L.P.
Evaluation of Disclosure Controls and Procedures
An evaluation was performed under the supervision and with the participation of Spirit Realty, L.P.'s management, including the Chief Executive Officer and Chief Financial Officer, of the effectiveness as of December 31, 20162017 of the design and operation of Spirit Realty, L.P.'s disclosure controls and procedures as defined in Rule 13a-15(e) and 15d-15(e) under the Exchange Act. Based on that evaluation, the Chief Executive Officer and Chief Financial Officer concluded, as of December 31, 2016,2017, that the design and operation of these disclosure controls and procedures were effective at the reasonable assurance level.
Management's Report on Internal Control over Financial Reporting
Management, including the Chief Executive Officer and Chief Financial Officer, are responsible for establishing and maintaining adequate internal control over financial reporting for Spirit Realty, L.P. Management used the criteria issued by the Committee of Sponsoring Organizations of the Treadway Commission in Internal Control - 2013 Integrated Framework to assess the effectiveness of Spirit Realty, L.P.'s internal control over financial reporting. Based upon the assessments, the Chief Executive Officer and Chief Financial Officer have concluded that, as of December 31, 2016,2017, internal control over financial reporting was effective.
Changes in Internal Control over Financial Reporting
As disclosed in Item 9A of Spirit Realty Capital, Inc.'s Annual Report on Form 10-K/A for the fiscal year ended December 31, 2015 filed on October 31, 2016, Spirit Realty Capital, Inc. failed to design controls over the review of the accounting for real estate dispositions; specifically, the allocation of a portion of Spirit Realty Capital, Inc.'s goodwill to the carrying amount of assets sold or held for sale when determining the gain or loss on sale to be recognized for sold assets or the amount, if any, of impairment losses to be recognized for assets held for sale.
Management became aware of this material weakness in the internal control over financial reporting and took immediate actions to remediate the material weakness. Management initiated controls over the proper application of GAAP in accounting for goodwill related to the disposal of assets and in allocating goodwill to held for sale assets to determine the amount, if any, for impairment charges. Management has fully remediated this material weakness as of December 31, 2016.
Except as noted in the preceding paragraph, thereThere were no changes to Spirit Realty, L.P.'s internal control over financial reporting (as defined in Rule 13a-15(e) and 15d-15(e) under the Exchange Act) that occurred during the quarter ended December 31, 20162017 that have materially affected, or are reasonably likely to materially affect, Spirit Realty, L.P.'s internal control over financial reporting.
Inherent Limitations on Effectiveness of Controls
Our management, including our Chief Executive Officer and Chief Financial Officer, believes that our disclosure controls and procedures and internal control over financial reporting are designed to provide reasonable assurance of achieving their objectives and are effective at the reasonable assurance level. However, our management does not expect that our disclosure controls and procedures or our internal controlcontrols over financial reporting will prevent all errors and all fraud. A control system, no matter how well conceived and operated, can provide only reasonable, not absolute, assurance that the objectives of the control system are met. Further, the design of a control system must reflect the fact that there are resource constraints, and the benefits of controls must be considered relative to their costs. Because of the inherent limitations in all control systems, no evaluation of controls can provide absolute assurance that all control issues and instances of fraud, if any, have been detected. These inherent limitations include the realities that judgments in decision making can be faulty, and that breakdowns can occur because of a simple error or mistake. Additionally, controls can be circumvented by the individual acts of some persons, by collusion of two or more people or by management override of the controls. The design of any system of controls also is based in part upon certain assumptions about the likelihood of future events, and there can be no assurance that any design will succeed in achieving its stated goals under all potential future conditions; over time, controls may become inadequate because of changes in conditions, or the degree of compliance with policies or procedures may deteriorate. Because of the inherent limitations in a cost-effective control system, misstatements due to error or fraud may occur and not be detected.
Item 9B. Other Information
None.
PART III
Item 10. Directors, Executive Officers and Corporate Governance
The information concerning our directors and executive officers required by Item 10 will be included in the Proxy Statement to be filed relating to our 20172018 Annual Meeting of Stockholders and is incorporated herein by reference.
Item 11. Executive Compensation
The information concerning our executive compensation required by Item 11 will be included in the Proxy Statement to be filed relating to our 20172018 Annual Meeting of Stockholders and is incorporated herein by reference.
Item 12. Security Ownership of Certain Beneficial Owners and Management and Related Stockholder Matters
The information concerning our security ownership of certain beneficial owners and management and related stockholder matters (including equity compensation plan information) required by Item 12 will be included in the Proxy Statement to be filed relating to our 20172018 Annual Meeting of Stockholders and is incorporated herein by reference.
Item 13. Certain Relationships and Related Transactions, and Director Independence
The information concerning certain relationships, related transactions and director independence required by Item 13 will be included in the Proxy Statement to be filed relating to our 20172018 Annual Meeting of Stockholders and is incorporated herein by reference.
Item 14. Principal Accountant Fees and Services
The information concerning our principal accounting fees and services required by Item 14 will be included in the Proxy Statement to be filed relating to our 20172018 Annual Meeting of Stockholders and is incorporated herein by reference.
PART IV
Item 15. Exhibits, Financial Statement Schedules
(a)(1) and (2)
Financial Statements and Schedules. The following documents are filed as a part of this report (see Item 8):
Reports of Independent Registered Public Accounting Firm.
Consolidated Balance Sheets as of December 31, 20162017 and 2015.2016.
Consolidated Statements of Operations for the Years Ended December 31, 2017, 2016 2015 and 2014.2015.
Consolidated Statements of Comprehensive Income (Loss) for the Years Ended December 31, 2017, 2016 2015 and 2014.2015.
Consolidated Statements of Stockholders’ Equity for the Years Ended December 31, 2017, 2016 2015 and 2014.2015.
Consolidated Statements of Cash Flows for the Years Ended December 31, 2017, 2016 2015 and 2014.2015.
Notes to Consolidated Financial Statements.
Schedule III - Real Estate and Accumulated Depreciation.Depreciation as of December 31, 2017.
Schedule IV - Mortgage Loans on Real Estate as of December 31, 2016.2017.
All other schedules are omitted since the required information is not present in amounts sufficient to require submission of the schedule or because the information required is included in the financial statements and the notes thereto.
(b) Exhibits.
|
| |
Exhibit No. | Description |
| | |
| 1.1 | |
| |
| | |
| 2.1 | Agreement and Plan of Merger, dated as of January 22, 2013, as amended by the First Amendment to Agreement and Plan of Merger, dated as of May 8, 2013, by and among Spirit Realty Capital, Inc. (f/k/a Cole Credit Property Trust II, Inc.), a Maryland corporation, Spirit Realty Capital, Inc., a Maryland corporation, Cole Operating Partnership II, LP, a Delaware limited partnership and Spirit Realty, L.P., a Delaware limited partnership. Previously filed by Spirit Realty Capital, Inc. as an exhibit to the Company’s Form 8-K filed with the Securities and Exchange Commission on January 22, 2013 and Exhibit 2.1 to the Company’s Form 8-K filed with the Securities and Exchange Commission on May 9, 2013, respectively.respectively, and incorporated herein by reference. |
| | |
| 2.2 | Articles of Merger by and between Spirit Realty Capital, Inc. (f/k/a Cole Credit Property Trust II, Inc.), a Maryland corporation, and Spirit Realty Capital, Inc., a Maryland corporation and the Amended and Restated Charter of Spirit Realty Capital, Inc. (f/k/a Cole Credit Property Trust II, Inc.) filed as Exhibit (Incorporated by reference to Exhibit 3.1 to the Company’s Current Report on Form 8-K (File No. 000-51963), filed on July 17, 2013). and incorporated herein by reference. |
| | |
| 3.1 | |
| | |
| 3.2 | |
| | |
| 3.3 | Third |
| |
| 3.4 | |
| |
| 3.5 | |
| |
| 3.6 | |
| | |
| 4.1 | |
| | |
| 4.2 | |
| | |
| 4.3 | |
| | |
| 4.4 | |
| | |
| 4.5 | |
| | |
| 4.6 | |
| | |
|
| |
Exhibit No. | Description |
| 4.7 | Series 2014-4 Indenture Supplement among Spirit Master Funding, LLC, Spirit Master Funding II, LLC, Spirit Master Funding III, LLC, Spirit Master Funding VI, LLC, Spirit Master Funding VIII, LLC and Citibank, N.A., dated November 26, 2014 filed as Exhibit 4.2 to the Company's Form 8-K on December 1, 2014 and incorporated herein by reference. |
| | |
| 4.8 | |
| | |
| 4.9 | |
| | |
|
| |
Exhibit No.
| Description
|
| 4.10 | |
| | |
| 4.11 | |
| | |
| 4.12 | |
| | |
| 4.13 | |
| | |
| 4.14 | Indenture, dated as of August 18, 2016, among Spirit Realty, L.P., as issuer, and U.S. Bank, National Association, as trustee, filed as Exhibit 4.1 of the Company's Form 8-K on August 19, 2016 and incorporated herein by reference. |
| | |
| 4.15 | First Supplemental Indenture, dated as of August 18, 2016, among Spirit Realty, L.P., as issuer, Spirit Realty Capital, Inc., as guarantor, and U.S. Bank, National Association, as trustee, including the form of the Notes and the guarantee filed as Exhibit 4.2 of the Company's Form 8-K on August 19, 2016 and incorporated herein by reference. |
| | |
| 4.16 | Registration Rights Agreement, dated August 18, 2016, among the Issuer, the Guarantor and J.P. Morgan Securities LLC, Wells Fargo Securities, LLC, Merrill Lynch, Pierce, Fenner & Smith Incorporated and Morgan Stanley & Co. LLC filed as Exhibit 4.3 of the Company's Form 8-K on August 19, 2016 and incorporated herein by reference. |
| | |
| 4.17 | |
| |
| 4.18* | Amendment No. 2 to Second Amended and Restated Master Indenture among Spirit Master Funding, LLC, Spirit Master Funding II, LLC, Spirit Master funding III, LLC, Spirit Master Funding VI, LLC, Spirit Master Funding VIII, LLC and Citibank, N.A., dated December 14, 2017. |
| |
| 4.19* | Amendment No. 3 to Second Amended and Restated Master Indenture among Spirit Master Funding, LLC, Spirit Master Funding II, LLC, Spirit Master funding III, LLC, Spirit Master Funding VI, LLC, Spirit Master Funding VIII, LLC and Citibank, N.A., dated January 29, 2018. |
| |
| 4.20* | Series 2017-1 Indenture Supplement among Spirit Master Funding, LLC, Spirit Master Funding II, LLC, Spirit Master funding III, LLC, Spirit Master Funding VI, LLC, Spirit Master Funding VIII, LLC and Citibank, N.A., dated December 14, 2017. |
| |
| 4.21* | Amendment No. 1 to Series 2017-1 Indenture Supplement among Spirit Master Funding, LLC, Spirit Master Funding II, LLC, Spirit Master funding III, LLC, Spirit Master Funding VI, LLC, Spirit Master Funding VIII, LLC and Citibank, N.A., dated January 30, 2018. |
| |
|
| |
Exhibit No. | Description |
| 10.1 | |
| | |
| 10.2 | |
| | |
| 10.3 | |
| | |
| 10.4 | |
| | |
| 10.5 | |
| | |
| 10.6 | |
| | |
| 10.7 | Security Agreement, by and among Spirit Realty Capital, Inc., Spirit General OP Holdings, LLC, Spirit Realty, L.P., Spirit Master Funding IV, LLC, Spirit Master Funding V, LLC, Deutsche Bank Securities Inc. and various lenders, dated as of July 17, 2013 filed as Exhibit 10.3 to the Company’s Form 8-K on July 17, 2013 and incorporated herein by reference. |
| | |
| 10.8 | Omnibus Collateral Assignment of Material Agreements, Permits and Licenses, by and among Spirit Realty Capital, Inc., Spirit General OP Holdings, LLC, Spirit Realty, L.P., Spirit Master Funding IV, LLC, Spirit Master Funding V, LLC, Deutsche Bank Securities Inc. and various lenders, dated as of July 17, 2013. Previously filed by Spirit Realty Capital, Inc. as an exhibit to the Company’s Form 8-K filed with the Securities and Exchange Commission on July 17, 2013. |
| | |
|
| |
Exhibit No.
| Description
|
| 10.9 | |
| | |
| 10.10 | |
| | |
| 10.11 | |
| | |
| 10.12 | |
| | |
| 10.13 | Second Amended and Restated Property Management and Servicing Agreement dated May 20, 2014, by and among Spirit Realty, L.P., Spirit Master Funding, LLC, Spirit Master Funding II, LLC, Spirit Master Funding III, LLC and Midland Loan Services, a division of PNC Bank, National Association filed as Exhibit 1.1 of the Company's Form 8-K on May 20, 2014 and incorporated herein by reference. |
| | |
| 10.14 | Amendment No. 1 to the Second Amended and Restated Property Management and Servicing Agreement dated November 26, 2014, by and among Spirit Realty, L.P., Spirit Master Funding, LLC, Spirit Master Funding II, LLC, Spirit Master Funding III, LLC and Midland Loan Services, a division of PNC Bank, National Association filed as Exhibit 1.2 of the Company's Form 8-K on December 1, 2014 and incorporated herein by reference.
|
| | |
| 10.15 | |
| | |
|
| |
Exhibit No. | Description |
| 10.16 | Defeasance, Assignment, Assumption and Release Agreement dated June 5, 2014 by and among Spirit SPE Portfolio 2006-1, LLC and Spirit SPE Portfolio 2006-2, LLC, U.S. Bank, National Association as Trustee for the Lender, Midland Loan Servicer, a division of PNC Bank, National Association as servicer and U.S. Bank, National Association as Securities Intermediary and Custodian filed as Exhibit 1.1 of the Company's Form 8-K on June 6,9, 2014 and incorporated herein by reference. |
| | |
| 10.17 | |
| | |
| 10.18 |
|
| | |
| 10.19 | |
| | |
| 10.20 | Amended and Restated Employment Agreement among Spirit Realty Capital, Inc. and Thomas H. Nolan, Jr., dated as of July 17, 2013 filed as Exhibit 10.2 of the Company's Form 8-K on July 17, 2013 and incorporated herein by reference. |
| |
10.21 | |
| | |
10.2310.21 | |
| | |
10.2510.22 | |
| | |
|
| |
Exhibit No.
10.23 | Description
|
10.26 | Employment Agreement among Spirit Realty Capital, Inc. and Phillip D. Joseph, Jr., dated as of March 25, 2015 filed as Exhibit 10.1 of the Company's Form 8-K on March 25,27, 2015 and incorporated herein by reference. |
| | |
10.2710.24 | |
| | |
10.2810.25 | |
| | |
10.2910.26 | |
| | |
10.3010.27 | Second Amended and Restated Employment Agreement among Spirit Realty Capital, Inc. and Thomas H. Nolan, Jr., dated as of August 27, 2015 filed as Exhibit 10.1 of the Company's Form 8-K on August 28, 2015 and incorporated herein by reference. |
| |
10.31 | |
| | |
10.3210.28 | |
| | |
10.3310.29 | |
| | |
10.3410.30 | |
| | |
10.35 |
| |
Exhibit No. | Description |
| 10.31 | |
| | |
10.3610.32 | |
| | |
10.3710.33 | |
| | |
10.3810.34 | |
| | |
10.3910.35 | |
| |
| 10.36 | |
| |
| 10.37 | |
| |
| 10.38 | |
| |
| 10.39 | |
| |
| 10.40 | Second Amendment to the Credit Agreement among Spirit Realty, L.P., various financial institutions, as lenders, and Wells Fargo Bank, National Association, as the administrative agent, dated as of April 28, 2017, filed as Exhibit 10.40 to the Company's Quarterly Report on Form 10-Q on May 3, 2017 and incorporated herein by reference. |
| |
| 10.41* | Amendment No. 2 to the Second Amended and Restated Property Management and Servicing Agreement among Spirit Realty, L.P., Spirit Master Funding, LLC, Spirit Master Funding II, LLC, Spirit Master funding III, LLC, Spirit Master Funding VI, LLC, and Spirit Master Funding VIII, LLC, dated December 14, 2017. |
| |
| 12.1* | |
| | |
| 14.1 | |
| | |
| 16.1 | |
| | |
| 21.1* | |
| | |
|
| |
Exhibit No.
| Description
|
| 23.1* | |
| |
| 23.2* | |
| | |
| 31.1* | |
| | |
|
| |
Exhibit No. | Description |
| 31.2* | |
| | |
| 31.3* | |
| | |
| 31.4* | |
| | |
| 32.1* | |
| | |
| 32.2* | |
| | |
| 101.1** | The following financial information from Spirit Realty Capital, Inc.'s Annual Report on Form 10-K for the year ended December 31, 2016,2017, formatted in XBRL (Extensible Business Reporting Language): (i) Consolidated Balance Sheets, (ii) Consolidated Statements of Operations, (iii) Consolidated Statements of Comprehensive Income (loss), (iv) Consolidated Statements of Stockholders' Equity, (v) Consolidated Statements of Cash Flows and (vi) Notes to the Consolidated Financial Statements. |
| |
| ** | Pursuant to applicable securities laws and regulations, these interactive data files are deemed not filed or part of a registration statement or prospectus for purposes of sections 11 or 12 of the Securities Act, are deemed not filed for purposes of section 18 of the Exchange Act and otherwise are not subject to liability under these sections. |
SPIRIT REALTY CAPITAL, INC.
Schedule III Real Estate and
Accumulated Depreciation
(Amounts in thousands)
|
| | | | | | | | | | | | | | | | | | | | | | | | | |
| | | | | | Initial Cost to Company | | Cost Capitalized Subsequent to Acquisition including impairment | | Gross Amount at December 31, 2016 (d) 2017 (g) | | | | | | | | |
| Concept | City, State | | Encumbrances (e) | | Land and Improvements | | Buildings and Improvements | | Land and Improvements | | Buildings and Improvements | | Land and Improvements | | Buildings and Improvements | | Total | | Final Accumulated Depreciation | | Date of Construction | | Date Acquired | | Life in which depreciation in latest Statement of Operations is computed |
Description | | Encumbrances (e)
| | Land and
Improvements
| | Buildings and
Improvements
| | Improvements/
Land
| | Improvements/
building
| | Land and
Improvements
| | Buildings and
Improvements
| | Total | | Final
Accum
| | Date of
Construction
| | Date
Acquired
| |
|
| | | | | | | | | | | | | | | | | | | | | | | | | | | | | | | | | | | | | | | | | |
| General Merchandise | | | | | | | | | | | | | | | | | | | | | | |
| | Aberdeen, SD | | (c) | | $ | 3,857 |
| | $ | 3,348 |
| | $ | — |
| | $ | — |
| | $ | 3,857 |
| | $ | 3,348 |
| | $ | 7,205 |
| | $ | (1,505 | ) | | 1984 | | 05/31/06 | | 15 to 30 Years |
| | Ainsworth, NE | | (a) | | 360 |
| | 1,829 |
| | — |
| | — |
| | 360 |
| | 1,829 |
| | 2,189 |
| | (448 | ) | | 2007 | | 12/08/09 | | 12 to 47 Years |
| | Alamogordo, NM | | (a) | | 476 |
| | 560 |
| | — |
| | — |
| | 476 |
| | 560 |
| | 1,036 |
| | (111 | ) | | 2006 | | 07/17/13 | | 8 to 40 Years |
| | Albany, MO | | (c) | | 66 |
| | 410 |
| | — |
| | — |
| | 66 |
| | 410 |
| | 476 |
| | (155 | ) | | 1990 | | 05/31/06 | | 15 to 30 Years |
| | Allegan, MI | | (c) | | 741 |
| | 1,198 |
| | — |
| | — |
| | 741 |
| | 1,198 |
| | 1,939 |
| | (553 | ) | | 2000 | | 05/31/06 | | 15 to 30 Years |
| | Anderson, SC | | (c) | | 4,771 |
| | 6,883 |
| | — |
| | — |
| | 4,771 |
| | 6,883 |
| | 11,654 |
| | (2,124 | ) | | 1993 | | 07/17/13 | | 7 to 21 Years |
| | Anderson, SC | | (a) | | 351 |
| | 966 |
| | — |
| | — |
| | 351 |
| | 966 |
| | 1,317 |
| | (108 | ) | | 1992 | | 07/17/13 | | 10 to 41 Years |
| | Appleton, WI | | (c) | | 4,898 |
| | 5,804 |
| | — |
| | — |
| | 4,898 |
| | 5,804 |
| | 10,702 |
| | (2,209 | ) | | 1971 | | 05/31/06 | | 15 to 30 Years |
| | Arcadia, WI | | (c) | | 673 |
| | 983 |
| | — |
| | — |
| | 673 |
| | 983 |
| | 1,656 |
| | (563 | ) | | 2000 | | 05/31/06 | | 15 to 30 Years |
| | Archbold, OH | | (c) | | 631 |
| | 1,229 |
| | (216 | ) | | (567 | ) | | 415 |
| | 662 |
| | 1,078 |
| | — |
| | 2000 | | 05/31/06 | | 15 to 30 Years |
| | Attica, IN | | (c) | | 550 |
| | 1,116 |
| | — |
| | — |
| | 550 |
| | 1,116 |
| | 1,666 |
| | (524 | ) | | 1999 | | 05/31/06 | | 15 to 30 Years |
| | Austin, MN | | (c) | | 4,246 |
| | 4,444 |
| | — |
| | — |
| | 4,246 |
| | 4,444 |
| | 8,690 |
| | (1,890 | ) | | 1983 | | 05/31/06 | | 15 to 30 Years |
| | Baton Rouge, LA | | (a) | | 328 |
| | 996 |
| | — |
| | — |
| | 328 |
| | 996 |
| | 1,324 |
| | (127 | ) | | 1999 | | 07/17/13 | | 10 to 40 Years |
| | Bay City, TX | | (c) | | 1,192 |
| | 3,250 |
| | — |
| | — |
| | 1,192 |
| | 3,250 |
| | 4,442 |
| | (874 | ) | | 1990 | | 07/17/13 | | 3 to 20 Years |
| | Beeville, TX | | (a) | | 101 |
| | 1,814 |
| | — |
| | — |
| | 101 |
| | 1,814 |
| | 1,915 |
| | (152 | ) | | 2004 | | 07/17/13 | | 10 to 45 Years |
| | Bellevue, NE | | (c) | | 3,269 |
| | 3,482 |
| | — |
| | — |
| | 3,269 |
| | 3,482 |
| | 6,751 |
| | (1,517 | ) | | 1984 | | 05/31/06 | | 15 to 30 Years |
| | Beloit, WI | | (c) | | 3,191 |
| | 4,414 |
| | — |
| | — |
| | 3,191 |
| | 4,414 |
| | 7,605 |
| | (2,523 | ) | | 1978 | | 05/31/06 | | 15 to 25 Years |
| | Belvidere, IL | | (c) | | 3,061 |
| | 3,609 |
| | — |
| | — |
| | 3,061 |
| | 3,609 |
| | 6,670 |
| | (1,569 | ) | | 1995 | | 05/31/06 | | 15 to 30 Years |
| | Bloomfield, IN | | (c) | | 639 |
| | 940 |
| | (204 | ) | | (425 | ) | | 435 |
| | 515 |
| | 950 |
| | — |
| | 1999 | | 05/31/06 | | 15 to 30 Years |
| | Borger, TX | | (c) | | 907 |
| | 3,243 |
| | (724 | ) | | (2,027 | ) | | 183 |
| | 1,216 |
| | 1,399 |
| | — |
| | 1991 | | 07/17/13 | | 3 to 25 Years |
| | Burlington, KS | | (c) | | 371 |
| | 565 |
| | — |
| | — |
| | 371 |
| | 565 |
| | 936 |
| | (362 | ) | | 1990 | | 05/31/06 | | 15 to 20 Years |
| | Calumet City, IL | | (a) | | 393 |
| | 949 |
| | — |
| | — |
| | 393 |
| | 949 |
| | 1,342 |
| | (136 | ) | | 1977 | | 07/17/13 | | 9 to 32 Years |
| | Carrollton, MO | | (c) | | 352 |
| | 345 |
| | — |
| | — |
| | 352 |
| | 345 |
| | 697 |
| | (268 | ) | | 1994 | | 07/21/11 | | 9 to 20 Years |
| | Centerville, TN | | (c) | | 420 |
| | 776 |
| | — |
| | — |
| | 420 |
| | 776 |
| | 1,196 |
| | (383 | ) | | 2000 | | 05/31/06 | | 15 to 30 Years |
| | Charlotte, NC | | (a) | | 371 |
| | 598 |
| | — |
| | — |
| | 371 |
| | 598 |
| | 969 |
| | (123 | ) | | 1957 | | 07/17/13 | | 8 to 25 Years |
| | Chiefland, FL | | (a) | | 376 |
| | 1,206 |
| | — |
| | — |
| | 376 |
| | 1,206 |
| | 1,582 |
| | (141 | ) | | 2007 | | 07/17/13 | | 10 to 47 Years |
| | Clanton, AL | | (a) | | 350 |
| | 816 |
| | — |
| | — |
| | 350 |
| | 816 |
| | 1,166 |
| | (98 | ) | | 2007 | | 07/17/13 | | 10 to 46 Years |
| | Clare, MI | | (c) | | 1,219 |
| | 760 |
| | — |
| | — |
| | 1,219 |
| | 760 |
| | 1,979 |
| | (558 | ) | | 2000 | | 05/31/06 | | 15 to 30 Years |
| | Clarion, IA | | (c) | | 365 |
| | 812 |
| | — |
| | — |
| | 365 |
| | 812 |
| | 1,177 |
| | (379 | ) | | 2000 | | 05/31/06 | | 15 to 30 Years |
| | Clintonville, WI | | (c) | | 495 |
| | 1,089 |
| | — |
| | — |
| | 495 |
| | 1,089 |
| | 1,584 |
| | (631 | ) | | 1978 | | 05/31/06 | | 15 to 25 Years |
| | De Pere, WI | | (c) | | 264 |
| | 1,681 |
| | — |
| | — |
| | 264 |
| | 1,681 |
| | 1,945 |
| | (603 | ) | | 2000 | | 05/31/06 | | 15 to 30 Years |
|
| | | | | | | | | | | | | | | | | | | | | | | | | | | | | | | | | |
| 10 Box | Rogers, AR | | (a) | | 1,028 |
| | 1,685 |
| | — |
| | — |
| | 1,028 |
| | 1,685 |
| | 2,713 |
| | (351 | ) | | 1994 | | 03/31/14 | | 6 to 20 Years |
| 24 Hour Fitness | Aurora, CO | | (d) | | 1,452 |
| | 4,413 |
| | — |
| | — |
| | 1,452 |
| | 4,413 |
| | 5,865 |
| | (726 | ) | | 1995 | | 07/17/13 | | 11 to 30 Years |
| 24 Hour Fitness | Lancaster, CA | | (d) | | 6,982 |
| | 9,255 |
| | — |
| | — |
| | 6,982 |
| | 9,255 |
| | 16,237 |
| | (1,118 | ) | | 1987 | | 05/07/15 | | 9 to 30 Years |
| 3rd Realm Extreme Air Sports | Little Rock, AR | | (d) | | 1,489 |
| | 3,888 |
| | — |
| | — |
| | 1,489 |
| | 3,888 |
| | 5,377 |
| | (30 | ) | | 2017 | | 09/29/17 | | 15 to 40 Years |
| Aaron's | Essex, MD | | (b) | | 294 |
| | 1,973 |
| | — |
| | — |
| | 294 |
| | 1,973 |
| | 2,267 |
| | (222 | ) | | 1998 | | 07/17/13 | | 10 to 45 Years |
| Aaron's | Charlotte, NC | | (b) | | 371 |
| | 598 |
| | — |
| | — |
| | 371 |
| | 598 |
| | 969 |
| | (158 | ) | | 1957 | | 07/17/13 | | 8 to 25 Years |
| Aaron's | Anderson, SC | | (b) | | 351 |
| | 966 |
| | — |
| | — |
| | 351 |
| | 966 |
| | 1,317 |
| | (140 | ) | | 1992 | | 07/17/13 | | 10 to 41 Years |
| Aaron's | Hartsville, SC | | (b) | | 536 |
| | 813 |
| | — |
| | — |
| | 536 |
| | 813 |
| | 1,349 |
| | (207 | ) | | 2007 | | 07/17/13 | | 10 to 37 Years |
| Aaron's | Griffin, GA | | (b) | | 459 |
| | 1,322 |
| | — |
| | — |
| | 459 |
| | 1,322 |
| | 1,781 |
| | (183 | ) | | 2007 | | 07/17/13 | | 10 to 49 Years |
| Aaron's | Sandersville, GA | | (b) | | 503 |
| | 751 |
| | — |
| | — |
| | 503 |
| | 751 |
| | 1,254 |
| | (137 | ) | | 2006 | | 07/17/13 | | 10 to 45 Years |
| Aaron's | Grovetown, GA | | (b) | | 425 |
| | 933 |
| | — |
| | — |
| | 425 |
| | 933 |
| | 1,358 |
| | (149 | ) | | 2007 | | 07/17/13 | | 10 to 45 Years |
| Aaron's | Largo, FL | | (b) | | 758 |
| | 1,025 |
| | — |
| | — |
| | 758 |
| | 1,025 |
| | 1,783 |
| | (162 | ) | | 1999 | | 07/17/13 | | 9 to 36 Years |
| Aaron's | Okeechobee, FL | | (b) | | 409 |
| | 1,298 |
| | — |
| | — |
| | 409 |
| | 1,298 |
| | 1,707 |
| | (174 | ) | | 2006 | | 07/17/13 | | 10 to 47 Years |
| Aaron's | Chiefland, FL | | (b) | | 376 |
| | 1,206 |
| | — |
| | — |
| | 376 |
| | 1,206 |
| | 1,582 |
| | (182 | ) | | 2007 | | 07/17/13 | | 10 to 47 Years |
| Aaron's | Clanton, AL | | (b) | | 350 |
| | 816 |
| | — |
| | — |
| | 350 |
| | 816 |
| | 1,166 |
| | (127 | ) | | 2007 | | 07/17/13 | | 10 to 46 Years |
| Aaron's | Forrest City, AR | | (b) | | 331 |
| | 860 |
| | — |
| | — |
| | 331 |
| | 860 |
| | 1,191 |
| | (123 | ) | | 2002 | | 07/17/13 | | 10 to 45 Years |
| Aaron's | Baton Rouge, LA | | (b) | | 328 |
| | 996 |
| | — |
| | — |
| | 328 |
| | 996 |
| | 1,324 |
| | (164 | ) | | 1999 | | 07/17/13 | | 10 to 40 Years |
| Aaron's | Shreveport, LA | | (b) | | 374 |
| | 490 |
| | — |
| | — |
| | 374 |
| | 490 |
| | 864 |
| | (160 | ) | | 2001 | | 07/17/13 | | 10 to 31 Years |
| Aaron's | Beeville, TX | | (b) | | 101 |
| | 1,814 |
| | — |
| | — |
| | 101 |
| | 1,814 |
| | 1,915 |
| | (197 | ) | | 2004 | | 07/17/13 | | 10 to 45 Years |
| Aaron's | Mansfield, TX | | (b) | | 859 |
| | 599 |
| | — |
| | — |
| | 859 |
| | 599 |
| | 1,458 |
| | (138 | ) | | 2007 | | 07/17/13 | | 10 to 34 Years |
| Aaron's | Navasota, TX | | (b) | | 322 |
| | 868 |
| | — |
| | — |
| | 322 |
| | 868 |
| | 1,190 |
| | (146 | ) | | 2007 | | 07/17/13 | | 10 to 44 Years |
| Aaron's | Wilton, NY | | (b) | | 1,348 |
| | 2,165 |
| | — |
| | — |
| | 1,348 |
| | 2,165 |
| | 3,513 |
| | (685 | ) | | 2000 | | 07/17/13 | | 8 to 27 Years |
| Aaron's | Rome, NY | | (b) | | 436 |
| | 699 |
| | — |
| | — |
| | 436 |
| | 699 |
| | 1,135 |
| | (164 | ) | | 1996 | | 07/17/13 | | 10 to 28 Years |
| Aaron's | Rensselaer, NY | | (b) | | 705 |
| | 657 |
| | — |
| | — |
| | 705 |
| | 657 |
| | 1,362 |
| | (418 | ) | | 1971 | | 07/17/13 | | 3 to 13 Years |
| Aaron's | Calumet City, IL | | (b) | | 393 |
| | 949 |
| | — |
| | — |
| | 393 |
| | 949 |
| | 1,342 |
| | (176 | ) | | 1977 | | 07/17/13 | | 9 to 32 Years |
| Aaron's | Alamogordo, NM | | (b) | | 476 |
| | 560 |
| | — |
| | — |
| | 476 |
| | 560 |
| | 1,036 |
| | (143 | ) | | 2006 | | 07/17/13 | | 8 to 40 Years |
| Aaron's | Mineral Wells, TX | | (b) | | 448 |
| | 878 |
| | — |
| | — |
| | 448 |
| | 878 |
| | 1,326 |
| | (148 | ) | | 2008 | | 07/17/13 | | 10 to 42 Years |
| Aaron's | Sweetwater, TX | | (b) | | 415 |
| | 1,097 |
| | — |
| | — |
| | 415 |
| | 1,097 |
| | 1,512 |
| | (165 | ) | | 2006 | | 07/17/13 | | 10 to 47 Years |
| Aaron's | Harrisonville, MO | | (b) | | 316 |
| | 466 |
| | — |
| | — |
| | 316 |
| | 466 |
| | 782 |
| | (130 | ) | | 1996 | | 07/17/13 | | 8 to 33 Years |
| Aaron's | Wichita, KS | | (b) | | 236 |
| | 741 |
| | — |
| | — |
| | 236 |
| | 741 |
| | 977 |
| | (105 | ) | | 1990 | | 07/17/13 | | 10 to 42 Years |
SPIRIT REALTY CAPITAL, INC.
Schedule III Real Estate and
Accumulated Depreciation
(Amounts in thousands)
|
| | | | | | | | | | | | | | | | | | | | | | | | | |
| | | | | | Initial Cost to Company | | Cost Capitalized Subsequent to Acquisition including impairment | | Gross Amount at December 31, 2016 (d) 2017 (g) | | | | | | | | |
| Concept | City, State | | Encumbrances (e) | | Land and Improvements | | Buildings and Improvements | | Land and Improvements | | Buildings and Improvements | | Land and Improvements | | Buildings and Improvements | | Total | | Final Accumulated Depreciation | | Date of Construction | | Date Acquired | | Life in which depreciation in latest Statement of Operations is computed |
Description | | Encumbrances (e)
| | Land and
Improvements
| | Buildings and
Improvements
| | Improvements/
Land
| | Improvements/
building
| | Land and
Improvements
| | Buildings and
Improvements
| | Total | | Final
Accum
| | Date of
Construction
| | Date
Acquired
| |
|
| | | | | | | | | | | | | | | | | | | | | | | | | | | | | | | | | | | | | | | | | |
| | Denver, CO | | (c) | | 7,839 |
| | 9,299 |
| | — |
| | — |
| | 7,839 |
| | 9,299 |
| | 17,138 |
| | (2,756 | ) | | 1991 | | 07/17/13 | | 5 to 17 Years |
| | Dixon, IL | | (c) | | 1,502 |
| | 2,810 |
| | — |
| | — |
| | 1,502 |
| | 2,810 |
| | 4,312 |
| | (1,205 | ) | | 1993 | | 05/31/06 | | 15 to 30 Years |
| | Dowagiac, MI | | (c) | | 762 |
| | 984 |
| | — |
| | — |
| | 762 |
| | 984 |
| | 1,746 |
| | (494 | ) | | 2000 | | 05/31/06 | | 15 to 30 Years |
| | Duluth, MN | | (c) | | 4,722 |
| | 6,955 |
| | — |
| | — |
| | 4,722 |
| | 6,955 |
| | 11,677 |
| | (2,693 | ) | | 1993 | | 05/31/06 | | 15 to 30 Years |
| | Dyersville, IA | | (c) | | 381 |
| | 1,082 |
| | — |
| | — |
| | 381 |
| | 1,082 |
| | 1,463 |
| | (470 | ) | | 2000 | | 05/31/06 | | 15 to 30 Years |
| | Escanaba, MI | | (c) | | 3,030 |
| | 3,321 |
| | — |
| | — |
| | 3,030 |
| | 3,321 |
| | 6,351 |
| | (1,823 | ) | | 1971 | | 05/31/06 | | 15 to 28 Years |
| | Essex, MD | | (a) | | 294 |
| | 1,973 |
| | — |
| | — |
| | 294 |
| | 1,973 |
| | 2,267 |
| | (172 | ) | | 1998 | | 07/17/13 | | 10 to 45 Years |
| | Estherville, IA | | (c) | | 630 |
| | 463 |
| | (273 | ) | | (301 | ) | | 357 |
| | 162 |
| | 519 |
| | — |
| | 1976 | | 05/31/06 | | 15 to 20 Years |
| | Fairmont, MN | | (c) | | 2,393 |
| | 3,546 |
| | — |
| | — |
| | 2,393 |
| | 3,546 |
| | 5,939 |
| | (1,430 | ) | | 1984 | | 05/31/06 | | 15 to 30 Years |
| | Fairview Heights, IL | | (c) | | 1,418 |
| | 2,383 |
| | — |
| | 521 |
| | 1,418 |
| | 2,904 |
| | 4,322 |
| | (1,141 | ) | | 1990 | | 07/17/13 | | 3 to 10 Years |
| | Fergus Falls, MN | | (c) | | 738 |
| | 1,175 |
| | — |
| | — |
| | 738 |
| | 1,175 |
| | 1,913 |
| | (653 | ) | | 1986 | | 05/31/06 | | 15 to 20 Years |
| | Flagstaff, AZ | | (c) | | 1,474 |
| | 1,321 |
| | (175 | ) | | 257 |
| | 1,299 |
| | 1,578 |
| | 2,877 |
| | — |
| | 2001 | | 11/02/15 | | 15 to 30 Years |
| | Foley, AL | | (c) | | 1,240 |
| | 2,983 |
| | — |
| | — |
| | 1,240 |
| | 2,983 |
| | 4,223 |
| | (309 | ) | | 1994 | | 05/08/15 | | 9 to 20 Years |
| | Fond du Lac, WI | | (c) | | 4,110 |
| | 5,210 |
| | — |
| | — |
| | 4,110 |
| | 5,210 |
| | 9,320 |
| | (1,985 | ) | | 1985 | | 05/31/06 | | 15 to 30 Years |
| | Forrest City, AR | | (a) | | 331 |
| | 860 |
| | — |
| | — |
| | 331 |
| | 860 |
| | 1,191 |
| | (95 | ) | | 2002 | | 07/17/13 | | 10 to 45 Years |
| | Fort Atkinson, WI | | (c) | | 1,005 |
| | 2,873 |
| | — |
| | — |
| | 1,005 |
| | 2,873 |
| | 3,878 |
| | (1,162 | ) | | 1984 | | 05/31/06 | | 15 to 30 Years |
| | Fountain Valley, CA | | (c) | | 9,470 |
| | 13,326 |
| | — |
| | — |
| | 9,470 |
| | 13,326 |
| | 22,796 |
| | (1,168 | ) | | 1968 | | 12/30/14 | | 11 to 30 Years |
| | Freeport, IL | | (c) | | 1,941 |
| | 2,431 |
| | — |
| | — |
| | 1,941 |
| | 2,431 |
| | 4,372 |
| | (1,197 | ) | | 1994 | | 05/31/06 | | 15 to 30 Years |
| | Gallatin, MO | | (c) | | 57 |
| | 405 |
| | — |
| | — |
| | 57 |
| | 405 |
| | 462 |
| | (159 | ) | | 1990 | | 05/31/06 | | 15 to 30 Years |
| | Glasgow, MT | | (c) | | 772 |
| | 1,623 |
| | — |
| | — |
| | 772 |
| | 1,623 |
| | 2,395 |
| | (741 | ) | | 1998 | | 05/31/06 | | 15 to 30 Years |
| | Glenwood, MN | | (c) | | 775 |
| | 1,404 |
| | — |
| | — |
| | 775 |
| | 1,404 |
| | 2,179 |
| | (531 | ) | | 1996 | | 05/31/06 | | 15 to 40 Years |
| | Gothenburg, NE | | (a) | | 391 |
| | 1,798 |
| | — |
| | — |
| | 391 |
| | 1,798 |
| | 2,189 |
| | (441 | ) | | 2007 | | 12/08/09 | | 12 to 47 Years |
| | Grafton, WI | | (c) | | 2,952 |
| | 4,206 |
| | — |
| | — |
| | 2,952 |
| | 4,206 |
| | 7,158 |
| | (1,794 | ) | | 1989 | | 05/31/06 | | 15 to 30 Years |
| | Green Bay, WI | | (c) | | 6,155 |
| | 6,298 |
| | — |
| | — |
| | 6,155 |
| | 6,298 |
| | 12,453 |
| | (2,396 | ) | | 1979 | | 05/31/06 | | 15 to 30 Years |
| | Green Bay, WI | | (c) | | 8,699 |
| | 12,160 |
| | — |
| | — |
| | 8,699 |
| | 12,160 |
| | 20,859 |
| | (6,150 | ) | | 2000 | | 05/31/06 | | 15 to 28 Years |
| | Green Bay, WI | | (c) | | 4,788 |
| | 4,605 |
| | — |
| | — |
| | 4,788 |
| | 4,605 |
| | 9,393 |
| | (2,571 | ) | | 1966 | | 05/31/06 | | 15 to 28 Years |
| | Greenfield, OH | | (c) | | 555 |
| | 1,041 |
| | — |
| | — |
| | 555 |
| | 1,041 |
| | 1,596 |
| | (492 | ) | | 2000 | | 05/31/06 | | 15 to 30 Years |
| | Griffin, GA | | (a) | | 459 |
| | 1,322 |
| | — |
| | — |
| | 459 |
| | 1,322 |
| | 1,781 |
| | (141 | ) | | 2007 | | 07/17/13 | | 10 to 49 Years |
| | Grovetown, GA | | (a) | | 425 |
| | 933 |
| | — |
| | — |
| | 425 |
| | 933 |
| | 1,358 |
| | (115 | ) | | 2007 | | 07/17/13 | | 10 to 45 Years |
| | Harrisonville, MO | | (a) | | 316 |
| | 466 |
| | — |
| | — |
| | 316 |
| | 466 |
| | 782 |
| | (101 | ) | | 1996 | | 07/17/13 | | 8 to 33 Years |
| | Hart, MI | | (c) | | 565 |
| | 1,377 |
| | — |
| | — |
| | 565 |
| | 1,377 |
| | 1,942 |
| | (580 | ) | | 1999 | | 05/31/06 | | 15 to 30 Years |
| | Hartsville, SC | | (a) | | 536 |
| | 813 |
| | — |
| | — |
| | 536 |
| | 813 |
| | 1,349 |
| | (160 | ) | | 2007 | | 07/17/13 | | 10 to 37 Years |
| | Havana, IL | | (c) | | 526 |
| | 813 |
| | — |
| | — |
| | 526 |
| | 813 |
| | 1,339 |
| | (402 | ) | | 2000 | | 05/31/06 | | 15 to 30 Years |
| | Helena, MT | | (c) | | 3,176 |
| | 5,583 |
| | (724 | ) | | — |
| | 2,452 |
| | 5,583 |
| | 8,035 |
| | (2,163 | ) | | 1992 | | 05/31/06 | | 15 to 30 Years |
| | Hodgenville, KY | | (c) | | 709 |
| | 838 |
| | (370 | ) | | (527 | ) | | 339 |
| | 311 |
| | 650 |
| | — |
| | 1999 | | 05/31/06 | | 15 to 30 Years |
| | Houghton, MI | | (c) | | 1,963 |
| | 4,025 |
| | — |
| | — |
| | 1,963 |
| | 4,025 |
| | 5,988 |
| | (1,805 | ) | | 1994 | | 05/31/06 | | 15 to 30 Years |
| | Jacksonville, IL | | (c) | | 3,603 |
| | 3,569 |
| | — |
| | — |
| | 3,603 |
| | 3,569 |
| | 7,172 |
| | (1,956 | ) | | 1996 | | 05/31/06 | | 15 to 30 Years |
|
| | | | | | | | | | | | | | | | | | | | | | | | | | | | | | | | | |
| Above All Extreme Air Sports | Brentwood, TN | | (d) | | 2,292 |
| | 2,273 |
| | — |
| | 2 |
| | 2,292 |
| | 2,275 |
| | 4,567 |
| | (339 | ) | | 1970 | | 09/30/15 | | 9 to 20 Years |
| ABRA | Suwanee, GA | | (a) | | 480 |
| | 1,350 |
| | — |
| | — |
| | 480 |
| | 1,350 |
| | 1,830 |
| | (239 | ) | | 1986 | | 10/21/13 | | 13 to 30 Years |
| Academy Sports | Macon, GA | | (d) | | 1,921 |
| | 4,890 |
| | — |
| | — |
| | 1,921 |
| | 4,890 |
| | 6,811 |
| | (1,027 | ) | | 2005 | | 07/17/13 | | 10 to 30 Years |
| Academy Sports | Katy, TX | | (d) | | 13,144 |
| | 96,194 |
| | — |
| | — |
| | 13,144 |
| | 96,194 |
| | 109,338 |
| | (14,219 | ) | | 1976 | | 07/17/13 | | 8 to 34 Years |
| Academy Sports | North Richland Hills, TX | | (d) | | 1,950 |
| | 5,451 |
| | — |
| | — |
| | 1,950 |
| | 5,451 |
| | 7,401 |
| | (288 | ) | | 1996 | | 07/17/13 | | 30 to 30 Years |
| Academy Sports | Lufkin, TX | | (c) | | 1,922 |
| | 2,735 |
| | — |
| | — |
| | 1,922 |
| | 2,735 |
| | 4,657 |
| | (623 | ) | | 2003 | | 07/17/13 | | 9 to 30 Years |
| Academy Sports | Greenville, TX | | (a) | | 2,229 |
| | 5,182 |
| | — |
| | 37 |
| | 2,229 |
| | 5,219 |
| | 7,448 |
| | (232 | ) | | 2016 | | 12/07/16 | | 14 to 40 Years |
| Accel International | Meridian, CT | | (d) | | 1,766 |
| | 7,848 |
| | — |
| | — |
| | 1,766 |
| | 7,848 |
| | 9,614 |
| | (955 | ) | | 1997 | | 12/17/14 | | 15 to 30 Years |
| Accel International | Avila, IN | | (d) | | 642 |
| | 4,958 |
| | — |
| | — |
| | 642 |
| | 4,958 |
| | 5,600 |
| | (570 | ) | | 1990 | | 12/17/14 | | 15 to 30 Years |
| Adult & Pediatric Orthopedics | Vernon Hills, IL | | (a) | | 992 |
| | 5,020 |
| | — |
| | — |
| | 992 |
| | 5,020 |
| | 6,012 |
| | (702 | ) | | 1991 | | 03/31/14 | | 15 to 30 Years |
| Advance Auto Parts | Columbia Heights, MN | | (d) | | 510 |
| | 1,314 |
| | — |
| | — |
| | 510 |
| | 1,314 |
| | 1,824 |
| | (186 | ) | | 2006 | | 07/17/13 | | 7 to 43 Years |
| Advance Auto Parts | Duluth, MN | | (d) | | 207 |
| | 1,462 |
| | — |
| | — |
| | 207 |
| | 1,462 |
| | 1,669 |
| | (168 | ) | | 2006 | | 07/17/13 | | 7 to 48 Years |
| Advance Auto Parts | Grand Forks, ND | | (d) | | 287 |
| | 1,132 |
| | — |
| | — |
| | 287 |
| | 1,132 |
| | 1,419 |
| | (183 | ) | | 2005 | | 07/17/13 | | 7 to 45 Years |
| Advance Auto Parts | Fergus Falls, MN | | (d) | | 294 |
| | 978 |
| | — |
| | — |
| | 294 |
| | 978 |
| | 1,272 |
| | (141 | ) | | 2005 | | 07/17/13 | | 7 to 47 Years |
| Advance Auto Parts | Holland Charter Township, MI | | (d) | | 493 |
| | 1,212 |
| | — |
| | — |
| | 493 |
| | 1,212 |
| | 1,705 |
| | (159 | ) | | 2005 | | 07/17/13 | | 7 to 47 Years |
| Advance Auto Parts | Holland, MI | | (d) | | 542 |
| | 1,384 |
| | — |
| | — |
| | 542 |
| | 1,384 |
| | 1,926 |
| | (190 | ) | | 2005 | | 07/17/13 | | 7 to 47 Years |
| Advance Auto Parts | Zeeland, MI | | (d) | | 490 |
| | 1,136 |
| | — |
| | — |
| | 490 |
| | 1,136 |
| | 1,626 |
| | (162 | ) | | 2005 | | 07/17/13 | | 7 to 47 Years |
| Advance Auto Parts | Rainsville, AL | | (b) | | 251 |
| | 1,073 |
| | — |
| | — |
| | 251 |
| | 1,073 |
| | 1,324 |
| | (172 | ) | | 2005 | | 07/17/13 | | 7 to 42 Years |
| Advance Auto Parts | Grand Bay, AL | | (b) | | 226 |
| | 1,242 |
| | — |
| | — |
| | 226 |
| | 1,242 |
| | 1,468 |
| | (162 | ) | | 2005 | | 07/17/13 | | 7 to 47 Years |
| Advance Auto Parts | Hurley, MS | | (b) | | 265 |
| | 1,052 |
| | — |
| | — |
| | 265 |
| | 1,052 |
| | 1,317 |
| | (162 | ) | | 2006 | | 07/17/13 | | 7 to 45 Years |
| Advance Auto Parts | Ashland, KY | | (b) | | 613 |
| | 1,284 |
| | — |
| | — |
| | 613 |
| | 1,284 |
| | 1,897 |
| | (194 | ) | | 2006 | | 07/17/13 | | 8 to 48 Years |
| Advance Auto Parts | Jackson, OH | | (b) | | 397 |
| | 1,251 |
| | — |
| | — |
| | 397 |
| | 1,251 |
| | 1,648 |
| | (180 | ) | | 2005 | | 07/17/13 | | 7 to 47 Years |
| Advance Auto Parts | New Boston, OH | | (b) | | 345 |
| | 1,538 |
| | — |
| | — |
| | 345 |
| | 1,538 |
| | 1,883 |
| | (191 | ) | | 2005 | | 07/17/13 | | 7 to 47 Years |
| Advance Auto Parts | Maryland Heights, MO | | (b) | | 522 |
| | 1,155 |
| | — |
| | — |
| | 522 |
| | 1,155 |
| | 1,677 |
| | (171 | ) | | 2005 | | 07/17/13 | | 7 to 47 Years |
| Advance Auto Parts | Scottsburg, IN | | (b) | | 238 |
| | 665 |
| | — |
| | — |
| | 238 |
| | 665 |
| | 903 |
| | (107 | ) | | 2006 | | 07/17/13 | | 8 to 43 Years |
| Advance Auto Parts | Charlotte, NC | | (b) | | 403 |
| | 1,146 |
| | — |
| | — |
| | 403 |
| | 1,146 |
| | 1,549 |
| | (195 | ) | | 2008 | | 07/17/13 | | 12 to 43 Years |
| Advance Auto Parts | Irvington, NJ | | (b) | | 1,605 |
| | 1,912 |
| | — |
| | — |
| | 1,605 |
| | 1,912 |
| | 3,517 |
| | (277 | ) | | 2006 | | 07/17/13 | | 7 to 47 Years |
| Advance Auto Parts | Midwest City, OK | | (b) | | 353 |
| | 815 |
| | — |
| | — |
| | 353 |
| | 815 |
| | 1,168 |
| | (139 | ) | | 2007 | | 07/17/13 | | 9 to 44 Years |
SPIRIT REALTY CAPITAL, INC.
Schedule III Real Estate and
Accumulated Depreciation
(Amounts in thousands)
|
| | | | | | | | | | | | | | | | | | | | | | | | | |
| | | | | | Initial Cost to Company | | Cost Capitalized Subsequent to Acquisition including impairment | | Gross Amount at December 31, 2016 (d) 2017 (g) | | | | | | | | |
| Concept | City, State | | Encumbrances (e) | | Land and Improvements | | Buildings and Improvements | | Land and Improvements | | Buildings and Improvements | | Land and Improvements | | Buildings and Improvements | | Total | | Final Accumulated Depreciation | | Date of Construction | | Date Acquired | | Life in which depreciation in latest Statement of Operations is computed |
Description | | Encumbrances (e)
| | Land and
Improvements
| | Buildings and
Improvements
| | Improvements/
Land
| | Improvements/
building
| | Land and
Improvements
| | Buildings and
Improvements
| | Total | | Final
Accum
| | Date of
Construction
| | Date
Acquired
| |
|
| | | | | | | | | | | | | | | | | | | | | | | | | | | | | | | | | | | | | | | | | |
| | Janesville, WI | | (c) | | 3,166 |
| | 4,808 |
| | — |
| | — |
| | 3,166 |
| | 4,808 |
| | 7,974 |
| | (2,595 | ) | | 1980 | | 05/31/06 | | 15 to 28 Years |
| | Kennewick, WA | | (c) | | 4,044 |
| | 5,347 |
| | — |
| | — |
| | 4,044 |
| | 5,347 |
| | 9,391 |
| | (2,195 | ) | | 1989 | | 05/31/06 | | 15 to 30 Years |
| | Kenosha, WI | | (c) | | 3,079 |
| | 4,259 |
| | — |
| | — |
| | 3,079 |
| | 4,259 |
| | 7,338 |
| | (2,427 | ) | | 1980 | | 05/31/06 | | 15 to 25 Years |
| | Kewaunee, WI | | (c) | | 872 |
| | 758 |
| | — |
| | — |
| | 872 |
| | 758 |
| | 1,630 |
| | (512 | ) | | 2000 | | 05/31/06 | | 15 to 30 Years |
| | Kimberly, WI | | (c) | | 3,550 |
| | 4,749 |
| | — |
| | — |
| | 3,550 |
| | 4,749 |
| | 8,299 |
| | (2,499 | ) | | 1979 | | 05/31/06 | | 15 to 28 Years |
| | Kingsford, MI | | (c) | | 3,736 |
| | 3,570 |
| | — |
| | — |
| | 3,736 |
| | 3,570 |
| | 7,306 |
| | (2,009 | ) | | 1970 | | 05/31/06 | | 15 to 28 Years |
| | La Crosse, WI | | (c) | | 2,896 |
| | 3,810 |
| | — |
| | — |
| | 2,896 |
| | 3,810 |
| | 6,706 |
| | (2,099 | ) | | 1978 | | 05/31/06 | | 15 to 25 Years |
| | Lake Hallie, WI | | (c) | | 2,627 |
| | 3,965 |
| | — |
| | — |
| | 2,627 |
| | 3,965 |
| | 6,592 |
| | (1,930 | ) | | 1982 | | 05/31/06 | | 15 to 30 Years |
| | Lancaster, WI | | (c) | | 581 |
| | 1,018 |
| | — |
| | — |
| | 581 |
| | 1,018 |
| | 1,599 |
| | (487 | ) | | 1999 | | 05/31/06 | | 15 to 30 Years |
| | Lander, WY | | (c) | | 289 |
| | 589 |
| | — |
| | — |
| | 289 |
| | 589 |
| | 878 |
| | (356 | ) | | 1974 | | 05/31/06 | | 15 to 20 Years |
| | Largo, FL | | (a) | | 758 |
| | 1,025 |
| | — |
| | — |
| | 758 |
| | 1,025 |
| | 1,783 |
| | (125 | ) | | 1999 | | 07/17/13 | | 9 to 36 Years |
| | Lewiston, ID | | (c) | | 409 |
| | 2,999 |
| | — |
| | — |
| | 409 |
| | 2,999 |
| | 3,408 |
| | (1,677 | ) | | 1987 | | 05/31/06 | | 15 to 25 Years |
| | Logan, UT | | (c) | | 454 |
| | 3,453 |
| | — |
| | — |
| | 454 |
| | 3,453 |
| | 3,907 |
| | (1,925 | ) | | 1989 | | 05/31/06 | | 15 to 20 Years |
| | Madison, SD | | (c) | | 1,060 |
| | 1,015 |
| | — |
| | — |
| | 1,060 |
| | 1,015 |
| | 2,075 |
| | (689 | ) | | 1975 | | 05/31/06 | | 15 to 25 Years |
| | Manistique, MI | | (c) | | 659 |
| | 1,223 |
| | — |
| | — |
| | 659 |
| | 1,223 |
| | 1,882 |
| | (571 | ) | | 2000 | | 05/31/06 | | 15 to 30 Years |
| | Manitowoc, WI | | (c) | | 2,573 |
| | 4,011 |
| | — |
| | — |
| | 2,573 |
| | 4,011 |
| | 6,584 |
| | (2,251 | ) | | 1977 | | 05/31/06 | | 15 to 28 Years |
| | Mankato, MN | | (c) | | 6,167 |
| | 4,861 |
| | — |
| | — |
| | 6,167 |
| | 4,861 |
| | 11,028 |
| | (2,626 | ) | | 1971 | | 05/31/06 | | 15 to 28 Years |
| | Mansfield, TX | | (a) | | 859 |
| | 599 |
| | — |
| | — |
| | 859 |
| | 599 |
| | 1,458 |
| | (106 | ) | | 2007 | | 07/17/13 | | 10 to 34 Years |
| | Marinette, WI | | (c) | | 1,452 |
| | 3,736 |
| | — |
| | — |
| | 1,452 |
| | 3,736 |
| | 5,188 |
| | (1,527 | ) | | 1990 | | 05/31/06 | | 15 to 30 Years |
| | Marion, KY | | (c) | | 724 |
| | 765 |
| | — |
| | — |
| | 724 |
| | 765 |
| | 1,489 |
| | (443 | ) | | 2000 | | 05/31/06 | | 15 to 30 Years |
| | Marquette, MI | | (c) | | 4,423 |
| | 5,774 |
| | — |
| | — |
| | 4,423 |
| | 5,774 |
| | 10,197 |
| | (3,136 | ) | | 1969 | | 05/31/06 | | 15 to 25 Years |
| | Marshall, MN | | (c) | | 4,152 |
| | 2,872 |
| | — |
| | — |
| | 4,152 |
| | 2,872 |
| | 7,024 |
| | (1,762 | ) | | 1972 | | 05/31/06 | | 15 to 28 Years |
| | Marshfield, WI | | (c) | | 3,272 |
| | 4,406 |
| | — |
| | — |
| | 3,272 |
| | 4,406 |
| | 7,678 |
| | (2,324 | ) | | 1968 | | 05/31/06 | | 15 to 28 Years |
| | Mason City, IA | | (c) | | 2,186 |
| | 3,888 |
| | — |
| | — |
| | 2,186 |
| | 3,888 |
| | 6,074 |
| | (2,122 | ) | | 1985 | | 05/31/06 | | 15 to 28 Years |
| | Memphis, MO | | (c) | | 448 |
| | 313 |
| | — |
| | — |
| | 448 |
| | 313 |
| | 761 |
| | (244 | ) | | 1983 | | 05/31/06 | | 15 to 20 Years |
| | Mineral Wells, TX | | (a) | | 448 |
| | 878 |
| | — |
| | — |
| | 448 |
| | 878 |
| | 1,326 |
| | (114 | ) | | 2008 | | 07/17/13 | | 10 to 42 Years |
| | Minerva, OH | | (c) | | 1,103 |
| | 902 |
| | — |
| | — |
| | 1,103 |
| | 902 |
| | 2,005 |
| | (585 | ) | | 2000 | | 05/31/06 | | 15 to 30 Years |
| | Missoula, MT | | (c) | | 4,123 |
| | 5,253 |
| | — |
| | — |
| | 4,123 |
| | 5,253 |
| | 9,376 |
| | (2,755 | ) | | 1987 | | 05/31/06 | | 15 to 28 Years |
| | Mitchell, SD | | (c) | | 3,918 |
| | 3,126 |
| | — |
| | — |
| | 3,918 |
| | 3,126 |
| | 7,044 |
| | (1,779 | ) | | 1973 | | 05/31/06 | | 15 to 28 Years |
| | Monmouth, IL | | (c) | | 2,037 |
| | 1,166 |
| | — |
| | — |
| | 2,037 |
| | 1,166 |
| | 3,203 |
| | (912 | ) | | 1971 | | 05/31/06 | | 15 to 25 Years |
| | Monroe, WI | | (c) | | 1,526 |
| | 4,027 |
| | — |
| | — |
| | 1,526 |
| | 4,027 |
| | 5,553 |
| | (1,619 | ) | | 1994 | | 05/31/06 | | 15 to 30 Years |
| | Monticello, IL | | (c) | | 641 |
| | 1,172 |
| | — |
| | — |
| | 641 |
| | 1,172 |
| | 1,813 |
| | (545 | ) | | 1999 | | 05/31/06 | | 15 to 30 Years |
| | Montpelier, OH | | (c) | | 557 |
| | 1,130 |
| | (146 | ) | | (464 | ) | | 411 |
| | 666 |
| | 1,077 |
| | — |
| | 2000 | | 05/31/06 | | 15 to 30 Years |
| | Mount Ayr, IA | | (c) | | 228 |
| | 666 |
| | — |
| | — |
| | 228 |
| | 666 |
| | 894 |
| | (281 | ) | | 1995 | | 05/31/06 | | 15 to 30 Years |
| | Mount Carmel, IL | | (c) | | 972 |
| | 1,602 |
| | — |
| | — |
| | 972 |
| | 1,602 |
| | 2,574 |
| | (973 | ) | | 2000 | | 05/31/06 | | 15 to 20 Years |
| | Murfreesboro, TN | | (c) | | 3,413 |
| | 6,727 |
| | — |
| | — |
| | 3,413 |
| | 6,727 |
| | 10,140 |
| | (700 | ) | | 1985 | | 02/25/15 | | 9 to 20 Years |
| | Navasota, TX | | (a) | | 322 |
| | 868 |
| | — |
| | — |
| | 322 |
| | 868 |
| | 1,190 |
| | (113 | ) | | 2007 | | 07/17/13 | | 10 to 44 Years |
| | New London, WI | | (c) | | 1,008 |
| | 2,094 |
| | — |
| | — |
| | 1,008 |
| | 2,094 |
| | 3,102 |
| | (711 | ) | | 1991 | | 07/17/13 | | 3 to 18 Years |
|
| | | | | | | | | | | | | | | | | | | | | | | | | | | | | | | | | |
| Advance Auto Parts | Penns Grove, NJ | | (b) | | 612 |
| | 1,564 |
| | — |
| | — |
| | 612 |
| | 1,564 |
| | 2,176 |
| | (215 | ) | | 2006 | | 07/17/13 | | 8 to 47 Years |
| Advance Auto Parts | St. Francis, WI | | (b) | | 532 |
| | 1,557 |
| | — |
| | — |
| | 532 |
| | 1,557 |
| | 2,089 |
| | (235 | ) | | 2006 | | 07/17/13 | | 8 to 48 Years |
| Advance Auto Parts | Willingboro, NJ | | (b) | | 784 |
| | 1,369 |
| | — |
| | — |
| | 784 |
| | 1,369 |
| | 2,153 |
| | (231 | ) | | 2007 | | 07/17/13 | | 9 to 47 Years |
| Advance Auto Parts | Dunellen, NJ | | (b) | | 1,177 |
| | 1,973 |
| | — |
| | — |
| | 1,177 |
| | 1,973 |
| | 3,150 |
| | (243 | ) | | 2008 | | 07/17/13 | | 10 to 48 Years |
| Advance Auto Parts | Greenfield, IN | | (a) | | 458 |
| | 996 |
| | — |
| | — |
| | 458 |
| | 996 |
| | 1,454 |
| | (146 | ) | | 2003 | | 07/17/13 | | 7 to 47 Years |
| Advance Auto Parts | Trenton, OH | | (a) | | 324 |
| | 842 |
| | — |
| | — |
| | 324 |
| | 842 |
| | 1,166 |
| | (134 | ) | | 2003 | | 07/17/13 | | 7 to 47 Years |
| Advance Auto Parts | Atmore, AL | | (d) | | 417 |
| | 444 |
| | — |
| | — |
| | 417 |
| | 444 |
| | 861 |
| | (38 | ) | | 1995 | | 07/22/16 | | 7 to 30 Years |
| Advance Auto Parts | Theodore, AL | | (d) | | 549 |
| | 755 |
| | — |
| | — |
| | 549 |
| | 755 |
| | 1,304 |
| | (46 | ) | | 1996 | | 07/22/16 | | 7 to 40 Years |
| Advance Auto Parts | Hialeah, FL | | (d) | | 682 |
| | 1,054 |
| | — |
| | — |
| | 682 |
| | 1,054 |
| | 1,736 |
| | (58 | ) | | 1998 | | 07/22/16 | | 7 to 40 Years |
| Advance Auto Parts | New Smyrna Beach, FL | | (d) | | 774 |
| | 818 |
| | — |
| | — |
| | 774 |
| | 818 |
| | 1,592 |
| | (46 | ) | | 1999 | | 07/22/16 | | 7 to 40 Years |
| Advance Auto Parts | Margate, FL | | (d) | | 480 |
| | 507 |
| | — |
| | — |
| | 480 |
| | 507 |
| | 987 |
| | (32 | ) | | 1991 | | 07/22/16 | | 7 to 40 Years |
| Advance Auto Parts | Fort Lauderdale, FL | | (d) | | 772 |
| | 1,005 |
| | — |
| | — |
| | 772 |
| | 1,005 |
| | 1,777 |
| | (60 | ) | | 1996 | | 07/22/16 | | 7 to 40 Years |
| Advance Auto Parts | Tampa, FL | | (d) | | 721 |
| | 1,055 |
| | — |
| | — |
| | 721 |
| | 1,055 |
| | 1,776 |
| | (56 | ) | | 1997 | | 07/22/16 | | 7 to 40 Years |
| Advance Auto Parts | Gibsonton, FL | | (d) | | 526 |
| | 448 |
| | — |
| | — |
| | 526 |
| | 448 |
| | 974 |
| | (45 | ) | | 1999 | | 07/22/16 | | 7 to 30 Years |
| Advance Auto Parts | Dayton, OH | | (d) | | 317 |
| | 572 |
| | — |
| | — |
| | 317 |
| | 572 |
| | 889 |
| | (38 | ) | | 1998 | | 07/22/16 | | 7 to 30 Years |
| Advance Auto Parts | Castle Shannon, PA | | (d) | | 620 |
| | 732 |
| | — |
| | — |
| | 620 |
| | 732 |
| | 1,352 |
| | (54 | ) | | 1998 | | 07/22/16 | | 7 to 30 Years |
| Advance Auto Parts | Burlington, IA | | (d) | | 467 |
| | 737 |
| | — |
| | — |
| | 467 |
| | 737 |
| | 1,204 |
| | (39 | ) | | 1989 | | 07/22/16 | | 7 to 40 Years |
| Advance Auto Parts | Camilla, GA | | (d) | | 419 |
| | 412 |
| | — |
| | — |
| | 419 |
| | 412 |
| | 831 |
| | (32 | ) | | 1995 | | 07/22/16 | | 7 to 30 Years |
| Advance Auto Parts | Savannah, GA | | (d) | | 688 |
| | 492 |
| | — |
| | — |
| | 688 |
| | 492 |
| | 1,180 |
| | (39 | ) | | 1995 | | 07/22/16 | | 7 to 40 Years |
| Advance Auto Parts | Columbus, GA | | (d) | | 628 |
| | 769 |
| | — |
| | — |
| | 628 |
| | 769 |
| | 1,397 |
| | (48 | ) | | 1998 | | 07/22/16 | | 7 to 40 Years |
| Advance Auto Parts | Waynesboro, GA | | (d) | | 330 |
| | 1,015 |
| | — |
| | — |
| | 330 |
| | 1,015 |
| | 1,345 |
| | (48 | ) | | 1995 | | 07/22/16 | | 7 to 50 Years |
| Advance Auto Parts | Blakeley, GA | | (d) | | 169 |
| | 887 |
| | — |
| | — |
| | 169 |
| | 887 |
| | 1,056 |
| | (39 | ) | | 1995 | | 07/22/16 | | 7 to 50 Years |
| Advance Auto Parts | Richmond Hill, GA | | (d) | | 418 |
| | 701 |
| | — |
| | — |
| | 418 |
| | 701 |
| | 1,119 |
| | (48 | ) | | 1995 | | 07/22/16 | | 7 to 30 Years |
| Advance Auto Parts | Augusta, GA | | (d) | | 482 |
| | 750 |
| | — |
| | — |
| | 482 |
| | 750 |
| | 1,232 |
| | (46 | ) | | 1998 | | 07/22/16 | | 7 to 40 Years |
| Advance Auto Parts | Kingsland, GA | | (d) | | 1,037 |
| | 997 |
| | — |
| | — |
| | 1,037 |
| | 997 |
| | 2,034 |
| | (53 | ) | | 1998 | | 07/22/16 | | 7 to 40 Years |
| Advance Auto Parts | Griffin, GA | | (d) | | 441 |
| | 1,142 |
| | — |
| | — |
| | 441 |
| | 1,142 |
| | 1,583 |
| | (55 | ) | | 1998 | | 07/22/16 | | 7 to 50 Years |
| Advance Auto Parts | College Park, GA | | (d) | | 386 |
| | 506 |
| | — |
| | — |
| | 386 |
| | 506 |
| | 892 |
| | (41 | ) | | 1998 | | 07/22/16 | | 7 to 30 Years |
| Advance Auto Parts | Leesburg, GA | | (d) | | 435 |
| | 494 |
| | — |
| | — |
| | 435 |
| | 494 |
| | 929 |
| | (51 | ) | | 1999 | | 07/22/16 | | 7 to 30 Years |
| Advance Auto Parts | Covington, LA | | (d) | | 507 |
| | 426 |
| | — |
| | — |
| | 507 |
| | 426 |
| | 933 |
| | (38 | ) | | 1998 | | 07/22/16 | | 7 to 30 Years |
| Advance Auto Parts | Alton, IL | | (d) | | 346 |
| | 553 |
| | — |
| | — |
| | 346 |
| | 553 |
| | 899 |
| | (42 | ) | | 1997 | | 07/22/16 | | 7 to 30 Years |
| Advance Auto Parts | St. Louis, MO | | (d) | | 607 |
| | 505 |
| | — |
| | — |
| | 607 |
| | 505 |
| | 1,112 |
| | (42 | ) | | 1997 | | 07/22/16 | | 7 to 30 Years |
SPIRIT REALTY CAPITAL, INC.
Schedule III Real Estate and
Accumulated Depreciation
(Amounts in thousands)
|
| | | | | | | | | | | | | | | | | | | | | | | | | |
| | | | | | Initial Cost to Company | | Cost Capitalized Subsequent to Acquisition including impairment | | Gross Amount at December 31, 2016 (d) 2017 (g) | | | | | | | | |
| Concept | City, State | | Encumbrances (e) | | Land and Improvements | | Buildings and Improvements | | Land and Improvements | | Buildings and Improvements | | Land and Improvements | | Buildings and Improvements | | Total | | Final Accumulated Depreciation | | Date of Construction | | Date Acquired | | Life in which depreciation in latest Statement of Operations is computed |
Description | | Encumbrances (e)
| | Land and
Improvements
| | Buildings and
Improvements
| | Improvements/
Land
| | Improvements/
building
| | Land and
Improvements
| | Buildings and
Improvements
| | Total | | Final
Accum
| | Date of
Construction
| | Date
Acquired
| |
|
| | | | | | | | | | | | | | | | | | | | | | | | | | | | | | | | | | | | | | | | | |
| | Newaygo, MI | | (c) | | 633 |
| | 1,155 |
| | — |
| | — |
| | 633 |
| | 1,155 |
| | 1,788 |
| | (531 | ) | | 2000 | | 05/31/06 | | 15 to 30 Years |
| | Norfolk, NE | | (c) | | 2,701 |
| | 2,912 |
| | — |
| | — |
| | 2,701 |
| | 2,912 |
| | 5,613 |
| | (1,467 | ) | | 1984 | | 05/31/06 | | 15 to 30 Years |
| | Oconto, WI | | (c) | | 496 |
| | 1,176 |
| | — |
| | — |
| | 496 |
| | 1,176 |
| | 1,672 |
| | (552 | ) | | 2000 | | 05/31/06 | | 15 to 30 Years |
| | Ogden, UT | | (c) | | 2,448 |
| | 3,864 |
| | — |
| | — |
| | 2,448 |
| | 3,864 |
| | 6,312 |
| | (1,567 | ) | | 1988 | | 05/31/06 | | 15 to 30 Years |
| | Okeechobee, FL | | (a) | | 409 |
| | 1,298 |
| | — |
| | — |
| | 409 |
| | 1,298 |
| | 1,707 |
| | (135 | ) | | 2006 | | 07/17/13 | | 10 to 47 Years |
| | Omaha, NE | | (c) | | 5,477 |
| | 3,986 |
| | (3,807 | ) | | (3,126 | ) | | 1,670 |
| | 860 |
| | 2,530 |
| | — |
| | 1984 | | 05/31/06 | | 15 to 30 Years |
| | Onalaska, WI | | (c) | | 2,468 |
| | 4,392 |
| | — |
| | — |
| | 2,468 |
| | 4,392 |
| | 6,860 |
| | (1,768 | ) | | 1989 | | 05/31/06 | | 15 to 30 Years |
| | O'Neill, NE | | (a) | | 400 |
| | 1,752 |
| | — |
| | — |
| | 400 |
| | 1,752 |
| | 2,152 |
| | (479 | ) | | 1972 | | 12/08/09 | | 12 to 47 Years |
| | Osceola, IA | | (c) | | 322 |
| | 422 |
| | — |
| | — |
| | 322 |
| | 422 |
| | 744 |
| | (254 | ) | | 1978 | | 05/31/06 | | 15 to 20 Years |
| | Oshkosh, WI | | (c) | | 3,595 |
| | 4,384 |
| | — |
| | — |
| | 3,595 |
| | 4,384 |
| | 7,979 |
| | (1,756 | ) | | 1984 | | 05/31/06 | | 15 to 30 Years |
| | Peoria, IL | | (c) | | 2,407 |
| | 5,452 |
| | — |
| | — |
| | 2,407 |
| | 5,452 |
| | 7,859 |
| | (657 | ) | | 2006 | | 07/17/13 | | 2 to 40 Years |
| | Perry, IA | | (c) | | 651 |
| | 1,015 |
| | — |
| | — |
| | 651 |
| | 1,015 |
| | 1,666 |
| | (515 | ) | | 1998 | | 05/31/06 | | 15 to 30 Years |
| | Powell, WY | | (c) | | 1,264 |
| | 859 |
| | — |
| | — |
| | 1,264 |
| | 859 |
| | 2,123 |
| | (567 | ) | | 1985 | | 05/31/06 | | 15 to 25 Years |
| | Quincy, IL | | (c) | | 3,510 |
| | 4,916 |
| | — |
| | — |
| | 3,510 |
| | 4,916 |
| | 8,426 |
| | (2,677 | ) | | 1986 | | 05/31/06 | | 15 to 28 Years |
| | Racine, WI | | (c) | | 3,076 |
| | 5,305 |
| | — |
| | — |
| | 3,076 |
| | 5,305 |
| | 8,381 |
| | (2,722 | ) | | 1979 | | 05/31/06 | | 15 to 25 Years |
| | Rawlins, WY | | (c) | | 430 |
| | 581 |
| | — |
| | — |
| | 430 |
| | 581 |
| | 1,011 |
| | (391 | ) | | 1971 | | 05/31/06 | | 15 to 20 Years |
| | Rensselaer, NY | | (a) | | 705 |
| | 657 |
| | — |
| | — |
| | 705 |
| | 657 |
| | 1,362 |
| | (367 | ) | | 1971 | | 07/17/13 | | 3 to 13 Years |
| | Rice Lake, WI | | (c) | | 1,535 |
| | 3,407 |
| | — |
| | — |
| | 1,535 |
| | 3,407 |
| | 4,942 |
| | (1,503 | ) | | 1995 | | 05/31/06 | | 15 to 30 Years |
| | River Falls, WI | | (c) | | 1,787 |
| | 4,283 |
| | — |
| | — |
| | 1,787 |
| | 4,283 |
| | 6,070 |
| | (1,744 | ) | | 1994 | | 05/31/06 | | 15 to 30 Years |
| | Rochester, MN | | (c) | | 6,466 |
| | 4,232 |
| | — |
| | — |
| | 6,466 |
| | 4,232 |
| | 10,698 |
| | (2,429 | ) | | 1981 | | 05/31/06 | | 15 to 28 Years |
| | Rochester, MN | | (c) | | 6,189 |
| | 4,511 |
| | — |
| | — |
| | 6,189 |
| | 4,511 |
| | 10,700 |
| | (2,524 | ) | | 1981 | | 05/31/06 | | 15 to 20 Years |
| | Rockville, IN | | (c) | | 628 |
| | 939 |
| | — |
| | — |
| | 628 |
| | 939 |
| | 1,567 |
| | (476 | ) | | 1999 | | 05/31/06 | | 15 to 30 Years |
| | Rome, NY | | (a) | | 436 |
| | 699 |
| | — |
| | — |
| | 436 |
| | 699 |
| | 1,135 |
| | (127 | ) | | 1996 | | 07/17/13 | | 10 to 28 Years |
| | Rothschild, WI | | (c) | | 2,685 |
| | 4,231 |
| | — |
| | — |
| | 2,685 |
| | 4,231 |
| | 6,916 |
| | (2,366 | ) | | 1977 | | 05/31/06 | | 15 to 29 Years |
| | Sandersville, GA | | (a) | | 503 |
| | 751 |
| | — |
| | — |
| | 503 |
| | 751 |
| | 1,254 |
| | (106 | ) | | 2006 | | 07/17/13 | | 10 to 45 Years |
| | Sheboygan, WI | | (c) | | 2,973 |
| | 4,340 |
| | — |
| | — |
| | 2,973 |
| | 4,340 |
| | 7,313 |
| | (1,969 | ) | | 1993 | | 05/31/06 | | 15 to 30 Years |
| | Shreveport, LA | | (a) | | 374 |
| | 490 |
| | — |
| | — |
| | 374 |
| | 490 |
| | 864 |
| | (124 | ) | | 2001 | | 07/17/13 | | 10 to 31 Years |
| | Sioux Falls, SD | | (c) | | 4,907 |
| | 4,023 |
| | — |
| | — |
| | 4,907 |
| | 4,023 |
| | 8,930 |
| | (2,260 | ) | | 1987 | | 05/31/06 | | 15 to 28 Years |
| | Somerville, TN | | (c) | | 345 |
| | 537 |
| | — |
| | — |
| | 345 |
| | 537 |
| | 882 |
| | (297 | ) | | 2000 | | 05/31/06 | | 15 to 30 Years |
| | Spencer, IN | | (c) | | 971 |
| | 2,483 |
| | — |
| | — |
| | 971 |
| | 2,483 |
| | 3,454 |
| | (572 | ) | | 1987 | | 07/17/13 | | 4 to 22 Years |
| | Spokane, WA | | (c) | | 1,014 |
| | 3,005 |
| | — |
| | — |
| | 1,014 |
| | 3,005 |
| | 4,019 |
| | (1,422 | ) | | 1987 | | 05/31/06 | | 15 to 29 Years |
| | St. Cloud, MN | | (c) | | 3,749 |
| | 4,884 |
| | — |
| | — |
| | 3,749 |
| | 4,884 |
| | 8,633 |
| | (2,673 | ) | | 1985 | | 05/31/06 | | 15 to 20 Years |
| | St. Cloud, MN | | (c) | | 5,033 |
| | 6,589 |
| | — |
| | — |
| | 5,033 |
| | 6,589 |
| | 11,622 |
| | (2,597 | ) | | 1991 | | 05/31/06 | | 15 to 30 Years |
| | Stevens Point, WI | | (c) | | 1,383 |
| | 5,401 |
| | — |
| | — |
| | 1,383 |
| | 5,401 |
| | 6,784 |
| | (2,612 | ) | | 1985 | | 05/31/06 | | 15 to 25 Years |
| | Sturgis, SD | | (c) | | 402 |
| | 717 |
| | — |
| | — |
| | 402 |
| | 717 |
| | 1,119 |
| | (432 | ) | | 1984 | | 05/31/06 | | 15 to 25 Years |
| | Sullivan, IL | | (c) | | 557 |
| | 879 |
| | — |
| | — |
| | 557 |
| | 879 |
| | 1,436 |
| | (442 | ) | | 1999 | | 05/31/06 | | 15 to 30 Years |
| | Sweetwater, TX | | (a) | | 415 |
| | 1,097 |
| | — |
| | — |
| | 415 |
| | 1,097 |
| | 1,512 |
| | (128 | ) | | 2006 | | 07/17/13 | | 10 to 47 Years |
| | Thermopolis, WY | | (a) | | 589 |
| | 1,600 |
| | — |
| | — |
| | 589 |
| | 1,600 |
| | 2,189 |
| | (402 | ) | | 2007 | | 12/08/09 | | 12 to 47 Years |
| | Tuscola, IL | | (c) | | 724 |
| | 897 |
| | — |
| | — |
| | 724 |
| | 897 |
| | 1,621 |
| | (491 | ) | | 2000 | | 05/31/06 | | 15 to 30 Years |
|
| | | | | | | | | | | | | | | | | | | | | | | | | | | | | | | | | |
| Advance Auto Parts | Hattiesburg, MS | | (d) | | 452 |
| | 821 |
| | — |
| | — |
| | 452 |
| | 821 |
| | 1,273 |
| | (39 | ) | | 1997 | | 07/22/16 | | 7 to 40 Years |
| Advance Auto Parts | Clinton, MS | | (d) | | 569 |
| | 693 |
| | — |
| | — |
| | 569 |
| | 693 |
| | 1,262 |
| | (49 | ) | | 1998 | | 07/22/16 | | 7 to 30 Years |
| Advance Auto Parts | Jackson, MS | | (d) | | 396 |
| | 423 |
| | — |
| | — |
| | 396 |
| | 423 |
| | 819 |
| | (30 | ) | | 1998 | | 07/22/16 | | 7 to 30 Years |
| Advance Auto Parts | Natchez, MS | | (d) | | 509 |
| | 754 |
| | — |
| | — |
| | 509 |
| | 754 |
| | 1,263 |
| | (39 | ) | | 1998 | | 07/22/16 | | 7 to 40 Years |
| Advance Auto Parts | Newton, MS | | (d) | | 336 |
| | 443 |
| | — |
| | — |
| | 336 |
| | 443 |
| | 779 |
| | (32 | ) | | 1998 | | 07/22/16 | | 7 to 30 Years |
| Advance Auto Parts | Wiggins, MS | | (d) | | 279 |
| | 630 |
| | — |
| | — |
| | 279 |
| | 630 |
| | 909 |
| | (41 | ) | | 1965 | | 07/22/16 | | 7 to 30 Years |
| Advance Auto Parts | Denmark, SC | | (d) | | 439 |
| | 504 |
| | — |
| | — |
| | 439 |
| | 504 |
| | 943 |
| | (40 | ) | | 1996 | | 07/22/16 | | 7 to 30 Years |
| Affordable Care, Inc. | Lincoln, NE | | (a) | | 711 |
| | 825 |
| | — |
| | — |
| | 711 |
| | 825 |
| | 1,536 |
| | (89 | ) | | 2010 | | 08/07/15 | | 8 to 40 Years |
| Affordable Care, Inc. | Bellevue, NE | | (a) | | 560 |
| | 446 |
| | — |
| | — |
| | 560 |
| | 446 |
| | 1,006 |
| | (60 | ) | | 2008 | | 08/07/15 | | 5 to 40 Years |
| Aggregate Industries | Annapolis Junction, MD | | (a) | | 2,245 |
| | 1,105 |
| | (1,535 | ) | | (547 | ) | | 710 |
| | 558 |
| | 1,268 |
| | (254 | ) | | 1930 | | 09/29/06 | | 15 to 30 Years |
| Airstrike Extreme Air Sports | Augusta, GA | | (d) | | 1,081 |
| | 1,488 |
| | — |
| | — |
| | 1,081 |
| | 1,488 |
| | 2,569 |
| | (288 | ) | | 1998 | | 09/30/15 | | 10 to 20 Years |
|
| | | | | | | | | | | | | | | | | | | | | | | | | | | | | | | | | |
| Alabama Clinics | Dothan, AL | | (d) | | 695 |
| | 1,707 |
| | — |
| | 20 |
| | 695 |
| | 1,727 |
| | 2,422 |
| | (242 | ) | | 2012 | | 12/21/16 | | 1 to 40 Years |
| Albertsons | Boise, ID | | (d) | | 1,470 |
| | 2,280 |
| | — |
| | — |
| | 1,470 |
| | 2,280 |
| | 3,750 |
| | (573 | ) | | 1982 | | 12/17/13 | | 4 to 20 Years |
| Albertsons | Las Cruces, NM | | (d) | | 1,132 |
| | 2,765 |
| | — |
| | — |
| | 1,132 |
| | 2,765 |
| | 3,897 |
| | (499 | ) | | 1983 | | 12/17/13 | | 5 to 30 Years |
| Albertsons | Midland, TX | | (d) | | 1,498 |
| | 3,096 |
| | — |
| | — |
| | 1,498 |
| | 3,096 |
| | 4,594 |
| | (764 | ) | | 1983 | | 12/17/13 | | 5 to 20 Years |
| Albertsons | Lompoc, CA | | (d) | | 2,743 |
| | 8,316 |
| | — |
| | — |
| | 2,743 |
| | 8,316 |
| | 11,059 |
| | (861 | ) | | 1992 | | 06/15/15 | | 15 to 30 Years |
| Albertsons | Tigard, OR | | (d) | | 5,515 |
| | 4,279 |
| | — |
| | — |
| | 5,515 |
| | 4,279 |
| | 9,794 |
| | (482 | ) | | 1998 | | 04/01/15 | | 15 to 30 Years |
| Albertsons | Lake Oswego, OR | | (d) | | 4,257 |
| | 5,891 |
| | — |
| | — |
| | 4,257 |
| | 5,891 |
| | 10,148 |
| | (470 | ) | | 1965 | | 03/18/15 | | 15 to 40 Years |
| Albertsons | Walla Walla, WA | | (d) | | 1,964 |
| | 8,420 |
| | — |
| | — |
| | 1,964 |
| | 8,420 |
| | 10,384 |
| | (719 | ) | | 1972 | | 03/02/15 | | 15 to 40 Years |
| Aldi | Tupelo, MS | | (b) | | 1,131 |
| | 1,176 |
| | (372 | ) | | (435 | ) | | 759 |
| | 741 |
| | 1,500 |
| | (48 | ) | | 1995 | | 07/17/13 | | 4 to 12 Years |
| Allstate Insurance Company | Yuma, AZ | | (c) | | 2,583 |
| | 5,221 |
| | — |
| | — |
| | 2,583 |
| | 5,221 |
| | 7,804 |
| | (1,019 | ) | | 2007 | | 07/17/13 | | 4 to 46 Years |
| AMC Theatres | Phoenix, AZ | | (a) | | 2,652 |
| | 11,495 |
| | — |
| | — |
| | 2,652 |
| | 11,495 |
| | 14,147 |
| | (3,228 | ) | | 1997 | | 07/01/05 | | 12 to 40 Years |
| AMC Theatres | Yukon, OK | | (c) | | 1,082 |
| | 3,538 |
| | — |
| | — |
| | 1,082 |
| | 3,538 |
| | 4,620 |
| | (669 | ) | | 2007 | | 07/17/13 | | 8 to 33 Years |
| AMC Theatres | Covina, CA | | (d) | | 5,566 |
| | 26,922 |
| | — |
| | — |
| | 5,566 |
| | 26,922 |
| | 32,488 |
| | (7,571 | ) | | 1997 | | 06/23/04 | | 13 to 40 Years |
| AMC Theatres | Surprise, AZ | | (a) | | 2,918 |
| | 7,122 |
| | — |
| | — |
| | 2,918 |
| | 7,122 |
| | 10,040 |
| | (567 | ) | | 2008 | | 11/10/15 | | 13 to 40 Years |
| AMC Theatres | South Bend, IN | | (a) | | 4,352 |
| | 9,411 |
| | — |
| | 21 |
| | 4,352 |
| | 9,432 |
| | 13,784 |
| | (1,099 | ) | | 1997 | | 01/04/16 | | 6 to 30 Years |
| American Lubefast | Waycross, GA | | (a) | | 380 |
| | 142 |
| | — |
| | — |
| | 380 |
| | 142 |
| | 522 |
| | (54 | ) | | 1998 | | 12/10/13 | | 15 to 30 Years |
| American Lubefast | Opelika, AL | | (b) | | 503 |
| | 628 |
| | — |
| | — |
| | 503 |
| | 628 |
| | 1,131 |
| | (303 | ) | | 1995 | | 09/07/07 | | 15 to 30 Years |
SPIRIT REALTY CAPITAL, INC.
Schedule III Real Estate and
Accumulated Depreciation
(Amounts in thousands)
|
| | | | | | | | | | | | | | | | | | | | | | | | | |
| | | | | | Initial Cost to Company | | Cost Capitalized Subsequent to Acquisition including impairment | | Gross Amount at December 31, 2016 (d) 2017 (g) | | | | | | | | |
| Concept | City, State | | Encumbrances (e) | | Land and Improvements | | Buildings and Improvements | | Land and Improvements | | Buildings and Improvements | | Land and Improvements | | Buildings and Improvements | | Total | | Final Accumulated Depreciation | | Date of Construction | | Date Acquired | | Life in which depreciation in latest Statement of Operations is computed |
Description | | Encumbrances (e)
| | Land and
Improvements
| | Buildings and
Improvements
| | Improvements/
Land
| | Improvements/
building
| | Land and
Improvements
| | Buildings and
Improvements
| | Total | | Final
Accum
| | Date of
Construction
| | Date
Acquired
| |
|
| | | | | | | | | | | | | | | | | | | | | | | | | | | | | | | | | | | | | | | | | |
| | Twin Falls, ID | | (c) | | 2,038 |
| | 3,696 |
| | — |
| | — |
| | 2,038 |
| | 3,696 |
| | 5,734 |
| | (2,053 | ) | | 1986 | | 05/31/06 | | 15 to 20 Years |
| | Union Gap, WA | | (c) | | 481 |
| | 4,079 |
| | — |
| | — |
| | 481 |
| | 4,079 |
| | 4,560 |
| | (2,222 | ) | | 1991 | | 05/31/06 | | 15 to 29 Years |
| | Washington, IA | | (c) | | 719 |
| | 865 |
| | (181 | ) | | (479 | ) | | 538 |
| | 386 |
| | 924 |
| | — |
| | 1973 | | 05/31/06 | | 15 to 20 Years |
| | Washington, IL | | (c) | | 1,195 |
| | 1,441 |
| | (391 | ) | | (517 | ) | | 804 |
| | 924 |
| | 1,728 |
| | — |
| | 1989 | | 07/17/13 | | 2 to 10 Years |
| | Watertown, SD | | (c) | | 3,064 |
| | 3,519 |
| | — |
| | — |
| | 3,064 |
| | 3,519 |
| | 6,583 |
| | (1,448 | ) | | 1985 | | 05/31/06 | | 15 to 30 Years |
| | Watertown, WI | | (c) | | 3,124 |
| | 4,436 |
| | — |
| | — |
| | 3,124 |
| | 4,436 |
| | 7,560 |
| | (2,400 | ) | | 1972 | | 05/31/06 | | 15 to 25 Years |
| | Waukon, IA | | (c) | | 604 |
| | 971 |
| | — |
| | — |
| | 604 |
| | 971 |
| | 1,575 |
| | (477 | ) | | 1998 | | 05/31/06 | | 15 to 30 Years |
| | Whiteville, NC | | (c) | | 1,119 |
| | 1,676 |
| | — |
| | — |
| | 1,119 |
| | 1,676 |
| | 2,795 |
| | (559 | ) | | 1988 | | 07/17/13 | | 7 to 30 Years |
| | Wichita, KS | | (a) | | 236 |
| | 741 |
| | — |
| | — |
| | 236 |
| | 741 |
| | 977 |
| | (81 | ) | | 1990 | | 07/17/13 | | 10 to 42 Years |
| | Wilton, NY | | (a) | | 1,348 |
| | 2,165 |
| | — |
| | — |
| | 1,348 |
| | 2,165 |
| | 3,513 |
| | (530 | ) | | 2000 | | 07/17/13 | | 8 to 27 Years |
| | Wisconsin Rapids, WI | | (c) | | 3,689 |
| | 4,806 |
| | — |
| | — |
| | 3,689 |
| | 4,806 |
| | 8,495 |
| | (2,581 | ) | | 1969 | | 05/31/06 | | 15 to 28 Years |
| | Woodsfield, OH | | (c) | | 691 |
| | 1,009 |
| | — |
| | — |
| | 691 |
| | 1,009 |
| | 1,700 |
| | (519 | ) | | 2000 | | 05/31/06 | | 15 to 30 Years |
| | Worthington, MN | | (c) | | 2,861 |
| | 3,767 |
| | — |
| | — |
| | 2,861 |
| | 3,767 |
| | 6,628 |
| | (1,562 | ) | | 1984 | | 05/31/06 | | 15 to 30 Years |
|
| | | | | | | | | | | | | | | | | | | | | | | | | | | | | | | | | |
| American Lubefast | Montgomery, AL | | (b) | | 398 |
| | 626 |
| | — |
| | — |
| | 398 |
| | 626 |
| | 1,024 |
| | (287 | ) | | 1997 | | 09/07/07 | | 15 to 30 Years |
| American Lubefast | Marianna, FL | | (b) | | 283 |
| | 452 |
| | — |
| | — |
| | 283 |
| | 452 |
| | 735 |
| | (186 | ) | | 1994 | | 09/07/07 | | 15 to 40 Years |
| American Lubefast | Montgomery, AL | | (b) | | 241 |
| | 628 |
| | — |
| | — |
| | 241 |
| | 628 |
| | 869 |
| | (263 | ) | | 1997 | | 09/07/07 | | 15 to 30 Years |
| American Lubefast | Auburn, AL | | (b) | | 676 |
| | 647 |
| | — |
| | — |
| | 676 |
| | 647 |
| | 1,323 |
| | (324 | ) | | 1995 | | 09/07/07 | | 15 to 30 Years |
| American Lubefast | Montgomery, AL | | (b) | | 422 |
| | 857 |
| | — |
| | — |
| | 422 |
| | 857 |
| | 1,279 |
| | (361 | ) | | 1992 | | 09/07/07 | | 15 to 30 Years |
| American Lubefast | Albany, GA | | (b) | | 242 |
| | 572 |
| | — |
| | — |
| | 242 |
| | 572 |
| | 814 |
| | (188 | ) | | 1982 | | 09/07/07 | | 15 to 40 Years |
| American Lubefast | Dothan, AL | | (b) | | 162 |
| | 659 |
| | — |
| | — |
| | 162 |
| | 659 |
| | 821 |
| | (268 | ) | | 1996 | | 09/07/07 | | 15 to 30 Years |
| American Lubefast | Montgomery, AL | | (b) | | 303 |
| | 636 |
| | — |
| | — |
| | 303 |
| | 636 |
| | 939 |
| | (274 | ) | | 1996 | | 09/07/07 | | 15 to 30 Years |
| American Lubefast | Crestview, FL | | (b) | | 544 |
| | 743 |
| | — |
| | — |
| | 544 |
| | 743 |
| | 1,287 |
| | (308 | ) | | 1975 | | 09/07/07 | | 15 to 30 Years |
| American Lubefast | Montgomery, AL | | (b) | | 275 |
| | 528 |
| | — |
| | — |
| | 275 |
| | 528 |
| | 803 |
| | (245 | ) | | 1988 | | 09/07/07 | | 15 to 30 Years |
| American Lubefast | Moultrie, GA | | (b) | | 179 |
| | 271 |
| | — |
| | — |
| | 179 |
| | 271 |
| | 450 |
| | (186 | ) | | 1983 | | 09/07/07 | | 15 to 20 Years |
| American Lubefast | Gulf Breeze, FL | | (b) | | 296 |
| | 457 |
| | — |
| | — |
| | 296 |
| | 457 |
| | 753 |
| | (193 | ) | | 1993 | | 09/07/07 | | 15 to 30 Years |
| American Lubefast | Albany, GA | | (b) | | 281 |
| | 575 |
| | — |
| | — |
| | 281 |
| | 575 |
| | 856 |
| | (272 | ) | | 1997 | | 09/07/07 | | 15 to 30 Years |
| American Lubefast | Pensacola, FL | | (b) | | 238 |
| | 564 |
| | — |
| | — |
| | 238 |
| | 564 |
| | 802 |
| | (239 | ) | | 1994 | | 09/07/07 | | 15 to 30 Years |
| American Lubefast | Pensacola, FL | | (b) | | 104 |
| | 333 |
| | — |
| | — |
| | 104 |
| | 333 |
| | 437 |
| | (151 | ) | | 1968 | | 09/07/07 | | 15 to 30 Years |
| American Lubefast | Niceville, FL | | (b) | | 458 |
| | 454 |
| | — |
| | — |
| | 458 |
| | 454 |
| | 912 |
| | (167 | ) | | 1996 | | 09/07/07 | | 15 to 40 Years |
| American Lubefast | Milton, FL | | (b) | | 137 |
| | 577 |
| | — |
| | — |
| | 137 |
| | 577 |
| | 714 |
| | (237 | ) | | 1986 | | 09/07/07 | | 15 to 30 Years |
| American Lubefast | Pensacola, FL | | (b) | | 148 |
| | 459 |
| | — |
| | — |
| | 148 |
| | 459 |
| | 607 |
| | (190 | ) | | 1972 | | 09/07/07 | | 15 to 30 Years |
| American Lubefast | Pensacola, FL | | (b) | | 195 |
| | 569 |
| | — |
| | — |
| | 195 |
| | 569 |
| | 764 |
| | (246 | ) | | 1983 | | 09/07/07 | | 15 to 30 Years |
| American Lubefast | Pensacola, FL | | (b) | | 150 |
| | 575 |
| | — |
| | — |
| | 150 |
| | 575 |
| | 725 |
| | (245 | ) | | 1986 | | 09/07/07 | | 15 to 30 Years |
| American Lubefast | Spanish Fort, AL | | (b) | | 563 |
| | 607 |
| | — |
| | — |
| | 563 |
| | 607 |
| | 1,170 |
| | (337 | ) | | 1993 | | 09/07/07 | | 15 to 30 Years |
| American Lubefast | Mobile, AL | | (b) | | 89 |
| | 501 |
| | — |
| | — |
| | 89 |
| | 501 |
| | 590 |
| | (201 | ) | | 1982 | | 11/30/07 | | 15 to 30 Years |
| American Lubefast | Valdosta, GA | | (b) | | 376 |
| | 576 |
| | — |
| | — |
| | 376 |
| | 576 |
| | 952 |
| | (262 | ) | | 1996 | | 11/30/07 | | 15 to 30 Years |
| American Lubefast | Ocean Springs, MS | | (b) | | 145 |
| | 186 |
| | — |
| | — |
| | 145 |
| | 186 |
| | 331 |
| | (40 | ) | | 1988 | | 07/17/13 | | 15 to 30 Years |
| American Lubefast | Panama City, FL | | (b) | | 378 |
| | 252 |
| | — |
| | — |
| | 378 |
| | 252 |
| | 630 |
| | (69 | ) | | 1997 | | 07/17/13 | | 15 to 30 Years |
| American Lubefast | Mobile, AL | | (b) | | 157 |
| | 508 |
| | — |
| | — |
| | 157 |
| | 508 |
| | 665 |
| | (213 | ) | | 1982 | | 09/07/07 | | 15 to 30 Years |
| American Lubefast | Wetumpka, AL | | (a) | | 185 |
| | 332 |
| | — |
| | — |
| | 185 |
| | 332 |
| | 517 |
| | (48 | ) | | 1995 | | 06/24/14 | | 12 to 30 Years |
| America's Auto Auction | Jacksonville, FL | | (a) | | 3,170 |
| | 938 |
| | — |
| | — |
| | 3,170 |
| | 938 |
| | 4,108 |
| | (649 | ) | | 1989 | | 12/28/05 | | 15 to 30 Years |
| America's Auto Auction | Tulsa, OK | | (a) | | 1,225 |
| | 373 |
| | — |
| | — |
| | 1,225 |
| | 373 |
| | 1,598 |
| | (745 | ) | | 1999 | | 12/28/05 | | 15 to 20 Years |
| America's Auto Auction | Greenville, SC | | (a) | | 2,561 |
| | 1,526 |
| | — |
| | — |
| | 2,561 |
| | 1,526 |
| | 4,087 |
| | (1,443 | ) | | 1999 | | 12/28/05 | | 15 to 30 Years |
SPIRIT REALTY CAPITAL, INC.
Schedule III Real Estate and Accumulated Depreciation
(Amounts in thousands)
|
| | | | | | | | | | | | | | | | | | | | | | | | | | | | | | | | | |
| Restaurants - Casual Dining | | | | | | | | | | | | | | | | | | | | | | |
| | Addison, TX | | (a) | | 1,615 |
| | 2,476 |
| | — |
| | — |
| | 1,615 |
| | 2,476 |
| | 4,091 |
| | (986 | ) | | 1998 | | 07/01/05 | | 15 to 30 Years |
| | Adrian, MI | | (c) | | 652 |
| | 1,233 |
| | — |
| | — |
| | 652 |
| | 1,233 |
| | 1,885 |
| | (111 | ) | | 1991 | | 12/23/14 | | 15 to 30 Years |
| | Albany, GA | | (a) | | 1,073 |
| | 1,719 |
| | (505 | ) | | (838 | ) | | 568 |
| | 881 |
| | 1,449 |
| | — |
| | 2003 | | 07/17/13 | | 12 to 33 Years |
| | Albany, GA | | (c) | | 744 |
| | 1,340 |
| | — |
| | — |
| | 744 |
| | 1,340 |
| | 2,084 |
| | (121 | ) | | 1971 | | 12/23/14 | | 15 to 30 Years |
| | Albany, OR | | (c) | | 913 |
| | 1,951 |
| | — |
| | — |
| | 913 |
| | 1,951 |
| | 2,864 |
| | (248 | ) | | 2005 | | 07/17/13 | | 12 to 35 Years |
| | Albuquerque, NM | | (a) | | 120 |
| | 1,336 |
| | — |
| | — |
| | 120 |
| | 1,336 |
| | 1,456 |
| | (419 | ) | | 1999 | | 07/01/05 | | 30 to 30 Years |
| | Albuquerque, NM | | (a) | | 1,036 |
| | 1,655 |
| | — |
| | — |
| | 1,036 |
| | 1,655 |
| | 2,691 |
| | (734 | ) | | 1994 | | 07/01/05 | | 15 to 30 Years |
| | Albuquerque, NM | | (a) | | 1,473 |
| | 2,947 |
| | — |
| | — |
| | 1,473 |
| | 2,947 |
| | 4,420 |
| | (570 | ) | | 2011 | | 07/17/13 | | 10 to 33 Years |
| | Alcoa, TN | | (a) | | 228 |
| | 219 |
| | — |
| | — |
| | 228 |
| | 219 |
| | 447 |
| | (113 | ) | | 1982 | | 11/02/07 | | 15 to 30 Years |
| | Alcoa, TN | | (a) | | 483 |
| | 318 |
| | — |
| | — |
| | 483 |
| | 318 |
| | 801 |
| | (169 | ) | | 1978 | | 11/02/07 | | 15 to 30 Years |
| | Alexandria, VA | | (a) | | 1,024 |
| | 202 |
| | — |
| | 12 |
| | 1,024 |
| | 214 |
| | 1,238 |
| | (147 | ) | | 1979 | | 12/19/06 | | 11 to 20 Years |
| | Alvin, TX | | (a) | | 256 |
| | 585 |
| | — |
| | — |
| | 256 |
| | 585 |
| | 841 |
| | (590 | ) | | 1997 | | 12/30/04 | | 10 to 15 Years |
| | Apple Valley, MN | | (a) | | 1,119 |
| | 1,055 |
| | — |
| | — |
| | 1,119 |
| | 1,055 |
| | 2,174 |
| | (469 | ) | | 1999 | | 09/24/04 | | 15 to 30 Years |
| | Appleton, WI | | (a) | | 727 |
| | 1,329 |
| | — |
| | 9 |
| | 727 |
| | 1,338 |
| | 2,065 |
| | (617 | ) | | 1993 | | 12/29/06 | | 7 to 30 Years |
| | Ardmore, OK | | (a) | | 1,332 |
| | 1,466 |
| | (704 | ) | | (677 | ) | | 628 |
| | 789 |
| | 1,417 |
| | (700 | ) | | 1986 | | 02/26/07 | | 14 to 30 Years |
| | Arkansas city, KS | | (a) | | 239 |
| | 975 |
| | — |
| | — |
| | 239 |
| | 975 |
| | 1,214 |
| | (111 | ) | | 1987 | | 06/04/14 | | 15 to 30 Years |
| | Arlington, TX | | (a) | | 2,064 |
| | 2,043 |
| | — |
| | — |
| | 2,064 |
| | 2,043 |
| | 4,107 |
| | (803 | ) | | 1995 | | 07/01/05 | | 15 to 30 Years |
| | Arlington, TX | | (a) | | 1,301 |
| | 1,032 |
| | — |
| | — |
| | 1,301 |
| | 1,032 |
| | 2,333 |
| | (716 | ) | | 1978 | | 02/26/07 | | 14 to 20 Years |
| | Ashland, OH | | (a) | | 294 |
| | 642 |
| | — |
| | — |
| | 294 |
| | 642 |
| | 936 |
| | (147 | ) | | 1971 | | 03/18/13 | | 13 to 20 Years |
|
| | | | | | | | | | | | | | | | | | | | | | | | | |
| | | | | | Initial Cost to Company | | Cost Capitalized Subsequent to Acquisition including impairment | | Gross Amount at December 31, 2016 (d) 2017 (g) | | | | | | | | |
| Concept | City, State | | Encumbrances (e) | | Land and Improvements | | Buildings and Improvements | | Land and Improvements | | Buildings and Improvements | | Land and Improvements | | Buildings and Improvements | | Total | | Final Accumulated Depreciation | | Date of Construction | | Date Acquired | | Life in which depreciation in latest Statement of Operations is computed |
Description | | Encumbrances (e)
| | Land and
Improvements
| | Buildings and
Improvements
| | Improvements/
Land
| | Improvements/
building
| | Land and
Improvements
| | Buildings and
Improvements
| | Total | | Final
Accum
| | Date of
Construction
| | Date
Acquired
| |
|
| | | | | | | | | | | | | | | | | | | | | | | | | | | | | | | | | |
| | Ashtabula, OH | | (a) | | 865 |
| | 244 |
| | — |
| | — |
| | 865 |
| | 244 |
| | 1,109 |
| | (160 | ) | | 1975 | | 02/06/07 | | 15 to 30 Years |
| | Athens, TN | | (a) | | 197 |
| | 341 |
| | — |
| | 176 |
| | 197 |
| | 517 |
| | 714 |
| | (231 | ) | | 1977 | | 11/02/07 | | 15 to 30 Years |
| | Augusta, GA | | (c) | | 1,494 |
| | 2,019 |
| | — |
| | — |
| | 1,494 |
| | 2,019 |
| | 3,513 |
| | (233 | ) | | 2005 | | 07/17/13 | | 13 to 40 Years |
| | Aurora, CO | | (c) | | 1,017 |
| | 1,743 |
| | — |
| | — |
| | 1,017 |
| | 1,743 |
| | 2,760 |
| | (212 | ) | | 1998 | | 07/17/13 | | 13 to 35 Years |
| | Aurora, CO | | (c) | | 1,521 |
| | 1,498 |
| | — |
| | — |
| | 1,521 |
| | 1,498 |
| | 3,019 |
| | (225 | ) | | 1992 | | 07/17/13 | | 9 to 32 Years |
| | Aurora, CO | | (c) | | 1,151 |
| | 1,742 |
| | — |
| | — |
| | 1,151 |
| | 1,742 |
| | 2,893 |
| | (127 | ) | | 1974 | | 12/23/14 | | 15 to 40 Years |
| | Austintown, OH | | (a) | | 1,106 |
| | 450 |
| | — |
| | — |
| | 1,106 |
| | 450 |
| | 1,556 |
| | (230 | ) | | 1991 | | 02/06/07 | | 15 to 30 Years |
| | Avon, IN | | (a) | | 899 |
| | 615 |
| | — |
| | — |
| | 899 |
| | 615 |
| | 1,514 |
| | (81 | ) | | 2014 | | 10/31/14 | | 14 to 30 Years |
| | Battle Creek, MI | | (a) | | 423 |
| | 560 |
| | — |
| | — |
| | 423 |
| | 560 |
| | 983 |
| | (85 | ) | | 1997 | | 12/24/13 | | 15 to 30 Years |
| | Beachwood, OH | | (c) | | 1,080 |
| | 1,773 |
| | — |
| | — |
| | 1,080 |
| | 1,773 |
| | 2,853 |
| | (132 | ) | | 1977 | | 12/23/14 | | 15 to 40 Years |
| | Beaumont, TX | | (a) | | 1,435 |
| | 1,541 |
| | — |
| | — |
| | 1,435 |
| | 1,541 |
| | 2,976 |
| | (685 | ) | | 1997 | | 06/29/07 | | 15 to 40 Years |
| | Bellflower, CA | | (a) | | 1,284 |
| | 1,636 |
| | — |
| | — |
| | 1,284 |
| | 1,636 |
| | 2,920 |
| | (139 | ) | | 1970 | | 12/19/14 | | 15 to 30 Years |
| | Bellflower, CA | | (a) | | 1,273 |
| | 1,501 |
| | — |
| | — |
| | 1,273 |
| | 1,501 |
| | 2,774 |
| | (92 | ) | | 1981 | | 12/19/14 | | 15 to 50 Years |
| | Benson, AZ | | (c) | | 313 |
| | 336 |
| | — |
| | — |
| | 313 |
| | 336 |
| | 649 |
| | (44 | ) | | 1996 | | 03/20/15 | | 15 to 20 Years |
| | Berkley, MI | | (a) | | 390 |
| | 540 |
| | — |
| | — |
| | 390 |
| | 540 |
| | 930 |
| | (58 | ) | | 1927 | | 10/31/14 | | 14 to 30 Years |
| | Bessemer, AL | | (a) | | 622 |
| | 983 |
| | — |
| | 64 |
| | 622 |
| | 1,047 |
| | 1,669 |
| | (178 | ) | | 2002 | | 03/29/13 | | 8 to 29 Years |
| | Birch Run, MI | | (c) | | 1,852 |
| | 1,290 |
| | — |
| | — |
| | 1,852 |
| | 1,290 |
| | 3,142 |
| | (199 | ) | | 2014 | | 12/24/14 | | 14 to 30 Years |
| | Birmingham, AL | | (a) | | 321 |
| | 739 |
| | — |
| | 50 |
| | 321 |
| | 789 |
| | 1,110 |
| | (133 | ) | | 1977 | | 03/29/13 | | 8 to 29 Years |
| | Birmingham, AL | | (a) | | 512 |
| | 983 |
| | — |
| | 65 |
| | 512 |
| | 1,048 |
| | 1,560 |
| | (179 | ) | | 2002 | | 03/29/13 | | 8 to 29 Years |
| | Blakely, GA | | (a) | | 288 |
| | 744 |
| | — |
| | — |
| | 288 |
| | 744 |
| | 1,032 |
| | (470 | ) | | 1987 | | 06/25/04 | | 15 to 20 Years |
| | Bloomington, IL | | (a) | | 393 |
| | 629 |
| | — |
| | — |
| | 393 |
| | 629 |
| | 1,022 |
| | (85 | ) | | 1986 | | 12/24/13 | | 15 to 30 Years |
| | Bloomington, IL | | (c) | | 662 |
| | 1,029 |
| | — |
| | — |
| | 662 |
| | 1,029 |
| | 1,691 |
| | (94 | ) | | 1975 | | 12/23/14 | | 15 to 30 Years |
| | Boise, ID | | (a) | | 809 |
| | 601 |
| | (400 | ) | | (259 | ) | | 409 |
| | 342 |
| | 751 |
| | (225 | ) | | 1998 | | 06/25/04 | | 15 to 30 Years |
| | Bowie, MD | | (a) | | 333 |
| | 173 |
| | — |
| | 200 |
| | 333 |
| | 373 |
| | 706 |
| | (220 | ) | | 1983 | | 11/27/06 | | 15 to 20 Years |
| | Bowie, MD | | (a) | | 1,501 |
| | 615 |
| | — |
| | — |
| | 1,501 |
| | 615 |
| | 2,116 |
| | (301 | ) | | 2004 | | 12/31/07 | | 15 to 40 Years |
| | Bowling Green, KY | | (a) | | 934 |
| | 3,135 |
| | (579 | ) | | (1,941 | ) | | 355 |
| | 1,194 |
| | 1,549 |
| | (26 | ) | | 1997 | | 07/17/13 | | 10 to 34 Years |
| | Boyne City, MI | | (c) | | 69 |
| | 938 |
| | — |
| | — |
| | 69 |
| | 938 |
| | 1,007 |
| | (37 | ) | | 1997 | | 11/09/15 | | 15 to 30 Years |
| | Bradford, PA | | (a) | | 368 |
| | 255 |
| | — |
| | — |
| | 368 |
| | 255 |
| | 623 |
| | (151 | ) | | 1977 | | 02/06/07 | | 15 to 30 Years |
| | Bradley, IL | | (c) | | 1,610 |
| | 1,783 |
| | — |
| | — |
| | 1,610 |
| | 1,783 |
| | 3,393 |
| | (179 | ) | | 1991 | | 12/23/14 | | 15 to 30 Years |
| | Brandon, FL | | (c) | | 1,358 |
| | 614 |
| | — |
| | — |
| | 1,358 |
| | 614 |
| | 1,972 |
| | (118 | ) | | 2004 | | 11/05/14 | | 14 to 20 Years |
| | Branson, MO | | (a) | | 1,497 |
| | 1,684 |
| | — |
| | — |
| | 1,497 |
| | 1,684 |
| | 3,181 |
| | (802 | ) | | 1994 | | 09/23/05 | | 15 to 30 Years |
| | Bridgeton, MO | | (a) | | 314 |
| | 1,160 |
| | — |
| | — |
| | 314 |
| | 1,160 |
| | 1,474 |
| | (134 | ) | | 1994 | | 12/24/13 | | 15 to 30 Years |
| | Broken Arrow, OK | | (a) | | 1,081 |
| | 226 |
| | — |
| | — |
| | 1,081 |
| | 226 |
| | 1,307 |
| | (27 | ) | | 2006 | | 12/24/13 | | 15 to 40 Years |
| | Broken Arrow, OK | | (a) | | 1,636 |
| | 1,620 |
| | — |
| | — |
| | 1,636 |
| | 1,620 |
| | 3,256 |
| | (197 | ) | | 2006 | | 07/21/14 | | 14 to 30 Years |
| | Brooklyn, OH | | (c) | | 1,226 |
| | 672 |
| | — |
| | — |
| | 1,226 |
| | 672 |
| | 1,898 |
| | (313 | ) | | 2001 | | 02/06/07 | | 10 to 25 Years |
| | Bryan, TX | | (a) | | 739 |
| | 700 |
| | — |
| | — |
| | 739 |
| | 700 |
| | 1,439 |
| | (439 | ) | | 1988 | | 12/30/04 | | 15 to 20 Years |
| | Burlington, IA | | (a) | | 304 |
| | 588 |
| | — |
| | — |
| | 304 |
| | 588 |
| | 892 |
| | (284 | ) | | 1996 | | 09/23/05 | | 15 to 30 Years |
| | Burlington, IA | | (a) | | 318 |
| | 484 |
| | — |
| | — |
| | 318 |
| | 484 |
| | 802 |
| | (240 | ) | | 2006 | | 12/04/06 | | 15 to 30 Years |
|
| | | | | | | | | | | | | | | | | | | | | | | | | | | | | | | | | |
| America's Auto Auction | Irving, TX | | (a) | | 7,348 |
| | 970 |
| | — |
| | — |
| | 7,348 |
| | 970 |
| | 8,318 |
| | (2,513 | ) | | 1960 | | 09/01/09 | | 12 to 27 Years |
| America's Auto Auction | Conroe, TX | | (a) | | 4,338 |
| | 448 |
| | 955 |
| | 145 |
| | 5,293 |
| | 593 |
| | 5,886 |
| | (1,849 | ) | | 2005 | | 09/01/09 | | 12 to 47 Years |
| America's Auto Auction | Irving, TX | | (a) | | 931 |
| | 268 |
| | — |
| | — |
| | 931 |
| | 268 |
| | 1,199 |
| | (190 | ) | | 1965 | | 09/01/09 | | 12 to 17 Years |
| America's Service Station | Dacula, GA | | (a) | | 1,067 |
| | 976 |
| | — |
| | — |
| | 1,067 |
| | 976 |
| | 2,043 |
| | (130 | ) | | 2000 | | 03/28/14 | | 15 to 40 Years |
| America's Service Station | Farragut, TN | | (a) | | 986 |
| | 1,148 |
| | — |
| | — |
| | 986 |
| | 1,148 |
| | 2,134 |
| | (166 | ) | | 2011 | | 03/28/14 | | 15 to 40 Years |
| Andy's Frozen Custard | Kansas City, MO | | (d) | | 772 |
| | 18 |
| | — |
| | 916 |
| �� | 772 |
| | 934 |
| | 1,706 |
| | (47 | ) | | 1995 | | 09/19/14 | | 40 to 40 Years |
| Andy's Frozen Custard | Rogers, AR | | (d) | | 334 |
| | 884 |
| | — |
| | — |
| | 334 |
| | 884 |
| | 1,218 |
| | (112 | ) | | 2005 | | 09/30/14 | | 15 to 30 Years |
| Andy's Frozen Custard | Naperville, IL | | (d) | | 976 |
| | — |
| | 27 |
| | 721 |
| | 1,003 |
| | 721 |
| | 1,724 |
| | (6 | ) | | 2016 | | 06/30/16 | | 40 to 40 Years |
| Andy's Frozen Custard | Orland Park, IL | | (d) | | 999 |
| | — |
| | — |
| | — |
| | 999 |
| | — |
| | 999 |
| | — |
| | (f) | | 09/12/16 | | (f) |
| Anixter | Mattoon, IL | | (a) | | 233 |
| | 263 |
| | — |
| | — |
| | 233 |
| | 263 |
| | 496 |
| | (224 | ) | | 1984 | | 05/01/05 | | 15 to 20 Years |
| Anixter | Fort Myers, FL | | (a) | | 641 |
| | 1,069 |
| | — |
| | — |
| | 641 |
| | 1,069 |
| | 1,710 |
| | (603 | ) | | 1999 | | 07/01/05 | | 14 to 30 Years |
| Applebee's | Chicago, IL | | (a) | | 1,675 |
| | 1,112 |
| | — |
| | — |
| | 1,675 |
| | 1,112 |
| | 2,787 |
| | (520 | ) | | 1999 | | 12/29/06 | | 15 to 30 Years |
| Applebee's | DeKalb, IL | | (a) | | 1,423 |
| | 1,552 |
| | — |
| | — |
| | 1,423 |
| | 1,552 |
| | 2,975 |
| | (783 | ) | | 1996 | | 12/29/06 | | 15 to 30 Years |
| Applebee's | Joliet, IL | | (a) | | 1,994 |
| | 1,207 |
| | — |
| | — |
| | 1,994 |
| | 1,207 |
| | 3,201 |
| | (694 | ) | | 1996 | | 12/29/06 | | 15 to 30 Years |
| Applebee's | Santa Fe, NM | | (d) | | 2,120 |
| | 2,033 |
| | — |
| | — |
| | 2,120 |
| | 2,033 |
| | 4,153 |
| | (305 | ) | | 1997 | | 07/17/13 | | 13 to 40 Years |
| Applebee's | Augusta, GA | | (d) | | 1,494 |
| | 2,019 |
| | — |
| | — |
| | 1,494 |
| | 2,019 |
| | 3,513 |
| | (301 | ) | | 2005 | | 07/17/13 | | 13 to 40 Years |
| Applebee's | Columbus, GA | | (d) | | 1,199 |
| | 1,911 |
| | — |
| | — |
| | 1,199 |
| | 1,911 |
| | 3,110 |
| | (295 | ) | | 2005 | | 07/17/13 | | 13 to 40 Years |
| Applebee's | Albany, OR | | (d) | | 913 |
| | 1,951 |
| | — |
| | — |
| | 913 |
| | 1,951 |
| | 2,864 |
| | (320 | ) | | 2005 | | 07/17/13 | | 12 to 35 Years |
| Applebee's | Macon, GA | | (d) | | 838 |
| | 1,723 |
| | — |
| | — |
| | 838 |
| | 1,723 |
| | 2,561 |
| | (259 | ) | | 1995 | | 07/17/13 | | 13 to 40 Years |
| Applebee's | Walla Walla, WA | | (d) | | 665 |
| | 2,072 |
| | — |
| | — |
| | 665 |
| | 2,072 |
| | 2,737 |
| | (359 | ) | | 2005 | | 07/17/13 | | 11 to 35 Years |
| Applebee's | Aurora, CO | | (d) | | 1,017 |
| | 1,743 |
| | — |
| | — |
| | 1,017 |
| | 1,743 |
| | 2,760 |
| | (274 | ) | | 1998 | | 07/17/13 | | 13 to 35 Years |
| Applebee's | Colorado Springs, CO | | (d) | | 937 |
| | 1,120 |
| | — |
| | — |
| | 937 |
| | 1,120 |
| | 2,057 |
| | (278 | ) | | 1998 | | 07/17/13 | | 8 to 25 Years |
| Applebee's | Columbus, GA | | (d) | | 2,102 |
| | 1,717 |
| | — |
| | — |
| | 2,102 |
| | 1,717 |
| | 3,819 |
| | (242 | ) | | 1993 | | 07/17/13 | | 13 to 40 Years |
| Applebee's | Gallup, NM | | (d) | | 937 |
| | 2,277 |
| | — |
| | — |
| | 937 |
| | 2,277 |
| | 3,214 |
| | (347 | ) | | 2004 | | 07/17/13 | | 13 to 40 Years |
| Applebee's | Warner Robins, GA | | (d) | | 1,228 |
| | 1,714 |
| | — |
| | — |
| | 1,228 |
| | 1,714 |
| | 2,942 |
| | (273 | ) | | 1994 | | 07/17/13 | | 11 to 40 Years |
| Applebee's | Savannah, GA | | (d) | | 1,112 |
| | 1,727 |
| | — |
| | — |
| | 1,112 |
| | 1,727 |
| | 2,839 |
| | (267 | ) | | 1993 | | 07/17/13 | | 13 to 40 Years |
SPIRIT REALTY CAPITAL, INC.
Schedule III Real Estate and
Accumulated Depreciation
(Amounts in thousands)
|
| | | | | | | | | | | | | | | | | | | | | | | | | |
| | | | | | Initial Cost to Company | | Cost Capitalized Subsequent to Acquisition including impairment | | Gross Amount at December 31, 2016 (d) 2017 (g) | | | | | | | | |
| Concept | City, State | | Encumbrances (e) | | Land and Improvements | | Buildings and Improvements | | Land and Improvements | | Buildings and Improvements | | Land and Improvements | | Buildings and Improvements | | Total | | Final Accumulated Depreciation | | Date of Construction | | Date Acquired | | Life in which depreciation in latest Statement of Operations is computed |
Description | | Encumbrances (e)
| | Land and
Improvements
| | Buildings and
Improvements
| | Improvements/
Land
| | Improvements/
building
| | Land and
Improvements
| | Buildings and
Improvements
| | Total | | Final
Accum
| | Date of
Construction
| | Date
Acquired
| |
|
| | | | | | | | | | | | | | | | | | | | | | | | | | | | | | | | | |
| | Burr Ridge, IL | | (a) | | 759 |
| | 977 |
| | 16 |
| | 1,584 |
| | 775 |
| | 2,561 |
| | 3,336 |
| | (1,027 | ) | | 1997 | | 06/25/04 | | 15 to 30 Years |
| | Calera, AL | | (a) | | 560 |
| | 912 |
| | — |
| | 84 |
| | 560 |
| | 996 |
| | 1,556 |
| | (183 | ) | | 2008 | | 03/29/13 | | 8 to 29 Years |
| | Canfield, OH | | (a) | | 449 |
| | 644 |
| | 92 |
| | — |
| | 541 |
| | 644 |
| | 1,185 |
| | (290 | ) | | 1973 | | 02/06/07 | | 15 to 30 Years |
| | Canton, MI | | (a) | | 2,071 |
| | 1,224 |
| | — |
| | — |
| | 2,071 |
| | 1,224 |
| | 3,295 |
| | (675 | ) | | 1996 | | 06/25/04 | | 15 to 30 Years |
| | Canton, MI | | (c) | | 914 |
| | 890 |
| | — |
| | — |
| | 914 |
| | 890 |
| | 1,804 |
| | (65 | ) | | 2014 | | 06/17/15 | | 15 to 40 Years |
| | Canton, OH | | (a) | | 1,325 |
| | 781 |
| | — |
| | — |
| | 1,325 |
| | 781 |
| | 2,106 |
| | (342 | ) | | 1989 | | 02/06/07 | | 15 to 30 Years |
| | Carrollton, GA | | (a) | | 985 |
| | 725 |
| | — |
| | — |
| | 985 |
| | 725 |
| | 1,710 |
| | (130 | ) | | 1995 | | 07/17/13 | | 11 to 33 Years |
| | Casper, WY | | (a) | | 54 |
| | 762 |
| | — |
| | — |
| | 54 |
| | 762 |
| | 816 |
| | (274 | ) | | 1969 | | 12/29/06 | | 15 to 30 Years |
| | Chanhassen, MN | | (a) | | 1,439 |
| | 784 |
| | — |
| | — |
| | 1,439 |
| | 784 |
| | 2,223 |
| | (138 | ) | | 1953 | | 05/22/14 | | 15 to 30 Years |
| | Charleston, IL | | (a) | | 272 |
| | 220 |
| | — |
| | — |
| | 272 |
| | 220 |
| | 492 |
| | (233 | ) | | 1986 | | 09/23/05 | | 10 to 15 Years |
| | Chatsworth, GA | | (a) | | 213 |
| | 558 |
| | — |
| | — |
| | 213 |
| | 558 |
| | 771 |
| | (232 | ) | | 1979 | | 11/02/07 | | 15 to 30 Years |
| | Chattanooga, TN | | (a) | | 352 |
| | 246 |
| | — |
| | — |
| | 352 |
| | 246 |
| | 598 |
| | (179 | ) | | 1984 | | 11/02/07 | | 15 to 30 Years |
| | Cheyenne, WY | | (a) | | 277 |
| | 2,041 |
| | — |
| | — |
| | 277 |
| | 2,041 |
| | 2,318 |
| | (1,015 | ) | | 1928 | | 12/29/06 | | 15 to 20 Years |
| | Chicago, IL | | (a) | | 1,675 |
| | 1,112 |
| | — |
| | — |
| | 1,675 |
| | 1,112 |
| | 2,787 |
| | (470 | ) | | 1999 | | 12/29/06 | | 15 to 30 Years |
| | Cincinnati, OH | | (a) | | 1,614 |
| | 4,134 |
| | — |
| | — |
| | 1,614 |
| | 4,134 |
| | 5,748 |
| | (378 | ) | | 2013 | | 01/15/14 | | 9 to 40 Years |
| | Claremont, CA | | (a) | | 2,764 |
| | 2,919 |
| | — |
| | — |
| | 2,764 |
| | 2,919 |
| | 5,683 |
| | (240 | ) | | 2011 | | 12/19/14 | | 15 to 40 Years |
| | Clarion, PA | | (a) | | 426 |
| | 653 |
| | — |
| | — |
| | 426 |
| | 653 |
| | 1,079 |
| | (304 | ) | | 1976 | | 02/06/07 | | 15 to 30 Years |
| | Clearwater, FL | | (a) | | 2,226 |
| | 858 |
| | — |
| | — |
| | 2,226 |
| | 858 |
| | 3,084 |
| | (376 | ) | | 2004 | | 12/31/07 | | 15 to 40 Years |
| | Cleveland, OH | | (a) | | 875 |
| | 138 |
| | — |
| | — |
| | 875 |
| | 138 |
| | 1,013 |
| | (26 | ) | | 1995 | | 12/24/13 | | 15 to 30 Years |
| | Clinton Township, MI | | (c) | | 1,377 |
| | 911 |
| | — |
| | — |
| | 1,377 |
| | 911 |
| | 2,288 |
| | (108 | ) | | 2003 | | 11/05/14 | | 14 to 30 Years |
| | Clinton, MD | | (a) | | 300 |
| | 193 |
| | — |
| | 200 |
| | 300 |
| | 393 |
| | 693 |
| | (179 | ) | | 1980 | | 11/27/06 | | 13 to 20 Years |
| | Clinton, TN | | (a) | | 417 |
| | 293 |
| | — |
| | — |
| | 417 |
| | 293 |
| | 710 |
| | (171 | ) | | 1994 | | 11/02/07 | | 15 to 30 Years |
| | Clovis, NM | | (c) | | 861 |
| | 2,172 |
| | — |
| | — |
| | 861 |
| | 2,172 |
| | 3,033 |
| | (268 | ) | | 2005 | | 07/17/13 | | 13 to 40 Years |
| | Colby, KS | | (a) | | 269 |
| | 567 |
| | — |
| | — |
| | 269 |
| | 567 |
| | 836 |
| | (73 | ) | | 1987 | | 06/04/14 | | 15 to 30 Years |
| | Colonial Heights, VA | | (a) | | 1,948 |
| | 500 |
| | 37 |
| | 1,463 |
| | 1,985 |
| | 1,963 |
| | 3,948 |
| | (129 | ) | | 1989 | | 10/25/13 | | 15 to 40 Years |
| | Colonie, NY | | (a) | | 1,322 |
| | 991 |
| | (350 | ) | | (261 | ) | | 972 |
| | 730 |
| | 1,702 |
| | (403 | ) | | 1994 | | 12/31/07 | | 15 to 40 Years |
| | Colorado Springs, CO | | (a) | | 674 |
| | 519 |
| | — |
| | — |
| | 674 |
| | 519 |
| | 1,193 |
| | (117 | ) | | 1989 | | 11/19/12 | | 5 to 30 Years |
| | Colorado Springs, CO | | (c) | | 937 |
| | 1,120 |
| | — |
| | — |
| | 937 |
| | 1,120 |
| | 2,057 |
| | (215 | ) | | 1998 | | 07/17/13 | | 8 to 25 Years |
| | Columbus, GA | | (c) | | 1,199 |
| | 1,911 |
| | — |
| | — |
| | 1,199 |
| | 1,911 |
| | 3,110 |
| | (228 | ) | | 2005 | | 07/17/13 | | 13 to 40 Years |
| | Columbus, GA | | (c) | | 2,102 |
| | 1,717 |
| | — |
| | — |
| | 2,102 |
| | 1,717 |
| | 3,819 |
| | (187 | ) | | 1993 | | 07/17/13 | | 13 to 40 Years |
| | Columbus, GA | | (c) | | 876 |
| | 1,243 |
| | — |
| | — |
| | 876 |
| | 1,243 |
| | 2,119 |
| | (115 | ) | | 2003 | | 12/23/14 | | 15 to 30 Years |
| | Conroe, TX | | (a) | | 942 |
| | 3,274 |
| | (575 | ) | | (2,006 | ) | | 367 |
| | 1,268 |
| | 1,635 |
| | (29 | ) | | 1993 | | 07/17/13 | | 11 to 32 Years |
| | Corry, PA | | (a) | | 411 |
| | 279 |
| | — |
| | — |
| | 411 |
| | 279 |
| | 690 |
| | (183 | ) | | 1977 | | 02/06/07 | | 15 to 30 Years |
| | Council Bluffs, IA | | (c) | | 1,070 |
| | 703 |
| | — |
| | — |
| | 1,070 |
| | 703 |
| | 1,773 |
| | (77 | ) | | 1995 | | 12/23/14 | | 15 to 30 Years |
| | Creston, IA | | (a) | | 103 |
| | 180 |
| | — |
| | — |
| | 103 |
| | 180 |
| | 283 |
| | (200 | ) | | 1974 | | 12/15/05 | | 10 to 15 Years |
| | Crossville, TN | | (a) | | 220 |
| | 288 |
| | — |
| | 176 |
| | 220 |
| | 464 |
| | 684 |
| | (215 | ) | | 1978 | | 11/02/07 | | 15 to 30 Years |
|
| | | | | | | | | | | | | | | | | | | | | | | | | | | | | | | | | |
| Applebee's | Union Gap, WA | | (d) | | 522 |
| | 2,218 |
| | — |
| | — |
| | 522 |
| | 2,218 |
| | 2,740 |
| | (284 | ) | | 2004 | | 07/17/13 | | 13 to 40 Years |
| Applebee's | Loveland, CO | | (d) | | 602 |
| | 1,913 |
| | — |
| | — |
| | 602 |
| | 1,913 |
| | 2,515 |
| | (255 | ) | | 1997 | | 07/17/13 | | 12 to 40 Years |
| Applebee's | Littleton, CO | | (d) | | 696 |
| | 1,943 |
| | — |
| | — |
| | 696 |
| | 1,943 |
| | 2,639 |
| | (282 | ) | | 1990 | | 07/17/13 | | 11 to 40 Years |
| Applebee's | Longview, WA | | (d) | | 870 |
| | 2,855 |
| | — |
| | — |
| | 870 |
| | 2,855 |
| | 3,725 |
| | (394 | ) | | 2004 | | 07/17/13 | | 13 to 40 Years |
| Applebee's | Grand Junction, CO | | (d) | | 1,363 |
| | 1,990 |
| | — |
| | — |
| | 1,363 |
| | 1,990 |
| | 3,353 |
| | (312 | ) | | 1995 | | 07/17/13 | | 10 to 40 Years |
| Applebee's | Garden City, GA | | (d) | | 1,184 |
| | 1,465 |
| | — |
| | — |
| | 1,184 |
| | 1,465 |
| | 2,649 |
| | (238 | ) | | 1998 | | 07/17/13 | | 9 to 40 Years |
| Applebee's | Fountain, CO | | (d) | | 861 |
| | 2,226 |
| | — |
| | — |
| | 861 |
| | 2,226 |
| | 3,087 |
| | (321 | ) | | 2005 | | 07/17/13 | | 12 to 38 Years |
| Applebee's | Aurora, CO | | (d) | | 1,521 |
| | 1,498 |
| | — |
| | — |
| | 1,521 |
| | 1,498 |
| | 3,019 |
| | (290 | ) | | 1992 | | 07/17/13 | | 9 to 32 Years |
| Applebee's | Macon, GA | | (d) | | 874 |
| | 1,712 |
| | — |
| | — |
| | 874 |
| | 1,712 |
| | 2,586 |
| | (269 | ) | | 1995 | | 07/17/13 | | 11 to 40 Years |
| Applebee's | Clovis, NM | | (d) | | 861 |
| | 2,172 |
| | — |
| | — |
| | 861 |
| | 2,172 |
| | 3,033 |
| | (347 | ) | | 2005 | | 07/17/13 | | 13 to 40 Years |
| Arby's | Madisonville, KY | | (a) | | 1,198 |
| | 819 |
| | (95 | ) | | — |
| | 1,103 |
| | 819 |
| | 1,922 |
| | (414 | ) | | 1990 | | 09/24/04 | | 15 to 30 Years |
| Arby's | Brunswick, GA | | (a) | | 774 |
| | 614 |
| | — |
| | — |
| | 774 |
| | 614 |
| | 1,388 |
| | (410 | ) | | 1999 | | 09/24/04 | | 15 to 20 Years |
| Arby's | Tooele, UT | | (a) | | 552 |
| | 624 |
| | — |
| | — |
| | 552 |
| | 624 |
| | 1,176 |
| | (476 | ) | | 1988 | | 09/24/04 | | 15 to 20 Years |
| Arby's | Jacksonville, FL | | (a) | | 480 |
| | 631 |
| | — |
| | — |
| | 480 |
| | 631 |
| | 1,111 |
| | (325 | ) | | 1998 | | 09/24/04 | | 15 to 30 Years |
| Arby's | McDonough, GA | | (a) | | 938 |
| | 697 |
| | — |
| | — |
| | 938 |
| | 697 |
| | 1,635 |
| | (393 | ) | | 1985 | | 09/24/04 | | 15 to 30 Years |
| Arby's | Cumming, GA | | (a) | | 967 |
| | 844 |
| | — |
| | — |
| | 967 |
| | 844 |
| | 1,811 |
| | (452 | ) | | 1986 | | 09/24/04 | | 15 to 30 Years |
| Arby's | Indianapolis, IN | | (a) | | 460 |
| | 587 |
| | — |
| | — |
| | 460 |
| | 587 |
| | 1,047 |
| | (278 | ) | | 1998 | | 09/24/04 | | 15 to 30 Years |
| Arby's | Jacksonville, FL | | (a) | | 872 |
| | 509 |
| | — |
| | — |
| | 872 |
| | 509 |
| | 1,381 |
| | (366 | ) | | 1984 | | 09/24/04 | | 15 to 20 Years |
| Arby's | Statesboro, GA | | (a) | | 779 |
| | 777 |
| | — |
| | — |
| | 779 |
| | 777 |
| | 1,556 |
| | (453 | ) | | 1985 | | 09/24/04 | | 15 to 20 Years |
| Arby's | Moncks Corner, SC | | (a) | | 573 |
| | 466 |
| | — |
| | — |
| | 573 |
| | 466 |
| | 1,039 |
| | (368 | ) | | 1998 | | 09/24/04 | | 15 to 20 Years |
| Arby's | Jacksonville, FL | | (a) | | 487 |
| | 871 |
| | — |
| | — |
| | 487 |
| | 871 |
| | 1,358 |
| | (509 | ) | | 1985 | | 12/30/04 | | 15 to 20 Years |
| Arby's | Orlando, FL | | (a) | | 642 |
| | 178 |
| | — |
| | — |
| | 642 |
| | 178 |
| | 820 |
| | (254 | ) | | 1967 | | 12/30/04 | | 10 to 15 Years |
| Arby's | Winter Springs, FL | | (a) | | 523 |
| | 446 |
| | — |
| | — |
| | 523 |
| | 446 |
| | 969 |
| | (345 | ) | | 1988 | | 12/30/04 | | 15 to 20 Years |
| Arby's | Lexington, KY | | (a) | | 636 |
| | 362 |
| | — |
| | — |
| | 636 |
| | 362 |
| | 998 |
| | (422 | ) | | 1978 | | 12/30/04 | | 10 to 15 Years |
| Arby's | Eustis, FL | | (a) | | 451 |
| | 377 |
| | — |
| | — |
| | 451 |
| | 377 |
| | 828 |
| | (440 | ) | | 1969 | | 12/30/04 | | 10 to 15 Years |
| Arby's | Lexington, KY | | (a) | | 713 |
| | 451 |
| | — |
| | — |
| | 713 |
| | 451 |
| | 1,164 |
| | (529 | ) | | 1976 | | 01/26/05 | | 10 to 15 Years |
| Arby's | Crawfordsville, IN | | (a) | | 557 |
| | 624 |
| | — |
| | — |
| | 557 |
| | 624 |
| | 1,181 |
| | (324 | ) | | 1998 | | 09/23/05 | | 15 to 30 Years |
|
| | | | | | | | | | | | | | | | | | | | | | | | | | | | | | | | | |
| Arby's | Mooresville, IN | | (a) | | 560 |
| | 549 |
| | — |
| | — |
| | 560 |
| | 549 |
| | 1,109 |
| | (411 | ) | | 1998 | | 09/23/05 | | 15 to 20 Years |
| Arby's | Martinsburg, WV | | (a) | | 887 |
| | 992 |
| | — |
| | — |
| | 887 |
| | 992 |
| | 1,879 |
| | (489 | ) | | 1999 | | 12/29/05 | | 15 to 30 Years |
| Arby's | Mount Pleasant, MI | | (a) | | 485 |
| | 642 |
| | — |
| | — |
| | 485 |
| | 642 |
| | 1,127 |
| | (309 | ) | | 1997 | | 12/29/05 | | 15 to 30 Years |
| Arby's | Sterling Heights, MI | | (a) | | 866 |
| | 960 |
| | — |
| | — |
| | 866 |
| | 960 |
| | 1,826 |
| | (449 | ) | | 2000 | | 12/29/05 | | 15 to 30 Years |
SPIRIT REALTY CAPITAL, INC.
Schedule III Real Estate and
Accumulated Depreciation
(Amounts in thousands)
|
| | | | | | | | | | | | | | | | | | | | | | | | | |
| | | | | | Initial Cost to Company | | Cost Capitalized Subsequent to Acquisition including impairment | | Gross Amount at December 31, 2016 (d) 2017 (g) | | | | | | | | |
| Concept | City, State | | Encumbrances (e) | | Land and Improvements | | Buildings and Improvements | | Land and Improvements | | Buildings and Improvements | | Land and Improvements | | Buildings and Improvements | | Total | | Final Accumulated Depreciation | | Date of Construction | | Date Acquired | | Life in which depreciation in latest Statement of Operations is computed |
Description | | Encumbrances (e)
| | Land and
Improvements
| | Buildings and
Improvements
| | Improvements/
Land
| | Improvements/
building
| | Land and
Improvements
| | Buildings and
Improvements
| | Total | | Final
Accum
| | Date of
Construction
| | Date
Acquired
| |
|
| | | | | | | | | | | | | | | | | | | | | | | | | | | | | | | | | |
| | Culpeper, VA | | (a) | | 367 |
| | 169 |
| | — |
| | — |
| | 367 |
| | 169 |
| | 536 |
| | (115 | ) | | 1977 | | 12/19/06 | | 15 to 20 Years |
| | Dallas, TX | | (a) | | 1,053 |
| | 412 |
| | — |
| | — |
| | 1,053 |
| | 412 |
| | 1,465 |
| | (255 | ) | | 1976 | | 07/01/05 | | 15 to 20 Years |
| | Dallas, TX | | (a) | | 1,366 |
| | 1,699 |
| | 227 |
| | — |
| | 1,593 |
| | 1,699 |
| | 3,292 |
| | (642 | ) | | 1997 | | 07/01/05 | | 15 to 30 Years |
| | Dallas, TX | | (a) | | 2,965 |
| | 9,066 |
| | — |
| | — |
| | 2,965 |
| | 9,066 |
| | 12,031 |
| | (1,001 | ) | | 1998 | | 07/17/13 | | 11 to 35 Years |
| | Danville, VA | | (a) | | 957 |
| | 2,813 |
| | — |
| | — |
| | 957 |
| | 2,813 |
| | 3,770 |
| | (300 | ) | | 2009 | | 08/21/13 | | 15 to 40 Years |
| | Dawsonville, GA | | (a) | | 925 |
| | 828 |
| | (187 | ) | | (216 | ) | | 738 |
| | 612 |
| | 1,350 |
| | — |
| | 2005 | | 07/17/13 | | 7 to 27 Years |
| | Dayton, OH | | (a) | | 1,026 |
| | 907 |
| | — |
| | — |
| | 1,026 |
| | 907 |
| | 1,933 |
| | (430 | ) | | 2002 | | 12/31/07 | | 15 to 40 Years |
| | Dayton, TN | | (a) | | 308 |
| | 291 |
| | — |
| | 176 |
| | 308 |
| | 467 |
| | 775 |
| | (214 | ) | | 1979 | | 11/02/07 | | 15 to 30 Years |
| | De Witt, IA | | (a) | | 248 |
| | 333 |
| | — |
| | — |
| | 248 |
| | 333 |
| | 581 |
| | (238 | ) | | 1984 | | 09/23/05 | | 15 to 20 Years |
| | Decatur, AL | | (a) | | 1,157 |
| | 1,725 |
| | — |
| | — |
| | 1,157 |
| | 1,725 |
| | 2,882 |
| | (302 | ) | | 2004 | | 07/17/13 | | 10 to 30 Years |
| | Decorah, IA | | (a) | | 207 |
| | 91 |
| | — |
| | — |
| | 207 |
| | 91 |
| | 298 |
| | (112 | ) | | 1985 | | 09/23/05 | | 10 to 15 Years |
| | DeKalb, IL | | (a) | | 1,423 |
| | 1,552 |
| | — |
| | — |
| | 1,423 |
| | 1,552 |
| | 2,975 |
| | (708 | ) | | 1996 | | 12/29/06 | | 15 to 30 Years |
| | Dickinson, ND | | (a) | | 616 |
| | 1,301 |
| | — |
| | — |
| | 616 |
| | 1,301 |
| | 1,917 |
| | (419 | ) | | 2003 | | 12/29/06 | | 15 to 40 Years |
| | Dodge City, KS | | (a) | | 249 |
| | 587 |
| | — |
| | — |
| | 249 |
| | 587 |
| | 836 |
| | (63 | ) | | 1985 | | 06/04/14 | | 15 to 30 Years |
| | Downey, CA | | (a) | | 2,329 |
| | 2,526 |
| | — |
| | — |
| | 2,329 |
| | 2,526 |
| | 4,855 |
| | (186 | ) | | 1993 | | 12/19/14 | | 15 to 40 Years |
| | Dubuque, IA | | (a) | | 479 |
| | 298 |
| | — |
| | — |
| | 479 |
| | 298 |
| | 777 |
| | (367 | ) | | 1970 | | 09/23/05 | | 10 to 15 Years |
| | Duluth, GA | | (c) | | 1,913 |
| | 4,576 |
| | — |
| | — |
| | 1,913 |
| | 4,576 |
| | 6,489 |
| | — |
| | 1984 | | 12/22/16 | | 13 to 40 Years |
| | Duluth, MN | | (a) | | 74 |
| | 423 |
| | — |
| | — |
| | 74 |
| | 423 |
| | 497 |
| | (134 | ) | | 1915 | | 05/24/05 | | 15 to 30 Years |
| | Durham, NC | | (c) | | 1,477 |
| | 1,661 |
| | — |
| | — |
| | 1,477 |
| | 1,661 |
| | 3,138 |
| | (157 | ) | | 1978 | | 12/23/14 | | 15 to 30 Years |
| | Dyersville, IA | | (a) | | 267 |
| | 513 |
| | — |
| | — |
| | 267 |
| | 513 |
| | 780 |
| | (356 | ) | | 1983 | | 09/23/05 | | 14 to 20 Years |
| | Eagen, MN | | (a) | | 724 |
| | 1,230 |
| | — |
| | — |
| | 724 |
| | 1,230 |
| | 1,954 |
| | (135 | ) | | 1996 | | 05/22/14 | | 15 to 30 Years |
| | Edinboro, PA | | (a) | | 384 |
| | 350 |
| | — |
| | — |
| | 384 |
| | 350 |
| | 734 |
| | (202 | ) | | 1973 | | 02/06/07 | | 15 to 30 Years |
| | Effingham, IL | | (a) | | 357 |
| | 228 |
| | — |
| | — |
| | 357 |
| | 228 |
| | 585 |
| | (279 | ) | | 1973 | | 09/23/05 | | 10 to 15 Years |
| | El Paso, TX | | (c) | | 1,725 |
| | 1,470 |
| | — |
| | — |
| | 1,725 |
| | 1,470 |
| | 3,195 |
| | (120 | ) | | 2014 | | 04/15/15 | | 15 to 30 Years |
| | Elizabethton, TN | | (a) | | 727 |
| | 482 |
| | — |
| | — |
| | 727 |
| | 482 |
| | 1,209 |
| | (71 | ) | | 2006 | | 12/24/13 | | 15 to 40 Years |
| | Elk Rapids, MI | | (c) | | 227 |
| | 947 |
| | — |
| | — |
| | 227 |
| | 947 |
| | 1,174 |
| | (41 | ) | | 1998 | | 11/09/15 | | 15 to 30 Years |
| | Emmitsburg, MD | | (a) | | 141 |
| | 182 |
| | — |
| | — |
| | 141 |
| | 182 |
| | 323 |
| | (104 | ) | | 1981 | | 11/27/06 | | 15 to 20 Years |
| | Emporia, KS | | (a) | | 657 |
| | 219 |
| | — |
| | — |
| | 657 |
| | 219 |
| | 876 |
| | (31 | ) | | 1997 | | 06/04/14 | | 15 to 30 Years |
| | Ephrata, PA | | (a) | | 685 |
| | 231 |
| | — |
| | — |
| | 685 |
| | 231 |
| | 916 |
| | (190 | ) | | 1978 | | 01/30/06 | | 15 to 20 Years |
| | Erie, PA | | (a) | | 575 |
| | 740 |
| | — |
| | — |
| | 575 |
| | 740 |
| | 1,315 |
| | (316 | ) | | 1974 | | 02/06/07 | | 15 to 30 Years |
| | Erie, PA | | (a) | | 463 |
| | 565 |
| | — |
| | — |
| | 463 |
| | 565 |
| | 1,028 |
| | (259 | ) | | 1973 | | 02/06/07 | | 15 to 30 Years |
| | Erie, PA | | (a) | | 855 |
| | 147 |
| | — |
| | — |
| | 855 |
| | 147 |
| | 1,002 |
| | (138 | ) | | 1973 | | 02/06/07 | | 15 to 30 Years |
| | Evansville, IN | | (a) | | 270 |
| | 231 |
| | — |
| | — |
| | 270 |
| | 231 |
| | 501 |
| | (73 | ) | | 2000 | | 06/25/04 | | 30 to 30 Years |
| | Fairborn, OH | | (a) | | 923 |
| | 468 |
| | — |
| | — |
| | 923 |
| | 468 |
| | 1,391 |
| | (269 | ) | | 1998 | | 06/25/04 | | 15 to 30 Years |
| | Fairview Heights, IL | | (a) | | 1,020 |
| | 826 |
| | — |
| | — |
| | 1,020 |
| | 826 |
| | 1,846 |
| | (470 | ) | | 1972 | | 12/31/07 | | 15 to 30 Years |
| | Findlay, OH | | (c) | | 958 |
| | 1,029 |
| | — |
| | — |
| | 958 |
| | 1,029 |
| | 1,987 |
| | (103 | ) | | 1991 | | 12/23/14 | | 15 to 30 Years |
| | Florence, AL | | (a) | | 794 |
| | 1,742 |
| | — |
| | — |
| | 794 |
| | 1,742 |
| | 2,536 |
| | (292 | ) | | 1995 | | 07/17/13 | | 8 to 27 Years |
| | Fort Smith, AR | | (a) | | 1,503 |
| | 1,323 |
| | — |
| | — |
| | 1,503 |
| | 1,323 |
| | 2,826 |
| | (874 | ) | | 1993 | | 09/23/05 | | 15 to 20 Years |
| | Fort Wayne, IN | | (a) | | 989 |
| | 2,057 |
| | — |
| | — |
| | 989 |
| | 2,057 |
| | 3,046 |
| | (741 | ) | | 2001 | | 11/10/05 | | 15 to 30 Years |
|
| | | | | | | | | | | | | | | | | | | | | | | | | | | | | | | | | |
| Arby's | Rock Hill, SC | | (a) | | 373 |
| | 722 |
| | — |
| | — |
| | 373 |
| | 722 |
| | 1,095 |
| | (458 | ) | | 1978 | | 12/29/05 | | 15 to 20 Years |
| Arby's | North Canton, OH | | (a) | | 484 |
| | 497 |
| | (14 | ) | | — |
| | 470 |
| | 497 |
| | 967 |
| | (339 | ) | | 1989 | | 12/29/06 | | 15 to 20 Years |
| Arby's | Sun City, AZ | | (a) | | 771 |
| | 372 |
| | — |
| | 250 |
| | 771 |
| | 622 |
| | 1,393 |
| | (284 | ) | | 1986 | | 12/29/06 | | 10 to 20 Years |
| Arby's | New Castle, PA | | (b) | | 573 |
| | 1,042 |
| | — |
| | — |
| | 573 |
| | 1,042 |
| | 1,615 |
| | (286 | ) | | 1999 | | 07/17/13 | | 7 to 25 Years |
| Arby's | Nappanee, IN | | (a) | | 301 |
| | 413 |
| | — |
| | — |
| | 301 |
| | 413 |
| | 714 |
| | (310 | ) | | 2005 | | 12/21/07 | | 15 to 20 Years |
| Arby's | Champlin, MN | | (d) | | 710 |
| | 408 |
| | — |
| | — |
| | 710 |
| | 408 |
| | 1,118 |
| | (96 | ) | | 2004 | | 03/20/15 | | 8 to 20 Years |
| Arby's | Tyler, TX | | (d) | | 355 |
| | 663 |
| | — |
| | — |
| | 355 |
| | 663 |
| | 1,018 |
| | (57 | ) | | 1980 | | 12/29/15 | | 15 to 30 Years |
| Arby's | Odessa, TX | | (d) | | 499 |
| | 941 |
| | — |
| | — |
| | 499 |
| | 941 |
| | 1,440 |
| | (77 | ) | | 1982 | | 12/29/15 | | 15 to 30 Years |
| Arby's | Midland, TX | | (d) | | 768 |
| | 893 |
| | — |
| | — |
| | 768 |
| | 893 |
| | 1,661 |
| | (75 | ) | | 1982 | | 12/29/15 | | 15 to 30 Years |
| Arby's | Amarillo, TX | | (a) | | 538 |
| | 615 |
| | — |
| | — |
| | 538 |
| | 615 |
| | 1,153 |
| | (65 | ) | | 1985 | | 12/29/15 | | 15 to 30 Years |
| Area 51 Extreme Air Sports | Baton Rouge, LA | | (d) | | 1,076 |
| | 2,289 |
| | — |
| | — |
| | 1,076 |
| | 2,289 |
| | 3,365 |
| | (186 | ) | | 2015 | | 11/13/15 | | 10 to 40 Years |
| Ashley Furniture | Abilene, TX | | (a) | | 1,316 |
| | 2,649 |
| | — |
| | — |
| | 1,316 |
| | 2,649 |
| | 3,965 |
| | (1,019 | ) | | 2000 | | 05/19/05 | | 15 to 40 Years |
| Ashley Furniture | El Paso, TX | | (a) | | 1,536 |
| | 3,852 |
| | — |
| | — |
| | 1,536 |
| | 3,852 |
| | 5,388 |
| | (1,717 | ) | | 1973 | | 07/01/05 | | 14 to 30 Years |
| Ashley Furniture | Amarillo, TX | | (d) | | 1,481 |
| | 4,999 |
| | — |
| | — |
| | 1,481 |
| | 4,999 |
| | 6,480 |
| | (947 | ) | | 2001 | | 07/17/13 | | 9 to 36 Years |
| Ashley Furniture | Anderson, SC | | (c) | | 870 |
| | 1,909 |
| | — |
| | — |
| | 870 |
| | 1,909 |
| | 2,779 |
| | (355 | ) | | 2006 | | 07/17/13 | | 8 to 40 Years |
| Ashley Furniture | Mount Juliet, TN | | (d) | | 2,049 |
| | 4,604 |
| | — |
| | — |
| | 2,049 |
| | 4,604 |
| | 6,653 |
| | (663 | ) | | 2008 | | 07/17/13 | | 10 to 45 Years |
| At Home | Broomfield, CO | | (d) | | 4,538 |
| | 4,675 |
| | — |
| | — |
| | 4,538 |
| | 4,675 |
| | 9,213 |
| | (479 | ) | | 1995 | | 08/01/16 | | 9 to 20 Years |
| At Home | Corpus Christi, TX | | (d) | | 3,734 |
| | 4,949 |
| | — |
| | — |
| | 3,734 |
| | 4,949 |
| | 8,683 |
| | (562 | ) | | 1986 | | 08/01/16 | | 8 to 20 Years |
| At Home | Jenison, MI | | (d) | | 2,303 |
| | 5,743 |
| | — |
| | 88 |
| | 2,303 |
| | 5,831 |
| | 8,134 |
| | (404 | ) | | 1989 | | 08/01/16 | | 8 to 30 Years |
| At Home | Buford, GA | | (d) | | 1,940 |
| | 4,704 |
| | — |
| | — |
| | 1,940 |
| | 4,704 |
| | 6,644 |
| | (314 | ) | | 1984 | | 08/01/16 | | 8 to 30 Years |
| At Home | Lubbock, TX | | (a) | | 4,585 |
| | 4,550 |
| | — |
| | 35 |
| | 4,585 |
| | 4,585 |
| | 9,170 |
| | (423 | ) | | 1985 | | 11/15/16 | | 6 to 20 Years |
| At Home | Louisville, KY | | (d) | | 4,726 |
| | 5,210 |
| | — |
| | 13 |
| | 4,726 |
| | 5,223 |
| | 9,949 |
| | (361 | ) | | 1984 | | 12/20/16 | | 9 to 20 Years |
| At Home | Mesa, AZ | | (d) | | 4,067 |
| | 4,321 |
| | — |
| | 13 |
| | 4,067 |
| | 4,334 |
| | 8,401 |
| | (340 | ) | | 2002 | | 12/20/16 | | 10 to 20 Years |
| AT&T | Santa Clara, CA | | (d) | | 2,873 |
| | 8,252 |
| | — |
| | — |
| | 2,873 |
| | 8,252 |
| | 11,125 |
| | (1,153 | ) | | 2002 | | 07/17/13 | | 5 to 48 Years |
| ATC Fitness | Southaven, MS | | (d) | | 1,187 |
| | 1,817 |
| | — |
| | — |
| | 1,187 |
| | 1,817 |
| | 3,004 |
| | (243 | ) | | 2014 | | 09/17/14 | | 15 to 40 Years |
| Austin's Park N Pizza Experience | Pflugerville, TX | | (a) | | 6,182 |
| | 1,349 |
| | — |
| | — |
| | 6,182 |
| | 1,349 |
| | 7,531 |
| | (366 | ) | | 2003 | | 08/29/14 | | 15 to 30 Years |
| AutoStart | Kansas City, MO | | (d) | | 1,310 |
| | 1,824 |
| | — |
| | 6 |
| | 1,310 |
| | 1,830 |
| | 3,140 |
| | (250 | ) | | 2001 | | 12/18/15 | | 15 to 20 Years |
| AutoStart | Kansas City, MO | | (d) | | 620 |
| | 1,280 |
| | — |
| | — |
| | 620 |
| | 1,280 |
| | 1,900 |
| | (184 | ) | | 1978 | | 12/31/15 | | 15 to 20 Years |
| AutoStart | Overland Park, KS | | (d) | | 1,390 |
| | 320 |
| | — |
| | — |
| | 1,390 |
| | 320 |
| | 1,710 |
| | (66 | ) | | 1967 | | 03/11/16 | | 7 to 20 Years |
| Avalon Flooring | Rio Grande, NJ | | (d) | | 753 |
| | 3,299 |
| | — |
| | — |
| | 753 |
| | 3,299 |
| | 4,052 |
| | (307 | ) | | 2006 | | 03/31/15 | | 11 to 40 Years |
SPIRIT REALTY CAPITAL, INC.
Schedule III Real Estate and
Accumulated Depreciation
(Amounts in thousands)
|
| | | | | | | | | | | | | | | | | | | | | | | | | |
| | | | | | Initial Cost to Company | | Cost Capitalized Subsequent to Acquisition including impairment | | Gross Amount at December 31, 2016 (d) 2017 (g) | | | | | | | | |
| Concept | City, State | | Encumbrances (e) | | Land and Improvements | | Buildings and Improvements | | Land and Improvements | | Buildings and Improvements | | Land and Improvements | | Buildings and Improvements | | Total | | Final Accumulated Depreciation | | Date of Construction | | Date Acquired | | Life in which depreciation in latest Statement of Operations is computed |
Description | | Encumbrances (e)
| | Land and
Improvements
| | Buildings and
Improvements
| | Improvements/
Land
| | Improvements/
building
| | Land and
Improvements
| | Buildings and
Improvements
| | Total | | Final
Accum
| | Date of
Construction
| | Date
Acquired
| |
|
| | | | | | | | | | | | | | | | | | | | | | | | | | | | | | | | | |
| | Fountain Hills, AZ | | (a) | | 825 |
| | 561 |
| | — |
| | — |
| | 825 |
| | 561 |
| | 1,386 |
| | (326 | ) | | 1995 | | 09/24/04 | | 15 to 30 Years |
| | Fountain, CO | | (c) | | 861 |
| | 2,226 |
| | — |
| | — |
| | 861 |
| | 2,226 |
| | 3,087 |
| | (248 | ) | | 2005 | | 07/17/13 | | 12 to 38 Years |
| | Frederick, MD | | (a) | | 440 |
| | 236 |
| | — |
| | 5 |
| | 440 |
| | 241 |
| | 681 |
| | (138 | ) | | 1977 | | 11/27/06 | | 11 to 20 Years |
| | Fredericksburg, TX | | (c) | | 511 |
| | 1,516 |
| | — |
| | — |
| | 511 |
| | 1,516 |
| | 2,027 |
| | (224 | ) | | 1985 | | 07/17/13 | | 11 to 30 Years |
| | Ft Wayne, IN | | (a) | | 1,110 |
| | 817 |
| | — |
| | — |
| | 1,110 |
| | 817 |
| | 1,927 |
| | (432 | ) | | 2003 | | 12/31/07 | | 15 to 40 Years |
| | Gadsden, AL | | (a) | | 626 |
| | 1,439 |
| | (229 | ) | | (506 | ) | | 397 |
| | 933 |
| | 1,330 |
| | (295 | ) | | 2007 | | 12/21/07 | | 10 to 50 Years |
| | Gainesville, FL | | (c) | | 1,489 |
| | 1,241 |
| | — |
| | — |
| | 1,489 |
| | 1,241 |
| | 2,730 |
| | — |
| | 2000 | | 12/28/16 | | 6 to 40 Years |
| | Gainesville, FL | | (c) | | 1,534 |
| | 883 |
| | — |
| | — |
| | 1,534 |
| | 883 |
| | 2,417 |
| | — |
| | 1984 | | 12/28/16 | | 6 to 30 Years |
| | Gallipolis, OH | | (a) | | 375 |
| | 1,295 |
| | — |
| | — |
| | 375 |
| | 1,295 |
| | 1,670 |
| | (177 | ) | | 1996 | | 10/25/13 | | 15 to 30 Years |
| | Gallup, NM | | (c) | | 937 |
| | 2,277 |
| | — |
| | — |
| | 937 |
| | 2,277 |
| | 3,214 |
| | (268 | ) | | 2004 | | 07/17/13 | | 13 to 40 Years |
| | Garden City, GA | | (c) | | 1,184 |
| | 1,465 |
| | — |
| | — |
| | 1,184 |
| | 1,465 |
| | 2,649 |
| | (184 | ) | | 1998 | | 07/17/13 | | 9 to 40 Years |
| | Garden City, KS | | (a) | | 246 |
| | 924 |
| | — |
| | — |
| | 246 |
| | 924 |
| | 1,170 |
| | (110 | ) | | 1984 | | 12/24/13 | | 15 to 30 Years |
| | Gardendale, AL | | (a) | | 438 |
| | 841 |
| | — |
| | 57 |
| | 438 |
| | 898 |
| | 1,336 |
| | (152 | ) | | 1996 | | 03/29/13 | | 8 to 29 Years |
| | Gaylord, MI | | (a) | | 1,003 |
| | 1,477 |
| | — |
| | — |
| | 1,003 |
| | 1,477 |
| | 2,480 |
| | (185 | ) | | 2014 | | 11/05/14 | | 14 to 30 Years |
| | Geneva, AL | | (a) | | 522 |
| | 570 |
| | — |
| | — |
| | 522 |
| | 570 |
| | 1,092 |
| | (622 | ) | | 1990 | | 06/25/04 | | 10 to 15 Years |
| | Geneva, NY | | (a) | | 177 |
| | 139 |
| | — |
| | — |
| | 177 |
| | 139 |
| | 316 |
| | (164 | ) | | 1975 | | 08/27/09 | | 8 to 13 Years |
| | Gilbert, AZ | | (a) | | 643 |
| | 1,669 |
| | — |
| | — |
| | 643 |
| | 1,669 |
| | 2,312 |
| | (304 | ) | | 2006 | | 10/28/11 | | 14 to 39 Years |
| | Glendale, AZ | | (a) | | 1,480 |
| | 1,329 |
| | — |
| | — |
| | 1,480 |
| | 1,329 |
| | 2,809 |
| | (529 | ) | | 1996 | | 06/25/04 | | 15 to 30 Years |
| | Glendale, AZ | | (a) | | 1,236 |
| | 272 |
| | — |
| | — |
| | 1,236 |
| | 272 |
| | 1,508 |
| | (244 | ) | | 1995 | | 06/25/04 | | 15 to 20 Years |
| | Golden, CO | | (a) | | 649 |
| | 334 |
| | — |
| | — |
| | 649 |
| | 334 |
| | 983 |
| | (53 | ) | | 1997 | | 12/24/13 | | 15 to 30 Years |
| | Grand Junction, CO | | (c) | | 1,363 |
| | 1,990 |
| | — |
| | — |
| | 1,363 |
| | 1,990 |
| | 3,353 |
| | (241 | ) | | 1995 | | 07/17/13 | | 10 to 40 Years |
| | Grand Rapids, MI | | (a) | | 986 |
| | 524 |
| | — |
| | — |
| | 986 |
| | 524 |
| | 1,510 |
| | (74 | ) | | 1985 | | 10/31/14 | | 14 to 30 Years |
| | Grandview, OH | | (a) | | 2,164 |
| | 1,165 |
| | — |
| | — |
| | 2,164 |
| | 1,165 |
| | 3,329 |
| | (307 | ) | | 1960 | | 07/17/13 | | 9 to 23 Years |
| | Greensboro, NC | | (a) | | 1,009 |
| | 444 |
| | — |
| | — |
| | 1,009 |
| | 444 |
| | 1,453 |
| | (304 | ) | | 2003 | | 12/31/07 | | 15 to 40 Years |
| | Grove City, PA | | (a) | | 531 |
| | 495 |
| | — |
| | — |
| | 531 |
| | 495 |
| | 1,026 |
| | (246 | ) | | 1976 | | 02/06/07 | | 15 to 30 Years |
| | Gurnee, IL | | (a) | | 586 |
| | 619 |
| | — |
| | — |
| | 586 |
| | 619 |
| | 1,205 |
| | (383 | ) | | 1995 | | 06/25/04 | | 15 to 20 Years |
| | Hagerstown, MD | | (a) | | 546 |
| | 342 |
| | — |
| | 68 |
| | 546 |
| | 410 |
| | 956 |
| | (218 | ) | | 1975 | | 11/27/06 | | 11 to 20 Years |
| | Hamilton, NY | | (a) | | 145 |
| | 152 |
| | — |
| | — |
| | 145 |
| | 152 |
| | 297 |
| | (115 | ) | | 1982 | | 06/30/09 | | 13 to 18 Years |
| | Hammond, IN | | (a) | | 976 |
| | 1,080 |
| | — |
| | — |
| | 976 |
| | 1,080 |
| | 2,056 |
| | (149 | ) | | 2014 | | 12/24/14 | | 14 to 30 Years |
| | Harriman, TN | | (a) | | 314 |
| | 143 |
| | — |
| | 176 |
| | 314 |
| | 319 |
| | 633 |
| | (170 | ) | | 1979 | | 11/02/07 | | 15 to 30 Years |
| | Harrisburg, PA | | (a) | | 762 |
| | 241 |
| | — |
| | 176 |
| | 762 |
| | 417 |
| | 1,179 |
| | (294 | ) | | 1977 | | 01/30/06 | | 15 to 20 Years |
| | Harrisburg, PA | | (a) | | 611 |
| | 239 |
| | — |
| | — |
| | 611 |
| | 239 |
| | 850 |
| | (256 | ) | | 1978 | | 01/30/06 | | 15 to 20 Years |
| | Harrisburg, PA | | (a) | | 423 |
| | 307 |
| | — |
| | — |
| | 423 |
| | 307 |
| | 730 |
| | (171 | ) | | 1973 | | 01/30/06 | | 15 to 20 Years |
| | Hermitage, PA | | (c) | | 604 |
| | 717 |
| | — |
| | — |
| | 604 |
| | 717 |
| | 1,321 |
| | (334 | ) | | 1978 | | 02/06/07 | | 10 to 25 Years |
| | Hilliard, OH | | (a) | | 1,149 |
| | 1,291 |
| | — |
| | — |
| | 1,149 |
| | 1,291 |
| | 2,440 |
| | (604 | ) | | 1997 | | 09/24/04 | | 15 to 30 Years |
| | Hiram, GA | | (a) | | 813 |
| | 716 |
| | — |
| | — |
| | 813 |
| | 716 |
| | 1,529 |
| | (194 | ) | | 1999 | | 07/17/13 | | 6 to 21 Years |
| | Hiram, GA | | (a) | | 1,255 |
| | 1,766 |
| | — |
| | — |
| | 1,255 |
| | 1,766 |
| | 3,021 |
| | (376 | ) | | 2003 | | 01/16/15 | | 9 to 15 Years |
|
| | | | | | | | | | | | | | | | | | | | | | | | | | | | | | | | | |
| Axel's | Mendota, MN | | (a) | | 536 |
| | 963 |
| | — |
| | — |
| | 536 |
| | 963 |
| | 1,499 |
| | (146 | ) | | 1995 | | 05/22/14 | | 15 to 30 Years |
| Axel's | Chanhassen, MN | | (a) | | 1,439 |
| | 784 |
| | — |
| | — |
| | 1,439 |
| | 784 |
| | 2,223 |
| | (191 | ) | | 1953 | | 05/22/14 | | 15 to 30 Years |
| B&B Theatres | Kansas City, MO | | (a) | | 2,543 |
| | 7,943 |
| | — |
| | — |
| | 2,543 |
| | 7,943 |
| | 10,486 |
| | (2,401 | ) | | 2003 | | 07/01/05 | | 14 to 50 Years |
| B&B Theatres | Lees Summit, MO | | (a) | | 3,517 |
| | 9,735 |
| | — |
| | — |
| | 3,517 |
| | 9,735 |
| | 13,252 |
| | (3,527 | ) | | 1999 | | 07/01/05 | | 14 to 40 Years |
| B&B Theatres | Bixby, OK | | (a) | | 5,585 |
| | 10,101 |
| | — |
| | — |
| | 5,585 |
| | 10,101 |
| | 15,686 |
| | (4,845 | ) | | 1998 | | 07/01/05 | | 14 to 30 Years |
| B&B Theatres | Overland Park, KS | | (a) | | 4,935 |
| | 12,281 |
| | — |
| | — |
| | 4,935 |
| | 12,281 |
| | 17,216 |
| | (3,234 | ) | | 2004 | | 08/01/09 | | 10 to 57 Years |
| Bagger Dave's Burger Tavern | Grand Rapids, MI | | (a) | | 986 |
| | 524 |
| | — |
| | — |
| | 986 |
| | 524 |
| | 1,510 |
| | (108 | ) | | 1985 | | 10/31/14 | | 14 to 30 Years |
| Bagger Dave's Burger Tavern | Berkley, MI | | (a) | | 390 |
| | 540 |
| | — |
| | — |
| | 390 |
| | 540 |
| | 930 |
| | (85 | ) | | 1927 | | 10/31/14 | | 14 to 30 Years |
| Bank of America | Delray Beach, FL | | (c) | | 3,831 |
| | 16,789 |
| | — |
| | — |
| | 3,831 |
| | 16,789 |
| | 20,620 |
| | (1,845 | ) | | 1975 | | 07/17/13 | | 8 to 50 Years |
| BE Aerospace | Winston-Salem, NC | | (c) | | 927 |
| | 3,455 |
| | — |
| | — |
| | 927 |
| | 3,455 |
| | 4,382 |
| | (772 | ) | | 1987 | | 07/17/13 | | 5 to 40 Years |
| Bellefonte Primary Care | Grayson, KY | | (d) | | 658 |
| | 3,171 |
| | — |
| | — |
| | 658 |
| | 3,171 |
| | 3,829 |
| | (397 | ) | | 2013 | | 08/18/14 | | 9 to 40 Years |
| Best Buy | Evanston, IL | | (d) | | 3,275 |
| | 5,338 |
| | — |
| | — |
| | 3,275 |
| | 5,338 |
| | 8,613 |
| | (133 | ) | | 1993 | | 07/17/13 | | 30 to 30 Years |
| Best Buy | Fayetteville, NC | | (c) | | 1,560 |
| | 6,893 |
| | — |
| | — |
| | 1,560 |
| | 6,893 |
| | 8,453 |
| | (1,009 | ) | | 1999 | | 07/17/13 | | 6 to 41 Years |
| Best Buy | Wichita, KS | | (d) | | 3,368 |
| | 6,312 |
| | — |
| | — |
| | 3,368 |
| | 6,312 |
| | 9,680 |
| | (1,352 | ) | | 1984 | | 07/17/13 | | 7 to 29 Years |
| Best Buy | Las Cruces, NM | | (d) | | 1,328 |
| | 2,616 |
| | — |
| | — |
| | 1,328 |
| | 2,616 |
| | 3,944 |
| | (418 | ) | | 2002 | | 07/17/13 | | 8 to 41 Years |
| Best Car Buys | Denver, CO | | (d) | | 4,124 |
| | 4,229 |
| | — |
| | — |
| | 4,124 |
| | 4,229 |
| | 8,353 |
| | (337 | ) | | 1980 | | 08/21/15 | | 15 to 40 Years |
| Big Al's | Vancouver, WA | | (a) | | 2,077 |
| | 9,395 |
| | — |
| | — |
| | 2,077 |
| | 9,395 |
| | 11,472 |
| | (928 | ) | | 2006 | | 06/30/14 | | 15 to 40 Years |
| Big Al's | Beaverton, OR | | (a) | | 5,608 |
| | 8,733 |
| | — |
| | — |
| | 5,608 |
| | 8,733 |
| | 14,341 |
| | (986 | ) | | 2010 | | 06/30/14 | | 15 to 40 Years |
| Big Sandy Furniture | Hurricane, WV | | (a) | | 727 |
| | 3,005 |
| | — |
| | — |
| | 727 |
| | 3,005 |
| | 3,732 |
| | (1,202 | ) | | 1998 | | 08/27/09 | | 12 to 27 Years |
| Big Sandy Furniture | Chillicothe, OH | | (a) | | 499 |
| | 2,296 |
| | — |
| | — |
| | 499 |
| | 2,296 |
| | 2,795 |
| | (953 | ) | | 1995 | | 08/27/09 | | 12 to 27 Years |
| Big Sandy Furniture | South Point, OH | | (a) | | 848 |
| | 2,948 |
| | — |
| | — |
| | 848 |
| | 2,948 |
| | 3,796 |
| | (1,207 | ) | | 1990 | | 08/27/09 | | 12 to 27 Years |
| Big Sandy Furniture | Portsmouth, OH | | (a) | | 561 |
| | 1,563 |
| | — |
| | — |
| | 561 |
| | 1,563 |
| | 2,124 |
| | (680 | ) | | 1988 | | 08/27/09 | | 12 to 27 Years |
| Big Sandy Furniture | Ashland, KY | | (a) | | 775 |
| | 2,037 |
| | — |
| | — |
| | 775 |
| | 2,037 |
| | 2,812 |
| | (851 | ) | | 1990 | | 08/27/09 | | 12 to 27 Years |
| Big Sandy Furniture | Parkersburg, WV | | (d) | | 1,800 |
| | 3,183 |
| | — |
| | — |
| | 1,800 |
| | 3,183 |
| | 4,983 |
| | (1,480 | ) | | 1976 | | 08/27/09 | | 12 to 27 Years |
| Big Sandy Furniture | Ashland, KY | | (d) | | 629 |
| | 754 |
| | — |
| | — |
| | 629 |
| | 754 |
| | 1,383 |
| | (364 | ) | | 1993 | | 08/27/09 | | 12 to 27 Years |
| Bi-Lo | Hartsville, SC | | (d) | | 696 |
| | 5,402 |
| | — |
| | — |
| | 696 |
| | 5,402 |
| | 6,098 |
| | (610 | ) | | 1988 | | 09/30/14 | | 10 to 40 Years |
| BJ's Wholesale Club | Haverhill, MA | | (d) | | 3,192 |
| | 15,353 |
| | — |
| | — |
| | 3,192 |
| | 15,353 |
| | 18,545 |
| | (2,730 | ) | | 2007 | | 07/17/13 | | 11 to 32 Years |
| BJ's Wholesale Club | Fort Lauderdale, FL | | (d) | | 6,775 |
| | 18,649 |
| | — |
| | — |
| | 6,775 |
| | 18,649 |
| | 25,424 |
| | (2,871 | ) | | 2007 | | 07/17/13 | | 12 to 37 Years |
SPIRIT REALTY CAPITAL, INC.
Schedule III Real Estate and
Accumulated Depreciation
(Amounts in thousands)
|
| | | | | | | | | | | | | | | | | | | | | | | | | |
| | | | | | Initial Cost to Company | | Cost Capitalized Subsequent to Acquisition including impairment | | Gross Amount at December 31, 2016 (d) 2017 (g) | | | | | | | | |
| Concept | City, State | | Encumbrances (e) | | Land and Improvements | | Buildings and Improvements | | Land and Improvements | | Buildings and Improvements | | Land and Improvements | | Buildings and Improvements | | Total | | Final Accumulated Depreciation | | Date of Construction | | Date Acquired | | Life in which depreciation in latest Statement of Operations is computed |
Description | | Encumbrances (e)
| | Land and
Improvements
| | Buildings and
Improvements
| | Improvements/
Land
| | Improvements/
building
| | Land and
Improvements
| | Buildings and
Improvements
| | Total | | Final
Accum
| | Date of
Construction
| | Date
Acquired
| |
|
| | | | | | | | | | | | | | | | | | | | | | | | | | | | | | | | | |
| | Homewood, AL | | (a) | | 583 |
| | 839 |
| | — |
| | — |
| | 583 |
| | 839 |
| | 1,422 |
| | (119 | ) | | 2002 | | 12/05/13 | | 15 to 30 Years |
| | Houston, TX | | (a) | | 1,098 |
| | 439 |
| | — |
| | — |
| | 1,098 |
| | 439 |
| | 1,537 |
| | (345 | ) | | 1995 | | 06/25/04 | | 15 to 40 Years |
| | Houston, TX | | (a) | | 1,156 |
| | 352 |
| | (22 | ) | | — |
| | 1,134 |
| | 352 |
| | 1,486 |
| | (286 | ) | | 1995 | | 06/25/04 | | 15 to 30 Years |
| | Houston, TX | | (a) | | 585 |
| | 561 |
| | — |
| | — |
| | 585 |
| | 561 |
| | 1,146 |
| | (589 | ) | | 1979 | | 12/30/04 | | 10 to 15 Years |
| | Houston, TX | | (a) | | 2,348 |
| | 1,347 |
| | — |
| | — |
| | 2,348 |
| | 1,347 |
| | 3,695 |
| | (689 | ) | | 1997 | | 06/29/07 | | 15 to 30 Years |
| | Huntington Park, CA | | (a) | | 1,822 |
| | 1,211 |
| | — |
| | — |
| | 1,822 |
| | 1,211 |
| | 3,033 |
| | (119 | ) | | 1957 | | 12/19/14 | | 15 to 30 Years |
| | Hutchinson, KS | | (a) | | 895 |
| | 856 |
| | — |
| | — |
| | 895 |
| | 856 |
| | 1,751 |
| | (108 | ) | | 1987 | | 06/04/14 | | 15 to 30 Years |
| | Hyattsville, MD | | (a) | | 702 |
| | 245 |
| | — |
| | — |
| | 702 |
| | 245 |
| | 947 |
| | (166 | ) | | 1985 | | 11/27/06 | | 15 to 20 Years |
|
| | | | | | | | | | | | | | | | | | | | | | | | | | | | | | | | | |
| BJ's Wholesale Club | Woodstock, GA | | (c) | | 4,383 |
| | 16,588 |
| | — |
| | — |
| | 4,383 |
| | 16,588 |
| | 20,971 |
| | (3,016 | ) | | 2001 | | 07/17/13 | | 8 to 33 Years |
| BJ's Wholesale Club | Tampa, FL | | (d) | | 4,810 |
| | 10,220 |
| | — |
| | 35 |
| | 4,810 |
| | 10,255 |
| | 15,065 |
| | (476 | ) | | 1993 | | 01/10/17 | | 10 to 30 Years |
| Black Angus Steakhouse | Glendale, AZ | | (a) | | 1,480 |
| | 1,329 |
| | — |
| | — |
| | 1,480 |
| | 1,329 |
| | 2,809 |
| | (585 | ) | | 1996 | | 06/25/04 | | 15 to 30 Years |
| Blue Rhino | Tavares, FL | | (a) | | 1,075 |
| | 5,098 |
| | — |
| | — |
| | 1,075 |
| | 5,098 |
| | 6,173 |
| | (1,809 | ) | | 2004 | | 07/01/05 | | 14 to 40 Years |
| Blue Rhino | Riverside, CA | | (a) | | 1,203 |
| | 6,254 |
| | — |
| | — |
| | 1,203 |
| | 6,254 |
| | 7,457 |
| | (1,884 | ) | | 2004 | | 07/01/05 | | 14 to 40 Years |
| Bojangle's | Hickory, NC | | (a) | | 1,105 |
| | 851 |
| | — |
| | — |
| | 1,105 |
| | 851 |
| | 1,956 |
| | (720 | ) | | 1995 | | 12/29/06 | | 13 to 28 Years |
| Bondcote | Pulaski, VA | | (a) | | 333 |
| | 1,536 |
| | — |
| | — |
| | 333 |
| | 1,536 |
| | 1,869 |
| | (961 | ) | | 1967 | | 12/11/06 | | 15 to 20 Years |
| Bondcote | Dublin, VA | | (a) | | 491 |
| | 1,401 |
| | — |
| | — |
| | 491 |
| | 1,401 |
| | 1,892 |
| | (929 | ) | | 1985 | | 12/11/06 | | 15 to 20 Years |
| Bonfire | Eagen, MN | | (a) | | 724 |
| | 1,230 |
| | — |
| | — |
| | 724 |
| | 1,230 |
| | 1,954 |
| | (187 | ) | | 1996 | | 05/22/14 | | 15 to 30 Years |
| Bonfire | Woodbury, MN | | (a) | | 3,165 |
| | 1,707 |
| | — |
| | — |
| | 3,165 |
| | 1,707 |
| | 4,872 |
| | (334 | ) | | 1995 | | 05/22/14 | | 15 to 30 Years |
| Books-A-Million | Rapid City, SD | | (d) | | 575 |
| | 2,568 |
| | — |
| | — |
| | 575 |
| | 2,568 |
| | 3,143 |
| | (419 | ) | | 2001 | | 07/17/13 | | 2 to 45 Years |
| Boozman-Hof | Rogers, AR | | (a) | | 2,014 |
| | 2,313 |
| | — |
| | — |
| | 2,014 |
| | 2,313 |
| | 4,327 |
| | (466 | ) | | 1988 | | 11/14/13 | | 13 to 30 Years |
| Boscovs | Voorhees, NJ | | (a) | | 2,027 |
| | 6,776 |
| | — |
| | — |
| | 2,027 |
| | 6,776 |
| | 8,803 |
| | (2,313 | ) | | 1970 | | 07/17/13 | | 5 to 20 Years |
| Bricktown Brewery | Oklahoma City, OK | | (a) | | 479 |
| | 1,877 |
| | — |
| | 177 |
| | 479 |
| | 2,054 |
| | 2,533 |
| | (388 | ) | | 1904 | | 12/02/13 | | 16 to 20 Years |
| Bricktown Brewery | Shawnee, OK | | (a) | | 621 |
| | 1,399 |
| | — |
| | — |
| | 621 |
| | 1,399 |
| | 2,020 |
| | (226 | ) | | 1984 | | 07/29/05 | | 15 to 30 Years |
| Bridgestone Tire | Atlanta, GA | | (a) | | 1,830 |
| | 363 |
| | — |
| | — |
| | 1,830 |
| | 363 |
| | 2,193 |
| | (144 | ) | | 1998 | | 07/17/13 | | 5 to 24 Years |
| Brookshire Brothers | Cleveland, TX | | (d) | | 465 |
| | 2,867 |
| | — |
| | — |
| | 465 |
| | 2,867 |
| | 3,332 |
| | (1,734 | ) | | 1991 | | 12/01/05 | | 15 to 20 Years |
| Brookshire Brothers | Corrigan, TX | | (d) | | 395 |
| | 630 |
| | — |
| | — |
| | 395 |
| | 630 |
| | 1,025 |
| | (442 | ) | | 1971 | | 12/01/05 | | 15 to 20 Years |
| Brookshire Brothers | Diboll, TX | | (d) | | 775 |
| | 872 |
| | — |
| | — |
| | 775 |
| | 872 |
| | 1,647 |
| | (626 | ) | | 1974 | | 12/01/05 | | 15 to 20 Years |
| Brookshire Brothers | Lufkin, TX | | (d) | | 1,178 |
| | 352 |
| | — |
| | — |
| | 1,178 |
| | 352 |
| | 1,530 |
| | (331 | ) | | 1977 | | 12/01/05 | | 15 to 20 Years |
| Brookshire Brothers | Navasota, TX | | (d) | | 781 |
| | 1,499 |
| | — |
| | — |
| | 781 |
| | 1,499 |
| | 2,280 |
| | (702 | ) | | 1992 | | 12/01/05 | | 15 to 30 Years |
| Brookshire Brothers | Timpson, TX | | (d) | | 253 |
| | 312 |
| | — |
| | — |
| | 253 |
| | 312 |
| | 565 |
| | (240 | ) | | 1978 | | 12/01/05 | | 15 to 20 Years |
| Brookshire Brothers | Alto, TX | | (a) | | 204 |
| | 464 |
| | — |
| | — |
| | 204 |
| | 464 |
| | 668 |
| | (119 | ) | | 1996 | | 03/31/14 | | 7 to 20 Years |
| Brookshire Brothers | Buffalo, TX | | (a) | | 522 |
| | 987 |
| | — |
| | — |
| | 522 |
| | 987 |
| | 1,509 |
| | (177 | ) | | 1990 | | 03/31/14 | | 7 to 30 Years |
| Brookshire Brothers | Groveton, TX | | (a) | | 264 |
| | 540 |
| | — |
| | — |
| | 264 |
| | 540 |
| | 804 |
| | (107 | ) | | 1996 | | 03/31/14 | | 7 to 30 Years |
| Brookshire Brothers | Lorena, TX | | (a) | | 657 |
| | 751 |
| | — |
| | — |
| | 657 |
| | 751 |
| | 1,408 |
| | (179 | ) | | 1999 | | 03/31/14 | | 7 to 20 Years |
| Brookshire Brothers | McGregor, TX | | (a) | | 748 |
| | 795 |
| | — |
| | — |
| | 748 |
| | 795 |
| | 1,543 |
| | (207 | ) | | 1999 | | 03/31/14 | | 7 to 20 Years |
| Brookshire Brothers | Hallettsville, TX | | (d) | | 550 |
| | 1,545 |
| | — |
| | — |
| | 550 |
| | 1,545 |
| | 2,095 |
| | (291 | ) | | 2004 | | 03/31/14 | | 10 to 30 Years |
| Bru Burger | Lexington, KY | | (a) | | 1,267 |
| | 944 |
| | — |
| | — |
| | 1,267 |
| | 944 |
| | 2,211 |
| | (656 | ) | | 1996 | | 02/26/07 | | 14 to 30 Years |
| Buck's Sports Grill | Rawlins, WY | | (a) | | 25 |
| | 406 |
| | — |
| | — |
| | 25 |
| | 406 |
| | 431 |
| | (240 | ) | | 1958 | | 12/29/06 | | 15 to 20 Years |
SPIRIT REALTY CAPITAL, INC.
Schedule III Real Estate and
Accumulated Depreciation
(Amounts in thousands)
|
| | | | | | | | | | | | | | | | | | | | | | | | | | | | | | | | | |
| | Independence, IA | | (a) | | 223 |
| | 473 |
| | — |
| | — |
| | 223 |
| | 473 |
| | 696 |
| | (518 | ) | | 1976 | | 09/23/05 | | 10 to 15 Years |
| | Independence, MO | | (a) | | 1,450 |
| | 1,967 |
| | — |
| | — |
| | 1,450 |
| | 1,967 |
| | 3,417 |
| | (670 | ) | | 2002 | | 06/29/07 | | 15 to 40 Years |
| | Indiana, PA | | (a) | | 331 |
| | 323 |
| | — |
| | — |
| | 331 |
| | 323 |
| | 654 |
| | (180 | ) | | 1982 | | 02/06/07 | | 15 to 30 Years |
| | Indianapolis, IN | | (a) | | 1,971 |
| | 2,295 |
| | — |
| | — |
| | 1,971 |
| | 2,295 |
| | 4,266 |
| | (645 | ) | | 2003 | | 11/10/05 | | 15 to 40 Years |
| | Indianapolis, IN | | (a) | | 590 |
| | 633 |
| | — |
| | — |
| | 590 |
| | 633 |
| | 1,223 |
| | (85 | ) | | 2014 | | 10/31/14 | | 14 to 30 Years |
| | Indianapolis, IN | | (c) | | 703 |
| | 1,223 |
| | — |
| | — |
| | 703 |
| | 1,223 |
| | 1,926 |
| | (118 | ) | | 1974 | | 12/23/14 | | 15 to 30 Years |
| | Indianapolis, IN | | (c) | | 418 |
| | 1,223 |
| | — |
| | — |
| | 418 |
| | 1,223 |
| | 1,641 |
| | (88 | ) | | 1992 | | 12/23/14 | | 15 to 30 Years |
| | Jackson, MI | | (a) | | 599 |
| | 354 |
| | — |
| | — |
| | 599 |
| | 354 |
| | 953 |
| | (59 | ) | | 1997 | | 12/24/13 | | 15 to 30 Years |
| | Johnson City, TN | | (c) | | 1,331 |
| | 2,304 |
| | — |
| | — |
| | 1,331 |
| | 2,304 |
| | 3,635 |
| | (380 | ) | | 1996 | | 07/17/13 | | 12 to 30 Years |
| | Johnstown, PA | | (a) | | 865 |
| | 938 |
| | — |
| | — |
| | 865 |
| | 938 |
| | 1,803 |
| | (324 | ) | | 1998 | | 07/17/13 | | 8 to 20 Years |
| | Joliet, IL | | (a) | | 1,994 |
| | 1,207 |
| | — |
| | — |
| | 1,994 |
| | 1,207 |
| | 3,201 |
| | (628 | ) | | 1996 | | 12/29/06 | | 15 to 30 Years |
| | Kansas City, KS | | (a) | | 796 |
| | 609 |
| | — |
| | — |
| | 796 |
| | 609 |
| | 1,405 |
| | (81 | ) | | 2006 | | 12/24/13 | | 15 to 40 Years |
| | Kimball, TN | | (a) | | 367 |
| | 283 |
| | — |
| | 176 |
| | 367 |
| | 459 |
| | 826 |
| | (217 | ) | | 1987 | | 11/02/07 | | 15 to 30 Years |
| | Kingwood, TX | | (a) | | 936 |
| | 387 |
| | — |
| | — |
| | 936 |
| | 387 |
| | 1,323 |
| | (300 | ) | | 1994 | | 06/25/04 | | 15 to 30 Years |
| | Knoxville, TN | | (a) | | 296 |
| | 343 |
| | — |
| | 176 |
| | 296 |
| | 519 |
| | 815 |
| | (223 | ) | | 1978 | | 11/02/07 | | 15 to 30 Years |
| | Knoxville, TN | | (a) | | 172 |
| | 700 |
| | — |
| | — |
| | 172 |
| | 700 |
| | 872 |
| | (251 | ) | | 1991 | | 11/02/07 | | 15 to 30 Years |
| | LaFayette, GA | | (a) | | 246 |
| | 434 |
| | — |
| | 176 |
| | 246 |
| | 610 |
| | 856 |
| | (257 | ) | | 1991 | | 11/02/07 | | 15 to 30 Years |
| | Lake Charles, LA | | (a) | | 1,620 |
| | 1,349 |
| | — |
| | — |
| | 1,620 |
| | 1,349 |
| | 2,969 |
| | (301 | ) | | 1987 | | 07/17/13 | | 10 to 24 Years |
| | Lakeville, MN | | (a) | | 342 |
| | 439 |
| | — |
| | — |
| | 342 |
| | 439 |
| | 781 |
| | (175 | ) | | 1988 | | 05/24/05 | | 15 to 30 Years |
| | Lancaster, PA | | (a) | | 308 |
| | 161 |
| | — |
| | — |
| | 308 |
| | 161 |
| | 469 |
| | (115 | ) | | 1977 | | 07/25/06 | | 15 to 30 Years |
| | Lander, WY | | (a) | | 57 |
| | 1,010 |
| | — |
| | — |
| | 57 |
| | 1,010 |
| | 1,067 |
| | (510 | ) | | 1883 | | 12/29/06 | | 15 to 20 Years |
| | Lanham, MD | | (a) | | 302 |
| | 193 |
| | — |
| | 200 |
| | 302 |
| | 393 |
| | 695 |
| | (182 | ) | | 1980 | | 11/27/06 | | 13 to 20 Years |
| | Lawrence, KS | | (a) | | 478 |
| | 209 |
| | — |
| | — |
| | 478 |
| | 209 |
| | 687 |
| | (23 | ) | | 1974 | | 06/04/14 | | 15 to 30 Years |
| | Lebanon, PA | | (a) | | 616 |
| | 316 |
| | — |
| | 176 |
| | 616 |
| | 492 |
| | 1,108 |
| | (305 | ) | | 1980 | | 01/30/06 | | 15 to 20 Years |
| | Leeds, AL | | (a) | | 907 |
| | 926 |
| | — |
| | 31 |
| | 907 |
| | 957 |
| | 1,864 |
| | (717 | ) | | 2003 | | 09/26/06 | | 9 to 40 Years |
| | Lewis Center, OH | | (a) | | 626 |
| | 560 |
| | — |
| | — |
| | 626 |
| | 560 |
| | 1,186 |
| | (274 | ) | | 1998 | | 06/25/04 | | 15 to 30 Years |
| | Lewiston, ID | | (c) | | 1,080 |
| | 866 |
| | — |
| | — |
| | 1,080 |
| | 866 |
| | 1,946 |
| | (97 | ) | | 1996 | | 12/23/14 | | 15 to 30 Years |
| | Lexington, KY | | (a) | | 1,267 |
| | 944 |
| | — |
| | — |
| | 1,267 |
| | 944 |
| | 2,211 |
| | (593 | ) | | 1996 | | 02/26/07 | | 14 to 30 Years |
|
| | | | | | | | | | | | | | | | | | | | | | | | | |
| | | | | | Initial Cost to Company | | Cost Capitalized Subsequent to Acquisition including impairment | | Gross Amount at December 31, 2016 (d) 2017 (g) | | | | | | | | |
| Concept | City, State | | Encumbrances (e) | | Land and Improvements | | Buildings and Improvements | | Land and Improvements | | Buildings and Improvements | | Land and Improvements | | Buildings and Improvements | | Total | | Final Accumulated Depreciation | | Date of Construction | | Date Acquired | | Life in which depreciation in latest Statement of Operations is computed |
Description | | Encumbrances (e)
| | Land and
Improvements
| | Buildings and
Improvements
| | Improvements/
Land
| | Improvements/
building
| | Land and
Improvements
| | Buildings and
Improvements
| | Total | | Final
Accum
| | Date of
Construction
| | Date
Acquired
| |
|
| | | | | | | | | | | | | | | | | | | | | | | | | | | | | | | | | |
| | Lexington, NC | | (a) | | 910 |
| | 1,059 |
| | — |
| | — |
| | 910 |
| | 1,059 |
| | 1,969 |
| | (170 | ) | | 1998 | | 10/25/13 | | 15 to 30 Years |
| | Little Rock, AR | | (a) | | 699 |
| | 1,700 |
| | (344 | ) | | (592 | ) | | 355 |
| | 1,108 |
| | 1,463 |
| | (887 | ) | | 1972 | | 02/26/07 | | 14 to 20 Years |
| | Little Rock, AR | | (a) | | 886 |
| | — |
| | — |
| | — |
| | 886 |
| | — |
| | 886 |
| | — |
| | (f) | | 06/26/14 | | (f) |
| | Littleton, CO | | (c) | | 696 |
| | 1,943 |
| | — |
| | — |
| | 696 |
| | 1,943 |
| | 2,639 |
| | (218 | ) | | 1990 | | 07/17/13 | | 11 to 40 Years |
| | Littleton, CO | | (a) | | 501 |
| | 629 |
| | — |
| | — |
| | 501 |
| | 629 |
| | 1,130 |
| | (83 | ) | | 1992 | | 12/24/13 | | 15 to 30 Years |
| | Longview, WA | | (c) | | 870 |
| | 2,855 |
| | — |
| | — |
| | 870 |
| | 2,855 |
| | 3,725 |
| | (305 | ) | | 2004 | | 07/17/13 | | 13 to 40 Years |
| | Loveland, CO | | (c) | | 602 |
| | 1,913 |
| | — |
| | — |
| | 602 |
| | 1,913 |
| | 2,515 |
| | (197 | ) | | 1997 | | 07/17/13 | | 12 to 40 Years |
| | Lufkin, TX | | (a) | | 927 |
| | 790 |
| | (448 | ) | | (474 | ) | | 479 |
| | 316 |
| | 795 |
| | — |
| | 1970 | | 02/26/07 | | 14 to 20 Years |
| | Lynchburg, VA | | (a) | | 2,033 |
| | 2,013 |
| | — |
| | — |
| | 2,033 |
| | 2,013 |
| | 4,046 |
| | (309 | ) | | 2000 | | 08/21/13 | | 15 to 30 Years |
| | Macon, GA | | (c) | | 838 |
| | 1,723 |
| | — |
| | — |
| | 838 |
| | 1,723 |
| | 2,561 |
| | (201 | ) | | 1995 | | 07/17/13 | | 13 to 40 Years |
| | Macon, GA | | (c) | | 874 |
| | 1,712 |
| | — |
| | — |
| | 874 |
| | 1,712 |
| | 2,586 |
| | (208 | ) | | 1995 | | 07/17/13 | | 11 to 40 Years |
| | Madill, OK | | (a) | | 352 |
| | 648 |
| | — |
| | — |
| | 352 |
| | 648 |
| | 1,000 |
| | (734 | ) | | 1972 | | 06/25/04 | | 10 to 15 Years |
| | Manchester, IA | | (a) | | 351 |
| | 495 |
| | — |
| | — |
| | 351 |
| | 495 |
| | 846 |
| | (541 | ) | | 1977 | | 09/23/05 | | 10 to 15 Years |
| | Maple Grove, MN | | (a) | | 1,852 |
| | 1,096 |
| | — |
| | — |
| | 1,852 |
| | 1,096 |
| | 2,948 |
| | (561 | ) | | 1997 | | 09/24/04 | | 15 to 30 Years |
| | Maquoketa, IA | | (a) | | 184 |
| | 90 |
| | — |
| | — |
| | 184 |
| | 90 |
| | 274 |
| | (138 | ) | | 1973 | | 09/23/05 | | 10 to 15 Years |
| | Marietta, GA | | (a) | | 1,221 |
| | 1,533 |
| | — |
| | — |
| | 1,221 |
| | 1,533 |
| | 2,754 |
| | (323 | ) | | 2003 | | 01/16/15 | | 9 to 15 Years |
| | Mars, PA | | (a) | | 946 |
| | 2,221 |
| | — |
| | — |
| | 946 |
| | 2,221 |
| | 3,167 |
| | (909 | ) | | 1990 | | 06/25/04 | | 15 to 30 Years |
| | Mason, OH | | (a) | | 619 |
| | 599 |
| | — |
| | — |
| | 619 |
| | 599 |
| | 1,218 |
| | (95 | ) | | 1994 | | 12/24/13 | | 15 to 30 Years |
| | Mayfield, KY | | (a) | | 307 |
| | 596 |
| | — |
| | — |
| | 307 |
| | 596 |
| | 903 |
| | (336 | ) | | 1997 | | 06/25/04 | | 15 to 30 Years |
| | McAllen, TX | | (a) | | 1,819 |
| | 1,188 |
| | — |
| | — |
| | 1,819 |
| | 1,188 |
| | 3,007 |
| | (669 | ) | | 1997 | | 06/29/07 | | 15 to 30 Years |
| | Meadville, PA | | (a) | | 981 |
| | 1,056 |
| | — |
| | — |
| | 981 |
| | 1,056 |
| | 2,037 |
| | (435 | ) | | 1983 | | 02/06/07 | | 15 to 30 Years |
| | Meadville, PA | | (c) | | 652 |
| | 1,284 |
| | — |
| | — |
| | 652 |
| | 1,284 |
| | 1,936 |
| | (132 | ) | | 1991 | | 12/23/14 | | 15 to 30 Years |
| | Mechanicsburg, PA | | (a) | | 801 |
| | 481 |
| | — |
| | — |
| | 801 |
| | 481 |
| | 1,282 |
| | (328 | ) | | 1995 | | 01/30/06 | | 15 to 20 Years |
| | Melbourne, FL | | (a) | | 2,005 |
| | 794 |
| | — |
| | — |
| | 2,005 |
| | 794 |
| | 2,799 |
| | (428 | ) | | 1986 | | 12/31/07 | | 15 to 40 Years |
| | Memphis, TN | | (a) | | 817 |
| | 1,637 |
| | — |
| | — |
| | 817 |
| | 1,637 |
| | 2,454 |
| | (348 | ) | | 2005 | | 01/16/15 | | 9 to 15 Years |
| | Mendota, MN | | (a) | | 536 |
| | 963 |
| | — |
| | — |
| | 536 |
| | 963 |
| | 1,499 |
| | (105 | ) | | 1995 | | 05/22/14 | | 15 to 30 Years |
| | Mentor, OH | | (a) | | 873 |
| | 790 |
| | — |
| | — |
| | 873 |
| | 790 |
| | 1,663 |
| | (385 | ) | | 2003 | | 12/31/07 | | 15 to 40 Years |
| | Mesa, AZ | | (a) | | 1,318 |
| | 234 |
| | — |
| | — |
| | 1,318 |
| | 234 |
| | 1,552 |
| | (236 | ) | | 1995 | | 06/25/04 | | 15 to 20 Years |
| | Mesa, AZ | | (a) | | 676 |
| | 911 |
| | — |
| | — |
| | 676 |
| | 911 |
| | 1,587 |
| | (202 | ) | | 1978 | | 10/28/11 | | 14 to 39 Years |
| | Mesa, AZ | | (c) | | 422 |
| | 1,002 |
| | — |
| | — |
| | 422 |
| | 1,002 |
| | 1,424 |
| | (127 | ) | | 1990 | | 06/14/13 | | 15 to 40 Years |
| | Metairie, LA | | (b) | | 800 |
| | 3,016 |
| | — |
| | — |
| | 800 |
| | 3,016 |
| | 3,816 |
| | (367 | ) | | 1964 | | 07/17/13 | | 10 to 30 Years |
| | Middleburg Heights, OH | (a) | | 1,456 |
| | 793 |
| | — |
| | — |
| | 1,456 |
| | 793 |
| | 2,249 |
| | (349 | ) | | 1987 | | 02/06/07 | | 15 to 30 Years |
| | Midlothian, VA | | (a) | | 823 |
| | 1,151 |
| | — |
| | 246 |
| | 823 |
| | 1,397 |
| | 2,220 |
| | (503 | ) | | 1994 | | 11/28/06 | | 15 to 30 Years |
| | Monroe, MI | | (c) | | 927 |
| | 897 |
| | — |
| | — |
| | 927 |
| | 897 |
| | 1,824 |
| | (106 | ) | | 1996 | | 12/23/14 | | 15 to 30 Years |
| | Monroeville, PA | | (c) | | 1,677 |
| | 3,508 |
| | — |
| | — |
| | 1,677 |
| | 3,508 |
| | 5,185 |
| | — |
| | 2009 | | 12/22/16 | | 12 to 30 Years |
| | Moody, AL | | (a) | | 518 |
| | 800 |
| | — |
| | 57 |
| | 518 |
| | 857 |
| | 1,375 |
| | (152 | ) | | 1997 | | 03/29/13 | | 8 to 29 Years |
| | Muskogee, OK | | (a) | | 968 |
| | 1,259 |
| | (448 | ) | | (568 | ) | | 520 |
| | 691 |
| | 1,211 |
| | (663 | ) | | 1984 | | 02/26/07 | | 14 to 30 Years |
| | New Boston, OH | | (a) | | 599 |
| | 1,498 |
| | — |
| | — |
| | 599 |
| | 1,498 |
| | 2,097 |
| | (197 | ) | | 1996 | | 10/25/13 | | 15 to 30 Years |
|
| | | | | | | | | | | | | | | | | | | | | | | | | | | | | | | | | |
| Buehler's Fresh Foods | Ashland, OH | | (a) | | 2,596 |
| | 8,200 |
| | — |
| | — |
| | 2,596 |
| | 8,200 |
| | 10,796 |
| | (656 | ) | | 2000 | | 10/14/15 | | 15 to 40 Years |
| Buehler's Fresh Foods | Dover, OH | | (a) | | 2,596 |
| | 8,087 |
| | — |
| | — |
| | 2,596 |
| | 8,087 |
| | 10,683 |
| | (771 | ) | | 1990 | | 10/14/15 | | 15 to 30 Years |
| Buehler's Fresh Foods | Medina, OH | | (a) | | 4,892 |
| | 10,983 |
| | — |
| | — |
| | 4,892 |
| | 10,983 |
| | 15,875 |
| | (1,108 | ) | | 1990 | | 10/14/15 | | 15 to 30 Years |
| Buehler's Fresh Foods | Wooster, OH | | (a) | | 3,694 |
| | 8,087 |
| | — |
| | — |
| | 3,694 |
| | 8,087 |
| | 11,781 |
| | (786 | ) | | 1980 | | 10/14/15 | | 30 to 30 Years |
| Buehler's Fresh Foods | Wadsworth, OH | | (a) | | 2,197 |
| | 9,285 |
| | — |
| | — |
| | 2,197 |
| | 9,285 |
| | 11,482 |
| | (816 | ) | | 1985 | | 10/14/15 | | 15 to 30 Years |
| Buffalo Wild Wings | Clinton Township, MI | | (d) | | 1,377 |
| | 911 |
| | — |
| | — |
| | 1,377 |
| | 911 |
| | 2,288 |
| | (158 | ) | | 2003 | | 11/05/14 | | 14 to 30 Years |
| Buffalo Wild Wings | Brandon, FL | | (d) | | 1,358 |
| | 614 |
| | — |
| | — |
| | 1,358 |
| | 614 |
| | 1,972 |
| | (173 | ) | | 2004 | | 11/05/14 | | 14 to 20 Years |
| Buffalo Wild Wings | Birch Run, MI | | (d) | | 1,852 |
| | 1,290 |
| | — |
| | — |
| | 1,852 |
| | 1,290 |
| | 3,142 |
| | (298 | ) | | 2014 | | 12/24/14 | | 14 to 30 Years |
|
| | | | | | | | | | | | | | | | | | | | | | | | | | | | | | | | | |
| Buffalo Wild Wings | Wesley Chapel, FL | | (d) | | 2,672 |
| | 1,725 |
| | — |
| | — |
| | 2,672 |
| | 1,725 |
| | 4,397 |
| | (165 | ) | | 2015 | | 08/18/15 | | 14 to 40 Years |
| Buffalo Wild Wings | Hammond, IN | | (a) | | 976 |
| | 1,080 |
| | — |
| | — |
| | 976 |
| | 1,080 |
| | 2,056 |
| | (223 | ) | | 2014 | | 12/24/14 | | 14 to 30 Years |
| Buffalo Wild Wings | Gaylord, MI | | (a) | | 1,003 |
| | 1,478 |
| | — |
| | — |
| | 1,003 |
| | 1,478 |
| | 2,481 |
| | (270 | ) | | 2014 | | 11/05/14 | | 14 to 30 Years |
| Buffet City | Orange City, FL | | (a) | | 409 |
| | 694 |
| | — |
| | — |
| | 409 |
| | 694 |
| | 1,103 |
| | (473 | ) | | 1984 | | 09/24/04 | | 11 to 20 Years |
| Burger King | Apopka, FL | | (a) | | 1,038 |
| | 482 |
| | — |
| | — |
| | 1,038 |
| | 482 |
| | 1,520 |
| | (623 | ) | | 1977 | | 06/25/04 | | 10 to 15 Years |
| Burger King | Saint Cloud, FL | | (a) | | 1,193 |
| | 557 |
| | — |
| | — |
| | 1,193 |
| | 557 |
| | 1,750 |
| | (395 | ) | | 1983 | | 06/25/04 | | 15 to 20 Years |
| Burger King | Orlando, FL | | (a) | | 1,249 |
| | 729 |
| | — |
| | — |
| | 1,249 |
| | 729 |
| | 1,978 |
| | (551 | ) | | 1985 | | 06/25/04 | | 15 to 20 Years |
| Burger King | Quincy, FL | | (a) | | 1,015 |
| | 416 |
| | — |
| | — |
| | 1,015 |
| | 416 |
| | 1,431 |
| | (472 | ) | | 1989 | | 09/24/04 | | 15 to 20 Years |
| Burger King | Saint Ann, MO | | (a) | | 588 |
| | 613 |
| | — |
| | — |
| | 588 |
| | 613 |
| | 1,201 |
| | (471 | ) | | 1985 | | 09/23/05 | | 15 to 20 Years |
| Burger King | Gilman, IL | | (a) | | 219 |
| | 414 |
| | — |
| | — |
| | 219 |
| | 414 |
| | 633 |
| | (313 | ) | | 1998 | | 09/23/05 | | 15 to 20 Years |
| Burger King | Springfield, IL | | (a) | | 1,072 |
| | 642 |
| | — |
| | — |
| | 1,072 |
| | 642 |
| | 1,714 |
| | (538 | ) | | 1988 | | 09/23/05 | | 15 to 20 Years |
| Burger King | Effingham, IL | | (a) | | 539 |
| | 575 |
| | — |
| | — |
| | 539 |
| | 575 |
| | 1,114 |
| | (310 | ) | | 1985 | | 09/23/05 | | 15 to 30 Years |
| Burger King | Decatur, IL | | (a) | | 940 |
| | 126 |
| | — |
| | — |
| | 940 |
| | 126 |
| | 1,066 |
| | (381 | ) | | 1992 | | 09/23/05 | | 15 to 20 Years |
| Burger King | Springfield, IL | | (a) | | 571 |
| | 630 |
| | — |
| | — |
| | 571 |
| | 630 |
| | 1,201 |
| | (353 | ) | | 1997 | | 09/23/05 | | 15 to 30 Years |
| Burger King | Romeoville, IL | | (a) | | 789 |
| | 713 |
| | (62 | ) | | — |
| | 727 |
| | 713 |
| | 1,440 |
| | (448 | ) | | 1999 | | 09/23/05 | | 15 to 20 Years |
| Burger King | Lincoln, IL | | (a) | | 203 |
| | 616 |
| | — |
| | — |
| | 203 |
| | 616 |
| | 819 |
| | (398 | ) | | 1990 | | 09/23/05 | | 15 to 20 Years |
| Burger King | Buffalo, NY | | (a) | | 737 |
| | 629 |
| | — |
| | — |
| | 737 |
| | 629 |
| | 1,366 |
| | (270 | ) | | 1993 | | 11/10/05 | | 15 to 30 Years |
| Burger King | Buffalo, NY | | (a) | | 821 |
| | 694 |
| | — |
| | — |
| | 821 |
| | 694 |
| | 1,515 |
| | (302 | ) | | 1976 | | 11/10/05 | | 15 to 30 Years |
| Burger King | Cheektowaga, NY | | (a) | | 561 |
| | 549 |
| | — |
| | — |
| | 561 |
| | 549 |
| | 1,110 |
| | (256 | ) | | 1985 | | 11/10/05 | | 15 to 30 Years |
| Burger King | Jamestown, NY | | (a) | | 508 |
| | 573 |
| | — |
| | — |
| | 508 |
| | 573 |
| | 1,081 |
| | (375 | ) | | 1988 | | 11/10/05 | | 15 to 20 Years |
SPIRIT REALTY CAPITAL, INC.
Schedule III Real Estate and
Accumulated Depreciation
(Amounts in thousands)
|
| | | | | | | | | | | | | | | | | | | | | | | | | |
| | | | | | Initial Cost to Company | | Cost Capitalized Subsequent to Acquisition including impairment | | Gross Amount at December 31, 2016 (d) 2017 (g) | | | | | | | | |
| Concept | City, State | | Encumbrances (e) | | Land and Improvements | | Buildings and Improvements | | Land and Improvements | | Buildings and Improvements | | Land and Improvements | | Buildings and Improvements | | Total | | Final Accumulated Depreciation | | Date of Construction | | Date Acquired | | Life in which depreciation in latest Statement of Operations is computed |
Description | | Encumbrances (e)
| | Land and
Improvements
| | Buildings and
Improvements
| | Improvements/
Land
| | Improvements/
building
| | Land and
Improvements
| | Buildings and
Improvements
| | Total | | Final
Accum
| | Date of
Construction
| | Date
Acquired
| |
|
| | | | | | | | | | | | | | | | | | | | | | | | | | | | | | | | | |
| | New Cumberland, PA | | (a) | | 634 |
| | 278 |
| | — |
| | 176 |
| | 634 |
| | 454 |
| | 1,088 |
| | (296 | ) | | 1990 | | 01/30/06 | | 15 to 20 Years |
| | Newport News, VA | | (c) | | 1,184 |
| | 311 |
| | — |
| | — |
| | 1,184 |
| | 311 |
| | 1,495 |
| | (287 | ) | | 1995 | | 06/25/04 | | 10 to 25 Years |
| | Newton, KS | | (a) | | 175 |
| | 661 |
| | — |
| | — |
| | 175 |
| | 661 |
| | 836 |
| | (76 | ) | | 1987 | | 06/30/14 | | 15 to 30 Years |
| | Norman, OK | | (a) | | 1,466 |
| | 2,294 |
| | — |
| | — |
| | 1,466 |
| | 2,294 |
| | 3,760 |
| | (1,052 | ) | | 1992 | | 07/02/07 | | 14 to 30 Years |
| | North Little Rock, AR | | (a) | | 1,398 |
| | 1,289 |
| | — |
| | — |
| | 1,398 |
| | 1,289 |
| | 2,687 |
| | (799 | ) | | 1993 | | 09/23/05 | | 15 to 20 Years |
| | Oak Ridge, TN | | (c) | | 988 |
| | 1,019 |
| | — |
| | — |
| | 988 |
| | 1,019 |
| | 2,007 |
| | (95 | ) | | 1994 | | 12/23/14 | | 15 to 30 Years |
| | Oklahoma City, OK | | (a) | | 479 |
| | 1,877 |
| | — |
| | — |
| | 479 |
| | 1,877 |
| | 2,356 |
| | (289 | ) | | 1904 | | 12/02/13 | | 20 to 20 Years |
| | Olean, NY | | (a) | | 355 |
| | 663 |
| | — |
| | — |
| | 355 |
| | 663 |
| | 1,018 |
| | (301 | ) | | 1977 | | 02/06/07 | | 15 to 30 Years |
| | Orange City, FL | | (a) | | 409 |
| | 694 |
| | — |
| | — |
| | 409 |
| | 694 |
| | 1,103 |
| | (432 | ) | | 1984 | | 09/24/04 | | 11 to 20 Years |
| | Orlando, FL | | (a) | | 2,006 |
| | 571 |
| | — |
| | — |
| | 2,006 |
| | 571 |
| | 2,577 |
| | (297 | ) | | 2002 | | 12/31/07 | | 15 to 40 Years |
| | Orlando, FL | | (c) | | 1,351 |
| | 1,404 |
| | — |
| | — |
| | 1,351 |
| | 1,404 |
| | 2,755 |
| | — |
| | 2002 | | 12/28/16 | | 8 to 40 Years |
| | Orlando, FL | | (c) | | 1,484 |
| | 1,415 |
| | — |
| | — |
| | 1,484 |
| | 1,415 |
| | 2,899 |
| | — |
| | 1998 | | 12/28/16 | | 6 to 40 Years |
| | Orlando, FL | | (c) | | 1,319 |
| | 1,424 |
| | — |
| | — |
| | 1,319 |
| | 1,424 |
| | 2,743 |
| | — |
| | 1997 | | 12/28/16 | | 7to 40 Years |
| | Ottawa, KS | | (a) | | 348 |
| | 816 |
| | — |
| | — |
| | 348 |
| | 816 |
| | 1,164 |
| | (91 | ) | | 1987 | | 06/04/14 | | 15 to 30 Years |
| | Overland Park, KS | | (a) | | 2,549 |
| | 3,219 |
| | — |
| | — |
| | 2,549 |
| | 3,219 |
| | 5,768 |
| | (349 | ) | | 1983 | | 05/15/14 | | 15 to 30 Years |
| | Oviedo, FL | | (c) | | 1,499 |
| | 1,449 |
| | — |
| | — |
| | 1,499 |
| | 1,449 |
| | 2,948 |
| | — |
| | 2006 | | 12/28/16 | | 7 to 40 Years |
| | Owensboro, KY | | (a) | | 250 |
| | 502 |
| | — |
| | — |
| | 250 |
| | 502 |
| | 752 |
| | (158 | ) | | 1991 | | 06/25/04 | | 30 to 30 Years |
| | Oxford, AL | | (c) | | 489 |
| | 1,212 |
| | — |
| | — |
| | 489 |
| | 1,212 |
| | 1,701 |
| | (112 | ) | | 1991 | | 12/23/14 | | 15 to 30 Years |
| | Paducah, KY | | (c) | | 1,485 |
| | 2,407 |
| | — |
| | — |
| | 1,485 |
| | 2,407 |
| | 3,892 |
| | — |
| | 2013 | | 12/22/16 | | 13 to 40 Years |
| | Paris, TX | | (c) | | 552 |
| | 1,821 |
| | — |
| | — |
| | 552 |
| | 1,821 |
| | 2,373 |
| | (241 | ) | | 1999 | | 07/17/13 | | 11 to 35 Years |
| | Pelham, AL | | (a) | | 605 |
| | 922 |
| | — |
| | 57 |
| | 605 |
| | 979 |
| | 1,584 |
| | (169 | ) | | 1998 | | 03/29/13 | | 8 to 29 Years |
| | Phoenix, AZ | | (a) | | 787 |
| | 663 |
| | — |
| | — |
| | 787 |
| | 663 |
| | 1,450 |
| | (198 | ) | | 1964 | | 10/28/11 | | 14 to 29 Years |
| | Picayune, MS | | (a) | | 1,250 |
| | 1,409 |
| | — |
| | — |
| | 1,250 |
| | 1,409 |
| | 2,659 |
| | (257 | ) | | 1999 | | 07/17/13 | | 7 to 29 Years |
| | Pico Rivera, CA | | (a) | | 2,785 |
| | 3,126 |
| | — |
| | — |
| | 2,785 |
| | 3,126 |
| | 5,911 |
| | (231 | ) | | 2014 | | 12/19/14 | | 15 to 40 Years |
| | Pittsburgh, PA | | (a) | | 1,289 |
| | 1,871 |
| | — |
| | — |
| | 1,289 |
| | 1,871 |
| | 3,160 |
| | (751 | ) | | 1992 | | 06/25/04 | | 15 to 30 Years |
| | Pittsburgh, PA | | (a) | | 1,481 |
| | 676 |
| | — |
| | — |
| | 1,481 |
| | 676 |
| | 2,157 |
| | (355 | ) | | 2006 | | 12/31/07 | | 15 to 40 Years |
| | Plano, TX | | (a) | | 2,418 |
| | 1,529 |
| | — |
| | — |
| | 2,418 |
| | 1,529 |
| | 3,947 |
| | (607 | ) | | 1998 | | 06/29/07 | | 15 to 40 Years |
| | Powell, TN | | (a) | | 252 |
| | 377 |
| | — |
| | 176 |
| | 252 |
| | 553 |
| | 805 |
| | (244 | ) | | 1982 | | 11/02/07 | | 15 to 30 Years |
| | Princeton, WV | | (a) | | 948 |
| | 2,212 |
| | — |
| | — |
| | 948 |
| | 2,212 |
| | 3,160 |
| | (416 | ) | | 2001 | | 07/17/13 | | 11 to 25 Years |
| | Queen Creek, AZ | | (c) | | 609 |
| | 1,159 |
| | — |
| | — |
| | 609 |
| | 1,159 |
| | 1,768 |
| | (162 | ) | | 2004 | | 06/14/13 | | 15 to 40 Years |
| | Rapid City, SD | | (a) | | 878 |
| | 1,657 |
| | — |
| | — |
| | 878 |
| | 1,657 |
| | 2,535 |
| | (824 | ) | | 1902 | | 12/29/06 | | 15 to 20 Years |
| | Rawlins, WY | | (a) | | 25 |
| | 406 |
| | — |
| | — |
| | 25 |
| | 406 |
| | 431 |
| | (217 | ) | | 1958 | | 12/29/06 | | 15 to 20 Years |
| | Reston, VA | | (a) | | 1,033 |
| | 193 |
| | — |
| | — |
| | 1,033 |
| | 193 |
| | 1,226 |
| | (139 | ) | | 1977 | | 11/27/06 | | 15 to 20 Years |
| | Richmond, VA | | (a) | | 1,253 |
| | 1,410 |
| | — |
| | 29 |
| | 1,253 |
| | 1,439 |
| | 2,692 |
| | (528 | ) | | 1977 | | 11/28/06 | | 15 to 30 Years |
| | Richmond, VA | | (c) | | 993 |
| | 922 |
| | — |
| | — |
| | 993 |
| | 922 |
| | 1,915 |
| | (98 | ) | | 2003 | | 03/20/15 | | 13 to 20 Years |
| | Ringgold, GA | | (a) | | 387 |
| | 374 |
| | — |
| | — |
| | 387 |
| | 374 |
| | 761 |
| | (177 | ) | | 1990 | | 11/02/07 | | 15 to 30 Years |
| | Riverside, CA | | (a) | | 1,988 |
| | 1,211 |
| | — |
| | — |
| | 1,988 |
| | 1,211 |
| | 3,199 |
| | (136 | ) | | 2002 | | 12/19/14 | | 15 to 30 Years |
|
| | | | | | | | | | | | | | | | | | | | | | | | | | | | | | | | | |
| Burger King | Louisville, KY | | (a) | | 1,010 |
| | 577 |
| | — |
| | — |
| | 1,010 |
| | 577 |
| | 1,587 |
| | (305 | ) | | 1994 | | 11/10/05 | | 15 to 30 Years |
| Burger King | Louisville, KY | | (a) | | 854 |
| | 514 |
| | — |
| | — |
| | 854 |
| | 514 |
| | 1,368 |
| | (276 | ) | | 1994 | | 11/10/05 | | 15 to 30 Years |
| Burger King | Niagara Falls, NY | | (a) | | 1,359 |
| | 551 |
| | — |
| | — |
| | 1,359 |
| | 551 |
| | 1,910 |
| | (305 | ) | | 1979 | | 11/10/05 | | 15 to 30 Years |
| Burger King | Springville, NY | | (a) | | 678 |
| | 586 |
| | — |
| | — |
| | 678 |
| | 586 |
| | 1,264 |
| | (290 | ) | | 1988 | | 11/10/05 | | 15 to 30 Years |
| Burger King | Escanaba, MI | | (a) | | 772 |
| | 767 |
| | — |
| | 300 |
| | 772 |
| | 1,067 |
| | 1,839 |
| | (716 | ) | | 1984 | | 12/29/05 | | 3 to 20 Years |
| Burger King | Oshkosh, WI | | (a) | | 765 |
| | 829 |
| | (40 | ) | | 300 |
| | 725 |
| | 1,129 |
| | 1,854 |
| | (643 | ) | | 1984 | | 12/29/05 | | 15 to 20 Years |
| Burger King | Hickory, NC | | (a) | | 292 |
| | 818 |
| | — |
| | — |
| | 292 |
| | 818 |
| | 1,110 |
| | (318 | ) | | 2000 | | 09/29/06 | | 15 to 40 Years |
| Burger King | Hudson, NC | | (a) | | 794 |
| | 616 |
| | — |
| | — |
| | 794 |
| | 616 |
| | 1,410 |
| | (308 | ) | | 1998 | | 09/29/06 | | 15 to 40 Years |
| Burger King | Fayetteville, NC | | (a) | | 470 |
| | 629 |
| | — |
| | — |
| | 470 |
| | 629 |
| | 1,099 |
| | (312 | ) | | 1999 | | 09/29/06 | | 15 to 30 Years |
| Burger King | Hope Mills, NC | | (a) | | 408 |
| | 930 |
| | — |
| | — |
| | 408 |
| | 930 |
| �� | 1,338 |
| | (408 | ) | | 1990 | | 09/29/06 | | 15 to 30 Years |
| Burger King | Fayetteville, NC | | (a) | | 489 |
| | 612 |
| | — |
| | — |
| | 489 |
| | 612 |
| | 1,101 |
| | (287 | ) | | 1987 | | 09/29/06 | | 15 to 30 Years |
| Burger King | Lillington, NC | | (a) | | 419 |
| | 687 |
| | — |
| | — |
| | 419 |
| | 687 |
| | 1,106 |
| | (275 | ) | | 1992 | | 09/29/06 | | 15 to 40 Years |
| Burger King | Sweetwater, TN | | (a) | | 602 |
| | 550 |
| | — |
| | 250 |
| | 602 |
| | 800 |
| | 1,402 |
| | (278 | ) | | 1999 | | 12/29/06 | | 15 to 40 Years |
| Burger King | Winchester, TN | | (a) | | 400 |
| | 291 |
| | — |
| | 250 |
| | 400 |
| | 541 |
| | 941 |
| | (225 | ) | | 1993 | | 12/29/06 | | 10 to 20 Years |
| Burger King | Aurora, IL | | (a) | | 286 |
| | 726 |
| | — |
| | — |
| | 286 |
| | 726 |
| | 1,012 |
| | (381 | ) | | 1998 | | 12/29/06 | | 15 to 30 Years |
| Burger King | Detroit, MI | | (a) | | 613 |
| | 688 |
| | — |
| | — |
| | 613 |
| | 688 |
| | 1,301 |
| | (468 | ) | | 1987 | | 02/13/09 | | 13 to 18 Years |
| Burger King | Carrollton, KY | | (a) | | 229 |
| | 730 |
| | — |
| | — |
| | 229 |
| | 730 |
| | 959 |
| | (325 | ) | | 1990 | | 06/30/09 | | 13 to 28 Years |
| Burger King | Sandusky, OH | | (a) | | 923 |
| | 406 |
| | (314 | ) | | (89 | ) | | 609 |
| | 317 |
| | 926 |
| | (148 | ) | | 1987 | | 08/27/09 | | 14 to 29 Years |
| Burger King | Seven Hills, OH | | (a) | | 496 |
| | 489 |
| | — |
| | — |
| | 496 |
| | 489 |
| | 985 |
| | (234 | ) | | 1977 | | 08/27/09 | | 13 to 28 Years |
| Burger King | Parma Heights, OH | | (a) | | 598 |
| | 535 |
| | — |
| | — |
| | 598 |
| | 535 |
| | 1,133 |
| | (235 | ) | | 2004 | | 08/27/09 | | 13 to 38 Years |
| Burger King | Durham, NC | | (b) | | 1,253 |
| | — |
| | — |
| | — |
| | 1,253 |
| | — |
| | 1,253 |
| | — |
| | (f) | | 07/17/13 | | (f) |
| Burger King | Artesia, NM | | (a) | | 435 |
| | 1,106 |
| | — |
| | — |
| | 435 |
| | 1,106 |
| | 1,541 |
| | (191 | ) | | 1984 | | 04/16/14 | | 15 to 30 Years |
| Burger King | Mebane, NC | | (a) | | 846 |
| | 682 |
| | — |
| | — |
| | 846 |
| | 682 |
| | 1,528 |
| | (321 | ) | | 1993 | | 09/29/06 | | 15 to 30 Years |
| Burger King | Garner, NC | | (a) | | 600 |
| | 765 |
| | — |
| | — |
| | 600 |
| | 765 |
| | 1,365 |
| | (394 | ) | | 1995 | | 09/29/06 | | 15 to 30 Years |
| Burger King | Fayetteville, NC | | (a) | | 607 |
| | 1,020 |
| | — |
| | — |
| | 607 |
| | 1,020 |
| | 1,627 |
| | (542 | ) | | 1996 | | 09/29/06 | | 15 to 30 Years |
| Caliber Collision | Conroe, TX | | (d) | | 2,056 |
| | 2,306 |
| | — |
| | 32 |
| | 2,056 |
| | 2,338 |
| | 4,394 |
| | (90 | ) | | 2016 | | 12/28/16 | | 14 to 50 Years |
| Caliber Collision | Houston, TX | | (d) | | 2,089 |
| | 2,332 |
| | — |
| | 33 |
| | 2,089 |
| | 2,365 |
| | 4,454 |
| | (67 | ) | | 2016 | | 03/16/17 | | 14 to 50 Years |
| Camping World | Saukville, WI | | (a) | | 2,061 |
| | 4,794 |
| | — |
| | — |
| | 2,061 |
| | 4,794 |
| | 6,855 |
| | (687 | ) | | 2014 | | 09/30/14 | | 15 to 40 Years |
| Camping World | Wentzville, MO | | (d) | | 2,040 |
| | 5,133 |
| | — |
| | 1,264 |
| | 2,040 |
| | 6,397 |
| | 8,437 |
| | (321 | ) | | 2015 | | 03/27/15 | | 39 to 40 Years |
| Camping World | Summerfield, FL | | (d) | | 3,059 |
| | 3,949 |
| | — |
| | — |
| | 3,059 |
| | 3,949 |
| | 7,008 |
| | (380 | ) | | 2004 | | 08/29/16 | | 10 to 30 Years |
| Camping World | Tulsa, OK | | (d) | | 4,569 |
| | 88 |
| | — |
| | 3,130 |
| | 4,569 |
| | 3,218 |
| | 7,787 |
| | (237 | ) | | 2016 | | 12/15/16 | | 11 to 40 Years |
| Camping World | Poteau, OK | | (b) | | 2,210 |
| | 3,839 |
| | — |
| | 17 |
| | 2,210 |
| | 3,856 |
| | 6,066 |
| | (165 | ) | | 2015 | | 03/22/17 | | 15 to 30 Years |
SPIRIT REALTY CAPITAL, INC.
Schedule III Real Estate and
Accumulated Depreciation
(Amounts in thousands)
|
| | | | | | | | | | | | | | | | | | | | | | | | | |
| | | | | | Initial Cost to Company | | Cost Capitalized Subsequent to Acquisition including impairment | | Gross Amount at December 31, 2016 (d) 2017 (g) | | | | | | | | |
| Concept | City, State | | Encumbrances (e) | | Land and Improvements | | Buildings and Improvements | | Land and Improvements | | Buildings and Improvements | | Land and Improvements | | Buildings and Improvements | | Total | | Final Accumulated Depreciation | | Date of Construction | | Date Acquired | | Life in which depreciation in latest Statement of Operations is computed |
Description | | Encumbrances (e)
| | Land and
Improvements
| | Buildings and
Improvements
| | Improvements/
Land
| | Improvements/
building
| | Land and
Improvements
| | Buildings and
Improvements
| | Total | | Final
Accum
| | Date of
Construction
| | Date
Acquired
| |
|
| | | | | | | | | | | | | | | | | | | | | | | | | | | | | | | | | |
| | Roanoke, VA | | (a) | | 1,362 |
| | 1,836 |
| | — |
| | — |
| | 1,362 |
| | 1,836 |
| | 3,198 |
| | (239 | ) | | 2000 | | 08/21/13 | | 15 to 30 Years |
| | Rock Falls, IL | | (a) | | 314 |
| | 631 |
| | — |
| | — |
| | 314 |
| | 631 |
| | 945 |
| | (293 | ) | | 1995 | | 09/23/05 | | 15 to 30 Years |
| | Rockford, IL | | (c) | | 1,348 |
| | 2,842 |
| | — |
| | — |
| | 1,348 |
| | 2,842 |
| | 4,190 |
| | — |
| | 1977 | | 12/22/16 | | 13 to 40 Years |
| | Salem, IL | | (a) | | 271 |
| | 218 |
| | — |
| | — |
| | 271 |
| | 218 |
| | 489 |
| | (113 | ) | | 2000 | | 07/28/04 | | 15 to 30 Years |
| | Salina, KS | | (c) | | 764 |
| | 1,100 |
| | — |
| | — |
| | 764 |
| | 1,100 |
| | 1,864 |
| | (111 | ) | | 1994 | | 12/23/14 | | 15 to 30 Years |
| | San Antonio, TX | | (a) | | 1,204 |
| | 519 |
| | — |
| | — |
| | 1,204 |
| | 519 |
| | 1,723 |
| | (48 | ) | | 1993 | | 09/26/13 | | 30 to 30 Years |
| | Sanford, FL | | (c) | | 1,405 |
| | 1,191 |
| | — |
| | — |
| | 1,405 |
| | 1,191 |
| | 2,596 |
| | — |
| | 1987 | | 12/28/16 | | 6 to 30 Years |
| | Santa Ana, CA | | (a) | | 2,112 |
| | 1,501 |
| | — |
| | — |
| | 2,112 |
| | 1,501 |
| | 3,613 |
| | (137 | ) | | 1976 | | 12/19/14 | | 15 to 30 Years |
| | Santa Fe, NM | | (c) | | 2,120 |
| | 2,033 |
| | — |
| | — |
| | 2,120 |
| | 2,033 |
| | 4,153 |
| | (236 | ) | | 1997 | | 07/17/13 | | 13 to 40 Years |
| | Sarasota, FL | | (a) | | 2,758 |
| | 412 |
| | — |
| | — |
| | 2,758 |
| | 412 |
| | 3,170 |
| | (136 | ) | | 2000 | | 07/17/13 | | 12 to 25 Years |
| | Savannah, GA | | (c) | | 1,112 |
| | 1,727 |
| | — |
| | — |
| | 1,112 |
| | 1,727 |
| | 2,839 |
| | (206 | ) | | 1993 | | 07/17/13 | | 13 to 40 Years |
| | Shawnee, OK | | (a) | | 621 |
| | 1,399 |
| | — |
| | — |
| | 621 |
| | 1,399 |
| | 2,020 |
| | (169 | ) | | 1984 | | 07/29/05 | | 15 to 30 Years |
| | Shelbyville, IN | | (c) | | 549 |
| | 752 |
| | — |
| | — |
| | 549 |
| | 752 |
| | 1,301 |
| | (258 | ) | | 2006 | | 12/21/07 | | 15 to 50 Years |
| | Sherman, TX | | (a) | | 1,013 |
| | 1,286 |
| | (415 | ) | | (542 | ) | | 598 |
| | 744 |
| | 1,342 |
| | (730 | ) | | 1994 | | 02/26/07 | | 14 to 30 Years |
| | Shreveport, LA | | (a) | | 759 |
| | 964 |
| | (446 | ) | | (727 | ) | | 313 |
| | 237 |
| | 550 |
| | — |
| | 1964 | | 02/26/07 | | 14 to 20 Years |
| | Silver Spring, MD | | (a) | | 1,008 |
| | 251 |
| | — |
| | — |
| | 1,008 |
| | 251 |
| | 1,259 |
| | (183 | ) | | 1983 | | 11/27/06 | | 15 to 20 Years |
| | Sioux Falls, SD | | (a) | | 639 |
| | 206 |
| | — |
| | — |
| | 639 |
| | 206 |
| | 845 |
| | (30 | ) | | 1994 | | 12/24/13 | | 15 to 30 Years |
| | Soddy Daisy, TN | | (a) | | 316 |
| | 405 |
| | — |
| | — |
| | 316 |
| | 405 |
| | 721 |
| | (193 | ) | | 1989 | | 11/02/07 | | 15 to 30 Years |
| | Springfield, IL | | (a) | | 1,115 |
| | 772 |
| | — |
| | — |
| | 1,115 |
| | 772 |
| | 1,887 |
| | (364 | ) | | 1996 | | 12/31/07 | | 15 to 40 Years |
| | Springfield, MO | | (a) | | 1,655 |
| | 1,467 |
| | — |
| | — |
| | 1,655 |
| | 1,467 |
| | 3,122 |
| | (773 | ) | | 1993 | | 09/23/05 | | 15 to 30 Years |
| | Stillwater, MN | | (a) | | 1,051 |
| | 1,051 |
| | — |
| | — |
| | 1,051 |
| | 1,051 |
| | 2,102 |
| | (587 | ) | | 1998 | | 09/24/04 | | 15 to 30 Years |
| | Stillwater, OK | | (a) | | 647 |
| | 687 |
| | — |
| | — |
| | 647 |
| | 687 |
| | 1,334 |
| | (85 | ) | | 1987 | | 06/04/14 | | 15 to 30 Years |
| | Stillwater, OK | | (c) | | 611 |
| | 1,447 |
| | — |
| | — |
| | 611 |
| | 1,447 |
| | 2,058 |
| | (109 | ) | | 1995 | | 12/23/14 | | 15 to 30 Years |
| | Sweetwater, TN | | (a) | | 231 |
| | 307 |
| | — |
| | — |
| | 231 |
| | 307 |
| | 538 |
| | (154 | ) | | 1979 | | 11/02/07 | | 15 to 30 Years |
| | Syracuse, NY | | (c) | | 734 |
| | 1,518 |
| | — |
| | — |
| | 734 |
| | 1,518 |
| | 2,252 |
| | (146 | ) | | 1981 | | 12/23/14 | | 15 to 30 Years |
| | Taylorville, IL | | (a) | | 154 |
| | 352 |
| | — |
| | — |
| | 154 |
| | 352 |
| | 506 |
| | (357 | ) | | 1980 | | 09/23/05 | | 10 to 15 Years |
| | Thornton, CO | | (a) | | 943 |
| | 128 |
| | — |
| | — |
| | 943 |
| | 128 |
| | 1,071 |
| | (21 | ) | | 1996 | | 12/24/13 | | 15 to 30 Years |
| | Thurmont, MD | | (a) | | 857 |
| | 307 |
| | — |
| | 68 |
| | 857 |
| | 375 |
| | 1,232 |
| | (217 | ) | | 1985 | | 11/27/06 | | 11 to 20 Years |
| | Tifton, GA | | (c) | | 642 |
| | 1,009 |
| | — |
| | — |
| | 642 |
| | 1,009 |
| | 1,651 |
| | (80 | ) | | 1995 | | 12/23/14 | | 15 to 40 Years |
| | Tilton, NH | | (c) | | 1,565 |
| | — |
| | — |
| | — |
| | 1,565 |
| | — |
| | 1,565 |
| | — |
| | (f) | | 07/17/13 | | (f) |
| | Tipton, IA | | (a) | | 240 |
| | 408 |
| | — |
| | — |
| | 240 |
| | 408 |
| | 648 |
| | (485 | ) | | 1991 | | 09/23/05 | | 10 to 15 Years |
| | Titusville, PA | | (a) | | 247 |
| | 438 |
| | — |
| | — |
| | 247 |
| | 438 |
| | 685 |
| | (205 | ) | | 1976 | | 04/29/11 | | 11 to 26 Years |
| | Topeka, KS | | (a) | | 1,224 |
| | 905 |
| | — |
| | — |
| | 1,224 |
| | 905 |
| | 2,129 |
| | (135 | ) | | 1988 | | 06/04/14 | | 15 to 30 Years |
| | Torrance, CA | | (a) | | 3,509 |
| | 2,754 |
| | — |
| | — |
| | 3,509 |
| | 2,754 |
| | 6,263 |
| | (205 | ) | | 1998 | | 12/19/14 | | 15 to 40 Years |
| | Traverse City, MI | | (c) | | 651 |
| | 1,255 |
| | — |
| | — |
| | 651 |
| | 1,255 |
| | 1,906 |
| | (64 | ) | | 2004 | | 11/09/15 | | 15 to 30 Years |
| | Trenton, GA | | (a) | | 300 |
| | 227 |
| | — |
| | — |
| | 300 |
| | 227 |
| | 527 |
| | (141 | ) | | 1991 | | 11/02/07 | | 15 to 30 Years |
| | Trussville, AL | | (a) | | 909 |
| | 892 |
| | — |
| | 57 |
| | 909 |
| | 949 |
| | 1,858 |
| | (185 | ) | | 2000 | | 03/29/13 | | 8 to 29 Years |
| | Trussville, AL | | (b) | | 1,222 |
| | 1,769 |
| | (1,029 | ) | | (1,498 | ) | | 193 |
| | 271 |
| | 464 |
| | (3 | ) | | 2007 | | 07/17/13 | | 12 to 38 Years |
| | Trussville, AL | | (a) | | 796 |
| | 256 |
| | — |
| | — |
| | 796 |
| | 256 |
| | 1,052 |
| | (51 | ) | | 1998 | | 12/24/13 | | 15 to 30 Years |
|
| | | | | | | | | | | | | | | | | | | | | | | | | | | | | | | | | |
| Camping World | Monticello, MN | | (d) | | 3,873 |
| | 769 |
| | — |
| | 1,386 |
| | 3,873 |
| | 2,155 |
| | 6,028 |
| | (194 | ) | | 2016 | | 12/29/16 | | 9 to 30 Years |
| Camping World | Biloxi, MS | | (d) | | 3,274 |
| | 627 |
| | — |
| | 6,107 |
| | 3,274 |
| | 6,734 |
| | 10,008 |
| | (62 | ) | | 2016 | | 12/22/16 | | 16 to 39 Years |
| Caremark RX, LLC | St. John, MO | | (d) | | 1,733 |
| | 3,095 |
| | 91 |
| | 365 |
| | 1,824 |
| | 3,460 |
| | 5,284 |
| | (821 | ) | | 1996 | | 07/17/13 | | 1 to 43 Years |
| CarMax | Pompano Beach, FL | | (d) | | 6,153 |
| | 5,010 |
| | — |
| | — |
| | 6,153 |
| | 5,010 |
| | 11,163 |
| | (1,355 | ) | | 2004 | | 06/30/05 | | 15 to 40 Years |
| CarMax | Ontario, CA | | (d) | | 7,981 |
| | 6,937 |
| | — |
| | — |
| | 7,981 |
| | 6,937 |
| | 14,918 |
| | (1,856 | ) | | 2005 | | 06/30/05 | | 15 to 40 Years |
| CarMax | Midlothian, VA | | (d) | | 4,775 |
| | 6,056 |
| | — |
| | — |
| | 4,775 |
| | 6,056 |
| | 10,831 |
| | (1,632 | ) | | 2004 | | 06/30/05 | | 15 to 40 Years |
| CarMax | Kennesaw, GA | | (a) | | 3,931 |
| | 5,334 |
| | — |
| | — |
| | 3,931 |
| | 5,334 |
| | 9,265 |
| | (1,612 | ) | | 1995 | | 02/16/12 | | 15 to 30 Years |
| CarMax | Pineville, NC | | (c) | | 4,865 |
| | 1,902 |
| | — |
| | — |
| | 4,865 |
| | 1,902 |
| | 6,767 |
| | (601 | ) | | 2002 | | 07/17/13 | | 10 to 30 Years |
| CarMax | Raleigh, NC | | (a) | | 4,163 |
| | 4,017 |
| | — |
| | — |
| | 4,163 |
| | 4,017 |
| | 8,180 |
| | (1,555 | ) | | 1994 | | 07/17/13 | | 4 to 25 Years |
| CarMax | Greenville, SC | | (a) | | 9,731 |
| | 11,625 |
| | — |
| | — |
| | 9,731 |
| | 11,625 |
| | 21,356 |
| | (2,287 | ) | | 1999 | | 07/17/13 | | 3 to 40 Years |
| CarMax | Jacksonville, FL | | (a) | | 6,155 |
| | 10,957 |
| | — |
| | — |
| | 6,155 |
| | 10,957 |
| | 17,112 |
| | (2,980 | ) | | 2005 | | 06/30/05 | | 15 to 40 Years |
| Carmike Cinemas | Cedar Rapids, IA | | (a) | | 2,521 |
| | 5,461 |
| | — |
| | — |
| | 2,521 |
| | 5,461 |
| | 7,982 |
| | (1,987 | ) | | 1998 | | 07/01/05 | | 15 to 40 Years |
| Carmike Cinemas | Colorado Springs, CO | | (a) | | 1,892 |
| | 1,732 |
| | — |
| | — |
| | 1,892 |
| | 1,732 |
| | 3,624 |
| | (1,036 | ) | | 1995 | | 09/30/05 | | 14 to 30 Years |
| Carmike Cinemas | Durham, NC | | (a) | | 1,630 |
| | 2,685 |
| | — |
| | — |
| | 1,630 |
| | 2,685 |
| | 4,315 |
| | (1,477 | ) | | 1994 | | 09/30/05 | | 13 to 30 Years |
| Carmike Cinemas | Columbia, SC | | (a) | | 2,115 |
| | 2,091 |
| | — |
| | — |
| | 2,115 |
| | 2,091 |
| | 4,206 |
| | (953 | ) | | 1996 | | 09/30/05 | | 15 to 30 Years |
| Carmike Cinemas | Greensboro, NC | | (a) | | 2,359 |
| | 2,431 |
| | — |
| | — |
| | 2,359 |
| | 2,431 |
| | 4,790 |
| | (1,149 | ) | | 1996 | | 09/30/05 | | 15 to 30 Years |
| Carmike Cinemas | Longview, TX | | (a) | | 1,432 |
| | 2,946 |
| | — |
| | — |
| | 1,432 |
| | 2,946 |
| | 4,378 |
| | (1,380 | ) | | 1995 | | 09/30/05 | | 15 to 30 Years |
| Carmike Cinemas | Wilmington, NC | | (a) | | 1,552 |
| | 2,934 |
| | — |
| | — |
| | 1,552 |
| | 2,934 |
| | 4,486 |
| | (1,325 | ) | | 1997 | | 09/30/05 | | 15 to 30 Years |
| Carmike Cinemas | Winston-Salem, NC | | (a) | | 1,567 |
| | 2,140 |
| | — |
| | — |
| | 1,567 |
| | 2,140 |
| | 3,707 |
| | (1,184 | ) | | 1993 | | 10/28/05 | | 13 to 30 Years |
| Carmike Cinemas | Fort Wayne, IN | | (a) | | 2,696 |
| | 9,849 |
| | 682 |
| | — |
| | 3,378 |
| | 9,849 |
| | 13,227 |
| | (3,533 | ) | | 2005 | | 11/30/05 | | 15 to 40 Years |
| Carmike Cinemas | Raleigh, NC | | (a) | | 3,636 |
| | 8,833 |
| | — |
| | — |
| | 3,636 |
| | 8,833 |
| | 12,469 |
| | (3,792 | ) | | 1988 | | 06/10/10 | | 9 to 27 Years |
| Carmike Cinemas | Johnston, IA | | (c) | | 3,046 |
| | 10,213 |
| | — |
| | — |
| | 3,046 |
| | 10,213 |
| | 13,259 |
| | (4,184 | ) | | 1998 | | 06/23/04 | | 15 to 30 Years |
| Carmike Cinemas | Missoula, MT | | (b) | | 2,333 |
| | 3,406 |
| | — |
| | — |
| | 2,333 |
| | 3,406 |
| | 5,739 |
| | (1,310 | ) | | 1998 | | 06/23/04 | | 15 to 40 Years |
| Carmike Cinemas | Chubbuck, ID | | (a) | | 1,845 |
| | 2,691 |
| | — |
| | — |
| | 1,845 |
| | 2,691 |
| | 4,536 |
| | (350 | ) | | 2004 | | 12/23/14 | | 10 to 30 Years |
| Carrington College | Phoenix, AZ | | (a) | | 1,840 |
| | 3,582 |
| | 266 |
| | 22 |
| | 2,106 |
| | 3,604 |
| | 5,710 |
| | (1,433 | ) | | 1975 | | 07/01/05 | | 3 to 40 Years |
| Carrington College | Mesquite, TX | | (d) | | 2,534 |
| | 1,780 |
| | — |
| | — |
| | 2,534 |
| | 1,780 |
| | 4,314 |
| | (616 | ) | | 1996 | | 07/17/13 | | 8 to 23 Years |
| Casual Male | Canton, MA | | (a) | | 28,721 |
| | 27,798 |
| | 15 |
| | 35 |
| | 28,736 |
| | 27,833 |
| | 56,569 |
| | (10,446 | ) | | 1962 | | 02/01/06 | | 15 to 30 Years |
| Cermak Fresh Market | Aurora, IL | | (a) | | 2,450 |
| | 7,566 |
| | — |
| | 343 |
| | 2,450 |
| | 7,909 |
| | 10,359 |
| | (317 | ) | | 1989 | | 01/09/17 | | 10 to 30 Years |
| Chapala | Boise, ID | | (a) | | 809 |
| | 601 |
| | (400 | ) | | (259 | ) | | 409 |
| | 342 |
| | 751 |
| | (242 | ) | | 1998 | | 06/25/04 | | 15 to 30 Years |
| Charleston's Restaurant | Norman, OK | | (a) | | 1,466 |
| | 2,294 |
| | — |
| | — |
| | 1,466 |
| | 2,294 |
| | 3,760 |
| | (1,164 | ) | | 1992 | | 07/02/07 | | 14 to 30 Years |
SPIRIT REALTY CAPITAL, INC.
Schedule III Real Estate and
Accumulated Depreciation
(Amounts in thousands)
|
| | | | | | | | | | | | | | | | | | | | | | | | | |
| | | | | | Initial Cost to Company | | Cost Capitalized Subsequent to Acquisition including impairment | | Gross Amount at December 31, 2016 (d) 2017 (g) | | | | | | | | |
| Concept | City, State | | Encumbrances (e) | | Land and Improvements | | Buildings and Improvements | | Land and Improvements | | Buildings and Improvements | | Land and Improvements | | Buildings and Improvements | | Total | | Final Accumulated Depreciation | | Date of Construction | | Date Acquired | | Life in which depreciation in latest Statement of Operations is computed |
Description | | Encumbrances (e)
| | Land and
Improvements
| | Buildings and
Improvements
| | Improvements/
Land
| | Improvements/
building
| | Land and
Improvements
| | Buildings and
Improvements
| | Total | | Final
Accum
| | Date of
Construction
| | Date
Acquired
| |
|
| | | | | | | | | | | | | | | | | | | | | | | | | | | | | | | | | |
| | Tullahoma, TN | | (c) | | 520 |
| | 886 |
| | — |
| | — |
| | 520 |
| | 886 |
| | 1,406 |
| | (74 | ) | | 1996 | | 12/23/14 | | 15 to 40 Years |
| | Tulsa, OK | | (a) | | 983 |
| | 1,232 |
| | (497 | ) | | (573 | ) | | 486 |
| | 659 |
| | 1,145 |
| | (611 | ) | | 1976 | | 02/26/07 | | 14 to 30 Years |
| | Tulsa, OK | | (a) | | 1,540 |
| | 1,997 |
| | — |
| | — |
| | 1,540 |
| | 1,997 |
| | 3,537 |
| | (726 | ) | | 2002 | | 07/02/07 | | 14 to 40 Years |
| | Tulsa, OK | | (a) | | 1,465 |
| | 1,728 |
| | — |
| | — |
| | 1,465 |
| | 1,728 |
| | 3,193 |
| | (198 | ) | | 2013 | | 07/21/14 | | 14 to 30 Years |
| | Tupelo, MS | | (a) | | 1,131 |
| | 1,175 |
| | (371 | ) | | (435 | ) | | 760 |
| | 740 |
| | 1,500 |
| | — |
| | 1995 | | 07/17/13 | | 7 to 26 Years |
| | Union Gap, WA | | (c) | | 522 |
| | 2,218 |
| | — |
| | — |
| | 522 |
| | 2,218 |
| | 2,740 |
| | (220 | ) | | 2004 | | 07/17/13 | | 13 to 40 Years |
| | Upper Marlboro, MD | | (a) | | 290 |
| | 172 |
| | — |
| | — |
| | 290 |
| | 172 |
| | 462 |
| | (137 | ) | | 1983 | | 11/27/06 | | 15 to 20 Years |
| | Vandalia, IL | | (a) | | 409 |
| | 202 |
| | — |
| | — |
| | 409 |
| | 202 |
| | 611 |
| | (331 | ) | | 1977 | | 09/23/05 | | 10 to 15 Years |
| | Vinton, IA | | (a) | | 121 |
| | 114 |
| | — |
| | — |
| | 121 |
| | 114 |
| | 235 |
| | (168 | ) | | 1978 | | 09/23/05 | | 10 to 15 Years |
| | Walkersville, MD | | (a) | | 381 |
| | 238 |
| | — |
| | 68 |
| | 381 |
| | 306 |
| | 687 |
| | (161 | ) | | 1985 | | 11/27/06 | | 11 to 20 Years |
| | Walla Walla, WA | | (c) | | 665 |
| | 2,072 |
| | — |
| | — |
| | 665 |
| | 2,072 |
| | 2,737 |
| | (278 | ) | | 2005 | | 07/17/13 | | 11 to 35 Years |
| | Warner Robins, GA | | (c) | | 1,228 |
| | 1,714 |
| | — |
| | — |
| | 1,228 |
| | 1,714 |
| | 2,942 |
| | (212 | ) | | 1994 | | 07/17/13 | | 11 to 40 Years |
| | Warren, OH | | (a) | | 973 |
| | 640 |
| | — |
| | — |
| | 973 |
| | 640 |
| | 1,613 |
| | (293 | ) | | 1999 | | 02/06/07 | | 15 to 30 Years |
| | Warren, PA | | (a) | | 383 |
| | 427 |
| | — |
| | — |
| | 383 |
| | 427 |
| | 810 |
| | (235 | ) | | 1970 | | 02/06/07 | | 15 to 30 Years |
| | Warrenton, VA | | (a) | | 378 |
| | 254 |
| | — |
| | — |
| | 378 |
| | 254 |
| | 632 |
| | (170 | ) | | 1985 | | 12/19/06 | | 14 to 20 Years |
| | Warwick, RI | | (a) | | 1,593 |
| | 1,314 |
| | — |
| | — |
| | 1,593 |
| | 1,314 |
| | 2,907 |
| | (542 | ) | | 1990 | | 12/31/07 | | 15 to 40 Years |
| | Waterford, MI | | (c) | | 761 |
| | 1,958 |
| | — |
| | — |
| | 761 |
| | 1,958 |
| | 2,719 |
| | (130 | ) | | 1997 | | 02/10/15 | | 15 to 40 Years |
| | Wesley Chapel, FL | | (c) | | 2,672 |
| | 1,725 |
| | — |
| | — |
| | 2,672 |
| | 1,725 |
| | 4,397 |
| | (95 | ) | | 2015 | | 08/18/15 | | 14 to 40 Years |
| | Whittier, CA | | (a) | | 1,439 |
| | 1,874 |
| | — |
| | — |
| | 1,439 |
| | 1,874 |
| | 3,313 |
| | (132 | ) | | 1991 | | 12/19/14 | | 15 to 40 Years |
| | Wichita Falls, TX | | (a) | | 851 |
| | 1,077 |
| | (271 | ) | | (317 | ) | | 580 |
| | 760 |
| | 1,340 |
| | (839 | ) | | 1976 | | 02/26/07 | | 14 to 20 Years |
| | Winfield, KS | | (a) | | 239 |
| | 866 |
| | — |
| | — |
| | 239 |
| | 866 |
| | 1,105 |
| | (104 | ) | | 1995 | | 06/04/14 | | 15 to 30 Years |
| | Winston-Salem, NC | | (c) | | 1,707 |
| | 1,873 |
| | — |
| | — |
| | 1,707 |
| | 1,873 |
| | 3,580 |
| | — |
| | 1998 | | 12/22/16 | | 13 to 40 Years |
| | Woodbury, MN | | (a) | | 555 |
| | 411 |
| | (146 | ) | | (86 | ) | | 409 |
| | 325 |
| | 734 |
| | (139 | ) | | 1987 | | 05/24/05 | | 15 to 30 Years |
| | Woodbury, MN | | (a) | | 3,165 |
| | 1,707 |
| | — |
| | — |
| | 3,165 |
| | 1,707 |
| | 4,872 |
| | (241 | ) | | 1995 | | 05/22/14 | | 15 to 30 Years |
| | Youngstown, OH | | (a) | | 1,560 |
| | 557 |
| | — |
| | — |
| | 1,560 |
| | 557 |
| | 2,117 |
| | (268 | ) | | 1985 | | 02/06/07 | | 15 to 30 Years |
| | Zanesville, OH | | (c) | | 1,088 |
| | 2,218 |
| | — |
| | — |
| | 1,088 |
| | 2,218 |
| | 3,306 |
| | — |
| | 1992 | | 12/22/16 | | 11 to 30 Years |
|
| | | | | | | | | | | | | | | | | | | | | | | | | | | | | | | | | |
| Charleston's Restaurant | Tulsa, OK | | (a) | | 1,540 |
| | 1,997 |
| | — |
| | — |
| | 1,540 |
| | 1,997 |
| | 3,537 |
| | (803 | ) | | 2002 | | 07/02/07 | | 14 to 40 Years |
| Chick-Fil-A | Carrollton, GA | | (b) | | 985 |
| | 725 |
| | — |
| | — |
| | 985 |
| | 725 |
| | 1,710 |
| | (168 | ) | | 1995 | | 07/17/13 | | 11 to 33 Years |
| Childcare Network | Evans, GA | | (d) | | 508 |
| | 640 |
| | — |
| | — |
| | 508 |
| | 640 |
| | 1,148 |
| | (93 | ) | | 2003 | | 11/14/14 | | 15 to 30 Years |
| Childcare Network | Stockbridge, GA | | (d) | | 533 |
| | 1,236 |
| | — |
| | (16 | ) | | 533 |
| | 1,220 |
| | 1,753 |
| | (177 | ) | | 2000 | | 10/31/14 | | 15 to 30 Years |
| Childcare Network | Warner Robins, GA | | (d) | | 431 |
| | 620 |
| | — |
| | — |
| | 431 |
| | 620 |
| | 1,051 |
| | (107 | ) | | 1995 | | 02/27/15 | | 15 to 20 Years |
| Childcare Network | Fort Walton Beach, FL | | (d) | | 200 |
| | 491 |
| | — |
| | — |
| | 200 |
| | 491 |
| | 691 |
| | (58 | ) | | 1977 | | 02/27/15 | | 15 to 30 Years |
| Childcare Network | Sanford, NC | | (d) | | 200 |
| | 611 |
| | — |
| | — |
| | 200 |
| | 611 |
| | 811 |
| | (71 | ) | | 2002 | | 02/27/15 | | 15 to 30 Years |
| Childcare Network | Norcross, GA | | (d) | | 831 |
| | 624 |
| | — |
| | — |
| | 831 |
| | 624 |
| | 1,455 |
| | (118 | ) | | 1985 | | 03/30/15 | | 15 to 20 Years |
| Childcare Network | Grand Prairie, TX | | (d) | | 1,057 |
| | 2,350 |
| | — |
| | — |
| | 1,057 |
| | 2,350 |
| | 3,407 |
| | (279 | ) | | 2007 | | 07/17/15 | | 15 to 30 Years |
| Childcare Network | Denton, TX | | (d) | | 626 |
| | 1,909 |
| | — |
| | — |
| | 626 |
| | 1,909 |
| | 2,535 |
| | (198 | ) | | 2000 | | 07/17/15 | | 15 to 30 Years |
| Childcare Network | Fort Worth, TX | | (d) | | 392 |
| | 871 |
| | — |
| | — |
| | 392 |
| | 871 |
| | 1,263 |
| | (111 | ) | | 2006 | | 07/17/15 | | 15 to 30 Years |
| Childcare Network | Columbus, GA | | (d) | | 342 |
| | 1,096 |
| | — |
| | 30 |
| | 342 |
| | 1,126 |
| | 1,468 |
| | (88 | ) | | 2015 | | 12/22/15 | | 15 to 40 Years |
| Childcare Network | High Point, NC | | (d) | | 205 |
| | 978 |
| | — |
| | — |
| | 205 |
| | 978 |
| | 1,183 |
| | (78 | ) | | 1981 | | 12/22/15 | | 15 to 30 Years |
| Childcare Network | Hampton, GA | | (d) | | 391 |
| | 460 |
| | — |
| | — |
| | 391 |
| | 460 |
| | 851 |
| | (57 | ) | | 2005 | | 12/22/15 | | 15 to 30 Years |
| Childcare Network | Marietta, GA | | (b) | | 538 |
| | 792 |
| | — |
| | 11 |
| | 538 |
| | 803 |
| | 1,341 |
| | (51 | ) | | 2009 | | 09/28/16 | | 11 to 30 Years |
| Childcare Network | Chattanooga, TN | | (b) | | 684 |
| | 841 |
| | — |
| | 11 |
| | 684 |
| | 852 |
| | 1,536 |
| | (50 | ) | | 1999 | | 09/28/16 | | 10 to 30 Years |
| Childcare Network | Elon, NC | | (d) | | 486 |
| | 846 |
| | — |
| | — |
| | 486 |
| | 846 |
| | 1,332 |
| | (65 | ) | | 1998 | | 12/02/16 | | 4 to 30 Years |
| Childcare Network | Winston-Salem, NC | | (d) | | 541 |
| | 659 |
| | — |
| | — |
| | 541 |
| | 659 |
| | 1,200 |
| | (41 | ) | | 1993 | | 12/02/16 | | 5 to 30 Years |
| Childcare Network | Greensboro, NC | | (d) | | 360 |
| | 540 |
| | — |
| | — |
| | 360 |
| | 540 |
| | 900 |
| | (26 | ) | | 1949 | | 12/02/16 | | 9 to 30 Years |
| Childcare Network | East Point, GA | | (d) | | 411 |
| | 1,279 |
| | — |
| | — |
| | 411 |
| | 1,279 |
| | 1,690 |
| | (49 | ) | | 2016 | | 12/13/16 | | 14 to 40 Years |
| Childcare Network | Burlington, NC | | (d) | | 306 |
| | 533 |
| | — |
| | — |
| | 306 |
| | 533 |
| | 839 |
| | (36 | ) | | 1971 | | 12/13/16 | | 7 to 20 Years |
|
| | | | | | | | | | | | | | | | | | | | | | | | | | | | | | | | | |
| Restaurants - Quick Service | | | | | | | | | | | | | | | | | | | | | | |
| | Aberdeen, NC | | (a) | | 564 |
| | 338 |
| | — |
| | — |
| | 564 |
| | 338 |
| | 902 |
| | (51 | ) | | 1994 | | 09/17/13 | | 15 to 30 Years |
| | Abilene, TX | | (c) | | 198 |
| | 311 |
| | — |
| | — |
| | 198 |
| | 311 |
| | 509 |
| | (60 | ) | | 1975 | | 07/17/13 | | 10 to 26 Years |
| | Abilene, TX | | (c) | | 1,132 |
| | 1,292 |
| | — |
| | — |
| | 1,132 |
| | 1,292 |
| | 2,424 |
| | (31 | ) | | 1979 | | 06/30/16 | | 5 to 30 Years |
| | Abilene, TX | | (c) | | 510 |
| | 818 |
| | — |
| | — |
| | 510 |
| | 818 |
| | 1,328 |
| | (20 | ) | | 1977 | | 06/30/16 | | 5 to 30 Years |
| | Adairsville, GA | | (a) | | 557 |
| | 318 |
| | — |
| | — |
| | 557 |
| | 318 |
| | 875 |
| | (177 | ) | | 1986 | | 09/29/06 | | 15 to 20 Years |
| | Akron, OH | | (a) | | 247 |
| | 198 |
| | — |
| | — |
| | 247 |
| | 198 |
| | 445 |
| | (137 | ) | | 1971 | | 05/25/05 | | 15 to 20 Years |
| | Akron, OH | | (a) | | 218 |
| | 273 |
| | — |
| | — |
| | 218 |
| | 273 |
| | 491 |
| | (165 | ) | | 1976 | | 05/25/05 | | 15 to 20 Years |
|
| | | | | | | | | | | | | | | | | | | | | | | | | | | | | | | | | |
| Children's Network | Pensacola, FL | | (d) | | 390 |
| | 1,360 |
| | — |
| | — |
| | 390 |
| | 1,360 |
| | 1,750 |
| | (30 | ) | | 2016 | | 02/23/17 | | 15 to 50 Years |
| Childtime | Cuyahoga Falls, OH | | (b) | | 279 |
| | 727 |
| | — |
| | — |
| | 279 |
| | 727 |
| | 1,006 |
| | (204 | ) | | 1974 | | 07/17/13 | | 8 to 25 Years |
| Childtime | Arlington, TX | | (b) | | 365 |
| | 532 |
| | — |
| | — |
| | 365 |
| | 532 |
| | 897 |
| | (163 | ) | | 2006 | | 07/17/13 | | 10 to 33 Years |
| Childtime | Oklahoma City, OK | | (b) | | 290 |
| | 341 |
| | — |
| | — |
| | 290 |
| | 341 |
| | 631 |
| | (116 | ) | | 1985 | | 07/17/13 | | 11 to 19 Years |
| Childtime | Rochester, NY | | (b) | | 242 |
| | 539 |
| | — |
| | — |
| | 242 |
| | 539 |
| | 781 |
| | (130 | ) | | 1981 | | 07/17/13 | | 8 to 28 Years |
| Childtime | Modesto, CA | | (b) | | 386 |
| | 664 |
| | — |
| | — |
| | 386 |
| | 664 |
| | 1,050 |
| | (183 | ) | | 1986 | | 07/17/13 | | 9 to 22 Years |
| Childtime | Morrisville, NC | | (d) | | 544 |
| | 1,378 |
| | — |
| | — |
| | 544 |
| | 1,378 |
| | 1,922 |
| | (148 | ) | | 2010 | | 02/19/15 | | 15 to 40 Years |
| Chili's | Paris, TX | | (d) | | 552 |
| | 1,821 |
| | — |
| | — |
| | 552 |
| | 1,821 |
| | 2,373 |
| | (311 | ) | | 1999 | | 07/17/13 | | 11 to 35 Years |
SPIRIT REALTY CAPITAL, INC.
Schedule III Real Estate and
Accumulated Depreciation
(Amounts in thousands)
|
| | | | | | | | | | | | | | | | | | | | | | | | | |
| | | | | | Initial Cost to Company | | Cost Capitalized Subsequent to Acquisition including impairment | | Gross Amount at December 31, 2016 (d) 2017 (g) | | | | | | | | |
| Concept | City, State | | Encumbrances (e) | | Land and Improvements | | Buildings and Improvements | | Land and Improvements | | Buildings and Improvements | | Land and Improvements | | Buildings and Improvements | | Total | | Final Accumulated Depreciation | | Date of Construction | | Date Acquired | | Life in which depreciation in latest Statement of Operations is computed |
Description | | Encumbrances (e)
| | Land and
Improvements
| | Buildings and
Improvements
| | Improvements/
Land
| | Improvements/
building
| | Land and
Improvements
| | Buildings and
Improvements
| | Total | | Final
Accum
| | Date of
Construction
| | Date
Acquired
| |
|
| | | | | | | | | | | | | | | | | | | | | | | | | | | | | | | | | |
| | Akron, OH | | (a) | | 310 |
| | 394 |
| | — |
| | — |
| | 310 |
| | 394 |
| | 704 |
| | (233 | ) | | 1982 | | 05/25/05 | | 15 to 20 Years |
| | Alamo, TX | | (c) | | 1,745 |
| | 715 |
| | — |
| | — |
| | 1,745 |
| | 715 |
| | 2,460 |
| | (87 | ) | | 1984 | | 07/17/13 | | 9 to 35 Years |
| | Albermarle, NC | | (a) | | 639 |
| | 310 |
| | — |
| | — |
| | 639 |
| | 310 |
| | 949 |
| | (50 | ) | | 1993 | | 09/17/13 | | 15 to 30 Years |
| | Albuquerque, NM | | (c) | | 265 |
| | 575 |
| | — |
| | — |
| | 265 |
| | 575 |
| | 840 |
| | (121 | ) | | 1980 | | 07/17/13 | | 11 to 26 Years |
| | Albuquerque, NM | | (c) | | 466 |
| | 591 |
| | — |
| | — |
| | 466 |
| | 591 |
| | 1,057 |
| | (94 | ) | | 1976 | | 07/17/13 | | 11 to 35 Years |
| | Albuquerque, NM | | (c) | | 267 |
| | 439 |
| | — |
| | — |
| | 267 |
| | 439 |
| | 706 |
| | (104 | ) | | 1975 | | 07/17/13 | | 11 to 25 Years |
| | Albuquerque, NM | | (c) | | 293 |
| | 300 |
| | — |
| | — |
| | 293 |
| | 300 |
| | 593 |
| | (89 | ) | | 1976 | | 07/17/13 | | 11 to 25 Years |
| | Altus, OK | | (c) | | 70 |
| | 413 |
| | — |
| | — |
| | 70 |
| | 413 |
| | 483 |
| | (75 | ) | | 1980 | | 07/17/13 | | 7 to 25 Years |
| | Altus, OK | | (a) | | 103 |
| | 237 |
| | — |
| | — |
| | 103 |
| | 237 |
| | 340 |
| | (50 | ) | | 2007 | | 07/17/13 | | 4 to 28 Years |
| | Amarillo, TX | | (a) | | 538 |
| | 615 |
| | — |
| | — |
| | 538 |
| | 615 |
| | 1,153 |
| | (33 | ) | | 1985 | | 12/29/15 | | 15 to 30 Years |
| | Americus, GA | | (c) | | 282 |
| | 406 |
| | — |
| | — |
| | 282 |
| | 406 |
| | 688 |
| | (98 | ) | | 1978 | | 07/17/13 | | 11 to 23 Years |
| | Anderson, IN | | (a) | | 363 |
| | 700 |
| | — |
| | — |
| | 363 |
| | 700 |
| | 1,063 |
| | (183 | ) | | 1995 | | 07/17/13 | | 8 to 17 Years |
| | Apopka, FL | | (a) | | 1,038 |
| | 482 |
| | — |
| | — |
| | 1,038 |
| | 482 |
| | 1,520 |
| | (581 | ) | | 1977 | | 06/25/04 | | 10 to 15 Years |
| | Arlington, TX | | (c) | | 449 |
| | 128 |
| | — |
| | — |
| | 449 |
| | 128 |
| | 577 |
| | (10 | ) | | 1978 | | 06/30/16 | | 5 to 10 Years |
| | Arlington, TX | | (c) | | 540 |
| | 1,205 |
| | — |
| | — |
| | 540 |
| | 1,205 |
| | 1,745 |
| | (26 | ) | | 1981 | | 06/30/16 | | 5 to 30 Years |
| | Artesia, NM | | (a) | | 435 |
| | 1,106 |
| | — |
| | — |
| | 435 |
| | 1,106 |
| | 1,541 |
| | (139 | ) | | 1984 | | 04/16/14 | | 15 to 30 Years |
| | Atlanta, GA | | (a) | | 513 |
| | 483 |
| | — |
| | — |
| | 513 |
| | 483 |
| | 996 |
| | (101 | ) | | 2002 | | 02/02/12 | | 15 to 30 Years |
| | Atlanta, GA | | (c) | | 336 |
| | 346 |
| | — |
| | — |
| | 336 |
| | 346 |
| | 682 |
| | (102 | ) | | 1981 | | 07/17/13 | | 11 to 22 Years |
| | Atlanta, GA | | (c) | | 554 |
| | 258 |
| | — |
| | — |
| | 554 |
| | 258 |
| | 812 |
| | (84 | ) | | 1980 | | 07/17/13 | | 11 to 23 Years |
| | Atlanta, GA | | (c) | | 683 |
| | 5 |
| | — |
| | — |
| | 683 |
| | 5 |
| | 688 |
| | (49 | ) | | 1975 | | 07/17/13 | | 11 to 23 Years |
| | Atlanta, GA | | (c) | | 394 |
| | 268 |
| | — |
| | — |
| | 394 |
| | 268 |
| | 662 |
| | (105 | ) | | 1975 | | 07/17/13 | | 11 to 16 Years |
| | Atlanta, GA | | (a) | | 309 |
| | 867 |
| | — |
| | — |
| | 309 |
| | 867 |
| | 1,176 |
| | (111 | ) | | 1994 | | 12/24/13 | | 15 to 30 Years |
| | Auburn, CA | | (a) | | 579 |
| | 299 |
| | — |
| | — |
| | 579 |
| | 299 |
| | 878 |
| | (140 | ) | | 1992 | | 12/29/06 | | 15 to 30 Years |
| | Aurora, IL | | (a) | | 286 |
| | 726 |
| | — |
| | — |
| | 286 |
| | 726 |
| | 1,012 |
| | (344 | ) | | 1998 | | 12/29/06 | | 15 to 30 Years |
| | Austell, GA | | (a) | | 838 |
| | 216 |
| | — |
| | — |
| | 838 |
| | 216 |
| | 1,054 |
| | (218 | ) | | 1962 | | 02/28/06 | | 15 to 20 Years |
| | Austin, TX | | (c) | | 531 |
| | 794 |
| | — |
| | — |
| | 531 |
| | 794 |
| | 1,325 |
| | (106 | ) | | 1967 | | 07/17/13 | | 11 to 32 Years |
| | Austin, TX | | (c) | | 904 |
| | 477 |
| | — |
| | — |
| | 904 |
| | 477 |
| | 1,381 |
| | (68 | ) | | 1976 | | 07/17/13 | | 11 to 35 Years |
| | Austin, TX | | (c) | | 418 |
| | 872 |
| | — |
| | — |
| | 418 |
| | 872 |
| | 1,290 |
| | (109 | ) | | 1986 | | 07/17/13 | | 11 to 35 Years |
| | Austin, TX | | (c) | | 689 |
| | 634 |
| | — |
| | — |
| | 689 |
| | 634 |
| | 1,323 |
| | (108 | ) | | 2003 | | 07/17/13 | | 11 to 35 Years |
| | Balch Springs, TX | | (c) | | 329 |
| | 576 |
| | — |
| | — |
| | 329 |
| | 576 |
| | 905 |
| | (114 | ) | | 1986 | | 07/17/13 | | 11 to 31 Years |
| | Bartlett, TN | | (a) | | 411 |
| | — |
| | — |
| | — |
| | 411 |
| | — |
| | 411 |
| | — |
| | (f) | | 10/30/13 | | (f) |
| | Bartonville, IL | | (a) | | 410 |
| | 856 |
| | — |
| | — |
| | 410 |
| | 856 |
| | 1,266 |
| | (178 | ) | | 1980 | | 12/21/12 | | 15 to 30 Years |
| | Baton Rouge, LA | | (a) | | 565 |
| | 286 |
| | — |
| | — |
| | 565 |
| | 286 |
| | 851 |
| | (227 | ) | | 1991 | | 06/25/04 | | 15 to 20 Years |
|
| | | | | | | | | | | | | | | | | | | | | | | | | | | | | | | | | |
| Chili's | Tilton, NH | | (d) | | 1,565 |
| | — |
| | — |
| | — |
| | 1,565 |
| | — |
| | 1,565 |
| | — |
| | (f) | | 07/17/13 | | (f) |
| Church's Chicken | Mansfield, OH | | (a) | | 225 |
| | 327 |
| | — |
| | — |
| | 225 |
| | 327 |
| | 552 |
| | (204 | ) | | 1972 | | 05/25/05 | | 15 to 20 Years |
| Church's Chicken | Akron, OH | | (a) | | 247 |
| | 198 |
| | — |
| | — |
| | 247 |
| | 198 |
| | 445 |
| | (152 | ) | | 1971 | | 05/25/05 | | 15 to 20 Years |
| Church's Chicken | Columbus, OH | | (a) | | 268 |
| | 354 |
| | — |
| | — |
| | 268 |
| | 354 |
| | 622 |
| | (240 | ) | | 1975 | | 05/25/05 | | 15 to 20 Years |
| Church's Chicken | St. Louis, MO | | (a) | | 290 |
| | 211 |
| | — |
| | — |
| | 290 |
| | 211 |
| | 501 |
| | (168 | ) | | 1973 | | 05/25/05 | | 15 to 20 Years |
| Church's Chicken | Columbus, OH | | (a) | | 294 |
| | 262 |
| | — |
| | — |
| | 294 |
| | 262 |
| | 556 |
| | (195 | ) | | 1976 | | 05/25/05 | | 15 to 20 Years |
| Church's Chicken | Akron, OH | | (a) | | 218 |
| | 273 |
| | — |
| | — |
| | 218 |
| | 273 |
| | 491 |
| | (182 | ) | | 1976 | | 05/25/05 | | 15 to 20 Years |
| Church's Chicken | St. Louis, MO | | (a) | | 231 |
| | 337 |
| | — |
| | — |
| | 231 |
| | 337 |
| | 568 |
| | (216 | ) | | 1972 | | 05/25/05 | | 15 to 20 Years |
| Church's Chicken | Canton, OH | | (a) | | 215 |
| | 483 |
| | — |
| | — |
| | 215 |
| | 483 |
| | 698 |
| | (277 | ) | | 1974 | | 05/25/05 | | 15 to 20 Years |
| Church's Chicken | St. Louis, MO | | (a) | | 189 |
| | 227 |
| | — |
| | — |
| | 189 |
| | 227 |
| | 416 |
| | (161 | ) | | 1972 | | 05/25/05 | | 15 to 20 Years |
| Church's Chicken | Maplewood, MO | | (a) | | 180 |
| | 225 |
| | — |
| | — |
| | 180 |
| | 225 |
| | 405 |
| | (153 | ) | | 1980 | | 05/25/05 | | 15 to 20 Years |
| Church's Chicken | Akron, OH | | (a) | | 310 |
| | 394 |
| | — |
| | — |
| | 310 |
| | 394 |
| | 704 |
| | (257 | ) | | 1982 | | 05/25/05 | | 15 to 20 Years |
| Church's Chicken | Overland, MO | | (a) | | 278 |
| | 494 |
| | — |
| | — |
| | 278 |
| | 494 |
| | 772 |
| | (305 | ) | | 1972 | | 05/25/05 | | 15 to 20 Years |
| Church's Chicken | Flint, MI | | (a) | | 340 |
| | 258 |
| | — |
| | — |
| | 340 |
| | 258 |
| | 598 |
| | (193 | ) | | 1979 | | 05/25/05 | | 15 to 20 Years |
| Church's Chicken | St. Louis, MO | | (a) | | 464 |
| | 218 |
| | — |
| | — |
| | 464 |
| | 218 |
| | 682 |
| | (192 | ) | | 1978 | | 05/25/05 | | 15 to 20 Years |
| Church's Chicken | Ferguson, MO | | (a) | | 293 |
| | 212 |
| | — |
| | — |
| | 293 |
| | 212 |
| | 505 |
| | (164 | ) | | 1974 | | 05/25/05 | | 15 to 20 Years |
| Church's Chicken | Detroit, MI | | (a) | | 425 |
| | 200 |
| | — |
| | — |
| | 425 |
| | 200 |
| | 625 |
| | (153 | ) | | 1977 | | 05/25/05 | | 15 to 20 Years |
| Church's Chicken | Normandy, MO | | (a) | | 265 |
| | 329 |
| | (6 | ) | | — |
| | 259 |
| | 329 |
| | 588 |
| | (224 | ) | | 1978 | | 05/25/05 | | 15 to 20 Years |
| Church's Chicken | Detroit, MI | | (a) | | 351 |
| | 209 |
| | — |
| | — |
| | 351 |
| | 209 |
| | 560 |
| | (155 | ) | | 1977 | | 05/25/05 | | 15 to 20 Years |
| Church's Chicken | Detroit, MI | | (a) | | 426 |
| | 223 |
| | — |
| | — |
| | 426 |
| | 223 |
| | 649 |
| | (171 | ) | | 1979 | | 05/25/05 | | 15 to 20 Years |
| Church's Chicken | Warren, MI | | (a) | | 488 |
| | 215 |
| | — |
| | — |
| | 488 |
| | 215 |
| | 703 |
| | (162 | ) | | 1979 | | 05/25/05 | | 15 to 20 Years |
| Church's Chicken | Detroit, MI | | (a) | | 413 |
| | 235 |
| | — |
| | — |
| | 413 |
| | 235 |
| | 648 |
| | (174 | ) | | 1977 | | 05/25/05 | | 15 to 20 Years |
| Church's Chicken | Detroit, MI | | (a) | | 301 |
| | 219 |
| | — |
| | — |
| | 301 |
| | 219 |
| | 520 |
| | (156 | ) | | 1972 | | 05/25/05 | | 15 to 20 Years |
| Church's Chicken | Detroit, MI | | (a) | | 270 |
| | 305 |
| | — |
| | — |
| | 270 |
| | 305 |
| | 575 |
| | (189 | ) | | 1976 | | 05/25/05 | | 15 to 20 Years |
| Church's Chicken | Detroit, MI | | (a) | | 271 |
| | 157 |
| | — |
| | — |
| | 271 |
| | 157 |
| | 428 |
| | (119 | ) | | 1978 | | 05/25/05 | | 15 to 20 Years |
| Church's Chicken | Detroit, MI | | (a) | | 385 |
| | 258 |
| | — |
| | — |
| | 385 |
| | 258 |
| | 643 |
| | (195 | ) | | 1979 | | 05/25/05 | | 15 to 20 Years |
| Church's Chicken | Indianapolis, IN | | (a) | | 258 |
| | 262 |
| | — |
| | — |
| | 258 |
| | 262 |
| | 520 |
| | (204 | ) | | 1970 | | 05/25/05 | | 15 to 20 Years |
| Church's Chicken | Indianapolis, IN | | (a) | | 266 |
| | 310 |
| | — |
| | — |
| | 266 |
| | 310 |
| | 576 |
| | (218 | ) | | 1971 | | 05/25/05 | | 15 to 20 Years |
| Church's Chicken | Detroit, MI | | (a) | | 428 |
| | 189 |
| | — |
| | — |
| | 428 |
| | 189 |
| | 617 |
| | (144 | ) | | 1979 | | 05/25/05 | | 15 to 20 Years |
| Church's Chicken | Indianapolis, IN | | (a) | | 170 |
| | 749 |
| | — |
| | — |
| | 170 |
| | 749 |
| | 919 |
| | (427 | ) | | 1983 | | 05/25/05 | | 15 to 20 Years |
SPIRIT REALTY CAPITAL, INC.
Schedule III Real Estate and
Accumulated Depreciation
(Amounts in thousands)
|
| | | | | | | | | | | | | | | | | | | | | | | | | |
| | | | | | Initial Cost to Company | | Cost Capitalized Subsequent to Acquisition including impairment | | Gross Amount at December 31, 2016 (d) 2017 (g) | | | | | | | | |
| Concept | City, State | | Encumbrances (e) | | Land and Improvements | | Buildings and Improvements | | Land and Improvements | | Buildings and Improvements | | Land and Improvements | | Buildings and Improvements | | Total | | Final Accumulated Depreciation | | Date of Construction | | Date Acquired | | Life in which depreciation in latest Statement of Operations is computed |
Description | | Encumbrances (e)
| | Land and
Improvements
| | Buildings and
Improvements
| | Improvements/
Land
| | Improvements/
building
| | Land and
Improvements
| | Buildings and
Improvements
| | Total | | Final
Accum
| | Date of
Construction
| | Date
Acquired
| |
|
| | | | | | | | | | | | | | | | | | | | | | | | | | | | | | | | | |
| | Baton Rouge, LA | | (a) | | 594 |
| | 417 |
| | — |
| | — |
| | 594 |
| | 417 |
| | 1,011 |
| | (299 | ) | | 1979 | | 06/25/04 | | 15 to 20 Years |
| | Baton Rouge, LA | | (a) | | 391 |
| | 599 |
| | — |
| | — |
| | 391 |
| | 599 |
| | 990 |
| | (355 | ) | | 1980 | | 09/24/04 | | 15 to 20 Years |
| | Baton Rouge, LA | | (a) | | 747 |
| | 558 |
| | — |
| | — |
| | 747 |
| | 558 |
| | 1,305 |
| | (401 | ) | | 1984 | | 09/24/04 | | 15 to 20 Years |
| | Baton Rouge, LA | | (a) | | 472 |
| | 642 |
| | — |
| | — |
| | 472 |
| | 642 |
| | 1,114 |
| | (289 | ) | | 1987 | | 09/24/04 | | 15 to 30 Years |
| | Bay Minette, AL | | (a) | | 583 |
| | 754 |
| | — |
| | — |
| | 583 |
| | 754 |
| | 1,337 |
| | (90 | ) | | 2000 | | 09/22/14 | | 15 to 30 Years |
| | Beaumont, TX | | (c) | | 581 |
| | 284 |
| | — |
| | — |
| | 581 |
| | 284 |
| | 865 |
| | (45 | ) | | 2001 | | 08/31/15 | | 15 to 20 Years |
| | Beaumont, TX | | (c) | | 777 |
| | 246 |
| | — |
| | — |
| | 777 |
| | 246 |
| | 1,023 |
| | (46 | ) | | 2000 | | 08/31/15 | | 15 to 20 Years |
| | Beaumont, TX | | (c) | | 758 |
| | 325 |
| | — |
| | — |
| | 758 |
| | 325 |
| | 1,083 |
| | (49 | ) | | 2007 | | 08/31/15 | | 15 to 30 Years |
| | Bedford, TX | | (c) | | 694 |
| | 516 |
| | — |
| | — |
| | 694 |
| | 516 |
| | 1,210 |
| | (19 | ) | | 1977 | | 06/30/16 | | 5 to 20 Years |
| | Beeville, TX | | (c) | | 120 |
| | 488 |
| | — |
| | — |
| | 120 |
| | 488 |
| | 608 |
| | (95 | ) | | 1972 | | 07/17/13 | | 9 to 25 Years |
| | Bellefontaine, OH | | (a) | | 388 |
| | 778 |
| | (12 | ) | | — |
| | 376 |
| | 778 |
| | 1,154 |
| | (433 | ) | | 1989 | | 12/29/06 | | 15 to 20 Years |
| | Bentonville, AR | | (a) | | 635 |
| | 900 |
| | — |
| | — |
| | 635 |
| | 900 |
| | 1,535 |
| | (396 | ) | | 2004 | | 07/07/05 | | 15 to 30 Years |
| | Birmingham, AL | | (c) | | 192 |
| | 656 |
| | — |
| | — |
| | 192 |
| | 656 |
| | 848 |
| | (150 | ) | | 1981 | | 07/17/13 | | 7 to 19 Years |
| | Birmingham, AL | | (c) | | 120 |
| | 151 |
| | — |
| | — |
| | 120 |
| | 151 |
| | 271 |
| | (56 | ) | | 1970 | | 07/17/13 | | 6 to 15 Years |
| | Birmingham, AL | | (c) | | 119 |
| | 158 |
| | — |
| | — |
| | 119 |
| | 158 |
| | 277 |
| | (54 | ) | | 1970 | | 07/17/13 | | 5 to 15 Years |
| | Birmingham, AL | | (c) | | 107 |
| | 508 |
| | — |
| | — |
| | 107 |
| | 508 |
| | 615 |
| | (111 | ) | | 1983 | | 07/17/13 | | 7 to 19 Years |
| | Birmingham, AL | | (c) | | 131 |
| | 526 |
| | — |
| | — |
| | 131 |
| | 526 |
| | 657 |
| | (119 | ) | | 1984 | | 07/17/13 | | 7 to 19 Years |
| | Bloomsburg, PA | | (c) | | 698 |
| | 823 |
| | — |
| | — |
| | 698 |
| | 823 |
| | 1,521 |
| | (80 | ) | | 1993 | | 11/18/14 | | 15 to 30 Years |
| | Blue Springs, MO | | (c) | | 688 |
| | 119 |
| | 101 |
| | (119 | ) | | 789 |
| | — |
| | 789 |
| | — |
| | (f) | | 08/27/09 | | (f) |
| | Bolingbrook, IL | | (a) | | 762 |
| | 821 |
| | — |
| | — |
| | 762 |
| | 821 |
| | 1,583 |
| | (488 | ) | | 1994 | | 09/23/05 | | 15 to 20 Years |
| | Boone, NC | | (a) | | 750 |
| | 379 |
| | — |
| | — |
| | 750 |
| | 379 |
| | 1,129 |
| | (213 | ) | | 2006 | | 12/29/06 | | 15 to 30 Years |
| | Bowling Green, KY | | (c) | | 756 |
| | 205 |
| | — |
| | — |
| | 756 |
| | 205 |
| | 961 |
| | (65 | ) | | 2007 | | 07/17/13 | | 4 to 39 Years |
| | Brazil, IN | | (a) | | 391 |
| | 903 |
| | — |
| | — |
| | 391 |
| | 903 |
| | 1,294 |
| | (142 | ) | | 1996 | | 07/17/13 | | 8 to 33 Years |
| | Bristol, TN | | (a) | | 484 |
| | 134 |
| | — |
| | — |
| | 484 |
| | 134 |
| | 618 |
| | (223 | ) | | 1991 | | 07/01/05 | | 15 to 20 Years |
| | Bristol, TN | | (a) | | 474 |
| | 282 |
| | — |
| | — |
| | 474 |
| | 282 |
| | 756 |
| | (143 | ) | | 1985 | | 12/21/12 | | 10 to 15 Years |
| | Bristol, VA | | (a) | | 492 |
| | 366 |
| | — |
| | — |
| | 492 |
| | 366 |
| | 858 |
| | (136 | ) | | 1982 | | 12/21/12 | | 15 to 20 Years |
| | Bristol, VA | | (a) | | 369 |
| | 564 |
| | — |
| | — |
| | 369 |
| | 564 |
| | 933 |
| | (152 | ) | | 1991 | | 12/21/12 | | 15 to 20 Years |
| | Broken Arrow, OK | | (c) | | 849 |
| | 1,020 |
| | — |
| | — |
| | 849 |
| | 1,020 |
| | 1,869 |
| | (26 | ) | | 1986 | | 06/30/16 | | 5 to 30 Years |
| | Brownsville, TX | | (c) | | 795 |
| | 556 |
| | — |
| | — |
| | 795 |
| | 556 |
| | 1,351 |
| | (72 | ) | | 1977 | | 07/17/13 | | 10 to 35 Years |
| | Brownsville, TX | | (c) | | 667 |
| | 785 |
| | — |
| | — |
| | 667 |
| | 785 |
| | 1,452 |
| | (100 | ) | | 1985 | | 07/17/13 | | 10 to 35 Years |
| | Brownsville, TX | | (c) | | 369 |
| | 679 |
| | — |
| | — |
| | 369 |
| | 679 |
| | 1,048 |
| | (97 | ) | | 1972 | | 07/17/13 | | 11 to 35 Years |
| | Brownsville, TX | | (c) | | 267 |
| | 652 |
| | — |
| | — |
| | 267 |
| | 652 |
| | 919 |
| | (81 | ) | | 2000 | | 07/17/13 | | 10 to 35 Years |
| | Brownsville, TX | | (c) | | 430 |
| | 656 |
| | — |
| | — |
| | 430 |
| | 656 |
| | 1,086 |
| | (133 | ) | | 1985 | | 07/17/13 | | 11 to 29 Years |
| | Brownsville, TX | | (c) | | 571 |
| | 930 |
| | — |
| | — |
| | 571 |
| | 930 |
| | 1,501 |
| | (140 | ) | | 2002 | | 07/17/13 | | 11 to 35 Years |
|
| | | | | | | | | | | | | | | | | | | | | | | | | | | | | | | | | |
| Church's Chicken | Washington Park, IL | | (a) | | 119 |
| | 324 |
| | — |
| | — |
| | 119 |
| | 324 |
| | 443 |
| | (208 | ) | | 1980 | | 05/25/05 | | 15 to 20 Years |
| Church's Chicken | Indianapolis, IN | | (a) | | 449 |
| | 153 |
| | — |
| | — |
| | 449 |
| | 153 |
| | 602 |
| | (155 | ) | | 1968 | | 05/25/05 | | 15 to 20 Years |
| Church's Chicken | Gary, IN | | (a) | | 109 |
| | 410 |
| | — |
| | — |
| | 109 |
| | 410 |
| | 519 |
| | (250 | ) | | 1980 | | 05/25/05 | | 15 to 20 Years |
| Church's Chicken | Harvey, IL | | (a) | | 361 |
| | 269 |
| | (80 | ) | | — |
| | 281 |
| | 269 |
| | 550 |
| | (364 | ) | | 1978 | | 05/25/05 | | 15 to 20 Years |
| Church's Chicken | Indianapolis, IN | | (a) | | 370 |
| | 150 |
| | — |
| | — |
| | 370 |
| | 150 |
| | 520 |
| | (138 | ) | | 1970 | | 05/25/05 | | 15 to 20 Years |
| Church's Chicken | Peoria, IL | | (a) | | 154 |
| | 320 |
| | — |
| | — |
| | 154 |
| | 320 |
| | 474 |
| | (217 | ) | | 1976 | | 05/25/05 | | 15 to 20 Years |
| Church's Chicken | Gary, IN | | (a) | | 210 |
| | 318 |
| | — |
| | — |
| | 210 |
| | 318 |
| | 528 |
| | (240 | ) | | 1979 | | 05/25/05 | | 15 to 20 Years |
| Church's Chicken | Gary, IN | | (a) | | 161 |
| | 493 |
| | — |
| | — |
| | 161 |
| | 493 |
| | 654 |
| | (316 | ) | | 1973 | | 05/25/05 | | 15 to 20 Years |
| Church's Chicken | Chicago, IL | | (a) | | 313 |
| | 275 |
| | — |
| | — |
| | 313 |
| | 275 |
| | 588 |
| | (170 | ) | | 1982 | | 05/25/05 | | 15 to 20 Years |
| Church's Chicken | Joliet, IL | | (a) | | 245 |
| | 193 |
| | — |
| | — |
| | 245 |
| | 193 |
| | 438 |
| | (155 | ) | | 1985 | | 05/25/05 | | 15 to 20 Years |
| Church's Chicken | Chicago, IL | | (a) | | 340 |
| | 220 |
| | — |
| | — |
| | 340 |
| | 220 |
| | 560 |
| | (159 | ) | | 1975 | | 05/25/05 | | 15 to 20 Years |
| Church's Chicken | Chicago, IL | | (a) | | 242 |
| | 244 |
| | — |
| | — |
| | 242 |
| | 244 |
| | 486 |
| | (174 | ) | | 1970 | | 05/25/05 | | 15 to 20 Years |
| Church's Chicken | East St. Louis, IL | | (a) | | 117 |
| | 334 |
| | — |
| | — |
| | 117 |
| | 334 |
| | 451 |
| | (158 | ) | | 1990 | | 05/25/05 | | 15 to 30 Years |
| Church's Chicken | Chicago, IL | | (a) | | 242 |
| | 256 |
| | — |
| | — |
| | 242 |
| | 256 |
| | 498 |
| | (167 | ) | | 1974 | | 05/25/05 | | 15 to 20 Years |
| Church's Chicken | Chicago, IL | | (a) | | 532 |
| | 279 |
| | — |
| | — |
| | 532 |
| | 279 |
| | 811 |
| | (184 | ) | | 1982 | | 05/25/05 | | 15 to 20 Years |
| Church's Chicken | Chicago, IL | | (a) | | 289 |
| | 260 |
| | — |
| | — |
| | 289 |
| | 260 |
| | 549 |
| | (166 | ) | | 1982 | | 05/25/05 | | 15 to 20 Years |
| Church's Chicken | Birmingham, AL | | (d) | | 192 |
| | 656 |
| | — |
| | — |
| | 192 |
| | 656 |
| | 848 |
| | (194 | ) | | 1981 | | 07/17/13 | | 7 to 19 Years |
| Church's Chicken | Birmingham, AL | | (d) | | 107 |
| | 508 |
| | — |
| | — |
| | 107 |
| | 508 |
| | 615 |
| | (143 | ) | | 1983 | | 07/17/13 | | 7 to 19 Years |
| Church's Chicken | Birmingham, AL | | (d) | | 131 |
| | 526 |
| | — |
| | — |
| | 131 |
| | 526 |
| | 657 |
| | (153 | ) | | 1984 | | 07/17/13 | | 7 to 19 Years |
| Church's Chicken | Greensboro, AL | | (d) | | 100 |
| | 663 |
| | — |
| | — |
| | 100 |
| | 663 |
| | 763 |
| | (121 | ) | | 1986 | | 07/17/13 | | 7 to 35 Years |
| Church's Chicken | Montgomery, AL | | (d) | | 288 |
| | 623 |
| | — |
| | — |
| | 288 |
| | 623 |
| | 911 |
| | (108 | ) | | 1998 | | 07/17/13 | | 9 to 35 Years |
| Church's Chicken | Montgomery, AL | | (d) | | 177 |
| | 516 |
| | — |
| | — |
| | 177 |
| | 516 |
| | 693 |
| | (170 | ) | | 1984 | | 07/17/13 | | 9 to 19 Years |
| Church's Chicken | Montgomery, AL | | (d) | | 247 |
| | 376 |
| | — |
| | — |
| | 247 |
| | 376 |
| | 623 |
| | (124 | ) | | 1999 | | 07/17/13 | | 10 to 24 Years |
| Church's Chicken | Montgomery, AL | | (d) | | 455 |
| | 579 |
| | — |
| | — |
| | 455 |
| | 579 |
| | 1,034 |
| | (130 | ) | | 1972 | | 07/17/13 | | 11 to 33 Years |
| Church's Chicken | Montgomery, AL | | (d) | | 313 |
| | 601 |
| | — |
| | — |
| | 313 |
| | 601 |
| | 914 |
| | (171 | ) | | 1999 | | 07/17/13 | | 10 to 27 Years |
| Church's Chicken | Phenix City, AL | | (d) | | 493 |
| | 497 |
| | — |
| | — |
| | 493 |
| | 497 |
| | 990 |
| | (81 | ) | | 1978 | | 07/17/13 | | 8 to 35 Years |
| Church's Chicken | Talladega, AL | | (d) | | 247 |
| | 245 |
| | — |
| | — |
| | 247 |
| | 245 |
| | 492 |
| | (117 | ) | | 1998 | | 07/17/13 | | 11 to 21 Years |
| Church's Chicken | Little Rock, AR | | (d) | | 99 |
| | 500 |
| | — |
| | — |
| | 99 |
| | 500 |
| | 599 |
| | (100 | ) | | 1970 | | 07/17/13 | | 8 to 30 Years |
| Church's Chicken | Little Rock, AR | | (d) | | 332 |
| | 432 |
| | — |
| | — |
| | 332 |
| | 432 |
| | 764 |
| | (78 | ) | | 1971 | | 07/17/13 | | 9 to 35 Years |
| Church's Chicken | Little Rock, AR | | (d) | | 263 |
| | 492 |
| | — |
| | — |
| | 263 |
| | 492 |
| | 755 |
| | (92 | ) | | 1975 | | 07/17/13 | | 9 to 35 Years |
SPIRIT REALTY CAPITAL, INC.
Schedule III Real Estate and
Accumulated Depreciation
(Amounts in thousands)
|
| | | | | | | | | | | | | | | | | | | | | | | | | |
| | | | | | Initial Cost to Company | | Cost Capitalized Subsequent to Acquisition including impairment | | Gross Amount at December 31, 2016 (d) 2017 (g) | | | | | | | | |
| Concept | City, State | | Encumbrances (e) | | Land and Improvements | | Buildings and Improvements | | Land and Improvements | | Buildings and Improvements | | Land and Improvements | | Buildings and Improvements | | Total | | Final Accumulated Depreciation | | Date of Construction | | Date Acquired | | Life in which depreciation in latest Statement of Operations is computed |
Description | | Encumbrances (e)
| | Land and
Improvements
| | Buildings and
Improvements
| | Improvements/
Land
| | Improvements/
building
| | Land and
Improvements
| | Buildings and
Improvements
| | Total | | Final
Accum
| | Date of
Construction
| | Date
Acquired
| |
|
| | | | | | | | | | | | | | | | | | | | | | | | | | | | | | | | | |
| | Brunswick, GA | | (a) | | 774 |
| | 614 |
| | — |
| | — |
| | 774 |
| | 614 |
| | 1,388 |
| | (371 | ) | | 1999 | | 09/24/04 | | 15 to 20 Years |
| | Bryan, TX | | (c) | | 441 |
| | 766 |
| | — |
| | — |
| | 441 |
| | 766 |
| | 1,207 |
| | (90 | ) | | 1972 | | 07/17/13 | | 10 to 35 Years |
| | Buckhannon, WV | | (a) | | 438 |
| | 529 |
| | — |
| | — |
| | 438 |
| | 529 |
| | 967 |
| | (142 | ) | | 1978 | | 12/21/12 | | 15 to 20 Years |
| | Buffalo, NY | | (a) | | 737 |
| | 629 |
| | — |
| | — |
| | 737 |
| | 629 |
| | 1,366 |
| | (244 | ) | | 1993 | | 11/10/05 | | 15 to 30 Years |
| | Buffalo, NY | | (a) | | 821 |
| | 694 |
| | — |
| | — |
| | 821 |
| | 694 |
| | 1,515 |
| | (273 | ) | | 1976 | | 11/10/05 | | 15 to 30 Years |
| | Calhoun, GA | | (a) | | 503 |
| | 713 |
| | — |
| | — |
| | 503 |
| | 713 |
| | 1,216 |
| | (149 | ) | | 1988 | | 02/02/12 | | 15 to 30 Years |
| | Canton, OH | | (a) | | 215 |
| | 483 |
| | — |
| | — |
| | 215 |
| | 483 |
| | 698 |
| | (251 | ) | | 1974 | | 05/25/05 | | 15 to 20 Years |
| | Carrollton, GA | | (a) | | 508 |
| | 603 |
| | — |
| | — |
| | 508 |
| | 603 |
| | 1,111 |
| | (233 | ) | | 2000 | | 02/28/06 | | 15 to 40 Years |
| | Carrollton, GA | | (a) | | 613 |
| | 503 |
| | — |
| | — |
| | 613 |
| | 503 |
| | 1,116 |
| | (144 | ) | | 1988 | | 02/02/12 | | 15 to 20 Years |
| | Carrollton, KY | | (a) | | 229 |
| | 730 |
| | — |
| | — |
| | 229 |
| | 730 |
| | 959 |
| | (294 | ) | | 1990 | | 06/30/09 | | 13 to 28 Years |
| | Carrolton, TX | | (c) | | 361 |
| | 415 |
| | — |
| | — |
| | 361 |
| | 415 |
| | 776 |
| | (99 | ) | | 1997 | | 07/17/13 | | 11 to 25 Years |
| | Cartersville, GA | | (a) | | 581 |
| | 730 |
| | — |
| | — |
| | 581 |
| | 730 |
| | 1,311 |
| | (343 | ) | | 1997 | | 02/28/06 | | 15 to 30 Years |
| | Cartersville, GA | | (a) | | 439 |
| | 451 |
| | — |
| | — |
| | 439 |
| | 451 |
| | 890 |
| | (252 | ) | | 1990 | | 02/28/06 | | 15 to 30 Years |
| | Cedar Hill, TX | | (a) | | 620 |
| | 501 |
| | — |
| | — |
| | 620 |
| | 501 |
| | 1,121 |
| | (274 | ) | | 2005 | | 12/29/06 | | 15 to 30 Years |
| | Celina, TX | | (c) | | 411 |
| | 199 |
| | — |
| | — |
| | 411 |
| | 199 |
| | 610 |
| | (12 | ) | | 2003 | | 07/25/16 | | 13 to 20 Years |
| | Champlin, MN | | (c) | | 710 |
| | 408 |
| | — |
| | — |
| | 710 |
| | 408 |
| | 1,118 |
| | (61 | ) | | 2004 | | 03/20/15 | | 8 to 20 Years |
| | Chattanooga, TN | | (a) | | 482 |
| | 682 |
| | — |
| | — |
| | 482 |
| | 682 |
| | 1,164 |
| | (327 | ) | | 1997 | | 06/25/04 | | 15 to 30 Years |
| | Chattanooga, TN | | (a) | | 600 |
| | 389 |
| | — |
| | — |
| | 600 |
| | 389 |
| | 989 |
| | (176 | ) | | 1995 | | 09/29/06 | | 15 to 30 Years |
| | Chattanooga, TN | | (c) | | 175 |
| | 271 |
| | — |
| | — |
| | 175 |
| | 271 |
| | 446 |
| | (59 | ) | | 2007 | | 07/17/13 | | 3 to 26 Years |
| | Cheektowaga, NY | | (a) | | 561 |
| | 549 |
| | — |
| | — |
| | 561 |
| | 549 |
| | 1,110 |
| | (231 | ) | | 1985 | | 11/10/05 | | 15 to 30 Years |
| | Chicago, IL | | (a) | | 313 |
| | 275 |
| | — |
| | — |
| | 313 |
| | 275 |
| | 588 |
| | (154 | ) | | 1982 | | 05/25/05 | | 15 to 20 Years |
| | Chicago, IL | | (a) | | 340 |
| | 220 |
| | — |
| | — |
| | 340 |
| | 220 |
| | 560 |
| | (144 | ) | | 1975 | | 05/25/05 | | 15 to 20 Years |
| | Chicago, IL | | (a) | | 242 |
| | 244 |
| | — |
| | — |
| | 242 |
| | 244 |
| | 486 |
| | (158 | ) | | 1970 | | 05/25/05 | | 15 to 20 Years |
| | Chicago, IL | | (a) | | 242 |
| | 256 |
| | — |
| | — |
| | 242 |
| | 256 |
| | 498 |
| | (151 | ) | | 1974 | | 05/25/05 | | 15 to 20 Years |
| | Chicago, IL | | (a) | | 532 |
| | 279 |
| | — |
| | — |
| | 532 |
| | 279 |
| | 811 |
| | (167 | ) | | 1982 | | 05/25/05 | | 15 to 20 Years |
| | Chicago, IL | | (a) | | 289 |
| | 260 |
| | — |
| | — |
| | 289 |
| | 260 |
| | 549 |
| | (150 | ) | | 1982 | | 05/25/05 | | 15 to 20 Years |
| | Chicago, IL | | (a) | | 976 |
| | 271 |
| | — |
| | — |
| | 976 |
| | 271 |
| | 1,247 |
| | (309 | ) | | 1987 | | 09/23/05 | | 10 to 15 Years |
| | Christiansburg, VA | | (a) | | 666 |
| | 168 |
| | — |
| | — |
| | 666 |
| | 168 |
| | 834 |
| | (279 | ) | | 1994 | | 07/01/05 | | 15 to 20 Years |
| | Claremore, OK | | (c) | | 903 |
| | 932 |
| | — |
| | — |
| | 903 |
| | 932 |
| | 1,835 |
| | (23 | ) | | 1985 | | 06/30/16 | | 5 to 30 Years |
| | Cleburne, TX | | (c) | | 129 |
| | 482 |
| | — |
| | — |
| | 129 |
| | 482 |
| | 611 |
| | (92 | ) | | 1997 | | 07/17/13 | | 9 to 25 Years |
| | Cleveland, TN | | (a) | | 501 |
| | 459 |
| | — |
| | — |
| | 501 |
| | 459 |
| | 960 |
| | (185 | ) | | 2004 | | 12/29/06 | | 15 to 40 Years |
| | College Park, GA | | (c) | | 839 |
| | 1,439 |
| | — |
| | — |
| | 839 |
| | 1,439 |
| | 2,278 |
| | (91 | ) | | 2007 | | 07/01/15 | | 15 to 30 Years |
| | Collierville, TN | | (a) | | 539 |
| | — |
| | — |
| | — |
| | 539 |
| | — |
| | 539 |
| | — |
| | (f) | | 10/30/13 | | (f) |
|
| | | | | | | | | | | | | | | | | | | | | | | | | | | | | | | | | |
| Church's Chicken | North Little Rock, AR | | (d) | | 128 |
| | 351 |
| | — |
| | — |
| | 128 |
| | 351 |
| | 479 |
| | (85 | ) | | 1999 | | 07/17/13 | | 10 to 28 Years |
| Church's Chicken | Pine Bluff, AR | | (d) | | 854 |
| | 431 |
| | — |
| | — |
| | 854 |
| | 431 |
| | 1,285 |
| | (75 | ) | | 1971 | | 07/17/13 | | 7 to 35 Years |
| Church's Chicken | Nogales, AZ | | (d) | | 207 |
| | 448 |
| | — |
| | — |
| | 207 |
| | 448 |
| | 655 |
| | (111 | ) | | 1976 | | 07/17/13 | | 11 to 25 Years |
| Church's Chicken | Phoenix, AZ | | (d) | | 523 |
| | 97 |
| | — |
| | — |
| | 523 |
| | 97 |
| | 620 |
| | (60 | ) | | 1976 | | 07/17/13 | | 9 to 16 Years |
| Church's Chicken | Phoenix, AZ | | (d) | | 321 |
| | 276 |
| | — |
| | — |
| | 321 |
| | 276 |
| | 597 |
| | (96 | ) | | 1975 | | 07/17/13 | | 10 to 20 Years |
| Church's Chicken | Phoenix, AZ | | (d) | | 384 |
| | 528 |
| | — |
| | — |
| | 384 |
| | 528 |
| | 912 |
| | (117 | ) | | 1974 | | 07/17/13 | | 11 to 27 Years |
| Church's Chicken | Phoenix, AZ | | (d) | | 368 |
| | 267 |
| | — |
| | — |
| | 368 |
| | 267 |
| | 635 |
| | (72 | ) | | 1974 | | 07/17/13 | | 11 to 23 Years |
| Church's Chicken | Phoenix, AZ | | (d) | | 415 |
| | 403 |
| | — |
| | — |
| | 415 |
| | 403 |
| | 818 |
| | (89 | ) | | 1975 | | 07/17/13 | | 8 to 27 Years |
| Church's Chicken | Phoenix, AZ | | (d) | | 599 |
| | 412 |
| | — |
| | — |
| | 599 |
| | 412 |
| | 1,011 |
| | (87 | ) | | 1980 | | 07/17/13 | | 10 to 35 Years |
| Church's Chicken | Phoenix, AZ | | (d) | | 400 |
| | 120 |
| | — |
| | — |
| | 400 |
| | 120 |
| | 520 |
| | (65 | ) | | 1977 | | 07/17/13 | | 11 to 13 Years |
| Church's Chicken | Oro Valley, AZ | | (d) | | 262 |
| | 193 |
| | — |
| | — |
| | 262 |
| | 193 |
| | 455 |
| | (79 | ) | | 1983 | | 07/17/13 | | 11 to 23 Years |
| Church's Chicken | Tucson, AZ | | (d) | | 191 |
| | 552 |
| | — |
| | — |
| | 191 |
| | 552 |
| | 743 |
| | (93 | ) | | 1981 | | 07/17/13 | | 11 to 35 Years |
| Church's Chicken | Tucson, AZ | | (d) | | 349 |
| | 479 |
| | — |
| | — |
| | 349 |
| | 479 |
| | 828 |
| | (93 | ) | | 1976 | | 07/17/13 | | 11 to 35 Years |
| Church's Chicken | Tucson, AZ | | (d) | | 221 |
| | 434 |
| | — |
| | — |
| | 221 |
| | 434 |
| | 655 |
| | (94 | ) | | 1980 | | 07/17/13 | | 11 to 27 Years |
| Church's Chicken | Americus, GA | | (d) | | 282 |
| | 406 |
| | — |
| | — |
| | 282 |
| | 406 |
| | 688 |
| | (127 | ) | | 1978 | | 07/17/13 | | 11 to 23 Years |
| Church's Chicken | Atlanta, GA | | (d) | | 336 |
| | 346 |
| | — |
| | — |
| | 336 |
| | 346 |
| | 682 |
| | (132 | ) | | 1981 | | 07/17/13 | | 11 to 22 Years |
| Church's Chicken | Atlanta, GA | | (d) | | 554 |
| | 258 |
| | — |
| | — |
| | 554 |
| | 258 |
| | 812 |
| | (109 | ) | | 1980 | | 07/17/13 | | 11 to 23 Years |
| Church's Chicken | Atlanta, GA | | (d) | | 683 |
| | 5 |
| | — |
| | — |
| | 683 |
| | 5 |
| | 688 |
| | (63 | ) | | 1975 | | 07/17/13 | | 11 to 23 Years |
| Church's Chicken | Atlanta, GA | | (d) | | 394 |
| | 268 |
| | — |
| | — |
| | 394 |
| | 268 |
| | 662 |
| | (136 | ) | | 1975 | | 07/17/13 | | 11 to 16 Years |
| Church's Chicken | Columbus, GA | | (d) | | 640 |
| | 403 |
| | — |
| | — |
| | 640 |
| | 403 |
| | 1,043 |
| | (131 | ) | | 1983 | | 07/17/13 | | 11 to 23 Years |
| Church's Chicken | Columbus, GA | | (d) | | 342 |
| | 49 |
| | — |
| | — |
| | 342 |
| | 49 |
| | 391 |
| | (69 | ) | | 1978 | | 07/17/13 | | 9 to 23 Years |
| Church's Chicken | Cordele, GA | | (d) | | 459 |
| | 181 |
| | — |
| | — |
| | 459 |
| | 181 |
| | 640 |
| | (68 | ) | | 1980 | | 07/17/13 | | 11 to 35 Years |
| Church's Chicken | Decatur, GA | | (d) | | 459 |
| | 133 |
| | — |
| | — |
| | 459 |
| | 133 |
| | 592 |
| | (70 | ) | | 1974 | | 07/17/13 | | 11 to 20 Years |
| Church's Chicken | Decatur, GA | | (d) | | 566 |
| | 49 |
| | — |
| | — |
| | 566 |
| | 49 |
| | 615 |
| | (100 | ) | | 1979 | | 07/17/13 | | 3 to 11 Years |
| Church's Chicken | Decatur, GA | | (d) | | 570 |
| | 30 |
| | — |
| | — |
| | 570 |
| | 30 |
| | 600 |
| | (61 | ) | | 1981 | | 07/17/13 | | 7 to 25 Years |
| Church's Chicken | East Point, GA | | (d) | | 429 |
| | 245 |
| | — |
| | — |
| | 429 |
| | 245 |
| | 674 |
| | (125 | ) | | 1977 | | 07/17/13 | | 11 to 19 Years |
| Church's Chicken | Fort Valley, GA | | (d) | | 353 |
| | 379 |
| | — |
| | — |
| | 353 |
| | 379 |
| | 732 |
| | (137 | ) | | 1985 | | 07/17/13 | | 11 to 23 Years |
| Church's Chicken | Griffin, GA | | (d) | | 215 |
| | 492 |
| | — |
| | — |
| | 215 |
| | 492 |
| | 707 |
| | (126 | ) | | 1978 | | 07/17/13 | | 11 to 25 Years |
| Church's Chicken | LaGrange, GA | | (d) | | 555 |
| | 44 |
| | — |
| | — |
| | 555 |
| | 44 |
| | 599 |
| | (175 | ) | | 1978 | | 07/17/13 | | 7 to 30 Years |
SPIRIT REALTY CAPITAL, INC.
Schedule III Real Estate and
Accumulated Depreciation
(Amounts in thousands)
|
| | | | | | | | | | | | | | | | | | | | | | | | | |
| | | | | | Initial Cost to Company | | Cost Capitalized Subsequent to Acquisition including impairment | | Gross Amount at December 31, 2016 (d) 2017 (g) | | | | | | | | |
| Concept | City, State | | Encumbrances (e) | | Land and Improvements | | Buildings and Improvements | | Land and Improvements | | Buildings and Improvements | | Land and Improvements | | Buildings and Improvements | | Total | | Final Accumulated Depreciation | | Date of Construction | | Date Acquired | | Life in which depreciation in latest Statement of Operations is computed |
Description | | Encumbrances (e)
| | Land and
Improvements
| | Buildings and
Improvements
| | Improvements/
Land
| | Improvements/
building
| | Land and
Improvements
| | Buildings and
Improvements
| | Total | | Final
Accum
| | Date of
Construction
| | Date
Acquired
| |
|
| | | | | | | | | | | | | | | | | | | | | | | | | | | | | | | | | |
| | Columbia, MO | | (a) | | 339 |
| | 1,126 |
| | — |
| | — |
| | 339 |
| | 1,126 |
| | 1,465 |
| | (136 | ) | | 1985 | | 12/24/13 | | 15 to 30 Years |
| | Columbus, GA | | (c) | | 640 |
| | 403 |
| | — |
| | — |
| | 640 |
| | 403 |
| | 1,043 |
| | (101 | ) | | 1983 | | 07/17/13 | | 11 to 23 Years |
| | Columbus, GA | | (c) | | 342 |
| | 49 |
| | — |
| | — |
| | 342 |
| | 49 |
| | 391 |
| | (54 | ) | | 1978 | | 07/17/13 | | 9 to 23 Years |
| | Columbus, OH | | (a) | | 268 |
| | 354 |
| | — |
| | — |
| | 268 |
| | 354 |
| | 622 |
| | (217 | ) | | 1975 | | 05/25/05 | | 15 to 20 Years |
| | Columbus, OH | | (a) | | 294 |
| | 262 |
| | — |
| | — |
| | 294 |
| | 262 |
| | 556 |
| | (177 | ) | | 1976 | | 05/25/05 | | 15 to 20 Years |
| | Commerce, GA | | (a) | | 219 |
| | 797 |
| | — |
| | — |
| | 219 |
| | 797 |
| | 1,016 |
| | (104 | ) | | 1990 | | 12/24/13 | | 15 to 30 Years |
| | Concord, NC | | (a) | | 244 |
| | 310 |
| | — |
| | — |
| | 244 |
| | 310 |
| | 554 |
| | (46 | ) | | 1993 | | 09/17/13 | | 15 to 30 Years |
| | Concord, NC | | (a) | | 855 |
| | 348 |
| | — |
| | — |
| | 855 |
| | 348 |
| | 1,203 |
| | (66 | ) | | 2004 | | 09/17/13 | | 15 to 30 Years |
| | Copperas Cove, TX | | (c) | | 186 |
| | 249 |
| | — |
| | — |
| | 186 |
| | 249 |
| | 435 |
| | (54 | ) | | 1973 | | 07/17/13 | | 11 to 23 Years |
| | Cordele, GA | | (c) | | 459 |
| | 181 |
| | — |
| | — |
| | 459 |
| | 181 |
| | 640 |
| | (53 | ) | | 1980 | | 07/17/13 | | 11 to 35 Years |
| | Covington, GA | | (a) | | 526 |
| | 665 |
| | — |
| | — |
| | 526 |
| | 665 |
| | 1,191 |
| | (131 | ) | | 2001 | | 02/02/12 | | 15 to 30 Years |
| | Covington, TN | | (c) | | 343 |
| | 152 |
| | — |
| | — |
| | 343 |
| | 152 |
| | 495 |
| | (68 | ) | | 2007 | | 07/17/13 | | 3 to 24 Years |
| | Crawfordsville, IN | | (a) | | 557 |
| | 624 |
| | — |
| | — |
| | 557 |
| | 624 |
| | 1,181 |
| | (293 | ) | | 1998 | | 09/23/05 | | 15 to 30 Years |
| | Creedmoor, NC | | (a) | | 451 |
| | 367 |
| | — |
| | — |
| | 451 |
| | 367 |
| | 818 |
| | (80 | ) | | 2006 | | 09/17/13 | | 15 to 30 Years |
| | Crossville, TN | | (a) | | 353 |
| | 382 |
| | — |
| | — |
| | 353 |
| | 382 |
| | 735 |
| | (117 | ) | | 1977 | | 09/01/05 | | 15 to 40 Years |
| | Cumming, GA | | (a) | | 967 |
| | 844 |
| | — |
| | — |
| | 967 |
| | 844 |
| | 1,811 |
| | (409 | ) | | 1986 | | 09/24/04 | | 15 to 30 Years |
| | Cumming, GA | | (a) | | 408 |
| | 827 |
| | — |
| | — |
| | 408 |
| | 827 |
| | 1,235 |
| | (113 | ) | | 1988 | | 12/24/13 | | 15 to 30 Years |
| | Dallas, TX | | (c) | | 88 |
| | 215 |
| | — |
| | — |
| | 88 |
| | 215 |
| | 303 |
| | (60 | ) | | 1980 | | 07/17/13 | | 9 to 19 Years |
| | Dallas, TX | | (c) | | 249 |
| | 431 |
| | — |
| | — |
| | 249 |
| | 431 |
| | 680 |
| | (63 | ) | | 1985 | | 07/17/13 | | 9 to 33 Years |
| | Dallas, TX | | (c) | | 164 |
| | 431 |
| | — |
| | — |
| | 164 |
| | 431 |
| | 595 |
| | (99 | ) | | 1968 | | 07/17/13 | | 10 to 18 Years |
| | Dallas, TX | | (c) | | 174 |
| | 450 |
| | — |
| | — |
| | 174 |
| | 450 |
| | 624 |
| | (83 | ) | | 1969 | | 07/17/13 | | 10 to 26 Years |
| | Dallas, TX | | (c) | | 236 |
| | 339 |
| | — |
| | — |
| | 236 |
| | 339 |
| | 575 |
| | (68 | ) | | 1971 | | 07/17/13 | | 10 to 23 Years |
| | Dallas, TX | | (c) | | 315 |
| | 209 |
| | — |
| | — |
| | 315 |
| | 209 |
| | 524 |
| | (49 | ) | | 1999 | | 07/17/13 | | 10 to 25 Years |
| | Dallas, TX | | (c) | | 392 |
| | 501 |
| | — |
| | — |
| | 392 |
| | 501 |
| | 893 |
| | (84 | ) | | 1985 | | 07/17/13 | | 11 to 30 Years |
| | Dallas, TX | | (c) | | 526 |
| | 203 |
| | — |
| | — |
| | 526 |
| | 203 |
| | 729 |
| | (14 | ) | | 1987 | | 06/30/16 | | 5 to 10 Years |
| | Danville, IL | | (a) | | 619 |
| | 672 |
| | — |
| | — |
| | 619 |
| | 672 |
| | 1,291 |
| | (349 | ) | | 1995 | | 12/29/06 | | 15 to 30 Years |
| | Davenport, IA | | (a) | | 441 |
| | 646 |
| | — |
| | — |
| | 441 |
| | 646 |
| | 1,087 |
| | (165 | ) | | 2002 | | 10/03/11 | | 15 to 30 Years |
| | Dayton, OH | | (a) | | 526 |
| | 598 |
| | — |
| | — |
| | 526 |
| | 598 |
| | 1,124 |
| | (359 | ) | | 1982 | | 12/08/09 | | 12 to 17 Years |
| | Dayton, OH | | (c) | | 467 |
| | 237 |
| | — |
| | — |
| | 467 |
| | 237 |
| | 704 |
| | (21 | ) | | 1984 | | 08/21/15 | | 15 to 20 Years |
| | Decatur, GA | | (a) | | 677 |
| | 539 |
| | — |
| | — |
| | 677 |
| | 539 |
| | 1,216 |
| | (109 | ) | | 1989 | | 02/02/12 | | 15 to 30 Years |
| | Decatur, GA | | (c) | | 459 |
| | 133 |
| | — |
| | — |
| | 459 |
| | 133 |
| | 592 |
| | (54 | ) | | 1974 | | 07/17/13 | | 11 to 20 Years |
| | Decatur, GA | | (c) | | 566 |
| | 49 |
| | — |
| | — |
| | 566 |
| | 49 |
| | 615 |
| | (89 | ) | | 1979 | | 07/17/13 | | 3 to 11 Years |
| | Decatur, GA | | (c) | | 554 |
| | 49 |
| | — |
| | — |
| | 554 |
| | 49 |
| | 603 |
| | (49 | ) | | 1977 | | 07/17/13 | | 7 to 25 Years |
| | Decatur, GA | | (c) | | 570 |
| | 30 |
| | — |
| | — |
| | 570 |
| | 30 |
| | 600 |
| | (47 | ) | | 1981 | | 07/17/13 | | 7 to 25 Years |
| | Decatur, IL | | (a) | | 940 |
| | 126 |
| | — |
| | — |
| | 940 |
| | 126 |
| | 1,066 |
| | (344 | ) | | 1992 | | 09/23/05 | | 15 to 20 Years |
|
| | | | | | | | | | | | | | | | | | | | | | | | | | | | | | | | | |
| Church's Chicken | Macon, GA | | (d) | | 291 |
| | 628 |
| | — |
| | — |
| | 291 |
| | 628 |
| | 919 |
| | (110 | ) | | 1983 | | 07/17/13 | | 10 to 35 Years |
| Church's Chicken | Macon, GA | | (d) | | 185 |
| | 553 |
| | — |
| | — |
| | 185 |
| | 553 |
| | 738 |
| | (115 | ) | | 1980 | | 07/17/13 | | 11 to 30 Years |
| Church's Chicken | Marietta, GA | | (d) | | 350 |
| | 173 |
| | — |
| | — |
| | 350 |
| | 173 |
| | 523 |
| | (86 | ) | | 1976 | | 07/17/13 | | 11 to 20 Years |
| Church's Chicken | Kansas City, MO | | (d) | | 312 |
| | 574 |
| | — |
| | — |
| | 312 |
| | 574 |
| | 886 |
| | (117 | ) | | 1996 | | 07/17/13 | | 10 to 30 Years |
| Church's Chicken | Kansas City, MO | | (d) | | 348 |
| | 730 |
| | — |
| | — |
| | 348 |
| | 730 |
| | 1,078 |
| | (131 | ) | | 1996 | | 07/17/13 | | 10 to 35 Years |
| Church's Chicken | Kansas City, MO | | (d) | | 462 |
| | 673 |
| | — |
| | — |
| | 462 |
| | 673 |
| | 1,135 |
| | (123 | ) | | 1996 | | 07/17/13 | | 10 to 35 Years |
| Church's Chicken | Kansas City, MO | | (d) | | 135 |
| | 616 |
| | — |
| | — |
| | 135 |
| | 616 |
| | 751 |
| | (137 | ) | | 1996 | | 07/17/13 | | 10 to 25 Years |
| Church's Chicken | Kansas City, MO | | (d) | | 310 |
| | 580 |
| | — |
| | — |
| | 310 |
| | 580 |
| | 890 |
| | (118 | ) | | 1996 | | 07/17/13 | | 10 to 31 Years |
| Church's Chicken | Kansas City, MO | | (d) | | 189 |
| | 837 |
| | — |
| | — |
| | 189 |
| | 837 |
| | 1,026 |
| | (186 | ) | | 1996 | | 07/17/13 | | 9 to 25 Years |
| Church's Chicken | Fort Worth, TX | | (d) | | 157 |
| | 263 |
| | — |
| | — |
| | 157 |
| | 263 |
| | 420 |
| | (92 | ) | | 1965 | | 07/17/13 | | 11 to 20 Years |
| Church's Chicken | Gulfport, MS | | (d) | | 540 |
| | 429 |
| | — |
| | — |
| | 540 |
| | 429 |
| | 969 |
| | (73 | ) | | 1971 | | 07/17/13 | | 11 to 35 Years |
| Church's Chicken | Jackson, MS | | (d) | | 215 |
| | 476 |
| | — |
| | — |
| | 215 |
| | 476 |
| | 691 |
| | (114 | ) | | 1977 | | 07/17/13 | | 11 to 25 Years |
| Church's Chicken | Jackson, MS | | (d) | | 996 |
| | 610 |
| | — |
| | — |
| | 996 |
| | 610 |
| | 1,606 |
| | (125 | ) | | 1978 | | 07/17/13 | | 11 to 35 Years |
| Church's Chicken | Jackson, MS | | (d) | | 195 |
| | 582 |
| | — |
| | — |
| | 195 |
| | 582 |
| | 777 |
| | (115 | ) | | 2000 | | 07/17/13 | | 11 to 30 Years |
| Church's Chicken | Jackson, MS | | (d) | | 447 |
| | 555 |
| | — |
| | — |
| | 447 |
| | 555 |
| | 1,002 |
| | (123 | ) | | 1998 | | 07/17/13 | | 11 to 35 Years |
| Church's Chicken | Laurel, MS | | (d) | | 690 |
| | 290 |
| | — |
| | — |
| | 690 |
| | 290 |
| | 980 |
| | (96 | ) | | 1971 | | 07/17/13 | | 11 to 24 Years |
| Church's Chicken | Vicksburg, MS | | (d) | | 278 |
| | 333 |
| | — |
| | — |
| | 278 |
| | 333 |
| | 611 |
| | (99 | ) | | 1972 | | 07/17/13 | | 11 to 25 Years |
| Church's Chicken | Albuquerque, NM | | (d) | | 265 |
| | 575 |
| | — |
| | — |
| | 265 |
| | 575 |
| | 840 |
| | (156 | ) | | 1980 | | 07/17/13 | | 11 to 26 Years |
| Church's Chicken | Albuquerque, NM | | (d) | | 466 |
| | 591 |
| | — |
| | — |
| | 466 |
| | 591 |
| | 1,057 |
| | (121 | ) | | 1976 | | 07/17/13 | | 11 to 35 Years |
| Church's Chicken | Albuquerque, NM | | (d) | | 267 |
| | 439 |
| | — |
| | — |
| | 267 |
| | 439 |
| | 706 |
| | (135 | ) | | 1975 | | 07/17/13 | | 11 to 25 Years |
| Church's Chicken | Albuquerque, NM | | (d) | | 293 |
| | 300 |
| | — |
| | — |
| | 293 |
| | 300 |
| | 593 |
| | (114 | ) | | 1976 | | 07/17/13 | | 11 to 25 Years |
| Church's Chicken | Hobbs, NM | | (d) | | 706 |
| | 534 |
| | — |
| | — |
| | 706 |
| | 534 |
| | 1,240 |
| | (117 | ) | | 1974 | | 07/17/13 | | 11 to 35 Years |
| Church's Chicken | Roswell, NM | | (d) | | 343 |
| | 321 |
| | — |
| | — |
| | 343 |
| | 321 |
| | 664 |
| | (123 | ) | | 1974 | | 07/17/13 | | 11 to 23 Years |
| Church's Chicken | Altus, OK | | (d) | | 70 |
| | 413 |
| | — |
| | — |
| | 70 |
| | 413 |
| | 483 |
| | (97 | ) | | 1980 | | 07/17/13 | | 7 to 25 Years |
| Church's Chicken | Oklahoma City, OK | | (d) | | 223 |
| | 469 |
| | — |
| | — |
| | 223 |
| | 469 |
| | 692 |
| | (142 | ) | | 1998 | | 07/17/13 | | 8 to 22 Years |
| Church's Chicken | Midwest City, OK | | (d) | | 318 |
| | 623 |
| | — |
| | — |
| | 318 |
| | 623 |
| | 941 |
| | (112 | ) | | 1985 | | 07/17/13 | | 9 to 35 Years |
| Church's Chicken | Oklahoma City, OK | | (d) | | 200 |
| | 428 |
| | — |
| | — |
| | 200 |
| | 428 |
| | 628 |
| | (109 | ) | | 1971 | | 07/17/13 | | 9 to 25 Years |
| Church's Chicken | Tulsa, OK | | (d) | | 767 |
| | 466 |
| | — |
| | — |
| | 767 |
| | 466 |
| | 1,233 |
| | (96 | ) | | 1976 | | 07/17/13 | | 8 to 35 Years |
| Church's Chicken | Tulsa, OK | | (d) | | 315 |
| | 717 |
| | — |
| | — |
| | 315 |
| | 717 |
| | 1,032 |
| | (123 | ) | | 1976 | | 07/17/13 | | 10 to 35 Years |
| Church's Chicken | The Village, OK | | (d) | | 211 |
| | 650 |
| | — |
| | — |
| | 211 |
| | 650 |
| | 861 |
| | (108 | ) | | 1978 | | 07/17/13 | | 9 to 35 Years |
SPIRIT REALTY CAPITAL, INC.
Schedule III Real Estate and
Accumulated Depreciation
(Amounts in thousands)
|
| | | | | | | | | | | | | | | | | | | | | | | | | |
| | | | | | Initial Cost to Company | | Cost Capitalized Subsequent to Acquisition including impairment | | Gross Amount at December 31, 2016 (d) 2017 (g) | | | | | | | | |
| Concept | City, State | | Encumbrances (e) | | Land and Improvements | | Buildings and Improvements | | Land and Improvements | | Buildings and Improvements | | Land and Improvements | | Buildings and Improvements | | Total | | Final Accumulated Depreciation | | Date of Construction | | Date Acquired | | Life in which depreciation in latest Statement of Operations is computed |
Description | | Encumbrances (e)
| | Land and
Improvements
| | Buildings and
Improvements
| | Improvements/
Land
| | Improvements/
building
| | Land and
Improvements
| | Buildings and
Improvements
| | Total | | Final
Accum
| | Date of
Construction
| | Date
Acquired
| |
|
| | | | | | | | | | | | | | | | | | | | | | | | | | | | | | | | | |
| | Deerfield Beach, FL | | (a) | | 668 |
| | 295 |
| | — |
| | — |
| | 668 |
| | 295 |
| | 963 |
| | (160 | ) | | 1970 | | 09/24/04 | | 15 to 30 Years |
| | Denham Springs, LA | | (a) | | 419 |
| | 594 |
| | — |
| | — |
| | 419 |
| | 594 |
| | 1,013 |
| | (363 | ) | | 1983 | | 09/24/04 | | 15 to 20 Years |
| | Denton, TX | | (c) | | 693 |
| | 884 |
| | — |
| | — |
| | 693 |
| | 884 |
| | 1,577 |
| | (22 | ) | | 1995 | | 06/30/16 | | 5 to 30 Years |
| | Detroit, MI | | (a) | | 425 |
| | 200 |
| | — |
| | — |
| | 425 |
| | 200 |
| | 625 |
| | (139 | ) | | 1977 | | 05/25/05 | | 15 to 20 Years |
| | Detroit, MI | | (a) | | 351 |
| | 209 |
| | — |
| | — |
| | 351 |
| | 209 |
| | 560 |
| | (140 | ) | | 1977 | | 05/25/05 | | 15 to 20 Years |
| | Detroit, MI | | (a) | | 426 |
| | 223 |
| | — |
| | — |
| | 426 |
| | 223 |
| | 649 |
| | (155 | ) | | 1979 | | 05/25/05 | | 15 to 20 Years |
| | Detroit, MI | | (a) | | 413 |
| | 235 |
| | — |
| | — |
| | 413 |
| | 235 |
| | 648 |
| | (157 | ) | | 1977 | | 05/25/05 | | 15 to 20 Years |
| | Detroit, MI | | (a) | | 301 |
| | 219 |
| | — |
| | — |
| | 301 |
| | 219 |
| | 520 |
| | (141 | ) | | 1972 | | 05/25/05 | | 15 to 20 Years |
| | Detroit, MI | | (a) | | 270 |
| | 305 |
| | — |
| | — |
| | 270 |
| | 305 |
| | 575 |
| | (171 | ) | | 1976 | | 05/25/05 | | 15 to 20 Years |
| | Detroit, MI | | (a) | | 271 |
| | 157 |
| | — |
| | — |
| | 271 |
| | 157 |
| | 428 |
| | (108 | ) | | 1978 | | 05/25/05 | | 15 to 20 Years |
| | Detroit, MI | | (a) | | 385 |
| | 258 |
| | — |
| | — |
| | 385 |
| | 258 |
| | 643 |
| | (176 | ) | | 1979 | | 05/25/05 | | 15 to 20 Years |
| | Detroit, MI | | (a) | | 428 |
| | 189 |
| | — |
| | — |
| | 428 |
| | 189 |
| | 617 |
| | (130 | ) | | 1979 | | 05/25/05 | | 15 to 20 Years |
| | Detroit, MI | | (a) | | 614 |
| | 688 |
| | — |
| | — |
| | 614 |
| | 688 |
| | 1,302 |
| | (421 | ) | | 1987 | | 02/13/09 | | 13 to 18 Years |
| | D'Iberville, MS | | (a) | | 597 |
| | 995 |
| | — |
| | — |
| | 597 |
| | 995 |
| | 1,592 |
| | (106 | ) | | 2005 | | 07/14/14 | | 15 to 30 Years |
| | Donna, TX | | (c) | | 1,091 |
| | 540 |
| | — |
| | — |
| | 1,091 |
| | 540 |
| | 1,631 |
| | (80 | ) | | 1984 | | 07/17/13 | | 10 to 35 Years |
| | Douglasville, GA | | (a) | | 712 |
| | 669 |
| | — |
| | — |
| | 712 |
| | 669 |
| | 1,381 |
| | (249 | ) | | 2003 | | 02/28/06 | | 15 to 40 Years |
| | Douglasville, GA | | (a) | | 764 |
| | 941 |
| | — |
| | — |
| | 764 |
| | 941 |
| | 1,705 |
| | (387 | ) | | 1990 | | 02/28/06 | | 15 to 30 Years |
| | Douglasville, GA | | (a) | | 127 |
| | — |
| | — |
| | — |
| | 127 |
| | — |
| | 127 |
| | — |
| | (f) | | 11/14/14 | | (f) |
| | Durham, NC | | (a) | | 1,253 |
| | — |
| | — |
| | — |
| | 1,253 |
| | — |
| | 1,253 |
| | — |
| | (f) | | 07/17/13 | | (f) |
| | Eagle Pass, TX | | (c) | | 597 |
| | 385 |
| | — |
| | — |
| | 597 |
| | 385 |
| | 982 |
| | (65 | ) | | 1977 | | 07/17/13 | | 9 to 35 Years |
| | East Aurora, NY | | (a) | | 424 |
| | 584 |
| | (129 | ) | | (329 | ) | | 295 |
| | 255 |
| | 550 |
| | — |
| | 1982 | | 11/10/05 | | 15 to 20 Years |
| | East Ellijay, GA | | (a) | | 562 |
| | 354 |
| | — |
| | — |
| | 562 |
| | 354 |
| | 916 |
| | (244 | ) | | 1984 | | 12/29/05 | | 15 to 20 Years |
| | East Point, GA | | (c) | | 429 |
| | 245 |
| | — |
| | — |
| | 429 |
| | 245 |
| | 674 |
| | (97 | ) | | 1977 | | 07/17/13 | | 11 to 19 Years |
| | East St. Louis, IL | | (a) | | 117 |
| | 334 |
| | — |
| | — |
| | 117 |
| | 334 |
| | 451 |
| | (143 | ) | | 1990 | | 05/25/05 | | 15 to 30 Years |
| | Edinburg, TX | | (c) | | 624 |
| | 888 |
| | — |
| | — |
| | 624 |
| | 888 |
| | 1,512 |
| | (115 | ) | | 1985 | | 07/17/13 | | 11 to 35 Years |
| | Effingham, IL | | (a) | | 539 |
| | 575 |
| | — |
| | — |
| | 539 |
| | 575 |
| | 1,114 |
| | (280 | ) | | 1985 | | 09/23/05 | | 15 to 30 Years |
| | Elizabethton, TN | | (a) | | 655 |
| | 129 |
| | — |
| | — |
| | 655 |
| | 129 |
| | 784 |
| | (226 | ) | | 1993 | | 07/01/05 | | 15 to 20 Years |
| | Elizabethton, TN | | (a) | | 735 |
| | 278 |
| | — |
| | — |
| | 735 |
| | 278 |
| | 1,013 |
| | (101 | ) | | 1971 | | 12/21/12 | | 15 to 20 Years |
| | Elmwood Park, IL | | (a) | | 650 |
| | 380 |
| | — |
| | — |
| | 650 |
| | 380 |
| | 1,030 |
| | (228 | ) | | 1993 | | 09/23/05 | | 15 to 20 Years |
| | Elsa, TX | | (c) | | 1,159 |
| | 141 |
| | — |
| | — |
| | 1,159 |
| | 141 |
| | 1,300 |
| | (41 | ) | | 1984 | | 07/17/13 | | 11 to 35 Years |
| | Emporia, KS | | (a) | | 508 |
| | 1,175 |
| | — |
| | — |
| | 508 |
| | 1,175 |
| | 1,683 |
| | (153 | ) | | 1969 | | 12/24/13 | | 15 to 30 Years |
| | Englewood, OH | | (c) | | 235 |
| | 345 |
| | — |
| | — |
| | 235 |
| | 345 |
| | 580 |
| | (22 | ) | | 1988 | | 08/21/15 | | 15 to 30 Years |
| | Enid, OK | | (c) | | 40 |
| | 55 |
| | — |
| | — |
| | 40 |
| | 55 |
| | 95 |
| | (5 | ) | | 1985 | | 06/30/16 | | 9 to 10 Years |
| | Escanaba, MI | | (a) | | 772 |
| | 767 |
| | — |
| | 300 |
| | 772 |
| | 1,067 |
| | 1,839 |
| | (579 | ) | | 1984 | | 12/29/05 | | 3 to 20 Years |
|
| | | | | | | | | | | | | | | | | | | | | | | | | | | | | | | | | |
| Church's Chicken | Memphis, TN | | (d) | | 128 |
| | 232 |
| | — |
| | — |
| | 128 |
| | 232 |
| | 360 |
| | (78 | ) | | 1971 | | 07/17/13 | | 8 to 20 Years |
| Church's Chicken | Memphis, TN | | (d) | | 156 |
| | 351 |
| | — |
| | — |
| | 156 |
| | 351 |
| | 507 |
| | (98 | ) | | 1971 | | 07/17/13 | | 7 to 25 Years |
| Church's Chicken | Memphis, TN | | (d) | | 288 |
| | 278 |
| | — |
| | — |
| | 288 |
| | 278 |
| | 566 |
| | (115 | ) | | 1976 | | 07/17/13 | | 6 to 20 Years |
| Church's Chicken | Memphis, TN | | (d) | | 206 |
| | 471 |
| | — |
| | — |
| | 206 |
| | 471 |
| | 677 |
| | (115 | ) | | 1979 | | 07/17/13 | | 10 to 25 Years |
| Church's Chicken | Memphis, TN | | (d) | | 163 |
| | 295 |
| | — |
| | — |
| | 163 |
| | 295 |
| | 458 |
| | (84 | ) | | 1979 | | 07/17/13 | | 10 to 25 Years |
| Church's Chicken | Memphis, TN | | (d) | | 212 |
| | 245 |
| | — |
| | — |
| | 212 |
| | 245 |
| | 457 |
| | (97 | ) | | 1971 | | 07/17/13 | | 7 to 25 Years |
| Church's Chicken | Memphis, TN | | (d) | | 180 |
| | 316 |
| | — |
| | — |
| | 180 |
| | 316 |
| | 496 |
| | (98 | ) | | 1971 | | 07/17/13 | | 7 to 20 Years |
| Church's Chicken | Memphis, TN | | (d) | | 264 |
| | 592 |
| | — |
| | — |
| | 264 |
| | 592 |
| | 856 |
| | (115 | ) | | 1971 | | 07/17/13 | | 11 to 35 Years |
| Church's Chicken | Memphis, TN | | (d) | | 426 |
| | 608 |
| | — |
| | — |
| | 426 |
| | 608 |
| | 1,034 |
| | (129 | ) | | 1971 | | 07/17/13 | | 11 to 32 Years |
| Church's Chicken | Abilene, TX | | (d) | | 198 |
| | 311 |
| | — |
| | — |
| | 198 |
| | 311 |
| | 509 |
| | (78 | ) | | 1975 | | 07/17/13 | | 10 to 26 Years |
| Church's Chicken | Alamo, TX | | (d) | | 1,745 |
| | 715 |
| | — |
| | — |
| | 1,745 |
| | 715 |
| | 2,460 |
| | (113 | ) | | 1984 | | 07/17/13 | | 9 to 35 Years |
| Church's Chicken | Austin, TX | | (d) | | 531 |
| | 794 |
| | — |
| | — |
| | 531 |
| | 794 |
| | 1,325 |
| | (138 | ) | | 1967 | | 07/17/13 | | 11 to 32 Years |
| Church's Chicken | Austin, TX | | (d) | | 904 |
| | 477 |
| | — |
| | — |
| | 904 |
| | 477 |
| | 1,381 |
| | (88 | ) | | 1976 | | 07/17/13 | | 11 to 35 Years |
| Church's Chicken | Austin, TX | | (d) | | 418 |
| | 872 |
| | — |
| | — |
| | 418 |
| | 872 |
| | 1,290 |
| | (140 | ) | | 1986 | | 07/17/13 | | 11 to 35 Years |
| Church's Chicken | Austin, TX | | (d) | | 689 |
| | 634 |
| | — |
| | — |
| | 689 |
| | 634 |
| | 1,323 |
| | (139 | ) | | 2003 | | 07/17/13 | | 11 to 35 Years |
| Church's Chicken | Balch Springs, TX | | (d) | | 329 |
| | 576 |
| | — |
| | — |
| | 329 |
| | 576 |
| | 905 |
| | (147 | ) | | 1986 | | 07/17/13 | | 11 to 31 Years |
| Church's Chicken | Beeville, TX | | (d) | | 120 |
| | 488 |
| | — |
| | — |
| | 120 |
| | 488 |
| | 608 |
| | (123 | ) | | 1972 | | 07/17/13 | | 9 to 25 Years |
| Church's Chicken | Brownsville, TX | | (d) | | 795 |
| | 556 |
| | — |
| | — |
| | 795 |
| | 556 |
| | 1,351 |
| | (93 | ) | | 1977 | | 07/17/13 | | 10 to 35 Years |
| Church's Chicken | Brownsville, TX | | (d) | | 667 |
| | 785 |
| | — |
| | — |
| | 667 |
| | 785 |
| | 1,452 |
| | (129 | ) | | 1985 | | 07/17/13 | | 10 to 35 Years |
| Church's Chicken | Brownsville, TX | | (d) | | 369 |
| | 679 |
| | — |
| | — |
| | 369 |
| | 679 |
| | 1,048 |
| | (125 | ) | | 1972 | | 07/17/13 | | 11 to 35 Years |
| Church's Chicken | Brownsville, TX | | (d) | | 267 |
| | 652 |
| | — |
| | — |
| | 267 |
| | 652 |
| | 919 |
| | (105 | ) | | 2000 | | 07/17/13 | | 10 to 35 Years |
| Church's Chicken | Brownsville, TX | | (d) | | 430 |
| | 656 |
| | — |
| | — |
| | 430 |
| | 656 |
| | 1,086 |
| | (171 | ) | | 1985 | | 07/17/13 | | 11 to 29 Years |
| Church's Chicken | Brownsville, TX | | (d) | | 571 |
| | 930 |
| | — |
| | — |
| | 571 |
| | 930 |
| | 1,501 |
| | (181 | ) | | 2002 | | 07/17/13 | | 11 to 35 Years |
| Church's Chicken | Bryan, TX | | (d) | | 441 |
| | 766 |
| | — |
| | — |
| | 441 |
| | 766 |
| | 1,207 |
| | (116 | ) | | 1972 | | 07/17/13 | | 10 to 35 Years |
| Church's Chicken | Carrolton, TX | | (d) | | 361 |
| | 415 |
| | — |
| | — |
| | 361 |
| | 415 |
| | 776 |
| | (128 | ) | | 1997 | | 07/17/13 | | 11 to 25 Years |
| Church's Chicken | Cleburne, TX | | (d) | | 129 |
| | 482 |
| | — |
| | — |
| | 129 |
| | 482 |
| | 611 |
| | (119 | ) | | 1997 | | 07/17/13 | | 9 to 25 Years |
| Church's Chicken | Copperas Cove, TX | | (d) | | 186 |
| | 249 |
| | — |
| | — |
| | 186 |
| | 249 |
| | 435 |
| | (70 | ) | | 1973 | | 07/17/13 | | 11 to 23 Years |
| Church's Chicken | Dallas, TX | | (d) | | 88 |
| | 215 |
| | — |
| | — |
| | 88 |
| | 215 |
| | 303 |
| | (77 | ) | | 1980 | | 07/17/13 | | 9 to 19 Years |
| Church's Chicken | Dallas, TX | | (d) | | 249 |
| | 431 |
| | — |
| | — |
| | 249 |
| | 431 |
| | 680 |
| | (81 | ) | | 1985 | | 07/17/13 | | 9 to 33 Years |
| Church's Chicken | Dallas, TX | | (d) | | 164 |
| | 431 |
| | — |
| | — |
| | 164 |
| | 431 |
| | 595 |
| | (127 | ) | | 1968 | | 07/17/13 | | 10 to 18 Years |
SPIRIT REALTY CAPITAL, INC.
Schedule III Real Estate and
Accumulated Depreciation
(Amounts in thousands)
|
| | | | | | | | | | | | | | | | | | | | | | | | | |
| | | | | | Initial Cost to Company | | Cost Capitalized Subsequent to Acquisition including impairment | | Gross Amount at December 31, 2016 (d) 2017 (g) | | | | | | | | |
| Concept | City, State | | Encumbrances (e) | | Land and Improvements | | Buildings and Improvements | | Land and Improvements | | Buildings and Improvements | | Land and Improvements | | Buildings and Improvements | | Total | | Final Accumulated Depreciation | | Date of Construction | | Date Acquired | | Life in which depreciation in latest Statement of Operations is computed |
Description | | Encumbrances (e)
| | Land and
Improvements
| | Buildings and
Improvements
| | Improvements/
Land
| | Improvements/
building
| | Land and
Improvements
| | Buildings and
Improvements
| | Total | | Final
Accum
| | Date of
Construction
| | Date
Acquired
| |
|
| | | | | | | | | | | | | | | | | | | | | | | | | | | | | | | | | |
| | Euless, TX | | (c) | | 674 |
| | 277 |
| | — |
| | — |
| | 674 |
| | 277 |
| | 951 |
| | (14 | ) | | 1979 | | 06/30/16 | | 5 to 20 Years |
| | Eureka, IL | | (a) | | 307 |
| | 338 |
| | — |
| | — |
| | 307 |
| | 338 |
| | 645 |
| | (191 | ) | | 1980 | | 12/21/12 | | 10 to 15 Years |
| | Eustis, FL | | (a) | | 451 |
| | 377 |
| | — |
| | — |
| | 451 |
| | 377 |
| | 828 |
| | (412 | ) | | 1969 | | 12/30/04 | | 10 to 15 Years |
| | Fayetteville, AR | | (a) | | 1,019 |
| | 1,150 |
| | — |
| | — |
| | 1,019 |
| | 1,150 |
| | 2,169 |
| | (119 | ) | | 2014 | | 06/23/14 | | 15 to 40 Years |
| | Fayetteville, NC | | (a) | | 470 |
| | 629 |
| | — |
| | — |
| | 470 |
| | 629 |
| | 1,099 |
| | (282 | ) | | 1999 | | 09/29/06 | | 15 to 30 Years |
| | Fayetteville, NC | | (a) | | 489 |
| | 612 |
| | — |
| | — |
| | 489 |
| | 612 |
| | 1,101 |
| | (259 | ) | | 1987 | | 09/29/06 | | 15 to 30 Years |
| | Fayetteville, NC | | (a) | | 607 |
| | 1,020 |
| | — |
| | — |
| | 607 |
| | 1,020 |
| | 1,627 |
| | (490 | ) | | 1996 | | 09/29/06 | | 15 to 30 Years |
| | Ferguson, MO | | (a) | | 293 |
| | 212 |
| | — |
| | — |
| | 293 |
| | 212 |
| | 505 |
| | (148 | ) | | 1974 | | 05/25/05 | | 15 to 20 Years |
| | Flint, MI | | (a) | | 340 |
| | 258 |
| | — |
| | — |
| | 340 |
| | 258 |
| | 598 |
| | (174 | ) | | 1979 | | 05/25/05 | | 15 to 20 Years |
| | Florence, KY | | (a) | | 524 |
| | 209 |
| | — |
| | — |
| | 524 |
| | 209 |
| | 733 |
| | (167 | ) | | 1992 | | 09/24/04 | | 15 to 30 Years |
| | Floresville, TX | | (c) | | 109 |
| | 555 |
| | — |
| | — |
| | 109 |
| | 555 |
| | 664 |
| | (101 | ) | | 1985 | | 07/17/13 | | 9 to 25 Years |
| | Flowood, MS | | (a) | | 338 |
| | 848 |
| | — |
| | — |
| | 338 |
| | 848 |
| | 1,186 |
| | (84 | ) | | 1994 | | 07/31/14 | | 15 to 30 Years |
| | Floyd, GA | | (a) | | 973 |
| | 415 |
| | — |
| | — |
| | 973 |
| | 415 |
| | 1,388 |
| | (179 | ) | | 1993 | | 02/28/06 | | 15 to 30 Years |
| | Forest Hill, TX | | (c) | | 784 |
| | 294 |
| | — |
| | — |
| | 784 |
| | 294 |
| | 1,078 |
| | (17 | ) | | 1999 | | 06/30/16 | | 5 to 20 Years |
| | Forsyth, GA | | (a) | | 495 |
| | 1,007 |
| | — |
| | — |
| | 495 |
| | 1,007 |
| | 1,502 |
| | (423 | ) | | 1984 | | 01/12/06 | | 15 to 30 Years |
| | Forsythe, GA | | (a) | | 249 |
| | 936 |
| | — |
| | — |
| | 249 |
| | 936 |
| | 1,185 |
| | (122 | ) | | 1983 | | 12/24/13 | | 15 to 30 Years |
| | Fort Lauderdale, FL | | (a) | | 601 |
| | 121 |
| | — |
| | — |
| | 601 |
| | 121 |
| | 722 |
| | (201 | ) | | 1984 | | 09/24/04 | | 10 to 15 Years |
| | Fort Pierce, FL | | (a) | | 667 |
| | 184 |
| | — |
| | — |
| | 667 |
| | 184 |
| | 851 |
| | (138 | ) | | 1999 | | 09/24/04 | | 15 to 30 Years |
| | Fort Wayne, IN | | (a) | | 660 |
| | 204 |
| | — |
| | — |
| | 660 |
| | 204 |
| | 864 |
| | (284 | ) | | 1982 | | 09/23/05 | | 10 to 15 Years |
| | Fort Worth, TX | | (c) | | 157 |
| | 263 |
| | — |
| | — |
| | 157 |
| | 263 |
| | 420 |
| | (71 | ) | | 1965 | | 07/17/13 | | 11 to 20 Years |
| | Fort Worth, TX | | (c) | | 164 |
| | 573 |
| | — |
| | — |
| | 164 |
| | 573 |
| | 737 |
| | (95 | ) | | 1965 | | 07/17/13 | | 11 to 25 Years |
| | Fort Worth, TX | | (c) | | 200 |
| | 643 |
| | — |
| | — |
| | 200 |
| | 643 |
| | 843 |
| | (102 | ) | | 1979 | | 07/17/13 | | 11 to 30 Years |
| | Fort Worth, TX | | (c) | | 356 |
| | 572 |
| | — |
| | — |
| | 356 |
| | 572 |
| | 928 |
| | (86 | ) | | 1970 | | 07/17/13 | | 11 to 35 Years |
| | Fort Worth, TX | | (c) | | 187 |
| | 539 |
| | — |
| | — |
| | 187 |
| | 539 |
| | 726 |
| | (80 | ) | | 1984 | | 07/17/13 | | 11 to 35 Years |
| | Fort Worth, TX | | (c) | | 331 |
| | 450 |
| | — |
| | — |
| | 331 |
| | 450 |
| | 781 |
| | (15 | ) | | 1977 | | 06/30/16 | | 5 to 20 Years |
| | Fort Worth, TX | | (c) | | 377 |
| | 193 |
| | — |
| | — |
| | 377 |
| | 193 |
| | 570 |
| | (13 | ) | | 1978 | | 06/30/16 | | 5 to 10 Years |
| | Fort Worth, TX | | (c) | | 335 |
| | 257 |
| | — |
| | — |
| | 335 |
| | 257 |
| | 592 |
| | (12 | ) | | 1985 | | 06/30/16 | | 5 to 20 Years |
| | Fort Worth, TX | | (c) | | 681 |
| | 928 |
| | — |
| | — |
| | 681 |
| | 928 |
| | 1,609 |
| | (24 | ) | | 1999 | | 06/30/16 | | 5 to 30 Years |
| | Ft Madison, IA | | (a) | | 191 |
| | 620 |
| | — |
| | — |
| | 191 |
| | 620 |
| | 811 |
| | (115 | ) | | 1980 | | 12/21/12 | | 15 to 30 Years |
| | Ft. Valley, GA | | (c) | | 353 |
| | 379 |
| | — |
| | — |
| | 353 |
| | 379 |
| | 732 |
| | (106 | ) | | 1985 | | 07/17/13 | | 11 to 23 Years |
| | Garland, TX | | (c) | | 141 |
| | 455 |
| | — |
| | — |
| | 141 |
| | 455 |
| | 596 |
| | (83 | ) | | 1986 | | 07/17/13 | | 10 to 25 Years |
| | Garland, TX | | (c) | | 532 |
| | 442 |
| | — |
| | — |
| | 532 |
| | 442 |
| | 974 |
| | (11 | ) | | 1979 | | 06/30/16 | | 5 to 30 Years |
| | Garner, NC | | (a) | | 600 |
| | 765 |
| | — |
| | — |
| | 600 |
| | 765 |
| | 1,365 |
| | (356 | ) | | 1995 | | 09/29/06 | | 15 to 30 Years |
| | Gary, IN | | (a) | | 109 |
| | 410 |
| | — |
| | — |
| | 109 |
| | 410 |
| | 519 |
| | (226 | ) | | 1980 | | 05/25/05 | | 15 to 20 Years |
| | Gary, IN | | (a) | | 210 |
| | 318 |
| | — |
| | — |
| | 210 |
| | 318 |
| | 528 |
| | (217 | ) | | 1979 | | 05/25/05 | | 15 to 20 Years |
| | Gary, IN | | (a) | | 161 |
| | 493 |
| | — |
| | — |
| | 161 |
| | 493 |
| | 654 |
| | (286 | ) | | 1973 | | 05/25/05 | | 15 to 20 Years |
| | Gilman, IL | | (a) | | 219 |
| | 414 |
| | — |
| | — |
| | 219 |
| | 414 |
| | 633 |
| | (283 | ) | | 1998 | | 09/23/05 | | 15 to 20 Years |
|
| | | | | | | | | | | | | | | | | | | | | | | | | | | | | | | | | |
| Church's Chicken | Dallas, TX | | (d) | | 174 |
| | 450 |
| | — |
| | — |
| | 174 |
| | 450 |
| | 624 |
| | (107 | ) | | 1969 | | 07/17/13 | | 10 to 26 Years |
| Church's Chicken | Dallas, TX | | (d) | | 315 |
| | 209 |
| | — |
| | — |
| | 315 |
| | 209 |
| | 524 |
| | (64 | ) | | 1999 | | 07/17/13 | | 10 to 25 Years |
| Church's Chicken | Dallas, TX | | (d) | | 392 |
| | 501 |
| | — |
| | — |
| | 392 |
| | 501 |
| | 893 |
| | (109 | ) | | 1985 | | 07/17/13 | | 11 to 30 Years |
| Church's Chicken | Donna, TX | | (d) | | 1,091 |
| | 540 |
| | — |
| | — |
| | 1,091 |
| | 540 |
| | 1,631 |
| | (104 | ) | | 1984 | | 07/17/13 | | 10 to 35 Years |
| Church's Chicken | Eagle Pass, TX | | (d) | | 597 |
| | 385 |
| | — |
| | — |
| | 597 |
| | 385 |
| | 982 |
| | (84 | ) | | 1977 | | 07/17/13 | | 9 to 35 Years |
| Church's Chicken | Edinburg, TX | | (d) | | 624 |
| | 888 |
| | — |
| | — |
| | 624 |
| | 888 |
| | 1,512 |
| | (149 | ) | | 1985 | | 07/17/13 | | 11 to 35 Years |
| Church's Chicken | Elsa, TX | | (d) | | 1,159 |
| | 141 |
| | — |
| | — |
| | 1,159 |
| | 141 |
| | 1,300 |
| | (53 | ) | | 1984 | | 07/17/13 | | 11 to 35 Years |
| Church's Chicken | Floresville, TX | | (d) | | 109 |
| | 555 |
| | — |
| | — |
| | 109 |
| | 555 |
| | 664 |
| | (131 | ) | | 1985 | | 07/17/13 | | 9 to 25 Years |
| Church's Chicken | Fort Worth, TX | | (d) | | 164 |
| | 573 |
| | — |
| | — |
| | 164 |
| | 573 |
| | 737 |
| | (122 | ) | | 1965 | | 07/17/13 | | 11 to 25 Years |
| Church's Chicken | Fort Worth, TX | | (d) | | 200 |
| | 643 |
| | — |
| | — |
| | 200 |
| | 643 |
| | 843 |
| | (132 | ) | | 1979 | | 07/17/13 | | 11 to 30 Years |
| Church's Chicken | Fort Worth, TX | | (d) | | 356 |
| | 572 |
| | — |
| | — |
| | 356 |
| | 572 |
| | 928 |
| | (111 | ) | | 1970 | | 07/17/13 | | 11 to 35 Years |
| Church's Chicken | Fort Worth, TX | | (d) | | 187 |
| | 539 |
| | — |
| | — |
| | 187 |
| | 539 |
| | 726 |
| | (104 | ) | | 1984 | | 07/17/13 | | 11 to 35 Years |
| Church's Chicken | Garland, TX | | (d) | | 141 |
| | 455 |
| | — |
| | — |
| | 141 |
| | 455 |
| | 596 |
| | (107 | ) | | 1986 | | 07/17/13 | | 10 to 25 Years |
| Church's Chicken | Grand Prairie, TX | | (d) | | 335 |
| | 527 |
| | — |
| | — |
| | 335 |
| | 527 |
| | 862 |
| | (101 | ) | | 1980 | | 07/17/13 | | 10 to 35 Years |
| Church's Chicken | Grand Prairie, TX | | (d) | | 147 |
| | 535 |
| | — |
| | — |
| | 147 |
| | 535 |
| | 682 |
| | (111 | ) | | 1985 | | 07/17/13 | | 11 to 30 Years |
| Church's Chicken | Greenville, TX | | (d) | | 325 |
| | 441 |
| | — |
| | — |
| | 325 |
| | 441 |
| | 766 |
| | (79 | ) | | 1972 | | 07/17/13 | | 10 to 35 Years |
| Church's Chicken | Haltom City, TX | | (d) | | 571 |
| | 425 |
| | — |
| | — |
| | 571 |
| | 425 |
| | 996 |
| | (86 | ) | | 2007 | | 07/17/13 | | 11 to 35 Years |
| Church's Chicken | Harlingen, TX | | (d) | | 923 |
| | 753 |
| | — |
| | — |
| | 923 |
| | 753 |
| | 1,676 |
| | (120 | ) | | 1985 | | 07/17/13 | | 10 to 35 Years |
| Church's Chicken | Harlingen, TX | | (d) | | 226 |
| | 519 |
| | — |
| | — |
| | 226 |
| | 519 |
| | 745 |
| | (115 | ) | | 1973 | | 07/17/13 | | 11 to 30 Years |
| Church's Chicken | Hidalgo, TX | | (d) | | 352 |
| | 1,043 |
| | — |
| | — |
| | 352 |
| | 1,043 |
| | 1,395 |
| | (183 | ) | | 2001 | | 07/17/13 | | 10 to 31 Years |
| Church's Chicken | Irving, TX | | (d) | | 463 |
| | 338 |
| | — |
| | — |
| | 463 |
| | 338 |
| | 801 |
| | (61 | ) | | 1967 | | 07/17/13 | | 10 to 35 Years |
| Church's Chicken | Killeen, TX | | (d) | | 289 |
| | 513 |
| | — |
| | — |
| | 289 |
| | 513 |
| | 802 |
| | (93 | ) | | 1974 | | 07/17/13 | | 9 to 35 Years |
| Church's Chicken | Kingsville, TX | | (d) | | 263 |
| | 461 |
| | — |
| | — |
| | 263 |
| | 461 |
| | 724 |
| | (86 | ) | | 1977 | | 07/17/13 | | 9 to 35 Years |
| Church's Chicken | Kirby, TX | | (d) | | 224 |
| | 262 |
| | — |
| | — |
| | 224 |
| | 262 |
| | 486 |
| | (89 | ) | | 1985 | | 07/17/13 | | 9 to 18 Years |
| Church's Chicken | La Feria, TX | | (d) | | 369 |
| | 941 |
| | — |
| | — |
| | 369 |
| | 941 |
| | 1,310 |
| | (153 | ) | | 2003 | | 07/17/13 | | 11 to 35 Years |
| Church's Chicken | Laredo, TX | | (d) | | 272 |
| | 713 |
| | — |
| | — |
| | 272 |
| | 713 |
| | 985 |
| | (110 | ) | | 1966 | | 07/17/13 | | 11 to 35 Years |
| Church's Chicken | Laredo, TX | | (d) | | 727 |
| | 698 |
| | — |
| | — |
| | 727 |
| | 698 |
| | 1,425 |
| | (114 | ) | | 1968 | | 07/17/13 | | 11 to 35 Years |
| Church's Chicken | Lewisville, TX | | (d) | | 913 |
| | 470 |
| | — |
| | — |
| | 913 |
| | 470 |
| | 1,383 |
| | (109 | ) | | 1976 | | 07/17/13 | | 8 to 35 Years |
| Church's Chicken | Lubbock, TX | | (d) | | 325 |
| | 794 |
| | — |
| | — |
| | 325 |
| | 794 |
| | 1,119 |
| | (147 | ) | | 2004 | | 07/17/13 | | 11 to 34 Years |
| Church's Chicken | McAllen, TX | | (d) | | 747 |
| | 408 |
| | — |
| | — |
| | 747 |
| | 408 |
| | 1,155 |
| | (74 | ) | | 1992 | | 07/17/13 | | 10 to 35 Years |
SPIRIT REALTY CAPITAL, INC.
Schedule III Real Estate and
Accumulated Depreciation
(Amounts in thousands)
|
| | | | | | | | | | | | | | | | | | | | | | | | | |
| | | | | | Initial Cost to Company | | Cost Capitalized Subsequent to Acquisition including impairment | | Gross Amount at December 31, 2016 (d) 2017 (g) | | | | | | | | |
| Concept | City, State | | Encumbrances (e) | | Land and Improvements | | Buildings and Improvements | | Land and Improvements | | Buildings and Improvements | | Land and Improvements | | Buildings and Improvements | | Total | | Final Accumulated Depreciation | | Date of Construction | | Date Acquired | | Life in which depreciation in latest Statement of Operations is computed |
Description | | Encumbrances (e)
| | Land and
Improvements
| | Buildings and
Improvements
| | Improvements/
Land
| | Improvements/
building
| | Land and
Improvements
| | Buildings and
Improvements
| | Total | | Final
Accum
| | Date of
Construction
| | Date
Acquired
| |
|
| | | | | | | | | | | | | | | | | | | | | | | | | | | | | | | | | |
| | Graceville, FL | | (a) | | 279 |
| | 1,036 |
| | — |
| | — |
| | 279 |
| | 1,036 |
| | 1,315 |
| | (139 | ) | | 1985 | | 12/24/13 | | 15 to 30 Years |
| | Grand Prairie, TX | | (c) | | 335 |
| | 527 |
| | — |
| | — |
| | 335 |
| | 527 |
| | 862 |
| | (78 | ) | | 1980 | | 07/17/13 | | 10 to 35 Years |
| | Grand Prairie, TX | | (c) | | 147 |
| | 535 |
| | — |
| | — |
| | 147 |
| | 535 |
| | 682 |
| | (86 | ) | | 1985 | | 07/17/13 | | 11 to 30 Years |
| | Grapevine, TX | | (c) | | 636 |
| | 414 |
| | — |
| | — |
| | 636 |
| | 414 |
| | 1,050 |
| | (14 | ) | | 1979 | | 06/30/16 | | 5 to 20 Years |
| | Grapevine, TX | | (c) | | 755 |
| | 677 |
| | — |
| | — |
| | 755 |
| | 677 |
| | 1,432 |
| | (25 | ) | | 1999 | | 06/30/16 | | 5 to 20 Years |
| | Greensboro, AL | | (c) | | 100 |
| | 663 |
| | — |
| | — |
| | 100 |
| | 663 |
| | 763 |
| | (94 | ) | | 1986 | | 07/17/13 | | 7 to 35 Years |
| | Greenville, TN | | (a) | | 289 |
| | 311 |
| | — |
| | — |
| | 289 |
| | 311 |
| | 600 |
| | (320 | ) | | 1972 | | 09/01/05 | | 10 to 15 Years |
| | Greenville, TN | | (a) | | 735 |
| | 517 |
| | — |
| | — |
| | 735 |
| | 517 |
| | 1,252 |
| | (104 | ) | | 2010 | | 03/29/13 | | 15 to 30 Years |
| | Greenville, TX | | (a) | | 223 |
| | 304 |
| | — |
| | — |
| | 223 |
| | 304 |
| | 527 |
| | (170 | ) | | 1985 | | 12/29/05 | | 15 to 20 Years |
| | Greenville, TX | | (c) | | 325 |
| | 441 |
| | — |
| | — |
| | 325 |
| | 441 |
| | 766 |
| | (61 | ) | | 1972 | | 07/17/13 | | 10 to 35 Years |
| | Greenville, TX | | (c) | | 429 |
| | 919 |
| | — |
| | — |
| | 429 |
| | 919 |
| | 1,348 |
| | (19 | ) | | 1985 | | 06/30/16 | | 5 to 30 Years |
| | Griffin, GA | | (c) | | 215 |
| | 492 |
| | — |
| | — |
| | 215 |
| | 492 |
| | 707 |
| | (98 | ) | | 1978 | | 07/17/13 | | 11 to 25 Years |
| | Griffin, GA | | (a) | | 249 |
| | 876 |
| | — |
| | — |
| | 249 |
| | 876 |
| | 1,125 |
| | (110 | ) | | 1979 | | 12/24/13 | | 15 to 30 Years |
| | Gulfport, MS | | (c) | | 540 |
| | 429 |
| | — |
| | — |
| | 540 |
| | 429 |
| | 969 |
| | (56 | ) | | 1971 | | 07/17/13 | | 11 to 35 Years |
| | Gunter, TX | | (c) | | 248 |
| | 250 |
| | — |
| | — |
| | 248 |
| | 250 |
| | 498 |
| | (10 | ) | | 2004 | | 07/25/16 | | 13 to 20 Years |
| | Haltom City, TX | | (c) | | 571 |
| | 425 |
| | — |
| | — |
| | 571 |
| | 425 |
| | 996 |
| | (66 | ) | | 2007 | | 07/17/13 | | 11 to 35 Years |
| | Haltom City, TX | | (c) | | 689 |
| | 804 |
| | — |
| | — |
| | 689 |
| | 804 |
| | 1,493 |
| | (21 | ) | | 1998 | | 06/30/16 | | 5 to 30 Years |
| | Hampton, GA | | (a) | | 568 |
| | 648 |
| | — |
| | — |
| | 568 |
| | 648 |
| | 1,216 |
| | (128 | ) | | 2002 | | 02/02/12 | | 15 to 30 Years |
| | Harlingen, TX | | (c) | | 923 |
| | 753 |
| | — |
| | — |
| | 923 |
| | 753 |
| | 1,676 |
| | (93 | ) | | 1985 | | 07/17/13 | | 10 to 35 Years |
| | Harlingen, TX | | (c) | | 226 |
| | 519 |
| | — |
| | — |
| | 226 |
| | 519 |
| | 745 |
| | (89 | ) | | 1973 | | 07/17/13 | | 11 to 30 Years |
| | Harriman, TN | | (a) | | 387 |
| | 502 |
| | — |
| | — |
| | 387 |
| | 502 |
| | 889 |
| | (263 | ) | | 1976 | | 09/01/05 | | 15 to 20 Years |
| | Harrisburg, NC | | (a) | | 489 |
| | 291 |
| | — |
| | — |
| | 489 |
| | 291 |
| | 780 |
| | (60 | ) | | 2004 | | 09/17/13 | | 15 to 30 Years |
| | Harrisonville, MO | | (a) | | 369 |
| | 1,195 |
| | — |
| | — |
| | 369 |
| | 1,195 |
| | 1,564 |
| | (151 | ) | | 1981 | | 12/24/13 | | 15 to 30 Years |
| | Harvey, IL | | (a) | | 361 |
| | 269 |
| | (80 | ) | | — |
| | 281 |
| | 269 |
| | 550 |
| | (346 | ) | | 1978 | | 05/25/05 | | 15 to 20 Years |
| | Hattiesburg, MS | | (a) | | 845 |
| | 995 |
| | — |
| | — |
| | 845 |
| | 995 |
| | 1,840 |
| | (107 | ) | | 2010 | | 07/14/14 | | 15 to 40 Years |
| | Havana, IL | | (a) | | 439 |
| | 297 |
| | — |
| | — |
| | 439 |
| | 297 |
| | 736 |
| | (184 | ) | | 1980 | | 12/21/12 | | 10 to 15 Years |
| | Hawkinsville, GA | | (a) | | 169 |
| | 946 |
| | — |
| | — |
| | 169 |
| | 946 |
| | 1,115 |
| | (119 | ) | | 1986 | | 12/24/13 | | 15 to 30 Years |
| | Henderson, KY | | (a) | | 656 |
| | 1,058 |
| | — |
| | — |
| | 656 |
| | 1,058 |
| | 1,714 |
| | (135 | ) | | 1992 | | 07/17/13 | | 7 to 35 Years |
| | Hickory, NC | | (a) | | 292 |
| | 818 |
| | — |
| | — |
| | 292 |
| | 818 |
| | 1,110 |
| | (287 | ) | | 2000 | | 09/29/06 | | 15 to 40 Years |
| | Hickory, NC | | (a) | | 1,105 |
| | 851 |
| | — |
| | — |
| | 1,105 |
| | 851 |
| | 1,956 |
| | (652 | ) | | 1995 | | 12/29/06 | | 13 to 28 Years |
| | Hidalgo, TX | | (c) | | 352 |
| | 1,043 |
| | — |
| | — |
| | 352 |
| | 1,043 |
| | 1,395 |
| | (141 | ) | | 2001 | | 07/17/13 | | 10 to 31 Years |
| | Hiram, GA | | (a) | | 1,006 |
| | 1,142 |
| | — |
| | — |
| | 1,006 |
| | 1,142 |
| | 2,148 |
| | (530 | ) | | 1987 | | 02/28/06 | | 15 to 30 Years |
| | Hobbs, NM | | (c) | | 706 |
| | 534 |
| | — |
| | — |
| | 706 |
| | 534 |
| | 1,240 |
| | (91 | ) | | 1974 | | 07/17/13 | | 11 to 35 Years |
| | Holly Springs, MS | | (a) | | 116 |
| | — |
| | — |
| | — |
| | 116 |
| | — |
| | 116 |
| | — |
| | (f) | | 10/30/13 | | (f) |
|
| | | | | | | | | | | | | | | | | | | | | | | | | | | | | | | | | |
| Church's Chicken | McAllen, TX | | (d) | | 601 |
| | 539 |
| | — |
| | — |
| | 601 |
| | 539 |
| | 1,140 |
| | (103 | ) | | 1985 | | 07/17/13 | | 11 to 35 Years |
| Church's Chicken | Mercedes, TX | | (d) | | 535 |
| | 575 |
| | — |
| | — |
| | 535 |
| | 575 |
| | 1,110 |
| | (105 | ) | | 1982 | | 07/17/13 | | 11 to 35 Years |
| Church's Chicken | Mesquite, TX | | (d) | | 234 |
| | 459 |
| | — |
| | — |
| | 234 |
| | 459 |
| | 693 |
| | (115 | ) | | 2001 | | 07/17/13 | | 11 to 28 Years |
| Church's Chicken | Midland, TX | | (d) | | 195 |
| | 432 |
| | — |
| | — |
| | 195 |
| | 432 |
| | 627 |
| | (78 | ) | | 1972 | | 07/17/13 | | 9 to 35 Years |
| Church's Chicken | Mission, TX | | (d) | | 577 |
| | 598 |
| | — |
| | — |
| | 577 |
| | 598 |
| | 1,175 |
| | (110 | ) | | 1981 | | 07/17/13 | | 9 to 35 Years |
| Church's Chicken | New Braunfels, TX | | (d) | | 302 |
| | 526 |
| | — |
| | — |
| | 302 |
| | 526 |
| | 828 |
| | (125 | ) | | 1973 | | 07/17/13 | | 10 to 27 Years |
| Church's Chicken | Odessa, TX | | (d) | | 597 |
| | 443 |
| | — |
| | — |
| | 597 |
| | 443 |
| | 1,040 |
| | (92 | ) | | 1979 | | 07/17/13 | | 10 to 35 Years |
| Church's Chicken | Odessa, TX | | (d) | | 670 |
| | 563 |
| | — |
| | — |
| | 670 |
| | 563 |
| | 1,233 |
| | (108 | ) | | 1972 | | 07/17/13 | | 10 to 35 Years |
| Church's Chicken | Pharr, TX | | (d) | | 694 |
| | 441 |
| | — |
| | — |
| | 694 |
| | 441 |
| | 1,135 |
| | (117 | ) | | 1997 | | 07/17/13 | | 10 to 26 Years |
| Church's Chicken | Pleasanton, TX | | (d) | | 230 |
| | 1,052 |
| | — |
| | — |
| | 230 |
| | 1,052 |
| | 1,282 |
| | (176 | ) | | 1985 | | 07/17/13 | | 11 to 35 Years |
|
| | | | | | | | | | | | | | | | | | | | | | | | | | | | | | | | | |
| Church's Chicken | Port Isabel, TX | | (d) | | 348 |
| | 672 |
| | — |
| | — |
| | 348 |
| | 672 |
| | 1,020 |
| | (132 | ) | | 2004 | | 07/17/13 | | 11 to 31 Years |
| Church's Chicken | Port Lavaca, TX | | (d) | | 339 |
| | 594 |
| | — |
| | — |
| | 339 |
| | 594 |
| | 933 |
| | (126 | ) | | 1985 | | 07/17/13 | | 11 to 28 Years |
| Church's Chicken | Raymondville, TX | | (d) | | 660 |
| | 455 |
| | — |
| | — |
| | 660 |
| | 455 |
| | 1,115 |
| | (104 | ) | | 1984 | | 07/17/13 | | 9 to 35 Years |
| Church's Chicken | Richland Hills, TX | | (d) | | 229 |
| | 199 |
| | — |
| | — |
| | 229 |
| | 199 |
| | 428 |
| | (62 | ) | | 1999 | | 07/17/13 | | 10 to 25 Years |
| Church's Chicken | Rio Grand City, TX | | (d) | | 1,746 |
| | 554 |
| | — |
| | — |
| | 1,746 |
| | 554 |
| | 2,300 |
| | (102 | ) | | 1984 | | 07/17/13 | | 12 to 35 Years |
| Church's Chicken | Roma, TX | | (d) | | 478 |
| | 855 |
| | — |
| | — |
| | 478 |
| | 855 |
| | 1,333 |
| | (159 | ) | | 1985 | | 07/17/13 | | 11 to 35 Years |
| Church's Chicken | San Antonio, TX | | (d) | | 205 |
| | 1,042 |
| | — |
| | — |
| | 205 |
| | 1,042 |
| | 1,247 |
| | (265 | ) | | 1976 | | 07/17/13 | | 10 to 20 Years |
| Church's Chicken | San Antonio, TX | | (d) | | 685 |
| | 257 |
| | — |
| | — |
| | 685 |
| | 257 |
| | 942 |
| | (57 | ) | | 1976 | | 07/17/13 | | 9 to 35 Years |
| Church's Chicken | San Antonio, TX | | (d) | | 592 |
| | 336 |
| | — |
| | — |
| | 592 |
| | 336 |
| | 928 |
| | (72 | ) | | 1968 | | 07/17/13 | | 9 to 35 Years |
| Church's Chicken | San Antonio, TX | | (d) | | 79 |
| | 347 |
| | — |
| | — |
| | 79 |
| | 347 |
| | 426 |
| | (61 | ) | | 1977 | | 07/17/13 | | 9 to 33 Years |
| Church's Chicken | San Antonio, TX | | (d) | | 395 |
| | 414 |
| | — |
| | — |
| | 395 |
| | 414 |
| | 809 |
| | (111 | ) | | 1984 | | 07/17/13 | | 11 to 25 Years |
| Church's Chicken | San Antonio, TX | | (d) | | 544 |
| | 521 |
| | — |
| | — |
| | 544 |
| | 521 |
| | 1,065 |
| | (100 | ) | | 1967 | | 07/17/13 | | 11 to 33 Years |
| Church's Chicken | San Antonio, TX | | (d) | | 375 |
| | 282 |
| | — |
| | — |
| | 375 |
| | 282 |
| | 657 |
| | (93 | ) | | 1965 | | 07/17/13 | | 9 to 21 Years |
| Church's Chicken | San Antonio, TX | | (d) | | 331 |
| | 449 |
| | — |
| | — |
| | 331 |
| | 449 |
| | 780 |
| | (113 | ) | | 1983 | | 07/17/13 | | 10 to 25 Years |
| Church's Chicken | San Antonio, TX | | (d) | | 283 |
| | 573 |
| | — |
| | — |
| | 283 |
| | 573 |
| | 856 |
| | (138 | ) | | 1971 | | 07/17/13 | | 11 to 33 Years |
| Church's Chicken | San Antonio, TX | | (d) | | 369 |
| | 226 |
| | — |
| | — |
| | 369 |
| | 226 |
| | 595 |
| | (61 | ) | | 1986 | | 07/17/13 | | 10 to 25 Years |
| Church's Chicken | San Antonio, TX | | (d) | | 397 |
| | 700 |
| | — |
| | — |
| | 397 |
| | 700 |
| | 1,097 |
| | (127 | ) | | 1984 | | 07/17/13 | | 11 to 35 Years |
| Church's Chicken | San Antonio, TX | | (d) | | 279 |
| | 261 |
| | — |
| | — |
| | 279 |
| | 261 |
| | 540 |
| | (70 | ) | | 1976 | | 07/17/13 | | 11 to 32 Years |
| Church's Chicken | San Benito, TX | | (d) | | 1,641 |
| | 688 |
| | — |
| | — |
| | 1,641 |
| | 688 |
| | 2,329 |
| | (113 | ) | | 1977 | | 07/17/13 | | 9 to 35 Years |
SPIRIT REALTY CAPITAL, INC.
Schedule III Real Estate and
Accumulated Depreciation
(Amounts in thousands)
|
| | | | | | | | | | | | | | | | | | | | | | | | | |
| | | | | | Initial Cost to Company | | Cost Capitalized Subsequent to Acquisition including impairment | | Gross Amount at December 31, 2016 (d) 2017 (g) | | | | | | | | |
| Concept | City, State | | Encumbrances (e) | | Land and Improvements | | Buildings and Improvements | | Land and Improvements | | Buildings and Improvements | | Land and Improvements | | Buildings and Improvements | | Total | | Final Accumulated Depreciation | | Date of Construction | | Date Acquired | | Life in which depreciation in latest Statement of Operations is computed |
Description | | Encumbrances (e)
| | Land and
Improvements
| | Buildings and
Improvements
| | Improvements/
Land
| | Improvements/
building
| | Land and
Improvements
| | Buildings and
Improvements
| | Total | | Final
Accum
| | Date of
Construction
| | Date
Acquired
| |
|
| | | | | | | | | | | | | | | | | | | | | | | | | | | | | | | | | |
| | Hope Mills, NC | | (a) | | 408 |
| | 930 |
| | — |
| | — |
| | 408 |
| | 930 |
| | 1,338 |
| | (369 | ) | | 1990 | | 09/29/06 | | 15 to 30 Years |
| | Horn Lake, MS | | (a) | | 231 |
| | — |
| | — |
| | — |
| | 231 |
| | — |
| | 231 |
| | — |
| | (f) | | 10/30/13 | | (f) |
| | Houston, TX | | (a) | | 592 |
| | 302 |
| | — |
| | — |
| | 592 |
| | 302 |
| | 894 |
| | (178 | ) | | 1979 | | 09/28/06 | | 15 to 20 Years |
| | Houston, TX | | (a) | | 1,329 |
| | — |
| | — |
| | — |
| | 1,329 |
| | — |
| | 1,329 |
| | — |
| | (f) | | 07/17/13 | | (f) |
| | Hudson, NC | | (a) | | 794 |
| | 616 |
| | — |
| | — |
| | 794 |
| | 616 |
| | 1,410 |
| | (279 | ) | | 1998 | | 09/29/06 | | 15 to 40 Years |
| | Hurst, TX | | (c) | | 505 |
| | 66 |
| | — |
| | — |
| | 505 |
| | 66 |
| | 571 |
| | (6 | ) | | 1978 | | 06/30/16 | | 5 to 10 Years |
| | Independence, MO | | (a) | | 396 |
| | 1,074 |
| | — |
| | — |
| | 396 |
| | 1,074 |
| | 1,470 |
| | (240 | ) | | 1984 | | 10/03/11 | | 15 to 30 Years |
| | Independence, MO | | (a) | | 279 |
| | 936 |
| | — |
| | — |
| | 279 |
| | 936 |
| | 1,215 |
| | (118 | ) | | 1979 | | 12/24/13 | | 15 to 30 Years |
| | Indianapolis, IN | | (a) | | 460 |
| | 587 |
| | — |
| | — |
| | 460 |
| | 587 |
| | 1,047 |
| | (251 | ) | | 1998 | | 09/24/04 | | 15 to 30 Years |
| | Indianapolis, IN | | (a) | | 258 |
| | 262 |
| | — |
| | — |
| | 258 |
| | 262 |
| | 520 |
| | (184 | ) | | 1970 | | 05/25/05 | | 15 to 20 Years |
| | Indianapolis, IN | | (a) | | 266 |
| | 310 |
| | — |
| | — |
| | 266 |
| | 310 |
| | 576 |
| | (197 | ) | | 1971 | | 05/25/05 | | 15 to 20 Years |
| | Indianapolis, IN | | (a) | | 170 |
| | 749 |
| | — |
| | — |
| | 170 |
| | 749 |
| | 919 |
| | (386 | ) | | 1983 | | 05/25/05 | | 15 to 20 Years |
| | Indianapolis, IN | | (a) | | 449 |
| | 153 |
| | — |
| | — |
| | 449 |
| | 153 |
| | 602 |
| | (140 | ) | | 1968 | | 05/25/05 | | 15 to 20 Years |
| | Indianapolis, IN | | (a) | | 370 |
| | 150 |
| | — |
| | — |
| | 370 |
| | 150 |
| | 520 |
| | (125 | ) | | 1970 | | 05/25/05 | | 15 to 20 Years |
| | Irving, TX | | (c) | | 463 |
| | 338 |
| | — |
| | — |
| | 463 |
| | 338 |
| | 801 |
| | (47 | ) | | 1967 | | 07/17/13 | | 10 to 35 Years |
| | Irving, TX | | (c) | | 481 |
| | 358 |
| | — |
| | — |
| | 481 |
| | 358 |
| | 839 |
| | (13 | ) | | 1978 | | 06/30/16 | | 5 to 20 Years |
| | Jackson, GA | | (a) | | 467 |
| | 729 |
| | — |
| | — |
| | 467 |
| | 729 |
| | 1,196 |
| | (168 | ) | | 1992 | | 02/02/12 | | 15 to 30 Years |
| | Jackson, MS | | (c) | | 215 |
| | 476 |
| | — |
| | — |
| | 215 |
| | 476 |
| | 691 |
| | (88 | ) | | 1977 | | 07/17/13 | | 11 to 25 Years |
| | Jackson, MS | | (c) | | 996 |
| | 610 |
| | — |
| | — |
| | 996 |
| | 610 |
| | 1,606 |
| | (97 | ) | | 1978 | | 07/17/13 | | 11 to 35 Years |
| | Jackson, MS | | (c) | | 195 |
| | 582 |
| | — |
| | — |
| | 195 |
| | 582 |
| | 777 |
| | (89 | ) | | 2000 | | 07/17/13 | | 11 to 30 Years |
| | Jackson, MS | | (c) | | 447 |
| | 555 |
| | — |
| | — |
| | 447 |
| | 555 |
| | 1,002 |
| | (95 | ) | | 1998 | | 07/17/13 | | 11 to 35 Years |
| | Jacksonville, FL | | (a) | | 480 |
| | 631 |
| | — |
| | — |
| | 480 |
| | 631 |
| | 1,111 |
| | (294 | ) | | 1998 | | 09/24/04 | | 15 to 30 Years |
| | Jacksonville, FL | | (a) | | 872 |
| | 509 |
| | — |
| | — |
| | 872 |
| | 509 |
| | 1,381 |
| | (331 | ) | | 1984 | | 09/24/04 | | 15 to 20 Years |
| | Jacksonville, FL | | (a) | | 487 |
| | 871 |
| | — |
| | — |
| | 487 |
| | 871 |
| | 1,358 |
| | (460 | ) | | 1985 | | 12/30/04 | | 15 to 20 Years |
| | Jamestown, NY | | (a) | | 508 |
| | 573 |
| | — |
| | — |
| | 508 |
| | 573 |
| | 1,081 |
| | (339 | ) | | 1988 | | 11/10/05 | | 15 to 20 Years |
| | Johnson City, TN | | (a) | | 718 |
| | 450 |
| | — |
| | — |
| | 718 |
| | 450 |
| | 1,168 |
| | (165 | ) | | 1983 | | 12/21/12 | | 15 to 20 Years |
| | Joliet, IL | | (a) | | 245 |
| | 193 |
| | — |
| | — |
| | 245 |
| | 193 |
| | 438 |
| | (140 | ) | | 1985 | | 05/25/05 | | 15 to 20 Years |
| | Jonesboro, GA | | (c) | | 680 |
| | 1,736 |
| | — |
| | — |
| | 680 |
| | 1,736 |
| | 2,416 |
| | (102 | ) | | 2006 | | 07/01/15 | | 15 to 30 Years |
| | Jonesborough, TN | | (a) | | 576 |
| | 329 |
| | — |
| | — |
| | 576 |
| | 329 |
| | 905 |
| | (108 | ) | | 1987 | | 12/21/12 | | 15 to 20 Years |
| | Kannapolix, NC | | (a) | | 244 |
| | 291 |
| | — |
| | — |
| | 244 |
| | 291 |
| | 535 |
| | (54 | ) | | 2001 | | 09/17/13 | | 15 to 30 Years |
| | Kansas City, KS | | (a) | | 349 |
| | 425 |
| | — |
| | — |
| | 349 |
| | 425 |
| | 774 |
| | (96 | ) | | 1977 | | 10/03/11 | | 14 to 29 Years |
| | Kansas City, KS | | (a) | | 594 |
| | 904 |
| | — |
| | — |
| | 594 |
| | 904 |
| | 1,498 |
| | (213 | ) | | 1999 | | 10/03/11 | | 15 to 30 Years |
| | Kansas City, KS | | (a) | | 289 |
| | 1,066 |
| | — |
| | — |
| | 289 |
| | 1,066 |
| | 1,355 |
| | (134 | ) | | 1980 | | 12/24/13 | | 15 to 30 Years |
| | Kansas City, MO | | (c) | | 312 |
| | 574 |
| | — |
| | — |
| | 312 |
| | 574 |
| | 886 |
| | (91 | ) | | 1996 | | 07/17/13 | | 10 to 30 Years |
| | Kansas City, MO | | (c) | | 348 |
| | 730 |
| | — |
| | — |
| | 348 |
| | 730 |
| | 1,078 |
| | (101 | ) | | 1996 | | 07/17/13 | | 10 to 35 Years |
| | Kansas City, MO | | (c) | | 462 |
| | 673 |
| | — |
| | — |
| | 462 |
| | 673 |
| | 1,135 |
| | (95 | ) | | 1996 | | 07/17/13 | | 10 to 35 Years |
|
| | | | | | | | | | | | | | | | | | | | | | | | | | | | | | | | | |
| Church's Chicken | Temple, TX | | (d) | | 705 |
| | 493 |
| | — |
| | — |
| | 705 |
| | 493 |
| | 1,198 |
| | (86 | ) | | 1983 | | 07/17/13 | | 10 to 35 Years |
| Church's Chicken | Tyler, TX | | (d) | | 227 |
| | 527 |
| | — |
| | — |
| | 227 |
| | 527 |
| | 754 |
| | (92 | ) | | 1976 | | 07/17/13 | | 11 to 35 Years |
| Church's Chicken | Universal City, TX | | (d) | | 408 |
| | 369 |
| | — |
| | — |
| | 408 |
| | 369 |
| | 777 |
| | (108 | ) | | 1989 | | 07/17/13 | | 9 to 25 Years |
| Church's Chicken | Victoria, TX | | (d) | | 129 |
| | 490 |
| | — |
| | — |
| | 129 |
| | 490 |
| | 619 |
| | (113 | ) | | 1985 | | 07/17/13 | | 11 to 28 Years |
| Church's Chicken | Victoria, TX | | (d) | | 367 |
| | 182 |
| | — |
| | — |
| | 367 |
| | 182 |
| | 549 |
| | (62 | ) | | 1984 | | 07/17/13 | | 11 to 22 Years |
| Church's Chicken | Waco, TX | | (d) | | 365 |
| | 542 |
| | — |
| | — |
| | 365 |
| | 542 |
| | 907 |
| | (87 | ) | | 1969 | | 07/17/13 | | 10 to 35 Years |
| Church's Chicken | Weslaco, TX | | (d) | | 860 |
| | 513 |
| | — |
| | — |
| | 860 |
| | 513 |
| | 1,373 |
| | (93 | ) | | 1990 | | 07/17/13 | | 11 to 35 Years |
| Church's Chicken | Weslaco, TX | | (d) | | 291 |
| | 786 |
| | — |
| | — |
| | 291 |
| | 786 |
| | 1,077 |
| | (172 | ) | | 1970 | | 07/17/13 | | 11 to 25 Years |
| Church's Chicken | Norfolk, VA | | (d) | | 373 |
| | 517 |
| | — |
| | — |
| | 373 |
| | 517 |
| | 890 |
| | (169 | ) | | 1988 | | 07/17/13 | | 7 to 20 Years |
| Church's Chicken | Portsmouth, VA | | (d) | | 574 |
| | 419 |
| | — |
| | — |
| | 574 |
| | 419 |
| | 993 |
| | (121 | ) | | 1988 | | 07/17/13 | | 10 to 25 Years |
| Cinemark | Tucson, AZ | | (d) | | 4,023 |
| | 10,346 |
| | — |
| | 52 |
| | 4,023 |
| | 10,398 |
| | 14,421 |
| | (280 | ) | | 2016 | | 02/21/17 | | 15 to 50 Years |
| Circle K | Akron, OH | | (d) | | 424 |
| | 1,139 |
| | — |
| | — |
| | 424 |
| | 1,139 |
| | 1,563 |
| | (243 | ) | | 1995 | | 07/17/13 | | 13 to 30 Years |
| Circle K | Cuyahoga Falls, OH | | (d) | | 657 |
| | 1,018 |
| | — |
| | — |
| | 657 |
| | 1,018 |
| | 1,675 |
| | (267 | ) | | 1995 | | 07/17/13 | | 13 to 30 Years |
| Circle K | Cleveland, OH | | (d) | | 804 |
| | 1,513 |
| | — |
| | — |
| | 804 |
| | 1,513 |
| | 2,317 |
| | (306 | ) | | 2002 | | 07/17/13 | | 13 to 35 Years |
| Circle K | Akron, OH | | (d) | | 587 |
| | 1,073 |
| | — |
| | — |
| | 587 |
| | 1,073 |
| | 1,660 |
| | (255 | ) | | 1998 | | 07/17/13 | | 13 to 32 Years |
| Circle K | Augusta, GA | | (d) | | 400 |
| | 1,540 |
| | — |
| | — |
| | 400 |
| | 1,540 |
| | 1,940 |
| | (281 | ) | | 1981 | | 07/17/13 | | 13 to 30 Years |
| Circle K | Auburn, AL | | (d) | | 757 |
| | 1,199 |
| | — |
| | — |
| | 757 |
| | 1,199 |
| | 1,956 |
| | (314 | ) | | 1990 | | 07/17/13 | | 10 to 25 Years |
| Circle K | El Paso, TX | | (d) | | 1,143 |
| | 1,029 |
| | — |
| | — |
| | 1,143 |
| | 1,029 |
| | 2,172 |
| | (558 | ) | | 2000 | | 07/17/13 | | 4 to 27 Years |
| Circle K | Fort Mill, SC | | (d) | | 1,589 |
| | 1,356 |
| | — |
| | — |
| | 1,589 |
| | 1,356 |
| | 2,945 |
| | (275 | ) | | 1999 | | 07/17/13 | | 10 to 33 Years |
| Circle K | Mount Pleasant, SC | | (d) | | 1,328 |
| | 1,073 |
| | — |
| | — |
| | 1,328 |
| | 1,073 |
| | 2,401 |
| | (220 | ) | | 1978 | | 07/17/13 | | 7 to 30 Years |
| Circle K | Goose Creek, SC | | (d) | | 682 |
| | 1,571 |
| | — |
| | — |
| | 682 |
| | 1,571 |
| | 2,253 |
| | (425 | ) | | 1983 | | 07/17/13 | | 7 to 20 Years |
| Circle K | Akron, OH | | (d) | | 500 |
| | 2,058 |
| | — |
| | — |
| | 500 |
| | 2,058 |
| | 2,558 |
| | (359 | ) | | 1999 | | 07/17/13 | | 15 to 33 Years |
| Circle K | Akron, OH | | (d) | | 337 |
| | 1,149 |
| | — |
| | — |
| | 337 |
| | 1,149 |
| | 1,486 |
| | (207 | ) | | 2001 | | 07/17/13 | | 15 to 35 Years |
| Circle K | Parma, OH | | (d) | | 437 |
| | 1,166 |
| | — |
| | — |
| | 437 |
| | 1,166 |
| | 1,603 |
| | (206 | ) | | 2002 | | 07/17/13 | | 15 to 35 Years |
| Circle K | Twinsburg, OH | | (d) | | 556 |
| | 1,317 |
| | — |
| | — |
| | 556 |
| | 1,317 |
| | 1,873 |
| | (247 | ) | | 2005 | | 07/17/13 | | 15 to 37 Years |
| Circle K | Cuyahoga Falls, OH | | (d) | | 958 |
| | 1,416 |
| | — |
| | — |
| | 958 |
| | 1,416 |
| | 2,374 |
| | (330 | ) | | 2002 | | 07/17/13 | | 15 to 35 Years |
| Circle K | Charlotte, NC | | (d) | | 1,508 |
| | 749 |
| | (128 | ) | | — |
| | 1,380 |
| | 749 |
| | 2,129 |
| | (205 | ) | | 1996 | | 07/17/13 | | 9 to 35 Years |
| Circle K | Savannah, GA | | (d) | | 1,001 |
| | 847 |
| | — |
| | — |
| | 1,001 |
| | 847 |
| | 1,848 |
| | (265 | ) | | 1997 | | 07/17/13 | | 8 to 37 Years |
| Circle K | Phenix City, AL | | (d) | | 554 |
| | 1,392 |
| | — |
| | — |
| | 554 |
| | 1,392 |
| | 1,946 |
| | (295 | ) | | 1999 | | 07/17/13 | | 13 to 33 Years |
| Circle K | Macon, GA | | (d) | | 470 |
| | 1,226 |
| | — |
| | — |
| | 470 |
| | 1,226 |
| | 1,696 |
| | (324 | ) | | 1974 | | 07/17/13 | | 7 to 35 Years |
| Circle K | Lanett, AL | | (d) | | 299 |
| | 844 |
| | — |
| | — |
| | 299 |
| | 844 |
| | 1,143 |
| | (203 | ) | | 1974 | | 07/17/13 | | 10 to 25 Years |
| Circle K | Monroe, LA | | (d) | | 517 |
| | 1,455 |
| | — |
| | — |
| | 517 |
| | 1,455 |
| | 1,972 |
| | (409 | ) | | 1986 | | 07/17/13 | | 6 to 28 Years |
SPIRIT REALTY CAPITAL, INC.
Schedule III Real Estate and
Accumulated Depreciation
(Amounts in thousands)
|
| | | | | | | | | | | | | | | | | | | | | | | | | |
| | | | | | Initial Cost to Company | | Cost Capitalized Subsequent to Acquisition including impairment | | Gross Amount at December 31, 2016 (d) 2017 (g) | | | | | | | | |
| Concept | City, State | | Encumbrances (e) | | Land and Improvements | | Buildings and Improvements | | Land and Improvements | | Buildings and Improvements | | Land and Improvements | | Buildings and Improvements | | Total | | Final Accumulated Depreciation | | Date of Construction | | Date Acquired | | Life in which depreciation in latest Statement of Operations is computed |
Description | | Encumbrances (e)
| | Land and
Improvements
| | Buildings and
Improvements
| | Improvements/
Land
| | Improvements/
building
| | Land and
Improvements
| | Buildings and
Improvements
| | Total | | Final
Accum
| | Date of
Construction
| | Date
Acquired
| |
|
| | | | | | | | | | | | | | | | | | | | | | | | | | | | | | | | | |
| | Kansas City, MO | | (c) | | 135 |
| | 616 |
| | — |
| | — |
| | 135 |
| | 616 |
| | 751 |
| | (106 | ) | | 1996 | | 07/17/13 | | 10 to 25 Years |
| | Kansas City, MO | | (c) | | 310 |
| | 580 |
| | — |
| | — |
| | 310 |
| | 580 |
| | 890 |
| | (92 | ) | | 1996 | | 07/17/13 | | 10 to 31 Years |
| | Kansas City, MO | | (c) | | 189 |
| | 837 |
| | — |
| | — |
| | 189 |
| | 837 |
| | 1,026 |
| | (144 | ) | | 1996 | | 07/17/13 | | 9 to 25 Years |
|
| | | | | | | | | | | | | | | | | | | | | | | | | | | | | | | | | |
| Circle K | Akron, OH | | (d) | | 595 |
| | 1,031 |
| | — |
| | — |
| | 595 |
| | 1,031 |
| | 1,626 |
| | (243 | ) | | 1995 | | 07/17/13 | | 14 to 30 Years |
| Circle K | Akron, OH | | (d) | | 554 |
| | 824 |
| | — |
| | — |
| | 554 |
| | 824 |
| | 1,378 |
| | (176 | ) | | 1969 | | 07/17/13 | | 14 to 38 Years |
| Circle K | Akron, OH | | (d) | | 517 |
| | 1,122 |
| | — |
| | — |
| | 517 |
| | 1,122 |
| | 1,639 |
| | (257 | ) | | 1994 | | 07/17/13 | | 13 to 29 Years |
| Circle K | Barberton, OH | | (d) | | 255 |
| | 1,244 |
| | — |
| | — |
| | 255 |
| | 1,244 |
| | 1,499 |
| | (265 | ) | | 1991 | | 07/17/13 | | 12 to 26 Years |
| Circle K | Charlotte, NC | | (d) | | 1,442 |
| | 789 |
| | — |
| | — |
| | 1,442 |
| | 789 |
| | 2,231 |
| | (263 | ) | | 1997 | | 07/17/13 | | 8 to 35 Years |
| Circle K | Savannah, GA | | (d) | | 831 |
| | 869 |
| | — |
| | — |
| | 831 |
| | 869 |
| | 1,700 |
| | (219 | ) | | 1990 | | 07/17/13 | | 14 to 30 Years |
| Circle K | Columbus, GA | | (d) | | 711 |
| | 943 |
| | — |
| | — |
| | 711 |
| | 943 |
| | 1,654 |
| | (208 | ) | | 1990 | | 07/17/13 | | 13 to 32 Years |
| Circle K | Columbus, GA | | (d) | | 574 |
| | 1,039 |
| | — |
| | — |
| | 574 |
| | 1,039 |
| | 1,613 |
| | (211 | ) | | 1984 | | 07/17/13 | | 13 to 32 Years |
| Circle K | Opelika, AL | | (d) | | 960 |
| | 1,716 |
| | — |
| | — |
| | 960 |
| | 1,716 |
| | 2,676 |
| | (469 | ) | | 1988 | | 07/17/13 | | 10 to 25 Years |
| Circle K | Baton Rouge, LA | | (d) | | 260 |
| | 859 |
| | — |
| | — |
| | 260 |
| | 859 |
| | 1,119 |
| | (206 | ) | | 1976 | | 07/17/13 | | 7 to 25 Years |
| Circle K | West Monroe, LA | | (d) | | 686 |
| | 981 |
| | — |
| | — |
| | 686 |
| | 981 |
| | 1,667 |
| | (542 | ) | | 1983 | | 07/17/13 | | 5 to 25 Years |
| Circle K | Copley, OH | | (d) | | 379 |
| | 999 |
| | — |
| | — |
| | 379 |
| | 999 |
| | 1,378 |
| | (236 | ) | | 1993 | | 07/17/13 | | 12 to 28 Years |
| Circle K | Akron, OH | | (d) | | 283 |
| | 1,160 |
| | — |
| | — |
| | 283 |
| | 1,160 |
| | 1,443 |
| | (217 | ) | | 1997 | | 07/17/13 | | 14 to 32 Years |
| Circle K | Akron, OH | | (d) | | 434 |
| | 1,198 |
| | — |
| | — |
| | 434 |
| | 1,198 |
| | 1,632 |
| | (266 | ) | | 1994 | | 07/17/13 | | 14 to 29 Years |
| Circle K | Kent, OH | | (d) | | 258 |
| | 917 |
| | — |
| | — |
| | 258 |
| | 917 |
| | 1,175 |
| | (190 | ) | | 1994 | | 07/17/13 | | 13 to 29 Years |
| Circle K | Huntersville, NC | | (d) | | 1,539 |
| | 924 |
| | — |
| | — |
| | 1,539 |
| | 924 |
| | 2,463 |
| | (344 | ) | | 1996 | | 07/17/13 | | 8 to 35 Years |
| Circle K | Springdale, SC | | (d) | | 794 |
| | 767 |
| | — |
| | — |
| | 794 |
| | 767 |
| | 1,561 |
| | (174 | ) | | 1999 | | 07/17/13 | | 13 to 33 Years |
| Circle K | Charleston, SC | | (d) | | 1,547 |
| | 1,242 |
| | — |
| | — |
| | 1,547 |
| | 1,242 |
| | 2,789 |
| | (403 | ) | | 1987 | | 07/17/13 | | 7 to 20 Years |
| Circle K | Port Wentworth, GA | | (d) | | 1,627 |
| | 1,131 |
| | — |
| | — |
| | 1,627 |
| | 1,131 |
| | 2,758 |
| | (663 | ) | | 1991 | | 07/17/13 | | 4 to 35 Years |
| Circle K | Columbus, GA | | (d) | | 867 |
| | 2,299 |
| | — |
| | — |
| | 867 |
| | 2,299 |
| | 3,166 |
| | (442 | ) | | 1978 | | 07/17/13 | | 13 to 30 Years |
| Circle K | Baton Rouge, LA | | (d) | | 330 |
| | 997 |
| | — |
| | — |
| | 330 |
| | 997 |
| | 1,327 |
| | (206 | ) | | 1970 | | 07/17/13 | | 8 to 30 Years |
| Circle K | Cuyahoga Falls, OH | | (d) | | 342 |
| | 806 |
| | — |
| | — |
| | 342 |
| | 806 |
| | 1,148 |
| | (199 | ) | | 1972 | | 07/17/13 | | 12 to 26 Years |
| Circle K | Akron, OH | | (d) | | 343 |
| | 1,193 |
| | — |
| | — |
| | 343 |
| | 1,193 |
| | 1,536 |
| | (236 | ) | | 1991 | | 07/17/13 | | 15 to 31 Years |
| Circle K | Akron, OH | | (d) | | 513 |
| | 1,251 |
| | — |
| | — |
| | 513 |
| | 1,251 |
| | 1,764 |
| | (257 | ) | | 1996 | | 07/17/13 | | 15 to 31 Years |
| Circle K | Bedford, OH | | (d) | | 750 |
| | 680 |
| | — |
| | — |
| | 750 |
| | 680 |
| | 1,430 |
| | (191 | ) | | 2000 | | 07/17/13 | | 15 to 33 Years |
| Circle K | El Paso, TX | | (d) | | 987 |
| | 558 |
| | — |
| | — |
| | 987 |
| | 558 |
| | 1,545 |
| | (224 | ) | | 1999 | | 07/17/13 | | 3 to 26 Years |
| Circle K | Valley, AL | | (d) | | 754 |
| | 804 |
| | — |
| | — |
| | 754 |
| | 804 |
| | 1,558 |
| | (214 | ) | | 1974 | | 07/17/13 | | 9 to 25 Years |
| Circle K | Midland, GA | | (d) | | 637 |
| | 2,136 |
| | — |
| | — |
| | 637 |
| | 2,136 |
| | 2,773 |
| | (343 | ) | | 1995 | | 07/17/13 | | 9 to 35 Years |
| Circle K | Columbus, GA | | (d) | | 1,465 |
| | 2,088 |
| | — |
| | — |
| | 1,465 |
| | 2,088 |
| | 3,553 |
| | (434 | ) | | 1995 | | 07/17/13 | | 11 to 34 Years |
| Circle K | Baton Rouge, LA | | (d) | | 481 |
| | 913 |
| | — |
| | — |
| | 481 |
| | 913 |
| | 1,394 |
| | (222 | ) | | 1977 | | 07/17/13 | | 8 to 30 Years |
| Circle K | Akron, OH | | (d) | | 321 |
| | 1,179 |
| | — |
| | — |
| | 321 |
| | 1,179 |
| | 1,500 |
| | (239 | ) | | 1994 | | 07/17/13 | | 13 to 29 Years |
| Circle K | Barberton, OH | | (d) | | 884 |
| | 1,885 |
| | — |
| | — |
| | 884 |
| | 1,885 |
| | 2,769 |
| | (389 | ) | | 1981 | | 07/17/13 | | 13 to 34 Years |
SPIRIT REALTY CAPITAL, INC.
Schedule III Real Estate and
Accumulated Depreciation
(Amounts in thousands)
|
| | | | | | | | | | | | | | | | | | | | | | | | | | | | | | | | | |
| | Kansas City, MO | | (a) | | 538 |
| | 936 |
| | — |
| | — |
| | 538 |
| | 936 |
| | 1,474 |
| | (126 | ) | | 1979 | | 12/24/13 | | 15 to 30 Years |
| | Kansas City, MO | | (c) | | 772 |
| | 18 |
| | — |
| | 916 |
| | 772 |
| | 934 |
| | 1,706 |
| | (23 | ) | | 1995 | | 09/19/14 | | 40 to 40 Years |
| | Keene, TX | | (c) | | 343 |
| | 260 |
| | — |
| | — |
| | 343 |
| | 260 |
| | 603 |
| | (11 | ) | | 2005 | | 07/25/16 | | 13 to 30 Years |
| | Kennesaw, GA | | (a) | | 907 |
| | 499 |
| | — |
| | — |
| | 907 |
| | 499 |
| | 1,406 |
| | (241 | ) | | 2001 | | 02/28/06 | | 15 to 40 Years |
| | Kilgore, TX | | (c) | | 140 |
| | 415 |
| | — |
| | — |
| | 140 |
| | 415 |
| | 555 |
| | (97 | ) | | 1985 | | 07/17/13 | | 11 to 20 Years |
| | Killeen, TX | | (c) | | 289 |
| | 513 |
| | — |
| | — |
| | 289 |
| | 513 |
| | 802 |
| | (72 | ) | | 1974 | | 07/17/13 | | 9 to 35 Years |
| | Kingsport, TN | | (a) | | 592 |
| | 200 |
| | — |
| | — |
| | 592 |
| | 200 |
| | 792 |
| | (324 | ) | | 1992 | | 07/01/05 | | 15 to 20 Years |
| | Kingsport, TN | | (a) | | 384 |
| | 877 |
| | — |
| | — |
| | 384 |
| | 877 |
| | 1,261 |
| | (168 | ) | | 1992 | | 12/21/12 | | 15 to 30 Years |
| | Kingsport, TN | | (c) | | 307 |
| | 766 |
| | — |
| | — |
| | 307 |
| | 766 |
| | 1,073 |
| | (113 | ) | | 2007 | | 07/17/13 | | 4 to 32 Years |
| | Kingston, PA | | (c) | | 521 |
| | 635 |
| | — |
| | — |
| | 521 |
| | 635 |
| | 1,156 |
| | (56 | ) | | 1978 | | 11/18/14 | | 15 to 30 Years |
| | Kingsville, TX | | (c) | | 263 |
| | 461 |
| | — |
| | — |
| | 263 |
| | 461 |
| | 724 |
| | (67 | ) | | 1977 | | 07/17/13 | | 9 to 35 Years |
| | Kingwood, WV | | (a) | | 618 |
| | 677 |
| | — |
| | — |
| | 618 |
| | 677 |
| | 1,295 |
| | (183 | ) | | 1979 | | 12/21/12 | | 15 to 20 Years |
| | Kirby, TX | | (c) | | 224 |
| | 262 |
| | — |
| | — |
| | 224 |
| | 262 |
| | 486 |
| | (69 | ) | | 1985 | | 07/17/13 | | 9 to 18 Years |
| | Knoxville, TN | | (a) | | 635 |
| | 227 |
| | — |
| | — |
| | 635 |
| | 227 |
| | 862 |
| | (286 | ) | | 1995 | | 07/01/05 | | 15 to 20 Years |
| | Knoxville, TN | | (a) | | 547 |
| | 230 |
| | — |
| | — |
| | 547 |
| | 230 |
| | 777 |
| | (358 | ) | | 1987 | | 07/01/05 | | 10 to 15 Years |
| | Knoxville, TN | | (a) | | 332 |
| | 185 |
| | — |
| | — |
| | 332 |
| | 185 |
| | 517 |
| | (120 | ) | | 1977 | | 09/01/05 | | 15 to 20 Years |
| | La Feria, TX | | (c) | | 369 |
| | 941 |
| | — |
| | — |
| | 369 |
| | 941 |
| | 1,310 |
| | (118 | ) | | 2003 | | 07/17/13 | | 11 to 35 Years |
| | La Vista, NE | | (a) | | 499 |
| | 664 |
| | — |
| | — |
| | 499 |
| | 664 |
| | 1,163 |
| | (144 | ) | | 1992 | | 10/03/11 | | 15 to 30 Years |
| | Lafayette, LA | | (a) | | 300 |
| | 779 |
| | — |
| | — |
| | 300 |
| | 779 |
| | 1,079 |
| | (97 | ) | | 1972 | | 10/30/13 | | 15 to 30 Years |
| | LaGrange, GA | | (c) | | 555 |
| | 44 |
| | — |
| | — |
| | 555 |
| | 44 |
| | 599 |
| | (135 | ) | | 1978 | | 07/17/13 | | 7 to 30 Years |
| | Lake Worth, TX | | (c) | | 427 |
| | 872 |
| | — |
| | — |
| | 427 |
| | 872 |
| | 1,299 |
| | (19 | ) | | 1983 | | 06/30/16 | | 5 to 30 Years |
| | Laredo, TX | | (c) | | 272 |
| | 713 |
| | — |
| | — |
| | 272 |
| | 713 |
| | 985 |
| | (85 | ) | | 1966 | | 07/17/13 | | 11 to 35 Years |
| | Laredo, TX | | (c) | | 727 |
| | 698 |
| | — |
| | — |
| | 727 |
| | 698 |
| | 1,425 |
| | (88 | ) | | 1968 | | 07/17/13 | | 11 to 35 Years |
| | Lauderdale Lakes, FL | | (a) | | 411 |
| | 346 |
| | — |
| | — |
| | 411 |
| | 346 |
| | 757 |
| | (149 | ) | | 1998 | | 12/29/06 | | 15 to 30 Years |
| | Laurel, MS | | (c) | | 690 |
| | 290 |
| | — |
| | — |
| | 690 |
| | 290 |
| | 980 |
| | (74 | ) | | 1971 | | 07/17/13 | | 11 to 24 Years |
| | Laurel, MS | | (a) | | 543 |
| | 754 |
| | — |
| | — |
| | 543 |
| | 754 |
| | 1,297 |
| | (88 | ) | | 1993 | | 09/22/14 | | 15 to 30 Years |
| | Lavon, TX | | (c) | | 404 |
| | 212 |
| | — |
| | — |
| | 404 |
| | 212 |
| | 616 |
| | (12 | ) | | 2003 | | 07/25/16 | | 13 to 20 Years |
| | Lees Summit, MO | | (a) | | 590 |
| | 69 |
| | 55 |
| | (69 | ) | | 645 |
| | — |
| | 645 |
| | — |
| | (f) | | 09/23/05 | | (f) |
| | Lees Summit, MO | | (a) | | 319 |
| | 906 |
| | — |
| | — |
| | 319 |
| | 906 |
| | 1,225 |
| | (119 | ) | | 1985 | | 12/24/13 | | 15 to 30 Years |
| | Leonard, TX | | (c) | | 323 |
| | 465 |
| | — |
| | — |
| | 323 |
| | 465 |
| | 788 |
| | (14 | ) | | 2005 | | 07/25/16 | | 13 to 30 Years |
| | Lewisville, TX | | (c) | | 913 |
| | 470 |
| | — |
| | — |
| | 913 |
| | 470 |
| | 1,383 |
| | (84 | ) | | 1976 | | 07/17/13 | | 8 to 35 Years |
| | Lexington, KY | | (a) | | 636 |
| | 362 |
| | — |
| | — |
| | 636 |
| | 362 |
| | 998 |
| | (396 | ) | | 1978 | | 12/30/04 | | 10 to 15 Years |
| | Lexington, KY | | (a) | | 713 |
| | 451 |
| | — |
| | — |
| | 713 |
| | 451 |
| | 1,164 |
| | (495 | ) | | 1976 | | 01/26/05 | | 10 to 15 Years |
| | Lillington, NC | | (a) | | 419 |
| | 687 |
| | — |
| | — |
| | 419 |
| | 687 |
| | 1,106 |
| | (249 | ) | | 1992 | | 09/29/06 | | 15 to 40 Years |
|
| | | | | | | | | | | | | | | | | | | | | | | | | |
| | | | | | Initial Cost to Company | | Cost Capitalized Subsequent to Acquisition including impairment | | Gross Amount at December 31, 2016 (d) 2017 (g) | | | | | | | | |
| Concept | City, State | | Encumbrances (e) | | Land and Improvements | | Buildings and Improvements | | Land and Improvements | | Buildings and Improvements | | Land and Improvements | | Buildings and Improvements | | Total | | Final Accumulated Depreciation | | Date of Construction | | Date Acquired | | Life in which depreciation in latest Statement of Operations is computed |
Description | | Encumbrances (e)
| | Land and
Improvements
| | Buildings and
Improvements
| | Improvements/
Land
| | Improvements/
building
| | Land and
Improvements
| | Buildings and
Improvements
| | Total | | Final
Accum
| | Date of
Construction
| | Date
Acquired
| |
|
| | | | | | | | | | | | | | | | | | | | | | | | | | | | | | | | | |
| | Lincoln, IL | | (a) | | 203 |
| | 616 |
| | — |
| | — |
| | 203 |
| | 616 |
| | 819 |
| | (360 | ) | | 1990 | | 09/23/05 | | 15 to 20 Years |
| | Little Elm, TX | | (c) | | 620 |
| | 244 |
| | — |
| | — |
| | 620 |
| | 244 |
| | 864 |
| | (14 | ) | | 2001 | | 07/25/16 | | 13 to 20 Years |
| | Little Rock, AR | | (a) | | 917 |
| | 847 |
| | — |
| | — |
| | 917 |
| | 847 |
| | 1,764 |
| | (389 | ) | | 2004 | | 07/07/05 | | 15 to 30 Years |
| | Little Rock, AR | | (c) | | 99 |
| | 500 |
| | — |
| | — |
| | 99 |
| | 500 |
| | 599 |
| | (77 | ) | | 1970 | | 07/17/13 | | 8 to 30 Years |
| | Little Rock, AR | | (c) | | 332 |
| | 432 |
| | — |
| | — |
| | 332 |
| | 432 |
| | 764 |
| | (61 | ) | | 1971 | | 07/17/13 | | 9 to 35 Years |
| | Little Rock, AR | | (c) | | 263 |
| | 492 |
| | — |
| | — |
| | 263 |
| | 492 |
| | 755 |
| | (71 | ) | | 1975 | | 07/17/13 | | 9 to 35 Years |
| | Lone Tree, CO | | (a) | | 1,717 |
| | 1,117 |
| | — |
| | — |
| | 1,717 |
| | 1,117 |
| | 2,834 |
| | (594 | ) | | 2000 | | 12/23/08 | | 13 to 38 Years |
| | Longview, TX | | (c) | | 149 |
| | 552 |
| | — |
| | — |
| | 149 |
| | 552 |
| | 701 |
| | (81 | ) | | 1985 | | 07/17/13 | | 9 to 35 Years |
| | Louisville, KY | | (a) | | 334 |
| | 251 |
| | — |
| | — |
| | 334 |
| | 251 |
| | 585 |
| | (143 | ) | | 1991 | | 09/24/04 | | 15 to 20 Years |
| | Louisville, KY | | (a) | | 1,010 |
| | 577 |
| | — |
| | — |
| | 1,010 |
| | 577 |
| | 1,587 |
| | (276 | ) | | 1994 | | 11/10/05 | | 15 to 30 Years |
| | Louisville, KY | | (a) | | 854 |
| | 514 |
| | — |
| | — |
| | 854 |
| | 514 |
| | 1,368 |
| | (249 | ) | | 1994 | | 11/10/05 | | 15 to 30 Years |
| | Lubbock, TX | | (a) | | 687 |
| | 856 |
| | — |
| | — |
| | 687 |
| | 856 |
| | 1,543 |
| | (390 | ) | | 2003 | | 07/07/05 | | 15 to 30 Years |
| | Lubbock, TX | | (c) | | 325 |
| | 794 |
| | — |
| | — |
| | 325 |
| | 794 |
| | 1,119 |
| | (114 | ) | | 2004 | | 07/17/13 | | 11 to 34 Years |
| | Mableton, GA | | (a) | | 454 |
| | 826 |
| | — |
| | — |
| | 454 |
| | 826 |
| | 1,280 |
| | (308 | ) | | 1987 | | 02/28/06 | | 15 to 30 Years |
| | Mableton, GA | | (a) | | 634 |
| | 578 |
| | — |
| | — |
| | 634 |
| | 578 |
| | 1,212 |
| | (239 | ) | | 1981 | | 02/28/06 | | 15 to 30 Years |
| | Macon, GA | | (c) | | 291 |
| | 628 |
| | — |
| | — |
| | 291 |
| | 628 |
| | 919 |
| | (85 | ) | | 1983 | | 07/17/13 | | 10 to 35 Years |
| | Macon, GA | | (c) | | 195 |
| | 347 |
| | — |
| | — |
| | 195 |
| | 347 |
| | 542 |
| | (74 | ) | | 1976 | | 07/17/13 | | 9 to 25 Years |
| | Macon, GA | | (c) | | 185 |
| | 553 |
| | — |
| | — |
| | 185 |
| | 553 |
| | 738 |
| | (89 | ) | | 1980 | | 07/17/13 | | 11 to 30 Years |
| | Madison, GA | | (a) | | 892 |
| | 739 |
| | — |
| | — |
| | 892 |
| | 739 |
| | 1,631 |
| | (329 | ) | | 1989 | | 01/12/06 | | 15 to 40 Years |
| | Madisonville, KY | | (a) | | 1,198 |
| | 819 |
| | — |
| | — |
| | 1,198 |
| | 819 |
| | 2,017 |
| | (384 | ) | | 1990 | | 09/24/04 | | 15 to 30 Years |
| | Mansfield, OH | | (a) | | 225 |
| | 327 |
| | — |
| | — |
| | 225 |
| | 327 |
| | 552 |
| | (184 | ) | | 1972 | | 05/25/05 | | 15 to 20 Years |
| | Mansfield, TX | | (a) | | 472 |
| | 760 |
| | — |
| | — |
| | 472 |
| | 760 |
| | 1,232 |
| | (387 | ) | | 1991 | | 12/29/06 | | 15 to 30 Years |
| | Maplewood, MO | | (a) | | 180 |
| | 225 |
| | — |
| | — |
| | 180 |
| | 225 |
| | 405 |
| | (139 | ) | | 1980 | | 05/25/05 | | 15 to 20 Years |
| | Marietta, GA | | (a) | | 797 |
| | 428 |
| | — |
| | — |
| | 797 |
| | 428 |
| | 1,225 |
| | (247 | ) | | 1990 | | 02/28/06 | | 15 to 30 Years |
| | Marietta, GA | | (c) | | 350 |
| | 173 |
| | — |
| | — |
| | 350 |
| | 173 |
| | 523 |
| | (66 | ) | | 1976 | | 07/17/13 | | 11 to 20 Years |
| | Marion, IN | | (a) | | 503 |
| | 153 |
| | — |
| | — |
| | 503 |
| | 153 |
| | 656 |
| | (133 | ) | | 1990 | | 09/24/04 | | 15 to 20 Years |
| | Marlin, TX | | (c) | | 81 |
| | 327 |
| | — |
| | — |
| | 81 |
| | 327 |
| | 408 |
| | (73 | ) | | 1985 | | 07/17/13 | | 8 to 25 Years |
| | Martinsburg, WV | | (a) | | 887 |
| | 992 |
| | — |
| | — |
| | 887 |
| | 992 |
| | 1,879 |
| | (442 | ) | | 1999 | | 12/29/05 | | 15 to 30 Years |
| | Martinsville, IN | | (a) | | 940 |
| | 1,128 |
| | — |
| | — |
| | 940 |
| | 1,128 |
| | 2,068 |
| | (164 | ) | | 1986 | | 07/17/13 | | 4 to 35 Years |
| | Maryville, TN | | (a) | | 810 |
| | 306 |
| | — |
| | — |
| | 810 |
| | 306 |
| | 1,116 |
| | (270 | ) | | 1993 | | 07/01/05 | | 15 to 20 Years |
| | Maryville, TN | | (c) | | 421 |
| | 380 |
| | — |
| | — |
| | 421 |
| | 380 |
| | 801 |
| | (85 | ) | | 2007 | | 07/17/13 | | 4 to 26 Years |
| | Mayfield, KY | | (a) | | 316 |
| | 603 |
| | — |
| | — |
| | 316 |
| | 603 |
| | 919 |
| | (303 | ) | | 1986 | | 12/08/09 | | 12 to 27 Years |
| | McAllen, TX | | (c) | | 747 |
| | 408 |
| | — |
| | — |
| | 747 |
| | 408 |
| | 1,155 |
| | (58 | ) | | 1992 | | 07/17/13 | | 10 to 35 Years |
| | McAllen, TX | | (c) | | 601 |
| | 539 |
| | — |
| | — |
| | 601 |
| | 539 |
| | 1,140 |
| | (80 | ) | | 1985 | | 07/17/13 | | 11 to 35 Years |
| | McDonough, GA | | (a) | | 938 |
| | 697 |
| | — |
| | — |
| | 938 |
| | 697 |
| | 1,635 |
| | (355 | ) | | 1985 | | 09/24/04 | | 15 to 30 Years |
| | McDonough, GA | | (a) | | 179 |
| | 806 |
| | — |
| | 1 |
| | 179 |
| | 807 |
| | 986 |
| | (101 | ) | | 1989 | | 12/24/13 | | 15 to 30 Years |
| | McDonough, GA | | (a) | | 418 |
| | 847 |
| | — |
| | — |
| | 418 |
| | 847 |
| | 1,265 |
| | (119 | ) | | 1995 | | 12/24/13 | | 15 to 30 Years |
| | McKinney, TX | | (c) | | 1,289 |
| | 467 |
| | — |
| | — |
| | 1,289 |
| | 467 |
| | 1,756 |
| | (23 | ) | | 2000 | | 06/30/16 | | 5 to 20 Years |
| | Mebane, NC | | (a) | | 846 |
| | 682 |
| | — |
| | — |
| | 846 |
| | 682 |
| | 1,528 |
| | (290 | ) | | 1993 | | 09/29/06 | | 15 to 30 Years |
| | Melissa, TX | | (c) | | 715 |
| | 609 |
| | — |
| | — |
| | 715 |
| | 609 |
| | 1,324 |
| | (19 | ) | | 2004 | | 07/25/16 | | 13 to 30 Years |
|
| | | | | | | | | | | | | | | | | | | | | | | | | | | | | | | | | |
| Circle K | Norton, OH | | (d) | | 581 |
| | 1,460 |
| | — |
| | — |
| | 581 |
| | 1,460 |
| | 2,041 |
| | (285 | ) | | 1984 | | 07/17/13 | | 13 to 35 Years |
| Circle K | Willoughby, OH | | (d) | | 477 |
| | 1,167 |
| | — |
| | — |
| | 477 |
| | 1,167 |
| | 1,644 |
| | (237 | ) | | 1986 | | 07/17/13 | | 13 to 32 Years |
| Circle K | Columbia, SC | | (d) | | 1,261 |
| | 985 |
| | — |
| | — |
| | 1,261 |
| | 985 |
| | 2,246 |
| | (251 | ) | | 1993 | | 07/17/13 | | 10 to 28 Years |
| Circle K | El Paso, TX | | (d) | | 1,090 |
| | 1,203 |
| | — |
| | — |
| | 1,090 |
| | 1,203 |
| | 2,293 |
| | (426 | ) | | 1999 | | 07/17/13 | | 6 to 35 Years |
| Circle K | Martinez, GA | | (d) | | 626 |
| | 996 |
| | — |
| | — |
| | 626 |
| | 996 |
| | 1,622 |
| | (487 | ) | | 1985 | | 07/17/13 | | 3 to 35 Years |
| Circle K | Pine Mountain, GA | | (d) | | 454 |
| | 1,627 |
| | — |
| | — |
| | 454 |
| | 1,627 |
| | 2,081 |
| | (309 | ) | | 1999 | | 07/17/13 | | 10 to 37 Years |
| Circle K | Beaufort, SC | | (d) | | 850 |
| | 1,337 |
| | — |
| | — |
| | 850 |
| | 1,337 |
| | 2,187 |
| | (294 | ) | | 1997 | | 07/17/13 | | 12 to 34 Years |
| Circle K | West Monroe, LA | | (d) | | 425 |
| | 1,558 |
| | — |
| | — |
| | 425 |
| | 1,558 |
| | 1,983 |
| | (483 | ) | | 1999 | | 07/17/13 | | 3 to 35 Years |
| Circle K | Akron, OH | | (d) | | 402 |
| | 1,263 |
| | — |
| | — |
| | 402 |
| | 1,263 |
| | 1,665 |
| | (228 | ) | | 2000 | | 07/17/13 | | 13 to 34 Years |
| Circle K | Akron, OH | | (d) | | 291 |
| | 1,230 |
| | — |
| | — |
| | 291 |
| | 1,230 |
| | 1,521 |
| | (278 | ) | | 1950 | | 07/17/13 | | 12 to 25 Years |
| Circle K | Canton, OH | | (d) | | 362 |
| | 1,159 |
| | — |
| | — |
| | 362 |
| | 1,159 |
| | 1,521 |
| | (265 | ) | | 1990 | | 07/17/13 | | 12 to 26 Years |
| Circle K | Maple Heights, OH | | (d) | | 747 |
| | 917 |
| | — |
| | — |
| | 747 |
| | 917 |
| | 1,664 |
| | (231 | ) | | 1998 | | 07/17/13 | | 13 to 32 Years |
| Circle K | Brookpark, OH | | (d) | | 623 |
| | 978 |
| | — |
| | — |
| | 623 |
| | 978 |
| | 1,601 |
| | (223 | ) | | 1998 | | 07/17/13 | | 13 to 32 Years |
| Circle K | Charlotte, NC | | (d) | | 1,392 |
| | 563 |
| | — |
| | — |
| | 1,392 |
| | 563 |
| | 1,955 |
| | (316 | ) | | 1991 | | 07/17/13 | | 6 to 32 Years |
| Circle K | Mobile, AL | | (d) | | 552 |
| | 1,664 |
| | — |
| | — |
| | 552 |
| | 1,664 |
| | 2,216 |
| | (407 | ) | | 1987 | | 07/17/13 | | 11 to 24 Years |
| Circle K | Bluffton, SC | | (d) | | 1,531 |
| | 645 |
| | — |
| | — |
| | 1,531 |
| | 645 |
| | 2,176 |
| | (205 | ) | | 1997 | | 07/17/13 | | 10 to 32 Years |
| Circle K | Macon, GA | | (d) | | 471 |
| | 1,066 |
| | — |
| | — |
| | 471 |
| | 1,066 |
| | 1,537 |
| | (351 | ) | | 1993 | | 07/17/13 | | 5 to 35 Years |
|
| | | | | | | | | | | | | | | | | | | | | | | | | | | | | | | | | |
| Circle K | Mobile, AL | | (d) | | 939 |
| | 878 |
| | — |
| | — |
| | 939 |
| | 878 |
| | 1,817 |
| | (280 | ) | | 1988 | | 07/17/13 | | 13 to 25 Years |
| Circle K | Shreveport, LA | | (d) | | 369 |
| | 1,183 |
| | — |
| | — |
| | 369 |
| | 1,183 |
| | 1,552 |
| | (320 | ) | | 1988 | | 07/17/13 | | 4 to 25 Years |
| Circle K | Seville, OH | | (d) | | 1,141 |
| | 2,604 |
| | — |
| | — |
| | 1,141 |
| | 2,604 |
| | 3,745 |
| | (503 | ) | | 2003 | | 07/17/13 | | 15 to 36 Years |
| Circle K | Barberton, OH | | (d) | | 321 |
| | 1,219 |
| | — |
| | — |
| | 321 |
| | 1,219 |
| | 1,540 |
| | (232 | ) | | 1983 | | 07/17/13 | | 14 to 31 Years |
| Circle K | Fairlawn, OH | | (d) | | 616 |
| | 1,064 |
| | — |
| | — |
| | 616 |
| | 1,064 |
| | 1,680 |
| | (262 | ) | | 1993 | | 07/17/13 | | 13 to 28 Years |
| Circle K | Canton, OH | | (d) | | 1,037 |
| | 1,557 |
| | — |
| | — |
| | 1,037 |
| | 1,557 |
| | 2,594 |
| | (376 | ) | | 2000 | | 07/17/13 | | 15 to 34 Years |
| Circle K | Northfield, OH | | (d) | | 873 |
| | 1,633 |
| | — |
| | — |
| | 873 |
| | 1,633 |
| | 2,506 |
| | (354 | ) | | 1983 | | 07/17/13 | | 15 to 35 Years |
| Circle K | Columbus, GA | | (d) | | 730 |
| | 1,317 |
| | — |
| | — |
| | 730 |
| | 1,317 |
| | 2,047 |
| | (295 | ) | | 1978 | | 07/17/13 | | 13 to 28 Years |
| Circle K | Opelika, AL | | (d) | | 400 |
| | 1,321 |
| | — |
| | — |
| | 400 |
| | 1,321 |
| | 1,721 |
| | (309 | ) | | 1989 | | 07/17/13 | | 10 to 24 Years |
| Circle K | Albuquerque, NM | | (d) | | 699 |
| | 777 |
| | — |
| | — |
| | 699 |
| | 777 |
| | 1,476 |
| | (311 | ) | | 1994 | | 07/17/13 | | 9 to 35 Years |
| Circle K | North Augusta, SC | | (d) | | 1,065 |
| | 894 |
| | — |
| | — |
| | 1,065 |
| | 894 |
| | 1,959 |
| | (189 | ) | | 1999 | | 07/17/13 | | 12 to 33 Years |
| Circle K | Bossier City, LA | | (d) | | 565 |
| | 1,051 |
| | (21 | ) | | — |
| | 544 |
| | 1,051 |
| | 1,595 |
| | (249 | ) | | 1987 | | 07/17/13 | | 9 to 25 Years |
| CircusTrix | Clovis, CA | | (d) | | 1,117 |
| | 26 |
| | — |
| | 238 |
| | 1,117 |
| | 264 |
| | 1,381 |
| | (3 | ) | | 2017 | | 12/06/16 | | 10 to 10 Years |
| Clean Freak | Phoenix, AZ | | (d) | | 2,066 |
| | 1,581 |
| | — |
| | — |
| | 2,066 |
| | 1,581 |
| | 3,647 |
| | (111 | ) | | 2009 | | 09/29/16 | | 21 to 30 Years |
SPIRIT REALTY CAPITAL, INC.
Schedule III Real Estate and
Accumulated Depreciation
(Amounts in thousands)
|
| | | | | | | | | | | | | | | | | | | | | | | | | |
| | | | | | Initial Cost to Company | | Cost Capitalized Subsequent to Acquisition including impairment | | Gross Amount at December 31, 2016 (d) 2017 (g) | | | | | | | | |
| Concept | City, State | | Encumbrances (e) | | Land and Improvements | | Buildings and Improvements | | Land and Improvements | | Buildings and Improvements | | Land and Improvements | | Buildings and Improvements | | Total | | Final Accumulated Depreciation | | Date of Construction | | Date Acquired | | Life in which depreciation in latest Statement of Operations is computed |
Description | | Encumbrances (e)
| | Land and
Improvements
| | Buildings and
Improvements
| | Improvements/
Land
| | Improvements/
building
| | Land and
Improvements
| | Buildings and
Improvements
| | Total | | Final
Accum
| | Date of
Construction
| | Date
Acquired
| |
|
| | | | | | | | | | | | | | | | | | | | | | | | | | | | | | | | | |
| | Memphis, TN | | (c) | | 208 |
| | 302 |
| | — |
| | — |
| | 208 |
| | 302 |
| | 510 |
| | (65 | ) | | 2007 | | 07/17/13 | | 3 to 24 Years |
| | Memphis, TN | | (c) | | 128 |
| | 232 |
| | — |
| | — |
| | 128 |
| | 232 |
| | 360 |
| | (60 | ) | | 1971 | | 07/17/13 | | 8 to 20 Years |
| | Memphis, TN | | (c) | | 156 |
| | 351 |
| | — |
| | — |
| | 156 |
| | 351 |
| | 507 |
| | (75 | ) | | 1971 | | 07/17/13 | | 7 to 25 Years |
| | Memphis, TN | | (c) | | 288 |
| | 278 |
| | — |
| | — |
| | 288 |
| | 278 |
| | 566 |
| | (89 | ) | | 1976 | | 07/17/13 | | 6 to 20 Years |
| | Memphis, TN | | (c) | | 206 |
| | 471 |
| | — |
| | — |
| | 206 |
| | 471 |
| | 677 |
| | (89 | ) | | 1979 | | 07/17/13 | | 10 to 25 Years |
| | Memphis, TN | | (c) | | 163 |
| | 295 |
| | — |
| | — |
| | 163 |
| | 295 |
| | 458 |
| | (65 | ) | | 1979 | | 07/17/13 | | 10 to 25 Years |
| | Memphis, TN | | (c) | | 212 |
| | 245 |
| | — |
| | — |
| | 212 |
| | 245 |
| | 457 |
| | (75 | ) | | 1971 | | 07/17/13 | | 7 to 25 Years |
| | Memphis, TN | | (c) | | 180 |
| | 316 |
| | — |
| | — |
| | 180 |
| | 316 |
| | 496 |
| | (76 | ) | | 1971 | | 07/17/13 | | 7 to 20 Years |
| | Memphis, TN | | (c) | | 264 |
| | 592 |
| | — |
| | — |
| | 264 |
| | 592 |
| | 856 |
| | (89 | ) | | 1971 | | 07/17/13 | | 11 to 35 Years |
| | Memphis, TN | | (c) | | 426 |
| | 608 |
| | — |
| | — |
| | 426 |
| | 608 |
| | 1,034 |
| | (100 | ) | | 1971 | | 07/17/13 | | 11 to 32 Years |
| | Memphis, TN | | (a) | | 320 |
| | — |
| | — |
| | — |
| | 320 |
| | — |
| | 320 |
| | — |
| | (f) | | 10/30/13 | | (f) |
| | Mercedes, TX | | (c) | | 535 |
| | 575 |
| | — |
| | — |
| | 535 |
| | 575 |
| | 1,110 |
| | (81 | ) | | 1982 | | 07/17/13 | | 11 to 35 Years |
| | Mesquite, TX | | (c) | | 234 |
| | 459 |
| | — |
| | — |
| | 234 |
| | 459 |
| | 693 |
| | (89 | ) | | 2001 | | 07/17/13 | | 11 to 28 Years |
| | Miami, FL | | (a) | | 602 |
| | 14 |
| | — |
| | — |
| | 602 |
| | 14 |
| | 616 |
| | (183 | ) | | 1978 | | 09/24/04 | | 10 to 15 Years |
| | Miami, FL | | (a) | | 596 |
| | 105 |
| | — |
| | — |
| | 596 |
| | 105 |
| | 701 |
| | (153 | ) | | 1978 | | 09/24/04 | | 10 to 15 Years |
| | Miamisburg, OH | | (c) | | 140 |
| | 262 |
| | — |
| | — |
| | 140 |
| | 262 |
| | 402 |
| | (22 | ) | | 1970 | | 08/21/15 | | 15 to 20 Years |
| | Midland, TX | | (c) | | 195 |
| | 432 |
| | — |
| | — |
| | 195 |
| | 432 |
| | 627 |
| | (60 | ) | | 1972 | | 07/17/13 | | 9 to 35 Years |
| | Midland, TX | | (c) | | 769 |
| | 893 |
| | — |
| | — |
| | 769 |
| | 893 |
| | 1,662 |
| | (37 | ) | | 1982 | | 12/29/15 | | 15 to 30 Years |
| | Midwest City, OK | | (c) | | 318 |
| | 623 |
| | — |
| | — |
| | 318 |
| | 623 |
| | 941 |
| | (87 | ) | | 1985 | | 07/17/13 | | 9 to 35 Years |
| | Milan, IL | | (a) | | 161 |
| | 533 |
| | — |
| | — |
| | 161 |
| | 533 |
| | 694 |
| | (107 | ) | | 1997 | | 10/03/11 | | 15 to 30 Years |
| | Mission, TX | | (c) | | 577 |
| | 598 |
| | — |
| | — |
| | 577 |
| | 598 |
| | 1,175 |
| | (85 | ) | | 1981 | | 07/17/13 | | 9 to 35 Years |
| | Moncks Corner, SC | | (a) | | 573 |
| | 466 |
| | — |
| | — |
| | 573 |
| | 466 |
| | 1,039 |
| | (332 | ) | | 1998 | | 09/24/04 | | 15 to 20 Years |
| | Monroe, GA | | (a) | | 618 |
| | 787 |
| | — |
| | — |
| | 618 |
| | 787 |
| | 1,405 |
| | (113 | ) | | 1977 | | 12/24/13 | | 15 to 30 Years |
| | Montgomery, AL | | (c) | | 288 |
| | 623 |
| | — |
| | — |
| | 288 |
| | 623 |
| | 911 |
| | (84 | ) | | 1998 | | 07/17/13 | | 9 to 35 Years |
| | Montgomery, AL | | (c) | | 177 |
| | 516 |
| | — |
| | — |
| | 177 |
| | 516 |
| | 693 |
| | (131 | ) | | 1984 | | 07/17/13 | | 9 to 19 Years |
| | Montgomery, AL | | (c) | | 247 |
| | 376 |
| | — |
| | — |
| | 247 |
| | 376 |
| | 623 |
| | (96 | ) | | 1999 | | 07/17/13 | | 10 to 24 Years |
| | Montgomery, AL | | (c) | | 455 |
| | 579 |
| | — |
| | — |
| | 455 |
| | 579 |
| | 1,034 |
| | (101 | ) | | 1972 | | 07/17/13 | | 11 to 33 Years |
| | Montgomery, AL | | (c) | | 313 |
| | 601 |
| | — |
| | — |
| | 313 |
| | 601 |
| | 914 |
| | (133 | ) | | 1999 | | 07/17/13 | | 10 to 27 Years |
| | Mooresville, IN | | (a) | | 560 |
| | 549 |
| | — |
| | — |
| | 560 |
| | 549 |
| | 1,109 |
| | (371 | ) | | 1998 | | 09/23/05 | | 15 to 20 Years |
| | Morristown, TN | | (a) | | 588 |
| | 781 |
| | — |
| | — |
| | 588 |
| | 781 |
| | 1,369 |
| | (304 | ) | | 1987 | | 09/01/05 | | 15 to 30 Years |
| | Morrow, GA | | (a) | | 652 |
| | 450 |
| | — |
| | — |
| | 652 |
| | 450 |
| | 1,102 |
| | (212 | ) | | 1995 | | 02/28/06 | | 15 to 30 Years |
| | Morrow, GA | | (a) | | 530 |
| | 568 |
| | — |
| | — |
| | 530 |
| | 568 |
| | 1,098 |
| | (100 | ) | | 2006 | | 02/02/12 | | 15 to 40 Years |
| | Moultrie, GA | | (a) | | 437 |
| | 563 |
| | — |
| | — |
| | 437 |
| | 563 |
| | 1,000 |
| | (105 | ) | | 2012 | | 03/29/13 | | 15 to 30 Years |
| | Moultrie, GA | | (a) | | 359 |
| | 827 |
| | — |
| | — |
| | 359 |
| | 827 |
| | 1,186 |
| | (105 | ) | | 1997 | | 12/24/13 | | 15 to 30 Years |
| | Mount Carmel, TN | | (a) | | 499 |
| | 536 |
| | — |
| | — |
| | 499 |
| | 536 |
| | 1,035 |
| | (130 | ) | | 1988 | | 12/21/12 | | 15 to 30 Years |
| | Mount Pleasant, MI | | (a) | | 485 |
| | 642 |
| | — |
| | — |
| | 485 |
| | 642 |
| | 1,127 |
| | (279 | ) | | 1997 | | 12/29/05 | | 15 to 30 Years |
| | Mount Pleasant, MI | | (a) | | 657 |
| | 854 |
| | — |
| | — |
| | 657 |
| | 854 |
| | 1,511 |
| | (343 | ) | | 2010 | | 02/13/09 | | 13 to 38 Years |
|
| | | | | | | | | | | | | | | | | | | | | | | | | | | | | | | | | |
| Clean Freak | Phoenix, AZ | | (d) | | 1,143 |
| | 439 |
| | — |
| | — |
| | 1,143 |
| | 439 |
| | 1,582 |
| | (41 | ) | | 1970 | | 09/29/16 | | 21 to 30 Years |
| Clean Freak | Chandler, AZ | | (d) | | 1,293 |
| | 1,951 |
| | — |
| | — |
| | 1,293 |
| | 1,951 |
| | 3,244 |
| | (116 | ) | | 2006 | | 09/29/16 | | 21 to 30 Years |
| Clean Freak | Phoenix, AZ | | (d) | | 1,835 |
| | 2,332 |
| | — |
| | 54 |
| | 1,835 |
| | 2,386 |
| | 4,221 |
| | (143 | ) | | 1974 | | 09/29/16 | | 21 to 30 Years |
| Clean Freak | Glendale, AZ | | (d) | | 1,524 |
| | 854 |
| | — |
| | — |
| | 1,524 |
| | 854 |
| | 2,378 |
| | (78 | ) | | 1988 | | 09/29/16 | | 21 to 30 Years |
| Columbus Arts & Tech Academy | Columbus, OH | | (a) | | 417 |
| | 5,100 |
| | — |
| | 849 |
| | 417 |
| | 5,949 |
| | 6,366 |
| | (2,489 | ) | | 1980 | | 03/17/06 | | 13 to 30 Years |
| Columbus Fish Market | Grandview, OH | | (b) | | 2,164 |
| | 1,165 |
| | — |
| | — |
| | 2,164 |
| | 1,165 |
| | 3,329 |
| | (397 | ) | | 1960 | | 07/17/13 | | 9 to 23 Years |
| Columbus Preparatory Academy | Columbus, OH | | (a) | | 1,069 |
| | 3,363 |
| | 330 |
| | 1,340 |
| | 1,399 |
| | 4,703 |
| | 6,102 |
| | (2,875 | ) | | 2004 | | 03/17/06 | | 13 to 20 Years |
| ConForm Automotive | Sidney, OH | | (a) | | 921 |
| | 4,177 |
| | — |
| | — |
| | 921 |
| | 4,177 |
| | 5,098 |
| | (2,525 | ) | | 1987 | | 12/22/05 | | 12 to 20 Years |
| Convergys | Las Cruces, NM | | (d) | | 808 |
| | 6,045 |
| | — |
| | — |
| | 808 |
| | 6,045 |
| | 6,853 |
| | (908 | ) | | 2008 | | 07/17/13 | | 4 to 52 Years |
| Cost-U-Less | St. Croix, VI | | (d) | | 2,132 |
| | 5,992 |
| | — |
| | — |
| | 2,132 |
| | 5,992 |
| | 8,124 |
| | (1,002 | ) | | 2005 | | 07/17/13 | | 8 to 37 Years |
| Courthouse Athletic Club | Salem, OR | | (a) | | 941 |
| | 2,620 |
| | 1,018 |
| | 5,042 |
| | 1,959 |
| | 7,662 |
| | 9,621 |
| | (2,483 | ) | | 1996 | | 12/01/05 | | 15 to 40 Years |
| Courthouse Athletic Club | Salem, OR | | (a) | | 1,509 |
| | 5,635 |
| | — |
| | — |
| | 1,509 |
| | 5,635 |
| | 7,144 |
| | (1,864 | ) | | 2001 | | 12/01/05 | | 15 to 40 Years |
| Courthouse Athletic Club | Salem, OR | | (a) | | 1,214 |
| | 4,911 |
| | — |
| | — |
| | 1,214 |
| | 4,911 |
| | 6,125 |
| | (1,652 | ) | | 1980 | | 12/01/05 | | 15 to 40 Years |
| Courthouse Athletic Club | Keizer, OR | | (a) | | 1,208 |
| | 4,089 |
| | — |
| | — |
| | 1,208 |
| | 4,089 |
| | 5,297 |
| | (1,361 | ) | | 1988 | | 12/01/05 | | 15 to 40 Years |
| Courthouse Athletic Club | Salem, OR | | (a) | | 1,589 |
| | 3,834 |
| | — |
| | — |
| | 1,589 |
| | 3,834 |
| | 5,423 |
| | (1,721 | ) | | 1977 | | 12/01/05 | | 15 to 30 Years |
| CoxHealth | Springfield, MO | | (d) | | 2,025 |
| | 3,911 |
| | — |
| | — |
| | 2,025 |
| | 3,911 |
| | 5,936 |
| | (660 | ) | | 1990 | | 09/23/14 | | 7 to 30 Years |
| Crème de la Crème | Lone Tree, CO | | (a) | | 2,020 |
| | 3,748 |
| | — |
| | — |
| | 2,020 |
| | 3,748 |
| | 5,768 |
| | (1,697 | ) | | 1999 | | 09/29/05 | | 15 to 30 Years |
| Crème de la Crème | Warrenville, IL | | (a) | | 2,542 |
| | 3,813 |
| | — |
| | — |
| | 2,542 |
| | 3,813 |
| | 6,355 |
| | (1,881 | ) | | 1999 | | 09/29/05 | | 15 to 30 Years |
| Crème de la Crème | Leawood, KS | | (a) | | 1,854 |
| | 3,914 |
| | — |
| | — |
| | 1,854 |
| | 3,914 |
| | 5,768 |
| | (1,846 | ) | | 1999 | | 09/29/05 | | 15 to 30 Years |
| Crème de la Crème | Westmont, IL | | (a) | | 1,375 |
| | 5,087 |
| | — |
| | — |
| | 1,375 |
| | 5,087 |
| | 6,462 |
| | (1,584 | ) | | 2003 | | 12/28/05 | | 15 to 40 Years |
| Crème de la Crème | Romeoville, IL | | (a) | | 1,684 |
| | 5,676 |
| | (1 | ) | | — |
| | 1,683 |
| | 5,676 |
| | 7,359 |
| | (1,449 | ) | | 2008 | | 11/07/08 | | 14 to 49 Years |
| Crème de la Crème | Duluth, GA | | (a) | | 2,289 |
| | 4,274 |
| | — |
| | — |
| | 2,289 |
| | 4,274 |
| | 6,563 |
| | (1,889 | ) | | 2007 | | 12/23/08 | | 13 to 48 Years |
| Crème de la Crème | Mount Laurel, NJ | | (a) | | 1,404 |
| | 5,655 |
| | — |
| | — |
| | 1,404 |
| | 5,655 |
| | 7,059 |
| | (1,566 | ) | | 2007 | | 05/01/09 | | 13 to 48 Years |
| Crème de la Crème | Chicago, IL | | (a) | | 5,057 |
| | 5,939 |
| | — |
| | — |
| | 5,057 |
| | 5,939 |
| | 10,996 |
| | (577 | ) | | 2009 | | 05/30/14 | | 15 to 40 Years |
| Crème de la Crème | Barrington, IL | | (a) | | 1,180 |
| | 5,939 |
| | — |
| | — |
| | 1,180 |
| | 5,939 |
| | 7,119 |
| | (620 | ) | | 2008 | | 05/30/14 | | 15 to 40 Years |
SPIRIT REALTY CAPITAL, INC.
Schedule III Real Estate and
Accumulated Depreciation
(Amounts in thousands)
|
| | | | | | | | | | | | | | | | | | | | | | | | | |
| | | | | | Initial Cost to Company | | Cost Capitalized Subsequent to Acquisition including impairment | | Gross Amount at December 31, 2016 (d) 2017 (g) | | | | | | | | |
| Concept | City, State | | Encumbrances (e) | | Land and Improvements | | Buildings and Improvements | | Land and Improvements | | Buildings and Improvements | | Land and Improvements | | Buildings and Improvements | | Total | | Final Accumulated Depreciation | | Date of Construction | | Date Acquired | | Life in which depreciation in latest Statement of Operations is computed |
Description | | Encumbrances (e)
| | Land and
Improvements
| | Buildings and
Improvements
| | Improvements/
Land
| | Improvements/
building
| | Land and
Improvements
| | Buildings and
Improvements
| | Total | | Final
Accum
| | Date of
Construction
| | Date
Acquired
| |
|
| | | | | | | | | | | | | | | | | | | | | | | | | | | | | | | | | |
| | Muskogee, OK | | (c) | | 853 |
| | 767 |
| | — |
| | — |
| | 853 |
| | 767 |
| | 1,620 |
| | (20 | ) | | 1985 | | 06/30/16 | | 5 to 30 Years |
| | Naperville, IL | | (c) | | 976 |
| | — |
| | 27 |
| | — |
| | 1,003 |
| | — |
| | 1,003 |
| | — |
| | (f) | | 06/30/16 | | (f) |
| | Nappanee, IN | | (a) | | 301 |
| | 413 |
| | — |
| | — |
| | 301 |
| | 413 |
| | 714 |
| | (279 | ) | | 2005 | | 12/21/07 | | 15 to 20 Years |
| | Nashville, TN | | (a) | | 264 |
| | — |
| | — |
| | — |
| | 264 |
| | — |
| | 264 |
| | — |
| | (f) | | 10/30/13 | | (f) |
| | Nashville, TN | | (a) | | 538 |
| | — |
| | — |
| | — |
| | 538 |
| | — |
| | 538 |
| | — |
| | (f) | | 10/30/13 | | (f) |
| | New Albany, IN | | (a) | | 497 |
| | 278 |
| | — |
| | — |
| | 497 |
| | 278 |
| | 775 |
| | (172 | ) | | 1992 | | 09/24/04 | | 15 to 30 Years |
| | New Braunfels, TX | | (c) | | 302 |
| | 526 |
| | — |
| | — |
| | 302 |
| | 526 |
| | 828 |
| | (97 | ) | | 1973 | | 07/17/13 | | 10 to 27 Years |
| | New Castle, PA | | (a) | | 573 |
| | 1,042 |
| | — |
| | — |
| | 573 |
| | 1,042 |
| | 1,615 |
| | (222 | ) | | 1999 | | 07/17/13 | | 7 to 25 Years |
| | Niagara Falls, NY | | (a) | | 1,359 |
| | 551 |
| | — |
| | — |
| | 1,359 |
| | 551 |
| | 1,910 |
| | (276 | ) | | 1979 | | 11/10/05 | | 15 to 30 Years |
| | Nogales, AZ | | (c) | | 207 |
| | 448 |
| | — |
| | — |
| | 207 |
| | 448 |
| | 655 |
| | (86 | ) | | 1976 | | 07/17/13 | | 11 to 25 Years |
| | Norcross, GA | | (a) | | 678 |
| | 402 |
| | — |
| | — |
| | 678 |
| | 402 |
| | 1,080 |
| | (240 | ) | | 1982 | | 02/28/06 | | 15 to 20 Years |
| | Norfolk, VA | | (c) | | 373 |
| | 517 |
| | — |
| | — |
| | 373 |
| | 517 |
| | 890 |
| | (131 | ) | | 1988 | | 07/17/13 | | 7 to 20 Years |
| | Normal, IL | | (a) | | 394 |
| | 240 |
| | — |
| | — |
| | 394 |
| | 240 |
| | 634 |
| | (122 | ) | | 1980 | | 12/21/12 | | 10 to 15 Years |
| | Normandy, MO | | (a) | | 265 |
| | 329 |
| | (6 | ) | | — |
| | 259 |
| | 329 |
| | 588 |
| | (203 | ) | | 1978 | | 05/25/05 | | 15 to 20 Years |
| | North Canton, OH | | (a) | | 484 |
| | 497 |
| | (14 | ) | | — |
| | 470 |
| | 497 |
| | 967 |
| | (306 | ) | | 1989 | | 12/29/06 | | 15 to 20 Years |
| | North Little Rock, AR | | (c) | | 128 |
| | 351 |
| | — |
| | — |
| | 128 |
| | 351 |
| | 479 |
| | (66 | ) | | 1999 | | 07/17/13 | | 10 to 28 Years |
| | Oak Ridge, TN | | (a) | | 669 |
| | 548 |
| | — |
| | — |
| | 669 |
| | 548 |
| | 1,217 |
| | (207 | ) | | 1976 | | 09/01/05 | | 15 to 30 Years |
| | Odessa, TX | | (c) | | 597 |
| | 443 |
| | — |
| | — |
| | 597 |
| | 443 |
| | 1,040 |
| | (71 | ) | | 1979 | | 07/17/13 | | 10 to 35 Years |
| | Odessa, TX | | (c) | | 670 |
| | 563 |
| | — |
| | — |
| | 670 |
| | 563 |
| | 1,233 |
| | (84 | ) | | 1972 | | 07/17/13 | | 10 to 35 Years |
| | Odessa, TX | | (c) | | 500 |
| | 941 |
| | — |
| | — |
| | 500 |
| | 941 |
| | 1,441 |
| | (38 | ) | | 1982 | | 12/29/15 | | 15 to 30 Years |
| | Oklahoma City, OK | | (c) | | 223 |
| | 469 |
| | — |
| | — |
| | 223 |
| | 469 |
| | 692 |
| | (110 | ) | | 1998 | | 07/17/13 | | 8 to 22 Years |
| | Oklahoma City, OK | | (c) | | 200 |
| | 428 |
| | — |
| | — |
| | 200 |
| | 428 |
| | 628 |
| | (85 | ) | | 1971 | | 07/17/13 | | 9 to 25 Years |
| | Oklahoma City, OK | | (a) | | 541 |
| | 842 |
| | (398 | ) | | (614 | ) | | 143 |
| | 228 |
| | 371 |
| | (61 | ) | | 2007 | | 07/17/13 | | 4 to 33 Years |
| | Oklahoma City, OK | | (c) | | 474 |
| | 516 |
| | — |
| | — |
| | 474 |
| | 516 |
| | 990 |
| | (19 | ) | | 1984 | | 06/30/16 | | 5 to 20 Years |
| | Oklahoma City, OK | | (c) | | 467 |
| | 273 |
| | — |
| | — |
| | 467 |
| | 273 |
| | 740 |
| | (17 | ) | | 1986 | | 06/30/16 | | 5 to 10 Years |
| | Oklahoma City, OK | | (c) | | 375 |
| | 605 |
| | — |
| | — |
| | 375 |
| | 605 |
| | 980 |
| | (14 | ) | | 1986 | | 06/30/16 | | 5 to 30 Years |
| | Omaha, NE | | (a) | | 539 |
| | 380 |
| | — |
| | — |
| | 539 |
| | 380 |
| | 919 |
| | (62 | ) | | 2006 | | 10/03/11 | | 15 to 40 Years |
| | Opelousas, LA | | (a) | | 419 |
| | 659 |
| | — |
| | — |
| | 419 |
| | 659 |
| | 1,078 |
| | (91 | ) | | 1968 | | 10/30/13 | | 15 to 30 Years |
| | Orange, TX | | (c) | | 541 |
| | 335 |
| | — |
| | — |
| | 541 |
| | 335 |
| | 876 |
| | (43 | ) | | 2007 | | 08/31/15 | | 15 to 30 Years |
| | Orland Park, IL | | (c) | | 999 |
| | — |
| | — |
| | — |
| | 999 |
| | — |
| | 999 |
| | — |
| | (f) | | 09/12/16 | | (f) |
| | Orlando, FL | | (a) | | 1,249 |
| | 729 |
| | — |
| | — |
| | 1,249 |
| | 729 |
| | 1,978 |
| | (498 | ) | | 1985 | | 06/25/04 | | 15 to 20 Years |
| | Orlando, FL | | (a) | | 642 |
| | 178 |
| | — |
| | — |
| | 642 |
| | 178 |
| | 820 |
| | (237 | ) | | 1967 | | 12/30/04 | | 10 to 15 Years |
| | Oshkosh, WI | | (a) | | 765 |
| | 829 |
| | (40 | ) | | 300 |
| | 725 |
| | 1,129 |
| | 1,854 |
| | (570 | ) | | 1984 | | 12/29/05 | | 15 to 20 Years |
| | Overland, MO | | (a) | | 278 |
| | 494 |
| | — |
| | — |
| | 278 |
| | 494 |
| | 772 |
| | (276 | ) | | 1972 | | 05/25/05 | | 15 to 20 Years |
|
| | | | | | | | | | | | | | | | | | | | | | | | | | | | | | | | | |
| Crown Distributing LLC | Arlington, WA | | (d) | | 1,860 |
| | 10,402 |
| | — |
| | — |
| | 1,860 |
| | 10,402 |
| | 12,262 |
| | (967 | ) | | 2002 | | 11/21/14 | | 7 to 40 Years |
| Crunch Fitness | Aurora, IL | | (b) | | 668 |
| | 2,615 |
| | — |
| | 23 |
| | 668 |
| | 2,638 |
| | 3,306 |
| | (133 | ) | | 2006 | | 11/29/16 | | 9 to 30 Years |
| Crunch Fitness | Eagle, ID | | (d) | | 1,428 |
| | 5,591 |
| | — |
| | 430 |
| | 1,428 |
| | 6,021 |
| | 7,449 |
| | (228 | ) | | 1999 | | 12/28/16 | | 10 to 30 Years |
| Crunch Fitness | Boise, ID | | (d) | | 1,335 |
| | 4,982 |
| | — |
| | 305 |
| | 1,335 |
| | 5,287 |
| | 6,622 |
| | (206 | ) | | 2001 | | 12/28/16 | | 8 to 30 Years |
| Crunch Fitness | Boise, ID | | (d) | | 823 |
| | 3,178 |
| | — |
| | 313 |
| | 823 |
| | 3,491 |
| | 4,314 |
| | (103 | ) | | 2003 | | 12/28/16 | | 10 to 40 Years |
| Crunch Fitness | Meridian, ID | | (d) | | 840 |
| | 2,950 |
| | — |
| | 273 |
| | 840 |
| | 3,223 |
| | 4,063 |
| | (114 | ) | | 1993 | | 12/28/16 | | 8 to 30 Years |
| C-Store (GPM Investments, LLC) | Daleville, VA | | (d) | | 467 |
| | 616 |
| | — |
| | — |
| | 467 |
| | 616 |
| | 1,083 |
| | (79 | ) | | 1989 | | 06/30/15 | | 15 to 30 Years |
| C-Store (GPM Investments, LLC) | Forest, VA | | (d) | | 248 |
| | 834 |
| | — |
| | — |
| | 248 |
| | 834 |
| | 1,082 |
| | (89 | ) | | 1995 | | 06/30/15 | | 15 to 30 Years |
| C-Store (GPM Investments, LLC) | Rustburg, VA | | (d) | | 526 |
| | 775 |
| | — |
| | — |
| | 526 |
| | 775 |
| | 1,301 |
| | (106 | ) | | 1990 | | 06/30/15 | | 15 to 30 Years |
| C-Store (GPM Investments, LLC) | Madison Heights, VA | | (d) | | 268 |
| | 417 |
| | — |
| | — |
| | 268 |
| | 417 |
| | 685 |
| | (51 | ) | | 1983 | | 06/30/15 | | 15 to 30 Years |
| C-Store (GPM Investments, LLC) | Lynchburg, VA | | (d) | | 467 |
| | 1,391 |
| | — |
| | — |
| | 467 |
| | 1,391 |
| | 1,858 |
| | (142 | ) | | 2006 | | 06/30/15 | | 15 to 30 Years |
| C-Store (GPM Investments, LLC) | Altavista, VA | | (d) | | 358 |
| | 1,401 |
| | — |
| | — |
| | 358 |
| | 1,401 |
| | 1,759 |
| | (140 | ) | | 1981 | | 06/30/15 | | 15 to 30 Years |
| C-Store (GPM Investments, LLC) | Altavista, VA | | (d) | | 467 |
| | 745 |
| | — |
| | — |
| | 467 |
| | 745 |
| | 1,212 |
| | (90 | ) | | 1984 | | 06/30/15 | | 15 to 30 Years |
| C-Store (GPM Investments, LLC) | South Boston, VA | | (d) | | 377 |
| | 705 |
| | — |
| | — |
| | 377 |
| | 705 |
| | 1,082 |
| | (75 | ) | | 1988 | | 06/30/15 | | 15 to 30 Years |
| C-Store (GPM Investments, LLC) | Blairs, VA | | (d) | | 318 |
| | 636 |
| | — |
| | — |
| | 318 |
| | 636 |
| | 954 |
| | (70 | ) | | 1987 | | 06/30/15 | | 15 to 30 Years |
| C-Store (GPM Investments, LLC) | Beattyville, KY | | (d) | | 278 |
| | 795 |
| | — |
| | — |
| | 278 |
| | 795 |
| | 1,073 |
| | (84 | ) | | 1981 | | 06/30/15 | | 15 to 30 Years |
| C-Store (GPM Investments, LLC) | Winchester, KY | | (d) | | 755 |
| | 775 |
| | — |
| | — |
| | 755 |
| | 775 |
| | 1,530 |
| | (104 | ) | | 1981 | | 06/30/15 | | 15 to 30 Years |
| C-Store (GPM Investments, LLC) | Irvine, KY | | (d) | | 219 |
| | 666 |
| | — |
| | — |
| | 219 |
| | 666 |
| | 885 |
| | (80 | ) | | 1987 | | 06/30/15 | | 15 to 30 Years |
| C-Store (GPM Investments, LLC) | Paris, KY | | (d) | | 129 |
| | 636 |
| | — |
| | — |
| | 129 |
| | 636 |
| | 765 |
| | (65 | ) | | 1988 | | 06/30/15 | | 15 to 30 Years |
| C-Store (GPM Investments, LLC) | Carlisle, KY | | (d) | | 209 |
| | 586 |
| | — |
| | — |
| | 209 |
| | 586 |
| | 795 |
| | (67 | ) | | 1989 | | 06/30/15 | | 15 to 30 Years |
| C-Store (GPM Investments, LLC) | Georgetown, KY | | (d) | | 725 |
| | 805 |
| | — |
| | — |
| | 725 |
| | 805 |
| | 1,530 |
| | (103 | ) | | 1989 | | 06/30/15 | | 15 to 30 Years |
SPIRIT REALTY CAPITAL, INC.
Schedule III Real Estate and
Accumulated Depreciation
(Amounts in thousands)
|
| | | | | | | | | | | | | | | | | | | | | | | | | |
| | | | | | Initial Cost to Company | | Cost Capitalized Subsequent to Acquisition including impairment | | Gross Amount at December 31, 2016 (d) 2017 (g) | | | | | | | | |
| Concept | City, State | | Encumbrances (e) | | Land and Improvements | | Buildings and Improvements | | Land and Improvements | | Buildings and Improvements | | Land and Improvements | | Buildings and Improvements | | Total | | Final Accumulated Depreciation | | Date of Construction | | Date Acquired | | Life in which depreciation in latest Statement of Operations is computed |
Description | | Encumbrances (e)
| | Land and
Improvements
| | Buildings and
Improvements
| | Improvements/
Land
| | Improvements/
building
| | Land and
Improvements
| | Buildings and
Improvements
| | Total | | Final
Accum
| | Date of
Construction
| | Date
Acquired
| |
|
| | | | | | | | | | | | | | | | | | | | | | | | | | | | | | | | | |
| | Parkersburg, WV | | (a) | | 416 |
| | 658 |
| | — |
| | 75 |
| | 416 |
| | 733 |
| | 1,149 |
| | (447 | ) | | 1986 | | 03/07/07 | | 4 to 20 Years |
| | Parkersburg, WV | | (a) | | 457 |
| | 309 |
| | — |
| | — |
| | 457 |
| | 309 |
| | 766 |
| | (163 | ) | | 1999 | | 12/21/12 | | 10 to 15 Years |
| | Parma Heights, OH | | (a) | | 598 |
| | 535 |
| | — |
| | — |
| | 598 |
| | 535 |
| | 1,133 |
| | (210 | ) | | 2004 | | 08/27/09 | | 13 to 38 Years |
| | Paxton, IL | | (a) | | 324 |
| | 658 |
| | — |
| | — |
| | 324 |
| | 658 |
| | 982 |
| | (456 | ) | | 1986 | | 12/29/05 | | 15 to 20 Years |
| | Pearson, GA | | (a) | | 159 |
| | 817 |
| | — |
| | — |
| | 159 |
| | 817 |
| | 976 |
| | (106 | ) | | 1994 | | 12/24/13 | | 15 to 30 Years |
| | Pensacola, FL | | (a) | | 860 |
| | 291 |
| | — |
| | — |
| | 860 |
| | 291 |
| | 1,151 |
| | (393 | ) | | 1977 | | 07/28/04 | | 10 to 15 Years |
| | Peoria, IL | | (a) | | 154 |
| | 320 |
| | — |
| | — |
| | 154 |
| | 320 |
| | 474 |
| | (196 | ) | | 1976 | | 05/25/05 | | 15 to 20 Years |
| | Peoria, IL | | (a) | | 383 |
| | 270 |
| | — |
| | — |
| | 383 |
| | 270 |
| | 653 |
| | (141 | ) | | 1980 | | 12/21/12 | | 10 to 15 Years |
| | Peoria, IL | | (a) | | 282 |
| | 435 |
| | — |
| | — |
| | 282 |
| | 435 |
| | 717 |
| | (123 | ) | | 1980 | | 12/21/12 | | 15 to 20 Years |
| | Pharr, TX | | (c) | | 694 |
| | 441 |
| | — |
| | — |
| | 694 |
| | 441 |
| | 1,135 |
| | (90 | ) | | 1997 | | 07/17/13 | | 10 to 26 Years |
| | Phenix City, AL | | (c) | | 493 |
| | 497 |
| | — |
| | — |
| | 493 |
| | 497 |
| | 990 |
| | (62 | ) | | 1978 | | 07/17/13 | | 8 to 35 Years |
| | Philippi, WV | | (a) | | 405 |
| | 232 |
| | — |
| | — |
| | 405 |
| | 232 |
| | 637 |
| | (133 | ) | | 1986 | | 12/21/12 | | 10 to 15 Years |
| | Phoenix, AZ | | (c) | | 523 |
| | 97 |
| | — |
| | — |
| | 523 |
| | 97 |
| | 620 |
| | (46 | ) | | 1976 | | 07/17/13 | | 9 to 16 Years |
| | Phoenix, AZ | | (c) | | 321 |
| | 276 |
| | — |
| | — |
| | 321 |
| | 276 |
| | 597 |
| | (74 | ) | | 1975 | | 07/17/13 | | 10 to 20 Years |
| | Phoenix, AZ | | (c) | | 384 |
| | 528 |
| | — |
| | — |
| | 384 |
| | 528 |
| | 912 |
| | (90 | ) | | 1974 | | 07/17/13 | | 11 to 27 Years |
| | Phoenix, AZ | | (c) | | 368 |
| | 267 |
| | — |
| | — |
| | 368 |
| | 267 |
| | 635 |
| | (56 | ) | | 1974 | | 07/17/13 | | 11 to 23 Years |
| | Phoenix, AZ | | (c) | | 415 |
| | 403 |
| | — |
| | — |
| | 415 |
| | 403 |
| | 818 |
| | (69 | ) | | 1975 | | 07/17/13 | | 8 to 27 Years |
| | Phoenix, AZ | | (c) | | 599 |
| | 412 |
| | — |
| | — |
| | 599 |
| | 412 |
| | 1,011 |
| | (67 | ) | | 1980 | | 07/17/13 | | 10 to 35 Years |
| | Phoenix, AZ | | (c) | | 400 |
| | 120 |
| | — |
| | — |
| | 400 |
| | 120 |
| | 520 |
| | (50 | ) | | 1977 | | 07/17/13 | | 11 to 13 Years |
| | Pilot Point, TX | | (c) | | 446 |
| | 436 |
| | — |
| | — |
| | 446 |
| | 436 |
| | 882 |
| | (16 | ) | | 2000 | | 07/25/16 | | 13 to 30 Years |
| | Pine Bluff, AR | | (c) | | 854 |
| | 431 |
| | — |
| | — |
| | 854 |
| | 431 |
| | 1,285 |
| | (58 | ) | | 1971 | | 07/17/13 | | 7 to 35 Years |
| | Pineville, LA | | (a) | | 558 |
| | 1,044 |
| | — |
| | — |
| | 558 |
| | 1,044 |
| | 1,602 |
| | (442 | ) | | 1996 | | 06/25/04 | | 11 to 30 Years |
| | Pleasanton, TX | | (c) | | 230 |
| | 1,052 |
| | — |
| | — |
| | 230 |
| | 1,052 |
| | 1,282 |
| | (136 | ) | | 1985 | | 07/17/13 | | 11 to 35 Years |
| | Ponca City, OK | | (c) | | 93 |
| | 249 |
| | — |
| | — |
| | 93 |
| | 249 |
| | 342 |
| | (52 | ) | | 2007 | | 07/17/13 | | 4 to 28 Years |
| | Port Allen, LA | | (a) | | 521 |
| | 575 |
| | — |
| | — |
| | 521 |
| | 575 |
| | 1,096 |
| | (311 | ) | | 1997 | | 09/24/04 | | 15 to 30 Years |
| | Port Arthur, TX | | (c) | | 188 |
| | 256 |
| | — |
| | — |
| | 188 |
| | 256 |
| | 444 |
| | (28 | ) | | 1976 | | 08/31/15 | | 15 to 20 Years |
| | Port Arthur, TX | | (c) | | 384 |
| | 266 |
| | — |
| | — |
| | 384 |
| | 266 |
| | 650 |
| | (41 | ) | | 2002 | | 08/31/15 | | 15 to 20 Years |
| | Port Arthur, TX | | (c) | | 403 |
| | 344 |
| | — |
| | — |
| | 403 |
| | 344 |
| | 747 |
| | (46 | ) | | 2004 | | 08/31/15 | | 15 to 20 Years |
| | Port Isabel, TX | | (c) | | 348 |
| | 672 |
| | — |
| | — |
| | 348 |
| | 672 |
| | 1,020 |
| | (102 | ) | | 2004 | | 07/17/13 | | 11 to 31 Years |
| | Port Lavaca, TX | | (c) | | 339 |
| | 594 |
| | — |
| | — |
| | 339 |
| | 594 |
| | 933 |
| | (97 | ) | | 1985 | | 07/17/13 | | 11 to 28 Years |
| | Portsmouth, VA | | (c) | | 574 |
| | 419 |
| | — |
| | — |
| | 574 |
| | 419 |
| | 993 |
| | (93 | ) | | 1988 | | 07/17/13 | | 10 to 25 Years |
| | Powell, TN | | (c) | | 411 |
| | 353 |
| | — |
| | — |
| | 411 |
| | 353 |
| | 764 |
| | (82 | ) | | 2007 | | 07/17/13 | | 4 to 26 Years |
| | Princeton, IN | | (a) | | 340 |
| | 906 |
| | — |
| | — |
| | 340 |
| | 906 |
| | 1,246 |
| | (262 | ) | | 1992 | | 07/17/13 | | 7 to 15 Years |
| | Prosper, TX | | (c) | | 990 |
| | 435 |
| | — |
| | — |
| | 990 |
| | 435 |
| | 1,425 |
| | (18 | ) | | 2004 | | 07/25/16 | | 13 to 30 Years |
| | Pulaski, VA | | (a) | | 444 |
| | 236 |
| | — |
| | — |
| | 444 |
| | 236 |
| | 680 |
| | (295 | ) | | 1994 | | 07/01/05 | | 15 to 20 Years |
| | Quincy, FL | | (a) | | 1,015 |
| | 416 |
| | — |
| | — |
| | 1,015 |
| | 416 |
| | 1,431 |
| | (427 | ) | | 1989 | | 09/24/04 | | 15 to 20 Years |
| | Quitman, GA | | (a) | | 259 |
| | 936 |
| | — |
| | — |
| | 259 |
| | 936 |
| | 1,195 |
| | (118 | ) | | 1985 | | 12/24/13 | | 15 to 30 Years |
| | Radford, VA | | (a) | | 499 |
| | 248 |
| | — |
| | — |
| | 499 |
| | 248 |
| | 747 |
| | (347 | ) | | 1995 | | 07/01/05 | | 15 to 20 Years |
|
| | | | | | | | | | | | | | | | | | | | | | | | | | | | | | | | | |
| C-Store (GPM Investments, LLC) | Georgetown, KY | | (d) | | 815 |
| | 934 |
| | — |
| | — |
| | 815 |
| | 934 |
| | 1,749 |
| | (116 | ) | | 1998 | | 06/30/15 | | 15 to 30 Years |
| C-Store (GPM Investments, LLC) | Mount Sterling, KY | | (d) | | 1,103 |
| | 1,103 |
| | — |
| | — |
| | 1,103 |
| | 1,103 |
| | 2,206 |
| | (150 | ) | | 2000 | | 06/30/15 | | 15 to 30 Years |
| C-Store (GPM Investments, LLC) | Harrodsburg, KY | | (d) | | 228 |
| | 824 |
| | — |
| | — |
| | 228 |
| | 824 |
| | 1,052 |
| | (89 | ) | | 1973 | | 06/30/15 | | 15 to 30 Years |
| C-Store (GPM Investments, LLC) | Carlisle, KY | | (d) | | 298 |
| | 874 |
| | — |
| | — |
| | 298 |
| | 874 |
| | 1,172 |
| | (101 | ) | | 2005 | | 06/30/15 | | 15 to 30 Years |
| C-Store (GPM Investments, LLC) | Salem, VA | | (d) | | 209 |
| | 576 |
| | — |
| | — |
| | 209 |
| | 576 |
| | 785 |
| | (66 | ) | | 1970 | | 06/30/15 | | 15 to 30 Years |
| C-Store (GPM Investments, LLC) | Salem, VA | | (d) | | 646 |
| | 517 |
| | — |
| | — |
| | 646 |
| | 517 |
| | 1,163 |
| | (73 | ) | | 1987 | | 06/30/15 | | 15 to 30 Years |
| C-Store (GPM Investments, LLC) | Roanoke, VA | | (d) | | 238 |
| | 497 |
| | — |
| | — |
| | 238 |
| | 497 |
| | 735 |
| | (53 | ) | | 1988 | | 06/30/15 | | 15 to 30 Years |
| C-Store (GPM Investments, LLC) | Roanoke, VA | | (d) | | 616 |
| | 534 |
| | — |
| | — |
| | 616 |
| | 534 |
| | 1,150 |
| | (76 | ) | | 1988 | | 06/30/15 | | 15 to 30 Years |
| C-Store (GPM Investments, LLC) | Bedford, VA | | (d) | | 258 |
| | 818 |
| | — |
| | — |
| | 258 |
| | 818 |
| | 1,076 |
| | (88 | ) | | 1997 | | 06/30/15 | | 15 to 30 Years |
| C-Store (GPM Investments, LLC) | Lynchburg, VA | | (d) | | 278 |
| | 699 |
| | — |
| | — |
| | 278 |
| | 699 |
| | 977 |
| | (70 | ) | | 1967 | | 06/30/15 | | 15 to 30 Years |
| C-Store (GPM Investments, LLC) | Gretna, VA | | (d) | | 268 |
| | 798 |
| | — |
| | — |
| | 268 |
| | 798 |
| | 1,066 |
| | (93 | ) | | 1978 | | 06/30/15 | | 15 to 30 Years |
| C-Store (GPM Investments, LLC) | Lynchburg, VA | | (d) | | 517 |
| | 1,142 |
| | — |
| | — |
| | 517 |
| | 1,142 |
| | 1,659 |
| | (128 | ) | | 2000 | | 06/30/15 | | 15 to 30 Years |
| C-Store (GPM Investments, LLC) | Moneta, VA | | (d) | | 437 |
| | 934 |
| | — |
| | — |
| | 437 |
| | 934 |
| | 1,371 |
| | (118 | ) | | 1999 | | 06/30/15 | | 15 to 30 Years |
| C-Store (GPM Investments, LLC) | Hurt, VA | | (d) | | 685 |
| | 1,023 |
| | — |
| | — |
| | 685 |
| | 1,023 |
| | 1,708 |
| | (133 | ) | | 1973 | | 06/30/15 | | 15 to 30 Years |
| C-Store (GPM Investments, LLC) | South Boston, VA | | (d) | | 407 |
| | 834 |
| | — |
| | — |
| | 407 |
| | 834 |
| | 1,241 |
| | (89 | ) | | 1983 | | 06/30/15 | | 15 to 30 Years |
| C-Store (GPM Investments, LLC) | South Boston, VA | | (d) | | 894 |
| | 1,232 |
| | — |
| | — |
| | 894 |
| | 1,232 |
| | 2,126 |
| | (147 | ) | | 1997 | | 06/30/15 | | 15 to 30 Years |
| C-Store (GPM Investments, LLC) | Gretna, VA | | (d) | | 159 |
| | 1,083 |
| | — |
| | — |
| | 159 |
| | 1,083 |
| | 1,242 |
| | (108 | ) | | 1996 | | 06/30/15 | | 15 to 30 Years |
| C-Store (GPM Investments, LLC) | Danville, VA | | (d) | | 348 |
| | 477 |
| | — |
| | — |
| | 348 |
| | 477 |
| | 825 |
| | (61 | ) | | 1989 | | 06/30/15 | | 15 to 30 Years |
| C-Store (GPM Investments, LLC) | South Boston, VA | | (d) | | 368 |
| | 517 |
| | — |
| | — |
| | 368 |
| | 517 |
| | 885 |
| | (71 | ) | | 1997 | | 06/30/15 | | 15 to 30 Years |
SPIRIT REALTY CAPITAL, INC.
Schedule III Real Estate and
Accumulated Depreciation
(Amounts in thousands)
|
| | | | | | | | | | | | | | | | | | | | | | | | | |
| | | | | | Initial Cost to Company | | Cost Capitalized Subsequent to Acquisition including impairment | | Gross Amount at December 31, 2016 (d) 2017 (g) | | | | | | | | |
| Concept | City, State | | Encumbrances (e) | | Land and Improvements | | Buildings and Improvements | | Land and Improvements | | Buildings and Improvements | | Land and Improvements | | Buildings and Improvements | | Total | | Final Accumulated Depreciation | | Date of Construction | | Date Acquired | | Life in which depreciation in latest Statement of Operations is computed |
Description | | Encumbrances (e)
| | Land and
Improvements
| | Buildings and
Improvements
| | Improvements/
Land
| | Improvements/
building
| | Land and
Improvements
| | Buildings and
Improvements
| | Total | | Final
Accum
| | Date of
Construction
| | Date
Acquired
| |
|
| | | | | | | | | | | | | | | | | | | | | | | | | | | | | | | | | |
| | Raleigh, NC | | (a) | | 639 |
| | 320 |
| | — |
| | — |
| | 639 |
| | 320 |
| | 959 |
| | (77 | ) | | 2008 | | 09/17/13 | | 15 to 30 Years |
| | Raymondville, TX | | (c) | | 660 |
| | 455 |
| | — |
| | — |
| | 660 |
| | 455 |
| | 1,115 |
| | (81 | ) | | 1984 | | 07/17/13 | | 9 to 35 Years |
| | Red Bank, TN | | (a) | | 610 |
| | 557 |
| | — |
| | — |
| | 610 |
| | 557 |
| | 1,167 |
| | (349 | ) | | 1997 | | 06/25/04 | | 15 to 30 Years |
| | Richland Hills, TX | | (c) | | 229 |
| | 199 |
| | — |
| | — |
| | 229 |
| | 199 |
| | 428 |
| | (48 | ) | | 1999 | | 07/17/13 | | 10 to 25 Years |
| | Rio Grand City, TX | | (c) | | 1,746 |
| | 554 |
| | — |
| | — |
| | 1,746 |
| | 554 |
| | 2,300 |
| | (79 | ) | | 1984 | | 07/17/13 | | 12 to 35 Years |
| | Riverdale, GA | | (c) | | 742 |
| | 1,789 |
| | — |
| | — |
| | 742 |
| | 1,789 |
| | 2,531 |
| | (91 | ) | | 2010 | | 09/17/15 | | 15 to 30 Years |
| | Robinson, IL | | (a) | | 250 |
| | 1,021 |
| | — |
| | — |
| | 250 |
| | 1,021 |
| | 1,271 |
| | (157 | ) | | 1994 | | 07/17/13 | | 7 to 33 Years |
| | Rochester, MN | | (a) | | 561 |
| | 83 |
| | 66 |
| | (83 | ) | | 627 |
| | — |
| | 627 |
| | — |
| | (f) | | 09/23/05 | | (f) |
| | Rock Hill, SC | | (a) | | 373 |
| | 722 |
| | — |
| | — |
| | 373 |
| | 722 |
| | 1,095 |
| | (414 | ) | | 1978 | | 12/29/05 | | 15 to 20 Years |
| | Rockwell, NC | | (a) | | 385 |
| | 385 |
| | — |
| | — |
| | 385 |
| | 385 |
| | 770 |
| | (89 | ) | | 2006 | | 09/17/13 | | 15 to 30 Years |
| | Rogers, AR | | (c) | | 334 |
| | 884 |
| | — |
| | — |
| | 334 |
| | 884 |
| | 1,218 |
| | (77 | ) | | 2005 | | 09/30/14 | | 15 to 30 Years |
| | Rogersville, TN | | (a) | | 384 |
| | 964 |
| | — |
| | — |
| | 384 |
| | 964 |
| | 1,348 |
| | (183 | ) | | 1986 | | 12/21/12 | | 15 to 30 Years |
| | Rolesville, NC | | (a) | | 526 |
| | 320 |
| | — |
| | — |
| | 526 |
| | 320 |
| | 846 |
| | (73 | ) | | 2007 | | 09/17/13 | | 15 to 30 Years |
| | Rolla, MO | | (a) | | 229 |
| | 857 |
| | — |
| | — |
| | 229 |
| | 857 |
| | 1,086 |
| | (110 | ) | | 1978 | | 12/24/13 | | 15 to 30 Years |
| | Roma, TX | | (c) | | 478 |
| | 855 |
| | — |
| | — |
| | 478 |
| | 855 |
| | 1,333 |
| | (123 | ) | | 1985 | | 07/17/13 | | 11 to 35 Years |
| | Romeoville, IL | | (a) | | 789 |
| | 713 |
| | (62 | ) | | — |
| | 727 |
| | 713 |
| | 1,440 |
| | (405 | ) | | 1999 | | 09/23/05 | | 15 to 20 Years |
| | Roswell, GA | | (a) | | 513 |
| | 559 |
| | — |
| | — |
| | 513 |
| | 559 |
| | 1,072 |
| | (93 | ) | | 2006 | | 02/02/12 | | 15 to 40 Years |
| | Roswell, NM | | (c) | | 343 |
| | 321 |
| | — |
| | — |
| | 343 |
| | 321 |
| | 664 |
| | (96 | ) | | 1974 | | 07/17/13 | | 11 to 23 Years |
| | Saint Ann, MO | | (a) | | 588 |
| | 613 |
| | — |
| | — |
| | 588 |
| | 613 |
| | 1,201 |
| | (425 | ) | | 1985 | | 09/23/05 | | 15 to 20 Years |
| | Saint Cloud, FL | | (a) | | 1,193 |
| | 557 |
| | — |
| | — |
| | 1,193 |
| | 557 |
| | 1,750 |
| | (357 | ) | | 1983 | | 06/25/04 | | 15 to 20 Years |
| | Salisbury, NC | | (a) | | 357 |
| | 338 |
| | — |
| | — |
| | 357 |
| | 338 |
| | 695 |
| | (59 | ) | | 2002 | | 09/17/13 | | 15 to 30 Years |
| | San Antonio, TX | | (a) | | 517 |
| | 373 |
| | — |
| | — |
| | 517 |
| | 373 |
| | 890 |
| | (200 | ) | | 2002 | | 09/25/06 | | 15 to 30 Years |
| | San Antonio, TX | | (a) | | 349 |
| | 429 |
| | — |
| | — |
| | 349 |
| | 429 |
| | 778 |
| | (261 | ) | | 1983 | | 09/25/06 | | 15 to 20 Years |
| | San Antonio, TX | | (a) | | 428 |
| | 339 |
| | — |
| | — |
| | 428 |
| | 339 |
| | 767 |
| | (185 | ) | | 2001 | | 09/25/06 | | 15 to 30 Years |
| | San Antonio, TX | | (a) | | 539 |
| | 300 |
| | — |
| | — |
| | 539 |
| | 300 |
| | 839 |
| | (200 | ) | | 2001 | | 09/25/06 | | 15 to 30 Years |
| | San Antonio, TX | | (c) | | 205 |
| | 1,042 |
| | — |
| | — |
| | 205 |
| | 1,042 |
| | 1,247 |
| | (205 | ) | | 1976 | | 07/17/13 | | 10 to 20 Years |
| | San Antonio, TX | | (c) | | 685 |
| | 257 |
| | — |
| | — |
| | 685 |
| | 257 |
| | 942 |
| | (44 | ) | | 1976 | | 07/17/13 | | 9 to 35 Years |
| | San Antonio, TX | | (c) | | 592 |
| | 336 |
| | — |
| | — |
| | 592 |
| | 336 |
| | 928 |
| | (56 | ) | | 1968 | | 07/17/13 | | 9 to 35 Years |
| | San Antonio, TX | | (c) | | 79 |
| | 347 |
| | — |
| | — |
| | 79 |
| | 347 |
| | 426 |
| | (47 | ) | | 1977 | | 07/17/13 | | 9 to 33 Years |
| | San Antonio, TX | | (c) | | 395 |
| | 414 |
| | — |
| | — |
| | 395 |
| | 414 |
| | 809 |
| | (86 | ) | | 1984 | | 07/17/13 | | 11 to 25 Years |
| | San Antonio, TX | | (c) | | 544 |
| | 521 |
| | — |
| | — |
| | 544 |
| | 521 |
| | 1,065 |
| | (77 | ) | | 1967 | | 07/17/13 | | 11 to 33 Years |
| | San Antonio, TX | | (c) | | 375 |
| | 282 |
| | — |
| | — |
| | 375 |
| | 282 |
| | 657 |
| | (72 | ) | | 1965 | | 07/17/13 | | 9 to 21 Years |
| | San Antonio, TX | | (c) | | 373 |
| | 170 |
| | — |
| | — |
| | 373 |
| | 170 |
| | 543 |
| | (47 | ) | | 1993 | | 07/17/13 | | 9 to 20 Years |
| | San Antonio, TX | | (c) | | 331 |
| | 449 |
| | — |
| | — |
| | 331 |
| | 449 |
| | 780 |
| | (87 | ) | | 1983 | | 07/17/13 | | 10 to 25 Years |
| | San Antonio, TX | | (c) | | 283 |
| | 573 |
| | — |
| | — |
| | 283 |
| | 573 |
| | 856 |
| | (107 | ) | | 1971 | | 07/17/13 | | 11 to 33 Years |
| | San Antonio, TX | | (c) | | 369 |
| | 226 |
| | — |
| | — |
| | 369 |
| | 226 |
| | 595 |
| | (47 | ) | | 1986 | | 07/17/13 | | 10 to 25 Years |
| | San Antonio, TX | | (c) | | 397 |
| | 700 |
| | — |
| | — |
| | 397 |
| | 700 |
| | 1,097 |
| | (98 | ) | | 1984 | | 07/17/13 | | 11 to 35 Years |
| | San Antonio, TX | | (c) | | 403 |
| | 61 |
| | — |
| | — |
| | 403 |
| | 61 |
| | 464 |
| | (130 | ) | | 1971 | | 07/17/13 | | 9 to 17 Years |
|
| | | | | | | | | | | | | | | | | | | | | | | | | | | | | | | | | |
| C-Store (GPM Investments, LLC) | Jackson, KY | | (d) | | 417 |
| | 765 |
| | — |
| | — |
| | 417 |
| | 765 |
| | 1,182 |
| | (89 | ) | | 1982 | | 06/30/15 | | 15 to 30 Years |
| C-Store (GPM Investments, LLC) | McKee, KY | | (d) | | 119 |
| | 973 |
| | — |
| | — |
| | 119 |
| | 973 |
| | 1,092 |
| | (91 | ) | | 1983 | | 06/30/15 | | 15 to 30 Years |
| C-Store (GPM Investments, LLC) | Paris, KY | | (d) | | 209 |
| | 576 |
| | — |
| | — |
| | 209 |
| | 576 |
| | 785 |
| | (66 | ) | | 1992 | | 06/30/15 | | 15 to 30 Years |
| C-Store (GPM Investments, LLC) | Cynthiana, KY | | (d) | | 119 |
| | 596 |
| | — |
| | — |
| | 119 |
| | 596 |
| | 715 |
| | (61 | ) | | 1985 | | 06/30/15 | | 15 to 30 Years |
| C-Store (GPM Investments, LLC) | Campton, KY | | (d) | | 189 |
| | 735 |
| | — |
| | — |
| | 189 |
| | 735 |
| | 924 |
| | (78 | ) | | 1996 | | 06/30/15 | | 15 to 30 Years |
| C-Store (GPM Investments, LLC) | Flemingsburg, KY | | (d) | | 1,073 |
| | 1,212 |
| | — |
| | — |
| | 1,073 |
| | 1,212 |
| | 2,285 |
| | (161 | ) | | 1997 | | 06/30/15 | | 15 to 30 Years |
| C-Store (GPM Investments, LLC) | Clay City, KY | | (d) | | 397 |
| | 884 |
| | — |
| | — |
| | 397 |
| | 884 |
| | 1,281 |
| | (120 | ) | | 2002 | | 06/30/15 | | 15 to 30 Years |
| C-Store (GPM Investments, LLC) | Hazard, KY | | (d) | | 288 |
| | 805 |
| | — |
| | — |
| | 288 |
| | 805 |
| | 1,093 |
| | (87 | ) | | 1991 | | 06/30/15 | | 15 to 30 Years |
| C-Store (GPM Investments, LLC) | Roanoke, VA | | (d) | | 397 |
| | 785 |
| | — |
| | — |
| | 397 |
| | 785 |
| | 1,182 |
| | (90 | ) | | 1986 | | 06/30/15 | | 15 to 30 Years |
| C-Store (GPM Investments, LLC) | Salem, VA | | (d) | | 387 |
| | 1,172 |
| | — |
| | — |
| | 387 |
| | 1,172 |
| | 1,559 |
| | (124 | ) | | 1973 | | 06/30/15 | | 15 to 30 Years |
| C-Store (GPM Investments, LLC) | Roanoke, VA | | (d) | | 397 |
| | 685 |
| | — |
| | — |
| | 397 |
| | 685 |
| | 1,082 |
| | (82 | ) | | 1997 | | 06/30/15 | | 15 to 30 Years |
| C-Store (GPM Investments, LLC) | Greenville, MI | | (d) | | 437 |
| | 628 |
| | — |
| | 194 |
| | 437 |
| | 822 |
| | 1,259 |
| | (60 | ) | | 1968 | | 05/19/16 | | 17 to 30 Years |
| C-Store (GPM Investments, LLC) | Spring Lake, MI | | (d) | | 247 |
| | 325 |
| | — |
| | 190 |
| | 247 |
| | 515 |
| | 762 |
| | (43 | ) | | 1964 | | 05/19/16 | | 17 to 30 Years |
| C-Store (GPM Investments, LLC) | Hastings, MI | | (d) | | 392 |
| | 437 |
| | — |
| | 190 |
| | 392 |
| | 627 |
| | 1,019 |
| | (57 | ) | | 1964 | | 05/19/16 | | 17 to 30 Years |
| C-Store (GPM Investments, LLC) | Zeeland, MI | | (d) | | 213 |
| | 426 |
| | — |
| | — |
| | 213 |
| | 426 |
| | 639 |
| | (35 | ) | | 1989 | | 05/19/16 | | 17 to 30 Years |
| C-Store (GPM Investments, LLC) | Holland, MI | | (d) | | 235 |
| | 325 |
| | — |
| | — |
| | 235 |
| | 325 |
| | 560 |
| | (31 | ) | | 1957 | | 05/19/16 | | 17 to 30 Years |
| C-Store (GPM Investments, LLC) | Eaton Rapids, MI | | (d) | | 291 |
| | 448 |
| | — |
| | — |
| | 291 |
| | 448 |
| | 739 |
| | (47 | ) | | 1945 | | 05/19/16 | | 17 to 30 Years |
| C-Store (GPM Investments, LLC) | Fremont, MI | | (d) | | 269 |
| | 269 |
| | — |
| | — |
| | 269 |
| | 269 |
| | 538 |
| | (34 | ) | | 1971 | | 05/19/16 | | 17 to 30 Years |
| C-Store (GPM Investments, LLC) | Sparta, MI | | (d) | | 291 |
| | 650 |
| | — |
| | — |
| | 291 |
| | 650 |
| | 941 |
| | (53 | ) | | 1993 | | 05/19/16 | | 17 to 30 Years |
SPIRIT REALTY CAPITAL, INC.
Schedule III Real Estate and
Accumulated Depreciation
(Amounts in thousands)
|
| | | | | | | | | | | | | | | | | | | | | | | | | |
| | | | | | Initial Cost to Company | | Cost Capitalized Subsequent to Acquisition including impairment | | Gross Amount at December 31, 2016 (d) 2017 (g) | | | | | | | | |
| Concept | City, State | | Encumbrances (e) | | Land and Improvements | | Buildings and Improvements | | Land and Improvements | | Buildings and Improvements | | Land and Improvements | | Buildings and Improvements | | Total | | Final Accumulated Depreciation | | Date of Construction | | Date Acquired | | Life in which depreciation in latest Statement of Operations is computed |
Description | | Encumbrances (e)
| | Land and
Improvements
| | Buildings and
Improvements
| | Improvements/
Land
| | Improvements/
building
| | Land and
Improvements
| | Buildings and
Improvements
| | Total | | Final
Accum
| | Date of
Construction
| | Date
Acquired
| |
|
| | | | | | | | | | | | | | | | | | | | | | | | | | | | | | | | | |
| | San Antonio, TX | | (c) | | 279 |
| | 261 |
| | — |
| | — |
| | 279 |
| | 261 |
| | 540 |
| | (54 | ) | | 1976 | | 07/17/13 | | 11 to 32 Years |
| | San Benito, TX | | (c) | | 1,641 |
| | 688 |
| | — |
| | — |
| | 1,641 |
| | 688 |
| | 2,329 |
| | (88 | ) | | 1977 | | 07/17/13 | | 9 to 35 Years |
| | Sandusky, OH | | (a) | | 922 |
| | 406 |
| | (314 | ) | | (89 | ) | | 608 |
| | 317 |
| | 925 |
| | (132 | ) | | 1987 | | 08/27/09 | | 14 to 29 Years |
| | Sapulpa, OK | | (c) | | 855 |
| | 1,030 |
| | — |
| | — |
| | 855 |
| | 1,030 |
| | 1,885 |
| | (25 | ) | | 1987 | | 06/30/16 | | 5 to 30 Years |
| | Sedalia, MO | | (a) | | 751 |
| | 662 |
| | — |
| | — |
| | 751 |
| | 662 |
| | 1,413 |
| | (352 | ) | | 1983 | | 12/29/06 | | 15 to 30 Years |
| | Seven Hills, OH | | (a) | | 496 |
| | 488 |
| | — |
| | — |
| | 496 |
| | 488 |
| | 984 |
| | (209 | ) | | 1977 | | 08/27/09 | | 13 to 28 Years |
| | Seymour, TN | | (a) | | 365 |
| | 440 |
| | — |
| | — |
| | 365 |
| | 440 |
| | 805 |
| | (86 | ) | | 2007 | | 07/17/13 | | 6 to 27 Years |
| | Siler City, NC | | (a) | | 686 |
| | 385 |
| | — |
| | — |
| | 686 |
| | 385 |
| | 1,071 |
| | (99 | ) | | 2005 | | 09/17/13 | | 15 to 30 Years |
| | Parkersburg, WV | | (a) | | 383 |
| | 404 |
| | — |
| | — |
| | 383 |
| | 404 |
| | 787 |
| | (111 | ) | | 1986 | | 12/21/12 | | 15 to 20 Years |
| | South Charleston, WV | | (a) | | 524 |
| | 541 |
| | — |
| | — |
| | 524 |
| | 541 |
| | 1,065 |
| | (134 | ) | | 1993 | | 12/21/12 | | 15 to 20 Years |
| | South Hill, VA | | (a) | | 564 |
| | 320 |
| | — |
| | — |
| | 564 |
| | 320 |
| | 884 |
| | (81 | ) | | 2007 | | 09/17/13 | | 15 to 30 Years |
| | Southlake, TX | | (c) | | 30 |
| | 58 |
| | — |
| | — |
| | 30 |
| | 58 |
| | 88 |
| | (5 | ) | | 1999 | | 06/30/16 | | 9 to 10 Years |
| | Spencer, IN | | (a) | | 136 |
| | 1,040 |
| | — |
| | — |
| | 136 |
| | 1,040 |
| | 1,176 |
| | (187 | ) | | 1999 | | 07/17/13 | | 8 to 22 Years |
| | Springfield, IL | | (a) | | 1,072 |
| | 642 |
| | — |
| | — |
| | 1,072 |
| | 642 |
| | 1,714 |
| | (486 | ) | | 1988 | | 09/23/05 | | 15 to 20 Years |
| | Springfield, IL | | (a) | | 571 |
| | 630 |
| | — |
| | — |
| | 571 |
| | 630 |
| | 1,201 |
| | (320 | ) | | 1997 | | 09/23/05 | | 15 to 30 Years |
| | Springfield, MO | | (a) | | 439 |
| | 719 |
| | — |
| | — |
| | 439 |
| | 719 |
| | 1,158 |
| | (336 | ) | | 2004 | | 12/29/06 | | 15 to 40 Years |
| | Springville, NY | | (a) | | 678 |
| | 586 |
| | — |
| | — |
| | 678 |
| | 586 |
| | 1,264 |
| | (262 | ) | | 1988 | | 11/10/05 | | 15 to 30 Years |
| | St. Louis, MO | | (a) | | 503 |
| | 651 |
| | — |
| | — |
| | 503 |
| | 651 |
| | 1,154 |
| | (386 | ) | | 1976 | | 09/24/04 | | 15 to 20 Years |
| | St. Louis, MO | | (a) | | 828 |
| | 351 |
| | — |
| | — |
| | 828 |
| | 351 |
| | 1,179 |
| | (300 | ) | | 1986 | | 09/24/04 | | 15 to 20 Years |
| | St. Louis, MO | | (a) | | 290 |
| | 211 |
| | — |
| | — |
| | 290 |
| | 211 |
| | 501 |
| | (152 | ) | | 1973 | | 05/25/05 | | 15 to 20 Years |
| | St. Louis, MO | | (a) | | 231 |
| | 337 |
| | — |
| | — |
| | 231 |
| | 337 |
| | 568 |
| | (195 | ) | | 1972 | | 05/25/05 | | 15 to 20 Years |
| | St. Louis, MO | | (a) | | 189 |
| | 227 |
| | — |
| | — |
| | 189 |
| | 227 |
| | 416 |
| | (145 | ) | | 1972 | | 05/25/05 | | 15 to 20 Years |
| | St. Louis, MO | | (a) | | 464 |
| | 218 |
| | — |
| | — |
| | 464 |
| | 218 |
| | 682 |
| | (174 | ) | | 1978 | | 05/25/05 | | 15 to 20 Years |
| | St. Paul, TX | | (c) | | 509 |
| | 192 |
| | — |
| | — |
| | 509 |
| | 192 |
| | 701 |
| | (13 | ) | | 2003 | | 07/25/16 | | 13 to 20 Years |
| | Statesboro, GA | | (a) | | 779 |
| | 777 |
| | — |
| | — |
| | 779 |
| | 777 |
| | 1,556 |
| | (410 | ) | | 1985 | | 09/24/04 | | 15 to 20 Years |
| | Sterling Heights, MI | | (a) | | 866 |
| | 960 |
| | — |
| | — |
| | 866 |
| | 960 |
| | 1,826 |
| | (406 | ) | | 2000 | | 12/29/05 | | 15 to 30 Years |
| | Stillwater, OK | | (c) | | 218 |
| | 1,262 |
| | — |
| | — |
| | 218 |
| | 1,262 |
| | 1,480 |
| | (160 | ) | | 2007 | | 07/17/13 | | 4 to 32 Years |
| | Stillwater, OK | | (c) | | 1,314 |
| | 1,111 |
| | — |
| | — |
| | 1,314 |
| | 1,111 |
| | 2,425 |
| | (85 | ) | | 2015 | | 03/31/15 | | 15 to 40 Years |
| | Stockbridge, GA | | (a) | | 388 |
| | 353 |
| | — |
| | — |
| | 388 |
| | 353 |
| | 741 |
| | (72 | ) | | 2001 | | 02/02/12 | | 15 to 30 Years |
| | Stone Mountain, GA | | (a) | | 379 |
| | 487 |
| | — |
| | — |
| | 379 |
| | 487 |
| | 866 |
| | (95 | ) | | 1986 | | 02/02/12 | | 15 to 30 Years |
| | Sun City, AZ | | (a) | | 771 |
| | 372 |
| | — |
| | — |
| | 771 |
| | 372 |
| | 1,143 |
| | (237 | ) | | 1986 | | 12/29/06 | | 15 to 20 Years |
| | Sweetwater, TN | | (a) | | 602 |
| | 550 |
| | — |
| | 250 |
| | 602 |
| | 800 |
| | 1,402 |
| | (244 | ) | | 1999 | | 12/29/06 | | 15 to 40 Years |
| | Talladega, AL | | (c) | | 247 |
| | 245 |
| | — |
| | — |
| | 247 |
| | 245 |
| | 492 |
| | (91 | ) | | 1998 | | 07/17/13 | | 11 to 21 Years |
| | Tempe, AZ | | (a) | | 480 |
| | 361 |
| | — |
| | — |
| | 480 |
| | 361 |
| | 841 |
| | (191 | ) | | 2003 | | 09/25/06 | | 15 to 30 Years |
| | Temple, TX | | (c) | | 705 |
| | 493 |
| | — |
| | — |
| | 705 |
| | 493 |
| | 1,198 |
| | (67 | ) | | 1983 | | 07/17/13 | | 10 to 35 Years |
| | Texarkana, TX | | (a) | | 265 |
| | 747 |
| | — |
| | — |
| | 265 |
| | 747 |
| | 1,012 |
| | (102 | ) | | 2013 | | 11/04/13 | | 14 to 30 Years |
| | The Village, OK | | (c) | | 211 |
| | 650 |
| | — |
| | — |
| | 211 |
| | 650 |
| | 861 |
| | (83 | ) | | 1978 | | 07/17/13 | | 9 to 35 Years |
|
| | | | | | | | | | | | | | | | | | | | | | | | | | | | | | | | | |
| C-Store (GPM Investments, LLC) | Three Rivers, MI | | (d) | | 1,256 |
| | 1,401 |
| | — |
| | — |
| | 1,256 |
| | 1,401 |
| | 2,657 |
| | (133 | ) | | 1982 | | 05/19/16 | | 20 to 30 Years |
| C-Store (GPM Investments, LLC) | Jackson, MI | | (d) | | 684 |
| | 1,188 |
| | — |
| | — |
| | 684 |
| | 1,188 |
| | 1,872 |
| | (100 | ) | | 1963 | | 05/19/16 | | 17 to 30 Years |
|
| | | | | | | | | | | | | | | | | | | | | | | | | | | | | | | | | |
| C-Store (GPM Investments, LLC) | Jackson, MI | | (d) | | 908 |
| | 1,132 |
| | — |
| | — |
| | 908 |
| | 1,132 |
| | 2,040 |
| | (107 | ) | | 1969 | | 05/19/16 | | 21 to 30 Years |
| C-Store (GPM Investments, LLC) | Cedar Springs, MI | | (d) | | 191 |
| | 348 |
| | — |
| | — |
| | 191 |
| | 348 |
| | 539 |
| | (31 | ) | | 1965 | | 05/19/16 | | 17 to 30 Years |
| C-Store (GPM Investments, LLC) | Burton, MI | | (d) | | 336 |
| | 1,323 |
| | — |
| | — |
| | 336 |
| | 1,323 |
| | 1,659 |
| | (90 | ) | | 1969 | | 05/19/16 | | 17 to 30 Years |
| C-Store (GPM Investments, LLC) | Cadillac, MI | | (d) | | 370 |
| | 404 |
| | — |
| | — |
| | 370 |
| | 404 |
| | 774 |
| | (43 | ) | | 1971 | | 05/19/16 | | 17 to 30 Years |
| C-Store (GPM Investments, LLC) | Swartz Creek, MI | | (d) | | 213 |
| | 460 |
| | — |
| | — |
| | 213 |
| | 460 |
| | 673 |
| | (39 | ) | | 1952 | | 05/19/16 | | 17 to 30 Years |
| C-Store (GPM Investments, LLC) | Grayling, MI | | (d) | | 2,052 |
| | 549 |
| | — |
| | — |
| | 2,052 |
| | 549 |
| | 2,601 |
| | (102 | ) | | 1988 | | 05/19/16 | | 17 to 30 Years |
| C-Store (GPM Investments, LLC) | Plainwell, MI | | (d) | | 785 |
| | 235 |
| | — |
| | — |
| | 785 |
| | 235 |
| | 1,020 |
| | (56 | ) | | 1998 | | 05/19/16 | | 17 to 30 Years |
| C-Store (GPM Investments, LLC) | Lansing, MI | | (d) | | 336 |
| | 168 |
| | — |
| | — |
| | 336 |
| | 168 |
| | 504 |
| | (33 | ) | | 1978 | | 05/19/16 | | 17 to 30 Years |
| C-Store (GPM Investments, LLC) | Menominee, MI | | (d) | | 235 |
| | 179 |
| | — |
| | — |
| | 235 |
| | 179 |
| | 414 |
| | (25 | ) | | 1966 | | 05/19/16 | | 17 to 30 Years |
| C-Store (GPM Investments, LLC) | Marquette, MI | | (d) | | 404 |
| | 146 |
| | — |
| | — |
| | 404 |
| | 146 |
| | 550 |
| | (23 | ) | | 1968 | | 05/19/16 | | 17 to 30 Years |
| C-Store (GPM Investments, LLC) | Scottville, MI | | (d) | | 235 |
| | 404 |
| | — |
| | — |
| | 235 |
| | 404 |
| | 639 |
| | (41 | ) | | 1959 | | 05/19/16 | | 17 to 30 Years |
| C-Store (GPM Investments, LLC) | Saginaw, MI | | (d) | | 1,177 |
| | 594 |
| | — |
| | — |
| | 1,177 |
| | 594 |
| | 1,771 |
| | (81 | ) | | 1989 | | 05/19/16 | | 17 to 30 Years |
| C-Store (GPM Investments, LLC) | Sault Ste Marie, MI | | (d) | | 1,760 |
| | 561 |
| | — |
| | — |
| | 1,760 |
| | 561 |
| | 2,321 |
| | (92 | ) | | 1993 | | 05/19/16 | | 17 to 30 Years |
| C-Store (GPM Investments, LLC) | Lansing, MI | | (d) | | 269 |
| | 179 |
| | — |
| | — |
| | 269 |
| | 179 |
| | 448 |
| | (27 | ) | | 1965 | | 05/19/16 | | 17 to 30 Years |
| C-Store (GPM Investments, LLC) | Merrillville, IN | | (d) | | 303 |
| | 247 |
| | — |
| | — |
| | 303 |
| | 247 |
| | 550 |
| | (33 | ) | | 1973 | | 05/19/16 | | 17 to 30 Years |
| C-Store (GPM Investments, LLC) | Stevensville, MI | | (d) | | 482 |
| | 191 |
| | — |
| | — |
| | 482 |
| | 191 |
| | 673 |
| | (41 | ) | | 1960 | | 05/19/16 | | 17 to 30 Years |
| C-Store (GPM Investments, LLC) | Charlotte, MI | | (d) | | 224 |
| | 157 |
| | — |
| | — |
| | 224 |
| | 157 |
| | 381 |
| | (26 | ) | | 1968 | | 05/19/16 | | 17 to 30 Years |
SPIRIT REALTY CAPITAL, INC.
Schedule III Real Estate and
Accumulated Depreciation
(Amounts in thousands)
|
| | | | | | | | | | | | | | | | | | | | | | | | | |
| | | | | | Initial Cost to Company | | Cost Capitalized Subsequent to Acquisition including impairment | | Gross Amount at December 31, 2016 (d) 2017 (g) | | | | | | | | |
| Concept | City, State | | Encumbrances (e) | | Land and Improvements | | Buildings and Improvements | | Land and Improvements | | Buildings and Improvements | | Land and Improvements | | Buildings and Improvements | | Total | | Final Accumulated Depreciation | | Date of Construction | | Date Acquired | | Life in which depreciation in latest Statement of Operations is computed |
Description | | Encumbrances (e)
| | Land and
Improvements
| | Buildings and
Improvements
| | Improvements/
Land
| | Improvements/
building
| | Land and
Improvements
| | Buildings and
Improvements
| | Total | | Final
Accum
| | Date of
Construction
| | Date
Acquired
| |
|
| | | | | | | | | | | | | | | | | | | | | | | | | | | | | | | | | |
| | Thomasville, GA | | (a) | | 408 |
| | 837 |
| | — |
| | — |
| | 408 |
| | 837 |
| | 1,245 |
| | (108 | ) | | 1985 | | 12/24/13 | | 15 to 30 Years |
| | Tipp City, OH | | (a) | | 789 |
| | 332 |
| | — |
| | — |
| | 789 |
| | 332 |
| | 1,121 |
| | (252 | ) | | 1991 | | 12/29/06 | | 15 to 20 Years |
| | Tooele, UT | | (a) | | 552 |
| | 624 |
| | — |
| | — |
| | 552 |
| | 624 |
| | 1,176 |
| | (430 | ) | | 1988 | | 09/24/04 | | 15 to 20 Years |
| | Trenton, MO | | (a) | | 309 |
| | 1,175 |
| | — |
| | — |
| | 309 |
| | 1,175 |
| | 1,484 |
| | (147 | ) | | 1976 | | 12/24/13 | | 15 to 30 Years |
| | Trotwood, OH | | (c) | | 281 |
| | 219 |
| | — |
| | — |
| | 281 |
| | 219 |
| | 500 |
| | (23 | ) | | 1971 | | 08/21/15 | | 15 to 20 Years |
| | Tucson, AZ | | (c) | | 262 |
| | 193 |
| | — |
| | — |
| | 262 |
| | 193 |
| | 455 |
| | (61 | ) | | 1983 | | 07/17/13 | | 11 to 23 Years |
| | Tucson, AZ | | (c) | | 191 |
| | 552 |
| | — |
| | — |
| | 191 |
| | 552 |
| | 743 |
| | (72 | ) | | 1981 | | 07/17/13 | | 11 to 35 Years |
| | Tucson, AZ | | (c) | | 349 |
| | 479 |
| | — |
| | — |
| | 349 |
| | 479 |
| | 828 |
| | (72 | ) | | 1976 | | 07/17/13 | | 11 to 35 Years |
| | Tucson, AZ | | (c) | | 221 |
| | 434 |
| | — |
| | — |
| | 221 |
| | 434 |
| | 655 |
| | (72 | ) | | 1980 | | 07/17/13 | | 11 to 27 Years |
| | Tulsa, OK | | (c) | | 767 |
| | 466 |
| | — |
| | — |
| | 767 |
| | 466 |
| | 1,233 |
| | (74 | ) | | 1976 | | 07/17/13 | | 8 to 35 Years |
| | Tulsa, OK | | (c) | | 315 |
| | 717 |
| | — |
| | — |
| | 315 |
| | 717 |
| | 1,032 |
| | (95 | ) | | 1976 | | 07/17/13 | | 10 to 35 Years |
| | Tulsa, OK | | (c) | | 835 |
| | 967 |
| | — |
| | — |
| | 835 |
| | 967 |
| | 1,802 |
| | (21 | ) | | 1978 | | 06/30/16 | | 5 to 30 Years |
| | Tulsa, OK | | (c) | | 760 |
| | 381 |
| | — |
| | — |
| | 760 |
| | 381 |
| | 1,141 |
| | (14 | ) | | 1984 | | 06/30/16 | | 5 to 20 Years |
| | Tulsa, OK | | (c) | | — |
| | 20 |
| | — |
| | — |
| | — |
| | 20 |
| | 20 |
| | (1 | ) | | 1982 | | 06/30/16 | | 10 to 10 Years |
| | Tyler, TX | | (c) | | 227 |
| | 527 |
| | — |
| | — |
| | 227 |
| | 527 |
| | 754 |
| | (71 | ) | | 1976 | | 07/17/13 | | 11 to 35 Years |
| | Tyler, TX | | (c) | | 355 |
| | 663 |
| | — |
| | — |
| | 355 |
| | 663 |
| | 1,018 |
| | (28 | ) | | 1980 | | 12/29/15 | | 15 to 30 Years |
| | Universal City, TX | | (c) | | 408 |
| | 369 |
| | — |
| | — |
| | 408 |
| | 369 |
| | 777 |
| | (84 | ) | | 1989 | | 07/17/13 | | 9 to 25 Years |
| | Vicksburg, MS | | (c) | | 278 |
| | 333 |
| | — |
| | — |
| | 278 |
| | 333 |
| | 611 |
| | (77 | ) | | 1972 | | 07/17/13 | | 11 to 25 Years |
| | Victoria, TX | | (c) | | 129 |
| | 490 |
| | — |
| | — |
| | 129 |
| | 490 |
| | 619 |
| | (87 | ) | | 1985 | | 07/17/13 | | 11 to 28 Years |
| | Victoria, TX | | (c) | | 367 |
| | 182 |
| | — |
| | — |
| | 367 |
| | 182 |
| | 549 |
| | (48 | ) | | 1984 | | 07/17/13 | | 11 to 22 Years |
| | Villa Rica, GA | | (a) | | 807 |
| | 629 |
| | — |
| | — |
| | 807 |
| | 629 |
| | 1,436 |
| | (317 | ) | | 1999 | | 02/28/06 | | 15 to 30 Years |
| | Vincennes, IN | | (a) | | 389 |
| | 1,425 |
| | — |
| | — |
| | 389 |
| | 1,425 |
| | 1,814 |
| | (207 | ) | | 2000 | | 07/17/13 | | 8 to 30 Years |
| | Waco, TX | | (c) | | 365 |
| | 542 |
| | — |
| | — |
| | 365 |
| | 542 |
| | 907 |
| | (67 | ) | | 1969 | | 07/17/13 | | 10 to 35 Years |
| | Warner Robins, GA | | (a) | | 229 |
| | 887 |
| | — |
| | — |
| | 229 |
| | 887 |
| | 1,116 |
| | (121 | ) | | 1978 | | 12/24/13 | | 15 to 30 Years |
| | Warren, MI | | (a) | | 488 |
| | 215 |
| | — |
| | — |
| | 488 |
| | 215 |
| | 703 |
| | (146 | ) | | 1979 | | 05/25/05 | | 15 to 20 Years |
| | Washington Park, IL | | (a) | | 119 |
| | 324 |
| | — |
| | — |
| | 119 |
| | 324 |
| | 443 |
| | (188 | ) | | 1980 | | 05/25/05 | | 15 to 20 Years |
| | Washington, IL | | (a) | | 264 |
| | 460 |
| | — |
| | — |
| | 264 |
| | 460 |
| | 724 |
| | (127 | ) | | 1980 | | 12/21/12 | | 15 to 20 Years |
| | Washington, IN | | (a) | | 272 |
| | 949 |
| | — |
| | — |
| | 272 |
| | 949 |
| | 1,221 |
| | (151 | ) | | 1995 | | 07/17/13 | | 8 to 33 Years |
| | Watertown, WI | | (a) | | 267 |
| | 338 |
| | — |
| | — |
| | 267 |
| | 338 |
| | 605 |
| | (182 | ) | | 1986 | | 06/30/09 | | 13 to 18 Years |
| | Waynesburg, PA | | (a) | | 323 |
| | 918 |
| | — |
| | — |
| | 323 |
| | 918 |
| | 1,241 |
| | (177 | ) | | 1982 | | 12/21/12 | | 15 to 30 Years |
| | Weatherford, TX | | (c) | | 260 |
| | 886 |
| | — |
| | 21 |
| | 260 |
| | 907 |
| | 1,167 |
| | (16 | ) | | 2015 | | 07/28/16 | | 18 to 30 Years |
| | Weslaco, TX | | (c) | | 860 |
| | 513 |
| | — |
| | — |
| | 860 |
| | 513 |
| | 1,373 |
| | (72 | ) | | 1990 | | 07/17/13 | | 11 to 35 Years |
| | Weslaco, TX | | (c) | | 291 |
| | 786 |
| | — |
| | — |
| | 291 |
| | 786 |
| | 1,077 |
| | (133 | ) | | 1970 | | 07/17/13 | | 11 to 25 Years |
| | Westchester, IL | | (a) | | 765 |
| | 437 |
| | — |
| | — |
| | 765 |
| | 437 |
| | 1,202 |
| | (240 | ) | | 1986 | | 09/29/06 | | 15 to 20 Years |
| | Weston, WV | | (a) | | 158 |
| | 695 |
| | — |
| | — |
| | 158 |
| | 695 |
| | 853 |
| | (119 | ) | | 1981 | | 12/21/12 | | 15 to 30 Years |
| | Williamsport, PA | | (c) | | 864 |
| | 979 |
| | — |
| | — |
| | 864 |
| | 979 |
| | 1,843 |
| | (87 | ) | | 1966 | | 11/18/14 | | 15 to 30 Years |
| | Winchester, TN | | (a) | | 400 |
| | 291 |
| | — |
| | 250 |
| | 400 |
| | 541 |
| | 941 |
| | (183 | ) | | 1993 | | 12/29/06 | | 15 to 20 Years |
| | Winter Springs, FL | | (a) | | 523 |
| | 446 |
| | — |
| | — |
| | 523 |
| | 446 |
| | 969 |
| | (312 | ) | | 1988 | | 12/30/04 | | 15 to 20 Years |
|
| | | | | | | | | | | | | | | | | | | | | | | | | | | | | | | | | |
| C-Store (GPM Investments, LLC) | Franklin, IN | | (d) | | 303 |
| | 213 |
| | — |
| | — |
| | 303 |
| | 213 |
| | 516 |
| | (29 | ) | | 1969 | | 05/19/16 | | 17 to 30 Years |
| C-Store (GPM Investments, LLC) | Muncie, IN | | (d) | | 448 |
| | 135 |
| | — |
| | — |
| | 448 |
| | 135 |
| | 583 |
| | (31 | ) | | 1983 | | 05/19/16 | | 17 to 30 Years |
| C-Store (GPM Investments, LLC) | Freeland, MI | | (d) | | 336 |
| | 437 |
| | — |
| | — |
| | 336 |
| | 437 |
| | 773 |
| | (44 | ) | | 1962 | | 05/19/16 | | 17 to 30 Years |
| C-Store (GPM Investments, LLC) | Midland, MI | | (d) | | 314 |
| | 135 |
| | — |
| | — |
| | 314 |
| | 135 |
| | 449 |
| | (26 | ) | | 1960 | | 05/19/16 | | 17 to 30 Years |
| C-Store (GPM Investments, LLC) | Saginaw, MI | | (d) | | 224 |
| | 135 |
| | — |
| | — |
| | 224 |
| | 135 |
| | 359 |
| | (22 | ) | | 1960 | | 05/19/16 | | 17 to 30 Years |
| C-Store (GPM Investments, LLC) | Coldwater, MI | | (d) | | 258 |
| | 135 |
| | — |
| | — |
| | 258 |
| | 135 |
| | 393 |
| | (23 | ) | | 1960 | | 05/19/16 | | 17 to 30 Years |
| C-Store (GPM Investments, LLC) | Jackson, MI | | (d) | | 247 |
| | 179 |
| | — |
| | — |
| | 247 |
| | 179 |
| | 426 |
| | (28 | ) | | 1965 | | 05/19/16 | | 17 to 30 Years |
| C-Store (GPM Investments, LLC) | Midland, MI | | (d) | | 191 |
| | 67 |
| | — |
| | — |
| | 191 |
| | 67 |
| | 258 |
| | (16 | ) | | 1962 | | 05/19/16 | | 17 to 30 Years |
| C-Store (GPM Investments, LLC) | Hillsdale, MI | | (d) | | 325 |
| | 157 |
| | — |
| | — |
| | 325 |
| | 157 |
| | 482 |
| | (25 | ) | | 1968 | | 05/19/16 | | 17 to 30 Years |
| C-Store (GPM Investments, LLC) | Mason, MI | | (d) | | 258 |
| | 157 |
| | — |
| | — |
| | 258 |
| | 157 |
| | 415 |
| | (27 | ) | | 1971 | | 05/19/16 | | 17 to 30 Years |
| C-Store (GPM Investments, LLC) | Allegan, MI | | (d) | | 392 |
| | 224 |
| | — |
| | — |
| | 392 |
| | 224 |
| | 616 |
| | (39 | ) | | 1965 | | 05/19/16 | | 17 to 30 Years |
| C-Store (GPM Investments, LLC) | Connersville, IN | | (d) | | 336 |
| | 179 |
| | — |
| | — |
| | 336 |
| | 179 |
| | 515 |
| | (25 | ) | | 1993 | | 05/19/16 | | 17 to 30 Years |
| C-Store (GPM Investments, LLC) | Indianapolis, IN | | (d) | | 426 |
| | 191 |
| | — |
| | — |
| | 426 |
| | 191 |
| | 617 |
| | (31 | ) | | 1973 | | 05/19/16 | | 17 to 30 Years |
| C-Store (GPM Investments, LLC) | Monticello, IN | | (d) | | 235 |
| | 202 |
| | — |
| | — |
| | 235 |
| | 202 |
| | 437 |
| | (28 | ) | | 1970 | | 05/19/16 | | 17 to 30 Years |
| C-Store (GPM Investments, LLC) | Frankfort, IN | | (d) | | 258 |
| | 202 |
| | — |
| | — |
| | 258 |
| | 202 |
| | 460 |
| | (28 | ) | | 1970 | | 05/19/16 | | 17 to 30 Years |
| C-Store (GPM Investments, LLC) | Grand Rapids, MI | | (d) | | 224 |
| | 123 |
| | — |
| | — |
| | 224 |
| | 123 |
| | 347 |
| | (17 | ) | | 1957 | | 05/19/16 | | 17 to 30 Years |
| C-Store (GPM Investments, LLC) | Grand Haven, MI | | (d) | | 661 |
| | 628 |
| | — |
| | — |
| | 661 |
| | 628 |
| | 1,289 |
| | (63 | ) | | 1992 | | 05/19/16 | | 17 to 30 Years |
| C-Store (GPM Investments, LLC) | Indianapolis, IN | | (d) | | 325 |
| | 157 |
| | — |
| | — |
| | 325 |
| | 157 |
| | 482 |
| | (23 | ) | | 1945 | | 05/19/16 | | 17 to 30 Years |
| C-Store (GPM Investments, LLC) | Indianapolis, IN | | (d) | | 247 |
| | 146 |
| | — |
| | — |
| | 247 |
| | 146 |
| | 393 |
| | (20 | ) | | 1972 | | 05/19/16 | | 17 to 30 Years |
SPIRIT REALTY CAPITAL, INC.
Schedule III Real Estate and
Accumulated Depreciation
(Amounts in thousands)
|
| | | | | | | | | | | | | | | | | | | | | | | | | |
| | | | | | Initial Cost to Company | | Cost Capitalized Subsequent to Acquisition including impairment | | Gross Amount at December 31, 2016 (d) 2017 (g) | | | | | | | | |
| Concept | City, State | | Encumbrances (e) | | Land and Improvements | | Buildings and Improvements | | Land and Improvements | | Buildings and Improvements | | Land and Improvements | | Buildings and Improvements | | Total | | Final Accumulated Depreciation | | Date of Construction | | Date Acquired | | Life in which depreciation in latest Statement of Operations is computed |
Description | | Encumbrances (e)
| | Land and
Improvements
| | Buildings and
Improvements
| | Improvements/
Land
| | Improvements/
building
| | Land and
Improvements
| | Buildings and
Improvements
| | Total | | Final
Accum
| | Date of
Construction
| | Date
Acquired
| |
|
| | | | | | | | | | | | | | | | | | | | | | | | | | | | | | | | | |
| | Wytheville, VA | | (a) | | 446 |
| | 172 |
| | — |
| | — |
| | 446 |
| | 172 |
| | 618 |
| | (210 | ) | | 1995 | | 07/01/05 | | 15 to 20 Years |
| | Xenia, OH | | (c) | | 384 |
| | 288 |
| | — |
| | — |
| | 384 |
| | 288 |
| | 672 |
| | (26 | ) | | 1985 | | 08/21/15 | | 15 to 20 Years |
| | Yukon, OK | | (a) | | 555 |
| | 373 |
| | — |
| | — |
| | 555 |
| | 373 |
| | 928 |
| | (236 | ) | | 2003 | | 07/01/05 | | 15 to 30 Years |
| | Zebulon, NC | | (a) | | 780 |
| | 395 |
| | — |
| | — |
| | 780 |
| | 395 |
| | 1,175 |
| | (92 | ) | | 2006 | | 09/17/13 | | 15 to 30 Years |
|
| | | | | | | | | | | | | | | | | | | | | | | | | | | | | | | | | |
| C-Store (GPM Investments, LLC) | Alpena, MI | | (d) | | 392 |
| | 336 |
| | — |
| | — |
| | 392 |
| | 336 |
| | 728 |
| | (37 | ) | | 1998 | | 05/19/16 | | 17 to 40 Years |
| C-Store (GPM Investments, LLC) | Alpena, MI | | (d) | | 471 |
| | 561 |
| | — |
| | — |
| | 471 |
| | 561 |
| | 1,032 |
| | (48 | ) | | 1999 | | 05/19/16 | | 17 to 40 Years |
| C-Store (GPM Investments, LLC) | Alma, MI | | (d) | | 235 |
| | 437 |
| | — |
| | — |
| | 235 |
| | 437 |
| | 672 |
| | (38 | ) | | 2006 | | 05/19/16 | | 17 to 30 Years |
| C-Store (GPM Investments, LLC) | Edmore, MI | | (d) | | 729 |
| | 774 |
| | — |
| | — |
| | 729 |
| | 774 |
| | 1,503 |
| | (88 | ) | | 1999 | | 05/19/16 | | 17 to 40 Years |
| C-Store (GPM Investments, LLC) | Ithaca, MI | | (d) | | 538 |
| | 381 |
| | — |
| | — |
| | 538 |
| | 381 |
| | 919 |
| | (52 | ) | | 1994 | | 05/19/16 | | 17 to 30 Years |
| C-Store (GPM Investments, LLC) | Saginaw, MI | | (d) | | 359 |
| | 191 |
| | — |
| | — |
| | 359 |
| | 191 |
| | 550 |
| | (23 | ) | | 1969 | | 05/19/16 | | 17 to 30 Years |
| C-Store (GPM Investments, LLC) | Traverse City, MI | | (d) | | 482 |
| | 179 |
| | — |
| | — |
| | 482 |
| | 179 |
| | 661 |
| | (24 | ) | | 1971 | | 05/19/16 | | 17 to 30 Years |
| C-Store (GPM Investments, LLC) | Norton Shores, MI | | (d) | | 325 |
| | 291 |
| | — |
| | — |
| | 325 |
| | 291 |
| | 616 |
| | (39 | ) | | 1962 | | 05/19/16 | | 17 to 30 Years |
| C-Store (GPM Investments, LLC) | Coopersville, MI | | (d) | | 998 |
| | 572 |
| | — |
| | — |
| | 998 |
| | 572 |
| | 1,570 |
| | (71 | ) | | 1968 | | 05/19/16 | | 17 to 30 Years |
| C-Store (GPM Investments, LLC) | Muskegon, MI | | (d) | | 605 |
| | 650 |
| | — |
| | — |
| | 605 |
| | 650 |
| | 1,255 |
| | (66 | ) | | 1959 | | 05/19/16 | | 17 to 30 Years |
| C-Store (GPM Investments, LLC) | Muskegon, MI | | (d) | | 291 |
| | 471 |
| | — |
| | — |
| | 291 |
| | 471 |
| | 762 |
| | (48 | ) | | 1964 | | 05/19/16 | | 17 to 30 Years |
| C-Store (GPM Investments, LLC) | Rushville, IN | | (d) | | 179 |
| | 112 |
| | — |
| | — |
| | 179 |
| | 112 |
| | 291 |
| | (17 | ) | | 1978 | | 05/19/16 | | 17 to 30 Years |
| C-Store (GPM Investments, LLC) | St Johns, MI | | (d) | | 460 |
| | 706 |
| | — |
| | — |
| | 460 |
| | 706 |
| | 1,166 |
| | (71 | ) | | 2011 | | 05/19/16 | | 17 to 30 Years |
| C-Store (GPM Investments, LLC) | Wyoming, MI | | (d) | | 314 |
| | 448 |
| | — |
| | — |
| | 314 |
| | 448 |
| | 762 |
| | (38 | ) | | 1958 | | 05/19/16 | | 17 to 30 Years |
| C-Store (Irving Oil Marketing, Inc.) | Sherman Mills, ME | | (d) | | 259 |
| | 163 |
| | — |
| | — |
| | 259 |
| | 163 |
| | 422 |
| | (77 | ) | | 1974 | | 06/28/12 | | 15 to 20 Years |
| C-Store (Irving Oil Marketing, Inc.) | Bangor, ME | | (d) | | 327 |
| | 141 |
| | — |
| | — |
| | 327 |
| | 141 |
| | 468 |
| | (91 | ) | | 1973 | | 06/28/12 | | 15 to 15 Years |
| C-Store (Irving Oil Marketing, Inc.) | Calais, ME | | (d) | | 187 |
| | 213 |
| | — |
| | — |
| | 187 |
| | 213 |
| | 400 |
| | (83 | ) | | 1968 | | 06/28/12 | | 15 to 20 Years |
| C-Store (Irving Oil Marketing, Inc.) | Brewer, ME | | (d) | | 238 |
| | 260 |
| | — |
| | — |
| | 238 |
| | 260 |
| | 498 |
| | (89 | ) | | 1967 | | 06/28/12 | | 15 to 25 Years |
| C-Store (Irving Oil Marketing, Inc.) | Harrington, ME | | (d) | | 331 |
| | 459 |
| | — |
| | — |
| | 331 |
| | 459 |
| | 790 |
| | (138 | ) | | 1992 | | 06/28/12 | | 15 to 32 Years |
SPIRIT REALTY CAPITAL, INC.
Schedule III Real Estate and
Accumulated Depreciation
(Amounts in thousands)
|
| | | | | | | | | | | | | | | | | | | | | | | | | | | | | | | | | |
| Movie Theatres | | | | | | | | | | | | | | | | | | | | | | |
| | Anderson, SC | | (c) | | 5,248 |
| | 6,437 |
| | — |
| | — |
| | 5,248 |
| | 6,437 |
| | 11,685 |
| | (786 | ) | | 2000 | | 09/25/14 | | 15 to 30 Years |
| | Arnold, MO | | (a) | | 3,275 |
| | 3,014 |
| | — |
| | — |
| | 3,275 |
| | 3,014 |
| | 6,289 |
| | (945 | ) | | 1999 | | 07/17/13 | | 5 to 21 Years |
| | Avon, IN | | (c) | | 3,388 |
| | 2,967 |
| | — |
| | — |
| | 3,388 |
| | 2,967 |
| | 6,355 |
| | (351 | ) | | 1995 | | 03/01/16 | | 4 to 30 Years |
| | Batavia, IL | | (a) | | 4,705 |
| | 7,561 |
| | — |
| | — |
| | 4,705 |
| | 7,561 |
| | 12,266 |
| | (2,636 | ) | | 1995 | | 06/30/09 | | 11 to 38 Years |
| | Bixby, OK | | (a) | | 5,585 |
| | 10,101 |
| | — |
| | — |
| | 5,585 |
| | 10,101 |
| | 15,686 |
| | (4,380 | ) | | 1998 | | 07/01/05 | | 14 to 30 Years |
| | Bowie, MD | | (c) | | 7,138 |
| | 5,935 |
| | — |
| | 23 |
| | 7,138 |
| | 5,958 |
| | 13,096 |
| | (39 | ) | | 1998 | | 11/23/16 | | 8 to 40 Years |
| | Carrollton, GA | | (c) | | 1,879 |
| | 5,868 |
| | — |
| | — |
| | 1,879 |
| | 5,868 |
| | 7,747 |
| | (404 | ) | | 2005 | | 12/30/14 | | 15 to 40 Years |
| | Cedar Rapids, IA | | (a) | | 2,521 |
| | 5,461 |
| | — |
| | — |
| | 2,521 |
| | 5,461 |
| | 7,982 |
| | (1,797 | ) | | 1998 | | 07/01/05 | | 15 to 40 Years |
| | Chubbock, ID | | (a) | | 1,845 |
| | 2,691 |
| | — |
| | — |
| | 1,845 |
| | 2,691 |
| | 4,536 |
| | (234 | ) | | 2004 | | 12/23/14 | | 10 to 30 Years |
| | Colorado Springs, CO | | (a) | | 1,892 |
| | 1,732 |
| | — |
| | — |
| | 1,892 |
| | 1,732 |
| | 3,624 |
| | (936 | ) | | 1995 | | 09/30/05 | | 14 to 30 Years |
| | Columbia, SC | | (a) | | 2,115 |
| | 2,091 |
| | — |
| | — |
| | 2,115 |
| | 2,091 |
| | 4,206 |
| | (862 | ) | | 1996 | | 09/30/05 | | 15 to 30 Years |
| | Covina, CA | | (c) | | 5,566 |
| | 26,922 |
| | — |
| | — |
| | 5,566 |
| | 26,922 |
| | 32,488 |
| | (6,844 | ) | | 1997 | | 06/23/04 | | 13 to 40 Years |
| | Danville, VA | | (c) | | 1,349 |
| | 6,406 |
| | — |
| | — |
| | 1,349 |
| | 6,406 |
| | 7,755 |
| | (410 | ) | | 2002 | | 12/30/14 | | 15 to 40 Years |
| | Dawsonville, GA | | (c) | | 1,859 |
| | 4,207 |
| | — |
| | — |
| | 1,859 |
| | 4,207 |
| | 6,066 |
| | (313 | ) | | 2005 | | 12/30/14 | | 15 to 40 Years |
| | Delano, MN | | (c) | | 397 |
| | 1,052 |
| | — |
| | — |
| | 397 |
| | 1,052 |
| | 1,449 |
| | (29 | ) | | 1984 | | 07/29/16 | | 6 to 20 Years |
| | Dickson City, PA | | (a) | | 4,198 |
| | 5,269 |
| | — |
| | — |
| | 4,198 |
| | 5,269 |
| | 9,467 |
| | (770 | ) | | 2010 | | 09/29/14 | | 13 to 30 Years |
| | Downey, CA | | (c) | | 1,767 |
| | 12,172 |
| | — |
| | — |
| | 1,767 |
| | 12,172 |
| | 13,939 |
| | (524 | ) | | 1997 | | 09/30/15 | | 15 to 30 Years |
| | Durham, NC | | (a) | | 1,630 |
| | 2,685 |
| | — |
| | — |
| | 1,630 |
| | 2,685 |
| | 4,315 |
| | (1,335 | ) | | 1994 | | 09/30/05 | | 13 to 30 Years |
| | East Bethel, MN | | (c) | | 545 |
| | 1,768 |
| | — |
| | — |
| | 545 |
| | 1,768 |
| | 2,313 |
| | (53 | ) | | 1990 | | 07/29/16 | | 6 to 20 Years |
| | Fenton, MO | | (a) | | 2,792 |
| | 5,982 |
| | — |
| | — |
| | 2,792 |
| | 5,982 |
| | 8,774 |
| | (577 | ) | | 2008 | | 09/29/14 | | 13 to 40 Years |
| | Fort Wayne, IN | | (a) | | 2,697 |
| | 9,849 |
| | 681 |
| | — |
| | 3,378 |
| | 9,849 |
| | 13,227 |
| | (3,190 | ) | | 2005 | | 11/30/05 | | 15 to 40 Years |
| | Gainesville, GA | | (c) | | 2,278 |
| | 8,684 |
| | — |
| | — |
| | 2,278 |
| | 8,684 |
| | 10,962 |
| | (538 | ) | | 1996 | | 12/30/14 | | 15 to 40 Years |
| | Gibsonton, FL | | (c) | | 4,970 |
| | 4,014 |
| | — |
| | 3,916 |
| | 4,970 |
| | 7,930 |
| | 12,900 |
| | (138 | ) | | 2016 | | 11/05/15 | | 15 to 15 Years |
| | Greensboro, NC | | (a) | | 2,359 |
| | 2,431 |
| | — |
| | — |
| | 2,359 |
| | 2,431 |
| | 4,790 |
| | (1,039 | ) | | 1996 | | 09/30/05 | | 15 to 30 Years |
| | Griffin, GA | | (c) | | 1,239 |
| | 3,188 |
| | — |
| | — |
| | 1,239 |
| | 3,188 |
| | 4,427 |
| | (303 | ) | | 2005 | | 12/30/14 | | 15 to 30 Years |
| | Hinesville, GA | | (c) | | 2,049 |
| | 5,216 |
| | — |
| | — |
| | 2,049 |
| | 5,216 |
| | 7,265 |
| | (342 | ) | | 2001 | | 12/30/14 | | 15 to 40 Years |
| | Johnston, IA | | (b) | | 3,046 |
| | 10,213 |
| | — |
| | — |
| | 3,046 |
| | 10,213 |
| | 13,259 |
| | (3,783 | ) | | 1998 | | 06/23/04 | | 15 to 30 Years |
| | Kansas City, MO | | (a) | | 2,543 |
| | 7,943 |
| | — |
| | — |
| | 2,543 |
| | 7,943 |
| | 10,486 |
| | (2,171 | ) | | 2003 | | 07/01/05 | | 14 to 50 Years |
| | Lakeville, MN | | (c) | | 2,843 |
| | 2,843 |
| | — |
| | 2,216 |
| | 2,843 |
| | 5,059 |
| | 7,902 |
| | (87 | ) | | 1998 | | 07/29/16 | | 6 to 30 Years |
| | Lebanon, PA | | (a) | | 747 |
| | 4,295 |
| | — |
| | — |
| | 747 |
| | 4,295 |
| | 5,042 |
| | (366 | ) | | 2006 | | 09/29/14 | | 13 to 30 Years |
| | Lees Summit, MO | | (a) | | 3,517 |
| | 9,735 |
| | — |
| | — |
| | 3,517 |
| | 9,735 |
| | 13,252 |
| | (3,188 | ) | | 1999 | | 07/01/05 | | 14 to 40 Years |
| | Longview, TX | | (a) | | 1,432 |
| | 2,946 |
| | — |
| | — |
| | 1,432 |
| | 2,946 |
| | 4,378 |
| | (1,248 | ) | | 1995 | | 09/30/05 | | 15 to 30 Years |
|
| | | | | | | | | | | | | | | | | | | | | | | | | |
| | | | | | Initial Cost to Company | | Cost Capitalized Subsequent to Acquisition including impairment | | Gross Amount at December 31, 2016 (d) 2017 (g) | | | | | | | | |
| Concept | City, State | | Encumbrances (e) | | Land and Improvements | | Buildings and Improvements | | Land and Improvements | | Buildings and Improvements | | Land and Improvements | | Buildings and Improvements | | Total | | Final Accumulated Depreciation | | Date of Construction | | Date Acquired | | Life in which depreciation in latest Statement of Operations is computed |
Description | | Encumbrances (e)
| | Land and
Improvements
| | Buildings and
Improvements
| | Improvements/
Land
| | Improvements/
building
| | Land and
Improvements
| | Buildings and
Improvements
| | Total | | Final
Accum
| | Date of
Construction
| | Date
Acquired
| |
|
| | | | | | | | | | | | | | | | | | | | | | | | | | | | | | | | | |
| | Martinsburg, WV | | (a) | | 2,450 |
| | 3,528 |
| | — |
| | — |
| | 2,450 |
| | 3,528 |
| | 5,978 |
| | (1,622 | ) | | 1998 | | 09/30/05 | | 12 to 30 Years |
| | Massillon, OH | | (a) | | 1,767 |
| | 2,667 |
| | — |
| | 1,600 |
| | 1,767 |
| | 4,267 |
| | 6,034 |
| | (372 | ) | | 2005 | | 09/29/14 | | 13 to 30 Years |
| | Missoula, MT | | (a) | | 2,333 |
| | 3,406 |
| | — |
| | — |
| | 2,333 |
| | 3,406 |
| | 5,739 |
| | (1,184 | ) | | 1998 | | 06/23/04 | | 15 to 40 Years |
| | Monrovia, CA | | (c) | | 2,448 |
| | 17,849 |
| | — |
| | — |
| | 2,448 |
| | 17,849 |
| | 20,297 |
| | (748 | ) | | 2000 | | 09/30/15 | | 15 to 30 Years |
| | Monticello, MN | | (c) | | 1,161 |
| | 3,155 |
| | — |
| | — |
| | 1,161 |
| | 3,155 |
| | 4,316 |
| | (87 | ) | | 2004 | | 07/29/16 | | 6 to 30 Years |
| | Mooresville, NC | | (c) | | 5,087 |
| | 6,800 |
| | — |
| | — |
| | 5,087 |
| | 6,800 |
| | 11,887 |
| | (637 | ) | | 1999 | | 09/25/14 | | 15 to 30 Years |
| | Nitro, WV | | (a) | | 1,816 |
| | 3,068 |
| | — |
| | — |
| | 1,816 |
| | 3,068 |
| | 4,884 |
| | (397 | ) | | 2005 | | 09/29/14 | | 13 to 30 Years |
| | Noblesville, IN | | (a) | | 1,760 |
| | — |
| | 2,338 |
| | 10,172 |
| | 4,098 |
| | 10,172 |
| | 14,270 |
| | (3,421 | ) | | 2008 | | 06/30/09 | | 14 to 39 Years |
| | Omaha, NE | | (c) | | 2,254 |
| | 4,249 |
| | — |
| | — |
| | 2,254 |
| | 4,249 |
| | 6,503 |
| | (369 | ) | | 2006 | | 03/26/15 | | 12 to 30 Years |
| | Overland Park, KS | | (a) | | 4,935 |
| | 12,281 |
| | — |
| | — |
| | 4,935 |
| | 12,281 |
| | 17,216 |
| | (2,924 | ) | | 2004 | | 08/01/09 | | 10 to 57 Years |
| | Phoenix, AZ | | (a) | | 2,652 |
| | 11,495 |
| | — |
| | — |
| | 2,652 |
| | 11,495 |
| | 14,147 |
| | (2,920 | ) | | 1997 | | 07/01/05 | | 12 to 40 Years |
| | Plymouth, MN | | (c) | | 2,516 |
| | 4,090 |
| | — |
| | 2,099 |
| | 2,516 |
| | 6,189 |
| | 8,705 |
| | (70 | ) | | 1988 | | 07/29/16 | | 6 to 30 Years |
| | Portage, IN | | (a) | | 4,621 |
| | 8,300 |
| | — |
| | — |
| | 4,621 |
| | 8,300 |
| | 12,921 |
| | (3,214 | ) | | 2007 | | 06/30/09 | | 13 to 38 Years |
| | Raleigh, NC | | (a) | | 3,636 |
| | 8,833 |
| | — |
| | — |
| | 3,636 |
| | 8,833 |
| | 12,469 |
| | (3,428 | ) | | 1988 | | 06/10/10 | | 9 to 27 Years |
| | Redlands, CA | | (c) | | 4,443 |
| | 17,859 |
| | — |
| | — |
| | 4,443 |
| | 17,859 |
| | 22,302 |
| | (793 | ) | | 1997 | | 09/30/15 | | 15 to 30 Years |
| | Rogers, MN | | (c) | | 2,337 |
| | 2,383 |
| | — |
| | 552 |
| | 2,337 |
| | 2,935 |
| | 5,272 |
| | (66 | ) | | 2006 | | 07/29/16 | | 6 to 30 Years |
| | Saginaw, MI | | (a) | | 2,538 |
| | — |
| | — |
| | 8,358 |
| | 2,538 |
| | 8,358 |
| | 10,896 |
| | (781 | ) | | 2013 | | 12/02/13 | | 15 to 50 Years |
| | Simpsonville, SC | | (a) | | 1,862 |
| | 5,453 |
| | — |
| | — |
| | 1,862 |
| | 5,453 |
| | 7,315 |
| | (537 | ) | | 2010 | | 09/29/14 | | 13 to 40 Years |
| | South Bend, IN | | (c) | | 4,352 |
| | 9,411 |
| | — |
| | — |
| | 4,352 |
| | 9,411 |
| | 13,763 |
| | (550 | ) | | 1997 | | 01/04/16 | | 6 to 30 Years |
| | Surprise, AZ | | (a) | | 2,918 |
| | 7,122 |
| | — |
| | — |
| | 2,918 |
| | 7,122 |
| | 10,040 |
| | (305 | ) | | 2008 | | 11/10/15 | | 13 to 40 Years |
| | Valdosta, GA | | (c) | | 3,038 |
| | 13,801 |
| | — |
| | — |
| | 3,038 |
| | 13,801 |
| | 16,839 |
| | (817 | ) | | 2001 | | 12/30/14 | | 15 to 40 Years |
| | Waconia, MN | | (c) | | 249 |
| | 1,464 |
| | — |
| | — |
| | 249 |
| | 1,464 |
| | 1,713 |
| | (31 | ) | | 1989 | | 07/29/16 | | 6 to 20 Years |
| | Warner Robins, GA | | (c) | | 2,598 |
| | 8,324 |
| | — |
| | — |
| | 2,598 |
| | 8,324 |
| | 10,922 |
| | (531 | ) | | 2010 | | 12/30/14 | | 15 to 40 Years |
| | WhiteBear Township, MN | | (c) | | 2,773 |
| | 5,476 |
| | — |
| | 107 |
| | 2,773 |
| | 5,583 |
| | 8,356 |
| | (148 | ) | | 1995 | | 07/29/16 | | 6 to 20 Years |
| | Wilmington, NC | | (a) | | 1,552 |
| | 2,934 |
| | — |
| | — |
| | 1,552 |
| | 2,934 |
| | 4,486 |
| | (1,198 | ) | | 1997 | | 09/30/05 | | 15 to 30 Years |
| | Winston-Salem, NC | | (a) | | 1,567 |
| | 2,140 |
| | — |
| | — |
| | 1,567 |
| | 2,140 |
| | 3,707 |
| | (1,070 | ) | | 1993 | | 10/28/05 | | 13 to 30 Years |
| | Woodstock, GA | | (c) | | 2,798 |
| | 5,057 |
| | — |
| | — |
| | 2,798 |
| | 5,057 |
| | 7,855 |
| | (421 | ) | | 1997 | | 12/30/14 | | 15 to 30 Years |
| | Yukon, OK | | (b) | | 1,082 |
| | 3,538 |
| | — |
| | — |
| | 1,082 |
| | 3,538 |
| | 4,620 |
| | (518 | ) | | 2007 | | 07/17/13 | | 8 to 33 Years |
|
| | | | | | | | | | | | | | | | | | | | | | | | | | | | | | | | | |
| C-Store (Irving Oil Marketing, Inc.) | Lewiston, ME | | (d) | | 460 |
| | 341 |
| | — |
| | — |
| | 460 |
| | 341 |
| | 801 |
| | (118 | ) | | 1994 | | 06/28/12 | | 15 to 28 Years |
| C-Store (Irving Oil Marketing, Inc.) | Rockland, ME | | (d) | | 211 |
| | 303 |
| | — |
| | — |
| | 211 |
| | 303 |
| | 514 |
| | (82 | ) | | 1984 | | 06/28/12 | | 15 to 28 Years |
| C-Store (Irving Oil Marketing, Inc.) | Oakfield, ME | | (d) | | 273 |
| | 229 |
| | — |
| | — |
| | 273 |
| | 229 |
| | 502 |
| | (95 | ) | | 1993 | | 06/28/12 | | 15 to 25 Years |
| C-Store (Irving Oil Marketing, Inc.) | Ashland, NH | | (d) | | 398 |
| | 157 |
| | — |
| | — |
| | 398 |
| | 157 |
| | 555 |
| | (64 | ) | | 1970 | | 06/28/12 | | 15 to 20 Years |
| C-Store (Irving Oil Marketing, Inc.) | Berlin, NH | | (d) | | 387 |
| | 317 |
| | — |
| | — |
| | 387 |
| | 317 |
| | 704 |
| | (118 | ) | | 1991 | | 06/28/12 | | 15 to 22 Years |
| C-Store (Irving Oil Marketing, Inc.) | Paris, ME | | (d) | | 139 |
| | 153 |
| | — |
| | — |
| | 139 |
| | 153 |
| | 292 |
| | (68 | ) | | 1954 | | 06/28/12 | | 15 to 17 Years |
| C-Store (Irving Oil Marketing, Inc.) | Madison, ME | | (d) | | 130 |
| | 410 |
| | — |
| | — |
| | 130 |
| | 410 |
| | 540 |
| | (109 | ) | | 1988 | | 06/28/12 | | 15 to 25 Years |
| C-Store (Irving Oil Marketing, Inc.) | Bartlett, NH | | (d) | | 325 |
| | 399 |
| | — |
| | — |
| | 325 |
| | 399 |
| | 724 |
| | (103 | ) | | 1998 | | 06/28/12 | | 15 to 32 Years |
| C-Store (Irving Oil Marketing, Inc.) | Auburn, ME | | (d) | | 371 |
| | 444 |
| | — |
| | — |
| | 371 |
| | 444 |
| | 815 |
| | (115 | ) | | 1996 | | 06/28/12 | | 15 to 30 Years |
| C-Store (Irving Oil Marketing, Inc.) | Auburn, ME | | (d) | | 287 |
| | 222 |
| | — |
| | — |
| | 287 |
| | 222 |
| | 509 |
| | (82 | ) | | 1968 | | 06/28/12 | | 15 to 20 Years |
| C-Store (Irving Oil Marketing, Inc.) | South Portland, ME | | (d) | | 661 |
| | 194 |
| | — |
| | — |
| | 661 |
| | 194 |
| | 855 |
| | (112 | ) | | 1970 | | 06/28/12 | | 15 to 15 Years |
| C-Store (Irving Oil Marketing, Inc.) | Freeport, ME | | (d) | | 503 |
| | 343 |
| | — |
| | — |
| | 503 |
| | 343 |
| | 846 |
| | (103 | ) | | 1991 | | 06/28/12 | | 15 to 26 Years |
| C-Store (Irving Oil Marketing, Inc.) | Sanford, ME | | (d) | | 807 |
| | 579 |
| | — |
| | — |
| | 807 |
| | 579 |
| | 1,386 |
| | (149 | ) | | 1997 | | 06/28/12 | | 15 to 28 Years |
| C-Store (Irving Oil Marketing, Inc.) | Gorham, NH | | (d) | | 723 |
| | 358 |
| | — |
| | — |
| | 723 |
| | 358 |
| | 1,081 |
| | (154 | ) | | 1975 | | 06/28/12 | | 15 to 18 Years |
| C-Store (Irving Oil Marketing, Inc.) | Manchester, ME | | (d) | | 279 |
| | 285 |
| | — |
| | — |
| | 279 |
| | 285 |
| | 564 |
| | (107 | ) | | 1990 | | 06/28/12 | | 15 to 20 Years |
| C-Store (Irving Oil Marketing, Inc.) | Augusta, ME | | (d) | | 318 |
| | 322 |
| | — |
| | — |
| | 318 |
| | 322 |
| | 640 |
| | (84 | ) | | 1997 | | 06/28/12 | | 15 to 28 Years |
| C-Store (Irving Oil Marketing, Inc.) | Concord, NH | | (d) | | 260 |
| | 330 |
| | — |
| | — |
| | 260 |
| | 330 |
| | 590 |
| | (95 | ) | | 1988 | | 06/28/12 | | 15 to 25 Years |
| C-Store (Irving Oil Marketing, Inc.) | Newport, NH | | (d) | | 519 |
| | 581 |
| | — |
| | — |
| | 519 |
| | 581 |
| | 1,100 |
| | (161 | ) | | 1998 | | 06/28/12 | | 15 to 30 Years |
| C-Store (Irving Oil Marketing, Inc.) | Yarmouth, ME | | (d) | | 950 |
| | 278 |
| | — |
| | — |
| | 950 |
| | 278 |
| | 1,228 |
| | (105 | ) | | 1990 | | 01/24/14 | | 14 to 40 Years |
SPIRIT REALTY CAPITAL, INC.
Schedule III Real Estate and
Accumulated Depreciation
(Amounts in thousands)
|
| | | | | | | | | | | | | | | | | | | | | | | | | | | | | | | | | |
| Convenience Stores | | | | | | | | | | | | | | | | | | | | | | |
| | Akron, OH | | (c) | | 424 |
| | 1,139 |
| | — |
| | — |
| | 424 |
| | 1,139 |
| | 1,563 |
| | (188 | ) | | 1995 | | 07/17/13 | | 13 to 30 Years |
| | Akron, OH | | (c) | | 587 |
| | 1,073 |
| | — |
| | — |
| | 587 |
| | 1,073 |
| | 1,660 |
| | (197 | ) | | 1998 | | 07/17/13 | | 13 to 32 Years |
| | Akron, OH | | (c) | | 500 |
| | 2,058 |
| | — |
| | — |
| | 500 |
| | 2,058 |
| | 2,558 |
| | (278 | ) | | 1999 | | 07/17/13 | | 15 to 33 Years |
| | Akron, OH | | (c) | | 337 |
| | 1,149 |
| | — |
| | — |
| | 337 |
| | 1,149 |
| | 1,486 |
| | (160 | ) | | 2001 | | 07/17/13 | | 15 to 35 Years |
| | Akron, OH | | (c) | | 595 |
| | 1,031 |
| | — |
| | — |
| | 595 |
| | 1,031 |
| | 1,626 |
| | (188 | ) | | 1995 | | 07/17/13 | | 14 to 30 Years |
| | Akron, OH | | (c) | | 554 |
| | 824 |
| | — |
| | — |
| | 554 |
| | 824 |
| | 1,378 |
| | (136 | ) | | 1969 | | 07/17/13 | | 14 to 38 Years |
| | Akron, OH | | (c) | | 517 |
| | 1,122 |
| | — |
| | — |
| | 517 |
| | 1,122 |
| | 1,639 |
| | (199 | ) | | 1994 | | 07/17/13 | | 13 to 29 Years |
|
| | | | | | | | | | | | | | | | | | | | | | | | | |
| | | | | | Initial Cost to Company | | Cost Capitalized Subsequent to Acquisition including impairment | | Gross Amount at December 31, 2016 (d) 2017 (g) | | | | | | | | |
| Concept | City, State | | Encumbrances (e) | | Land and Improvements | | Buildings and Improvements | | Land and Improvements | | Buildings and Improvements | | Land and Improvements | | Buildings and Improvements | | Total | | Final Accumulated Depreciation | | Date of Construction | | Date Acquired | | Life in which depreciation in latest Statement of Operations is computed |
Description | | Encumbrances (e)
| | Land and
Improvements
| | Buildings and
Improvements
| | Improvements/
Land
| | Improvements/
building
| | Land and
Improvements
| | Buildings and
Improvements
| | Total | | Final
Accum
| | Date of
Construction
| | Date
Acquired
| |
|
| | | | | | | | | | | | | | | | | | | | | | | | | | | | | | | | | |
| | Akron, OH | | (c) | | 283 |
| | 1,160 |
| | — |
| | — |
| | 283 |
| | 1,160 |
| | 1,443 |
| | (168 | ) | | 1997 | | 07/17/13 | | 14 to 32 Years |
| | Akron, OH | | (c) | | 434 |
| | 1,198 |
| | — |
| | — |
| | 434 |
| | 1,198 |
| | 1,632 |
| | (206 | ) | | 1994 | | 07/17/13 | | 14 to 29 Years |
| | Akron, OH | | (c) | | 343 |
| | 1,193 |
| | — |
| | — |
| | 343 |
| | 1,193 |
| | 1,536 |
| | (183 | ) | | 1991 | | 07/17/13 | | 15 to 31 Years |
| | Akron, OH | | (c) | | 513 |
| | 1,251 |
| | — |
| | — |
| | 513 |
| | 1,251 |
| | 1,764 |
| | (199 | ) | | 1996 | | 07/17/13 | | 15 to 31 Years |
| | Akron, OH | | (c) | | 321 |
| | 1,179 |
| | — |
| | — |
| | 321 |
| | 1,179 |
| | 1,500 |
| | (185 | ) | | 1994 | | 07/17/13 | | 13 to 29 Years |
| | Akron, OH | | (c) | | 402 |
| | 1,263 |
| | — |
| | — |
| | 402 |
| | 1,263 |
| | 1,665 |
| | (177 | ) | | 2000 | | 07/17/13 | | 13 to 34 Years |
| | Akron, OH | | (c) | | 291 |
| | 1,230 |
| | — |
| | — |
| | 291 |
| | 1,230 |
| | 1,521 |
| | (215 | ) | | 1950 | | 07/17/13 | | 12 to 25 Years |
| | Albuquerque, NM | | (c) | | 699 |
| | 777 |
| | — |
| | — |
| | 699 |
| | 777 |
| | 1,476 |
| | (241 | ) | | 1994 | | 07/17/13 | | 9 to 35 Years |
| | Allegan, MI | | (c) | | 392 |
| | 224 |
| | — |
| | — |
| | 392 |
| | 224 |
| | 616 |
| | (15 | ) | | 1965 | | 05/19/16 | | 17 to 30 Years |
| | Alma, MI | | (c) | | 235 |
| | 437 |
| | — |
| | — |
| | 235 |
| | 437 |
| | 672 |
| | (14 | ) | | 2006 | | 05/19/16 | | 17 to 30 Years |
| | Alpena, MI | | (c) | | 392 |
| | 336 |
| | — |
| | — |
| | 392 |
| | 336 |
| | 728 |
| | (14 | ) | | 1998 | | 05/19/16 | | 17 to 40 Years |
| | Alpena, MI | | (c) | | 471 |
| | 561 |
| | — |
| | — |
| | 471 |
| | 561 |
| | 1,032 |
| | (18 | ) | | 1999 | | 05/19/16 | | 17 to 40 Years |
| | Altavista, VA | | (c) | | 358 |
| | 1,401 |
| | — |
| | — |
| | 358 |
| | 1,401 |
| | 1,759 |
| | (84 | ) | | 1981 | | 06/30/15 | | 15 to 30 Years |
| | Altavista, VA | | (c) | | 467 |
| | 745 |
| | — |
| | — |
| | 467 |
| | 745 |
| | 1,212 |
| | (54 | ) | | 1984 | | 06/30/15 | | 15 to 30 Years |
| | Anniston, AL | | (c) | | 490 |
| | 210 |
| | — |
| | — |
| | 490 |
| | 210 |
| | 700 |
| | (14 | ) | | 1960 | | 07/11/16 | | 15 to 20 Years |
| | Apopka, FL | | (c) | | 477 |
| | 389 |
| | — |
| | — |
| | 477 |
| | 389 |
| | 866 |
| | (76 | ) | | 1989 | | 12/19/13 | | 15 to 30 Years |
| | Apopka, FL | | (c) | | 1,357 |
| | 748 |
| | — |
| | — |
| | 1,357 |
| | 748 |
| | 2,105 |
| | (99 | ) | | 1997 | | 10/28/15 | | 15 to 30 Years |
| | Apple Valley, CA | | (c) | | 782 |
| | 662 |
| | — |
| | — |
| | 782 |
| | 662 |
| | 1,444 |
| | (251 | ) | | 1985 | | 05/02/14 | | 10 to 15 Years |
| | Asheville, NC | | (a) | | 278 |
| | 776 |
| | — |
| | 168 |
| | 278 |
| | 944 |
| | 1,222 |
| | (180 | ) | | 2000 | | 01/01/14 | | 8 to 29 Years |
| | Asheville, NC | | (a) | | 247 |
| | 497 |
| | — |
| | 87 |
| | 247 |
| | 584 |
| | 831 |
| | (121 | ) | | 1986 | | 01/01/14 | | 8 to 29 Years |
| | Ashland, NH | | (c) | | 398 |
| | 157 |
| | — |
| | — |
| | 398 |
| | 157 |
| | 555 |
| | (53 | ) | | 1970 | | 06/28/12 | | 15 to 20 Years |
| | Auburn, AL | | (c) | | 757 |
| | 1,199 |
| | — |
| | — |
| | 757 |
| | 1,199 |
| | 1,956 |
| | (243 | ) | | 1990 | | 07/17/13 | | 10 to 25 Years |
| | Auburn, AL | | (c) | | 2,188 |
| | 945 |
| | — |
| | 85 |
| | 2,188 |
| | 1,030 |
| | 3,218 |
| | (47 | ) | | 2001 | | 07/11/16 | | 15 to 40 Years |
| | Auburn, ME | | (c) | | 371 |
| | 444 |
| | — |
| | — |
| | 371 |
| | 444 |
| | 815 |
| | (94 | ) | | 1996 | | 06/28/12 | | 15 to 30 Years |
| | Auburn, ME | | (c) | | 287 |
| | 222 |
| | — |
| | — |
| | 287 |
| | 222 |
| | 509 |
| | (67 | ) | | 1968 | | 06/28/12 | | 15 to 20 Years |
| | Augusta, GA | | (c) | | 400 |
| | 1,540 |
| | — |
| | — |
| | 400 |
| | 1,540 |
| | 1,940 |
| | (217 | ) | | 1981 | | 07/17/13 | | 13 to 30 Years |
| | Augusta, ME | | (c) | | 318 |
| | 322 |
| | — |
| | — |
| | 318 |
| | 322 |
| | 640 |
| | (69 | ) | | 1997 | | 06/28/12 | | 15 to 28 Years |
| | Bangor, ME | | (c) | | 327 |
| | 141 |
| | — |
| | — |
| | 327 |
| | 141 |
| | 468 |
| | (75 | ) | | 1973 | | 06/28/12 | | 15 to 15 Years |
| | Barberton, OH | | (c) | | 255 |
| | 1,244 |
| | — |
| | — |
| | 255 |
| | 1,244 |
| | 1,499 |
| | (205 | ) | | 1991 | | 07/17/13 | | 12 to 26 Years |
| | Barberton, OH | | (c) | | 884 |
| | 1,885 |
| | — |
| | — |
| | 884 |
| | 1,885 |
| | 2,769 |
| | (301 | ) | | 1981 | | 07/17/13 | | 13 to 34 Years |
| | Barberton, OH | | (c) | | 321 |
| | 1,219 |
| | — |
| | — |
| | 321 |
| | 1,219 |
| | 1,540 |
| | (180 | ) | | 1983 | | 07/17/13 | | 14 to 31 Years |
| | Bartlett, NH | | (c) | | 325 |
| | 399 |
| | — |
| | — |
| | 325 |
| | 399 |
| | 724 |
| | (85 | ) | | 1998 | | 06/28/12 | | 15 to 32 Years |
| | Barton, VT | | (c) | | 307 |
| | 609 |
| | — |
| | — |
| | 307 |
| | 609 |
| | 916 |
| | (69 | ) | | 1975 | | 01/24/14 | | 14 to 40 Years |
| | Baton Rouge, LA | | (c) | | 260 |
| | 859 |
| | — |
| | — |
| | 260 |
| | 859 |
| | 1,119 |
| | (159 | ) | | 1976 | | 07/17/13 | | 7 to 25 Years |
| | Baton Rouge, LA | | (c) | | 330 |
| | 997 |
| | — |
| | — |
| | 330 |
| | 997 |
| | 1,327 |
| | (159 | ) | | 1970 | | 07/17/13 | | 8 to 30 Years |
| | Baton Rouge, LA | | (c) | | 481 |
| | 913 |
| | — |
| | — |
| | 481 |
| | 913 |
| | 1,394 |
| | (172 | ) | | 1977 | | 07/17/13 | | 8 to 30 Years |
| | Beattyville, KY | | (c) | | 278 |
| | 795 |
| | — |
| | — |
| | 278 |
| | 795 |
| | 1,073 |
| | (51 | ) | | 1981 | | 06/30/15 | | 15 to 30 Years |
| | Beaufort, SC | | (c) | | 850 |
| | 1,337 |
| | — |
| | — |
| | 850 |
| | 1,337 |
| | 2,187 |
| | (228 | ) | | 1997 | | 07/17/13 | | 12 to 34 Years |
|
| | | | | | | | | | | | | | | | | | | | | | | | | | | | | | | | | |
| C-Store (Irving Oil Marketing, Inc.) | Waldoboro, ME | | (d) | | 1,450 |
| | 834 |
| | — |
| | — |
| | 1,450 |
| | 834 |
| | 2,284 |
| | (210 | ) | | 1996 | | 01/24/14 | | 14 to 40 Years |
| C-Store (Irving Oil Marketing, Inc.) | Wiscasset, ME | | (d) | | 1,305 |
| | 538 |
| | — |
| | — |
| | 1,305 |
| | 538 |
| | 1,843 |
| | (215 | ) | | 1992 | | 01/24/14 | | 14 to 30 Years |
| C-Store (Irving Oil Marketing, Inc.) | South Portland, ME | | (d) | | 448 |
| | 593 |
| | — |
| | — |
| | 448 |
| | 593 |
| | 1,041 |
| | (109 | ) | | 1970 | | 01/24/14 | | 14 to 40 Years |
| C-Store (Irving Oil Marketing, Inc.) | Hampden, ME | | (d) | | 987 |
| | 424 |
| | — |
| | — |
| | 987 |
| | 424 |
| | 1,411 |
| | (186 | ) | | 1997 | | 01/24/14 | | 14 to 30 Years |
| C-Store (Irving Oil Marketing, Inc.) | Presque Isle, ME | | (d) | | 708 |
| | 390 |
| | — |
| | — |
| | 708 |
| | 390 |
| | 1,098 |
| | (144 | ) | | 1995 | | 01/24/14 | | 14 to 30 Years |
| C-Store (Irving Oil Marketing, Inc.) | Bucksport, ME | | (d) | | 1,203 |
| | 587 |
| | — |
| | — |
| | 1,203 |
| | 587 |
| | 1,790 |
| | (141 | ) | | 1995 | | 01/24/14 | | 14 to 40 Years |
| C-Store (Irving Oil Marketing, Inc.) | Belmont, NH | | (d) | | 315 |
| | 218 |
| | — |
| | — |
| | 315 |
| | 218 |
| | 533 |
| | (60 | ) | | 1969 | | 01/24/14 | | 14 to 30 Years |
| C-Store (Irving Oil Marketing, Inc.) | Laconia, NH | | (d) | | 411 |
| | 770 |
| | — |
| | — |
| | 411 |
| | 770 |
| | 1,181 |
| | (157 | ) | | 1998 | | 01/24/14 | | 14 to 30 Years |
| C-Store (Irving Oil Marketing, Inc.) | Raymond, NH | | (d) | | 1,722 |
| | 430 |
| | — |
| | — |
| | 1,722 |
| | 430 |
| | 2,152 |
| | (215 | ) | | 1986 | | 01/24/14 | | 14 to 20 Years |
| C-Store (Irving Oil Marketing, Inc.) | Grandtham, NH | | (d) | | 576 |
| | 394 |
| | — |
| | — |
| | 576 |
| | 394 |
| | 970 |
| | (108 | ) | | 1989 | | 01/24/14 | | 14 to 30 Years |
| C-Store (Irving Oil Marketing, Inc.) | Belmont, NH | | (d) | | 524 |
| | 879 |
| | — |
| | — |
| | 524 |
| | 879 |
| | 1,403 |
| | (193 | ) | | 2002 | | 01/24/14 | | 14 to 30 Years |
| C-Store (Irving Oil Marketing, Inc.) | Keene, NH | | (d) | | 553 |
| | 289 |
| | — |
| | — |
| | 553 |
| | 289 |
| | 842 |
| | (80 | ) | | 1960 | | 01/24/14 | | 14 to 30 Years |
| C-Store (Irving Oil Marketing, Inc.) | Barton, VT | | (d) | | 307 |
| | 609 |
| | — |
| | — |
| | 307 |
| | 609 |
| | 916 |
| | (93 | ) | | 1975 | | 01/24/14 | | 14 to 40 Years |
| C-Store (JAKG Petro, LLC) | Youngstown, FL | | (d) | | 1,449 |
| | 1,763 |
| | — |
| | 33 |
| | 1,449 |
| | 1,796 |
| | 3,245 |
| | (95 | ) | | 1999 | | 04/26/17 | | 15 to 30 Years |
| C-Store (Jordan Oil Company of the Carolinas, Inc) | Murphy, NC | | (a) | | 489 |
| | 297 |
| | — |
| | 49 |
| | 489 |
| | 346 |
| | 835 |
| | (119 | ) | | 1965 | | 05/08/13 | | 8 to 19 Years |
| C-Store (Jordan Oil Company of the Carolinas, Inc) | Roebuck, SC | | (a) | | 708 |
| | 818 |
| | — |
| | 150 |
| | 708 |
| | 968 |
| | 1,676 |
| | (305 | ) | | 1992 | | 01/01/14 | | 8 to 29 Years |
| C-Store (Jordan Oil Company of the Carolinas, Inc) | Laurens, SC | | (a) | | 504 |
| | 622 |
| | — |
| | 117 |
| | 504 |
| | 739 |
| | 1,243 |
| | (225 | ) | | 1992 | | 01/01/14 | | 8 to 29 Years |
| C-Store (Jordan Oil Company of the Carolinas, Inc) | Asheville, NC | | (a) | | 278 |
| | 776 |
| | — |
| | 166 |
| | 278 |
| | 942 |
| | 1,220 |
| | (227 | ) | | 2000 | | 01/01/14 | | 8 to 29 Years |
SPIRIT REALTY CAPITAL, INC.
Schedule III Real Estate and
Accumulated Depreciation
(Amounts in thousands)
|
| | | | | | | | | | | | | | | | | | | | | | | | | |
| | | | | | Initial Cost to Company | | Cost Capitalized Subsequent to Acquisition including impairment | | Gross Amount at December 31, 2016 (d) 2017 (g) | | | | | | | | |
| Concept | City, State | | Encumbrances (e) | | Land and Improvements | | Buildings and Improvements | | Land and Improvements | | Buildings and Improvements | | Land and Improvements | | Buildings and Improvements | | Total | | Final Accumulated Depreciation | | Date of Construction | | Date Acquired | | Life in which depreciation in latest Statement of Operations is computed |
Description | | Encumbrances (e)
| | Land and
Improvements
| | Buildings and
Improvements
| | Improvements/
Land
| | Improvements/
building
| | Land and
Improvements
| | Buildings and
Improvements
| | Total | | Final
Accum
| | Date of
Construction
| | Date
Acquired
| |
|
| | | | | | | | | | | | | | | | | | | | | | | | | | | | | | | | | |
| | Bedford, OH | | (c) | | 750 |
| | 680 |
| | — |
| | — |
| | 750 |
| | 680 |
| | 1,430 |
| | (148 | ) | | 2000 | | 07/17/13 | | 15 to 33 Years |
| | Bedford, VA | | (c) | | 258 |
| | 818 |
| | — |
| | — |
| | 258 |
| | 818 |
| | 1,076 |
| | (53 | ) | | 1997 | | 06/30/15 | | 15 to 30 Years |
| | Belle Glade, FL | | (c) | | 978 |
| | 1,184 |
| | — |
| | — |
| | 978 |
| | 1,184 |
| | 2,162 |
| | (101 | ) | | 1960 | | 10/30/14 | | 15 to 40 Years |
| | Belle Isle, FL | | (c) | | 908 |
| | 738 |
| | — |
| | — |
| | 908 |
| | 738 |
| | 1,646 |
| | (67 | ) | | 1996 | | 10/27/15 | | 15 to 30 Years |
| | Belmont, NH | | (c) | | 315 |
| | 218 |
| | — |
| | — |
| | 315 |
| | 218 |
| | 533 |
| | (45 | ) | | 1969 | | 01/24/14 | | 14 to 30 Years |
| | Belmont, NH | | (c) | | 524 |
| | 879 |
| | — |
| | — |
| | 524 |
| | 879 |
| | 1,403 |
| | (144 | ) | | 2002 | | 01/24/14 | | 14 to 30 Years |
| | Bergman, AR | | (c) | | 404 |
| | 549 |
| | — |
| | — |
| | 404 |
| | 549 |
| | 953 |
| | (9 | ) | | 1996 | | 09/30/16 | | 14 to 40 Years |
| | Berlin, NH | | (c) | | 387 |
| | 317 |
| | — |
| | — |
| | 387 |
| | 317 |
| | 704 |
| | (97 | ) | | 1991 | | 06/28/12 | | 15 to 22 Years |
| | Berryville, AR | | (c) | | 314 |
| | 381 |
| | — |
| | — |
| | 314 |
| | 381 |
| | 695 |
| | (6 | ) | | 1996 | | 09/30/16 | | 14 to 40 Years |
| | Blairs, VA | | (c) | | 318 |
| | 636 |
| | — |
| | — |
| | 318 |
| | 636 |
| | 954 |
| | (42 | ) | | 1987 | | 06/30/15 | | 15 to 30 Years |
| | Bluffton, SC | | (c) | | 1,531 |
| | 645 |
| | — |
| | — |
| | 1,531 |
| | 645 |
| | 2,176 |
| | (159 | ) | | 1997 | | 07/17/13 | | 10 to 32 Years |
| | Bossier City, LA | | (c) | | 565 |
| | 1,051 |
| | (21 | ) | | — |
| | 544 |
| | 1,051 |
| | 1,595 |
| | (192 | ) | | 1987 | | 07/17/13 | | 9 to 25 Years |
| | Branson, MO | | (c) | | 605 |
| | 818 |
| | — |
| | — |
| | 605 |
| | 818 |
| | 1,423 |
| | (13 | ) | | 1993 | | 09/30/16 | | 15 to 30 Years |
| | Branson, MO | | (c) | | 1,177 |
| | 1,199 |
| | — |
| | — |
| | 1,177 |
| | 1,199 |
| | 2,376 |
| | (20 | ) | | 1999 | | 09/30/16 | | 12 to 40 Years |
| | Brewer, ME | | (c) | | 238 |
| | 260 |
| | — |
| | — |
| | 238 |
| | 260 |
| | 498 |
| | (73 | ) | | 1967 | | 06/28/12 | | 15 to 25 Years |
| | Brookpark, OH | | (c) | | 623 |
| | 978 |
| | — |
| | — |
| | 623 |
| | 978 |
| | 1,601 |
| | (172 | ) | | 1998 | | 07/17/13 | | 13 to 32 Years |
| | Bucksport, ME | | (c) | | 1,203 |
| | 587 |
| | — |
| | — |
| | 1,203 |
| | 587 |
| | 1,790 |
| | (105 | ) | | 1995 | | 01/24/14 | | 14 to 40 Years |
| | Burton, MI | | (c) | | 336 |
| | 1,323 |
| | — |
| | — |
| | 336 |
| | 1,323 |
| | 1,659 |
| | (34 | ) | | 1969 | | 05/19/16 | | 17 to 30 Years |
| | Butler, MO | | (c) | | 919 |
| | 1,076 |
| | — |
| | — |
| | 919 |
| | 1,076 |
| | 1,995 |
| | (20 | ) | | 1996 | | 09/30/16 | | 15 to 30 Years |
| | Cadillac, MI | | (c) | | 370 |
| | 404 |
| | — |
| | — |
| | 370 |
| | 404 |
| | 774 |
| | (17 | ) | | 1971 | | 05/19/16 | | 17 to 30 Years |
| | Calais, ME | | (c) | | 187 |
| | 213 |
| | — |
| | — |
| | 187 |
| | 213 |
| | 400 |
| | (68 | ) | | 1968 | | 06/28/12 | | 15 to 20 Years |
| | Campton, KY | | (c) | | 189 |
| | 735 |
| | — |
| | — |
| | 189 |
| | 735 |
| | 924 |
| | (47 | ) | | 1996 | | 06/30/15 | | 15 to 30 Years |
| | Canton, OH | | (c) | | 362 |
| | 1,159 |
| | — |
| | — |
| | 362 |
| | 1,159 |
| | 1,521 |
| | (205 | ) | | 1990 | | 07/17/13 | | 12 to 26 Years |
| | Canton, OH | | (c) | | 1,037 |
| | 1,557 |
| | — |
| | — |
| | 1,037 |
| | 1,557 |
| | 2,594 |
| | (291 | ) | | 2000 | | 07/17/13 | | 15 to 34 Years |
| | Carlisle, KY | | (c) | | 209 |
| | 586 |
| | — |
| | — |
| | 209 |
| | 586 |
| | 795 |
| | (40 | ) | | 1989 | | 06/30/15 | | 15 to 30 Years |
| | Carlisle, KY | | (c) | | 298 |
| | 874 |
| | — |
| | — |
| | 298 |
| | 874 |
| | 1,172 |
| | (61 | ) | | 2005 | | 06/30/15 | | 15 to 30 Years |
| | Catlettsburg, KY | | (a) | | 9,344 |
| | 3,989 |
| | — |
| | — |
| | 9,344 |
| | 3,989 |
| | 13,333 |
| | (4,046 | ) | | 2001 | | 07/01/05 | | 13 to 40 Years |
| | Cave Creek, AZ | | (c) | | 2,711 |
| | 2,201 |
| | — |
| | — |
| | 2,711 |
| | 2,201 |
| | 4,912 |
| | (927 | ) | | 1998 | | 07/02/07 | | 15 to 40 Years |
| | Cedar Springs, MI | | (c) | | 191 |
| | 348 |
| | — |
| | — |
| | 191 |
| | 348 |
| | 539 |
| | (12 | ) | | 1965 | | 05/19/16 | | 17 to 30 Years |
| | Charleston, SC | | (c) | | 1,547 |
| | 1,242 |
| | — |
| | — |
| | 1,547 |
| | 1,242 |
| | 2,789 |
| | (312 | ) | | 1987 | | 07/17/13 | | 7 to 20 Years |
| | Charlotte, MI | | (c) | | 224 |
| | 157 |
| | — |
| | — |
| | 224 |
| | 157 |
| | 381 |
| | (10 | ) | | 1968 | | 05/19/16 | | 17 to 30 Years |
| | Charlotte, NC | | (c) | | 1,508 |
| | 749 |
| | (128 | ) | | — |
| | 1,380 |
| | 749 |
| | 2,129 |
| | (159 | ) | | 1996 | | 07/17/13 | | 9 to 35 Years |
| | Charlotte, NC | | (c) | | 1,442 |
| | 789 |
| | — |
| | — |
| | 1,442 |
| | 789 |
| | 2,231 |
| | (204 | ) | | 1997 | | 07/17/13 | | 8 to 35 Years |
| | Charlotte, NC | | (c) | | 1,392 |
| | 563 |
| | — |
| | — |
| | 1,392 |
| | 563 |
| | 1,955 |
| | (245 | ) | | 1991 | | 07/17/13 | | 6 to 32 Years |
| | Clay City, KY | | (c) | | 397 |
| | 884 |
| | — |
| | — |
| | 397 |
| | 884 |
| | 1,281 |
| | (72 | ) | | 2002 | | 06/30/15 | | 15 to 30 Years |
| | Cleveland, MO | | (c) | | 701 |
| | 894 |
| | — |
| | — |
| | 701 |
| | 894 |
| | 1,595 |
| | (133 | ) | | 1994 | | 11/18/14 | | 15 to 20 Years |
| | Cleveland, OH | | (c) | | 804 |
| | 1,513 |
| | — |
| | — |
| | 804 |
| | 1,513 |
| | 2,317 |
| | (237 | ) | | 2002 | | 07/17/13 | | 13 to 35 Years |
| | Clinton, MO | | (c) | | 291 |
| | 404 |
| | — |
| | — |
| | 291 |
| | 404 |
| | 695 |
| | (7 | ) | | 1960 | | 09/30/16 | | 15 to 30 Years |
| | Coldwater, MI | | (c) | | 258 |
| | 135 |
| | — |
| | — |
| | 258 |
| | 135 |
| | 393 |
| | (9 | ) | | 1960 | | 05/19/16 | | 17 to 30 Years |
| | Columbia, SC | | (c) | | 1,061 |
| | 1,073 |
| | (428 | ) | | (462 | ) | | 633 |
| | 611 |
| | 1,244 |
| | — |
| | 1997 | | 07/17/13 | | 11 to 32 Years |
|
| | | | | | | | | | | | | | | | | | | | | | | | | | | | | | | | | |
| C-Store (Jordan Oil Company of the Carolinas, Inc) | Asheville, NC | | (a) | | 247 |
| | 497 |
| | — |
| | 86 |
| | 247 |
| | 583 |
| | 830 |
| | (154 | ) | | 1986 | | 01/01/14 | | 8 to 29 Years |
| C-Store (Jordan Oil Company of the Carolinas, Inc) | Honea Path, SC | | (a) | | 1,269 |
| | 1,134 |
| | — |
| | 173 |
| | 1,269 |
| | 1,307 |
| | 2,576 |
| | (465 | ) | | 1996 | | 01/01/14 | | 8 to 29 Years |
| C-Store (Jordan Oil Company of the Carolinas, Inc) | Inman, SC | | (a) | | 2,183 |
| | 897 |
| | — |
| | 163 |
| | 2,183 |
| | 1,060 |
| | 3,243 |
| | (669 | ) | | 1994 | | 05/08/13 | | 8 to 29 Years |
| C-Store (Jordan Oil Company of the Carolinas, Inc) | Summerville, SC | | (a) | | 1,317 |
| | 1,459 |
| | (151 | ) | | 206 |
| | 1,166 |
| | 1,665 |
| | 2,831 |
| | (391 | ) | | 2001 | | 05/08/13 | | 8 to 29 Years |
| C-Store (Mountain Express Oil Company Southeast, LLC) | Auburn, AL | | (d) | | 2,188 |
| | 945 |
| | — |
| | 85 |
| | 2,188 |
| | 1,030 |
| | 3,218 |
| | (111 | ) | | 2001 | | 07/11/16 | | 22 to 40 Years |
| C-Store (Mountain Express Oil Company Southeast, LLC) | Montgomery, AL | | (d) | | 648 |
| | 228 |
| | — |
| | — |
| | 648 |
| | 228 |
| | 876 |
| | (49 | ) | | 1965 | | 07/11/16 | | 15 to 20 Years |
| C-Store (Mountain Express Oil Company Southeast, LLC) | Anniston, AL | | (d) | | 490 |
| | 210 |
| | — |
| | — |
| | 490 |
| | 210 |
| | 700 |
| | (44 | ) | | 1960 | | 07/11/16 | | 15 to 20 Years |
| C-Store (Mountain Express Oil Company Southeast, LLC) | Lincoln, AL | | (d) | | 1,785 |
| | 1,312 |
| | — |
| | 2 |
| | 1,785 |
| | 1,314 |
| | 3,099 |
| | (123 | ) | | 2001 | | 07/11/16 | | 22 to 40 Years |
|
| | | | | | | | | | | | | | | | | | | | | | | | | | | | | | | | | |
| C-Store (Mountain Express Oil Company Southeast, LLC) | Lagrange, GA | | (d) | | 1,033 |
| | 368 |
| | — |
| | — |
| | 1,033 |
| | 368 |
| | 1,401 |
| | (68 | ) | | 1972 | | 07/11/16 | | 15 to 20 Years |
| C-Store (Mountain Express Oil Company Southeast, LLC) | Panama City, FL | | (d) | | 630 |
| | 298 |
| | — |
| | — |
| | 630 |
| | 298 |
| | 928 |
| | (52 | ) | | 1951 | | 07/11/16 | | 15 to 20 Years |
| C-Store (Mountain Express Oil Company Southeast, LLC) | Prattville, AL | | (d) | | 1,978 |
| | 735 |
| | — |
| | — |
| | 1,978 |
| | 735 |
| | 2,713 |
| | (95 | ) | | 1995 | | 07/11/16 | | 19 to 30 Years |
SPIRIT REALTY CAPITAL, INC.
Schedule III Real Estate and
Accumulated Depreciation
(Amounts in thousands)
|
| | | | | | | | | | | | | | | | | | | | | | | | | |
| | | | | | Initial Cost to Company | | Cost Capitalized Subsequent to Acquisition including impairment | | Gross Amount at December 31, 2016 (d) 2017 (g) | | | | | | | | |
| Concept | City, State | | Encumbrances (e) | | Land and Improvements | | Buildings and Improvements | | Land and Improvements | | Buildings and Improvements | | Land and Improvements | | Buildings and Improvements | | Total | | Final Accumulated Depreciation | | Date of Construction | | Date Acquired | | Life in which depreciation in latest Statement of Operations is computed |
Description | | Encumbrances (e)
| | Land and
Improvements
| | Buildings and
Improvements
| | Improvements/
Land
| | Improvements/
building
| | Land and
Improvements
| | Buildings and
Improvements
| | Total | | Final
Accum
| | Date of
Construction
| | Date
Acquired
| |
|
| | | | | | | | | | | | | | | | | | | | | | | | | | | | | | | | | |
| | Columbia, SC | | (c) | | 1,261 |
| | 985 |
| | — |
| | — |
| | 1,261 |
| | 985 |
| | 2,246 |
| | (194 | ) | | 1993 | | 07/17/13 | | 10 to 28 Years |
| | Columbus, GA | | (c) | | 711 |
| | 943 |
| | — |
| | — |
| | 711 |
| | 943 |
| | 1,654 |
| | (161 | ) | | 1990 | | 07/17/13 | | 13 to 32 Years |
| | Columbus, GA | | (c) | | 574 |
| | 1,039 |
| | — |
| | — |
| | 574 |
| | 1,039 |
| | 1,613 |
| | (163 | ) | | 1984 | | 07/17/13 | | 13 to 32 Years |
| | Columbus, GA | | (c) | | 867 |
| | 2,299 |
| | — |
| | — |
| | 867 |
| | 2,299 |
| | 3,166 |
| | (342 | ) | | 1978 | | 07/17/13 | | 13 to 30 Years |
| | Columbus, GA | | (c) | | 1,465 |
| | 2,088 |
| | — |
| | — |
| | 1,465 |
| | 2,088 |
| | 3,553 |
| | (336 | ) | | 1995 | | 07/17/13 | | 11 to 34 Years |
| | Columbus, GA | | (c) | | 730 |
| | 1,317 |
| | — |
| | — |
| | 730 |
| | 1,317 |
| | 2,047 |
| | (228 | ) | | 1978 | | 07/17/13 | | 13 to 28 Years |
| | Concord, NH | | (c) | | 260 |
| | 330 |
| | — |
| | — |
| | 260 |
| | 330 |
| | 590 |
| | (78 | ) | | 1988 | | 06/28/12 | | 15 to 25 Years |
| | Connersville, IN | | (c) | | 336 |
| | 179 |
| | — |
| | — |
| | 336 |
| | 179 |
| | 515 |
| | (10 | ) | | 1993 | | 05/19/16 | | 17 to 30 Years |
| | Coopersville, MI | | (c) | | 998 |
| | 572 |
| | — |
| | — |
| | 998 |
| | 572 |
| | 1,570 |
| | (27 | ) | | 1968 | | 05/19/16 | | 17 to 30 Years |
| | Copley, OH | | (c) | | 379 |
| | 999 |
| | — |
| | — |
| | 379 |
| | 999 |
| | 1,378 |
| | (183 | ) | | 1993 | | 07/17/13 | | 12 to 28 Years |
| | Cuyahoga Falls, OH | | (c) | | 657 |
| | 1,018 |
| | — |
| | — |
| | 657 |
| | 1,018 |
| | 1,675 |
| | (207 | ) | | 1995 | | 07/17/13 | | 13 to 30 Years |
| | Cuyahoga Falls, OH | | (c) | | 958 |
| | 1,416 |
| | — |
| | — |
| | 958 |
| | 1,416 |
| | 2,374 |
| | (256 | ) | | 2002 | | 07/17/13 | | 15 to 35 Years |
| | Cuyahoga Falls, OH | | (c) | | 342 |
| | 806 |
| | — |
| | — |
| | 342 |
| | 806 |
| | 1,148 |
| | (154 | ) | | 1972 | | 07/17/13 | | 12 to 26 Years |
| | Cynthiana, KY | | (c) | | 119 |
| | 596 |
| | — |
| | — |
| | 119 |
| | 596 |
| | 715 |
| | (37 | ) | | 1985 | | 06/30/15 | | 15 to 30 Years |
| | Daleville, VA | | (c) | | 467 |
| | 616 |
| | — |
| | — |
| | 467 |
| | 616 |
| | 1,083 |
| | (48 | ) | | 1989 | | 06/30/15 | | 15 to 30 Years |
| | Danville, VA | | (c) | | 348 |
| | 477 |
| | — |
| | — |
| | 348 |
| | 477 |
| | 825 |
| | (37 | ) | | 1989 | | 06/30/15 | | 15 to 30 Years |
| | Eaton Rapids, MI | | (c) | | 291 |
| | 448 |
| | — |
| | — |
| | 291 |
| | 448 |
| | 739 |
| | (18 | ) | | 1945 | | 05/19/16 | | 17 to 30 Years |
| | Edmore, MI | | (c) | | 729 |
| | 774 |
| | — |
| | — |
| | 729 |
| | 774 |
| | 1,503 |
| | (34 | ) | | 1999 | | 05/19/16 | | 17 to 40 Years |
| | El Paso, TX | | (c) | | 1,143 |
| | 1,029 |
| | — |
| | — |
| | 1,143 |
| | 1,029 |
| | 2,172 |
| | (438 | ) | | 2000 | | 07/17/13 | | 4 to 27 Years |
| | El Paso, TX | | (c) | | 987 |
| | 558 |
| | — |
| | — |
| | 987 |
| | 558 |
| | 1,545 |
| | (203 | ) | | 1999 | | 07/17/13 | | 3 to 26 Years |
| | El Paso, TX | | (c) | | 1,090 |
| | 1,203 |
| | — |
| | — |
| | 1,090 |
| | 1,203 |
| | 2,293 |
| | (330 | ) | | 1999 | | 07/17/13 | | 6 to 35 Years |
| | Fairlawn, OH | | (c) | | 616 |
| | 1,064 |
| | — |
| | — |
| | 616 |
| | 1,064 |
| | 1,680 |
| | (203 | ) | | 1993 | | 07/17/13 | | 13 to 28 Years |
| | Fallon, NV | | (c) | | 1,262 |
| | 1,321 |
| | — |
| | — |
| | 1,262 |
| | 1,321 |
| | 2,583 |
| | (177 | ) | | 1985 | | 10/31/14 | | 15 to 40 Years |
| | Fayetteville, AR | | (c) | | 986 |
| | 897 |
| | — |
| | — |
| | 986 |
| | 897 |
| | 1,883 |
| | (18 | ) | | 1996 | | 09/30/16 | | 11 to 30 Years |
| | Fayetteville, AR | | (c) | | 1,760 |
| | 953 |
| | — |
| | — |
| | 1,760 |
| | 953 |
| | 2,713 |
| | (14 | ) | | 1996 | | 09/30/16 | | 16 to 40 Years |
| | Flemingsburg, KY | | (c) | | 1,073 |
| | 1,212 |
| | — |
| | — |
| | 1,073 |
| | 1,212 |
| | 2,285 |
| | (96 | ) | | 1997 | | 06/30/15 | | 15 to 30 Years |
| | Forest, VA | | (c) | | 248 |
| | 834 |
| | — |
| | — |
| | 248 |
| | 834 |
| | 1,082 |
| | (54 | ) | | 1995 | | 06/30/15 | | 15 to 30 Years |
| | Forsyth, MO | | (c) | | 370 |
| | 572 |
| | — |
| | — |
| | 370 |
| | 572 |
| | 942 |
| | (9 | ) | | 1950 | | 09/30/16 | | 14 to 30 Years |
| | Fort Mill, SC | | (c) | | 1,589 |
| | 1,356 |
| | — |
| | — |
| | 1,589 |
| | 1,356 |
| | 2,945 |
| | (213 | ) | | 1999 | | 07/17/13 | | 10 to 33 Years |
| | Fort Pierce, FL | | (c) | | 1,064 |
| | 1,659 |
| | — |
| | — |
| | 1,064 |
| | 1,659 |
| | 2,723 |
| | (164 | ) | | 1977 | | 10/30/14 | | 15 to 40 Years |
| | Fort Pierce, FL | | (c) | | 681 |
| | 1,404 |
| | — |
| | — |
| | 681 |
| | 1,404 |
| | 2,085 |
| | (125 | ) | | 1989 | | 10/30/14 | | 15 to 40 Years |
| | Frankfort, IN | | (c) | | 258 |
| | 202 |
| | — |
| | — |
| | 258 |
| | 202 |
| | 460 |
| | (11 | ) | | 1970 | | 05/19/16 | | 17 to 30 Years |
| | Franklin, IN | | (c) | | 303 |
| | 213 |
| | — |
| | — |
| | 303 |
| | 213 |
| | 516 |
| | (11 | ) | | 1969 | | 05/19/16 | | 17 to 30 Years |
| | Freeland, MI | | (c) | | 336 |
| | 437 |
| | — |
| | — |
| | 336 |
| | 437 |
| | 773 |
| | (17 | ) | | 1962 | | 05/19/16 | | 17 to 30 Years |
| | Freeport, ME | | (c) | | 503 |
| | 343 |
| | — |
| | — |
| | 503 |
| | 343 |
| | 846 |
| | (84 | ) | | 1991 | | 06/28/12 | | 15 to 26 Years |
| | Fremont, CA | | (c) | | 1,905 |
| | 361 |
| | — |
| | — |
| | 1,905 |
| | 361 |
| | 2,266 |
| | (78 | ) | | 1990 | | 10/31/14 | | 15 to 30 Years |
| | Fremont, MI | | (c) | | 269 |
| | 269 |
| | — |
| | — |
| | 269 |
| | 269 |
| | 538 |
| | (13 | ) | | 1971 | | 05/19/16 | | 17 to 30 Years |
|
| | | | | | | | | | | | | | | | | | | | | | | | | | | | | | | | | |
| C-Store (Mountain Express Oil Company Southeast, LLC) | Greenville, AL | | (d) | | 1,278 |
| | 490 |
| | — |
| | — |
| | 1,278 |
| | 490 |
| | 1,768 |
| | (89 | ) | | 1991 | | 07/11/16 | | 19 to 30 Years |
| C-Store (Mountain Express Oil Company Southeast, LLC) | Lanett, AL | | (d) | | 788 |
| | 350 |
| | — |
| | — |
| | 788 |
| | 350 |
| | 1,138 |
| | (68 | ) | | 1975 | | 07/11/16 | | 15 to 20 Years |
| C-Store (Mountain Express Oil Company Southeast, LLC) | Sumiton, AL | | (d) | | 1,138 |
| | 420 |
| | — |
| | — |
| | 1,138 |
| | 420 |
| | 1,558 |
| | (108 | ) | | 1970 | | 07/11/16 | | 11 to 20 Years |
| C-Store (Mountain Express Oil Company Southeast, LLC) | Ragland, AL | | (d) | | 385 |
| | 595 |
| | — |
| | — |
| | 385 |
| | 595 |
| | 980 |
| | (47 | ) | | 1986 | | 07/11/16 | | 15 to 30 Years |
| C-Store (Mountain Express Oil Company Southeast, LLC) | Valley, AL | | (d) | | 280 |
| | 368 |
| | — |
| | — |
| | 280 |
| | 368 |
| | 648 |
| | (42 | ) | | 1955 | | 07/11/16 | | 15 to 20 Years |
| C-Store (Mountain Express Oil Company Southeast, LLC) | Sylacauga, AL | | (d) | | 560 |
| | 438 |
| | — |
| | — |
| | 560 |
| | 438 |
| | 998 |
| | (61 | ) | | 1948 | | 07/11/16 | | 15 to 20 Years |
| C-Store (Silver Spring Fuel, LLC) | Springfield, MO | | (d) | | 431 |
| | 732 |
| | — |
| | 86 |
| | 431 |
| | 818 |
| | 1,249 |
| | (73 | ) | | 1988 | | 03/31/16 | | 18 to 30 Years |
| C-Store (Silver Spring Fuel, LLC) | Springfield, MO | | (d) | | 562 |
| | 1,007 |
| | — |
| | — |
| | 562 |
| | 1,007 |
| | 1,569 |
| | (93 | ) | | 1989 | | 03/31/16 | | 18 to 30 Years |
| C-Store (Silver Spring Fuel, LLC) | Marshfield, MO | | (d) | | 615 |
| | 811 |
| | — |
| | — |
| | 615 |
| | 811 |
| | 1,426 |
| | (79 | ) | | 1987 | | 03/31/16 | | 18 to 30 Years |
| C-Store (Silver Spring Fuel, LLC) | Springfield, MO | | (d) | | 327 |
| | 732 |
| | — |
| | — |
| | 327 |
| | 732 |
| | 1,059 |
| | (64 | ) | | 1987 | | 03/31/16 | | 18 to 30 Years |
| C-Store (SM Trading Corporation) | Kansas City, MO | | (d) | | 925 |
| | 1,027 |
| | — |
| | — |
| | 925 |
| | 1,027 |
| | 1,952 |
| | (160 | ) | | 1996 | | 11/18/14 | | 15 to 30 Years |
| C-Store (SM Trading Corporation) | Kearney, MO | | (d) | | 529 |
| | 925 |
| | — |
| | — |
| | 529 |
| | 925 |
| | 1,454 |
| | (135 | ) | | 2001 | | 11/18/14 | | 15 to 30 Years |
| C-Store (SM Trading Corporation) | Cleveland, MO | | (d) | | 701 |
| | 894 |
| | — |
| | — |
| | 701 |
| | 894 |
| | 1,595 |
| | (196 | ) | | 1994 | | 11/18/14 | | 15 to 20 Years |
SPIRIT REALTY CAPITAL, INC.
Schedule III Real Estate and
Accumulated Depreciation
(Amounts in thousands)
|
| | | | | | | | | | | | | | | | | | | | | | | | | |
| | | | | | Initial Cost to Company | | Cost Capitalized Subsequent to Acquisition including impairment | | Gross Amount at December 31, 2016 (d) 2017 (g) | | | | | | | | |
| Concept | City, State | | Encumbrances (e) | | Land and Improvements | | Buildings and Improvements | | Land and Improvements | | Buildings and Improvements | | Land and Improvements | | Buildings and Improvements | | Total | | Final Accumulated Depreciation | | Date of Construction | | Date Acquired | | Life in which depreciation in latest Statement of Operations is computed |
Description | | Encumbrances (e)
| | Land and
Improvements
| | Buildings and
Improvements
| | Improvements/
Land
| | Improvements/
building
| | Land and
Improvements
| | Buildings and
Improvements
| | Total | | Final
Accum
| | Date of
Construction
| | Date
Acquired
| |
|
| | | | | | | | | | | | | | | | | | | | | | | | | | | | | | | | | |
| | Georgetown, KY | | (c) | | 725 |
| | 805 |
| | — |
| | — |
| | 725 |
| �� | 805 |
| | 1,530 |
| | (62 | ) | | 1989 | | 06/30/15 | | 15 to 30 Years |
| | Georgetown, KY | | (c) | | 815 |
| | 934 |
| | — |
| | — |
| | 815 |
| | 934 |
| | 1,749 |
| | (70 | ) | | 1998 | | 06/30/15 | | 15 to 30 Years |
| | Goose Creek, SC | | (c) | | 682 |
| | 1,571 |
| | — |
| | — |
| | 682 |
| | 1,571 |
| | 2,253 |
| | (329 | ) | | 1983 | | 07/17/13 | | 7 to 20 Years |
| | Gorham, NH | | (c) | | 723 |
| | 358 |
| | — |
| | — |
| | 723 |
| | 358 |
| | 1,081 |
| | (126 | ) | | 1975 | | 06/28/12 | | 15 to 18 Years |
| | Grand Haven, MI | | (c) | | 661 |
| | 628 |
| | — |
| | — |
| | 661 |
| | 628 |
| | 1,289 |
| | (24 | ) | | 1992 | | 05/19/16 | | 17 to 30 Years |
| | Grand Rapids, MI | | (c) | | 224 |
| | 123 |
| | — |
| | — |
| | 224 |
| | 123 |
| | 347 |
| | (7 | ) | | 1957 | | 05/19/16 | | 17 to 30 Years |
| | Grandtham, NH | | (c) | | 576 |
| | 394 |
| | — |
| | — |
| | 576 |
| | 394 |
| | 970 |
| | (80 | ) | | 1989 | | 01/24/14 | | 14 to 30 Years |
| | Grayling, MI | | (c) | | 2,052 |
| | 549 |
| | — |
| | — |
| | 2,052 |
| | 549 |
| | 2,601 |
| | (40 | ) | | 1988 | | 05/19/16 | | 17 to 30 Years |
| | Greenville, AL | | (c) | | 1,278 |
| | 490 |
| | — |
| | — |
| | 1,278 |
| | 490 |
| | 1,768 |
| | (34 | ) | | 1991 | | 07/11/16 | | 15 to 30 Years |
| | Greenville, MI | | (c) | | 437 |
| | 628 |
| | — |
| | 194 |
| | 437 |
| | 822 |
| | 1,259 |
| | (23 | ) | | 1968 | | 05/19/16 | | 17 to 30 Years |
| | Gresham, OR | | (c) | | 879 |
| | 643 |
| | — |
| | — |
| | 879 |
| | 643 |
| | 1,522 |
| | (92 | ) | | 1990 | | 10/28/14 | | 15 to 30 Years |
| | Gretna, VA | | (c) | | 268 |
| | 798 |
| | — |
| | — |
| | 268 |
| | 798 |
| | 1,066 |
| | (56 | ) | | 1978 | | 06/30/15 | | 15 to 30 Years |
| | Gretna, VA | | (c) | | 159 |
| | 1,083 |
| | — |
| | — |
| | 159 |
| | 1,083 |
| | 1,242 |
| | (65 | ) | | 1996 | | 06/30/15 | | 15 to 30 Years |
| | Hampden, ME | | (c) | | 987 |
| | 424 |
| | — |
| | — |
| | 987 |
| | 424 |
| | 1,411 |
| | (139 | ) | | 1997 | | 01/24/14 | | 14 to 30 Years |
| | Harrington, ME | | (c) | | 331 |
| | 459 |
| | — |
| | — |
| | 331 |
| | 459 |
| | 790 |
| | (113 | ) | | 1992 | | 06/28/12 | | 15 to 32 Years |
| | Harrison, AR | | (c) | | 2,309 |
| | 2,040 |
| | — |
| | — |
| | 2,309 |
| | 2,040 |
| | 4,349 |
| | (45 | ) | | 1996 | | 09/30/16 | | 15 to 30 Years |
| | Harrison, AR | | (c) | | 235 |
| | 202 |
| | — |
| | — |
| | 235 |
| | 202 |
| | 437 |
| | (4 | ) | | 1971 | | 09/30/16 | | 17 to 30 Years |
| | Harrison, AR | | (c) | | 224 |
| | 717 |
| | — |
| | — |
| | 224 |
| | 717 |
| | 941 |
| | (9 | ) | | 1980 | | 09/30/16 | | 12 to 30 Years |
| | Harrison, AR | | (c) | | 673 |
| | 471 |
| | — |
| | — |
| | 673 |
| | 471 |
| | 1,144 |
| | (8 | ) | | 1985 | | 09/30/16 | | 14 to 30 Years |
| | Harrison, AR | | (c) | | 392 |
| | 336 |
| | — |
| | — |
| | 392 |
| | 336 |
| | 728 |
| | (8 | ) | | 1982 | | 09/30/16 | | 12 to 30 Years |
| | Harrison, AR | | (c) | | 594 |
| | 482 |
| | — |
| | — |
| | 594 |
| | 482 |
| | 1,076 |
| | (8 | ) | | 1981 | | 09/30/16 | | 16 to 40 Years |
| | Harrodsburg, KY | | (c) | | 229 |
| | 824 |
| | — |
| | — |
| | 229 |
| | 824 |
| | 1,053 |
| | (53 | ) | | 1973 | | 06/30/15 | | 15 to 30 Years |
| | Hastings, MI | | (c) | | 392 |
| | 437 |
| | — |
| | 190 |
| | 392 |
| | 627 |
| | 1,019 |
| | (22 | ) | | 1964 | | 05/19/16 | | 17 to 30 Years |
| | Hazard, KY | | (c) | | 288 |
| | 805 |
| | — |
| | — |
| | 288 |
| | 805 |
| | 1,093 |
| | (52 | ) | | 1991 | | 06/30/15 | | 15 to 30 Years |
| | Hillsdale, MI | | (c) | | 325 |
| | 157 |
| | — |
| | — |
| | 325 |
| | 157 |
| | 482 |
| | (10 | ) | | 1968 | | 05/19/16 | | 17 to 30 Years |
| | Hockessin, DE | | (c) | | 1,921 |
| | 2,477 |
| | — |
| | — |
| | 1,921 |
| | 2,477 |
| | 4,398 |
| | (346 | ) | | 2001 | | 07/17/13 | | 8 to 46 Years |
| | Holland, MI | | (c) | | 235 |
| | 325 |
| | — |
| | — |
| | 235 |
| | 325 |
| | 560 |
| | (12 | ) | | 1957 | | 05/19/16 | | 17 to 30 Years |
| | Honea Path, SC | | (a) | | 1,268 |
| | 1,134 |
| | — |
| | 175 |
| | 1,268 |
| | 1,309 |
| | 2,577 |
| | (367 | ) | | 1996 | | 01/01/14 | | 8 to 29 Years |
| | Huntersville, NC | | (c) | | 1,539 |
| | 924 |
| | — |
| | — |
| | 1,539 |
| | 924 |
| | 2,463 |
| | (266 | ) | | 1996 | | 07/17/13 | | 8 to 35 Years |
| | Huntington Beach, CA | | (c) | | 2,035 |
| | 155 |
| | — |
| | — |
| | 2,035 |
| | 155 |
| | 2,190 |
| | (77 | ) | | 1962 | | 10/31/14 | | 15 to 30 Years |
| | Huntington Park, CA | | (c) | | 1,909 |
| | 891 |
| | — |
| | — |
| | 1,909 |
| | 891 |
| | 2,800 |
| | (202 | ) | | 1947 | | 05/02/14 | | 15 to 20 Years |
| | Huntsville, AR | | (c) | | 359 |
| | 504 |
| | — |
| | — |
| | 359 |
| | 504 |
| | 863 |
| | (8 | ) | | 2003 | | 09/30/16 | | 15 to 40 Years |
| | Hurt, VA | | (c) | | 685 |
| | 1,023 |
| | — |
| | — |
| | 685 |
| | 1,023 |
| | 1,708 |
| | (80 | ) | | 1973 | | 06/30/15 | | 15 to 30 Years |
|
| | | | | | | | | | | | | | | | | | | | | | | | | | | | | | | | | |
| C-Store (SM Trading Corporation) | Lebo, KS | | (d) | | 1,951 |
| | 762 |
| | — |
| | — |
| | 1,951 |
| | 762 |
| | 2,713 |
| | (214 | ) | | 1976 | | 11/18/14 | | 15 to 20 Years |
| C-Store (Supermesa Fuel & Merc, LLC) | Phoenix, AZ | | (d) | | 2,243 |
| | 4,243 |
| | — |
| | — |
| | 2,243 |
| | 4,243 |
| | 6,486 |
| | (1,793 | ) | | 2001 | | 07/02/07 | | 15 to 40 Years |
| C-Store (Supermesa Fuel & Merc, LLC) | Scottsdale, AZ | | (d) | | 4,416 |
| | 2,384 |
| | — |
| | — |
| | 4,416 |
| | 2,384 |
| | 6,800 |
| | (1,212 | ) | | 2000 | | 07/02/07 | | 15 to 40 Years |
| C-Store (Supermesa Fuel & Merc, LLC) | Cave Creek, AZ | | (d) | | 2,711 |
| | 2,201 |
| | — |
| | — |
| | 2,711 |
| | 2,201 |
| | 4,912 |
| | (1,025 | ) | | 1998 | | 07/02/07 | | 15 to 40 Years |
| C-Store (Supermesa Fuel & Merc, LLC) | Scottsdale, AZ | | (d) | | 2,765 |
| | 2,196 |
| | — |
| | — |
| | 2,765 |
| | 2,196 |
| | 4,961 |
| | (1,113 | ) | | 1995 | | 07/02/07 | | 15 to 40 Years |
| C-Store (Supermesa Fuel & Merc, LLC) | Scottsdale, AZ | | (d) | | 5,123 |
| | 2,683 |
| | — |
| | — |
| | 5,123 |
| | 2,683 |
| | 7,806 |
| | (1,729 | ) | | 1991 | | 07/02/07 | | 15 to 40 Years |
| C-Store (Supermesa Fuel & Merc, LLC) | Scottsdale, AZ | | (d) | | 3,437 |
| | 2,373 |
| | — |
| | — |
| | 3,437 |
| | 2,373 |
| | 5,810 |
| | (1,530 | ) | | 1996 | | 07/02/07 | | 15 to 40 Years |
| C-Store (Town Star Holdings, LLC) | Fort Pierce, FL | | (d) | | 1,064 |
| | 1,659 |
| | — |
| | — |
| | 1,064 |
| | 1,659 |
| | 2,723 |
| | (239 | ) | | 1977 | | 10/30/14 | | 15 to 40 Years |
| C-Store (Town Star Holdings, LLC) | Fort Pierce, FL | | (d) | | 681 |
| | 1,404 |
| | — |
| | — |
| | 681 |
| | 1,404 |
| | 2,085 |
| | (183 | ) | | 1989 | | 10/30/14 | | 15 to 40 Years |
| C-Store (Town Star Holdings, LLC) | Okeechobee, FL | | (d) | | 468 |
| | 936 |
| | — |
| | — |
| | 468 |
| | 936 |
| | 1,404 |
| | (128 | ) | | 1976 | | 10/30/14 | | 15 to 40 Years |
| C-Store (Town Star Holdings, LLC) | Okeechobee, FL | | (d) | | 808 |
| | 1,191 |
| | — |
| | — |
| | 808 |
| | 1,191 |
| | 1,999 |
| | (189 | ) | | 1984 | | 10/30/14 | | 15 to 40 Years |
| C-Store (Town Star Holdings, LLC) | Okeechobee, FL | | (d) | | 386 |
| | 1,764 |
| | — |
| | — |
| | 386 |
| | 1,764 |
| | 2,150 |
| | (188 | ) | | 1975 | | 10/30/14 | | 15 to 40 Years |
| C-Store (Town Star Holdings, LLC) | Okeechobee, FL | | (d) | | 558 |
| | 1,024 |
| | — |
| | — |
| | 558 |
| | 1,024 |
| | 1,582 |
| | (136 | ) | | 1986 | | 10/30/14 | | 15 to 40 Years |
| C-Store (Town Star Holdings, LLC) | Belle Glade, FL | | (d) | | 978 |
| | 1,184 |
| | — |
| | — |
| | 978 |
| | 1,184 |
| | 2,162 |
| | (148 | ) | | 1960 | | 10/30/14 | | 15 to 40 Years |
| C-Store (Town Star Holdings, LLC) | Jacksonville, FL | | (d) | | 2,285 |
| | 1,537 |
| | — |
| | — |
| | 2,285 |
| | 1,537 |
| | 3,822 |
| | (295 | ) | | 2010 | | 10/28/15 | | 15 to 40 Years |
| C-Store (Town Star Holdings, LLC) | Kissimmee, FL | | (d) | | 2,115 |
| | 1,602 |
| | — |
| | — |
| | 2,115 |
| | 1,602 |
| | 3,717 |
| | (208 | ) | | 2006 | | 10/27/15 | | 15 to 40 Years |
SPIRIT REALTY CAPITAL, INC.
Schedule III Real Estate and
Accumulated Depreciation
(Amounts in thousands)
|
| | | | | | | | | | | | | | | | | | | | | | | | | | | | | | | | | |
| | Indianapolis, IN | | (c) | | 426 |
| | 191 |
| | — |
| | — |
| | 426 |
| | 191 |
| | 617 |
| | (12 | ) | | 1973 | | 05/19/16 | | 17 to 30 Years |
| | Indianapolis, IN | | (c) | | 325 |
| | 157 |
| | — |
| | — |
| | 325 |
| | 157 |
| | 482 |
| | (9 | ) | | 1945 | | 05/19/16 | | 17 to 30 Years |
| | Indianapolis, IN | | (c) | | 247 |
| | 146 |
| | — |
| | — |
| | 247 |
| | 146 |
| | 393 |
| | (8 | ) | | 1972 | | 05/19/16 | | 17 to 30 Years |
|
| | | | | | | | | | | | | | | | | | | | | | | | | |
| | | | | | Initial Cost to Company | | Cost Capitalized Subsequent to Acquisition including impairment | | Gross Amount at December 31, 2016 (d) 2017 (g) | | | | | | | | |
| Concept | City, State | | Encumbrances (e) | | Land and Improvements | | Buildings and Improvements | | Land and Improvements | | Buildings and Improvements | | Land and Improvements | | Buildings and Improvements | | Total | | Final Accumulated Depreciation | | Date of Construction | | Date Acquired | | Life in which depreciation in latest Statement of Operations is computed |
Description | | Encumbrances (e)
| | Land and
Improvements
| | Buildings and
Improvements
| | Improvements/
Land
| | Improvements/
building
| | Land and
Improvements
| | Buildings and
Improvements
| | Total | | Final
Accum
| | Date of
Construction
| | Date
Acquired
| |
|
| | | | | | | | | | | | | | | | | | | | | | | | | | | | | | | | | |
| | Inglewood, CA | | (c) | | 1,053 |
| | 635 |
| | — |
| | 30 |
| | 1,053 |
| | 665 |
| | 1,718 |
| | (75 | ) | | 1995 | | 06/04/14 | | 15 to 40 Years |
| | Inman, SC | | (a) | | 2,183 |
| | 897 |
| | — |
| | 165 |
| | 2,183 |
| | 1,062 |
| | 3,245 |
| | (527 | ) | | 1994 | | 05/08/13 | | 8 to 29 Years |
| | Irvine, KY | | (c) | | 219 |
| | 666 |
| | — |
| | — |
| | 219 |
| | 666 |
| | 885 |
| | (48 | ) | | 1987 | | 06/30/15 | | 15 to 30 Years |
| | Ithaca, MI | | (c) | | 538 |
| | 381 |
| | — |
| | — |
| | 538 |
| | 381 |
| | 919 |
| | (20 | ) | | 1994 | | 05/19/16 | | 17 to 30 Years |
| | Jackson, KY | | (c) | | 417 |
| | 765 |
| | — |
| | — |
| | 417 |
| | 765 |
| | 1,182 |
| | (53 | ) | | 1982 | | 06/30/15 | | 15 to 30 Years |
| | Jackson, MI | | (c) | | 684 |
| | 1,188 |
| | — |
| | — |
| | 684 |
| | 1,188 |
| | 1,872 |
| | (38 | ) | | 1963 | | 05/19/16 | | 17 to 30 Years |
| | Jackson, MI | | (c) | | 908 |
| | 1,132 |
| | — |
| | — |
| | 908 |
| | 1,132 |
| | 2,040 |
| | (45 | ) | | 1969 | | 05/19/16 | | 17 to 30 Years |
| | Jackson, MI | | (c) | | 247 |
| | 179 |
| | — |
| | — |
| | 247 |
| | 179 |
| | 426 |
| | (11 | ) | | 1965 | | 05/19/16 | | 17 to 30 Years |
| | Jacksonville, FL | | (c) | | 2,285 |
| | 1,537 |
| | — |
| | — |
| | 2,285 |
| | 1,537 |
| | 3,822 |
| | (159 | ) | | 2010 | | 10/28/15 | | 15 to 40 Years |
| | Kansas City, MO | | (c) | | 925 |
| | 1,027 |
| | — |
| | — |
| | 925 |
| | 1,027 |
| | 1,952 |
| | (108 | ) | | 1996 | | 11/18/14 | | 15 to 30 Years |
| | Kearney, MO | | (c) | | 529 |
| | 925 |
| | — |
| | — |
| | 529 |
| | 925 |
| | 1,454 |
| | (91 | ) | | 2001 | | 11/18/14 | | 15 to 30 Years |
| | Keene, NH | | (c) | | 553 |
| | 289 |
| | — |
| | — |
| | 553 |
| | 289 |
| | 842 |
| | (60 | ) | | 1960 | | 01/24/14 | | 14 to 30 Years |
| | Kent, OH | | (c) | | 258 |
| | 917 |
| | — |
| | — |
| | 258 |
| | 917 |
| | 1,175 |
| | (147 | ) | | 1994 | | 07/17/13 | | 13 to 29 Years |
| | Kent, WA | | (c) | | 1,450 |
| | 381 |
| | — |
| | — |
| | 1,450 |
| | 381 |
| | 1,831 |
| | (82 | ) | | 1987 | | 10/28/14 | | 15 to 30 Years |
| | Kissimmee, FL | | (c) | | 759 |
| | 1,060 |
| | — |
| | 13 |
| | 759 |
| | 1,073 |
| | 1,832 |
| | (208 | ) | | 2005 | | 12/19/13 | | 15 to 30 Years |
| | Kissimmee, FL | | (c) | | 2,115 |
| | 1,602 |
| | — |
| | — |
| | 2,115 |
| | 1,602 |
| | 3,717 |
| | (112 | ) | | 2006 | | 10/27/15 | | 15 to 40 Years |
| | Laconia, NH | | (c) | | 411 |
| | 770 |
| | — |
| | — |
| | 411 |
| | 770 |
| | 1,181 |
| | (117 | ) | | 1998 | | 01/24/14 | | 14 to 30 Years |
| | Lagrange, GA | | (c) | | 1,033 |
| | 368 |
| | — |
| | — |
| | 1,033 |
| | 368 |
| | 1,401 |
| | (22 | ) | | 1972 | | 07/11/16 | | 15 to 20 Years |
| | Lanett, AL | | (c) | | 299 |
| | 844 |
| | — |
| | — |
| | 299 |
| | 844 |
| | 1,143 |
| | (157 | ) | | 1974 | | 07/17/13 | | 10 to 25 Years |
| | Lanett, AL | | (c) | | 788 |
| | 350 |
| | — |
| | — |
| | 788 |
| | 350 |
| | 1,138 |
| | (22 | ) | | 1975 | | 07/11/16 | | 15 to 20 Years |
| | Lansing, MI | | (c) | | 336 |
| | 168 |
| | — |
| | — |
| | 336 |
| | 168 |
| | 504 |
| | (13 | ) | | 1978 | | 05/19/16 | | 17 to 30 Years |
| | Lansing, MI | | (c) | | 269 |
| | 179 |
| | — |
| | — |
| | 269 |
| | 179 |
| | 448 |
| | (10 | ) | | 1965 | | 05/19/16 | | 17 to 30 Years |
| | Laurens, SC | | (a) | | 505 |
| | 622 |
| | — |
| | 118 |
| | 505 |
| | 740 |
| | 1,245 |
| | (178 | ) | | 1992 | | 01/01/14 | | 8 to 29 Years |
| | Lead Hill, AR | | (c) | | 258 |
| | 1,054 |
| | — |
| | — |
| | 258 |
| | 1,054 |
| | 1,312 |
| | (12 | ) | | 1974 | | 09/30/16 | | 15 to 30 Years |
| | Lebo, KS | | (c) | | 1,951 |
| | 762 |
| | — |
| | — |
| | 1,951 |
| | 762 |
| | 2,713 |
| | (144 | ) | | 1976 | | 11/18/14 | | 15 to 20 Years |
| | Lewiston, ME | | (c) | | 460 |
| | 341 |
| | — |
| | — |
| | 460 |
| | 341 |
| | 801 |
| | (97 | ) | | 1994 | | 06/28/12 | | 15 to 28 Years |
| | Lincoln, AL | | (c) | | 1,785 |
| | 1,312 |
| | — |
| | 2 |
| | 1,785 |
| | 1,314 |
| | 3,099 |
| | (50 | ) | | 2001 | | 07/11/16 | | 15 to 40 Years |
| | Long Beach, CA | | (c) | | 1,049 |
| | 635 |
| | — |
| | — |
| | 1,049 |
| | 635 |
| | 1,684 |
| | (96 | ) | | 1959 | | 05/02/14 | | 15 to 30 Years |
| | Los Angeles, CA | | (c) | | 2,178 |
| | 504 |
| | — |
| | — |
| | 2,178 |
| | 504 |
| | 2,682 |
| | (154 | ) | | 1963 | | 05/02/14 | | 15 to 20 Years |
| | Lynchburg, VA | | (c) | | 467 |
| | 1,391 |
| | — |
| | — |
| | 467 |
| | 1,391 |
| | 1,858 |
| | (85 | ) | | 2006 | | 06/30/15 | | 15 to 30 Years |
| | Lynchburg, VA | | (c) | | 278 |
| | 699 |
| | — |
| | — |
| | 278 |
| | 699 |
| | 977 |
| | (42 | ) | | 1967 | | 06/30/15 | | 15 to 30 Years |
| | Lynchburg, VA | | (c) | | 517 |
| | 1,142 |
| | — |
| | — |
| | 517 |
| | 1,142 |
| | 1,659 |
| | (77 | ) | | 2000 | | 06/30/15 | | 15 to 30 Years |
| | Macon, GA | | (c) | | 470 |
| | 1,226 |
| | — |
| | — |
| | 470 |
| | 1,226 |
| | 1,696 |
| | (251 | ) | | 1974 | | 07/17/13 | | 7 to 35 Years |
| | Macon, GA | | (c) | | 471 |
| | 1,066 |
| | — |
| | — |
| | 471 |
| | 1,066 |
| | 1,537 |
| | (271 | ) | | 1993 | | 07/17/13 | | 5 to 35 Years |
| | Madison Heights, VA | | (c) | | 268 |
| | 417 |
| | — |
| | — |
| | 268 |
| | 417 |
| | 685 |
| | (31 | ) | | 1983 | | 06/30/15 | | 15 to 30 Years |
| | Madison, ME | | (c) | | 130 |
| | 410 |
| | — |
| | — |
| | 130 |
| | 410 |
| | 540 |
| | (89 | ) | | 1988 | | 06/28/12 | | 15 to 25 Years |
| | Manahawkin, NJ | | (c) | | 3,258 |
| | 1,954 |
| | — |
| | — |
| | 3,258 |
| | 1,954 |
| | 5,212 |
| | (586 | ) | | 2001 | | 07/17/13 | | 8 to 46 Years |
| | Manchester, ME | | (c) | | 279 |
| | 285 |
| | — |
| | — |
| | 279 |
| | 285 |
| | 564 |
| | (88 | ) | | 1990 | | 06/28/12 | | 15 to 20 Years |
| | Maple Heights, OH | | (c) | | 747 |
| | 917 |
| | — |
| | — |
| | 747 |
| | 917 |
| | 1,664 |
| | (179 | ) | | 1998 | | 07/17/13 | | 13 to 32 Years |
|
| | | | | | | | | | | | | | | | | | | | | | | | | | | | | | | | | |
| C-Store (Town Star Holdings, LLC) | Orlando, FL | | (d) | | 1,397 |
| | 1,028 |
| | — |
| | — |
| | 1,397 |
| | 1,028 |
| | 2,425 |
| | (204 | ) | | 1990 | | 10/29/15 | | 15 to 30 Years |
| C-Store (Town Star Holdings, LLC) | Belle Isle, FL | | (d) | | 908 |
| | 738 |
| | — |
| | — |
| | 908 |
| | 738 |
| | 1,646 |
| | (124 | ) | | 1996 | | 10/27/15 | | 15 to 30 Years |
| C-Store (Town Star Holdings, LLC) | Apopka, FL | | (d) | | 1,357 |
| | 748 |
| | — |
| | — |
| | 1,357 |
| | 748 |
| | 2,105 |
| | (184 | ) | | 1997 | | 10/28/15 | | 15 to 30 Years |
| C-Store (US Investment Group, Inc.) | Kissimmee, FL | | (d) | | 759 |
| | 1,061 |
| | — |
| | 13 |
| | 759 |
| | 1,074 |
| | 1,833 |
| | (279 | ) | | 2005 | | 12/19/13 | | 15 to 30 Years |
| C-Store (US Investment Group, Inc.) | Apopka, FL | | (d) | | 477 |
| | 389 |
| | — |
| | — |
| | 477 |
| | 389 |
| | 866 |
| | (101 | ) | | 1989 | | 12/19/13 | | 15 to 30 Years |
| C-Store (US Investment Group, Inc.) | Orlando, FL | | (d) | | 1,167 |
| | 982 |
| | — |
| | — |
| | 1,167 |
| | 982 |
| | 2,149 |
| | (281 | ) | | 2001 | | 12/19/13 | | 15 to 30 Years |
| C-Store (US Investment Group, Inc.) | Orlando, FL | | (d) | | 1,080 |
| | 798 |
| | — |
| | — |
| | 1,080 |
| | 798 |
| | 1,878 |
| | (210 | ) | | 2001 | | 12/19/13 | | 15 to 30 Years |
| C-Store (US Investment Group, Inc.) | Orlando, FL | | (d) | | 1,303 |
| | 496 |
| | — |
| | — |
| | 1,303 |
| | 496 |
| | 1,799 |
| | (178 | ) | | 1994 | | 12/19/13 | | 15 to 30 Years |
| C-Store (US Investment Group, Inc.) | Orlando, FL | | (d) | | 973 |
| | 350 |
| | — |
| | — |
| | 973 |
| | 350 |
| | 1,323 |
| | (158 | ) | | 1991 | | 12/19/13 | | 15 to 30 Years |
| C-Store (US Investment Group, Inc.) | Orlando, FL | | (d) | | 1,128 |
| | 496 |
| | — |
| | — |
| | 1,128 |
| | 496 |
| | 1,624 |
| | (185 | ) | | 1995 | | 12/19/13 | �� | 15 to 30 Years |
| C-Store (US Investment Group, Inc.) | Oakland, FL | | (d) | | 1,303 |
| | 1,109 |
| | — |
| | — |
| | 1,303 |
| | 1,109 |
| | 2,412 |
| | (353 | ) | | 2002 | | 12/19/13 | | 15 to 30 Years |
| C-Store (US Investment Group, Inc.) | Orlando, FL | | (d) | | 1,644 |
| | 1,829 |
| | — |
| | — |
| | 1,644 |
| | 1,829 |
| | 3,473 |
| | (351 | ) | | 2000 | | 12/19/13 | | 15 to 40 Years |
| C-Store (US Investment Group, Inc.) | Oviedo, FL | | (d) | | 973 |
| | 798 |
| | — |
| | — |
| | 973 |
| | 798 |
| | 1,771 |
| | (233 | ) | | 1995 | | 12/19/13 | | 15 to 30 Years |
| C-Store (Wawa, Inc.) | Narberth, PA | | (d) | | 1,812 |
| | 3,163 |
| | — |
| | — |
| | 1,812 |
| | 3,163 |
| | 4,975 |
| | (403 | ) | | 2006 | | 07/17/13 | | 8 to 46 Years |
| C-Store (Wawa, Inc.) | Hockessin, DE | | (d) | | 1,921 |
| | 2,477 |
| | — |
| | — |
| | 1,921 |
| | 2,477 |
| | 4,398 |
| | (448 | ) | | 2001 | | 07/17/13 | | 8 to 46 Years |
SPIRIT REALTY CAPITAL, INC.
Schedule III Real Estate and
Accumulated Depreciation
(Amounts in thousands)
|
| | | | | | | | | | | | | | | | | | | | | | | | | |
| | | | | | Initial Cost to Company | | Cost Capitalized Subsequent to Acquisition including impairment | | Gross Amount at December 31, 2016 (d) 2017 (g) | | | | | | | | |
| Concept | City, State | | Encumbrances (e) | | Land and Improvements | | Buildings and Improvements | | Land and Improvements | | Buildings and Improvements | | Land and Improvements | | Buildings and Improvements | | Total | | Final Accumulated Depreciation | | Date of Construction | | Date Acquired | | Life in which depreciation in latest Statement of Operations is computed |
Description | | Encumbrances (e)
| | Land and
Improvements
| | Buildings and
Improvements
| | Improvements/
Land
| | Improvements/
building
| | Land and
Improvements
| | Buildings and
Improvements
| | Total | | Final
Accum
| | Date of
Construction
| | Date
Acquired
| |
|
| | | | | | | | | | | | | | | | | | | | | | | | | | | | | | | | | |
| | Marquette, MI | | (c) | | 404 |
| | 146 |
| | — |
| | — |
| | 404 |
| | 146 |
| | 550 |
| | (9 | ) | | 1968 | | 05/19/16 | | 17 to 30 Years |
| | Marshfield, MO | | (c) | | 615 |
| | 811 |
| | — |
| | — |
| | 615 |
| | 811 |
| | 1,426 |
| | (34 | ) | | 1987 | | 03/31/16 | | 18 to 30 Years |
| | Martinez, GA | | (c) | | 626 |
| | 996 |
| | — |
| | — |
| | 626 |
| | 996 |
| | 1,622 |
| | (412 | ) | | 1985 | | 07/17/13 | | 3 to 35 Years |
| | Mason, MI | | (c) | | 258 |
| | 157 |
| | — |
| | — |
| | 258 |
| | 157 |
| | 415 |
| | (10 | ) | | 1971 | | 05/19/16 | | 17 to 30 Years |
| | McKee, KY | | (c) | | 119 |
| | 973 |
| | — |
| | — |
| | 119 |
| | 973 |
| | 1,092 |
| | (55 | ) | | 1983 | | 06/30/15 | | 15 to 30 Years |
| | Menominee, MI | | (c) | | 235 |
| | 179 |
| | — |
| | — |
| | 235 |
| | 179 |
| | 414 |
| | (10 | ) | | 1966 | | 05/19/16 | | 17 to 30 Years |
| | Merrillville, IN | | (c) | | 303 |
| | 247 |
| | — |
| | — |
| | 303 |
| | 247 |
| | 550 |
| | (13 | ) | | 1973 | | 05/19/16 | | 17 to 30 Years |
| | Midland, GA | | (c) | | 637 |
| | 2,136 |
| | — |
| | — |
| | 637 |
| | 2,136 |
| | 2,773 |
| | (265 | ) | | 1995 | | 07/17/13 | | 9 to 35 Years |
| | Midland, MI | | (c) | | 314 |
| | 135 |
| | — |
| | — |
| | 314 |
| | 135 |
| | 449 |
| | (10 | ) | | 1960 | | 05/19/16 | | 17 to 30 Years |
| | Midland, MI | | (c) | | 191 |
| | 67 |
| | — |
| | — |
| | 191 |
| | 67 |
| | 258 |
| | (6 | ) | | 1962 | | 05/19/16 | | 17 to 30 Years |
| | Mobile, AL | | (c) | | 552 |
| | 1,664 |
| | — |
| | — |
| | 552 |
| | 1,664 |
| | 2,216 |
| | (315 | ) | | 1987 | | 07/17/13 | | 11 to 24 Years |
| | Mobile, AL | | (c) | | 939 |
| | 878 |
| | — |
| | — |
| | 939 |
| | 878 |
| | 1,817 |
| | (217 | ) | | 1988 | | 07/17/13 | | 13 to 25 Years |
| | Moneta, VA | | (c) | | 437 |
| | 934 |
| | — |
| | — |
| | 437 |
| | 934 |
| | 1,371 |
| | (71 | ) | | 1999 | | 06/30/15 | | 15 to 30 Years |
| | Monroe, LA | | (c) | | 517 |
| | 1,455 |
| | — |
| | — |
| | 517 |
| | 1,455 |
| | 1,972 |
| | (316 | ) | | 1986 | | 07/17/13 | | 6 to 28 Years |
| | Montclair, CA | | (c) | | 4,957 |
| | 4,136 |
| | — |
| | 375 |
| | 4,957 |
| | 4,511 |
| | 9,468 |
| | (581 | ) | | 1989 | | 10/31/14 | | 15 to 40 Years |
| | Montgomery, AL | | (c) | | 648 |
| | 228 |
| | — |
| | — |
| | 648 |
| | 228 |
| | 876 |
| | (16 | ) | | 1965 | | 07/11/16 | | 15 to 20 Years |
| | Monticello, IN | | (c) | | 235 |
| | 202 |
| | — |
| | — |
| | 235 |
| | 202 |
| | 437 |
| | (11 | ) | | 1970 | | 05/19/16 | | 17 to 30 Years |
| | Mount Pleasant, SC | | (c) | | 1,328 |
| | 1,073 |
| | — |
| | — |
| | 1,328 |
| | 1,073 |
| | 2,401 |
| | (170 | ) | | 1978 | | 07/17/13 | | 7 to 30 Years |
| | Mountain Home, AR | | (c) | | 224 |
| | 493 |
| | — |
| | 2 |
| | 224 |
| | 495 |
| | 719 |
| | (6 | ) | | 1991 | | 09/30/16 | | 12 to 40 Years |
| | Mt Sterling, KY | | (c) | | 1,103 |
| | 1,103 |
| | — |
| | — |
| | 1,103 |
| | 1,103 |
| | 2,206 |
| | (90 | ) | | 2000 | | 06/30/15 | | 15 to 30 Years |
| | Muncie, IN | | (c) | | 448 |
| | 135 |
| | — |
| | — |
| | 448 |
| | 135 |
| | 583 |
| | (12 | ) | | 1983 | | 05/19/16 | | 17 to 30 Years |
| | Murphy, NC | | (a) | | 489 |
| | 298 |
| | — |
| | 49 |
| | 489 |
| | 347 |
| | 836 |
| | (94 | ) | | 1965 | | 05/08/13 | | 8 to 19 Years |
| | Muskegon, MI | | (c) | | 605 |
| | 650 |
| | — |
| | — |
| | 605 |
| | 650 |
| | 1,255 |
| | (25 | ) | | 1959 | | 05/19/16 | | 17 to 30 Years |
| | Muskegon, MI | | (c) | | 291 |
| | 471 |
| | — |
| | — |
| | 291 |
| | 471 |
| | 762 |
| | (18 | ) | | 1964 | | 05/19/16 | | 17 to 30 Years |
| | N. Augusta, SC | | (c) | | 1,065 |
| | 894 |
| | — |
| | — |
| | 1,065 |
| | 894 |
| | 1,959 |
| | (146 | ) | | 1999 | | 07/17/13 | | 12 to 33 Years |
| | Narberth, PA | | (c) | | 1,812 |
| | 3,163 |
| | — |
| | — |
| | 1,812 |
| | 3,163 |
| | 4,975 |
| | (312 | ) | | 2006 | | 07/17/13 | | 8 to 46 Years |
| | Neosho, MO | | (c) | | 504 |
| | 628 |
| | — |
| | — |
| | 504 |
| | 628 |
| | 1,132 |
| | (10 | ) | | 2002 | | 09/30/16 | | 14 to 40 Years |
| | Newport, NH | | (c) | | 519 |
| | 581 |
| | — |
| | — |
| | 519 |
| | 581 |
| | 1,100 |
| | (132 | ) | | 1998 | | 06/28/12 | | 15 to 30 Years |
| | Northfield, OH | | (c) | | 873 |
| | 1,633 |
| | — |
| | — |
| | 873 |
| | 1,633 |
| | 2,506 |
| | (274 | ) | | 1983 | | 07/17/13 | | 15 to 35 Years |
| | Norton Shores, MI | | (c) | | 325 |
| | 291 |
| | — |
| | — |
| | 325 |
| | 291 |
| | 616 |
| | (15 | ) | | 1962 | | 05/19/16 | | 17 to 30 Years |
| | Norton, OH | | (c) | | 581 |
| | 1,460 |
| | — |
| | — |
| | 581 |
| | 1,460 |
| | 2,041 |
| | (220 | ) | | 1984 | | 07/17/13 | | 13 to 35 Years |
| | Oakfield, ME | | (c) | | 273 |
| | 229 |
| | — |
| | — |
| | 273 |
| | 229 |
| | 502 |
| | (78 | ) | | 1993 | | 06/28/12 | | 15 to 25 Years |
| | Oakland, FL | | (c) | | 1,303 |
| | 1,109 |
| | — |
| | — |
| | 1,303 |
| | 1,109 |
| | 2,412 |
| | (265 | ) | | 2002 | | 12/19/13 | | 15 to 30 Years |
| | Okeechobee, FL | | (c) | | 468 |
| | 936 |
| | — |
| | — |
| | 468 |
| | 936 |
| | 1,404 |
| | (88 | ) | | 1976 | | 10/30/14 | | 15 to 40 Years |
| | Okeechobee, FL | | (c) | | 808 |
| | 1,191 |
| | — |
| | — |
| | 808 |
| | 1,191 |
| | 1,999 |
| | (129 | ) | | 1984 | | 10/30/14 | | 15 to 40 Years |
| | Okeechobee, FL | | (c) | | 386 |
| | 1,764 |
| | — |
| | — |
| | 386 |
| | 1,764 |
| | 2,150 |
| | (129 | ) | | 1975 | | 10/30/14 | | 15 to 40 Years |
| | Okeechobee, FL | | (c) | | 558 |
| | 1,024 |
| | — |
| | — |
| | 558 |
| | 1,024 |
| | 1,582 |
| | (93 | ) | | 1986 | | 10/30/14 | | 15 to 40 Years |
| | Ontario, CA | | (c) | | 1,307 |
| | 1,307 |
| | — |
| | — |
| | 1,307 |
| | 1,307 |
| | 2,614 |
| | (163 | ) | | 1964 | | 05/02/14 | | 15 to 30 Years |
|
| | | | | | | | | | | | | | | | | | | | | | | | | | | | | | | | | |
| C-Store (Wawa, Inc.) | Manahawkin, NJ | | (d) | | 3,258 |
| | 1,954 |
| | — |
| | — |
| | 3,258 |
| | 1,954 |
| | 5,212 |
| | (758 | ) | | 2001 | | 07/17/13 | | 8 to 46 Years |
| C-Store (White Oak Station, LLC) | Mountain Home, AR | | (d) | | 224 |
| | 493 |
| | — |
| | 2 |
| | 224 |
| | 495 |
| | 719 |
| | (31 | ) | | 1991 | | 09/30/16 | | 12 to 40 Years |
| C-Store (White Oak Station, LLC) | Harrison, AR | | (d) | | 2,309 |
| | 2,040 |
| | — |
| | — |
| | 2,309 |
| | 2,040 |
| | 4,349 |
| | (272 | ) | | 1996 | | 09/30/16 | | 11 to 30 Years |
| C-Store (White Oak Station, LLC) | Harrison, AR | | (d) | | 235 |
| | 202 |
| | — |
| | — |
| | 235 |
| | 202 |
| | 437 |
| | (21 | ) | | 1971 | | 09/30/16 | | 17 to 30 Years |
| C-Store (White Oak Station, LLC) | Yellville, AR | | (d) | | 269 |
| | 740 |
| | — |
| | — |
| | 269 |
| | 740 |
| | 1,009 |
| | (50 | ) | | 1984 | | 09/30/16 | | 13 to 30 Years |
| C-Store (White Oak Station, LLC) | Harrison, AR | | (d) | | 224 |
| | 717 |
| | — |
| | — |
| | 224 |
| | 717 |
| | 941 |
| | (45 | ) | | 1980 | | 09/30/16 | | 12 to 30 Years |
| C-Store (White Oak Station, LLC) | Huntsville, AR | | (d) | | 359 |
| | 504 |
| | — |
| | — |
| | 359 |
| | 504 |
| | 863 |
| | (40 | ) | | 2003 | | 09/30/16 | | 15 to 40 Years |
| C-Store (White Oak Station, LLC) | Lead Hill, AR | | (d) | | 258 |
| | 1,054 |
| | — |
| | — |
| | 258 |
| | 1,054 |
| | 1,312 |
| | (59 | ) | | 1974 | | 09/30/16 | | 15 to 30 Years |
| C-Store (White Oak Station, LLC) | Harrison, AR | | (d) | | 673 |
| | 471 |
| | — |
| | — |
| | 673 |
| | 471 |
| | 1,144 |
| | (39 | ) | | 1985 | | 09/30/16 | | 14 to 30 Years |
| C-Store (White Oak Station, LLC) | Branson, MO | | (d) | | 605 |
| | 818 |
| | — |
| | — |
| | 605 |
| | 818 |
| | 1,423 |
| | (66 | ) | | 1993 | | 09/30/16 | | 15 to 30 Years |
| C-Store (White Oak Station, LLC) | Fayetteville, AR | | (d) | | 986 |
| | 897 |
| | — |
| | — |
| | 986 |
| | 897 |
| | 1,883 |
| | (77 | ) | | 1996 | | 09/30/16 | | 15 to 30 Years |
| C-Store (White Oak Station, LLC) | Harrison, AR | | (d) | | 392 |
| | 336 |
| | — |
| | — |
| | 392 |
| | 336 |
| | 728 |
| | (40 | ) | | 1982 | | 09/30/16 | | 12 to 30 Years |
| C-Store (White Oak Station, LLC) | Branson, MO | | (d) | | 1,177 |
| | 1,199 |
| | — |
| | — |
| | 1,177 |
| | 1,199 |
| | 2,376 |
| | (101 | ) | | 1999 | | 09/30/16 | | 12 to 40 Years |
| C-Store (White Oak Station, LLC) | Ridgedale, MO | | (d) | | 1,199 |
| | 1,177 |
| | — |
| | — |
| | 1,199 |
| | 1,177 |
| | 2,376 |
| | (102 | ) | | 1995 | | 09/30/16 | | 13 to 30 Years |
| C-Store (White Oak Station, LLC) | Neosho, MO | | (d) | | 504 |
| | 628 |
| | — |
| | — |
| | 504 |
| | 628 |
| | 1,132 |
| | (49 | ) | | 2002 | | 09/30/16 | | 14 to 40 Years |
| C-Store (White Oak Station, LLC) | Bergman, AR | | (d) | | 404 |
| | 549 |
| | — |
| | — |
| | 404 |
| | 549 |
| | 953 |
| | (45 | ) | | 1996 | | 09/30/16 | | 14 to 40 Years |
| C-Store (White Oak Station, LLC) | Harrison, AR | | (d) | | 594 |
| | 482 |
| | — |
| | — |
| | 594 |
| | 482 |
| | 1,076 |
| | (38 | ) | | 1981 | | 09/30/16 | | 16 to 40 Years |
| C-Store (White Oak Station, LLC) | Berryville, AR | | (d) | | 314 |
| | 381 |
| | — |
| | — |
| | 314 |
| | 381 |
| | 695 |
| | (31 | ) | | 1996 | | 09/30/16 | | 14 to 40 Years |
| C-Store (White Oak Station, LLC) | Fayetteville, AR | | (d) | | 1,760 |
| | 953 |
| | — |
| | — |
| | 1,760 |
| | 953 |
| | 2,713 |
| | (72 | ) | | 1996 | | 09/30/16 | | 16 to 40 Years |
SPIRIT REALTY CAPITAL, INC.
Schedule III Real Estate and
Accumulated Depreciation
(Amounts in thousands)
|
| | | | | | | | | | | | | | | | | | | | | | | | | |
| | | | | | Initial Cost to Company | | Cost Capitalized Subsequent to Acquisition including impairment | | Gross Amount at December 31, 2016 (d) 2017 (g) | | | | | | | | |
| Concept | City, State | | Encumbrances (e) | | Land and Improvements | | Buildings and Improvements | | Land and Improvements | | Buildings and Improvements | | Land and Improvements | | Buildings and Improvements | | Total | | Final Accumulated Depreciation | | Date of Construction | | Date Acquired | | Life in which depreciation in latest Statement of Operations is computed |
Description | | Encumbrances (e)
| | Land and
Improvements
| | Buildings and
Improvements
| | Improvements/
Land
| | Improvements/
building
| | Land and
Improvements
| | Buildings and
Improvements
| | Total | | Final
Accum
| | Date of
Construction
| | Date
Acquired
| |
|
| | | | | | | | | | | | | | | | | | | | | | | | | | | | | | | | | |
| | Opelika, AL | | (c) | | 960 |
| | 1,716 |
| | — |
| | — |
| | 960 |
| | 1,716 |
| | 2,676 |
| | (363 | ) | | 1988 | | 07/17/13 | | 10 to 25 Years |
| | Opelika, AL | | (c) | | 400 |
| | 1,321 |
| | — |
| | — |
| | 400 |
| | 1,321 |
| | 1,721 |
| | (239 | ) | | 1989 | | 07/17/13 | | 10 to 24 Years |
| | Orlando, FL | | (c) | | 1,167 |
| | 982 |
| | — |
| | — |
| | 1,167 |
| | 982 |
| | 2,149 |
| | (211 | ) | | 2001 | | 12/19/13 | | 15 to 30 Years |
| | Orlando, FL | | (c) | | 1,080 |
| | 798 |
| | — |
| | — |
| | 1,080 |
| | 798 |
| | 1,878 |
| | (158 | ) | | 2001 | | 12/19/13 | | 15 to 30 Years |
| | Orlando, FL | | (c) | | 1,303 |
| | 496 |
| | — |
| | — |
| | 1,303 |
| | 496 |
| | 1,799 |
| | (133 | ) | | 1994 | | 12/19/13 | | 15 to 30 Years |
| | Orlando, FL | | (c) | | 973 |
| | 350 |
| | — |
| | — |
| | 973 |
| | 350 |
| | 1,323 |
| | (119 | ) | | 1991 | | 12/19/13 | | 15 to 30 Years |
| | Orlando, FL | | (c) | | 1,128 |
| | 496 |
| | — |
| | — |
| | 1,128 |
| | 496 |
| | 1,624 |
| | (139 | ) | | 1995 | | 12/19/13 | | 15 to 30 Years |
| | Orlando, FL | | (c) | | 1,644 |
| | 1,829 |
| | — |
| | — |
| | 1,644 |
| | 1,829 |
| | 3,473 |
| | (264 | ) | | 2000 | | 12/19/13 | | 15 to 40 Years |
| | Orlando, FL | | (c) | | 1,255 |
| | 1,333 |
| | — |
| | — |
| | 1,255 |
| | 1,333 |
| | 2,588 |
| | (240 | ) | | 2001 | | 12/19/13 | | 15 to 40 Years |
| | Orlando, FL | | (c) | | 1,397 |
| | 1,028 |
| | — |
| | — |
| | 1,397 |
| | 1,028 |
| | 2,425 |
| | (109 | ) | | 1990 | | 10/29/15 | | 15 to 30 Years |
| | Oviedo, FL | | (c) | | 1,556 |
| | 982 |
| | — |
| | — |
| | 1,556 |
| | 982 |
| | 2,538 |
| | (240 | ) | | 2002 | | 12/19/13 | | 15 to 30 Years |
| | Oviedo, FL | | (c) | | 973 |
| | 798 |
| | — |
| | — |
| | 973 |
| | 798 |
| | 1,771 |
| | (175 | ) | | 1995 | | 12/19/13 | | 15 to 30 Years |
| | Oxnard, CA | | (c) | | 1,330 |
| | 950 |
| | — |
| | 363 |
| | 1,330 |
| | 1,313 |
| | 2,643 |
| | (165 | ) | | 1966 | | 06/27/14 | | 15 to 30 Years |
| | Oxnard, CA | | (c) | | 2,284 |
| | 3,620 |
| | — |
| | — |
| | 2,284 |
| | 3,620 |
| | 5,904 |
| | (293 | ) | | 2003 | | 09/09/14 | | 15 to 40 Years |
| | Panama City, FL | | (c) | | 630 |
| | 298 |
| | — |
| | — |
| | 630 |
| | 298 |
| | 928 |
| | (17 | ) | | 1951 | | 07/11/16 | | 15 to 20 Years |
| | Paris, KY | | (c) | | 129 |
| | 636 |
| | — |
| | — |
| | 129 |
| | 636 |
| | 765 |
| | (39 | ) | | 1988 | | 06/30/15 | | 15 to 30 Years |
| | Paris, KY | | (c) | | 209 |
| | 576 |
| | — |
| | — |
| | 209 |
| | 576 |
| | 785 |
| | (40 | ) | | 1992 | | 06/30/15 | | 15 to 30 Years |
| | Paris, ME | | (c) | | 139 |
| | 153 |
| | — |
| | — |
| | 139 |
| | 153 |
| | 292 |
| | (55 | ) | | 1954 | | 06/28/12 | | 15 to 17 Years |
| | Parma, OH | | (c) | | 437 |
| | 1,166 |
| | — |
| | — |
| | 437 |
| | 1,166 |
| | 1,603 |
| | (160 | ) | | 2002 | | 07/17/13 | | 15 to 35 Years |
| | Phenix City, AL | | (c) | | 554 |
| | 1,392 |
| | — |
| | — |
| | 554 |
| | 1,392 |
| | 1,946 |
| | (228 | ) | | 1999 | | 07/17/13 | | 13 to 33 Years |
| | Phoenix, AZ | | (c) | | 2,243 |
| | 4,243 |
| | — |
| | — |
| | 2,243 |
| | 4,243 |
| | 6,486 |
| | (1,621 | ) | | 2001 | | 07/02/07 | | 15 to 40 Years |
| | Phoenix, AZ | | (c) | | 1,212 |
| | 380 |
| | — |
| | — |
| | 1,212 |
| | 380 |
| | 1,592 |
| | (76 | ) | | 1985 | | 03/20/15 | | 7 to 40 Years |
| | Pine Mountain, GA | | (c) | | 454 |
| | 1,627 |
| | — |
| | — |
| | 454 |
| | 1,627 |
| | 2,081 |
| | (239 | ) | | 1999 | | 07/17/13 | | 10 to 37 Years |
| | Plainwell, MI | | (c) | | 785 |
| | 235 |
| | — |
| | — |
| | 785 |
| | 235 |
| | 1,020 |
| | (22 | ) | | 1998 | | 05/19/16 | | 17 to 30 Years |
| | Pomona, CA | | (c) | | 1,551 |
| | 839 |
| | — |
| | 127 |
| | 1,551 |
| | 966 |
| | 2,517 |
| | (143 | ) | | 1967 | | 05/02/14 | | 15 to 30 Years |
| | Pomona, CA | | (c) | | 1,078 |
| | 864 |
| | — |
| | — |
| | 1,078 |
| | 864 |
| | 1,942 |
| | (111 | ) | | 1999 | | 06/04/14 | | 15 to 40 Years |
| | Port Wentworth, GA | | (c) | | 1,627 |
| | 1,131 |
| | — |
| | — |
| | 1,627 |
| | 1,131 |
| | 2,758 |
| | (513 | ) | | 1991 | | 07/17/13 | | 4 to 35 Years |
| | Portland, OR | | (c) | | 516 |
| | 272 |
| | — |
| | — |
| | 516 |
| | 272 |
| | 788 |
| | (45 | ) | | 1991 | | 10/28/14 | | 15 to 30 Years |
| | Prattville, AL | | (c) | | 1,978 |
| | 735 |
| | — |
| | — |
| | 1,978 |
| | 735 |
| | 2,713 |
| | (36 | ) | | 1995 | | 07/11/16 | | 15 to 30 Years |
| | Presque Isle, ME | | (c) | | 708 |
| | 390 |
| | — |
| | — |
| | 708 |
| | 390 |
| | 1,098 |
| | (107 | ) | | 1995 | | 01/24/14 | | 14 to 30 Years |
| | Prosser, WA | | (c) | | 245 |
| | 444 |
| | — |
| | — |
| | 245 |
| | 444 |
| | 689 |
| | (56 | ) | | 1985 | | 10/28/14 | | 15 to 30 Years |
| | Ragland, AL | | (c) | | 385 |
| | 595 |
| | — |
| | — |
| | 385 |
| | 595 |
| | 980 |
| | (15 | ) | | 1986 | | 07/11/16 | | 15 to 30 Years |
| | Raymond, NH | | (c) | | 1,722 |
| | 430 |
| | — |
| | — |
| | 1,722 |
| | 430 |
| | 2,152 |
| | (160 | ) | | 1986 | | 01/24/14 | | 14 to 20 Years |
| | Reseda, CA | | (c) | | 2,064 |
| | 1,013 |
| | — |
| | — |
| | 2,064 |
| | 1,013 |
| | 3,077 |
| | (132 | ) | | 1997 | | 05/02/14 | | 15 to 40 Years |
| | Reseda, CA | | (c) | | 2,422 |
| | 605 |
| | — |
| | — |
| | 2,422 |
| | 605 |
| | 3,027 |
| | (149 | ) | | 1997 | | 05/02/14 | | 15 to 30 Years |
| | Ridgedale, MO | | (c) | | 1,199 |
| | 1,177 |
| | — |
| | — |
| | 1,199 |
| | 1,177 |
| | 2,376 |
| | (20 | ) | | 1995 | | 09/30/16 | | 13 to 30 Years |
| | Roanoke, VA | | (c) | | 238 |
| | 497 |
| | — |
| | — |
| | 238 |
| | 497 |
| | 735 |
| | (32 | ) | | 1988 | | 06/30/15 | | 15 to 30 Years |
| | Roanoke, VA | | (c) | | 616 |
| | 534 |
| | — |
| | — |
| | 616 |
| | 534 |
| | 1,150 |
| | (46 | ) | | 1988 | | 06/30/15 | | 15 to 30 Years |
|
| | | | | | | | | | | | | | | | | | | | | | | | | | | | | | | | | |
| C-Store (White Oak Station, LLC) | Springdale, AR | | (d) | | 2,119 |
| | 1,401 |
| | — |
| | 157 |
| | 2,119 |
| | 1,558 |
| | 3,677 |
| | (124 | ) | | 2010 | | 09/30/16 | | 17 to 40 Years |
| C-Store (White Oak Station, LLC) | Clinton, MO | | (d) | | 291 |
| | 404 |
| | — |
| | — |
| | 291 |
| | 404 |
| | 695 |
| | (33 | ) | | 1960 | | 09/30/16 | | 15 to 30 Years |
| C-Store (White Oak Station, LLC) | Butler, MO | | (d) | | 919 |
| | 1,076 |
| | — |
| | — |
| | 919 |
| | 1,076 |
| | 1,995 |
| | (99 | ) | | 1996 | | 09/30/16 | | 15 to 30 Years |
| C-Store (White Oak Station, LLC) | Forsyth, MO | | (d) | | 370 |
| | 572 |
| | — |
| | — |
| | 370 |
| | 572 |
| | 942 |
| | (46 | ) | | 1950 | | 09/30/16 | | 14 to 30 Years |
| CVS | Alpharetta, GA | | (c) | | 968 |
| | 2,614 |
| | — |
| | — |
| | 968 |
| | 2,614 |
| | 3,582 |
| | (388 | ) | | 1998 | | 07/17/13 | | 5 to 40 Years |
| CVS | Richland Hills, TX | | (c) | | 997 |
| | 2,951 |
| | — |
| | — |
| | 997 |
| | 2,951 |
| | 3,948 |
| | (409 | ) | | 1997 | | 07/17/13 | | 4 to 40 Years |
| CVS | Portsmouth, OH | | (d) | | 354 |
| | 1,953 |
| | (276 | ) | | (1,514 | ) | | 78 |
| | 439 |
| | 517 |
| | (4 | ) | | 1997 | | 07/17/13 | | 1 to 33 Years |
| CVS | Madison, MS | | (d) | | 745 |
| | 3,323 |
| | — |
| | — |
| | 745 |
| | 3,323 |
| | 4,068 |
| | (463 | ) | | 2004 | | 07/17/13 | | 11 to 40 Years |
| CVS | Okeechobee, FL | | (d) | | 674 |
| | 5,088 |
| | — |
| | — |
| | 674 |
| | 5,088 |
| | 5,762 |
| | (855 | ) | | 2001 | | 07/17/13 | | 9 to 30 Years |
| CVS | Orlando, FL | | (d) | | 781 |
| | 3,799 |
| | — |
| | — |
| | 781 |
| | 3,799 |
| | 4,580 |
| | (646 | ) | | 2005 | | 07/17/13 | | 10 to 30 Years |
| CVS | Gulfport, MS | | (d) | | 441 |
| | 4,208 |
| | — |
| | — |
| | 441 |
| | 4,208 |
| | 4,649 |
| | (539 | ) | | 2000 | | 07/17/13 | | 12 to 40 Years |
| CVS | Clinton, NY | | (d) | | 1,050 |
| | 2,090 |
| | — |
| | — |
| | 1,050 |
| | 2,090 |
| | 3,140 |
| | (348 | ) | | 2005 | | 07/17/13 | | 11 to 42 Years |
| CVS | Glenville Scotia, NY | | (d) | | 1,314 |
| | 3,964 |
| | — |
| | — |
| | 1,314 |
| | 3,964 |
| | 5,278 |
| | (557 | ) | | 2006 | | 07/17/13 | | 12 to 43 Years |
| CVS | Florence, SC | | (d) | | 744 |
| | 2,070 |
| | — |
| | — |
| | 744 |
| | 2,070 |
| | 2,814 |
| | (306 | ) | | 1998 | | 07/17/13 | | 5 to 39 Years |
| CVS | Amarillo, TX | | (d) | | 916 |
| | 2,747 |
| | — |
| | — |
| | 916 |
| | 2,747 |
| | 3,663 |
| | (412 | ) | | 1994 | | 07/17/13 | | 20 to 20 Years |
| CVS | Indianapolis, IN | | (c) | | 860 |
| | 2,754 |
| | — |
| | — |
| | 860 |
| | 2,754 |
| | 3,614 |
| | (424 | ) | | 1998 | | 07/17/13 | | 10 to 40 Years |
| CVS | Onley, VA | | (d) | | 2,530 |
| | 2,296 |
| | — |
| | — |
| | 2,530 |
| | 2,296 |
| | 4,826 |
| | (400 | ) | | 2007 | | 07/17/13 | | 12 to 43 Years |
| CVS | Columbia, TN | | (d) | | 842 |
| | 1,864 |
| | — |
| | — |
| | 842 |
| | 1,864 |
| | 2,706 |
| | (304 | ) | | 1997 | | 07/17/13 | | 4 to 37 Years |
| CVS | Hamilton, OH | | (d) | | 738 |
| | 2,429 |
| | — |
| | — |
| | 738 |
| | 2,429 |
| | 3,167 |
| | (373 | ) | | 1998 | | 07/17/13 | | 5 to 39 Years |
| CVS | Mechanicville, NY | | (d) | | 654 |
| | 3,120 |
| | — |
| | — |
| | 654 |
| | 3,120 |
| | 3,774 |
| | (439 | ) | | 1997 | | 07/17/13 | | 4 to 38 Years |
| CVS | Atlanta, GA | | (c) | | 1,316 |
| | 2,266 |
| | — |
| | — |
| | 1,316 |
| | 2,266 |
| | 3,582 |
| | (358 | ) | | 2006 | | 07/17/13 | | 14 to 42 Years |
| CVS | Carrolton, TX | | (d) | | 945 |
| | 1,967 |
| | — |
| | — |
| | 945 |
| | 1,967 |
| | 2,912 |
| | (282 | ) | | 1995 | | 07/17/13 | | 1 to 39 Years |
| CVS | Kissimmee, FL | | (d) | | 1,508 |
| | 2,153 |
| | — |
| | — |
| | 1,508 |
| | 2,153 |
| | 3,661 |
| | (354 | ) | | 1995 | | 07/17/13 | | 2 to 40 Years |
| CVS | Lake Worth, TX | | (d) | | 1,044 |
| | 1,817 |
| | — |
| | — |
| | 1,044 |
| | 1,817 |
| | 2,861 |
| | (364 | ) | | 1996 | | 07/17/13 | | 2 to 30 Years |
| CVS | Richardson, TX | | (c) | | 803 |
| | 2,575 |
| | — |
| | — |
| | 803 |
| | 2,575 |
| | 3,378 |
| | (351 | ) | | 1996 | | 07/17/13 | | 3 to 40 Years |
| CVS | River Oaks, TX | | (c) | | 829 |
| | 2,871 |
| | — |
| | — |
| | 829 |
| | 2,871 |
| | 3,700 |
| | (426 | ) | | 1996 | | 07/17/13 | | 3 to 40 Years |
| CVS | The Colony, TX | | (d) | | 1,028 |
| | 1,769 |
| | — |
| | — |
| | 1,028 |
| | 1,769 |
| | 2,797 |
| | (261 | ) | | 1996 | | 07/17/13 | | 1 to 40 Years |
| CVS | Wichita Falls, TX | | (d) | | 503 |
| | 2,530 |
| | — |
| | — |
| | 503 |
| | 2,530 |
| | 3,033 |
| | (366 | ) | | 1995 | | 07/17/13 | | 2 to 40 Years |
| CVS | Wichita Falls, TX | | (d) | | 528 |
| | 2,022 |
| | — |
| | — |
| | 528 |
| | 2,022 |
| | 2,550 |
| | (282 | ) | | 1995 | | 07/17/13 | | 1 to 40 Years |
SPIRIT REALTY CAPITAL, INC.
Schedule III Real Estate and
Accumulated Depreciation
(Amounts in thousands)
|
| | | | | | | | | | | | | | | | | | | | | | | | | |
| | | | | | Initial Cost to Company | | Cost Capitalized Subsequent to Acquisition including impairment | | Gross Amount at December 31, 2016 (d) 2017 (g) | | | | | | | | |
| Concept | City, State | | Encumbrances (e) | | Land and Improvements | | Buildings and Improvements | | Land and Improvements | | Buildings and Improvements | | Land and Improvements | | Buildings and Improvements | | Total | | Final Accumulated Depreciation | | Date of Construction | | Date Acquired | | Life in which depreciation in latest Statement of Operations is computed |
Description | | Encumbrances (e)
| | Land and
Improvements
| | Buildings and
Improvements
| | Improvements/
Land
| | Improvements/
building
| | Land and
Improvements
| | Buildings and
Improvements
| | Total | | Final
Accum
| | Date of
Construction
| | Date
Acquired
| |
|
| | | | | | | | | | | | | | | | | | | | | | | | | | | | | | | | | |
| | Roanoke, VA | | (c) | | 397 |
| | 785 |
| | — |
| | — |
| | 397 |
| | 785 |
| | 1,182 |
| | (54 | ) | | 1986 | | 06/30/15 | | 15 to 30 Years |
| | Roanoke, VA | | (c) | | 397 |
| | 685 |
| | — |
| | — |
| | 397 |
| | 685 |
| | 1,082 |
| | (49 | ) | | 1997 | | 06/30/15 | | 15 to 30 Years |
| | Rockland, ME | | (c) | | 211 |
| | 303 |
| | — |
| | — |
| | 211 |
| | 303 |
| | 514 |
| | (67 | ) | | 1984 | | 06/28/12 | | 15 to 28 Years |
| | Roebuck, SC | | (a) | | 708 |
| | 818 |
| | — |
| | 152 |
| | 708 |
| | 970 |
| | 1,678 |
| | (241 | ) | | 1992 | | 01/01/14 | | 8 to 29 Years |
| | Rushville, IN | | (c) | | 179 |
| | 112 |
| | — |
| | — |
| | 179 |
| | 112 |
| | 291 |
| | (7 | ) | | 1978 | | 05/19/16 | | 17 to 30 Years |
| | Rustburg, VA | | (c) | | 527 |
| | 775 |
| | — |
| | — |
| | 527 |
| | 775 |
| | 1,302 |
| | (64 | ) | | 1990 | | 06/30/15 | | 15 to 30 Years |
| | Saginaw, MI | | (c) | | 1,177 |
| | 594 |
| | — |
| | — |
| | 1,177 |
| | 594 |
| | 1,771 |
| | (31 | ) | | 1989 | | 05/19/16 | | 17 to 30 Years |
| | Saginaw, MI | | (c) | | 224 |
| | 135 |
| | — |
| | — |
| | 224 |
| | 135 |
| | 359 |
| | (8 | ) | | 1960 | | 05/19/16 | | 17 to 30 Years |
| | Saginaw, MI | | (c) | | 359 |
| | 191 |
| | — |
| | — |
| | 359 |
| | 191 |
| | 550 |
| | (9 | ) | | 1969 | | 05/19/16 | | 17 to 30 Years |
| | St. Augustine, FL | | (a) | | 9,556 |
| | 2,543 |
| | — |
| | — |
| | 9,556 |
| | 2,543 |
| | 12,099 |
| | (2,815 | ) | | 2005 | | 07/01/05 | | 13 to 40 Years |
| | Salem, OR | | (c) | | 879 |
| | 281 |
| | — |
| | — |
| | 879 |
| | 281 |
| | 1,160 |
| | (96 | ) | | 1991 | | 10/28/14 | | 15 to 30 Years |
| | Salem, VA | | (c) | | 209 |
| | 576 |
| | — |
| | — |
| | 209 |
| | 576 |
| | 785 |
| | (40 | ) | | 1970 | | 06/30/15 | | 15 to 30 Years |
| | Salem, VA | | (c) | | 646 |
| | 517 |
| | — |
| | — |
| | 646 |
| | 517 |
| | 1,163 |
| | (44 | ) | | 1987 | | 06/30/15 | | 15 to 30 Years |
| | Salem, VA | | (c) | | 387 |
| | 1,172 |
| | — |
| | — |
| | 387 |
| | 1,172 |
| | 1,559 |
| | (74 | ) | | 1973 | | 06/30/15 | | 15 to 30 Years |
| | San Francisco, CA | | (c) | | 1,604 |
| | 82 |
| | — |
| | — |
| | 1,604 |
| | 82 |
| | 1,686 |
| | (41 | ) | | 1980 | | 10/28/14 | | 15 to 30 Years |
| | Sanford, ME | | (c) | | 807 |
| | 579 |
| | — |
| | — |
| | 807 |
| | 579 |
| | 1,386 |
| | (122 | ) | | 1997 | | 06/28/12 | | 15 to 28 Years |
| | Sault Ste Marie, MI | | (c) | | 1,760 |
| | 561 |
| | — |
| | — |
| | 1,760 |
| | 561 |
| | 2,321 |
| | (36 | ) | | 1993 | | 05/19/16 | | 17 to 30 Years |
| | Savannah, GA | | (c) | | 1,001 |
| | 847 |
| | — |
| | — |
| | 1,001 |
| | 847 |
| | 1,848 |
| | (205 | ) | | 1997 | | 07/17/13 | | 8 to 37 Years |
| | Savannah, GA | | (c) | | 831 |
| | 869 |
| | — |
| | — |
| | 831 |
| | 869 |
| | 1,700 |
| | (169 | ) | | 1990 | | 07/17/13 | | 14 to 30 Years |
| | Scottsdale, AZ | | (c) | | 4,416 |
| | 2,384 |
| | — |
| | — |
| | 4,416 |
| | 2,384 |
| | 6,800 |
| | (1,096 | ) | | 2000 | | 07/02/07 | | 15 to 40 Years |
| | Scottsdale, AZ | | (c) | | 2,765 |
| | 2,196 |
| | — |
| | — |
| | 2,765 |
| | 2,196 |
| | 4,961 |
| | (1,006 | ) | | 1995 | | 07/02/07 | | 15 to 40 Years |
| | Scottsdale, AZ | | (c) | | 5,123 |
| | 2,683 |
| | — |
| | — |
| | 5,123 |
| | 2,683 |
| | 7,806 |
| | (1,563 | ) | | 1991 | | 07/02/07 | | 15 to 40 Years |
| | Scottsdale, AZ | | (c) | | 3,437 |
| | 2,373 |
| | — |
| | — |
| | 3,437 |
| | 2,373 |
| | 5,810 |
| | (1,383 | ) | | 1996 | | 07/02/07 | | 15 to 40 Years |
| | Scottville, MI | | (c) | | 235 |
| | 404 |
| | — |
| | — |
| | 235 |
| | 404 |
| | 639 |
| | (16 | ) | | 1959 | | 05/19/16 | | 17 to 30 Years |
| | Seville, OH | | (c) | | 1,141 |
| | 2,604 |
| | — |
| | — |
| | 1,141 |
| | 2,604 |
| | 3,745 |
| | (389 | ) | | 2003 | | 07/17/13 | | 15 to 36 Years |
| | Sherman Mills, ME | | (c) | | 259 |
| | 163 |
| | — |
| | — |
| | 259 |
| | 163 |
| | 422 |
| | (63 | ) | | 1974 | | 06/28/12 | | 15 to 20 Years |
| | Shoreline, WA | | (c) | | 516 |
| | 172 |
| | — |
| | — |
| | 516 |
| | 172 |
| | 688 |
| | (27 | ) | | 1955 | | 10/28/14 | | 15 to 30 Years |
| | Shreveport, LA | | (c) | | 369 |
| | 1,183 |
| | — |
| | — |
| | 369 |
| | 1,183 |
| | 1,552 |
| | (251 | ) | | 1988 | | 07/17/13 | | 4 to 25 Years |
| | South Boston, VA | | (c) | | 378 |
| | 705 |
| | — |
| | — |
| | 378 |
| | 705 |
| | 1,083 |
| | (45 | ) | | 1988 | | 06/30/15 | | 15 to 30 Years |
| | South Boston, VA | | (c) | | 407 |
| | 834 |
| | — |
| | — |
| | 407 |
| | 834 |
| | 1,241 |
| | (54 | ) | | 1983 | | 06/30/15 | | 15 to 30 Years |
| | South Boston, VA | | (c) | | 894 |
| | 1,232 |
| | — |
| | — |
| | 894 |
| | 1,232 |
| | 2,126 |
| | (88 | ) | | 1997 | | 06/30/15 | | 15 to 30 Years |
| | South Boston, VA | | (c) | | 368 |
| | 517 |
| | — |
| | — |
| | 368 |
| | 517 |
| | 885 |
| | (43 | ) | | 1997 | | 06/30/15 | | 15 to 30 Years |
| | South Portland, ME | | (c) | | 661 |
| | 194 |
| | — |
| | — |
| | 661 |
| | 194 |
| | 855 |
| | (91 | ) | | 1970 | | 06/28/12 | | 15 to 15 Years |
| | South Portland, ME | | (c) | | 448 |
| | 593 |
| | — |
| | — |
| | 448 |
| | 593 |
| | 1,041 |
| | (81 | ) | | 1970 | | 01/24/14 | | 14 to 40 Years |
|
| | | | | | | | | | | | | | | | | | | | | | | | | | | | | | | | | |
| CVS | Maynard, MA | | (d) | | 1,683 |
| | 3,984 |
| | — |
| | — |
| | 1,683 |
| | 3,984 |
| | 5,667 |
| | (495 | ) | | 2004 | | 07/17/13 | | 14 to 42 Years |
| CVS | Myrtle Beach, SC | | (d) | | 828 |
| | 4,024 |
| | — |
| | — |
| | 828 |
| | 4,024 |
| | 4,852 |
| | (535 | ) | | 2004 | | 07/17/13 | | 12 to 42 Years |
| CVS | Waynesville, NC | | (d) | | 1,495 |
| | 2,365 |
| | — |
| | — |
| | 1,495 |
| | 2,365 |
| | 3,860 |
| | (347 | ) | | 2005 | | 07/17/13 | | 12 to 42 Years |
| CVS | Indianapolis, IN | | (c) | | 733 |
| | 2,882 |
| | — |
| | — |
| | 733 |
| | 2,882 |
| | 3,615 |
| | (430 | ) | | 1997 | | 07/17/13 | | 10 to 38 Years |
| CVS | Lincoln, IL | | (c) | | 444 |
| | 3,043 |
| | — |
| | — |
| | 444 |
| | 3,043 |
| | 3,487 |
| | (432 | ) | | 2007 | | 07/17/13 | | 11 to 43 Years |
|
| | | | | | | | | | | | | | | | | | | | | | | | | | | | | | | | | |
| CVS | Azle, TX | | (c) | | 1,213 |
| | 3,504 |
| | — |
| | — |
| | 1,213 |
| | 3,504 |
| | 4,717 |
| | (439 | ) | | 2008 | | 07/17/13 | | 15 to 43 Years |
| CVS | New Cumberland, PA | | (c) | | 794 |
| | 2,663 |
| | — |
| | — |
| | 794 |
| | 2,663 |
| | 3,457 |
| | (377 | ) | | 2007 | | 07/17/13 | | 12 to 43 Years |
| CVS | St. Augustine, FL | | (d) | | 1,048 |
| | 2,905 |
| | — |
| | — |
| | 1,048 |
| | 2,905 |
| | 3,953 |
| | (409 | ) | | 2008 | | 07/17/13 | | 11 to 42 Years |
| Dairy Queen | Palmer, AK | | (d) | | 510 |
| | 1,350 |
| | — |
| | 90 |
| | 510 |
| | 1,440 |
| | 1,950 |
| | (54 | ) | | 2000 | | 02/16/17 | | 10 to 30 Years |
| Dairy Queen | Anchorage, AK | | (d) | | 1,150 |
| | 1,262 |
| | — |
| | — |
| | 1,150 |
| | 1,262 |
| | 2,412 |
| | (37 | ) | | 2007 | | 02/16/17 | | 15 to 40 Years |
| Dairy Queen | Anchorage, AK | | (d) | | 333 |
| | 461 |
| | — |
| | — |
| | 333 |
| | 461 |
| | 794 |
| | (14 | ) | | 2010 | | 02/16/17 | | 10 to 40 Years |
| Dairy Queen | Wasilla, AK | | (d) | | 577 |
| | 1,260 |
| | — |
| | — |
| | 577 |
| | 1,260 |
| | 1,837 |
| | (77 | ) | | 1984 | | 02/16/17 | | 5 to 20 Years |
| Dark | Canton, MI | | (a) | | 2,071 |
| | 1,224 |
| | — |
| | — |
| | 2,071 |
| | 1,224 |
| | 3,295 |
| | (747 | ) | | 1996 | | 06/25/04 | | 15 to 30 Years |
| Dave & Buster's | Marietta, GA | | (a) | | 3,908 |
| | 8,630 |
| | (74 | ) | | — |
| | 3,834 |
| | 8,630 |
| | 12,464 |
| | (3,732 | ) | | 1992 | | 07/01/05 | | 15 to 30 Years |
| Dave & Buster's | Addison, IL | | (d) | | 4,690 |
| | 6,692 |
| | — |
| | — |
| | 4,690 |
| | 6,692 |
| | 11,382 |
| | (2,092 | ) | | 1995 | | 07/17/13 | | 7 to 24 Years |
| Dave & Buster's | Tucson, AZ | | (d) | | 2,874 |
| | 5,655 |
| | — |
| | 43 |
| | 2,874 |
| | 5,698 |
| | 8,572 |
| | (146 | ) | | 2017 | | 03/31/17 | | 15 to 50 Years |
| Dave & Buster's | Westlake, OH | | (d) | | 2,856 |
| | 1 |
| | — |
| | 44 |
| | 2,856 |
| | 45 |
| | 2,901 |
| | (3 | ) | | 2016 | | 05/18/17 | | 10 to 10 Years |
| David McDavid Acura Pre-Owned | Plano, TX | | (d) | | 3,064 |
| | 2,707 |
| | — |
| | — |
| | 3,064 |
| | 2,707 |
| | 5,771 |
| | (1,559 | ) | | 1992 | | 06/29/07 | | 5 to 30 Years |
| David's Bridal | Lenexa, KS | | (d) | | 919 |
| | 2,476 |
| | — |
| | — |
| | 919 |
| | 2,476 |
| | 3,395 |
| | (347 | ) | | 2005 | | 07/17/13 | | 2 to 47 Years |
| Davis-Standard | Pawcatuck, CT | | (d) | | 2,736 |
| | 9,218 |
| | — |
| | 36 |
| | 2,736 |
| | 9,254 |
| | 11,990 |
| | (447 | ) | | 1969 | | 10/27/16 | | 7 to 40 Years |
| Davis-Standard | Fulton, NY | | (d) | | 445 |
| | 6,113 |
| | — |
| | 35 |
| | 445 |
| | 6,148 |
| | 6,593 |
| | (238 | ) | | 1983 | | 10/27/16 | | 5 to 40 Years |
| Defined Fitness | Albuquerque, NM | | (d) | | 1,914 |
| | 3,724 |
| | — |
| | — |
| | 1,914 |
| | 3,724 |
| | 5,638 |
| | (389 | ) | | 1995 | | 04/23/15 | | 15 to 30 Years |
| Defined Fitness | Rio Rancho, NM | | (d) | | 1,448 |
| | 2,172 |
| | — |
| | — |
| | 1,448 |
| | 2,172 |
| | 3,620 |
| | (242 | ) | | 1997 | | 04/23/15 | | 15 to 30 Years |
| Defined Fitness | Albuquerque, NM | | (d) | | 2,391 |
| | 4,008 |
| | — |
| | — |
| | 2,391 |
| | 4,008 |
| | 6,399 |
| | (432 | ) | | 2001 | | 04/23/15 | | 15 to 30 Years |
| Defined Fitness | Albuquerque, NM | | (d) | | 4,732 |
| | 6,845 |
| | — |
| | — |
| | 4,732 |
| | 6,845 |
| | 11,577 |
| | (631 | ) | | 1972 | | 04/23/15 | | 15 to 40 Years |
| Defined Fitness | Farmington, NM | | (d) | | 2,242 |
| | 6,696 |
| | — |
| | — |
| | 2,242 |
| | 6,696 |
| | 8,938 |
| | (545 | ) | | 1999 | | 04/23/15 | | 15 to 40 Years |
| DefyGravity Wilmington Trampoline Park | Wilmington, NC | | (d) | | 837 |
| | 1,429 |
| | — |
| | — |
| | 837 |
| | 1,429 |
| | 2,266 |
| | (228 | ) | | 2006 | | 09/30/15 | | 9 to 20 Years |
| Denny's | Fountain Hills, AZ | | (a) | | 825 |
| | 561 |
| | — |
| | — |
| | 825 |
| | 561 |
| | 1,386 |
| | (360 | ) | | 1995 | | 09/24/04 | | 15 to 30 Years |
| Denny's | Benson, AZ | | (d) | | 313 |
| | 336 |
| | — |
| | — |
| | 313 |
| | 336 |
| | 649 |
| | (69 | ) | | 1996 | | 03/20/15 | | 15 to 20 Years |
SPIRIT REALTY CAPITAL, INC.
Schedule III Real Estate and
Accumulated Depreciation
(Amounts in thousands)
|
| | | | | | | | | | | | | | | | | | | | | | | | | |
| | | | | | Initial Cost to Company | | Cost Capitalized Subsequent to Acquisition including impairment | | Gross Amount at December 31, 2016 (d) 2017 (g) | | | | | | | | |
| Concept | City, State | | Encumbrances (e) | | Land and Improvements | | Buildings and Improvements | | Land and Improvements | | Buildings and Improvements | | Land and Improvements | | Buildings and Improvements | | Total | | Final Accumulated Depreciation | | Date of Construction | | Date Acquired | | Life in which depreciation in latest Statement of Operations is computed |
Description | | Encumbrances (e)
| | Land and
Improvements
| | Buildings and
Improvements
| | Improvements/
Land
| | Improvements/
building
| | Land and
Improvements
| | Buildings and
Improvements
| | Total | | Final
Accum
| | Date of
Construction
| | Date
Acquired
| |
|
| | | | | | | | | | | | | | | | | | | | | | | | | | | | | | | | | |
| | Sparta, MI | | (c) | | 291 |
| | 650 |
| | — |
| | — |
| | 291 |
| | 650 |
| | 941 |
| | (20 | ) | | 1993 | | 05/19/16 | | 17 to 30 Years |
| | Spiceland, IN | | (a) | | 9,649 |
| | 3,063 |
| | — |
| | — |
| | 9,649 |
| | 3,063 |
| | 12,712 |
| | (3,527 | ) | | 38534 | | 07/01/05 | | 13 to 40 Years |
| | Spring Lake, MI | | (c) | | 247 |
| | 325 |
| | — |
| | 190 |
| | 247 |
| | 515 |
| | 762 |
| | (16 | ) | | 1964 | | 05/19/16 | | 17 to 30 Years |
| | Springdale, AR | | (c) | | 2,119 |
| | 1,401 |
| | — |
| | 157 |
| | 2,119 |
| | 1,558 |
| | 3,677 |
| | (25 | ) | | 2010 | | 09/30/16 | | 17 to 40 Years |
| | Springdale, SC | | (c) | | 794 |
| | 767 |
| | — |
| | — |
| | 794 |
| | 767 |
| | 1,561 |
| | (134 | ) | | 1999 | | 07/17/13 | | 13 to 33 Years |
| | Springfield, MO | | (c) | | 431 |
| | 732 |
| | — |
| | 86 |
| | 431 |
| | 818 |
| | 1,249 |
| | (32 | ) | | 1988 | | 03/31/16 | | 18 to 30 Years |
| | Springfield, MO | | (c) | | 562 |
| | 1,007 |
| | — |
| | — |
| | 562 |
| | 1,007 |
| | 1,569 |
| | (40 | ) | | 1989 | | 03/31/16 | | 18 to 30 Years |
| | Springfield, MO | | (c) | | 327 |
| | 732 |
| | — |
| | — |
| | 327 |
| | 732 |
| | 1,059 |
| | (28 | ) | | 1987 | | 03/31/16 | | 18 to 30 Years |
| | St Johns, MI | | (c) | | 460 |
| | 706 |
| | — |
| | — |
| | 460 |
| | 706 |
| | 1,166 |
| | (27 | ) | | 2011 | | 05/19/16 | | 17 to 30 Years |
| | Stanton, CA | | (c) | | 985 |
| | 566 |
| | — |
| | — |
| | 985 |
| | 566 |
| | 1,551 |
| | (78 | ) | | 1966 | | 10/31/14 | | 15 to 30 Years |
| | Stevensville, MI | | (c) | | 482 |
| | 191 |
| | — |
| | — |
| | 482 |
| | 191 |
| | 673 |
| | (16 | ) | | 1960 | | 05/19/16 | | 17 to 30 Years |
| | Sumiton, AL | | (c) | | 1,138 |
| | 420 |
| | — |
| | — |
| | 1,138 |
| | 420 |
| | 1,558 |
| | (28 | ) | | 1970 | | 07/11/16 | | 15 to 20 Years |
| | Summerville, SC | | (a) | | 1,317 |
| | 1,459 |
| | (151 | ) | | 208 |
| | 1,166 |
| | 1,667 |
| | 2,833 |
| | (309 | ) | | 2001 | | 05/08/13 | | 8 to 29 Years |
| | Swartz Creek, MI | | (c) | | 213 |
| | 460 |
| | — |
| | — |
| | 213 |
| | 460 |
| | 673 |
| | (15 | ) | | 1952 | | 05/19/16 | | 17 to 30 Years |
| | Sylacauga, AL | | (c) | | 560 |
| | 438 |
| | — |
| | — |
| | 560 |
| | 438 |
| | 998 |
| | (20 | ) | | 1948 | | 07/11/16 | | 15 to 20 Years |
| | Tacoma, WA | | (c) | | 326 |
| | 290 |
| | — |
| | — |
| | 326 |
| | 290 |
| | 616 |
| | (46 | ) | | 1987 | | 10/28/14 | | 15 to 30 Years |
| | Temple City, CA | | (c) | | 948 |
| | 544 |
| | — |
| | 134 |
| | 948 |
| | 678 |
| | 1,626 |
| | (88 | ) | | 1955 | | 05/02/14 | | 15 to 30 Years |
| | Three Rivers, MI | | (c) | | 1,256 |
| | 1,401 |
| | — |
| | — |
| | 1,256 |
| | 1,401 |
| | 2,657 |
| | (55 | ) | | 1982 | | 05/19/16 | | 17 to 30 Years |
| | Traverse City, MI | | (c) | | 482 |
| | 179 |
| | — |
| | — |
| | 482 |
| | 179 |
| | 661 |
| | (9 | ) | | 1971 | | 05/19/16 | | 17 to 30 Years |
| | Twinsburg, OH | | (c) | | 556 |
| | 1,317 |
| | — |
| | — |
| | 556 |
| | 1,317 |
| | 1,873 |
| | (191 | ) | | 2005 | | 07/17/13 | | 15 to 37 Years |
| | Union Gap, WA | | (c) | | 417 |
| | 272 |
| | — |
| | — |
| | 417 |
| | 272 |
| | 689 |
| | (48 | ) | | 1983 | | 10/28/14 | | 15 to 30 Years |
| | Vallejo, CA | | (c) | | 2,923 |
| | 2,904 |
| | — |
| | — |
| | 2,923 |
| | 2,904 |
| | 5,827 |
| | (360 | ) | | 1970 | | 10/31/14 | | 15 to 40 Years |
| | Valley, AL | | (c) | | 754 |
| | 804 |
| | — |
| | — |
| | 754 |
| | 804 |
| | 1,558 |
| | (165 | ) | | 1974 | | 07/17/13 | | 9 to 25 Years |
| | Valley, AL | | (c) | | 280 |
| | 368 |
| | — |
| | — |
| | 280 |
| | 368 |
| | 648 |
| | (14 | ) | | 1955 | | 07/11/16 | | 15 to 20 Years |
| | Ventura, CA | | (c) | | 2,473 |
| | 909 |
| | — |
| | 169 |
| | 2,473 |
| | 1,078 |
| | 3,551 |
| | (183 | ) | | 1971 | | 05/02/14 | | 15 to 30 Years |
| | Ventura, CA | | (c) | | 2,274 |
| | 641 |
| | — |
| | — |
| | 2,274 |
| | 641 |
| | 2,915 |
| | (295 | ) | | 1971 | | 05/02/14 | | 10 to 15 Years |
| | Vista, CA | | (c) | | 1,745 |
| | 497 |
| | — |
| | — |
| | 1,745 |
| | 497 |
| | 2,242 |
| | (92 | ) | | 1987 | | 10/31/14 | | 15 to 40 Years |
| | Waitsburg, WA | | (c) | | 190 |
| | 344 |
| | — |
| | — |
| | 190 |
| | 344 |
| | 534 |
| | (45 | ) | | 1980 | | 10/28/14 | | 15 to 30 Years |
| | Waldoboro, ME | | (c) | | 1,450 |
| | 834 |
| | — |
| | — |
| | 1,450 |
| | 834 |
| | 2,284 |
| | (157 | ) | | 1996 | | 01/24/14 | | 14 to 40 Years |
| | West Monroe, LA | | (c) | | 686 |
| | 981 |
| | — |
| | — |
| | 686 |
| | 981 |
| | 1,667 |
| | (420 | ) | | 1983 | | 07/17/13 | | 5 to 25 Years |
| | West Monroe, LA | | (c) | | 425 |
| | 1,558 |
| | — |
| | — |
| | 425 |
| | 1,558 |
| | 1,983 |
| | (424 | ) | | 1999 | | 07/17/13 | | 3 to 35 Years |
| | Willoughby, OH | | (c) | | 477 |
| | 1,167 |
| | — |
| | — |
| | 477 |
| | 1,167 |
| | 1,644 |
| | (183 | ) | | 1986 | | 07/17/13 | | 13 to 32 Years |
| | Winchester, KY | | (c) | | 755 |
| | 775 |
| | — |
| | — |
| | 755 |
| | 775 |
| | 1,530 |
| | (63 | ) | | 1981 | | 06/30/15 | | 15 to 30 Years |
| | Winter Park, FL | | (c) | | 992 |
| | 1,021 |
| | — |
| | — |
| | 992 |
| | 1,021 |
| | 2,013 |
| | (170 | ) | | 2004 | | 12/19/13 | | 15 to 40 Years |
| | Wiscasset, ME | | (c) | | 1,305 |
| | 538 |
| | — |
| | — |
| | 1,305 |
| | 538 |
| | 1,843 |
| | (160 | ) | | 1992 | | 01/24/14 | | 14 to 30 Years |
| | Woodburn, OR | | (c) | | 942 |
| | 616 |
| | — |
| | — |
| | 942 |
| | 616 |
| | 1,558 |
| | (107 | ) | | 1985 | | 10/28/14 | | 15 to 30 Years |
| | Wyoming, MI | | (c) | | 314 |
| | 448 |
| | — |
| | — |
| | 314 |
| | 448 |
| | 762 |
| | (14 | ) | | 1958 | | 05/19/16 | | 17 to 30 Years |
|
| | | | | | | | | | | | | | | | | | | | | | | | | | | | | | | | | |
| Diagnostic Health Centers of Texas | Beaumont, TX | | (a) | | 438 |
| | 1,976 |
| | — |
| | — |
| | 438 |
| | 1,976 |
| | 2,414 |
| | (303 | ) | | 1985 | | 03/31/14 | | 15 to 30 Years |
| Diagnostic Health Centers of Texas | Port Arthur, TX | | (a) | | 468 |
| | 2,057 |
| | — |
| | — |
| | 468 |
| | 2,057 |
| | 2,525 |
| | (313 | ) | | 1997 | | 03/31/14 | | 15 to 30 Years |
| Dillon Tire | Lincoln, NE | | (a) | | 1,319 |
| | 1,604 |
| | — |
| | — |
| | 1,319 |
| | 1,604 |
| | 2,923 |
| | (864 | ) | | 1972 | | 04/29/11 | | 11 to 26 Years |
| Dollar General | Crossville, TN | | (d) | | 1,041 |
| | 1,871 |
| | — |
| | — |
| | 1,041 |
| | 1,871 |
| | 2,912 |
| | (390 | ) | | 2006 | | 07/17/13 | | 7 to 40 Years |
| Dollar General | Ardmore, TN | | (d) | | 950 |
| | 1,847 |
| | — |
| | — |
| | 950 |
| | 1,847 |
| | 2,797 |
| | (392 | ) | | 2005 | | 07/17/13 | | 8 to 40 Years |
| Dollar General | Livingston, TN | | (d) | | 1,073 |
| | 1,889 |
| | — |
| | — |
| | 1,073 |
| | 1,889 |
| | 2,962 |
| | (430 | ) | | 2006 | | 07/17/13 | | 7 to 40 Years |
| Dollar General | Wetumpka, AL | | (c) | | 303 |
| | 784 |
| | — |
| | — |
| | 303 |
| | 784 |
| | 1,087 |
| | (114 | ) | | 2011 | | 09/17/13 | | 12 to 40 Years |
| Dollar General | Orrville, AL | | (c) | | 192 |
| | 826 |
| | — |
| | — |
| | 192 |
| | 826 |
| | 1,018 |
| | (124 | ) | | 2011 | | 09/17/13 | | 12 to 40 Years |
| Dollar General | Rehobeth, AL | | (c) | | 259 |
| | 774 |
| | — |
| | — |
| | 259 |
| | 774 |
| | 1,033 |
| | (107 | ) | | 2011 | | 09/17/13 | | 12 to 40 Years |
| Dollar General | Tallassee, AL | | (c) | | 141 |
| | 895 |
| | — |
| | — |
| | 141 |
| | 895 |
| | 1,036 |
| | (114 | ) | | 2011 | | 09/17/13 | | 12 to 40 Years |
| Dollar General | Jasper, AL | | (c) | | 365 |
| | 1,052 |
| | — |
| | — |
| | 365 |
| | 1,052 |
| | 1,417 |
| | (144 | ) | | 2011 | | 09/17/13 | | 12 to 40 Years |
| Dollar General | Cowarts, AL | | (c) | | 396 |
| | 836 |
| | — |
| | — |
| | 396 |
| | 836 |
| | 1,232 |
| | (117 | ) | | 2011 | | 09/17/13 | | 12 to 40 Years |
| Dollar General | Centre, AL | | (c) | | 233 |
| | 767 |
| | — |
| | — |
| | 233 |
| | 767 |
| | 1,000 |
| | (109 | ) | | 2011 | | 09/17/13 | | 12 to 40 Years |
| Dollar General | Crossville, TN | | (c) | | 264 |
| | 849 |
| | — |
| | — |
| | 264 |
| | 849 |
| | 1,113 |
| | (118 | ) | | 2011 | | 09/17/13 | | 12 to 40 Years |
| Dollar General | Eastaboga, AL | | (c) | | 223 |
| | 937 |
| | — |
| | — |
| | 223 |
| | 937 |
| | 1,160 |
| | (127 | ) | | 2011 | | 09/17/13 | | 12 to 40 Years |
| Dollar General | Enterprise, AL | | (c) | | 255 |
| | 803 |
| | — |
| | — |
| | 255 |
| | 803 |
| | 1,058 |
| | (110 | ) | | 2011 | | 09/17/13 | | 12 to 40 Years |
| Dollar General | Tornillo, TX | | (c) | | 255 |
| | 818 |
| | — |
| | — |
| | 255 |
| | 818 |
| | 1,073 |
| | (126 | ) | | 2012 | | 10/29/13 | | 13 to 40 Years |
| Dollar General | Crystal City, TX | | (c) | | 295 |
| | 939 |
| | — |
| | — |
| | 295 |
| | 939 |
| | 1,234 |
| | (122 | ) | | 2012 | | 10/29/13 | | 13 to 40 Years |
| Dollar General | Temple, TX | | (c) | | 414 |
| | 897 |
| | — |
| | — |
| | 414 |
| | 897 |
| | 1,311 |
| | (128 | ) | | 2012 | | 10/29/13 | | 13 to 40 Years |
| Dollar General | Fruita, CO | | (c) | | 255 |
| | 1,025 |
| | — |
| | — |
| | 255 |
| | 1,025 |
| | 1,280 |
| | (139 | ) | | 2012 | | 10/29/13 | | 13 to 40 Years |
| Dollar General | De Soto, KS | | (c) | | 301 |
| | 1,049 |
| | — |
| | — |
| | 301 |
| | 1,049 |
| | 1,350 |
| | (161 | ) | | 2012 | | 10/29/13 | | 13 to 40 Years |
| Dollar General | La Cygne, KS | | (c) | | 120 |
| | 833 |
| | — |
| | — |
| | 120 |
| | 833 |
| | 953 |
| | (113 | ) | | 2012 | | 10/29/13 | | 13 to 40 Years |
| Dollar General | Topeka, KS | | (c) | | 313 |
| | 882 |
| | — |
| | — |
| | 313 |
| | 882 |
| | 1,195 |
| | (130 | ) | | 2012 | | 10/29/13 | | 13 to 40 Years |
| Dollar General | Emporia, KS | | (c) | | 292 |
| | 1,176 |
| | — |
| | — |
| | 292 |
| | 1,176 |
| | 1,468 |
| | (163 | ) | | 2012 | | 10/29/13 | | 13 to 40 Years |
| Dollar General | Hill City, KS | | (c) | | 243 |
| | 815 |
| | — |
| | — |
| | 243 |
| | 815 |
| | 1,058 |
| | (129 | ) | | 2012 | | 10/29/13 | | 13 to 40 Years |
| Dollar General | Pagosa Springs, CO | | (c) | | 253 |
| | 1,031 |
| | — |
| | — |
| | 253 |
| | 1,031 |
| | 1,284 |
| | (134 | ) | | 2012 | | 10/29/13 | | 13 to 40 Years |
| Dollar General | Silt, CO | | (c) | | 334 |
| | 894 |
| | — |
| | — |
| | 334 |
| | 894 |
| | 1,228 |
| | (117 | ) | | 2012 | | 10/29/13 | | 13 to 40 Years |
| Dollar General | Gore, OK | | (c) | | 182 |
| | 924 |
| | — |
| | — |
| | 182 |
| | 924 |
| | 1,106 |
| | (128 | ) | | 2012 | | 10/29/13 | | 13 to 40 Years |
| Dollar General | Stigler, OK | | (c) | | 610 |
| | 809 |
| | — |
| | — |
| | 610 |
| | 809 |
| | 1,419 |
| | (131 | ) | | 2012 | | 10/29/13 | | 13 to 40 Years |
| Dollar General | Okay, OK | | (c) | | 200 |
| | 901 |
| | — |
| | — |
| | 200 |
| | 901 |
| | 1,101 |
| | (123 | ) | | 2012 | | 10/29/13 | | 13 to 40 Years |
SPIRIT REALTY CAPITAL, INC.
Schedule III Real Estate and
Accumulated Depreciation
(Amounts in thousands)
|
| | | | | | | | | | | | | | | | | | | | | | | | | |
| | | | | | Initial Cost to Company | | Cost Capitalized Subsequent to Acquisition including impairment | | Gross Amount at December 31, 2016 (d) 2017 (g) | | | | | | | | |
| Concept | City, State | | Encumbrances (e) | | Land and Improvements | | Buildings and Improvements | | Land and Improvements | | Buildings and Improvements | | Land and Improvements | | Buildings and Improvements | | Total | | Final Accumulated Depreciation | | Date of Construction | | Date Acquired | | Life in which depreciation in latest Statement of Operations is computed |
Description | | Encumbrances (e)
| | Land and
Improvements
| | Buildings and
Improvements
| | Improvements/
Land
| | Improvements/
building
| | Land and
Improvements
| | Buildings and
Improvements
| | Total | | Final
Accum
| | Date of
Construction
| | Date
Acquired
| |
|
| | | | | | | | | | | | | | | | | | | | | | | | | | | | | | | | | |
| | Yakima, WA | | (c) | | 462 |
| | 317 |
| | — |
| | — |
| | 462 |
| | 317 |
| | 779 |
| | (46 | ) | | 1989 | | 10/28/14 | | 15 to 30 Years |
| | Yarmouth, ME | | (c) | | 950 |
| | 278 |
| | — |
| | — |
| | 950 |
| | 278 |
| | 1,228 |
| | (78 | ) | | 1990 | | 01/24/14 | | 14 to 40 Years |
| | Yellville, AR | | (c) | | 269 |
| | 740 |
| | — |
| | — |
| | 269 |
| | 740 |
| | 1,009 |
| | (10 | ) | | 1984 | | 09/30/16 | | 13 to 30 Years |
| | Zeeland, MI | | (c) | | 213 |
| | 426 |
| | — |
| | — |
| | 213 |
| | 426 |
| | 639 |
| | (13 | ) | | 1989 | | 05/19/16 | | 17 to 30 Years |
|
| | | | | | | | | | | | | | | | | | | | | | | | | | | | | | | | | |
| Dollar General | Hobart, OK | | (c) | | 230 |
| | 910 |
| | — |
| | — |
| | 230 |
| | 910 |
| | 1,140 |
| | (130 | ) | | 2012 | | 10/29/13 | | 13 to 40 Years |
| Dollar General | Atoka, OK | | (c) | | 466 |
| | 1,304 |
| | — |
| | — |
| | 466 |
| | 1,304 |
| | 1,770 |
| | (171 | ) | | 2012 | | 10/29/13 | | 13 to 40 Years |
| Dollar General | Claremore, OK | | (c) | | 243 |
| | 928 |
| | — |
| | — |
| | 243 |
| | 928 |
| | 1,171 |
| | (121 | ) | | 2012 | | 10/29/13 | | 13 to 40 Years |
| Dollar General | Adair, OK | | (c) | | 264 |
| | 855 |
| | — |
| | — |
| | 264 |
| | 855 |
| | 1,119 |
| | (116 | ) | | 2012 | | 10/29/13 | | 13 to 40 Years |
| Dollar General | Altus, OK | | (c) | | 315 |
| | 918 |
| | — |
| | — |
| | 315 |
| | 918 |
| | 1,233 |
| | (119 | ) | | 2012 | | 10/29/13 | | 13 to 40 Years |
| Dollar General | Ketchum, OK | | (c) | | 297 |
| | 760 |
| | — |
| | — |
| | 297 |
| | 760 |
| | 1,057 |
| | (126 | ) | | 2012 | | 10/29/13 | | 13 to 40 Years |
| Dollar General | Spiro, OK | | (c) | | 263 |
| | 1,099 |
| | — |
| | — |
| | 263 |
| | 1,099 |
| | 1,362 |
| | (164 | ) | | 2012 | | 10/29/13 | | 13 to 40 Years |
| Dollar General | Walters, OK | | (c) | | 173 |
| | 1,042 |
| | — |
| | — |
| | 173 |
| | 1,042 |
| | 1,215 |
| | (139 | ) | | 2012 | | 10/29/13 | | 13 to 40 Years |
| Dollar General | Sand Springs, OK | | (c) | | 396 |
| | 1,039 |
| | — |
| | — |
| | 396 |
| | 1,039 |
| | 1,435 |
| | (144 | ) | | 2012 | | 10/29/13 | | 13 to 40 Years |
| Dollar General | Ord, NE | | (c) | | 222 |
| | 1,010 |
| | — |
| | — |
| | 222 |
| | 1,010 |
| | 1,232 |
| | (140 | ) | | 2012 | | 10/29/13 | | 13 to 40 Years |
| Dollar General | Las Cruces, NM | | (c) | | 452 |
| | 900 |
| | — |
| | — |
| | 452 |
| | 900 |
| | 1,352 |
| | (137 | ) | | 2012 | | 10/29/13 | | 13 to 40 Years |
| Dollar General | Hobbs, NM | | (c) | | 405 |
| | 949 |
| | — |
| | — |
| | 405 |
| | 949 |
| | 1,354 |
| | (148 | ) | | 2012 | | 10/29/13 | | 13 to 40 Years |
| Dollar General | Western Grove, AR | | (d) | | 391 |
| | 595 |
| | — |
| | — |
| | 391 |
| | 595 |
| | 986 |
| | (92 | ) | | 2014 | | 12/15/14 | | 14 to 40 Years |
| Dollar General | Quinton, OK | | (d) | | 245 |
| | 683 |
| | — |
| | — |
| | 245 |
| | 683 |
| | 928 |
| | (77 | ) | | 2014 | | 12/15/14 | | 14 to 40 Years |
| Dollar General | Alpena, AR | | (d) | | 359 |
| | 600 |
| | — |
| | — |
| | 359 |
| | 600 |
| | 959 |
| | (91 | ) | | 2014 | | 12/15/14 | | 14 to 40 Years |
| Dollar General | Keota, OK | | (d) | | 215 |
| | 687 |
| | — |
| | — |
| | 215 |
| | 687 |
| | 902 |
| | (81 | ) | | 2014 | | 12/15/14 | | 14 to 40 Years |
| Dollar General | Cameron, OK | | (d) | | 312 |
| | 710 |
| | — |
| | — |
| | 312 |
| | 710 |
| | 1,022 |
| | (77 | ) | | 2014 | | 12/15/14 | | 14 to 40 Years |
| Dollar General | Center Ridge, AR | | (d) | | 313 |
| | 595 |
| | — |
| | — |
| | 313 |
| | 595 |
| | 908 |
| | (90 | ) | | 2014 | | 12/15/14 | | 14 to 40 Years |
| Dollar General | Byng, OK | | (b) | | 205 |
| | 646 |
| | — |
| | — |
| | 205 |
| | 646 |
| | 851 |
| | (62 | ) | | 2015 | | 07/14/15 | | 14 to 40 Years |
| Dollar General | Oppelo, AR | | (a) | | 354 |
| | 553 |
| | — |
| | — |
| | 354 |
| | 553 |
| | 907 |
| | (69 | ) | | 2015 | | 07/14/15 | | 14 to 40 Years |
| Dollar General | Red Oak, OK | | (a) | | 245 |
| | 675 |
| | — |
| | — |
| | 245 |
| | 675 |
| | 920 |
| | (62 | ) | | 2015 | | 07/14/15 | | 14 to 40 Years |
| Dollar General | La Plata, MO | | (d) | | 283 |
| | 653 |
| | — |
| | — |
| | 283 |
| | 653 |
| | 936 |
| | (82 | ) | | 2014 | | 04/27/15 | | 14 to 40 Years |
| Dollar General | Birch Tree, MO | | (d) | | 252 |
| | 659 |
| | — |
| | — |
| | 252 |
| | 659 |
| | 911 |
| | (86 | ) | | 2014 | | 03/31/15 | | 14 to 40 Years |
| Dollar General | Pineville, MO | | (d) | | 253 |
| | 699 |
| | — |
| | — |
| | 253 |
| | 699 |
| | 952 |
| | (91 | ) | | 2014 | | 03/31/15 | | 14 to 40 Years |
| Dollar General | Aztec, NM | | (d) | | 548 |
| | 623 |
| | — |
| | — |
| | 548 |
| | 623 |
| | 1,171 |
| | (84 | ) | | 2014 | | 03/31/15 | | 14 to 40 Years |
| Dollar General | Creal Springs, IL | | (d) | | 261 |
| | 653 |
| | — |
| | — |
| | 261 |
| | 653 |
| | 914 |
| | (81 | ) | | 2014 | | 04/27/15 | | 14 to 40 Years |
| Dollar General | Lakeview, IA | | (d) | | 251 |
| | 568 |
| | — |
| | — |
| | 251 |
| | 568 |
| | 819 |
| | (67 | ) | | 2015 | | 04/27/15 | | 14 to 40 Years |
| Dollar General | Pleasant Hope, MO | | (d) | | 263 |
| | 650 |
| | — |
| | — |
| | 263 |
| | 650 |
| | 913 |
| | (78 | ) | | 2014 | | 05/14/15 | | 14 to 40 Years |
| Dollar General | Los Lunas, NM | | (d) | | 281 |
| | 740 |
| | — |
| | — |
| | 281 |
| | 740 |
| | 1,021 |
| | (92 | ) | | 2015 | | 05/14/15 | | 14 to 40 Years |
| Dollar General | Bloomfield, NM | | (d) | | 409 |
| | 663 |
| | — |
| | — |
| | 409 |
| | 663 |
| | 1,072 |
| | (74 | ) | | 2015 | | 05/14/15 | | 14 to 40 Years |
| Dollar General | Drexel, MO | | (d) | | 184 |
| | 727 |
| | — |
| | — |
| | 184 |
| | 727 |
| | 911 |
| | (78 | ) | | 2015 | | 05/14/15 | | 14 to 40 Years |
| Dollar General | Bentonia, MS | | (b) | | 227 |
| | 745 |
| | — |
| | — |
| | 227 |
| | 745 |
| | 972 |
| | (71 | ) | | 2014 | | 06/22/15 | | 13 to 40 Years |
SPIRIT REALTY CAPITAL, INC.
Schedule III Real Estate and
Accumulated Depreciation
(Amounts in thousands)
|
| | | | | | | | | | | | | | | | | | | | | | | | | | | | | | | | | |
| Grocery | | | | | | | | | | | | | | | | | | | | | | |
| | Abilene, TX | | (a) | | 1,586 |
| | 2,230 |
| | — |
| | — |
| | 1,586 |
| | 2,230 |
| | 3,816 |
| | (549 | ) | | 1979 | | 03/27/13 | | 6 to 20 Years |
| | Alto, TX | | (a) | | 204 |
| | 464 |
| | — |
| | — |
| | 204 |
| | 464 |
| | 668 |
| | (87 | ) | | 1996 | | 03/31/14 | | 7 to 20 Years |
| | Amarillo, TX | | (c) | | 3,559 |
| | 4,575 |
| | — |
| | — |
| | 3,559 |
| | 4,575 |
| | 8,134 |
| | (1,245 | ) | | 1999 | | 05/23/05 | | 14 to 40 Years |
| | Amarillo, TX | | (c) | | 1,828 |
| | 1,292 |
| | — |
| | — |
| | 1,828 |
| | 1,292 |
| | 3,120 |
| | (482 | ) | | 1988 | | 05/23/05 | | 9 to 30 Years |
| | Amarillo, TX | | (c) | | 1,573 |
| | 1,586 |
| | — |
| | — |
| | 1,573 |
| | 1,586 |
| | 3,159 |
| | (589 | ) | | 1989 | | 05/23/05 | | 9 to 30 Years |
| | Amarillo, TX | | (a) | | 1,574 |
| | 1,389 |
| | — |
| | — |
| | 1,574 |
| | 1,389 |
| | 2,963 |
| | (516 | ) | | 1989 | | 05/23/05 | | 9 to 30 Years |
| | Ashland, OH | | (c) | | 2,596 |
| | 8,200 |
| | — |
| | — |
| | 2,596 |
| | 8,200 |
| | 10,796 |
| | (364 | ) | | 2000 | | 10/14/15 | | 15 to 40 Years |
| | Atascadero, CA | | (c) | | 3,677 |
| | 8,920 |
| | — |
| | — |
| | 3,677 |
| | 8,920 |
| | 12,597 |
| | (641 | ) | | 2000 | | 04/06/15 | | 15 to 30 Years |
| | Bald Knob, AR | | (a) | | 328 |
| | 327 |
| | — |
| | — |
| | 328 |
| | 327 |
| | 655 |
| | (102 | ) | | 1971 | | 03/31/14 | | 1 to 15 Years |
| | Bethany, MO | | (c) | | 648 |
| | 379 |
| | — |
| | — |
| | 648 |
| | 379 |
| | 1,027 |
| | (319 | ) | | 1974 | | 05/31/06 | | 15 to 20 Years |
| | Blairsville, GA | | (c) | | 1,652 |
| | 3,102 |
| | — |
| | — |
| | 1,652 |
| | 3,102 |
| | 4,754 |
| | (359 | ) | | 2001 | | 09/30/14 | | 10 to 30 Years |
| | Boise, ID | | (b) | | 1,470 |
| | 2,280 |
| | — |
| | — |
| | 1,470 |
| | 2,280 |
| | 3,750 |
| | (430 | ) | | 1982 | | 12/17/13 | | 4 to 20 Years |
| | Buffalo, TX | | (a) | | 522 |
| | 987 |
| | — |
| | — |
| | 522 |
| | 987 |
| | 1,509 |
| | (130 | ) | | 1990 | | 03/31/14 | | 7 to 30 Years |
| | Burkburnett, TX | | (a) | | 2,030 |
| | 2,706 |
| | — |
| | — |
| | 2,030 |
| | 2,706 |
| | 4,736 |
| | (781 | ) | | 1997 | | 05/23/05 | | 11 to 40 Years |
| | Chattanooga, TN | | (c) | | 1,817 |
| | 5,281 |
| | — |
| | — |
| | 1,817 |
| | 5,281 |
| | 7,098 |
| | (527 | ) | | 1969 | | 09/30/14 | | 10 to 30 Years |
| | Childress, TX | | (c) | | 747 |
| | 934 |
| | — |
| | — |
| | 747 |
| | 934 |
| | 1,681 |
| | (290 | ) | | 1997 | | 05/23/05 | | 7 to 40 Years |
| | Chula Vista, CA | | (c) | | 3,801 |
| | 5,718 |
| | — |
| | — |
| | 3,801 |
| | 5,718 |
| | 9,519 |
| | (405 | ) | | 1986 | | 03/20/15 | | 15 to 30 Years |
| | Cleveland, TX | | (c) | | 465 |
| | 2,867 |
| | — |
| | — |
| | 465 |
| | 2,867 |
| | 3,332 |
| | (1,568 | ) | | 1991 | | 12/01/05 | | 15 to 20 Years |
| | Collierville, TN | | (c) | | 2,217 |
| | 14,205 |
| | — |
| | 8 |
| | 2,217 |
| | 14,213 |
| | 16,430 |
| | (1,669 | ) | | 2002 | | 07/17/13 | | 3 to 45 Years |
| | Corrigan, TX | | (c) | | 395 |
| | 630 |
| | — |
| | — |
| | 395 |
| | 630 |
| | 1,025 |
| | (399 | ) | | 1971 | | 12/01/05 | | 15 to 20 Years |
| | Dallas, TX | | (c) | | 3,975 |
| | — |
| | — |
| | — |
| | 3,975 |
| | — |
| | 3,975 |
| | — |
| | (f) | | 07/17/13 | | (f) |
| | Dayton, TN | | (c) | | 1,122 |
| | 6,767 |
| | — |
| | — |
| | 1,122 |
| | 6,767 |
| | 7,889 |
| | (514 | ) | | 1999 | | 09/30/14 | | 10 to 40 Years |
| | Diboll, TX | | (c) | | 775 |
| | 872 |
| | — |
| | — |
| | 775 |
| | 872 |
| | 1,647 |
| | (566 | ) | | 1974 | | 12/01/05 | | 15 to 20 Years |
| | Dover, OH | | (c) | | 2,596 |
| | 8,087 |
| | — |
| | — |
| | 2,596 |
| | 8,087 |
| | 10,683 |
| | (428 | ) | | 1990 | | 10/14/15 | | 15 to 30 Years |
| | El Cajon, CA | | (c) | | 7,323 |
| | 10,056 |
| | — |
| | — |
| | 7,323 |
| | 10,056 |
| | 17,379 |
| | (751 | ) | | 1997 | | 03/16/15 | | 15 to 30 Years |
| | Eureka, CA | | (c) | | 3,108 |
| | 12,817 |
| | — |
| | — |
| | 3,108 |
| | 12,817 |
| | 15,925 |
| | (1,380 | ) | | 1960 | | 07/17/13 | | 3 to 40 Years |
| | Fort Smith, AR | | (a) | | 837 |
| | 1,831 |
| | — |
| | — |
| | 837 |
| | 1,831 |
| | 2,668 |
| | (289 | ) | | 1994 | | 04/30/14 | | 3 to 20 Years |
| | Groveton, TX | | (a) | | 264 |
| | 540 |
| | — |
| | — |
| | 264 |
| | 540 |
| | 804 |
| | (79 | ) | | 1996 | | 03/31/14 | | 7 to 30 Years |
| | Hallettsville, TX | | (c) | | 550 |
| | 1,545 |
| | — |
| | — |
| | 550 |
| | 1,545 |
| | 2,095 |
| | (214 | ) | | 2004 | | 03/31/14 | | 10 to 30 Years |
| | Hartsville, SC | | (c) | | 696 |
| | 5,402 |
| | — |
| | — |
| | 696 |
| | 5,402 |
| | 6,098 |
| | (423 | ) | | 1988 | | 09/30/14 | | 10 to 40 Years |
| | Indianapolis, IN | | (c) | | 1,640 |
| | 8,063 |
| | — |
| | — |
| | 1,640 |
| | 8,063 |
| | 9,703 |
| | (1,026 | ) | | 1999 | | 07/17/13 | | 7 to 33 Years |
| | LaGrange, GA | | (b) | | 972 |
| | 8,435 |
| | — |
| | — |
| | 972 |
| | 8,435 |
| | 9,407 |
| | (1,345 | ) | | 1998 | | 07/17/13 | | 4 to 25 Years |
|
| | | | | | | | | | | | | | | | | | | | | | | | | |
| | | | | | Initial Cost to Company | | Cost Capitalized Subsequent to Acquisition including impairment | | Gross Amount at December 31, 2016 (d) 2017 (g) | | | | | | | | |
| Concept | City, State | | Encumbrances (e) | | Land and Improvements | | Buildings and Improvements | | Land and Improvements | | Buildings and Improvements | | Land and Improvements | | Buildings and Improvements | | Total | | Final Accumulated Depreciation | | Date of Construction | | Date Acquired | | Life in which depreciation in latest Statement of Operations is computed |
Description | | Encumbrances (e)
| | Land and
Improvements
| | Buildings and
Improvements
| | Improvements/
Land
| | Improvements/
building
| | Land and
Improvements
| | Buildings and
Improvements
| | Total | | Final
Accum
| | Date of
Construction
| | Date
Acquired
| |
|
| | | | | | | | | | | | | | | | | | | | | | | | | | | | | | | | | |
| | Lake Oswego, OR | | (c) | | 4,257 |
| | 5,891 |
| | — |
| | — |
| | 4,257 |
| | 5,891 |
| | 10,148 |
| | (299 | ) | | 1965 | | 03/18/15 | | 15 to 40 Years |
| | Lancaster, CA | | (b) | | 1,569 |
| | 4,271 |
| | — |
| | — |
| | 1,569 |
| | 4,271 |
| | 5,840 |
| | (561 | ) | | 1983 | | 12/17/13 | | 5 to 30 Years |
| | Las Cruces, NM | | (b) | | 1,132 |
| | 2,765 |
| | — |
| | — |
| | 1,132 |
| | 2,765 |
| | 3,897 |
| | (375 | ) | | 1983 | | 12/17/13 | | 5 to 30 Years |
| | Levelland, TX | | (c) | | 1,651 |
| | 2,158 |
| | — |
| | — |
| | 1,651 |
| | 2,158 |
| | 3,809 |
| | (623 | ) | | 1997 | | 05/23/05 | | 11 to 40 Years |
| | Lompoc, CA | | (c) | | 2,743 |
| | 8,316 |
| | — |
| | — |
| | 2,743 |
| | 8,316 |
| | 11,059 |
| | (527 | ) | | 1992 | | 06/15/15 | | 15 to 30 Years |
| | Lorena, TX | | (a) | | 657 |
| | 751 |
| | — |
| | — |
| | 657 |
| | 751 |
| | 1,408 |
| | (132 | ) | | 1999 | | 03/31/14 | | 7 to 20 Years |
| | Lubbock, TX | | (a) | | 1,782 |
| | 2,055 |
| | — |
| | — |
| | 1,782 |
| | 2,055 |
| | 3,837 |
| | (593 | ) | | 1997 | | 05/23/05 | | 11 to 40 Years |
| | Lufkin, TX | | (c) | | 1,178 |
| | 352 |
| | — |
| | — |
| | 1,178 |
| | 352 |
| | 1,530 |
| | (300 | ) | | 1977 | | 12/01/05 | | 15 to 20 Years |
| | McGregor, TX | | (a) | | 748 |
| | 795 |
| | — |
| | — |
| | 748 |
| | 795 |
| | 1,543 |
| | (152 | ) | | 1999 | | 03/31/14 | | 7 to 20 Years |
| | Medina, OH | | (c) | | 4,892 |
| | 10,983 |
| | — |
| | — |
| | 4,892 |
| | 10,983 |
| | 15,875 |
| | (616 | ) | | 1990 | | 10/14/15 | | 15 to 30 Years |
| | Midland, TX | | (b) | | 1,498 |
| | 3,096 |
| | — |
| | — |
| | 1,498 |
| | 3,096 |
| | 4,594 |
| | (573 | ) | | 1983 | | 12/17/13 | | 5 to 20 Years |
| | Missoula, MT | | (c) | | 2,510 |
| | 4,714 |
| | — |
| | — |
| | 2,510 |
| | 4,714 |
| | 7,224 |
| | (346 | ) | | 1999 | | 03/11/15 | | 15 to 30 Years |
| | Missoula, MT | | (c) | | 3,008 |
| | 5,168 |
| | — |
| | — |
| | 3,008 |
| | 5,168 |
| | 8,176 |
| | (366 | ) | | 2008 | | 03/12/15 | | 15 to 30 Years |
| | Muleshoe, TX | | (b) | | 471 |
| | 1,770 |
| | — |
| | — |
| | 471 |
| | 1,770 |
| | 2,241 |
| | (328 | ) | | 1999 | | 08/29/11 | | 15 to 40 Years |
| | Navasota, TX | | (c) | | 781 |
| | 1,499 |
| | — |
| | — |
| | 781 |
| | 1,499 |
| | 2,280 |
| | (635 | ) | | 1992 | | 12/01/05 | | 15 to 30 Years |
| | Omaha, NE | | (b) | | 2,198 |
| | 3,328 |
| | — |
| | — |
| | 2,198 |
| | 3,328 |
| | 5,526 |
| | (683 | ) | | 1982 | | 12/17/13 | | 4 to 20 Years |
| | Palmdale, CA | | (c) | | 3,850 |
| | 9,803 |
| | — |
| | — |
| | 3,850 |
| | 9,803 |
| | 13,653 |
| | (569 | ) | | 2005 | | 03/23/15 | | 15 to 40 Years |
| | Perryton, TX | | (a) | | 1,029 |
| | 597 |
| | — |
| | — |
| | 1,029 |
| | 597 |
| | 1,626 |
| | (212 | ) | | 1997 | | 05/23/05 | | 7 to 40 Years |
| | Plainview, TX | | (c) | | 620 |
| | 5,415 |
| | — |
| | — |
| | 620 |
| | 5,415 |
| | 6,035 |
| | (1,352 | ) | | 2000 | | 08/25/05 | | 14 to 40 Years |
| | Port Angeles, WA | | (c) | | 2,227 |
| | 7,361 |
| | — |
| | — |
| | 2,227 |
| | 7,361 |
| | 9,588 |
| | (549 | ) | | 1995 | | 02/17/15 | | 15 to 30 Years |
| | Rogers, AR | | (a) | | 1,028 |
| | 1,685 |
| | — |
| | — |
| | 1,028 |
| | 1,685 |
| | 2,713 |
| | (257 | ) | | 1994 | | 03/31/14 | | 6 to 20 Years |
| | Silverdale, WA | | (c) | | 3,302 |
| | 5,948 |
| | — |
| | — |
| | 3,302 |
| | 5,948 |
| | 9,250 |
| | (354 | ) | | 1999 | | 03/06/15 | | 15 to 40 Years |
| | Snyder, TX | | (c) | | 2,062 |
| | 2,963 |
| | — |
| | — |
| | 2,062 |
| | 2,963 |
| | 5,025 |
| | (809 | ) | | 1999 | | 05/23/05 | | 14 to 40 Years |
| | St. Paul, MN | | (a) | | 1,262 |
| | 1,016 |
| | — |
| | — |
| | 1,262 |
| | 1,016 |
| | 2,278 |
| | (118 | ) | | 1980 | | 03/31/14 | | 15 to 30 Years |
| | Tigard, OR | | (c) | | 5,515 |
| | 4,279 |
| | — |
| | — |
| | 5,515 |
| | 4,279 |
| | 9,794 |
| | (307 | ) | | 1998 | | 04/01/15 | | 15 to 30 Years |
| | Timpson, TX | | (c) | | 253 |
| | 312 |
| | — |
| | — |
| | 253 |
| | 312 |
| | 565 |
| | (217 | ) | | 1978 | | 12/01/05 | | 15 to 20 Years |
| | Vernon, TX | | (a) | | 1,791 |
| | 2,550 |
| | — |
| | — |
| | 1,791 |
| | 2,550 |
| | 4,341 |
| | (736 | ) | | 1997 | | 05/23/05 | | 11 to 40 Years |
| | Wadsworth, OH | �� | (c) | | 2,197 |
| | 9,285 |
| | — |
| | — |
| | 2,197 |
| | 9,285 |
| | 11,482 |
| | (453 | ) | | 1985 | | 10/14/15 | | 15 to 30 Years |
| | Walla Walla, WA | | (c) | | 1,964 |
| | 8,420 |
| | — |
| | — |
| | 1,964 |
| | 8,420 |
| | 10,384 |
| | (466 | ) | | 1972 | | 03/02/15 | | 15 to 40 Years |
| | Westlake Village, CA | | (c) | | 6,449 |
| | 6,129 |
| | — |
| | — |
| | 6,449 |
| | 6,129 |
| | 12,578 |
| | (407 | ) | | 1998 | | 04/20/15 | | 15 to 30 Years |
| | Wichita Falls, TX | | (c) | | — |
| | 6,259 |
| | — |
| | — |
| | — |
| | 6,259 |
| | 6,259 |
| | (3,116 | ) | | 1997 | | 05/23/05 | | 13 to 20 Years |
| | Wooster, OH | | (c) | | 3,694 |
| | 8,087 |
| | — |
| | — |
| | 3,694 |
| | 8,087 |
| | 11,781 |
| | (437 | ) | | 1980 | | 10/14/15 | | 15 to 30 Years |
|
| | | | | | | | | | | | | | | | | | | | | | | | | | | | | | | | | |
| Dollar General | Laurel, MS | | (a) | | 431 |
| | 705 |
| | — |
| | — |
| | 431 |
| | 705 |
| | 1,136 |
| | (80 | ) | | 2012 | | 06/22/15 | | 11 to 40 Years |
| Dollar General | Maben, MS | | (d) | | 263 |
| | 734 |
| | — |
| | — |
| | 263 |
| | 734 |
| | 997 |
| | (73 | ) | | 2014 | | 09/24/15 | | 13 to 40 Years |
| Dollar Tree | Alliance, OH | | (d) | | 556 |
| | 1,317 |
| | (423 | ) | | (810 | ) | | 133 |
| | 507 |
| | 640 |
| | (19 | ) | | 1996 | | 07/17/13 | | 0 to 27 Years |
| DOW Emergency | Livingston, TX | | (d) | | 1,505 |
| | 7,616 |
| | — |
| | 1,032 |
| | 1,505 |
| | 8,648 |
| | 10,153 |
| | (381 | ) | | 2014 | | 03/30/16 | | 16 to 40 Years |
| Drive Time | Independence, MO | | (d) | | 1,058 |
| | 1,297 |
| | — |
| | — |
| | 1,058 |
| | 1,297 |
| | 2,355 |
| | (475 | ) | | 1968 | | 11/25/14 | | 4 to 15 Years |
| Drive Time | Gladstone, MO | | (d) | | 1,100 |
| | 774 |
| | — |
| | — |
| | 1,100 |
| | 774 |
| | 1,874 |
| | (141 | ) | | 2005 | | 03/11/15 | | 4 to 40 Years |
| Eddie Merlot's | Burr Ridge, IL | | (a) | | 759 |
| | 977 |
| | 16 |
| | 1,584 |
| | 775 |
| | 2,561 |
| | 3,336 |
| | (1,186 | ) | | 1997 | | 06/25/04 | | 15 to 30 Years |
| Eddie Merlot's | Fort Wayne, IN | | (a) | | 989 |
| | 2,057 |
| | — |
| | — |
| | 989 |
| | 2,057 |
| | 3,046 |
| | (820 | ) | | 2001 | | 11/10/05 | | 15 to 30 Years |
| Eddie Merlot's | Indianapolis, IN | | (a) | | 1,971 |
| | 2,295 |
| | — |
| | — |
| | 1,971 |
| | 2,295 |
| | 4,266 |
| | (714 | ) | | 2003 | | 11/10/05 | | 15 to 40 Years |
| El Chico | Sherman, TX | | (a) | | 1,013 |
| | 1,286 |
| | (415 | ) | | (542 | ) | | 598 |
| | 744 |
| | 1,342 |
| | (782 | ) | | 1994 | | 02/26/07 | | 14 to 30 Years |
| El Chico | Muskogee, OK | | (a) | | 968 |
| | 1,259 |
| | (448 | ) | | (568 | ) | | 520 |
| | 691 |
| | 1,211 |
| | (709 | ) | | 1984 | | 02/26/07 | | 14 to 30 Years |
| El Chico | Ardmore, OK | | (a) | | 1,332 |
| | 1,466 |
| | (704 | ) | | (677 | ) | | 628 |
| | 789 |
| | 1,417 |
| | (747 | ) | | 1986 | | 02/26/07 | | 14 to 30 Years |
| El Chico | Arlington, TX | | (a) | | 1,301 |
| | 1,032 |
| | — |
| | — |
| | 1,301 |
| | 1,032 |
| | 2,333 |
| | (794 | ) | | 1978 | | 02/26/07 | | 14 to 20 Years |
| El Chico | Little Rock, AR | | (a) | | 699 |
| | 1,700 |
| | (344 | ) | | (592 | ) | | 355 |
| | 1,108 |
| | 1,463 |
| | (952 | ) | | 1972 | | 02/26/07 | | 14 to 20 Years |
| Emagine Theaters | Lakeville, MN | | (d) | | 2,843 |
| | 2,843 |
| | (419 | ) | | 3,070 |
| | 2,424 |
| | 5,913 |
| | 8,337 |
| | (310 | ) | | 1998 | | 07/29/16 | | 7 to 30 Years |
|
| | | | | | | | | | | | | | | | | | | | | | | | | | | | | | | | | |
| Drug Stores / Pharmacies | | | | | | | | | | | | | | | | | | | | | | |
| | Albany, GA | | (c) | | 961 |
| | 3,314 |
| | — |
| | — |
| | 961 |
| | 3,314 |
| | 4,275 |
| | (342 | ) | | 2008 | | 7/17/2013 | | 12 to 43 Years |
| | Alliance, OH | | (c) | | 556 |
| | 1,317 |
| | — |
| | — |
| | 556 |
| | 1,317 |
| | 1,873 |
| | (274 | ) | | 1996 | | 7/17/2013 | | 3 to 31 Years |
| | Alpharetta, GA | | (b) | | 968 |
| | 2,614 |
| | — |
| | — |
| | 968 |
| | 2,614 |
| | 3,582 |
| | (300 | ) | | 1998 | | 7/17/2013 | | 5 to 40 Years |
| | Amarillo, TX | | (c) | | 916 |
| | 2,747 |
| | — |
| | — |
| | 916 |
| | 2,747 |
| | 3,663 |
| | (275 | ) | | 1994 | | 7/17/2013 | | 20 to 20 Years |
|
| | | | | | | | | | | | | | | | | | | | | | | | | | | | | | | | | |
| Emagine Theaters | Rogers, MN | | (d) | | 2,337 |
| | 2,384 |
| | — |
| | 1,983 |
| | 2,337 |
| | 4,367 |
| | 6,704 |
| | (285 | ) | | 2006 | | 07/29/16 | | 5 to 30 Years |
| Emagine Theaters | White Bear Township, MN | | (d) | | 2,773 |
| | 5,476 |
| | — |
| | 107 |
| | 2,773 |
| | 5,583 |
| | 8,356 |
| | (521 | ) | | 1995 | | 07/29/16 | | 5 to 20 Years |
| Emagine Theaters | Monticello, MN | | (d) | | 1,161 |
| | 3,155 |
| | — |
| | — |
| | 1,161 |
| | 3,155 |
| | 4,316 |
| | (272 | ) | | 2004 | | 07/29/16 | | 7 to 30 Years |
| Emagine Theaters | Plymouth, MN | | (d) | | 2,516 |
| | 4,089 |
| | — |
| | 2,450 |
| | 2,516 |
| | 6,539 |
| | 9,055 |
| | (306 | ) | | 1988 | | 07/29/16 | | 4 to 30 Years |
| Emagine Theaters | Waconia, MN | | (d) | | 249 |
| | 1,464 |
| | — |
| | — |
| | 249 |
| | 1,464 |
| | 1,713 |
| | (106 | ) | | 1989 | | 07/29/16 | | 6 to 20 Years |
| Emagine Theaters | East Bethel, MN | | (d) | | 545 |
| | 1,768 |
| | — |
| | — |
| | 545 |
| | 1,768 |
| | 2,313 |
| | (191 | ) | | 1990 | | 07/29/16 | | 5 to 20 Years |
| Emagine Theaters | Delano, MN | | (d) | | 397 |
| | 1,052 |
| | — |
| | — |
| | 397 |
| | 1,052 |
| | 1,449 |
| | (122 | ) | | 1984 | | 07/29/16 | | 3 to 20 Years |
| Emerus Urgent Care | Schertz, TX | | (a) | | 2,596 |
| | 9,944 |
| | — |
| | — |
| | 2,596 |
| | 9,944 |
| | 12,540 |
| | (1,067 | ) | | 2013 | | 05/16/14 | | 13 to 40 Years |
| Excellence ER | Garland, TX | | (d) | | 1,256 |
| | 4,516 |
| | — |
| | — |
| | 1,256 |
| | 4,516 |
| | 5,772 |
| | (203 | ) | | 2016 | | 03/30/16 | | 17 to 50 Years |
| Excellence ER | Harlingen, TX | | (d) | | 1,734 |
| | 520 |
| | — |
| | 5,616 |
| | 1,734 |
| | 6,136 |
| | 7,870 |
| | (122 | ) | | 2016 | | 12/01/16 | | 49 to 50 Years |
| Express Oil Change | Birmingham, AL | | (a) | | 417 |
| | 1,237 |
| | — |
| | — |
| | 417 |
| | 1,237 |
| | 1,654 |
| | (322 | ) | | 1970 | | 12/22/06 | | 40 to 40 Years |
| Express Oil Change | Birmingham, AL | | (a) | | 300 |
| | 839 |
| | — |
| | — |
| | 300 |
| | 839 |
| | 1,139 |
| | (175 | ) | | 1998 | | 12/22/06 | | 50 to 50 Years |
| Express Oil Change | Alabaster, AL | | (a) | | 631 |
| | 1,010 |
| | — |
| | — |
| | 631 |
| | 1,010 |
| | 1,641 |
| | (263 | ) | | 1995 | | 12/22/06 | | 40 to 40 Years |
SPIRIT REALTY CAPITAL, INC.
Schedule III Real Estate and
Accumulated Depreciation
(Amounts in thousands)
|
| | | | | | | | | | | | | | | | | | | | | | | | | |
| | | | | | Initial Cost to Company | | Cost Capitalized Subsequent to Acquisition including impairment | | Gross Amount at December 31, 2016 (d) 2017 (g) | | | | | | | | |
| Concept | City, State | | Encumbrances (e) | | Land and Improvements | | Buildings and Improvements | | Land and Improvements | | Buildings and Improvements | | Land and Improvements | | Buildings and Improvements | | Total | | Final Accumulated Depreciation | | Date of Construction | | Date Acquired | | Life in which depreciation in latest Statement of Operations is computed |
Description | | Encumbrances (e)
| | Land and
Improvements
| | Buildings and
Improvements
| | Improvements/
Land
| | Improvements/
building
| | Land and
Improvements
| | Buildings and
Improvements
| | Total | | Final
Accum
| | Date of
Construction
| | Date
Acquired
| |
|
| | | | | | | | | | | | | | | | | | | | | | | | | | | | | | | | | |
| | Atlanta, GA | | (b) | | 1,316 |
| | 2,266 |
| | — |
| | — |
| | 1,316 |
| | 2,266 |
| | 3,582 |
| | (277 | ) | | 2006 | | 7/17/2013 | | 14 to 42 Years |
| | Austin, MN | | (c) | | 485 |
| | 3,606 |
| | — |
| | — |
| | 485 |
| | 3,606 |
| | 4,091 |
| | (369 | ) | | 2004 | | 7/17/2013 | | 11 to 42 Years |
| | Azle, TX | | (b) | | 1,213 |
| | 3,504 |
| | — |
| | — |
| | 1,213 |
| | 3,504 |
| | 4,717 |
| | (340 | ) | | 2008 | | 7/17/2013 | | 15 to 43 Years |
| | Batesville, MS | | (b) | | 421 |
| | 3,932 |
| | — |
| | — |
| | 421 |
| | 3,932 |
| | 4,353 |
| | (371 | ) | | 2007 | | 7/17/2013 | | 10 to 42 Years |
| | Brentwood, TN | | (c) | | 2,933 |
| | 2,584 |
| | — |
| | — |
| | 2,933 |
| | 2,584 |
| | 5,517 |
| | (507 | ) | | 2006 | | 7/17/2013 | | 11 to 38 Years |
| | Bridgetown, OH | | (c) | | 1,015 |
| | 3,769 |
| | — |
| | — |
| | 1,015 |
| | 3,769 |
| | 4,784 |
| | (389 | ) | | 1999 | | 7/17/2013 | | 5 to 43 Years |
| | Bryan, TX | | (c) | | 1,049 |
| | 5,633 |
| | — |
| | — |
| | 1,049 |
| | 5,633 |
| | 6,682 |
| | (544 | ) | | 2001 | | 7/17/2013 | | 6 to 40 Years |
| | Buffalo, NY | | (a) | | 681 |
| | 925 |
| | — |
| | — |
| | 681 |
| | 925 |
| | 1,606 |
| | (260 | ) | | 1993 | | 7/1/2005 | | 19 to 40 Years |
| | Canton, IL | | (c) | | 703 |
| | 4,098 |
| | — |
| | — |
| | 703 |
| | 4,098 |
| | 4,801 |
| | (414 | ) | | 2006 | | 7/17/2013 | | 12 to 43 Years |
| | Carrolton, TX | | (c) | | 945 |
| | 1,967 |
| | — |
| | — |
| | 945 |
| | 1,967 |
| | 2,912 |
| | (219 | ) | | 1995 | | 7/17/2013 | | 1 to 39 Years |
| | Cincinnati, OH | | (b) | | 1,527 |
| | 4,307 |
| | — |
| | — |
| | 1,527 |
| | 4,307 |
| | 5,834 |
| | (442 | ) | | 2000 | | 7/17/2013 | | 7 to 42 Years |
| | Cleveland, OH | | (c) | | 776 |
| | 1,158 |
| | — |
| | — |
| | 776 |
| | 1,158 |
| | 1,934 |
| | (185 | ) | | 1998 | | 7/17/2013 | | 5 to 30 Years |
| | Clinton, NY | | (c) | | 1,050 |
| | 2,090 |
| | — |
| | — |
| | 1,050 |
| | 2,090 |
| | 3,140 |
| | (269 | ) | | 2005 | | 7/17/2013 | | 11 to 42 Years |
| | Columbia, MO | | (b) | | 1,047 |
| | 5,242 |
| | — |
| | — |
| | 1,047 |
| | 5,242 |
| | 6,289 |
| | (466 | ) | | 2002 | | 7/17/2013 | | 9 to 44 Years |
| | Columbia, TN | | (c) | | 842 |
| | 1,864 |
| | — |
| | — |
| | 842 |
| | 1,864 |
| | 2,706 |
| | (235 | ) | | 1997 | | 7/17/2013 | | 4 to 37 Years |
| | Columbia, TN | | (c) | | 1,109 |
| | 1,683 |
| | — |
| | — |
| | 1,109 |
| | 1,683 |
| | 2,792 |
| | (220 | ) | | 1997 | | 7/17/2013 | | 4 to 41 Years |
| | Columbus, MS | | (b) | | 769 |
| | 3,475 |
| | — |
| | — |
| | 769 |
| | 3,475 |
| | 4,244 |
| | (343 | ) | | 2004 | | 7/17/2013 | | 11 to 41 Years |
| | Crossville, TN | | (b) | | 1,890 |
| | 3,680 |
| | — |
| | — |
| | 1,890 |
| | 3,680 |
| | 5,570 |
| | (385 | ) | | 2001 | | 7/17/2013 | | 7 to 41 Years |
| | Dallas, TX | | (c) | | 735 |
| | 3,328 |
| | — |
| | — |
| | 735 |
| | 3,328 |
| | 4,063 |
| | (342 | ) | | 1996 | | 7/17/2013 | | 3 to 40 Years |
| | Defiance, OH | | (c) | | 645 |
| | 2,452 |
| | — |
| | — |
| | 645 |
| | 2,452 |
| | 3,097 |
| | (315 | ) | | 2005 | | 7/17/2013 | | 11 to 38 Years |
| | DeSoto, TX | | (b) | | 1,007 |
| | 2,313 |
| | — |
| | — |
| | 1,007 |
| | 2,313 |
| | 3,320 |
| | (280 | ) | | 1997 | | 7/17/2013 | | 5 to 40 Years |
| | Easton, PA | | (c) | | 1,028 |
| | 3,996 |
| | — |
| | — |
| | 1,028 |
| | 3,996 |
| | 5,024 |
| | (449 | ) | | 2006 | | 7/17/2013 | | 12 to 41 Years |
| | Elmira, NY | | (c) | | 1,066 |
| | 4,230 |
| | — |
| | — |
| | 1,066 |
| | 4,230 |
| | 5,296 |
| | (435 | ) | | 2007 | | 7/17/2013 | | 12 to 43 Years |
| | Enterprise, AL | | (c) | | 1,163 |
| | 1,612 |
| | — |
| | — |
| | 1,163 |
| | 1,612 |
| | 2,775 |
| | (238 | ) | | 2006 | | 7/17/2013 | | 11 to 37 Years |
| | Evansville, IN | | (b) | | 1,249 |
| | 3,924 |
| | — |
| | — |
| | 1,249 |
| | 3,924 |
| | 5,173 |
| | (409 | ) | | 2007 | | 7/17/2013 | | 12 to 44 Years |
| | Florence, SC | | (b) | | 744 |
| | 2,070 |
| | — |
| | — |
| | 744 |
| | 2,070 |
| | 2,814 |
| | (237 | ) | | 1998 | | 7/17/2013 | | 5 to 39 Years |
| | Fort Worth, TX | | (b) | | 1,601 |
| | 1,894 |
| | — |
| | — |
| | 1,601 |
| | 1,894 |
| | 3,495 |
| | (246 | ) | | 1999 | | 7/17/2013 | | 6 to 39 Years |
| | Fredericksburg, VA | | (c) | | 1,426 |
| | 2,077 |
| | — |
| | — |
| | 1,426 |
| | 2,077 |
| | 3,503 |
| | (280 | ) | | 2006 | | 7/17/2013 | | 14 to 37 Years |
| | Fremont, OH | | (c) | | 504 |
| | 1,405 |
| | — |
| | — |
| | 504 |
| | 1,405 |
| | 1,909 |
| | (218 | ) | | 1998 | | 7/17/2013 | | 4 to 31 Years |
| | Gainesville, FL | | (c) | | 922 |
| | 2,705 |
| | — |
| | — |
| | 922 |
| | 2,705 |
| | 3,627 |
| | (295 | ) | | 1998 | | 7/17/2013 | | 4 to 40 Years |
| | Glassport, PA | | (c) | | 550 |
| | 2,471 |
| | — |
| | — |
| | 550 |
| | 2,471 |
| | 3,021 |
| | (325 | ) | | 2006 | | 7/17/2013 | | 11 to 37 Years |
| | Glenville Scotia, NY | | (c) | | 1,314 |
| | 3,964 |
| | — |
| | — |
| | 1,314 |
| | 3,964 |
| | 5,278 |
| | (431 | ) | | 2006 | | 7/17/2013 | | 12 to 43 Years |
| | Gulfport, MS | | (c) | | 441 |
| | 4,208 |
| | — |
| | — |
| | 441 |
| | 4,208 |
| | 4,649 |
| | (417 | ) | | 2000 | | 7/17/2013 | | 12 to 40 Years |
| | Hamilton, OH | | (c) | | 738 |
| | 2,429 |
| | — |
| | — |
| | 738 |
| | 2,429 |
| | 3,167 |
| | (288 | ) | | 1998 | | 7/17/2013 | | 5 to 39 Years |
| | Harriman, TN | | (c) | | 1,951 |
| | 3,250 |
| | — |
| | — |
| | 1,951 |
| | 3,250 |
| | 5,201 |
| | (368 | ) | | 2007 | | 7/17/2013 | | 12 to 43 Years |
| | Houston, TX | | (c) | | 1,079 |
| | 3,582 |
| | — |
| | — |
| | 1,079 |
| | 3,582 |
| | 4,661 |
| | (360 | ) | | 2001 | | 7/17/2013 | | 6 to 40 Years |
| | Indianapolis, IN | | (b) | | 860 |
| | 2,754 |
| | — |
| | — |
| | 860 |
| | 2,754 |
| | 3,614 |
| | (328 | ) | | 1998 | | 7/17/2013 | | 10 to 40 Years |
| | Indianapolis, IN | | (b) | | 733 |
| | 2,882 |
| | — |
| | — |
| | 733 |
| | 2,882 |
| | 3,615 |
| | (333 | ) | | 1997 | | 7/17/2013 | | 10 to 38 Years |
| | Jacksonville, FL | | (b) | | 521 |
| | 4,365 |
| | — |
| | — |
| | 521 |
| | 4,365 |
| | 4,886 |
| | (434 | ) | | 2000 | | 7/17/2013 | | 7 to 40 Years |
|
| | | | | | | | | | | | | | | | | | | | | | | | | | | | | | | | | |
| Express Oil Change | Birmingham, AL | | (a) | | 607 |
| | 1,379 |
| | — |
| | — |
| | 607 |
| | 1,379 |
| | 1,986 |
| | (359 | ) | | 1988 | | 12/22/06 | | 40 to 40 Years |
| Express Oil Change | Bessemer, AL | | (a) | | 358 |
| | 1,197 |
| | — |
| | — |
| | 358 |
| | 1,197 |
| | 1,555 |
| | (312 | ) | | 1988 | | 12/22/06 | | 40 to 40 Years |
| Express Oil Change | Birmingham, AL | | (a) | | 343 |
| | 901 |
| | — |
| | — |
| | 343 |
| | 901 |
| | 1,244 |
| | (235 | ) | | 1989 | | 12/22/06 | | 40 to 40 Years |
| Express Oil Change | Gardendale, AL | | (a) | | 586 |
| | 1,274 |
| | — |
| | — |
| | 586 |
| | 1,274 |
| | 1,860 |
| | (332 | ) | | 1989 | | 12/22/06 | | 40 to 40 Years |
| Express Oil Change | Birmingham, AL | | (a) | | 334 |
| | 1,119 |
| | — |
| | — |
| | 334 |
| | 1,119 |
| | 1,453 |
| | (291 | ) | | 1989 | | 12/22/06 | | 40 to 40 Years |
| Express Oil Change | Oxford, AL | | (a) | | 120 |
| | 1,224 |
| | — |
| | — |
| | 120 |
| | 1,224 |
| | 1,344 |
| | (319 | ) | | 1990 | | 12/22/06 | | 40 to 40 Years |
| Express Oil Change | Birmingham, AL | | (a) | | 372 |
| | 1,073 |
| | — |
| | — |
| | 372 |
| | 1,073 |
| | 1,445 |
| | (373 | ) | | 1965 | | 12/22/06 | | 30 to 30 Years |
| Express Oil Change | Birmingham, AL | | (a) | | 339 |
| | 858 |
| | — |
| | — |
| | 339 |
| | 858 |
| | 1,197 |
| | (223 | ) | | 1990 | | 12/22/06 | | 40 to 40 Years |
| Express Oil Change | Huntsville, AL | | (a) | | 195 |
| | 1,649 |
| | — |
| | — |
| | 195 |
| | 1,649 |
| | 1,844 |
| | (429 | ) | | 1993 | | 12/22/06 | | 40 to 40 Years |
| Express Oil Change | Auburn, AL | | (a) | | 354 |
| | 1,182 |
| | 30 |
| | 78 |
| | 384 |
| | 1,260 |
| | 1,644 |
| | (456 | ) | | 1987 | | 12/22/06 | | 15 to 30 Years |
| Express Oil Change | Huntsville, AL | | (a) | | 295 |
| | 893 |
| | — |
| | — |
| | 295 |
| | 893 |
| | 1,188 |
| | (233 | ) | | 1994 | | 12/22/06 | | 40 to 40 Years |
| Express Oil Change | Madison, AL | | (a) | | 359 |
| | 1,505 |
| | 40 |
| | 456 |
| | 399 |
| | 1,961 |
| | 2,360 |
| | (418 | ) | | 1995 | | 12/22/06 | | 15 to 40 Years |
| Express Oil Change | Madison, AL | | (a) | | 211 |
| | 1,401 |
| | — |
| | — |
| | 211 |
| | 1,401 |
| | 1,612 |
| | (365 | ) | | 1997 | | 12/22/06 | | 40 to 40 Years |
| Express Oil Change | Huntsville, AL | | (a) | | 374 |
| | 1,295 |
| | — |
| | 109 |
| | 374 |
| | 1,404 |
| | 1,778 |
| | (384 | ) | | 1997 | | 12/22/06 | | 19 to 40 Years |
| Express Oil Change | Huntsville, AL | | (a) | | 252 |
| | 917 |
| | — |
| | — |
| | 252 |
| | 917 |
| | 1,169 |
| | (318 | ) | | 1965 | | 12/22/06 | | 30 to 30 Years |
| Express Oil Change | Decatur, AL | | (a) | | 187 |
| | 1,174 |
| | — |
| | 98 |
| | 187 |
| | 1,272 |
| | 1,459 |
| | (286 | ) | | 2000 | | 12/22/06 | | 19 to 50 Years |
| Express Oil Change | Florence, AL | | (a) | | 130 |
| | 1,128 |
| | — |
| | — |
| | 130 |
| | 1,128 |
| | 1,258 |
| | (235 | ) | | 1999 | | 12/22/06 | | 50 to 50 Years |
| Express Oil Change | Huntsville, AL | | (a) | | 184 |
| | 1,037 |
| | — |
| | — |
| | 184 |
| | 1,037 |
| | 1,221 |
| | (216 | ) | | 2001 | | 12/22/06 | | 50 to 50 Years |
| Express Oil Change | Decatur, AL | | (a) | | 84 |
| | 803 |
| | — |
| | — |
| | 84 |
| | 803 |
| | 887 |
| | (167 | ) | | 2001 | | 12/22/06 | | 50 to 50 Years |
SPIRIT REALTY CAPITAL, INC.
Schedule III Real Estate and
Accumulated Depreciation
(Amounts in thousands)
|
| | | | | | | | | | | | | | | | | | | | | | | | | |
| | | | | | Initial Cost to Company | | Cost Capitalized Subsequent to Acquisition including impairment | | Gross Amount at December 31, 2016 (d) 2017 (g) | | | | | | | | |
| Concept | City, State | | Encumbrances (e) | | Land and Improvements | | Buildings and Improvements | | Land and Improvements | | Buildings and Improvements | | Land and Improvements | | Buildings and Improvements | | Total | | Final Accumulated Depreciation | | Date of Construction | | Date Acquired | | Life in which depreciation in latest Statement of Operations is computed |
Description | | Encumbrances (e)
| | Land and
Improvements
| | Buildings and
Improvements
| | Improvements/
Land
| | Improvements/
building
| | Land and
Improvements
| | Buildings and
Improvements
| | Total | | Final
Accum
| | Date of
Construction
| | Date
Acquired
| |
|
| | | | | | | | | | | | | | | | | | | | | | | | | | | | | | | | | |
| | Kansas City, MO | | (c) | | 634 |
| | 4,341 |
| | — |
| | — |
| | 634 |
| | 4,341 |
| | 4,975 |
| | (442 | ) | | 1997 | | 7/17/2013 | | 4 to 43 Years |
| | Kansas City, MO | | (c) | | 532 |
| | 3,549 |
| | — |
| | — |
| | 532 |
| | 3,549 |
| | 4,081 |
| | (398 | ) | | 1998 | | 7/17/2013 | | 4 to 39 Years |
| | Kansas City, MO | | (c) | | 862 |
| | 4,367 |
| | — |
| | — |
| | 862 |
| | 4,367 |
| | 5,229 |
| | (441 | ) | | 2000 | | 7/17/2013 | | 6 to 42 Years |
| | Kansas City, MO | | (c) | | 518 |
| | 4,234 |
| | — |
| | — |
| | 518 |
| | 4,234 |
| | 4,752 |
| | (429 | ) | | 1999 | | 7/17/2013 | | 6 to 43 Years |
| | Kissimmee, FL | | (c) | | 1,508 |
| | 2,153 |
| | — |
| | — |
| | 1,508 |
| | 2,153 |
| | 3,661 |
| | (284 | ) | | 1995 | | 7/17/2013 | | 2 to 40 Years |
| | Knoxville, TN | | (c) | | 2,107 |
| | 3,334 |
| | — |
| | — |
| | 2,107 |
| | 3,334 |
| | 5,441 |
| | (390 | ) | | 2000 | | 7/17/2013 | | 6 to 40 Years |
| | Lake Worth, TX | | (c) | | 1,044 |
| | 1,817 |
| | — |
| | — |
| | 1,044 |
| | 1,817 |
| | 2,861 |
| | (282 | ) | | 1996 | | 7/17/2013 | | 2 to 30 Years |
| | LaMarque, TX | | (b) | | 464 |
| | 3,139 |
| | — |
| | — |
| | 464 |
| | 3,139 |
| | 3,603 |
| | (361 | ) | | 2000 | | 7/17/2013 | | 7 to 40 Years |
| | Lansing, MI | | (c) | | 196 |
| | 1,487 |
| | — |
| | — |
| | 196 |
| | 1,487 |
| | 1,683 |
| | (198 | ) | | 1996 | | 7/17/2013 | | 3 to 31 Years |
| | Lima, OH | | (b) | | 568 |
| | 3,221 |
| | — |
| | — |
| | 568 |
| | 3,221 |
| | 3,789 |
| | (350 | ) | | 2005 | | 7/17/2013 | | 12 to 43 Years |
| | Lincoln, IL | | (b) | | 444 |
| | 3,043 |
| | — |
| | — |
| | 444 |
| | 3,043 |
| | 3,487 |
| | (334 | ) | | 2007 | | 7/17/2013 | | 11 to 43 Years |
| | Lincolnton, NC | | (c) | | 548 |
| | 1,537 |
| | — |
| | — |
| | 548 |
| | 1,537 |
| | 2,085 |
| | (202 | ) | | 1998 | | 7/17/2013 | | 4 to 37 Years |
| | Madeira, OH | | (c) | | 951 |
| | 3,978 |
| | — |
| | — |
| | 951 |
| | 3,978 |
| | 4,929 |
| | (391 | ) | | 1998 | | 7/17/2013 | | 5 to 44 Years |
| | Madison, MS | | (c) | | 745 |
| | 3,323 |
| | — |
| | — |
| | 745 |
| | 3,323 |
| | 4,068 |
| | (358 | ) | | 2004 | | 7/17/2013 | | 11 to 40 Years |
| | Maynard, MA | | (c) | | 1,683 |
| | 3,984 |
| | — |
| | — |
| | 1,683 |
| | 3,984 |
| | 5,667 |
| | (383 | ) | | 2004 | | 7/17/2013 | | 14 to 42 Years |
| | Mechanicville, NY | | (c) | | 654 |
| | 3,120 |
| | — |
| | — |
| | 654 |
| | 3,120 |
| | 3,774 |
| | (340 | ) | | 1997 | | 7/17/2013 | | 4 to 38 Years |
| | Memphis, TN | | (c) | | 961 |
| | 5,389 |
| | — |
| | — |
| | 961 |
| | 5,389 |
| | 6,350 |
| | (510 | ) | | 2002 | | 7/17/2013 | | 12 to 43 Years |
| | Mobile, AL | | (c) | | 586 |
| | 4,389 |
| | — |
| | — |
| | 586 |
| | 4,389 |
| | 4,975 |
| | (389 | ) | | 2007 | | 7/17/2013 | | 13 to 44 Years |
| | Moundsville, WV | | (a) | | 706 |
| | 1,002 |
| | — |
| | — |
| | 706 |
| | 1,002 |
| | 1,708 |
| | (286 | ) | | 1993 | | 7/1/2005 | | 19 to 40 Years |
| | Mount Pleasant, TX | | (c) | | 1,192 |
| | 4,578 |
| | — |
| | — |
| | 1,192 |
| | 4,578 |
| | 5,770 |
| | (485 | ) | | 2009 | | 7/17/2013 | | 14 to 43 Years |
| | Myrtle Beach, SC | | (c) | | 828 |
| | 4,024 |
| | — |
| | — |
| | 828 |
| | 4,024 |
| | 4,852 |
| | (414 | ) | | 2004 | | 7/17/2013 | | 12 to 42 Years |
| | New Cumberland, PA | | (b) | | 794 |
| | 2,663 |
| | — |
| | — |
| | 794 |
| | 2,663 |
| | 3,457 |
| | (291 | ) | | 2007 | | 7/17/2013 | | 12 to 43 Years |
| | Newton, IA | | (b) | | 365 |
| | 4,475 |
| | — |
| | — |
| | 365 |
| | 4,475 |
| | 4,840 |
| | (428 | ) | | 2001 | | 7/17/2013 | | 7 to 44 Years |
| | Norwich, CT | | (c) | | 627 |
| | 4,767 |
| | — |
| | 27 |
| | 627 |
| | 4,794 |
| | 5,421 |
| | (96 | ) | | 1975 | | 6/30/2016 | | 4 to 30 Years |
| | Okeechobee, FL | | (c) | | 674 |
| | 5,088 |
| | — |
| | — |
| | 674 |
| | 5,088 |
| | 5,762 |
| | (661 | ) | | 2001 | | 7/17/2013 | | 9 to 30 Years |
| | Olivette, MO | | (b) | | 1,816 |
| | 5,917 |
| | — |
| | — |
| | 1,816 |
| | 5,917 |
| | 7,733 |
| | (625 | ) | | 2001 | | 7/17/2013 | | 11 to 42 Years |
| | Oneida, NY | | (a) | | 1,315 |
| | 1,411 |
| | — |
| | — |
| | 1,315 |
| | 1,411 |
| | 2,726 |
| | (401 | ) | | 1999 | | 7/1/2005 | | 19 to 40 Years |
| | Oneida, TN | | (c) | | 1,866 |
| | 3,334 |
| | — |
| | — |
| | 1,866 |
| | 3,334 |
| | 5,200 |
| | (369 | ) | | 2007 | | 7/17/2013 | | 13 to 43 Years |
| | Onley, VA | | (c) | | 2,530 |
| | 2,296 |
| | — |
| | — |
| | 2,530 |
| | 2,296 |
| | 4,826 |
| | (310 | ) | | 2007 | | 7/17/2013 | | 12 to 43 Years |
| | Orlando, FL | | (c) | | 781 |
| | 3,799 |
| | — |
| | — |
| | 781 |
| | 3,799 |
| | 4,580 |
| | (500 | ) | | 2005 | | 7/17/2013 | | 10 to 30 Years |
| | Parkville, MO | | (c) | | 1,854 |
| | 2,568 |
| | — |
| | — |
| | 1,854 |
| | 2,568 |
| | 4,422 |
| | (341 | ) | | 2006 | | 7/17/2013 | | 11 to 38 Years |
| | Philadelphia, PA | | (a) | | 733 |
| | 1,087 |
| | — |
| | — |
| | 733 |
| | 1,087 |
| | 1,820 |
| | (305 | ) | | 1993 | | 7/1/2005 | | 19 to 40 Years |
| | Philadelphia, PA | | (a) | | 1,613 |
| | 1,880 |
| | — |
| | — |
| | 1,613 |
| | 1,880 |
| | 3,493 |
| | (519 | ) | | 1999 | | 7/1/2005 | | 19 to 40 Years |
| | Plains, PA | | (c) | | 1,502 |
| | 2,611 |
| | — |
| | — |
| | 1,502 |
| | 2,611 |
| | 4,113 |
| | (345 | ) | | 2006 | | 7/17/2013 | | 12 to 37 Years |
| | Portsmouth, OH | | (c) | | 354 |
| | 1,953 |
| | — |
| | — |
| | 354 |
| | 1,953 |
| | 2,307 |
| | (217 | ) | | 1997 | | 7/17/2013 | | 5 to 38 Years |
| | Portsmouth, OH | | (b) | | 219 |
| | 2,049 |
| | — |
| | — |
| | 219 |
| | 2,049 |
| | 2,268 |
| | (206 | ) | | 1997 | | 7/17/2013 | | 4 to 38 Years |
| | Richardson, TX | | (b) | | 803 |
| | 2,575 |
| | — |
| | — |
| | 803 |
| | 2,575 |
| | 3,378 |
| | (272 | ) | | 1996 | | 7/17/2013 | | 3 to 40 Years |
|
| | | | | | | | | | | | | | | | | | | | | | | | | | | | | | | | | |
| Express Oil Change | Pinson, AL | | (a) | | 320 |
| | 916 |
| | — |
| | — |
| | 320 |
| | 916 |
| | 1,236 |
| | (191 | ) | | 2001 | | 12/22/06 | | 50 to 50 Years |
| Family Dollar Stores | Texarkana, AR | | (a) | | 303 |
| | 201 |
| | — |
| | — |
| | 303 |
| | 201 |
| | 504 |
| | (59 | ) | | 1988 | | 03/31/14 | | 4 to 20 Years |
| Family Dollar Stores | Mesa, AZ | | (d) | | 734 |
| | 2 |
| | 102 |
| | 630 |
| | 836 |
| | 632 |
| | 1,468 |
| | (62 | ) | | 1955 | | 11/13/14 | | 10 to 50 Years |
| Family Dollar Stores | Kincheloe, MI | | (d) | | 317 |
| | 626 |
| | — |
| | — |
| | 317 |
| | 626 |
| | 943 |
| | (84 | ) | | 2014 | | 03/20/15 | | 14 to 40 Years |
| Family Dollar Stores | Mansfield, OH | | (d) | | 288 |
| | 825 |
| | — |
| | — |
| | 288 |
| | 825 |
| | 1,113 |
| | (83 | ) | | 2014 | | 04/28/15 | | 9 to 40 Years |
| Family Dollar Stores | Des Moines, IA | | (d) | | 354 |
| | 807 |
| | — |
| | — |
| | 354 |
| | 807 |
| | 1,161 |
| | (95 | ) | | 2014 | | 03/20/15 | | 8 to 40 Years |
| Family Dollar Stores | Otter Tail, MN | | (d) | | 338 |
| | 791 |
| | — |
| | — |
| | 338 |
| | 791 |
| | 1,129 |
| | (82 | ) | | 2014 | | 03/20/15 | | 14 to 40 Years |
| Family Dollar Stores | Evart, MI | | (d) | | 306 |
| | 703 |
| | — |
| | — |
| | 306 |
| | 703 |
| | 1,009 |
| | (80 | ) | | 2014 | | 03/20/15 | | 14 to 40 Years |
| Family Dollar Stores | Anderson, IN | | (d) | | 359 |
| | 781 |
| | — |
| | — |
| | 359 |
| | 781 |
| | 1,140 |
| | (86 | ) | | 2015 | | 03/20/15 | | 14 to 40 Years |
| Family Dollar Stores | Bulls Gap, TN | | (d) | | 466 |
| | 762 |
| | — |
| | — |
| | 466 |
| | 762 |
| | 1,228 |
| | (86 | ) | | 2014 | | 03/20/15 | | 14 to 40 Years |
| Family Dollar Stores | Duluth, MN | | (d) | | 422 |
| | 869 |
| | — |
| | — |
| | 422 |
| | 869 |
| | 1,291 |
| | (94 | ) | | 2015 | | 05/12/15 | | 9 to 40 Years |
| Family Fare Supermarket | Omaha, NE | | (d) | | 2,198 |
| | 3,328 |
| | — |
| | — |
| | 2,198 |
| | 3,328 |
| | 5,526 |
| | (909 | ) | | 1982 | | 12/17/13 | | 4 to 20 Years |
| Family Medical Centers | Jacksonville, FL | | (d) | | 815 |
| | 1,606 |
| | — |
| | — |
| | 815 |
| | 1,606 |
| | 2,421 |
| | (241 | ) | | 1977 | | 08/18/14 | | 6 to 30 Years |
| Family Medical Centers | Middleburg, FL | | (d) | | 521 |
| | 2,589 |
| | — |
| | 65 |
| | 521 |
| | 2,654 |
| | 3,175 |
| | (396 | ) | | 1988 | | 08/18/14 | | 7 to 30 Years |
| Famous Dave's | Maple Grove, MN | | (a) | | 1,852 |
| | 1,096 |
| | — |
| | — |
| | 1,852 |
| | 1,096 |
| | 2,948 |
| | (620 | ) | | 1997 | | 09/24/04 | | 15 to 30 Years |
| Famous Dave's | Apple Valley, MN | | (a) | | 1,119 |
| | 1,055 |
| | — |
| | — |
| | 1,119 |
| | 1,055 |
| | 2,174 |
| | (518 | ) | | 1999 | | 09/24/04 | | 15 to 30 Years |
| Faurecia Interior Systems | Auburn Hills, MI | | (d) | | 3,542 |
| | 6,597 |
| | 169 |
| | — |
| | 3,711 |
| | 6,597 |
| | 10,308 |
| | (1,730 | ) | | 1995 | | 07/17/13 | | 8 to 38 Years |
| Fazoli's | Lees Summit, MO | | (a) | | 590 |
| | 69 |
| | 55 |
| | (69 | ) | | 645 |
| | — |
| | 645 |
| | — |
| | (f) | | 09/23/05 | | (f) |
| Fazoli's | Rochester, MN | | (a) | | 561 |
| | 83 |
| | 66 |
| | (83 | ) | | 627 |
| | — |
| | 627 |
| | — |
| | (f) | | 09/23/05 | | (f) |
| Fazoli's | Fort Wayne, IN | | (a) | | 660 |
| | 204 |
| | — |
| | — |
| | 660 |
| | 204 |
| | 864 |
| | (305 | ) | | 1982 | | 09/23/05 | | 10 to 15 Years |
| Fazoli's | Blue Springs, MO | | (d) | | 688 |
| | 119 |
| | 101 |
| | (119 | ) | | 789 |
| | — |
| | 789 |
| | — |
| | (f) | | 08/27/09 | | (f) |
| FedEx | Peoria, IL | | (d) | | 953 |
| | 1,917 |
| | — |
| | 12 |
| | 953 |
| | 1,929 |
| | 2,882 |
| | (514 | ) | | 1996 | | 07/17/13 | | 3 to 30 Years |
SPIRIT REALTY CAPITAL, INC.
Schedule III Real Estate and
Accumulated Depreciation
(Amounts in thousands)
|
| | | | | | | | | | | | | | | | | | | | | | | | | |
| | | | | | Initial Cost to Company | | Cost Capitalized Subsequent to Acquisition including impairment | | Gross Amount at December 31, 2016 (d) 2017 (g) | | | | | | | | |
| Concept | City, State | | Encumbrances (e) | | Land and Improvements | | Buildings and Improvements | | Land and Improvements | | Buildings and Improvements | | Land and Improvements | | Buildings and Improvements | | Total | | Final Accumulated Depreciation | | Date of Construction | | Date Acquired | | Life in which depreciation in latest Statement of Operations is computed |
Description | | Encumbrances (e)
| | Land and
Improvements
| | Buildings and
Improvements
| | Improvements/
Land
| | Improvements/
building
| | Land and
Improvements
| | Buildings and
Improvements
| | Total | | Final
Accum
| | Date of
Construction
| | Date
Acquired
| |
|
| | | | | | | | | | | | | | | | | | | | | | | | | | | | | | | | | |
| | Richland Hills, TX | | (b) | | 997 |
| | 2,951 |
| | — |
| | — |
| | 997 |
| | 2,951 |
| | 3,948 |
| | (317 | ) | | 1997 | | 7/17/2013 | | 4 to 40 Years |
| | Richmond Hills, GA | | (c) | | 688 |
| | 4,081 |
| | — |
| | — |
| | 688 |
| | 4,081 |
| | 4,769 |
| | (406 | ) | | 2009 | | 7/17/2013 | | 13 to 44 Years |
| | River Oaks, TX | | (b) | | 829 |
| | 2,871 |
| | — |
| | — |
| | 829 |
| | 2,871 |
| | 3,700 |
| | (331 | ) | | 1996 | | 7/17/2013 | | 3 to 40 Years |
| | Rome, NY | | (c) | | 1,135 |
| | 3,104 |
| | — |
| | — |
| | 1,135 |
| | 3,104 |
| | 4,239 |
| | (321 | ) | | 2007 | | 7/17/2013 | | 13 to 43 Years |
| | Saco, ME | | (c) | | 898 |
| | 1,702 |
| | — |
| | — |
| | 898 |
| | 1,702 |
| | 2,600 |
| | (297 | ) | | 1997 | | 7/17/2013 | | 3 to 29 Years |
| | Saginaw, MI | | (a) | | 1,064 |
| | 3,906 |
| | — |
| | — |
| | 1,064 |
| | 3,906 |
| | 4,970 |
| | (407 | ) | | 2000 | | 7/17/2013 | | 7 to 41 Years |
| | San Antonio, TX | | (c) | | 841 |
| | 3,909 |
| | — |
| | — |
| | 841 |
| | 3,909 |
| | 4,750 |
| | (382 | ) | | 2004 | | 7/17/2013 | | 14 to 40 Years |
| | Seattle, WA | | (b) | | 2,589 |
| | 4,245 |
| | — |
| | — |
| | 2,589 |
| | 4,245 |
| | 6,834 |
| | (432 | ) | | 2002 | | 7/17/2013 | | 9 to 43 Years |
| | Shreveport, LA | | (c) | | 1,461 |
| | 3,605 |
| | — |
| | — |
| | 1,461 |
| | 3,605 |
| | 5,066 |
| | (400 | ) | | 1999 | | 7/17/2013 | | 6 to 40 Years |
| | Spartanburg, SC | | (b) | | 1,196 |
| | 1,671 |
| | — |
| | — |
| | 1,196 |
| | 1,671 |
| | 2,867 |
| | (232 | ) | | 1999 | | 7/17/2013 | | 5 to 34 Years |
| | St. Augustine, FL | | (c) | | 1,048 |
| | 2,905 |
| | — |
| | — |
| | 1,048 |
| | 2,905 |
| | 3,953 |
| | (317 | ) | | 2008 | | 7/17/2013 | | 11 to 42 Years |
| | St. Clair Shores, MI | | (a) | | 1,169 |
| | 761 |
| | — |
| | — |
| | 1,169 |
| | 761 |
| | 1,930 |
| | (288 | ) | | 1991 | | 5/2/2005 | | 15 to 30 Years |
| | The Colony, TX | | (c) | | 1,028 |
| | 1,769 |
| | — |
| | — |
| | 1,028 |
| | 1,769 |
| | 2,797 |
| | (202 | ) | | 1996 | | 7/17/2013 | | 1 to 40 Years |
| | Topeka, KS | | (c) | | 912 |
| | 2,681 |
| | — |
| | — |
| | 912 |
| | 2,681 |
| | 3,593 |
| | (327 | ) | | 1999 | | 7/17/2013 | | 6 to 38 Years |
| | Tulsa, OK | | (c) | | 741 |
| | 3,179 |
| | — |
| | — |
| | 741 |
| | 3,179 |
| | 3,920 |
| | (339 | ) | | 1994 | | 7/17/2013 | | 1 to 35 Years |
| | Uhrichsville, OH | | (a) | | 617 |
| | 2,345 |
| | — |
| | — |
| | 617 |
| | 2,345 |
| | 2,962 |
| | (618 | ) | | 2000 | | 7/1/2005 | | 19 to 40 Years |
| | Waco, TX | | (c) | | 858 |
| | 3,455 |
| | — |
| | — |
| | 858 |
| | 3,455 |
| | 4,313 |
| | (401 | ) | | 1998 | | 7/17/2013 | | 5 to 35 Years |
| | Wauseon, OH | | (c) | | 1,000 |
| | 2,034 |
| | — |
| | — |
| | 1,000 |
| | 2,034 |
| | 3,034 |
| | (280 | ) | | 2005 | | 7/17/2013 | | 12 to 37 Years |
| | Waynesville, NC | | (c) | | 1,495 |
| | 2,365 |
| | — |
| | — |
| | 1,495 |
| | 2,365 |
| | 3,860 |
| | (269 | ) | | 2005 | | 7/17/2013 | | 12 to 42 Years |
| | Wichita Falls, TX | | (c) | | 503 |
| | 2,530 |
| | — |
| | — |
| | 503 |
| | 2,530 |
| | 3,033 |
| | (284 | ) | | 1995 | | 7/17/2013 | | 2 to 40 Years |
| | Wichita Falls, TX | | (c) | | 528 |
| | 2,022 |
| | — |
| | — |
| | 528 |
| | 2,022 |
| | 2,550 |
| | (219 | ) | | 1995 | | 7/17/2013 | | 1 to 40 Years |
|
| | | | | | | | | | | | | | | | | | | | | | | | | | | | | | | | | |
| FedEx | Walker, MI | | (c) | | 2,287 |
| | 4,469 |
| | (1,369 | ) | | (2,527 | ) | | 918 |
| | 1,942 |
| | 2,860 |
| | (154 | ) | | 2001 | | 07/17/13 | | 4 to 30 Years |
| FedEx | Huntsville, AL | | (c) | | 5,115 |
| | 6,701 |
| | — |
| | — |
| | 5,115 |
| | 6,701 |
| | 11,816 |
| | (2,052 | ) | | 2008 | | 07/17/13 | | 10 to 38 Years |
| FedEx | Baton Rouge, LA | | (c) | | 2,898 |
| | 8,024 |
| | — |
| | — |
| | 2,898 |
| | 8,024 |
| | 10,922 |
| | (1,368 | ) | | 2008 | | 07/17/13 | | 9 to 43 Years |
| FedEx | Oak Park, MI | | (d) | | 16,713 |
| | 19,718 |
| | — |
| | 38 |
| | 16,713 |
| | 19,756 |
| | 36,469 |
| | (511 | ) | | 2016 | | 06/26/17 | | 14 to 40 Years |
| Ferguson Enterprises | Shallotte, NC | | (c) | | 705 |
| | 1,794 |
| | — |
| | — |
| | 705 |
| | 1,794 |
| | 2,499 |
| | (427 | ) | | 2006 | | 07/17/13 | | 10 to 30 Years |
| Ferguson Enterprises | Salisbury, MD | | (d) | | 4,210 |
| | 6,613 |
| | — |
| | — |
| | 4,210 |
| | 6,613 |
| | 10,823 |
| | (2,157 | ) | | 2007 | | 07/17/13 | | 10 to 27 Years |
| Ferguson Enterprises | Powhatan, VA | | (d) | | 4,342 |
| | 2,963 |
| | — |
| | — |
| | 4,342 |
| | 2,963 |
| | 7,305 |
| | (1,629 | ) | | 2007 | | 07/17/13 | | 10 to 31 Years |
| Ferguson Enterprises | Ocala, FL | | (d) | | 2,260 |
| | 4,709 |
| | — |
| | — |
| | 2,260 |
| | 4,709 |
| | 6,969 |
| | (1,079 | ) | | 2006 | | 07/17/13 | | 8 to 46 Years |
| Ferguson Enterprises | Front Royal, VA | | (c) | | 7,257 |
| | 35,711 |
| | — |
| | — |
| | 7,257 |
| | 35,711 |
| | 42,968 |
| | (7,677 | ) | | 2007 | | 07/17/13 | | 9 to 34 Years |
| Ferguson Enterprises | Cohasset, MN | | (c) | | 334 |
| | 1,134 |
| | — |
| | — |
| | 334 |
| | 1,134 |
| | 1,468 |
| | (305 | ) | | 2007 | | 07/17/13 | | 10 to 26 Years |
| Ferguson Enterprises | Auburn, AL | | (c) | | 884 |
| | 1,530 |
| | — |
| | — |
| | 884 |
| | 1,530 |
| | 2,414 |
| | (355 | ) | | 2007 | | 07/17/13 | | 10 to 32 Years |
| Fitness Evolution | Sacramento, CA | | (d) | | 1,236 |
| | 2,883 |
| | — |
| | — |
| | 1,236 |
| | 2,883 |
| | 4,119 |
| | (372 | ) | | 1990 | | 09/29/15 | | 15 to 20 Years |
| Flying J Travel Plaza | Saint Augustine, FL | | (a) | | 9,556 |
| | 2,543 |
| | — |
| | — |
| | 9,556 |
| | 2,543 |
| | 12,099 |
| | (3,114 | ) | | 2005 | | 07/01/05 | | 13 to 40 Years |
| Flying J Travel Plaza | Spiceland, IN | | (a) | | 9,649 |
| | 3,063 |
| | — |
| | — |
| | 9,649 |
| | 3,063 |
| | 12,712 |
| | (3,901 | ) | | 2005 | | 07/01/05 | | 13 to 40 Years |
| Flying J Travel Plaza | Catlettsburg, KY | | (a) | | 9,344 |
| | 3,989 |
| | — |
| | — |
| | 9,344 |
| | 3,989 |
| | 13,333 |
| | (4,476 | ) | | 2001 | | 07/01/05 | | 13 to 40 Years |
| Flying Star Café | Albuquerque, NM | | (a) | | 120 |
| | 1,336 |
| | — |
| | — |
| | 120 |
| | 1,336 |
| | 1,456 |
| | (464 | ) | | 1999 | | 07/01/05 | | 30 to 30 Years |
| Flying Star Café | Albuquerque, NM | | (a) | | 1,036 |
| | 1,655 |
| | — |
| | — |
| | 1,036 |
| | 1,655 |
| | 2,691 |
| | (812 | ) | | 1994 | | 07/01/05 | | 15 to 30 Years |
| Focus Child Development Center | Riverdale, GA | | (a) | | 663 |
| | 1,336 |
| | — |
| | 32 |
| | 663 |
| | 1,368 |
| | 2,031 |
| | (80 | ) | | 1998 | | 06/29/16 | | 10 to 40 Years |
| Focus Child Development Center | Dalton, GA | | (a) | | 396 |
| | 1,396 |
| | — |
| | — |
| | 396 |
| | 1,396 |
| | 1,792 |
| | (70 | ) | | 1996 | | 06/29/16 | | 10 to 40 Years |
| Focus Child Development Center | Riverdale, GA | | (a) | | 436 |
| | 525 |
| | — |
| | — |
| | 436 |
| | 525 |
| | 961 |
| | (32 | ) | | 1965 | | 06/29/16 | | 10 to 40 Years |
| Food City | Blairsville, GA | | (d) | | 1,652 |
| | 3,102 |
| | — |
| | — |
| | 1,652 |
| | 3,102 |
| | 4,754 |
| | (517 | ) | | 2001 | | 09/30/14 | | 10 to 30 Years |
SPIRIT REALTY CAPITAL, INC.
Schedule III Real Estate and
Accumulated Depreciation
(Amounts in thousands)
|
| | | | | | | | | | | | | | | | | | | | | | | | | | | | | | | | | |
| Medical / Other Office | | | | | | | | | | | | | | | | | | | | | | |
| | Anderson, IN | | (a) | | 411 |
| | 1,673 |
| | — |
| | — |
| | 411 |
| | 1,673 |
| | 2,084 |
| | (133 | ) | | 1981 | | 03/31/14 | | 15 to 40 Years |
| | Bath, NY | | (c) | | 72 |
| | 707 |
| | — |
| | — |
| | 72 |
| | 707 |
| | 779 |
| | (45 | ) | | 1970 | | 04/30/15 | | 15 to 30 Years |
| | Beaumont, TX | | (a) | | 438 |
| | 1,976 |
| | — |
| | — |
| | 438 |
| | 1,976 |
| | 2,414 |
| | (222 | ) | | 1985 | | 03/31/14 | | 15 to 30 Years |
| | Beavercreek, OH | | (c) | | 559 |
| | 1,420 |
| | — |
| | — |
| | 559 |
| | 1,420 |
| | 1,979 |
| | (152 | ) | | 1985 | | 08/18/14 | | 7 to 40 Years |
| | Belleville, IL | | (a) | | 140 |
| | 431 |
| | — |
| | — |
| | 140 |
| | 431 |
| | 571 |
| | (67 | ) | | 1979 | | 03/31/14 | | 15 to 20 Years |
| | Bellevue, NE | | (a) | | 560 |
| | 446 |
| | — |
| | — |
| | 560 |
| | 446 |
| | 1,006 |
| | (35 | ) | | 2008 | | 08/07/15 | | 5 to 40 Years |
| | Binghamton, NY | | (c) | | 328 |
| | 2,214 |
| | — |
| | — |
| | 328 |
| | 2,214 |
| | 2,542 |
| | (133 | ) | | 1985 | | 04/30/15 | | 15 to 30 Years |
| | Bonita Springs, FL | | (a) | | 317 |
| | 1,619 |
| | — |
| | — |
| | 317 |
| | 1,619 |
| | 1,936 |
| | (217 | ) | | 2003 | | 08/30/12 | | 15 to 50 Years |
| | Bonita Springs, FL | | (a) | | 738 |
| | 4,022 |
| | — |
| | — |
| | 738 |
| | 4,022 |
| | 4,760 |
| | (520 | ) | | 2006 | | 08/30/12 | | 15 to 50 Years |
| | Bonita Springs, FL | | (a) | | 376 |
| | 940 |
| | — |
| | — |
| | 376 |
| | 940 |
| | 1,316 |
| | (147 | ) | | 2006 | | 08/30/12 | | 15 to 50 Years |
| | Brandon, FL | | (a) | | 110 |
| | 671 |
| | — |
| | — |
| | 110 |
| | 671 |
| | 781 |
| | (63 | ) | | 1999 | | 03/31/14 | | 15 to 30 Years |
|
| | | | | | | | | | | | | | | | | | | | | | | | | |
| | | | | | Initial Cost to Company | | Cost Capitalized Subsequent to Acquisition including impairment | | Gross Amount at December 31, 2016 (d) 2017 (g) | | | | | | | | |
| Concept | City, State | | Encumbrances (e) | | Land and Improvements | | Buildings and Improvements | | Land and Improvements | | Buildings and Improvements | | Land and Improvements | | Buildings and Improvements | | Total | | Final Accumulated Depreciation | | Date of Construction | | Date Acquired | | Life in which depreciation in latest Statement of Operations is computed |
Description | | Encumbrances (e)
| | Land and
Improvements
| | Buildings and
Improvements
| | Improvements/
Land
| | Improvements/
building
| | Land and
Improvements
| | Buildings and
Improvements
| | Total | | Final
Accum
| | Date of
Construction
| | Date
Acquired
| |
|
| | | | | | | | | | | | | | | | | | | | | | | | | | | | | | | | | |
| | Brandon, MS | | (a) | | 200 |
| | 281 |
| | — |
| | — |
| | 200 |
| | 281 |
| | 481 |
| | (42 | ) | | 1986 | | 03/31/14 | | 15 to 30 Years |
| | Bullhead City, AZ | | (a) | | 147 |
| | 489 |
| | — |
| | — |
| | 147 |
| | 489 |
| | 636 |
| | (49 | ) | | 1970 | | 09/30/13 | | 15 to 50 Years |
| | Bullhead City, AZ | | (a) | | 57 |
| | 946 |
| | — |
| | — |
| | 57 |
| | 946 |
| | 1,003 |
| | (69 | ) | | 2005 | | 04/08/14 | | 15 to 40 Years |
| | Camp Hill, PA | | (a) | | 180 |
| | 581 |
| | — |
| | — |
| | 180 |
| | 581 |
| | 761 |
| | (62 | ) | | 1991 | | 03/31/14 | | 15 to 30 Years |
| | Camp Hill, PA | | (a) | | 140 |
| | 641 |
| | — |
| | — |
| | 140 |
| | 641 |
| | 781 |
| | (66 | ) | | 1990 | | 03/31/14 | | 15 to 30 Years |
| | Cape Coral, FL | | (a) | | 545 |
| | 1,716 |
| | — |
| | — |
| | 545 |
| | 1,716 |
| | 2,261 |
| | (273 | ) | | 2011 | | 08/30/12 | | 15 to 50 Years |
| | Cherry Hill, NJ | | (c) | | 4,078 |
| | 6,076 |
| | — |
| | — |
| | 4,078 |
| | 6,076 |
| | 10,154 |
| | (29 | ) | | 1998 | | 11/23/16 | | 13 to 30 Years |
| | Chicago, IL | | (a) | | 186 |
| | 1,780 |
| | — |
| | — |
| | 186 |
| | 1,780 |
| | 1,966 |
| | (115 | ) | | 2007 | | 09/30/13 | | 50 to 50 Years |
| | Clarksville, TN | | (a) | | 281 |
| | 531 |
| | — |
| | — |
| | 281 |
| | 531 |
| | 812 |
| | (56 | ) | | 1997 | | 03/31/14 | | 15 to 30 Years |
| | Clarksville, TN | | (a) | | 978 |
| | 2,718 |
| | — |
| | — |
| | 978 |
| | 2,718 |
| | 3,696 |
| | (177 | ) | | 2011 | | 12/04/14 | | 15 to 40 Years |
| | Clayton, GA | | (a) | | 70 |
| | 311 |
| | — |
| | — |
| | 70 |
| | 311 |
| | 381 |
| | (36 | ) | | 1963 | | 03/31/14 | | 15 to 30 Years |
| | Columbia, MO | | (a) | | 1,012 |
| | 7,054 |
| | — |
| | — |
| | 1,012 |
| | 7,054 |
| | 8,066 |
| | (531 | ) | | 2004 | | 03/31/14 | | 15 to 40 Years |
| | Columbia, SC | | (b) | | 3,378 |
| | 35,153 |
| | — |
| | — |
| | 3,378 |
| | 35,153 |
| | 38,531 |
| | (2,780 | ) | | 2003 | | 12/31/13 | | 15 to 40 Years |
| | Columbus, GA | | (a) | | 190 |
| | 531 |
| | — |
| | — |
| | 190 |
| | 531 |
| | 721 |
| | (65 | ) | | 1993 | | 03/31/14 | | 15 to 30 Years |
| | Corning, NY | | (c) | | 123 |
| | 1,261 |
| | — |
| | — |
| | 123 |
| | 1,261 |
| | 1,384 |
| | (78 | ) | | 1999 | | 04/30/15 | | 15 to 30 Years |
| | Crystal Lake, IL | | (a) | | 200 |
| | 631 |
| | — |
| | — |
| | 200 |
| | 631 |
| | 831 |
| | (71 | ) | | 2001 | | 03/31/14 | | 15 to 30 Years |
| | Dallas, TX | | (a) | | 1,633 |
| | 21,835 |
| | — |
| | 2,019 |
| | 1,633 |
| | 23,854 |
| | 25,487 |
| | (5,087 | ) | | 2005 | | 08/29/05 | | 15 to 50 Years |
| | Dallas, TX | | (a) | | 1,915 |
| | 9,150 |
| | — |
| | — |
| | 1,915 |
| | 9,150 |
| | 11,065 |
| | (1,393 | ) | | 2006 | | 03/28/13 | | 11 to 50 Years |
| | Debary, FL | | (a) | | 100 |
| | 641 |
| | — |
| | — |
| | 100 |
| | 641 |
| | 741 |
| | (66 | ) | | 1989 | | 03/31/14 | | 15 to 30 Years |
| | Defiance, OH | | (a) | | 130 |
| | 491 |
| | — |
| | — |
| | 130 |
| | 491 |
| | 621 |
| | (56 | ) | | 1959 | | 03/31/14 | | 15 to 30 Years |
| | Devine, TX | | (a) | | 240 |
| | 481 |
| | — |
| | — |
| | 240 |
| | 481 |
| | 721 |
| | (61 | ) | | 2002 | | 03/31/14 | | 15 to 30 Years |
| | Dothan, AL | | (c) | | 695 |
| | 1,707 |
| | — |
| | — |
| | 695 |
| | 1,707 |
| | 2,402 |
| | — |
| | 2012 | | 12/21/16 | | 1 to 40 Years |
| | Dunwoody, GA | | (c) | | 1,061 |
| | 4,556 |
| | — |
| | 22 |
| | 1,061 |
| | 4,578 |
| | 5,639 |
| | (37 | ) | | 1988 | | 10/27/16 | | 2 to 40 Years |
| | East Alton, IL | | (a) | | 170 |
| | 80 |
| | — |
| | — |
| | 170 |
| | 80 |
| | 250 |
| | (20 | ) | | 1960 | | 03/31/14 | | 15 to 20 Years |
| | Eastman, GA | | (a) | | 130 |
| | 551 |
| | — |
| | — |
| | 130 |
| | 551 |
| | 681 |
| | (65 | ) | | 1988 | | 03/31/14 | | 15 to 30 Years |
| | El Paso, TX | | (a) | | 890 |
| | 3,555 |
| | — |
| | — |
| | 890 |
| | 3,555 |
| | 4,445 |
| | (55 | ) | | 2015 | | 06/20/16 | | 11 to 50 Years |
| | Elizabethton, TN | | (c) | | 482 |
| | 1,139 |
| | — |
| | — |
| | 482 |
| | 1,139 |
| | 1,621 |
| | (138 | ) | | 2008 | | 08/18/14 | | 6 to 30 Years |
| | Elkhart, IN | | (a) | | 90 |
| | 341 |
| | — |
| | — |
| | 90 |
| | 341 |
| | 431 |
| | (35 | ) | | 1969 | | 03/31/14 | | 15 to 30 Years |
| | Elmira, NY | | (c) | | 185 |
| | 3,902 |
| | — |
| | — |
| | 185 |
| | 3,902 |
| | 4,087 |
| | (230 | ) | | 1985 | | 04/30/15 | | 15 to 30 Years |
| | Endicott, NY | | (c) | | 92 |
| | 348 |
| | — |
| | — |
| | 92 |
| | 348 |
| | 440 |
| | (27 | ) | | 2001 | | 04/30/15 | | 15 to 30 Years |
| | Evansville, IN | | (a) | | 130 |
| | 391 |
| | — |
| | — |
| | 130 |
| | 391 |
| | 521 |
| | (45 | ) | | 1986 | | 03/31/14 | | 15 to 30 Years |
| | Fairlea, WV | | (c) | | 298 |
| | 1,280 |
| | — |
| | — |
| | 298 |
| | 1,280 |
| | 1,578 |
| | (138 | ) | | 2009 | | 08/18/14 | | 10 to 40 Years |
| | Franklin, TX | | (c) | | 159 |
| | 1,124 |
| | — |
| | 29 |
| | 159 |
| | 1,153 |
| | 1,312 |
| | (110 | ) | | 2012 | | 08/18/14 | | 4 to 40 Years |
| | Ft. Myers, FL | | (a) | | 903 |
| | 6,445 |
| | — |
| | — |
| | 903 |
| | 6,445 |
| | 7,348 |
| | (799 | ) | | 1989 | | 08/30/12 | | 15 to 50 Years |
| | Ft. Wayne, IN | | (a) | | 150 |
| | 1,022 |
| | — |
| | — |
| | 150 |
| | 1,022 |
| | 1,172 |
| | (81 | ) | | 1965 | | 03/31/14 | | 15 to 40 Years |
| | Gahanna, OH | | (a) | | 411 |
| | 982 |
| | — |
| | — |
| | 411 |
| | 982 |
| | 1,393 |
| | (112 | ) | | 1998 | | 03/31/14 | | 15 to 40 Years |
| | Gainesville, FL | | (a) | | 180 |
| | 711 |
| | — |
| | — |
| | 180 |
| | 711 |
| | 891 |
| | (69 | ) | | 1941 | | 03/31/14 | | 15 to 30 Years |
| | Garland, TX | | (c) | | 1,256 |
| | 4,516 |
| | — |
| | — |
| | 1,256 |
| | 4,516 |
| | 5,772 |
| | (87 | ) | | 2016 | | 03/30/16 | | 50 to 50 Years |
|
| | | | | | | | | | | | | | | | | | | | | | | | | | | | | | | | | |
| Food City | Chattanooga, TN | | (d) | | 1,817 |
| | 5,281 |
| | — |
| | — |
| | 1,817 |
| | 5,281 |
| | 7,098 |
| | (760 | ) | | 1969 | | 09/30/14 | | 10 to 30 Years |
| Food City | Dayton, TN | | (d) | | 1,122 |
| | 6,767 |
| | — |
| | — |
| | 1,122 |
| | 6,767 |
| | 7,889 |
| | (740 | ) | | 1999 | | 09/30/14 | | 10 to 40 Years |
| Fox and Hound | Richmond, VA | | (d) | | 993 |
| | 922 |
| | — |
| | — |
| | 993 |
| | 922 |
| | 1,915 |
| | (154 | ) | | 2003 | | 03/20/15 | | 13 to 20 Years |
| Fox Rehabilitation Services | Cherry Hill, NJ | | (d) | | 4,078 |
| | 6,076 |
| | — |
| | — |
| | 4,078 |
| | 6,076 |
| | 10,154 |
| | (362 | ) | | 1998 | | 11/23/16 | | 9 to 30 Years |
| Fred's Super Dollar | Cabot, AR | | (a) | | 132 |
| | 404 |
| | — |
| | — |
| | 132 |
| | 404 |
| | 536 |
| | (157 | ) | | 1970 | | 03/31/14 | | 1 to 15 Years |
| Fresenius Medical Care | Elizabethton, TN | | (d) | | 482 |
| | 1,139 |
| | — |
| | — |
| | 482 |
| | 1,139 |
| | 1,621 |
| | (196 | ) | | 2008 | | 08/18/14 | | 6 to 30 Years |
| Fresenius Medical Care | Fairlea, WV | | (d) | | 298 |
| | 1,280 |
| | — |
| | — |
| | 298 |
| | 1,280 |
| | 1,578 |
| | (196 | ) | | 2009 | | 08/18/14 | | 10 to 40 Years |
| Fuddruckers | Mesa, AZ | | (a) | | 1,318 |
| | 234 |
| | — |
| | — |
| | 1,318 |
| | 234 |
| | 1,552 |
| | (261 | ) | | 1995 | | 06/25/04 | | 15 to 20 Years |
| Fuddruckers | Houston, TX | | (a) | | 1,098 |
| | 439 |
| | — |
| | — |
| | 1,098 |
| | 439 |
| | 1,537 |
| | (382 | ) | | 1995 | | 06/25/04 | | 15 to 40 Years |
| Fuddruckers | Houston, TX | | (a) | | 1,156 |
| | 352 |
| | (22 | ) | | — |
| | 1,134 |
| | 352 |
| | 1,486 |
| | (317 | ) | | 1995 | | 06/25/04 | | 15 to 30 Years |
| Fuddruckers | Glendale, AZ | | (a) | | 1,236 |
| | 272 |
| | — |
| | — |
| | 1,236 |
| | 272 |
| | 1,508 |
| | (270 | ) | | 1995 | | 06/25/04 | | 15 to 20 Years |
| Fuddruckers | Kingwood, TX | | (a) | | 936 |
| | 387 |
| | — |
| | (387 | ) | | 936 |
| | — |
| | 936 |
| | (198 | ) | | 1994 | | 06/25/04 | | 15 to 30 Years |
| Gardner School | Nashville, TN | | (d) | | 2,461 |
| | 1,427 |
| | — |
| | — |
| | 2,461 |
| | 1,427 |
| | 3,888 |
| | (140 | ) | | 1976 | | 03/27/15 | | 15 to 40 Years |
| General Motors | Caldwell, TX | | (a) | | 1,775 |
| | 1,725 |
| | — |
| | — |
| | 1,775 |
| | 1,725 |
| | 3,500 |
| | (1,061 | ) | | 2000 | | 04/29/11 | | 11 to 36 Years |
| Georgia Theatre | Danville, VA | | (d) | | 1,349 |
| | 6,406 |
| | — |
| | — |
| | 1,349 |
| | 6,406 |
| | 7,755 |
| | (614 | ) | | 2002 | | 12/30/14 | | 15 to 40 Years |
| Georgia Theatre | Hinesville, GA | | (d) | | 2,049 |
| | 5,216 |
| | — |
| | — |
| | 2,049 |
| | 5,216 |
| | 7,265 |
| | (513 | ) | | 2001 | | 12/30/14 | | 15 to 40 Years |
| Georgia Theatre | Valdosta, GA | | (d) | | 3,038 |
| | 13,801 |
| | — |
| | — |
| | 3,038 |
| | 13,801 |
| | 16,839 |
| | (1,225 | ) | | 2001 | | 12/30/14 | | 15 to 40 Years |
| Georgia Theatre | Warner Robins, GA | | (d) | | 2,598 |
| | 8,324 |
| | — |
| | — |
| | 2,598 |
| | 8,324 |
| | 10,922 |
| | (796 | ) | | 2010 | | 12/30/14 | | 15 to 40 Years |
| Gerber Collision & Glass | Clayton, NC | | (a) | | 684 |
| | 1,254 |
| | — |
| | — |
| | 684 |
| | 1,254 |
| | 1,938 |
| | (200 | ) | | 2001 | | 03/31/14 | | 7 to 30 Years |
| Gerber Collision & Glass | Greensboro, NC | | (a) | | 721 |
| | 1,179 |
| | — |
| | — |
| | 721 |
| | 1,179 |
| | 1,900 |
| | (208 | ) | | 2002 | | 03/31/14 | | 7 to 30 Years |
| Golden Chick | Weatherford, TX | | (d) | | 260 |
| | 886 |
| | — |
| | 21 |
| | 260 |
| | 907 |
| | 1,167 |
| | (55 | ) | | 2015 | | 07/28/16 | | 18 to 30 Years |
| Golden Corral | Fort Smith, AR | | (a) | | 1,503 |
| | 1,323 |
| | — |
| | — |
| | 1,503 |
| | 1,323 |
| | 2,826 |
| | (967 | ) | | 1993 | | 09/23/05 | | 15 to 20 Years |
| Golden Corral | Branson, MO | | (a) | | 1,497 |
| | 1,684 |
| | — |
| | — |
| | 1,497 |
| | 1,684 |
| | 3,181 |
| | (888 | ) | | 1994 | | 09/23/05 | | 15 to 30 Years |
| Golden Corral | Springfield, MO | | (a) | | 1,655 |
| | 1,467 |
| | — |
| | — |
| | 1,655 |
| | 1,467 |
| | 3,122 |
| | (855 | ) | | 1993 | | 09/23/05 | | 15 to 30 Years |
| Golden Corral | North Little Rock, AR | | (a) | | 1,398 |
| | 1,289 |
| | — |
| | — |
| | 1,398 |
| | 1,289 |
| | 2,687 |
| | (884 | ) | | 1993 | | 09/23/05 | | 15 to 20 Years |
|
| | | | | | | | | | | | | | | | | | | | | | | | | | | | | | | | | |
| Golden Corral | Albuquerque, NM | | (b) | | 1,473 |
| | 2,947 |
| | — |
| | — |
| | 1,473 |
| | 2,947 |
| | 4,420 |
| | (737 | ) | | 2011 | | 07/17/13 | | 10 to 33 Years |
| Golden Corral | Gallipolis, OH | | (a) | | 375 |
| | 1,295 |
| | — |
| | — |
| | 375 |
| | 1,295 |
| | 1,670 |
| | (233 | ) | | 1996 | | 10/25/13 | | 15 to 30 Years |
SPIRIT REALTY CAPITAL, INC.
Schedule III Real Estate and
Accumulated Depreciation
(Amounts in thousands)
|
| | | | | | | | | | | | | | | | | | | | | | | | | |
| | | | | | Initial Cost to Company | | Cost Capitalized Subsequent to Acquisition including impairment | | Gross Amount at December 31, 2016 (d) 2017 (g) | | | | | | | | |
| Concept | City, State | | Encumbrances (e) | | Land and Improvements | | Buildings and Improvements | | Land and Improvements | | Buildings and Improvements | | Land and Improvements | | Buildings and Improvements | | Total | | Final Accumulated Depreciation | | Date of Construction | | Date Acquired | | Life in which depreciation in latest Statement of Operations is computed |
Description | | Encumbrances (e)
| | Land and
Improvements
| | Buildings and
Improvements
| | Improvements/
Land
| | Improvements/
building
| | Land and
Improvements
| | Buildings and
Improvements
| | Total | | Final
Accum
| | Date of
Construction
| | Date
Acquired
| |
|
| | | | | | | | | | | | | | | | | | | | | | | | | | | | | | | | | |
| | Germantown, TN | | (a) | | 91 |
| | 171 |
| | — |
| | — |
| | 91 |
| | 171 |
| | 262 |
| | (14 | ) | | 1984 | | 04/08/14 | | 15 to 40 Years |
| | Glendale, AZ | | (a) | | 371 |
| | 491 |
| | — |
| | — |
| | 371 |
| | 491 |
| | 862 |
| | (52 | ) | | 1988 | | 03/31/14 | | 15 to 30 Years |
| | Grayson, KY | | (c) | | 658 |
| | 3,171 |
| | — |
| | — |
| | 658 |
| | 3,171 |
| | 3,829 |
| | (279 | ) | | 2013 | | 08/18/14 | | 9 to 40 Years |
| | Harlingen, TX | | (c) | | 1,734 |
| | 520 |
| | — |
| | — |
| | 1,734 |
| | 520 |
| | 2,254 |
| | — |
| | 2016 | | 12/01/16 | | 20 to 40 Years |
| | Hartsville, SC | | (a) | | 90 |
| | 180 |
| | — |
| | — |
| | 90 |
| | 180 |
| | 270 |
| | (18 | ) | | 1973 | | 03/31/14 | | 15 to 40 Years |
| | Jacksonville, FL | | (a) | | 57 |
| | 365 |
| | — |
| | — |
| | 57 |
| | 365 |
| | 422 |
| | (36 | ) | | 1986 | | 04/08/14 | | 15 to 30 Years |
| | Jacksonville, FL | | (c) | | 815 |
| | 1,606 |
| | — |
| | — |
| | 815 |
| | 1,606 |
| | 2,421 |
| | (169 | ) | | 1977 | | 08/18/14 | | 6 to 30 Years |
| | Kennewick, WA | | (c) | | 353 |
| | 4,248 |
| | — |
| | — |
| | 353 |
| | 4,248 |
| | 4,601 |
| | (104 | ) | | 2011 | | 03/31/16 | | 13 to 40 Years |
| | Largo, FL | | (a) | | 150 |
| | 311 |
| | — |
| | — |
| | 150 |
| | 311 |
| | 461 |
| | (32 | ) | | 1962 | | 03/31/14 | | 15 to 30 Years |
| | Las Cruces, NM | | (c) | | 808 |
| | 6,045 |
| | — |
| | — |
| | 808 |
| | 6,045 |
| | 6,853 |
| | (702 | ) | | 2008 | | 07/17/13 | | 4 to 52 Years |
| | Las Vegas, NV | | (a) | | 430 |
| | 3,589 |
| | — |
| | — |
| | 430 |
| | 3,589 |
| | 4,019 |
| | (265 | ) | | 2002 | | 09/30/13 | | 15 to 50 Years |
| | Lewisville, TX | | (a) | | 1,766 |
| | 8,087 |
| | — |
| | — |
| | 1,766 |
| | 8,087 |
| | 9,853 |
| | (669 | ) | | 2002 | | 03/31/14 | | 8 to 40 Years |
| | Lincoln, NE | | (a) | | 711 |
| | 825 |
| | — |
| | — |
| | 711 |
| | 825 |
| | 1,536 |
| | (52 | ) | | 2010 | | 08/07/15 | | 8 to 40 Years |
| | Litchfield, IL | | (a) | | 210 |
| | 311 |
| | — |
| | — |
| | 210 |
| | 311 |
| | 521 |
| | (54 | ) | | 1962 | | 03/31/14 | | 15 to 20 Years |
| | Litchfield, IL | | (a) | | 110 |
| | 120 |
| | — |
| | — |
| | 110 |
| | 120 |
| | 230 |
| | (18 | ) | | 1962 | | 03/31/14 | | 15 to 20 Years |
| | Livingston, TX | | (c) | | 1,505 |
| | 7,616 |
| | — |
| | 32 |
| | 1,505 |
| | 7,648 |
| | 9,153 |
| | (164 | ) | | 2014 | | 03/30/16 | | 40 to 40 Years |
| | Logansport, IN | | (a) | | 30 |
| | 421 |
| | — |
| | — |
| | 30 |
| | 421 |
| | 451 |
| | (40 | ) | | 1920 | | 03/31/14 | | 15 to 30 Years |
| | Longview, TX | | (a) | | 200 |
| | 601 |
| | — |
| | — |
| | 200 |
| | 601 |
| | 801 |
| | (72 | ) | | 2003 | | 03/31/14 | | 15 to 30 Years |
| | Marion, IN | | (a) | | 140 |
| | 321 |
| | — |
| | — |
| | 140 |
| | 321 |
| | 461 |
| | (42 | ) | | 1988 | | 03/31/14 | | 15 to 30 Years |
| | Marion, IN | | (a) | | 130 |
| | 421 |
| | — |
| | — |
| | 130 |
| | 421 |
| | 551 |
| | (51 | ) | | 1974 | | 03/31/14 | | 15 to 30 Years |
| | Maryville, IL | | (a) | | 301 |
| | 401 |
| | — |
| | — |
| | 301 |
| | 401 |
| | 702 |
| | (51 | ) | | 1995 | | 03/31/14 | | 15 to 30 Years |
| | Mechanicsburg, PA | | (a) | | 230 |
| | 1,032 |
| | 152 |
| | — |
| | 382 |
| | 1,032 |
| | 1,414 |
| | (107 | ) | | 1990 | | 03/31/14 | | 15 to 30 Years |
| | Melbourne, FL | | (a) | | 321 |
| | 651 |
| | — |
| | — |
| | 321 |
| | 651 |
| | 972 |
| | (65 | ) | | 1987 | | 03/31/14 | | 15 to 30 Years |
| | Memphis, TN | | (a) | | 91 |
| | 490 |
| | — |
| | — |
| | 91 |
| | 490 |
| | 581 |
| | (49 | ) | | 1987 | | 04/08/14 | | 15 to 30 Years |
| | Mesa, AZ | | (a) | | 372 |
| | 1,398 |
| | — |
| | — |
| | 372 |
| | 1,398 |
| | 1,770 |
| | (110 | ) | | 2003 | | 09/30/13 | | 15 to 50 Years |
| | Middleburg, FL | | (c) | | 521 |
| | 2,589 |
| | — |
| | 65 |
| | 521 |
| | 2,654 |
| | 3,175 |
| | (277 | ) | | 1988 | | 08/18/14 | | 7 to 30 Years |
| | Midland, TX | | (a) | | 3,074 |
| | 2,033 |
| | — |
| | — |
| | 3,074 |
| | 2,033 |
| | 5,107 |
| | (42 | ) | | 2015 | | 06/20/16 | | 11 to 50 Years |
| | Monroe, GA | | (a) | | 110 |
| | 631 |
| | — |
| | — |
| | 110 |
| | 631 |
| | 741 |
| | (69 | ) | | 2001 | | 03/31/14 | | 15 to 30 Years |
| | Monroe, MI | | (c) | | 728 |
| | 3,440 |
| | — |
| | — |
| | 728 |
| | 3,440 |
| | 4,168 |
| | (404 | ) | | 2002 | | 08/18/14 | | 9 to 30 Years |
| | Naples, FL | | (a) | | 1,351 |
| | 5,368 |
| | — |
| | — |
| | 1,351 |
| | 5,368 |
| | 6,719 |
| | (663 | ) | | 2002 | | 08/30/12 | | 15 to 50 Years |
| | Naples, FL | | (a) | | 1,829 |
| | 4,522 |
| | — |
| | — |
| | 1,829 |
| | 4,522 |
| | 6,351 |
| | (668 | ) | | 1978 | | 08/30/12 | | 15 to 40 Years |
| | Naples, FL | | (a) | | 1,057 |
| | 3,845 |
| | — |
| | — |
| | 1,057 |
| | 3,845 |
| | 4,902 |
| | (489 | ) | | 2012 | | 10/31/12 | | 15 to 50 Years |
| | New Port Richey, FL | | (a) | | 274 |
| | 1,162 |
| | — |
| | — |
| | 274 |
| | 1,162 |
| | 1,436 |
| | (117 | ) | | 2004 | | 04/08/14 | | 15 to 30 Years |
| | New Port Richey, FL | | (a) | | 456 |
| | 1,151 |
| | — |
| | — |
| | 456 |
| | 1,151 |
| | 1,607 |
| | (131 | ) | | 2004 | | 04/08/14 | | 15 to 30 Years |
| | North Myrtle Beach, SC | | (a) | | 581 |
| | 601 |
| | — |
| | — |
| | 581 |
| | 601 |
| | 1,182 |
| | (84 | ) | | 2004 | | 03/31/14 | | 15 to 30 Years |
| | Ocala, FL | | (a) | | 23 |
| | 547 |
| | — |
| | — |
| | 23 |
| | 547 |
| | 570 |
| | (50 | ) | | 1984 | | 04/08/14 | | 30 to 30 Years |
| | Oelwein, IA | | (c) | | 226 |
| | 681 |
| | — |
| | — |
| | 226 |
| | 681 |
| | 907 |
| | (82 | ) | | 1995 | | 08/18/14 | | 5 to 30 Years |
|
| | | | | | | | | | | | | | | | | | | | | | | | | | | | | | | | | |
| Golden Corral | Colonial Heights, VA | | (a) | | 1,947 |
| | 500 |
| | 37 |
| | 1,463 |
| | 1,984 |
| | 1,963 |
| | 3,947 |
| | (180 | ) | | 1989 | | 10/25/13 | | 15 to 40 Years |
| Golden Corral | Lexington, NC | | (a) | | 910 |
| | 1,059 |
| | — |
| | — |
| | 910 |
| | 1,059 |
| | 1,969 |
| | (224 | ) | | 1998 | | 10/25/13 | | 15 to 30 Years |
| Golden Corral | Danville, VA | | (a) | | 957 |
| | 2,813 |
| | — |
| | — |
| | 957 |
| | 2,813 |
| | 3,770 |
| | (390 | ) | | 2009 | | 08/21/13 | | 15 to 40 Years |
| Golden Corral | Roanoke, VA | | (a) | | 1,362 |
| | 1,836 |
| | — |
| | — |
| | 1,362 |
| | 1,836 |
| | 3,198 |
| | (311 | ) | | 2000 | | 08/21/13 | | 15 to 30 Years |
| Golden Corral | Lynchburg, VA | | (a) | | 2,033 |
| | 2,013 |
| | — |
| | — |
| | 2,033 |
| | 2,013 |
| | 4,046 |
| | (402 | ) | | 2000 | | 08/21/13 | | 15 to 30 Years |
| Golden Corral | Decatur, AL | | (b) | | 1,157 |
| | 1,725 |
| | — |
| | — |
| | 1,157 |
| | 1,725 |
| | 2,882 |
| | (390 | ) | | 2004 | | 07/17/13 | | 10 to 30 Years |
| Golden Corral | Florence, AL | | (b) | | 794 |
| | 1,742 |
| | — |
| | — |
| | 794 |
| | 1,742 |
| | 2,536 |
| | (377 | ) | | 1995 | | 07/17/13 | | 8 to 27 Years |
| Gold's Gym | O'Fallon, IL | | (d) | | 2,243 |
| | 5,002 |
| | — |
| | — |
| | 2,243 |
| | 5,002 |
| | 7,245 |
| | (882 | ) | | 2005 | | 07/17/13 | | 6 to 37 Years |
| Gold's Gym | O' Fallon, MO | | (d) | | 1,669 |
| | 6,054 |
| | — |
| | — |
| | 1,669 |
| | 6,054 |
| | 7,723 |
| | (994 | ) | | 2007 | | 07/17/13 | | 9 to 34 Years |
| Gold's Gym | St. Peters, MO | | (d) | | 1,814 |
| | 5,810 |
| | — |
| | — |
| | 1,814 |
| | 5,810 |
| | 7,624 |
| | (1,070 | ) | | 2007 | | 07/17/13 | | 9 to 34 Years |
| Gold's Gym | Clifton, CO | | (a) | | 1,280 |
| | 6,975 |
| | — |
| | — |
| | 1,280 |
| | 6,975 |
| | 8,255 |
| | (641 | ) | | 1983 | | 06/30/15 | | 15 to 30 Years |
| Gold's Gym | Grand Junction, CO | | (a) | | 1,825 |
| | 10,478 |
| | — |
| | — |
| | 1,825 |
| | 10,478 |
| | 12,303 |
| | (653 | ) | | 2007 | | 11/05/15 | | 15 to 40 Years |
| Gold's Gym | Pawtucket, RI | | (a) | | 946 |
| | 3,093 |
| | — |
| | 28 |
| | 946 |
| | 3,121 |
| | 4,067 |
| | (230 | ) | | 1980 | | 06/28/16 | | 5 to 30 Years |
| Goodrich Quality Theaters | Portage, IN | | (a) | | 4,621 |
| | 8,300 |
| | — |
| | — |
| | 4,621 |
| | 8,300 |
| | 12,921 |
| | (3,562 | ) | | 2007 | | 06/30/09 | | 13 to 38 Years |
| Goodrich Quality Theaters | Batavia, IL | | (a) | | 4,705 |
| | 7,561 |
| | — |
| | — |
| | 4,705 |
| | 7,561 |
| | 12,266 |
| | (2,916 | ) | | 1995 | | 06/30/09 | | 11 to 38 Years |
| Goodrich Quality Theaters | Noblesville, IN | | (a) | | 1,760 |
| | — |
| | 2,338 |
| | 10,172 |
| | 4,098 |
| | 10,172 |
| | 14,270 |
| | (3,831 | ) | | 2008 | | 06/30/09 | | 14 to 39 Years |
| Goodrich Quality Theaters | Siginaw, MI | | (a) | | 2,538 |
| | 8,359 |
| | — |
| | — |
| | 2,538 |
| | 8,359 |
| | 10,897 |
| | (1,044 | ) | | 2013 | | 12/02/13 | | 15 to 50 Years |
| Goodrich Quality Theaters | Gibsonton, FL | | (d) | | 4,970 |
| | 4,014 |
| | — |
| | 7,505 |
| | 4,970 |
| | 11,519 |
| | 16,489 |
| | (388 | ) | | 2016 | | 11/05/15 | | 13 to 50 Years |
| Gordmans | Peoria, IL | | (d) | | 2,407 |
| | 5,452 |
| | (1,490 | ) | | (3,404 | ) | | 917 |
| | 2,048 |
| | 2,965 |
| | (59 | ) | | 2006 | | 07/17/13 | | 2 to 36 Years |
| Grand Sport Restaurant | Tulsa, OK | | (a) | | 983 |
| | 1,232 |
| | (497 | ) | | (573 | ) | | 486 |
| | 659 |
| | 1,145 |
| | (651 | ) | | 1976 | | 02/26/07 | | 14 to 30 Years |
| H&E Equipment Services | Corpus Christi, TX | | (d) | | 1,790 |
| | 1,267 |
| | — |
| | — |
| | 1,790 |
| | 1,267 |
| | 3,057 |
| | (376 | ) | | 2014 | | 09/30/14 | | 11 to 30 Years |
| Hajoca Corporation | D'Iberville, MS | | (a) | | 250 |
| | 339 |
| | — |
| | — |
| | 250 |
| | 339 |
| | 589 |
| | (218 | ) | | 1984 | | 05/01/05 | | 15 to 20 Years |
| Hajoca Corporation | Aiken, SC | | (a) | | 108 |
| | 265 |
| | — |
| | — |
| | 108 |
| | 265 |
| | 373 |
| | (154 | ) | | 1985 | | 05/01/05 | | 15 to 20 Years |
| Hajoca Corporation | Statesville, NC | | (a) | | 614 |
| | 355 |
| | — |
| | — |
| | 614 |
| | 355 |
| | 969 |
| | (432 | ) | | 1976 | | 05/01/05 | | 9 to 15 Years |
| Hajoca Corporation | Greenville, SC | | (a) | | 344 |
| | 210 |
| | — |
| | — |
| | 344 |
| | 210 |
| | 554 |
| | (272 | ) | | 1981 | | 05/01/05 | | 9 to 15 Years |
| Hajoca Corporation | West Columbia, SC | | (a) | | 262 |
| | 598 |
| | — |
| | — |
| | 262 |
| | 598 |
| | 860 |
| | (375 | ) | | 1984 | | 05/01/05 | | 9 to 20 Years |
| Hajoca Corporation | Sebring, FL | | (a) | | 318 |
| | 291 |
| | — |
| | — |
| | 318 |
| | 291 |
| | 609 |
| | (216 | ) | | 1982 | | 07/01/05 | | 15 to 20 Years |
SPIRIT REALTY CAPITAL, INC.
Schedule III Real Estate and
Accumulated Depreciation
(Amounts in thousands)
|
| | | | | | | | | | | | | | | | | | | | | | | | | |
| | | | | | Initial Cost to Company | | Cost Capitalized Subsequent to Acquisition including impairment | | Gross Amount at December 31, 2016 (d) 2017 (g) | | | | | | | | |
| Concept | City, State | | Encumbrances (e) | | Land and Improvements | | Buildings and Improvements | | Land and Improvements | | Buildings and Improvements | | Land and Improvements | | Buildings and Improvements | | Total | | Final Accumulated Depreciation | | Date of Construction | | Date Acquired | | Life in which depreciation in latest Statement of Operations is computed |
Description | | Encumbrances (e)
| | Land and
Improvements
| | Buildings and
Improvements
| | Improvements/
Land
| | Improvements/
building
| | Land and
Improvements
| | Buildings and
Improvements
| | Total | | Final
Accum
| | Date of
Construction
| | Date
Acquired
| |
|
| | | | | | | | | | | | | | | | | | | | | | | | | | | | | | | | | |
| | Ogden, UT | | (c) | | 597 |
| | 2,331 |
| | — |
| | — |
| | 597 |
| | 2,331 |
| | 2,928 |
| | (265 | ) | | 1985 | | 08/18/14 | | 7 to 30 Years |
| | Okeechobee, FL | | (a) | | 190 |
| | 521 |
| | — |
| | — |
| | 190 |
| | 521 |
| | 711 |
| | (53 | ) | | 1990 | | 03/31/14 | | 15 to 30 Years |
| | Orange, TX | | (a) | | 389 |
| | 2,090 |
| | — |
| | — |
| | 389 |
| | 2,090 |
| | 2,479 |
| | (36 | ) | | 2015 | | 06/20/16 | | 10 to 50 Years |
| | Orlando, FL | | (a) | | 291 |
| | 230 |
| | — |
| | — |
| | 291 |
| | 230 |
| | 521 |
| | (27 | ) | | 1979 | | 03/31/14 | | 15 to 30 Years |
| | Osceola, IN | | (a) | | 291 |
| | 671 |
| | — |
| | — |
| | 291 |
| | 671 |
| | 962 |
| | (79 | ) | | 1996 | | 03/31/14 | | 15 to 40 Years |
| | Oxford, MS | | (a) | | 1,416 |
| | 4,451 |
| | — |
| | — |
| | 1,416 |
| | 4,451 |
| | 5,867 |
| | (363 | ) | | 2001 | | 05/15/14 | | 15 to 40 Years |
| | Pataskala, OH | | (a) | | 261 |
| | 782 |
| | — |
| | — |
| | 261 |
| | 782 |
| | 1,043 |
| | (68 | ) | | 1995 | | 03/31/14 | | 15 to 40 Years |
| | Phoenix, AZ | | (a) | | 352 |
| | 2,435 |
| | — |
| | — |
| | 352 |
| | 2,435 |
| | 2,787 |
| | (171 | ) | | 1973 | | 09/30/13 | | 15 to 50 Years |
| | Port Arthur, TX | | (a) | | 468 |
| | 2,057 |
| | — |
| | — |
| | 468 |
| | 2,057 |
| | 2,525 |
| | (230 | ) | | 1997 | | 03/31/14 | | 15 to 30 Years |
| | Raytown, MO | | (a) | | 80 |
| | 631 |
| | — |
| | — |
| | 80 |
| | 631 |
| | 711 |
| | (67 | ) | | 1989 | | 03/31/14 | | 15 to 30 Years |
| | Rio Rancho, NM | | (a) | | 301 |
| | 461 |
| | — |
| | — |
| | 301 |
| | 461 |
| | 762 |
| | (55 | ) | | 1992 | | 03/31/14 | | 15 to 30 Years |
| | Rogers, AR | | (a) | | 2,014 |
| | 2,313 |
| | — |
| | — |
| | 2,014 |
| | 2,313 |
| | 4,327 |
| | (354 | ) | | 1988 | | 11/14/13 | | 13 to 30 Years |
| | Round Rock, TX | | (c) | | 271 |
| | 728 |
| | — |
| | — |
| | 271 |
| | 728 |
| | 999 |
| | (62 | ) | | 1985 | | 08/18/14 | | 8 to 40 Years |
| | Sandy Springs, GA | | (a) | | 455 |
| | 1,147 |
| | — |
| | — |
| | 455 |
| | 1,147 |
| | 1,602 |
| | (165 | ) | | 1963 | | 04/17/14 | | 14 to 20 Years |
| | Schertz, TX | | (a) | | 2,596 |
| | 9,944 |
| | — |
| | — |
| | 2,596 |
| | 9,944 |
| | 12,540 |
| | (770 | ) | | 2013 | | 05/16/14 | | 13 to 40 Years |
| | Sherman, TX | | (a) | | 1,249 |
| | 4,713 |
| | — |
| | — |
| | 1,249 |
| | 4,713 |
| | 5,962 |
| | (217 | ) | | 2013 | | 06/30/15 | | 15 to 40 Years |
| | South Bend, IN | | (a) | | 341 |
| | 321 |
| | — |
| | — |
| | 341 |
| | 321 |
| | 662 |
| | (57 | ) | | 1955 | | 03/31/14 | | 15 to 20 Years |
| | Spartanburg, SC | | (a) | | 150 |
| | 401 |
| | — |
| | — |
| | 150 |
| | 401 |
| | 551 |
| | (44 | ) | | 1992 | | 03/31/14 | | 15 to 30 Years |
| | Springfield, IL | | (a) | | 451 |
| | 1,162 |
| | — |
| | — |
| | 451 |
| | 1,162 |
| | 1,613 |
| | (132 | ) | | 1992 | | 03/31/14 | | 15 to 30 Years |
| | Springfield, MO | | (a) | | 561 |
| | 631 |
| | — |
| | — |
| | 561 |
| | 631 |
| | 1,192 |
| | (76 | ) | | 1996 | | 03/31/14 | | 15 to 30 Years |
| | Springfield, MO | | (c) | | 2,025 |
| | 3,911 |
| | — |
| | — |
| | 2,025 |
| | 3,911 |
| | 5,936 |
| | (459 | ) | | 1990 | | 09/23/14 | | 7 to 30 Years |
| | St. John, MO | | (c) | | 1,733 |
| | 3,095 |
| | 91 |
| | 365 |
| | 1,824 |
| | 3,460 |
| | 5,284 |
| | (600 | ) | | 1996 | | 07/17/13 | | 1 to 43 Years |
| | Steubenville, OH | | (c) | | 363 |
| | 3,726 |
| | — |
| | — |
| | 363 |
| | 3,726 |
| | 4,089 |
| | (264 | ) | | 2009 | | 08/18/14 | | 14 to 40 Years |
| | Tyler, TX | | (a) | | 1,526 |
| | 2,374 |
| | — |
| | — |
| | 1,526 |
| | 2,374 |
| | 3,900 |
| | (41 | ) | | 2015 | | 06/20/16 | | 11 to 50 Years |
| | Vernon Hills, IL | | (a) | | 992 |
| | 5,020 |
| | — |
| | — |
| | 992 |
| | 5,020 |
| | 6,012 |
| | (515 | ) | | 1991 | | 03/31/14 | | 15 to 30 Years |
| | Vero Beach, FL | | (a) | | 220 |
| | 731 |
| | — |
| | — |
| | 220 |
| | 731 |
| | 951 |
| | (74 | ) | | 1974 | | 03/31/14 | | 15 to 30 Years |
| | Vicksburg, MS | | (a) | | 150 |
| | 351 |
| | — |
| | — |
| | 150 |
| | 351 |
| | 501 |
| | (45 | ) | | 1984 | | 03/31/14 | | 15 to 30 Years |
| | Waco, TX | | (a) | | 232 |
| | 1,510 |
| | — |
| | — |
| | 232 |
| | 1,510 |
| | 1,742 |
| | (106 | ) | | 1992 | | 06/20/14 | | 15 to 40 Years |
| | Warren, IN | | (c) | | 220 |
| | 278 |
| | — |
| | — |
| | 220 |
| | 278 |
| | 498 |
| | (55 | ) | | 2007 | | 08/18/14 | | 4 to 20 Years |
| | Watkins Glen, NY | | (c) | | 113 |
| | 318 |
| | — |
| | — |
| | 113 |
| | 318 |
| | 431 |
| | (27 | ) | | 2002 | | 04/30/15 | | 15 to 30 Years |
| | Waynesboro, PA | | (a) | | 100 |
| | 601 |
| | — |
| | — |
| | 100 |
| | 601 |
| | 701 |
| | (49 | ) | | 1957 | | 03/31/14 | | 15 to 40 Years |
| | Westfield, IN | | (a) | | 362 |
| | 751 |
| | — |
| | — |
| | 362 |
| | 751 |
| | 1,113 |
| | (77 | ) | | 1992 | | 03/31/14 | | 15 to 40 Years |
| | Wharton, TX | | (c) | | 192 |
| | 1,090 |
| | — |
| | — |
| | 192 |
| | 1,090 |
| | 1,282 |
| | (96 | ) | | 2009 | | 08/18/14 | | 15 to 40 Years |
| | Wittenberg, WI | | (a) | | 41 |
| | 210 |
| | — |
| | — |
| | 41 |
| | 210 |
| | 251 |
| | (21 | ) | | 1982 | | 03/31/14 | | 15 to 30 Years |
| | Wylie, TX | | (a) | | 210 |
| | 912 |
| | — |
| | — |
| | 210 |
| | 912 |
| | 1,122 |
| | (96 | ) | | 1986 | | 03/31/14 | | 15 to 30 Years |
| | York, PA | | (a) | | 100 |
| | 481 |
| | — |
| | — |
| | 100 |
| | 481 |
| | 581 |
| | (50 | ) | | 1984 | | 03/31/14 | | 15 to 30 Years |
|
| | | | | | | | | | | | | | | | | | | | | | | | | | | | | | | | | |
| Hardee's | East Ellijay, GA | | (a) | | 562 |
| | 354 |
| | — |
| | — |
| | 562 |
| | 354 |
| | 916 |
| | (270 | ) | | 1984 | | 12/29/05 | | 15 to 20 Years |
| Hardee's | Paxton, IL | | (a) | | 324 |
| | 658 |
| | — |
| | — |
| | 324 |
| | 658 |
| | 982 |
| | (505 | ) | | 1986 | | 12/29/05 | | 15 to 20 Years |
| Hardee's | Adairsville, GA | | (a) | | 557 |
| | 318 |
| | — |
| | — |
| | 557 |
| | 318 |
| | 875 |
| | (195 | ) | | 1986 | | 09/29/06 | | 15 to 20 Years |
| Hardee's | Parkersburg, WV | | (a) | | 416 |
| | 658 |
| | — |
| | 75 |
| | 416 |
| | 733 |
| | 1,149 |
| | (486 | ) | | 1986 | | 03/07/07 | | 4 to 20 Years |
| Hardee's | Watertown, WI | | (a) | | 267 |
| | 338 |
| | — |
| | — |
| | 267 |
| | 338 |
| | 605 |
| | (205 | ) | | 1986 | | 06/30/09 | | 13 to 18 Years |
| Hardee's | Mayfield, KY | | (a) | | 316 |
| | 603 |
| | — |
| | — |
| | 316 |
| | 603 |
| | 919 |
| | (335 | ) | | 1986 | | 12/08/09 | | 12 to 27 Years |
| Hardee's | South Charleston, WV | | (b) | | 524 |
| | 541 |
| | — |
| | — |
| | 524 |
| | 541 |
| | 1,065 |
| | (168 | ) | | 1993 | | 12/21/12 | | 15 to 20 Years |
| Hardee's | Weston, WV | | (b) | | 158 |
| | 695 |
| | — |
| | — |
| | 158 |
| | 695 |
| | 853 |
| | (148 | ) | | 1981 | | 12/21/12 | | 15 to 30 Years |
| Hardee's | Buckhannon, WV | | (b) | | 438 |
| | 529 |
| | — |
| | — |
| | 438 |
| | 529 |
| | 967 |
| | (177 | ) | | 1978 | | 12/21/12 | | 15 to 20 Years |
| Hardee's | Kingwood, WV | | (b) | | 618 |
| | 677 |
| | — |
| | — |
| | 618 |
| | 677 |
| | 1,295 |
| | (229 | ) | | 1979 | | 12/21/12 | | 15 to 20 Years |
| Hardee's | Waynesburg, PA | | (b) | | 323 |
| | 918 |
| | — |
| | — |
| | 323 |
| | 918 |
| | 1,241 |
| | (221 | ) | | 1982 | | 12/21/12 | | 15 to 30 Years |
| Hardee's | So. Parkersburg, WV | | (b) | | 383 |
| | 404 |
| | — |
| | — |
| | 383 |
| | 404 |
| | 787 |
| | (138 | ) | | 1986 | | 12/21/12 | | 15 to 20 Years |
| Hardee's | Bristol, VA | | (b) | | 492 |
| | 366 |
| | — |
| | — |
| | 492 |
| | 366 |
| | 858 |
| | (169 | ) | | 1982 | | 12/21/12 | | 15 to 20 Years |
| Hardee's | Parkersburg, WV | | (b) | | 457 |
| | 309 |
| | — |
| | — |
| | 457 |
| | 309 |
| | 766 |
| | (204 | ) | | 1999 | | 12/21/12 | | 10 to 15 Years |
| Hardee's | Bristol, TN | | (b) | | 474 |
| | 282 |
| | — |
| | — |
| | 474 |
| | 282 |
| | 756 |
| | (178 | ) | | 1985 | | 12/21/12 | | 10 to 15 Years |
| Hardee's | Mount Carmel, TN | | (b) | | 499 |
| | 536 |
| | — |
| | — |
| | 499 |
| | 536 |
| | 1,035 |
| | (162 | ) | | 1988 | | 12/21/12 | | 15 to 30 Years |
| Hardee's | Philippi, WV | | (b) | | 405 |
| | 232 |
| | — |
| | — |
| | 405 |
| | 232 |
| | 637 |
| | (166 | ) | | 1986 | | 12/21/12 | | 10 to 15 Years |
| Hardee's | Elizabethton, TN | | (b) | | 735 |
| | 278 |
| | — |
| | — |
| | 735 |
| | 278 |
| | 1,013 |
| | (127 | ) | | 1971 | | 12/21/12 | | 15 to 20 Years |
| Hardee's | Johnson City, TN | | (b) | | 718 |
| | 450 |
| | — |
| | — |
| | 718 |
| | 450 |
| | 1,168 |
| | (206 | ) | | 1983 | | 12/21/12 | | 15 to 20 Years |
| Hardee's | Bristol, VA | | (b) | | 369 |
| | 564 |
| | — |
| | — |
| | 369 |
| | 564 |
| | 933 |
| | (190 | ) | | 1991 | | 12/21/12 | | 15 to 20 Years |
| Hardee's | Rogersville, TN | | (b) | | 384 |
| | 964 |
| | — |
| | — |
| | 384 |
| | 964 |
| | 1,348 |
| | (229 | ) | | 1986 | | 12/21/12 | | 15 to 30 Years |
| Hardee's | Jonesborough, TN | | (b) | | 576 |
| | 329 |
| | — |
| | — |
| | 576 |
| | 329 |
| | 905 |
| | (136 | ) | | 1987 | | 12/21/12 | | 15 to 20 Years |
| Hardee's | Kingsport, TN | | (b) | | 384 |
| | 877 |
| | — |
| | — |
| | 384 |
| | 877 |
| | 1,261 |
| | (210 | ) | | 1992 | | 12/21/12 | | 15 to 30 Years |
| Hardee's | Eureka, IL | | (b) | | 307 |
| | 338 |
| | — |
| | — |
| | 307 |
| | 338 |
| | 645 |
| | (238 | ) | | 1980 | | 12/21/12 | | 10 to 15 Years |
| Hardee's | Peoria, IL | | (b) | | 383 |
| | 270 |
| | — |
| | — |
| | 383 |
| | 270 |
| | 653 |
| | (176 | ) | | 1980 | | 12/21/12 | | 10 to 15 Years |
| Hardee's | Bartonville, IL | | (b) | | 410 |
| | 856 |
| | — |
| | — |
| | 410 |
| | 856 |
| | 1,266 |
| | (223 | ) | | 1980 | | 12/21/12 | | 15 to 30 Years |
| Hardee's | Fort Madison, IA | | (b) | | 191 |
| | 620 |
| | — |
| | — |
| | 191 |
| | 620 |
| | 811 |
| | (143 | ) | | 1980 | | 12/21/12 | | 15 to 30 Years |
| Hardee's | Havana, IL | | (b) | | 439 |
| | 297 |
| | — |
| | — |
| | 439 |
| | 297 |
| | 736 |
| | (230 | ) | | 1980 | | 12/21/12 | | 10 to 15 Years |
| Hardee's | Washington, IL | | (b) | | 264 |
| | 460 |
| | — |
| | — |
| | 264 |
| | 460 |
| | 724 |
| | (159 | ) | | 1980 | | 12/21/12 | | 15 to 20 Years |
| Hardee's | Normal, IL | | (b) | | 394 |
| | 240 |
| | — |
| | — |
| | 394 |
| | 240 |
| | 634 |
| | (153 | ) | | 1980 | | 12/21/12 | | 10 to 15 Years |
| Hardee's | Peoria, IL | | (b) | | 282 |
| | 435 |
| | — |
| | — |
| | 282 |
| | 435 |
| | 717 |
| | (154 | ) | | 1980 | | 12/21/12 | | 15 to 20 Years |
SPIRIT REALTY CAPITAL, INC.
Schedule III Real Estate and
Accumulated Depreciation
(Amounts in thousands)
|
| | | | | | | | | | | | | | | | | | | | | | | | | |
| | | | | | Initial Cost to Company | | Cost Capitalized Subsequent to Acquisition including impairment | | Gross Amount at December 31, 2016 (d) 2017 (g) | | | | | | | | |
| Concept | City, State | | Encumbrances (e) | | Land and Improvements | | Buildings and Improvements | | Land and Improvements | | Buildings and Improvements | | Land and Improvements | | Buildings and Improvements | | Total | | Final Accumulated Depreciation | | Date of Construction | | Date Acquired | | Life in which depreciation in latest Statement of Operations is computed |
Description | | Encumbrances (e)
| | Land and
Improvements
| | Buildings and
Improvements
| | Improvements/
Land
| | Improvements/
building
| | Land and
Improvements
| | Buildings and
Improvements
| | Total | | Final
Accum
| | Date of
Construction
| | Date
Acquired
| |
|
| | | | | | | | | | | | | | | | | | | | | | | | | | | | | | | | | |
| | Amherst, NY | | (b) | | 1,868 |
| | 7,503 |
| | (1,069 | ) | | (4,385 | ) | | 799 |
| | 3,118 |
| | 3,917 |
| | (736 | ) | | 1993 | | 07/17/13 | | 2 to 40 Years |
| | Ankeny, IA | | (b) | | 3,913 |
| | 3,671 |
| | — |
| | — |
| | 3,913 |
| | 3,671 |
| | 7,584 |
| | (730 | ) | | 2003 | | 10/15/12 | | 15 to 30 Years |
| | Bend, OR | | (a) | | 1,516 |
| | 4,850 |
| | — |
| | — |
| | 1,516 |
| | 4,850 |
| | 6,366 |
| | (484 | ) | | 2000 | | 08/15/13 | | 10 to 50 Years |
| | Biloxi, MS | | (c) | | 3,274 |
| | 627 |
| | — |
| | — |
| | 3,274 |
| | 627 |
| | 3,901 |
| | — |
| | 2016 | | 12/22/16 | | 16 to 16 Years |
| | Colorado Springs, CO | | (c) | | 2,568 |
| | 4,842 |
| | — |
| | — |
| | 2,568 |
| | 4,842 |
| | 7,410 |
| | (73 | ) | | 2005 | | 08/31/16 | | 10 to 40 Years |
| | Greenville, TX | | (a) | | 2,229 |
| | 5,181 |
| | — |
| | — |
| | 2,229 |
| | 5,181 |
| | 7,410 |
| | (19 | ) | | 2016 | | 12/07/16 | | 14 to 40 Years |
| | Houston, TX | | (c) | | 2,060 |
| | 1,248 |
| | — |
| | — |
| | 2,060 |
| | 1,248 |
| | 3,308 |
| | (47 | ) | | 1995 | | 07/17/13 | | 40 to 40 Years |
| | Katy, TX | | (c) | | 13,144 |
| | 96,194 |
| | — |
| | — |
| | 13,144 |
| | 96,194 |
| | 109,338 |
| | (11,000 | ) | | 1976 | | 07/17/13 | | 8 to 34 Years |
| | Kenosha, WI | | (a) | | 3,421 |
| | 7,407 |
| | — |
| | — |
| | 3,421 |
| | 7,407 |
| | 10,828 |
| | (2,431 | ) | | 2004 | | 07/01/05 | | 14 to 40 Years |
| | Loveland, CO | | (b) | | 2,329 |
| | 4,750 |
| | — |
| | — |
| | 2,329 |
| | 4,750 |
| | 7,079 |
| | (800 | ) | | 2001 | | 10/15/12 | | 15 to 30 Years |
| | Lufkin, TX | | (b) | | 1,922 |
| | 2,735 |
| | — |
| | — |
| | 1,922 |
| | 2,735 |
| | 4,657 |
| | (481 | ) | | 2003 | | 07/17/13 | | 9 to 30 Years |
| | Macon, GA | | (c) | | 1,921 |
| | 4,890 |
| | — |
| | — |
| | 1,921 |
| | 4,890 |
| | 6,811 |
| | (795 | ) | | 2005 | | 07/17/13 | | 10 to 30 Years |
| | Mesa, AZ | | (b) | | 2,040 |
| | 5,696 |
| | — |
| | — |
| | 2,040 |
| | 5,696 |
| | 7,736 |
| | (963 | ) | | 2005 | | 10/15/12 | | 15 to 30 Years |
| | Midvale, UT | | (b) | | 2,931 |
| | 4,844 |
| | — |
| | — |
| | 2,931 |
| | 4,844 |
| | 7,775 |
| | (842 | ) | | 2002 | | 10/15/12 | | 15 to 30 Years |
| | Monticello, MN | | (c) | | 3,873 |
| | 768 |
| | — |
| | — |
| | 3,873 |
| | 768 |
| | 4,641 |
| | — |
| | 2016 | | 12/29/16 | | 15 to 30 Years |
| | N. Richland Hills, TX | | (c) | | 1,950 |
| | 5,451 |
| | — |
| | — |
| | 1,950 |
| | 5,451 |
| | 7,401 |
| | (106 | ) | | 1996 | | 07/17/13 | | 30 to 30 Years |
| | New Hartford, NY | | (a) | | 2,168 |
| | 4,851 |
| | — |
| | — |
| | 2,168 |
| | 4,851 |
| | 7,019 |
| | (2,016 | ) | | 2004 | | 07/01/05 | | 14 to 40 Years |
| | Newnan, GA | | (c) | | 2,938 |
| | 4,472 |
| | — |
| | 318 |
| | 2,938 |
| | 4,790 |
| | 7,728 |
| | (320 | ) | | 2014 | | 07/03/14 | | 15 to 40 Years |
| | Opelika, AL | | (b) | | 2,117 |
| | 5,737 |
| | — |
| | — |
| | 2,117 |
| | 5,737 |
| | 7,854 |
| | (681 | ) | | 2012 | | 06/14/13 | | 14 to 40 Years |
| | Phoenix, AZ | | (b) | | 2,098 |
| | 5,338 |
| | — |
| | — |
| | 2,098 |
| | 5,338 |
| | 7,436 |
| | (920 | ) | | 2003 | | 10/15/12 | | 15 to 30 Years |
| | Pocatello, ID | | (b) | | 3,682 |
| | 10,658 |
| | — |
| | — |
| | 3,682 |
| | 10,658 |
| | 14,340 |
| | (1,659 | ) | | 2006 | | 07/17/13 | | 5 to 38 Years |
| | Saukville, WI | | (a) | | 2,061 |
| | 4,794 |
| | — |
| | — |
| | 2,061 |
| | 4,794 |
| | 6,855 |
| | (476 | ) | | 2014 | | 09/30/14 | | 15 to 40 Years |
| | Soldotna, AK | | (a) | | 1,177 |
| | 2,245 |
| | — |
| | — |
| | 1,177 |
| | 2,245 |
| | 3,422 |
| | (181 | ) | | 1983 | | 05/22/14 | | 15 to 40 Years |
| | Thornton, CO | | (b) | | 2,836 |
| | 5,069 |
| | — |
| | — |
| | 2,836 |
| | 5,069 |
| | 7,905 |
| | (948 | ) | | 2003 | | 10/15/12 | | 15 to 30 Years |
| | Tulsa, OK | | (c) | | 4,569 |
| | 87 |
| | — |
| | — |
| | 4,569 |
| | 87 |
| | 4,656 |
| | — |
| | 2016 | | 12/15/16 | | 11 to 40 Years |
| | Tuscaloosa, AL | | (b) | | 3,321 |
| | 4,053 |
| | — |
| | — |
| | 3,321 |
| | 4,053 |
| | 7,374 |
| | (401 | ) | | 2013 | | 09/30/13 | | 14 to 50 Years |
| | Valdosta, GA | | (b) | | 2,930 |
| | 5,012 |
| | — |
| | — |
| | 2,930 |
| | 5,012 |
| | 7,942 |
| | (644 | ) | | 2012 | | 06/14/13 | | 14 to 40 Years |
| | Waite Park, MN | | (c) | | 4,919 |
| | 25,384 |
| | — |
| | 54 |
| | 4,919 |
| | 25,438 |
| | 30,357 |
| | (683 | ) | | 1979 | | 06/09/16 | | 4 to 40 Years |
| | Wentzville, MO | | (c) | | 2,040 |
| | 5,133 |
| | — |
| | 1,264 |
| | 2,040 |
| | 6,397 |
| | 8,437 |
| | (161 | ) | | 2015 | | 03/27/15 | | 39 to 40 Years |
| | Williston, ND | | (c) | | 2,190 |
| | 4,132 |
| | — |
| | — |
| | 2,190 |
| | 4,132 |
| | 6,322 |
| | (167 | ) | | 2015 | | 08/24/15 | | 15 to 50 Years |
|
| | | | | | | | | | | | | | | | | | | | | | | | | | | | | | | | | |
| Hardee's | Hawkinsville, GA | | (a) | | 169 |
| | 946 |
| | — |
| | — |
| | 169 |
| | 946 |
| | 1,115 |
| | (158 | ) | | 1986 | | 12/24/13 | | 15 to 30 Years |
| Hardee's | Atlanta, GA | | (a) | | 309 |
| | 867 |
| | — |
| | — |
| | 309 |
| | 867 |
| | 1,176 |
| | (147 | ) | | 1994 | | 12/24/13 | | 15 to 30 Years |
| Hardee's | Monroe, GA | | (a) | | 618 |
| | 787 |
| | — |
| | — |
| | 618 |
| | 787 |
| | 1,405 |
| | (150 | ) | | 1977 | | 12/24/13 | | 15 to 30 Years |
| Hardee's | Warner Robins, GA | | (a) | | 229 |
| | 887 |
| | — |
| | — |
| | 229 |
| | 887 |
| | 1,116 |
| | (161 | ) | | 1978 | | 12/24/13 | | 15 to 30 Years |
| Hardee's | Griffin, GA | | (a) | | 249 |
| | 877 |
| | — |
| | — |
| | 249 |
| | 877 |
| | 1,126 |
| | (146 | ) | | 1979 | | 12/24/13 | | 15 to 30 Years |
| Hardee's | Commerce, GA | | (a) | | 219 |
| | 797 |
| | — |
| | — |
| | 219 |
| | 797 |
| | 1,016 |
| | (138 | ) | | 1990 | | 12/24/13 | | 15 to 30 Years |
| Hardee's | Forsyth, GA | | (a) | | 249 |
| | 936 |
| | — |
| | — |
| | 249 |
| | 936 |
| | 1,185 |
| | (162 | ) | | 1983 | | 12/24/13 | | 15 to 30 Years |
| Hardee's | Cumming, GA | | (a) | | 408 |
| | 827 |
| | — |
| | — |
| | 408 |
| | 827 |
| | 1,235 |
| | (150 | ) | | 1988 | | 12/24/13 | | 15 to 30 Years |
| Hardee's | McDonough, GA | | (a) | | 179 |
| | 806 |
| | — |
| | 1 |
| | 179 |
| | 807 |
| | 986 |
| | (134 | ) | | 1989 | | 12/24/13 | | 15 to 30 Years |
| Hardee's | McDonough, GA | | (a) | | 418 |
| | 847 |
| | — |
| | — |
| | 418 |
| | 847 |
| | 1,265 |
| | (158 | ) | | 1995 | | 12/24/13 | | 15 to 30 Years |
| Hardee's | Moultrie, GA | | (a) | | 359 |
| | 827 |
| | — |
| | — |
| | 359 |
| | 827 |
| | 1,186 |
| | (139 | ) | | 1997 | | 12/24/13 | | 15 to 30 Years |
| Hardee's | Thomasville, GA | | (a) | | 408 |
| | 837 |
| | — |
| | — |
| | 408 |
| | 837 |
| | 1,245 |
| | (143 | ) | | 1985 | | 12/24/13 | | 15 to 30 Years |
| Hardee's | Quitman, GA | | (a) | | 259 |
| | 936 |
| | — |
| | — |
| | 259 |
| | 936 |
| | 1,195 |
| | (157 | ) | | 1985 | | 12/24/13 | | 15 to 30 Years |
| Hardee's | Graceville, FL | | (a) | | 279 |
| | 1,036 |
| | — |
| | — |
| | 279 |
| | 1,036 |
| | 1,315 |
| | (186 | ) | | 1985 | | 12/24/13 | | 15 to 30 Years |
| Hardee's | Pearson, GA | | (a) | | 159 |
| | 817 |
| | — |
| | — |
| | 159 |
| | 817 |
| | 976 |
| | (141 | ) | | 1994 | | 12/24/13 | | 15 to 30 Years |
| Hardee's | Emporia, KS | | (a) | | 508 |
| | 1,175 |
| | — |
| | — |
| | 508 |
| | 1,175 |
| | 1,683 |
| | (205 | ) | | 1969 | | 12/24/13 | | 15 to 30 Years |
| Hardee's | Rolla, MO | | (a) | | 229 |
| | 857 |
| | — |
| | — |
| | 229 |
| | 857 |
| | 1,086 |
| | (146 | ) | | 1978 | | 12/24/13 | | 15 to 30 Years |
| Hardee's | Independence, MO | | (a) | | 279 |
| | 936 |
| | — |
| | — |
| | 279 |
| | 936 |
| | 1,215 |
| | (157 | ) | | 1979 | | 12/24/13 | | 15 to 30 Years |
| Hardee's | Kansas City, MO | | (a) | | 538 |
| | 936 |
| | — |
| | — |
| | 538 |
| | 936 |
| | 1,474 |
| | (167 | ) | | 1979 | | 12/24/13 | | 15 to 30 Years |
| Hardee's | Kansas City, KS | | (a) | | 289 |
| | 1,066 |
| | — |
| | — |
| | 289 |
| | 1,066 |
| | 1,355 |
| | (179 | ) | | 1980 | | 12/24/13 | | 15 to 30 Years |
| Hardee's | Trenton, MO | | (a) | | 309 |
| | 1,175 |
| | — |
| | — |
| | 309 |
| | 1,175 |
| | 1,484 |
| | (197 | ) | | 1976 | | 12/24/13 | | 15 to 30 Years |
| Hardee's | Harrisonville, MO | | (a) | | 369 |
| | 1,195 |
| | — |
| | — |
| | 369 |
| | 1,195 |
| | 1,564 |
| | (202 | ) | | 1981 | | 12/24/13 | | 15 to 30 Years |
| Hardee's | Lees Summit, MO | | (a) | | 319 |
| | 906 |
| | — |
| | — |
| | 319 |
| | 906 |
| | 1,225 |
| | (158 | ) | | 1985 | | 12/24/13 | | 15 to 30 Years |
| Hardee's | Columbia, MO | | (a) | | 339 |
| | 1,126 |
| | — |
| | — |
| | 339 |
| | 1,126 |
| | 1,465 |
| | (182 | ) | | 1985 | | 12/24/13 | | 15 to 30 Years |
| Harp's Marketplace | Fort Smith, AR | | (a) | | 837 |
| | 1,831 |
| | — |
| | — |
| | 837 |
| | 1,831 |
| | 2,668 |
| | (395 | ) | | 1994 | | 04/30/14 | | 3 to 20 Years |
| Hartford Provision Company | South Windsor, CT | | (d) | | 1,590 |
| | 6,774 |
| | — |
| | 502 |
| | 1,590 |
| | 7,276 |
| | 8,866 |
| | (1,013 | ) | | 1982 | | 05/05/15 | | 7 to 20 Years |
| Havana Farm and Home Supply | Havana, IL | | (d) | | 526 |
| | 813 |
| | — |
| | — |
| | 526 |
| | 813 |
| | 1,339 |
| | (445 | ) | | 2000 | | 05/31/06 | | 15 to 30 Years |
| HD Supply | West Columbia, SC | | (a) | | 324 |
| | 108 |
| | — |
| | — |
| | 324 |
| | 108 |
| | 432 |
| | (88 | ) | | 1989 | | 05/01/05 | | 15 to 20 Years |
| HD Supply | Tontitown, AR | | (a) | | 230 |
| | 92 |
| | — |
| | — |
| | 230 |
| | 92 |
| | 322 |
| | (91 | ) | | 1987 | | 05/01/05 | | 15 to 20 Years |
| HD Supply | Indianapolis, IN | | (a) | | 607 |
| | 520 |
| | — |
| | — |
| | 607 |
| | 520 |
| | 1,127 |
| | (380 | ) | | 1990 | | 05/01/05 | | 15 to 20 Years |
SPIRIT REALTY CAPITAL, INC.
Schedule III Real Estate and
Accumulated Depreciation
(Amounts in thousands)
|
| | | | | | | | | | | | | | | | | | | | | | | | | | | | | | | | | |
| Health and Fitness | | | | | | | | | | | | | | | | | | | | | | |
| | Albuquerque, NM | | (c) | | 1,915 |
| | 3,724 |
| | — |
| | — |
| | 1,915 |
| | 3,724 |
| | 5,639 |
| | (243 | ) | | 1995 | | 04/23/15 | | 15 to 30 Years |
| | Albuquerque, NM | | (c) | | 2,391 |
| | 4,008 |
| | — |
| | — |
| | 2,391 |
| | 4,008 |
| | 6,399 |
| | (270 | ) | | 2001 | | 04/23/15 | | 15 to 30 Years |
| | Albuquerque, NM | | (c) | | 4,732 |
| | 6,845 |
| | — |
| | — |
| | 4,732 |
| | 6,845 |
| | 11,577 |
| | (394 | ) | | 1972 | | 04/23/15 | | 15 to 40 Years |
| | Aurora, CO | | (c) | | 1,452 |
| | 4,413 |
| | — |
| | — |
| | 1,452 |
| | 4,413 |
| | 5,865 |
| | (562 | ) | | 1995 | | 07/17/13 | | 11 to 30 Years |
| | Aurora, IL | | (a) | | 668 |
| | 2,615 |
| | — |
| | 23 |
| | 668 |
| | 2,638 |
| | 3,306 |
| | (12 | ) | | 2006 | | 11/29/16 | | 9 to 30 Years |
|
| | | | | | | | | | | | | | | | | | | | | | | | | |
| | | | | | Initial Cost to Company | | Cost Capitalized Subsequent to Acquisition including impairment | | Gross Amount at December 31, 2016 (d) 2017 (g) | | | | | | | | |
| Concept | City, State | | Encumbrances (e) | | Land and Improvements | | Buildings and Improvements | | Land and Improvements | | Buildings and Improvements | | Land and Improvements | | Buildings and Improvements | | Total | | Final Accumulated Depreciation | | Date of Construction | | Date Acquired | | Life in which depreciation in latest Statement of Operations is computed |
Description | | Encumbrances (e)
| | Land and
Improvements
| | Buildings and
Improvements
| | Improvements/
Land
| | Improvements/
building
| | Land and
Improvements
| | Buildings and
Improvements
| | Total | | Final
Accum
| | Date of
Construction
| | Date
Acquired
| |
|
| | | | | | | | | | | | | | | | | | | | | | | | | | | | | | | | | |
| | Boise, ID | | (c) | | 1,335 |
| | 4,982 |
| | — |
| | — |
| | 1,335 |
| | 4,982 |
| | 6,317 |
| | — |
| | 2001 | | 12/28/16 | | 8 to 30 Years |
| | Boise, ID | | (c) | | 823 |
| | 3,178 |
| | — |
| | — |
| | 823 |
| | 3,178 |
| | 4,001 |
| | — |
| | 2003 | | 12/28/16 | | 10 to 40 Years |
| | Brooklyn Park, MN | | (c) | | 3,176 |
| | 7,771 |
| | — |
| | — |
| | 3,176 |
| | 7,771 |
| | 10,947 |
| | (1,086 | ) | | 2008 | | 07/17/13 | | 10 to 35 Years |
| | Burnsville, MN | | (a) | | 1,461 |
| | 1,597 |
| | — |
| | 22 |
| | 1,461 |
| | 1,619 |
| | 3,080 |
| | (83 | ) | | 1978 | | 04/15/16 | | 8 to 20 Years |
| | Chandler, AZ | | (a) | | 1,028 |
| | 5,318 |
| | — |
| | — |
| | 1,028 |
| | 5,318 |
| | 6,346 |
| | (561 | ) | | 2002 | | 07/17/13 | | 8 to 40 Years |
| | Chandler, AZ | | (a) | | 1,326 |
| | 2,665 |
| | — |
| | — |
| | 1,326 |
| | 2,665 |
| | 3,991 |
| | (32 | ) | | 2007 | | 09/30/16 | | 13 to 30 Years |
| | Chicago, IL | | (a) | | 1,009 |
| | 2,965 |
| | — |
| | — |
| | 1,009 |
| | 2,965 |
| | 3,974 |
| | (300 | ) | | 2007 | | 12/09/13 | | 14 to 40 Years |
| | Clifton, CO | | (a) | | 1,280 |
| | 6,975 |
| | — |
| | — |
| | 1,280 |
| | 6,975 |
| | 8,255 |
| | (385 | ) | | 1983 | | 06/30/15 | | 15 to 30 Years |
| | Clinton Township, MI | | (a) | | 5,430 |
| | 7,254 |
| | (2,799 | ) | | (1,160 | ) | | 2,631 |
| | 6,094 |
| | 8,725 |
| | (752 | ) | | 1999 | | 01/09/07 | | 15 to 30 Years |
| | Eagle, ID | | (c) | | 1,428 |
| | 5,591 |
| | — |
| | — |
| | 1,428 |
| | 5,591 |
| | 7,019 |
| | — |
| | 1999 | | 12/28/16 | | 15 to 30 Years |
| | Farmington, NM | | (c) | | 2,242 |
| | 6,696 |
| | — |
| | — |
| | 2,242 |
| | 6,696 |
| | 8,938 |
| | (341 | ) | | 1999 | | 04/23/15 | | 15 to 40 Years |
| | Glendale, AZ | | (a) | | 1,402 |
| | 2,879 |
| | — |
| | — |
| | 1,402 |
| | 2,879 |
| | 4,281 |
| | (34 | ) | | 2008 | | 09/30/16 | | 13 to 30 Years |
| | Grand Junction, CO | | (a) | | 1,825 |
| | 10,478 |
| | — |
| | — |
| | 1,825 |
| | 10,478 |
| | 12,303 |
| | (351 | ) | | 2007 | | 11/05/15 | | 15 to 40 Years |
| | Greenwood, IN | | (b) | | 1,973 |
| | 9,764 |
| | — |
| | — |
| | 1,973 |
| | 9,764 |
| | 11,737 |
| | (1,006 | ) | | 2007 | | 07/17/13 | | 10 to 42 Years |
| | Keizer, OR | | (a) | | 1,208 |
| | 4,089 |
| | — |
| | — |
| | 1,208 |
| | 4,089 |
| | 5,297 |
| | (1,230 | ) | | 1988 | | 12/01/05 | | 15 to 40 Years |
| | Lancaster, CA | | (c) | | 6,982 |
| | 9,255 |
| | — |
| | — |
| | 6,982 |
| | 9,255 |
| | 16,237 |
| | (699 | ) | | 1987 | | 05/07/15 | | 9 to 30 Years |
| | League City, TX | | (b) | | 2,514 |
| | 6,767 |
| | — |
| | — |
| | 2,514 |
| | 6,767 |
| | 9,281 |
| | (772 | ) | | 2008 | | 07/17/13 | | 10 to 42 Years |
| | Louisville, KY | | (c) | | 2,205 |
| | 3,551 |
| | — |
| | — |
| | 2,205 |
| | 3,551 |
| | 5,756 |
| | (279 | ) | | 1995 | | 11/02/15 | | 9 to 20 Years |
| | Manteca, CA | | (c) | | 796 |
| | 2,062 |
| | — |
| | — |
| | 796 |
| | 2,062 |
| | 2,858 |
| | (106 | ) | | 2001 | | 09/04/15 | | 15 to 30 Years |
| | Matteson, IL | | (c) | | 4,587 |
| | 6,328 |
| | — |
| | — |
| | 4,587 |
| | 6,328 |
| | 10,915 |
| | (896 | ) | | 2007 | | 07/17/13 | | 10 to 34 Years |
| | Meridian, ID | | (c) | | 840 |
| | 2,950 |
| | — |
| | — |
| | 840 |
| | 2,950 |
| | 3,790 |
| | — |
| | 1993 | | 12/28/16 | | 8 to 30 Years |
| | Mesquite, TX | | (c) | | 601 |
| | 1,770 |
| | — |
| | — |
| | 601 |
| | 1,770 |
| | 2,371 |
| | (95 | ) | | 1986 | | 01/15/16 | | 8 to 30 Years |
| | Modesto, CA | | (c) | | 2,350 |
| | 5,923 |
| | — |
| | — |
| | 2,350 |
| | 5,923 |
| | 8,273 |
| | (581 | ) | | 1964 | | 12/05/14 | | 10 to 30 Years |
| | Naperville, IL | | (b) | | 5,015 |
| | 6,946 |
| | — |
| | — |
| | 5,015 |
| | 6,946 |
| | 11,961 |
| | (887 | ) | | 2007 | | 07/17/13 | | 9 to 38 Years |
| | O' Fallon, MO | | (c) | | 1,669 |
| | 6,054 |
| | — |
| | — |
| | 1,669 |
| | 6,054 |
| | 7,723 |
| | (769 | ) | | 2007 | | 07/17/13 | | 9 to 34 Years |
| | O'Fallon, IL | | (c) | | 2,243 |
| | 5,002 |
| | — |
| | — |
| | 2,243 |
| | 5,002 |
| | 7,245 |
| | (682 | ) | | 2005 | | 07/17/13 | | 6 to 37 Years |
| | Olathe, KS | | (c) | | 1,816 |
| | 5,526 |
| | — |
| | — |
| | 1,816 |
| | 5,526 |
| | 7,342 |
| | (671 | ) | | 2007 | | 07/17/13 | | 12 to 39 Years |
| | Pawtucket, RI | | (a) | | 946 |
| | 3,093 |
| | — |
| | 26 |
| | 946 |
| | 3,119 |
| | 4,065 |
| | (84 | ) | | 1980 | | 06/28/16 | | 4 to 30 Years |
| | Phoenix, AZ | | (c) | | 642 |
| | 2,245 |
| | — |
| | — |
| | 642 |
| | 2,245 |
| | 2,887 |
| | (201 | ) | | 1988 | | 09/30/14 | | 14 to 30 Years |
| | Rio Rancho, NM | | (c) | | 1,448 |
| | 2,172 |
| | — |
| | — |
| | 1,448 |
| | 2,172 |
| | 3,620 |
| | (152 | ) | | 1997 | | 04/23/15 | | 15 to 30 Years |
| | Sacramento, CA | | (c) | | 1,236 |
| | 2,883 |
| | — |
| | — |
| | 1,236 |
| | 2,883 |
| | 4,119 |
| | (207 | ) | | 1990 | | 09/29/15 | | 15 to 20 Years |
| | Saint Cloud, MN | | (a) | | 912 |
| | 1,427 |
| | — |
| | — |
| | 912 |
| | 1,427 |
| | 2,339 |
| | (180 | ) | | 1989 | | 12/16/14 | | 15 to 20 Years |
| | Salem, OR | | (a) | | 941 |
| | 2,620 |
| | 1,018 |
| | 5,042 |
| | 1,959 |
| | 7,662 |
| | 9,621 |
| | (2,233 | ) | | 1996 | | 12/01/05 | | 15 to 40 Years |
| | Salem, OR | | (a) | | 1,509 |
| | 5,635 |
| | — |
| | — |
| | 1,509 |
| | 5,635 |
| | 7,144 |
| | (1,685 | ) | | 2001 | | 12/01/05 | | 15 to 40 Years |
| | Salem, OR | | (a) | | 1,214 |
| | 4,911 |
| | — |
| | — |
| | 1,214 |
| | 4,911 |
| | 6,125 |
| | (1,493 | ) | | 1980 | | 12/01/05 | | 15 to 40 Years |
| | Salem, OR | | (a) | | 1,589 |
| | 3,834 |
| | — |
| | — |
| | 1,589 |
| | 3,834 |
| | 5,423 |
| | (1,555 | ) | | 1977 | | 12/01/05 | | 15 to 30 Years |
| | Sartell, MN | | (a) | | 3,092 |
| | 3,765 |
| | — |
| | — |
| | 3,092 |
| | 3,765 |
| | 6,857 |
| | (464 | ) | | 2001 | | 12/16/14 | | 15 to 30 Years |
| | Southaven, MS | | (c) | | 1,187 |
| | 1,817 |
| | — |
| | — |
| | 1,187 |
| | 1,817 |
| | 3,004 |
| | (168 | ) | | 2014 | | 09/17/14 | | 15 to 40 Years |
|
| | | | | | | | | | | | | | | | | | | | | | | | | | | | | | | | | |
| HD Supply | Knoxville, TN | | (a) | | 259 |
| | 111 |
| | — |
| | — |
| | 259 |
| | 111 |
| | 370 |
| | (185 | ) | | 1981 | | 05/01/05 | | 10 to 15 Years |
| HD Supply | Wilmington, NC | | (a) | | 370 |
| | 122 |
| | — |
| | — |
| | 370 |
| | 122 |
| | 492 |
| | (110 | ) | | 1987 | | 05/01/05 | | 15 to 20 Years |
| HD Supply | Lawrenceville, GA | | (a) | | 500 |
| | 237 |
| | — |
| | — |
| | 500 |
| | 237 |
| | 737 |
| | (211 | ) | | 1996 | | 05/01/05 | | 15 to 30 Years |
| HD Supply | Roanoke, VA | | (a) | | 333 |
| | 124 |
| | — |
| | — |
| | 333 |
| | 124 |
| | 457 |
| | (184 | ) | | 1975 | | 05/01/05 | | 10 to 15 Years |
| HD Supply | Hickory, NC | | (a) | | 199 |
| | 262 |
| | — |
| | — |
| | 199 |
| | 262 |
| | 461 |
| | (210 | ) | | 1989 | | 05/01/05 | | 15 to 20 Years |
| HD Supply | Florence, SC | | (a) | | 221 |
| | 174 |
| | — |
| | — |
| | 221 |
| | 174 |
| | 395 |
| | (226 | ) | | 1974 | | 05/01/05 | | 10 to 15 Years |
| HD Supply | Martinsburg, WV | | (a) | | 173 |
| | 20 |
| | — |
| | — |
| | 173 |
| | 20 |
| | 193 |
| | (50 | ) | | 1972 | | 05/01/05 | | 10 to 15 Years |
| HD Supply | Spokane, WA | | (a) | | 518 |
| | 193 |
| | — |
| | — |
| | 518 |
| | 193 |
| | 711 |
| | (186 | ) | | 1998 | | 05/01/05 | | 15 to 30 Years |
| HD Supply | Greer, SC | | (a) | | 268 |
| | 236 |
| | — |
| | — |
| | 268 |
| | 236 |
| | 504 |
| | (176 | ) | | 1993 | | 05/01/05 | | 15 to 30 Years |
| HD Supply | Jacksonville, FL | | (a) | | 339 |
| | 226 |
| | — |
| | — |
| | 339 |
| | 226 |
| | 565 |
| | (207 | ) | | 1987 | | 07/01/05 | | 15 to 20 Years |
|
| | | | | | | | | | | | | | | | | | | | | | | | | | | | | | | | | |
| HD Supply | Jacksonville, FL | | (a) | | 963 |
| | 1,007 |
| | — |
| | — |
| | 963 |
| | 1,007 |
| | 1,970 |
| | (1,008 | ) | | 2001 | | 07/01/05 | | 9 to 20 Years |
| HD Supply | Conroe, TX | | (a) | | 492 |
| | 723 |
| | — |
| | — |
| | 492 |
| | 723 |
| | 1,215 |
| | (363 | ) | | 1999 | | 07/01/05 | | 14 to 30 Years |
| HD Supply | Pompano Beach, FL | | (a) | | 1,144 |
| | 337 |
| | — |
| | — |
| | 1,144 |
| | 337 |
| | 1,481 |
| | (252 | ) | | 1990 | | 07/01/05 | | 15 to 30 Years |
| HD Supply | Riviera Beach, FL | | (a) | | 500 |
| | 170 |
| | — |
| | — |
| | 500 |
| | 170 |
| | 670 |
| | (156 | ) | | 1987 | | 07/01/05 | | 15 to 20 Years |
| Health Point Family Medicine | Franklin, TX | | (d) | | 159 |
| | 1,124 |
| | — |
| | 29 |
| | 159 |
| | 1,153 |
| | 1,312 |
| | (157 | ) | | 2012 | | 08/18/14 | | 4 to 40 Years |
| Heartland Dental | Bullhead City, AZ | | (a) | | 57 |
| | 946 |
| | — |
| | — |
| | 57 |
| | 946 |
| | 1,003 |
| | (94 | ) | | 2005 | | 04/08/14 | | 15 to 40 Years |
| Heartland Dental | Glendale, AZ | | (a) | | 371 |
| | 491 |
| | — |
| | — |
| | 371 |
| | 491 |
| | 862 |
| | (71 | ) | | 1988 | | 03/31/14 | | 15 to 30 Years |
| Heartland Dental | Brandon, FL | | (a) | | 110 |
| | 671 |
| | — |
| | — |
| | 110 |
| | 671 |
| | 781 |
| | (86 | ) | | 1999 | | 03/31/14 | | 15 to 30 Years |
| Heartland Dental | Ocala, FL | | (a) | | 23 |
| | 547 |
| | — |
| | — |
| | 23 |
| | 547 |
| | 570 |
| | (68 | ) | | 1984 | | 04/08/14 | | 30 to 30 Years |
| Heartland Dental | Gainesville, FL | | (a) | | 180 |
| | 711 |
| | — |
| | — |
| | 180 |
| | 711 |
| | 891 |
| | (94 | ) | | 1941 | | 03/31/14 | | 15 to 30 Years |
| Heartland Dental | Largo, FL | | (a) | | 150 |
| | 311 |
| | — |
| | — |
| | 150 |
| | 311 |
| | 461 |
| | (44 | ) | | 1962 | | 03/31/14 | | 15 to 30 Years |
| Heartland Dental | New Port Richey, FL | | (a) | | 274 |
| | 1,162 |
| | — |
| | — |
| | 274 |
| | 1,162 |
| | 1,436 |
| | (160 | ) | | 2004 | | 04/08/14 | | 15 to 30 Years |
| Heartland Dental | New Port Richey, FL | | (a) | | 456 |
| | 1,151 |
| | — |
| | — |
| | 456 |
| | 1,151 |
| | 1,607 |
| | (178 | ) | | 2004 | | 04/08/14 | | 15 to 30 Years |
| Heartland Dental | Melbourne, FL | | (a) | | 321 |
| | 651 |
| | — |
| | — |
| | 321 |
| | 651 |
| | 972 |
| | (89 | ) | | 1987 | | 03/31/14 | | 15 to 30 Years |
| Heartland Dental | Okeechobee, FL | | (a) | | 190 |
| | 521 |
| | — |
| | — |
| | 190 |
| | 521 |
| | 711 |
| | (73 | ) | | 1990 | | 03/31/14 | | 15 to 30 Years |
| Heartland Dental | Debary, FL | | (a) | | 100 |
| | 641 |
| | — |
| | — |
| | 100 |
| | 641 |
| | 741 |
| | (90 | ) | | 1989 | | 03/31/14 | | 15 to 30 Years |
| Heartland Dental | Orlando, FL | | (a) | | 291 |
| | 230 |
| | — |
| | — |
| | 291 |
| | 230 |
| | 521 |
| | (36 | ) | | 1979 | | 03/31/14 | | 15 to 30 Years |
| Heartland Dental | Vero Beach, FL | | (a) | | 220 |
| | 731 |
| | — |
| | — |
| | 220 |
| | 731 |
| | 951 |
| | (101 | ) | | 1974 | | 03/31/14 | | 15 to 30 Years |
| Heartland Dental | Jacksonville, FL | | (a) | | 57 |
| | 365 |
| | — |
| | — |
| | 57 |
| | 365 |
| | 422 |
| | (48 | ) | | 1986 | | 04/08/14 | | 15 to 30 Years |
| Heartland Dental | Columbus, GA | | (a) | | 190 |
| | 531 |
| | — |
| | — |
| | 190 |
| | 531 |
| | 721 |
| | (89 | ) | | 1993 | | 03/31/14 | | 15 to 30 Years |
SPIRIT REALTY CAPITAL, INC.
Schedule III Real Estate and
Accumulated Depreciation
(Amounts in thousands)
|
| | | | | | | | | | | | | | | | | | | | | | | | | |
| | | | | | Initial Cost to Company | | Cost Capitalized Subsequent to Acquisition including impairment | | Gross Amount at December 31, 2016 (d) 2017 (g) | | | | | | | | |
| Concept | City, State | | Encumbrances (e) | | Land and Improvements | | Buildings and Improvements | | Land and Improvements | | Buildings and Improvements | | Land and Improvements | | Buildings and Improvements | | Total | | Final Accumulated Depreciation | | Date of Construction | | Date Acquired | | Life in which depreciation in latest Statement of Operations is computed |
Description | | Encumbrances (e)
| | Land and
Improvements
| | Buildings and
Improvements
| | Improvements/
Land
| | Improvements/
building
| | Land and
Improvements
| | Buildings and
Improvements
| | Total | | Final
Accum
| | Date of
Construction
| | Date
Acquired
| |
|
| | | | | | | | | | | | | | | | | | | | | | | | | | | | | | | | | |
| | St. Peters, MO | | (c) | | 1,814 |
| | 5,810 |
| | — |
| | — |
| | 1,814 |
| | 5,810 |
| | 7,624 |
| | (828 | ) | | 2007 | | 07/17/13 | | 9 to 34 Years |
| | Taylorsville, UT | | (c) | | 1,496 |
| | 3,593 |
| | — |
| | — |
| | 1,496 |
| | 3,593 |
| | 5,089 |
| | (227 | ) | | 1988 | | 11/20/15 | | 12 to 20 Years |
| | West Chester, OH | | (b) | | 606 |
| | 9,832 |
| | — |
| | — |
| | 606 |
| | 9,832 |
| | 10,438 |
| | (891 | ) | | 2009 | | 07/17/13 | | 7 to 43 Years |
|
| | | | | | | | | | | | | | | | | | | | | | | | | | | | | | | | | |
| Heartland Dental | Eastman, GA | | (a) | | 130 |
| | 551 |
| | — |
| | — |
| | 130 |
| | 551 |
| | 681 |
| | (89 | ) | | 1988 | | 03/31/14 | | 15 to 30 Years |
| Heartland Dental | Monroe, GA | | (a) | | 110 |
| | 631 |
| | — |
| | — |
| | 110 |
| | 631 |
| | 741 |
| | (94 | ) | | 2001 | | 03/31/14 | | 15 to 30 Years |
| Heartland Dental | Clayton, GA | | (a) | | 70 |
| | 311 |
| | — |
| | — |
| | 70 |
| | 311 |
| | 381 |
| | (49 | ) | | 1963 | | 03/31/14 | | 15 to 30 Years |
| Heartland Dental | Springfield, IL | | (a) | | 451 |
| | 1,162 |
| | — |
| | — |
| | 451 |
| | 1,162 |
| | 1,613 |
| | (180 | ) | | 1992 | | 03/31/14 | | 15 to 30 Years |
| Heartland Dental | Litchfield, IL | | (a) | | 210 |
| | 311 |
| | — |
| | — |
| | 210 |
| | 311 |
| | 521 |
| | (73 | ) | | 1962 | | 03/31/14 | | 15 to 20 Years |
| Heartland Dental | Maryville, IL | | (a) | | 301 |
| | 401 |
| | — |
| | — |
| | 301 |
| | 401 |
| | 702 |
| | (70 | ) | | 1995 | | 03/31/14 | | 15 to 30 Years |
| Heartland Dental | Belleville, IL | | (a) | | 140 |
| | 431 |
| | — |
| | — |
| | 140 |
| | 431 |
| | 571 |
| | (91 | ) | | 1979 | | 03/31/14 | | 15 to 20 Years |
| Heartland Dental | East Alton, IL | | (a) | | 170 |
| | 80 |
| | — |
| | — |
| | 170 |
| | 80 |
| | 250 |
| | (28 | ) | | 1960 | | 03/31/14 | | 15 to 20 Years |
| Heartland Dental | Litchfield, IL | | (a) | | 110 |
| | 120 |
| | — |
| | — |
| | 110 |
| | 120 |
| | 230 |
| | (25 | ) | | 1962 | | 03/31/14 | | 15 to 20 Years |
| Heartland Dental | Crystal Lake, IL | | (a) | | 200 |
| | 631 |
| | — |
| | — |
| | 200 |
| | 631 |
| | 831 |
| | (96 | ) | | 2001 | | 03/31/14 | | 15 to 30 Years |
| Heartland Dental | Marion, IN | | (a) | | 140 |
| | 321 |
| | — |
| | — |
| | 140 |
| | 321 |
| | 461 |
| | (58 | ) | | 1988 | | 03/31/14 | | 15 to 30 Years |
| Heartland Dental | Logansport, IN | | (a) | | 30 |
| | 421 |
| | — |
| | — |
| | 30 |
| | 421 |
| | 451 |
| | (55 | ) | | 1920 | | 03/31/14 | | 15 to 30 Years |
| Heartland Dental | Fort Wayne, IN | | (a) | | 150 |
| | 1,022 |
| | — |
| | — |
| | 150 |
| | 1,022 |
| | 1,172 |
| | (111 | ) | | 1965 | | 03/31/14 | | 15 to 40 Years |
| Heartland Dental | Anderson, IN | | (a) | | 411 |
| | 1,673 |
| | — |
| | — |
| | 411 |
| | 1,673 |
| | 2,084 |
| | (182 | ) | | 1981 | | 03/31/14 | | 15 to 40 Years |
| Heartland Dental | Westfield, IN | | (a) | | 361 |
| | 751 |
| | — |
| | — |
| | 361 |
| | 751 |
| | 1,112 |
| | (106 | ) | | 1992 | | 03/31/14 | | 15 to 40 Years |
| Heartland Dental | South Bend, IN | | (a) | | 341 |
| | 321 |
| | — |
| | — |
| | 341 |
| | 321 |
| | 662 |
| | (78 | ) | | 1955 | | 03/31/14 | | 15 to 20 Years |
| Heartland Dental | Evansville, IN | | (a) | | 130 |
| | 391 |
| | — |
| | — |
| | 130 |
| | 391 |
| | 521 |
| | (61 | ) | | 1986 | | 03/31/14 | | 15 to 30 Years |
| Heartland Dental | Osceola, IN | | (a) | | 291 |
| | 671 |
| | — |
| | — |
| | 291 |
| | 671 |
| | 962 |
| | (108 | ) | | 1996 | | 03/31/14 | | 15 to 40 Years |
| Heartland Dental | Marion, IN | | (a) | | 130 |
| | 421 |
| | — |
| | — |
| | 130 |
| | 421 |
| | 551 |
| | (70 | ) | | 1974 | | 03/31/14 | | 15 to 30 Years |
| Heartland Dental | Elkhart, IN | | (a) | | 90 |
| | 341 |
| | — |
| | — |
| | 90 |
| | 341 |
| | 431 |
| | (48 | ) | | 1969 | | 03/31/14 | | 15 to 30 Years |
| Heartland Dental | Springfield, MO | | (a) | | 561 |
| | 631 |
| | — |
| | — |
| | 561 |
| | 631 |
| | 1,192 |
| | (104 | ) | | 1996 | | 03/31/14 | | 15 to 30 Years |
| Heartland Dental | Columbia, MO | | (a) | | 1,012 |
| | 7,054 |
| | — |
| | — |
| | 1,012 |
| | 7,054 |
| | 8,066 |
| | (724 | ) | | 2004 | | 03/31/14 | | 15 to 40 Years |
| Heartland Dental | Raytown, MO | | (a) | | 80 |
| | 631 |
| | — |
| | — |
| | 80 |
| | 631 |
| | 711 |
| | (91 | ) | | 1989 | | 03/31/14 | | 15 to 30 Years |
| Heartland Dental | Brandon, MS | | (a) | | 200 |
| | 281 |
| | — |
| | — |
| | 200 |
| | 281 |
| | 481 |
| | (58 | ) | | 1986 | | 03/31/14 | | 15 to 30 Years |
| Heartland Dental | Vicksburg, MS | | (a) | | 150 |
| | 351 |
| | — |
| | — |
| | 150 |
| | 351 |
| | 501 |
| | (61 | ) | | 1984 | | 03/31/14 | | 15 to 30 Years |
| Heartland Dental | Rio Rancho, NM | | (a) | | 301 |
| | 461 |
| | — |
| | — |
| | 301 |
| | 461 |
| | 762 |
| | (75 | ) | | 1992 | | 03/31/14 | | 15 to 30 Years |
| Heartland Dental | Gahanna, OH | | (a) | | 411 |
| | 982 |
| | — |
| | — |
| | 411 |
| | 982 |
| | 1,393 |
| | (152 | ) | | 1998 | | 03/31/14 | | 15 to 40 Years |
| Heartland Dental | Pataskala, OH | | (a) | | 261 |
| | 782 |
| | — |
| | — |
| | 261 |
| | 782 |
| | 1,043 |
| | (93 | ) | | 1995 | | 03/31/14 | | 15 to 40 Years |
| Heartland Dental | Defiance, OH | | (a) | | 130 |
| | 491 |
| | — |
| | — |
| | 130 |
| | 491 |
| | 621 |
| | (76 | ) | | 1959 | | 03/31/14 | | 15 to 30 Years |
| Heartland Dental | Camp Hill, PA | | (a) | | 180 |
| | 581 |
| | — |
| | — |
| | 180 |
| | 581 |
| | 761 |
| | (85 | ) | | 1991 | | 03/31/14 | | 15 to 30 Years |
| Heartland Dental | Mechanicsburg, PA | | (a) | | 231 |
| | 1,032 |
| | 152 |
| | — |
| | 383 |
| | 1,032 |
| | 1,415 |
| | (147 | ) | | 1990 | | 03/31/14 | | 15 to 30 Years |
| Heartland Dental | York, PA | | (a) | | 100 |
| | 481 |
| | — |
| | — |
| | 100 |
| | 481 |
| | 581 |
| | (68 | ) | | 1984 | | 03/31/14 | | 15 to 30 Years |
SPIRIT REALTY CAPITAL, INC.
Schedule III Real Estate and
Accumulated Depreciation
(Amounts in thousands)
|
| | | | | | | | | | | | | | | | | | | | | | | | | | | | | | | | | |
| Automotive Parts and Service | | | | | | | | | | | | | | | | | | | | |
| | Acworth, GA | | (a) | | 823 |
| | 976 |
| | — |
| | — |
| | 823 |
| | 976 |
| | 1,799 |
| | (93 | ) | | 1999 | | 03/28/14 | | 15 to 40 Years |
| | Alabaster, AL | | (a) | | 631 |
| | 1,010 |
| | — |
| | — |
| | 631 |
| | 1,010 |
| | 1,641 |
| | (238 | ) | | 1995 | | 12/22/06 | | 40 to 40 Years |
| | Albany, GA | | (a) | | 242 |
| | 572 |
| | — |
| | — |
| | 242 |
| | 572 |
| | 814 |
| | (170 | ) | | 1982 | | 09/07/07 | | 15 to 40 Years |
| | Albany, GA | | (a) | | 281 |
| | 575 |
| | — |
| | — |
| | 281 |
| | 575 |
| | 856 |
| | (246 | ) | | 1997 | | 09/07/07 | | 15 to 30 Years |
| | Albuquerque, NM | | (a) | | 885 |
| | 2,998 |
| | — |
| | — |
| | 885 |
| | 2,998 |
| | 3,883 |
| | (350 | ) | | 1990 | | 07/17/13 | | 7 to 35 Years |
| | Alton, IL | | (c) | | 346 |
| | 553 |
| | — |
| | — |
| | 346 |
| | 553 |
| | 899 |
| | (13 | ) | | 1997 | | 07/22/16 | | 7 to 30 Years |
| | Ann Arbor, MI | | (a) | | 684 |
| | 413 |
| | — |
| | — |
| | 684 |
| | 413 |
| | 1,097 |
| | (67 | ) | | 1989 | | 06/23/14 | | 15 to 20 Years |
| | Arlington Heights, IL | | (a) | | 1,530 |
| | 5,354 |
| | — |
| | — |
| | 1,530 |
| | 5,354 |
| | 6,884 |
| | (620 | ) | | 1995 | | 07/17/13 | | 9 to 36 Years |
| | Ashland, KY | | (a) | | 613 |
| | 1,284 |
| | — |
| | — |
| | 613 |
| | 1,284 |
| | 1,897 |
| | (150 | ) | | 2006 | | 07/17/13 | | 8 to 48 Years |
| | Atlanta, GA | | (a) | | 1,830 |
| | 363 |
| | — |
| | — |
| | 1,830 |
| | 363 |
| | 2,193 |
| | (111 | ) | | 1998 | | 07/17/13 | | 5 to 24 Years |
| | Atmore, AL | | (c) | | 417 |
| | 444 |
| | — |
| | — |
| | 417 |
| | 444 |
| | 861 |
| | (12 | ) | | 1995 | | 07/22/16 | | 7 to 30 Years |
| | Auburn Hills, MI | | (c) | | 3,542 |
| | 6,597 |
| | 169 |
| | — |
| | 3,711 |
| | 6,597 |
| | 10,308 |
| | (1,332 | ) | | 1995 | | 07/17/13 | | 8 to 38 Years |
| | Auburn, AL | | (a) | | 354 |
| | 1,182 |
| | 30 |
| | 78 |
| | 384 |
| | 1,260 |
| | 1,644 |
| | (412 | ) | | 1987 | | 12/22/06 | | 15 to 30 Years |
| | Auburn, AL | | (a) | | 676 |
| | 647 |
| | — |
| | — |
| | 676 |
| | 647 |
| | 1,323 |
| | (293 | ) | | 1995 | | 09/07/07 | | 15 to 30 Years |
| | Augusta, GA | | (c) | | 482 |
| | 750 |
| | — |
| | — |
| | 482 |
| | 750 |
| | 1,232 |
| | (14 | ) | | 1998 | | 07/22/16 | | 7 to 40 Years |
| | Battle Creek, MI | | (a) | | 211 |
| | 419 |
| | — |
| | — |
| | 211 |
| | 419 |
| | 630 |
| | (64 | ) | | 1981 | | 06/23/14 | | 15 to 20 Years |
| | Battle Creek, MI | | (a) | | 302 |
| | 262 |
| | — |
| | — |
| | 302 |
| | 262 |
| | 564 |
| | (44 | ) | | 1987 | | 06/23/14 | | 15 to 20 Years |
| | Battle Creek, MI | | (a) | | 594 |
| | 262 |
| | — |
| | — |
| | 594 |
| | 262 |
| | 856 |
| | (76 | ) | | 1998 | | 06/23/14 | | 15 to 20 Years |
| | Bessemer, AL | | (a) | | 358 |
| | 1,197 |
| | — |
| | — |
| | 358 |
| | 1,197 |
| | 1,555 |
| | (282 | ) | | 1988 | | 12/22/06 | | 40 to 40 Years |
| | Birmingham, AL | | (a) | | 417 |
| | 1,237 |
| | — |
| | — |
| | 417 |
| | 1,237 |
| | 1,654 |
| | (291 | ) | | 1970 | | 12/22/06 | | 40 to 40 Years |
| | Birmingham, AL | | (a) | | 300 |
| | 839 |
| | — |
| | — |
| | 300 |
| | 839 |
| | 1,139 |
| | (158 | ) | | 1998 | | 12/22/06 | | 50 to 50 Years |
| | Birmingham, AL | | (a) | | 607 |
| | 1,379 |
| | — |
| | — |
| | 607 |
| | 1,379 |
| | 1,986 |
| | (325 | ) | | 1988 | | 12/22/06 | | 40 to 40 Years |
| | Birmingham, AL | | (a) | | 343 |
| | 901 |
| | — |
| | — |
| | 343 |
| | 901 |
| | 1,244 |
| | (212 | ) | | 1989 | | 12/22/06 | | 40 to 40 Years |
| | Birmingham, AL | | (a) | | 334 |
| | 1,119 |
| | — |
| | — |
| | 334 |
| | 1,119 |
| | 1,453 |
| | (263 | ) | | 1989 | | 12/22/06 | | 40 to 40 Years |
| | Birmingham, AL | | (a) | | 372 |
| | 1,073 |
| | — |
| | — |
| | 372 |
| | 1,073 |
| | 1,445 |
| | (337 | ) | | 1965 | | 12/22/06 | | 30 to 30 Years |
| | Birmingham, AL | | (a) | | 339 |
| | 858 |
| | — |
| | — |
| | 339 |
| | 858 |
| | 1,197 |
| | (202 | ) | | 1990 | | 12/22/06 | | 40 to 40 Years |
| | Blakeley, GA | | (c) | | 169 |
| | 887 |
| | — |
| | — |
| | 169 |
| | 887 |
| | 1,056 |
| | (12 | ) | | 1995 | | 07/22/16 | | 7 to 50 Years |
| | Bloomfield, MI | | (a) | | 554 |
| | 332 |
| | — |
| | — |
| | 554 |
| | 332 |
| | 886 |
| | (58 | ) | | 1987 | | 06/23/14 | | 15 to 20 Years |
| | Bonita Springs, FL | | (a) | | 582 |
| | 312 |
| | — |
| | 101 |
| | 582 |
| | 413 |
| | 995 |
| | (99 | ) | | 1990 | | 03/19/13 | | 10 to 30 Years |
| | Bradenton, FL | | (a) | | 594 |
| | 493 |
| | — |
| | 222 |
| | 594 |
| | 715 |
| | 1,309 |
| | (178 | ) | | 1988 | | 03/19/13 | | 10 to 30 Years |
| | Burlington, IA | | (c) | | 467 |
| | 737 |
| | — |
| | — |
| | 467 |
| | 737 |
| | 1,204 |
| | (12 | ) | | 1989 | | 07/22/16 | | 7 to 40 Years |
| | Camilla, GA | | (c) | | 419 |
| | 412 |
| | — |
| | — |
| | 419 |
| | 412 |
| | 831 |
| | (10 | ) | | 1995 | | 07/22/16 | | 7 to 30 Years |
|
| | | | | | | | | | | | | | | | | | | | | | | | | |
| | | | | | Initial Cost to Company | | Cost Capitalized Subsequent to Acquisition including impairment | | Gross Amount at December 31, 2016 (d) 2017 (g) | | | | | | | | |
| Concept | City, State | | Encumbrances (e) | | Land and Improvements | | Buildings and Improvements | | Land and Improvements | | Buildings and Improvements | | Land and Improvements | | Buildings and Improvements | | Total | | Final Accumulated Depreciation | | Date of Construction | | Date Acquired | | Life in which depreciation in latest Statement of Operations is computed |
Description | | Encumbrances (e)
| | Land and
Improvements
| | Buildings and
Improvements
| | Improvements/
Land
| | Improvements/
building
| | Land and
Improvements
| | Buildings and
Improvements
| | Total | | Final
Accum
| | Date of
Construction
| | Date
Acquired
| |
|
| | | | | | | | | | | | | | | | | | | | | | | | | | | | | | | | | |
| | Castle Shannon, PA | | (c) | | 620 |
| | 732 |
| | — |
| | — |
| | 620 |
| | 732 |
| | 1,352 |
| | (16 | ) | | 1998 | | 07/22/16 | | 7 to 30 Years |
| | Charlotte, NC | | (a) | | 403 |
| | 1,146 |
| | — |
| | — |
| | 403 |
| | 1,146 |
| | 1,549 |
| | (151 | ) | | 2008 | | 07/17/13 | | 12 to 43 Years |
| | Chesterfield Twshp, MI | | (a) | | 181 |
| | 302 |
| | — |
| | — |
| | 181 |
| | 302 |
| | 483 |
| | (51 | ) | | 1990 | | 06/23/14 | | 15 to 20 Years |
| | Clarksville, IN | | (a) | | 1,055 |
| | 1,758 |
| | — |
| | — |
| | 1,055 |
| | 1,758 |
| | 2,813 |
| | (289 | ) | | 1993 | | 07/17/13 | | 8 to 30 Years |
| | Clarksville, TN | | (a) | | 658 |
| | 1,243 |
| | — |
| | — |
| | 658 |
| | 1,243 |
| | 1,901 |
| | (143 | ) | | 2000 | | 03/31/14 | | 14 to 30 Years |
| | Clawson, MI | | (a) | | 262 |
| | 242 |
| | — |
| | — |
| | 262 |
| | 242 |
| | 504 |
| | (40 | ) | | 1984 | | 06/23/14 | | 15 to 20 Years |
| | Clayton, NC | | (a) | | 684 |
| | 1,254 |
| | — |
| | — |
| | 684 |
| | 1,254 |
| | 1,938 |
| | (147 | ) | | 2001 | | 03/31/14 | | 7 to 30 Years |
| | Clearwater, FL | | (a) | | 463 |
| | 443 |
| | — |
| | 131 |
| | 463 |
| | 574 |
| | 1,037 |
| | (125 | ) | | 1989 | | 03/19/13 | | 10 to 30 Years |
| | Clinton Township, MI | | (a) | | 141 |
| | 282 |
| | — |
| | — |
| | 141 |
| | 282 |
| | 423 |
| | (45 | ) | | 1987 | | 06/23/14 | | 15 to 20 Years |
| | Clinton, MS | | (c) | | 569 |
| | 693 |
| | — |
| | — |
| | 569 |
| | 693 |
| | 1,262 |
| | (15 | ) | | 1998 | | 07/22/16 | | 7 to 30 Years |
| | College Park, GA | | (c) | | 386 |
| | 506 |
| | — |
| | — |
| | 386 |
| | 506 |
| | 892 |
| | (13 | ) | | 1998 | | 07/22/16 | | 7 to 30 Years |
| | Colorado Springs, CO | | (a) | | 1,335 |
| | 1,587 |
| | — |
| | — |
| | 1,335 |
| | 1,587 |
| | 2,922 |
| | (368 | ) | | 1994 | | 07/17/13 | | 7 to 26 Years |
| | Columbia Heights, MN | | (c) | | 510 |
| | 1,314 |
| | — |
| | — |
| | 510 |
| | 1,314 |
| | 1,824 |
| | (144 | ) | | 2006 | | 07/17/13 | | 7 to 43 Years |
| | Columbus, GA | | (c) | | 628 |
| | 769 |
| | — |
| | — |
| | 628 |
| | 769 |
| | 1,397 |
| | (15 | ) | | 1998 | | 07/22/16 | | 7 to 40 Years |
| | Conroe, TX | | (c) | | 2,056 |
| | 2,306 |
| | — |
| | — |
| | 2,056 |
| | 2,306 |
| | 4,362 |
| | — |
| | 2016 | | 12/28/16 | | 14 to 50 Years |
| | Covington, LA | | (c) | | 507 |
| | 426 |
| | — |
| | — |
| | 507 |
| | 426 |
| | 933 |
| | (11 | ) | | 1998 | | 07/22/16 | | 7 to 30 Years |
| | Crestview, FL | | (a) | | 544 |
| | 743 |
| | — |
| | — |
| | 544 |
| | 743 |
| | 1,287 |
| | (278 | ) | | 1975 | | 09/07/07 | | 15 to 30 Years |
| | Dacula, GA | | (a) | | 1,067 |
| | 976 |
| | — |
| | — |
| | 1,067 |
| | 976 |
| | 2,043 |
| | (95 | ) | | 2000 | | 03/28/14 | | 15 to 40 Years |
| | Dayton, OH | | (c) | | 317 |
| | 572 |
| | — |
| | — |
| | 317 |
| | 572 |
| | 889 |
| | (12 | ) | | 1998 | | 07/22/16 | | 7 to 30 Years |
| | Decatur, AL | | (a) | | 187 |
| | 1,174 |
| | — |
| | 98 |
| | 187 |
| | 1,272 |
| | 1,459 |
| | (256 | ) | | 2000 | | 12/22/06 | | 19 to 50 Years |
| | Decatur, AL | | (a) | | 84 |
| | 803 |
| | — |
| | — |
| | 84 |
| | 803 |
| | 887 |
| | (151 | ) | | 2001 | | 12/22/06 | | 50 to 50 Years |
| | Denmark, SC | | (c) | | 439 |
| | 504 |
| | — |
| | — |
| | 439 |
| | 504 |
| | 943 |
| | (12 | ) | | 1996 | | 07/22/16 | | 7 to 30 Years |
| | Dothan, AL | | (a) | | 162 |
| | 659 |
| | — |
| | — |
| | 162 |
| | 659 |
| | 821 |
| | (242 | ) | | 1996 | | 09/07/07 | | 15 to 30 Years |
| | Duluth, MN | | (c) | | 207 |
| | 1,462 |
| | — |
| | — |
| | 207 |
| | 1,462 |
| | 1,669 |
| | (130 | ) | | 2006 | | 07/17/13 | | 7 to 48 Years |
| | Dunellen, NJ | | (a) | | 1,177 |
| | 1,973 |
| | — |
| | — |
| | 1,177 |
| | 1,973 |
| | 3,150 |
| | (188 | ) | | 2008 | | 07/17/13 | | 10 to 48 Years |
| | El Centro, CA | | (a) | | 1,295 |
| | 1,504 |
| | — |
| | — |
| | 1,295 |
| | 1,504 |
| | 2,799 |
| | (255 | ) | | 1998 | | 07/17/13 | | 9 to 33 Years |
| | Estero, FL | | (a) | | 334 |
| | 571 |
| | — |
| | — |
| | 334 |
| | 571 |
| | 905 |
| | (88 | ) | | 2009 | | 10/28/13 | | 9 to 30 Years |
| | Estero, FL | | (a) | | 394 |
| | 399 |
| | — |
| | — |
| | 394 |
| | 399 |
| | 793 |
| | (72 | ) | | 2004 | | 10/28/13 | | 9 to 30 Years |
| | Farmington Hills, MI | | (a) | | 382 |
| | 282 |
| | — |
| | — |
| | 382 |
| | 282 |
| | 664 |
| | (52 | ) | | 1987 | | 06/23/14 | | 15 to 20 Years |
| | Farragut, TN | | (a) | | 986 |
| | 1,148 |
| | — |
| | — |
| | 986 |
| | 1,148 |
| | 2,134 |
| | (122 | ) | | 2011 | | 03/28/14 | | 15 to 40 Years |
| | Fergus Falls, MN | | (c) | | 294 |
| | 978 |
| | — |
| | — |
| | 294 |
| | 978 |
| | 1,272 |
| | (109 | ) | | 2005 | | 07/17/13 | | 7 to 47 Years |
| | Florence, AL | | (a) | | 130 |
| | 1,128 |
| | — |
| | — |
| | 130 |
| | 1,128 |
| | 1,258 |
| | (212 | ) | | 1999 | | 12/22/06 | | 50 to 50 Years |
| | Fort Lauderdale, FL | | (c) | | 772 |
| | 1,005 |
| | — |
| | — |
| | 772 |
| | 1,005 |
| | 1,777 |
| | (18 | ) | | 1996 | | 07/22/16 | | 7 to 40 Years |
| | Fort Myers, FL | | (a) | | 555 |
| | 312 |
| | — |
| | 131 |
| | 555 |
| | 443 |
| | 998 |
| | (111 | ) | | 1990 | | 03/19/13 | | 10 to 30 Years |
| | Frederick, MD | | (a) | | 1,571 |
| | 2,529 |
| | — |
| | — |
| | 1,571 |
| | 2,529 |
| | 4,100 |
| | (320 | ) | | 1987 | | 07/17/13 | | 9 to 40 Years |
|
| | | | | | | | | | | | | | | | | | | | | | | | | | | | | | | | | |
| Heartland Dental | Waynesboro, PA | | (a) | | 100 |
| | 601 |
| | — |
| | — |
| | 100 |
| | 601 |
| | 701 |
| | (66 | ) | | 1957 | | 03/31/14 | | 15 to 40 Years |
| Heartland Dental | Camp Hill, PA | | (a) | | 140 |
| | 641 |
| | — |
| | — |
| | 140 |
| | 641 |
| | 781 |
| | (90 | ) | | 1990 | | 03/31/14 | | 15 to 30 Years |
| Heartland Dental | Hartsville, SC | | (a) | | 90 |
| | 180 |
| | — |
| | — |
| | 90 |
| | 180 |
| | 270 |
| | (24 | ) | | 1973 | | 03/31/14 | | 15 to 40 Years |
| Heartland Dental | Spartanburg, SC | | (a) | | 150 |
| | 401 |
| | — |
| | — |
| | 150 |
| | 401 |
| | 551 |
| | (60 | ) | | 1992 | | 03/31/14 | | 15 to 30 Years |
| Heartland Dental | North Myrtle Beach, SC | | (a) | | 581 |
| | 601 |
| | — |
| | — |
| | 581 |
| | 601 |
| | 1,182 |
| | (115 | ) | | 2004 | | 03/31/14 | | 15 to 30 Years |
| Heartland Dental | Clarksville, TN | | (a) | | 281 |
| | 531 |
| | — |
| | — |
| | 281 |
| | 531 |
| | 812 |
| | (76 | ) | | 1997 | | 03/31/14 | | 15 to 30 Years |
| Heartland Dental | Germantown, TN | | (a) | | 91 |
| | 171 |
| | — |
| | — |
| | 91 |
| | 171 |
| | 262 |
| | (19 | ) | | 1984 | | 04/08/14 | | 15 to 40 Years |
| Heartland Dental | Memphis, TN | | (a) | | 91 |
| | 490 |
| | — |
| | — |
| | 91 |
| | 490 |
| | 581 |
| | (67 | ) | | 1987 | | 04/08/14 | | 15 to 30 Years |
| Heartland Dental | Wylie, TX | | (a) | | 210 |
| | 912 |
| | — |
| | — |
| | 210 |
| | 912 |
| | 1,122 |
| | (132 | ) | | 1986 | | 03/31/14 | | 15 to 30 Years |
| Heartland Dental | Devine, TX | | (a) | | 240 |
| | 481 |
| | — |
| | — |
| | 240 |
| | 481 |
| | 721 |
| | (83 | ) | | 2002 | | 03/31/14 | | 15 to 30 Years |
| Heartland Dental | Longview, TX | | (a) | | 200 |
| | 601 |
| | — |
| | — |
| | 200 |
| | 601 |
| | 801 |
| | (98 | ) | | 2003 | | 03/31/14 | | 15 to 30 Years |
| Heartland Dental | Wittenberg, WI | | (a) | | 41 |
| | 210 |
| | — |
| | — |
| | 41 |
| | 210 |
| | 251 |
| | (29 | ) | | 1982 | | 03/31/14 | | 15 to 30 Years |
| HHI-Formtech | Troy, MI | | (a) | | 1,128 |
| | 947 |
| | — |
| | — |
| | 1,128 |
| | 947 |
| | 2,075 |
| | (388 | ) | | 1952 | | 03/10/06 | | 15 to 30 Years |
| HHI-Formtech | Royal Oak, MI | | (a) | | 3,426 |
| | 7,071 |
| | — |
| | — |
| | 3,426 |
| | 7,071 |
| | 10,497 |
| | (2,850 | ) | | 1952 | | 03/10/06 | | 15 to 30 Years |
| High Heaven Trampoline Park | Flowood, MS | | (d) | | 900 |
| | 1,137 |
| | — |
| | — |
| | 900 |
| | 1,137 |
| | 2,037 |
| | (167 | ) | | 1995 | | 11/13/15 | | 9 to 20 Years |
| High Rise Extreme Air Sports | Rogers, AR | | (d) | | 635 |
| | 2,376 |
| | — |
| | — |
| | 635 |
| | 2,376 |
| | 3,011 |
| | (209 | ) | | 2014 | | 09/30/15 | | 9 to 40 Years |
| Hobby Lobby | Littleton, CO | | (d) | | 7,839 |
| | 9,299 |
| | — |
| | — |
| | 7,839 |
| | 9,299 |
| | 17,138 |
| | (3,562 | ) | | 1991 | | 07/17/13 | | 5 to 17 Years |
| HOM Furniture | Hermantown, MN | | (a) | | 1,881 |
| | 7,761 |
| | — |
| | — |
| | 1,881 |
| | 7,761 |
| | 9,642 |
| | (2,539 | ) | | 2003 | | 04/08/05 | | 15 to 40 Years |
| HOM Furniture | Eau Claire, WI | | (a) | | 1,597 |
| | 6,964 |
| | — |
| | — |
| | 1,597 |
| | 6,964 |
| | 8,561 |
| | (3,060 | ) | | 2004 | | 04/08/05 | | 15 to 30 Years |
| HOM Furniture | Fargo, ND | | (d) | | 2,095 |
| | 8,525 |
| | — |
| | — |
| | 2,095 |
| | 8,525 |
| | 10,620 |
| | (1,376 | ) | | 2005 | | 07/17/13 | | 8 to 32 Years |
| Home Depot | Lakewood, CO | | (c) | | 3,822 |
| | — |
| | — |
| | — |
| | 3,822 |
| | — |
| | 3,822 |
| | — |
| | (f) | | 07/17/13 | | (f) |
| Home Depot | Colma, CA | | (d) | | 21,065 |
| | 13,597 |
| | — |
| | 481 |
| | 21,065 |
| | 14,078 |
| | 35,143 |
| | (2,376 | ) | | 1995 | | 07/17/13 | | 2 to 33 Years |
| Home Depot | Memphis, TN | | (d) | | 3,777 |
| | 10,303 |
| | — |
| | 43 |
| | 3,777 |
| | 10,346 |
| | 14,123 |
| | (390 | ) | | 1996 | | 02/28/17 | | 9 to 30 Years |
| Home Depot | Highland Heights, OH | | (d) | | 4,897 |
| | 11,272 |
| | — |
| | 43 |
| | 4,897 |
| | 11,315 |
| | 16,212 |
| | (427 | ) | | 1995 | | 02/21/17 | | 3 to 30 Years |
| Home Depot | Tempe, AZ | | (d) | | 7,417 |
| | 9,795 |
| | — |
| | 41 |
| | 7,417 |
| | 9,836 |
| | 17,253 |
| | (391 | ) | | 1978 | | 05/12/17 | | 10 to 30 Years |
| Hooters | Richmond, VA | | (a) | | 1,253 |
| | 1,410 |
| | — |
| | 29 |
| | 1,253 |
| | 1,439 |
| | 2,692 |
| | (586 | ) | | 1977 | | 11/28/06 | | 15 to 30 Years |
| Hooters | Midlothian, VA | | (a) | | 823 |
| | 1,151 |
| | — |
| | 246 |
| | 823 |
| | 1,397 |
| | 2,220 |
| | (572 | ) | | 1994 | | 11/28/06 | | 15 to 30 Years |
| Hughes | Bowling Green, KY | | (a) | | 136 |
| | 228 |
| | — |
| | — |
| | 136 |
| | 228 |
| | 364 |
| | (112 | ) | | 1993 | | 05/01/05 | | 15 to 30 Years |
| Humperdinks | Arlington, TX | | (a) | | 2,064 |
| | 2,043 |
| | — |
| | — |
| | 2,064 |
| | 2,043 |
| | 4,107 |
| | (888 | ) | | 1995 | | 07/01/05 | | 15 to 30 Years |
| IBM | Greece, NY | | (d) | | 1,419 |
| | 20,548 |
| | — |
| | (11,004 | ) | | 1,419 |
| | 9,544 |
| | 10,963 |
| | (124 | ) | | 1989 | | 08/02/17 | | 10 to 40 Years |
SPIRIT REALTY CAPITAL, INC.
Schedule III Real Estate and
Accumulated Depreciation
(Amounts in thousands)
|
| | | | | | | | | | | | | | | | | | | | | | | | | |
| | | | | | Initial Cost to Company | | Cost Capitalized Subsequent to Acquisition including impairment | | Gross Amount at December 31, 2016 (d) 2017 (g) | | | | | | | | |
| Concept | City, State | | Encumbrances (e) | | Land and Improvements | | Buildings and Improvements | | Land and Improvements | | Buildings and Improvements | | Land and Improvements | | Buildings and Improvements | | Total | | Final Accumulated Depreciation | | Date of Construction | | Date Acquired | | Life in which depreciation in latest Statement of Operations is computed |
Description | | Encumbrances (e)
| | Land and
Improvements
| | Buildings and
Improvements
| | Improvements/
Land
| | Improvements/
building
| | Land and
Improvements
| | Buildings and
Improvements
| | Total | | Final
Accum
| | Date of
Construction
| | Date
Acquired
| |
|
| | | | | | | | | | | | | | | | | | | | | | | | | | | | | | | | | |
| | Gardendale, AL | | (a) | | 586 |
| | 1,274 |
| | — |
| | — |
| | 586 |
| | 1,274 |
| | 1,860 |
| | (300 | ) | | 1989 | | 12/22/06 | | 40 to 40 Years |
| | Gibsonton, FL | | (c) | | 526 |
| | 448 |
| | — |
| | — |
| | 526 |
| | 448 |
| | 974 |
| | (14 | ) | | 1999 | | 07/22/16 | | 7 to 30 Years |
| | Grand Bay, AL | | (a) | | 226 |
| | 1,242 |
| | — |
| | — |
| | 226 |
| | 1,242 |
| | 1,468 |
| | (125 | ) | | 2005 | | 07/17/13 | | 7 to 47 Years |
| | Grand Forks, ND | | (c) | | 287 |
| | 1,132 |
| | — |
| | — |
| | 287 |
| | 1,132 |
| | 1,419 |
| | (142 | ) | | 2005 | | 07/17/13 | | 7 to 45 Years |
| | Greenfield, IN | | (a) | | 458 |
| | 996 |
| | — |
| | — |
| | 458 |
| | 996 |
| | 1,454 |
| | (113 | ) | | 2003 | | 07/17/13 | | 7 to 47 Years |
| | Greensboro, NC | | (a) | | 721 |
| | 1,179 |
| | — |
| | — |
| | 721 |
| | 1,179 |
| | 1,900 |
| | (153 | ) | | 2002 | | 03/31/14 | | 7 to 30 Years |
| | Griffin, GA | | (c) | | 441 |
| | 1,142 |
| | — |
| | — |
| | 441 |
| | 1,142 |
| | 1,583 |
| | (17 | ) | | 1998 | | 07/22/16 | | 7 to 50 Years |
| | Gulf Breeze, FL | | (a) | | 296 |
| | 457 |
| | — |
| | — |
| | 296 |
| | 457 |
| | 753 |
| | (174 | ) | | 1993 | | 09/07/07 | | 15 to 30 Years |
| | Hampton, VA | | (a) | | 1,662 |
| | 2,974 |
| | — |
| | — |
| | 1,662 |
| | 2,974 |
| | 4,636 |
| | (448 | ) | | 1993 | | 07/17/13 | | 9 to 35 Years |
| | Hattiesburg, MS | | (c) | | 452 |
| | 821 |
| | — |
| | — |
| | 452 |
| | 821 |
| | 1,273 |
| | (12 | ) | | 1997 | | 07/22/16 | | 7 to 40 Years |
| | Hialeah, FL | | (c) | | 682 |
| | 1,054 |
| | — |
| | — |
| | 682 |
| | 1,054 |
| | 1,736 |
| | (17 | ) | | 1998 | | 07/22/16 | | 7 to 40 Years |
| | Holland Township, MI | | (c) | | 493 |
| | 1,212 |
| | — |
| | — |
| | 493 |
| | 1,212 |
| | 1,705 |
| | (123 | ) | | 2005 | | 07/17/13 | | 7 to 47 Years |
| | Holland, MI | | (c) | | 542 |
| | 1,384 |
| | — |
| | — |
| | 542 |
| | 1,384 |
| | 1,926 |
| | (147 | ) | | 2005 | | 07/17/13 | | 7 to 47 Years |
| | Huntsville, AL | | (a) | | 195 |
| | 1,649 |
| | — |
| | — |
| | 195 |
| | 1,649 |
| | 1,844 |
| | (388 | ) | | 1993 | | 12/22/06 | | 40 to 40 Years |
| | Huntsville, AL | | (a) | | 295 |
| | 893 |
| | — |
| | — |
| | 295 |
| | 893 |
| | 1,188 |
| | (210 | ) | | 1994 | | 12/22/06 | | 40 to 40 Years |
| | Huntsville, AL | | (a) | | 374 |
| | 1,295 |
| | — |
| | 109 |
| | 374 |
| | 1,404 |
| | 1,778 |
| | (344 | ) | | 1997 | | 12/22/06 | | 19 to 40 Years |
| | Huntsville, AL | | (a) | | 252 |
| | 917 |
| | — |
| | — |
| | 252 |
| | 917 |
| | 1,169 |
| | (288 | ) | | 1965 | | 12/22/06 | | 30 to 30 Years |
| | Huntsville, AL | | (a) | | 184 |
| | 1,037 |
| | — |
| | — |
| | 184 |
| | 1,037 |
| | 1,221 |
| | (195 | ) | | 2001 | | 12/22/06 | | 50 to 50 Years |
| | Hurley, MS | | (a) | | 265 |
| | 1,052 |
| | — |
| | — |
| | 265 |
| | 1,052 |
| | 1,317 |
| | (125 | ) | | 2006 | | 07/17/13 | | 7 to 45 Years |
| | Irvington, NJ | | (a) | | 1,605 |
| | 1,912 |
| | — |
| | — |
| | 1,605 |
| | 1,912 |
| | 3,517 |
| | (215 | ) | | 2006 | | 07/17/13 | | 7 to 47 Years |
| | Jackson, MS | | (c) | | 396 |
| | 423 |
| | — |
| | — |
| | 396 |
| | 423 |
| | 819 |
| | (9 | ) | | 1998 | | 07/22/16 | | 7 to 30 Years |
| | Jackson, OH | | (a) | | 397 |
| | 1,251 |
| | — |
| | — |
| | 397 |
| | 1,251 |
| | 1,648 |
| | (139 | ) | | 2005 | | 07/17/13 | | 7 to 47 Years |
| | Kalamazoo, MI | | (a) | | 201 |
| | 362 |
| | — |
| | — |
| | 201 |
| | 362 |
| | 563 |
| | (55 | ) | | 1987 | | 06/23/14 | | 15 to 20 Years |
| | Kalamazoo, MI | | (a) | | 312 |
| | 262 |
| | — |
| | — |
| | 312 |
| | 262 |
| | 574 |
| | (44 | ) | | 1984 | | 06/23/14 | | 15 to 20 Years |
| | Kalamazoo, MI | | (a) | | 60 |
| | 211 |
| | — |
| | — |
| | 60 |
| | 211 |
| | 271 |
| | (31 | ) | | 1986 | | 06/23/14 | | 15 to 20 Years |
| | Kalamazoo, MI | | (a) | | 171 |
| | 332 |
| | — |
| | — |
| | 171 |
| | 332 |
| | 503 |
| | (58 | ) | | 1979 | | 06/23/14 | | 15 to 20 Years |
| | Kalamazoo, MI | | (a) | | 352 |
| | 262 |
| | — |
| | — |
| | 352 |
| | 262 |
| | 614 |
| | (53 | ) | | 1987 | | 06/23/14 | | 15 to 20 Years |
| | Kalamazoo, MI | | (a) | | 503 |
| | 342 |
| | — |
| | — |
| | 503 |
| | 342 |
| | 845 |
| | (93 | ) | | 1989 | | 06/23/14 | | 15 to 20 Years |
| | Kalamazoo, MI | | (a) | | 247 |
| | 333 |
| | — |
| | — |
| | 247 |
| | 333 |
| | 580 |
| | (49 | ) | | 1982 | | 07/30/14 | | 15 to 20 Years |
| | Kalamzaoo, MI | | (a) | | 141 |
| | 141 |
| | — |
| | — |
| | 141 |
| | 141 |
| | 282 |
| | (28 | ) | | 1959 | | 06/23/14 | | 15 to 20 Years |
| | Kennesaw, GA | | (a) | | 874 |
| | 1,270 |
| | — |
| | — |
| | 874 |
| | 1,270 |
| | 2,144 |
| | (121 | ) | | 1999 | | 03/28/14 | | 15 to 40 Years |
| | Kingsland, GA | | (c) | | 1,037 |
| | 997 |
| | — |
| | — |
| | 1,037 |
| | 997 |
| | 2,034 |
| | (16 | ) | | 1998 | | 07/22/16 | | 7 to 40 Years |
| | Lakeland, FL | | (a) | | 1,204 |
| | 1,917 |
| | — |
| | — |
| | 1,204 |
| | 1,917 |
| | 3,121 |
| | (258 | ) | | 1991 | | 07/17/13 | | 7 to 38 Years |
| | Largo, FL | | (a) | | 416 |
| | 493 |
| | — |
| | 111 |
| | 416 |
| | 604 |
| | 1,020 |
| | (127 | ) | | 1989 | | 03/19/13 | | 10 to 30 Years |
| | Lawrenceville, GA | | (a) | | 722 |
| | 976 |
| | — |
| | — |
| | 722 |
| | 976 |
| | 1,698 |
| | (95 | ) | | 2000 | | 03/28/14 | | 15 to 40 Years |
| | Leesburg, GA | | (c) | | 435 |
| | 494 |
| | — |
| | — |
| | 435 |
| | 494 |
| | 929 |
| | (16 | ) | | 1999 | | 07/22/16 | | 7 to 30 Years |
| | Lincoln, NE | | (a) | | 1,318 |
| | 1,604 |
| | — |
| | — |
| | 1,318 |
| | 1,604 |
| | 2,922 |
| | (781 | ) | | 1972 | | 04/29/11 | | 11 to 26 Years |
| | Livonia, MI | | (a) | | 252 |
| | 262 |
| | — |
| | — |
| | 252 |
| | 262 |
| | 514 |
| | (44 | ) | | 1986 | | 06/23/14 | | 15 to 20 Years |
|
| | | | | | | | | | | | | | | | | | | | | | | | | | | | | | | | | |
| IBM | Columbus, OH | | (d) | | 3,154 |
| | 19,715 |
| | — |
| | 12,816 |
| | 3,154 |
| | 32,531 |
| | 35,685 |
| | (578 | ) | | 1989 | | 08/02/17 | | 5 to 30 Years |
| III Forks | Dallas, TX | | (b) | | 2,965 |
| | 9,066 |
| | — |
| | — |
| | 2,965 |
| | 9,066 |
| | 12,031 |
| | (1,294 | ) | | 1998 | | 07/17/13 | | 11 to 35 Years |
| Industrial | New Castle, PA | | (d) | | 1,084 |
| | 5,507 |
| | — |
| | — |
| | 1,084 |
| | 5,507 |
| | 6,591 |
| | (1,243 | ) | | 1999 | | 07/17/13 | | 8 to 26 Years |
| In-Shape | Modesto, CA | | (d) | | 2,350 |
| | 5,923 |
| | — |
| | — |
| | 2,350 |
| | 5,923 |
| | 8,273 |
| | (860 | ) | | 1964 | | 12/05/14 | | 10 to 30 Years |
| In-Shape | Manteca, CA | | (d) | | 796 |
| | 2,062 |
| | — |
| | — |
| | 796 |
| | 2,062 |
| | 2,858 |
| | (185 | ) | | 2001 | | 09/04/15 | | 15 to 30 Years |
| J. Jill | Tilton, NH | | (c) | | 7,420 |
| | 19,608 |
| | — |
| | — |
| | 7,420 |
| | 19,608 |
| | 27,028 |
| | (5,512 | ) | | 1998 | | 07/17/13 | | 8 to 25 Years |
| Jack in the Box | Auburn, CA | | (a) | | 579 |
| | 299 |
| | — |
| | — |
| | 579 |
| | 299 |
| | 878 |
| | (155 | ) | | 1992 | | 12/29/06 | | 15 to 30 Years |
| Jack Stack Barbeque | Overland Park, KS | | (a) | | 2,549 |
| | 3,219 |
| | — |
| | — |
| | 2,549 |
| | 3,219 |
| | 5,768 |
| | (480 | ) | | 1983 | | 05/15/14 | | 15 to 30 Years |
| Jiffy Lube | Bonita Springs, FL | | (b) | | 582 |
| | 312 |
| | — |
| | 101 |
| | 582 |
| | 413 |
| | 995 |
| | (125 | ) | | 1990 | | 03/19/13 | | 10 to 30 Years |
| Jiffy Lube | Sarasota, FL | | (b) | | 386 |
| | 312 |
| | — |
| | 141 |
| | 386 |
| | 453 |
| | 839 |
| | (137 | ) | | 1987 | | 03/19/13 | | 10 to 30 Years |
| Jiffy Lube | Naples, FL | | (b) | | 333 |
| | 302 |
| | — |
| | 121 |
| | 333 |
| | 423 |
| | 756 |
| | (122 | ) | | 1990 | | 03/19/13 | | 10 to 30 Years |
| Jiffy Lube | Largo, FL | | (b) | | 416 |
| | 493 |
| | — |
| | 111 |
| | 416 |
| | 604 |
| | 1,020 |
| | (160 | ) | | 1989 | | 03/19/13 | | 10 to 30 Years |
| Jiffy Lube | Fort Myers, FL | | (b) | | 555 |
| | 312 |
| | — |
| | 131 |
| | 555 |
| | 443 |
| | 998 |
| | (141 | ) | | 1990 | | 03/19/13 | | 10 to 30 Years |
| Jiffy Lube | Sarasota, FL | | (b) | | 278 |
| | 312 |
| | — |
| | 131 |
| | 278 |
| | 443 |
| | 721 |
| | (123 | ) | | 1987 | | 03/19/13 | | 10 to 30 Years |
| Jiffy Lube | Clearwater, FL | | (b) | | 463 |
| | 443 |
| | — |
| | 131 |
| | 463 |
| | 574 |
| | 1,037 |
| | (158 | ) | | 1989 | | 03/19/13 | | 10 to 30 Years |
| Jiffy Lube | Bradenton, FL | | (b) | | 594 |
| | 493 |
| | — |
| | 222 |
| | 594 |
| | 715 |
| | 1,309 |
| | (225 | ) | | 1988 | | 03/19/13 | | 10 to 30 Years |
| Jo-Ann's | Reading, PA | | (d) | | 449 |
| | 3,222 |
| | — |
| | — |
| | 449 |
| | 3,222 |
| | 3,671 |
| | (366 | ) | | 1998 | | 07/17/13 | | 8 to 40 Years |
| Jo-Ann's | Alpharetta, GA | | (d) | | 2,819 |
| | 3,139 |
| | — |
| | — |
| | 2,819 |
| | 3,139 |
| | 5,958 |
| | (475 | ) | | 2000 | | 07/17/13 | | 5 to 43 Years |
|
| | | | | | | | | | | | | | | | | | | | | | | | | | | | | | | | | |
| Joe's Crab Shack | Beaumont, TX | | (a) | | 1,435 |
| | 1,541 |
| | — |
| | — |
| | 1,435 |
| | 1,541 |
| | 2,976 |
| | (758 | ) | | 1997 | | 06/29/07 | | 15 to 40 Years |
| Joe's Crab Shack | Plano, TX | | (a) | | 2,418 |
| | 1,529 |
| | — |
| | — |
| | 2,418 |
| | 1,529 |
| | 3,947 |
| | (672 | ) | | 1998 | | 06/29/07 | | 15 to 40 Years |
| Joe's Crab Shack | Colorado Springs, CO | | (a) | | 674 |
| | 519 |
| | — |
| | — |
| | 674 |
| | 519 |
| | 1,193 |
| | (146 | ) | | 1989 | | 11/19/12 | | 5 to 30 Years |
| Kansas Bar and Grill | Emporia, KS | | (a) | | 657 |
| | 219 |
| | — |
| | — |
| | 657 |
| | 219 |
| | 876 |
| | (43 | ) | | 1997 | | 06/04/14 | | 15 to 30 Years |
| Kansas Bar and Grill | Winfield, KS | | (a) | | 239 |
| | 866 |
| | — |
| | — |
| | 239 |
| | 866 |
| | 1,105 |
| | (144 | ) | | 1995 | | 06/04/14 | | 15 to 30 Years |
| Kansas Bar and Grill | Colby, KS | | (a) | | 269 |
| | 567 |
| | — |
| | — |
| | 269 |
| | 567 |
| | 836 |
| | (101 | ) | | 1987 | | 06/04/14 | | 15 to 30 Years |
| Kansas Bar and Grill | Dodge City, KS | | (a) | | 249 |
| | 587 |
| | — |
| | — |
| | 249 |
| | 587 |
| | 836 |
| | (87 | ) | | 1985 | | 06/04/14 | | 15 to 30 Years |
| Kansas Bar and Grill | Newton, KS | | (a) | | 175 |
| | 661 |
| | — |
| | — |
| | 175 |
| | 661 |
| | 836 |
| | (106 | ) | | 1987 | | 06/30/14 | | 15 to 30 Years |
SPIRIT REALTY CAPITAL, INC.
Schedule III Real Estate and
Accumulated Depreciation
(Amounts in thousands)
|
| | | | | | | | | | | | | | | | | | | | | | | | | |
| | | | | | Initial Cost to Company | | Cost Capitalized Subsequent to Acquisition including impairment | | Gross Amount at December 31, 2016 (d) 2017 (g) | | | | | | | | |
| Concept | City, State | | Encumbrances (e) | | Land and Improvements | | Buildings and Improvements | | Land and Improvements | | Buildings and Improvements | | Land and Improvements | | Buildings and Improvements | | Total | | Final Accumulated Depreciation | | Date of Construction | | Date Acquired | | Life in which depreciation in latest Statement of Operations is computed |
Description | | Encumbrances (e)
| | Land and
Improvements
| | Buildings and
Improvements
| | Improvements/
Land
| | Improvements/
building
| | Land and
Improvements
| | Buildings and
Improvements
| | Total | | Final
Accum
| | Date of
Construction
| | Date
Acquired
| |
|
| | | | | | | | | | | | | | | | | | | | | | | | | | | | | | | | | |
| | Macomb Township, MI | | (a) | | 181 |
| | 262 |
| | — |
| | — |
| | 181 |
| | 262 |
| | 443 |
| | (43 | ) | | 1986 | | 06/23/14 | | 15 to 20 Years |
| | Madison Heights, MI | | (a) | | 352 |
| | 493 |
| | — |
| | — |
| | 352 |
| | 493 |
| | 845 |
| | (78 | ) | | 1984 | | 06/23/14 | | 15 to 20 Years |
| | Madison, AL | | (a) | | 359 |
| | 1,505 |
| | 40 |
| | 456 |
| | 399 |
| | 1,961 |
| | 2,360 |
| | (363 | ) | | 1995 | | 12/22/06 | | 15 to 40 Years |
| | Madison, AL | | (a) | | 211 |
| | 1,401 |
| | — |
| | — |
| | 211 |
| | 1,401 |
| | 1,612 |
| | (330 | ) | | 1997 | | 12/22/06 | | 40 to 40 Years |
| | Madison, TN | | (a) | | 662 |
| | 1,567 |
| | — |
| | — |
| | 662 |
| | 1,567 |
| | 2,229 |
| | (145 | ) | | 2000 | | 03/31/14 | | 14 to 40 Years |
| | Margate, FL | | (c) | | 480 |
| | 507 |
| | — |
| | — |
| | 480 |
| | 507 |
| | 987 |
| | (10 | ) | | 1991 | | 07/22/16 | | 7 to 40 Years |
| | Marianna, FL | | (a) | | 283 |
| | 452 |
| | — |
| | — |
| | 283 |
| | 452 |
| | 735 |
| | (168 | ) | | 1994 | | 09/07/07 | | 15 to 40 Years |
| | Maryland Heights, MO | | (a) | | 522 |
| | 1,155 |
| | — |
| | — |
| | 522 |
| | 1,155 |
| | 1,677 |
| | (132 | ) | | 2005 | | 07/17/13 | | 7 to 47 Years |
| | Midwest City, OK | | (a) | | 353 |
| | 815 |
| | — |
| | — |
| | 353 |
| | 815 |
| | 1,168 |
| | (107 | ) | | 2007 | | 07/17/13 | | 9 to 44 Years |
| | Milton, FL | | (a) | | 137 |
| | 577 |
| | — |
| | — |
| | 137 |
| | 577 |
| | 714 |
| | (214 | ) | | 1986 | | 09/07/07 | | 15 to 30 Years |
| | Mobile, AL | | (a) | | 157 |
| | 508 |
| | — |
| | — |
| | 157 |
| | 508 |
| | 665 |
| | (192 | ) | | 1982 | | 09/07/07 | | 15 to 30 Years |
| | Mobile, AL | | (a) | | 89 |
| | 501 |
| | — |
| | — |
| | 89 |
| | 501 |
| | 590 |
| | (181 | ) | | 1982 | | 11/30/07 | | 15 to 30 Years |
| | Montgomery, AL | | (a) | | 398 |
| | 626 |
| | — |
| | — |
| | 398 |
| | 626 |
| | 1,024 |
| | (259 | ) | | 1997 | | 09/07/07 | | 15 to 30 Years |
| | Montgomery, AL | | (a) | | 241 |
| | 628 |
| | — |
| | — |
| | 241 |
| | 628 |
| | 869 |
| | (238 | ) | | 1997 | | 09/07/07 | | 15 to 30 Years |
| | Montgomery, AL | | (a) | | 422 |
| | 857 |
| | — |
| | — |
| | 422 |
| | 857 |
| | 1,279 |
| | (326 | ) | | 1992 | | 09/07/07 | | 15 to 30 Years |
| | Montgomery, AL | | (a) | | 303 |
| | 636 |
| | — |
| | — |
| | 303 |
| | 636 |
| | 939 |
| | (247 | ) | | 1996 | | 09/07/07 | | 15 to 30 Years |
| | Montgomery, AL | | (a) | | 275 |
| | 528 |
| | — |
| | — |
| | 275 |
| | 528 |
| | 803 |
| | (222 | ) | | 1988 | | 09/07/07 | | 15 to 30 Years |
| | Moultrie, GA | | (a) | | 179 |
| | 271 |
| | — |
| | — |
| | 179 |
| | 271 |
| | 450 |
| | (168 | ) | | 1983 | | 09/07/07 | | 15 to 20 Years |
| | Naples, FL | | (a) | | 333 |
| | 302 |
| | — |
| | 121 |
| | 333 |
| | 423 |
| | 756 |
| | (96 | ) | | 1990 | | 03/19/13 | | 10 to 30 Years |
| | Naples, FL | | (a) | | 249 |
| | 265 |
| | — |
| | — |
| | 249 |
| | 265 |
| | 514 |
| | (49 | ) | | 1966 | | 10/28/13 | | 9 to 20 Years |
| | Naples, FL | | (a) | | 425 |
| | 424 |
| | — |
| | — |
| | 425 |
| | 424 |
| | 849 |
| | (72 | ) | | 2006 | | 10/28/13 | | 9 to 30 Years |
| | Nashville, TN | | (a) | | 828 |
| | 1,405 |
| | — |
| | — |
| | 828 |
| | 1,405 |
| | 2,233 |
| | (176 | ) | | 2000 | | 03/31/14 | | 14 to 30 Years |
| | Natchez, MS | | (c) | | 509 |
| | 754 |
| | — |
| | — |
| | 509 |
| | 754 |
| | 1,263 |
| | (12 | ) | | 1998 | | 07/22/16 | | 7 to 40 Years |
| | New Boston, OH | | (a) | | 345 |
| | 1,538 |
| | — |
| | — |
| | 345 |
| | 1,538 |
| | 1,883 |
| | (148 | ) | | 2005 | | 07/17/13 | | 7 to 47 Years |
| | New Smyrna Beach, FL | | (c) | | 774 |
| | 818 |
| | — |
| | — |
| | 774 |
| | 818 |
| | 1,592 |
| | (14 | ) | | 1999 | | 07/22/16 | | 7 to 40 Years |
| | Newton, MS | | (c) | | 336 |
| | 443 |
| | — |
| | — |
| | 336 |
| | 443 |
| | 779 |
| | (10 | ) | | 1998 | | 07/22/16 | | 7 to 30 Years |
| | Niceville, FL | | (a) | | 458 |
| | 454 |
| | — |
| | — |
| | 458 |
| | 454 |
| | 912 |
| | (150 | ) | | 1996 | | 09/07/07 | | 15 to 40 Years |
| | North Little Rock, AR | | (a) | | 244 |
| | 310 |
| | — |
| | — |
| | 244 |
| | 310 |
| | 554 |
| | (42 | ) | | 2001 | | 03/31/14 | | 2 to 30 Years |
| | Ocean Springs, MS | | (a) | | 145 |
| | 186 |
| | — |
| | — |
| | 145 |
| | 186 |
| | 331 |
| | (31 | ) | | 1988 | | 07/17/13 | | 15 to 30 Years |
| | Opelika, AL | | (a) | | 503 |
| | 628 |
| | — |
| | — |
| | 503 |
| | 628 |
| | 1,131 |
| | (274 | ) | | 1995 | | 09/07/07 | | 15 to 30 Years |
| | Orem, UT | | (a) | | 1,224 |
| | 2,132 |
| | — |
| | — |
| | 1,224 |
| | 2,132 |
| | 3,356 |
| | (278 | ) | | 1990 | | 07/17/13 | | 9 to 40 Years |
| | Oxford, AL | | (a) | | 120 |
| | 1,224 |
| | — |
| | — |
| | 120 |
| | 1,224 |
| | 1,344 |
| | (288 | ) | | 1990 | | 12/22/06 | | 40 to 40 Years |
| | Panama City, FL | | (a) | | 378 |
| | 252 |
| | — |
| | — |
| | 378 |
| | 252 |
| | 630 |
| | (53 | ) | | 1997 | | 07/17/13 | | 15 to 30 Years |
| | Pasadena, TX | | (a) | | 1,224 |
| | 4,263 |
| | — |
| | — |
| | 1,224 |
| | 4,263 |
| | 5,487 |
| | (488 | ) | | 1995 | | 07/17/13 | | 9 to 40 Years |
| | Pea Ridge, AR | | (a) | | 217 |
| | — |
| | — |
| | — |
| | 217 |
| | — |
| | 217 |
| | — |
| | (f) | | 03/31/14 | | (f) |
|
| | | | | | | | | | | | | | | | | | | | | | | | | | | | | | | | | |
| Kansas Buffet Company | Stillwater, OK | | (a) | | 647 |
| | 687 |
| | — |
| | — |
| | 647 |
| | 687 |
| | 1,334 |
| | (118 | ) | | 1987 | | 06/04/14 | | 15 to 30 Years |
| Kansas Buffet Company | Hutchinson, KS | | (a) | | 895 |
| | 856 |
| | — |
| | — |
| | 895 |
| | 856 |
| | 1,751 |
| | (150 | ) | | 1987 | | 06/04/14 | | 15 to 30 Years |
| Kansas Buffet Company | Ottawa, KS | | (a) | | 348 |
| | 816 |
| | — |
| | — |
| | 348 |
| | 816 |
| | 1,164 |
| | (126 | ) | | 1987 | | 06/04/14 | | 15 to 30 Years |
| Kansas Buffet Company | Arkansas city, KS | | (a) | | 239 |
| | 975 |
| | — |
| | — |
| | 239 |
| | 975 |
| | 1,214 |
| | (154 | ) | | 1987 | | 06/04/14 | | 15 to 30 Years |
| Kansas Buffet Company | Topeka, KS | | (a) | | 1,224 |
| | 905 |
| | — |
| | — |
| | 1,224 |
| | 905 |
| | 2,129 |
| | (187 | ) | | 1988 | | 06/04/14 | | 15 to 30 Years |
| K-Bob's Steakhouse | Fredericksburg, TX | | (d) | | 511 |
| | 1,516 |
| | — |
| | — |
| | 511 |
| | 1,516 |
| | 2,027 |
| | (290 | ) | | 1985 | | 07/17/13 | | 11 to 30 Years |
| Kerry's Car Care | Phoenix, AZ | | (a) | | 956 |
| | 1,485 |
| | — |
| | — |
| | 956 |
| | 1,485 |
| | 2,441 |
| | (125 | ) | | 2015 | | 06/24/16 | | 4 to 40 Years |
| KFC | Atlanta, GA | | (a) | | 513 |
| | 483 |
| | — |
| | — |
| | 513 |
| | 483 |
| | 996 |
| | (122 | ) | | 2002 | | 02/02/12 | | 15 to 30 Years |
| KFC | Roswell, GA | | (a) | | 513 |
| | 559 |
| | — |
| | — |
| | 513 |
| | 559 |
| | 1,072 |
| | (111 | ) | | 2006 | | 02/02/12 | | 15 to 40 Years |
| KFC | Kansas City, KS | | (a) | | 349 |
| | 425 |
| | — |
| | — |
| | 349 |
| | 425 |
| | 774 |
| | (114 | ) | | 1977 | | 10/03/11 | | 14 to 29 Years |
| KFC | Milan, IL | | (b) | | 161 |
| | 533 |
| | — |
| | — |
| | 161 |
| | 533 |
| | 694 |
| | (128 | ) | | 1997 | | 10/03/11 | | 15 to 30 Years |
| KFC | Davenport, IA | | (b) | | 441 |
| | 646 |
| | — |
| | — |
| | 441 |
| | 646 |
| | 1,087 |
| | (196 | ) | | 2002 | | 10/03/11 | | 15 to 30 Years |
| KFC | Independence, MO | | (b) | | 396 |
| | 1,074 |
| | — |
| | — |
| | 396 |
| | 1,074 |
| | 1,470 |
| | (285 | ) | | 1984 | | 10/03/11 | | 15 to 30 Years |
| KFC | Kansas City, KS | | (b) | | 594 |
| | 904 |
| | — |
| | — |
| | 594 |
| | 904 |
| | 1,498 |
| | (254 | ) | | 1999 | | 10/03/11 | | 15 to 30 Years |
| KFC | La Vista, NE | | (b) | | 499 |
| | 664 |
| | — |
| | — |
| | 499 |
| | 664 |
| | 1,163 |
| | (172 | ) | | 1992 | | 10/03/11 | | 15 to 30 Years |
| KFC | Omaha, NE | | (b) | | 539 |
| | 380 |
| | — |
| | — |
| | 539 |
| | 380 |
| | 919 |
| | (73 | ) | | 2006 | | 10/03/11 | | 15 to 40 Years |
| KFC | Calhoun, GA | | (b) | | 503 |
| | 713 |
| | — |
| | — |
| | 503 |
| | 713 |
| | 1,216 |
| | (179 | ) | | 1988 | | 02/02/12 | | 15 to 30 Years |
| KFC | Covington, GA | | (b) | | 526 |
| | 665 |
| | — |
| | — |
| | 526 |
| | 665 |
| | 1,191 |
| | (158 | ) | | 2001 | | 02/02/12 | | 15 to 30 Years |
| KFC | Decatur, GA | | (b) | | 677 |
| | 539 |
| | — |
| | — |
| | 677 |
| | 539 |
| | 1,216 |
| | (132 | ) | | 1989 | | 02/02/12 | | 15 to 30 Years |
| KFC | Hampton, GA | | (b) | | 568 |
| | 648 |
| | — |
| | — |
| | 568 |
| | 648 |
| | 1,216 |
| | (154 | ) | | 2002 | | 02/02/12 | | 15 to 30 Years |
| KFC | Jackson, GA | | (b) | | 467 |
| | 729 |
| | — |
| | — |
| | 467 |
| | 729 |
| | 1,196 |
| | (202 | ) | | 1992 | | 02/02/12 | | 15 to 30 Years |
| KFC | Morrow, GA | | (b) | | 530 |
| | 568 |
| | — |
| | — |
| | 530 |
| | 568 |
| | 1,098 |
| | (120 | ) | | 2006 | | 02/02/12 | | 15 to 40 Years |
| KFC | Stockbridge, GA | | (b) | | 388 |
| | 353 |
| | — |
| | — |
| | 388 |
| | 353 |
| | 741 |
| | (87 | ) | | 2001 | | 02/02/12 | | 15 to 30 Years |
| KFC | Stone Mountain, GA | | (b) | | 379 |
| | 487 |
| | — |
| | — |
| | 379 |
| | 487 |
| | 866 |
| | (114 | ) | | 1986 | | 02/02/12 | | 15 to 30 Years |
| KFC | Kingston, PA | | (d) | | 521 |
| | 635 |
| | — |
| | — |
| | 521 |
| | 635 |
| | 1,156 |
| | (82 | ) | | 1978 | | 11/18/14 | | 15 to 30 Years |
| KFC | Bloomsburg, PA | | (d) | | 698 |
| | 823 |
| | — |
| | — |
| | 698 |
| | 823 |
| | 1,521 |
| | (119 | ) | | 1993 | | 11/18/14 | | 15 to 30 Years |
| KFC | Williamsport, PA | | (d) | | 864 |
| | 979 |
| | — |
| | — |
| | 864 |
| | 979 |
| | 1,843 |
| | (128 | ) | | 1966 | | 11/18/14 | | 15 to 30 Years |
| Kohl's | Wichita, KS | | (d) | | 2,163 |
| | 7,036 |
| | — |
| | 242 |
| | 2,163 |
| | 7,278 |
| | 9,441 |
| | (1,311 | ) | | 1996 | | 07/17/13 | | 8 to 36 Years |
SPIRIT REALTY CAPITAL, INC.
Schedule III Real Estate and
Accumulated Depreciation
(Amounts in thousands)
|
| | | | | | | | | | | | | | | | | | | | | | | | | |
| | | | | | Initial Cost to Company | | Cost Capitalized Subsequent to Acquisition including impairment | | Gross Amount at December 31, 2016 (d) 2017 (g) | | | | | | | | |
| Concept | City, State | | Encumbrances (e) | | Land and Improvements | | Buildings and Improvements | | Land and Improvements | | Buildings and Improvements | | Land and Improvements | | Buildings and Improvements | | Total | | Final Accumulated Depreciation | | Date of Construction | | Date Acquired | | Life in which depreciation in latest Statement of Operations is computed |
Description | | Encumbrances (e)
| | Land and
Improvements
| | Buildings and
Improvements
| | Improvements/
Land
| | Improvements/
building
| | Land and
Improvements
| | Buildings and
Improvements
| | Total | | Final
Accum
| | Date of
Construction
| | Date
Acquired
| |
|
| | | | | | | | | | | | | | | | | | | | | | | | | | | | | | | | | |
| | Penns Grove, NJ | | (a) | | 612 |
| | 1,564 |
| | — |
| | — |
| | 612 |
| | 1,564 |
| | 2,176 |
| | (166 | ) | | 2006 | | 07/17/13 | | 8 to 47 Years |
| | Pensacola, FL | | (a) | | 238 |
| | 564 |
| | — |
| | — |
| | 238 |
| | 564 |
| | 802 |
| | (216 | ) | | 1994 | | 09/07/07 | | 15 to 30 Years |
| | Pensacola, FL | | (a) | | 104 |
| | 333 |
| | — |
| | — |
| | 104 |
| | 333 |
| | 437 |
| | (137 | ) | | 1968 | | 09/07/07 | | 15 to 30 Years |
| | Pensacola, FL | | (a) | | 148 |
| | 459 |
| | — |
| | — |
| | 148 |
| | 459 |
| | 607 |
| | (172 | ) | | 1972 | | 09/07/07 | | 15 to 30 Years |
| | Pensacola, FL | | (a) | | 195 |
| | 569 |
| | — |
| | — |
| | 195 |
| | 569 |
| | 764 |
| | (222 | ) | | 1983 | | 09/07/07 | | 15 to 30 Years |
| | Pensacola, FL | | (a) | | 150 |
| | 575 |
| | — |
| | — |
| | 150 |
| | 575 |
| | 725 |
| | (222 | ) | | 1986 | | 09/07/07 | | 15 to 30 Years |
| | Phoenix, AZ | | (a) | | 956 |
| | 1,485 |
| | — |
| | — |
| | 956 |
| | 1,485 |
| | 2,441 |
| | (38 | ) | | 2015 | | 06/24/16 | | 5 to 40 Years |
| | Pinson, AL | | (a) | | 320 |
| | 916 |
| | — |
| | — |
| | 320 |
| | 916 |
| | 1,236 |
| | (173 | ) | | 2001 | | 12/22/06 | | 50 to 50 Years |
| | Port Orange, FL | | (a) | | 599 |
| | 967 |
| | — |
| | 35 |
| | 599 |
| | 1,002 |
| | 1,601 |
| | (23 | ) | | 1997 | | 06/24/16 | | 30 to 30 Years |
| | Portage, MI | | (a) | | 423 |
| | 262 |
| | — |
| | — |
| | 423 |
| | 262 |
| | 685 |
| | (46 | ) | | 1985 | | 06/23/14 | | 15 to 20 Years |
| | Portland, ME | | (a) | | 650 |
| | 566 |
| | — |
| | — |
| | 650 |
| | 566 |
| | 1,216 |
| | (282 | ) | | 1993 | | 06/30/09 | | 13 to 28 Years |
| | Rainsville, AL | | (a) | | 251 |
| | 1,073 |
| | — |
| | — |
| | 251 |
| | 1,073 |
| | 1,324 |
| | (133 | ) | | 2005 | | 07/17/13 | | 7 to 42 Years |
| | Richmond Hill, GA | | (c) | | 418 |
| | 701 |
| | — |
| | — |
| | 418 |
| | 701 |
| | 1,119 |
| | (14 | ) | | 1995 | | 07/22/16 | | 7 to 30 Years |
| | Sarasota, FL | | (a) | | 386 |
| | 312 |
| | — |
| | 141 |
| | 386 |
| | 453 |
| | 839 |
| | (108 | ) | | 1987 | | 03/19/13 | | 10 to 30 Years |
| | Sarasota, FL | | (a) | | 278 |
| | 312 |
| | — |
| | 131 |
| | 278 |
| | 443 |
| | 721 |
| | (97 | ) | | 1987 | | 03/19/13 | | 10 to 30 Years |
| | Savannah, GA | | (c) | | 688 |
| | 492 |
| | — |
| | — |
| | 688 |
| | 492 |
| | 1,180 |
| | (12 | ) | | 1995 | | 07/22/16 | | 7 to 40 Years |
| | Scottsburg, IN | | (a) | | 238 |
| | 665 |
| | — |
| | — |
| | 238 |
| | 665 |
| | 903 |
| | (83 | ) | | 2006 | | 07/17/13 | | 8 to 43 Years |
| | Shelby Township, MI | | (a) | | 387 |
| | 355 |
| | — |
| | — |
| | 387 |
| | 355 |
| | 742 |
| | (60 | ) | | 1989 | | 07/30/14 | | 15 to 20 Years |
| | Spanish Fort, AL | | (a) | | 563 |
| | 607 |
| | — |
| | — |
| | 563 |
| | 607 |
| | 1,170 |
| | (305 | ) | | 1993 | | 09/07/07 | | 15 to 30 Years |
| | St Clair Shores, MI | | (a) | | 242 |
| | 272 |
| | — |
| | — |
| | 242 |
| | 272 |
| | 514 |
| | (46 | ) | | 1985 | | 06/23/14 | | 15 to 20 Years |
| | St. Francis, WI | | (a) | | 532 |
| | 1,557 |
| | — |
| | — |
| | 532 |
| | 1,557 |
| | 2,089 |
| | (182 | ) | | 2006 | | 07/17/13 | | 8 to 48 Years |
| | St. Louis, MO | | (c) | | 607 |
| | 505 |
| | — |
| | — |
| | 607 |
| | 505 |
| | 1,112 |
| | (13 | ) | | 1997 | | 07/22/16 | | 7 to 30 Years |
| | Suwanee, GA | | (a) | | 480 |
| | 1,350 |
| | — |
| | — |
| | 480 |
| | 1,350 |
| | 1,830 |
| | (181 | ) | | 1986 | | 10/21/13 | | 13 to 30 Years |
| | Tamarac, FL | | (a) | | 1,407 |
| | 2,660 |
| | — |
| | — |
| | 1,407 |
| | 2,660 |
| | 4,067 |
| | (317 | ) | | 1997 | | 07/17/13 | | 7 to 39 Years |
| | Tampa, FL | | (c) | | 721 |
| | 1,055 |
| | — |
| | — |
| | 721 |
| | 1,055 |
| | 1,776 |
| | (17 | ) | | 1997 | | 07/22/16 | | 7 to 40 Years |
| | Theodore, AL | | (c) | | 549 |
| | 755 |
| | — |
| | — |
| | 549 |
| | 755 |
| | 1,304 |
| | (14 | ) | | 1996 | | 07/22/16 | | 7 to 40 Years |
| | Trenton, OH | | (a) | | 324 |
| | 842 |
| | — |
| | — |
| | 324 |
| | 842 |
| | 1,166 |
| | (104 | ) | | 2003 | | 07/17/13 | | 7 to 47 Years |
| | Troy, MI | | (a) | | 322 |
| | 392 |
| | — |
| | — |
| | 322 |
| | 392 |
| | 714 |
| | (61 | ) | | 1984 | | 06/23/14 | | 15 to 20 Years |
| | Troy, MI | | (a) | | 281 |
| | 267 |
| | — |
| | — |
| | 281 |
| | 267 |
| | 548 |
| | (26 | ) | | 1989 | | 12/03/14 | | 15 to 30 Years |
| | Valdosta, GA | | (a) | | 376 |
| | 576 |
| | — |
| | — |
| | 376 |
| | 576 |
| | 952 |
| | (236 | ) | | 1996 | | 11/30/07 | | 15 to 30 Years |
| | Warren, AR | | (a) | | 217 |
| | 375 |
| | — |
| | — |
| | 217 |
| | 375 |
| | 592 |
| | (56 | ) | | 2006 | | 03/31/14 | | 13 to 30 Years |
| | Warren, MI | | (a) | | 409 |
| | 344 |
| | — |
| | — |
| | 409 |
| | 344 |
| | 753 |
| | (54 | ) | | 1986 | | 07/30/14 | | 15 to 20 Years |
| | Waterford, MI | | (a) | | 292 |
| | 362 |
| | — |
| | — |
| | 292 |
| | 362 |
| | 654 |
| | (62 | ) | | 1989 | | 06/23/14 | | 15 to 20 Years |
| | Waycross, GA | | (a) | | 380 |
| | 142 |
| | — |
| | — |
| | 380 |
| | 142 |
| | 522 |
| | (41 | ) | | 1998 | | 12/10/13 | | 15 to 30 Years |
| | Waynesboro, GA | | (c) | | 330 |
| | 1,015 |
| | — |
| | — |
| | 330 |
| | 1,015 |
| | 1,345 |
| | (15 | ) | | 1995 | | 07/22/16 | | 7 to 50 Years |
| | West Warwick, RI | | (a) | | 1,323 |
| | 2,917 |
| | — |
| | — |
| | 1,323 |
| | 2,917 |
| | 4,240 |
| | (369 | ) | | 1993 | | 07/17/13 | | 9 to 41 Years |
| | Wetumpka, AL | | (a) | | 185 |
| | 332 |
| | — |
| | — |
| | 185 |
| | 332 |
| | 517 |
| | (34 | ) | | 1995 | | 06/24/14 | | 12 to 30 Years |
|
| | | | | | | | | | | | | | | | | | | | | | | | | | | | | | | | | |
| Kohl's | Lake Zurich, IL | | (d) | | 4,860 |
| | 6,935 |
| | — |
| | — |
| | 4,860 |
| | 6,935 |
| | 11,795 |
| | (1,648 | ) | | 2000 | | 07/17/13 | | 7 to 32 Years |
| Kohl's | Grand Forks, ND | | (d) | | 1,516 |
| | 10,008 |
| | — |
| | — |
| | 1,516 |
| | 10,008 |
| | 11,524 |
| | (1,271 | ) | | 2006 | | 07/17/13 | | 9 to 46 Years |
| Kohl's | Tilton, NH | | (d) | | 3,959 |
| | — |
| | — |
| | — |
| | 3,959 |
| | — |
| | 3,959 |
| | — |
| | (f) | | 07/17/13 | | (f) |
| Kohl's | Olathe, KS | | (d) | | 3,505 |
| | 5,847 |
| | — |
| | 322 |
| | 3,505 |
| | 6,169 |
| | 9,674 |
| | (1,303 | ) | | 1995 | | 07/17/13 | | 9 to 35 Years |
| Kohl's | Sherwood, AR | | (d) | | 2,300 |
| | 5,995 |
| | — |
| | — |
| | 2,300 |
| | 5,995 |
| | 8,295 |
| | (886 | ) | | 2003 | | 02/23/15 | | 8 to 30 Years |
| Krispy Kreme | Bentonville, AR | | (a) | | 635 |
| | 900 |
| | — |
| | — |
| | 635 |
| | 900 |
| | 1,535 |
| | (438 | ) | | 2004 | | 07/07/05 | | 15 to 30 Years |
| Krispy Kreme | Little Rock, AR | | (a) | | 917 |
| | 847 |
| | — |
| | — |
| | 917 |
| | 847 |
| | 1,764 |
| | (430 | ) | | 2004 | | 07/07/05 | | 15 to 30 Years |
| Krispy Kreme | Lubbock, TX | | (a) | | 687 |
| | 856 |
| | — |
| | — |
| | 687 |
| | 856 |
| | 1,543 |
| | (432 | ) | | 2003 | | 07/07/05 | | 15 to 30 Years |
| Krispy Kreme | Lone Tree, CO | | (a) | | 1,717 |
| | 1,117 |
| | — |
| | — |
| | 1,717 |
| | 1,117 |
| | 2,834 |
| | (658 | ) | | 2000 | | 12/23/08 | | 13 to 38 Years |
| Kroger | LaGrange, GA | | (c) | | 972 |
| | 8,435 |
| | — |
| | — |
| | 972 |
| | 8,435 |
| | 9,407 |
| | (1,739 | ) | | 1998 | | 07/17/13 | | 4 to 25 Years |
| LA Fitness | Brooklyn Park, MN | | (d) | | 3,176 |
| | 7,771 |
| | — |
| | — |
| | 3,176 |
| | 7,771 |
| | 10,947 |
| | (1,404 | ) | | 2008 | | 07/17/13 | | 10 to 35 Years |
| LA Fitness | Matteson, IL | | (d) | | 4,587 |
| | 6,328 |
| | — |
| | — |
| | 4,587 |
| | 6,328 |
| | 10,915 |
| | (1,159 | ) | | 2007 | | 07/17/13 | | 10 to 34 Years |
| LA Fitness | Greenwood, IN | | (c) | | 1,973 |
| | 9,764 |
| | — |
| | — |
| | 1,973 |
| | 9,764 |
| | 11,737 |
| | (1,301 | ) | | 2007 | | 07/17/13 | | 10 to 42 Years |
| LA Fitness | League City, TX | | (c) | | 2,514 |
| | 6,767 |
| | — |
| | — |
| | 2,514 |
| | 6,767 |
| | 9,281 |
| | (998 | ) | | 2008 | | 07/17/13 | | 10 to 42 Years |
| LA Fitness | Naperville, IL | | (c) | | 5,015 |
| | 6,946 |
| | — |
| | — |
| | 5,015 |
| | 6,946 |
| | 11,961 |
| | (1,147 | ) | | 2007 | | 07/17/13 | | 9 to 38 Years |
| LA Fitness | Clinton Township, MI | | (a) | | 5,430 |
| | 7,254 |
| | (2,800 | ) | | (1,157 | ) | | 2,630 |
| | 6,097 |
| | 8,727 |
| | (1,003 | ) | | 1999 | | 01/09/07 | | 15 to 30 Years |
| LA Fitness | West Chester, OH | | (c) | | 606 |
| | 9,832 |
| | — |
| | — |
| | 606 |
| | 9,832 |
| | 10,438 |
| | (1,152 | ) | | 2009 | | 07/17/13 | | 7 to 43 Years |
| Ladybird Academy | Lake Mary, FL | | (d) | | 1,209 |
| | 1,733 |
| | — |
| | 851 |
| | 1,209 |
| | 2,584 |
| | 3,793 |
| | (270 | ) | | 2005 | | 09/19/14 | | 15 to 40 Years |
| Ladybird Academy | Sanford, FL | | (d) | | 1,028 |
| | 1,310 |
| | — |
| | — |
| | 1,028 |
| | 1,310 |
| | 2,338 |
| | (203 | ) | | 2003 | | 09/19/14 | | 15 to 40 Years |
| Ladybird Academy | Orlando, FL | | (d) | | 1,925 |
| | 2,529 |
| | — |
| | — |
| | 1,925 |
| | 2,529 |
| | 4,454 |
| | (319 | ) | | 2007 | | 09/19/14 | | 15 to 40 Years |
| Ladybird Academy | Windermere, FL | | (d) | | 2,912 |
| | 2,670 |
| | — |
| | — |
| | 2,912 |
| | 2,670 |
| | 5,582 |
| | (363 | ) | | 2011 | | 09/19/14 | | 15 to 40 Years |
| Ladybird Academy | Winter Springs, FL | | (d) | | 534 |
| | 746 |
| | — |
| | — |
| | 534 |
| | 746 |
| | 1,280 |
| | (135 | ) | | 1987 | | 09/19/14 | | 15 to 30 Years |
| Ladybird Academy | McKinney, TX | | (d) | | 1,056 |
| | 6,696 |
| | — |
| | 31 |
| | 1,056 |
| | 6,727 |
| | 7,783 |
| | (305 | ) | | 2015 | | 01/29/16 | | 17 to 50 Years |
| La-Z-Boy | Glendale, AZ | | (d) | | 1,395 |
| | 4,242 |
| | — |
| | — |
| | 1,395 |
| | 4,242 |
| | 5,637 |
| | (658 | ) | | 2001 | | 07/17/13 | | 2 to 45 Years |
| La-Z-Boy | Newington, CT | | (c) | | 1,778 |
| | 4,496 |
| | — |
| | — |
| | 1,778 |
| | 4,496 |
| | 6,274 |
| | (596 | ) | | 2006 | | 07/17/13 | | 8 to 45 Years |
| La-Z-Boy | Kentwood, MI | | (d) | | 1,145 |
| | 4,085 |
| | — |
| | — |
| | 1,145 |
| | 4,085 |
| | 5,230 |
| | (585 | ) | | 1987 | | 07/17/13 | | 4 to 38 Years |
| Lee's Famous Recipe Chicken | Xenia, OH | | (d) | | 384 |
| | 288 |
| | — |
| | — |
| | 384 |
| | 288 |
| | 672 |
| | (46 | ) | | 1985 | | 08/21/15 | | 15 to 20 Years |
| Lee's Famous Recipe Chicken | Dayton, OH | | (d) | | 467 |
| | 237 |
| | — |
| | — |
| | 467 |
| | 237 |
| | 704 |
| | (37 | ) | | 1984 | | 08/21/15 | | 15 to 20 Years |
| Lee's Famous Recipe Chicken | Miamisburg, OH | | (d) | | 139 |
| | 262 |
| | — |
| | — |
| | 139 |
| | 262 |
| | 401 |
| | (38 | ) | | 1970 | | 08/21/15 | | 15 to 20 Years |
SPIRIT REALTY CAPITAL, INC.
Schedule III Real Estate and
Accumulated Depreciation
(Amounts in thousands)
|
| | | | | | | | | | | | | | | | | | | | | | | | | |
| | | | | | Initial Cost to Company | | Cost Capitalized Subsequent to Acquisition including impairment | | Gross Amount at December 31, 2016 (d) 2017 (g) | | | | | | | | |
| Concept | City, State | | Encumbrances (e) | | Land and Improvements | | Buildings and Improvements | | Land and Improvements | | Buildings and Improvements | | Land and Improvements | | Buildings and Improvements | | Total | | Final Accumulated Depreciation | | Date of Construction | | Date Acquired | | Life in which depreciation in latest Statement of Operations is computed |
Description | | Encumbrances (e)
| | Land and
Improvements
| | Buildings and
Improvements
| | Improvements/
Land
| | Improvements/
building
| | Land and
Improvements
| | Buildings and
Improvements
| | Total | | Final
Accum
| | Date of
Construction
| | Date
Acquired
| |
|
| | | | | | | | | | | | | | | | | | | | | | | | | | | | | | | | | |
| | Wiggins, MS | | (c) | | 279 |
| | 630 |
| | — |
| | — |
| | 279 |
| | 630 |
| | 909 |
| | (12 | ) | | 1965 | | 07/22/16 | | 7 to 30 Years |
| | Willingboro, NJ | | (a) | | 784 |
| | 1,369 |
| | — |
| | — |
| | 784 |
| | 1,369 |
| | 2,153 |
| | (179 | ) | | 2007 | | 07/17/13 | | 9 to 47 Years |
| | Woodstock, GA | | (a) | | 1,108 |
| | 1,281 |
| | — |
| | — |
| | 1,108 |
| | 1,281 |
| | 2,389 |
| | (131 | ) | | 1999 | | 03/28/14 | | 15 to 40 Years |
| | Ypislianti, MI | | (a) | | 1,107 |
| | 745 |
| | — |
| | — |
| | 1,107 |
| | 745 |
| | 1,852 |
| | (109 | ) | | 1999 | | 06/23/14 | | 15 to 30 Years |
| | Zeeland, MI | | (c) | | 490 |
| | 1,136 |
| | — |
| | — |
| | 490 |
| | 1,136 |
| | 1,626 |
| | (125 | ) | | 2005 | | 07/17/13 | | 7 to 47 Years |
|
| | | | | | | | | | | | | | | | | | | | | | | | | | | | | | | | | |
| Lee's Famous Recipe Chicken | Englewood, OH | | (d) | | 235 |
| | 345 |
| | — |
| | — |
| | 235 |
| | 345 |
| | 580 |
| | (38 | ) | | 1988 | | 08/21/15 | | 15 to 30 Years |
| Lee's Famous Recipe Chicken | Trotwood, OH | | (d) | | 281 |
| | 220 |
| | — |
| | — |
| | 281 |
| | 220 |
| | 501 |
| | (39 | ) | | 1971 | | 08/21/15 | | 15 to 20 Years |
| Lerner and Rowe | Las Vegas, NV | | (a) | | 430 |
| | 3,589 |
| | — |
| | — |
| | 430 |
| | 3,589 |
| | 4,019 |
| | (347 | ) | | 2002 | | 09/30/13 | | 15 to 50 Years |
| Lerner and Rowe | Phoenix, AZ | | (a) | | 352 |
| | 2,435 |
| | — |
| | — |
| | 352 |
| | 2,435 |
| | 2,787 |
| | (224 | ) | | 1973 | | 09/30/13 | | 15 to 50 Years |
| Lerner and Rowe | Mesa, AZ | | (a) | | 372 |
| | 1,398 |
| | — |
| | — |
| | 372 |
| | 1,398 |
| | 1,770 |
| | (144 | ) | | 2003 | | 09/30/13 | | 15 to 50 Years |
| Lerner and Rowe | Bullhead City, AZ | | (a) | | 147 |
| | 489 |
| | — |
| | — |
| | 147 |
| | 489 |
| | 636 |
| | (64 | ) | | 1970 | | 09/30/13 | | 15 to 50 Years |
| Lerner and Rowe | Chicago, IL | | (a) | | 186 |
| | 1,780 |
| | — |
| | — |
| | 186 |
| | 1,780 |
| | 1,966 |
| | (151 | ) | | 2007 | | 09/30/13 | | 50 to 50 Years |
| Liberty Oilfield Services, LLC | Gillette, WY | | (d) | | 1,520 |
| | 4,561 |
| | — |
| | — |
| | 1,520 |
| | 4,561 |
| | 6,081 |
| | (552 | ) | | 2001 | | 12/30/14 | | 15 to 40 Years |
| Liberty Oilfield Services, LLC | Henderson, CO | | (d) | | 3,240 |
| | 5,720 |
| | — |
| | — |
| | 3,240 |
| | 5,720 |
| | 8,960 |
| | (637 | ) | | 1977 | | 12/30/14 | | 15 to 50 Years |
| Logan's Roadhouse | Johnson City, TN | | (d) | | 1,331 |
| | 2,304 |
| | — |
| | — |
| | 1,331 |
| | 2,304 |
| | 3,635 |
| | (492 | ) | | 1996 | | 07/17/13 | | 12 to 30 Years |
| Logan's Roadhouse | Trussville, AL | | (c) | | 1,222 |
| | 1,770 |
| | (1,029 | ) | | (1,499 | ) | | 193 |
| | 271 |
| | 464 |
| | (15 | ) | | 2007 | | 07/17/13 | | 9 to 34 Years |
| Long John Silver's | Crossville, TN | | (a) | | 353 |
| | 382 |
| | — |
| | — |
| | 353 |
| | 382 |
| | 735 |
| | (129 | ) | | 1977 | | 09/01/05 | | 15 to 40 Years |
| Long John Silver's | Morristown, TN | | (a) | | 588 |
| | 781 |
| | — |
| | — |
| | 588 |
| | 781 |
| | 1,369 |
| | (336 | ) | | 1987 | | 09/01/05 | | 15 to 30 Years |
| Long John Silver's | Oak Ridge, TN | | (a) | | 669 |
| | 548 |
| | — |
| | — |
| | 669 |
| | 548 |
| | 1,217 |
| | (228 | ) | | 1976 | | 09/01/05 | | 15 to 30 Years |
| Long John Silver's | Harriman, TN | | (a) | | 387 |
| | 502 |
| | — |
| | — |
| | 387 |
| | 502 |
| | 889 |
| | (291 | ) | | 1976 | | 09/01/05 | | 15 to 20 Years |
| Long John Silver's | Knoxville, TN | | (a) | | 332 |
| | 185 |
| | — |
| | — |
| | 332 |
| | 185 |
| | 517 |
| | (132 | ) | | 1977 | | 09/01/05 | | 15 to 20 Years |
| Long John Silver's | Greenville, TN | | (a) | | 289 |
| | 311 |
| | — |
| | — |
| | 289 |
| | 311 |
| | 600 |
| | (341 | ) | | 1972 | | 09/01/05 | | 10 to 15 Years |
| Long John Silver's / A&W | Houston, TX | | (b) | | 1,329 |
| | — |
| | — |
| | — |
| | 1,329 |
| | — |
| | 1,329 |
| | — |
| | (f) | | 07/17/13 | | (f) |
| Lowe's | Midland, TX | | (d) | | 5,826 |
| | 6,633 |
| | — |
| | 366 |
| | 5,826 |
| | 6,999 |
| | 12,825 |
| | (1,546 | ) | | 1996 | | 07/17/13 | | 2 to 35 Years |
| Lowe's | Lubbock, TX | | (d) | | 2,644 |
| | 10,009 |
| | — |
| | 480 |
| | 2,644 |
| | 10,489 |
| | 13,133 |
| | (2,011 | ) | | 1996 | | 07/17/13 | | 0 to 36 Years |
| Lowe's | Cincinnati, OH | | (d) | | 6,086 |
| | 10,984 |
| | — |
| | — |
| | 6,086 |
| | 10,984 |
| | 17,070 |
| | (2,676 | ) | | 1998 | | 07/17/13 | | 4 to 28 Years |
| Lowe's | Chester, NY | | (d) | | 6,432 |
| | — |
| | — |
| | — |
| | 6,432 |
| | — |
| | 6,432 |
| | — |
| | (f) | | 07/17/13 | | (f) |
| Lowe's | Tilton, NH | | (d) | | 13,185 |
| | — |
| | — |
| | — |
| | 13,185 |
| | — |
| | 13,185 |
| | — |
| | (f) | | 07/17/13 | | (f) |
| MAACO | Phoenix, AZ | | (d) | | 834 |
| | 1,206 |
| | — |
| | 87 |
| | 834 |
| | 1,293 |
| | 2,127 |
| | (47 | ) | | 1989 | | 03/31/17 | | 10 to 30 Years |
| MAACO | Kingman, AZ | | (d) | | 265 |
| | 588 |
| | — |
| | — |
| | 265 |
| | 588 |
| | 853 |
| | (26 | ) | | 1977 | | 03/31/17 | | 10 to 30 Years |
| MAACO | Houston, TX | | (d) | | 1,334 |
| | 579 |
| | — |
| | — |
| | 1,334 |
| | 579 |
| | 1,913 |
| | (21 | ) | | 1950 | | 03/31/17 | | 10 to 30 Years |
| MAACO | Tuscon, AZ | | (d) | | 333 |
| | 1,030 |
| | — |
| | — |
| | 333 |
| | 1,030 |
| | 1,363 |
| | (37 | ) | | 1999 | | 03/31/17 | | 10 to 30 Years |
| MAACO | Dallas, TX | | (d) | | 265 |
| | 814 |
| | — |
| | — |
| | 265 |
| | 814 |
| | 1,079 |
| | (29 | ) | | 1987 | | 03/31/17 | | 10 to 30 Years |
| Main Event | Fort Worth, TX | | (d) | | 2,468 |
| | 5,418 |
| | — |
| | — |
| | 2,468 |
| | 5,418 |
| | 7,886 |
| | (1,904 | ) | | 2003 | | 09/30/05 | | 15 to 40 Years |
SPIRIT REALTY CAPITAL, INC.
Schedule III Real Estate and
Accumulated Depreciation
(Amounts in thousands)
|
| | | | | | | | | | | | | | | | | | | | | | | | | | | | | | | | | |
| Entertainment | | | | | | | | | | | | | | | | | | | | | | |
| | Addison, IL | | (c) | | 4,690 |
| | 6,692 |
| | — |
| | — |
| | 4,690 |
| | 6,692 |
| | 11,382 |
| | (1,618 | ) | | 1995 | | 07/17/13 | | 7 to 24 Years |
| | Augusta, GA | | (c) | | 1,081 |
| | 1,488 |
| | — |
| | — |
| | 1,081 |
| | 1,488 |
| | 2,569 |
| | (161 | ) | | 1998 | | 09/30/15 | | 10 to 20 Years |
| | Austin, TX | | (c) | | 4,425 |
| | 8,142 |
| | — |
| | — |
| | 4,425 |
| | 8,142 |
| | 12,567 |
| | (2,724 | ) | | 2005 | | 09/30/05 | | 15 to 40 Years |
| | Baton Rouge, LA | | (c) | | 1,076 |
| | 2,289 |
| | — |
| | — |
| | 1,076 |
| | 2,289 |
| | 3,365 |
| | (100 | ) | | 2015 | | 11/13/15 | | 10 to 40 Years |
| | Beaverton, OR | | (a) | | 5,608 |
| | 8,733 |
| | — |
| | — |
| | 5,608 |
| | 8,733 |
| | 14,341 |
| | (704 | ) | | 2010 | | 06/30/14 | | 15 to 40 Years |
| | Brentwood, TN | | (c) | | 2,292 |
| | 2,273 |
| | — |
| | 2 |
| | 2,292 |
| | 2,275 |
| | 4,567 |
| | (190 | ) | | 1970 | | 09/30/15 | | 9 to 20 Years |
| | Clovis, CA | | (c) | | 1,117 |
| | — |
| | — |
| | — |
| | 1,117 |
| | — |
| | 1,117 |
| | — |
| | (f) | | 12/06/16 | | (f) |
| | Conroe, TX | | (c) | | 2,886 |
| | 5,763 |
| | — |
| | — |
| | 2,886 |
| | 5,763 |
| | 8,649 |
| | (1,817 | ) | | 2004 | | 09/30/05 | | 15 to 40 Years |
| | Flowood, MS | | (c) | | 900 |
| | 1,137 |
| | — |
| | — |
| | 900 |
| | 1,137 |
| | 2,037 |
| | (90 | ) | | 1995 | | 11/13/15 | | 9 to 20 Years |
| | Fort Worth, TX | | (c) | | 2,468 |
| | 5,418 |
| | — |
| | — |
| | 2,468 |
| | 5,418 |
| | 7,886 |
| | (1,721 | ) | | 2003 | | 09/30/05 | | 15 to 40 Years |
| | Grapevine, TX | | (c) | | 2,554 |
| | 5,377 |
| | — |
| | — |
| | 2,554 |
| | 5,377 |
| | 7,931 |
| | (1,725 | ) | | 2000 | | 09/30/05 | | 15 to 40 Years |
| | Jenison, MI | | (c) | | 1,111 |
| | 2,207 |
| | — |
| | — |
| | 1,111 |
| | 2,207 |
| | 3,318 |
| | (721 | ) | | 1999 | | 07/17/13 | | 3 to 22 Years |
| | Knoxville, TN | | (c) | | 1,509 |
| | 2,016 |
| | 188 |
| | 3,021 |
| | 1,697 |
| | 5,037 |
| | 6,734 |
| | (107 | ) | | 1987 | | 12/10/15 | | 40 to 60 Years |
| | Las Vegas, NV | | (b) | | 3,225 |
| | 30,483 |
| | — |
| | — |
| | 3,225 |
| | 30,483 |
| | 33,708 |
| | (2,505 | ) | | 2007 | | 07/17/13 | | 13 to 55 Years |
| | Lewisville, TX | | (c) | | 2,130 |
| | 4,630 |
| | — |
| | — |
| | 2,130 |
| | 4,630 |
| | 6,760 |
| | (1,492 | ) | | 1998 | | 09/30/05 | | 15 to 40 Years |
| | Marietta, GA | | (a) | | 3,908 |
| | 8,630 |
| | (74 | ) | | — |
| | 3,834 |
| | 8,630 |
| | 12,464 |
| | (3,373 | ) | | 1992 | | 07/01/05 | | 15 to 30 Years |
| | Pflugerville, TX | | (a) | | 6,182 |
| | 1,349 |
| | — |
| | — |
| | 6,182 |
| | 1,349 |
| | 7,531 |
| | (256 | ) | | 2003 | | 08/29/14 | | 15 to 30 Years |
| | Plano, TX | | (c) | | 3,225 |
| | 6,302 |
| | — |
| | — |
| | 3,225 |
| | 6,302 |
| | 9,527 |
| | (1,969 | ) | | 2001 | | 09/30/05 | | 15 to 40 Years |
| | Rogers, AR | | (c) | | 635 |
| | 2,376 |
| | — |
| | — |
| | 635 |
| | 2,376 |
| | 3,011 |
| | (117 | ) | | 2014 | | 09/30/15 | | 9 to 40 Years |
| | Tampa, FL | | (c) | | 1,588 |
| | 6,134 |
| | — |
| | — |
| | 1,588 |
| | 6,134 |
| | 7,722 |
| | (290 | ) | | 1990 | | 06/05/15 | | 15 to 40 Years |
| | Vancouver, WA | | (a) | | 2,077 |
| | 9,395 |
| | — |
| | — |
| | 2,077 |
| | 9,395 |
| | 11,472 |
| | (663 | ) | | 2006 | | 06/30/14 | | 15 to 40 Years |
| | Wilmington, NC | | (c) | | 837 |
| | 1,429 |
| | — |
| | — |
| | 837 |
| | 1,429 |
| | 2,266 |
| | (127 | ) | | 2006 | | 09/30/15 | | 9 to 20 Years |
|
| | | | | | | | | | | | | | | | | | | | | | | | | | | | | | | | | |
| Home Furnishings | | | | | | | | | | | | | | | | | | | | | | |
| | Abilene, TX | | (a) | | 1,316 |
| | 2,649 |
| | — |
| | — |
| | 1,316 |
| | 2,649 |
| | 3,965 |
| | (921 | ) | | 2000 | | 05/19/05 | | 15 to 40 Years |
| | Alpharetta, GA | | (c) | | 2,819 |
| | 3,139 |
| | — |
| | — |
| | 2,819 |
| | 3,139 |
| | 5,958 |
| | (368 | ) | | 2000 | | 07/17/13 | | 5 to 43 Years |
| | Amarillo, TX | | (c) | | 1,481 |
| | 4,999 |
| | — |
| | — |
| | 1,481 |
| | 4,999 |
| | 6,480 |
| | (733 | ) | | 2001 | | 07/17/13 | | 9 to 36 Years |
| | Anderson, SC | | (b) | | 870 |
| | 1,909 |
| | — |
| | — |
| | 870 |
| | 1,909 |
| | 2,779 |
| | (274 | ) | | 2006 | | 07/17/13 | | 8 to 40 Years |
| | Ashland, KY | | (a) | | 775 |
| | 2,037 |
| | — |
| | — |
| | 775 |
| | 2,037 |
| | 2,812 |
| | (770 | ) | | 1990 | | 08/27/09 | | 12 to 27 Years |
| | Ashland, KY | | (a) | | 629 |
| | 754 |
| | — |
| | — |
| | 629 |
| | 754 |
| | 1,383 |
| | (329 | ) | | 1993 | | 08/27/09 | | 12 to 27 Years |
| | Bensalem, PA | | (a) | | 1,653 |
| | 3,085 |
| | — |
| | — |
| | 1,653 |
| | 3,085 |
| | 4,738 |
| | (1,240 | ) | | 1987 | | 01/03/07 | | 15 to 30 Years |
| | Chillicothe, OH | | (a) | | 499 |
| | 2,296 |
| | — |
| | — |
| | 499 |
| | 2,296 |
| | 2,795 |
| | (861 | ) | | 1995 | | 08/27/09 | | 12 to 27 Years |
| | Columbia, SC | | (c) | | 596 |
| | 872 |
| | — |
| | 216 |
| | 596 |
| | 1,088 |
| | 1,684 |
| | (150 | ) | | 1998 | | 07/17/13 | | 9 to 45 Years |
| | Douglasville, GA | | (c) | | 2,612 |
| | 4,840 |
| | — |
| | 87 |
| | 2,612 |
| | 4,927 |
| | 7,539 |
| | (1,042 | ) | | 2006 | | 07/17/13 | | 4 to 39 Years |
| | Eau Claire, WI | | (a) | | 1,597 |
| | 6,964 |
| | — |
| | — |
| | 1,597 |
| | 6,964 |
| | 8,561 |
| | (2,766 | ) | | 2004 | | 04/08/05 | | 15 to 30 Years |
| | El Paso, TX | | (a) | | 1,536 |
| | 3,852 |
| | — |
| | — |
| | 1,536 |
| | 3,852 |
| | 5,388 |
| | (1,552 | ) | | 1973 | | 07/01/05 | | 14 to 30 Years |
| | Fairless Hills, PA | | (a) | | 3,655 |
| | 5,271 |
| | — |
| | — |
| | 3,655 |
| | 5,271 |
| | 8,926 |
| | (2,237 | ) | | 1994 | | 01/03/07 | | 15 to 30 Years |
| | Fargo, ND | | (c) | | 2,095 |
| | 8,525 |
| | — |
| | — |
| | 2,095 |
| | 8,525 |
| | 10,620 |
| | (1,065 | ) | | 2005 | | 07/17/13 | | 8 to 32 Years |
|
| | | | | | | | | | | | | | | | | | | | | | | | | |
| | | | | | Initial Cost to Company | | Cost Capitalized Subsequent to Acquisition including impairment | | Gross Amount at December 31, 2016 (d) 2017 (g) | | | | | | | | |
| Concept | City, State | | Encumbrances (e) | | Land and Improvements | | Buildings and Improvements | | Land and Improvements | | Buildings and Improvements | | Land and Improvements | | Buildings and Improvements | | Total | | Final Accumulated Depreciation | | Date of Construction | | Date Acquired | | Life in which depreciation in latest Statement of Operations is computed |
Description | | Encumbrances (e)
| | Land and
Improvements
| | Buildings and
Improvements
| | Improvements/
Land
| | Improvements/
building
| | Land and
Improvements
| | Buildings and
Improvements
| | Total | | Final
Accum
| | Date of
Construction
| | Date
Acquired
| |
|
| | | | | | | | | | | | | | | | | | | | | | | | | | | | | | | | | |
| | Glendale, AZ | | (c) | | 1,395 |
| | 4,242 |
| | — |
| | — |
| | 1,395 |
| | 4,242 |
| | 5,637 |
| | (534 | ) | | 2001 | | 07/17/13 | | 2 to 45 Years |
| | Hermantown, MN | | (a) | | 1,881 |
| | 7,761 |
| | — |
| | — |
| | 1,881 |
| | 7,761 |
| | 9,642 |
| | (2,295 | ) | | 2003 | | 04/08/05 | | 15 to 40 Years |
| | Horseheads, NY | | (a) | | 1,376 |
| | 12,506 |
| | — |
| | — |
| | 1,376 |
| | 12,506 |
| | 13,882 |
| | (339 | ) | | 2005 | | 10/06/15 | | 15 to 50 Years |
| | Houston, TX | | (c) | | 2,150 |
| | 2,320 |
| | — |
| | 1,601 |
| | 2,150 |
| | 3,921 |
| | 6,071 |
| | (109 | ) | | 1995 | | 07/17/13 | | 38 to 40 Years |
| | Hurricane, WV | | (a) | | 727 |
| | 3,005 |
| | — |
| | — |
| | 727 |
| | 3,005 |
| | 3,732 |
| | (1,087 | ) | | 1998 | | 08/27/09 | | 12 to 27 Years |
| | Independence, MO | | (b) | | 2,157 |
| | 2,597 |
| | — |
| | — |
| | 2,157 |
| | 2,597 |
| | 4,754 |
| | (633 | ) | | 1999 | | 07/17/13 | | 7 to 21 Years |
| | Johnson City, NY | | (a) | | 1,459 |
| | 10,433 |
| | — |
| | — |
| | 1,459 |
| | 10,433 |
| | 11,892 |
| | (363 | ) | | 1978 | | 10/06/15 | | 15 to 40 Years |
| | Kentwood, MI | | (c) | | 1,145 |
| | 4,085 |
| | — |
| | — |
| | 1,145 |
| | 4,085 |
| | 5,230 |
| | (452 | ) | | 1987 | | 07/17/13 | | 4 to 38 Years |
| | Maple Shade, NJ | | (c) | | 1,942 |
| | 3,792 |
| | — |
| | — |
| | 1,942 |
| | 3,792 |
| | 5,734 |
| | (906 | ) | | 1998 | | 07/17/13 | | 5 to 25 Years |
| | Morrisville, PA | | (a) | | 1,345 |
| | 8,288 |
| | — |
| | — |
| | 1,345 |
| | 8,288 |
| | 9,633 |
| | (2,756 | ) | | 2004 | | 01/03/07 | | 15 to 40 Years |
| | Newington, CT | | (b) | | 1,778 |
| | 4,496 |
| | — |
| | — |
| | 1,778 |
| | 4,496 |
| | 6,274 |
| | (461 | ) | | 2006 | | 07/17/13 | | 8 to 45 Years |
| | Parkersburg, WV | | (a) | | 1,800 |
| | 3,183 |
| | — |
| | — |
| | 1,800 |
| | 3,183 |
| | 4,983 |
| | (1,338 | ) | | 1976 | | 08/27/09 | | 12 to 27 Years |
| | Portsmouth, OH | | (a) | | 561 |
| | 1,563 |
| | — |
| | — |
| | 561 |
| | 1,563 |
| | 2,124 |
| | (615 | ) | | 1988 | | 08/27/09 | | 12 to 27 Years |
| | Reading, PA | | (c) | | 449 |
| | 3,222 |
| | — |
| | — |
| | 449 |
| | 3,222 |
| | 3,671 |
| | (283 | ) | | 1998 | | 07/17/13 | | 8 to 40 Years |
| | Salt Lake City, UT | | (b) | | 4,955 |
| | 18,250 |
| | (3,205 | ) | | (11,979 | ) | | 1,750 |
| | 6,271 |
| | 8,021 |
| | (1,693 | ) | | 1989 | | 07/17/13 | | 3 to 40 Years |
| | South Point, OH | | (a) | | 848 |
| | 2,948 |
| | — |
| | — |
| | 848 |
| | 2,948 |
| | 3,796 |
| | (1,091 | ) | | 1990 | | 08/27/09 | | 12 to 27 Years |
| | St. Louis, MO | | (a) | | 785 |
| | 1,023 |
| | — |
| | — |
| | 785 |
| | 1,023 |
| | 1,808 |
| | (114 | ) | | 1996 | | 08/30/13 | | 15 to 40 Years |
| | Staunton, VA | | (c) | | 578 |
| | 2,062 |
| | — |
| | 276 |
| | 578 |
| | 2,338 |
| | 2,916 |
| | (550 | ) | | 1988 | | 07/17/13 | | 5 to 20 Years |
|
| | | | | | | | | | | | | | | | | | | | | | | | | | | | | | | | | |
| Main Event | Conroe, TX | | (d) | | 2,886 |
| | 5,763 |
| | — |
| | — |
| | 2,886 |
| | 5,763 |
| | 8,649 |
| | (2,010 | ) | | 2004 | | 09/30/05 | | 15 to 40 Years |
| Main Event | Austin, TX | | (d) | | 4,425 |
| | 8,142 |
| | — |
| | — |
| | 4,425 |
| | 8,142 |
| | 12,567 |
| | (3,014 | ) | | 2005 | | 09/30/05 | | 15 to 40 Years |
| Main Event | Lewisville, TX | | (d) | | 2,130 |
| | 4,630 |
| | — |
| | — |
| | 2,130 |
| | 4,630 |
| | 6,760 |
| | (1,650 | ) | | 1998 | | 09/30/05 | | 15 to 40 Years |
| Main Event | Grapevine, TX | | (d) | | 2,554 |
| | 5,377 |
| | — |
| | — |
| | 2,554 |
| | 5,377 |
| | 7,931 |
| | (1,908 | ) | | 2000 | | 09/30/05 | | 15 to 40 Years |
| Main Event | Plano, TX | | (d) | | 3,225 |
| | 6,302 |
| | — |
| | — |
| | 3,225 |
| | 6,302 |
| | 9,527 |
| | (2,178 | ) | | 2001 | | 09/30/05 | | 15 to 40 Years |
| Main Event | Pittsburgh, PA | | (d) | | 3,099 |
| | 5,285 |
| | — |
| | 1,586 |
| | 3,099 |
| | 6,871 |
| | 9,970 |
| | (110 | ) | | 2003 | | 07/07/17 | | 10 to 40 Years |
| Malibu Boats | Merced, CA | | (d) | | 3,456 |
| | 9,007 |
| | — |
| | — |
| | 3,456 |
| | 9,007 |
| | 12,463 |
| | (3,390 | ) | | 1998 | | 03/31/08 | | 15 to 30 Years |
|
| | | | | | | | | | | | | | | | | | | | | | | | | | | | | | | | | |
| Education | | | | | | | | | | | | | | | | | | | | | | |
| | Alpena, MI | | (a) | | 236 |
| | 2,051 |
| | (186 | ) | | (1,751 | ) | | 50 |
| | 300 |
| | 350 |
| | — |
| | 1936 | | 03/17/06 | | 13 to 20 Years |
| | Arlington, TX | | (a) | | 365 |
| | 532 |
| | — |
| | — |
| | 365 |
| | 532 |
| | 897 |
| | (126 | ) | | 2006 | | 07/17/13 | | 10 to 33 Years |
| | Barrington, IL | | (a) | | 1,180 |
| | 5,939 |
| | — |
| | — |
| | 1,180 |
| | 5,939 |
| | 7,119 |
| | (447 | ) | | 2008 | | 05/30/14 | | 15 to 40 Years |
| | Burlington, NC | | (c) | | 306 |
| | 533 |
| | — |
| | — |
| | 306 |
| | 533 |
| | 839 |
| | (2 | ) | | 1971 | | 12/13/16 | | 7 to 20 Years |
| | Chattanoga, TN | | (a) | | 684 |
| | 841 |
| | — |
| | 11 |
| | 684 |
| | 852 |
| | 1,536 |
| | (10 | ) | | 1999 | | 09/28/16 | | 10 to 30 Years |
| | Chicago, IL | | (a) | | 5,057 |
| | 5,939 |
| | — |
| | — |
| | 5,057 |
| | 5,939 |
| | 10,996 |
| | (416 | ) | | 2009 | | 05/30/14 | | 15 to 40 Years |
| | Columbus, GA | | (c) | | 342 |
| | 1,096 |
| | — |
| | 30 |
| | 342 |
| | 1,126 |
| | 1,468 |
| | (44 | ) | | 2015 | | 12/22/15 | | 15 to 40 Years |
| | Columbus, OH | | (a) | | 417 |
| | 5,100 |
| | — |
| | 849 |
| | 417 |
| | 5,949 |
| | 6,366 |
| | (2,248 | ) | | 1980 | | 03/17/06 | | 13 to 30 Years |
| | Columbus, OH | | (a) | | 1,069 |
| | 3,363 |
| | 330 |
| | 1,340 |
| | 1,399 |
| | 4,703 |
| | 6,102 |
| | (2,590 | ) | | 2004 | | 03/17/06 | | 13 to 20 Years |
| | Cuyahoga Falls, OH | | (a) | | 279 |
| | 727 |
| | — |
| | — |
| | 279 |
| | 727 |
| | 1,006 |
| | (158 | ) | | 1974 | | 07/17/13 | | 8 to 25 Years |
| | Dalton, GA | | (a) | | 396 |
| | 1,396 |
| | — |
| | — |
| | 396 |
| | 1,396 |
| | 1,792 |
| | (24 | ) | | 1996 | | 06/29/16 | | 10 to 40 Years |
| | Denton, TX | | (c) | | 627 |
| | 1,909 |
| | — |
| | — |
| | 627 |
| | 1,909 |
| | 2,536 |
| | (116 | ) | | 2000 | | 07/17/15 | | 15 to 30 Years |
| | Duluth, GA | | (a) | | 2,289 |
| | 4,274 |
| | — |
| | — |
| | 2,289 |
| | 4,274 |
| | 6,563 |
| | (1,704 | ) | | 2007 | | 12/23/08 | | 13 to 48 Years |
| | East Point, GA | | (c) | | 411 |
| | 1,279 |
| | — |
| | — |
| | 411 |
| | 1,279 |
| | 1,690 |
| | (4 | ) | | 2016 | | 12/13/16 | | 14 to 40 Years |
| | Elon, NC | | (c) | | 486 |
| | 846 |
| | — |
| | — |
| | 486 |
| | 846 |
| | 1,332 |
| | (3 | ) | | 1998 | | 12/02/16 | | 4 to 30 Years |
| | Evans, GA | | (c) | | 508 |
| | 640 |
| | — |
| | — |
| | 508 |
| | 640 |
| | 1,148 |
| | (64 | ) | | 2003 | | 11/14/14 | | 15 to 30 Years |
|
| | | | | | | | | | | | | | | | | | | | | | | | | | | | | | | | | |
| Malibu Boats | Loudon, TN | | (d) | | 1,188 |
| | 4,904 |
| | — |
| | — |
| | 1,188 |
| | 4,904 |
| | 6,092 |
| | (2,153 | ) | | 1992 | | 03/31/08 | | 15 to 30 Years |
| Marcus Theaters | Arnold, MO | | (a) | | 3,275 |
| | 3,014 |
| | — |
| | — |
| | 3,275 |
| | 3,014 |
| | 6,289 |
| | (1,222 | ) | | 1999 | | 07/17/13 | | 5 to 21 Years |
| Markle Medical Center | Warren, IN | | (d) | | 220 |
| | 278 |
| | — |
| | — |
| | 220 |
| | 278 |
| | 498 |
| | (79 | ) | | 2007 | | 08/18/14 | | 4 to 20 Years |
| Martin's | Kennesaw, GA | | (a) | | 907 |
| | 499 |
| | — |
| | — |
| | 907 |
| | 499 |
| | 1,406 |
| | (267 | ) | | 2001 | | 02/28/06 | | 15 to 40 Years |
| Martin's | Douglasville, GA | | (a) | | 712 |
| | 669 |
| | — |
| | — |
| | 712 |
| | 669 |
| | 1,381 |
| | (275 | ) | | 2003 | | 02/28/06 | | 15 to 40 Years |
| Martin's | Mableton, GA | | (a) | | 454 |
| | 826 |
| | — |
| | — |
| | 454 |
| | 826 |
| | 1,280 |
| | (341 | ) | | 1987 | | 02/28/06 | | 15 to 30 Years |
| Martin's | Cartersville, GA | | (a) | | 581 |
| | 730 |
| | — |
| | — |
| | 581 |
| | 730 |
| | 1,311 |
| | (380 | ) | | 1997 | | 02/28/06 | | 15 to 30 Years |
| Martin's | Villa Rica, GA | | (a) | | 807 |
| | 629 |
| | — |
| | — |
| | 807 |
| | 629 |
| | 1,436 |
| | (351 | ) | | 1999 | | 02/28/06 | | 15 to 30 Years |
| Martin's | Carrollton, GA | | (a) | | 508 |
| | 603 |
| | — |
| | — |
| | 508 |
| | 603 |
| | 1,111 |
| | (258 | ) | | 2000 | | 02/28/06 | | 15 to 40 Years |
| Martin's | Cartersville, GA | | (a) | | 439 |
| | 451 |
| | — |
| | — |
| | 439 |
| | 451 |
| | 890 |
| | (279 | ) | | 1990 | | 02/28/06 | | 15 to 30 Years |
| Martin's | Floyd, GA | | (a) | | 973 |
| | 415 |
| | — |
| | — |
| | 973 |
| | 415 |
| | 1,388 |
| | (198 | ) | | 1993 | | 02/28/06 | | 15 to 30 Years |
| Martin's | Morrow, GA | | (a) | | 652 |
| | 450 |
| | — |
| | — |
| | 652 |
| | 450 |
| | 1,102 |
| | (235 | ) | | 1995 | | 02/28/06 | | 15 to 30 Years |
| Martin's | Hiram, GA | | (a) | | 1,006 |
| | 1,142 |
| | — |
| | — |
| | 1,006 |
| | 1,142 |
| | 2,148 |
| | (586 | ) | | 1987 | | 02/28/06 | | 15 to 30 Years |
| Martin's | Marietta, GA | | (a) | | 797 |
| | 428 |
| | — |
| | — |
| | 797 |
| | 428 |
| | 1,225 |
| | (273 | ) | | 1990 | | 02/28/06 | | 15 to 30 Years |
| Martin's | Douglasville, GA | | (a) | | 764 |
| | 941 |
| | — |
| | — |
| | 764 |
| | 941 |
| | 1,705 |
| | (428 | ) | | 1990 | | 02/28/06 | | 15 to 30 Years |
| Martin's | Austell, GA | | (a) | | 838 |
| | 216 |
| | — |
| | — |
| | 838 |
| | 216 |
| | 1,054 |
| | (241 | ) | | 1962 | | 02/28/06 | | 15 to 20 Years |
| Martin's | Mableton, GA | | (a) | | 634 |
| | 578 |
| | — |
| | — |
| | 634 |
| | 578 |
| | 1,212 |
| | (264 | ) | | 1981 | | 02/28/06 | | 15 to 30 Years |
| Martin's | Norcross, GA | | (a) | | 678 |
| | 402 |
| | — |
| | — |
| | 678 |
| | 402 |
| | 1,080 |
| | (266 | ) | | 1982 | | 02/28/06 | | 15 to 20 Years |
| Martin's | Douglasville, GA | | (a) | | 127 |
| | — |
| | — |
| | 210 |
| | 127 |
| | 210 |
| | 337 |
| | — |
| | (f) | | 11/14/14 | | (f) |
| Mattress Firm | Columbia, SC | | (d) | | 596 |
| | 872 |
| | — |
| | 216 |
| | 596 |
| | 1,088 |
| | 1,684 |
| | (201 | ) | | 1998 | | 07/17/13 | | 9 to 45 Years |
| Max & Erma's | Mars, PA | | (a) | | 946 |
| | 2,221 |
| | — |
| | — |
| | 946 |
| | 2,221 |
| | 3,167 |
| | (1,005 | ) | | 1990 | | 06/25/04 | | 15 to 30 Years |
| Max & Erma's | Pittsburgh, PA | | (a) | | 1,289 |
| | 1,871 |
| | — |
| | — |
| | 1,289 |
| | 1,871 |
| | 3,160 |
| | (831 | ) | | 1992 | | 06/25/04 | | 15 to 30 Years |
| Max & Erma's | Hilliard, OH | | (a) | | 1,149 |
| | 1,291 |
| | — |
| | — |
| | 1,149 |
| | 1,291 |
| | 2,440 |
| | (668 | ) | | 1997 | | 09/24/04 | | 15 to 30 Years |
SPIRIT REALTY CAPITAL, INC.
Schedule III Real Estate and
Accumulated Depreciation
(Amounts in thousands)
|
| | | | | | | | | | | | | | | | | | | | | | | | | |
| | | | | | Initial Cost to Company | | Cost Capitalized Subsequent to Acquisition including impairment | | Gross Amount at December 31, 2016 (d) 2017 (g) | | | | | | | | |
| Concept | City, State | | Encumbrances (e) | | Land and Improvements | | Buildings and Improvements | | Land and Improvements | | Buildings and Improvements | | Land and Improvements | | Buildings and Improvements | | Total | | Final Accumulated Depreciation | | Date of Construction | | Date Acquired | | Life in which depreciation in latest Statement of Operations is computed |
Description | | Encumbrances (e)
| | Land and
Improvements
| | Buildings and
Improvements
| | Improvements/
Land
| | Improvements/
building
| | Land and
Improvements
| | Buildings and
Improvements
| | Total | | Final
Accum
| | Date of
Construction
| | Date
Acquired
| |
|
| | | | | | | | | | | | | | | | | | | | | | | | | | | | | | | | | |
| | Fort Worth, TX | | (c) | | 392 |
| | 871 |
| | — |
| | — |
| | 392 |
| | 871 |
| | 1,263 |
| | (65 | ) | | 2006 | | 07/17/15 | | 15 to 30 Years |
| | Ft. Walton Beach, FL | | (c) | | 200 |
| | 491 |
| | — |
| | — |
| | 200 |
| | 491 |
| | 691 |
| | (37 | ) | | 1977 | | 02/27/15 | | 15 to 30 Years |
| | Grand Prairie, TX | | (c) | | 1,057 |
| | 2,350 |
| | — |
| | — |
| | 1,057 |
| | 2,350 |
| | 3,407 |
| | (164 | ) | | 2007 | | 07/17/15 | | 15 to 30 Years |
| | Grand Rapids, MI | | (c) | | 393 |
| | 1,363 |
| | — |
| | — |
| | 393 |
| | 1,363 |
| | 1,756 |
| | (107 | ) | | 2001 | | 03/20/15 | | 5 to 30 Years |
| | Greensboro, NC | | (c) | | 360 |
| | 540 |
| | — |
| | — |
| | 360 |
| | 540 |
| | 900 |
| | (2 | ) | | 1949 | | 12/02/16 | | 9 to 30 Years |
| | Hampton, GA | | (c) | | 391 |
| | 460 |
| | — |
| | — |
| | 391 |
| | 460 |
| | 851 |
| | (28 | ) | | 2005 | | 12/22/15 | | 15 to 30 Years |
| | Henderson, NV | | (c) | | 2,757 |
| | 6,113 |
| | — |
| | — |
| | 2,757 |
| | 6,113 |
| | 8,870 |
| | (580 | ) | | 2010 | | 05/16/14 | | 15 to 40 Years |
| | High Point, NC | | (c) | | 206 |
| | 978 |
| | — |
| | — |
| | 206 |
| | 978 |
| | 1,184 |
| | (39 | ) | | 1981 | | 12/22/15 | | 15 to 30 Years |
| | Humble, TX | | (c) | | 2,108 |
| | 7,208 |
| | — |
| | — |
| | 2,108 |
| | 7,208 |
| | 9,316 |
| | (829 | ) | | 2012 | | 12/10/13 | | 15 to 40 Years |
| | Lake Mary, FL | | (c) | | 1,209 |
| | 1,733 |
| | — |
| | 851 |
| | 1,209 |
| | 2,584 |
| | 3,793 |
| | (172 | ) | | 2005 | | 09/19/14 | | 15 to 40 Years |
| | Leawood, KS | | (a) | | 1,854 |
| | 3,914 |
| | — |
| | — |
| | 1,854 |
| | 3,914 |
| | 5,768 |
| | (1,668 | ) | | 1999 | | 09/29/05 | | 15 to 30 Years |
| | Lone Tree, CO | | (a) | | 2,020 |
| | 3,748 |
| | — |
| | — |
| | 2,020 |
| | 3,748 |
| | 5,768 |
| | (1,534 | ) | | 1999 | | 09/29/05 | | 15 to 30 Years |
| | Manchester Center, VT | | (a) | | 1,198 |
| | 4,688 |
| | (911 | ) | | (3,475 | ) | | 287 |
| | 1,213 |
| | 1,500 |
| | — |
| | 1935 | | 12/07/05 | | 14 to 40 Years |
| | Marietta, GA | | (a) | | 538 |
| | 792 |
| | — |
| | 11 |
| | 538 |
| | 803 |
| | 1,341 |
| | (10 | ) | | 2009 | | 09/28/16 | | 11 to 30 Years |
| | McKinney, TX | | (c) | | 1,056 |
| | 6,696 |
| | — |
| | 31 |
| | 1,056 |
| | 6,727 |
| | 7,783 |
| | (146 | ) | | 2015 | | 01/29/16 | | 17 to 50 Years |
| | Mesquite, TX | | (c) | | 2,534 |
| | 1,780 |
| | — |
| | — |
| | 2,534 |
| | 1,780 |
| | 4,314 |
| | (476 | ) | | 1996 | | 07/17/13 | | 8 to 23 Years |
| | Modesto, CA | | (a) | | 386 |
| | 664 |
| | — |
| | — |
| | 386 |
| | 664 |
| | 1,050 |
| | (142 | ) | | 1986 | | 07/17/13 | | 9 to 22 Years |
| | Morrisville, NC | | (c) | | 544 |
| | 1,378 |
| | — |
| | — |
| | 544 |
| | 1,378 |
| | 1,922 |
| | (96 | ) | | 2010 | | 02/19/15 | | 15 to 40 Years |
| | Mt. Laurel, NJ | | (a) | | 1,404 |
| | 5,655 |
| | — |
| | — |
| | 1,404 |
| | 5,655 |
| | 7,059 |
| | (1,409 | ) | | 2007 | | 05/01/09 | | 13 to 48 Years |
| | Nashville, TN | | (c) | | 2,461 |
| | 1,427 |
| | — |
| | — |
| | 2,461 |
| | 1,427 |
| | 3,888 |
| | (89 | ) | | 1976 | | 03/27/15 | | 15 to 40 Years |
| | Norcross, GA | | (c) | | 831 |
| | 624 |
| | — |
| | — |
| | 831 |
| | 624 |
| | 1,455 |
| | (75 | ) | | 1985 | | 03/30/15 | | 15 to 20 Years |
| | Oklahoma City, OK | | (a) | | 290 |
| | 341 |
| | — |
| | — |
| | 290 |
| | 341 |
| | 631 |
| | (90 | ) | | 1985 | | 07/17/13 | | 11 to 19 Years |
| | Orlando, FL | | (c) | | 1,925 |
| | 2,529 |
| | — |
| | — |
| | 1,925 |
| | 2,529 |
| | 4,454 |
| | (221 | ) | | 2007 | | 09/19/14 | | 15 to 40 Years |
| | Phoenix, AZ | | (a) | | 1,841 |
| | 3,582 |
| | 265 |
| | 22 |
| | 2,106 |
| | 3,604 |
| | 5,710 |
| | (1,279 | ) | | 1975 | | 07/01/05 | | 3 to 40 Years |
| | Pittsburgh, PA | | (a) | | 457 |
| | 693 |
| | — |
| | — |
| | 457 |
| | 693 |
| | 1,150 |
| | (226 | ) | | 1985 | | 07/17/13 | | 5 to 15 Years |
| | Riverdale, GA | | (a) | | 663 |
| | 1,336 |
| | — |
| | 32 |
| | 663 |
| | 1,368 |
| | 2,031 |
| | (27 | ) | | 1998 | | 06/29/16 | | 10 to 40 Years |
| | Riverdale, GA | | (a) | | 436 |
| | 525 |
| | — |
| | — |
| | 436 |
| | 525 |
| | 961 |
| | (11 | ) | | 1965 | | 06/29/16 | | 10 to 40 Years |
| | Rochester, NY | | (a) | | 242 |
| | 539 |
| | — |
| | — |
| | 242 |
| | 539 |
| | 781 |
| | (101 | ) | | 1981 | | 07/17/13 | | 8 to 28 Years |
| | Romeoville, IL | | (a) | | 1,684 |
| | 5,676 |
| | — |
| | — |
| | 1,684 |
| | 5,676 |
| | 7,360 |
| | (1,297 | ) | | 2008 | | 11/07/08 | | 14 to 49 Years |
| | Sanford, FL | | (c) | | 1,028 |
| | 1,310 |
| | — |
| | — |
| | 1,028 |
| | 1,310 |
| | 2,338 |
| | (140 | ) | | 2003 | | 09/19/14 | | 15 to 40 Years |
| | Sanford, NC | | (c) | | 200 |
| | 611 |
| | — |
| | — |
| | 200 |
| | 611 |
| | 811 |
| | (46 | ) | | 2002 | | 02/27/15 | | 15 to 30 Years |
| | Stockbridge, GA | | (c) | | 533 |
| | 1,236 |
| | — |
| | (16 | ) | | 533 |
| | 1,220 |
| | 1,753 |
| | (121 | ) | | 2000 | | 10/31/14 | | 15 to 30 Years |
| | The Woodlands, TX | | (c) | | 2,039 |
| | 7,154 |
| | — |
| | — |
| | 2,039 |
| | 7,154 |
| | 9,193 |
| | (824 | ) | | 2011 | | 09/25/13 | | 15 to 40 Years |
| | Warner Robins, GA | | (c) | | 431 |
| | 620 |
| | — |
| | — |
| | 431 |
| | 620 |
| | 1,051 |
| | (69 | ) | | 1995 | | 02/27/15 | | 15 to 20 Years |
| | Warrenville, IL | | (a) | | 2,542 |
| | 3,813 |
| | — |
| | — |
| | 2,542 |
| | 3,813 |
| | 6,355 |
| | (1,701 | ) | | 1999 | | 09/29/05 | | 15 to 30 Years |
| | Westmont, IL | | (a) | | 1,375 |
| | 5,087 |
| | — |
| | — |
| | 1,375 |
| | 5,087 |
| | 6,462 |
| | (1,432 | ) | | 2003 | | 12/28/05 | | 15 to 40 Years |
|
| | | | | | | | | | | | | | | | | | | | | | | | | | | | | | | | | |
| Mealey's Furniture | Bensalem, PA | | (a) | | 1,653 |
| | 3,085 |
| | — |
| | — |
| | 1,653 |
| | 3,085 |
| | 4,738 |
| | (1,371 | ) | | 1987 | | 01/03/07 | | 15 to 30 Years |
| Mealey's Furniture | Fairless Hills, PA | | (a) | | 3,655 |
| | 5,271 |
| | — |
| | — |
| | 3,655 |
| | 5,271 |
| | 8,926 |
| | (2,475 | ) | | 1994 | | 01/03/07 | | 15 to 30 Years |
| Mealey's Furniture | Morrisville, PA | | (a) | | 1,345 |
| | 8,288 |
| | — |
| | — |
| | 1,345 |
| | 8,288 |
| | 9,633 |
| | (3,049 | ) | | 2004 | | 01/03/07 | | 15 to 40 Years |
| Meineke Car Care Center | Lawrenceville, GA | | (a) | | 722 |
| | 976 |
| | — |
| | — |
| | 722 |
| | 976 |
| | 1,698 |
| | (130 | ) | | 2000 | | 03/28/14 | | 15 to 40 Years |
| Meineke Car Care Center | Kennesaw, GA | | (a) | | 874 |
| | 1,270 |
| | — |
| | — |
| | 874 |
| | 1,270 |
| | 2,144 |
| | (165 | ) | | 1999 | | 03/28/14 | | 15 to 40 Years |
| Meineke Car Care Center | Woodstock, GA | | (a) | | 1,108 |
| | 1,281 |
| | — |
| | — |
| | 1,108 |
| | 1,281 |
| | 2,389 |
| | (178 | ) | | 1999 | | 03/28/14 | | 15 to 40 Years |
| Meineke Car Care Center | Acworth, GA | | (a) | | 823 |
| | 976 |
| | — |
| | — |
| | 823 |
| | 976 |
| | 1,799 |
| | (127 | ) | | 1999 | | 03/28/14 | | 15 to 40 Years |
| Memphis Contract Packaging | Somerville, TN | | (d) | | 345 |
| | 537 |
| | — |
| | — |
| | 345 |
| | 537 |
| | 882 |
| | (328 | ) | | 2000 | | 05/31/06 | | 15 to 30 Years |
| Metaldyne BSM | Fremont, IN | | (a) | | 427 |
| | 2,176 |
| | — |
| | — |
| | 427 |
| | 2,176 |
| | 2,603 |
| | (912 | ) | | 1960 | | 02/21/07 | | 14 to 30 Years |
| Mills Fleet Farm | Waite Park, MN | | (a) | | 4,919 |
| | 25,384 |
| | — |
| | 54 |
| | 4,919 |
| | 25,438 |
| | 30,357 |
| | (1,878 | ) | | 1979 | | 06/09/16 | | 4 to 40 Years |
| Milo's | Calera, AL | | (b) | | 560 |
| | 912 |
| | — |
| | 82 |
| | 560 |
| | 994 |
| | 1,554 |
| | (229 | ) | | 2008 | | 03/29/13 | | 8 to 29 Years |
| Milo's | Pelham, AL | | (b) | | 605 |
| | 923 |
| | — |
| | 55 |
| | 605 |
| | 978 |
| | 1,583 |
| | (212 | ) | | 1998 | | 03/29/13 | | 8 to 29 Years |
| Milo's | Moody, AL | | (b) | | 518 |
| | 800 |
| | — |
| | 55 |
| | 518 |
| | 855 |
| | 1,373 |
| | (191 | ) | | 1997 | | 03/29/13 | | 8 to 29 Years |
| Milo's | Gardendale, AL | | (b) | | 438 |
| | 841 |
| | — |
| | 55 |
| | 438 |
| | 896 |
| | 1,334 |
| | (191 | ) | | 1996 | | 03/29/13 | | 8 to 29 Years |
| Milo's | Bessemer, AL | | (b) | | 622 |
| | 983 |
| | — |
| | 62 |
| | 622 |
| | 1,045 |
| | 1,667 |
| | (224 | ) | | 2002 | | 03/29/13 | | 8 to 29 Years |
| Milo's | Birmingham, AL | | (b) | | 321 |
| | 740 |
| | — |
| | 48 |
| | 321 |
| | 788 |
| | 1,109 |
| | (167 | ) | | 1977 | | 03/29/13 | | 8 to 29 Years |
| Milo's | Birmingham, AL | | (b) | | 512 |
| | 983 |
| | — |
| | 63 |
| | 512 |
| | 1,046 |
| | 1,558 |
| | (225 | ) | | 2002 | | 03/29/13 | | 8 to 29 Years |
| Milo's | Trussville, AL | | (b) | | 909 |
| | 892 |
| | — |
| | 55 |
| | 909 |
| | 947 |
| | 1,856 |
| | (233 | ) | | 2000 | | 03/29/13 | | 8 to 29 Years |
| Milo's | Homewood, AL | | (a) | | 583 |
| | 839 |
| | — |
| | — |
| | 583 |
| | 839 |
| | 1,422 |
| | (157 | ) | | 2002 | | 12/05/13 | | 15 to 30 Years |
| Missoula Fresh Market | Missoula, MT | | (d) | | 2,510 |
| | 4,714 |
| | — |
| | — |
| | 2,510 |
| | 4,714 |
| | 7,224 |
| | (534 | ) | | 1999 | | 03/11/15 | | 15 to 30 Years |
| Missoula Fresh Market | Missoula, MT | | (d) | | 3,008 |
| | 5,168 |
| | — |
| | — |
| | 3,008 |
| | 5,168 |
| | 8,176 |
| | (565 | ) | | 2008 | | 03/12/15 | | 15 to 30 Years |
| Mister Car Wash | Meridian, ID | | (b) | | 1,923 |
| | 2,170 |
| | 536 |
| | 20 |
| | 2,459 |
| | 2,190 |
| | 4,649 |
| | (656 | ) | | 2006 | | 05/15/13 | | 15 to 30 Years |
| Mister Car Wash | Boise, ID | | (b) | | 2,155 |
| | 2,488 |
| | — |
| | — |
| | 2,155 |
| | 2,488 |
| | 4,643 |
| | (702 | ) | | 2004 | | 05/15/13 | | 15 to 30 Years |
| Mister Car Wash | Boise, ID | | (b) | | 217 |
| | — |
| | — |
| | — |
| | 217 |
| | — |
| | 217 |
| | (9 | ) | | (f) | | 05/15/13 | | (f) |
| Mister Car Wash | Nampa, ID | | (b) | | 3,240 |
| | 2,343 |
| | — |
| | — |
| | 3,240 |
| | 2,343 |
| | 5,583 |
| | (761 | ) | | 2010 | | 05/15/13 | | 15 to 30 Years |
| Mister Car Wash | Albuquerque, NM | | (a) | | 2,472 |
| | 2,117 |
| | — |
| | — |
| | 2,472 |
| | 2,117 |
| | 4,589 |
| | (474 | ) | | 2005 | | 05/13/14 | | 15 to 30 Years |
| Mister Car Wash | Albuquerque, NM | | (a) | | 2,657 |
| | 3,225 |
| | — |
| | — |
| | 2,657 |
| | 3,225 |
| | 5,882 |
| | (738 | ) | | 1960 | | 05/13/14 | | 15 to 30 Years |
SPIRIT REALTY CAPITAL, INC.
Schedule III Real Estate and
Accumulated Depreciation
(Amounts in thousands)
|
| | | | | | | | | | | | | | | | | | | | | | | | | |
| | | | | | Initial Cost to Company | | Cost Capitalized Subsequent to Acquisition including impairment | | Gross Amount at December 31, 2016 (d) 2017 (g) | | | | | | | | |
| Concept | City, State | | Encumbrances (e) | | Land and Improvements | | Buildings and Improvements | | Land and Improvements | | Buildings and Improvements | | Land and Improvements | | Buildings and Improvements | | Total | | Final Accumulated Depreciation | | Date of Construction | | Date Acquired | | Life in which depreciation in latest Statement of Operations is computed |
Description | | Encumbrances (e)
| | Land and
Improvements
| | Buildings and
Improvements
| | Improvements/
Land
| | Improvements/
building
| | Land and
Improvements
| | Buildings and
Improvements
| | Total | | Final
Accum
| | Date of
Construction
| | Date
Acquired
| |
|
| | | | | | | | | | | | | | | | | | | | | | | | | | | | | | | | | |
| | Windermere, FL | | (c) | | 2,912 |
| | 2,670 |
| | — |
| | — |
| | 2,912 |
| | 2,670 |
| | 5,582 |
| | (251 | ) | | 2011 | | 09/19/14 | | 15 to 40 Years |
| | Winston-Salem, NC | | (c) | | 541 |
| | 659 |
| | — |
| | — |
| | 541 |
| | 659 |
| | 1,200 |
| | (2 | ) | | 1993 | | 12/02/16 | | 5 to 30 Years |
| | Winter Springs, FL | | (c) | | 534 |
| | 746 |
| | — |
| | — |
| | 534 |
| | 746 |
| | 1,280 |
| | (94 | ) | | 1987 | | 09/19/14 | | 15 to 30 Years |
|
| | | | | | | | | | | | | | | | | | | | | | | | | | | | | | | | | |
| Mister Car Wash | Albuquerque, NM | | (a) | | 1,151 |
| | 1,677 |
| | — |
| | — |
| | 1,151 |
| | 1,677 |
| | 2,828 |
| | (326 | ) | | 1976 | | 05/13/14 | | 15 to 30 Years |
| Mister Car Wash | Albuquerque, NM | | (a) | | 1,563 |
| | 2,700 |
| | — |
| | — |
| | 1,563 |
| | 2,700 |
| | 4,263 |
| | (431 | ) | | 1994 | | 05/13/14 | | 15 to 30 Years |
| Mister Car Wash | Albuquerque, NM | | (a) | | 2,586 |
| | 2,742 |
| | — |
| | — |
| | 2,586 |
| | 2,742 |
| | 5,328 |
| | (516 | ) | | 2002 | | 05/13/14 | | 15 to 30 Years |
| Mister Car Wash | Millersville, MD | | (d) | | 2,250 |
| | 1,636 |
| | — |
| | — |
| | 2,250 |
| | 1,636 |
| | 3,886 |
| | (221 | ) | | 2007 | | 01/21/15 | | 15 to 30 Years |
| Mister Car Wash | Edgewater, MD | | (d) | | 4,720 |
| | 1,460 |
| | — |
| | — |
| | 4,720 |
| | 1,460 |
| | 6,180 |
| | (247 | ) | | 2005 | | 01/21/15 | | 15 to 30 Years |
| Mister Car Wash | Abilene, TX | | (d) | | 2,733 |
| | 3,080 |
| | — |
| | — |
| | 2,733 |
| | 3,080 |
| | 5,813 |
| | (386 | ) | | 1993 | | 04/07/15 | | 15 to 30 Years |
| Mister Car Wash | Madison, WI | | (d) | | 564 |
| | 1,623 |
| | — |
| | — |
| | 564 |
| | 1,623 |
| | 2,187 |
| | (153 | ) | | 1956 | | 06/30/15 | | 15 to 30 Years |
| Mister Car Wash | Madison, WI | | (d) | | 611 |
| | 1,775 |
| | — |
| | — |
| | 611 |
| | 1,775 |
| | 2,386 |
| | (199 | ) | | 1958 | | 06/30/15 | | 15 to 30 Years |
| Mister Car Wash | Madison, WI | | (d) | | 905 |
| | 2,728 |
| | — |
| | — |
| | 905 |
| | 2,728 |
| | 3,633 |
| | (278 | ) | | 1961 | | 06/30/15 | | 15 to 30 Years |
| Mister Car Wash | Rockford, IL | | (d) | | 705 |
| | 2,669 |
| | — |
| | — |
| | 705 |
| | 2,669 |
| | 3,374 |
| | (252 | ) | | 1959 | | 06/30/15 | | 15 to 30 Years |
| Mister Car Wash | Round Rock, TX | | (d) | | 1,167 |
| | 1,549 |
| | — |
| | — |
| | 1,167 |
| | 1,549 |
| | 2,716 |
| | (196 | ) | | 2009 | | 05/07/15 | | 15 to 30 Years |
| Mister Car Wash | Orlando, FL | | (d) | | 2,709 |
| | 2,728 |
| | — |
| | 45 |
| | 2,709 |
| | 2,773 |
| | 5,482 |
| | (255 | ) | | 2001 | | 02/09/16 | | 13 to 30 Years |
| Mister Car Wash | Orlando, FL | | (d) | | 1,629 |
| | 1,895 |
| | — |
| | — |
| | 1,629 |
| | 1,895 |
| | 3,524 |
| | (188 | ) | | 2005 | | 02/09/16 | | 13 to 30 Years |
| Mister Car Wash | Casselberry, FL | | (d) | | 1,042 |
| | 2,406 |
| | — |
| | — |
| | 1,042 |
| | 2,406 |
| | 3,448 |
| | (196 | ) | | 1988 | | 02/09/16 | | 13 to 30 Years |
| Mister Car Wash | Ocoee, FL | | (d) | | 2,128 |
| | 1,775 |
| | — |
| | 18 |
| | 2,128 |
| | 1,793 |
| | 3,921 |
| | (149 | ) | | 2009 | | 05/03/16 | | 17 to 30 Years |
| Mister Car Wash | Houston, TX | | (a) | | 1,703 |
| | 1,221 |
| | — |
| | — |
| | 1,703 |
| | 1,221 |
| | 2,924 |
| | (303 | ) | | 1996 | | 06/18/14 | | 15 to 30 Years |
| Mister Car Wash | Saint Paul, MN | | (d) | | 5,274 |
| | 136 |
| | — |
| | 67 |
| | 5,274 |
| | 203 |
| | 5,477 |
| | (423 | ) | | 1966 | | 12/13/16 | | 12 to 30 Years |
| Monterey's Tex Mex | Alvin, TX | | (a) | | 256 |
| | 585 |
| | — |
| | — |
| | 256 |
| | 585 |
| | 841 |
| | (628 | ) | | 1997 | | 12/30/04 | | 10 to 15 Years |
| Monterey's Tex Mex | Houston, TX | | (a) | | 585 |
| | 561 |
| | — |
| | — |
| | 585 |
| | 561 |
| | 1,146 |
| | (628 | ) | | 1979 | | 12/30/04 | | 10 to 15 Years |
| Monterey's Tex Mex | Bryan, TX | | (a) | | 739 |
| | 700 |
| | — |
| | — |
| | 739 |
| | 700 |
| | 1,439 |
| | (485 | ) | | 1988 | | 12/30/04 | | 15 to 20 Years |
| Mountainside Fitness | Chandler, AZ | | (a) | | 1,028 |
| | 5,318 |
| | — |
| | — |
| | 1,028 |
| | 5,318 |
| | 6,346 |
| | (726 | ) | | 2002 | | 07/17/13 | | 8 to 40 Years |
| Multi-Tenant | Lakewood, OH | | (d) | | 522 |
| | 2,053 |
| | — |
| | — |
| | 522 |
| | 2,053 |
| | 2,575 |
| | (319 | ) | | 1996 | | 07/17/13 | | 3 to 35 Years |
| Multi-Tenant | Topeka, KS | | (d) | | 542 |
| | 2,251 |
| | — |
| | — |
| | 542 |
| | 2,251 |
| | 2,793 |
| | (275 | ) | | 2006 | | 07/17/13 | | 3 to 48 Years |
| Multi-Tenant | Victoria, TX | | (d) | | 2,631 |
| | 7,710 |
| | — |
| | 20 |
| | 2,631 |
| | 7,730 |
| | 10,361 |
| | (1,498 | ) | | 2006 | | 07/17/13 | | 3 to 43 Years |
| Multi-Tenant | Collierville, TN | | (d) | | 2,217 |
| | 14,205 |
| | — |
| | 8 |
| | 2,217 |
| | 14,213 |
| | 16,430 |
| | (2,160 | ) | | 2002 | | 07/17/13 | | 3 to 45 Years |
| Multi-Tenant | Pocatello, ID | | (c) | | 3,682 |
| | 10,658 |
| | — |
| | — |
| | 3,682 |
| | 10,658 |
| | 14,340 |
| | (2,145 | ) | | 2006 | | 07/17/13 | | 5 to 38 Years |
| Multi-Tenant | Maple Shade, NJ | | (d) | | 1,942 |
| | 3,792 |
| | — |
| | — |
| | 1,942 |
| | 3,792 |
| | 5,734 |
| | (1,171 | ) | | 1998 | | 07/17/13 | | 5 to 25 Years |
| Multi-Tenant | Broadview, IL | | (d) | | 12,392 |
| | 32,193 |
| | — |
| | 644 |
| | 12,392 |
| | 32,837 |
| | 45,229 |
| | (7,125 | ) | | 1994 | | 07/17/13 | | 2 to 30 Years |
| Multi-Tenant | Bedford Park, IL | | (c) | | 10,242 |
| | 11,839 |
| | — |
| | — |
| | 10,242 |
| | 11,839 |
| | 22,081 |
| | (3,560 | ) | | 1993 | | 07/17/13 | | 7 to 20 Years |
| Multi-Tenant | Whiteville, NC | | (d) | | 1,119 |
| | 1,676 |
| | — |
| | — |
| | 1,119 |
| | 1,676 |
| | 2,795 |
| | (722 | ) | | 1988 | | 07/17/13 | | 7 to 30 Years |
| Multi-Tenant | Kennesaw, GA | | (d) | | 3,560 |
| | 23,583 |
| | — |
| | — |
| | 3,560 |
| | 23,583 |
| | 27,143 |
| | (2,956 | ) | | 1996 | | 07/17/13 | | 8 to 45 Years |
SPIRIT REALTY CAPITAL, INC.
Schedule III Real Estate and
Accumulated Depreciation
(Amounts in thousands)
|
| | | | | | | | | | | | | | | | | | | | | | | | | | | | | | | | | |
| Building Materials | | | | | | | | | | | | | | | | | | | | | | |
| | Aiken, SC | | (a) | | 108 |
| | 265 |
| | — |
| | — |
| | 108 |
| | 265 |
| | 373 |
| | (139 | ) | | 1985 | | 05/01/05 | | 15 to 20 Years |
| | Ankeny, IA | | (c) | | 687 |
| | 2,162 |
| | — |
| | — |
| | 687 |
| | 2,162 |
| | 2,849 |
| | (289 | ) | | 2006 | | 07/17/13 | | 8 to 43 Years |
| | Auburn, AL | | (b) | | 884 |
| | 1,530 |
| | — |
| | — |
| | 884 |
| | 1,530 |
| | 2,414 |
| | (275 | ) | | 2007 | | 07/17/13 | | 10 to 32 Years |
| | Baldwinsville, NY | | (b) | | 1,105 |
| | 2,008 |
| | — |
| | — |
| | 1,105 |
| | 2,008 |
| | 3,113 |
| | (407 | ) | | 2005 | | 07/17/13 | | 11 to 37 Years |
| | Baytown, TX | | (c) | | 1,440 |
| | 1,712 |
| | — |
| | — |
| | 1,440 |
| | 1,712 |
| | 3,152 |
| | (293 | ) | | 2007 | | 07/17/13 | | 9 to 39 Years |
| | Bowling Green, KY | | (a) | | 136 |
| | 228 |
| | — |
| | — |
| | 136 |
| | 228 |
| | 364 |
| | (101 | ) | | 1993 | | 05/01/05 | | 15 to 30 Years |
| | Carroll, OH | | (c) | | 1,144 |
| | 4,557 |
| | — |
| | — |
| | 1,144 |
| | 4,557 |
| | 5,701 |
| | (831 | ) | | 1976 | | 07/17/13 | | 3 to 30 Years |
| | Charlotte, NC | | (c) | | 4,582 |
| | 6,511 |
| | — |
| | — |
| | 4,582 |
| | 6,511 |
| | 11,093 |
| | (1,325 | ) | | 2007 | | 07/17/13 | | 10 to 26 Years |
| | Clovis, NM | | (a) | | 1,704 |
| | 1,342 |
| | — |
| | — |
| | 1,704 |
| | 1,342 |
| | 3,046 |
| | (361 | ) | | 2007 | | 07/17/13 | | 9 to 33 Years |
| | Cohasset, MN | | (b) | | 334 |
| | 1,134 |
| | — |
| | — |
| | 334 |
| | 1,134 |
| | 1,468 |
| | (236 | ) | | 2007 | | 07/17/13 | | 10 to 26 Years |
| | Conroe, TX | | (a) | | 492 |
| | 723 |
| | — |
| | — |
| | 492 |
| | 723 |
| | 1,215 |
| | (329 | ) | | 1999 | | 07/01/05 | | 14 to 30 Years |
| | Corpus Christi, TX | | (c) | | 1,790 |
| | 1,267 |
| | — |
| | — |
| | 1,790 |
| | 1,267 |
| | 3,057 |
| | (260 | ) | | 2014 | | 09/30/14 | | 11 to 30 Years |
| | Crockett, TX | | (c) | | 835 |
| | 1,591 |
| | — |
| | — |
| | 835 |
| | 1,591 |
| | 2,426 |
| | (315 | ) | | 2006 | | 07/17/13 | | 8 to 36 Years |
| | D'Iberville, MS | | (a) | | 250 |
| | 339 |
| | — |
| | — |
| | 250 |
| | 339 |
| | 589 |
| | (197 | ) | | 1984 | | 05/01/05 | | 15 to 20 Years |
| | Ellettsville, IN | | (b) | | 894 |
| | 1,872 |
| | — |
| | — |
| | 894 |
| | 1,872 |
| | 2,766 |
| | (302 | ) | | 2010 | | 07/17/13 | | 11 to 47 Years |
| | Fairview, TN | | (b) | | 975 |
| | 2,274 |
| | — |
| | — |
| | 975 |
| | 2,274 |
| | 3,249 |
| | (318 | ) | | 2007 | | 07/17/13 | | 8 to 47 Years |
| | Florence, SC | | (a) | | 221 |
| | 174 |
| | — |
| | — |
| | 221 |
| | 174 |
| | 395 |
| | (211 | ) | | 1974 | | 05/01/05 | | 10 to 15 Years |
| | Fort Myers, FL | | (a) | | 641 |
| | 1,069 |
| | — |
| | — |
| | 641 |
| | 1,069 |
| | 1,710 |
| | (545 | ) | | 1999 | | 07/01/05 | | 14 to 30 Years |
|
| | | | | | | | | | | | | | | | | | | | | | | | | |
| | | | | | Initial Cost to Company | | Cost Capitalized Subsequent to Acquisition including impairment | | Gross Amount at December 31, 2016 (d) 2017 (g) | | | | | | | | |
| Concept | City, State | | Encumbrances (e) | | Land and Improvements | | Buildings and Improvements | | Land and Improvements | | Buildings and Improvements | | Land and Improvements | | Buildings and Improvements | | Total | | Final Accumulated Depreciation | | Date of Construction | | Date Acquired | | Life in which depreciation in latest Statement of Operations is computed |
Description | | Encumbrances (e)
| | Land and
Improvements
| | Buildings and
Improvements
| | Improvements/
Land
| | Improvements/
building
| | Land and
Improvements
| | Buildings and
Improvements
| | Total | | Final
Accum
| | Date of
Construction
| | Date
Acquired
| |
|
| | | | | | | | | | | | | | | | | | | | | | | | | | | | | | | | | |
| | Fredericksburg, TX | | (c) | | 1,194 |
| | 1,636 |
| | — |
| | — |
| | 1,194 |
| | 1,636 |
| | 2,830 |
| | (300 | ) | | 2007 | | 07/17/13 | | 8 to 42 Years |
| | Front Royal, VA | | (b) | | 7,257 |
| | 35,711 |
| | — |
| | — |
| | 7,257 |
| | 35,711 |
| �� | 42,968 |
| | (5,939 | ) | | 2007 | | 07/17/13 | | 9 to 34 Years |
| | Greenville, SC | | (a) | | 344 |
| | 210 |
| | — |
| | — |
| | 344 |
| | 210 |
| | 554 |
| | (255 | ) | | 1981 | | 05/01/05 | | 9 to 15 Years |
| | Greer, SC | | (a) | | 268 |
| | 236 |
| | — |
| | — |
| | 268 |
| | 236 |
| | 504 |
| | (159 | ) | | 1993 | | 05/01/05 | | 15 to 30 Years |
| | Hickory, NC | | (a) | | 199 |
| | 262 |
| | — |
| | — |
| | 199 |
| | 262 |
| | 461 |
| | (190 | ) | | 1989 | | 05/01/05 | | 15 to 20 Years |
| | Indianapolis, IN | | (a) | | 607 |
| | 520 |
| | — |
| | — |
| | 607 |
| | 520 |
| | 1,127 |
| | (343 | ) | | 1990 | | 05/01/05 | | 15 to 20 Years |
| | Jacksonville, FL | | (a) | | 339 |
| | 226 |
| | — |
| | — |
| | 339 |
| | 226 |
| | 565 |
| | (187 | ) | | 1987 | | 07/01/05 | | 15 to 20 Years |
| | Jacksonville, FL | | (a) | | 963 |
| | 1,007 |
| | — |
| | — |
| | 963 |
| | 1,007 |
| | 1,970 |
| | (917 | ) | | 2001 | | 07/01/05 | | 9 to 20 Years |
| | Knoxville, TN | | (a) | | 259 |
| | 111 |
| | — |
| | — |
| | 259 |
| | 111 |
| | 370 |
| | (171 | ) | | 1981 | | 05/01/05 | | 10 to 15 Years |
| | La Grange, KY | | (b) | | 1,524 |
| | 1,871 |
| | — |
| | — |
| | 1,524 |
| | 1,871 |
| | 3,395 |
| | (278 | ) | | 2008 | | 07/17/13 | | 10 to 48 Years |
| | La Grange, TX | | (c) | | 822 |
| | 1,953 |
| | — |
| | — |
| | 822 |
| | 1,953 |
| | 2,775 |
| | (335 | ) | | 2006 | | 07/17/13 | | 8 to 40 Years |
| | Lakeland, FL | | (a) | | 1,098 |
| | 1,281 |
| | — |
| | — |
| | 1,098 |
| | 1,281 |
| | 2,379 |
| | (876 | ) | | 1984 | | 07/01/05 | | 14 to 20 Years |
| | Lawrenceville, GA | | (a) | | 500 |
| | 237 |
| | — |
| | — |
| | 500 |
| | 237 |
| | 737 |
| | (191 | ) | | 1996 | | 05/01/05 | | 15 to 30 Years |
| | Livingston, TX | | (c) | | 1,893 |
| | 1,134 |
| | — |
| | — |
| | 1,893 |
| | 1,134 |
| | 3,027 |
| | (315 | ) | | 2006 | | 07/17/13 | | 8 to 33 Years |
| | Lowville, NY | | (b) | | 791 |
| | 1,659 |
| | — |
| | — |
| | 791 |
| | 1,659 |
| | 2,450 |
| | (256 | ) | | 2010 | | 07/17/13 | | 12 to 42 Years |
| | Malone, NY | | (b) | | 793 |
| | 1,677 |
| | — |
| | — |
| | 793 |
| | 1,677 |
| | 2,470 |
| | (291 | ) | | 2010 | | 07/17/13 | | 11 to 42 Years |
| | Marinette, WI | | (c) | | 1,236 |
| | 1,611 |
| | — |
| | — |
| | 1,236 |
| | 1,611 |
| | 2,847 |
| | (307 | ) | | 2006 | | 07/17/13 | | 8 to 38 Years |
| | Martinsburg, WV | | (a) | | 173 |
| | 20 |
| | — |
| | — |
| | 173 |
| | 20 |
| | 193 |
| | (46 | ) | | 1972 | | 05/01/05 | | 10 to 15 Years |
| | Mattoon, IL | | (a) | | 233 |
| | 263 |
| | — |
| | — |
| | 233 |
| | 263 |
| | 496 |
| | (202 | ) | | 1984 | | 05/01/05 | | 15 to 20 Years |
| | Mountain Home, AR | | (a) | | 944 |
| | 690 |
| | — |
| | — |
| | 944 |
| | 690 |
| | 1,634 |
| | (227 | ) | | 1977 | | 03/31/14 | | 6 to 15 Years |
| | Mt. Sterling, KY | | (c) | | 1,785 |
| | 1,051 |
| | — |
| | — |
| | 1,785 |
| | 1,051 |
| | 2,836 |
| | (292 | ) | | 2011 | | 07/17/13 | | 12 to 38 Years |
| | Navasota, TX | | (c) | | 1,013 |
| | 1,772 |
| | — |
| | — |
| | 1,013 |
| | 1,772 |
| | 2,785 |
| | (333 | ) | | 2006 | | 07/17/13 | | 8 to 41 Years |
| | New Braunfels, TX | | (c) | | 1,257 |
| | 1,778 |
| | — |
| | — |
| | 1,257 |
| | 1,778 |
| | 3,035 |
| | (300 | ) | | 2006 | | 07/17/13 | | 7 to 38 Years |
| | Ocala, FL | | (c) | | 2,260 |
| | 4,709 |
| | — |
| | — |
| | 2,260 |
| | 4,709 |
| | 6,969 |
| | (835 | ) | | 2006 | | 07/17/13 | | 8 to 46 Years |
| | Parkersburg, WV | | (c) | | 966 |
| | 1,843 |
| | — |
| | — |
| | 966 |
| | 1,843 |
| | 2,809 |
| | (318 | ) | | 2005 | | 07/17/13 | | 7 to 37 Years |
| | Paw Paw, MI | | (c) | | 1,517 |
| | 1,619 |
| | — |
| | — |
| | 1,517 |
| | 1,619 |
| | 3,136 |
| | (364 | ) | | 2006 | | 07/17/13 | | 8 to 33 Years |
| | Pocahontas, AR | | (a) | | 361 |
| | 471 |
| | — |
| | — |
| | 361 |
| | 471 |
| | 832 |
| | (110 | ) | | 1986 | | 03/31/14 | | 7 to 20 Years |
| | Pompano Beach, FL | | (a) | | 1,144 |
| | 337 |
| | — |
| | — |
| | 1,144 |
| | 337 |
| | 1,481 |
| | (228 | ) | | 1990 | | 07/01/05 | | 15 to 30 Years |
| | Powhatan, VA | | (c) | | 4,342 |
| | 2,963 |
| | — |
| | — |
| | 4,342 |
| | 2,963 |
| | 7,305 |
| | (1,260 | ) | | 2007 | | 07/17/13 | | 10 to 31 Years |
| | Prior Lake, MN | | (c) | | 1,998 |
| | 2,454 |
| | — |
| | — |
| | 1,998 |
| | 2,454 |
| | 4,452 |
| | (499 | ) | | 1991 | | 07/17/13 | | 7 to 26 Years |
| | Riviera Beach, FL | | (a) | | 500 |
| | 170 |
| | — |
| | — |
| | 500 |
| | 170 |
| | 670 |
| | (141 | ) | | 1987 | | 07/01/05 | | 15 to 20 Years |
| | Roanoke, VA | | (a) | | 333 |
| | 124 |
| | — |
| | — |
| | 333 |
| | 124 |
| | 457 |
| | (171 | ) | | 1975 | | 05/01/05 | | 10 to 15 Years |
| | Rockford, MN | | (c) | | 1,298 |
| | 2,652 |
| | — |
| | — |
| | 1,298 |
| | 2,652 |
| | 3,950 |
| | (404 | ) | | 2007 | | 07/17/13 | | 9 to 43 Years |
| | Rome, NY | | (c) | | 1,326 |
| | 1,110 |
| | — |
| | — |
| | 1,326 |
| | 1,110 |
| | 2,436 |
| | (261 | ) | | 2007 | | 07/17/13 | | 9 to 34 Years |
| | Salisbury, MD | | (c) | | 4,210 |
| | 6,613 |
| | — |
| | — |
| | 4,210 |
| | 6,613 |
| | 10,823 |
| | (1,669 | ) | | 2007 | | 07/17/13 | | 10 to 27 Years |
|
| | | | | | | | | | | | | | | | | | | | | | | | | | | | | | | | | |
| Multi-Tenant | Alcoa, TN | | (d) | | 918 |
| | 3,170 |
| | — |
| | — |
| | 918 |
| | 3,170 |
| | 4,088 |
| | (452 | ) | | 1999 | | 07/17/13 | | 8 to 40 Years |
| Multi-Tenant | Bridgeton, MO | | (d) | | 11,464 |
| | 9,907 |
| | — |
| | — |
| | 11,464 |
| | 9,907 |
| | 21,371 |
| | (3,299 | ) | | 1991 | | 07/17/13 | | 7 to 25 Years |
| Multi-Tenant | Staunton, VA | | (d) | | 578 |
| | 2,063 |
| | — |
| | 358 |
| | 578 |
| | 2,421 |
| | 2,999 |
| | (724 | ) | | 1988 | | 07/17/13 | | 5 to 20 Years |
| Multi-Tenant | Independence, MO | | (c) | | 2,157 |
| | 2,597 |
| | — |
| | — |
| | 2,157 |
| | 2,597 |
| | 4,754 |
| | (819 | ) | | 1999 | | 07/17/13 | | 7 to 21 Years |
| Multi-Tenant | Douglasville, GA | | (d) | | 2,612 |
| | 4,840 |
| | — |
| | 87 |
| | 2,612 |
| | 4,927 |
| | 7,539 |
| | (1,348 | ) | | 2006 | | 07/17/13 | | 4 to 39 Years |
| Multi-Tenant | Bald Knob, AR | | (a) | | 328 |
| | 327 |
| | — |
| | — |
| | 328 |
| | 327 |
| | 655 |
| | (138 | ) | | 1971 | | 03/31/14 | | 1 to 15 Years |
| Multi-Tenant | Oxford, MS | | (a) | | 1,416 |
| | 4,451 |
| | — |
| | — |
| | 1,416 |
| | 4,451 |
| | 5,867 |
| | (499 | ) | | 2001 | | 05/15/14 | | 15 to 40 Years |
| Multi-Tenant | Collierville, TN | | (d) | | 1,114 |
| | 6,726 |
| | — |
| | — |
| | 1,114 |
| | 6,726 |
| | 7,840 |
| | (1,302 | ) | | 2002 | | 07/17/13 | | 9 to 49 Years |
| Multi-Tenant | Fountain Valley, CA | | (d) | | 9,470 |
| | 13,326 |
| | — |
| | — |
| | 9,470 |
| | 13,326 |
| | 22,796 |
| | (1,745 | ) | | 1968 | | 12/30/14 | | 11 to 30 Years |
| Multi-Tenant | Louisville, KY | | (d) | | 2,205 |
| | 3,551 |
| | — |
| | — |
| | 2,205 |
| | 3,551 |
| | 5,756 |
| | (518 | ) | | 1995 | | 11/02/15 | | 9 to 20 Years |
| Multi-Tenant | Salt Lake City, UT | | (d) | | 4,955 |
| | 18,250 |
| | (3,205 | ) | | (11,979 | ) | | 1,750 |
| | 6,271 |
| | 8,021 |
| | (1,925 | ) | | 1989 | | 07/17/13 | | 3 to 40 Years |
| Multi-Tenant | Bay City, TX | | (d) | | 1,192 |
| | 3,249 |
| | — |
| | (9 | ) | | 1,192 |
| | 3,240 |
| | 4,432 |
| | (1,118 | ) | | 1990 | | 07/17/13 | | 7 to 20 Years |
| Multi-Tenant | Bethany, MO | | (d) | | 648 |
| | 379 |
| | — |
| | — |
| | 648 |
| | 379 |
| | 1,027 |
| | (353 | ) | | 1974 | | 05/31/06 | | 15 to 20 Years |
| Multi-Tenant | Columbia, SC | | (d) | | 2,095 |
| | 16,191 |
| | (627 | ) | | (1,136 | ) | | 1,468 |
| | 15,055 |
| | 16,523 |
| | (7,239 | ) | | 1988 | | 09/09/05 | | 5 to 29 Years |
| NAPA | North Little Rock, AR | | (a) | | 244 |
| | 311 |
| | — |
| | — |
| | 244 |
| | 311 |
| | 555 |
| | (56 | ) | | 2001 | | 03/31/14 | | 2 to 30 Years |
| National Paintball Supply | Sewell, NJ | | (a) | | 858 |
| | 8,418 |
| | (431 | ) | | (3,915 | ) | | 427 |
| | 4,503 |
| | 4,930 |
| | (79 | ) | | 2000 | | 11/17/06 | | 5 to 40 Years |
| Neighbor's Emergency Center | El Paso, TX | | (d) | | 891 |
| | 3,555 |
| | (716 | ) | | (2,867 | ) | | 175 |
| | 688 |
| | 863 |
| | — |
| | 2015 | | 06/20/16 | | 11 to 50 Years |
| Neighbor's Emergency Center | Midland, TX | | (d) | | 3,074 |
| | 2,033 |
| | — |
| | — |
| | 3,074 |
| | 2,033 |
| | 5,107 |
| | (119 | ) | | 2015 | | 06/20/16 | | 11 to 50 Years |
|
| | | | | | | | | | | | | | | | | | | | | | | | | | | | | | | | | |
| Neighbor's Emergency Center | Orange, TX | | (d) | | 389 |
| | 2,090 |
| | — |
| | — |
| | 389 |
| | 2,090 |
| | 2,479 |
| | (105 | ) | | 2015 | | 06/20/16 | | 10 to 50 Years |
| Neighbor's Emergency Center | Tyler, TX | | (d) | | 1,527 |
| | 2,374 |
| | (997 | ) | | (1,569 | ) | | 530 |
| | 805 |
| | 1,335 |
| | — |
| | 2015 | | 06/20/16 | | 11 to 50 Years |
| NextCare Urgent Care | Round Rock, TX | | (d) | | 271 |
| | 728 |
| | — |
| | — |
| | 271 |
| | 728 |
| | 999 |
| | (88 | ) | | 1985 | | 08/18/14 | | 8 to 40 Years |
| Norms | Huntington Park, CA | | (a) | | 1,822 |
| | 1,211 |
| | — |
| | — |
| | 1,822 |
| | 1,211 |
| | 3,033 |
| | (179 | ) | | 1957 | | 12/19/14 | | 15 to 30 Years |
| Norms | Bellflower, CA | | (a) | | 1,284 |
| | 1,636 |
| | — |
| | — |
| | 1,284 |
| | 1,636 |
| | 2,920 |
| | (209 | ) | | 1970 | | 12/19/14 | | 15 to 30 Years |
| Norms | Whittier, CA | | (a) | | 1,439 |
| | 1,874 |
| | — |
| | — |
| | 1,439 |
| | 1,874 |
| | 3,313 |
| | (199 | ) | | 1991 | | 12/19/14 | | 15 to 40 Years |
| Norms | Torrance, CA | | (a) | | 3,509 |
| | 2,754 |
| | — |
| | — |
| | 3,509 |
| | 2,754 |
| | 6,263 |
| | (308 | ) | | 1998 | | 12/19/14 | | 15 to 40 Years |
| Norms | Claremont, CA | | (a) | | 2,764 |
| | 2,919 |
| | — |
| | — |
| | 2,764 |
| | 2,919 |
| | 5,683 |
| | (360 | ) | | 2011 | | 12/19/14 | | 15 to 40 Years |
| Norms | Santa Ana, CA | | (a) | | 2,112 |
| | 1,501 |
| | — |
| | — |
| | 2,112 |
| | 1,501 |
| | 3,613 |
| | (206 | ) | | 1976 | | 12/19/14 | | 15 to 30 Years |
SPIRIT REALTY CAPITAL, INC.
Schedule III Real Estate and
Accumulated Depreciation
(Amounts in thousands)
|
| | | | | | | | | | | | | | | | | | | | | | | | | |
| | | | | | Initial Cost to Company | | Cost Capitalized Subsequent to Acquisition including impairment | | Gross Amount at December 31, 2016 (d) 2017 (g) | | | | | | | | |
| Concept | City, State | | Encumbrances (e) | | Land and Improvements | | Buildings and Improvements | | Land and Improvements | | Buildings and Improvements | | Land and Improvements | | Buildings and Improvements | | Total | | Final Accumulated Depreciation | | Date of Construction | | Date Acquired | | Life in which depreciation in latest Statement of Operations is computed |
Description | | Encumbrances (e)
| | Land and
Improvements
| | Buildings and
Improvements
| | Improvements/
Land
| | Improvements/
building
| | Land and
Improvements
| | Buildings and
Improvements
| | Total | | Final
Accum
| | Date of
Construction
| | Date
Acquired
| |
|
| | | | | | | | | | | | | | | | | | | | | | | | | | | | | | | | | |
| | Sebring, FL | | (a) | | 318 |
| | 291 |
| | — |
| | — |
| | 318 |
| | 291 |
| | 609 |
| | (195 | ) | | 1982 | | 07/01/05 | | 15 to 20 Years |
| | Shallotte, NC | | (b) | | 705 |
| | 1,794 |
| | — |
| | — |
| | 705 |
| | 1,794 |
| | 2,499 |
| | (330 | ) | | 2006 | | 07/17/13 | | 10 to 30 Years |
| | Spokane, WA | | (a) | | 518 |
| | 193 |
| | — |
| | — |
| | 518 |
| | 193 |
| | 711 |
| | (168 | ) | | 1998 | | 05/01/05 | | 15 to 30 Years |
| | Statesville, NC | | (a) | | 614 |
| | 355 |
| | — |
| | — |
| | 614 |
| | 355 |
| | 969 |
| | (406 | ) | | 1976 | | 05/01/05 | | 9 to 15 Years |
| | Tontitown, AR | | (a) | | 230 |
| | 92 |
| | — |
| | — |
| | 230 |
| | 92 |
| | 322 |
| | (82 | ) | | 1987 | | 05/01/05 | | 15 to 20 Years |
| | West Columbia, SC | | (a) | | 324 |
| | 108 |
| | — |
| | — |
| | 324 |
| | 108 |
| | 432 |
| | (80 | ) | | 1989 | | 05/01/05 | | 15 to 20 Years |
| | West Columbia, SC | | (a) | | 262 |
| | 598 |
| | — |
| | — |
| | 262 |
| | 598 |
| | 860 |
| | (343 | ) | | 1984 | | 05/01/05 | | 9 to 20 Years |
| | Wilmington, NC | | (a) | | 370 |
| | 122 |
| | — |
| | — |
| | 370 |
| | 122 |
| | 492 |
| | (100 | ) | | 1987 | | 05/01/05 | | 15 to 20 Years |
|
| | | | | | | | | | | | | | | | | | | | | | | | | | | | | | | | | |
| Norms | Downey, CA | | (a) | | 2,329 |
| | 2,526 |
| | — |
| | — |
| | 2,329 |
| | 2,526 |
| | 4,855 |
| | (278 | ) | | 1993 | | 12/19/14 | | 15 to 40 Years |
| Norms | Riverside, CA | | (a) | | 1,988 |
| | 1,211 |
| | — |
| | — |
| | 1,988 |
| | 1,211 |
| | 3,199 |
| | (204 | ) | | 2002 | | 12/19/14 | | 15 to 30 Years |
| Norms | Pico Rivera, CA | | (a) | | 2,785 |
| | 3,126 |
| | — |
| | — |
| | 2,785 |
| | 3,126 |
| | 5,911 |
| | (346 | ) | | 2014 | | 12/19/14 | | 15 to 40 Years |
| Norms | Bellflower, CA | | (a) | | 1,273 |
| | 1,501 |
| | — |
| | — |
| | 1,273 |
| | 1,501 |
| | 2,774 |
| | (138 | ) | | 1981 | | 12/19/14 | | 15 to 50 Years |
| Northern Tool & Equipment | Blaine, MN | | (d) | | 1,728 |
| | 3,437 |
| | — |
| | — |
| | 1,728 |
| | 3,437 |
| | 5,165 |
| | (525 | ) | | 2006 | | 07/17/13 | | 8 to 43 Years |
| Office Depot | Dayton, OH | | (d) | | 710 |
| | 2,417 |
| | — |
| | — |
| | 710 |
| | 2,417 |
| | 3,127 |
| | (331 | ) | | 2005 | | 07/17/13 | | 8 to 47 Years |
| Office Depot | Greenville, MS | | (d) | | 583 |
| | 2,315 |
| | — |
| | — |
| | 583 |
| | 2,315 |
| | 2,898 |
| | (371 | ) | | 2000 | | 07/17/13 | | 1 to 35 Years |
| Office Depot | Oxford, MS | | (d) | | 1,625 |
| | 1,024 |
| | — |
| | — |
| | 1,625 |
| | 1,024 |
| | 2,649 |
| | (245 | ) | | 2006 | | 07/17/13 | | 9 to 33 Years |
| Office Depot | Enterprise, AL | | (d) | | 675 |
| | 2,239 |
| | — |
| | — |
| | 675 |
| | 2,239 |
| | 2,914 |
| | (333 | ) | | 2006 | | 07/17/13 | | 8 to 43 Years |
| Office Depot | Benton, AR | | (d) | | 1,236 |
| | 1,926 |
| | — |
| | — |
| | 1,236 |
| | 1,926 |
| | 3,162 |
| | (335 | ) | | 2001 | | 07/17/13 | | 3 to 38 Years |
| Office Depot | Laurel, MS | | (d) | | 401 |
| | 2,164 |
| | — |
| | 300 |
| | 401 |
| | 2,464 |
| | 2,865 |
| | (352 | ) | | 2002 | | 07/17/13 | | 3 to 35 Years |
| Office Depot | Morrisville, NC | | (d) | | 408 |
| | 2,732 |
| | — |
| | — |
| | 408 |
| | 2,732 |
| | 3,140 |
| | (354 | ) | | 2008 | | 07/17/13 | | 11 to 47 Years |
| Office Depot | Balcones Heights, TX | | (c) | | 1,888 |
| | 2,117 |
| | — |
| | — |
| | 1,888 |
| | 2,117 |
| | 4,005 |
| | (328 | ) | | 2009 | | 07/17/13 | | 11 to 46 Years |
| Office Max | Orangeburg, SC | | (d) | | 621 |
| | 2,208 |
| | — |
| | — |
| | 621 |
| | 2,208 |
| | 2,829 |
| | (308 | ) | | 1999 | | 07/17/13 | | 0 to 45 Years |
| Ogden Clinic | Ogden, UT | | (d) | | 597 |
| | 2,331 |
| | — |
| | — |
| | 597 |
| | 2,331 |
| | 2,928 |
| | (378 | ) | | 1985 | | 08/18/14 | | 7 to 30 Years |
| Ojos Locos Sports Cantina | San Antonio, TX | | (a) | | 1,204 |
| | 519 |
| | — |
| | — |
| | 1,204 |
| | 519 |
| | 1,723 |
| | (65 | ) | | 1993 | | 09/26/13 | | 30 to 30 Years |
| Ojos Locos Sports Cantina | El Paso, TX | | (d) | | 1,725 |
| | 1,470 |
| | — |
| | — |
| | 1,725 |
| | 1,470 |
| | 3,195 |
| | (189 | ) | | 2014 | | 04/15/15 | | 15 to 30 Years |
| Old Mexico Cantina | Gadsden, AL | | (a) | | 626 |
| | 1,439 |
| | (229 | ) | | (506 | ) | | 397 |
| | 933 |
| | 1,330 |
| | (324 | ) | | 2007 | | 12/21/07 | | 10 to 50 Years |
| Old Time Pottery | Fairview Heights, IL | | (d) | | 1,418 |
| | 2,383 |
| | — |
| | 521 |
| | 1,418 |
| | 2,904 |
| | 4,322 |
| | (1,456 | ) | | 1990 | | 07/17/13 | �� | 0 to 10 Years |
| Old Time Pottery | Foley, AL | | (d) | | 1,240 |
| | 2,983 |
| | — |
| | — |
| | 1,240 |
| | 2,983 |
| | 4,223 |
| | (494 | ) | | 1994 | | 05/08/15 | | 9 to 20 Years |
| Old Time Pottery | Murfreesboro, TN | | (d) | | 3,413 |
| | 6,727 |
| | — |
| | — |
| | 3,413 |
| | 6,727 |
| | 10,140 |
| | (1,080 | ) | | 1985 | | 02/25/15 | | 9 to 20 Years |
| Oregano's Pizza Bistro | Phoenix, AZ | | (a) | | 787 |
| | 663 |
| | — |
| | — |
| | 787 |
| | 663 |
| | 1,450 |
| | (236 | ) | | 1964 | | 10/28/11 | | 14 to 29 Years |
| Oregano's Pizza Bistro | Mesa, AZ | | (a) | | 675 |
| | 911 |
| | — |
| | — |
| | 675 |
| | 911 |
| | 1,586 |
| | (241 | ) | | 1978 | | 10/28/11 | | 14 to 39 Years |
| Oregano's Pizza Bistro | Gilbert, AZ | | (a) | | 643 |
| | 1,669 |
| | — |
| | — |
| | 643 |
| | 1,669 |
| | 2,312 |
| | (363 | ) | | 2006 | | 10/28/11 | | 14 to 39 Years |
| O'Reilly Auto Parts | Dallas, TX | | (d) | | 3,975 |
| | — |
| | — |
| | — |
| | 3,975 |
| | — |
| | 3,975 |
| | — |
| | (f) | | 07/17/13 | | (f) |
| O'Reilly Auto Parts | Warren, AR | | (a) | | 217 |
| | 375 |
| | — |
| | — |
| | 217 |
| | 375 |
| | 592 |
| | (76 | ) | | 2006 | | 03/31/14 | | 13 to 30 Years |
| O'Reilly Auto Parts | Pea Ridge, AR | | (a) | | 217 |
| | — |
| | — |
| | — |
| | 217 |
| | — |
| | 217 |
| | — |
| | (f) | | 03/31/14 | | (f) |
SPIRIT REALTY CAPITAL, INC.
Schedule III Real Estate and
Accumulated Depreciation
(Amounts in thousands)
|
| | | | | | | | | | | | | | | | | | | | | | | | | | | | | | | | | |
| Apparel | | | | | | | | | | | | | | | | | | | | | | |
| | Canton, MA | | (c) | | 28,693 |
| | 27,813 |
| | — |
| | — |
| | 28,693 |
| | 27,813 |
| | 56,506 |
| | (9,384 | ) | | 1962 | | 02/01/06 | | 15 to 30 Years |
| | Collierville, TN | | (c) | | 1,114 |
| | 6,726 |
| | — |
| | — |
| | 1,114 |
| | 6,726 |
| | 7,840 |
| | (1,007 | ) | | 2002 | | 07/17/13 | | 9 to 49 Years |
| | Fairview Heights, IL | | (b) | | 8,637 |
| | 23,418 |
| | — |
| | 223 |
| | 8,637 |
| | 23,641 |
| | 32,278 |
| | (4,103 | ) | | 1999 | | 07/17/13 | | 5 to 39 Years |
| | Grand Forks, ND | | (c) | | 1,516 |
| | 10,008 |
| | — |
| | — |
| | 1,516 |
| | 10,008 |
| | 11,524 |
| | (983 | ) | | 2006 | | 07/17/13 | | 9 to 46 Years |
| | Lake Zurich, IL | | (b) | | 4,860 |
| | 6,935 |
| | — |
| | — |
| | 4,860 |
| | 6,935 |
| | 11,795 |
| | (1,275 | ) | | 2000 | | 07/17/13 | | 7 to 32 Years |
| | Lenexa, KS | | (c) | | 919 |
| | 2,476 |
| | — |
| | — |
| | 919 |
| | 2,476 |
| | 3,395 |
| | (270 | ) | | 2005 | | 07/17/13 | | 2 to 47 Years |
| | Olathe, KS | | (c) | | 3,505 |
| | 5,847 |
| | — |
| | 321 |
| | 3,505 |
| | 6,168 |
| | 9,673 |
| | (1,005 | ) | | 1995 | | 07/17/13 | | 9 to 35 Years |
| | Sherwood, AR | | (c) | | 2,300 |
| | 5,995 |
| | — |
| | — |
| | 2,300 |
| | 5,995 |
| | 8,295 |
| | (576 | ) | | 2003 | | 02/23/15 | | 8 to 30 Years |
| | Tilton, NH | | (c) | | 3,959 |
| | — |
| | — |
| | — |
| | 3,959 |
| | — |
| | 3,959 |
| | — |
| | (f) | | 07/17/13 | | (f) |
| | Tilton, NH | | (b) | | 7,420 |
| | 19,608 |
| | — |
| | — |
| | 7,420 |
| | 19,608 |
| | 27,028 |
| | (4,264 | ) | | 1998 | | 07/17/13 | | 8 to 25 Years |
| | Topeka, KS | | (c) | | 542 |
| | 2,251 |
| | — |
| | — |
| | 542 |
| | 2,251 |
| | 2,793 |
| | (216 | ) | | 2006 | | 07/17/13 | | 3 to 48 Years |
| | Victoria, TX | | (c) | | 2,631 |
| | 7,710 |
| | — |
| | 20 |
| | 2,631 |
| | 7,730 |
| | 10,361 |
| | (1,228 | ) | | 2006 | | 07/17/13 | | 3 to 43 Years |
| | Voorhees, NJ | | (a) | | 2,027 |
| | 6,776 |
| | — |
| | — |
| | 2,027 |
| | 6,776 |
| | 8,803 |
| | (1,789 | ) | | 1970 | | 07/17/13 | | 5 to 20 Years |
| | Wichita, KS | | (c) | | 2,163 |
| | 7,036 |
| | — |
| | — |
| | 2,163 |
| | 7,036 |
| | 9,199 |
| | (1,013 | ) | | 1996 | | 07/17/13 | | 8 to 36 Years |
|
| | | | | | | | | | | | | | | | | | | | | | | | | | | | | | | | | |
| Specialty Retail | | | | | | | | | | | | | | | | | | | | | | | | |
| | Algonquin, IL | | (a) | | 4,171 |
| | 5,613 |
| | — |
| | — |
| | 4,171 |
| | 5,613 |
| | 9,784 |
| | (1,755 | ) | | 2007 | | 04/30/09 | | 13 to 38 Years |
| | Alpharetta, GA | | (a) | | 2,497 |
| | 2,160 |
| | — |
| | — |
| | 2,497 |
| | 2,160 |
| | 4,657 |
| | (1,135 | ) | | 1994 | | 07/01/05 | | 15 to 30 Years |
| | Alpharetta, GA | | (a) | | 4,079 |
| | 1,948 |
| | — |
| | — |
| | 4,079 |
| | 1,948 |
| | 6,027 |
| | (1,431 | ) | | 1983 | | 07/01/05 | | 15 to 20 Years |
| | Atlanta, GA | | (a) | | 4,863 |
| | 815 |
| | — |
| | — |
| | 4,863 |
| | 815 |
| | 5,678 |
| | (710 | ) | | 1970 | | 07/01/05 | | 15 to 20 Years |
| | Aurora, IL | | (a) | | 1,979 |
| | 4,111 |
| | — |
| | — |
| | 1,979 |
| | 4,111 |
| | 6,090 |
| | (1,510 | ) | | 1989 | | 04/30/09 | | 13 to 28 Years |
| | Avon, OH | | (a) | | 1,550 |
| | 2,749 |
| | — |
| | — |
| | 1,550 |
| | 2,749 |
| | 4,299 |
| | (896 | ) | | 2007 | | 04/30/09 | | 13 to 38 Years |
| | Batavia, IL | | (a) | | 1,857 |
| | 3,441 |
| | — |
| | — |
| | 1,857 |
| | 3,441 |
| | 5,298 |
| | (1,343 | ) | | 2001 | | 04/30/09 | | 13 to 28 Years |
| | Broomfield, CO | | (c) | | 4,538 |
| | 4,675 |
| | — |
| | — |
| | 4,538 |
| | 4,675 |
| | 9,213 |
| | (141 | ) | | 1995 | | 08/01/16 | | 9 to 20 Years |
| | Buford, GA | | (c) | | 1,940 |
| | 4,704 |
| | — |
| | — |
| | 1,940 |
| | 4,704 |
| | 6,644 |
| | (93 | ) | | 1984 | | 08/01/16 | | 8 to 30 Years |
| | Caldwell, ID | | (c) | | 470 |
| | 1,739 |
| | — |
| | — |
| | 470 |
| | 1,739 |
| | 2,209 |
| | (63 | ) | | 2009 | | 07/31/15 | | 15 to 50 Years |
| | Corpus Christi, TX | | (c) | | 3,734 |
| | 4,949 |
| | — |
| | — |
| | 3,734 |
| | 4,949 |
| | 8,683 |
| | (166 | ) | | 1986 | | 08/01/16 | | 8 to 20 Years |
|
| | | | | | | | | | | | | | | | | | | | | | | | | |
| | | | | | Initial Cost to Company | | Cost Capitalized Subsequent to Acquisition including impairment | | Gross Amount at December 31, 2016 (d) 2017 (g) | | | | | | | | |
| Concept | City, State | | Encumbrances (e) | | Land and Improvements | | Buildings and Improvements | | Land and Improvements | | Buildings and Improvements | | Land and Improvements | | Buildings and Improvements | | Total | | Final Accumulated Depreciation | | Date of Construction | | Date Acquired | | Life in which depreciation in latest Statement of Operations is computed |
Description | | Encumbrances (e)
| | Land and
Improvements
| | Buildings and
Improvements
| | Improvements/
Land
| | Improvements/
building
| | Land and
Improvements
| | Buildings and
Improvements
| | Total | | Final
Accum
| | Date of
Construction
| | Date
Acquired
| |
|
| | | | | | | | | | | | | | | | | | | | | | | | | | | | | | | | | |
| | Davenport, IA | | (a) | | 2,823 |
| | 4,475 |
| | — |
| | — |
| | 2,823 |
| | 4,475 |
| | 7,298 |
| | (1,550 | ) | | 2007 | | 04/30/09 | | 13 to 38 Years |
| | Downers Grove, IL | | (a) | | 1,772 |
| | 2,227 |
| | — |
| | — |
| | 1,772 |
| | 2,227 |
| | 3,999 |
| | (943 | ) | | 1994 | | 04/30/09 | | 13 to 28 Years |
| | Gurnee, IL | | (a) | | 767 |
| | 1,632 |
| | — |
| | — |
| | 767 |
| | 1,632 |
| | 2,399 |
| | (699 | ) | | 1999 | | 04/30/09 | | 13 to 28 Years |
| | Jenison, MI | | (c) | | 2,303 |
| | 5,743 |
| | — |
| | 88 |
| | 2,303 |
| | 5,831 |
| | 8,134 |
| | (119 | ) | | 1989 | | 08/01/16 | | 8 to 30 Years |
| | Joliet, IL | | (a) | | 1,700 |
| | 5,698 |
| | — |
| | — |
| | 1,700 |
| | 5,698 |
| | 7,398 |
| | (1,653 | ) | | 2004 | | 04/30/09 | | 13 to 38 Years |
| | Louisville, KY | | (c) | | 4,726 |
| | 5,211 |
| | — |
| | — |
| | 4,726 |
| | 5,211 |
| | 9,937 |
| | (3 | ) | | 1984 | | 12/20/16 | | 9 to 20 Years |
| | Loves Park, IL | | (a) | | 1,551 |
| | 6,447 |
| | — |
| | — |
| | 1,551 |
| | 6,447 |
| | 7,998 |
| | (1,797 | ) | | 2004 | | 04/30/09 | | 13 to 38 Years |
| | Lubbock, TX | | (a) | | 4,585 |
| | 4,550 |
| | — |
| | — |
| | 4,585 |
| | 4,550 |
| | 9,135 |
| | (53 | ) | | 1985 | | 11/15/16 | | 8 to 20 Years |
| | Marietta, GA | | (a) | | 4,675 |
| | 854 |
| | — |
| | — |
| | 4,675 |
| | 854 |
| | 5,529 |
| | (737 | ) | | 1996 | | 07/01/05 | | 15 to 30 Years |
| | Marietta, GA | | (a) | | 2,610 |
| | 865 |
| | — |
| | — |
| | 2,610 |
| | 865 |
| | 3,475 |
| | (709 | ) | | 1977 | | 07/01/05 | | 15 to 20 Years |
| | Merrillville, IN | | (a) | | 1,324 |
| | 3,975 |
| | — |
| | — |
| | 1,324 |
| | 3,975 |
| | 5,299 |
| | (1,569 | ) | | 1986 | | 04/30/09 | | 13 to 28 Years |
| | Mesa, AZ | | (c) | | 4,067 |
| | 4,322 |
| | — |
| | — |
| | 4,067 |
| | 4,322 |
| | 8,389 |
| | (2 | ) | | 2002 | | 12/20/16 | | 10 to 20 Years |
| | Mundelein, IL | | (a) | | 1,991 |
| | 4,308 |
| | — |
| | — |
| | 1,991 |
| | 4,308 |
| | 6,299 |
| | (1,646 | ) | | 2002 | | 04/30/09 | | 13 to 28 Years |
| | Peoria, IL | | (a) | | 2,497 |
| | 4,401 |
| | — |
| | — |
| | 2,497 |
| | 4,401 |
| | 6,898 |
| | (1,473 | ) | | 2004 | | 04/30/09 | | 13 to 38 Years |
| | Rapid City, SD | | (c) | | 575 |
| | 2,568 |
| | — |
| | — |
| | 575 |
| | 2,568 |
| | 3,143 |
| | (326 | ) | | 2001 | | 07/17/13 | | 2 to 45 Years |
| | Schaumburg, IL | | (a) | | 2,067 |
| | 2,632 |
| | — |
| | — |
| | 2,067 |
| | 2,632 |
| | 4,699 |
| | (1,047 | ) | | 2002 | | 04/30/09 | | 13 to 28 Years |
| | Spokane, WA | | (c) | | 970 |
| | 1,945 |
| | — |
| | — |
| | 970 |
| | 1,945 |
| | 2,915 |
| | (83 | ) | | 1994 | | 07/31/15 | | 15 to 40 Years |
| | Summerfield, FL | | (c) | | 3,059 |
| | 3,949 |
| | — |
| | — |
| | 3,059 |
| | 3,949 |
| | 7,008 |
| | (86 | ) | | 2004 | | 08/29/16 | | 13 to 30 Years |
| | Tinley Park, IL | | (a) | | 1,108 |
| | 2,091 |
| | — |
| | — |
| | 1,108 |
| | 2,091 |
| | 3,199 |
| | (780 | ) | | 1990 | | 04/30/09 | | 13 to 28 Years |
|
| | | | | | | | | | | | | | | | | | | | | | | | | | | | | | | | | |
| Orscheln Farm and Home | Mountain Home, AR | | (a) | | 944 |
| | 690 |
| | — |
| | — |
| | 944 |
| | 690 |
| | 1,634 |
| | (309 | ) | | 1977 | | 03/31/14 | | 6 to 15 Years |
| Orscheln Farm and Home | Pocahontas, AR | | (a) | | 361 |
| | 471 |
| | — |
| | — |
| | 361 |
| | 471 |
| | 832 |
| | (150 | ) | | 1986 | | 03/31/14 | | 7 to 20 Years |
| Pawn I | Spokane, WA | | (d) | | 970 |
| | 1,945 |
| | — |
| | — |
| | 970 |
| | 1,945 |
| | 2,915 |
| | (142 | ) | | 1994 | | 07/31/15 | | 15 to 40 Years |
| Pawn I | Caldwell, ID | | (d) | | 470 |
| | 1,739 |
| | — |
| | — |
| | 470 |
| | 1,739 |
| | 2,209 |
| | (108 | ) | | 2009 | | 07/31/15 | | 15 to 50 Years |
| Pep Boys | Clarksville, IN | | (b) | | 1,055 |
| | 1,758 |
| | — |
| | — |
| | 1,055 |
| | 1,758 |
| | 2,813 |
| | (373 | ) | | 1993 | | 07/17/13 | | 8 to 30 Years |
| Pep Boys | El Centro, CA | | (b) | | 1,295 |
| | 1,504 |
| | — |
| | — |
| | 1,295 |
| | 1,504 |
| | 2,799 |
| | (330 | ) | | 1998 | | 07/17/13 | | 9 to 33 Years |
| Pep Boys | Frederick, MD | | (b) | | 1,571 |
| | 2,529 |
| | — |
| | ��� |
| | 1,571 |
| | 2,529 |
| | 4,100 |
| | (413 | ) | | 1987 | | 07/17/13 | | 9 to 40 Years |
| Pep Boys | Hampton, VA | | (b) | | 1,662 |
| | 2,974 |
| | — |
| | — |
| | 1,662 |
| | 2,974 |
| | 4,636 |
| | (579 | ) | | 1993 | | 07/17/13 | | 9 to 35 Years |
| Pep Boys | Lakeland, FL | | (b) | | 1,204 |
| | 1,917 |
| | — |
| | — |
| | 1,204 |
| | 1,917 |
| | 3,121 |
| | (333 | ) | | 1991 | | 07/17/13 | | 7 to 38 Years |
| Pep Boys | Orem, UT | | (b) | | 1,224 |
| | 2,132 |
| | — |
| | — |
| | 1,224 |
| | 2,132 |
| | 3,356 |
| | (359 | ) | | 1990 | | 07/17/13 | | 9 to 40 Years |
| Pep Boys | Pasadena, TX | | (b) | | 1,224 |
| | 4,263 |
| | — |
| | — |
| | 1,224 |
| | 4,263 |
| | 5,487 |
| | (631 | ) | | 1995 | | 07/17/13 | | 9 to 40 Years |
| Pep Boys | Tamarac, FL | | (b) | | 1,407 |
| | 2,660 |
| | — |
| | — |
| | 1,407 |
| | 2,660 |
| | 4,067 |
| | (409 | ) | | 1997 | | 07/17/13 | | 7 to 39 Years |
| Pep Boys | West Warwick, RI | | (b) | | 1,323 |
| | 2,917 |
| | — |
| | — |
| | 1,323 |
| | 2,917 |
| | 4,240 |
| | (477 | ) | | 1993 | | 07/17/13 | | 9 to 41 Years |
| Pep Boys | Albuquerque, NM | | (b) | | 885 |
| | 2,998 |
| | — |
| | — |
| | 885 |
| | 2,998 |
| | 3,883 |
| | (453 | ) | | 1990 | | 07/17/13 | | 7 to 35 Years |
| Pep Boys | Arlington Heights, IL | | (b) | | 1,530 |
| | 5,354 |
| | — |
| | — |
| | 1,530 |
| | 5,354 |
| | 6,884 |
| | (802 | ) | | 1995 | | 07/17/13 | | 9 to 36 Years |
| Pep Boys | Colorado Springs, CO | | (b) | | 1,335 |
| | 1,587 |
| | — |
| | — |
| | 1,335 |
| | 1,587 |
| | 2,922 |
| | (476 | ) | | 1994 | | 07/17/13 | | 7 to 26 Years |
| Perkins Family Restaurant | Middleburg Heights, OH | | (a) | | 1,456 |
| | 793 |
| | — |
| | — |
| | 1,456 |
| | 793 |
| | 2,249 |
| | (386 | ) | | 1987 | | 02/06/07 | | 15 to 30 Years |
| Perkins Family Restaurant | Ashtabula, OH | | (a) | | 865 |
| | 244 |
| | — |
| | — |
| | 865 |
| | 244 |
| | 1,109 |
| | (177 | ) | | 1975 | | 02/06/07 | | 15 to 30 Years |
| Perkins Family Restaurant | Erie, PA | | (a) | | 575 |
| | 740 |
| | — |
| | — |
| | 575 |
| | 740 |
| | 1,315 |
| | (350 | ) | | 1974 | | 02/06/07 | | 15 to 30 Years |
| Perkins Family Restaurant | Indiana, PA | | (a) | | 331 |
| | 323 |
| | — |
| | — |
| | 331 |
| | 323 |
| | 654 |
| | (199 | ) | | 1982 | | 02/06/07 | | 15 to 30 Years |
| Perkins Family Restaurant | Canfield, OH | | (a) | | 449 |
| | 644 |
| | 92 |
| | — |
| | 541 |
| | 644 |
| | 1,185 |
| | (321 | ) | | 1973 | | 02/06/07 | | 15 to 30 Years |
| Perkins Family Restaurant | Warren, PA | | (a) | | 383 |
| | 427 |
| | — |
| | — |
| | 383 |
| | 427 |
| | 810 |
| | (260 | ) | | 1970 | | 02/06/07 | | 15 to 30 Years |
| Perkins Family Restaurant | Erie, PA | | (a) | | 463 |
| | 565 |
| | — |
| | — |
| | 463 |
| | 565 |
| | 1,028 |
| | (287 | ) | | 1973 | | 02/06/07 | | 15 to 30 Years |
| Perkins Family Restaurant | Grove City, PA | | (a) | | 531 |
| | 495 |
| | — |
| | — |
| | 531 |
| | 495 |
| | 1,026 |
| | (272 | ) | | 1976 | | 02/06/07 | | 15 to 30 Years |
| Perkins Family Restaurant | Clarion, PA | | (a) | | 426 |
| | 653 |
| | — |
| | — |
| | 426 |
| | 653 |
| | 1,079 |
| | (337 | ) | | 1976 | | 02/06/07 | | 15 to 30 Years |
SPIRIT REALTY CAPITAL, INC.
Schedule III Real Estate and
Accumulated Depreciation
(Amounts in thousands)
|
| | | | | | | | | | | | | | | | | | | | | | | | | | | | | | | | | |
| Automotive Dealers | | | | | | | | | | | | | | | | | | | | | | |
| | Caldwell, TX | | (a) | | 1,775 |
| | 1,725 |
| | — |
| | — |
| | 1,775 |
| | 1,725 |
| | 3,500 |
| | (955 | ) | | 2000 | | 04/29/11 | | 11 to 36 Years |
| | Conroe, TX | | (a) | | 4,338 |
| | 448 |
| | 955 |
| | 144 |
| | 5,293 |
| | 592 |
| | 5,885 |
| | (1,668 | ) | | 2005 | | 09/01/09 | | 12 to 47 Years |
| | Denver, CO | | (c) | | 4,124 |
| | 4,229 |
| | — |
| | — |
| | 4,124 |
| | 4,229 |
| | 8,353 |
| | (193 | ) | | 1980 | | 08/21/15 | | 15 to 40 Years |
| | Gettysburg, PA | | (a) | | 1,385 |
| | 3,259 |
| | — |
| | — |
| | 1,385 |
| | 3,259 |
| | 4,644 |
| | (1,438 | ) | | 2005 | | 02/16/07 | | 5 to 30 Years |
| | Gladstone, MO | | (c) | | 1,100 |
| | 774 |
| | — |
| | — |
| | 1,100 |
| | 774 |
| | 1,874 |
| | (91 | ) | | 2005 | | 03/11/15 | | 4 to 40 Years |
| | Greenville, SC | | (a) | | 2,561 |
| | 1,526 |
| | — |
| | — |
| | 2,561 |
| | 1,526 |
| | 4,087 |
| | (1,304 | ) | | 1999 | | 12/28/05 | | 15 to 30 Years |
|
| | | | | | | | | | | | | | | | | | | | | | | | | |
| | | | | | Initial Cost to Company | | Cost Capitalized Subsequent to Acquisition including impairment | | Gross Amount at December 31, 2016 (d) 2017 (g) | | | | | | | | |
| Concept | City, State | | Encumbrances (e) | | Land and Improvements | | Buildings and Improvements | | Land and Improvements | | Buildings and Improvements | | Land and Improvements | | Buildings and Improvements | | Total | | Final Accumulated Depreciation | | Date of Construction | | Date Acquired | | Life in which depreciation in latest Statement of Operations is computed |
Description | | Encumbrances (e)
| | Land and
Improvements
| | Buildings and
Improvements
| | Improvements/
Land
| | Improvements/
building
| | Land and
Improvements
| | Buildings and
Improvements
| | Total | | Final
Accum
| | Date of
Construction
| | Date
Acquired
| |
|
| | | | | | | | | | | | | | | | | | | | | | | | | | | | | | | | | |
| | Greenville, SC | | (c) | | 9,731 |
| | 11,625 |
| | — |
| | — |
| | 9,731 |
| | 11,625 |
| | 21,356 |
| | (1,777 | ) | | 1999 | | 07/17/13 | | 3 to 40 Years |
| | Independence, MO | | (c) | | 1,058 |
| | 1,297 |
| | — |
| | — |
| | 1,058 |
| | 1,297 |
| | 2,355 |
| | (321 | ) | | 1968 | | 11/25/14 | | 4 to 15 Years |
| | Irving, TX | | (a) | | 7,348 |
| | 970 |
| | — |
| | — |
| | 7,348 |
| | 970 |
| | 8,318 |
| | (2,271 | ) | | 1960 | | 09/01/09 | | 12 to 27 Years |
| | Irving, TX | | (a) | | 931 |
| | 268 |
| | — |
| | — |
| | 931 |
| | 268 |
| | 1,199 |
| | (172 | ) | | 1965 | | 09/01/09 | | 12 to 17 Years |
| | Jacksonville, FL | | (c) | | 6,155 |
| | 10,957 |
| | — |
| | — |
| | 6,155 |
| | 10,957 |
| | 17,112 |
| | (2,694 | ) | | 2005 | | 06/30/05 | | 15 to 40 Years |
| | Jacksonville, FL | | (a) | | 3,170 |
| | 938 |
| | — |
| | — |
| | 3,170 |
| | 938 |
| | 4,108 |
| | (587 | ) | | 1989 | | 12/28/05 | | 15 to 30 Years |
| | Kansas City, MO | | (c) | | 1,310 |
| | 1,824 |
| | — |
| | 6 |
| | 1,310 |
| | 1,830 |
| | 3,140 |
| | (125 | ) | | 2001 | | 12/18/15 | | 15 to 20 Years |
| | Kansas City, MO | | (c) | | 620 |
| | 1,280 |
| | — |
| | — |
| | 620 |
| | 1,280 |
| | 1,900 |
| | (92 | ) | | 1978 | | 12/31/15 | | 15 to 20 Years |
| | Kennesaw, GA | | (a) | | 3,931 |
| | 5,334 |
| | — |
| | — |
| | 3,931 |
| | 5,334 |
| | 9,265 |
| | (1,336 | ) | | 1995 | | 02/16/12 | | 15 to 30 Years |
| | Midlothian, VA | | (c) | | 4,775 |
| | 6,056 |
| | — |
| | — |
| | 4,775 |
| | 6,056 |
| | 10,831 |
| | (1,476 | ) | | 2004 | | 06/30/05 | | 15 to 40 Years |
| | Ontario, CA | | (c) | | 7,981 |
| | 6,937 |
| | — |
| | — |
| | 7,981 |
| | 6,937 |
| | 14,918 |
| | (1,678 | ) | | 2005 | | 06/30/05 | | 15 to 40 Years |
| | Overland Park, KS | | (c) | | 1,390 |
| | 320 |
| | — |
| | — |
| | 1,390 |
| | 320 |
| | 1,710 |
| | (30 | ) | | 1967 | | 03/11/16 | | 7 to 20 Years |
| | Pineville, NC | | (b) | | 4,865 |
| | 1,902 |
| | — |
| | — |
| | 4,865 |
| | 1,902 |
| | 6,767 |
| | (465 | ) | | 2002 | | 07/17/13 | | 10 to 30 Years |
| | Plano, TX | | (c) | | 3,064 |
| | 2,707 |
| | — |
| | — |
| | 3,064 |
| | 2,707 |
| | 5,771 |
| | (1,413 | ) | | 1992 | | 06/29/07 | | 5 to 30 Years |
| | Pompano Beach, FL | | (c) | | 6,153 |
| | 5,010 |
| | — |
| | — |
| | 6,153 |
| | 5,010 |
| | 11,163 |
| | (1,225 | ) | | 2004 | | 06/30/05 | | 15 to 40 Years |
| | Raleigh, NC | | (a) | | 4,163 |
| | 4,017 |
| | — |
| | — |
| | 4,163 |
| | 4,017 |
| | 8,180 |
| | (1,203 | ) | | 1994 | | 07/17/13 | | 4 to 25 Years |
| | Tulsa, OK | | (a) | | 1,225 |
| | 373 |
| | — |
| | — |
| | 1,225 |
| | 373 |
| | 1,598 |
| | (673 | ) | | 1999 | | 12/28/05 | | 15 to 20 Years |
|
| | | | | | | | | | | | | | | | | | | | | | | | | | | | | | | | | |
| Perkins Family Restaurant | Meadville, PA | | (a) | | 981 |
| | 1,056 |
| | — |
| | — |
| | 981 |
| | 1,056 |
| | 2,037 |
| | (481 | ) | | 1983 | | 02/06/07 | | 15 to 30 Years |
| Perkins Family Restaurant | Edinboro, PA | | (a) | | 384 |
| | 350 |
| | — |
| | — |
| | 384 |
| | 350 |
| | 734 |
| | (224 | ) | | 1973 | | 02/06/07 | | 15 to 30 Years |
| Perkins Family Restaurant | Warren, OH | | (a) | | 973 |
| | 640 |
| | — |
| | — |
| | 973 |
| | 640 |
| | 1,613 |
| | (324 | ) | | 1999 | | 02/06/07 | | 15 to 30 Years |
| Perkins Family Restaurant | Erie, PA | | (a) | | 855 |
| | 147 |
| | — |
| | — |
| | 855 |
| | 147 |
| | 1,002 |
| | (153 | ) | | 1973 | | 02/06/07 | | 15 to 30 Years |
| Perkins Family Restaurant | Bradford, PA | | (a) | | 368 |
| | 255 |
| | — |
| | — |
| | 368 |
| | 255 |
| | 623 |
| | (167 | ) | | 1977 | | 02/06/07 | | 15 to 30 Years |
| Perkins Family Restaurant | Olean, NY | | (a) | | 355 |
| | 663 |
| | — |
| | — |
| | 355 |
| | 663 |
| | 1,018 |
| | (333 | ) | | 1977 | | 02/06/07 | | 15 to 30 Years |
| Perkins Family Restaurant | Corry, PA | | (a) | | 411 |
| | 279 |
| | — |
| | — |
| | 411 |
| | 279 |
| | 690 |
| | (202 | ) | | 1977 | | 02/06/07 | | 15 to 30 Years |
| Perkins Family Restaurant | Austintown, OH | | (a) | | 1,106 |
| | 450 |
| | — |
| | — |
| | 1,106 |
| | 450 |
| | 1,556 |
| | (254 | ) | | 1991 | | 02/06/07 | | 15 to 30 Years |
| Perkins Family Restaurant | Canton, OH | | (a) | | 1,325 |
| | 781 |
| | — |
| | — |
| | 1,325 |
| | 781 |
| | 2,106 |
| | (378 | ) | | 1989 | | 02/06/07 | | 15 to 30 Years |
| Perkins Family Restaurant | Youngstown, OH | | (a) | | 1,560 |
| | 557 |
| | — |
| | — |
| | 1,560 |
| | 557 |
| | 2,117 |
| | (296 | ) | | 1985 | | 02/06/07 | | 15 to 30 Years |
| Perkins Family Restaurant | Titusville, PA | | (a) | | 247 |
| | 438 |
| | — |
| | — |
| | 247 |
| | 438 |
| | 685 |
| | (226 | ) | | 1976 | | 04/29/11 | | 11 to 26 Years |
| Perkins Family Restaurant | Brooklyn, OH | | (d) | | 1,226 |
| | 672 |
| | (152 | ) | | (672 | ) | | 1,074 |
| | — |
| | 1,074 |
| | — |
| | (f) | | 02/06/07 | | (f) |
| Perkins Family Restaurant | Hermitage, PA | | (d) | | 604 |
| | 717 |
| | — |
| | — |
| | 604 |
| | 717 |
| | 1,321 |
| | (370 | ) | | 1978 | | 02/06/07 | | 10 to 25 Years |
| Perkins Family Restaurant | Ashland, OH | | (b) | | 294 |
| | 642 |
| | — |
| | — |
| | 294 |
| | 642 |
| | 936 |
| | (186 | ) | | 1971 | | 03/18/13 | | 13 to 20 Years |
| PetSmart | McCarran, NV | | (d) | | 8,333 |
| | 37,763 |
| | — |
| | — |
| | 8,333 |
| | 37,763 |
| | 46,096 |
| | (6,518 | ) | | 2008 | | 07/17/13 | | 8 to 40 Years |
| PetSmart | Chattanooga, TN | | (c) | | 1,689 |
| | 2,837 |
| | — |
| | — |
| | 1,689 |
| | 2,837 |
| | 4,526 |
| | (444 | ) | | 1996 | | 07/17/13 | | 8 to 40 Years |
| PetSmart | Daytona Beach, FL | | (c) | | 775 |
| | 3,880 |
| | — |
| | — |
| | 775 |
| | 3,880 |
| | 4,655 |
| | (518 | ) | | 1996 | | 07/17/13 | | 8 to 42 Years |
| PetSmart | Fredericksburg, VA | | (c) | | 1,783 |
| | 3,491 |
| | — |
| | — |
| | 1,783 |
| | 3,491 |
| | 5,274 |
| | (512 | ) | | 1997 | | 07/17/13 | | 8 to 44 Years |
| Pier1 Imports | St. Louis, MO | | (a) | | 785 |
| | 1,023 |
| | — |
| | — |
| | 785 |
| | 1,023 |
| | 1,808 |
| | (148 | ) | | 1996 | | 08/30/13 | | 15 to 40 Years |
| Pike Nursery | Alpharetta, GA | | (a) | | 2,497 |
| | 2,160 |
| | — |
| | — |
| | 2,497 |
| | 2,160 |
| | 4,657 |
| | (1,255 | ) | | 1994 | | 07/01/05 | | 15 to 30 Years |
| Pike Nursery | Marietta, GA | | (a) | | 4,675 |
| | 854 |
| | — |
| | — |
| | 4,675 |
| | 854 |
| | 5,529 |
| | (816 | ) | | 1996 | | 07/01/05 | | 15 to 30 Years |
| Pike Nursery | Atlanta, GA | | (a) | | 4,863 |
| | 815 |
| | — |
| | — |
| | 4,863 |
| | 815 |
| | 5,678 |
| | (785 | ) | | 1970 | | 07/01/05 | | 15 to 20 Years |
| Pike Nursery | Alpharetta, GA | | (a) | | 4,079 |
| | 1,948 |
| | — |
| | — |
| | 4,079 |
| | 1,948 |
| | 6,027 |
| | (1,583 | ) | | 1983 | | 07/01/05 | | 15 to 20 Years |
SPIRIT REALTY CAPITAL, INC.
Schedule III Real Estate and
Accumulated Depreciation
(Amounts in thousands)
|
| | | | | | | | | | | | | | | | | | | | | | | | | | | | | | | | | |
| Home Improvement | | | | | | | | | | | | | | | | | | | | | | |
| | Bedford Park, IL | | (b) | | 10,242 |
| | 11,839 |
| | — |
| | — |
| | 10,242 |
| | 11,839 |
| | 22,081 |
| | (2,754 | ) | | 1993 | | 07/17/13 | | 7 to 20 Years |
| | Blaine, MN | | (c) | | 1,728 |
| | 3,437 |
| | — |
| | — |
| | 1,728 |
| | 3,437 |
| | 5,165 |
| | (406 | ) | | 2006 | | 07/17/13 | | 8 to 43 Years |
| | Bridgeton, MO | | (c) | | 11,464 |
| | 9,907 |
| | — |
| | — |
| | 11,464 |
| | 9,907 |
| | 21,371 |
| | (2,552 | ) | | 1991 | | 07/17/13 | | 7 to 25 Years |
| | Broadview, IL | | (c) | | 12,392 |
| | 32,193 |
| | — |
| | 154 |
| | 12,392 |
| | 32,347 |
| | 44,739 |
| | (5,698 | ) | | 1994 | | 07/17/13 | | 2 to 30 Years |
| | Chester, NY | | (c) | | 6,432 |
| | — |
| | — |
| | — |
| | 6,432 |
| | — |
| | 6,432 |
| | — |
| | (f) | | 07/17/13 | | (f) |
| | Cincinnati, OH | | (b) | | 6,086 |
| | 10,984 |
| | — |
| | — |
| | 6,086 |
| | 10,984 |
| | 17,070 |
| | (2,070 | ) | | 1998 | | 07/17/13 | | 4 to 28 Years |
| | Colma, CA | | (c) | | 21,065 |
| | 13,597 |
| | — |
| | — |
| | 21,065 |
| | 13,597 |
| | 34,662 |
| | (1,837 | ) | | 1995 | | 07/17/13 | | 2 to 33 Years |
| | Enterprise, AL | | (c) | | 1,924 |
| | 5,083 |
| | — |
| | 260 |
| | 1,924 |
| | 5,343 |
| | 7,267 |
| | (1,220 | ) | | 1995 | | 07/17/13 | | 1 to 27 Years |
| | Lakewood, CO | | (b) | | 3,822 |
| | — |
| | — |
| | — |
| | 3,822 |
| | — |
| | 3,822 |
| | — |
| | (f) | | 07/17/13 | | (f) |
| | Lubbock, TX | | (c) | | 2,644 |
| | 10,008 |
| | — |
| | 481 |
| | 2,644 |
| | 10,489 |
| | 13,133 |
| | (1,584 | ) | | 1996 | | 07/17/13 | | 2 to 36 Years |
| | Midland, TX | | (c) | | 5,826 |
| | 6,633 |
| | — |
| | 366 |
| | 5,826 |
| | 6,999 |
| | 12,825 |
| | (1,199 | ) | | 1996 | | 07/17/13 | | 2 to 35 Years |
| | Rio Grande, NJ | | (c) | | 753 |
| | 3,299 |
| | — |
| | — |
| | 753 |
| | 3,299 |
| | 4,052 |
| | (196 | ) | | 2006 | | 03/31/15 | | 11 to 40 Years |
| | Tilton, NH | | (c) | | 13,185 |
| | — |
| | — |
| | — |
| | 13,185 |
| | — |
| | 13,185 |
| | — |
| | (f) | | 07/17/13 | | (f) |
|
| | | | | | | | | | | | | | | | | | | | | | | | | | | | | | | | | |
| Distribution | | | | | | | | | | | | | | | | | | | | | | |
| | Arlington, WA | | (c) | | 1,860 |
| | 10,402 |
| | — |
| | — |
| | 1,860 |
| | 10,402 |
| | 12,262 |
| | (654 | ) | | 2002 | | 11/21/2014 | | 7 to 40 Years |
| | Baton Rouge, LA | | (b) | | 2,898 |
| | 8,024 |
| | — |
| | — |
| | 2,898 |
| | 8,024 |
| | 10,922 |
| | (1,059 | ) | | 2008 | | 7/17/2013 | | 9 to 43 Years |
| | Dayton, NJ | | (c) | | 12,701 |
| | 10,723 |
| | — |
| | — |
| | 12,701 |
| | 10,723 |
| | 23,424 |
| | (118 | ) | | 1975 | | 10/27/2016 | | 7 to 30 Years |
|
| | | | | | | | | | | | | | | | | | | | | | | | | |
| | | | | | Initial Cost to Company | | Cost Capitalized Subsequent to Acquisition including impairment | | Gross Amount at December 31, 2016 (d) 2017 (g) | | | | | | | | |
| Concept | City, State | | Encumbrances (e) | | Land and Improvements | | Buildings and Improvements | | Land and Improvements | | Buildings and Improvements | | Land and Improvements | | Buildings and Improvements | | Total | | Final Accumulated Depreciation | | Date of Construction | | Date Acquired | | Life in which depreciation in latest Statement of Operations is computed |
Description | | Encumbrances (e)
| | Land and
Improvements
| | Buildings and
Improvements
| | Improvements/
Land
| | Improvements/
building
| | Land and
Improvements
| | Buildings and
Improvements
| | Total | | Final
Accum
| | Date of
Construction
| | Date
Acquired
| |
|
| | | | | | | | | | | | | | | | | | | | | | | | | | | | | | | | | |
| | Edwardsville, KS | | (c) | | 12,780 |
| | 13,501 |
| | — |
| | — |
| | 12,780 |
| | 13,501 |
| | 26,281 |
| | (3,707 | ) | | 1999 | | 7/17/2013 | | 9 to 29 Years |
| | Hickory, NC | | (c) | | 1,356 |
| | 5,406 |
| | — |
| | — |
| | 1,356 |
| | 5,406 |
| | 6,762 |
| | (427 | ) | | 2006 | | 5/11/2015 | | 10 to 30 Years |
| | Huntsville, AL | | (b) | | 5,115 |
| | 6,701 |
| | — |
| | — |
| | 5,115 |
| | 6,701 |
| | 11,816 |
| | (1,587 | ) | | 2008 | | 7/17/2013 | | 10 to 38 Years |
| | Maxton, NC | | (c) | | 870 |
| | 6,960 |
| | — |
| | — |
| | 870 |
| | 6,960 |
| | 7,830 |
| | (2 | ) | | 2016 | | 12/16/2016 | | 9 to 40 Years |
| | Peoria, IL | | (c) | | 953 |
| | 1,916 |
| | — |
| | 13 |
| | 953 |
| | 1,929 |
| | 2,882 |
| | (398 | ) | | 1996 | | 7/17/2013 | | 3 to 30 Years |
| | Riverside, CA | | (a) | | 1,203 |
| | 6,254 |
| | — |
| | — |
| | 1,203 |
| | 6,254 |
| | 7,457 |
| | (1,703 | ) | | 2004 | | 7/1/2005 | | 14 to 40 Years |
| | Rockford, IL | | (c) | | 1,407 |
| | 3,708 |
| | (966 | ) | | (2,399 | ) | | 441 |
| | 1,309 |
| | 1,750 |
| | — |
| | 1994 | | 7/17/2013 | | 2 to 33 Years |
| | South Windsor, CT | | (c) | | 1,590 |
| | 6,774 |
| | — |
| | — |
| | 1,590 |
| | 6,774 |
| | 8,364 |
| | (627 | ) | | 1982 | | 5/5/2015 | | 7 to 20 Years |
| | Tavares, FL | | (a) | | 1,075 |
| | 5,098 |
| | — |
| | — |
| | 1,075 |
| | 5,098 |
| | 6,173 |
| | (1,635 | ) | | 2004 | | 7/1/2005 | | 14 to 40 Years |
| | Walker, MI | | (b) | | 2,287 |
| | 4,469 |
| | (1,369 | ) | | (2,527 | ) | | 918 |
| | 1,942 |
| | 2,860 |
| | (24 | ) | | 2001 | | 7/17/2013 | | 4 to 34 Years |
|
| | | | | | | | | | | | | | | | | | | | | | | | | | | | | | | | | |
| Pike Nursery | Marietta, GA | | (a) | | 2,610 |
| | 865 |
| | — |
| | — |
| | 2,610 |
| | 865 |
| | 3,475 |
| | (785 | ) | | 1977 | | 07/01/05 | | 15 to 20 Years |
| Pine Creek Medical Center | Dallas, TX | | (a) | | 1,633 |
| | 21,835 |
| | — |
| | 2,019 |
| | 1,633 |
| | 23,854 |
| | 25,487 |
| | (5,631 | ) | | 2005 | | 08/29/05 | | 15 to 50 Years |
| Pine Creek Medical Center | Dallas, TX | | (a) | | 1,915 |
| | 9,150 |
| | — |
| | — |
| | 1,915 |
| | 9,150 |
| | 11,065 |
| | (1,807 | ) | | 2006 | | 03/28/13 | | 11 to 50 Years |
| Pioneer Hi-Bred | Maxton, NC | | (d) | | 870 |
| | 6,961 |
| | — |
| | 29 |
| | 870 |
| | 6,990 |
| | 7,860 |
| | (230 | ) | | 2016 | | 12/16/16 | | 9 to 40 Years |
| Pizza Hut | Evansville, IN | | (a) | | 270 |
| | 231 |
| | — |
| | — |
| | 270 |
| | 231 |
| | 501 |
| | (80 | ) | | 2000 | | 06/25/04 | | 30 to 30 Years |
| Pizza Hut | Owensboro, KY | | (a) | | 250 |
| | 502 |
| | — |
| | — |
| | 250 |
| | 502 |
| | 752 |
| | (174 | ) | | 1991 | | 06/25/04 | | 30 to 30 Years |
| Pizza Hut | Madill, OK | | (a) | | 352 |
| | 648 |
| | — |
| | — |
| | 352 |
| | 648 |
| | 1,000 |
| | (785 | ) | | 1972 | | 06/25/04 | | 10 to 15 Years |
| Pizza Hut | Geneva, AL | | (a) | | 522 |
| | 570 |
| | — |
| | — |
| | 522 |
| | 570 |
| | 1,092 |
| | (664 | ) | | 1990 | | 06/25/04 | | 10 to 15 Years |
| Pizza Hut | Blakely, GA | | (a) | | 288 |
| | 744 |
| | — |
| | — |
| | 288 |
| | 744 |
| | 1,032 |
| | (520 | ) | | 1987 | | 06/25/04 | | 15 to 20 Years |
| Pizza Hut | Mayfield, KY | | (a) | | 307 |
| | 596 |
| | — |
| | — |
| | 307 |
| | 596 |
| | 903 |
| | (372 | ) | | 1997 | | 06/25/04 | | 15 to 30 Years |
| Pizza Hut | Salem, IL | | (a) | | 271 |
| | 218 |
| | — |
| | — |
| | 271 |
| | 218 |
| | 489 |
| | (125 | ) | | 2000 | | 07/28/04 | | 15 to 30 Years |
| Pizza Hut | Burlington, IA | | (a) | | 304 |
| | 588 |
| | — |
| | — |
| | 304 |
| | 588 |
| | 892 |
| | (314 | ) | | 1996 | | 09/23/05 | | 15 to 30 Years |
| Pizza Hut | Dubuque, IA | | (a) | | 479 |
| | 298 |
| | — |
| | — |
| | 479 |
| | 298 |
| | 777 |
| | (393 | ) | | 1970 | | 09/23/05 | | 10 to 15 Years |
| Pizza Hut | Tipton, IA | | (a) | | 240 |
| | 408 |
| | — |
| | — |
| | 240 |
| | 408 |
| | 648 |
| | (520 | ) | | 1991 | | 09/23/05 | | 10 to 15 Years |
| Pizza Hut | Dyersville, IA | | (a) | | 267 |
| | 513 |
| | — |
| | — |
| | 267 |
| | 513 |
| | 780 |
| | (394 | ) | | 1983 | | 09/23/05 | | 14 to 20 Years |
| Pizza Hut | Independence, IA | | (a) | | 223 |
| | 473 |
| | — |
| | — |
| | 223 |
| | 473 |
| | 696 |
| | (554 | ) | | 1976 | | 09/23/05 | | 10 to 15 Years |
|
| | | | | | | | | | | | | | | | | | | | | | | | | | | | | | | | | |
| Car Washes | | | | | | | | | | | | | | | | | | | | | | |
| | Abilene, TX | | (c) | | 2,733 |
| | 3,080 |
| | — |
| | — |
| | 2,733 |
| | 3,080 |
| | 5,813 |
| | (246 | ) | | 1993 | | 04/07/15 | | 15 to 30 Years |
| | Albuquerque, NM | | (a) | | 2,472 |
| | 2,117 |
| | — |
| | — |
| | 2,472 |
| | 2,117 |
| | 4,589 |
| | (345 | ) | | 2005 | | 05/13/14 | | 15 to 30 Years |
| | Albuquerque, NM | | (a) | | 2,657 |
| | 3,225 |
| | — |
| | — |
| | 2,657 |
| | 3,225 |
| | 5,882 |
| | (537 | ) | | 1960 | | 05/13/14 | | 15 to 30 Years |
| | Albuquerque, NM | | (a) | | 1,179 |
| | — |
| | — |
| | — |
| | 1,179 |
| | — |
| | 1,179 |
| | — |
| | (f) | | 05/13/14 | | (f) |
| | Albuquerque, NM | | (a) | | 1,151 |
| | 1,677 |
| | — |
| | — |
| | 1,151 |
| | 1,677 |
| | 2,828 |
| | (237 | ) | | 1976 | | 05/13/14 | | 15 to 30 Years |
| | Albuquerque, NM | | (a) | | 1,563 |
| | 2,700 |
| | — |
| | — |
| | 1,563 |
| | 2,700 |
| | 4,263 |
| | (313 | ) | | 1994 | | 05/13/14 | | 15 to 30 Years |
| | Albuquerque, NM | | (a) | | 2,586 |
| | 2,742 |
| | — |
| | — |
| | 2,586 |
| | 2,742 |
| | 5,328 |
| | (375 | ) | | 2002 | | 05/13/14 | | 15 to 30 Years |
| | Arlington, TN | | (c) | | 868 |
| | 1,487 |
| | — |
| | — |
| | 868 |
| | 1,487 |
| | 2,355 |
| | (83 | ) | | 2010 | | 09/30/15 | | 15 to 30 Years |
| | Boise, ID | | (a) | | 2,155 |
| | 2,488 |
| | — |
| | — |
| | 2,155 |
| | 2,488 |
| | 4,643 |
| | (552 | ) | | 2004 | | 05/15/13 | | 15 to 30 Years |
| | Boise, ID | | (a) | | 217 |
| | — |
| | — |
| | — |
| | 217 |
| | — |
| | 217 |
| | (7 | ) | | 2013 | | 05/15/13 | | 15 to 15 Years |
| | Casselberry, FL | | (c) | | 1,042 |
| | 2,406 |
| | — |
| | — |
| | 1,042 |
| | 2,406 |
| | 3,448 |
| | (93 | ) | | 1988 | | 02/09/16 | | 13 to 30 Years |
| | Chandler, AZ | | (c) | | 1,293 |
| | 1,951 |
| | — |
| | — |
| | 1,293 |
| | 1,951 |
| | 3,244 |
| | (23 | ) | | 2006 | | 09/29/16 | | 21 to 30 Years |
| | Edgewater, MD | | (c) | | 4,720 |
| | 1,460 |
| | — |
| | — |
| | 4,720 |
| | 1,460 |
| | 6,180 |
| | (162 | ) | | 2005 | | 01/21/15 | | 15 to 30 Years |
| | Edmond, OK | | (c) | | 644 |
| | 1,896 |
| | — |
| | — |
| | 644 |
| | 1,896 |
| | 2,540 |
| | (93 | ) | | 2005 | | 09/30/15 | | 15 to 30 Years |
| | Glendale, AZ | | (c) | | 1,524 |
| | 854 |
| | — |
| | — |
| | 1,524 |
| | 854 |
| | 2,378 |
| | (16 | ) | | 1988 | | 09/29/16 | | 21 to 30 Years |
| | Houston, TX | | (a) | | 1,703 |
| | 1,221 |
| | — |
| | — |
| | 1,703 |
| | 1,221 |
| | 2,924 |
| | (216 | ) | | 1996 | | 06/18/14 | | 15 to 30 Years |
| | Madison, WI | | (c) | | 564 |
| | 1,623 |
| | — |
| | — |
| | 564 |
| | 1,623 |
| | 2,187 |
| | (92 | ) | | 1956 | | 06/30/15 | | 15 to 30 Years |
| | Madison, WI | | (c) | | 612 |
| | 1,775 |
| | — |
| | — |
| | 612 |
| | 1,775 |
| | 2,387 |
| | (119 | ) | | 1958 | | 06/30/15 | | 15 to 30 Years |
| | Madison, WI | | (c) | | 905 |
| | 2,728 |
| | — |
| | — |
| | 905 |
| | 2,728 |
| | 3,633 |
| | (167 | ) | | 1961 | | 06/30/15 | | 15 to 30 Years |
| | Meridian, ID | | (a) | | 1,924 |
| | 2,170 |
| | 536 |
| | 20 |
| | 2,460 |
| | 2,190 |
| | 4,650 |
| | (515 | ) | | 2006 | | 05/15/13 | | 15 to 30 Years |
| | Millersville, MD | | (c) | | 2,250 |
| | 1,636 |
| | — |
| | — |
| | 2,250 |
| | 1,636 |
| | 3,886 |
| | (145 | ) | | 2007 | | 01/21/15 | | 15 to 30 Years |
| | Nampa, ID | | (a) | | 3,240 |
| | 2,343 |
| | — |
| | — |
| | 3,240 |
| | 2,343 |
| | 5,583 |
| | (598 | ) | | 2010 | | 05/15/13 | | 15 to 30 Years |
| | Ocoee, FL | | (c) | | 2,128 |
| | 1,775 |
| | — |
| | 18 |
| | 2,128 |
| | 1,793 |
| | 3,921 |
| | (60 | ) | | 2009 | | 05/03/16 | | 17 to 30 Years |
|
| | | | | | | | | | | | | | | | | | | | | | | | | | | | | | | | | |
| Pizza Hut | Manchester, IA | | (a) | | 351 |
| | 495 |
| | — |
| | — |
| | 351 |
| | 495 |
| | 846 |
| | (578 | ) | | 1977 | | 09/23/05 | | 10 to 15 Years |
| Pizza Hut | Rock Falls, IL | | (a) | | 314 |
| | 631 |
| | — |
| | — |
| | 314 |
| | 631 |
| | 945 |
| | (324 | ) | | 1995 | | 09/23/05 | | 15 to 30 Years |
| Pizza Hut | De Witt, IA | | (a) | | 248 |
| | 333 |
| | — |
| | — |
| | 248 |
| | 333 |
| | 581 |
| | (264 | ) | | 1984 | | 09/23/05 | | 15 to 20 Years |
| Pizza Hut | Vandalia, IL | | (a) | | 409 |
| | 202 |
| | — |
| | — |
| | 409 |
| | 202 |
| | 611 |
| | (358 | ) | | 1977 | | 09/23/05 | | 10 to 15 Years |
| Pizza Hut | Charleston, IL | | (a) | | 272 |
| | 220 |
| | — |
| | — |
| | 272 |
| | 220 |
| | 492 |
| | (248 | ) | | 1986 | | 09/23/05 | | 10 to 15 Years |
| Pizza Hut | Effingham, IL | | (a) | | 357 |
| | 228 |
| | — |
| | — |
| | 357 |
| | 228 |
| | 585 |
| | (299 | ) | | 1973 | | 09/23/05 | | 10 to 15 Years |
| Pizza Hut | Maquoketa, IA | | (a) | | 184 |
| | 90 |
| | — |
| | — |
| | 184 |
| | 90 |
| | 274 |
| | (149 | ) | | 1973 | | 09/23/05 | | 10 to 15 Years |
| Pizza Hut | Taylorville, IL | | (a) | | 154 |
| | 352 |
| | — |
| | — |
| | 154 |
| | 352 |
| | 506 |
| | (380 | ) | | 1980 | | 09/23/05 | | 10 to 15 Years |
| Pizza Hut | Decorah, IA | | (a) | | 207 |
| | 91 |
| | — |
| | — |
| | 207 |
| | 91 |
| | 298 |
| | (120 | ) | | 1985 | | 09/23/05 | | 10 to 15 Years |
| Pizza Hut | Vinton, IA | | (a) | | 121 |
| | 114 |
| | — |
| | — |
| | 121 |
| | 114 |
| | 235 |
| | (181 | ) | | 1978 | | 09/23/05 | | 10 to 15 Years |
| Pizza Hut | Creston, IA | | (a) | | 103 |
| | 180 |
| | — |
| | — |
| | 103 |
| | 180 |
| | 283 |
| | (214 | ) | | 1974 | | 12/15/05 | | 10 to 15 Years |
| Pizza Hut | New Cumberland, PA | | (a) | | 634 |
| | 278 |
| | — |
| | 176 |
| | 634 |
| | 454 |
| | 1,088 |
| | (336 | ) | | 1990 | | 01/30/06 | | 15 to 20 Years |
| Pizza Hut | Ephrata, PA | | (a) | | 685 |
| | 231 |
| | — |
| | — |
| | 685 |
| | 231 |
| | 916 |
| | (210 | ) | | 1978 | | 01/30/06 | | 15 to 20 Years |
| Pizza Hut | Harrisburg, PA | | (a) | | 762 |
| | 241 |
| | — |
| | 176 |
| | 762 |
| | 417 |
| | 1,179 |
| | (336 | ) | | 1977 | | 01/30/06 | | 15 to 20 Years |
SPIRIT REALTY CAPITAL, INC.
Schedule III Real Estate and
Accumulated Depreciation
(Amounts in thousands)
|
| | | | | | | | | | | | | | | | | | | | | | | | | |
| | | | | | Initial Cost to Company | | Cost Capitalized Subsequent to Acquisition including impairment | | Gross Amount at December 31, 2016 (d) 2017 (g) | | | | | | | | |
| Concept | City, State | | Encumbrances (e) | | Land and Improvements | | Buildings and Improvements | | Land and Improvements | | Buildings and Improvements | | Land and Improvements | | Buildings and Improvements | | Total | | Final Accumulated Depreciation | | Date of Construction | | Date Acquired | | Life in which depreciation in latest Statement of Operations is computed |
Description | | Encumbrances (e)
| | Land and
Improvements
| | Buildings and
Improvements
| | Improvements/
Land
| | Improvements/
building
| | Land and
Improvements
| | Buildings and
Improvements
| | Total | | Final
Accum
| | Date of
Construction
| | Date
Acquired
| |
|
| | | | | | | | | | | | | | | | | | | | | | | | | | | | | | | | | |
| | Oklahoma City, OK | | (c) | | 545 |
| | 1,995 |
| | — |
| | — |
| | 545 |
| | 1,995 |
| | 2,540 |
| | (97 | ) | | 2005 | | 09/30/15 | | 15 to 30 Years |
| | Oklahoma City, OK | | (c) | | 1,004 |
| | 1,933 |
| | — |
| | — |
| | 1,004 |
| | 1,933 |
| | 2,937 |
| | (106 | ) | | 2005 | | 09/30/15 | | 15 to 30 Years |
| | Orlando, FL | | (c) | | 2,709 |
| | 2,728 |
| | — |
| | 45 |
| | 2,709 |
| | 2,773 |
| | 5,482 |
| | (122 | ) | | 2001 | | 02/09/16 | | 13 to 30 Years |
| | Orlando, FL | | (c) | | 1,629 |
| | 1,895 |
| | — |
| | — |
| | 1,629 |
| | 1,895 |
| | 3,524 |
| | (89 | ) | | 2005 | | 02/09/16 | | 13 to 30 Years |
| | Phoenix, AZ | | (c) | | 2,066 |
| | 1,581 |
| | — |
| | — |
| | 2,066 |
| | 1,581 |
| | 3,647 |
| | (22 | ) | | 2009 | | 09/29/16 | | 21 to 30 Years |
| | Phoenix, AZ | | (c) | | 1,143 |
| | 439 |
| | — |
| | — |
| | 1,143 |
| | 439 |
| | 1,582 |
| | (8 | ) | | 1970 | | 09/29/16 | | 21 to 30 Years |
| | Phoenix, AZ | | (c) | | 1,835 |
| | 2,332 |
| | — |
| | 54 |
| | 1,835 |
| | 2,386 |
| | 4,221 |
| | (29 | ) | | 1974 | | 09/29/16 | | 21 to 30 Years |
| | Rockford, IL | | (c) | | 706 |
| | 2,669 |
| | — |
| | — |
| | 706 |
| | 2,669 |
| | 3,375 |
| | (151 | ) | | 1959 | | 06/30/15 | | 15 to 30 Years |
| | Round Rock, TX | | (c) | | 1,167 |
| | 1,549 |
| | — |
| | — |
| | 1,167 |
| | 1,549 |
| | 2,716 |
| | (123 | ) | | 2009 | | 05/07/15 | | 15 to 30 Years |
| | Sherwood, AR | | (c) | | 1,128 |
| | 1,388 |
| | — |
| | — |
| | 1,128 |
| | 1,388 |
| | 2,516 |
| | (91 | ) | | 2010 | | 09/30/15 | | 15 to 30 Years |
| | Siloam Springs, AR | | (c) | | 991 |
| | 1,884 |
| | — |
| | — |
| | 991 |
| | 1,884 |
| | 2,875 |
| | (101 | ) | | 2005 | | 09/30/15 | | 15 to 30 Years |
| | Springdale, AR | | (c) | | 521 |
| | 2,032 |
| | — |
| | — |
| | 521 |
| | 2,032 |
| | 2,553 |
| | (100 | ) | | 2005 | | 09/30/15 | | 15 to 30 Years |
| | St. Paul, MN | | (c) | | 5,274 |
| | 136 |
| | — |
| | — |
| | 5,274 |
| | 136 |
| | 5,410 |
| | (26 | ) | | 1966 | | 12/13/16 | | 12 to 30 Years |
| | Texarkana, TX | | (c) | | 483 |
| | 1,400 |
| | — |
| | — |
| | 483 |
| | 1,400 |
| | 1,883 |
| | (70 | ) | | 2010 | | 09/30/15 | | 15 to 30 Years |
|
| | | | | | | | | | | | | | | | | | | | | | | | | | | | | | | | | |
| Pizza Hut | Lebanon, PA | | (a) | | 616 |
| | 316 |
| | — |
| | 176 |
| | 616 |
| | 492 |
| | 1,108 |
| | (348 | ) | | 1980 | | 01/30/06 | | 15 to 20 Years |
| Pizza Hut | Mechanicsburg, PA | | (a) | | 801 |
| | 481 |
| | — |
| | — |
| | 801 |
| | 481 |
| | 1,282 |
| | (363 | ) | | 1995 | | 01/30/06 | | 15 to 20 Years |
| Pizza Hut | Harrisburg, PA | | (a) | | 611 |
| | 239 |
| | — |
| | — |
| | 611 |
| | 239 |
| | 850 |
| | (283 | ) | | 1978 | | 01/30/06 | | 15 to 20 Years |
| Pizza Hut | Harrisburg, PA | | (a) | | 423 |
| | 307 |
| | — |
| | — |
| | 423 |
| | 307 |
| | 730 |
| | (189 | ) | | 1973 | | 01/30/06 | | 15 to 20 Years |
| Pizza Hut | Lancaster, PA | | (a) | | 308 |
| | 161 |
| | — |
| | — |
| | 308 |
| | 161 |
| | 469 |
| | (127 | ) | | 1977 | | 07/25/06 | | 15 to 30 Years |
| Pizza Hut | Hyattsville, MD | | (a) | | 702 |
| | 245 |
| | — |
| | — |
| | 702 |
| | 245 |
| | 947 |
| | (184 | ) | | 1985 | | 11/27/06 | | 15 to 20 Years |
| Pizza Hut | Walkersville, MD | | (a) | | 381 |
| | 238 |
| | — |
| | 68 |
| | 381 |
| | 306 |
| | 687 |
| | (182 | ) | | 1985 | | 11/27/06 | | 11 to 20 Years |
| Pizza Hut | Hagerstown, MD | | (a) | | 546 |
| | 342 |
| | — |
| | 68 |
| | 546 |
| | 410 |
| | 956 |
| | (246 | ) | | 1975 | | 11/27/06 | | 11 to 20 Years |
| Pizza Hut | Silver Spring, MD | | (a) | | 1,008 |
| | 251 |
| | — |
| | — |
| | 1,008 |
| | 251 |
| | 1,259 |
| | (202 | ) | | 1983 | | 11/27/06 | | 15 to 20 Years |
| Pizza Hut | Frederick, MD | | (a) | | 440 |
| | 236 |
| | — |
| | 5 |
| | 440 |
| | 241 |
| | 681 |
| | (153 | ) | | 1977 | | 11/27/06 | | 11 to 20 Years |
| Pizza Hut | Bowie, MD | | (a) | | 333 |
| | 173 |
| | — |
| | 200 |
| | 333 |
| | 373 |
| | 706 |
| | (257 | ) | | 1983 | | 11/27/06 | | 15 to 20 Years |
| Pizza Hut | Thurmont, MD | | (a) | | 857 |
| | 307 |
| | — |
| | 68 |
| | 857 |
| | 375 |
| | 1,232 |
| | (245 | ) | | 1985 | | 11/27/06 | | 11 to 20 Years |
| Pizza Hut | Lanham, MD | | (a) | | 302 |
| | 193 |
| | — |
| | 200 |
| | 302 |
| | 393 |
| | 695 |
| | (211 | ) | | 1980 | | 11/27/06 | | 13 to 20 Years |
| Pizza Hut | Reston, VA | | (a) | | 1,033 |
| | 193 |
| | — |
| | — |
| | 1,033 |
| | 193 |
| | 1,226 |
| | (154 | ) | | 1977 | | 11/27/06 | | 15 to 20 Years |
| Pizza Hut | Emmitsburg, MD | | (a) | | 141 |
| | 182 |
| | — |
| | — |
| | 141 |
| | 182 |
| | 323 |
| | (115 | ) | | 1981 | | 11/27/06 | | 15 to 20 Years |
| Pizza Hut | Clinton, MD | | (a) | | 300 |
| | 193 |
| | — |
| | 200 |
| | 300 |
| | 393 |
| | 693 |
| | (208 | ) | | 1980 | | 11/27/06 | | 13 to 20 Years |
| Pizza Hut | Upper Marlboro, MD | | (a) | | 290 |
| | 172 |
| | — |
| | — |
| | 290 |
| | 172 |
| | 462 |
| | (151 | ) | | 1983 | | 11/27/06 | | 15 to 20 Years |
| Pizza Hut | Burlington, IA | | (a) | | 318 |
| | 484 |
| | — |
| | — |
| | 318 |
| | 484 |
| | 802 |
| | (265 | ) | | 2006 | | 12/04/06 | | 15 to 30 Years |
| Pizza Hut | Alexandria, VA | | (a) | | 1,024 |
| | 202 |
| | — |
| | 12 |
| | 1,024 |
| | 214 |
| | 1,238 |
| | (164 | ) | | 1979 | | 12/19/06 | | 11 to 20 Years |
| Pizza Hut | Culpeper, VA | | (a) | | 367 |
| | 169 |
| | — |
| | — |
| | 367 |
| | 169 |
| | 536 |
| | (128 | ) | | 1977 | | 12/19/06 | | 15 to 20 Years |
| Pizza Hut | Warrenton, VA | | (a) | | 378 |
| | 254 |
| | — |
| | — |
| | 378 |
| | 254 |
| | 632 |
| | (188 | ) | | 1985 | | 12/19/06 | | 14 to 20 Years |
| Pizza Hut | Powell, TN | | (a) | | 252 |
| | 377 |
| | — |
| | 176 |
| | 252 |
| | 553 |
| | 805 |
| | (278 | ) | | 1982 | | 11/02/07 | | 15 to 30 Years |
| Pizza Hut | Sweetwater, TN | | (a) | | 231 |
| | 307 |
| | — |
| | — |
| | 231 |
| | 307 |
| | 538 |
| | (171 | ) | | 1979 | | 11/02/07 | | 15 to 30 Years |
| Pizza Hut | Knoxville, TN | | (a) | | 296 |
| | 343 |
| | — |
| | 176 |
| | 296 |
| | 519 |
| | 815 |
| | (253 | ) | | 1978 | | 11/02/07 | | 15 to 30 Years |
| Pizza Hut | Chattanooga, TN | | (a) | | 352 |
| | 246 |
| | — |
| | — |
| | 352 |
| | 246 |
| | 598 |
| | (198 | ) | | 1984 | | 11/02/07 | | 15 to 30 Years |
| Pizza Hut | Clinton, TN | | (a) | | 417 |
| | 293 |
| | — |
| | — |
| | 417 |
| | 293 |
| | 710 |
| | (190 | ) | | 1994 | | 11/02/07 | | 15 to 30 Years |
| Pizza Hut | Ringgold, GA | | (a) | | 387 |
| | 374 |
| | — |
| | — |
| | 387 |
| | 374 |
| | 761 |
| | (196 | ) | | 1990 | | 11/02/07 | | 15 to 30 Years |
| Pizza Hut | LaFayette, GA | | (a) | | 246 |
| | 434 |
| | — |
| | 176 |
| | 246 |
| | 610 |
| | 856 |
| | (292 | ) | | 1991 | | 11/02/07 | | 15 to 30 Years |
| Pizza Hut | Trenton, GA | | (a) | | 300 |
| | 227 |
| | — |
| | — |
| | 300 |
| | 227 |
| | 527 |
| | (157 | ) | | 1991 | | 11/02/07 | | 15 to 30 Years |
| Pizza Hut | Knoxville, TN | | (a) | | 172 |
| | 700 |
| | — |
| | — |
| | 172 |
| | 700 |
| | 872 |
| | (278 | ) | | 1991 | | 11/02/07 | | 15 to 30 Years |
| Pizza Hut | Alcoa, TN | | (a) | | 228 |
| | 219 |
| | — |
| | — |
| | 228 |
| | 219 |
| | 447 |
| | (125 | ) | | 1982 | | 11/02/07 | | 15 to 30 Years |
| Pizza Hut | Chatsworth, GA | | (a) | | 213 |
| | 558 |
| | — |
| | — |
| | 213 |
| | 558 |
| | 771 |
| | (258 | ) | | 1979 | | 11/02/07 | | 15 to 30 Years |
SPIRIT REALTY CAPITAL, INC.
Schedule III Real Estate and
Accumulated Depreciation
(Amounts in thousands)
|
| | | | | | | | | | | | | | | | | | | | | | | | | | | | | | | | | |
| Manufacturing | | | | | | | | | | | | | | | | | | | | | | |
| | Annapolis Junction, MD | | (a) | | 2,245 |
| | 1,105 |
| | (1,535 | ) | | (547 | ) | | 710 |
| | 558 |
| | 1,268 |
| | (231 | ) | | 1930 | | 09/29/06 | | 15 to 30 Years |
| | Avila, IN | | (c) | | 642 |
| | 4,958 |
| | — |
| | — |
| | 642 |
| | 4,958 |
| | 5,600 |
| | (380 | ) | | 1990 | | 12/17/14 | | 15 to 30 Years |
| | Byron, IL | | (a) | | 734 |
| | 4,334 |
| | — |
| | — |
| | 734 |
| | 4,334 |
| | 5,068 |
| | (2,243 | ) | | 1965 | | 12/29/06 | | 10 to 20 Years |
| | Dublin, VA | | (a) | | 491 |
| | 1,401 |
| | — |
| | — |
| | 491 |
| | 1,401 |
| | 1,892 |
| | (839 | ) | | 1985 | | 12/11/06 | | 15 to 20 Years |
| | Edon, OH | | (c) | | 642 |
| | 2,649 |
| | (268 | ) | | (1,663 | ) | | 374 |
| | 986 |
| | 1,360 |
| | — |
| | 1953 | | 02/21/07 | | 14 to 20 Years |
| | Fremont, IN | | (a) | | 427 |
| | 2,176 |
| | — |
| | — |
| | 427 |
| | 2,176 |
| | 2,603 |
| | (824 | ) | | 1960 | | 02/21/07 | | 14 to 30 Years |
| | Fulton, NY | | (c) | | 445 |
| | 6,113 |
| | — |
| | 35 |
| | 445 |
| | 6,148 |
| | 6,593 |
| | (32 | ) | | 1983 | | 10/27/16 | | 7 to 40 Years |
| | Houston, TX | | (c) | | 2,421 |
| | 15,723 |
| | (1,504 | ) | | (10,089 | ) | | 917 |
| | 5,634 |
| | 6,551 |
| | — |
| | 1983 | | 07/17/13 | | 2 to 35 Years |
| | Loudon, TN | | (c) | | 1,188 |
| | 4,904 |
| | — |
| | — |
| | 1,188 |
| | 4,904 |
| | 6,092 |
| | (1,932 | ) | | 1992 | | 03/31/08 | | 15 to 30 Years |
| | Merced, CA | | (c) | | 3,456 |
| | 9,007 |
| | — |
| | — |
| | 3,456 |
| | 9,007 |
| | 12,463 |
| | (3,043 | ) | | 1998 | | 03/31/08 | | 15 to 30 Years |
| | Meridian, CT | | (c) | | 1,766 |
| | 7,848 |
| | — |
| | — |
| | 1,766 |
| | 7,848 |
| | 9,614 |
| | (637 | ) | | 1997 | | 12/17/14 | | 15 to 30 Years |
| | Minerva, OH | | (c) | | 649 |
| | 3,920 |
| | (217 | ) | | (770 | ) | | 432 |
| | 3,150 |
| | 3,582 |
| | (1,747 | ) | | 1919 | | 02/21/07 | | 8 to 20 Years |
| | New Castle, PA | | (c) | | 1,084 |
| | 5,507 |
| | — |
| | — |
| | 1,084 |
| | 5,507 |
| | 6,591 |
| | (961 | ) | | 1999 | | 07/17/13 | | 8 to 26 Years |
| | Pawcatuck, CT | | (c) | | 2,736 |
| | 9,218 |
| | — |
| | 36 |
| | 2,736 |
| | 9,254 |
| | 11,990 |
| | (76 | ) | | 1969 | | 10/27/16 | | 5 to 40 Years |
| | Pulaski, VA | | (a) | | 333 |
| | 1,536 |
| | — |
| | — |
| | 333 |
| | 1,536 |
| | 1,869 |
| | (869 | ) | | 1967 | | 12/11/06 | | 15 to 20 Years |
| | Royal Oak, MI | | (a) | | 3,426 |
| | 7,071 |
| | — |
| | — |
| | 3,426 |
| | 7,071 |
| | 10,497 |
| | (2,577 | ) | | 1952 | | 03/10/06 | | 15 to 30 Years |
| | Scottdale, PA | | (b) | | 607 |
| | 11,008 |
| | (203 | ) | | (2,239 | ) | | 404 |
| | 8,769 |
| | 9,173 |
| | (5,123 | ) | | 1959 | | 12/28/06 | | 14 to 20 Years |
| | Sidney, OH | | (a) | | 921 |
| | 4,177 |
| | — |
| | — |
| | 921 |
| | 4,177 |
| | 5,098 |
| | (2,283 | ) | | 1987 | | 12/22/05 | | 12 to 20 Years |
| | Troy, MI | | (a) | | 1,128 |
| | 947 |
| | — |
| | — |
| | 1,128 |
| | 947 |
| | 2,075 |
| | (351 | ) | | 1952 | | 03/10/06 | | 15 to 30 Years |
| | Winston-Salem, NC | | (b) | | 927 |
| | 3,455 |
| | — |
| | — |
| | 927 |
| | 3,455 |
| | 4,382 |
| | (597 | ) | | 1987 | | 07/17/13 | | 5 to 40 Years |
|
| | | | | | | | | | | | | | | | | | | | | | | | | | | | | | | | | |
| Dollar Stores | | | | | | | | | | | | | | | | | | | | | | |
| | Adair, OK | | (b) | | 264 |
| | 855 |
| | — |
| | — |
| | 264 |
| | 855 |
| | 1,119 |
| | (88 | ) | | 2012 | | 10/29/13 | | 13 to 40 Years |
| | Alpena, AR | | (c) | | 359 |
| | 600 |
| | — |
| | — |
| | 359 |
| | 600 |
| | 959 |
| | (61 | ) | | 2014 | | 12/15/14 | | 14 to 40 Years |
| | Altus, OK | | (b) | | 315 |
| | 918 |
| | — |
| | — |
| | 315 |
| | 918 |
| | 1,233 |
| | (91 | ) | | 2012 | | 10/29/13 | | 13 to 40 Years |
| | Anderson, IN | | (c) | | 359 |
| | 781 |
| | — |
| | — |
| | 359 |
| | 781 |
| | 1,140 |
| | (55 | ) | | 2015 | | 03/20/15 | | 14 to 40 Years |
| | Ardmore, TN | | (c) | | 950 |
| | 1,847 |
| | — |
| | — |
| | 950 |
| | 1,847 |
| | 2,797 |
| | (304 | ) | | 2005 | | 07/17/13 | | 8 to 40 Years |
| | Atoka, OK | | (b) | | 466 |
| | 1,304 |
| | — |
| | — |
| | 466 |
| | 1,304 |
| | 1,770 |
| | (130 | ) | | 2012 | | 10/29/13 | | 13 to 40 Years |
| | Aztec, NM | | (c) | | 548 |
| | 623 |
| | — |
| | — |
| | 548 |
| | 623 |
| | 1,171 |
| | (53 | ) | | 2014 | | 03/31/15 | | 14 to 40 Years |
| | Bentonia, MS | | (a) | | 227 |
| | 745 |
| | — |
| | — |
| | 227 |
| | 745 |
| | 972 |
| | (43 | ) | | 2014 | | 06/22/15 | | 13 to 40 Years |
| | Birch Tree, MO | | (c) | | 252 |
| | 659 |
| | — |
| | — |
| | 252 |
| | 659 |
| | 911 |
| | (55 | ) | | 2014 | | 03/31/15 | | 14 to 40 Years |
| | Bloomfield, NM | | (c) | | 409 |
| | 663 |
| | — |
| | — |
| | 409 |
| | 663 |
| | 1,072 |
| | (46 | ) | | 2015 | | 05/14/15 | | 14 to 40 Years |
| | Buckatunna, MS | | (c) | | 199 |
| | 798 |
| | — |
| | — |
| | 199 |
| | 798 |
| | 997 |
| | (38 | ) | | 2014 | | 09/24/15 | | 13 to 40 Years |
| | Bulls Gap, TN | | (c) | | 467 |
| | 762 |
| | — |
| | — |
| | 467 |
| | 762 |
| | 1,229 |
| | (54 | ) | | 2014 | | 03/20/15 | | 14 to 40 Years |
| | Byng, OK | | (a) | | 205 |
| | 646 |
| | — |
| | — |
| | 205 |
| | 646 |
| | 851 |
| | (37 | ) | | 2015 | | 07/14/15 | | 14 to 40 Years |
| | Cabot, AR | | (a) | | 132 |
| | 404 |
| | — |
| | — |
| | 132 |
| | 404 |
| | 536 |
| | (115 | ) | | 1970 | | 03/31/14 | | 1 to 15 Years |
| | Cameron, OK | | (c) | | 312 |
| | 710 |
| | — |
| | — |
| | 312 |
| | 710 |
| | 1,022 |
| | (52 | ) | | 2014 | | 12/15/14 | | 14 to 40 Years |
| | Center Ridge, AR | | (c) | | 313 |
| | 595 |
| | — |
| | — |
| | 313 |
| | 595 |
| | 908 |
| | (61 | ) | | 2014 | | 12/15/14 | | 14 to 40 Years |
| | Centre, AL | | (b) | | 233 |
| | 767 |
| | — |
| | — |
| | 233 |
| | 767 |
| | 1,000 |
| | (83 | ) | | 2011 | | 09/17/13 | | 12 to 40 Years |
| | Claremore, OK | | (b) | | 243 |
| | 928 |
| | — |
| | — |
| | 243 |
| | 928 |
| | 1,171 |
| | (92 | ) | | 2012 | | 10/29/13 | | 13 to 40 Years |
| | Clear Lake, IA | | (c) | | 374 |
| | 760 |
| | — |
| | — |
| | 374 |
| | 760 |
| | 1,134 |
| | (52 | ) | | 2015 | | 05/14/15 | | 14 to 40 Years |
| | Clovis, NM | | (c) | | 311 |
| | 659 |
| | — |
| | — |
| | 311 |
| | 659 |
| | 970 |
| | (46 | ) | | 2015 | | 05/14/15 | | 14 to 40 Years |
|
| | | | | | | | | | | | | | | | | | | | | | | | | |
| | | | | | Initial Cost to Company | | Cost Capitalized Subsequent to Acquisition including impairment | | Gross Amount at December 31, 2016 (d) 2017 (g) | | | | | | | | |
| Concept | City, State | | Encumbrances (e) | | Land and Improvements | | Buildings and Improvements | | Land and Improvements | | Buildings and Improvements | | Land and Improvements | | Buildings and Improvements | | Total | | Final Accumulated Depreciation | | Date of Construction | | Date Acquired | | Life in which depreciation in latest Statement of Operations is computed |
Description | | Encumbrances (e)
| | Land and
Improvements
| | Buildings and
Improvements
| | Improvements/
Land
| | Improvements/
building
| | Land and
Improvements
| | Buildings and
Improvements
| | Total | | Final
Accum
| | Date of
Construction
| | Date
Acquired
| |
|
| | | | | | | | | | | | | | | | | | | | | | | | | | | | | | | | | |
| | Cowarts, AL | | (b) | | 396 |
| | 836 |
| | — |
| | — |
| | 396 |
| | 836 |
| | 1,232 |
| | (89 | ) | | 2011 | | 09/17/13 | | 12 to 40 Years |
| | Creal Springs, IL | | (c) | | 261 |
| | 653 |
| | — |
| | — |
| | 261 |
| | 653 |
| | 914 |
| | (51 | ) | | 2014 | | 04/27/15 | | 14 to 40 Years |
| | Crossville, TN | | (c) | | 1,041 |
| | 1,871 |
| | — |
| | — |
| | 1,041 |
| | 1,871 |
| | 2,912 |
| | (301 | ) | | 2006 | | 07/17/13 | | 7 to 40 Years |
| | Crossville, TN | | (b) | | 264 |
| | 849 |
| | — |
| | — |
| | 264 |
| | 849 |
| | 1,113 |
| | (90 | ) | | 2011 | | 09/17/13 | | 12 to 40 Years |
| | Crystal City, TX | | (b) | | 295 |
| | 939 |
| | — |
| | — |
| | 295 |
| | 939 |
| | 1,234 |
| | (93 | ) | | 2012 | | 10/29/13 | | 13 to 40 Years |
| | De Soto, KS | | (b) | | 301 |
| | 1,049 |
| | — |
| | — |
| | 301 |
| | 1,049 |
| | 1,350 |
| | (122 | ) | | 2012 | | 10/29/13 | | 13 to 40 Years |
| | Des Moines, IA | | (c) | | 354 |
| | 807 |
| | — |
| | — |
| | 354 |
| | 807 |
| | 1,161 |
| | (61 | ) | | 2014 | | 03/20/15 | | 8 to 40 Years |
| | Drexel, MO | | (c) | | 184 |
| | 727 |
| | — |
| | — |
| | 184 |
| | 727 |
| | 911 |
| | (48 | ) | | 2015 | | 05/14/15 | | 14 to 40 Years |
| | Duluth, MN | | (c) | | 422 |
| | 869 |
| | — |
| | — |
| | 422 |
| | 869 |
| | 1,291 |
| | (59 | ) | | 2015 | | 05/12/15 | | 9 to 40 Years |
| | Eastaboga, AL | | (b) | | 223 |
| | 937 |
| | — |
| | — |
| | 223 |
| | 937 |
| | 1,160 |
| | (97 | ) | | 2011 | | 09/17/13 | | 12 to 40 Years |
| | Emporia, KS | | (b) | | 292 |
| | 1,176 |
| | — |
| | — |
| | 292 |
| | 1,176 |
| | 1,468 |
| | (124 | ) | | 2012 | | 10/29/13 | | 13 to 40 Years |
| | Enterprise, AL | | (b) | | 255 |
| | 803 |
| | — |
| | — |
| | 255 |
| | 803 |
| | 1,058 |
| | (84 | ) | | 2011 | | 09/17/13 | | 12 to 40 Years |
| | Evart, MI | | (c) | | 306 |
| | 703 |
| | — |
| | — |
| | 306 |
| | 703 |
| | 1,009 |
| | (51 | ) | | 2014 | | 03/20/15 | | 14 to 40 Years |
| | Fruita, CO | | (b) | | 255 |
| | 1,025 |
| | — |
| | — |
| | 255 |
| | 1,025 |
| | 1,280 |
| | (106 | ) | | 2012 | | 10/29/13 | | 13 to 40 Years |
| | Gore, OK | | (b) | | 182 |
| | 924 |
| | — |
| | — |
| | 182 |
| | 924 |
| | 1,106 |
| | (98 | ) | | 2012 | | 10/29/13 | | 13 to 40 Years |
| | Hill City, KS | | (b) | | 243 |
| | 815 |
| | — |
| | — |
| | 243 |
| | 815 |
| | 1,058 |
| | (98 | ) | | 2012 | | 10/29/13 | | 13 to 40 Years |
| | Hobart, OK | | (b) | | 230 |
| | 910 |
| | — |
| | — |
| | 230 |
| | 910 |
| | 1,140 |
| | (99 | ) | | 2012 | | 10/29/13 | | 13 to 40 Years |
| | Hobbs, NM | | (b) | | 405 |
| | 949 |
| | — |
| | — |
| | 405 |
| | 949 |
| | 1,354 |
| | (113 | ) | | 2012 | | 10/29/13 | | 13 to 40 Years |
| | Hurley, MS | | (a) | | 412 |
| | 1,084 |
| | — |
| | — |
| | 412 |
| | 1,084 |
| | 1,496 |
| | (62 | ) | | 2013 | | 06/22/15 | | 13 to 40 Years |
| | Jasper, AL | | (b) | | 365 |
| | 1,052 |
| | — |
| | — |
| | 365 |
| | 1,052 |
| | 1,417 |
| | (110 | ) | | 2011 | | 09/17/13 | | 12 to 40 Years |
| | Keota, OK | | (c) | | 215 |
| | 687 |
| | — |
| | — |
| | 215 |
| | 687 |
| | 902 |
| | (55 | ) | | 2014 | | 12/15/14 | | 14 to 40 Years |
| | Ketchum, OK | | (b) | | 297 |
| | 760 |
| | — |
| | — |
| | 297 |
| | 760 |
| | 1,057 |
| | (96 | ) | | 2012 | | 10/29/13 | | 13 to 40 Years |
| | Kinross/Kincheloe, MI | | (c) | | 317 |
| | 626 |
| | — |
| | — |
| | 317 |
| | 626 |
| | 943 |
| | (54 | ) | | 2014 | | 03/20/15 | | 14 to 40 Years |
| | La Cygne, KS | | (b) | | 120 |
| | 833 |
| | — |
| | — |
| | 120 |
| | 833 |
| | 953 |
| | (86 | ) | | 2012 | | 10/29/13 | | 13 to 40 Years |
| | La Plata, MO | | (c) | | 283 |
| | 653 |
| | — |
| | — |
| | 283 |
| | 653 |
| | 936 |
| | (51 | ) | | 2014 | | 04/27/15 | | 14 to 40 Years |
| | Lakeview, IA | | (c) | | 251 |
| | 568 |
| | — |
| | — |
| | 251 |
| | 568 |
| | 819 |
| | (42 | ) | | 2015 | | 04/27/15 | | 14 to 40 Years |
| | Lakewood, OH | | (c) | | 522 |
| | 2,053 |
| | — |
| | — |
| | 522 |
| | 2,053 |
| | 2,575 |
| | (251 | ) | | 1996 | | 07/17/13 | | 3 to 35 Years |
| | Las Cruces, NM | | (b) | | 452 |
| | 900 |
| | — |
| | — |
| | 452 |
| | 900 |
| | 1,352 |
| | (104 | ) | | 2012 | | 10/29/13 | | 13 to 40 Years |
| | Laurel, MS | | (a) | | 432 |
| | 705 |
| | — |
| | — |
| | 432 |
| | 705 |
| | 1,137 |
| | (48 | ) | | 2012 | | 06/22/15 | | 11 to 40 Years |
| | Livingston, TN | | (c) | | 1,073 |
| | 1,889 |
| | — |
| | — |
| | 1,073 |
| | 1,889 |
| | 2,962 |
| | (333 | ) | | 2006 | | 07/17/13 | | 7 to 40 Years |
| | Los Lunas, NM | | (c) | | 282 |
| | 740 |
| | — |
| | — |
| | 282 |
| | 740 |
| | 1,022 |
| | (57 | ) | | 2015 | | 05/14/15 | | 14 to 40 Years |
| | Maben, MS | | (c) | | 263 |
| | 734 |
| | — |
| | — |
| | 263 |
| | 734 |
| | 997 |
| | (41 | ) | | 2014 | | 09/24/15 | | 13 to 40 Years |
| | Mansfield, OH | | (c) | | 288 |
| | 825 |
| | — |
| | — |
| | 288 |
| | 825 |
| | 1,113 |
| | (52 | ) | | 2014 | | 04/28/15 | | 9 to 40 Years |
| | Meridian, MS | | (c) | | 211 |
| | 934 |
| | — |
| | — |
| | 211 |
| | 934 |
| | 1,145 |
| | (43 | ) | | 2014 | | 09/24/15 | | 14 to 40 Years |
| | Mesa, AZ | | (c) | | 734 |
| | 2 |
| | 103 |
| | 630 |
| | 837 |
| | 632 |
| | 1,469 |
| | (38 | ) | | 1955 | | 11/13/14 | | 10 to 50 Years |
| | Nashville, AR | | (c) | | 519 |
| | 697 |
| | (153 | ) | | (255 | ) | | 366 |
| | 442 |
| | 808 |
| | — |
| | 1995 | | 03/31/14 | | 1 to 20 Years |
| | Okay, OK | | (b) | | 200 |
| | 901 |
| | — |
| | — |
| | 200 |
| | 901 |
| | 1,101 |
| | (93 | ) | | 2012 | | 10/29/13 | | 13 to 40 Years |
| | Oppelo, AR | | (a) | | 354 |
| | 553 |
| | — |
| | — |
| | 354 |
| | 553 |
| | 907 |
| | (42 | ) | | 2015 | | 07/14/15 | | 14 to 40 Years |
| | Ord, NE | | (b) | | 222 |
| | 1,010 |
| | — |
| | — |
| | 222 |
| | 1,010 |
| | 1,232 |
| | (107 | ) | | 2012 | | 10/29/13 | | 13 to 40 Years |
| | Orrville, AL | | (b) | | 192 |
| | 826 |
| | — |
| | — |
| | 192 |
| | 826 |
| | 1,018 |
| | (95 | ) | | 2011 | | 09/17/13 | | 12 to 40 Years |
|
| | | | | | | | | | | | | | | | | | | | | | | | | | | | | | | | | |
| Pizza Hut | Crossville, TN | | (a) | | 220 |
| | 288 |
| | — |
| | 176 |
| | 220 |
| | 464 |
| | 684 |
| | (245 | ) | | 1978 | | 11/02/07 | | 15 to 30 Years |
| Pizza Hut | Harriman, TN | | (a) | | 314 |
| | 143 |
| | — |
| | 176 |
| | 314 |
| | 319 |
| | 633 |
| | (194 | ) | | 1979 | | 11/02/07 | | 15 to 30 Years |
| Pizza Hut | Soddy Daisy, TN | | (a) | | 316 |
| | 405 |
| | — |
| | — |
| | 316 |
| | 405 |
| | 721 |
| | (214 | ) | | 1989 | | 11/02/07 | | 15 to 30 Years |
| Pizza Hut | Athens, TN | | (a) | | 197 |
| | 341 |
| | — |
| | 176 |
| | 197 |
| | 517 |
| | 714 |
| | (262 | ) | | 1977 | | 11/02/07 | | 15 to 30 Years |
| Pizza Hut | Alcoa, TN | | (a) | | 483 |
| | 318 |
| | — |
| | — |
| | 483 |
| | 318 |
| | 801 |
| | (188 | ) | | 1978 | | 11/02/07 | | 15 to 30 Years |
| Pizza Hut | Dayton, TN | | (a) | | 308 |
| | 291 |
| | — |
| | 176 |
| | 308 |
| | 467 |
| | 775 |
| | (244 | ) | | 1979 | | 11/02/07 | | 15 to 30 Years |
| Pizza Hut | Kimball, TN | | (a) | | 367 |
| | 283 |
| | — |
| | 176 |
| | 367 |
| | 459 |
| | 826 |
| | (247 | ) | | 1987 | | 11/02/07 | | 15 to 30 Years |
| Pizza Hut | Duluth, MN | | (a) | | 74 |
| | 423 |
| | — |
| | — |
| | 74 |
| | 423 |
| | 497 |
| | (148 | ) | | 1915 | | 05/24/05 | | 15 to 30 Years |
| Pizza Hut | Lakeville, MN | | (a) | | 342 |
| | 439 |
| | — |
| | 80 |
| | 342 |
| | 519 |
| | 861 |
| | (196 | ) | | 1988 | | 05/24/05 | | 15 to 30 Years |
| Pizza Hut | Woodbury, MN | | (a) | | 555 |
| | 411 |
| | (146 | ) | | (16 | ) | | 409 |
| | 395 |
| | 804 |
| | (162 | ) | | 1987 | | 05/24/05 | | 15 to 30 Years |
| Planet Fitness | Chicago, IL | | (a) | | 1,009 |
| | 2,965 |
| | — |
| | — |
| | 1,009 |
| | 2,965 |
| | 3,974 |
| | (397 | ) | | 2007 | | 12/09/13 | | 14 to 40 Years |
| Planet Fitness | Phoenix, AZ | | (d) | | 642 |
| | 2,245 |
| | — |
| | — |
| | 642 |
| | 2,245 |
| | 2,887 |
| | (290 | ) | | 1988 | | 09/30/14 | | 14 to 30 Years |
| Planet Fitness | Mesquite, TX | | (d) | | 601 |
| | 1,770 |
| | — |
| | — |
| | 601 |
| | 1,770 |
| | 2,371 |
| | (191 | ) | | 1986 | | 01/15/16 | | 8 to 30 Years |
| Planet Fitness | Burnsville, MN | | (b) | | 1,461 |
| | 1,597 |
| | — |
| | 22 |
| | 1,461 |
| | 1,619 |
| | 3,080 |
| | (195 | ) | | 1978 | | 04/15/16 | | 8 to 20 Years |
| Popeye's Chicken & Biscuits | Baton Rouge, LA | | (a) | | 565 |
| | 286 |
| | — |
| | — |
| | 565 |
| | 286 |
| | 851 |
| | (251 | ) | | 1991 | | 06/25/04 | | 15 to 20 Years |
| Popeye's Chicken & Biscuits | San Antonio, TX | | (a) | | 517 |
| | 373 |
| | — |
| | — |
| | 517 |
| | 373 |
| | 890 |
| | (221 | ) | | 2002 | | 09/25/06 | | 15 to 30 Years |
| Popeye's Chicken & Biscuits | Tempe, AZ | | (a) | | 480 |
| | 361 |
| | — |
| | — |
| | 480 |
| | 361 |
| | 841 |
| | (211 | ) | | 2003 | | 09/25/06 | | 15 to 30 Years |
| Popeye's Chicken & Biscuits | San Antonio, TX | | (a) | | 349 |
| | 429 |
| | — |
| | — |
| | 349 |
| | 429 |
| | 778 |
| | (289 | ) | | 1983 | | 09/25/06 | | 15 to 20 Years |
| Popeye's Chicken & Biscuits | San Antonio, TX | | (a) | | 428 |
| | 339 |
| | — |
| | — |
| | 428 |
| | 339 |
| | 767 |
| | (205 | ) | | 2001 | | 09/25/06 | | 15 to 30 Years |
| Popeye's Chicken & Biscuits | San Antonio, TX | | (a) | | 539 |
| | 300 |
| | — |
| | — |
| | 539 |
| | 300 |
| | 839 |
| | (221 | ) | | 2001 | | 09/25/06 | | 15 to 30 Years |
| Popeye's Chicken & Biscuits | Houston, TX | | (a) | | 592 |
| | 302 |
| | — |
| | — |
| | 592 |
| | 302 |
| | 894 |
| | (197 | ) | | 1979 | | 09/28/06 | | 15 to 20 Years |
| Popeye's Chicken & Biscuits | Lafayette, LA | | (a) | | 300 |
| | 779 |
| | — |
| | — |
| | 300 |
| | 779 |
| | 1,079 |
| | (128 | ) | | 1972 | | 10/30/13 | | 15 to 30 Years |
| Popeye's Chicken & Biscuits | Opelousas, LA | | (a) | | 419 |
| | 659 |
| | — |
| | — |
| | 419 |
| | 659 |
| | 1,078 |
| | (119 | ) | | 1968 | | 10/30/13 | | 15 to 30 Years |
| Popeye's Chicken & Biscuits | Bartlett, TN | | (a) | | 411 |
| | — |
| | — |
| | — |
| | 411 |
| | — |
| | 411 |
| | — |
| | (f) | | 10/30/13 | | (f) |
| Popeye's Chicken & Biscuits | Memphis, TN | | (a) | | 320 |
| | — |
| | — |
| | — |
| | 320 |
| | — |
| | 320 |
| | — |
| | (f) | | 10/30/13 | | (f) |
SPIRIT REALTY CAPITAL, INC.
Schedule III Real Estate and
Accumulated Depreciation
(Amounts in thousands)
|
| | | | | | | | | | | | | | | | | | | | | | | | | |
| | | | | | Initial Cost to Company | | Cost Capitalized Subsequent to Acquisition including impairment | | Gross Amount at December 31, 2016 (d) 2017 (g) | | | | | | | | |
| Concept | City, State | | Encumbrances (e) | | Land and Improvements | | Buildings and Improvements | | Land and Improvements | | Buildings and Improvements | | Land and Improvements | | Buildings and Improvements | | Total | | Final Accumulated Depreciation | | Date of Construction | | Date Acquired | | Life in which depreciation in latest Statement of Operations is computed |
Description | | Encumbrances (e)
| | Land and
Improvements
| | Buildings and
Improvements
| | Improvements/
Land
| | Improvements/
building
| | Land and
Improvements
| | Buildings and
Improvements
| | Total | | Final
Accum
| | Date of
Construction
| | Date
Acquired
| |
|
| | | | | | | | | | | | | | | | | | | | | | | | | | | | | | | | | |
| | Otter Tail, MN | | (c) | | 338 |
| | 791 |
| | — |
| | — |
| | 338 |
| | 791 |
| | 1,129 |
| | (52 | ) | | 2014 | | 03/20/15 | | 14 to 40 Years |
| | Pagosa Springs, CO | | (b) | | 253 |
| | 1,031 |
| | — |
| | — |
| | 253 |
| | 1,031 |
| | 1,284 |
| | (102 | ) | | 2012 | | 10/29/13 | | 13 to 40 Years |
| | Pineville, MO | | (c) | | 253 |
| | 699 |
| | — |
| | — |
| | 253 |
| | 699 |
| | 952 |
| | (58 | ) | | 2014 | | 03/31/15 | | 14 to 40 Years |
| | Pleasant Hope, MO | | (c) | | 263 |
| | 650 |
| | — |
| | — |
| | 263 |
| | 650 |
| | 913 |
| | (49 | ) | | 2014 | | 05/14/15 | | 14 to 40 Years |
| | Quinton, OK | | (c) | | 245 |
| | 683 |
| | — |
| | — |
| | 245 |
| | 683 |
| | 928 |
| | (52 | ) | | 2014 | | 12/15/14 | | 14 to 40 Years |
| | Red Oak, OK | | (a) | | 245 |
| | 675 |
| | — |
| | — |
| | 245 |
| | 675 |
| | 920 |
| | (37 | ) | | 2015 | | 07/14/15 | | 14 to 40 Years |
| | Rehobeth, AL | | (b) | | 259 |
| | 774 |
| | — |
| | — |
| | 259 |
| | 774 |
| | 1,033 |
| | (82 | ) | | 2011 | | 09/17/13 | | 12 to 40 Years |
| | Salem, MO | | (c) | | 410 |
| | 778 |
| | — |
| | — |
| | 410 |
| | 778 |
| | 1,188 |
| | (61 | ) | | 2015 | | 04/27/15 | | 14 to 40 Years |
| | Sand Springs, OK | | (b) | | 396 |
| | 1,039 |
| | — |
| | — |
| | 396 |
| | 1,039 |
| | 1,435 |
| | (109 | ) | | 2012 | | 10/29/13 | | 13 to 40 Years |
| | Silt, CO | | (b) | | 334 |
| | 894 |
| | — |
| | — |
| | 334 |
| | 894 |
| | 1,228 |
| | (89 | ) | | 2012 | | 10/29/13 | | 13 to 40 Years |
| | Spiro, OK | | (b) | | 263 |
| | 1,099 |
| | — |
| | — |
| | 263 |
| | 1,099 |
| | 1,362 |
| | (125 | ) | | 2012 | | 10/29/13 | | 13 to 40 Years |
| | Stigler, OK | | (b) | | 610 |
| | 809 |
| | — |
| | — |
| | 610 |
| | 809 |
| | 1,419 |
| | (99 | ) | | 2012 | | 10/29/13 | | 13 to 40 Years |
| | Tallassee, AL | | (b) | | 141 |
| | 895 |
| | — |
| | — |
| | 141 |
| | 895 |
| | 1,036 |
| | (87 | ) | | 2011 | | 09/17/13 | | 12 to 40 Years |
| | Temple, TX | | (b) | | 414 |
| | 897 |
| | — |
| | — |
| | 414 |
| | 897 |
| | 1,311 |
| | (98 | ) | | 2012 | | 10/29/13 | | 13 to 40 Years |
| | Texarkana, AR | | (a) | | 303 |
| | 201 |
| | — |
| | — |
| | 303 |
| | 201 |
| | 504 |
| | (43 | ) | | 1988 | | 03/31/14 | | 4 to 20 Years |
| | Topeka, KS | | (b) | | 313 |
| | 882 |
| | — |
| | — |
| | 313 |
| | 882 |
| | 1,195 |
| | (99 | ) | | 2012 | | 10/29/13 | | 13 to 40 Years |
| | Tornillo, TX | | (b) | | 255 |
| | 818 |
| | — |
| | — |
| | 255 |
| | 818 |
| | 1,073 |
| | (96 | ) | | 2012 | | 10/29/13 | | 13 to 40 Years |
| | Walters, OK | | (b) | | 173 |
| | 1,042 |
| | — |
| | — |
| | 173 |
| | 1,042 |
| | 1,215 |
| | (105 | ) | | 2012 | | 10/29/13 | | 13 to 40 Years |
| | Western Grove, AR | | (c) | | 391 |
| | 595 |
| | — |
| | — |
| | 391 |
| | 595 |
| | 986 |
| | (62 | ) | | 2014 | | 12/15/14 | | 14 to 40 Years |
| | Wetumpka, AL | | (b) | | 303 |
| | 784 |
| | — |
| | — |
| | 303 |
| | 784 |
| | 1,087 |
| | (87 | ) | | 2011 | | 09/17/13 | | 12 to 40 Years |
| | Wilburton, OK | | (c) | | 522 |
| | 887 |
| | — |
| | — |
| | 522 |
| | 887 |
| | 1,409 |
| | (73 | ) | | 2014 | | 12/15/14 | | 14 to 40 Years |
|
| | | | | | | | | | | | | | | | | | | | | | | | | | | | | | | | | |
| Popeye's Chicken & Biscuits | Holly Springs, MS | | (a) | | 116 |
| | — |
| | — |
| | — |
| | 116 |
| | — |
| | 116 |
| | — |
| | (f) | | 10/30/13 | | (f) |
| Popeye's Chicken & Biscuits | Collierville, TN | | (a) | | 539 |
| | — |
| | — |
| | — |
| | 539 |
| | — |
| | 539 |
| | — |
| | (f) | | 10/30/13 | | (f) |
| Popeye's Chicken & Biscuits | Nashville, TN | | (a) | | 264 |
| | — |
| | — |
| | — |
| | 264 |
| | — |
| | 264 |
| | — |
| | (f) | | 10/30/13 | | (f) |
| Popeye's Chicken & Biscuits | Horn Lake, MS | | (a) | | 231 |
| | — |
| | — |
| | — |
| | 231 |
| | — |
| | 231 |
| | — |
| | (f) | | 10/30/13 | | (f) |
| Popeye's Chicken & Biscuits | Nashville, TN | | (a) | | 538 |
| | — |
| | — |
| | — |
| | 538 |
| | — |
| | 538 |
| | — |
| | (f) | | 10/30/13 | | (f) |
| Popeye's Chicken & Biscuits | Baton Rouge, LA | | (a) | | 594 |
| | 417 |
| | — |
| | — |
| | 594 |
| | 417 |
| | 1,011 |
| | (331 | ) | | 1979 | | 06/25/04 | | 15 to 20 Years |
| Popeye's Chicken & Biscuits | Port Allen, LA | | (a) | | 521 |
| | 575 |
| | — |
| | — |
| | 521 |
| | 575 |
| | 1,096 |
| | (344 | ) | | 1997 | | 09/24/04 | | 15 to 30 Years |
| Popeye's Chicken & Biscuits | Baton Rouge, LA | | (a) | | 472 |
| | 642 |
| | — |
| | — |
| | 472 |
| | 642 |
| | 1,114 |
| | (319 | ) | | 1987 | | 09/24/04 | | 15 to 30 Years |
| Popeye's Chicken & Biscuits | Miami, FL | | (a) | | 602 |
| | 14 |
| | — |
| | — |
| | 602 |
| | 14 |
| | 616 |
| | (202 | ) | | 1978 | | 09/24/04 | | 10 to 15 Years |
| Popeye's Chicken & Biscuits | Miami, FL | | (a) | | 596 |
| | 105 |
| | — |
| | — |
| | 596 |
| | 105 |
| | 701 |
| | (165 | ) | | 1978 | | 09/24/04 | | 10 to 15 Years |
| Popeye's Chicken & Biscuits | Deerfield Beach, FL | | (a) | | 668 |
| | 295 |
| | — |
| | — |
| | 668 |
| | 295 |
| | 963 |
| | (178 | ) | | 1970 | | 09/24/04 | | 15 to 30 Years |
| Popeye's Chicken & Biscuits | Fort Lauderdale, FL | | (a) | | 601 |
| | 121 |
| | — |
| | — |
| | 601 |
| | 121 |
| | 722 |
| | (218 | ) | | 1984 | | 09/24/04 | | 10 to 15 Years |
| Popeye's Chicken & Biscuits | Pensacola, FL | | (a) | | 860 |
| | 291 |
| | — |
| | — |
| | 860 |
| | 291 |
| | 1,151 |
| | (422 | ) | | 1977 | | 07/28/04 | | 10 to 15 Years |
| Popeye's Chicken & Biscuits | St. Louis, MO | | (a) | | 503 |
| | 651 |
| | — |
| | — |
| | 503 |
| | 651 |
| | 1,154 |
| | (427 | ) | | 1976 | | 09/24/04 | | 15 to 20 Years |
| Popeye's Chicken & Biscuits | St. Louis, MO | | (a) | | 828 |
| | 351 |
| | — |
| | — |
| | 828 |
| | 351 |
| | 1,179 |
| | (332 | ) | | 1986 | | 09/24/04 | | 15 to 20 Years |
| Popeye's Chicken & Biscuits | Fort Pierce, FL | | (a) | | 667 |
| | 184 |
| | — |
| | — |
| | 667 |
| | 184 |
| | 851 |
| | (153 | ) | | 1999 | | 09/24/04 | | 15 to 30 Years |
| Popeye's Chicken & Biscuits | Lauderdale Lakes, FL | | (a) | | 411 |
| | 346 |
| | — |
| | — |
| | 411 |
| | 346 |
| | 757 |
| | (165 | ) | | 1998 | | 12/29/06 | | 15 to 30 Years |
| Primanti Bros. | Avon, IN | | (a) | | 899 |
| | 614 |
| | — |
| | 188 |
| | 899 |
| | 802 |
| | 1,701 |
| | (123 | ) | | 2014 | | 10/31/14 | | 14 to 30 Years |
| Primanti Bros. | Indianapolis, IN | | (a) | | 590 |
| | 633 |
| | — |
| | — |
| | 590 |
| | 633 |
| | 1,223 |
| | (125 | ) | | 2014 | | 10/31/14 | | 14 to 30 Years |
| PriMed Physicians | Beavercreek, OH | | (d) | | 559 |
| | 1,420 |
| | — |
| | — |
| | 559 |
| | 1,420 |
| | 1,979 |
| | (216 | ) | | 1985 | | 08/18/14 | | 7 to 40 Years |
SPIRIT REALTY CAPITAL, INC.
Schedule III Real Estate and
Accumulated Depreciation
(Amounts in thousands)
|
| | | | | | | | | | | | | | | | | | | | | | | | | | | | | | | | | |
| Consumer Electronics | | | | | | | | | | | | | | | | | | | | | | |
| | Beaumont, TX | | (b) | | 778 |
| | 9,297 |
| | — |
| | — |
| | 778 |
| | 9,297 |
| | 10,075 |
| | (1,780 | ) | | 1971 | | 07/17/13 | | 3 to 25 Years |
| | Fayetteville, NC | | (b) | | 1,560 |
| | 6,893 |
| | — |
| | — |
| | 1,560 |
| | 6,893 |
| | 8,453 |
| | (781 | ) | | 1999 | | 07/17/13 | | 6 to 41 Years |
| | Great Falls, MT | | (a) | | 1,486 |
| | 3,856 |
| | (387 | ) | | (1,447 | ) | | 1,099 |
| | 2,409 |
| | 3,508 |
| | — |
| | 2004 | | 07/01/05 | | 13 to 40 Years |
| | Greensboro, NC | | (b) | | 2,776 |
| | 3,990 |
| | — |
| | — |
| | 2,776 |
| | 3,990 |
| | 6,766 |
| | (441 | ) | | 2007 | | 07/17/13 | | 10 to 47 Years |
| | Grove City, OH | | (b) | | 2,050 |
| | 3,288 |
| | — |
| | — |
| | 2,050 |
| | 3,288 |
| | 5,338 |
| | (429 | ) | | 2008 | | 07/17/13 | | 9 to 38 Years |
| | Kansas City, KS | | (c) | | 1,932 |
| | 5,629 |
| | — |
| | — |
| | 1,932 |
| | 5,629 |
| | 7,561 |
| | (646 | ) | | 2009 | | 07/17/13 | | 6 to 43 Years |
| | Las Cruces, NM | | (c) | | 1,328 |
| | 2,616 |
| | — |
| | — |
| | 1,328 |
| | 2,616 |
| | 3,944 |
| | (323 | ) | | 2002 | | 07/17/13 | | 8 to 41 Years |
| | Mt Juliet, TN | | (c) | | 2,049 |
| | 4,604 |
| | — |
| | — |
| | 2,049 |
| | 4,604 |
| | 6,653 |
| | (513 | ) | | 2008 | | 07/17/13 | | 10 to 45 Years |
| | Roswell, NM | | (a) | | 1,002 |
| | 3,177 |
| | — |
| | — |
| | 1,002 |
| | 3,177 |
| | 4,179 |
| | (849 | ) | | 2004 | | 07/01/05 | | 14 to 50 Years |
| | Santa Clara, CA | | (c) | | 2,873 |
| | 8,252 |
| | — |
| | — |
| | 2,873 |
| | 8,252 |
| | 11,125 |
| | (892 | ) | | 2002 | | 07/17/13 | | 5 to 48 Years |
| | Wichita, KS | | (c) | | 3,368 |
| | 6,312 |
| | — |
| | — |
| | 3,368 |
| | 6,312 |
| | 9,680 |
| | (1,046 | ) | | 1984 | | 07/17/13 | | 7 to 29 Years |
|
| | | | | | | | | | | | | | | | | | | | | | | | | |
| | | | | | Initial Cost to Company | | Cost Capitalized Subsequent to Acquisition including impairment | | Gross Amount at December 31, 2016 (d) 2017 (g) | | | | | | | | |
| Concept | City, State | | Encumbrances (e) | | Land and Improvements | | Buildings and Improvements | | Land and Improvements | | Buildings and Improvements | | Land and Improvements | | Buildings and Improvements | | Total | | Final Accumulated Depreciation | | Date of Construction | | Date Acquired | | Life in which depreciation in latest Statement of Operations is computed |
Description | | Encumbrances (e)
| | Land and
Improvements
| | Buildings and
Improvements
| | Improvements/
Land
| | Improvements/
building
| | Land and
Improvements
| | Buildings and
Improvements
| | Total | | Final
Accum
| | Date of
Construction
| | Date
Acquired
| |
|
| | | | | | | | | | | | | | | | | | | | | | | | | | | | | | | | | |
| Pet Supplies and Service | | | | | | | | | | | | | | | | | | | | | | |
| | Chattanooga, TN | | (b) | | 1,689 |
| | 2,837 |
| | — |
| | — |
| | 1,689 |
| | 2,837 |
| | 4,526 |
| | (343 | ) | | 1996 | | 07/17/13 | | 8 to 40 Years |
| | Daytona Beach, FL | | (b) | | 775 |
| | 3,880 |
| | — |
| | — |
| | 775 |
| | 3,880 |
| | 4,655 |
| | (400 | ) | | 1996 | | 07/17/13 | | 8 to 42 Years |
| | Fredericksburg, VA | | (b) | | 1,783 |
| | 3,491 |
| | — |
| | — |
| | 1,783 |
| | 3,491 |
| | 5,274 |
| | (396 | ) | | 1997 | | 07/17/13 | | 8 to 44 Years |
| | McCarran, NV | | (c) | | 8,333 |
| | 37,763 |
| | — |
| | — |
| | 8,333 |
| | 37,763 |
| | 46,096 |
| | (5,042 | ) | | 2008 | | 07/17/13 | | 8 to 40 Years |
|
| | | | | | | | | | | | | | | | | | | | | | | | | | | | | | | | | |
| Progressive Medical Center | Dunwoody, GA | | (d) | | 1,061 |
| | 4,556 |
| | — |
| | 22 |
| | 1,061 |
| | 4,578 |
| | 5,639 |
| | (250 | ) | | 1988 | | 10/27/16 | | 2 to 40 Years |
| Promedica Physicians Eyecare | Monroe, MI | | (d) | | 728 |
| | 3,440 |
| | — |
| | — |
| | 728 |
| | 3,440 |
| | 4,168 |
| | (575 | ) | | 2002 | | 08/18/14 | | 9 to 30 Years |
| Rainbow Kids Clinic | Clarksville, TN | | (a) | | 978 |
| | 2,718 |
| | — |
| | — |
| | 978 |
| | 2,718 |
| | 3,696 |
| | (262 | ) | | 2011 | | 12/04/14 | | 15 to 40 Years |
| Rally's | New Albany, IN | | (a) | | 497 |
| | 278 |
| | — |
| | — |
| | 497 |
| | 278 |
| | 775 |
| | (190 | ) | | 1992 | | 09/24/04 | | 15 to 30 Years |
| Rally's | Louisville, KY | | (a) | | 334 |
| | 251 |
| | — |
| | — |
| | 334 |
| | 251 |
| | 585 |
| | (159 | ) | | 1991 | | 09/24/04 | | 15 to 20 Years |
| Rally's | Florence, KY | | (a) | | 524 |
| | 209 |
| | — |
| | — |
| | 524 |
| | 209 |
| | 733 |
| | (184 | ) | | 1992 | | 09/24/04 | | 15 to 30 Years |
| Rally's | Marion, IN | | (a) | | 503 |
| | 153 |
| | — |
| | — |
| | 503 |
| | 153 |
| | 656 |
| | (147 | ) | | 1990 | | 09/24/04 | | 15 to 20 Years |
| Raymour & Flanigan Furniture | Horseheads, NY | | (a) | | 1,376 |
| | 12,506 |
| | — |
| | — |
| | 1,376 |
| | 12,506 |
| | 13,882 |
| | (611 | ) | | 2005 | | 10/06/15 | | 15 to 50 Years |
| Raymour & Flanigan Furniture | Johnson City, NY | | (a) | | 1,459 |
| | 10,433 |
| | — |
| | — |
| | 1,459 |
| | 10,433 |
| | 11,892 |
| | (653 | ) | | 1978 | | 10/06/15 | | 15 to 40 Years |
|
| | | | | | | | | | | | | | | | | | | | | | | | | | | | | | | | | |
| Wholesale Clubs | | | | | | | | | | | | | | | | | | | | | | |
| | Ft Lauderdale, FL | | (c) | | 6,775 |
| | 18,649 |
| | — |
| | — |
| | 6,775 |
| | 18,649 |
| | 25,424 |
| | (2,221 | ) | | 2007 | | 07/17/13 | | 12 to 37 Years |
| | Haverhill, MA | | (c) | | 3,192 |
| | 15,353 |
| | — |
| | — |
| | 3,192 |
| | 15,353 |
| | 18,545 |
| | (2,112 | ) | | 2007 | | 07/17/13 | | 11 to 32 Years |
| | St. Croix, VI | | (c) | | 2,132 |
| | 5,992 |
| | — |
| | — |
| | 2,132 |
| | 5,992 |
| | 8,124 |
| | (775 | ) | | 2005 | | 07/17/13 | | 8 to 37 Years |
| | Woodstock, GA | | (b) | | 4,383 |
| | 16,588 |
| | — |
| | — |
| | 4,383 |
| | 16,588 |
| | 20,971 |
| | (2,333 | ) | | 2001 | | 07/17/13 | | 8 to 33 Years |
|
| | | | | | | | | | | | | | | | | | | | | | | | | | | | | | | | | |
| RBG Eye Associates | Sherman, TX | | (a) | | 1,249 |
| | 4,713 |
| | — |
| | — |
| | 1,249 |
| | 4,713 |
| | 5,962 |
| | (362 | ) | | 2013 | | 06/30/15 | | 15 to 40 Years |
| Red Lobster | Albany, GA | | (d) | | 744 |
| | 1,340 |
| | — |
| | — |
| | 744 |
| | 1,340 |
| | 2,084 |
| | (181 | ) | | 1971 | | 12/23/14 | | 15 to 30 Years |
| Red Lobster | Columbus, GA | | (d) | | 876 |
| | 1,243 |
| | — |
| | — |
| | 876 |
| | 1,243 |
| | 2,119 |
| | (173 | ) | | 2003 | | 12/23/14 | | 15 to 30 Years |
| Red Lobster | Aurora, CO | | (d) | | 1,151 |
| | 1,742 |
| | — |
| | — |
| | 1,151 |
| | 1,742 |
| | 2,893 |
| | (190 | ) | | 1974 | | 12/23/14 | | 15 to 40 Years |
| Red Lobster | Bloomington, IL | | (d) | | 662 |
| | 1,029 |
| | — |
| | — |
| | 662 |
| | 1,029 |
| | 1,691 |
| | (142 | ) | | 1975 | | 12/23/14 | | 15 to 30 Years |
| Red Lobster | Durham, NC | | (d) | | 1,477 |
| | 1,661 |
| | — |
| | — |
| | 1,477 |
| | 1,661 |
| | 3,138 |
| | (235 | ) | | 1978 | | 12/23/14 | | 15 to 30 Years |
| Red Lobster | Beachwood, OH | | (d) | | 1,080 |
| | 1,773 |
| | — |
| | — |
| | 1,080 |
| | 1,773 |
| | 2,853 |
| | (198 | ) | | 1977 | | 12/23/14 | | 15 to 40 Years |
| Red Lobster | Syracuse, NY | | (d) | | 734 |
| | 1,518 |
| | — |
| | — |
| | 734 |
| | 1,518 |
| | 2,252 |
| | (219 | ) | | 1981 | | 12/23/14 | | 15 to 30 Years |
| Red Lobster | Bradley, IL | | (d) | | 1,610 |
| | 1,783 |
| | — |
| | — |
| | 1,610 |
| | 1,783 |
| | 3,393 |
| | (268 | ) | | 1991 | | 12/23/14 | | 15 to 30 Years |
| Red Lobster | Meadville, PA | | (d) | | 652 |
| | 1,284 |
| | — |
| | — |
| | 652 |
| | 1,284 |
| | 1,936 |
| | (198 | ) | | 1991 | | 12/23/14 | | 15 to 30 Years |
| Red Lobster | Oxford, AL | | (d) | | 489 |
| | 1,212 |
| | — |
| | — |
| | 489 |
| | 1,212 |
| | 1,701 |
| | (168 | ) | | 1991 | | 12/23/14 | | 15 to 30 Years |
| Red Lobster | Findlay, OH | | (d) | | 958 |
| | 1,029 |
| | — |
| | — |
| | 958 |
| | 1,029 |
| | 1,987 |
| | (154 | ) | | 1991 | | 12/23/14 | | 15 to 30 Years |
| Red Lobster | Adrian, MI | | (d) | | 652 |
| | 1,233 |
| | — |
| | — |
| | 652 |
| | 1,233 |
| | 1,885 |
| | (166 | ) | | 1991 | | 12/23/14 | | 15 to 30 Years |
| Red Lobster | Salina, KS | | (d) | | 764 |
| | 1,100 |
| | — |
| | — |
| | 764 |
| | 1,100 |
| | 1,864 |
| | (167 | ) | | 1994 | | 12/23/14 | | 15 to 30 Years |
| Red Lobster | Tifton, GA | | (d) | | 642 |
| | 1,009 |
| | — |
| | — |
| | 642 |
| | 1,009 |
| | 1,651 |
| | (120 | ) | | 1995 | | 12/23/14 | | 15 to 40 Years |
| Red Lobster | Council Bluffs, IA | | (d) | | 1,070 |
| | 703 |
| | — |
| | — |
| | 1,070 |
| | 703 |
| | 1,773 |
| | (115 | ) | | 1995 | | 12/23/14 | | 15 to 30 Years |
| Red Lobster | Stillwater, OK | | (d) | | 611 |
| | 1,447 |
| | — |
| | — |
| | 611 |
| | 1,447 |
| | 2,058 |
| | (163 | ) | | 1995 | | 12/23/14 | | 15 to 30 Years |
| Red Lobster | Monroe, MI | | (d) | | 927 |
| | 897 |
| | — |
| | — |
| | 927 |
| | 897 |
| | 1,824 |
| | (159 | ) | | 1996 | | 12/23/14 | | 15 to 30 Years |
SPIRIT REALTY CAPITAL, INC.
Schedule III Real Estate and
Accumulated Depreciation
(Amounts in thousands)
|
| | | | | | | | | | | | | | | | | | | | | | | | | | | | | | | | | |
| Office Supplies | | | | | | | | | | | | | | | | | | | | | | |
| | Alcoa, TN | | (c) | | 918 |
| | 3,170 |
| | — |
| | — |
| | 918 |
| | 3,170 |
| | 4,088 |
| | (350 | ) | | 1999 | | 07/17/13 | | 8 to 40 Years |
| | Angola, IN | | (c) | | 431 |
| | 2,488 |
| | (301 | ) | | (1,668 | ) | | 130 |
| | 820 |
| | 950 |
| | — |
| | 2000 | | 07/17/13 | | 1 to 44 Years |
| | Balcones Heights, TX | | (b) | | 1,888 |
| | 2,117 |
| | — |
| | — |
| | 1,888 |
| | 2,117 |
| | 4,005 |
| | (254 | ) | | 2009 | | 07/17/13 | | 11 to 46 Years |
| | Benton, AR | | (c) | | 1,236 |
| | 1,926 |
| | — |
| | — |
| | 1,236 |
| | 1,926 |
| | 3,162 |
| | (260 | ) | | 2001 | | 07/17/13 | | 3 to 38 Years |
| | Clarksville, IN | | (c) | | 991 |
| | 3,161 |
| | — |
| | — |
| | 991 |
| | 3,161 |
| | 4,152 |
| | (303 | ) | | 2006 | | 07/17/13 | | 3 to 48 Years |
| | Crossville, TN | | (c) | | 668 |
| | 2,705 |
| | — |
| | — |
| | 668 |
| | 2,705 |
| | 3,373 |
| | (288 | ) | | 2001 | | 07/17/13 | | 3 to 46 Years |
| | Dayton, OH | | (c) | | 710 |
| | 2,417 |
| | — |
| | — |
| | 710 |
| | 2,417 |
| | 3,127 |
| | (256 | ) | | 2005 | | 07/17/13 | | 8 to 47 Years |
| | Enterprise, AL | | (c) | | 675 |
| | 2,239 |
| | — |
| | — |
| | 675 |
| | 2,239 |
| | 2,914 |
| | (258 | ) | | 2006 | | 07/17/13 | | 8 to 43 Years |
| | Greenville, MS | | (c) | | 583 |
| | 2,315 |
| | — |
| | — |
| | 583 |
| | 2,315 |
| | 2,898 |
| | (288 | ) | | 2000 | | 07/17/13 | | 1 to 35 Years |
| | Greenville, SC | | (b) | | 742 |
| | 3,026 |
| | — |
| | — |
| | 742 |
| | 3,026 |
| | 3,768 |
| | (269 | ) | | 2006 | | 07/17/13 | | 3 to 48 Years |
| | Guntersville, AL | | (c) | | 1,039 |
| | 2,535 |
| | — |
| | — |
| | 1,039 |
| | 2,535 |
| | 3,574 |
| | (268 | ) | | 2001 | | 07/17/13 | | 2 to 46 Years |
| | Laurel, MS | | (c) | | 401 |
| | 2,164 |
| | — |
| | — |
| | 401 |
| | 2,164 |
| | 2,565 |
| | (272 | ) | | 2002 | | 07/17/13 | | 3 to 35 Years |
| | London, KY | | (c) | | 1,398 |
| | 2,061 |
| | — |
| | — |
| | 1,398 |
| | 2,061 |
| | 3,459 |
| | (248 | ) | | 2001 | | 07/17/13 | | 3 to 46 Years |
| | Moraine, OH | | (c) | | 781 |
| | 2,649 |
| | (533 | ) | | (1,797 | ) | | 248 |
| | 852 |
| | 1,100 |
| | — |
| | 2006 | | 07/17/13 | | 2 to 43 Years |
| | Morrisville, NC | | (c) | | 408 |
| | 2,732 |
| | — |
| | — |
| | 408 |
| | 2,732 |
| | 3,140 |
| | (274 | ) | | 2008 | | 07/17/13 | | 11 to 47 Years |
| | Orangeburg, SC | | (c) | | 621 |
| | 2,208 |
| | — |
| | — |
| | 621 |
| | 2,208 |
| | 2,829 |
| | (239 | ) | | 1999 | | 07/17/13 | | 12 to 45 Years |
| | Oxford, MS | | (c) | | 1,625 |
| | 1,024 |
| | — |
| | — |
| | 1,625 |
| | 1,024 |
| | 2,649 |
| | (190 | ) | | 2006 | | 07/17/13 | | 9 to 33 Years |
| | Peru, IL | | (c) | | 963 |
| | 2,033 |
| | — |
| | — |
| | 963 |
| | 2,033 |
| | 2,996 |
| | (292 | ) | | 1998 | | 07/17/13 | | 1 to 35 Years |
| | Warrensburg, MO | | (c) | | 651 |
| | 2,261 |
| | (460 | ) | | (1,571 | ) | | 191 |
| | 690 |
| | 881 |
| | — |
| | 2001 | | 07/17/13 | | 3 to 38 Years |
| | Warsaw, IN | | (b) | | 590 |
| | 2,504 |
| | — |
| | — |
| | 590 |
| | 2,504 |
| | 3,094 |
| | (280 | ) | | 1998 | | 07/17/13 | | 11 to 44 Years |
|
| | | | | | | | | | | | | | | | | | | | | | | | | | | | | | | | | |
| Financial Services | | | | | | | | | | | | | | | | | | | | | | |
| | Columbia, SC | | (c) | | 2,095 |
| | 16,191 |
| | (627 | ) | | (1,136 | ) | | 1,468 |
| | 15,055 |
| | 16,523 |
| | (6,596 | ) | | 1988 | | 09/09/05 | | 5 to 29 Years |
| | Cross Plains, WI | | (c) | | 1,118 |
| | 1,479 |
| | (271 | ) | | (338 | ) | | 847 |
| | 1,141 |
| | 1,988 |
| | — |
| | 1988 | | 07/17/13 | | 1 to 22 Years |
| | Delray Beach, FL | | (b) | | 3,831 |
| | 16,789 |
| | — |
| | — |
| | 3,831 |
| | 16,789 |
| | 20,620 |
| | (1,428 | ) | | 1975 | | 07/17/13 | | 8 to 50 Years |
| | Kennesaw, GA | | (c) | | 3,560 |
| | 23,583 |
| | — |
| | — |
| | 3,560 |
| | 23,583 |
| | 27,143 |
| | (2,287 | ) | | 1996 | | 07/17/13 | | 8 to 45 Years |
| | Yuma, AZ | | (b) | | 2,583 |
| | 5,221 |
| | — |
| | — |
| | 2,583 |
| | 5,221 |
| | 7,804 |
| | (789 | ) | | 2007 | | 07/17/13 | | 4 to 46 Years |
|
| | | | | | | | | | | | | | | | | | | | | | | | | | | | | | | | | | | | | | | | | |
| Other | | | | | | | | | | | | | | | | | | | | | | |
| | Gillette, WY | | (c) | | 1,520 |
| | 4,561 |
| | — |
| | — |
| | 1,520 |
| | 4,561 |
| | 6,081 |
| | (368 | ) | | 2001 | | 12/30/14 | | 15 to 40 Years |
|
| | | | | | | | | | | | | | | | | | | | | | | | | |
| | | | | | Initial Cost to Company | | Cost Capitalized Subsequent to Acquisition including impairment | | Gross Amount at December 31, 2016 (d) 2017 (g) | | | | | | | | |
| Concept | City, State | | Encumbrances (e) | | Land and Improvements | | Buildings and Improvements | | Land and Improvements | | Buildings and Improvements | | Land and Improvements | | Buildings and Improvements | | Total | | Final Accumulated Depreciation | | Date of Construction | | Date Acquired | | Life in which depreciation in latest Statement of Operations is computed |
Description | | Encumbrances (e)
| | Land and
Improvements
| | Buildings and
Improvements
| | Improvements/
Land
| | Improvements/
building
| | Land and
Improvements
| | Buildings and
Improvements
| | Total | | Final
Accum
| | Date of
Construction
| | Date
Acquired
| |
|
| | | | | | | | | | | | | | | | | | | | | | | | | | | | | | | | | | | | | | | | | |
| | Henderson, CO | | (c) | | 3,240 |
| | 5,720 |
| | — |
| | — |
| | 3,240 |
| | 5,720 |
| | 8,960 |
| | (425 | ) | | 1977 | | 12/30/14 | | 15 to 50 Years |
| | | |
| | $ | 2,730,491 |
| | $ | 4,784,889 |
| | $ | (26,481 | ) | | $ | (9,668 | ) | | $ | 2,704,010 |
| | $ | 4,775,221 |
| | $ | 7,479,231 |
| | $ | (940,005 | ) | | | | | | |
|
| | | | | | | | | | | | | | | | | | | | | | | | | | | | | | | | | |
| Red Lobster | Tullahoma, TN | | (d) | | 520 |
| | 886 |
| | — |
| | — |
| | 520 |
| | 886 |
| | 1,406 |
| | (111 | ) | | 1996 | | 12/23/14 | | 15 to 40 Years |
| Red Lobster | Lewiston, ID | | (d) | | 1,080 |
| | 866 |
| | — |
| | — |
| | 1,080 |
| | 866 |
| | 1,946 |
| | (146 | ) | | 1996 | | 12/23/14 | | 15 to 30 Years |
| Red Lobster | Indianapolis, IN | | (d) | | 418 |
| | 1,223 |
| | — |
| | — |
| | 418 |
| | 1,223 |
| | 1,641 |
| | (132 | ) | | 1992 | | 12/23/14 | | 15 to 30 Years |
| Red Lobster | Waterford, MI | | (d) | | 761 |
| | 1,958 |
| | — |
| | — |
| | 761 |
| | 1,958 |
| | 2,719 |
| | (197 | ) | | 1997 | | 02/10/15 | | 15 to 40 Years |
| Red Lobster | Paducah, KY | | (d) | | 1,485 |
| | 2,407 |
| | — |
| | 69 |
| | 1,485 |
| | 2,476 |
| | 3,961 |
| | (96 | ) | | 2013 | | 12/22/16 | | 13 to 40 Years |
| Red Lobster | Winston-Salem, NC | | (d) | | 1,707 |
| | 1,873 |
| | — |
| | — |
| | 1,707 |
| | 1,873 |
| | 3,580 |
| | (74 | ) | | 1998 | | 12/22/16 | | 13 to 40 Years |
| Red Lobster | Rockford, IL | | (d) | | 1,348 |
| | 2,842 |
| | — |
| | — |
| | 1,348 |
| | 2,842 |
| | 4,190 |
| | (109 | ) | | 1977 | | 12/22/16 | | 13 to 40 Years |
| Red Lobster | Zanesville, OH | | (d) | | 1,088 |
| | 2,218 |
| | — |
| | — |
| | 1,088 |
| | 2,218 |
| | 3,306 |
| | (112 | ) | | 1992 | | 12/22/16 | | 11 to 30 Years |
| Red Lobster | Monroeville, PA | | (d) | | 1,677 |
| | 3,508 |
| | — |
| | — |
| | 1,677 |
| | 3,508 |
| | 5,185 |
| | (159 | ) | | 2009 | | 12/22/16 | | 12 to 30 Years |
| Red Lobster | Duluth, GA | | (d) | | 1,913 |
| | 4,576 |
| | — |
| | — |
| | 1,913 |
| | 4,576 |
| | 6,489 |
| | (151 | ) | | 1984 | | 12/22/16 | | 13 to 40 Years |
| Red Mesa Grill | Traverse City, MI | | (d) | | 651 |
| | 1,255 |
| | — |
| | — |
| | 651 |
| | 1,255 |
| | 1,906 |
| | (119 | ) | | 2004 | | 11/09/15 | | 15 to 30 Years |
| Red Mesa Grill | Boyne City, MI | | (d) | | 69 |
| | 938 |
| | — |
| | — |
| | 69 |
| | 938 |
| | 1,007 |
| | (69 | ) | | 1997 | | 11/09/15 | | 15 to 30 Years |
| Red Mesa Grill | Elk Rapids, MI | | (d) | | 227 |
| | 947 |
| | — |
| | — |
| | 227 |
| | 947 |
| | 1,174 |
| | (76 | ) | | 1998 | | 11/09/15 | | 15 to 30 Years |
| Red Robin Gourmet Burgers | Gurnee, IL | | (a) | | 586 |
| | 619 |
| | — |
| | — |
| | 586 |
| | 619 |
| | 1,205 |
| | (424 | ) | | 1995 | | 06/25/04 | | 15 to 20 Years |
| Regal Cinemas | Martinsburg, WV | | (a) | | 2,450 |
| | 3,528 |
| | — |
| | — |
| | 2,450 |
| | 3,528 |
| | 5,978 |
| | (1,794 | ) | | 1998 | | 09/30/05 | | 12 to 30 Years |
| Regal Cinemas | Fenton, MO | | (a) | | 2,792 |
| | 5,982 |
| | — |
| | — |
| | 2,792 |
| | 5,982 |
| | 8,774 |
| | (833 | ) | | 2008 | | 09/29/14 | | 13 to 40 Years |
| Regal Cinemas | Lebanon, PA | | (a) | | 747 |
| | 4,295 |
| | — |
| | — |
| | 747 |
| | 4,295 |
| | 5,042 |
| | (527 | ) | | 2006 | | 09/29/14 | | 13 to 30 Years |
| Regal Cinemas | Massillon, OH | | (a) | | 1,767 |
| | 2,667 |
| | — |
| | 1,600 |
| | 1,767 |
| | 4,267 |
| | 6,034 |
| | (582 | ) | | 2005 | | 09/29/14 | | 13 to 30 Years |
| Regal Cinemas | Nitro, WV | | (a) | | 1,816 |
| | 3,068 |
| | — |
| | — |
| | 1,816 |
| | 3,068 |
| | 4,884 |
| | (573 | ) | | 2005 | | 09/29/14 | | 13 to 30 Years |
| Regal Cinemas | Dickson City, PA | | (a) | | 4,198 |
| | 5,269 |
| | — |
| | — |
| | 4,198 |
| | 5,269 |
| | 9,467 |
| | (1,111 | ) | | 2010 | | 09/29/14 | | 13 to 30 Years |
| Regal Cinemas | Simpsonville, SC | | (a) | | 1,862 |
| | 5,453 |
| | — |
| | — |
| | 1,862 |
| | 5,453 |
| | 7,315 |
| | (775 | ) | | 2010 | | 09/29/14 | | 13 to 40 Years |
| Regal Cinemas | Carrollton, GA | | (d) | | 1,879 |
| | 5,868 |
| | — |
| | — |
| | 1,879 |
| | 5,868 |
| | 7,747 |
| | (606 | ) | | 2005 | | 12/30/14 | | 15 to 40 Years |
| Regal Cinemas | Dawsonville, GA | | (d) | | 1,859 |
| | 4,207 |
| | — |
| | — |
| | 1,859 |
| | 4,207 |
| | 6,066 |
| | (469 | ) | | 2005 | | 12/30/14 | | 15 to 40 Years |
| Regal Cinemas | Gainesville, GA | | (d) | | 2,278 |
| | 8,684 |
| | — |
| | — |
| | 2,278 |
| | 8,684 |
| | 10,962 |
| | (807 | ) | | 1996 | | 12/30/14 | | 15 to 40 Years |
| Regal Cinemas | Woodstock, GA | | (d) | | 2,798 |
| | 5,057 |
| | — |
| | — |
| | 2,798 |
| | 5,057 |
| | 7,855 |
| | (632 | ) | | 1997 | | 12/30/14 | | 15 to 30 Years |
| Regal Cinemas | Griffin, GA | | (d) | | 1,239 |
| | 3,188 |
| | — |
| | — |
| | 1,239 |
| | 3,188 |
| | 4,427 |
| | (455 | ) | | 2005 | | 12/30/14 | | 15 to 30 Years |
| Regal Cinemas | Omaha, NE | | (d) | | 2,254 |
| | 4,249 |
| | — |
| | — |
| | 2,254 |
| | 4,249 |
| | 6,503 |
| | (578 | ) | | 2006 | | 03/26/15 | | 12 to 30 Years |
| Regal Cinemas | Avon, IN | | (d) | | 3,388 |
| | 2,967 |
| | — |
| | 3,651 |
| | 3,388 |
| | 6,618 |
| | 10,006 |
| | (860 | ) | | 1995 | | 03/01/16 | | 4 to 30 Years |
| Regal Cinemas | Bowie, MD | | (d) | | 7,138 |
| | 5,936 |
| | — |
| | 23 |
| | 7,138 |
| | 5,959 |
| | 13,097 |
| | (368 | ) | | 1998 | | 11/23/16 | | 8 to 40 Years |
| Renn Kirby Chevrolet Buick | Gettysburg, PA | | (a) | | 1,385 |
| | 3,259 |
| | — |
| | — |
| | 1,385 |
| | 3,259 |
| | 4,644 |
| | (1,575 | ) | | 2005 | | 02/16/07 | | 5 to 30 Years |
SPIRIT REALTY CAPITAL, INC.
Schedule III Real Estate and
Accumulated Depreciation
(Amounts in thousands)
|
| | | | | | | | | | | | | | | | | | | | | | | | | |
| | | | | | Initial Cost to Company | | Cost Capitalized Subsequent to Acquisition including impairment | | | | | | | | | | | | Gross Amount at December 31, 2017 (g) | | | | | | | | |
| Concept | (a)City, State | Represents properties collateralized with Master Trust Debt | Encumbrances (e) | | Land and Improvements | | Buildings and Improvements | | Land and Improvements | | Buildings and Improvements | | Land and Improvements | | Buildings and Improvements | | Total | | Final Accumulated Depreciation | | Date of $1,672,706.Construction | | Date Acquired | | Life in which depreciation in latest Statement of Operations is computed |
|
| | | | | | | | | | | | | | | | | | | | | | | | | | | | | | | | | |
| Repair One | Port Orange, FL | | (a) | | 599 |
| | 967 |
| | — |
| | 35 |
| | 599 |
| | 1,002 |
| | 1,601 |
| | (67 | ) | | 1997 | | 06/24/16 | | 13 to 30 Years |
| Rick Johnson Auto & Tire | Naples, FL | | (a) | | 249 |
| | 265 |
| | — |
| | — |
| | 249 |
| | 265 |
| | 514 |
| | (65 | ) | | 1966 | | 10/28/13 | | 9 to 20 Years |
| Rick Johnson Auto & Tire | Naples, FL | | (a) | | 425 |
| | 424 |
| | — |
| | — |
| | 425 |
| | 424 |
| | 849 |
| | (95 | ) | | 2006 | | 10/28/13 | | 9 to 30 Years |
| Rick Johnson Auto & Tire | Estero, FL | | (a) | | 334 |
| | 571 |
| | — |
| | — |
| | 334 |
| | 571 |
| | 905 |
| | (116 | ) | | 2009 | | 10/28/13 | | 9 to 30 Years |
| Rick Johnson Auto & Tire | Estero, FL | | (a) | | 394 |
| | 399 |
| | — |
| | — |
| | 394 |
| | 399 |
| | 793 |
| | (94 | ) | | 2004 | | 10/28/13 | | 9 to 30 Years |
| Rite Aid | St. Clair Shores, MI | | (a) | | 1,169 |
| | 761 |
| | — |
| | — |
| | 1,169 |
| | 761 |
| | 1,930 |
| | (319 | ) | | 1991 | | 05/02/05 | | 15 to 30 Years |
| Rite Aid | Philadelphia, PA | | (a) | | 733 |
| | 1,087 |
| | — |
| | — |
| | 733 |
| | 1,087 |
| | 1,820 |
| | (337 | ) | | 1993 | | 07/01/05 | | 19 to 40 Years |
| Rite Aid | Moundsville, WV | | (a) | | 706 |
| | 1,002 |
| | — |
| | — |
| | 706 |
| | 1,002 |
| | 1,708 |
| | (316 | ) | | 1993 | | 07/01/05 | | 19 to 40 Years |
| Rite Aid | Oneida, NY | | (a) | | 1,315 |
| | 1,411 |
| | — |
| | — |
| | 1,315 |
| | 1,411 |
| | 2,726 |
| | (443 | ) | | 1999 | | 07/01/05 | | 19 to 40 Years |
| Rite Aid | Uhrichsville, OH | | (a) | | 617 |
| | 2,345 |
| | — |
| | — |
| | 617 |
| | 2,345 |
| | 2,962 |
| | (683 | ) | | 2000 | | 07/01/05 | | 19 to 40 Years |
| Rite Aid | Buffalo, NY | | (a) | | 681 |
| | 925 |
| | — |
| | — |
| | 681 |
| | 925 |
| | 1,606 |
| | (288 | ) | | 1993 | | 07/01/05 | | 19 to 40 Years |
| Rite Aid | Philadelphia, PA | | (a) | | 1,613 |
| | 1,880 |
| | — |
| | — |
| | 1,613 |
| | 1,880 |
| | 3,493 |
| | (574 | ) | | 1999 | | 07/01/05 | | 19 to 40 Years |
| Rite Aid | Enterprise, AL | | (d) | | 1,163 |
| | 1,612 |
| | — |
| | — |
| | 1,163 |
| | 1,612 |
| | 2,775 |
| | (308 | ) | | 2006 | | 07/17/13 | | 11 to 37 Years |
| Rite Aid | Wauseon, OH | | (d) | | 1,000 |
| | 2,034 |
| | — |
| | — |
| | 1,000 |
| | 2,034 |
| | 3,034 |
| | (361 | ) | | 2005 | | 07/17/13 | | 12 to 37 Years |
| Rite Aid | Fremont, OH | | (d) | | 504 |
| | 1,405 |
| | (378 | ) | | (1,053 | ) | | 126 |
| | 352 |
| | 478 |
| | (14 | ) | | 1998 | | 07/17/13 | | 4 to 27 Years |
| Rite Aid | Cleveland, OH | | (d) | | 776 |
| | 1,158 |
| | — |
| | — |
| | 776 |
| | 1,158 |
| | 1,934 |
| | (239 | ) | | 1998 | | 07/17/13 | | 5 to 30 Years |
| Rite Aid | Defiance, OH | | (d) | | 645 |
| | 2,452 |
| | — |
| | — |
| | 645 |
| | 2,452 |
| | 3,097 |
| | (407 | ) | | 2005 | | 07/17/13 | | 11 to 38 Years |
| Rite Aid | Lansing, MI | | (d) | | 196 |
| | 1,487 |
| | — |
| | — |
| | 196 |
| | 1,487 |
| | 1,683 |
| | (256 | ) | | 1996 | | 07/17/13 | | 3 to 31 Years |
| Rite Aid | Glassport, PA | | (d) | | 550 |
| | 2,471 |
| | — |
| | — |
| | 550 |
| | 2,471 |
| | 3,021 |
| | (421 | ) | | 2006 | | 07/17/13 | | 11 to 37 Years |
| Rite Aid | Lincolnton, NC | | (d) | | 548 |
| | 1,537 |
| | — |
| | — |
| | 548 |
| | 1,537 |
| | 2,085 |
| | (262 | ) | | 1998 | | 07/17/13 | | 4 to 37 Years |
| Rite Aid | Easton, PA | | (d) | | 1,028 |
| | 3,996 |
| | — |
| | — |
| | 1,028 |
| | 3,996 |
| | 5,024 |
| | (580 | ) | | 2006 | | 07/17/13 | | 12 to 41 Years |
| Rite Aid | Plains, PA | | (d) | | 1,502 |
| | 2,611 |
| | — |
| | — |
| | 1,502 |
| | 2,611 |
| | 4,113 |
| | (446 | ) | | 2006 | | 07/17/13 | | 12 to 37 Years |
| Rite Aid | Lima, OH | | (d) | | 568 |
| | 3,221 |
| | — |
| | — |
| | 568 |
| | 3,221 |
| | 3,789 |
| | (453 | ) | | 2005 | | 07/17/13 | | 12 to 43 Years |
| Rite Aid | Fredericksburg, VA | | (d) | | 1,426 |
| | 2,077 |
| | — |
| | — |
| | 1,426 |
| | 2,077 |
| | 3,503 |
| | (361 | ) | | 2006 | | 07/17/13 | | 14 to 37 Years |
| Rite Aid | Spartanburg, SC | | (d) | | 1,196 |
| | 1,671 |
| | — |
| | — |
| | 1,196 |
| | 1,671 |
| | 2,867 |
| | (300 | ) | | 1999 | | 07/17/13 | | 5 to 34 Years |
| Rite Aid | Hixson, TN | | (d) | | 450 |
| | 2,025 |
| | — |
| | — |
| | 450 |
| | 2,025 |
| | 2,475 |
| | (21 | ) | | 1997 | | 07/17/13 | | 40 to 40 Years |
| Ruth's Chris Steakhouse | Metairie, LA | | (c) | | 800 |
| | 3,016 |
| | — |
| | — |
| | 800 |
| | 3,016 |
| | 3,816 |
| | (474 | ) | | 1964 | | 07/17/13 | | 10 to 30 Years |
| Ruth's Chris Steakhouse | Sarasota, FL | | (b) | | 2,758 |
| | 412 |
| | — |
| | — |
| | 2,758 |
| | 412 |
| | 3,170 |
| | (176 | ) | | 2000 | | 07/17/13 | | 12 to 25 Years |
SPIRIT REALTY CAPITAL, INC.
Schedule III Real Estate and
Accumulated Depreciation
(Amounts in thousands)
|
| | | | | | | | | | | | | | | | | | | | | | | | | |
| | | | | Initial Cost to Company | | Cost Capitalized Subsequent to Acquisition including impairment | | Gross Amount at December 31, 2017 (g) | | | | | | | | |
| Concept | (b)City, State | Represents properties collateralized with fixed CMBS Debt | Encumbrances (e) | | Land and Improvements | | Buildings and Improvements | | Land and Improvements | | Buildings and Improvements | | Land and Improvements | | Buildings and Improvements | | Total | | Final Accumulated Depreciation | | Date of $514,919.Construction | | Date Acquired | | Life in which depreciation in latest Statement of Operations is computed |
|
| | | | | | | | | | | | | | | | | | | | | | | | | | | | | | | | | |
| Ryan's | Bowling Green, KY | | (b) | | 934 |
| | 3,135 |
| | (579 | ) | | (1,940 | ) | | 355 |
| | 1,195 |
| | 1,550 |
| | (70 | ) | | 1997 | | 07/17/13 | | 10 to 34 Years |
| Ryan's | Lake Charles, LA | | (b) | | 1,619 |
| | 1,349 |
| | — |
| | — |
| | 1,619 |
| | 1,349 |
| | 2,968 |
| | (389 | ) | | 1987 | | 07/17/13 | | 10 to 24 Years |
| Ryan's | Picayune, MS | | (b) | | 1,250 |
| | 1,409 |
| | — |
| | — |
| | 1,250 |
| | 1,409 |
| | 2,659 |
| | (333 | ) | | 1999 | | 07/17/13 | | 7 to 29 Years |
| Ryan's | Conroe, TX | | (b) | | 942 |
| | 3,274 |
| | (575 | ) | | (2,006 | ) | | 367 |
| | 1,268 |
| | 1,635 |
| | (78 | ) | | 1993 | | 07/17/13 | | 11 to 32 Years |
| Ryan's | Princeton, WV | | (b) | | 948 |
| | 2,212 |
| | — |
| | — |
| | 948 |
| | 2,212 |
| | 3,160 |
| | (538 | ) | | 2001 | | 07/17/13 | | 11 to 25 Years |
| Saisaki Asian Bistro and Sushi | Newport News, VA | | (d) | | 1,184 |
| | 311 |
| | — |
| | — |
| | 1,184 |
| | 311 |
| | 1,495 |
| | (318 | ) | | 1995 | | 06/25/04 | | 10 to 25 Years |
| Sanford's Grub & Pub | Dickinson, ND | | (a) | | 616 |
| | 1,301 |
| | — |
| | — |
| | 616 |
| | 1,301 |
| | 1,917 |
| | (464 | ) | | 2003 | | 12/29/06 | | 15 to 40 Years |
| Sanford's Grub & Pub | Cheyenne, WY | | (d) | | 277 |
| | 2,041 |
| | — |
| | — |
| | 277 |
| | 2,041 |
| | 2,318 |
| | (1,122 | ) | | 1928 | | 12/29/06 | | 15 to 20 Years |
| Serrano's Mexican Restaurant | Mesa, AZ | | (d) | | 422 |
| | 1,002 |
| | — |
| | — |
| | 422 |
| | 1,002 |
| | 1,424 |
| | (163 | ) | | 1990 | | 06/14/13 | | 15 to 40 Years |
| Serrano's Mexican Restaurant | Queen Creek, AZ | | (d) | | 609 |
| | 1,159 |
| | — |
| | — |
| | 609 |
| | 1,159 |
| | 1,768 |
| | (208 | ) | | 2004 | | 06/14/13 | | 15 to 40 Years |
| Service King | Madison, TN | | (a) | | 662 |
| | 1,567 |
| | — |
| | — |
| | 662 |
| | 1,567 |
| | 2,229 |
| | (197 | ) | | 2000 | | 03/31/14 | | 14 to 40 Years |
| Service King | Nashville, TN | | (a) | | 828 |
| | 1,405 |
| | — |
| | — |
| | 828 |
| | 1,405 |
| | 2,233 |
| | (239 | ) | | 2000 | | 03/31/14 | | 14 to 30 Years |
| Service King | Clarksville, TN | | (a) | | 658 |
| | 1,243 |
| | — |
| | — |
| | 658 |
| | 1,243 |
| | 1,901 |
| | (195 | ) | | 2000 | | 03/31/14 | | 14 to 30 Years |
| Sheffield Pharmaceuticals | Norwich, CT | | (d) | | 627 |
| | 4,767 |
| | — |
| | 27 |
| | 627 |
| | 4,794 |
| | 5,421 |
| | (288 | ) | | 1975 | | 06/30/16 | | 4 to 30 Years |
| Shell | Kimberling City, MO | | (d) | | 173 |
| | 474 |
| | — |
| | 9 |
| | 173 |
| | 483 |
| | 656 |
| | (15 | ) | | 1950 | | 03/23/17 | | 15 to 30 Years |
| Shell | Branson, MO | | (d) | | 1,781 |
| | 2,864 |
| | — |
| | — |
| | 1,781 |
| | 2,864 |
| | 4,645 |
| | (126 | ) | | 1992 | | 03/23/17 | | 15 to 30 Years |
| Shell | Joplin, MO | | (d) | | 352 |
| | 434 |
| | — |
| | 28 |
| | 352 |
| | 462 |
| | 814 |
| | (16 | ) | | 2008 | | 05/05/17 | | 15 to 40 Years |
| Shell | Richland, MO | | (d) | | 2,657 |
| | 1,181 |
| | — |
| | — |
| | 2,657 |
| | 1,181 |
| | 3,838 |
| | (142 | ) | | 1984 | | 05/05/17 | | 10 to 20 Years |
| Shell | Holiday Island, AR | | (d) | | 222 |
| | 357 |
| | — |
| | — |
| | 222 |
| | 357 |
| | 579 |
| | (16 | ) | | 2000 | | 05/05/17 | | 10 to 30 Years |
| Shooters World | Tampa, FL | | (d) | | 1,588 |
| | 6,134 |
| | — |
| | — |
| | 1,588 |
| | 6,134 |
| | 7,722 |
| | (473 | ) | | 1990 | | 06/05/15 | | 15 to 40 Years |
| Shopko | Woodsfield, OH | | (d) | | 691 |
| | 1,009 |
| | — |
| | — |
| | 691 |
| | 1,009 |
| | 1,700 |
| | (574 | ) | | 2000 | | 05/31/06 | | 15 to 30 Years |
| Shopko | Manistique, MI | | (d) | | 659 |
| | 1,223 |
| | — |
| | — |
| | 659 |
| | 1,223 |
| | 1,882 |
| | (625 | ) | | 2000 | | 05/31/06 | | 15 to 30 Years |
| Shopko | Minerva, OH | | (d) | | 1,103 |
| | 902 |
| | — |
| | — |
| | 1,103 |
| | 902 |
| | 2,005 |
| | (647 | ) | | 2000 | | 05/31/06 | | 15 to 30 Years |
| Shopko | Burlington, KS | | (d) | | 371 |
| | 565 |
| | — |
| | — |
| | 371 |
| | 565 |
| | 936 |
| | (402 | ) | | 1990 | | 05/31/06 | | 15 to 20 Years |
|
| | | | | | | | | | | | | | | | | | | | | | | | | | | | | | | | | |
| Shopko | Clarion, IA | | (d) | | 365 |
| | 812 |
| | — |
| | — |
| | 365 |
| | 812 |
| | 1,177 |
| | (415 | ) | | 2000 | | 05/31/06 | | 15 to 30 Years |
| Shopko | Mount Ayr, IA | | (d) | | 228 |
| | 666 |
| | — |
| | — |
| | 228 |
| | 666 |
| | 894 |
| | (311 | ) | | 1995 | | 05/31/06 | | 15 to 30 Years |
| Shopko | Gallatin, MO | | (d) | | 57 |
| | 405 |
| | — |
| | — |
| | 57 |
| | 405 |
| | 462 |
| | (175 | ) | | 1990 | | 05/31/06 | | 15 to 30 Years |
SPIRIT REALTY CAPITAL, INC.
Schedule III Real Estate and
Accumulated Depreciation
(Amounts in thousands)
|
| | | | | | | | | | | | | | | | | | | | | | | | | |
| | | | | Initial Cost to Company | | Cost Capitalized Subsequent to Acquisition including impairment | | Gross Amount at December 31, 2017 (g) | | | | | | | | |
| Concept | (c)City, State | Represents unencumbered Properties. | Encumbrances (e) | | Land and Improvements | | Buildings and Improvements | | Land and Improvements | | Buildings and Improvements | | Land and Improvements | | Buildings and Improvements | | Total | | Final Accumulated Depreciation | | Date of Construction | | Date Acquired | | Life in which depreciation in latest Statement of Operations is computed |
|
| | | | | | | | | | | | | | | | | | | | | | | | | | | | | | | | | |
| Shopko | Memphis, MO | | (d) | | 448 |
| | 313 |
| | — |
| | — |
| | 448 |
| | 313 |
| | 761 |
| | (270 | ) | | 1983 | | 05/31/06 | | 15 to 20 Years |
| Shopko | Albany, MO | | (d) | | 66 |
| | 410 |
| | — |
| | — |
| | 66 |
| | 410 |
| | 476 |
| | (171 | ) | | 1990 | | 05/31/06 | | 15 to 30 Years |
| Shopko | Powell, WY | | (d) | | 1,264 |
| | 859 |
| | — |
| | — |
| | 1,264 |
| | 859 |
| | 2,123 |
| | (621 | ) | | 1985 | | 05/31/06 | | 15 to 25 Years |
| Shopko | Tuscola, IL | | (d) | | 724 |
| | 897 |
| | — |
| | — |
| | 724 |
| | 897 |
| | 1,621 |
| | (543 | ) | | 2000 | | 05/31/06 | | 15 to 30 Years |
| Shopko | Rockville, IN | | (d) | | 628 |
| | 939 |
| | — |
| | — |
| | 628 |
| | 939 |
| | 1,567 |
| | (526 | ) | | 1999 | | 05/31/06 | | 15 to 30 Years |
| Shopko | Sturgis, SD | | (d) | | 402 |
| | 717 |
| | — |
| | — |
| | 402 |
| | 717 |
| | 1,119 |
| | (471 | ) | | 1984 | | 05/31/06 | | 15 to 25 Years |
| Shopko | Attica, IN | | (d) | | 550 |
| | 1,116 |
| | — |
| | — |
| | 550 |
| | 1,116 |
| | 1,666 |
| | (580 | ) | | 1999 | | 05/31/06 | | 15 to 30 Years |
| Shopko | Monticello, IL | | (d) | | 641 |
| | 1,172 |
| | — |
| | — |
| | 641 |
| | 1,172 |
| | 1,813 |
| | (603 | ) | | 1999 | | 05/31/06 | | 15 to 30 Years |
| Shopko | Clintonville, WI | | (d) | | 495 |
| | 1,089 |
| | — |
| | — |
| | 495 |
| | 1,089 |
| | 1,584 |
| | (690 | ) | | 1978 | | 05/31/06 | | 15 to 25 Years |
| Shopko | Lancaster, WI | | (d) | | 581 |
| | 1,018 |
| | — |
| | — |
| | 581 |
| | 1,018 |
| | 1,599 |
| | (534 | ) | | 1999 | | 05/31/06 | | 15 to 30 Years |
| Shopko | Perry, IA | | (d) | | 651 |
| | 1,015 |
| | — |
| | — |
| | 651 |
| | 1,015 |
| | 1,666 |
| | (564 | ) | | 1998 | | 05/31/06 | | 15 to 30 Years |
| Shopko | Glasgow, MT | | (d) | | 772 |
| | 1,623 |
| | — |
| | — |
| | 772 |
| | 1,623 |
| | 2,395 |
| | (814 | ) | | 1998 | | 05/31/06 | | 15 to 30 Years |
| Shopko | Arcadia, WI | | (d) | | 673 |
| | 983 |
| | — |
| | — |
| | 673 |
| | 983 |
| | 1,656 |
| | (616 | ) | | 2000 | | 05/31/06 | | 15 to 30 Years |
| Shopko | Lander, WY | | (d) | | 289 |
| | 589 |
| | — |
| | — |
| | 289 |
| | 589 |
| | 878 |
| | (394 | ) | | 1974 | | 05/31/06 | | 15 to 20 Years |
| Shopko | Waukon, IA | | (d) | | 604 |
| | 971 |
| | — |
| | — |
| | 604 |
| | 971 |
| | 1,575 |
| | (523 | ) | | 1998 | | 05/31/06 | | 15 to 30 Years |
| Shopko | Dyersville, IA | | (d) | | 381 |
| | 1,082 |
| | — |
| | — |
| | 381 |
| | 1,082 |
| | 1,463 |
| | (515 | ) | | 2000 | | 05/31/06 | | 15 to 30 Years |
| Shopko | Glenwood, MN | | (d) | | 775 |
| | 1,404 |
| | — |
| | — |
| | 775 |
| | 1,404 |
| | 2,179 |
| | (582 | ) | | 1996 | | 05/31/06 | | 15 to 40 Years |
| Shopko | Dowagiac, MI | | (d) | | 762 |
| | 984 |
| | — |
| | — |
| | 762 |
| | 984 |
| | 1,746 |
| | (546 | ) | | 2000 | | 05/31/06 | | 15 to 30 Years |
| Shopko | Hart, MI | | (d) | | 565 |
| | 1,377 |
| | — |
| | — |
| | 565 |
| | 1,377 |
| | 1,942 |
| | (634 | ) | | 1999 | | 05/31/06 | | 15 to 30 Years |
| Shopko | Rawlins, WY | | (d) | | 430 |
| | 581 |
| | — |
| | — |
| | 430 |
| | 581 |
| | 1,011 |
| | (433 | ) | | 1971 | | 05/31/06 | | 15 to 20 Years |
| Shopko | Oconto, WI | | (d) | | 496 |
| | 1,176 |
| | — |
| | — |
| | 496 |
| | 1,176 |
| | 1,672 |
| | (611 | ) | | 2000 | | 05/31/06 | | 15 to 30 Years |
| Shopko | Newaygo, MI | | (d) | | 633 |
| | 1,155 |
| | — |
| | — |
| | 633 |
| | 1,155 |
| | 1,788 |
| | (587 | ) | | 2000 | | 05/31/06 | | 15 to 30 Years |
| Shopko | Clare, MI | | (d) | | 1,219 |
| | 760 |
| | — |
| | — |
| | 1,219 |
| | 760 |
| | 1,979 |
| | (617 | ) | | 2000 | | 05/31/06 | | 15 to 30 Years |
| Shopko | Kewaunee, WI | | (d) | | 872 |
| | 758 |
| | — |
| | — |
| | 872 |
| | 758 |
| | 1,630 |
| | (567 | ) | | 2000 | | 05/31/06 | | 15 to 30 Years |
| Shopko | Madison, SD | | (d) | | 1,060 |
| | 1,015 |
| | — |
| | — |
| | 1,060 |
| | 1,015 |
| | 2,075 |
| | (756 | ) | | 1975 | | 05/31/06 | | 15 to 25 Years |
| Shopko | Mount Carmel, IL | | (d) | | 972 |
| | 1,602 |
| | — |
| | — |
| | 972 |
| | 1,602 |
| | 2,574 |
| | (1,077 | ) | | 2000 | | 05/31/06 | | 15 to 20 Years |
| Shopko | Fergus Falls, MN | | (d) | | 738 |
| | 1,175 |
| | — |
| | — |
| | 738 |
| | 1,175 |
| | 1,913 |
| | (722 | ) | | 1986 | | 05/31/06 | | 15 to 20 Years |
| Shopko | Allegan, MI | | (d) | | 741 |
| | 1,198 |
| | — |
| | — |
| | 741 |
| | 1,198 |
| | 1,939 |
| | (612 | ) | | 2000 | | 05/31/06 | | 15 to 30 Years |
| Shopko | Spokane, WA | | (d) | | 1,014 |
| | 3,005 |
| | — |
| | — |
| | 1,014 |
| | 3,005 |
| | 4,019 |
| | (1,562 | ) | | 1987 | | 05/31/06 | | 15 to 29 Years |
| Shopko | Twin Falls, ID | | (d) | | 2,037 |
| | 3,696 |
| | — |
| | — |
| | 2,037 |
| | 3,696 |
| | 5,733 |
| | (2,274 | ) | | 1986 | | 05/31/06 | | 15 to 20 Years |
| Shopko | Worthington, MN | | (d) | | 2,861 |
| | 3,767 |
| | — |
| | — |
| | 2,861 |
| | 3,767 |
| | 6,628 |
| | (1,721 | ) | | 1984 | | 05/31/06 | | 15 to 30 Years |
| Shopko | St. Cloud, MN | | (d) | | 3,749 |
| | 4,884 |
| | — |
| | — |
| | 3,749 |
| | 4,884 |
| | 8,633 |
| | (2,957 | ) | | 1985 | | 05/31/06 | | 15 to 20 Years |
SPIRIT REALTY CAPITAL, INC.
Schedule III Real Estate and
Accumulated Depreciation
(Amounts in thousands)
|
| | | | | | | | | | | | | | | | | | | | | | | | | |
| | | | | Initial Cost to Company | | Cost Capitalized Subsequent to Acquisition including impairment | | Gross Amount at December 31, 2017 (g) | | | | | | | | |
| Concept | City, State | | Encumbrances (e) | | Land and Improvements | | Buildings and Improvements | | Land and Improvements | | Buildings and Improvements | | Land and Improvements | | Buildings and Improvements | | Total | | Final Accumulated Depreciation | | Date of Construction | | Date Acquired | | Life in which depreciation in latest Statement of Operations is computed |
|
| | | | | | | | | | | | | | | | | | | | | | | | | | | | | | | | | |
| Shopko | Austin, MN | | (d) | | 4,246 |
| | 4,444 |
| | — |
| | — |
| | 4,246 |
| | 4,444 |
| | 8,690 |
| | (2,081 | ) | | 1983 | | 05/31/06 | | 15 to 30 Years |
| Shopko | Mankato, MN | | (d) | | 6,167 |
| | 4,861 |
| | — |
| | — |
| | 6,167 |
| | 4,861 |
| | 11,028 |
| | (2,896 | ) | | 1971 | | 05/31/06 | | 15 to 28 Years |
| Shopko | Aberdeen, SD | | (d) | | 3,857 |
| | 3,348 |
| | — |
| | — |
| | 3,857 |
| | 3,348 |
| | 7,205 |
| | (1,658 | ) | | 1984 | | 05/31/06 | | 15 to 30 Years |
| Shopko | Rochester, MN | | (d) | | 6,466 |
| | 4,232 |
| | — |
| | — |
| | 6,466 |
| | 4,232 |
| | 10,698 |
| | (2,678 | ) | | 1981 | | 05/31/06 | | 15 to 28 Years |
| Shopko | Marquette, MI | | (d) | | 4,423 |
| | 5,774 |
| | — |
| | — |
| | 4,423 |
| | 5,774 |
| | 10,197 |
| | (3,460 | ) | | 1969 | | 05/31/06 | | 15 to 25 Years |
| Shopko | Rochester, MN | | (d) | | 6,189 |
| | 4,511 |
| | — |
| | — |
| | 6,189 |
| | 4,511 |
| | 10,700 |
| | (2,792 | ) | | 1981 | | 05/31/06 | | 15 to 20 Years |
| Shopko | Lewiston, ID | | (d) | | 409 |
| | 2,999 |
| | — |
| | — |
| | 409 |
| | 2,999 |
| | 3,408 |
| | (1,848 | ) | | 1987 | | 05/31/06 | | 15 to 25 Years |
| Shopko | Houghton, MI | | (d) | | 1,963 |
| | 4,025 |
| | — |
| | — |
| | 1,963 |
| | 4,025 |
| | 5,988 |
| | (1,980 | ) | | 1994 | | 05/31/06 | | 15 to 30 Years |
| Shopko | Missoula, MT | | (d) | | 4,123 |
| | 5,253 |
| | — |
| | — |
| | 4,123 |
| | 5,253 |
| | 9,376 |
| | (3,038 | ) | | 1987 | | 05/31/06 | | 15 to 28 Years |
| Shopko | Kingsford, MI | | (d) | | 3,736 |
| | 3,570 |
| | — |
| | — |
| | 3,736 |
| | 3,570 |
| | 7,306 |
| | (2,212 | ) | | 1970 | | 05/31/06 | | 15 to 28 Years |
| Shopko | Escanaba, MI | | (d) | | 3,030 |
| | 3,321 |
| | — |
| | — |
| | 3,030 |
| | 3,321 |
| | 6,351 |
| | (2,008 | ) | | 1971 | | 05/31/06 | | 15 to 28 Years |
| Shopko | Union Gap, WA | | (d) | | 481 |
| | 4,079 |
| | — |
| | — |
| | 481 |
| | 4,079 |
| | 4,560 |
| | (2,447 | ) | | 1991 | | 05/31/06 | | 15 to 29 Years |
| Shopko | Jacksonville, IL | | (d) | | 3,603 |
| | 3,569 |
| | — |
| | — |
| | 3,603 |
| | 3,569 |
| | 7,172 |
| | (2,153 | ) | | 1996 | | 05/31/06 | | 15 to 30 Years |
| Shopko | River Falls, WI | | (d) | | 1,787 |
| | 4,283 |
| | — |
| | — |
| | 1,787 |
| | 4,283 |
| | 6,070 |
| | (1,920 | ) | | 1994 | | 05/31/06 | | 15 to 30 Years |
| Shopko | Dixon, IL | | (d) | | 1,502 |
| | 2,810 |
| | — |
| | — |
| | 1,502 |
| | 2,810 |
| | 4,312 |
| | (1,327 | ) | | 1993 | | 05/31/06 | | 15 to 30 Years |
| Shopko | Belvidere, IL | | (d) | | 3,061 |
| | 3,609 |
| | — |
| | — |
| | 3,061 |
| | 3,609 |
| | 6,670 |
| | (1,729 | ) | | 1995 | | 05/31/06 | | 15 to 30 Years |
| Shopko | Freeport, IL | | (d) | | 1,941 |
| | 2,431 |
| | — |
| | — |
| | 1,941 |
| | 2,431 |
| | 4,372 |
| | (1,317 | ) | | 1994 | | 05/31/06 | | 15 to 30 Years |
| Shopko | Helena, MT | | (d) | | 3,176 |
| | 5,583 |
| | (724 | ) | | — |
| | 2,452 |
| | 5,583 |
| | 8,035 |
| | (2,381 | ) | | 1992 | | 05/31/06 | | 15 to 30 Years |
| Shopko | Sheboygan, WI | | (d) | | 2,973 |
| | 4,340 |
| | — |
| | — |
| | 2,973 |
| | 4,340 |
| | 7,313 |
| | (2,167 | ) | | 1993 | | 05/31/06 | | 15 to 30 Years |
| Shopko | Monroe, WI | | (d) | | 1,526 |
| | 4,027 |
| | — |
| | — |
| | 1,526 |
| | 4,027 |
| | 5,553 |
| | (1,783 | ) | | 1994 | | 05/31/06 | | 15 to 30 Years |
| Shopko | Duluth, MN | | (d) | | 4,722 |
| | 6,955 |
| | — |
| | — |
| | 4,722 |
| | 6,955 |
| | 11,677 |
| | (2,972 | ) | | 1993 | | 05/31/06 | | 15 to 30 Years |
| Shopko | Onalaska, WI | | (d) | | 2,468 |
| | 4,392 |
| | — |
| | — |
| | 2,468 |
| | 4,392 |
| | 6,860 |
| | (1,947 | ) | | 1989 | | 05/31/06 | | 15 to 30 Years |
| Shopko | Logan, UT | | (d) | | 454 |
| | 3,453 |
| | — |
| | — |
| | 454 |
| | 3,453 |
| | 3,907 |
| | (2,130 | ) | | 1989 | | 05/31/06 | | 15 to 20 Years |
| Shopko | Sioux Falls, SD | | (d) | | 4,907 |
| | 4,023 |
| | — |
| | — |
| | 4,907 |
| | 4,023 |
| | 8,930 |
| | (2,492 | ) | | 1987 | | 05/31/06 | | 15 to 28 Years |
| Shopko | Grafton, WI | | (d) | | 2,952 |
| | 4,206 |
| | — |
| | — |
| | 2,952 |
| | 4,206 |
| | 7,158 |
| | (1,977 | ) | | 1989 | | 05/31/06 | | 15 to 30 Years |
| Shopko | Watertown, SD | | (d) | | 3,064 |
| | 3,519 |
| | — |
| | — |
| | 3,064 |
| | 3,519 |
| | 6,583 |
| | (1,596 | ) | | 1985 | | 05/31/06 | | 15 to 30 Years |
| Shopko | Albert Lea, MN | | (d) | | 2,526 |
| | 3,141 |
| | — |
| | — |
| | 2,526 |
| | 3,141 |
| | 5,667 |
| | (1,993 | ) | | 1985 | | 05/31/06 | | 15 to 25 Years |
| Shopko | Stevens Point, WI | | (d) | | 1,383 |
| | 5,401 |
| | — |
| | — |
| | 1,383 |
| | 5,401 |
| | 6,784 |
| | (2,881 | ) | | 1985 | | 05/31/06 | | 15 to 25 Years |
| Shopko | Fond du Lac, WI | | (d) | | 4,110 |
| | 5,210 |
| | — |
| | — |
| | 4,110 |
| | 5,210 |
| | 9,320 |
| | (2,186 | ) | | 1985 | | 05/31/06 | | 15 to 30 Years |
| Shopko | Mason City, IA | | (d) | | 2,186 |
| | 3,888 |
| | — |
| | — |
| | 2,186 |
| | 3,888 |
| | 6,074 |
| | (2,340 | ) | | 1985 | | 05/31/06 | | 15 to 28 Years |
| Shopko | Oshkosh, WI | | (d) | | 3,594 |
| | 4,384 |
| | — |
| | — |
| | 3,594 |
| | 4,384 |
| | 7,978 |
| | (1,934 | ) | | 1984 | | 05/31/06 | | 15 to 30 Years |
| Shopko | Kenosha, WI | | (d) | | 3,079 |
| | 4,259 |
| | — |
| | — |
| | 3,079 |
| | 4,259 |
| | 7,338 |
| | (2,676 | ) | | 1980 | | 05/31/06 | | 15 to 25 Years |
SPIRIT REALTY CAPITAL, INC.
Schedule III Real Estate and
Accumulated Depreciation
(Amounts in thousands)
|
| | | | | | | | | | | | | | | | | | | | | | | | | |
| | | | | Initial Cost to Company | | Cost Capitalized Subsequent to Acquisition including impairment | | Gross Amount at December 31, 2017 (g) | | | | | | | | |
| Concept | City, State | | Encumbrances (e) | | Land and Improvements | | Buildings and Improvements | | Land and Improvements | | Buildings and Improvements | | Land and Improvements | | Buildings and Improvements | | Total | | Final Accumulated Depreciation | | Date of Construction | | Date Acquired | | Life in which depreciation in latest Statement of Operations is computed |
|
| | | | | | | | | | | | | | | | | | | | | | | | | | | | | | | | | |
| Shopko | Norfolk, NE | | (d) | | 2,701 |
| | 2,912 |
| | — |
| | — |
| | 2,701 |
| | 2,912 |
| | 5,613 |
| | (1,617 | ) | | 1984 | | 05/31/06 | | 15 to 30 Years |
| Shopko | Kimberly, WI | | (d) | | 3,550 |
| | 4,749 |
| | — |
| | — |
| | 3,550 |
| | 4,749 |
| | 8,299 |
| | (2,755 | ) | | 1979 | | 05/31/06 | | 15 to 28 Years |
| Shopko | Lake Hallie, WI | | (d) | | 2,627 |
| | 3,965 |
| | — |
| | — |
| | 2,627 |
| | 3,965 |
| | 6,592 |
| | (2,125 | ) | | 1982 | | 05/31/06 | | 15 to 30 Years |
| Shopko | Janesville, WI | | (d) | | 3,166 |
| | 4,808 |
| | — |
| | — |
| | 3,166 |
| | 4,808 |
| | 7,974 |
| | (2,862 | ) | | 1980 | | 05/31/06 | | 15 to 28 Years |
| Shopko | Marshall, MN | | (d) | | 4,152 |
| | 2,872 |
| | — |
| | — |
| | 4,152 |
| | 2,872 |
| | 7,024 |
| | (1,943 | ) | | 1972 | | 05/31/06 | | 15 to 28 Years |
| Shopko | Racine, WI | | (d) | | 3,076 |
| | 5,305 |
| | — |
| | — |
| | 3,076 |
| | 5,305 |
| | 8,381 |
| | (3,001 | ) | | 1979 | | 05/31/06 | | 15 to 25 Years |
| Shopko | Mitchell, SD | | (d) | | 3,918 |
| | 3,126 |
| | — |
| | — |
| | 3,918 |
| | 3,126 |
| | 7,044 |
| | (1,961 | ) | | 1973 | | 05/31/06 | | 15 to 28 Years |
| Shopko | St. Cloud, MN | | (d) | | 5,033 |
| | 6,589 |
| | — |
| | — |
| | 5,033 |
| | 6,589 |
| | 11,622 |
| | (2,863 | ) | | 1991 | | 05/31/06 | | 15 to 30 Years |
| Shopko | Beloit, WI | | (d) | | 3,191 |
| | 4,414 |
| | — |
| | — |
| | 3,191 |
| | 4,414 |
| | 7,605 |
| | (2,782 | ) | | 1978 | | 05/31/06 | | 15 to 25 Years |
| Shopko | Watertown, WI | | (d) | | 3,124 |
| | 4,436 |
| | — |
| | — |
| | 3,124 |
| | 4,436 |
| | 7,560 |
| | (2,646 | ) | | 1972 | | 05/31/06 | | 15 to 25 Years |
| Shopko | Marshfield, WI | | (d) | | 3,272 |
| | 4,406 |
| | — |
| | — |
| | 3,272 |
| | 4,406 |
| | 7,678 |
| | (2,561 | ) | | 1968 | | 05/31/06 | | 15 to 28 Years |
| Shopko | Hutchinson, MN | | (d) | | 2,793 |
| | 4,108 |
| | — |
| | — |
| | 2,793 |
| | 4,108 |
| | 6,901 |
| | (1,847 | ) | | 1991 | | 05/31/06 | | 15 to 30 Years |
| Shopko | Appleton, WI | | (d) | | 4,898 |
| | 5,804 |
| | — |
| | — |
| | 4,898 |
| | 5,804 |
| | 10,702 |
| | (2,432 | ) | | 1971 | | 05/31/06 | | 15 to 30 Years |
| Shopko | Rothschild, WI | | (d) | | 2,685 |
| | 4,231 |
| | — |
| | — |
| | 2,685 |
| | 4,231 |
| | 6,916 |
| | (2,607 | ) | | 1977 | | 05/31/06 | | 15 to 29 Years |
| Shopko | Green Bay, WI | | (d) | | 6,155 |
| | 6,298 |
| | — |
| | — |
| | 6,155 |
| | 6,298 |
| | 12,453 |
| | (2,640 | ) | | 1979 | | 05/31/06 | | 15 to 30 Years |
| Shopko | Wisconsin Rapids, WI | | (d) | | 3,689 |
| | 4,806 |
| | — |
| | — |
| | 3,689 |
| | 4,806 |
| | 8,495 |
| | (2,845 | ) | | 1969 | | 05/31/06 | | 15 to 28 Years |
| Shopko | De Pere, WI | | (d) | | 264 |
| | 1,681 |
| | — |
| | — |
| | 264 |
| | 1,681 |
| | 1,945 |
| | (665 | ) | | 2000 | | 05/31/06 | | 15 to 30 Years |
| Shopko | La Crosse, WI | | (d) | | 2,896 |
| | 3,810 |
| | — |
| | — |
| | 2,896 |
| | 3,810 |
| | 6,706 |
| | (2,315 | ) | | 1978 | | 05/31/06 | | 15 to 25 Years |
| Shopko | Monmouth, IL | | (d) | | 2,037 |
| | 1,166 |
| | — |
| | — |
| | 2,037 |
| | 1,166 |
| | 3,203 |
| | (1,003 | ) | | 1971 | | 05/31/06 | | 15 to 25 Years |
| Shopko | Green Bay, WI | | (d) | | 8,698 |
| | 12,160 |
| | — |
| | — |
| | 8,698 |
| | 12,160 |
| | 20,858 |
| | (6,782 | ) | | 2000 | | 05/31/06 | | 15 to 28 Years |
| Shopko | Quincy, IL | | (d) | | 3,510 |
| | 4,916 |
| | — |
| | — |
| | 3,510 |
| | 4,916 |
| | 8,426 |
| | (2,954 | ) | | 1986 | | 05/31/06 | | 15 to 28 Years |
| Shopko | Green Bay, WI | | (d) | | 4,788 |
| | 4,605 |
| | — |
| | — |
| | 4,788 |
| | 4,605 |
| | 9,393 |
| | (2,834 | ) | | 1966 | | 05/31/06 | | 15 to 28 Years |
| Shopko | Gothenburg, NE | | (a) | | 391 |
| | 1,798 |
| | — |
| | — |
| | 391 |
| | 1,798 |
| | 2,189 |
| | (490 | ) | | 2007 | | 12/08/09 | | 12 to 47 Years |
| Shopko | Thermopolis, WY | | (a) | | 589 |
| | 1,601 |
| | — |
| | — |
| | 589 |
| | 1,601 |
| | 2,190 |
| | (446 | ) | | 2007 | | 12/08/09 | | 12 to 47 Years |
| Shopko | Ainsworth, NE | | (a) | | 361 |
| | 1,829 |
| | — |
| | — |
| | 361 |
| | 1,829 |
| | 2,190 |
| | (497 | ) | | 2007 | | 12/08/09 | | 12 to 47 Years |
| Shopko | O'Neill, NE | | (a) | | 400 |
| | 1,752 |
| | — |
| | — |
| | 400 |
| | 1,752 |
| | 2,152 |
| | (530 | ) | | 1972 | | 12/08/09 | | 12 to 47 Years |
| Shopko | Carrollton, MO | | (d) | | 352 |
| | 345 |
| | — |
| | — |
| | 352 |
| | 345 |
| | 697 |
| | (289 | ) | | 1994 | | 07/21/11 | | 9 to 20 Years |
| Skyline Chili | Fairborn, OH | | (a) | | 923 |
| | 468 |
| | — |
| | — |
| | 923 |
| | 468 |
| | 1,391 |
| | (297 | ) | | 1998 | | 06/25/04 | | 15 to 30 Years |
| Skyline Chili | Lewis Center, OH | | (a) | | 626 |
| | 560 |
| | — |
| | — |
| | 626 |
| | 560 |
| | 1,186 |
| | (303 | ) | | 1998 | | 06/25/04 | | 15 to 30 Years |
| Slim Chickens | Texarkana, TX | | (a) | | 265 |
| | 747 |
| | — |
| | — |
| | 265 |
| | 747 |
| | 1,012 |
| | (134 | ) | | 2013 | | 11/04/13 | | 14 to 30 Years |
| Slim Chickens | Fayetteville, AR | | (a) | | 1,019 |
| | 1,150 |
| | — |
| | — |
| | 1,019 |
| | 1,150 |
| | 2,169 |
| | (167 | ) | | 2014 | | 06/23/14 | | 15 to 40 Years |
| Slim Chickens | Stillwater, OK | | (d) | | 1,314 |
| | 1,111 |
| | — |
| | — |
| | 1,314 |
| | 1,111 |
| | 2,425 |
| | (133 | ) | | 2015 | | 03/31/15 | | 15 to 40 Years |
SPIRIT REALTY CAPITAL, INC.
Schedule III Real Estate and
Accumulated Depreciation
(Amounts in thousands)
|
| | | | | | | | | | | | | | | | | | | | | | | | | |
| | | | | Initial Cost to Company | | Cost Capitalized Subsequent to Acquisition including impairment | | Gross Amount at December 31, 2017 (g) | | | | | | | | |
| Concept | City, State | | Encumbrances (e) | | Land and Improvements | | Buildings and Improvements | | Land and Improvements | | Buildings and Improvements | | Land and Improvements | | Buildings and Improvements | | Total | | Final Accumulated Depreciation | | Date of Construction | | Date Acquired | | Life in which depreciation in latest Statement of Operations is computed |
|
| | | | | | | | | | | | | | | | | | | | | | | | | | | | | | | | | |
| Smart & Final | Westlake Village, CA | | (d) | | 6,449 |
| | 6,129 |
| | — |
| | — |
| | 6,449 |
| | 6,129 |
| | 12,578 |
| | (651 | ) | | 1998 | | 04/20/15 | | 15 to 30 Years |
|
| | | | | | | | | | | | | | | | | | | | | | | | | | | | | | | | | |
| Smart & Final | Palmdale, CA | | (d) | | 3,849 |
| | 9,803 |
| | — |
| | — |
| | 3,849 |
| | 9,803 |
| | 13,652 |
| | (894 | ) | | 2005 | | 03/23/15 | | 15 to 40 Years |
| Smart & Final | Chula Vista, CA | | (d) | | 3,801 |
| | 5,718 |
| | — |
| | — |
| | 3,801 |
| | 5,718 |
| | 9,519 |
| | (636 | ) | | 1986 | | 03/20/15 | | 15 to 30 Years |
| Smart & Final | El Cajon, CA | | (d) | | 7,323 |
| | 10,056 |
| | — |
| | — |
| | 7,323 |
| | 10,056 |
| | 17,379 |
| | (1,180 | ) | | 1997 | | 03/16/15 | | 15 to 30 Years |
| Smart & Final | Atascadero, CA | | (d) | | 3,677 |
| | 8,920 |
| | — |
| | — |
| | 3,677 |
| | 8,920 |
| | 12,597 |
| | (1,007 | ) | | 2000 | | 04/06/15 | | 15 to 30 Years |
| Smokey Bones | Pittsburgh, PA | | (b) | | 1,481 |
| | 676 |
| | — |
| | — |
| | 1,481 |
| | 676 |
| | 2,157 |
| | (394 | ) | | 2006 | | 12/31/07 | | 15 to 40 Years |
| Smokey Bones | Clearwater, FL | | (b) | | 2,226 |
| | 858 |
| | — |
| | — |
| | 2,226 |
| | 858 |
| | 3,084 |
| | (418 | ) | | 2004 | | 12/31/07 | | 15 to 40 Years |
| Smokey Bones | Greensboro, NC | | (b) | | 1,009 |
| | 444 |
| | — |
| | — |
| | 1,009 |
| | 444 |
| | 1,453 |
| | (338 | ) | | 2003 | | 12/31/07 | | 15 to 40 Years |
| Smokey Bones | Bowie, MD | | (b) | | 1,501 |
| | 615 |
| | — |
| | — |
| | 1,501 |
| | 615 |
| | 2,116 |
| | (334 | ) | | 2004 | | 12/31/07 | | 15 to 40 Years |
| Smokey Bones | Fort Wayne, IN | | (b) | | 1,110 |
| | 817 |
| | — |
| | — |
| | 1,110 |
| | 817 |
| | 1,927 |
| | (480 | ) | | 2003 | | 12/31/07 | | 15 to 40 Years |
| Smokey Bones | Mentor, OH | | (b) | | 873 |
| | 790 |
| | — |
| | — |
| | 873 |
| | 790 |
| | 1,663 |
| | (428 | ) | | 2003 | | 12/31/07 | | 15 to 40 Years |
| Smokey Bones | Melbourne, FL | | (b) | | 2,005 |
| | 794 |
| | — |
| | — |
| | 2,005 |
| | 794 |
| | 2,799 |
| | (476 | ) | | 1986 | | 12/31/07 | | 15 to 40 Years |
| Smokey Bones | Fairview Heights, IL | | (b) | | 1,020 |
| | 826 |
| | — |
| | — |
| | 1,020 |
| | 826 |
| | 1,846 |
| | (523 | ) | | 1972 | | 12/31/07 | | 15 to 30 Years |
| Smokey Bones | Dayton, OH | | (b) | | 1,026 |
| | 907 |
| | — |
| | — |
| | 1,026 |
| | 907 |
| | 1,933 |
| | (478 | ) | | 2002 | | 12/31/07 | | 15 to 40 Years |
| Smokey Bones | Warwick, RI | | (b) | | 1,593 |
| | 1,314 |
| | — |
| | — |
| | 1,593 |
| | 1,314 |
| | 2,907 |
| | (602 | ) | | 1990 | | 12/31/07 | | 15 to 40 Years |
| Smokey Bones | Springfield, IL | | (b) | | 1,115 |
| | 772 |
| | — |
| | — |
| | 1,115 |
| | 772 |
| | 1,887 |
| | (404 | ) | | 1996 | | 12/31/07 | | 15 to 40 Years |
| Smokey Bones | Orlando, FL | | (b) | | 2,006 |
| | 571 |
| | — |
| | — |
| | 2,006 |
| | 571 |
| | 2,577 |
| | (330 | ) | | 2002 | | 12/31/07 | | 15 to 40 Years |
| Smokey Bones | Colonie, NY | | (b) | | 1,322 |
| | 991 |
| | (350 | ) | | (261 | ) | | 972 |
| | 730 |
| | 1,702 |
| | (445 | ) | | 1994 | | 12/31/07 | | 15 to 40 Years |
| Solea Mexican Grill | Appleton, WI | | (a) | | 727 |
| | 1,329 |
| | — |
| | 9 |
| | 727 |
| | 1,338 |
| | 2,065 |
| | (677 | ) | | 1993 | | 12/29/06 | | 7 to 30 Years |
| Sonic | Pilot Point, TX | | (d) | | 446 |
| | 436 |
| | — |
| | — |
| | 446 |
| | 436 |
| | 882 |
| | (51 | ) | | 2000 | | 07/25/16 | | 13 to 30 Years |
| Sonic | Little Elm, TX | | (d) | | 620 |
| | 244 |
| | — |
| | — |
| | 620 |
| | 244 |
| | 864 |
| | (45 | ) | | 2001 | | 07/25/16 | | 13 to 20 Years |
| Sonic | Celina, TX | | (d) | | 411 |
| | 199 |
| | — |
| | — |
| | 411 |
| | 199 |
| | 610 |
| | (38 | ) | | 2003 | | 07/25/16 | | 13 to 20 Years |
| Sonic | St.Paul, TX | | (d) | | 509 |
| | 192 |
| | — |
| | — |
| | 509 |
| | 192 |
| | 701 |
| | (42 | ) | | 2003 | | 07/25/16 | | 13 to 20 Years |
| Sonic | Lavon, TX | | (d) | | 404 |
| | 212 |
| | — |
| | — |
| | 404 |
| | 212 |
| | 616 |
| | (41 | ) | | 2003 | | 07/25/16 | | 13 to 20 Years |
| Sonic | Melissa, TX | | (d) | | 715 |
| | 609 |
| | — |
| | — |
| | 715 |
| | 609 |
| | 1,324 |
| | (64 | ) | | 2004 | | 07/25/16 | | 13 to 30 Years |
| Sonic | Prosper, TX | | (d) | | 990 |
| | 435 |
| | — |
| | — |
| | 990 |
| | 435 |
| | 1,425 |
| | (58 | ) | | 2004 | | 07/25/16 | | 13 to 30 Years |
| Sonic | Gunter, TX | | (d) | | 248 |
| | 250 |
| | — |
| | — |
| | 248 |
| | 250 |
| | 498 |
| | (34 | ) | | 2004 | | 07/25/16 | | 13 to 20 Years |
| Sonic | Leonard, TX | | (d) | | 323 |
| | 465 |
| | — |
| | — |
| | 323 |
| | 465 |
| | 788 |
| | (48 | ) | | 2005 | | 07/25/16 | | 13 to 30 Years |
| Sonic | Keene, TX | | (d) | | 343 |
| | 260 |
| | — |
| | — |
| | 343 |
| | 260 |
| | 603 |
| | (36 | ) | | 2005 | | 07/25/16 | | 13 to 30 Years |
| Sonic Drive-In | Knoxville, TN | | (a) | | 635 |
| | 227 |
| | — |
| | — |
| | 635 |
| | 227 |
| | 862 |
| | (316 | ) | | 1995 | | 07/01/05 | | 15 to 20 Years |
| Sonic Drive-In | Radford, VA | | (a) | | 499 |
| | 248 |
| | — |
| | — |
| | 499 |
| | 248 |
| | 747 |
| | (384 | ) | | 1995 | | 07/01/05 | | 15 to 20 Years |
SPIRIT REALTY CAPITAL, INC.
Schedule III Real Estate and
Accumulated Depreciation
(Amounts in thousands)
|
| | | | | | | | | | | | | | | | | | | | | | | | | |
| | | | | Initial Cost to Company | | Cost Capitalized Subsequent to Acquisition including impairment | | Gross Amount at December 31, 2017 (g) | | | | | | | | |
| Concept | City, State | | Encumbrances (e) | | Land and Improvements | | Buildings and Improvements | | Land and Improvements | | Buildings and Improvements | | Land and Improvements | | Buildings and Improvements | | Total | | Final Accumulated Depreciation | | Date of Construction | | Date Acquired | | Life in which depreciation in latest Statement of Operations is computed |
|
| | | | | | | | | | | | | | | | | | | | | | | | | | | | | | | | | |
| Sonic Drive-In | Christiansburg, VA | | (a) | | 666 |
| | 168 |
| | — |
| | — |
| | 666 |
| | 168 |
| | 834 |
| | (308 | ) | | 1994 | | 07/01/05 | | 15 to 20 Years |
| Sonic Drive-In | Pulaski, VA | | (a) | | 444 |
| | 236 |
| | — |
| | — |
| | 444 |
| | 236 |
| | 680 |
| | (326 | ) | | 1994 | | 07/01/05 | | 15 to 20 Years |
| Sonic Drive-In | Wytheville, VA | | (a) | | 446 |
| | 172 |
| | — |
| | — |
| | 446 |
| | 172 |
| | 618 |
| | (233 | ) | | 1995 | | 07/01/05 | | 15 to 20 Years |
| Sonic Drive-In | Maryville, TN | | (a) | | 810 |
| | 306 |
| | — |
| | — |
| | 810 |
| | 306 |
| | 1,116 |
| | (298 | ) | | 1993 | | 07/01/05 | | 15 to 20 Years |
| Sonic Drive-In | Kingsport, TN | | (a) | | 592 |
| | 200 |
| | — |
| | — |
| | 592 |
| | 200 |
| | 792 |
| | (358 | ) | | 1992 | | 07/01/05 | | 15 to 20 Years |
| Sonic Drive-In | Knoxville, TN | | (a) | | 547 |
| | 230 |
| | — |
| | — |
| | 547 |
| | 230 |
| | 777 |
| | (387 | ) | | 1987 | | 07/01/05 | | 10 to 15 Years |
| Sonic Drive-In | Bristol, TN | | (a) | | 484 |
| | 134 |
| | — |
| | — |
| | 484 |
| | 134 |
| | 618 |
| | (247 | ) | | 1991 | | 07/01/05 | | 15 to 20 Years |
| Sonic Drive-In | Elizabethton, TN | | (a) | | 655 |
| | 129 |
| | — |
| | — |
| | 655 |
| | 129 |
| | 784 |
| | (250 | ) | | 1993 | | 07/01/05 | | 15 to 20 Years |
| Sonic Drive-In | Raleigh, NC | | (b) | | 639 |
| | 320 |
| | — |
| | — |
| | 639 |
| | 320 |
| | 959 |
| | (101 | ) | | 2008 | | 09/17/13 | | 15 to 30 Years |
| Sonic Drive-In | Concord, NC | | (b) | | 244 |
| | 310 |
| | — |
| | — |
| | 244 |
| | 310 |
| | 554 |
| | (60 | ) | | 1993 | | 09/17/13 | | 15 to 30 Years |
| Sonic Drive-In | Rolesville, NC | | (b) | | 526 |
| | 320 |
| | — |
| | — |
| | 526 |
| | 320 |
| | 846 |
| | (96 | ) | | 2007 | | 09/17/13 | | 15 to 30 Years |
| Sonic Drive-In | Albermarle, NC | | (b) | | 639 |
| | 310 |
| | — |
| | — |
| | 639 |
| | 310 |
| | 949 |
| | (65 | ) | | 1993 | | 09/17/13 | | 15 to 30 Years |
| Sonic Drive-In | Salisbury, NC | | (b) | | 357 |
| | 338 |
| | — |
| | — |
| | 357 |
| | 338 |
| | 695 |
| | (77 | ) | | 2002 | | 09/17/13 | | 15 to 30 Years |
| Sonic Drive-In | Rockwell, NC | | (b) | | 385 |
| | 385 |
| | — |
| | — |
| | 385 |
| | 385 |
| | 770 |
| | (116 | ) | | 2006 | | 09/17/13 | | 15 to 30 Years |
| Sonic Drive-In | South Hill, VA | | (b) | | 564 |
| | 320 |
| | — |
| | — |
| | 564 |
| | 320 |
| | 884 |
| | (107 | ) | | 2007 | | 09/17/13 | | 15 to 30 Years |
| Sonic Drive-In | Zebulon, NC | | (b) | | 780 |
| | 395 |
| | — |
| | — |
| | 780 |
| | 395 |
| | 1,175 |
| | (120 | ) | | 2006 | | 09/17/13 | | 15 to 30 Years |
| Sonic Drive-In | Siler City, NC | | (b) | | 686 |
| | 385 |
| | — |
| | — |
| | 686 |
| | 385 |
| | 1,071 |
| | (129 | ) | | 2005 | | 09/17/13 | | 15 to 30 Years |
| Sonic Drive-In | Creedmoor, NC | | (b) | | 451 |
| | 367 |
| | — |
| | — |
| | 451 |
| | 367 |
| | 818 |
| | (105 | ) | | 2006 | | 09/17/13 | | 15 to 30 Years |
| Sonic Drive-In | Kannapolis, NC | | (b) | | 244 |
| | 291 |
| | — |
| | — |
| | 244 |
| | 291 |
| | 535 |
| | (71 | ) | | 2001 | | 09/17/13 | | 15 to 30 Years |
| Sonic Drive-In | Harrisburg, NC | | (b) | | 489 |
| | 291 |
| | — |
| | — |
| | 489 |
| | 291 |
| | 780 |
| | (79 | ) | | 2004 | | 09/17/13 | | 15 to 30 Years |
| Sonic Drive-In | Concord, NC | | (b) | | 855 |
| | 348 |
| | — |
| | — |
| | 855 |
| | 348 |
| | 1,203 |
| | (87 | ) | | 2004 | | 09/17/13 | | 15 to 30 Years |
| Sonic Drive-In | Aberdeen, NC | | (b) | | 564 |
| | 338 |
| | — |
| | — |
| | 564 |
| | 338 |
| | 902 |
| | (67 | ) | | 1994 | | 09/17/13 | | 15 to 30 Years |
| Sonic Drive-In | Flowood, MS | | (a) | | 338 |
| | 848 |
| | — |
| | — |
| | 338 |
| | 848 |
| | 1,186 |
| | (119 | ) | | 1994 | | 07/31/14 | | 15 to 30 Years |
| Sonic Drive-In | Hattiesburg, MS | | (a) | | 845 |
| | 995 |
| | — |
| | — |
| | 845 |
| | 995 |
| | 1,840 |
| | (151 | ) | | 2010 | | 07/14/14 | | 15 to 40 Years |
| Sonic Drive-In | D'Iberville, MS | | (a) | | 597 |
| | 995 |
| | — |
| | — |
| | 597 |
| | 995 |
| | 1,592 |
| | (150 | ) | | 2005 | | 07/14/14 | | 15 to 30 Years |
| Sonic Drive-In | Laurel, MS | | (a) | | 543 |
| | 754 |
| | — |
| | — |
| | 543 |
| | 754 |
| | 1,297 |
| | (127 | ) | | 1993 | | 09/22/14 | | 15 to 30 Years |
| Sonic Drive-In | Bay Minette, AL | | (a) | | 583 |
| | 754 |
| | — |
| | — |
| | 583 |
| | 754 |
| | 1,337 |
| | (130 | ) | | 2000 | | 09/22/14 | | 15 to 30 Years |
| Sonic Drive-In | Beaumont, TX | | (d) | | 580 |
| | 284 |
| | — |
| | — |
| | 580 |
| | 284 |
| | 864 |
| | (79 | ) | | 2001 | | 08/31/15 | | 15 to 20 Years |
| Sonic Drive-In | Port Arthur, TX | | (d) | | 187 |
| | 256 |
| | — |
| | — |
| | 187 |
| | 256 |
| | 443 |
| | (48 | ) | | 1976 | | 08/31/15 | | 15 to 20 Years |
| Sonic Drive-In | Port Arthur, TX | | (d) | | 384 |
| | 266 |
| | — |
| | — |
| | 384 |
| | 266 |
| | 650 |
| | (72 | ) | | 2002 | | 08/31/15 | | 15 to 20 Years |
| Sonic Drive-In | Beaumont, TX | | (d) | | 777 |
| | 246 |
| | — |
| | — |
| | 777 |
| | 246 |
| | 1,023 |
| | (81 | ) | | 2000 | | 08/31/15 | | 15 to 20 Years |
| Sonic Drive-In | Port Arthur, TX | | (d) | | 403 |
| | 344 |
| | — |
| | — |
| | 403 |
| | 344 |
| | 747 |
| | (80 | ) | | 2004 | | 08/31/15 | | 15 to 20 Years |
SPIRIT REALTY CAPITAL, INC.
Schedule III Real Estate and
Accumulated Depreciation
(Amounts in thousands)
|
| | | | | | | | | | | | | | | | | | | | | | | | | |
| | | | | Initial Cost to Company | | Cost Capitalized Subsequent to Acquisition including impairment | | Gross Amount at December 31, 2017 (g) | | | | | | | | |
| Concept | City, State | | Encumbrances (e) | | Land and Improvements | | Buildings and Improvements | | Land and Improvements | | Buildings and Improvements | | Land and Improvements | | Buildings and Improvements | | Total | | Final Accumulated Depreciation | | Date of Construction | | Date Acquired | | Life in which depreciation in latest Statement of Operations is computed |
|
| | | | | | | | | | | | | | | | | | | | | | | | | | | | | | | | | |
| Sonic Drive-In | Beaumont, TX | | (d) | | 758 |
| | 325 |
| | — |
| | — |
| | 758 |
| | 325 |
| | 1,083 |
| | (85 | ) | | 2007 | | 08/31/15 | | 15 to 30 Years |
| Sonic Drive-In | Orange, TX | | (d) | | 541 |
| | 335 |
| | — |
| | — |
| | 541 |
| | 335 |
| | 876 |
| | (75 | ) | | 2007 | | 08/31/15 | | 15 to 30 Years |
| Sonny's BBQ | Gainesville, FL | | (d) | | 1,489 |
| | 1,241 |
| | — |
| | 104 |
| | 1,489 |
| | 1,345 |
| | 2,834 |
| | (53 | ) | | 2000 | | 12/28/16 | | 6 to 40 Years |
| Sonny's BBQ | Gainesville, FL | | (d) | | 1,534 |
| | 883 |
| | — |
| | — |
| | 1,534 |
| | 883 |
| | 2,417 |
| | (44 | ) | | 1984 | | 12/28/16 | | 6 to 30 Years |
| Sonny's BBQ | Orlando, FL | | (d) | | 1,351 |
| | 1,404 |
| | — |
| | — |
| | 1,351 |
| | 1,404 |
| | 2,755 |
| | (47 | ) | | 2002 | | 12/28/16 | | 8 to 40 Years |
| Sonny's BBQ | Orlando, FL | | (d) | | 1,484 |
| | 1,415 |
| | — |
| | — |
| | 1,484 |
| | 1,415 |
| | 2,899 |
| | (55 | ) | | 1998 | | 12/28/16 | | 6 to 40 Years |
| Sonny's BBQ | Orlando, FL | | (d) | | 1,319 |
| | 1,424 |
| | — |
| | — |
| | 1,319 |
| | 1,424 |
| | 2,743 |
| | (48 | ) | | 1997 | | 12/28/16 | | 7 to 40 Years |
| Sonny's BBQ | Oviedo, FL | | (d) | | 1,499 |
| | 1,449 |
| | — |
| | — |
| | 1,499 |
| | 1,449 |
| | 2,948 |
| | (56 | ) | | 2006 | | 12/28/16 | | 7 to 40 Years |
| Sonny's BBQ | Sanford, FL | | (d) | | 1,405 |
| | 1,191 |
| | — |
| | — |
| | 1,405 |
| | 1,191 |
| | 2,596 |
| | (57 | ) | | 1987 | | 12/28/16 | | 6 to 30 Years |
| Sonny's BBQ | Inverness, FL | | (d) | | 584 |
| | 503 |
| | — |
| | 1 |
| | 584 |
| | 504 |
| | 1,088 |
| | (18 | ) | | 1998 | | 06/09/17 | | 10 to 30 Years |
| South Carolina Oncology Associates | Columbia, SC | | (d) | | 3,378 |
| | 35,153 |
| | — |
| | — |
| | 3,378 |
| | 35,153 |
| | 38,531 |
| | (3,707 | ) | | 2003 | | 12/31/13 | | 15 to 40 Years |
| Southern Theatres | Mooresville, NC | | (d) | | 5,087 |
| | 6,800 |
| | — |
| | — |
| | 5,087 |
| | 6,800 |
| | 11,887 |
| | (920 | ) | | 1999 | | 09/25/14 | | 15 to 30 Years |
| Southern Theatres | Anderson, SC | | (d) | | 5,248 |
| | 6,437 |
| | — |
| | — |
| | 5,248 |
| | 6,437 |
| | 11,685 |
| | (1,136 | ) | | 2000 | | 09/25/14 | | 15 to 30 Years |
| Southwest Stainless | Lakeland, FL | | (a) | | 1,098 |
| | 1,281 |
| | — |
| | — |
| | 1,098 |
| | 1,281 |
| | 2,379 |
| | (969 | ) | | 1984 | | 07/01/05 | | 14 to 20 Years |
| Specialists in Urology (21st Century Oncology Holdings, Inc.) | Bonita Springs, FL | | (b) | | 317 |
| | 1,619 |
| | — |
| | — |
| | 317 |
| | 1,619 |
| | 1,936 |
| | (267 | ) | | 2003 | | 08/30/12 | | 15 to 50 Years |
| Specialists in Urology (21st Century Oncology Holdings, Inc.) | Cape Coral, FL | | (b) | | 545 |
| | 1,716 |
| | — |
| | — |
| | 545 |
| | 1,716 |
| | 2,261 |
| | (337 | ) | | 2011 | | 08/30/12 | | 15 to 50 Years |
| Specialists in Urology (21st Century Oncology Holdings, Inc.) | Fort Myers, FL | | (b) | | 903 |
| | 6,445 |
| | — |
| | — |
| | 903 |
| | 6,445 |
| | 7,348 |
| | (986 | ) | | 1989 | | 08/30/12 | | 15 to 50 Years |
| Specialists in Urology (21st Century Oncology Holdings, Inc.) | Naples, FL | | (b) | | 1,351 |
| | 5,368 |
| | — |
| | — |
| | 1,351 |
| | 5,368 |
| | 6,719 |
| | (818 | ) | | 2002 | | 08/30/12 | | 15 to 50 Years |
| Specialists in Urology (21st Century Oncology Holdings, Inc.) | Naples, FL | | (b) | | 1,829 |
| | 4,522 |
| | — |
| | — |
| | 1,829 |
| | 4,522 |
| | 6,351 |
| | (825 | ) | | 1978 | | 08/30/12 | | 15 to 40 Years |
SPIRIT REALTY CAPITAL, INC.
Schedule III Real Estate and
Accumulated Depreciation
(Amounts in thousands)
|
| | | | | | | | | | | | | | | | | | | | | | | | | |
| | | | | Initial Cost to Company | | Cost Capitalized Subsequent to Acquisition including impairment | | Gross Amount at December 31, 2017 (g) | | | | | | | | |
| Concept | City, State | | Encumbrances (e) | | Land and Improvements | | Buildings and Improvements | | Land and Improvements | | Buildings and Improvements | | Land and Improvements | | Buildings and Improvements | | Total | | Final Accumulated Depreciation | | Date of Construction | | Date Acquired | | Life in which depreciation in latest Statement of Operations is computed |
|
| | | | | | | | | | | | | | | | | | | | | | | | | | | | | | | | | |
| Specialists in Urology (21st Century Oncology Holdings, Inc.) | Bonita Springs, FL | | (b) | | 738 |
| | 4,022 |
| | — |
| | — |
| | 738 |
| | 4,022 |
| | 4,760 |
| | (642 | ) | | 2006 | | 08/30/12 | | 15 to 50 Years |
| Specialists in Urology (21st Century Oncology Holdings, Inc.) | Bonita Springs, FL | | (b) | | 376 |
| | 940 |
| | — |
| | — |
| | 376 |
| | 940 |
| | 1,316 |
| | (182 | ) | | 2006 | | 08/30/12 | | 15 to 50 Years |
| Specialists in Urology (21st Century Oncology Holdings, Inc.) | Naples, FL | | (b) | | 1,057 |
| | 3,845 |
| | — |
| | — |
| | 1,057 |
| | 3,845 |
| | 4,902 |
| | (608 | ) | | 2012 | | 10/31/12 | | 15 to 50 Years |
| Specialists in Urology (Northwest Cancer Care Management Co, LLC) | Kennewick, WA | | (d) | | 353 |
| | 4,248 |
| | — |
| | — |
| | 353 |
| | 4,248 |
| | 4,601 |
| | (238 | ) | | 2011 | | 03/31/16 | | 13 to 40 Years |
| Sportsman's Warehouse | Thornton, CO | | (d) | | 2,836 |
| | 5,069 |
| | — |
| | — |
| | 2,836 |
| | 5,069 |
| | 7,905 |
| | (1,174 | ) | | 2003 | | 10/15/12 | | 15 to 30 Years |
| Sportsman's Warehouse | Ankeny, IA | | (d) | | 3,913 |
| | 3,671 |
| | — |
| | — |
| | 3,913 |
| | 3,671 |
| | 7,584 |
| | (905 | ) | | 2003 | | 10/15/12 | | 15 to 30 Years |
| Sportsman's Warehouse | Midvale, UT | | (d) | | 2,931 |
| | 4,844 |
| | — |
| | — |
| | 2,931 |
| | 4,844 |
| | 7,775 |
| | (1,042 | ) | | 2002 | | 10/15/12 | | 15 to 30 Years |
| Sportsman's Warehouse | Mesa, AZ | | (d) | | 2,040 |
| | 5,696 |
| | — |
| | — |
| | 2,040 |
| | 5,696 |
| | 7,736 |
| | (1,192 | ) | | 2005 | | 10/15/12 | | 15 to 30 Years |
| Sportsman's Warehouse | Phoenix, AZ | | (d) | | 2,098 |
| | 5,338 |
| | — |
| | — |
| | 2,098 |
| | 5,338 |
| | 7,436 |
| | (1,139 | ) | | 2003 | | 10/15/12 | | 15 to 30 Years |
| Sportsman's Warehouse | Loveland, CO | | (d) | | 2,329 |
| | 4,750 |
| | — |
| | — |
| | 2,329 |
| | 4,750 |
| | 7,079 |
| | (990 | ) | | 2001 | | 10/15/12 | | 15 to 30 Years |
| Sportsman's Warehouse | Bend, OR | | (b) | | 1,516 |
| | 4,850 |
| | — |
| | — |
| | 1,516 |
| | 4,850 |
| | 6,366 |
| | (626 | ) | | 2000 | | 08/15/13 | | 10 to 50 Years |
| Sportsman's Warehouse | Soldotna, AK | | (a) | | 1,177 |
| | 2,245 |
| | — |
| | — |
| | 1,177 |
| | 2,245 |
| | 3,422 |
| | (251 | ) | | 1983 | | 05/22/14 | | 15 to 40 Years |
| Sportsman's Warehouse | Williston, ND | | (d) | | 2,190 |
| | 4,132 |
| | — |
| | — |
| | 2,190 |
| | 4,132 |
| | 6,322 |
| | (292 | ) | | 2015 | | 08/24/15 | | 15 to 50 Years |
| Sportsman's Warehouse | Colorado Springs, CO | | (d) | | 2,568 |
| | 4,842 |
| | — |
| | — |
| | 2,568 |
| | 4,842 |
| | 7,410 |
| | (293 | ) | | 2005 | | 08/31/16 | | 10 to 40 Years |
| Spring East Buffet | Leeds, AL | | (a) | | 907 |
| | 926 |
| | — |
| | 31 |
| | 907 |
| | 957 |
| | 1,864 |
| | (791 | ) | | 2003 | | 09/26/06 | | 9 to 40 Years |
| SRS Distribution | Port Richey, FL | | (a) | | 741 |
| | 660 |
| | — |
| | — |
| | 741 |
| | 660 |
| | 1,401 |
| | (766 | ) | | 1975 | | 07/01/05 | | 10 to 15 Years |
| Staples | Crossville, TN | | (d) | | 668 |
| | 2,705 |
| | — |
| | — |
| | 668 |
| | 2,705 |
| | 3,373 |
| | (372 | ) | | 2001 | | 07/17/13 | | 3 to 46 Years |
SPIRIT REALTY CAPITAL, INC.
Schedule III Real Estate and
Accumulated Depreciation
(Amounts in thousands)
|
| | | | | | | | | | | | | | | | | | | | | | | | | |
| | | | | Initial Cost to Company | | Cost Capitalized Subsequent to Acquisition including impairment | | Gross Amount at December 31, 2017 (g) | | | | | | | | |
| Concept | City, State | | Encumbrances (e) | | Land and Improvements | | Buildings and Improvements | | Land and Improvements | | Buildings and Improvements | | Land and Improvements | | Buildings and Improvements | | Total | | Final Accumulated Depreciation | | Date of Construction | | Date Acquired | | Life in which depreciation in latest Statement of Operations is computed |
|
| | | | | | | | | | | | | | | | | | | | | | | | | | | | | | | | | |
| Staples | Peru, IL | | (d) | | 963 |
| | 2,033 |
| | — |
| | — |
| | 963 |
| | 2,033 |
| | 2,996 |
| | (377 | ) | | 1998 | | 07/17/13 | | 1 to 35 Years |
| Staples | Clarksville, IN | | (d) | | 991 |
| | 3,161 |
| | — |
| | — |
| | 991 |
| | 3,161 |
| | 4,152 |
| | (389 | ) | | 2006 | | 07/17/13 | | 3 to 48 Years |
| Staples | Greenville, SC | | (d) | | 742 |
| | 3,026 |
| | — |
| | — |
| | 742 |
| | 3,026 |
| | 3,768 |
| | (345 | ) | | 2006 | | 07/17/13 | | 3 to 48 Years |
|
| | | | | | | | | | | | | | | | | | | | | | | | | | | | | | | | | |
| Staples | Warsaw, IN | | (d) | | 590 |
| | 2,504 |
| | — |
| | — |
| | 590 |
| | 2,504 |
| | 3,094 |
| | (362 | ) | | 1998 | | 07/17/13 | | 0 to 44 Years |
| Staples | Guntersville, AL | | (d) | | 1,039 |
| | 2,535 |
| | — |
| | — |
| | 1,039 |
| | 2,535 |
| | 3,574 |
| | (345 | ) | | 2001 | | 07/17/13 | | 2 to 46 Years |
| Starbucks | Memphis, TN | | (d) | | 208 |
| | 302 |
| | — |
| | — |
| | 208 |
| | 302 |
| | 510 |
| | (84 | ) | | 2007 | | 07/17/13 | | 3 to 24 Years |
| Starbucks | Bowling Green, KY | | (d) | | 756 |
| | 205 |
| | — |
| | — |
| | 756 |
| | 205 |
| | 961 |
| | (84 | ) | | 2007 | | 07/17/13 | | 4 to 39 Years |
| Starbucks | Ponca City, OK | | (d) | | 93 |
| | 249 |
| | — |
| | — |
| | 93 |
| | 249 |
| | 342 |
| | (67 | ) | | 2007 | | 07/17/13 | | 4 to 28 Years |
| Starbucks | Stillwater, OK | | (d) | | 218 |
| | 1,262 |
| | — |
| | — |
| | 218 |
| | 1,262 |
| | 1,480 |
| | (207 | ) | | 2007 | | 07/17/13 | | 4 to 32 Years |
| Starbucks | Powell, TN | | (d) | | 411 |
| | 353 |
| | — |
| | — |
| | 411 |
| | 353 |
| | 764 |
| | (106 | ) | | 2007 | | 07/17/13 | | 4 to 26 Years |
| Starbucks | Chattanooga, TN | | (d) | | 175 |
| | 271 |
| | — |
| | — |
| | 175 |
| | 271 |
| | 446 |
| | (75 | ) | | 2007 | | 07/17/13 | | 3 to 26 Years |
| Starbucks | Kingsport, TN | | (d) | | 307 |
| | 766 |
| | — |
| | — |
| | 307 |
| | 766 |
| | 1,073 |
| | (146 | ) | | 2007 | | 07/17/13 | | 4 to 32 Years |
| Starbucks | Altus, OK | | (a) | | 103 |
| | 237 |
| | — |
| | — |
| | 103 |
| | 237 |
| | 340 |
| | (64 | ) | | 2007 | | 07/17/13 | | 4 to 28 Years |
| Starbucks | Oklahoma City, OK | | (a) | | 541 |
| | 842 |
| | (398 | ) | | (614 | ) | | 143 |
| | 228 |
| | 371 |
| | (72 | ) | | 2007 | | 07/17/13 | | 4 to 33 Years |
| Stater Bros. Markets | Lancaster, CA | | (d) | | 1,569 |
| | 4,271 |
| | — |
| | — |
| | 1,569 |
| | 4,271 |
| | 5,840 |
| | (748 | ) | | 1983 | | 12/17/13 | | 5 to 30 Years |
| Station Casinos | Las Vegas, NV | | (a) | | 3,225 |
| | 30,483 |
| | — |
| | — |
| | 3,225 |
| | 30,483 |
| | 33,708 |
| | (3,238 | ) | | 2007 | | 07/17/13 | | 13 to 55 Years |
| Studio Movie Grill | Downey, CA | | (d) | | 1,767 |
| | 12,172 |
| | — |
| | 1,850 |
| | 1,767 |
| | 14,022 |
| | 15,789 |
| | (956 | ) | | 1997 | | 09/30/15 | | 15 to 30 Years |
| Studio Movie Grill | Monrovia, CA | | (d) | | 2,448 |
| | 17,849 |
| | — |
| | 1,850 |
| | 2,448 |
| | 19,699 |
| | 22,147 |
| | (1,360 | ) | | 2000 | | 09/30/15 | | 15 to 30 Years |
| Studio Movie Grill | Redlands, CA | | (d) | | 4,442 |
| | 17,859 |
| | — |
| | 1,850 |
| | 4,442 |
| | 19,709 |
| | 24,151 |
| | (1,442 | ) | | 1997 | | 09/30/15 | | 15 to 30 Years |
| Studio Movie Grill | Marietta, GA | | (d) | | 2,930 |
| | 7,616 |
| | — |
| | 67 |
| | 2,930 |
| | 7,683 |
| | 10,613 |
| | (140 | ) | | 1987 | | 03/15/17 | | 10 to 40 Years |
| Sunny Delight | Dayton, NJ | | (d) | | 12,701 |
| | 10,723 |
| | — |
| | — |
| | 12,701 |
| | 10,723 |
| | 23,424 |
| | (774 | ) | | 1975 | | 10/27/16 | | 7 to 30 Years |
| Taco Bell | Red Bank, TN | | (a) | | 610 |
| | 557 |
| | — |
| | — |
| | 610 |
| | 557 |
| | 1,167 |
| | (386 | ) | | 1997 | | 06/25/04 | | 15 to 30 Years |
| Taco Bell | Chattanooga, TN | | (a) | | 482 |
| | 682 |
| | — |
| | — |
| | 482 |
| | 682 |
| | 1,164 |
| | (362 | ) | | 1997 | | 06/25/04 | | 15 to 30 Years |
| Taco Bell | Chattanooga, TN | | (a) | | 600 |
| | 389 |
| | — |
| | — |
| | 600 |
| | 389 |
| | 989 |
| | (195 | ) | | 1995 | | 09/29/06 | | 15 to 30 Years |
| Taco Bell | Tipp City, OH | | (a) | | 789 |
| | 332 |
| | — |
| | — |
| | 789 |
| | 332 |
| | 1,121 |
| | (278 | ) | | 1991 | | 12/29/06 | | 15 to 20 Years |
| Taco Bell | Bellefontaine, OH | | (a) | | 388 |
| | 778 |
| | (12 | ) | | — |
| | 376 |
| | 778 |
| | 1,154 |
| | (480 | ) | | 1989 | | 12/29/06 | | 15 to 20 Years |
| Taco Bell | Sedalia, MO | | (a) | | 751 |
| | 662 |
| | — |
| | — |
| | 751 |
| | 662 |
| | 1,413 |
| | (389 | ) | | 1983 | | 12/29/06 | | 15 to 30 Years |
| Taco Bell | Springfield, MO | | (a) | | 439 |
| | 719 |
| | — |
| | — |
| | 439 |
| | 719 |
| | 1,158 |
| | (371 | ) | | 2004 | | 12/29/06 | | 15 to 40 Years |
| Taco Bell | Danville, IL | | (a) | | 619 |
| | 672 |
| | — |
| | — |
| | 619 |
| | 672 |
| | 1,291 |
| | (386 | ) | | 1995 | | 12/29/06 | | 15 to 30 Years |
| Taco Bell | Boone, NC | | (a) | | 750 |
| | 379 |
| | — |
| | — |
| | 750 |
| | 379 |
| | 1,129 |
| | (235 | ) | | 2006 | | 12/29/06 | | 15 to 30 Years |
SPIRIT REALTY CAPITAL, INC.
Schedule III Real Estate and
Accumulated Depreciation
(Amounts in thousands)
|
| | | | | | | | | | | | | | | | | | | | | | | | | |
| | | | | Initial Cost to Company | | Cost Capitalized Subsequent to Acquisition including impairment | | Gross Amount at December 31, 2017 (g) | | | | | | | | |
| Concept | City, State | | Encumbrances (e) | | Land and Improvements | | Buildings and Improvements | | Land and Improvements | | Buildings and Improvements | | Land and Improvements | | Buildings and Improvements | | Total | | Final Accumulated Depreciation | | Date of Construction | | Date Acquired | | Life in which depreciation in latest Statement of Operations is computed |
|
| | | | | | | | | | | | | | | | | | | | | | | | | | | | | | | | | |
| Taco Bell | Cleveland, TN | | (a) | | 501 |
| | 459 |
| | — |
| | — |
| | 501 |
| | 459 |
| | 960 |
| | (204 | ) | | 2004 | | 12/29/06 | | 15 to 40 Years |
| Taco Bell | Mount Pleasant, MI | | (a) | | 657 |
| | 854 |
| | — |
| | — |
| | 657 |
| | 854 |
| | 1,511 |
| | (379 | ) | | 2010 | | 02/13/09 | | 13 to 38 Years |
| Taco Bell | Dayton, OH | | (a) | | 526 |
| | 598 |
| | — |
| | — |
| | 526 |
| | 598 |
| | 1,124 |
| | (398 | ) | | 1982 | | 12/08/09 | | 12 to 17 Years |
| Taco Bell | Greenville, TN | | (b) | | 735 |
| | 517 |
| | — |
| | — |
| | 735 |
| | 517 |
| | 1,252 |
| | (132 | ) | | 2010 | | 03/29/13 | | 15 to 30 Years |
| Taco Bell | Moultrie, GA | | (b) | | 437 |
| | 563 |
| | — |
| | — |
| | 437 |
| | 563 |
| | 1,000 |
| | (133 | ) | | 2012 | | 03/29/13 | | 15 to 30 Years |
| Taco Bell | Princeton, IN | | (b) | | 340 |
| | 906 |
| | — |
| | — |
| | 340 |
| | 906 |
| | 1,246 |
| | (339 | ) | | 1992 | | 07/17/13 | | 7 to 15 Years |
| Taco Bell | Robinson, IL | | (b) | | 250 |
| | 1,021 |
| | — |
| | — |
| | 250 |
| | 1,021 |
| | 1,271 |
| | (203 | ) | | 1994 | | 07/17/13 | | 7 to 33 Years |
| Taco Bell | Brazil, IN | | (b) | | 391 |
| | 903 |
| | — |
| | — |
| | 391 |
| | 903 |
| | 1,294 |
| | (183 | ) | | 1996 | | 07/17/13 | | 8 to 33 Years |
| Taco Bell | Washington, IN | | (b) | | 272 |
| | 949 |
| | — |
| | — |
| | 272 |
| | 949 |
| | 1,221 |
| | (195 | ) | | 1995 | | 07/17/13 | | 8 to 33 Years |
| Taco Bell | Henderson, KY | | (b) | | 656 |
| | 1,058 |
| | — |
| | — |
| | 656 |
| | 1,058 |
| | 1,714 |
| | (175 | ) | | 1992 | | 07/17/13 | | 7 to 35 Years |
| Taco Bell | Martinsville, IN | | (b) | | 940 |
| | 1,128 |
| | — |
| | — |
| | 940 |
| | 1,128 |
| | 2,068 |
| | (213 | ) | | 1986 | | 07/17/13 | | 4 to 35 Years |
| Taco Bell | Anderson, IN | | (b) | | 363 |
| | 700 |
| | — |
| | — |
| | 363 |
| | 700 |
| | 1,063 |
| | (237 | ) | | 1995 | | 07/17/13 | | 8 to 17 Years |
| Taco Bell / KFC | Vincennes, IN | | (b) | | 389 |
| | 1,425 |
| | — |
| | — |
| | 389 |
| | 1,425 |
| | 1,814 |
| | (268 | ) | | 2000 | | 07/17/13 | | 8 to 30 Years |
| Taco Bell / KFC | Spencer, IN | | (b) | | 136 |
| | 1,040 |
| | — |
| | — |
| | 136 |
| | 1,040 |
| | 1,176 |
| | (241 | ) | | 1999 | | 07/17/13 | | 8 to 22 Years |
| Taco Bueno | Yukon, OK | | (a) | | 555 |
| | 373 |
| | — |
| | — |
| | 555 |
| | 373 |
| | 928 |
| | (261 | ) | | 2003 | | 07/01/05 | | 15 to 30 Years |
| Taco Bueno | Cedar Hill, TX | | (a) | | 620 |
| | 501 |
| | — |
| | — |
| | 620 |
| | 501 |
| | 1,121 |
| | (303 | ) | | 2005 | | 12/29/06 | | 15 to 30 Years |
| Taco Bueno | Mansfield, TX | | (a) | | 472 |
| | 760 |
| | — |
| | — |
| | 472 |
| | 760 |
| | 1,232 |
| | (428 | ) | | 1991 | | 12/29/06 | | 15 to 30 Years |
| Taco Bueno | Hurst, TX | | (d) | | 505 |
| | 66 |
| | — |
| | — |
| | 505 |
| | 66 |
| | 571 |
| | (18 | ) | | 1978 | | 06/30/16 | | 5 to 10 Years |
| Taco Bueno | Arlington, TX | | (d) | | 449 |
| | 128 |
| | — |
| | — |
| | 449 |
| | 128 |
| | 577 |
| | (42 | ) | | 1978 | | 06/30/16 | | 4 to 10 Years |
| Taco Bueno | Fort Worth, TX | | (d) | | 331 |
| | 450 |
| | — |
| | — |
| | 331 |
| | 450 |
| | 781 |
| | (44 | ) | | 1977 | | 06/30/16 | | 5 to 20 Years |
| Taco Bueno | Bedford, TX | | (d) | | 694 |
| | 516 |
| | — |
| | — |
| | 694 |
| | 516 |
| | 1,210 |
| | (56 | ) | | 1977 | | 06/30/16 | | 5 to 20 Years |
| Taco Bueno | Tulsa, OK | | (d) | | 835 |
| | 967 |
| | — |
| | — |
| | 835 |
| | 967 |
| | 1,802 |
| | (64 | ) | | 1978 | | 06/30/16 | | 5 to 30 Years |
| Taco Bueno | Fort Worth, TX | | (d) | | 377 |
| | 193 |
| | — |
| | — |
| | 377 |
| | 193 |
| | 570 |
| | (48 | ) | | 1978 | | 06/30/16 | | 4 to 10 Years |
| Taco Bueno | Euless, TX | | (d) | | 674 |
| | 277 |
| | — |
| | — |
| | 674 |
| | 277 |
| | 951 |
| | (43 | ) | | 1979 | | 06/30/16 | | 5 to 20 Years |
| Taco Bueno | Abilene, TX | | (d) | | 1,132 |
| | 1,292 |
| | — |
| | — |
| | 1,132 |
| | 1,292 |
| | 2,424 |
| | (92 | ) | | 1979 | | 06/30/16 | | 5 to 30 Years |
| Taco Bueno | Arlington, TX | | (d) | | 540 |
| | 1,205 |
| | — |
| | — |
| | 540 |
| | 1,205 |
| | 1,745 |
| | (77 | ) | | 1981 | | 06/30/16 | | 5 to 30 Years |
| Taco Bueno | Denton, TX | | (d) | | 693 |
| | 884 |
| | — |
| | — |
| | 693 |
| | 884 |
| | 1,577 |
| | (67 | ) | | 1995 | | 06/30/16 | | 5 to 30 Years |
| Taco Bueno | Lake Worth, TX | | (d) | | 427 |
| | 872 |
| | — |
| | — |
| | 427 |
| | 872 |
| | 1,299 |
| | (56 | ) | | 1983 | | 06/30/16 | | 5 to 30 Years |
| Taco Bueno | Tulsa, OK | | (d) | | 760 |
| | 381 |
| | — |
| | — |
| | 760 |
| | 381 |
| | 1,141 |
| | (43 | ) | | 1984 | | 06/30/16 | | 5 to 20 Years |
| Taco Bueno | Garland, TX | | (d) | | 532 |
| | 442 |
| | — |
| | — |
| | 532 |
| | 442 |
| | 974 |
| | (34 | ) | | 1979 | | 06/30/16 | | 5 to 30 Years |
| Taco Bueno | Grapevine, TX | | (d) | | 636 |
| | 414 |
| | — |
| | — |
| | 636 |
| | 414 |
| | 1,050 |
| | (43 | ) | | 1979 | | 06/30/16 | | 5 to 20 Years |
| Taco Bueno | Muskogee, OK | | (d) | | 853 |
| | 767 |
| | — |
| | — |
| | 853 |
| | 767 |
| | 1,620 |
| | (59 | ) | | 1985 | | 06/30/16 | | 5 to 30 Years |
SPIRIT REALTY CAPITAL, INC.
Schedule III Real Estate and
Accumulated Depreciation
(Amounts in thousands)
|
| | | | | | | | | | | | | | | | | | | | | | | | | |
| | | | | Initial Cost to Company | | Cost Capitalized Subsequent to Acquisition including impairment | | Gross Amount at December 31, 2017 (g) | | | | | | | | |
| Concept | City, State | | Encumbrances (e) | | Land and Improvements | | Buildings and Improvements | | Land and Improvements | | Buildings and Improvements | | Land and Improvements | | Buildings and Improvements | | Total | | Final Accumulated Depreciation | | Date of Construction | | Date Acquired | | Life in which depreciation in latest Statement of Operations is computed |
|
| | | | | | | | | | | | | | | | | | | | | | | | | | | | | | | | | |
| Taco Bueno | Oklahoma City, OK | | (d) | | 474 |
| | 516 |
| | — |
| | — |
| | 474 |
| | 516 |
| | 990 |
| | (56 | ) | | 1984 | | 06/30/16 | | 5 to 20 Years |
| Taco Bueno | Fort Worth, TX | | (d) | | 335 |
| | 257 |
| | — |
| | — |
| | 335 |
| | 257 |
| | 592 |
| | (35 | ) | | 1985 | | 06/30/16 | | 5 to 20 Years |
| Taco Bueno | Claremore, OK | | (d) | | 903 |
| | 932 |
| | — |
| | — |
| | 903 |
| | 932 |
| | 1,835 |
| | (69 | ) | | 1985 | | 06/30/16 | | 5 to 30 Years |
| Taco Bueno | Oklahoma City, OK | | (d) | | 467 |
| | 273 |
| | — |
| | — |
| | 467 |
| | 273 |
| | 740 |
| | (50 | ) | | 1986 | | 06/30/16 | | 5 to 10 Years |
| Taco Bueno | Broken Arrow, OK | | (d) | | 849 |
| | 1,020 |
| | — |
| | — |
| | 849 |
| | 1,020 |
| | 1,869 |
| | (67 | ) | | 1986 | | 06/30/16 | | 5 to 30 Years |
| Taco Bueno | Dallas, TX | | (d) | | 526 |
| | 203 |
| | — |
| | — |
| | 526 |
| | 203 |
| | 729 |
| | (41 | ) | | 1987 | | 06/30/16 | | 5 to 10 Years |
| Taco Bueno | Sapulpa, OK | | (d) | | 855 |
| | 1,030 |
| | — |
| | — |
| | 855 |
| | 1,030 |
| | 1,885 |
| | (76 | ) | | 1987 | | 06/30/16 | | 5 to 30 Years |
| Taco Bueno | Abilene, TX | | (d) | | 510 |
| | 818 |
| | — |
| | — |
| | 510 |
| | 818 |
| | 1,328 |
| | (60 | ) | | 1977 | | 06/30/16 | | 5 to 30 Years |
| Taco Bueno | Oklahoma City, OK | | (d) | | 375 |
| | 605 |
| | — |
| | — |
| | 375 |
| | 605 |
| | 980 |
| | (42 | ) | | 1986 | | 06/30/16 | | 5 to 30 Years |
| Taco Bueno | Greenville, TX | | (d) | | 429 |
| | 919 |
| | — |
| | — |
| | 429 |
| | 919 |
| | 1,348 |
| | (58 | ) | | 1985 | | 06/30/16 | | 5 to 30 Years |
| Taco Bueno | Irving, TX | | (d) | | 481 |
| | 358 |
| | — |
| | — |
| | 481 |
| | 358 |
| | 839 |
| | (39 | ) | | 1978 | | 06/30/16 | | 5 to 20 Years |
| Taco Bueno | Haltom City, TX | | (d) | | 689 |
| | 804 |
| | — |
| | — |
| | 689 |
| | 804 |
| | 1,493 |
| | (63 | ) | | 1998 | | 06/30/16 | | 5 to 30 Years |
| Taco Bueno | Grapevine, TX | | (d) | | 755 |
| | 677 |
| | — |
| | — |
| | 755 |
| | 677 |
| | 1,432 |
| | (75 | ) | | 1999 | | 06/30/16 | | 5 to 20 Years |
| Taco Bueno | Fort Worth, TX | | (d) | | 681 |
| | 928 |
| | — |
| | — |
| | 681 |
| | 928 |
| | 1,609 |
| | (71 | ) | | 1999 | | 06/30/16 | | 5 to 30 Years |
| Taco Bueno | Forest Hill, TX | | (d) | | 784 |
| | 294 |
| | — |
| | — |
| | 784 |
| | 294 |
| | 1,078 |
| | (49 | ) | | 1999 | | 06/30/16 | | 5 to 20 Years |
| Taco Bueno | McKinney, TX | | (d) | | 1,289 |
| | 467 |
| | — |
| | — |
| | 1,289 |
| | 467 |
| | 1,756 |
| | (68 | ) | | 2000 | | 06/30/16 | | 5 to 20 Years |
| Taco Bueno | Tulsa, OK | | (d) | | — |
| | 20 |
| | — |
| | — |
| | — |
| | 20 |
| | 20 |
| | (3 | ) | | 1982 | | 06/30/16 | | 10 to 10 Years |
| Taco Bueno | Enid, OK | | (d) | | 40 |
| | 55 |
| | — |
| | — |
| | 40 |
| | 55 |
| | 95 |
| | (28 | ) | | 1985 | | 06/30/16 | | 3 to 10 Years |
| Taco Bueno | Southlake, TX | | (d) | | 30 |
| | 58 |
| | — |
| | — |
| | 30 |
| | 58 |
| | 88 |
| | (24 | ) | | 1999 | | 06/30/16 | | 3 to 10 Years |
| Ted's Cafe Escondido | Broken Arrow, OK | | (a) | | 1,636 |
| | 1,620 |
| | — |
| | — |
| | 1,636 |
| | 1,620 |
| | 3,256 |
| | (279 | ) | | 2006 | | 07/21/14 | | 14 to 30 Years |
| Ted's Cafe Escondido | Tulsa, OK | | (a) | | 1,465 |
| | 1,728 |
| | — |
| | — |
| | 1,465 |
| | 1,728 |
| | 3,193 |
| | (280 | ) | | 2013 | | 07/21/14 | | 14 to 30 Years |
| Terra Mulch Products | Hickory, NC | | (d) | | 1,356 |
| | 5,406 |
| | — |
| | — |
| | 1,356 |
| | 5,406 |
| | 6,762 |
| | (683 | ) | | 2006 | | 05/11/15 | | 10 to 30 Years |
| Texas Corral | Shelbyville, IN | | (d) | | 549 |
| | 752 |
| | — |
| | — |
| | 549 |
| | 752 |
| | 1,301 |
| | (287 | ) | | 2006 | | 12/21/07 | | 15 to 50 Years |
| Texas Roadhouse | Hiram, GA | | (a) | | 1,255 |
| | 1,766 |
| | — |
| | — |
| | 1,255 |
| | 1,766 |
| | 3,021 |
| | (572 | ) | | 2003 | | 01/16/15 | | 9 to 15 Years |
| Texas Roadhouse | Marietta, GA | | (a) | | 1,221 |
| | 1,533 |
| | — |
| | — |
| | 1,221 |
| | 1,533 |
| | 2,754 |
| | (491 | ) | | 2003 | | 01/16/15 | | 9 to 15 Years |
| Texas Roadhouse | Memphis, TN | | (a) | | 817 |
| | 1,637 |
| | — |
| | — |
| | 817 |
| | 1,637 |
| | 2,454 |
| | (530 | ) | | 2005 | | 01/16/15 | | 9 to 15 Years |
| The Atlanta Center for Foot & Ankle Surgery | Sandy Springs, GA | | (a) | | 455 |
| | 1,147 |
| | — |
| | — |
| | 455 |
| | 1,147 |
| | 1,602 |
| | (227 | ) | | 1963 | | 04/17/14 | | 14 to 20 Years |
| The Children's Courtyard | Frederick, CO | | (d) | | 334 |
| | 2,146 |
| | — |
| | 37 |
| | 334 |
| | 2,183 |
| | 2,517 |
| | (57 | ) | | 2003 | | 03/31/17 | | 15 to 30 Years |
SPIRIT REALTY CAPITAL, INC.
Schedule III Real Estate and
Accumulated Depreciation
(Amounts in thousands)
|
| | | | | | | | | | | | | | | | | | | | | | | | | |
| | | | | Initial Cost to Company | | Cost Capitalized Subsequent to Acquisition including impairment | | Gross Amount at December 31, 2017 (g) | | | | | | | | |
| Concept | City, State | | Encumbrances (e) | | Land and Improvements | | Buildings and Improvements | | Land and Improvements | | Buildings and Improvements | | Land and Improvements | | Buildings and Improvements | | Total | | Final Accumulated Depreciation | | Date of Construction | | Date Acquired | | Life in which depreciation in latest Statement of Operations is computed |
|
| | | | | | | | | | | | | | | | | | | | | | | | | | | | | | | | | |
| The Forge Bar and Grill | Lander, WY | | (a) | | 57 |
| | 1,010 |
| | — |
| | — |
| | 57 |
| | 1,010 |
| | 1,067 |
| | (564 | ) | | 1883 | | 12/29/06 | | 15 to 20 Years |
| The Great Escape | Davenport, IA | | (a) | | 2,823 |
| | 4,475 |
| | — |
| | — |
| | 2,823 |
| | 4,475 |
| | 7,298 |
| | (1,716 | ) | | 2007 | | 04/30/09 | | 13 to 38 Years |
| The Great Escape | Avon, OH | | (a) | | 1,550 |
| | 2,750 |
| | — |
| | — |
| | 1,550 |
| | 2,750 |
| | 4,300 |
| | (993 | ) | | 2007 | | 04/30/09 | | 13 to 38 Years |
| The Great Escape | Peoria, IL | | (a) | | 2,497 |
| | 4,401 |
| | — |
| | — |
| | 2,497 |
| | 4,401 |
| | 6,898 |
| | (1,631 | ) | | 2004 | | 04/30/09 | | 13 to 38 Years |
| The Great Escape | Loves Park, IL | | (a) | | 1,550 |
| | 6,447 |
| | — |
| | — |
| | 1,550 |
| | 6,447 |
| | 7,997 |
| | (1,990 | ) | | 2004 | | 04/30/09 | | 13 to 38 Years |
| The Great Escape | Tinley Park, IL | | (a) | | 1,108 |
| | 2,091 |
| | — |
| | — |
| | 1,108 |
| | 2,091 |
| | 3,199 |
| | (864 | ) | | 1990 | | 04/30/09 | | 13 to 28 Years |
| The Great Escape | Schaumburg, IL | | (a) | | 2,067 |
| | 2,632 |
| | — |
| | — |
| | 2,067 |
| | 2,632 |
| | 4,699 |
| | (1,160 | ) | | 2002 | | 04/30/09 | | 13 to 28 Years |
| The Great Escape | Merrillville, IN | | (a) | | 1,323 |
| | 3,975 |
| | — |
| | — |
| | 1,323 |
| | 3,975 |
| | 5,298 |
| | (1,737 | ) | | 1986 | | 04/30/09 | | 13 to 28 Years |
| The Great Escape | Mundelein, IL | | (a) | | 1,991 |
| | 4,307 |
| | — |
| | — |
| | 1,991 |
| | 4,307 |
| | 6,298 |
| | (1,822 | ) | | 2002 | | 04/30/09 | | 13 to 28 Years |
| The Great Escape | Joliet, IL | | (a) | | 1,700 |
| | 5,698 |
| | — |
| | — |
| | 1,700 |
| | 5,698 |
| | 7,398 |
| | (1,830 | ) | | 2004 | | 04/30/09 | | 13 to 38 Years |
| The Great Escape | Downers Grove, IL | | (a) | | 1,772 |
| | 2,227 |
| | — |
| | — |
| | 1,772 |
| | 2,227 |
| | 3,999 |
| | (1,044 | ) | | 1994 | | 04/30/09 | | 13 to 28 Years |
| The Great Escape | Gurnee, IL | | (a) | | 767 |
| | 1,633 |
| | — |
| | — |
| | 767 |
| | 1,633 |
| | 2,400 |
| | (774 | ) | | 1999 | | 04/30/09 | | 13 to 28 Years |
| The Great Escape | Batavia, IL | | (a) | | 1,858 |
| | 3,441 |
| | — |
| | — |
| | 1,858 |
| | 3,441 |
| | 5,299 |
| | (1,487 | ) | | 2001 | | 04/30/09 | | 13 to 28 Years |
|
| | | | | | | | | | | | | | | | | | | | | | | | | | | | | | | | | |
| The Great Escape | Aurora, IL | | (a) | | 1,979 |
| | 4,111 |
| | — |
| | (1 | ) | | 1,979 |
| | 4,110 |
| | 6,089 |
| | (1,672 | ) | | 1989 | | 04/30/09 | | 13 to 28 Years |
| The Great Escape | Algonquin, IL | | (a) | | 4,171 |
| | 5,613 |
| | — |
| | — |
| | 4,171 |
| | 5,613 |
| | 9,784 |
| | (1,943 | ) | | 2007 | | 04/30/09 | | 13 to 38 Years |
| Tire Warehouse | Portland, ME | | (a) | | 650 |
| | 566 |
| | — |
| | — |
| | 650 |
| | 566 |
| | 1,216 |
| | (58 | ) | | 1993 | | 06/30/09 | | 13 to 28 Years |
| Touchstone Imaging | Waco, TX | | (a) | | 232 |
| | 1,510 |
| | — |
| | — |
| | 232 |
| | 1,510 |
| | 1,742 |
| | (149 | ) | | 1992 | | 06/20/14 | | 15 to 40 Years |
| Tractor Supply | Parkersburg, WV | | (d) | | 966 |
| | 1,843 |
| | — |
| | — |
| | 966 |
| | 1,843 |
| | 2,809 |
| | (412 | ) | | 2005 | | 07/17/13 | | 7 to 37 Years |
| Tractor Supply | Ankeny, IA | | (d) | | 687 |
| | 2,162 |
| | — |
| | — |
| | 687 |
| | 2,162 |
| | 2,849 |
| | (373 | ) | | 2006 | | 07/17/13 | | 8 to 43 Years |
| Tractor Supply | Marinette, WI | | (d) | | 1,236 |
| | 1,611 |
| | — |
| | — |
| | 1,236 |
| | 1,611 |
| | 2,847 |
| | (397 | ) | | 2006 | | 07/17/13 | | 8 to 38 Years |
| Tractor Supply | Paw Paw, MI | | (d) | | 1,517 |
| | 1,619 |
| | — |
| | — |
| | 1,517 |
| | 1,619 |
| | 3,136 |
| | (471 | ) | | 2006 | | 07/17/13 | | 8 to 33 Years |
| Tractor Supply | Rockford, MN | | (d) | | 1,298 |
| | 2,652 |
| | — |
| | — |
| | 1,298 |
| | 2,652 |
| | 3,950 |
| | (523 | ) | | 2007 | | 07/17/13 | | 9 to 43 Years |
| Tractor Supply | Navasota, TX | | (d) | | 1,013 |
| | 1,772 |
| | — |
| | — |
| | 1,013 |
| | 1,772 |
| | 2,785 |
| | (431 | ) | | 2006 | | 07/17/13 | | 8 to 41 Years |
| Tractor Supply | Fredericksburg, TX | | (d) | | 1,194 |
| | 1,636 |
| | — |
| | — |
| | 1,194 |
| | 1,636 |
| | 2,830 |
| | (388 | ) | | 2007 | | 07/17/13 | | 8 to 42 Years |
| Tractor Supply | Fairview, TN | | (d) | | 975 |
| | 2,274 |
| | — |
| | — |
| | 975 |
| | 2,274 |
| | 3,249 |
| | (411 | ) | | 2007 | | 07/17/13 | | 8 to 47 Years |
| Tractor Supply | Baytown, TX | | (d) | | 1,440 |
| | 1,712 |
| | — |
| | — |
| | 1,440 |
| | 1,712 |
| | 3,152 |
| | (378 | ) | | 2007 | | 07/17/13 | | 9 to 39 Years |
| Tractor Supply | Prior Lake, MN | | (d) | | 1,998 |
| | 2,454 |
| | — |
| | — |
| | 1,998 |
| | 2,454 |
| | 4,452 |
| | (645 | ) | | 1991 | | 07/17/13 | | 7 to 26 Years |
| Tractor Supply | Rome, NY | | (d) | | 1,326 |
| | 1,110 |
| | — |
| | — |
| | 1,326 |
| | 1,110 |
| | 2,436 |
| | (338 | ) | | 2007 | | 07/17/13 | | 9 to 34 Years |
| Tractor Supply | Carroll, OH | | (d) | | 1,144 |
| | 4,557 |
| | — |
| | — |
| | 1,144 |
| | 4,557 |
| | 5,701 |
| | (1,072 | ) | | 1976 | | 07/17/13 | | 3 to 30 Years |
| Tractor Supply | Baldwinsville, NY | | (c) | | 1,105 |
| | 2,008 |
| | — |
| | — |
| | 1,105 |
| | 2,008 |
| | 3,113 |
| | (527 | ) | | 2005 | | 07/17/13 | | 11 to 37 Years |
SPIRIT REALTY CAPITAL, INC.
Schedule III Real Estate and
Accumulated Depreciation
(Amounts in thousands)
|
| | | | | | | | | | | | | | | | | | | | | | | | | |
| | | | | Initial Cost to Company | | Cost Capitalized Subsequent to Acquisition including impairment | | Gross Amount at December 31, 2017 (g) | | | | | | | | |
| Concept | City, State | | Encumbrances (e) | | Land and Improvements | | Buildings and Improvements | | Land and Improvements | | Buildings and Improvements | | Land and Improvements | | Buildings and Improvements | | Total | | Final Accumulated Depreciation | | Date of Construction | | Date Acquired | | Life in which depreciation in latest Statement of Operations is computed |
|
| | | | | | | | | | | | | | | | | | | | | | | | | | | | | | | | | |
| Tractor Supply | La Grange, KY | | (c) | | 1,524 |
| | 1,871 |
| | — |
| | — |
| | 1,524 |
| | 1,871 |
| | 3,395 |
| | (360 | ) | | 2008 | | 07/17/13 | | 10 to 48 Years |
| Tractor Supply | Lowville, NY | | (c) | | 791 |
| | 1,659 |
| | — |
| | — |
| | 791 |
| | 1,659 |
| | 2,450 |
| | (331 | ) | | 2010 | | 07/17/13 | | 12 to 42 Years |
| Tractor Supply | Malone, NY | | (c) | | 793 |
| | 1,677 |
| | — |
| | — |
| | 793 |
| | 1,677 |
| | 2,470 |
| | (377 | ) | | 2010 | | 07/17/13 | | 11 to 42 Years |
| Tractor Supply | Ellettsville, IN | | (c) | | 894 |
| | 1,872 |
| | — |
| | — |
| | 894 |
| | 1,872 |
| | 2,766 |
| | (391 | ) | | 2010 | | 07/17/13 | | 11 to 47 Years |
| Tractor Supply | Mount Sterling, KY | | (d) | | 1,785 |
| | 1,051 |
| | — |
| | — |
| | 1,785 |
| | 1,051 |
| | 2,836 |
| | (378 | ) | | 2011 | | 07/17/13 | | 12 to 38 Years |
| Tractor Supply | Clovis, NM | | (a) | | 1,704 |
| | 1,342 |
| | — |
| | — |
| | 1,704 |
| | 1,342 |
| | 3,046 |
| | (467 | ) | | 2007 | | 07/17/13 | | 9 to 33 Years |
| Tutor Time | Pittsburgh, PA | | (b) | | 457 |
| | 693 |
| | — |
| | — |
| | 457 |
| | 693 |
| | 1,150 |
| | (292 | ) | | 1985 | | 07/17/13 | | 5 to 15 Years |
| Tutor Time | Grand Rapids, MI | | (d) | | 393 |
| | 1,363 |
| | — |
| | — |
| | 393 |
| | 1,363 |
| | 1,756 |
| | (168 | ) | | 2001 | | 03/20/15 | | 5 to 30 Years |
| Twin Peaks | Little Rock, AR | | (a) | | 886 |
| | — |
| | — |
| | — |
| | 886 |
| | — |
| | 886 |
| | — |
| | (f) | | 06/26/14 | | (f) |
| Twin Tiers Eye Care | Elmira, NY | | (d) | | 184 |
| | 3,902 |
| | — |
| | — |
| | 184 |
| | 3,902 |
| | 4,086 |
| | (369 | ) | | 1985 | | 04/30/15 | | 15 to 30 Years |
| Twin Tiers Eye Care | Binghamton, NY | | (d) | | 328 |
| | 2,214 |
| | — |
| | — |
| | 328 |
| | 2,214 |
| | 2,542 |
| | (213 | ) | | 1985 | | 04/30/15 | | 15 to 30 Years |
| Twin Tiers Eye Care | Bath, NY | | (d) | | 72 |
| | 707 |
| | — |
| | — |
| | 72 |
| | 707 |
| | 779 |
| | (72 | ) | | 1970 | | 04/30/15 | | 15 to 30 Years |
| Twin Tiers Eye Care | Corning, NY | | (d) | | 123 |
| | 1,261 |
| | — |
| | — |
| | 123 |
| | 1,261 |
| | 1,384 |
| | (125 | ) | | 1999 | | 04/30/15 | | 15 to 30 Years |
| Twin Tiers Eye Care | Endicott, NY | | (d) | | 92 |
| | 348 |
| | — |
| | — |
| | 92 |
| | 348 |
| | 440 |
| | (44 | ) | | 2001 | | 04/30/15 | | 15 to 30 Years |
| Twin Tiers Eye Care | Watkins Glen, NY | | (d) | | 113 |
| | 318 |
| | — |
| | — |
| | 113 |
| | 318 |
| | 431 |
| | (43 | ) | | 2002 | | 04/30/15 | | 15 to 30 Years |
| Uncle Ed's Oil Shoppe | Battle Creek, MI | | (a) | | 211 |
| | 419 |
| | — |
| | — |
| | 211 |
| | 419 |
| | 630 |
| | (90 | ) | | 1981 | | 06/23/14 | | 15 to 20 Years |
| Uncle Ed's Oil Shoppe | Kalamazoo, MI | | (a) | | 247 |
| | 333 |
| | — |
| | — |
| | 247 |
| | 333 |
| | 580 |
| | (69 | ) | | 1982 | | 07/30/14 | | 15 to 20 Years |
| Uncle Ed's Oil Shoppe | Kalamazoo, MI | | (a) | | 201 |
| | 362 |
| | — |
| | — |
| | 201 |
| | 362 |
| | 563 |
| | (77 | ) | | 1987 | | 06/23/14 | | 15 to 20 Years |
| Uncle Ed's Oil Shoppe | Kalamazoo, MI | | (a) | | 312 |
| | 262 |
| | — |
| | — |
| | 312 |
| | 262 |
| | 574 |
| | (62 | ) | | 1984 | | 06/23/14 | | 15 to 20 Years |
| Uncle Ed's Oil Shoppe | Troy, MI | | (a) | | 322 |
| | 392 |
| | — |
| | — |
| | 322 |
| | 392 |
| | 714 |
| | (85 | ) | | 1984 | | 06/23/14 | | 15 to 20 Years |
| Uncle Ed's Oil Shoppe | Portage, MI | | (a) | | 423 |
| | 262 |
| | — |
| | — |
| | 423 |
| | 262 |
| | 685 |
| | (65 | ) | | 1985 | | 06/23/14 | | 15 to 20 Years |
| Uncle Ed's Oil Shoppe | Madison Heights, MI | | (a) | | 352 |
| | 493 |
| | — |
| | — |
| | 352 |
| | 493 |
| | 845 |
| | (110 | ) | | 1984 | | 06/23/14 | | 15 to 20 Years |
| Uncle Ed's Oil Shoppe | Kalamazoo, MI | | (a) | | 60 |
| | 211 |
| | — |
| | — |
| | 60 |
| | 211 |
| | 271 |
| | (44 | ) | | 1986 | | 06/23/14 | | 15 to 20 Years |
SPIRIT REALTY CAPITAL, INC.
Schedule III Real Estate and
Accumulated Depreciation
(Amounts in thousands)
|
| | | | | | | | | | | | | | | | | | | | | | | | | |
| | | | | Initial Cost to Company | | Cost Capitalized Subsequent to Acquisition including impairment | | Gross Amount at December 31, 2017 (g) | | | | | | | | |
| Concept | City, State | | Encumbrances (e) | | Land and Improvements | | Buildings and Improvements | | Land and Improvements | | Buildings and Improvements | | Land and Improvements | | Buildings and Improvements | | Total | | Final Accumulated Depreciation | | Date of Construction | | Date Acquired | | Life in which depreciation in latest Statement of Operations is computed |
|
| | | | | | | | | | | | | | | | | | | | | | | | | | | | | | | | | |
| Uncle Ed's Oil Shoppe | Warren, MI | | (a) | | 409 |
| | 344 |
| | — |
| | — |
| | 409 |
| | 344 |
| | 753 |
| | (76 | ) | | 1986 | | 07/30/14 | | 15 to 20 Years |
| Uncle Ed's Oil Shoppe | Clawson, MI | | (a) | | 262 |
| | 242 |
| | — |
| | — |
| | 262 |
| | 242 |
| | 504 |
| | (56 | ) | | 1984 | | 06/23/14 | | 15 to 20 Years |
| Uncle Ed's Oil Shoppe | Livonia, MI | | (a) | | 252 |
| | 262 |
| | — |
| | — |
| | 252 |
| | 262 |
| | 514 |
| | (62 | ) | | 1986 | | 06/23/14 | | 15 to 20 Years |
| Uncle Ed's Oil Shoppe | Farmington Hills, MI | | (a) | | 382 |
| | 282 |
| | — |
| | — |
| | 382 |
| | 282 |
| | 664 |
| | (73 | ) | | 1987 | | 06/23/14 | | 15 to 20 Years |
| Uncle Ed's Oil Shoppe | Kalamazoo, MI | | (a) | | 171 |
| | 332 |
| | — |
| | — |
| | 171 |
| | 332 |
| | 503 |
| | (82 | ) | | 1979 | | 06/23/14 | | 15 to 20 Years |
| Uncle Ed's Oil Shoppe | Battle Creek, MI | | (a) | | 302 |
| | 262 |
| | — |
| | — |
| | 302 |
| | 262 |
| | 564 |
| | (62 | ) | | 1987 | | 06/23/14 | | 15 to 20 Years |
| Uncle Ed's Oil Shoppe | St Clair Shores, MI | | (a) | | 242 |
| | 272 |
| | — |
| | — |
| | 242 |
| | 272 |
| | 514 |
| | (64 | ) | | 1985 | | 06/23/14 | | 15 to 20 Years |
| Uncle Ed's Oil Shoppe | Clinton Township, MI | | (a) | | 141 |
| | 282 |
| | — |
| | — |
| | 141 |
| | 282 |
| | 423 |
| | (63 | ) | | 1987 | | 06/23/14 | | 15 to 20 Years |
| Uncle Ed's Oil Shoppe | Kalamazoo, MI | | (a) | | 352 |
| | 262 |
| | — |
| | — |
| | 352 |
| | 262 |
| | 614 |
| | (74 | ) | | 1987 | | 06/23/14 | | 15 to 20 Years |
| Uncle Ed's Oil Shoppe | Bloomfield, MI | | (a) | | 554 |
| | 332 |
| | — |
| | — |
| | 554 |
| | 332 |
| | 886 |
| | (82 | ) | | 1987 | | 06/23/14 | | 15 to 20 Years |
| Uncle Ed's Oil Shoppe | Waterford, MI | | (a) | | 292 |
| | 362 |
| | — |
| | — |
| | 292 |
| | 362 |
| | 654 |
| | (87 | ) | | 1989 | | 06/23/14 | | 15 to 20 Years |
| Uncle Ed's Oil Shoppe | Troy, MI | | (a) | | 281 |
| | 267 |
| | — |
| | — |
| | 281 |
| | 267 |
| | 548 |
| | (39 | ) | | 1989 | | 12/03/14 | | 15 to 30 Years |
| Uncle Ed's Oil Shoppe | Ann Arbor, MI | | (a) | | 684 |
| | 413 |
| | — |
| | — |
| | 684 |
| | 413 |
| | 1,097 |
| | (93 | ) | | 1989 | | 06/23/14 | | 15 to 20 Years |
| Uncle Ed's Oil Shoppe | Shelby Township, MI | | (a) | | 387 |
| | 355 |
| | — |
| | — |
| | 387 |
| | 355 |
| | 742 |
| | (85 | ) | | 1989 | | 07/30/14 | | 15 to 20 Years |
| Uncle Ed's Oil Shoppe | Chesterfield Township, MI | | (a) | | 181 |
| | 302 |
| | — |
| | — |
| | 181 |
| | 302 |
| | 483 |
| | (72 | ) | | 1990 | | 06/23/14 | | 15 to 20 Years |
| Uncle Ed's Oil Shoppe | Macomb Township, MI | | (a) | | 181 |
| | 262 |
| | — |
| | — |
| | 181 |
| | 262 |
| | 443 |
| | (60 | ) | | 1986 | | 06/23/14 | | 15 to 20 Years |
| Uncle Ed's Oil Shoppe | Ypsilanti, MI | | (a) | | 1,107 |
| | 745 |
| | — |
| | — |
| | 1,107 |
| | 745 |
| | 1,852 |
| | (153 | ) | | 1999 | | 06/23/14 | | 15 to 30 Years |
| Uncle Ed's Oil Shoppe | Kalamazoo, MI | | (a) | | 503 |
| | 342 |
| | — |
| | — |
| | 503 |
| | 342 |
| | 845 |
| | (130 | ) | | 1989 | | 06/23/14 | | 15 to 20 Years |
| Uncle Ed's Oil Shoppe | Battle Creek, MI | | (a) | | 594 |
| | 262 |
| | — |
| | — |
| | 594 |
| | 262 |
| | 856 |
| | (107 | ) | | 1998 | | 06/23/14 | | 15 to 20 Years |
SPIRIT REALTY CAPITAL, INC.
Schedule III Real Estate and
Accumulated Depreciation
(Amounts in thousands)
|
| | | | | | | | | | | | | | | | | | | | | | | | | |
| | | | | Initial Cost to Company | | Cost Capitalized Subsequent to Acquisition including impairment | | Gross Amount at December 31, 2017 (g) | | | | | | | | |
| Concept | City, State | | Encumbrances (e) | | Land and Improvements | | Buildings and Improvements | | Land and Improvements | | Buildings and Improvements | | Land and Improvements | | Buildings and Improvements | | Total | | Final Accumulated Depreciation | | Date of Construction | | Date Acquired | | Life in which depreciation in latest Statement of Operations is computed |
|
| | | | | | | | | | | | | | | | | | | | | | | | | | | | | | | | | |
| Uncle Ed's Oil Shoppe | Kalamazoo, MI | | (a) | | 141 |
| | 141 |
| | — |
| | — |
| | 141 |
| | 141 |
| | 282 |
| | (39 | ) | | 1959 | | 06/23/14 | | 15 to 20 Years |
| United Supermarkets | Childress, TX | | (d) | | 747 |
| | 934 |
| | — |
| | — |
| | 747 |
| | 934 |
| | 1,681 |
| | (311 | ) | | 1997 | | 05/23/05 | | 7 to 40 Years |
| United Supermarkets | Amarillo, TX | | (d) | | 3,559 |
| | 4,575 |
| | — |
| | — |
| | 3,559 |
| | 4,575 |
| | 8,134 |
| | (1,377 | ) | | 1999 | | 05/23/05 | | 14 to 40 Years |
| United Supermarkets | Levelland, TX | | (d) | | 1,651 |
| | 2,158 |
| | — |
| | — |
| | 1,651 |
| | 2,158 |
| | 3,809 |
| | (674 | ) | | 1997 | | 05/23/05 | | 11 to 40 Years |
| United Supermarkets | Amarillo, TX | | (d) | | 1,828 |
| | 1,292 |
| | — |
| | — |
| | 1,828 |
| | 1,292 |
| | 3,120 |
| | (522 | ) | | 1988 | | 05/23/05 | | 9 to 30 Years |
| United Supermarkets | Snyder, TX | | (d) | | 2,062 |
| | 2,963 |
| | — |
| | — |
| | 2,062 |
| | 2,963 |
| | 5,025 |
| | (895 | ) | | 1999 | | 05/23/05 | | 14 to 40 Years |
| United Supermarkets | Amarillo, TX | | (d) | | 1,573 |
| | 1,586 |
| | — |
| | — |
| | 1,573 |
| | 1,586 |
| | 3,159 |
| | (638 | ) | | 1989 | | 05/23/05 | | 9 to 30 Years |
| United Supermarkets | Wichita Falls, TX | | (d) | | — |
| | 6,259 |
| | — |
| | — |
| | — |
| | 6,259 |
| | 6,259 |
| | (3,447 | ) | | 1997 | | 05/23/05 | | 13 to 20 Years |
| United Supermarkets | Plainview, TX | | (d) | | 620 |
| | 5,415 |
| | — |
| | — |
| | 620 |
| | 5,415 |
| | 6,035 |
| | (1,495 | ) | | 2000 | | 08/25/05 | | 14 to 40 Years |
| United Supermarkets | Abilene, TX | | (a) | | 1,586 |
| | 2,230 |
| | — |
| | — |
| | 1,586 |
| | 2,230 |
| | 3,816 |
| | (695 | ) | | 1979 | | 03/27/13 | | 6 to 20 Years |
| United Supermarkets | Muleshoe, TX | | (c) | | 471 |
| | 1,770 |
| | — |
| | — |
| | 471 |
| | 1,770 |
| | 2,241 |
| | (390 | ) | | 1999 | | 08/29/11 | | 15 to 40 Years |
| United Supermarkets | Amarillo, TX | | (a) | | 1,574 |
| | 1,389 |
| | — |
| | — |
| | 1,574 |
| | 1,389 |
| | 2,963 |
| | (559 | ) | | 1989 | | 05/23/05 | | 9 to 30 Years |
| United Supermarkets | Burkburnett, TX | | (a) | | 2,030 |
| | 2,706 |
| | — |
| | — |
| | 2,030 |
| | 2,706 |
| | 4,736 |
| | (846 | ) | | 1997 | | 05/23/05 | | 11 to 40 Years |
| United Supermarkets | Lubbock, TX | | (a) | | 1,782 |
| | 2,055 |
| | — |
| | — |
| | 1,782 |
| | 2,055 |
| | 3,837 |
| | (642 | ) | | 1997 | | 05/23/05 | | 11 to 40 Years |
| United Supermarkets | Perryton, TX | | (a) | | 1,029 |
| | 597 |
| | — |
| | — |
| | 1,029 |
| | 597 |
| | 1,626 |
| | (225 | ) | | 1997 | | 05/23/05 | | 7 to 40 Years |
| United Supermarkets | Vernon, TX | | (a) | | 1,791 |
| | 2,550 |
| | — |
| | — |
| | 1,791 |
| | 2,550 |
| | 4,341 |
| | (797 | ) | | 1997 | | 05/23/05 | | 11 to 40 Years |
| Unity Point Clinic | Oelwein, IA | | (d) | | 226 |
| | 681 |
| | — |
| | — |
| | 226 |
| | 681 |
| | 907 |
| | (117 | ) | | 1995 | | 08/18/14 | | 5 to 30 Years |
| Vacant | Roswell, NM | | (a) | | 1,002 |
| | 3,177 |
| | (479 | ) | | (1,700 | ) | | 523 |
| | 1,477 |
| | 2,000 |
| | — |
| | 2004 | | 07/01/05 | | 14 to 50 Years |
| Vacant | Kenosha, WI | | (a) | | 3,421 |
| | 7,407 |
| | — |
| | — |
| | 3,421 |
| | 7,407 |
| | 10,828 |
| | (2,689 | ) | | 2004 | | 07/01/05 | | 14 to 40 Years |
| Vacant | New Hartford, NY | | (a) | | 2,168 |
| | 4,851 |
| | (1,549 | ) | | (3,332 | ) | | 619 |
| | 1,519 |
| | 2,138 |
| | (24 | ) | | 2004 | | 07/01/05 | | 1 to 29 Years |
| Vacant | Rapid City, SD | | (a) | | 878 |
| | 1,657 |
| | (176 | ) | | (1,010 | ) | | 702 |
| | 647 |
| | 1,349 |
| | — |
| | 1902 | | 12/29/06 | | 15 to 20 Years |
SPIRIT REALTY CAPITAL, INC.
Schedule III Real Estate and
Accumulated Depreciation
(Amounts in thousands)
|
| | | | | | | | | | | | | | | | | | | | | | | | | |
| | | | | Initial Cost to Company | | Cost Capitalized Subsequent to Acquisition including impairment | | Gross Amount at December 31, 2017 (g) | | | | | | | | |
| Concept | City, State | | Encumbrances (e) | | Land and Improvements | | Buildings and Improvements | | Land and Improvements | | Buildings and Improvements | | Land and Improvements | | Buildings and Improvements | | Total | | Final Accumulated Depreciation | | Date of Construction | | Date Acquired | | Life in which depreciation in latest Statement of Operations is computed |
|
| | | | | | | | | | | | | | | | | | | | | | | | | | | | | | | | | |
| Vacant | Scottdale, PA | | (c) | | 607 |
| | 11,008 |
| | (524 | ) | | (10,341 | ) | | 83 |
| | 667 |
| | 750 |
| | — |
| | 1959 | | 12/28/06 | | 3 to 10 Years |
| Vacant | Independence, MO | | (a) | | 1,450 |
| | 1,967 |
| | (843 | ) | | (1,259 | ) | | 607 |
| | 708 |
| | 1,315 |
| | (9 | ) | | 2002 | | 06/29/07 | | 4 to 29 Years |
| Vacant | Valdosta, GA | | (c) | | 2,930 |
| | 5,012 |
| | (2,292 | ) | | (3,963 | ) | | 638 |
| | 1,049 |
| | 1,687 |
| | (11 | ) | | 2012 | | 06/14/13 | | 9 to 35 Years |
| Vacant | Opelika, AL | | (c) | | 2,117 |
| | 5,737 |
| | (1,625 | ) | | (4,437 | ) | | 492 |
| | 1,300 |
| | 1,792 |
| | (12 | ) | | 2012 | | 06/14/13 | | 10 to 35 Years |
| Vacant | Portsmouth, OH | | (c) | | 219 |
| | 2,049 |
| | (165 | ) | | (1,549 | ) | | 54 |
| | 500 |
| | 554 |
| | (8 | ) | | 1997 | | 07/17/13 | | 1 to 34 Years |
| Vacant | Amherst, NY | | (c) | | 1,868 |
| | 7,503 |
| | (1,069 | ) | | (4,385 | ) | | 799 |
| | 3,118 |
| | 3,917 |
| | (847 | ) | | 1993 | | 07/17/13 | | 2 to 40 Years |
| Vacant | Beaumont, TX | | (c) | | 778 |
| | 9,297 |
| | (522 | ) | | (6,423 | ) | | 256 |
| | 2,874 |
| | 3,130 |
| | (110 | ) | | 1971 | | 07/17/13 | | 3 to 21 Years |
| Vacant | Greensboro, NC | | (c) | | 2,776 |
| | 3,990 |
| | — |
| | — |
| | 2,776 |
| | 3,990 |
| | 6,766 |
| | (570 | ) | | 2007 | | 07/17/13 | | 10 to 47 Years |
| Vacant | Indianapolis, IN | | (d) | | 1,640 |
| | 8,063 |
| | — |
| | — |
| | 1,640 |
| | 8,063 |
| | 9,703 |
| | (1,326 | ) | | 1999 | | 07/17/13 | | 7 to 33 Years |
| Vacant | Grove City, OH | | (c) | | 2,050 |
| | 3,288 |
| | (1,202 | ) | | (1,981 | ) | | 848 |
| | 1,307 |
| | 2,155 |
| | (42 | ) | | 2008 | | 07/17/13 | | 6 to 34 Years |
| Vacant | Kansas City, KS | | (d) | | 1,932 |
| | 5,629 |
| | — |
| | — |
| | 1,932 |
| | 5,629 |
| | 7,561 |
| | (834 | ) | | 2009 | | 07/17/13 | | 6 to 43 Years |
| Vacant | Tuscaloosa, AL | | (c) | | 3,321 |
| | 4,053 |
| | (2,392 | ) | | (2,963 | ) | | 929 |
| | 1,090 |
| | 2,019 |
| | (9 | ) | | 2013 | | 09/30/13 | | 10 to 46 Years |
| Vacant | Lewisville, TX | | (a) | | 1,767 |
| | 8,086 |
| | (1,213 | ) | | (5,677 | ) | | 554 |
| | 2,409 |
| | 2,963 |
| | (20 | ) | | 2002 | | 03/31/14 | | 4 to 36 Years |
| Vacant | Newnan, GA | | (d) | | 2,938 |
| | 4,472 |
| | — |
| | 319 |
| | 2,938 |
| | 4,791 |
| | 7,729 |
| | (473 | ) | | 2014 | | 07/03/14 | | 15 to 40 Years |
| Valley Surgical Center | Steubenville, OH | | (d) | | 363 |
| | 3,726 |
| | — |
| | — |
| | 363 |
| | 3,726 |
| | 4,089 |
| | (376 | ) | | 2009 | | 08/18/14 | | 14 to 40 Years |
| VASA Fitness | Taylorsville, UT | | (d) | | 1,496 |
| | 3,593 |
| | — |
| | — |
| | 1,496 |
| | 3,593 |
| | 5,089 |
| | (434 | ) | | 1988 | | 11/20/15 | | 12 to 20 Years |
| Veloce Indoor Speedway | Knoxville, TN | | (d) | | 1,508 |
| | 2,017 |
| | 188 |
| | 3,021 |
| | 1,696 |
| | 5,038 |
| | 6,734 |
| | (252 | ) | | 1987 | | 12/10/15 | | 9 to 60 Years |
| Verizon | Covington, TN | | (d) | | 343 |
| | 152 |
| | — |
| | — |
| | 343 |
| | 152 |
| | 495 |
| | (88 | ) | | 2007 | | 07/17/13 | | 3 to 24 Years |
|
| | | | | | | | | | | | | | | | | | | | | | | | | | | | | | | | | |
| Walgreens | Olivette, MO | | (c) | | 1,816 |
| | 5,917 |
| | — |
| | — |
| | 1,816 |
| | 5,917 |
| | 7,733 |
| | (808 | ) | | 2001 | | 07/17/13 | | 11 to 42 Years |
| Walgreens | Columbia, MO | | (c) | | 1,047 |
| | 5,242 |
| | — |
| | — |
| | 1,047 |
| | 5,242 |
| | 6,289 |
| | (602 | ) | | 2002 | | 07/17/13 | | 9 to 44 Years |
| Walgreens | Knoxville, TN | | (d) | | 2,107 |
| | 3,334 |
| | — |
| | — |
| | 2,107 |
| | 3,334 |
| | 5,441 |
| | (504 | ) | | 2000 | | 07/17/13 | | 6 to 40 Years |
| Walgreens | Picayune, MS | | (d) | | 954 |
| | 3,132 |
| | — |
| | — |
| | 954 |
| | 3,132 |
| | 4,086 |
| | (406 | ) | | 2006 | | 07/17/13 | | 10 to 42 Years |
| Walgreens | Madeira, OH | | (d) | | 951 |
| | 3,978 |
| | — |
| | — |
| | 951 |
| | 3,978 |
| | 4,929 |
| | (506 | ) | | 1998 | | 07/17/13 | | 5 to 44 Years |
| Walgreens | Shreveport, LA | | (d) | | 1,461 |
| | 3,605 |
| | — |
| | — |
| | 1,461 |
| | 3,605 |
| | 5,066 |
| | (517 | ) | | 1999 | | 07/17/13 | | 6 to 40 Years |
| Walgreens | Gainesville, FL | | (d) | | 922 |
| | 2,705 |
| | — |
| | — |
| | 922 |
| | 2,705 |
| | 3,627 |
| | (381 | ) | | 1998 | | 07/17/13 | | 4 to 40 Years |
| Walgreens | Bridgetown, OH | | (d) | | 1,015 |
| | 3,769 |
| | — |
| | — |
| | 1,015 |
| | 3,769 |
| | 4,784 |
| | (503 | ) | | 1999 | | 07/17/13 | | 5 to 43 Years |
| Walgreens | Dallas, TX | | (d) | | 735 |
| | 3,328 |
| | — |
| | — |
| | 735 |
| | 3,328 |
| | 4,063 |
| | (440 | ) | | 1996 | | 07/17/13 | | 3 to 40 Years |
| Walgreens | Houston, TX | | (d) | | 1,079 |
| | 3,582 |
| | — |
| | — |
| | 1,079 |
| | 3,582 |
| | 4,661 |
| | (465 | ) | | 2001 | | 07/17/13 | | 6 to 40 Years |
| Walgreens | Bryan, TX | | (d) | | 1,049 |
| | 5,633 |
| | — |
| | — |
| | 1,049 |
| | 5,633 |
| | 6,682 |
| | (703 | ) | | 2001 | | 07/17/13 | | 6 to 40 Years |
| Walgreens | Fort Worth, TX | | (d) | | 1,601 |
| | 1,894 |
| | — |
| | — |
| | 1,601 |
| | 1,894 |
| | 3,495 |
| | (318 | ) | | 1999 | | 07/17/13 | | 6 to 39 Years |
SPIRIT REALTY CAPITAL, INC.
Schedule III Real Estate and
Accumulated Depreciation
(Amounts in thousands)
|
| | | | | | | | | | | | | | | | | | | | | | | | | |
| | | | | Initial Cost to Company | | Cost Capitalized Subsequent to Acquisition including impairment | | Gross Amount at December 31, 2017 (g) | | | | | | | | |
| Concept | City, State | | Encumbrances (e) | | Land and Improvements | | Buildings and Improvements | | Land and Improvements | | Buildings and Improvements | | Land and Improvements | | Buildings and Improvements | | Total | | Final Accumulated Depreciation | | Date of Construction | | Date Acquired | | Life in which depreciation in latest Statement of Operations is computed |
|
| | | | | | | | | | | | | | | | | | | | | | | | | | | | | | | | | |
| Walgreens | Kansas City, MO | | (d) | | 634 |
| | 4,341 |
| | — |
| | — |
| | 634 |
| | 4,341 |
| | 4,975 |
| | (571 | ) | | 1997 | | 07/17/13 | | 4 to 43 Years |
| Walgreens | Kansas City, MO | | (d) | | 532 |
| | 3,549 |
| | — |
| | — |
| | 532 |
| | 3,549 |
| | 4,081 |
| | (515 | ) | | 1998 | | 07/17/13 | | 4 to 39 Years |
| Walgreens | Kansas City, MO | | (d) | | 862 |
| | 4,367 |
| | — |
| | — |
| | 862 |
| | 4,367 |
| | 5,229 |
| | (571 | ) | | 2000 | | 07/17/13 | | 6 to 42 Years |
| Walgreens | Kansas City, MO | | (d) | | 518 |
| | 4,234 |
| | — |
| | — |
| | 518 |
| | 4,234 |
| | 4,752 |
| | (554 | ) | | 1999 | | 07/17/13 | | 6 to 43 Years |
| Walgreens | Topeka, KS | | (d) | | 912 |
| | 2,681 |
| | — |
| | — |
| | 912 |
| | 2,681 |
| | 3,593 |
| | (423 | ) | | 1999 | | 07/17/13 | | 6 to 38 Years |
| Walgreens | DeSoto, TX | | (c) | | 1,007 |
| | 2,313 |
| | — |
| | — |
| | 1,007 |
| | 2,313 |
| | 3,320 |
| | (362 | ) | | 1997 | | 07/17/13 | | 5 to 40 Years |
| Walgreens | Waco, TX | | (d) | | 858 |
| | 3,455 |
| | — |
| | — |
| | 858 |
| | 3,455 |
| | 4,313 |
| | (518 | ) | | 1998 | | 07/17/13 | | 5 to 35 Years |
| Walgreens | Cincinnati, OH | | (c) | | 1,527 |
| | 4,307 |
| | — |
| | — |
| | 1,527 |
| | 4,307 |
| | 5,834 |
| | (571 | ) | | 2000 | | 07/17/13 | | 7 to 42 Years |
| Walgreens | Batesville, MS | | (c) | | 421 |
| | 3,932 |
| | — |
| | — |
| | 421 |
| | 3,932 |
| | 4,353 |
| | (480 | ) | | 2007 | | 07/17/13 | | 10 to 42 Years |
| Walgreens | Elmira, NY | | (d) | | 1,066 |
| | 4,230 |
| | — |
| | — |
| | 1,066 |
| | 4,230 |
| | 5,296 |
| | (563 | ) | | 2007 | | 07/17/13 | | 12 to 43 Years |
| Walgreens | Albany, GA | | (d) | | 961 |
| | 3,314 |
| | — |
| | — |
| | 961 |
| | 3,314 |
| | 4,275 |
| | (443 | ) | | 2008 | | 07/17/13 | | 12 to 43 Years |
| Walgreens | Rome, NY | | (d) | | 1,135 |
| | 3,104 |
| | — |
| | — |
| | 1,135 |
| | 3,104 |
| | 4,239 |
| | (415 | ) | | 2007 | | 07/17/13 | | 13 to 43 Years |
| Walgreens | Columbus, MS | | (c) | | 769 |
| | 3,475 |
| | — |
| | — |
| | 769 |
| | 3,475 |
| | 4,244 |
| | (443 | ) | | 2004 | | 07/17/13 | | 11 to 41 Years |
| Walgreens | Crossville, TN | | (c) | | 1,890 |
| | 3,680 |
| | — |
| | — |
| | 1,890 |
| | 3,680 |
| | 5,570 |
| | (498 | ) | | 2001 | | 07/17/13 | | 7 to 41 Years |
| Walgreens | Jacksonville, FL | | (c) | | 521 |
| | 4,365 |
| | — |
| | — |
| | 521 |
| | 4,365 |
| | 4,886 |
| | (561 | ) | | 2000 | | 07/17/13 | | 7 to 40 Years |
| Walgreens | LaMarque, TX | | (c) | | 464 |
| | 3,139 |
| | — |
| | — |
| | 464 |
| | 3,139 |
| | 3,603 |
| | (467 | ) | | 2000 | | 07/17/13 | | 7 to 40 Years |
| Walgreens | Tulsa, OK | | (d) | | 741 |
| | 3,179 |
| | — |
| | — |
| | 741 |
| | 3,179 |
| | 3,920 |
| | (438 | ) | | 1994 | | 07/17/13 | | 1 to 35 Years |
| Walgreens | Newton, IA | | (c) | | 365 |
| | 4,475 |
| | — |
| | — |
| | 365 |
| | 4,475 |
| | 4,840 |
| | (553 | ) | | 2001 | | 07/17/13 | | 7 to 44 Years |
| Walgreens | Seattle, WA | | (c) | | 2,589 |
| | 4,245 |
| | — |
| | — |
| | 2,589 |
| | 4,245 |
| | 6,834 |
| | (558 | ) | | 2002 | | 07/17/13 | | 9 to 43 Years |
| Walgreens | Evansville, IN | | (c) | | 1,249 |
| | 3,924 |
| | — |
| | — |
| | 1,249 |
| | 3,924 |
| | 5,173 |
| | (528 | ) | | 2007 | | 07/17/13 | | 12 to 44 Years |
| Walgreens | Canton, IL | | (d) | | 703 |
| | 4,098 |
| | — |
| | — |
| | 703 |
| | 4,098 |
| | 4,801 |
| | (535 | ) | | 2006 | | 07/17/13 | | 12 to 43 Years |
| Walgreens | Memphis, TN | | (d) | | 961 |
| | 5,389 |
| | — |
| | — |
| | 961 |
| | 5,389 |
| | 6,350 |
| | (659 | ) | | 2002 | | 07/17/13 | | 12 to 43 Years |
| Walgreens | Parkville, MO | | (d) | | 1,854 |
| | 2,568 |
| | — |
| | — |
| | 1,854 |
| | 2,568 |
| | 4,422 |
| | (441 | ) | | 2006 | | 07/17/13 | | 11 to 38 Years |
| Walgreens | San Antonio, TX | | (d) | | 841 |
| | 3,909 |
| | — |
| | — |
| | 841 |
| | 3,909 |
| | 4,750 |
| | (494 | ) | | 2004 | | 07/17/13 | | 14 to 40 Years |
| Walgreens | Mount Pleasant, TX | | (d) | | 1,192 |
| | 4,578 |
| | — |
| | — |
| | 1,192 |
| | 4,578 |
| | 5,770 |
| | (627 | ) | | 2009 | | 07/17/13 | | 14 to 43 Years |
| Walgreens | Saginaw, MI | | (a) | | 1,064 |
| | 3,906 |
| | — |
| | — |
| | 1,064 |
| | 3,906 |
| | 4,970 |
| | (527 | ) | | 2000 | | 07/17/13 | | 7 to 41 Years |
| Wal-Mart | Anderson, SC | | (d) | | 4,770 |
| | 6,883 |
| | — |
| | — |
| | 4,770 |
| | 6,883 |
| | 11,653 |
| | (2,745 | ) | | 1993 | | 07/17/13 | | 0 to 21 Years |
| Wal-Mart | Spencer, IN | | (d) | | 971 |
| | 2,483 |
| | — |
| | — |
| | 971 |
| | 2,483 |
| | 3,454 |
| | (740 | ) | | 1987 | | 07/17/13 | | 4 to 22 Years |
| Wal-Mart | New London, WI | | (d) | | 1,008 |
| | 2,094 |
| | — |
| | — |
| | 1,008 |
| | 2,094 |
| | 3,102 |
| | (918 | ) | | 1991 | | 07/17/13 | | 3 to 18 Years |
| Wendy's | Pineville, LA | | (a) | | 558 |
| | 1,044 |
| | — |
| | — |
| | 558 |
| | 1,044 |
| | 1,602 |
| | (485 | ) | | 1996 | | 06/25/04 | | 11 to 30 Years |
| Wendy's | Greenville, TX | | (a) | | 223 |
| | 304 |
| | — |
| | — |
| | 223 |
| | 304 |
| | 527 |
| | (188 | ) | | 1985 | | 12/29/05 | | 15 to 20 Years |
| Wendy's | Forsyth, GA | | (a) | | 495 |
| | 1,007 |
| | — |
| | — |
| | 495 |
| | 1,007 |
| | 1,502 |
| | (467 | ) | | 1984 | | 01/12/06 | | 15 to 30 Years |
SPIRIT REALTY CAPITAL, INC.
Schedule III Real Estate and
Accumulated Depreciation
(Amounts in thousands)
|
| | | | | | | | | | | | | | | | | | | | | | | | | |
| | | | | Initial Cost to Company | | Cost Capitalized Subsequent to Acquisition including impairment | | Gross Amount at December 31, 2017 (g) | | | | | | | | |
| Concept | City, State | | Encumbrances (e) | | Land and Improvements | | Buildings and Improvements | | Land and Improvements | | Buildings and Improvements | | Land and Improvements | | Buildings and Improvements | | Total | | Final Accumulated Depreciation | | Date of Construction | | Date Acquired | | Life in which depreciation in latest Statement of Operations is computed |
|
| | | | | | | | | | | | | | | | | | | | | | | | | | | | | | | | | |
| Wendy's | Madison, GA | | (a) | | 892 |
| | 739 |
| | — |
| | — |
| | 892 |
| | 739 |
| | 1,631 |
| | (364 | ) | | 1989 | | 01/12/06 | | 15 to 40 Years |
| Winco Grocery | Eureka, CA | | (d) | | 3,108 |
| | 12,817 |
| | — |
| | — |
| | 3,108 |
| | 12,817 |
| | 15,925 |
| | (1,779 | ) | | 1960 | | 07/17/13 | | 3 to 40 Years |
| Yard House | Cincinnati, OH | | (a) | | 1,614 |
| | 4,134 |
| | — |
| | — |
| | 1,614 |
| | 4,134 |
| | 5,748 |
| | (504 | ) | | 2013 | | 01/15/14 | | 9 to 40 Years |
| YouFit | Sartell, MN | | (b) | | 3,092 |
| | 3,765 |
| | — |
| | — |
| | 3,092 |
| | 3,765 |
| | 6,857 |
| | (696 | ) | | 2001 | | 12/16/14 | | 15 to 30 Years |
| YouFit | Saint Cloud, MN | | (b) | | 912 |
| | 1,427 |
| | — |
| | — |
| | 912 |
| | 1,427 |
| | 2,339 |
| | (270 | ) | | 1989 | | 12/16/14 | | 15 to 20 Years |
| YouFit | Chandler, AZ | | (a) | | 1,326 |
| | 2,665 |
| | — |
| | — |
| | 1,326 |
| | 2,665 |
| | 3,991 |
| | (160 | ) | | 2007 | | 09/30/16 | | 10 to 30 Years |
| YouFit | Phoenix, AZ | | (a) | | 1,402 |
| | 2,879 |
| | — |
| | — |
| | 1,402 |
| | 2,879 |
| | 4,281 |
| | (177 | ) | | 2008 | | 09/30/16 | | 10 to 30 Years |
| Zaxby's | Jonesboro, GA | | (d) | | 679 |
| | 1,736 |
| | — |
| | — |
| | 679 |
| | 1,736 |
| | 2,415 |
| | (170 | ) | | 2006 | | 07/01/15 | | 15 to 30 Years |
| Zaxby's | College Park, GA | | (d) | | 839 |
| | 1,439 |
| | — |
| | — |
| | 839 |
| | 1,439 |
| | 2,278 |
| | (152 | ) | | 2007 | | 07/01/15 | | 15 to 30 Years |
| Zaxby's | Riverdale, GA | | (d) | | 741 |
| | 1,789 |
| | — |
| | — |
| | 741 |
| | 1,789 |
| | 2,530 |
| | (164 | ) | | 2010 | | 09/17/15 | | 15 to 30 Years |
| Zips Car Wash | Arlington, TN | | (d) | | 867 |
| | 1,487 |
| | — |
| | — |
| | 867 |
| | 1,487 |
| | 2,354 |
| | (149 | ) | | 2010 | | 09/30/15 | | 15 to 30 Years |
| Zips Car Wash | Edmond, OK | | (d) | | 644 |
| | 1,896 |
| | — |
| | — |
| | 644 |
| | 1,896 |
| | 2,540 |
| | (168 | ) | | 2005 | | 09/30/15 | | 15 to 30 Years |
| Zips Car Wash | Oklahoma City, OK | | (d) | | 545 |
| | 1,995 |
| | — |
| | — |
| | 545 |
| | 1,995 |
| | 2,540 |
| | (174 | ) | | 2005 | | 09/30/15 | | 15 to 30 Years |
| Zips Car Wash | Oklahoma City, OK | | (d) | | 1,004 |
| | 1,933 |
| | — |
| | — |
| | 1,004 |
| | 1,933 |
| | 2,937 |
| | (191 | ) | | 2005 | | 09/30/15 | | 15 to 30 Years |
| Zips Car Wash | Sherwood, AR | | (d) | | 1,128 |
| | 1,388 |
| | — |
| | — |
| | 1,128 |
| | 1,388 |
| | 2,516 |
| | (164 | ) | | 2010 | | 09/30/15 | | 15 to 30 Years |
| Zips Car Wash | Siloam Springs, AR | | (d) | | 991 |
| | 1,884 |
| | — |
| | — |
| | 991 |
| | 1,884 |
| | 2,875 |
| | (182 | ) | | 2005 | | 09/30/15 | | 15 to 30 Years |
| Zips Car Wash | Springdale, AR | | (d) | | 520 |
| | 2,032 |
| | — |
| | — |
| | 520 |
| | 2,032 |
| | 2,552 |
| | (180 | ) | | 2005 | | 09/30/15 | | 15 to 30 Years |
| Zips Car Wash | Texarkana, TX | | (d) | | 483 |
| | 1,400 |
| | — |
| | — |
| | 483 |
| | 1,400 |
| | 1,883 |
| | (125 | ) | | 2010 | | 09/30/15 | | 15 to 30 Years |
| Zips Car Wash | San Antonio, TX | | (d) | | 1,422 |
| | 1,108 |
| | — |
| | 110 |
| | 1,422 |
| | 1,218 |
| | 2,640 |
| | (50 | ) | | 2010 | | 03/29/17 | | 10 to 30 Years |
| Zips Car Wash | Converse, TX | | (d) | | 1,253 |
| | 1,493 |
| | — |
| | 199 |
| | 1,253 |
| | 1,692 |
| | 2,945 |
| | (75 | ) | | 2011 | | 03/29/17 | | 10 to 30 Years |
| Zips Car Wash | Universal City, TX | | (d) | | 1,167 |
| | 1,440 |
| | — |
| | 123 |
| | 1,167 |
| | 1,563 |
| | 2,730 |
| | (40 | ) | | 2011 | | 06/30/17 | | 15 to 30 Years |
| Zips Car Wash | New Braunfels, TX | | (d) | | 1,261 |
| | 1,571 |
| | — |
| | 110 |
| | 1,261 |
| | 1,681 |
| | 2,942 |
| | (57 | ) | | 2010 | | 03/29/17 | | 10 to 30 Years |
| Zips Car Wash | Seguin, TX | | (d) | | 621 |
| | 1,264 |
| | — |
| | 110 |
| | 621 |
| | 1,374 |
| | 1,995 |
| | (56 | ) | | 2010 | | 03/29/17 | | 10 to 30 Years |
| | | | | | 2,618,723 |
| | 4,689,916 |
| | (29,793 | ) | | 2,461 |
| | 2,588,930 |
| | 4,692,377 |
| | 7,281,307 |
| | (1,075,643 | ) | | | | | | |
SPIRIT REALTY CAPITAL, INC.
Schedule III Real Estate and
Accumulated Depreciation
(Amounts in thousands)
|
| | | | | | | | | | | | | | | | | | | | | | | | | |
| | | | | Initial Cost to Company | | Cost Capitalized Subsequent to Acquisition including impairment | | Gross Amount at December 31, 2017 (g) | | | | | | | | |
| Concept | City, State | | Encumbrances (e) | | Land and Improvements | | Buildings and Improvements | | Land and Improvements | | Buildings and Improvements | | Land and Improvements | | Buildings and Improvements | | Total | | Final Accumulated Depreciation | | Date of Construction | | Date Acquired | | Life in which depreciation in latest Statement of Operations is computed |
|
| |
| (a) | Represents properties collateralized with Master Trust 2014 debt of $1,981,166, including $45,366 of debt held by the Company. |
| (b) | Represents properties collateralized with Master Trust 2013 debt of $312,704. |
| (c) | Represents properties collateralized with fixed CMBS debt of $323,749. |
| (d) | Represents unencumbered properties. |
| (e) | The aggregate cost of properties for federal income tax purposes is approximately $6.32$6.03 billion at December 31, 2016. | | | | | | 2017 |
| (e) | As of December 31, 2016 certain direct finance lease and held for sale properties had fixed CMBS encumbrances of $13,508 and are not included in the table above. | | | | |
| (f) | Represents Landland only properties with no depreciation and therefore date of construction and estimated life for depreciation is not applicable. | | | | | | |
| (g) | | | | | | | | |
| | | | | | | | |
| | | | | | | | As of December 31, 2017, certain direct finance lease and held for sale properties has fixed CMBS debt of $8,898 and are not included in the table above. |
| | | | 2016 | | 2015 | | 2014 | 2017 | | 2016 | | 2015 |
| Land, buildings, and improvements | | | | | | | | | | |
| Balance at the beginning of the year | $ | 7,527,369 |
| | $ | 7,193,796 |
| | $ | 6,519,293 |
| $ | 7,479,231 |
| | $ | 7,527,369 |
| | $ | 7,193,796 |
|
| Additions: | | | | | | | | | | |
| Acquisitions - Cole/Merger | — |
| | — |
| | — |
| |
| Acquisitions/capital expenditures/other additions - non-merger | 691,332 |
| | 873,344 |
| | 936,916 |
| |
| Acquisitions, capital expenditures, and reclassifications from held for sale and deferred financing leases | | 337,497 |
| | 691,332 |
| | 873,344 |
|
| Deductions: | | | | | | | | | | |
| Dispositions of land, buildings, and improvements | (508,961 | ) | | (405,437 | ) | | (99,798 | ) | |
| Held for sale | (150,529 | ) | | (74,638 | ) | | (123,776 | ) | |
| Impairment | (79,980 | ) | | (59,696 | ) | | (38,839 | ) | |
| Dispositions of land, buildings, and improvements and other adjustments | | (422,653 | ) | | (508,961 | ) | | (405,437 | ) |
| Reclassifications to held for sale | | (34,813 | ) | | (150,529 | ) | | (74,638 | ) |
| Impairments | | (77,955 | ) | | (79,980 | ) | | (59,696 | ) |
| Gross Real Estate Balance at close of the year | $ | 7,479,231 |
| | $ | 7,527,369 |
| | $ | 7,193,796 |
| $ | 7,281,307 |
| | $ | 7,479,231 |
| | $ | 7,527,369 |
|
| | | | | | | | | | | |
| Accumulated depreciation and amortization | | | | | | | | | | |
| Balance at the beginning of the year | $ | (860,954 | ) | | $ | (752,210 | ) | | $ | (590,067 | ) | $ | (940,005 | ) | | $ | (860,954 | ) | | $ | (752,210 | ) |
| Additions: | | | | | | | | | | |
| Depreciation expense | (221,993 | ) | | (210,395 | ) | | (194,382 | ) | |
| Depreciation expense and reclassifications from held for sale | | (219,803 | ) | | (221,993 | ) | | (210,395 | ) |
| Deductions: | | | | | | | | | | |
| Dispositions of land, buildings, and improvements | 127,787 |
| | 80,965 |
| | 13,528 |
| |
| Held for sale | 15,155 |
| | 20,686 |
| | 18,711 |
| |
| Dispositions of land, buildings, and improvements and other adjustments | | 82,156 |
| | 127,787 |
| | 80,965 |
|
| Reclassifications to held for sale | | 2,009 |
| | 15,155 |
| | 20,686 |
|
| Balance at close of the year | (940,005 | ) | | (860,954 | ) | | (752,210 | ) | (1,075,643 | ) | | (940,005 | ) | | (860,954 | ) |
| | | | | | | | | | | |
| Net Real Estate Investment | $ | 6,539,226 |
| | $ | 6,666,415 |
| | $ | 6,441,586 |
| $ | 6,205,664 |
| | $ | 6,539,226 |
| | $ | 6,666,415 |
|
SPIRIT REALTY CAPITAL, INC.
Schedule IV
Mortgage Loans on Real Estate
As of December 31, 20162017
(In thousands)
|
| | | | | | | | | | | | | | | | |
| Mortgage | | Stated Interest Rate | | Final Maturity Date (1) | | Periodic Payment Terms | | Face Amount | | Carrying Amount of Mortgages |
| Automotive parts and service <3% | | 8.60% - 9.35% | | 1/1/2021 | | 1/1/2021 | | Principal & Interest (2) | | $ | 10,588 |
| | $ | 9,436 |
|
| Restaurants <3% | | 9.55% - 10.47% | | 8/1/2020 | | 7/1/2028 | | Principal & Interest (3) | | 58,296 |
| | 53,168 |
|
| | | | | | | | | | | $ | 68,884 |
| | $ | 62,604 |
|
| | | | | | | | | | | | | |
(1) Reflects current maturity of the investment and does not consider any options to extend beyond the current maturity |
(2) Balloon payments of $5.1 million at maturity |
(3) Balloon payments of $29.1 million at maturity |
| |
|
| | | | | | | | | | | | | | | | | | | | | | | | | | |
| Description | | Location(s) | | Stated Interest Rate | | Final Maturity Date (1) | | Periodic Payment Terms | | Prior Liens | | Face Amount of Mortgages | | Carrying Amount of Mortgages (2) | | Principal Amount of Loans Subject to Delinquent Principal or Interest (3) |
| Restaurants - Casual Dining | | AL, AR, AZ (3), GA, KS, KY, LA, MA, MD, MI, NC (2), NJ, OK, PA, SC (2), TN, TX (2), WV | | 9.84% | | 8/1/2020 | | Principal & Interest (4) | | $ | — |
| | $ | 37,939 |
| | $ | 31,776 |
| | $ | — |
|
| Restaurants - Quick Service | | AZ (2), CA, FL (6), GA (3), MA, MD, MI (2), NC, VA (3) | | 10.47% | | 10/1/2020 | | Principal & Interest (5) | | — |
| | 17,711 |
| | 13,937 |
| | — |
|
| Automotive Parts | | TX (24), LA (2) | | 8.60% - 9.35% | | 1/1/2021 | | Principal & Interest (6) | | — |
| | 10,588 |
| | 8,459 |
| | — |
|
| Restaurants - Casual Dining | | CO (3), IL, KS, MI (2), MO, OH (2), OK, SD, TN | | 4.00% - 9.00% | | 9/25/2020 | | Mixed (7) | | — |
| | 13,125 |
| | 9,939 |
| | — |
|
| Grocery | | CA | | 5.00% | | 6/29/2018 | | Interest Only (8) | | — |
| | 9,000 |
| | 9,000 |
| | — |
|
| Restaurants < 3% | | OH (3), PA (2) | | 9.55% | | 5/1/2026 | - | 7/1/2028 | | Principal & Interest | | — |
| | 2,635 |
| | 1,501 |
| | 1,469 |
|
| Total | | | | | | | | | | | | $ | — |
| | $ | 90,998 |
| | $ | 74,612 |
| | $ | 1,469 |
|
| | | | | | | | | | | | | | | | | | | |
(1) Reflects current maturity of the investment and does not consider any options to extend beyond the current maturity | | | | | | | | |
(2) The aggregate tax basis of the mortgage loans outstanding on December 31, 2017 was $69.9 million. | | | | | | | | | |
(3) One borrower associated with two properties filed for bankruptcy November 11, 2017, the remaining balance of the mortgage notes and related accrued interest have been fully reserved, totaling $360.0 thousand. Delinquent balances in the amount of $29.0 thousand have been reserved related to one borrower associated with three properties. |
(4) Balloon payment of $21.5 million due at maturity | | | | | | | | | |
(5) Balloon payments of $7.2 million due at maturity | | | | | | | | | |
(6) Consists of two notes, $6.6 million at 9.35% and $4.0 million at 8.60% with a combined balloon payment of $5.0 million due at maturity |
(7) Deferred interest (4.0%) year 1, Interest only (4.0%) year 2, Principal and interest (9.0%) year 3, Balloon payment of $8.6 million due at maturity |
(8) Balloon payment of $9.0 million due at maturity | | | | | | | | | |
SPIRIT REALTY CAPITAL, INC.
Schedule IV
Mortgage Loans on Real Estate
As of December 31, 2017
(In thousands)
| | | | 2016 | | 2015 | | 2014 | 2017 | | 2016 | | 2015 |
| Reconciliation of Mortgage Loans on Real Estate | | | | | | | | | | |
| Balance January 1, | $ | 100,082 |
| | $ | 109,046 |
| | $ | 117,291 |
| $ | 62,604 |
| | $ | 100,082 |
| | $ | 109,046 |
|
| Additions during period | | | | | | | | | | |
| Mortgage loans acquired in Merger Transaction | — |
| | — |
| | — |
| |
| Premium on mortgage loans acquired in Merger | — |
| | — |
| | — |
| |
| New mortgage loans | — |
| | — |
| | — |
| 24,015 |
| | — |
| | — |
|
| Deductions during period | | | | | | | | | | |
| Collections of principal (inclusive of loans receivable exchanged for real estate acquired) | (34,686 | ) | | (6,497 | ) | | (5,720 | ) | (9,462 | ) | | (34,686 | ) | | (6,497 | ) |
| Foreclosures | — |
| | — |
| | — |
| |
| Amortization of premium | (2,792 | ) | | (2,466 | ) | | (2,525 | ) | (2,156 | ) | | (2,792 | ) | | (2,466 | ) |
| Amortization of capitalized loan origination costs | — |
| | (1 | ) | | — |
| — |
| | — |
| | (1 | ) |
| Mortgage loans receivable December 31, | 62,604 |
| | 100,082 |
| | 109,046 |
| 75,001 |
| | 62,604 |
| | 100,082 |
|
| Mortgage loan loss provisions | | (389 | ) | | — |
| | — |
|
| | | 74,612 |
| | 62,604 |
| | 100,082 |
|
| Equipment and other loans receivable | 4,474 |
| | 4,245 |
| | 379 |
| 5,355 |
| | 4,474 |
| | 4,245 |
|
| Provision for other loan loss | (500 | ) | | (324 | ) | | — |
| — |
| | (500 | ) | | (324 | ) |
| | 3,974 |
| | 3,921 |
| | 379 |
| 5,355 |
| | 3,974 |
| | 3,921 |
|
| Total loans receivable | $ | 66,578 |
| | $ | 104,003 |
| | $ | 109,425 |
| $ | 79,967 |
| | $ | 66,578 |
| | $ | 104,003 |
|
SIGNATURES
Pursuant to the requirements of the Securities Exchange Act of 1934, the registrant has duly caused this report to be signed on its behalf by the undersigned thereunto duly authorized.
|
| | |
| | SPIRIT REALTY CAPITAL, INC. (Registrant) |
| | | |
| | By: | /s/ Prakash J. Parag |
| | Name: | Prakash J. Parag |
| | Title: | Chief Accounting Officer and Senior Vice President (Principal Accounting Officer) |
Date: February 23, 201722, 2018
POWER OF ATTORNEY
KNOW ALL PERSONS BY THESE PRESENTS, that each person whose signature appears below does hereby constitute and appoint Thomas H. Nolan Jr.,Jackson Hsieh, Phillip D. Joseph, Jr. and Jay Young, and each of them singly, our true and lawful attorneys with full power to them, and each of them singly, to sign for us and in our names in the capacities indicated below, the Form 10-K filed herewith and any and all amendments to said Form 10-K, and generally to do all such things in our names and in our capacities as officers and directors to enable Spirit Realty Capital, Inc. to comply with the provisions of the Securities Exchange Act of 1934, as amended, and all requirements of the Securities and Exchange Commission in connection therewith, hereby ratifying and confirming our signatures as they may be signed by our said attorneys, or any of them, to said Form 10-K and any and all amendments thereto.
Pursuant to the requirements of the Securities and Exchange Act, this report has been signed below by the following persons on behalf of the registrant and in the capacities and on the dates indicated.
|
| | |
| Name | Title | Date |
/s/ Thomas H. Nolan, Jr.Jackson Hsieh | Chairman of the Board of DirectorsPresident and Chief Executive Officer (Principal Executive Officer)
| February 23, 201722, 2018 |
| | | |
| /s/ Phillip D. Joseph, Jr. | Chief Financial Officer, Executive Vice President and Treasurer (Principal Financial Officer) | February 23, 201722, 2018 |
| | | |
| /s/ Prakash J. Parag | Chief Accounting Officer and Senior Vice President (Principal Accounting Officer) | February 23, 201722, 2018 |
| | | |
| /s/ Kevin M. Charlton | Director | February 23, 201722, 2018 |
| | | |
| /s/ Todd A. Dunn | Director | February 23, 2017 |
| | |
/s/ David J. Gilbert | Director | February 23, 201722, 2018 |
| | | |
| /s/ Richard I. Gilchrist | Director | February 23, 201722, 2018 |
| | | |
| /s/ Diane M. Morefield | Director | February 23, 201722, 2018 |
| | | |
| /s/ Sheli Z. Rosenberg | Director | February 23, 201722, 2018 |
| | | |
| /s/ Thomas D. Senkbeil | Director | February 23, 201722, 2018 |
| | | |
| /s/ Nicholas P. Shepherd | Director | February 23, 201722, 2018 |
SIGNATURES
Pursuant to the requirements of the Securities Exchange Act of 1934, the registrant has duly caused this report to be signed on its behalf by the undersigned thereunto duly authorized.
|
| | |
| | SPIRIT REALTY, L.P. (Registrant) |
| | | |
| | By: | Spirit Realty Capital, Inc., in its capacity as sole member of Spirit General Holdings, LLC, as sole general partner and on behalf of Spirit Realty, L.P. |
| | By: | /s/ Prakash J. Parag |
| | Name: | Prakash J. Parag |
| | Title: | Chief Accounting Officer and Senior Vice President (Principal Accounting Officer) |
Date: February 23, 201722, 2018
POWER OF ATTORNEY
KNOW ALL PERSONS BY THESE PRESENTS, that each person whose signature appears below does hereby constitute and appoint Thomas H. Nolan Jr.,Jackson Hsieh, Phillip D. Joseph, Jr. and Jay Young, and each of them singly, our true and lawful attorneys with full power to them, and each of them singly, to sign for us and in our names in the capacities indicated below, the Form 10-K filed herewith and any and all amendments to said Form 10-K, and generally to do all such things in our names and in our capacities as officers and directors to enable Spirit Realty Capital, Inc., in its capacity as sole member of Spirit GEneralGeneral Holdings, LLC, as sole general partner and on behalf of Spirit Realty, L.P., to comply with the provisions of the Securities Exchange Act of 1934, as amended, and all requirements of the Securities and Exchange Commission in connection therewith, hereby ratifying and confirming our signatures as they may be signed by our said attorneys, or any of them, to said Form 10-K and any and all amendments thereto.
Pursuant to the requirements of the Securities and Exchange Act, this report has been signed below by the following persons on behalf of the registrant and in the capacities and on the dates indicated.
|
| | |
| Name | Title | Date |
/s/ Thomas H. Nolan, Jr.Jackson Hsieh | Chairman of the Board of DirectorsPresident and Chief Executive Officer (Principal Executive Officer)
| February 23, 201722, 2018 |
| | | |
| /s/ Phillip D. Joseph, Jr. | Chief Financial Officer, Executive Vice President and Treasurer (Principal Financial Officer) | February 23, 201722, 2018 |
| | | |
| /s/ Prakash J. Parag | Chief Accounting Officer and Senior Vice President (Principal Accounting Officer) | February 23, 201722, 2018 |
| | | |
| /s/ Kevin M. Charlton | Director | February 23, 201722, 2018 |
| | | |
| /s/ Todd A. Dunn | Director | February 23, 2017 |
| | |
/s/ David J. Gilbert | Director | February 23, 201722, 2018 |
| | | |
| /s/ Richard I. Gilchrist | Director | February 23, 201722, 2018 |
| | | |
| /s/ Diane M. Morefield | Director | February 23, 201722, 2018 |
| | | |
| /s/ Sheli Z. Rosenberg | Director | February 23, 201722, 2018 |
| | | |
| /s/ Thomas D. Senkbeil | Director | February 23, 201722, 2018 |
| | | |
| /s/ Nicholas P. Shepherd | Director | February 23, 201722, 2018 |