UNITED STATES
SECURITIES AND EXCHANGE COMMISSION
Washington, D.C. 20549
FORM 10-K
(Mark One)
| | | | | |
| ☑ | ANNUAL REPORT PURSUANT TO SECTION 13 OR 15(d) OF THE SECURITIES EXCHANGE ACT OF 1934 |
For the Fiscal Year Ended January 29, 2022February 3, 2024
or
| | | | | |
| ☐ | TRANSITION REPORT PURSUANT TO SECTION 13 OR 15(d) OF THE SECURITIES EXCHANGE ACT OF 1934 |
| | | | | | | | | | | |
| For the transition period from | | to | |
Commission file number 1-32545
| | |
| DESIGNER BRANDS INC. |
| (Exact name of registrant as specified in its charter) |
| | | | | | | | | | | | | | |
| Ohio | 31-0746639 |
| (State or other jurisdiction of incorporation or organization) | (I.R.S. Employer Identification No.) |
| | | | |
| 810 DSW Drive, | Columbus, | Ohio | | 43219 |
| (Address of principal executive offices) | (Zip Code) |
Registrant's telephone number, including area code: ((614) 237-7100
614) 237-7100
Securities registered pursuant to Section 12(b) of the Act:
| | | | | | | | |
| Title of each class | Trading Symbol | Name of each exchange on which registered |
| Class A Common Shares, without par value | DBI | New York Stock Exchange |
Securities registered pursuant to Section 12(g) of the Act: None
Indicate by check mark if the registrant is a well-known seasoned issuer, as defined in Rule 405 of the Securities Act. ☑ Yes
☐ No
Indicate by check mark if the registrant is not required to file reports pursuant to Section 13 or Section 15(d) of the Act. ☐ Yes ☑ No
Indicate by check mark whether the registrant (1) has filed all reports required to be filed by Section 13 or 15(d) of the Securities Exchange Act of 1934 during the preceding 12 months (or for such shorter period that the registrant was required to file such reports), and (2) has been subject to such filing requirements for the past 90 days. ☑ Yes ☐ No
Indicate by check mark whether the registrant has submitted electronically every Interactive Data File required to be submitted pursuant to Rule 405 of Regulation S-T (§ 232.405 of this chapter) during the preceding 12 months (or for such shorter period that the registrant was required to submit such files). ☑ Yes ☐ No
Indicate by check mark whether the registrant is a large accelerated filer, an accelerated filer, a non-accelerated filer, a smaller reporting company, or an emerging growth company. See the definitions of "large accelerated filer," "accelerated filer," "smaller reporting company," and "emerging growth company" in Rule 12b-2 of the Exchange Act.
| | | | | | | | | | | | | | | | | | | | | | | |
| Large accelerated filer | ☑☐ | | Accelerated filer | ☐☑ | | | |
| Non-accelerated filer | ☐ | | Smaller reporting company | ☐ | | | |
| | | Emerging growth company | ☐ | | | |
If an emerging growth company, indicate by check mark if the registrant has elected not to use the extended transition period for complying with any new or revised financial accounting standards provided pursuant to Section 13(a) of the Exchange
Act. ☐
Indicate by check mark whether the registrant has filed a report on and attestation to its management's assessment of the effectiveness of its internal control over financial reporting under Section 404(b) of the Sarbanes-Oxley Act (15 U.S.C. 7262(b)) by the registered public accounting firm that prepared or issued its audit report. ☑
If securities are registered pursuant to Section 12(b) of the Act, indicate by check mark whether the financial statements of the registrant included in the filing reflect the correction of an error to previously issued financial statements. ☐
Indicate by check mark whether any of those error corrections are restatements that required a recovery analysis of incentive-based compensation received by any of the registrant’s executive officers during the relevant recovery period pursuant to §240.10D-1(b). ☐
Indicate by check mark whether the registrant is a shell company (as defined in Rule 12b-2 of the Exchange Act). ☐ Yes ☑ No
The aggregate market value of the registrant's Class A common shares held by non-affiliates of the registrant as of July 31, 2021,29, 2023, was $867,203,588.$475,747,686.
Number of shares outstanding of each of the registrant's classes of common stock, as of March 14, 2022: 65,651,60718, 2024: 49,507,730 Class A common shares and 7,732,7437,732,733 Class B common shares.
DOCUMENTS INCORPORATED BY REFERENCE
Portions of the registrant's definitiveDefinitive Proxy Statement on Schedule 14A for the 20222024 Annual Meeting of Shareholders, which statement will be filed pursuant to Regulation 14A no later than 120 days after the end of the fiscal year covered by this report, are incorporated by reference into Part III of this Annual Report on
Form 10-K.
DESIGNER BRANDS INC.
TABLE OF CONTENTS
| | | | | | | | |
| | |
| PART I | | |
| Item 1 | | |
| Item 1A | | |
| Item 1B | | |
| Item 1C | | |
| Item 2 | | |
| Item 3 | | |
| Item 4 | | |
| PART II | | |
| Item 5 | | |
| Item 6 | | |
| Item 7 | | |
| Item 7A | | |
| Item 8 | | |
| | |
| | |
| | |
| | |
| | |
| | |
| | |
| Item 9 | | |
| Item 9A | | |
| Item 9B | | |
| Item 9C | | |
| PART III | | |
| Item 10 | | |
| Item 11 | | |
| Item 12 | | |
| Item 13 | | |
| Item 14 | | |
| PART IV | | |
| Item 15 | | |
| Item 16 | | |
| | |
All references to "we," "us," "our," "Designer Brands," "Designer Brands Inc.," or the "Company" in this Annual Report on Form 10-K for the fiscal year ended February 3, 2024 (this "Form 10-K") mean Designer Brands Inc. and its subsidiaries.
We own many trademarks and service marks. This Form 10-K may contain trademarks, trade dress, and tradenames of other companies. Use or display of other parties' trademarks, trade dress or tradenamestrade names is not intended to and does not imply a relationship with the trademark, trade dress or tradenametrade name owner.
We have included ourcertain website addresses throughout this reportForm 10-K as inactive textual references only. The information contained on the websites referenced herein is not incorporated into this Form 10-K.
Cautionary Statement Regarding Forward-Looking Information for Purposes of the "Safe Harbor" Provisions of the Private Securities Litigation Reform Act of 1995
Certain statements in this Form 10-K may constitute forward-looking statements and are made pursuant to the safe harbor provisions of the Private Securities Litigation Reform Act of 1995. Such statements reflect our current views with respect to, among other things, future events and financial performance. You can identify these forward-looking statements by the use of forward-looking words such as "outlook," "could," "believes," "expects," "potential," "continues," "may," "will," "should," "would," "seeks," "approximately," "predicts," "intends," "plans," "estimates," "anticipates," or the negative version of those words or other comparable words. Any forward-looking statements contained in this Form 10-K are based upon current plans, estimates, expectations, and assumptions relating to our operations, results of operations, financial condition, and liquidity. The inclusion of any forward-looking statements should not be regarded as a representation by us or any other person that the future plans, estimates, or expectations contemplated by us will be achieved. Such forward-looking statements are subject to numerous risks, uncertainties, and other factors that may cause actual results, performance, or achievements to be materially different from any future results, performance, or achievements expressed or implied by the forward-looking statements. In addition to other factors discussed elsewhere in this report,Form 10-K, including those factors described under Part I, Item 1A. Risk Factors, there are a number of important factors that could cause actual results, performance, or achievements to differ materially from those discussed in forward-looking statements that include, but are not limited to, the following:
•risks and uncertainty related to the ongoing coronavirus ("COVID-19") pandemic, any future COVID-19 resurgence, and any other adverse public health developments;
•uncertain general economic conditions, including inflation and supply chainrecession concerns, rising interest rates, inflationary pressures, domestic and global political and social conditions and the potential impact of geopolitical turmoil or conflict, and the related impacts to consumer discretionary spending;
•our ability to anticipate and respond to fashion trends,rapidly changing consumer preferences, customer expectations, and changing customer expectations;fashion trends;
•maintainingour ability to maintain strong relationships with our vendors, manufacturers, licensors, and retailer customers;
•risks related to losses or disruptions associated with our distribution systems, including our distribution centers and fulfillment center and stores, whether as a result of the COVID-19 pandemic, reliance on third-party providers or otherwise;
•risks related to cyber security threats and privacy or data security breaches or the potential loss or disruption of our information technology ("IT") systems;
•risks related to the implementation of new or updated IT systems;
•our ability to protect our reputation and to maintain the brands we license;
•our reliance on our loyalty programs and marketing to drive traffic, sales, and customer loyalty;
•failureour ability to retain our key executives orexisting management team, and to continue to attract qualified new personnel;
•risks related to the loss or disruption of our information systems and data and our ability to prevent or mitigate breaches of our information security and the compromise of sensitive and confidential data;
•our ability to protect our reputation and to maintain the brands we license;
•risks related to restrictions imposed by our senior secured asset-based revolving credit facility, as amended ("ABL Revolver"), and our senior secured term loan credit agreement, as amended ("Term Loan"), that could limit our ability to fund our operations;
•our competitiveness with respect to style, price, brand availability, shopping platforms, and customer service;
•our ability to provide customers with cost-effective shopping platforms;
•risks related to our international operations including international trade,and our reliance on foreign sources for merchandise, exposure to political, economic, operational, compliance and other risks, and fluctuations in foreign currency exchange rates;
•our ability to protect the health and safety of our associates and our customers, which may be affected by current or future government regulations related to stay-at-home orders and/or orders related to the operation of non-essential businesses;merchandise;
•our ability to comply with privacy laws and regulations, as well as other legal obligations;
•risks associated with climate change and other corporate responsibility issues; and
•uncertaintyuncertainties related to future legislation, regulatory reform, policy changes, or interpretive guidance on existing legislation.
If one or more of these or other risks or uncertainties materialize, or if our underlying assumptions prove to be incorrect, actual results, performance, or achievements may vary materially from what we have projected. Furthermore, new factors emerge from time to time, and it is not possible for management to predict all such factors, nor can management assess the impact of any such factor on the business or the extent to which any factor, or combination of factors, may cause results to differ materially from those contained in any forward-looking statement. Any forward-looking statement speaks only as of the date on which such statement is made, and, except as required by law, we undertake no obligation to update any forward-looking statement to reflect events or circumstances after the date on which such statement is made or to reflect the occurrence of unanticipated events.
PART I
OVERVIEW
Designer Brands Inc., originally founded as DSW Inc., is one of North America'sthe world's largest designers, producers, and retailers of footwear and accessories. We operate in three reportable segments: the U.S. Retail segment, the Canada Retail segment, and the Brand Portfolio segment. The U.S. Retail segment operates the DSW Designer Shoe Warehouse ("DSW") banner through its direct-to-consumer U.S. stores and e-commerce site. The Canada Retail segment operates The Shoe Company and DSW banners through its direct-to-consumer Canada stores and e-commerce sites. Together, the U.S. Retail and Canada Retail segments are referred to as the "retail segments." The Brand Portfolio segment earns revenue from the salewholesale of wholesale products to retailers and international distributors, commissions for serving retailers as the design and buying agent for products under private labels, (which we refer to as "First Cost"), and the sale of branded products through our direct-to-consumer e-commerce site at www.vincecamuto.com.sites for the Vince Camuto, Keds, Hush Puppies, and Topo brands.
Our fiscal year ends on the Saturday nearest to January 31. References to a fiscal year (e.g., "2021""2023") refer to the calendar year in which the fiscal year begins. This reporting schedule is followed by many national retail companies and typically results in a 52-week fiscal year (including 2022), but occasionally will contain an additional week resulting in a 53-week fiscal year.year (including 2023).
RETAIL SEGMENTS
BANNERS
We offer a wide assortment of brand name dress, casual, and athletic footwear and accessories for women, men and kids with a significant number of our products geared towards athletic and kids.under the following banners:
•DSW Designer Shoe Warehouse- Our DSW banner, which is offered both in the United States ("U.S.") and in Canada, is the destination for on-trend and fashion-forward footwear and accessory brands at a great value every single day, offering a wide assortment of brand name dress, casual and athletic footwear and accessories for women, men and kids.day.
•The Shoe Company- The Shoe Company banner in Canada offers on-trend footwear and accessory brands that target every-day family styles at a great value every single day.
Our e-commerce platforms offer customers convenient, 24/7 access to our products through our websites, www.dsw.com, www.dsw.ca, and www.theshoecompany.ca, withincluding mobile-optimized sites, and our mobile DSW application. Our omni-channel capabilities allow customers to order a wide range of styles, sizes, widths and categories. Online orders in the U.S. and Canada can be fulfilled from any one of our stores. Online orders from the U.S. can also be fulfilled from our fulfillmentdistribution center located in New Jersey ("East Coast Logistics Center"), which is a shared facility with the Brand Portfolio segment, or directly from our suppliersvendors (referred to as "drop ship"). Our order routing optimization system determines the best location to fulfill digitally demandeddigitally-demanded products, which allows us to optimize our operating profit. To further meet customer demand of how they receive products, we provide our customers options to Buy Online Pick Up in Store, Buy Online Ship to Store, and Curbside Pickup in the majority of our locations. Likewise, returns may be shipped to us or brought back to any of our locations.
ASSORTMENT
WeIn the retail segments, we sell a large assortment of brand name, designernational brands and exclusive branded merchandise. During 2020 and continuing into 2021,brands we experienced a shift in customer preferences from dress toward casual and athletic offerings (referredhave rights to sell through ownership or license arrangements, which we refer to as "athleisure"). We plan to continue to expand our athleisure and kids’ products, and offer customers stylish exclusive brands, including the Vince Camuto, Lucky, JLO Jennifer Lopez, and Jessica Simpson brands."Owned Brands." We believe that offering a robust assortment of our increased penetration inOwned Brands alongside top national brands within the athletic market, coupled withretail segments provides our historical success in dress and seasonal footwearcustomers with a fully integrated supply chain supported by our Brand Portfolio segment, positionunique assortment and allows us to be a premier footwear retailerlean into our integrated business model for the entire family's needs over the long term.
The following table presents certain data about the sourcing ofproviding value. In addition to disaggregating our merchandise:
| | | | | | | | | | | |
| 2021 | | 2020 |
| Number of unrelated third-party merchandise vendors | 440 | | | 480 | |
| Percentage of purchases from: | | | |
| Brand Portfolio segment, including First Cost sourced exclusive branded products and wholesale purchases of licensed products | 9 | % | | 8 | % |
| Top three unrelated third-party merchandise vendors | 20 | % | | 22 | % |
We separatenet sales between Owned Brands and national brands, we disaggregate our merchandisenet sales for our retail segments into four primary categories: women's footwear, men's footwear, kids' footwear, and accessories and other. Refer to Note 23, Revenue, of the Consolidated Financial Statementsconsolidated financial statements of this Form 10-K for the U.S. Retail and Canada Retail segments' totaldisaggregation of net sales attributable to eachsales.
The following table presents certain data about the sourcing of our merchandise category.for our retail segments:
| | | | | | | | | | | |
| 2023 | | 2022 |
| Number of unrelated third-party merchandise vendors at end of fiscal year | 412 | | | 420 | |
| Percentage of purchases from: | | | |
| Brand Portfolio segment sourced Owned Brands | 9 | % | | 8 | % |
| Top three national brand vendors | 21 | % | | 22 | % |
| | | |
LOYALTY PROGRAMS
We invite customers to join our VIP rewards programs, wherewhich enable members to earn points towardstoward discounts on future purchases. Our VIP rewards programs providesprovide timely customer insights and createscreate stronger customer engagement, while driving a higher-than-average level of customer spend.
The following table presents the number of members enrolled in our loyalty programs that have made a purchase over the prior two years and the percentage of retail segments' net sales generated from these members:
| | January 29, 2022 | | January 30, 2021 |
| Number of VIP members (in thousands) | 28,175 | | | 28,614 | |
| 2023 | | | 2023 | | 2022 |
| Number of VIP members at end of the fiscal year (in millions) | |
| Percentage of retail segments' net sales generated from VIP members | Percentage of retail segments' net sales generated from VIP members | 87 | % | | 84 | % | Percentage of retail segments' net sales generated from VIP members | 90 | % | | 89 | % |
DISTRIBUTION AND FULFILLMENT
For our U.S. Retail segment operations, the majority of our inventory is shipped directly from suppliers to our distribution center, which is located in Columbus, Ohio, and a West Coast facility that is operated by a third party, where the inventory is then processed, sorted, and shipped to one of our pool locations located throughout the country, and then on to the stores. Our inventory can also be shipped directly to our customers from our fulfillment center, also located in Columbus, Ohio, and supported by a third-party service provider, to our customers.East Coast Logistics Center. For our Canada Retail segment, we engage a logistics service provider to receive and distribute inventory to our stores. Through our ship-from-store capability, both in the U.S. and in Canada, inventory is shipped directly from our stores to customers. Through our U.S. drop ship program, inventory is shipped from the vendor's warehouseour vendors' warehouses directly to the customer.our customers.
Inventory management is important to our business as webusiness. We manage our inventory levels based on anticipated sales and the delivery requirements of our customers. Our inventory management strategy is focused on continuing to meet consumer demand, while improving our efficiency over the long term by enhancing systems and processes.
BRAND PORTFOLIO SEGMENT
BRANDS
Our
The Brand Portfolio segment designs, develops, and sources in-season fashion footwear and accessories through Camuto LLC, a wholly-owned subsidiary doing business as "Camuto Group,"of our Owned Brands for the sale of wholesale merchandise to our retail segments and our other retailer customers. Our First Cost model earnsWe also earn commission-based income for serving retailers as their design and buying agent, while leveraging our overall design and sourcing infrastructure. In addition, we sell our branded products on a direct-to-consumer e-commerce site at www.vincecamuto.com.sites for the Vince Camuto, Keds, Hush Puppies, and Topo brands. Refer to Note 23, Revenue, of the Consolidated Financial Statementsconsolidated financial statements of this Form 10-K, for the Brand Portfolio segments'segment's total net sales attributable to each channel. The Brand Portfolio segment has fourfive customers that makemade up approximately 57%40.0% of its totalsegment net sales in 2023, excluding intersegment net sales, and the loss of any or all of these customers could have a material adverse effect on the Brand Portfolio segment.
Using 2021 net sales as a baseline, we have a long-term goal of doubling the net sales from our Owned Brands by 2026 for all of our segments combined, while maintaining our net sales of national brands in our retail segments. We expect this long-term goal will result in approximately one-third of our total net sales coming from Owned Brands by 2026. During 2023 and 2022, the net sales of Owned Brands represented 25.8% and 25.5%, respectively, of consolidated net sales, compared to a baseline of 19.6% from 2021. We believe that increasing net sales from our Owned Brands products will not only drive growth and expand our gross margin but will also elevate our presence as a brand builder. Refer to Note 3, Revenue, of the consolidated financial statements of this Form 10-K, for the disaggregation of net sales.
LICENSING RIGHTS
Through Camuto Group, we own the footwear,Equity Investments and in some cases the handbag, licensing rights of Jessica Simpson, Lucky Brand, and, through a joint venture, JLO Jennifer Lopez. In partnership with Authentic Brands Group LLC, a global brand management and marketing company, we have a 40% stakeLicensing Rights- Our equity investments in ABG-Camuto, LLC ("ABG-Camuto"), a joint venture that owns several intellectual property rights, including, among others, Vince Camuto and Louise et Cie. ABG-Camuto is responsible for the growth and marketing of the brands held by the joint venture. We have entered into a licensing agreement with ABG-Camuto whereby we pay royalties to ABG-Camuto, with the royalty expense included in our cost of sales on the consolidated statements of operations, based on the sales of licensed products, subject to guaranteed minimums. ABG-Camuto also earns royalties on sales from third parties that license the brand names to produce non-footwear product categories. Given our 40% ownership interest in ABG-Camuto, we recognize earnings under the equity method, included within the Brand Portfolio segment as it is consideredLe Tigre 360 Global LLC ("Le Tigre") are an integral part of the Brand Portfolio segment business.segment. We have a 40.0% ownership interest in ABG-Camuto, a joint venture that owns the intellectual property rights of Vince Camuto and other brands. We are party to a licensing agreement with ABG-Camuto, which grants us the exclusive right to design, source, and sell footwear and handbags under the brands that ABG-Camuto owns. In July 2022, we acquired a 33.3% ownership interest in Le Tigre, which manages the Le Tigre brand. We are also party to a license agreement with Le Tigre, which grants us the exclusive right to design, source, and sell Le Tigre-branded footwear. In addition, we own the licensing rights for footwear and handbags of the Lucky Brand and the licensing rights for footwear of the Jessica Simpson brand and, beginning in 2023, the Hush Puppies brand.
Acquisitions- On December 13, 2022, we acquired a 79.4% ownership interest in Topo Athletic LLC ("Topo"). Topo is a designer of specialty athletic footwear that sells its Topo branded products at wholesale to retailers and international distributors and through its direct-to-consumer e-commerce site. The Topo acquisition provides us with expanded capabilities within the athletic footwear market. On February 4, 2023, we acquired the Keds business ("Keds"), including the Keds brand, inventory, and inventory-related accounts payable, from Wolverine World Wide, Inc. The Keds business designs, sources, and sells branded footwear at wholesale to retailers and international distributors and through its direct-to-consumer e-commerce sites.
SOURCING AND DISTRIBUTION
We source each of our product lines based on the individual design, style and quality specifications of the products. Our Brand Portfolio segment does not own or operate manufacturing facilities; rather, we use our sourcing offices in China and Brazil to procure our products from third-party manufacturers. Prior to production, our sourcing offices inspect samples and prototypes of each style and monitor the quality of the production process. We manage our inventory levels based on existing orders and anticipated sales.
The manufacturers of our products are required to meet our quality, human rights, local compliance, safety, and other standard requirements. These vendors are expected to respect local laws, rules, and regulations of the countries in which they operate and have pledged to follow the standards set forth in the Company's Vendor Code of Conduct, which details our dedication to human rights, labor rights, environmental responsibility, and workplace safety. The majority of our wholesale inventory is shipped directly from factories in foreign countries to our distribution center in Westampton, New Jersey,East Coast Logistics Center where the inventory is then processed, sorted, and provided to our customers' shipping carriers.
The following table presents the percentages of the Brand Portfolio segment's purchases of merchandise units sourced by country:
| | 2021 | | 2020 |
| 2023 | | | 2023 | | 2022 |
| China | China | 75 | % | | 73 | % | China | 76 | % | | 76 | % |
| Vietnam | Vietnam | 9 | % | | 13 | % | Vietnam | 10 | % | | 9 | % |
| India | | India | 5 | % | | 4 | % |
| Cambodia | | Cambodia | 5 | % | | 1 | % |
| Brazil | Brazil | 11 | % | | 7 | % | Brazil | 3 | % | | 9 | % |
| All other foreign locations | All other foreign locations | 5 | % | | 7 | % | All other foreign locations | 1 | % | | 1 | % |
COMPETITION
The footwear market is highly competitive with few barriers to entry. We compete against a diverse group of manufacturers and retailers, including department stores, online retailers, mall-based shoe stores, national chains, independent shoe retailers, single-brand specialty retailers, online shoe retailers, brand-oriented discounters, multi-channel specialty retailers, and brand suppliers. In addition, our wholesale retailer customers sell shoes purchased from competing footwear suppliers with owned and licensed brands that are well known.
CHIEF EXECUTIVE OFFICER TRANSITION
In January 2023, we announced our succession process relating to the Company's Chief Executive Officer ("CEO") role whereby our former CEO, Roger Rawlins, stepped down from his role as CEO and as a member of the Company's Board of Directors (the "Board") effective April 1, 2023, at which time Doug Howe, who previously served as Executive Vice President of the Company and President of DSW, assumed the CEO role and joined the Board. As previously disclosed, Mr. Rawlins commenced service as a strategic advisor to the Company and the Board effective April 1, 2023 and will continue in this role through April 1, 2024 under the terms of a transition and consulting agreement.
HUMAN CAPITAL MANAGEMENT
We believe the strength of our workforce is critical to our success. Our associates strive every day to create a welcoming and inclusive environment for themselves and our customers.customers to advance our mission of inspiring self-expression. One of our core strategies is to invest in and support our associates who are key to differentiating our products and experiences in the competitive footwear market. We monitor and adapt as necessary to maintain our competitive position, including the following areas of focus:
WORKFORCE
Our key human capital management objectives are to attract, develop, advance, and retain the highest quality talent. To support these objectives, our human resources programs are aimedaim to:
•develop associates to prepare them for critical roles and leadership positions for the future;
•reward and support associates through competitive pay, benefit,benefits, and perquisite programs;
•enhancecultivate an associate-centric culture where our culture through efforts aimed at making the workplace more engagingassociates feel empowered, valued, inspired, and inclusive;included;
•acquire talent and facilitate internal talent mobility to create a high-performing diverse workforce;
•embrace hybrid and remote work arrangements where possible to utilize flexibility as a competitive advantage; and
•evolve and invest in technology, tools, and resources to support our associates at work.
As of January 29, 2022,February 3, 2024, we employed approximately 13,500 people14,000 associates worldwide, approximately 12,000 of which approximately 11,600whom are employed in the U.S.
TOTAL REWARDS
To remain an employer of choice and maintain the strength of our workforce, we continually assess the current business environment and labor market to refine our compensation practices, benefit programs, and other associate resources. This practice was especially crucial in 2021 as we worked to mitigate the ongoing challenging labor market. We have a history of investing in our workforce and offer comprehensive, relevant, and innovative benefits to eligible associates in the U.S.
Compensation Related-Compensation-
•We strive to provide market competitive wages and salaries,pay targeting the middle of the market in most cases.
•We establish a minimum starting pay rate for each U.S. store that exceeds applicable minimum wage requirements.
•To be competitive for logistics center talent, we increased the start rates in 2023 and continually monitor local pay practices.
•We monitor pay equity and invest in pay processes that allow us to assess whether associates with similar roles and experience earn equal pay for comparable work.
•We provide a Compensation Essentials training module that educates and equips managers to facilitate healthy conversations about compensation. Every manager is expected to complete this training.
•Our incentive plans provide additional cash compensation upon the achievement of results that meet or exceed defined Company goals and are available tofor eligible store management, distributionlogistics centers, and corporate support center associates.
•We provide stock-based, long-term incentives for senior executives through the director level that align with the interests of shareholders.
•We provide retirement benefits through ourwith a safe harbor 401(k) plan withthat includes an employer matching contributionscontribution of up to 4% of associate contributions.
•In 2021, we rewarded our frontline store associates with three separate discretionary bonuses to express appreciation for their dedication and perseverance through the ongoing challenges precipitated by the pandemic.
Health & Wellness Related-
•We continue to offer a COVID-19 paid leave policy that provides up to one week of pay for associates who contract the virus, are involuntarily quarantined, are experiencing side effects from obtaining a vaccine, or are without work due to changes in store hours because of direct or indirect impacts of the virus.
•In 2021, we implemented a new benefit granting paid time off to over 8,500 U.S. part-time associates, which they began accruing for use at the beginning of 2022.
•Up to seven days of free backup childcare per year is provided to all full-time associates who need emergency childcare services for any reason.
•All associates are provided free access to a national resource network to locate babysitters and nannies, who have been cleared by a background check, as well as discounts on tutoring, day care centers, and pet sitters.
•Free counseling is available to all associates, their dependents, and their family members 24/7/365, including access to licensed counselors and work/life balance and bereavement specialists.
•Health & Wellbeing- We understand the importance of taking care of our associates and that every associate's journey is unique. Our inclusive benefits approach provides support and resources needed to care for them and their loved ones. We invest in comprehensive health and wellbeing benefits that help attract and retain the talent necessary to achieve our goals, some of which are highlighted below.
Comprehensive health insurance coverage is available to all full-time and Affordable Care Act eligible part-time associates through multiple medical plans. These plans which also include prescription and vision insurance. Dental coverage is also available.insurance, as well as:
•Other benefits provided to associates and their dependents who are enrolled in a medical plan include:
◦conciergeConcierge care coordinators and nurses who can assist with clinical support for health conditions, locate high quality doctors, enroll in benefit plans,high-quality physicians, advocate to resolve insurance billing issues, connect members to available community resources, and answer member benefit questions;questions.
◦•Free unlimited telemedicine access to U.S. board-certified physicians, via phone or video, conference, for general medical, dermatology, and mental health services;services.
◦•fertility services that provide conciergeSpecialty prescription drug medications, with many at no cost.
•Concierge support and access to leading fertility centers of excellence across the nation. Our medical plan coversU.S. as well as up to two cycles of IVFin vitro fertilization or other fertility services in addition to necessary fertility medication and testing; and
◦maternity and parenting tools to assist before, throughout, and beyond pregnancy. The program helps associates discover tools and resources available throughout a maternity/paternity leave of absence, as well as the subsequent return to work.testing.
•Multiple types of paid leaveExpert nurse care coordinator support provided through our maternity program.
•Medical access travel benefits for those who must travel greater than 100 miles from home to obtain access to covered medical care.
All full-time associates are provided. Full-time associates receiveeligible for:
•Company subsidized dental insurance.
•Company-provided life and accidental death and dismemberment insurance.
•Pay for short-term disability, income replacement insurance at no cost, paid parental leave, and jury duty pay. All associates are eligible for military pay and bereavement pay.duty.
•Voluntary benefits (long-term disability, accident, hospital indemnity and critical illness) and flexible spending accountsaccounts.
•Adoption assistance with reimbursement of up to $10,000 of eligible expenses for each adoption.
•Up to $5,250 in tuition reimbursement annually, plus access to partner schools who offer capped annual tuition to receive a degree at little to no cost when combined with our reimbursement.
All full-time and part-time associates are available to full-time associates to support their financial needs.eligible for:
•Company paid time off, military, and bereavement pay.
•Generous product discounts at DSW, American Eagle Outfitters/Aerie, and American Signature/Value City Furniture.
•Free legal help is available tocounseling for all associates, their dependents, and their family members, including access to licensed counselors, work/life balance support, and bereavement specialists.
•Free accredited general education college courses as well as discounted tuition offerings through multiple partner schools.
•Discounted legal support in areas such as civil/criminal needs, family disputes, immigration law, landlord/tenant issues, and basic document preparation.
•Free financial help including debt counseling, lease/purchase guidance, taxes, financial planning, and college funding, is available to all associates.
•Adoption assistance is available to all full-time associates with reimbursement up to $10,000 of eligible expenses for each adoption.
•Free accredited, general education college courses, as well as discounted tuition offerings through multiple partner schools, is available to all associates.
•Tuition reimbursement up to $5,250/year is available to all full-time associates, providing the opportunity to take classes or earn a bachelor's degree.
•Discounts on DSW, American Eagle Outfitters/Aerie, and American Signature/Value City Furniture products are available to all associates.
•Associate accomplishments and work anniversaries, starting with one year of service, are recognized and rewarded through our web-based "Inspire Greatness" recognition program.funding.
TALENT DEVELOPMENT
To help our associates succeed in their roles, we emphasize continuous learning and development opportunities. Training provided through our online learning platform includes anearly 240 resources, including videos, self-paced on-demand learning, and virtual instructor-led sessions. A wide variety of topics and isresources are designed to address the needs of our entire workforce, from entry-level associates to our most senior executives. During 2023, over 8,000 associates completed approximately 80,000 learning experiences through our online learning platform. We invest resources in professional development and growth as a means of improving associate performance, engagement, and retention. During 2021, over 11,800 associates completed one of our over 280 courses via our online learning platform.retention. We believe that our continued focus on frequent and constructive performance feedback, talent reviews, succession planning, and retention have contributed to a strong internal promotion rate.
PHILANTHROPY THROUGH DBI GIVESDESIGNER BRANDS FOUNDATION
The Company isWe are committed to good corporate citizenship. Not only do we strive to create positive impacts within our organization, but we aim to better the communities in which we conduct business. DBI Gives isIn 2023, we officially launched our philanthropic community interest group whosecharitable Designer Brands Foundation to expand our corporate giving. The Designer Brands Foundation's mission is to inspire community involvementadvance empowerment of individuals, removing barriers, and enhance associate engagementhelping them put their best foot forward in the diverse communities in which we live, serve, and haswork. The Designer Brands Foundation features three mainprimary areas of focus:
1.Empowerment- Support organizations that prioritize empowerment and build self-confidence without discrimination.
2.Diversity, Equity & Inclusion ("DE&I")- Support organizations whose key constituents align with the diversity dimensions represented by our Business Resource Groups ("BRGs").
3.Community- TheAs the places where our associates live and work mean everythingare vitally important to us. As a result,us, we support the organizations that put our local communities first and provide opportunities for our associates to give back through volunteering and donations.
DBI Gives, hasour philanthropic Community Interest Group ("CIG"), aims to inspire community involvement and enhance associate engagement through volunteering and three primary areas of partnership:
1.SOLES4SOULSSoles4Souls- Soles4Souls creates sustainable jobs and provides relief through the distribution of shoes and clothing around the world, while keeping them out of landfills and giving shoes and garments a second life. Since partnering with Soles4Souls in 2018, we are proud to have donated nearly sixover 9 million pairs of shoes, including 1.7 million pairs in 2023. In 2023, we focused our store register donation efforts in support of Soles4Souls, generating over $2.1 million in customer-funded donations, which is more than 1.8 million pairs donatedthree times the monetary donations we made to Soles4Souls in 2021.2022.
2.Two Ten Footwear Foundation- Two Ten provides scholarships and financial aid to people working in the footwear industry, as well as free counseling and community resources.resources to people working in the footwear industry. Many of our own associates have been beneficiaries of Two Ten's programs. We support Two Ten with corporate financial donations and subject matter expertise to continue to enrich their community program offerings.
3.Hometown Partnerships- From annual United Way fundraisers to American Red Cross blood drives, local nonprofit partnerships, and associate volunteering efforts, we always look for ways to helpsupport and better the communities in which we operate. In 2021, we receivedlive, serve, and work. During the Dale. E Heydlauff United Way Legacy Award for Outstanding Philanthropy Leadership from Columbus Business First, for the new2023 holiday season, associates globally participated in giving back to their local communities. Our DSW and innovative partnerships we forged through our point-of-sale campaigns and the creation of the Equity Advancement Fund at United Way of Central Ohio. Through our register donations, during 2021, we also raised nearly $200,000 for Nationwide Children’s Hospital’s "On Your Sleeves" program to advance their goal of providing free mental health education resources to children in all communitiesThe Shoe Company stores across the U.S. and Canada collected and donated food items to their local food banks. Our corporate teams in the U.S., Canada, Brazil, and China gathered to give their time assembling cold-weather kits for those experiencing homelessness, packing meals for those with serious illnesses, hosting blood drives, and more.
DIVERSITY, EQUITY, AND INCLUSION ("DE&I")
We support diversity, equity,From the inside out, DE&I at Designer Brands starts with an inclusive and inclusion. We believe:
•Diversityis the celebration of the ways weequitable workplace, one where all associates belong and are alike, as well as unique.
•Equity compels usempowered to be fair, while also recognizingtheir authentic selves, bringing their unique backgrounds, perspectives, and experiences to the need to treat others differently to mitigate the risk of inadvertently perpetuating systemic barriers.
•Inclusion is the act of ensuringtable. We believe that empowering our differences are not only acknowledged, but also welcomedpowers up innovation and valued.ignites positive change. That core belief, best expressed in our mission of "We inspire self-expression" extends to our customers, communities, and supply chain, fueling our passion to help change the industry and advance prosperity for all.
We strive to inspire self-expression, authenticity, and empowerment to drive the best possible experiences for our associates, customers, and communities. Formal ways for associates, on a voluntary basis, to getbe involved and help advance our DE&I strategyignite innovation and positive change include:
•BRGs are- associate-led groups organized around a common diversity dimension to foster an inclusive and engaging work environment for all.
•Community Interest Groups ("CIGs") areCIGs - associate-led groups based on a common passion or interest to drive a sense of community and shared purpose.
•Diversity Councils are- associate-led groups organized to create a sense of inclusion and belonging for those who work in our stores distribution centers, and fulfillment center.logistics centers.
No group is exclusive; allAll groups are inclusive and open to any associate who wants to join, and associates can be members ofjoin as many groups as they want.choose. Our BRGs, CIGs, and Diversity Councils provide a unique strategic perspective ofbased on shared experience, background, and allyship while promoting diversity and belonging in our workplace and community.
community in alignment with our business goals. We proudly support eight BRGs, four CIGs, and two Diversity Councils (one in the U.S. and one in Canada). In 2023, we launched our first BRG/CIG/Diversity Council
with the purpose of educating, engaging, and increasing the participation of our associates and leaders in these groups. Our DE&I principles are also reflected in our associate training programs, which address our policies against harassment, bullying, and bias in the workplworkplace.
ace. In 2021,
a Racism Matters webinar series was utilized to address systemic racism and to ensure we continue to create an inclusive culture for all associates. Recognizing and respecting our customer base, weTable of contentsWe strive to maintain a diverse and inclusive workforce. In the U.S., nearly 80%As of February 3, 2024, 78% of our U.S. based associates areself-identified as female and over 50%56% of theour U.S. associate population is comprised ofself-identified as people of color. Additionally, as36% of the endBoard and 58% of 2021, women make up 40% of the Company's Board of Directors and 49% of the executives in the vice president and above population.positions self-identified as female.
Mr. Rawlins,Howe, Designer Brands' Chief Executive Officer,CEO, is a proud signatory of the CEO Action for Diversity & Inclusion Pledge, the largest CEO-driven business commitment to advance diversity and inclusion in the workplace. This demonstrates our top-down approach to furthering our goals of cultivating open dialogue, expanding diversity training, sharing best practices withwith other companies, and engaging our Board of Directors in the evaluation of our progress. progress. For the thirdfourth consecutive year, Designer Brands has been recognized for its LGBTQ+ inclusion efforts with a perfectreceiving the Equality 100 Award by earning the top score onof 100 in the Human Rights Campaign's ("HRC")Campaign Foundation's 2023-2024 Corporate Equality Index, which places us on HRC's "Best Places to Work for LGBT Equality" list.Index. Designer Brands has also been recognized by Forbes as one of "The Best Employers for Women"Diversity" for 2023.
With a goal of increasing diversity in the footwear design world, in 2022, we partnered with legendary footwear designer and "The Best Employerspresident of Pensole Lewis College of Business and Design, Dr. D'Wayne Edwards. In 2023, we celebrated the grand opening of the JEMS by PENSOLE factory located in Somersworth, New Hampshire, as one of the first black-owned footwear factories in the U.S. The development and opening of the factory represent the culmination of our $2.0 million investment focused on advancing action-oriented DE&I. In the fall of 2023, we launched the FIRST JEM, the inaugural shoe from JEMS by PENSOLE, in select stores and online. Ultimately, this partnership is aimed at creating careers and investing in diverse, talented, and aspiring designers to become the future of our industry.
Each step we take brings us closer to realizing our vision of DE&I. We are committed to continuing to walk the walk and aspiring to create conditions for Diversity."everyone to put their best foot forward without barriers and to reach their highest potential.
We believe that paying our peopleassociates fairly, regardless of gender, race, ethnicity, or any other status, enables us to deliver on our goal of creating an inclusive environment where we can all be ourselves, contribute ideas, and do our best work. To this end, we have investedtake several steps to ensure pay rates are fair, competitive, and based on job-related factors. For example, we regularly review external market data, internal pay grades, position of pay in the pay equityrange, as well as individual factors such as performance, training, and prior experience related to the work, to ensure fair pay. We also invest in pay processes that allow us to assess whether associates with similar roles and experience earn equal pay for
comparable work. Against the backdrop of our belief that equality and diversity makes our organization stronger, we continue to focus on and invest in pay equity processes.
We are on a journey to promote greater levels of DE&I in everything we do and recognize that there is still a long way to go. We will continue to challenge our own biases, initiate difficult conversations in meaningful ways, engage diverse perspectives to drive innovation, and intentionally evolve our operating strategies to advance this important work.
ASSOCIATE ENGAGEMENT
Our culture is a towering strength of Designer Brands, and that culture is built upon and codified by a set of unified values that guide how we aspire to operate as a collective organization. The values are a creation of our associates, inclusive and representative of our global organization, having resulted from a process wherein associates were invited to join conversations to identify and define our organizational values and subsequently discuss how to integrate them into our culture. As a result, they come to life internally for our associates as they are reflected in how: "we love what we do; we own what we do; we do what's right; and we belong."
We provide all associates with the opportunity to share their opinions and feedback onin relation to their employment experience through engagement surveys performed on a regular basis across all business segments. Results of the surveys are measured and analyzed with a goal of enhancing the associate experience, strengthening engagement and retention, and driving change. In addition to Company-led surveys, leaders are encouraged to conduct "skip level" touch bases, host round tableroundtable chats, and conduct follow-up activities to better understand associate feedback. We are embracing a flexible work environment by rolling out the option for our corporate associates to work where they choose to, whether that be in the office, at home or elsewhere, to best meet their individual needs. Upon exiting the Company, associates who voluntarily leave the business are provided with an exit survey to help us measure satisfaction and engagement, and identifyin addition to identifying the factors that may have contributed to pursuing another opportunity.
We continue to develop opportunities for associate connection and engagement in the evolving workplace environment by listening to our associates and taking actions on what is most important and impactful to them. One of the things our associates tell us is important to them is recognition. Our "Inspire Greatness" recognition program provides various means to recognize and reward associate accomplishments and work anniversaries.
GOVERNMENT REGULATIONS
Our business activities are global and subject to various federal, state, local, and foreign laws, rules, and regulations. For example, substantially all of our import operations are subject to complex trade and customs laws, regulations, and tax requirements, such as sanctions orders or tariffs set by governments through mutual agreements or unilateral actions. In addition, the countries in whichwhere our products are manufactured or imported from which are imported may, from time to time, impose additional duties,
tariffs, or other restrictions on our imports or adversely modify existing restrictions. Changes in tax policy or trade regulations, the disallowance of tax deductions on imported merchandise, or the imposition of new tariffs on imported products, could have an adverse effect on our business, results of operations, and competitive position. Compliance with these laws, rules, and regulations has not had, and is not expected to have, a material effect on our capital expenditures, results of operations, and competitive position as compared to prior periods. For more information on the potential impacts of government regulations affecting our business, see Item 1A. Risk Factors.
INTELLECTUAL PROPERTY
We have registered a number ofown numerous trademarks, service marks, and domain namesdomains in the U.S., Canada, and internationally, including DSW®such as Crown Vintage®, DSW®, DSW Shoe Warehouse®Warehouse®, and DSW Designer Shoe Warehouse®Warehouse®,Keds®, Kelly & Katie®, Mix No.6®, Pro-Keds®, and Topo Athletic®. We also have a 40% ownership interest in ABG-Camuto, which holdsowns the intellectual property rightsVince Camuto® trademark, and a 33.3% ownership interest in Le Tigre, which owns the Le Tigre® trademark. As of Vince Camuto®February 3, 2024, we have approximately 900 trademark registrations and pending applications in the U.S., Louise et Cie®,Canada, and others. ABG-Camuto licenses the rights to certain of its trademarks in specific categories, such as footwear and handbags, to Camuto Group, which as of January 29, 2022, have seven years remaining on the initial license term, which are indefinitely renewable on five-year terms.internationally. We believeconsider our trademarks, and service marks, and domains to have significant value and areto be important to building our name recognition.
SEASONALITY
Our business consists of two principal selling seasons: the spring season, which includes the first and second fiscal quarters, and the fall season, which includes the third and fourth fiscal quarters. Generally,Typically, net sales are slightly higher in the fall season have been slightly higher than in the spring season. Our seasonal results of operationsHowever, this may fluctuate based on the changenot hold true when net sales are influenced by global economic conditions, changes in weather conditions, the timing of acquisitions, and our customers' interest in new seasonal styles. Since the COVID-19 outbreak, we have not experienced the typical seasonal trends given changes in customer behavior.
AVAILABLE INFORMATIONINFORMATION
Information about Designer Brands, Inc., including its reports filed with or furnished to the Securities and Exchange Commission ("SEC"), is available through Designer Brands Inc.'sour website at www.designerbrands.com. Such reports are accessible at no charge through Designer Brands Inc.'sour website and are made available as soon as reasonably practicable after such material is filed with or furnished to the SEC. The SEC also maintains a website that contains reports, proxy statements, and other information regarding issuers that file electronically with the SEC at www.sec.gov.
Investing in our Class A common shares involves a high degree of risk. In addition to the other information in this Form 10-K and in our other public filings, investors should carefully consider the following risk factors. The risks described below are not the only ones facing us.risks we face or may face. The occurrence of any of the following risks, or the occurrence of additional risks and uncertainties not presently known to us or that we currently believe to be immaterial, could materially and adversely affect our business, financial condition or results of operations. In such case, the trading price of our Class A common shares could decline, and investors may lose all or part of their original investment. This Form 10-K also contains forward-looking statements and estimates that involve risks and uncertainties. Our actual results could differ materially from those anticipated in the forward-looking statements and estimates as a result of specific factors, including the risks and uncertainties described below.
RISKS RELATING TO MACROECONOMIC AND INDUSTRY CONDITIONS
The ongoing COVID-19 pandemicA downturn in global economic conditions or a decline in consumer confidence in the economy has had,adversely affected discretionary consumer spending and may continue to have, a material adversedo so, which has impacted, and likely will continue to impact, on our business, operations, liquidity, financial condition, and results of operations.business.
The COVID-19 pandemic has negativelyAdverse global economic conditions that are caused by events or conditions beyond our control create uncertainties and have in the past impacted the global economy, disrupted consumer spending and global supply chains, and created significant volatility and disruption of financial markets. The COVID-19 pandemic has had an adverse impact on our business and financial performance, particularly in 2020, and we expect this adverse impact to continue. The extent of the impact of the COVID-19 pandemic on our business and financial performance, including our ability to execute our near-term and long-term business strategies and initiativesmay in the expected time frame, will depend on future developments, including the duration, severity and any resurgences of the COVID-19 pandemic, which are uncertain and cannot be predicted.
For instance, we have continued to experience reduced store traffic and net sales as compared to pre-COVID-19 periods, and it is unclear when customer behavior will return to pre-COVID-19 patterns, if at all. The ongoing and prolonged nature of the COVID-19 pandemic may lead to further adjustments to our operations. As such, the ultimate impacts of the COVID-19 pandemic on our businesses will depend on future developments, including the availability of labor, global supply chain disruptions, new emerging variants of COVID-19 and the severity thereof, and the global availability and use of vaccines or palliatives, all of which are highly uncertain and cannot be predicted. As a result, we may have future write-downs or adjustments to inventories, receivables, long-lived assets, intangibles, goodwill, and the valuation allowance on deferred tax assets.
The COVID-19 pandemic also has the potential to significantly impact our supply chain if the factories that manufacture our products, the distribution systems we use to manage our inventory, or the operations of our logistics and other service providers are disrupted, temporarily closed or experience worker shortages. All of the products manufactured through the Brand Portfolio segment come from third-party facilities outside of the U.S., with 75% sourced from China during 2021, whereas our U.S. Retail segment and Canada Retail segment merchandise is purchased from both domestic and foreign vendors. Many of our domestic vendors import a large portion of their merchandise from abroad, with the majority manufactured in China. The COVID-19 pandemic has led to work and travel restrictions within, to, and out of mainland China, which in turn maymaterially adversely affect our manufacturers as well as our vendors' manufacturers. The COVID-19 pandemic may also make it difficult for our suppliers and our vendors' suppliers to source raw materials from, manufacture goods in, and export products from China and other countries. If the severity and reach of the COVID-19 pandemic continues or worsens, there may be significant and material disruptions to our supply chain and operations, which could have a material adverse effect on our financial position,business, results of operations, and cash flows.financial condition. These adverse economic conditions include inflation, slower growth or recession, new or increased tariffs and other barriers to trade, changes to fiscal and monetary policy, higher interest rates, high unemployment, decreased consumer confidence in the economy, public health threats, international hostilities, foreign currency exchange rate fluctuations, conditions affecting the retail environment for products we sell, and other matters that influence consumer confidence.
We rely on consumer discretionary spending, which may be adversely affected by economic downturns and other macroeconomic conditions or trends, and/or negatively impacted asThroughout 2023, a result of the COVID-19 pandemic.
Our business and operating results are subject todownturn in global economic conditions, and their impact on consumer discretionary spending. Many factors that may negatively influence consumer spending are becoming increasingly present asmost notably the growing concerns of a result of the COVID-19 pandemic and political instability, including high levels of instability in the job market, higher consumer debt levels, reductions in net worth, declines in certain asset values and related market uncertainty, fluctuatingpotential recession, rising interest rates, inflationary pressures, and credit availability, fluctuating fuelsignificant foreign currency volatility, adversely impacted discretionary consumer income levels and other energy costs, general uncertainty regarding the overall future political and economic environment, recent large-scale social unrest across much of the U.S., international turmoil and conflicts, war, terrorism, geopolitical uncertainties, trade policies and sanctions.spending for our customers. Consumer purchases ofspending on discretionary items, including our products, generally declinedeclines during periods of economic uncertainty, when disposable income is reduced, or when there is a reduction in consumer confidence. During 2023, our net sales declined as we experienced overall lower direct-to-consumer traffic and we became more promotional in an increasingly competitive landscape.
Additionally, anyour major retailer customers for our Brand Portfolio segment may experience a significant downturn in their businesses as a result of macroeconomic conditions and, in turn, these customers may reduce their purchases from us, which may have a material adverse effect on our business. Competitive pricing pressure has been exacerbated by a more promotional retail environment as the industry experienced a shift from tighter inventory positions to excess inventory and as macroeconomic conditions impact discretionary consumer spending. These factors ultimately could require us to enact mitigating operating efficiency measures that could have a material adverse effect on our business, operations, and results of operations.
The continuation of these trends could have a material adverse economic, political,effect on our business or social conditions may have the effect of directly or indirectly impacting our operating results in a negative manner.results. Moreover, we are unable to predict the severity of macroeconomic uncertainty, whether or when such circumstances may improve or worsen, or the full impact such circumstances could have on our business.
Our industry is subject to cost and pricing pressures thatWe may be exacerbated byunable to compete in the impacts of inflation,highly competitive footwear market, which could have a
material adverse effect on our business and operations.
The retail industry is subject to cost and pricing pressures and uncertainties throughout the supply chain. Pricing pressure has been exacerbated by the variability and availability of raw materials in recent months, combined with labor and cost inflation and uncertainty throughout the supply chain. These factors could require us to enact mitigating pricing actions and operating efficiency measures that could have a material adverse effect on customer demand.our business.
The footwear market is highly competitive with few barriers to entry. We compete against a diverse group of manufacturers and retailers, including department stores, online retailers, mall-based shoe stores, national chains, independent shoe retailers, single-brand specialty retailers, brand-oriented discounters, multi-channel specialty retailers, and brand suppliers. In addition, our wholesale retailer customers sell shoes purchased from competing footwear suppliers with brands that are well known. Our success depends on our ability to remain competitive with respect to assortment, fashion trends, quality, convenience, and value. The performance of our competitors, as well as a change in their promotional and pricing approaches as a result of the current economic environment, marketing activities, and other business strategies, could have a material adverse effect on our business.
E-commerce networks have rapidly evolved and consumer receptiveness to shopping online has substantially increased. Competition from e-commerce players has significantly increased due to their ability to provide improved user experiences, greater ease of buying goods, low or no shipping fees, faster shipping times, and more favorable return policies. Businesses, including our suppliers, can easily launch e-commerce websites and mobile platforms at nominal costs by using commercially available software or partnering with any of a number of successful digital marketplace providers. Some of our suppliers use such platforms to compete with us by allowing consumers to purchase products directly through the supplier. Competitors with other revenue sources may also be able to devote more resources to marketing and promotional campaigns, adopt more aggressive pricing policies, and devote more resources to websites, mobile platforms and applications, and systems development.
Our business may be adversely affected if we are unable to provide our customers with cost-effective shopping platforms that are able to respond and adapt to rapid changes in technology.
The number of people who access the Internet through devices other than personal computers, including mobile phones, smartphones, handheld computers such as notebooks and tablets, video game consoles, and television set-top devices, has increased dramatically in recent years. The smaller screen size, functionality, and memory associated with smartphones, laptops, and tablets may make using our websites and purchasing our products online more difficult. The versions of our websites developed for these devices and our mobile app may not be compelling to consumers. In addition, it is time-consuming and costly to keep pace with rapidly changing and continuously evolving technology, including potential changes related to artificial intelligence. If it is more difficult for our customers to buy products from us on their mobile devices, or if our customers choose not to buy products from us on their mobile devices or to use mobile products that do not offer access to our websites, our customer growth could be harmed, which could have a material adverse effect on our business, financial condition, and results of operations.
We are also dependent on the interoperability of our websites with popular mobile operating systems that we do not control, such as iOS and Android, and any changes in such systems that degrade the functionality of our websites or mobile app, limit or
discontinue our access to a particular platform, or give preferential treatment to competitive products or services, could
adversely affect the usage of our websites on mobile devices. We are also subject to the policies and terms of service of the providers of such operating systems and mobile application download stores, which govern the promotion, distribution, content, and operation of our mobile applications. Each provider has broad discretion to change and interpret its terms of service and other policies with respect to us and other developers, and those changes may be unfavorable to us. Additionally, mobile application download stores have imposed, and are likely to continue imposing, certain privacy- and security-related restrictions and controls on the providers and applications within their marketplaces.
RISKS RELATING TO OUR BUSINESS AND OPERATIONS
We may be unable to anticipate and respond to rapidly changing consumer preferences, changing customer expectations, and fashion trends, which could have a material adverse effect on our business.
Demand for our products fluctuates according to rapid changes in consumer preferences and trends, which are dictated by lifestyle, fashion, and season, and may shift quickly. As a result of the COVID-19 pandemic, our business experienced a shift in consumer behavior and corresponding preferences to increased demand for athleisure and casual products and away from dress and seasonal categories. This shift requires us to anticipate and respond to numerous and fluctuating variables in fashion trends and other conditions in the markets in which our customers are situated. A variety of factors will affect our ability to maintain the proper mix of products, including: localincluding economic conditions impacting customers' discretionary consumer spending; unanticipated fashion trends; our ability to provide timely access to popular brands at attractive prices; our success in distributing merchandise to our stores, online customers, and our wholesale retailer customers in an efficient manner; and changes in weather patterns, which, in turn, may affect consumer preferences. If we are unable to anticipate trends and fulfill the merchandise needs of our customers, we may experience decreases in our net sales and/or may be forced to increase markdowns in relation to slow-moving merchandise, either of which could have a material adverse effect on our business.
As we look ahead to our strategic growth initiatives, we have organized our efforts around three pillars:
•Customer- We are focused on offering great products and differentiated experiences in order to drive customer engagement and loyalty.
•Brand- We will continue to prioritize growing our own brands while also partnering with some of the top brands in the industry in order to offer one of the largest assortments.
•Speed- We are exploring improved processes to deliver products to our customers more quickly.
Achieving these priorities depends in part on us executing our strategies successfully, and the initiatives that we implement in connection with these strategies may not resonate with our customers. We may not be able to realize, in whole or in part, the anticipated benefits of these strategies or within the expected time frames. In the event that our strategies do not meet customer expectations or are not differentiated from our competitors' offerings, it may have a material adverse effect on our business. In addition, these efforts could place increased demands on our financial, managerial, operational, and administrative resources. We are investing in additional resources, both capital and personnel, and will be implementing new systems and processes or changes to existing systems and processes. These investments could cost more than anticipated, divert resources from other areas of our business, and fail to yield the anticipated benefits, any of which could have a material adverse effect on our business. We could also experience downtime or other technical issues as we make changes to our systems and processes, which could have a material adverse effect on our business.
We rely on our strong relationships with vendors to purchase products.products, including third-party manufacturers and national brand vendors. If these relationships were to be impaired, we may be unable to obtain a sufficient assortment of merchandise at attractive prices or respond promptly to rapidly changing fashion trends, either of which could have a material adverse effect on our business and financial performance.
OurThe success depends, to a significant extent, on the willingness and ability of our business depends on our ability to obtain products from our vendors, including third-party manufacturers and national brand vendors, on a timely basis, on acceptable terms, and to supply us with merchandise that meets our changing customer expectations, especially as we concentrate our receipts to fewer branded vendors.specifications. If we fail to maintain strong relationships with these vendors or if they fail to ensure the quality of merchandise that they supply to us, our ability to provide our customers with merchandise they want at favorable prices may be limited, which could have a negative impactmaterial adverse effect on our business. In addition, our merchandise costs have increased and may increase further due to increased costs incurred by our vendors in raw materials, energy, labor, freight, or duties and taxes on imports, or other reasons, our ability to respond or the effect of our response could adversely affect our net sales or gross profit. Further, any negative brand image, widespread product defects, financial distress, or negative publicity related to our key vendors, or other vendors could have a material adverse effect on our reputation and on our business.
We do not exert direct control over our vendors' operations and cannot guarantee that any vendor will have sufficient production capacity, meet our delivery expectations, or meet our product safety, social compliance, or quality standards. We typically do not have long-term supply contracts with our vendors, and the loss of any of our major vendors could disrupt our operations and adversely affect our business. If these third-party manufacturers do not perform their obligations, cease working with us, fail to meet our product safety, social compliance, or quality standards, or are unable to provide us with the materials and services that we need, at prices and on terms that are acceptable to us, then we could experience product delays and shortages. Failure by us to deliver quality products to our customers on a timely basis and any associated damage to our reputation could have a material adverse impact on our business and results of operations.
Decisions by national brand vendors not to sell to us or to limit the availability of theirthe products they sell to us could have a negative impact on our business. In addition, our inability to stock our sales channels with desired merchandise at attractive prices could result in lower net sales and decreased customer interest in our sales channels, which could have a material adverse effect on our business. During 2021, 2023, three key third-partynational brand vendors together supplied approximately 20%21% of our retail segments merchandise, with no individual vendor providing more than 10% of our retail merchandise. The loss of, or a reduction in the amount and quality of merchandise supplied by, any of our high-volume vendors could have an adverse effect on our business. For example, one of these top three vendors, Nike, Inc., ceased shipping products to us during the third quarter of 2021. In order to replace this brand, we are expanding and concentrating our volume of exclusive branded products, wholesale products from our Brand Portfolio segment, and with other high-volume vendors. If we are unable to offer suitable alternatives to satisfy product demand, sales could decline, which could have a material adverse effect on our operating results.
Losses or disruptions associated with our distribution systems, including our distribution centers and fulfillment center and stores, could have a material adverse effect on our business and operations.
Our operating results depend on the orderly operation of our receiving, distribution, and fulfillment processes, which in turn dependsdepend on vendors' adherence to shipping schedules and our effective management of our facilities. We may not anticipate all of the changing demands on our operations, and events beyond our control may occur, including disruptions in operations due to public health threats, such as the COVID-19 pandemic, delays in the integration of new stores, catastrophic events, shortages in labor, or shipping problems, any of which may result in delays in the delivery of merchandise to our stores and customers. We rely on the flow of goods through ports worldwide on a consistent basis from factories and suppliers. Disruptions at ports could create significant risks for our business, particularly if these disruptions occur during peak importing times. For example, the COVID-19 pandemic has resulted in delays at ports due to shipping backlog, availability of vessels, capacity constraints, and other disruptions. If we experience significant delays in receiving product, this could result in canceled orders by retailer customers, unanticipated inventory shortages, or receipt of seasonal product after the peak selling season, and increased expense of air freight, which could have a material adverse effect on our business and operations.
Our distribution system is dependent on the timely performance of services by third parties. The COVID-19 pandemic could also impact our ability to timely meet our customers' needs for fulfillment due to disruptions with third-party vendors, carriers, and other service providers, as well as increased freight and logistics costs. We are also subject to risk of damage or loss during delivery by our shipping vendors. IfIn addition, if our merchandise is not delivered to customers in a timely fashion or is damaged or lost during the delivery process, our customers could become dissatisfied and cease shopping on our sites,websites, which could adversely affect our business and operating results. If we encounter problemsissues with our ability to timely and satisfactorily fulfill customer orders, our ability to meet customer expectations, manage inventory, and complete sales, such problems could have a material adverse effect on our business.business may be adversely affected. While we maintain business interruption and property insurance, in the eventif any of ourthe points within our distribution systemsystems were to shut down for any reason or if we were to incur higher costs and longer lead times in connection with a disruption, our insurance may not be sufficient to cover the impact to theour business.
The successFuture acquisitions of our Brand Portfolio segment is dependent on our third-party manufacturersand investments in new businesses and brands and other business partners.
The success of our Brand Portfolio segment depends on our ability to obtain products from our third-party manufacturers on a timely basis, on acceptable terms, and to our specifications. We do not exert direct control over the manufacturers' operations and cannot guarantee that any third-party manufacturer will have sufficient production capacity, meet our production deadlines, or meet our product safety, social compliance, or quality standards. We typically do not have long-term supply contracts with our manufacturers, and the loss of any of our major manufacturersgrowth strategies could disrupt our operationsongoing business and adversely affectimpact our business. In addition, we cannot predict the impact of global events such as inclement weather, natural disasters, public health threats, or acts of terrorism. If these third-party manufacturers do not perform their obligations, cease working with us, fail to meet our product safety, social compliance or quality standards, or are unable to provide us with the materials and services we need at prices and terms that are acceptable to us, such disruptions may cause product delays and shortages, failure to deliver quality products to our customers on a timely basis, and damage to our reputation, which could have a material adverse impact on our businessfinancial condition and results of operations.
From time to time, we may acquire or invest in businesses, or we may license brands that we believe could complement our business and offer growth opportunities. For example, in the first quarter of 2023, we acquired Keds and in the third quarter of 2023, we licensed the Hush Puppies brand, which both include the use of a transition services arrangement as we work toward integration into our existing infrastructure. The success ofexpected synergies and contributions to our Brand Portfolio segment is dependent on the strength of our relationships with our retailer customers, and reductions in or loss of sales to such customersbusiness as a result of these and other investments may not materialize. Further, such integrations may disrupt our business or divert the ongoing COVID-19 pandemic couldattention of our management. Achieving the expected benefits depends in large part on our successful integration of any new operations, systems, and personnel in a timely and efficient manner. We cannot ensure that all of our integration efforts will be completed on a timely basis, as planned, or without substantial expense, delay, or other operational problems. Until we make substantial progress with our integration efforts, we also face the risk that we may not be able to effectively manage the business and achieve planned results. In addition, the integration process may strain our financial and managerial controls and reporting systems and procedures and may also result in the diversion of management and financial resources from core business objectives. Our integration efforts may not be successful, or we may not realize the anticipated benefits after we complete our integration efforts.
We have a long-term goal of doubling the net sales from our Owned Brands by 2026 (using 2021 net sales as a baseline), while also maintaining our levels of net sales of national brands. We expect this long-term goal will result in approximately one-third of our total net sales coming from our Owned Brands by 2026. Achieving these priorities depends in part on us executing our growth strategies successfully, and the initiatives that we implement in connection with these strategies may not resonate with our customers. We may not be able to realize the anticipated benefits of these growth strategies in whole, in part, or within the expected time frames. If our growth strategies do not meet customer expectations or are not differentiated from our competitors' offerings, this may have a material adverse effect on our business. In addition, these efforts could place increased demands on our financial, performance.managerial, operational, and administrative resources.
Our major retailer customers have experiencedIn addition, we may from time to time evaluate and pursue other strategic initiatives, investments, or acquisitions. These strategic initiatives, investments, or acquisitions could involve various inherent risks and the benefits sought may continue to experience a significant downturn in their businesses as a resultnot be realized, or these strategic initiatives, investments, or acquisitions may not create value or may harm our brand and adversely affect our business, financial condition, and results of the ongoing COVID-19 pandemic and, in turn, these customers have reduced, and may continue to reduce, their purchases from us, which has had and may continue to have a material adverse effect on the Brand Portfolio segment.operations.
We are dependent on our customer loyalty programs and marketing to drive traffic, sales and loyalty, and any decrease in membership or purchases from members could have a material adverse effect on our business.
Customer traffic is influenced by our marketing and our loyalty programs. We rely on our loyalty programs to drive customer traffic, sales, and purchase frequency. Loyalty members earn points toward discounts on future purchases through our VIP rewards programs in the U.S. and Canada. We employ a variety of marketing methods, including email, direct mail, and social media, to communicate exclusive offers to our rewards members. As of January 29, 2022, we have approximately 28 million members enrolled in our loyalty programs who have made at least one purchase over the last two years. In 2021, shoppers in the loyalty programs generated approximately 87% of the combined U.S. Retail and Canada Retail segments' net sales. In the event that our rewards members do not continue to shop, we fail to add new members, the number of members decreases, or our marketing is not effective in driving customer traffic, such event could have a material adverse effect on our business.
Our failure to retain our existing senior management team and to continue toattract qualified new personnel could have a material adverse effect on our business.
Our business requires disciplined execution at all levels of our organization, which requires an experienced and talented management team. If we were to lose the benefit of the experience, efforts and abilities of any of our key executives and sourcing and buying personnel, our business could be adversely affected. We have entered into employment agreements with several key executives and also offer compensation packages designed to attract and retain talent. Furthermore, our ability to manage our business will require us to continue to train, motivate, and develop our associates to maintain a high level of talent for future challenges and succession planning. Competition for these types of personnel is intense, and we may not be successful in attracting and retaining the personnel required to grow and operate our business.
The loss or disruption of information technologyIT services could affect our ability to implement our strategiesoperations and have a material adverse effect on our business.
Our information technologyIT systems are an integral part of our strategies infor efficiently operating our business, in managing operations, and protecting against security risks related to our electronic processing and transmitting of confidential customer and associate data. The requirements to keep our information technologyIT systems operating at peak performance may be higher than anticipated and could strain our capital resources, management ofas well as impact our ability to manage any system upgrades, implementation ofimplement new systems, and the related changemake management processes required withprocess changes for newly implemented systems, integrate new systemsbusinesses from transition service arrangements, and our ability to prevent any future information security breaches. In addition, any significant disruption of our data center could have a material adverse effect on thoseour operations dependent on those systems, specifically, our store and e-commerce operations, our distribution centers, and fulfillment center and our merchandising team. While we maintain business interruption and property insurance, in the event of a data center shutdown, our insurance may not be sufficient to cover the impact to theour business.
Our e-commerce operations are important to our business and are subject to various risks of operating online and mobile selling capabilities, such as the failure of our information technologyIT infrastructure, including any third-party hardware or software, resulting in downtime or other technical issues; reliance on third-party logistics providers to deliver our products to customers; inability to respond to technological changes; violations of state or federal laws;changes, such as those related to artificial intelligence; credit card fraud; or other information security breaches. Failure to mitigate these risks could reduce e-commerce sales, damage our reputation, and have a material adverse effect on our business.
The implementation of new or updated IT systems could result in significant disruptions to our operations.
The interdependence of our systems creates significant risk to the successful completion of implementing new systems or upgrading existing systems, and the failure of any one system could have a material adverse effect on our overall IT infrastructure. We may experience difficulties as we transition to these new or upgraded systems and processes, including loss or corruption of data, decreases in productivity as our associates and third-party providers become familiar with new systems, and increased costs. Difficulties in implementing new or upgraded information systems or significant system failures could disrupt our operations and have a material adverse effect on our business and results of operations. If we are unable to successfully manage changes as we implement new or updated systems, including harmonizing our systems, data, processes, and reporting analytics, our ability to conduct, manage, and control routine business functions could be adversely affected. In addition, we could incur material, unanticipated expenses, including additional costs related to implementation.
We face risks related to our electronic processing of sensitive and confidential personal and business data. If such data areis lost or disclosed in an unauthorized manner, or if we or our third-party vendors are subject to cyberattacks, data breaches, other security incidents, or disruption of information technologyIT systems or software, such eventswe could expose usbe exposed to liability or experience reputational harm, which could damage our reputation, and have a material adverse effect on our business.
Given the nature of our business, we, together with third parties acting on our behalf, receive, collect, process, use, and retain sensitive and confidential customer and associate data in addition toand proprietary business information. Our business relies on information technologyIT networks and systems to market and sell our products, process financial and personal information, manage a variety of business processes, and comply with regulatory, legal, and tax requirements. We also depend on a variety of information systems to effectively process customer orders and other data, for digital marketing activities, and for electronic communications amongwith our associates, customers, prospective customers, and vendors. Some of our third-party service providers, such as identity verification and payment processing providers, also regularly have access to customer data. Additionally, we maintain other confidential, proprietary, or otherwise sensitive information relating to our business and from third parties.
The information technologyIT networks and systems owned, operated, controlled, or used by us or our vendors may be vulnerablesusceptible to damage, disruptions or shutdowns, software or hardware vulnerabilities, data breaches, security incidents, supply-side attacks, failures during the process of upgrading or replacing software, databases, or components, power outages, natural disasters, hardware failures, attacks by computer hackers, telecommunication failures, user errors, user malfeasance, computer viruses, unauthorized access, phishing or social engineering attacks, ransomware attacks, distributed denial-of-service attacks, brute force, robocalls, and other real or perceived cyberattacks or catastrophic events, allany of which may not be prevented by our efforts to secure our computer systems. Any of these incidents could lead to interruptions or shutdowns of our platform, disruptions in our ability to process customer orders or to track, record, or analyze the sale of our products, loss or corruption of data, or unauthorized access to or acquisition of personal information or other sensitive information, such as our intellectual property. We utilize security tools and controls, and also rely onwhich include reasonable efforts to ensure that our third-party vendors to usemaintain sufficient security measures, including encryption and authentication technology, in an effort to reduce our cyber risk and protect personal and other sensitive information. However, advancesnone of our or our vendors' security measures can provide absolute security. Advances in computer capabilities, increasingly sophisticated tools and methods used by hackers and cyber terrorists, new discoveries in the field of cryptography, the potential use of artificial intelligence by cyber-attackers to develop malicious
code and launch sophisticated phishing attempts, or other developments may result in our or our vendors' failure or inability or the failure or inability of our vendors, to adequately protect personal or other sensitive information and there can be no assurance thatinformation. Despite our or our vendors' security measures, we or our vendors will notmay suffer a cyberattack, that hackers or other unauthorized parties will notmay gain access to or exfiltrate personal information or other sensitive data, or thatand any such data compromise or unauthorized access willmay not be discovered in a timely fashion.
We rely on associates, contractors, and other third parties who may attempt to circumvent our security measures in order to obtain suchpersonal information or other sensitive data and may purposefully or inadvertently cause a breach involving such information. Actual or anticipated attacks may cause us to incur increasingincreased costs, including costs to deploy additional personnel and protection technologies, train associates, pay higher insurance premiums, and engage third-party specialists for additional services. An information security breach involving confidential and personal data could damage our reputation, andadversely affect our customers' willingness to purchase from us, and adversely affect our vendors' willingness to supply or provide services to us. In addition, we may incur material liabilities and remediation costs as a result of an information security breach, including potential liability for stolen customer or associate data, costs relating to repairing system damage, or costs of providing credit monitoring or other benefits to customers or associates affected by the breach. In the eventIf we experience an information security breach, our insurance may not be sufficient to cover the impact to theour business. Although we have developed mitigating security controls to reduce our cyber risk and protect our data from loss or disclosure due to a security breach, including processes designed to reduce the impact of a security breach at a third-party vendor, such measures cannot provide absolute security.
We, and our third-party vendors, regularly experience cyberattacks aimed at disrupting services. Our third-party vendors have been and may be the victim of cyber-related attacks that could lead to operational disruptions that could have an adverse effect on our ability to fulfill customer orders. Security incidents, such as ransomware attacks, are becoming increasingly prevalent and severe, as well as increasingly difficult to detect. We, and our third-party vendors, have been subject to cyber, phishing, and social engineering attacks and other security incidents in the past and may continue to be subject to such attacks in the future. Security breaches can also occur as a result of non-technical issues, including intentional or inadvertent actions by our associates, our third-party vendors, or their personnel, or other parties. If we or our third-party service providers experience security breaches that result in a decline in marketplace performance, availability problems, or the loss of, corruption of, unauthorized access to, or disclosure of personal data or confidential information, peoplecustomers may become unwilling to provide us with the information necessary for such customers to make purchases on our sites,e-commerce websites, and our reputation and market position could be harmed. Existing
customers may also decrease their purchases or close their accounts altogether. We could also face potential claims, investigations, regulatory proceedings, liability, and litigation, and could bear other substantial costs in connection with remediating and otherwise responding to any data security breach, all of which may not be adequately covered by insurance, and which may result in an increase in our costs for insurance or insurance not being available to us on economically feasible terms, or at all. Insurers may also deny us coverage as to any future claim. Any of these results could harm our growth prospects, financial condition, business, and reputation.
We, or third parties we rely on, may not be able to fully, continuously, and effectively implement security controls as intended. As described in Item 1C. Cybersecurity, we utilize a risk-based approach and exercise judgment to determine the security controls to implement, and it is possible that we may not implement appropriate controls if we do not recognize or if we underestimate a particular risk. In addition, security controls, no matter how well-designed or implemented, may only mitigate and not fully eliminate risks. Cybersecurity events, when detected by security tools or third parties, may not always be immediately understood or acted upon.
Our failure to protect the value of our banners, Owned Brands, or our reputation could have a material adverse effect on our brands.
The value of our brandsOur success is largely dependent on the success of our ability to provide our customers with a merchandise assortment that they want and our ability to provide a consistent, high qualityhigh-quality customer experience. We also believe that maintaining and enhancing the reputation and recognition of our banners particularly DSW, isand our Owned Brands are critical to our ability to expand and retain our customer base. Any negative publicity about us or the significant brands we offer may reduce demand for our merchandise. Failure to comply with ethical, social, product, labor, health and safety, accounting, or environmental standards could also jeopardize our reputation and potentially lead to various adverse consumer actions. In addition, negative claims or publicity, including on social media, regarding celebrities with whom we have license and endorsement arrangements with could adversely affect our reputation and sales, regardless of whether such claims are accurate. Consumer actions could include boycotts and negative publicity through social or digital media. PublicNegative public perception about us or the products we carry, whether justified or not, could impair our reputation, involvesubject us into litigation, damage our brand, andbrands, or have a material adverse effect on our business.
We hold exclusive licensing rights that allow us to design, source, and sell footwear for certain of our brands may also depend on the success of our corporate social responsibility ("CSR") and sustainability initiatives, which require company-wide coordination and alignment. Risks associated with these initiatives include any increased public focus, including by governmental and nongovernmental organizations, new laws and regulations, increased costs associated with sustainability efforts and/or compliance with laws and regulations, as well as increased pressure to expand our CSR and sustainability disclosures in these areas, make commitments, set targets or establish additional goals and take actions to such targets and goals. All of the foregoing could expose us to market, operational and execution costs or risks. Any CSR or sustainability metrics that we currently or may in the future disclose, whether based on the standards we set for ourselves or those set by others, may influence our reputation and the value of our brands. There is also increased focus, including by investors, customers, and other stakeholders, on CSR and other sustainability matters, including the use of plastic, energy, waste, and worker safety. Our reputation could be damaged if we do not, or are perceived to not, act responsibly with respect to sustainability matters, which could also have a material adverse effect on our business, results of operations, financial position, and cash flows.
The reputation and competitive position of our Brand Portfolio segment is dependent on our ability to maintain the brands we license.
In partnership with Authentickey Owned Brands, Group LLC, a global brand management and marketing company, we formed ABG-Camuto, a joint venture in which we have a 40% interest. This joint venture acquired several intellectual property rights, including Vince Camuto, Louise et Cie, and others, and focuses on licensing and developing new category extensions to support the global growth of these brands. ABG-Camuto has entered into a licensing agreement with us, which will earn royalties from the net sales of Camuto Group under the brands acquired. In addition, we own footwear, and in some cases handbag, licensing rights of Jessica Simpson, Lucky Brand, Hush Puppies, and through a joint venture, JLO Jennifer Lopez.
Le Tigre. We rely on our ability to retain and maintain good relationships with the licensors and their ability to maintain strong, well-recognized brands and trademarks. The terms of our license agreements vary and are subject to renewal with various termination provisions. There can be no assurance thatprovisions, and we willmay not be able to renew these licenses. Even our longer-term or renewable licenses are typically dependent upon our ability to market and sell the licensed products at specified levels, and our failure to meet such levels may result in the termination or non-renewal of such licenses. Furthermore, many of our license agreements require minimum royalty payments, and if we are unable to generate sufficient sales and profitability to cover these minimum royalty requirements, we may be required to make additional payments to the licensors, which could have a material adverse effect on our business and results of operations.
13The value of the brands we sell may also depend on the success of our corporate social responsibility ("CSR") and sustainability initiatives, which require Company-wide coordination and alignment. Risks associated with these initiatives include any increased public focus, including by governmental and nongovernmental organizations, new laws and regulations, increased costs associated with sustainability efforts and/or compliance with laws and regulations, as well as increased pressure to expand our CSR and sustainability disclosures in these areas, make commitments, set targets, or establish additional goals and take actions to achieve such targets and goals. All of the foregoing could expose us to market, operational, and execution costs or risks. Any CSR or sustainability metrics that we currently or may in the future disclose, whether based on the standards we set for ourselves or those set by others, or our failure to achieve any CSR or sustainability metrics that we currently or may in the future disclose, may influence our reputation and the value of the brands that we offer. There is also increased focus, including by investors, customers, and other stakeholders, on CSR and other sustainability matters, including the use of plastic, energy, waste, and worker safety. Our reputation could be damaged if we do not, or are perceived to not, act responsibly with respect to sustainability matters, which could also have a material adverse effect on our business, results of operations, financial position, and cash flows.
We are dependent on our customer loyalty programs and marketing to drive traffic, sales, and loyalty, and any decrease in membership or purchases from members could have a material adverse effect on our business.
Customer traffic is influenced by our marketing methods and our loyalty programs. We rely on our loyalty programs to drive customer traffic, sales, and purchase frequency. Loyalty members earn points toward discounts on future purchases through our VIP rewards programs in the U.S. and Canada. We employ a variety of marketing methods, including email, direct mail, and social media, to communicate product offerings and various promotions and discounts to all of our customers, as well as exclusive offers to our rewards members. As of February 3, 2024, we had 32.1 million members enrolled in our loyalty programs who have made at least one purchase over the last two years. In 2023, shoppers in the loyalty programs generated approximately 90% of the combined U.S. Retail and Canada Retail segments' net sales. If our rewards members decrease their purchase frequency or do not continue to shop with us, we fail to add new members, the number of members decreases, or our marketing is not effective in driving customer traffic, such event could have a material adverse effect on our business.
Our failure to retain our existing senior management team or continue to attract qualified new personnel could have a material adverse effect on our business.
The success of our business is dependent on the continuation of an experienced and talented management team. If we were to lose the benefit of the experience, efforts, and abilities of any of our key executives or members of senior management, our business could be adversely affected. We have entered into employment agreements with certain of our key executives and also offer compensation packages designed to attract and retain talent. In addition, our ability to manage our business will require us to continue to train, motivate, and develop our associates to maintain a high level of talent for future challenges and succession planning. Competition for these types of personnel is intense, and we may not be successful in attracting and retaining the personnel required to grow and operate our business.
Our ABL Revolver hasand Term Loan contain restrictions that could limit our ability to fund operations, which could adversely affect our business.
Funds drawn under our ABL Revolver may be used for working capital purposes, capital expenditures, share repurchases, other expenditures, and permitted acquisitions, as defined in the ABL Revolver. The amount of credit available under the ABL Revolver is limited to a borrowing base formulated on, among other things, a percentage of the book value of eligible inventory and credit card receivables, as reduced by certain reserves. Consequently, it is possible that, should we need to access any additional funds from our ABL Revolver, such funds may not be available in full. The ABL Revolver containsrequires us to maintain a minimum availability covenant where an eventfixed charge coverage ratio of default shall occur ifnot less than 1:1 when availability is less than the greater of $30.0$47.3 million or 10.0% of of the maximum creditborrowing amount. In addition, the
Our ABL Revolver containsand Term Loan also contain customary covenants restricting our activities, including limitations on theour ability to sell assets, engage in acquisitions, enter into transactions involving related parties, incur additional debt, grant liens on assets, pay dividends, or repurchase stock, and make certain other changes. There are specific exceptions to these covenants, including, in some cases, upon satisfying specified payment conditions.conditions based on availability. The ABL Revolver containsand Term Loan contain customary events of default.default, including failure to comply with certain financial and other covenants. Upon an event of default that is not cured or waived within the applicable cure periods,period, in addition to other remedies that may be available to the lenders, theour obligations may be accelerated, outstanding letters of credit may be required to be cash collateralized, and remedies may be exercised against the collateral.
We use the ABL Revolver for borrowings and to secure letters of credit, both of which reduce the amount of available credit. The actual amount that is available under the ABL Revolver fluctuates, due to factors including, but not limited to, eligible inventory and credit card receivables, reserve amounts, outstanding letters of credit, and outstanding borrowings. Consequently, it is possible that, should we need to access any additional funds from our ABL Revolver, it may not be available in full.
RISKS RELATING TO EXTERNAL FACTORS
We may be unable to compete in our highly competitive market, which could have a material adverse effectOur international operations and reliance on our business.
The footwear market is highly competitive with few barriers to entry. We compete against a diverse group of manufacturers and retailers, including department stores, mall-based shoe stores, national chains, independent shoe retailers, single-brand specialty retailers, online shoe retailers, brand-oriented discounters, multi-channel specialty retailers, and brand suppliers. In addition, our wholesale retailer customers sell shoes purchased from competing footwear suppliers with owned and licensed brands that are well known. Our success depends on our ability to remain competitive with respect to assortment, quality, convenience, and value. The performance of our competitors, as well as a change in their pricing policies as a result of the current economic environment, marketing activities, and other business strategies, could have a material adverse effect on our business.
E-commerce networks have rapidly evolved while consumer receptiveness to shopping online has substantially increased. Competition from e-commerce players has significantly increased due to their ability to provide improved user experience, greater ease of buying goods, low or no shipping fees, faster shipping times, and more favorable return policies. Businesses, including our suppliers, can easily launch online sites and mobile platforms at nominal costs by using commercially available software or partnering with any of a number of successful digital marketplace providers. Some of our suppliers use such platforms to compete withforeign-sourced merchandise exposes us by allowing consumers to purchase products directly through the supplier. Competitors with other revenue sources may also be able to devote more resources to marketing and promotional campaigns, adopt more aggressive pricing policies, and devote more resources to websites, mobile platforms and applications, and systems development.
Our business may be adversely affected if we are unable to provide our customers with cost-effective shopping platforms that are able to respond and adapt to rapid changes in technology.
The number of people who access the Internet through devices other than personal computers, including mobile phones, smartphones, handheld computers such as notebooks and tablets, video game consoles, and television set-top devices, has increased dramatically in the past few years. The smaller screen size, functionality, and memory associated with smartphones, laptops, and tablets may make the use of our sites and purchasing our products more difficult. The versions of our sites developed for these devices and our mobile app may not be compelling to consumers.
In addition, it is time consuming and costly to keep pace with rapidly changing and continuously evolving technology. We cannot be certain that our mobile applications or our mobile-optimized sites will be successful in the future. As existing mobile devices and platforms evolve and new mobile devices and platforms are released, it is difficult to predict the problems we may encounter in adjusting and developing applications for changes and alternative devices and platforms, and we may need to devote significant resources to the creation, support, and maintenance of such applications. If we are unable to attract customers to our websites through these devices or are slow to develop versions of our websites that are more compatible with alternative devices or a mobile application, we may fail to capture a significant share of customers, which could have a material adverse effect on our business.
Further, we continually upgrade existing technologies and business applications, and we may be required to implement new technologies or business applications in the future. The implementation of upgrades and changes requires significant investments. Our results of operations may be affected by the timing, effectiveness, and costs associated with the successful implementation of any upgrades or changes to our systems and infrastructure. In the event that it is more difficult for our customers to buy products from us on their mobile devices, or if our customers choose not to buy products from us on their mobile devices or to use mobile products that do not offer access to our websites, our customer growth could be harmed, which could have a material adverse effect on our business, financial condition, and results of operations.
We also are dependent on the interoperability of our sites with popular mobile operating systems that we do not control, such as iOS and Android, and any changes in such systems that degrade the functionality of our sites or mobile app, limit or discontinue our access to a particular platform, or give preferential treatment to competitive products or services, could adversely affect the usage of our sites on mobile devices. We are also subject to the policies and terms of service of the providers of such operating systems and mobile application download stores, which govern the promotion, distribution, content, and operation of our mobile applications. Each provider has broad discretion to change and interpret its terms of service and other policies with respect to us and other developers, and those changes may be unfavorable to us. Additionally, mobile application download stores have imposed, and are likely to continue imposing, certain privacy-and security-related restrictions and controls on the providers and applications within their marketplaces. For example, Apple released a software update in 2021 that, by default, blocks advertisers from tracking certain mobile device activity unless affirmative consent is obtained.
In the event that it is more difficult for our customers to access and use our sites on their mobile devices, or if our customers choose not to access or to use our sites on their mobile devices or to use mobile products that do not offer access to our sites, it could have a material adverse effect on our business, financial condition, and results of operations.
We rely on foreign sources for our merchandise, and our business is therefore subject to risks associated with international trade.matters.
We have key international operations in various locations, including Canada, China, and Brazil, and we face risks inherent in purchasingsourcing our merchandise from suppliersthird-party manufacturers and national brand vendors with foreign operations. Our operations such as:may be adversely affected by international political, economic, and social instability; local laws and customs; legal and regulatory constraints, including compliance with applicable anti-bribery, anti-corruption, labor, trade, and foreign tax laws; local business practices, including compliance with foreign laws and with domestic and international labor standards; and currency laws and regulations. Risks may also include, among others, public health threats, includingwhich has in the COVID-19 pandemic; economicpast materially adversely impacted our business; inclement weather and political instability in countries where these suppliers are located;natural disasters; international hostilities, or acts of war, including the ongoing war in Ukraine and the Israel-Hamas war, the recent militant attacks on cargo vessels in the Red Sea, which ultimately could adversely impact supplier deliveries or terrorism affecting the U.S.freight costs, or foreign countries from which our merchandise is sourced;terrorism; increases in shipping costs; transportation delays and interruptions, including increased inspections of import shipments by domestic authorities;authorities or the occurrence of international trade disruptions; work stoppages; expropriation or nationalization; changes in foreign government administration and governmental policies; changes in import duties or quotas; compliancecost and difficulties associated with trademanaging operations outside of the U.S.; possible adverse tax consequences from changes in tax laws or the unfavorable resolution of tax assessments or audits; and greater difficulty in enforcing intellectual property rights. Additionally, fluctuations in foreign tax laws; and local business practices, including compliance withcurrency exchange rates may negatively impact our financial results. With a substantial portion of our merchandise being imported from foreign laws and with domestic and international labor standards. Suchcountries, any of these events may increasecould result in our costs and disrupt our operations,failure to obtain merchandise in a timely manner, which ultimately could have a material adverse effect on our business, financial condition, andor results of operations.
We require our business partners to operate in compliance with applicable laws and regulations and our internal requirements. However, we do not control such third parties or their labor and business practices. The violation of labor or other laws by any one of our vendors could have a material adverse effect on our business. In addition, we rely on manufacturers that operate outside of North America, including China, Vietnam, and Brazil, who may disclose our intellectual property or other proprietary information to competitors or third parties, which could result in the distribution and sale of counterfeit versions of our products.
Our international operations expose us to political, economic, operational, compliance, and other risks.
We have international operations in various locations, including China, Canada, and Brazil. The success of our international operations may be adversely affected by political, economic, and social conditions beyond our control, local laws and customs, and legal and regulatory constraints, including compliance with applicable anti-bribery, anti-corruption, labor, and currency laws and regulations. Risks inherent in our existing and future operations also include, among others, public health threats, such as the COVID-19 pandemic, the cost and difficulties of managing operations outside of the U.S., possible adverse tax consequences from changes in tax laws or the unfavorable resolution of tax assessments or audits, and greater difficulty in enforcing intellectual property rights. Additionally, foreign currency exchange rates and fluctuations may negatively impact our financial results. Any of these events could have a material adverse effect on our business, financial condition, or results of operations.
Vaccine mandates and other governmental regulations relating to the ongoing COVID-19 pandemic could have a material adverse impact on our business, operations, and results of operations.
On September 9, 2021, President Biden announced a proposed rule requiring that all employers with at least 100 employees require that their employees be fully vaccinated or tested weekly (the "vaccine mandate"). The U.S. Department of Labor’s Occupational Safety and Health Administration ("OSHA") issued an emergency temporary standard regulation to carry out this mandate. On January 26, 2022, OSHA withdrew the emergency temporary standard regulation, ending the vaccine mandate. At this time, it remains unclear whether OSHA will try to enact similar mandates in the future. As a result, we may be required to implement a requirement that all of our associates or certain of our associates get vaccinated or regularly tested for COVID-19. At this time, it is not possible to predict the impact that a vaccine mandate and any other related measures, or a vaccine requirement should we adopt one, will have on us. Any vaccine requirement put in place may result in employee attrition and impact our ability to recruit new talent, all of which could have a material adverse effect on our business, operations, and results of operations.
We are subject to stringent and changing privacy laws, regulations, and standards, as well as policies, contracts, and other obligations related to data privacy and security. Our failure to comply with privacy laws and regulations, as well as other legal obligations, could have a material adverse effect on our business.
State, federal, and foreign governments have enacted and are increasingly enactingcontinuing to enact laws and regulations governing the collection, use, retention, sharing, transfer, and security of personally identifiable information and data. AOur business is subject to a variety of federal, state, local, and foreign laws and regulations, orders, rules, codes, regulatory guidance, and certain industry standards regarding privacy, data protection, consumer protection, information security, and the processing of personal information and other data apply to our business.data. For example, the California Consumer Privacy Act of 2018 ("CCPA"), which took effect on January 1, 2020, imposes certain restrictions and disclosure obligations on businesses that collect personal information about California residents and provides for a private right of action, as well as penalties for noncompliance. The CCPA provides for civil penalties for violations and creates a private right of action for certain data breaches that is expected to increase data breach litigation. It remains unclear how various provisions ofIn addition, the CCPA will be interpreted and enforced. The California Privacy Rights Act ("CPRA"), which was passed in November 2020 and will take took effect in January 2023 (with a look-back for certain requirements to January 2022), which amends and expands the CCPA and places additional restrictions on the "sharing" of personal information for purposes of cross-context behavioral advertising. We may beare subject to additional state privacy regulations, in the future, including the Virginia Consumer Data Protection Act, and the Colorado Privacy Act, both ofthe Connecticut Data Privacy Act, and the Utah Consumer Privacy Act, which regulate the processing of "personal data" regarding their respective residents and grantswhich grant residents certain rights with respect to their personal data. State laws are changing rapidly, and new legislation proposed or enacted in a number of other states imposes, or has the potential to impose, additional obligations on companies that process confidential, sensitive and personal information, and will continue to shape the data privacy environment nationally. The U.S. federal government is also significantly focused on privacy matters.
We are subject to other consumer protection laws including California's Consumer Legal Remedies Act and unfair competition and false advertising laws, the Fair and Accurate Credit Transactions Act and the Telephone Consumer Protection Act, Canada's Anti-Spam Law, the CCPA, CPRA and other recently enacted consumer data protection laws. Additionally, the regulatory environment is increasingly demanding with frequent new and changing requirements concerning cybersecurity, information security, and privacy, which may be inconsistent from one jurisdiction to another. Any failure by us or any of our business partners to comply with applicable laws, rules, and regulations may result in investigations or actions against us by governmental entities, private claims and litigation, fines, penalties, or other liabilities. Such events may increase our expenses, expose us to liabilities, and impairharm our reputation, which could have a material adverse effect on our business.
While we aim to comply with applicable data protection laws and obligations in all material respects, there is no assurance that we will notcould be subject to claims that we have violated such laws and obligations, willwe may not be able to successfully defend against such claims, or will notand we could be subject to significant fines and penalties in the event of non-compliance. Additionally, to the extent multiple state-level laws are introduced with inconsistent or conflicting standards and there is no federal law to preempt such laws, compliance with such laws could be difficult and costly to achieve, or impossible to achieve, and we could be subject to fines and penalties in the event of non-compliance.
LegislativeExtreme or regulatory initiatives related to climate changeunseasonable weather conditions in locations where we and our vendors operate could have a material adverse effect on our business.
Greenhouse gasesLocations where we operate and that we consider to be material to our business, as set forth in Item 2. Properties of this Form 10-K, as well as locations operated by our vendors, may be subject to natural disasters, other extreme weather conditions, and negative climate change patterns. Weather-related risks, including resource scarcity, rationing, or unexpected costs from increases in fuel or raw material prices, could disrupt our operations. Such disruptions may result in decreased demand for our products and disruptions in our sales channels and sourcing and distribution networks, which ultimately could have ana material adverse effect on global temperatures,our business, financial condition, and results of operations. Extreme weather events and changes in weather patterns can also influence customer trends and shopping habits. Because our business is heavily weighted towards dress and seasonal products, unseasonably warm temperatures during our fall selling season or unseasonably cool weather during our spring selling season may diminish demand for our seasonal merchandise. We experienced this during 2023 with respect to unseasonably warm weather during our fall selling season, which adversely impacted our results of operations.
In addition, heavy snowfall, hurricanes, or other severe weather events where our retail stores and the retail stores of our wholesale customers are located may decrease customer traffic in those stores and reduce our sales and profitability. Moreover, natural disasters such as earthquakes, hurricanes, wildfires and tsunamis, whether occurring in the U.S. or abroad, and their related consequences and effects, including energy shortages and public health issues, could disrupt our operations. In particular, if a natural disaster or severe weather event were to occur in an area in which we or our suppliers, customers, or distribution centers are located, our continued success would depend, in part, on the safety and availability of the relevant personnel and facilities and proper functioning of our or our third parties’ systems and operations. There is growing concern that climate change may increase both the frequency and severity of extreme weather conditions and natural disasters. SuchIn addition, the physical changes caused by climate change could result in changes in regulations, consumer preferences, production capabilities, availability of raw materials and costs, which could in turn affect our business, operating results, and financial condition.
If we were to experience a local or regional disaster or other business continuity event or concurrent events, we could experience operational challenges, depending upon how a local or regional event may affect our human capital across our operations or regarding particular aspects of our operations, such as key executive officers or personnel. Further, if we are unable to find alternative suppliers or shipping channels, replace capacity at key manufacturing or distribution locations or quickly repair damage to our IT systems and networks, including the Internet and third-party services, we could be late in delivering, or be unable to deliver, products to our customers. Any of these events could result in decreased demand for our products and disruptions in our sales channels and manufacturing and distribution networks, including those of our vendors, which could have a negativematerial adverse effect on our business. Concern over climate change may result in newbusiness, financial condition, and results of operations.
Legislative or additional legislativeregulatory initiatives related to environmental, social, and regulatory requirements to reduce or mitigate the effects of climate change on the environment, which could result in future tax, transportation cost, and utility increases. Moreover, natural disasters and extreme weather conditions may impact the productivity of our facilities, the operation of our supply chain, or consumer buying patterns. Any of these risksgovernance ("ESG") matters could have a material adverse effect on our business.
UncertaintyNew laws and regulations related to ESG matters, including the recently-finalized climate disclosure rules adopted by the SEC, have been issued and new proposals may be adopted, which could require us to undertake costly initiatives or operational changes. Non-compliance with these emerging rules or standards, or a failure to address regulator, stakeholder, and societal expectations, may result in future changespotential cost increases, litigation, fines, penalties, brand or reputational damage, loss of customers and vendors, or failure to legislation,retain and attract talent. Managing compliance and implementing ESG goals and initiatives involves risks and uncertainties, including increased costs. Any failure, or perceived failure, to manage ESG risks, adhere to public statements, comply with federal, state, or international ESG laws and regulations, or meet evolving and varied stakeholder expectations could result in legal and regulatory reform, or policies, other than those previously discussed, could have a material adverse effect onproceedings against us and materially adversely affect our business.
Laws, regulations, and policies in various jurisdictions may be subject to significant change due to economic, political, and other conditions. Such changes, including additional taxes and tariffs, may result in additional costs to our business and could require us to increase prices to our customers or, if unable to do so, result in a material adverse effect on our financial performance.
RISKS RELATING TO OUR COMMON SHARES
Our amended and restated articles of incorporation, amended and restated code of regulations, and Ohio state law contain provisions that may have the effect of delaying or preventing a change in control of Designer Brands Inc.the Company. This could adversely affect the value of our Class A common shares.
Our amended and restated articles of incorporation authorize our Board of Directors to issue up to 100,000,000100 million preferred shares and to determine the powers, preferences, privileges, rights, including voting rights, qualifications, limitations, and restrictions on those shares, without any further vote or action by the shareholders. The rights of the holders of our Class A common shares will be subject to, and may be adversely affected by, the rights of the holders of any preferred shares that may be issued in the future. The issuance of preferred shares could have the effect of delaying, deterring, or preventing a change in control of the Company and could adversely affect the voting power of our common shares.
In addition, provisions of our amended and restated articles of incorporation, amended and restated code of regulations, and Ohio law, together or separately, could discourage potential acquisition proposals, delay or prevent a change in control, or limit the price that certain investors might be willing to pay in the future for our common shares. Among other things, these provisions establish a staggered board, require a super-majority vote to remove directors, and establish certain advance notice procedures for nomination of candidates for election as directors and for shareholder proposals to be considered at shareholders' meetings.
We do not expect a trading market for the Company's Class B common shares to develop and, therefore, any investment in the Company's Class B common shares may be effectively illiquid, unless such shares are converted into the Company's Class A common shares.
There is currently no public market for the Company's Class B common shares. We do not intend to list the Class B common shares on any securities exchange or any automated quotation system. As a result, there can be no assurance that a secondary market willfor the Company's Class B common shares may not develop, and we do not expect any market makers to participate in a secondary market. Because the Class B common shares are not listed on a securities exchange or an automated quotation system, it may be difficult to obtain pricing information with respect to the Class B common shares. Accordingly, there may be a limited number of buyers if a holder decideddecides to sell its Class B common shares. This may affect the price a holder would receive upon such sale. Alternatively, a holder of such shares could convert themthe shares into Class A common shares, on a share for shareshare-for-share basis, prior to selling. However, such conversion could affect the timing of any such sale, which may in turn affect the price a holder may receive upon such sale.
Entities owned by or controlled by Jay L. Schottenstein, the Executive Chairman of the Designer Brands Inc.our Board, of Directors, and members of his family (the "Schottenstein Affiliates") directly control or substantially influence the outcome of matters submitted for Designer Brands Inc. shareholder votes, and their interests may differ from other shareholders.
As of January 29, 2022,February 3, 2024, the Schottenstein Affiliates havebeneficially owned approximately 54% of the voting power26% of the Company's outstanding common shares.shares, representing 62% of the combined voting power, consisting of, in the aggregate, 7.1 million Class A common shares (which are entitled to one vote per share) and 7.7 million Class B common shares (which are entitled to eight votes per share). The Schottenstein Affiliates directly control or substantially influence the outcome of matters submitted to Designer Brands Inc.'sour shareholders for approval, including the election of directors, approval of mergers or other business combinations, and approval of acquisitions or dispositions of assets. The interests of the Schottenstein Affiliates may differ from or be opposed to the interests of other shareholders, and theirthe Schottenstein Affiliates' level of ownership and voting power in the Company may have the effect of delaying or preventing a subsequent change in control of the Company that may be favored by other shareholders.
The Schottenstein Affiliates engage in a variety of businesses, including, but not limited to, business and inventory liquidations, apparel companies, and real estate investments. Opportunities may arise in the area of potential competitive business activities that may be attractive to the Schottenstein Affiliates and us. Our amended and restated articles of incorporation provide that the Schottenstein Affiliates are under no obligation to communicate or offer any corporate opportunity to us. In addition, the Schottenstein Affiliates have the right to engage in similar activities as us, do business with our suppliers and customers, and, except as limited by agreement, employ or otherwise engage any of our officersexecutives or associates.
Furthermore, as a "controlled company" within the meaning of the New York Stock Exchange (the "NYSE") rules, the Company qualifies for, and in the future may opt to rely on, exemptions from certain corporate governance requirements, including having a majority of independent directors, as well as having nominating and corporate governance and compensation committees composed entirely of independent directors.
| | | | | | | | | | | | | | |
| ITEM 1B. UNRESOLVED STAFF COMMENTS |
None.
RISK MANAGEMENT AND STRATEGY
We have developed an information security program that is designed to address material risks from cybersecurity threats. Our information security program is integrated into our overall enterprise risk management process, which the Board ultimately oversees. The Board has delegated its responsibility for cybersecurity risk oversight to the Technology Committee of the Board, which is responsible for (i) regularly reviewing with management significant cybersecurity, privacy, and IT risks or exposures, and our policies and processes with respect to risk assessment and risk management of the same; (ii) regularly reviewing with management an assessment of the steps management has taken to monitor and control such risks; and (iii) regularly reporting to the full Board on such matters.
As described in further detail below, our information security program is led by our Director of IT Security & Compliance ("DITSC"), who is responsible for our overall information security strategy, policy, security engineering, operations, and cyber threat detection and response. The program includes policies and procedures that guide our implementation and maintenance of security measures and controls. Risk-based analysis and judgment of the DITSC and our management team, along with feedback from internal and third-party audits and assessments, are used to select security controls to address risks. The following factors, among others, are considered when identifying security controls: likelihood and severity of a risk, impact on the Company and others if a risk materializes, feasibility of controls, and impact of controls on operations and others. Third parties also play a role in our cybersecurity, as we engage security firms in different capacities to provide or operate some of these controls and technology systems, including cloud-based platforms and services. For example, third parties are used to conduct assessments, such as vulnerability scans and penetration testing. We use a variety of processes to address and oversee cybersecurity threats related to the use of third-party technology and services, including a vendor risk management program.
We have a written incident response plan and conduct tabletop exercises to enhance incident response preparedness. We have other response protocols to address operating impacts due to disruptions in services and technology, including scenario run books and mitigation plans for key vendors. Employees undergo security awareness training when hired and annually.
GOVERNANCE
The DITSC is the Company's management position with primary responsibility for the development, operation, and maintenance of our information security program. The DITSC has over 20 years of experience in cybersecurity, including over 15 years of experience in the Cyber Defense and Electronic Warfare section of the U.S. Army. The DITSC has obtained multiple subject matter certifications, including the Global Information Assurance Certification. The DITSC briefs the Technology Committee of the Board regularly and oversees regular cybersecurity training and education opportunities for the Board, which covers topics ranging from the current threat landscape to our cybersecurity program metrics, risks, and roadmap. Management receives regular updates on cybersecurity risks from the DITSC. In the event of a security incident, the DITSC will follow the escalation process in our incident response plan to notify the Company's Crisis Committee, which is composed of a cross-functional group of Company leaders. The Crisis Committee will work with the DITSC to respond to and remediate any actual cybersecurity incidents. Depending on the severity of the security incident, the DITSC and the Crisis Committee are to escalate the security incident to the Chief Legal Officer and the Principal Accounting Officer, who will assess materiality in consultation with outside counsel. The Chief Legal Officer will notify the Technology Committee and the Board of any potential material incident.
Although the risks from cyber threats have not materially affected our business strategy, results of operations, or financial condition to date, we continue to closely monitor cyber risk. We may not be successful in preventing or mitigating a cybersecurity incident that could have a material adverse effect on us. While we maintain cybersecurity insurance, the costs related to cybersecurity threats or disruptions may not be fully insured. See Item 1A. Risk factors for a discussion of cybersecurity risks.
The following table summarizes the location and general use of our principal properties as of January 29, 2022February 3, 2024 that we consider to be material to our business and that we believe will meet our operational needs for the foreseeable future:
| | | | | | | | | | | | | | | | | | | | | | | | | | |
| Facility | | Location | | Owned/Leased | | Segment | | Approximate Square Feet |
| Principal corporate office | | Columbus, Ohio | | Owned | | Corporate and U.S. Retail | | 178,000 | |
| Distribution center | | Columbus, Ohio | | Owned | | U.S. Retail | | 625,000 | |
Fulfillment center(1)
| | Columbus, Ohio | | Leased | | U.S. Retail | | 854,000 | |
Distribution centerEast Coast Logistics Center | | Westampton, New Jersey | | Leased | | U.S. Retail and Brand Portfolio | | 683,000 | |
U.S. retail stores(2)(1) | | 508499 various U.S. locations | | Leased | | U.S. Retail | | 10,308,0009,958,000 | |
Canada retail stores(3)(2) | | 140143 various Canadian locations | | Leased | | Canada Retail | | 1,103,0001,114,000 | |
| Showrooms | | 7Six various U.S. locations | | Leased | | Brand Portfolio | | 95,00094,000 | |
| Foreign sourcing offices | | One location in China and one location in Brazil | | Leased | | Brand Portfolio | | 117,000 | |
(1) Our fulfillment center is leased from a Schottenstein Affiliate, a related party, and expires in September 2022 with two renewal options of five years each.
(2) Our DSW U.S. stores average approximately 20,30020,000 square feet. Most of the store leases are for a fixed term with options for extension periods, exercisable at our option.
(3)(2) The Shoe Company and DSW stores in Canada average approximately 7,9007,800 square feet. Most of the store leases are for a fixed term with options for extension periods, exercisable at our option.
| | | | | | | | | | | | | | |
| ITEM 3. LEGAL PROCEEDINGS |
The information set forth in Note 1314, Commitments and Contingencies - Legal Proceedings, of the Consolidated Financial Statementsconsolidated financial statements of this Form 10-K is incorporated herein by reference.
| | | | | | | | | | | | | | |
| ITEM 4. MINE SAFETY DISCLOSURES |
Not applicable.
PART II
| | | | | | | | | | | | | | |
| ITEM 5. MARKET FOR THE REGISTRANT'S COMMON EQUITY, RELATED STOCKHOLDER MATTERS AND ISSUER PURCHASES OF EQUITY SECURITIES |
COMMON SHARES
Our Class A common shares are listed for trading on the NYSE under the ticker symbol "DBI." There is currently no public market for the Company's Class B common shares, but the Class B common shares can be exchanged forconverted into the Company's Class A common shares at the election of the holder on a share for shareshare-for-share basis. Holders of Class A common shares are entitled to one vote per share and holders of Class B common shares are entitled to eight votes per share on matters submitted to shareholders for approval. As of March 14, 2022,18, 2024, there were 197191 holders of record of our Class A common shares and 1312 holders of record of our Class B common shares. TheThe number of holders of record is based upon the actual number of holders registered at such date and does not include holders of shares in "street names" or persons, partnerships, associates, corporations, or other entities identified in security position listings maintained by depositories.
DIVIDENDS
The payment of any future dividends is subject to the restrictions imposed by the ABL Revolver and is at the discretion of our Board of Directors, which considersand is based on our expectations of future earnings, cash flow, financial condition, capital requirements, changes in taxation laws, general economic condition, and any other relevant factors. We anticipate declaring dividends on a quarterly basis.
On March 14, 2024, the Board declared a quarterly cash dividend payment of $0.05 per share for both Class A and Class B common shares. The dividend will be paid on April 12, 2024 to shareholders of record as of the close of business on March 29, 2024.
SHARE REPURCHASE PROGRAM
On August 17, 2017, the Board of Directors authorized the repurchase of an additional $500$500.0 million of Class A common shares under our share repurchase program, which was added to the $33.5 million remaining from the previous authorization, authorization. Awith s of February 3, 2024$334.9, $87.7 million of Class A common shares that remain authorizedremained available for repurchase under the program as of January 29, 2022.program. During 2021, we did not repurchase any Class A common shares. The share repurchase program is subject to restrictions imposed by the ABL Revolver and may be suspended, modified or discontinued at any time, and we have no obligation to repurchase any amount of our Class A common shares under the program. Any share repurchasesShares will be completedrepurchased in the open market at times and in amounts considered appropriate based on price and market conditions.
The following table sets forth the Class A common shares repurchased during the three months ended February 3, 2024:
| | | | | | | | | | | | | | | | | | | | | | | | | |
| (in thousands, except per share amounts) | (a) Total Number of Shares Purchased (1) | | (b)
Average Price Paid per Share | | (c)
Total Number of Shares Purchased as Part of Publicly Announced Programs | | (d)
Approximate Dollar Value of Shares that May Yet Be Purchased Under the Programs | | |
| October 29, 2023 to November 25, 2023 | 55 | | | $ | 10.07 | | | — | | | $ | 87,677 | | | |
| November 26, 2023 to December 30, 2023 | 78 | | | $ | 8.80 | | | — | | | $ | 87,677 | | | |
| December 31, 2023 to February 3, 2024 | 59 | | | $ | 8.42 | | | — | | | $ | 87,677 | | | |
| 192 | | | $ | 9.06 | | | — | | | | | |
(1) The total number of shares repurchased represents shares withheld in connection with tax payments due upon vesting of employee restricted stock awards.
RESTRICTIONS
The ABL Revolver containsand the Term Loan contain customary covenants restricting our activities, including limitations on the ability to pay dividends or repurchase stock. There are specific exceptions to these covenants including, in some cases, upon satisfying specified payment conditions. As of March 14, 2022, we were limited in our ability to pay dividends or repurchase stock above a maximum of $63.1 million.conditions based on availability.
PERFORMANCE GRAPH
The following graph compares our cumulative total shareholder return on our Class A common shares with the cumulative total returns of the Standard and Poor's ("S&P") MidCap 400 Index and the S&P MidCap 400 Retail Index, both of which are published indices. The comparison of the cumulative total returns for each investment assumes that $100 was invested on January 28, 2017February 2, 2019 and that all dividends were reinvested. This comparison includes the period beginning February 2, 2019 and ended January 28, 2017 through the period ended January 29, 2022.February 3, 2024.
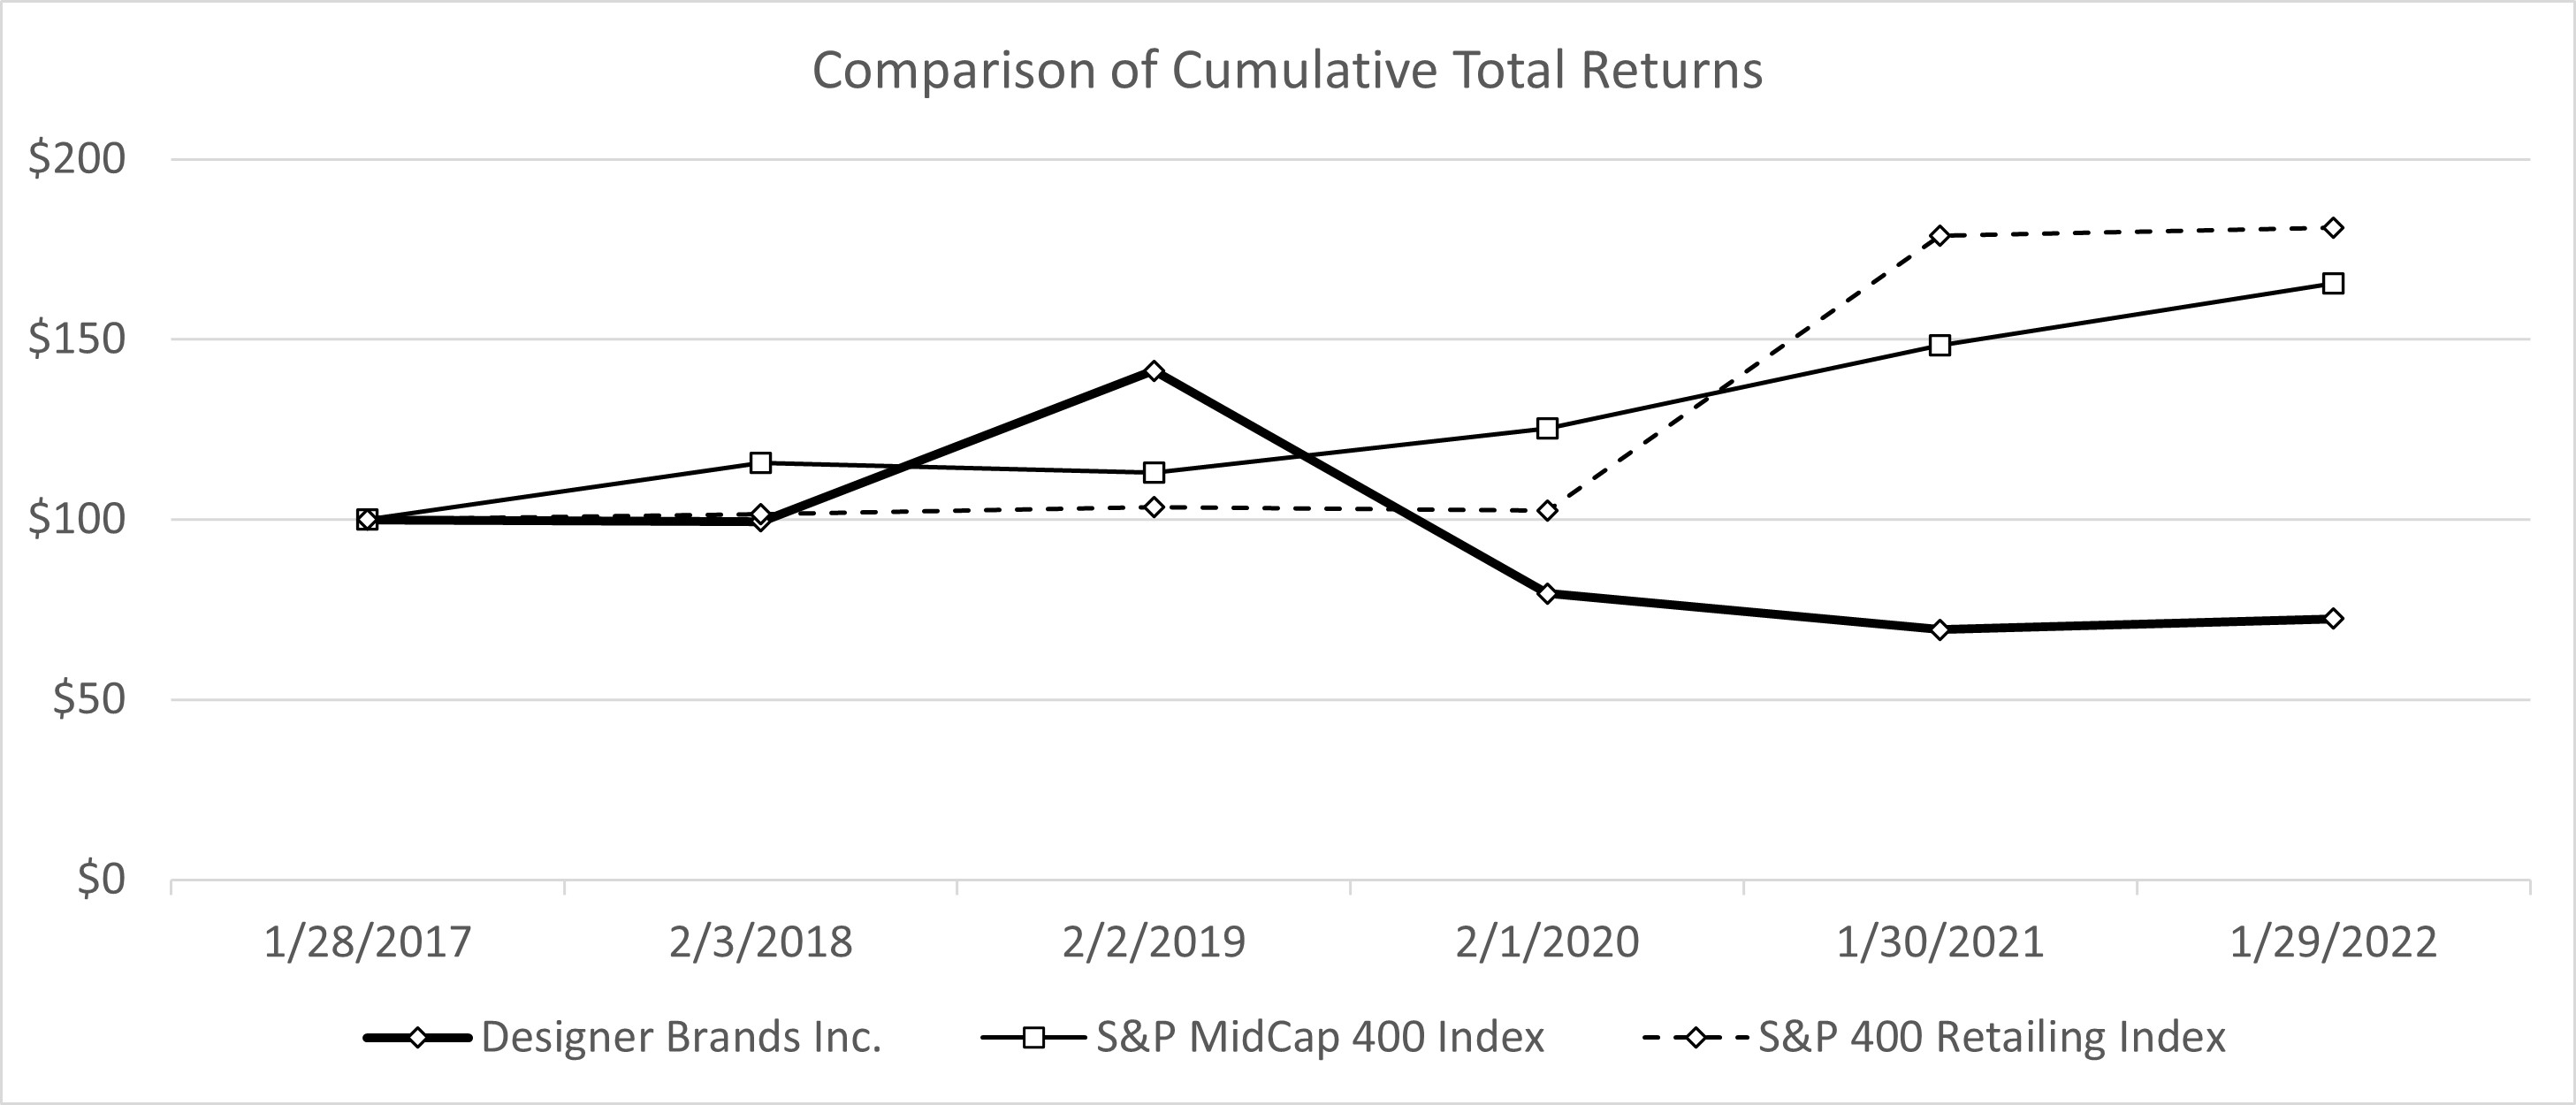
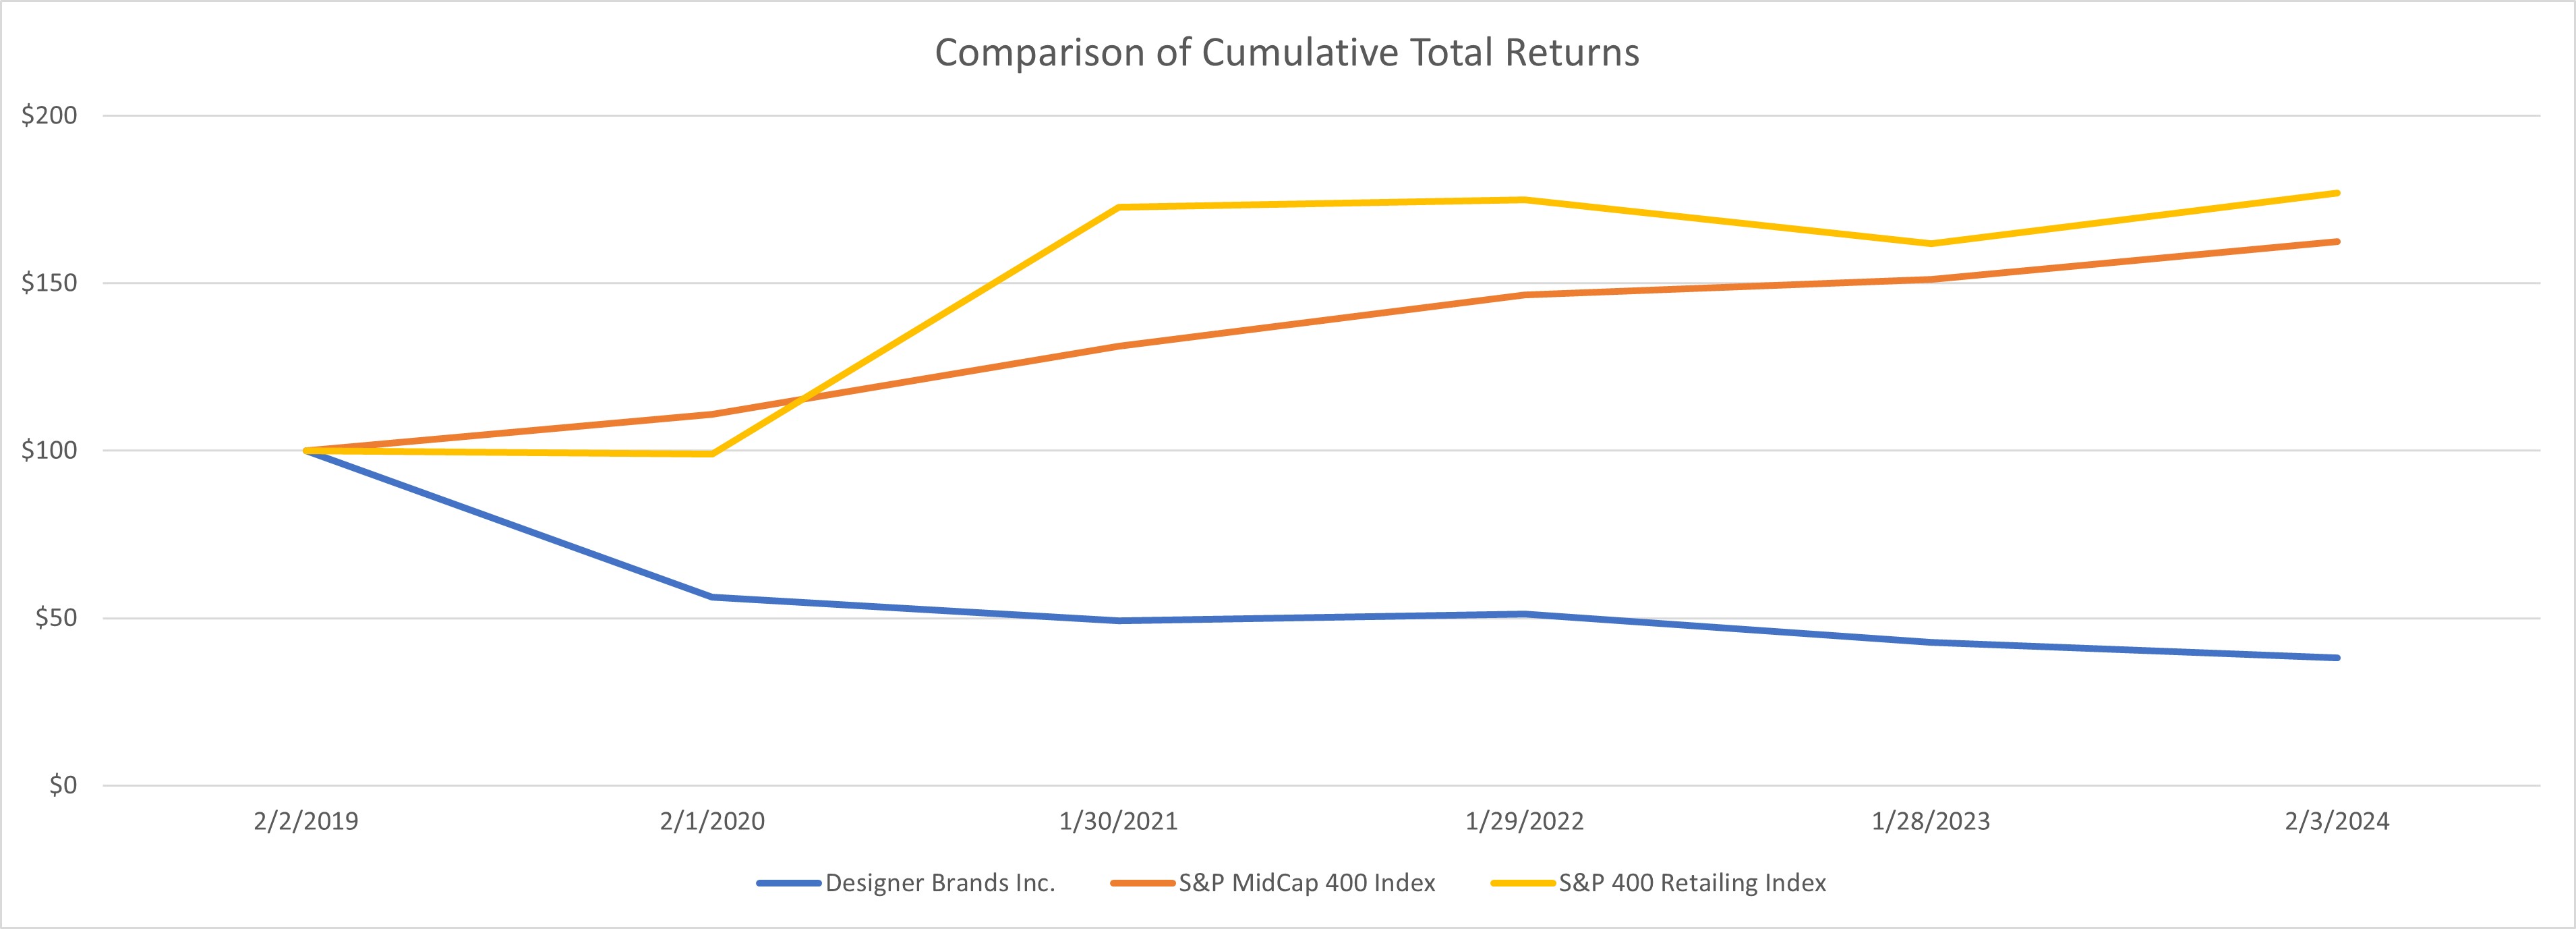
| | Company / Index | Company / Index | | January 28, 2017 | | February 3, 2018 | | February 2, 2019 | | February 1, 2020 | | January 30, 2021 | | January 29, 2022 | Company / Index | | February 2, 2019 | | February 1, 2020 | | January 30, 2021 | | January 29, 2022 | | January 28, 2023 | | February 3, 2024 |
| Designer Brands Inc. | Designer Brands Inc. | | $ | 100.00 | | | $ | 99.50 | | | $ | 141.35 | | | $ | 79.44 | | | $ | 69.46 | | | $ | 72.52 | |
| S&P MidCap 400 Index | S&P MidCap 400 Index | | $ | 100.00 | | | $ | 115.74 | | | $ | 112.95 | | | $ | 125.21 | | | $ | 148.32 | | | $ | 165.45 | |
| S&P MidCap 400 Retail Index | S&P MidCap 400 Retail Index | | $ | 100.00 | | | $ | 101.40 | | | $ | 103.48 | | | $ | 102.42 | | | $ | 178.77 | | | $ | 181.07 | |
| | | | | | | | | | | | | | |
| ITEM 7. MANAGEMENT'S DISCUSSION AND ANALYSIS OF FINANCIAL CONDITION AND RESULTS OF OPERATIONS |
This management's discussion and analysis of financial condition and results of operations contains forward-looking statements that involve various risks and uncertainties. See Cautionary Statement Regarding Forward-Looking Information for Purposes of the "Safe Harbor" Provisions of the Private Securities Litigation Reform Act of 1995 on page ii for a discussion of the uncertainties, risks, and assumptions associated with these statements. This discussion is best read in conjunction with our Consolidated Financial Statements,consolidated financial statements, including the notes thereto, set forth in Item 8. Financial Statements and Supplementary Data of this Form 10-K. The results of operations for the periods reflected herein are not necessarily indicative of results that may be expected for future periods, and our actual results may differ materially from those discussed in the forward-looking statements as a result of various factors, including but not limited to those listed under Item 1A. Risk Factors of this Form 10-K and included elsewhere in this Form 10-K.
The following discussion includes a comparison of our results of operations and liquidity and capital resources for 20212023 and 2020.2022. Except where it may be useful in understanding 20212023 results, we have omitted discussion of results for 2019,2021, which may be found in Item 7. Management's Discussion and Analysis of Financial Condition and Results of Operations of our Annual Report on Form 10-K for the year ended January 30, 2021,28, 2023, filed with the SEC on March 22, 2021.
EXECUTIVE OVERVIEW AND TRENDS IN OUR BUSINESS
DespiteFor 2023, net sales decreased 7.3% and total comparable sales decreased 9.0% over last year. During 2023, net sales from our Owned Brands decreased 6.2% over last year, with Owned Brands representing 25.8% of consolidated net sales as compared to 25.5% for last year. At the continuing challengesbeginning of 2023, we completed the volatile market conditionsacquisition of Keds, expanding our Owned Brands' reach into casual and supply chain disruptions,athleisure footwear in the wholesale and direct-to-consumer e-commerce channels and complementing the additions of Le Tigre and Topo during 2022. We believe these acquisitions represent significant steps taken toward our strong resultslong-term goal of net sales from our Owned Brands reaching one-third of total sales by 2026. Gross profit as a percentage of net sales for 2021 demonstrated our ability to be nimble and quickly adapt our business model. Our operating profit in 2021 surpassed pre-COVID-19 levels with a 61% growth2023 was 90 basis points lower when compared to 2019last year, primarily due to promotional pricing and we continued to make progress by:
•Growing our market share in historically underpenetrated categories,the deleveraging effect of lower sales on fixed store occupancy costs, which more than offset lower logistics costs, including athletic, men’sfreight, shipping, and kids’;
•Maintaining our leading position in the seasonal and dress categories; and
•Leaning further into our in-house design and sourcing capabilities as we move towards our goal of becoming a builder of brands.distribution.
As we look ahead to our strategic growth, we have organized our efforts around three pillars - Customer, Brand, and Speed:
•Customer- More than ever, our customers have a great desire for products and experiences, and we are adding resources to our digital, information technology ("IT") and analytics teams to understand precisely what they want and what can be improved to provide the best possible experience. Undertaking these actions will enable us to better understand our customers, provide improved service, and target new demographics in ways that we have never deployed before. We are also developing new ideas for how we can provide more value to our VIP rewards members, who we believe continue to be the lifeblood of our business and our largest competitive differentiator.
•Brand- Controlling our own brand destiny is critical for our growth. As we continue to design some of the best brands in the industry, Vince Camuto, Jessica Simpson, Lucky Brand and JLO Jennifer Lopez, we are combining that with our strong direct-to-consumer distribution through our physical footprint in North America and digital infrastructure. We are also partnering with some of the top national brands in the industry to offer one of the largest and broadest assortments. We remain focused on investing in our top 50 brands and will continue to prioritize growing our own brands.
•Speed- Moving quickly is of the utmost importance to consumers. We are developing processes to deliver products more quickly. Fulfillment of digital customer orders currently takes five to seven business days and we are working to improve that to two to three calendar days while simultaneously finding efficiencies to contain costs. We are optimizing our current infrastructure and expanding our delivery partnerships. We are also working to improve collaboration through technology and processes across our organization and to gain additional efficiencies in our overall development cycle.EFFECTS OF INFLATION AND GLOBAL ECONOMIC CONDITIONS
IMPACT OF THE COVID-19 PANDEMIC ON OUR RESULTS OF OPERATIONSThroughout 2023, a downturn in global economic conditions, most notably the growing concerns of a potential recession, rising interest rates, inflationary pressures, changes in employment levels, and significant foreign currency volatility, has adversely impacted discretionary consumer income levels and spending for our customers. Consumer spending on discretionary items, including our products, generally declines during periods of economic uncertainty, when disposable income is reduced, or when there is a reduction in consumer confidence. We are unable to predict the severity of macroeconomic uncertainty, whether or when such circumstances may improve or worsen, or the full impact such circumstances could have on our business. As it relates to our business, during the second half of 2022 and continuing into 2023, our net sales declined as we experienced lower traffic and became more promotional under a more competitive landscape. Competitive pricing pressure has been exacerbated by a more promotional retail environment as macroeconomic conditions continue to impact discretionary consumer spending. These factors ultimately could require us to enact mitigating operating efficiency measures that could have a material adverse effect on business, operations, and results of operations.
As we continue to closely monitor the ongoing COVID-19 pandemic, our top priority remains protecting the health and safety of our customers and associates. As this continues to be an unprecedented period of uncertainty, we have made adjustments and may continue to adjust our operational plans, inventory controls, and liquidity management, as well as make changes to our expense and capital expenditure plans. While trends improved during 2021 as compared to 2020, we cannot reasonably estimate the extent to which our business will continue to be affected by the COVID-19 pandemic and to what extent the recent improved trends will continue. For instance, we have continued to experience reduced customer in-store traffic and net sales when compared to pre-COVID-19 periods, and it is unclear when customer behavior will return to pre-COVID-19 patterns, if at all. The ongoing and prolonged nature of the COVID-19 pandemic may lead to further adjustments to our operations. As such, the ultimate impacts of the COVID-19 pandemic on our businesses will depend on future developments, including the availability of labor, global supply chain disruptions, new variants of COVID-19 and the severity thereof, and the global availability and use of vaccines or palliatives, all of which are highly uncertain and cannot be predicted. As a result, we may have future write-downs or adjustments to inventories, receivables, long-lived assets, intangibles, goodwill, and the valuation allowance on deferred tax assets.
FINANCIAL SUMMARY AND OTHER KEY METRICS
For 2023:
•Net sales increaseddecreased to $3.2$3.1 billion for 2021from $2.2$3.3 billion for 2020.last year.
•GrossGross profit as a percentage of net sales was 33.4% for 2021, as31.7% compared to 13.9% for 2020 and higher than the pre-COVID-19 rate, which was 28.6% for 2019.32.6% last year.
•Net income for 2021attributable to Designer Brands Inc. was $154.5$29.1 million, or $2.00$0.46 per diluted share, which included net after-tax charges of $14.0 million, or $0.22 per diluted share, primarily related to restructuring and integration costs, impairment charges, and CEO transition costs, compared to $162.7 million, or $2.26 per diluted share, last year, which included net after-tax benefits of $23.2$29.0 million,, or $0.30$0.41 per diluted share, primarily related to the change in valuation allowance on deferred tax assets, partially offset by the loss on extinguishment of debt and write-off of debt issuance costs, restructuring and termination costs, impairment charges, and target acquisitionCEO transition costs. Net loss for 2020 was $488.7 million, or a loss of $6.77 per diluted share, which included net after-tax charges of $207.1 million, or $2.87 per diluted share, primarily related to impairment and restructuring charges, a settlement gain with a vendor, and the valuation allowance established against deferred tax assets.
Comparable Sales Performance Metric- The following table presents the percent change in comparable sales for each segment and in total:
| | 2021 | | 2020 | |
| 2023 | |
| 2023 | |
| 2023 | |
| Change in comparable sales: | |
| Change in comparable sales: | |
| Change in comparable sales: | Change in comparable sales: | | |
| U.S. Retail segment | U.S. Retail segment | 55.0 | % | | (34.9) | % | |
| U.S. Retail segment | |
| U.S. Retail segment | |
| Canada Retail segment | |
| Canada Retail segment | |
| Canada Retail segment | Canada Retail segment | 20.1 | % | | (26.0) | % | |
| Brand Portfolio segment - direct-to-consumer channel | Brand Portfolio segment - direct-to-consumer channel | 30.9 | % | | 38.2 | % | |
| Other | NA | | (50.4) | % | |
| Brand Portfolio segment - direct-to-consumer channel | |
| Brand Portfolio segment - direct-to-consumer channel | |
| Total | Total | 51.6 | % | | (34.2) | % | |
| Total | |
| Total | |
NA - Not applicable
We consider the percent change in comparable sales from the same previous year period, a primary metric commonly used throughout the retail industry, to be an important measurement for management and investors of the performance of our direct-to-consumer businesses. We include in our comparable sales metric sales from stores in operation for at least 14 months at the beginning of the applicable year. Stores are added to the comparable base at the beginning of the year and are dropped for comparative purposes in the quarter in which they are closed. Comparable sales include stores temporarily closed as a resultthe e-commerce sales of the COVID-19 pandemic as management believes that this metric is meaningful to monitor our performance.U.S. Retail and Canada Retail segments. Comparable sales also include e-commerce sales. Comparableexclude the 53rd week of sales in 2023 and, specifically for the Canada Retail segment, exclude the impact of foreign currency translation, and arewhich is calculated by translating current period results at the foreign currency exchange rate used in the comparable period of the prior year. Comparable sales include the e-commerce sales of the Brand Portfolio segment from the direct-to-consumer e-commerce site for the Vince Camuto brand. The e-commerce sales for Topo, Keds, and Hush Puppies will be added to the comparable base for the Brand Portfolio segment includebeginning with the direct-to-consumer e-commerce site www.vincecamuto.com. Beginning withfirst quarter of 2024, the second quarter of 2024, and the third quarter of 2020, comparable sales do not include the Other segment due to no longer having activity in the Other segment.2024, respectively. The calculation of comparable sales varies across the retail industry and, as a result, the calculations of other retail companies may not be consistent with our calculation.
Number of Stores- As ofAt the end of 2021 and 2020,the last two fiscal years, we had the following number of stores:
| | January 29, 2022 | | January 30, 2021 | |
| February 3, 2024 | | | February 3, 2024 | | January 28, 2023 |
| U.S. Retail segment - DSW stores | U.S. Retail segment - DSW stores | 508 | | | 519 | | |
| Canada Retail segment: | Canada Retail segment: | | |
| The Shoe Company stores | The Shoe Company stores | 115 | | | 117 | | |
| The Shoe Company stores | |
| The Shoe Company stores | |
| DSW stores | DSW stores | 25 | | | 27 | | |
| 140 | | | 144 | | |
| 143 | |
| Total number of stores | Total number of stores | 648 | | | 663 | | |
RESULTS OF OPERATIONS
The following table presents our consolidated results of operations with associated percentages of net sales:
| | (amounts in thousands, except per share amounts) | (amounts in thousands, except per share amounts) | 2021 | | 2020 | | Change | (amounts in thousands, except per share amounts) | 2023 | | 2022 | | Change |
| Amount | | % of Net Sales | | Amount | | % of Net Sales | | Amount | | % |
| Amount | | | Amount | | % of Net Sales | | Amount | | % of Net Sales | | Amount | | % |
| Net sales | Net sales | $ | 3,196,583 | | | 100.0 | % | | $ | 2,234,719 | | | 100.0 | % | | $ | 961,864 | | | 43.0 | % | Net sales | $ | 3,074,976 | | | 100.0 | | 100.0 | % | | $ | 3,315,428 | | | 100.0 | | 100.0 | % | | $ | (240,452) | | | (7.3) | | (7.3) | % |
| Cost of sales | Cost of sales | (2,127,946) | | | (66.6) | | | (1,923,478) | | | (86.1) | | | (204,468) | | | 10.6 | % | Cost of sales | (2,100,090) | | | (68.3) | | (68.3) | | | (2,236,203) | | (2,236,203) | | | (67.4) | | (67.4) | | | 136,113 | | 136,113 | | | (6.1) | | (6.1) | % |
| Gross profit | Gross profit | 1,068,637 | | | 33.4 | | | 311,241 | | | 13.9 | | | 757,396 | | | 243.3 | % | Gross profit | 974,886 | | | 31.7 | | 31.7 | | | 1,079,225 | | 1,079,225 | | | 32.6 | | 32.6 | | | (104,339) | | (104,339) | | | (9.7) | | (9.7) | % |
| Operating expenses | Operating expenses | (870,682) | | | (27.2) | | | (753,278) | | | (33.7) | | | (117,404) | | | 15.6 | % | Operating expenses | (907,041) | | | (29.4) | | (29.4) | | | (896,382) | | (896,382) | | | (27.1) | | (27.1) | | | (10,659) | | (10,659) | | | 1.2 | | 1.2 | % |
| Income from equity investment | 8,986 | | | 0.3 | | | 9,329 | | | 0.5 | | | (343) | | | (3.7) | % |
| Income from equity investments | | Income from equity investments | 9,390 | | | 0.3 | | | 8,864 | | | 0.3 | | | 526 | | | 5.9 | % |
| Impairment charges | Impairment charges | (1,720) | | | (0.1) | | | (153,606) | | | (6.9) | | | 151,886 | | | (98.9) | % | Impairment charges | (4,834) | | | (0.2) | | (0.2) | | | (4,317) | | (4,317) | | | (0.1) | | (0.1) | | | (517) | | (517) | | | 12.0 | | 12.0 | % |
| Operating profit (loss) | 205,221 | | | 6.4 | | | (586,314) | | | (26.2) | | | 791,535 | | | NM |
| Operating profit | | Operating profit | 72,401 | | | 2.4 | | | 187,390 | | | 5.7 | | | (114,989) | | | (61.4) | % |
| Interest expense, net | Interest expense, net | (32,129) | | | (1.0) | | | (23,694) | | | (1.1) | | | (8,435) | | | 35.6 | % | Interest expense, net | (32,171) | | | (1.0) | | (1.0) | | | (14,874) | | (14,874) | | | (0.5) | | (0.5) | | | (17,297) | | (17,297) | | | 116.3 | | 116.3 | % |
| Non-operating income (expenses), net | (67) | | | (0.0) | | | 1,361 | | | 0.1 | | | (1,428) | | | NM |
| Income (loss) before income taxes | 173,025 | | | 5.4 | | | (608,647) | | | (27.2) | | | 781,672 | | | NM |
| Loss on extinguishment of debt and write-off of debt issuance costs | | Loss on extinguishment of debt and write-off of debt issuance costs | — | | | — | | | (12,862) | | | (0.4) | | | 12,862 | | | NM |
| Non-operating expenses, net | | Non-operating expenses, net | (33) | | | — | | | (130) | | | — | | | 97 | | | (74.6) | % |
| Income before income taxes | | Income before income taxes | 40,197 | | | 1.4 | | | 159,524 | | | 4.8 | | | (119,327) | | | (74.8) | % |
| Income tax benefit (provision) | Income tax benefit (provision) | (18,544) | | | (0.6) | | | 119,928 | | | 5.3 | | | (138,472) | | | NM | Income tax benefit (provision) | (10,981) | | | (0.4) | | (0.4) | | | 3,142 | | 3,142 | | | 0.1 | | 0.1 | | | (14,123) | | (14,123) | | | NM | | NM |
| Net income (loss) | $ | 154,481 | | | 4.8 | % | | $ | (488,719) | | | (21.9) | % | | $ | 643,200 | | | NM |
| Basic and diluted earnings (loss) per share: | | | | |
| Basic earnings (loss) per share | $ | 2.12 | | | $ | (6.77) | | | $ | 8.89 | | | NM |
| Diluted earnings (loss) per share | $ | 2.00 | | | $ | (6.77) | | | $ | 8.77 | | | NM |
| Net income | | Net income | 29,216 | | | 1.0 | | | 162,666 | | | 4.9 | | | (133,450) | | | (82.0) | % |
| Net loss (income) attributable to redeemable noncontrolling interest | | Net loss (income) attributable to redeemable noncontrolling interest | (154) | | | — | | | 10 | | | — | | | (164) | | | NM |
| Net income attributable to Designer Brands Inc. | | Net income attributable to Designer Brands Inc. | $ | 29,062 | | | 1.0 | % | | $ | 162,676 | | | 4.9 | % | | $ | (133,614) | | | (82.1) | % |
| Earnings per share attributable to Designer Brands Inc.: | |
| Basic earnings per share | |
| Basic earnings per share | |
| Basic earnings per share | | $ | 0.47 | | | | | $ | 2.41 | | | | | $ | (1.94) | | | (80.5) | % |
| Diluted earnings per share | | Diluted earnings per share | $ | 0.46 | | | | | $ | 2.26 | | | | | $ | (1.80) | | | (79.6) | % |
| Weighted average shares used in per share calculations: | Weighted average shares used in per share calculations: | |
| Basic shares | Basic shares | 73,024 | | | 72,198 | | | 826 | | | 1.1 | % |
| Basic shares | |
| Basic shares | | 61,296 | | | | | 67,603 | | | | | (6,307) | | | (9.3) | % |
| Diluted shares | Diluted shares | 77,268 | | | 72,198 | | | 5,070 | | | 7.0 | % | Diluted shares | 63,375 | | | | | 72,101 | | | | 72,101 | | | | | (8,726) | | | | (8,726) | | | (12.1) | | (12.1) | % |
NM - Not meaningful
NET SALES
The following table summarizes net sales by segment:
| | (dollars in thousands) | (dollars in thousands) | 2021 | | 2020 | | Change | (dollars in thousands) | 2023 | | 2022 | | Change |
| Amount | | % of Total Segment Net Sales | | Amount | | % of Total Segment Net Sales | | Amount | | % | | Comparable Sales % |
| Amount | | | Amount | | % of Segment Net Sales | | Amount | | % of Segment Net Sales | | Amount | | % | | Comparable Sales % |
| Segment net sales: | Segment net sales: | | | |
| U.S. Retail | |
| U.S. Retail | |
| U.S. Retail | U.S. Retail | $ | 2,769,706 | | | 84.2 | % | | $ | 1,800,323 | | | 78.5 | % | | $ | 969,383 | | | 53.8 | % | | 55.0% | $ | 2,533,849 | | | 80.5 | | 80.5 | % | | $ | 2,791,513 | | | 82.0 | | 82.0 | % | | $ | (257,664) | | | (9.2) | | (9.2) | % | | (9.5)% |
| Canada Retail | Canada Retail | 234,809 | | | 7.1 | % | | 182,659 | | | 8.0 | % | | 52,150 | | | 28.6 | % | | 20.1% | Canada Retail | 264,229 | | | 8.4 | | 8.4 | % | | 283,241 | | | 8.3 | | 8.3 | % | | (19,012) | | | (6.7) | | (6.7) | % | | (5.9)% |
| Brand Portfolio | Brand Portfolio | 286,024 | | | 8.7 | % | | 248,646 | | | 10.8 | % | | 37,378 | | | 15.0 | % | | 30.9% | Brand Portfolio | 348,976 | | | 11.1 | | 11.1 | % | | 327,715 | | | 9.7 | | 9.7 | % | | 21,261 | | | 6.5 | | 6.5 | % | | 6.0% |
| Other | — | | | — | % | | 62,909 | | | 2.7 | % | | (62,909) | | | NM | | NA |
| Total segment net sales | Total segment net sales | 3,290,539 | | | 100.0 | % | | 2,294,537 | | | 100.0 | % | | 996,002 | | | 43.4 | % | | 51.6% | Total segment net sales | 3,147,054 | | | 100.0 | | 100.0 | % | | 3,402,469 | | | 100.0 | | 100.0 | % | | (255,415) | | | (7.5) | | (7.5) | % | | (9.0)% |
| Elimination of intersegment net sales | Elimination of intersegment net sales | (93,956) | | | (59,818) | | | (34,138) | | | 57.1 | % | |
| Consolidated net sales | Consolidated net sales | $ | 3,196,583 | | | $ | 2,234,719 | | | | $ | 961,864 | | | 43.0 | % | |
| Consolidated net sales | |
| Consolidated net sales | |
The improvement inDuring 2023, net sales including increasesdecreased in the U.S. Retail segment, primarily due to the decrease in comparable sales and total consolidated netof $260.3 million, with the additional week of sales during 2021 over 20202023 offset by the impact of net store closures since the end of 2022. The decrease in comparable sales for the U.S. Retail segment was largely driven by a resultdecrease in comparable transactions of approximately 5%, driven by lower traffic, and a decrease in the comparable average sales amounts per transaction of approximately 5% as we were more promotional than we were during the same period last year. Net sales decreased in the Canada Retail segment due to the decrease in comparable sales of $16.6 million, with the majority of the temporary closure of stores in 2020 during our peak spring selling season in responseremaining decrease due to the COVID-19 pandemic and significantly reduced customer in-store traffic since re-opening. During 2021,unfavorable impact from foreign currency translation partially offset by the additional week of sales significantly recovered from 2020 levels, although we have continued to experience reduced customer in-store traffic and consolidated netin 2023. The decrease in comparable sales remain lower when compared to pre-COVID-19 periods. During a portion of 2021,for the Canada Retail segment was impacted primarily by further temporary closures and restrictions in certain key markets. In addition, netlower comparable average sales were impacted by permanent store closures, including those serviced inamount per transaction. Net sales for the Other segment. The Brand Portfolio segment increased due to the net sales were higher in 2021 than 2020 due to increased ordersadded from the acquired Topo and Keds businesses partially offset by lower wholesale sales as our retailer customers also recover, but net sales were still below pre-COVID-19 levels.pulled back on orders.
GROSS PROFIT
The following table summarizes gross profit by segment:
| | | | | | | | | | | | | | | | | | | | | | | | | | | | | | | | | | | | | | | | | |
| (dollars in thousands) | 2021 | | 2020 | | Change |
| Amount | | % of Segment Net Sales | | Amount | | % of Segment Net Sales | | Amount | | % | | Basis Points |
| Segment gross profit: | | | | | | | | | | | | | |
| U.S. Retail | $ | 933,555 | | | 33.7 | % | | $ | 242,786 | | | 13.5 | % | | $ | 690,769 | | | 284.5 | % | | 2,020 | |
| Canada Retail | 76,728 | | | 32.7 | % | | 28,651 | | | 15.7 | % | | 48,077 | | | 167.8 | % | | 1,700 | |
| Brand Portfolio | 66,774 | | | 23.3 | % | | 36,393 | | | 14.6 | % | | 30,381 | | | 83.5 | % | | 870 | |
| Other | — | | | — | % | | 962 | | | 1.5 | % | | (962) | | | NM | | NM |
| Total segment gross profit | 1,077,057 | | | 32.7 | % | | 308,792 | | | 13.5 | % | | 768,265 | | | 248.8 | % | | 1,920 | |
| Elimination of intersegment gross loss (profit) | (8,420) | | | | | 2,449 | | | | | (10,869) | | | | | |
| Consolidated gross profit | $ | 1,068,637 | | | 33.4 | % | | $ | 311,241 | | | 13.9 | % | | $ | 757,396 | | | 243.3 | % | | 1,950 | |
NM - Not meaningful | | | | | | | | | | | | | | | | | | | | | | | | | | | | | | | | | | | | | | | | | |
| (dollars in thousands) | 2023 | | 2022 | | Change |
| Amount | | % of Segment Net Sales | | Amount | | % of Segment Net Sales | | Amount | | % | | Basis Points |
| Segment gross profit: | | | | | | | | | | | | | |
| U.S. Retail | $ | 794,266 | | | 31.3 | % | | $ | 904,583 | | | 32.4 | % | | $ | (110,317) | | | (12.2) | % | | (110) | |
| Canada Retail | 84,794 | | | 32.1 | % | | 99,121 | | | 35.0 | % | | (14,327) | | | (14.5) | % | | (290) | |
| Brand Portfolio | 92,545 | | | 26.5 | % | | 72,006 | | | 22.0 | % | | 20,539 | | | 28.5 | % | | 450 | |
| Total segment gross profit | 971,605 | | | 30.9 | % | | 1,075,710 | | | 31.6 | % | | (104,105) | | | (9.7) | % | | (70) | |
| Net recognition of intersegment gross profit | 3,281 | | | | | 3,515 | | | | | (234) | | | | | |
| Consolidated gross profit | $ | 974,886 | | | 31.7 | % | | $ | 1,079,225 | | | 32.6 | % | | $ | (104,339) | | | (9.7) | % | | (90) | |
The improvementdecrease in consolidated gross profit was primarilyprimarily driven by increasedthe decrease in consolidated net sales during 2021 as compared to 2020. We addressedover the temporary closure of stores in 2020,same period last year, partially offset by lower freight and the subsequent reduction in customer in-store traffic upon store re-openings, with aggressive promotional activity. These actions resulted in higher inventory reserves, increased shipping costs associated with higherand lower distribution costs in the U.S. Retail segment as we realized the benefit of moving our digital penetration, and deleveraged distribution and fulfillment store occupancy, and royalty expenses on lower sales volume during 2020. During 2021, tight inventory positions resulted in fewer promotions. Accordingly, grossactivities from our Ohio location to our New Jersey location. Gross profit as a percentage of net sales for 2021 was higher by 480decreased 110 basis points thanfor the pre-COVID-19 rate, which was 28.6% for 2019. The Brand Portfolio segment's grossU.S. Retail segment when compared to the same period last year, primarily due to the deleveraging effect of lower sales on fixed occupancy costs as well as being more promotional, partially offset by lower logistics costs including freight, shipping, and distribution. Gross profit as a percentage of net sales significantly improved during 2021 compared to 2020 but remained below pre-COVID-19 levelsdecreased 290 basis points for the Canada Retail segment when compared to 2019the same period last year, primarily due to a mix shift in sales towards lower margin products and the deleveraging effect of lower sales on fixed occupancy costs. Gross profit as a percentage of net sales increased 450 basis points for the Brand Portfolio segment when compared to the same period last year, primarily due to the deleverage impactschange in mix of products sold, improved inventory positions, lower net sales.freight costs, and the leverage of higher sales on royalty expense since the acquired businesses do not have any royalty obligations.
EliminationThe net recognition of intersegment gross loss (profit)profit consisted of the following:
| | (dollars in thousands) | 2021 | | 2020 |
| | Elimination of intersegment activity: | |
| (in thousands) | | (in thousands) | 2023 | | 2022 |
| Intersegment recognition and elimination activity: | |
| Net sales recognized by Brand Portfolio segment | |
| Net sales recognized by Brand Portfolio segment | |
| Net sales recognized by Brand Portfolio segment | Net sales recognized by Brand Portfolio segment | $ | (93,956) | | | $ | (59,818) | |
| Cost of sales: | Cost of sales: | |
| Cost of sales recognized by Brand Portfolio segment | Cost of sales recognized by Brand Portfolio segment | 62,039 | | | 42,028 | |
| Cost of sales recognized by Brand Portfolio segment | |
| Cost of sales recognized by Brand Portfolio segment | |
| Recognition of intersegment gross profit for inventory previously purchased that was subsequently sold to external customers during the current period | Recognition of intersegment gross profit for inventory previously purchased that was subsequently sold to external customers during the current period | 23,497 | | | 20,239 | |
| $ | (8,420) | | | $ | 2,449 | |
| $ | |
OPERATING EXPENSES
Operating expenses increased by $117.4$10.7 million during 2021 as compared to 2020,2023 over last year, primarily driven by the implementation of temporary leaves of absence without pay for a significant number of our employees and reducing pay for nearly all employees not placed on temporary leave in response to the COVID-19 pandemic for most of the first half of 2020. During the second half of 2020, we re-opened our stores, discontinued the furlough program, and restored pay for our associates that had taken pay reductions, but made reductions to our workforce. During 2021, we had an increase in store payroll costsmarketing expenses as we invested more in brand awareness, the additional operating expenses from the acquired Topo and Keds businesses, and the additional week during 2023, partially offset by a decrease in incentive compensation in line with the increase inlower net sales and higher incentive compensation expense.sales. Operating expenses, as a percentage of net sales, improved to 27.2% in 2021 compared to 33.7% in 2020, but was still higher thanincreased 240 basis points over the pre-COVID-19 rate, which was 25.1% as a percentage of sales in 2019, primarilysame period last year due to higher direct marketing expense and incentive compensation onthe lower sales.net sales as we deleveraged our increased costs.
IMPAIRMENT CHARGES
During 2021, 2023, we recorded impairment charges of $1.7$4.8 million, for abandoned equipment we are replacing and for the sublease of an abandoned leased space. As a result of the material reduction in net sales and cash flows due to the temporary closure of all of our stores during 2020, we performed an impairment analysis at the store level. In addition, we evaluated other long-lived assets based on our intent to use such assets going forward. During 2020, we recorded impairment charges of $127.1 million for under-performing stores. Also during 2020, we recorded an impairment charge of $6.5 million for the Brand Portfolio segment customer relationship intangible asset resulting in a full impairment due to the lack of projected cash flows over the remaining useful life. Further, as a result of the material reduction in net sales and cash flows and the decrease in the Company's market capitalization due to the impact of the COVID-19 pandemic on macroeconomic conditions, we performed an impairment analysis for goodwill and other indefinite-lived intangible assets. Our analysis concluded that the fair value of the First Cost reporting unit within the Brand Portfolio segment did not exceed its carrying value. Accordingly, during 2020, we recorded an impairment charge of $20.0 million for the First Cost reporting unitprimarily in the Brand Portfolio segment resulting from an abandoned leased space. During 2022, we recorded impairment charges of $4.3 million, primarily in the Brand Portfolio segment, resulting from subleases of abandoned leased spaces.
INTEREST EXPENSE, NET
For 2023, interest expense, net, increased by $17.3 million over last year, primarily driven by overall higher interest rates on our debt, with higher rates on the ABL Revolver over last year and the addition of the Term Loan, and a full impairment.higher average debt balance during 2023.
LOSS ON EXTINGUISHMENT OF DEBT AND WRITE-OFF OF DEBT ISSUANCE COSTS
In connection with the settlement of our previous senior secured term loan agreement ("Previous Term Loan") on February 8, 2022, we incurred a $12.7 million loss on extinguishment of debt, composed of a $6.9 million prepayment premium and a $5.7 million write-off of unamortized debt issuance costs. As a result of the replacement of the ABL Revolver during 2022, we also wrote off $0.2 million of debt issuance costs.
INCOME TAXES
The effective tax rate changedwas a positive 27.3% for 2023, as compared to 10.7%a negative 2.0% for 2021 from 19.7% for 2020.2022. The effective tax rate for 2021 is2023 differed from the result of maintaining a full valuation allowance on deferredstatutory rate primarily due to non-deductible compensation offset by other permanent adjustments. The effective tax assets while also recording net discrete tax benefits, primarilyrate for 2022 differed from the statutory rate as a result of adjustments to our estimated 2020 return reflecting implemented tax strategies. The rate for 2020 isreleasing $55.7 million of the result of recording an additional valuation allowance of $87.6 million partially offset by the ability to carry back current year losses to apermanent tax year where the U.S. federal statutory tax rate was 35%.adjustments, primarily non-deductible compensation.
LIQUIDITY AND CAPITAL RESOURCES
OVERVIEW
Our primary ongoing operating cash flow requirements are for inventory purchases, payments on lease obligations and licensing royalty commitments, other working capital needs, capital expenditures, and capital expenditures.debt service. Our working capital and inventory levels fluctuate seasonally.
During 2023, the following significant transactions impacted our liquidity:
•On February 4, 2023, we completed the acquisition of Keds for $127.3 million in cash consideration, funded with available cash and borrowings on the ABL Revolver.
•On February 28, 2023, the ABL Revolver was amended to increase the available capacity under the revolving line of credit from $550.0 million to $600.0 million and to add a first-in last-out term loan ("FILO Term Loan") of up to $30.0 million, which was drawn in full, subject to a borrowing base.
•On June 23, 2023, we entered into a Term Loan and borrowed $135.0 million during 2023.
•We repurchased an aggregate of 9.7 million Class A common shares, including open market purchases and purchases under a modified "Dutch Auction" tender offer, at an aggregate cost of $102.2 million, including transaction costs and excise tax. As of February 3, 2024, $87.7 million of Class A common shares remained available for repurchase under the share repurchase program.
The following table summarizes our material undiscounted cash requirements for 20222024 and future fiscal years thereafter, and provides reference for each item to the relevant note of the Consolidated Financial Statementsconsolidated financial statements of this Form 10-K:
| | (in thousands) | (in thousands) | Note Reference | | 2022 | | Future Fiscal Years Thereafter | | Total | (in thousands) | Note Reference | | 2024 | | Future Fiscal Years Thereafter | | Total |
| Debt maturities | Debt maturities | Note 11 | | $ | — | | | 231,250 | | | $ | 231,250 | |
| Fixed minimum lease payments | Fixed minimum lease payments | Note 12 | | $ | 229,051 | | | 654,618 | | | $ | 883,669 | |
| Noncancelable purchase obligations | Noncancelable purchase obligations | Note 13 | | $ | 9,101 | | | 12,285 | | | $ | 21,386 | |
| Guaranteed minimum royalty payments | Guaranteed minimum royalty payments | Note 13 | | $ | 34,659 | | | 222,029 | | | $ | 256,688 | |
On February 8, 2022,In addition to the above, we settledhave an exclusive call option and the noncontrolling interest holders have a put option with respect to our purchase of the remaining 20.6% ownership interest in fullTopo upon the $231.3 million principal amount outstanding under our senior secured term loan ("Term Loan"). In connection with this settlement, we incurredoccurrence of certain events or after a $12.7 million loss on extinguishmentperiod of debt, comprisedthree years following the close of a $6.9 million prepayment premium and a $5.7 million write-off of unamortized debt issuance costs,the transaction, which will be recordedwas December 13, 2022. The redemption price is defined in the first quarteroperating agreement and is based primarily on a fixed multiple of 2022. The settlementTopo's trailing 12 months of the Term Loan was made using proceeds from borrowings under the ABL Revolver.adjusted earnings before interest, taxes, depreciation, amortization, and other agreed upon adjustments.
We are committed to a cash management strategy that maintains liquidity to adequately support the operation of the business, pursue our growth strategy, and withstand unanticipated business volatility, including the impacts of the COVID-19 pandemic.global economic conditions on our results of operations. We believe that cash generated from our operations, together with our current levels of cash, andas well as the availability under our ABL Revolver and Term Loan, are sufficient to maintain our ongoing operations, support seasonal working capital requirements, fund acquisitions and fund capital expenditures, repurchase common shares under our share repurchase program, and meet our debt service obligations over the next 12 months and beyond.
The following table presents the key categories of our consolidated statements of cash flows:
| | (in thousands) | (in thousands) | 2021 | | 2020 | | Change | (in thousands) | 2023 | | 2022 | | Change |
| Net cash provided by (used in) operating activities | $ | 171,429 | | | $ | (153,793) | | | $ | 325,222 | |
| Net cash provided by (used in) investing activities | (35,028) | | | 2,631 | | | (37,659) | |
| Net cash provided by operating activities | |
| Net cash used in investing activities | |
| Net cash provided by (used in) financing activities | Net cash provided by (used in) financing activities | (121,490) | | | 122,954 | | | (244,444) | |
| Effect of exchange rate changes on cash balances | Effect of exchange rate changes on cash balances | (33) | | | 1,225 | | | (1,258) | |
| Net increase (decrease) in cash, cash equivalents, and restricted cash | $ | 14,878 | | | $ | (26,983) | | | $ | 41,861 | |
| Net decrease in cash, cash equivalents, and restricted cash | |
OPERATING CASH FLOWS
The changedecrease in net cash provided by (used in) operations was largely driven by the receipt of $120.3 million of our income tax receivable from the Internal Revenue Service during 2022 and the decrease in net income recognized during 2021 versus a net loss incurred during 2020 as a result of the impacts of the COVID-19 pandemic,in 2023 over last year, after adjusting for non-cash activity including impairment chargesdepreciation and amortization and the change in deferred taxes. This wasloss on extinguishment of debt and write-off of debt issuance costs. These were partially offset by higherlower spend on working capital due to the decreased investment in inventory with the slowdown in net sales, as our business recovered fromdiscussed above in the impactsresults of the COVID-19 pandemicoperations, and the measures we implemented in 2020 to manage our working capital to preserve liquidity, including delaying vendor and landlordtiming of payments while we renegotiated terms, reducing inventory orders, and significantly cutting costs.on current liabilities.
INVESTING CASH FLOWS
For 2021,2023, net cash used in investing activities was primarily due to the acquisition of Keds for $127.3 million and capital expenditures of $55.0 million relating to infrastructure and IT projects, new stores, and store improvements. For 2022, the net cash used in investing activities was primarily due to capital expenditures of $55.0 million relating to infrastructure and IT projects, new stores, store improvements, the acquisition of Topo for $19.1 million, and store improvements. For 2020, the net cash provided by investing activities was due to the liquidation of our available-for-sale securities and the proceeds from a settlement with a vendor, partially offset by capital expenditures.investment in Le Tigre for $8.2 million.
FINANCING CASH FLOWS
During 2021,For 2023, the net cash provided by financing activities was due to proceeds from the issuance of the Term Loan of $135.0 million and the net receipts of $20.0 million from our ABL Revolver, partially offset by the repurchase of 9.7 million Class A common shares at an aggregate cost of $102.2 million, including transaction costs and excise tax, payments of $17.5 million for taxes for stock-based compensation shares withheld, payments of dividends of $12.2 million, and payments of debt issuance costs of $10.7 million. For 2022, the net cash used in financing activities was due to net paymentsthe payment of $100.0$238.2 million on the ABL Revolver and payments of $12.5 million on the Term Loan. During 2020, the net cash provided by financing activities was due to net proceeds from borrowings from our ABL Revolver and Term Loan of $343.7 million offset byfor the settlement of borrowings under our senior unsecured revolving credit agreement (the "Credit Facility")the Previous Term Loan, the repurchase of $190.010.7 million Class A common shares at an aggregate cost of $147.5 million, and the payment of debt issuance costsdividends of $21.4$13.5 million, associated withpartially offset by the changes we made tonet receipts of $281.0 million from our debt structure.revolving lines of credit.
DEBT
ABL Revolver- On August 7, 2020,March 30, 2022, we replaced the Credit Facilityour previous senior secured asset-based revolving credit facility with theour current ABL Revolver, which was subsequently amended on February 28, 2023 and June 23, 2023. The amended ABL Revolver provides a revolving line of credit of up to $400.0 million. Our$600.0 million, including a Canadian sub-limit of up to $60.0 million, a $75.0 million sub-limit for the issuance of letters of credit, a $60.0 million sub-limit for swing-loan advances for U.S. borrowings, and a $6.0 million sub-limit for swing-loan advances for Canadian borrowings. In addition, the ABL Revolver includes a FILO Term Loan of up to $30.0 million, which was drawn in full on February 28, 2023. The FILO Term Loan may be repaid in full, but not in part, so long as certain payment conditions are satisfied. Once repaid, no portion of the FILO Term Loan may be reborrowed. The ABL Revolver, which matures in August 20252027, may be used to provide funds for working capital, capital expenditures, share repurchases, other expenditures, and is securedpermitted acquisitions as defined by substantially all of our personal property assets, including a first priority lien onthe credit card receivables and inventory.facility agreement. The amount of credit available is limited to a borrowing base basedformulated on, among other things, a percentage of the book value of eligible inventory and credit card receivables, as reduced by certain reserves. As of January 29, 2022,February 3, 2024, the ABL Revolverrevolving line of credit (excluding the FILO Term Loan) had a borrowing base of $400.0$437.0 million, with no$271.1 million in outstanding borrowings and $4.9and $5.0 million in letters of credit issued, resulting in $395.1$160.9 million availableavailable for borrowings.
Term Loan- Loan- On August 7, 2020, June 23, 2023, we also entered into a $250.0 millionthe Term Loan.Loan and have since borrowed the maximum aggregate amount of $135.0 million. The Term Loan was collateralized by a first priority lien on substantially allmatures at the earliest of our personal and real property (subject to certain exceptions), including investment property and intellectual property, and by a second priority lien on certain other personal property, primarily credit card receivables, and inventory, that constitute first priority collateral forthe date the ABL Revolver.
Termination of Term Loan- As discussed above, on February 8, 2022, we voluntarily terminated our Term Loan and settled in full the $231.3 million principal amount then outstanding. In connection with this settlement, we incurred a $12.7 million loss on extinguishment of debt, comprised of a $6.9 million prepayment premium and a $5.7 million write-off of unamortized debt issuance costs, which will be recorded in the first quarter of 2022. The settlementRevolver matures (currently March 2027) or five years from closing of the Term Loan was made using proceeds from borrowings under the ABL Revolver. As of January 29, 2022, the total borrowings under the Term Loan were classified as long-term debt since we had the ability and intent to refinance the Term Loan using borrowings from our ABL Revolver, which we classify as long-term debt. Following the termination of the Term Loan, we had $235.0 million of outstanding borrowings, resulting in $160.1 million remaining available for borrowings, under the ABL Revolver.(June 2028).
Debt Covenants- The ABL Revolver containsrequires us to maintain a minimum availabilityfixed charge coverage ratio covenant where an event of default shall occur ifnot less than 1:1 when availability is less than the greater of $30.0$47.3 million or 10.0% of the maximum creditborrowing amount. In addition,At any time that liquidity is less than $100.0 million, the Term Loan requires a maximum consolidated net leverage ratio as of the last day of each fiscal month, calculated on a trailing twelve-month basis, of (1) 2.25 to 1.00 for any trailing twelve-month period through February 3, 2024, and (2) 2.50 to 1.00 thereafter. Testing of the consolidated net leverage ratio ends after liquidity has been greater than or equal to $100.0 million for a period of 45 consecutive days. The ABL Revolver containsand the Term Loan also contain customary covenants restricting ourcertain activities, including limitations on theour ability to sell assets, engage in acquisitions, enter into transactions involving related parties, incur additional debt, grant liens on assets, pay dividends or repurchase stock, and make certain other changes. There are specific exceptions to these covenants including, in some cases, upon satisfying specified payment conditions.conditions based on availability. As of January 29, 2022,February 3, 2024, we were in compliance with all financial covenants.covenants contained in the ABL Revolver and the Term Loan.
Termination of Previous Term Loan- On February 8, 2022, we settled in full the $231.3 million principal amount outstanding on that date under our Previous Term Loan. In connection with this settlement, during 2022 we incurred a $12.7 million loss on extinguishment of debt, composed of a $6.9 million prepayment premium and a $5.7 million write-off of unamortized debt issuance costs.
Refer to Note 11,12, Debt, of the Consolidated Financial Statementsconsolidated financial statements of this Form 10-K for further information about our debt arrangements.
CAPITAL EXPENDITURE PLANS FOR CAPITALIZED COSTS
WeDuring 2024, we expect to spend approximately $70.0$65.0 million to $80.0$75.0 million that will be capitalized for capital expenditures in 2022. Ourproperty and equipment and implementation costs for cloud computing arrangements accounted for as service contracts. Our future investments will depend primarily on the number of stores we open and remodel, infrastructure and IT projects that we undertake, and the timing of these expenditures.
RECENTLY ISSUED ACCOUNTING PRONOUNCEMENTS
There are no recentThe information related to recently issued accounting pronouncements that are expected to have a material impact to ouras set forth in Note 1, Description of Business and Significant Accounting Policies - Recently Issued Accounting Pronouncements, of the consolidated financial statements when adopted.included in this Form 10-K is incorporated herein by reference.
CRITICAL ACCOUNTING POLICIES AND ESTIMATES
As discussed in Note 1, Description of Business and Significant Accounting Policies, of the Consolidated Financial Statementsconsolidated financial statements included in this Form 10-K, the preparation of our consolidated financial statements in conformity with accounting principles generally accepted in the U.S. requires management to make estimates and assumptions that affect the reported amounts of assets, liabilities, and disclosure of commitments and contingencies at the date of the consolidated financial statements and reported amounts of revenue and expenses during the reporting period. We base these estimates and judgments on factors we believe to be relevant, the results of which form the basis for making judgments about the carrying values of assets and liabilities that are not readily apparent from other sources. The process of determining significant estimates is fact-specific and takes into account factors such as historical experience, current and expected economic conditions, product mix, and, in some cases, actuarial and valuation techniques. We constantly re-evaluatereevaluate these significant factors and make adjustments where facts and circumstances dictate. While we believe that the factors considered provide a meaningful basis for the accounting policies applied in the preparation of the consolidated financial statements, we cannot guarantee that our estimates and assumptions will be accurate. As the determination of these estimates requires the exercise of judgment, actual results may differ from those estimates, and such differences may be material to our consolidated financial statements.
We believe the following represent the most significant accounting policies, critical estimates and assumptions, among others, used in the preparation of our consolidated financial statements:
| | | | | | | | |
| Policy | Judgments and Estimates | Effect if Actual Results
Differ from Assumptions |
Inventories- The U.S. Retail segment inventory is accounted for using the retail inventory method, andwhich is stated at the lower of cost or market. Under the retail inventory method, the valuation of inventories at cost and the resulting gross profits are determined by applying a calculated cost-to-retail ratio to the retail value of inventories. The cost basis of inventories reflected on the balance sheet is decreased by charges to cost of sales at the time that the retail value of the inventory is lowered by markdowns. The Canada Retail and Brand Portfolio segments account for inventory using the moving average cost method and is stated at the lower of cost or net realizable value. For all inventories, we also monitor excess and obsolete inventories that may need to be liquidated at amounts below cost. We perform physical inventory counts or cycle counts on all inventory on hand throughout the year and adjust the recorded balance to reflect the results. We record estimated shrink between physical inventory counts, based on historical experience and recent results, less amounts realized. | Inherent in the calculation of inventories are certain significant judgments and estimates, including setting the original merchandise retail value, markdowns, shrink, and liquidation values. The shrink reserve is calculated as a percentage of net sales from the last physical inventory date, based on both historical experience and recent physical inventory results, less amounts realized. Aged inventory may be written down using estimated liquidation values and cost of disposal based on historical experience. | If the reduction to inventories for markdowns, shrink, and aged inventories were to increase by 10%, cost of sales would increase by approximately $3.9$4.1 million. |
| | | | | | | | |
| Policy | Judgments and Estimates | Effect if Actual Results
Differ from Assumptions |
Asset Impairment of Long-Lived Assets- We periodically evaluate the carrying amount of our long-lived assets, primarily property and equipment and operating lease assets, when events and circumstances warrant such a review to ascertain if any assets have been impaired. The carrying amount of a long-lived asset or asset group is considered impaired when the carrying value of the asset or asset group exceeds the expected future cash flows from the asset or asset group. The impairment loss recognized is the excess of the carrying value of the asset or asset group over its fair value. | Our reviews are conducted at the lowest identifiable level, which typically is at the store level for the majority of our long-lived assets. Fair value at the store level is typically based on projected discounted cash flows over the remaining lease term. We also review construction in progressconstruction-in-progress projects, including internal-use software under development, for recoverability when we have a strategic shift in our plans. | A 10% change in our projected cash flows for our store fleet would not result in a material amount of additional impairment charges. To the extent that these future projections or our strategies change, the conclusion regarding impairment may differ from our current estimates. |
| | | | | | | | |
Policy | Judgments and Estimates | Effect if Actual Results
Differ from Assumptions |
Impairment of Goodwill and Other Indefinite Lived Intangible Assets- We evaluate goodwill and other indefinite livedindefinite-lived intangible assets for impairment annually during our fourth quarter, or more frequently if an event occurs or circumstances change, such as material deterioration in performance or a significant and sustained decline in our stock price, that would indicate that impairment may exist. When evaluating for impairment, we may first perform a qualitative assessment to determine whether it is more likely than not that there is an impairment. If we do not perform a qualitative assessment, or if we determine that it is more likely than not that the carrying value exceeds its fair value, we will calculate the estimated fair value. Fair value is the price a willing buyer would pay and is typically calculated using a discounted cash flow analysis. Where deemed appropriate, we may also utilize a market approach for estimating fair value. Impairment charges are calculated as the amount by which the carrying amount exceeds its fair value, but not to exceed the carrying value for goodwill.value. | When assessing goodwill and other indefinite lived intangible assets for impairment, our decision to perform a qualitative impairment assessment is influenced by a number of factors, including the significance of the excess of the estimated fair value over carrying value at the last assessment date and the amount of time since the last quantitative fair value assessments. Our quantitative impairment calculations contain uncertainties, as we are required to make assumptions and to apply judgment when estimating future cash flows, including projected revenue and operating results, as well as selecting appropriate discount rates and an assumed royalty rate. Estimates of revenue and operating results are based on internal projections considering past performance and forecasted changes, strategic initiatives, and the business environment impacting performance. Discount rates and a royalty rate are selected based on market participant assumptions. These estimates are highly subjective, and our ability to realize the future cash flows used in our fair value calculations is affected by factors such as the success of strategic initiatives, changes in economic conditions, changes in our operating performance and changes in our business strategies. | As of January 29, 2022,February 3, 2024, we had goodwill of $93.7 million, of goodwill within$25.8 million, and $4.3 million for the U.S. Retail, segment, which is alsoKeds, and Topo reporting units, respectively. As of the reporting unit, and $15.5 million in indefinite-lived trademarks and tradenames within the Canada Retail segment. We performed a qualitative impairment assessment for goodwill. In addition,fourth quarter measurement date, we determined the fair valuesvalue of the indefinite-lived intangiblesU.S. Retail and Topo reporting units were in excess of their carrying valuesvalue and a 10% decrease in fair valuesvalue would not result in a materialan impairment charge. The goodwill for the Keds reporting unit was a result of the acquisition of Keds in 2023 with the final allocation of the total considerations completed in the fourth quarter of 2023, and its fair value was in excess of its carrying value by approximately 9% as of the fourth quarter measurement date.
As of February 3, 2024, we had indefinite-lived tradenames of $46.9 million and $14.8 million within the Brand Portfolio segment and Canada Retail segment, respectively. The indefinite-lived tradename within the Brand Portfolio segment was a result of the acquisition of Keds with the final allocation of the total considerations completed in the fourth quarter of 2023, and its fair value was in excess of its carrying value by approximately 10% as of the fourth quarter measurement period. We determined that the fair value of the indefinite-lived tradename within the Canada Retail segment was in excess of the carrying value and a 10% decrease in fair value would not result in an impairment charge.
As we periodically reassess estimated future cash flows and asset fair values, changes in our estimates and assumptions may cause us to realize material impairment charges in the future. |
Leases- We recognize lease liabilities based on the present value of the future fixed lease commitments over the lease term with corresponding lease assets. The majority of our real estate leases provide for renewal options, which are typically not included in the lease term used for measuring the lease assets and lease liabilities as it is not reasonably certain we will exercise options.
| We determine the discount rate for each lease by estimating the rate that we would be required to pay on a secured borrowing for an amount equal to the lease payments over the lease term. | As of January 29, 2022, a change in our discount rate of 100 basis points would have changed the recorded operating lease assets and liabilities by approximately $19.7 million. |
| | | | | | | | |
| Policy | Judgments and Estimates | Effect if Actual Results
Differ from Assumptions |
Income Taxes- We determine the aggregate amount of income tax provision or benefit to accrue and the amount that will be currently receivable or payable based upon tax statutes of each jurisdiction in which we do business. Deferred tax assets and liabilities, as a result of these timing differences, are reflected on our balance sheet for temporary differences that are expected to reverse in subsequent years. A valuation allowance is established against deferred tax assets when it is more likely than not that some or all of the deferred tax assets will not be realized. We review and update our tax positions as necessary to add any new uncertain tax positions taken, or to remove previously identified uncertain positions that have been adequately resolved. Additionally, uncertain positions may be remeasured as warranted by changes in facts or law. | Our ability to recover deferred tax assets depends on several factors, including the amount of net operating losses we can carry back and our ability to project future taxable income. In evaluating future taxable income, significant weight is given to positive and negative evidence that is objectively verifiable. In addition, tax laws, regulations, and policies in various jurisdictions may be subject to significant change due to economic, political and other conditions, and significant judgment is required in estimating amounts for income taxes. There may be transactions that occur during the ordinary course of business for which the ultimate tax determination is uncertain. The U.S. Treasury Department, the U.S. Internal Revenue Service, and other standard-setting bodies could interpret or issue guidance on how provisions of tax laws, regulations, and policies will be applied or otherwise administered that is different from our interpretation. In addition, state, local or foreign jurisdictions may enact tax laws that could result in further changes to taxation and materially affect our financial position and results of operations. | As of January 29, 2022,February 3, 2024, our deferred tax assets were reserved with a valuation allowance of $70.8$12.1 million. We also had gross unrecognized tax benefits of $11.1$16.4 million. However, we may have material adjustments in the future that may impact our income tax amounts based on additional information, additional guidance or revised interpretations. |
| | | | | | | | | | | | | | |
| ITEM 7A. QUANTITATIVE AND QUALITATIVE DISCLOSURES ABOUT MARKET RISK |
We have market risk exposure related to interest rates and foreign currency exchange rates. Market risk is measured as the potential negative impact on earnings, cash flows, or fair values resulting from a hypothetical change in interest rates or foreign currency exchange rates over the next year. We currently do not utilize hedging instruments to mitigate these market risks.
INTEREST RATE RISK
As of January 29, 2022,February 3, 2024, we had $231.3$301.1 million and $133.1 million outstanding on our ABL Revolver and Term Loan, which was settled in full on February 8, 2022, using proceeds from borrowingsrespectively. Borrowings and letters of credit issued under the ABL Revolver. Borrowings under both theRevolver and Term Loan and the ABL Revolver areaccrue interest based on variable rates of interest, which expose us to interest rate market risks, particularly during a period of rising interest rates. The impact of a hypothetical 100 basis point increase in interest rates on our outstanding borrowings would not result in a material amountapproximately $4.0 million of additional expense over a 12-month period based on the balance as of January 29, 2022.February 3, 2024.
FOREIGN CURRENCY EXCHANGE RISK
We are exposed to the impact of foreign exchange rate risk primarily through U.S. dollar denominated debt held by our operations in Canada,Canadian legal entity where the functional currency is the Canadian dollar, as well as foreign denominated cash accounts.dollar. A hypothetical 10% movement in the exchange rates couldrate would result in a $2.2 million foreign currency translation fluctuation, which would be recorded in accumulated other comprehensive loss within the consolidated balance sheets, and $3.3 millionan immaterial impact of foreign currency revaluation which would be recorded into non-operating income (expenses),expenses, net, within the consolidated statements of operations.
| | | | | | | | | | | | | | |
| ITEM 8. FINANCIAL STATEMENTS AND SUPPLEMENTARY DATA |
REPORT OF INDEPENDENT REGISTERED PUBLIC ACCOUNTING FIRM
To the shareholders and the Board of Directors of Designer Brands Inc.
Opinions on the Financial Statements and Internal Control over Financial Reporting
We have audited the accompanying consolidated balance sheets of Designer Brands Inc. and subsidiaries (the "Company") as of January 29, 2022February 3, 2024 and January 30, 2021,28, 2023, the related consolidated statements of operations, comprehensive income, (loss), shareholders' equity, and cash flows, for each of the three years in the period ended January 29, 2022,February 3, 2024, and the related notes (collectively referred to as the "financial statements"). We also have audited the Company’sCompany's internal control over financial reporting as of January 29, 2022,February 3, 2024, based on criteria established in Internal Control -— Integrated Framework (2013) issued by the Committee of Sponsoring Organizations of the Treadway Commission (COSO).
In our opinion, the financial statements referred to above present fairly, in all material respects, the financial position of the Company as of January 29, 2022February 3, 2024 and January 30, 2021,28, 2023, and the results of its operations and its cash flows for each of the three years in the period ended January 29, 2022,February 3, 2024, in conformity with accounting principles generally accepted in the United States of America. Also, in our opinion, the Company maintained, in all material respects, effective internal control over financial reporting as of January 29, 2022,February 3, 2024, based on criteria established in Internal Control -— Integrated Framework (2013) issued by COSO.
Basis for Opinions
The Company’sCompany's management is responsible for these financial statements, for maintaining effective internal control over financial reporting, and for its assessment of the effectiveness of internal control over financial reporting, included in the accompanying Management’sManagement's Report on Internal Control over Financial Reporting. Our responsibility is to express an opinion on these financial statements and an opinion on the Company’sCompany's internal control over financial reporting based on our audits. We are a public accounting firm registered with the Public Company Accounting Oversight Board (United States) (PCAOB) and are required to be independent with respect to the Company in accordance with the U.S. federal securities laws and the applicable rules and regulations of the Securities and Exchange Commission and the PCAOB.
We conducted our audits in accordance with the standards of the PCAOB. Those standards require that we plan and perform the audits to obtain reasonable assurance about whether the financial statements are free of material misstatement, whether due to error or fraud, and whether effective internal control over financial reporting was maintained in all material respects.
Our audits of the financial statements included performing procedures to assess the risks of material misstatement of the financial statements, whether due to error or fraud, and performing procedures to respond to those risks. Such procedures included examining, on a test basis, evidence regarding the amounts and disclosures in the financial statements. Our audits also included evaluating the accounting principles used and significant estimates made by management, as well as evaluating the overall presentation of the financial statements. Our audit of internal control over financial reporting included obtaining an understanding of internal control over financial reporting, assessing the risk that a material weakness exists, and testing and evaluating the design and operating effectiveness of internal control based on the assessed risk. Our audits also included performing such other procedures as we considered necessary in the circumstances. We believe that our audits provide a reasonable basis for our opinions.
Definition and Limitations of Internal Control over Financial Reporting
A company’scompany's internal control over financial reporting is a process designed to provide reasonable assurance regarding the reliability of financial reporting and the preparation of financial statements for external purposes in accordance with generally accepted accounting principles. A company’scompany's internal control over financial reporting includes those policies and procedures that (1) pertain to the maintenance of records that, in reasonable detail, accurately and fairly reflect the transactions and dispositions of the assets of the company; (2) provide reasonable assurance that transactions are recorded as necessary to permit preparation of financial statements in accordance with generally accepted accounting principles, and that receipts and expenditures of the company are being made only in accordance with authorizations of management and directors of the company; and (3) provide reasonable assurance regarding prevention or timely detection of unauthorized acquisition, use, or disposition of the company’scompany's assets that could have a material effect on the financial statements.
Because of its inherent limitations, internal control over financial reporting may not prevent or detect misstatements. Also, projections of any evaluation of effectiveness to future periods are subject to the risk that controls may become inadequate because of changes in conditions, or that the degree of compliance with the policies or procedures may deteriorate.
Critical Audit Matter
The critical audit matter communicated below is a matter arising from the current-period audit of the financial statements that was communicated or required to be communicated to the audit committee and that (1) relates to accounts or disclosures that are material to the financial statements and (2) involved our especially challenging, subjective, or complex judgments. The communication of critical audit matters does not alter in any way our opinion on the financial statements, taken as a whole, and we are not, by communicating the critical audit matter below, providing a separate opinion on the critical audit matter or on the accounts or disclosures to which it relates.
Valuation of U.S. Retail Segment Inventories – Refer to Note 1 to the financial statements
Critical Audit Matter Description
The U.S. Retail segment, which includes stores operated in the U.S. under the DSW Designer Shoe Warehouse banner and its related e-commerce site, accounts for inventory using the retail inventory method and is stated at the lower of cost or market. Under the retail inventory method, the valuation of inventories at cost and the resulting gross profits are determined by applying a calculated cost-to-retail ratio to the retail value of inventories. The cost basis of inventories reflected on the balance sheet is decreased by charges to cost of sales at the time the retail value of the inventory is lowered by markdowns. Earnings are negatively impacted as the merchandise is marked down prior to sale.
Inherent in the valuation of inventoryinventories are certain significant judgments and estimates, including estimating inventory markdowns, which can significantly impact the ending inventory valuation and the resulting gross profit. Earnings are negatively impacted as the merchandise is marked down prior to sale.
Given the significant estimates and assumptions management utilizes to measure inventory markdowns at period end, a high degree of auditor judgment and an increased extent of effort is required when performing audit procedures to evaluate the reasonableness of estimates and assumptions. Such estimates are basedrely on the timing and completeness of recorded markdowns.
How the Critical Audit Matter Was Addressed in the Audit
Our audit procedures related to the completeness of estimated inventory markdowns included the following, among others:
•We tested the design and effectiveness of controls over the timing and completeness of estimated inventory markdowns, including management’s controls over the valuation of the estimated inventory markdown reserves, and the approvalmonitoring of lowering the retail value of inventory through markdowns.
•We evaluated management’smanagement's ability to accurately estimate inventory markdowns by comparing estimated inventory markdowns as of January 29, 2022February 3, 2024 to subsequent sales of clearance inventory.
•We observed physical inventory counts throughout the fiscal year, including merchandise designated for clearance.
•We assessed inventory aging as of February 3, 2024, and subsequent sell through as of March 2022.
•We tested the amount of estimated inventory markdowns by evaluating management’smanagement's calculation.
•We developed an independent expectation for estimated inventory markdowns based on historical inventory balances and compared our expectation to the amount recorded by management.
/s/ DELOITTE & TOUCHE LLP
Columbus, Ohio
March 21, 202225, 2024
We have served as the Company's auditor since 1997.
CONSOLIDATED STATEMENTS OF OPERATIONS
| | | | | | | | | | | | | | | | | |
| (in thousands, except per share amounts) | 2021 | | 2020 | | 2019 |
| Net sales | $ | 3,196,583 | | | $ | 2,234,719 | | | $ | 3,492,687 | |
| Cost of sales | (2,127,946) | | | (1,923,478) | | | (2,493,017) | |
| Gross profit | 1,068,637 | | | 311,241 | | | 999,670 | |
| Operating expenses | (870,682) | | | (753,278) | | | (874,749) | |
| Income from equity investment | 8,986 | | | 9,329 | | | 10,149 | |
| Impairment charges | (1,720) | | | (153,606) | | | (7,771) | |
| Operating profit (loss) | 205,221 | | | (586,314) | | | 127,299 | |
| | | | | |
| | | | | |
| Interest expense, net | (32,129) | | | (23,694) | | | (7,355) | |
| Non-operating income (expenses), net | (67) | | | 1,361 | | | (170) | |
| Income (loss) before income taxes | 173,025 | | | (608,647) | | | 119,774 | |
| Income tax benefit (provision) | (18,544) | | | 119,928 | | | (25,277) | |
| Net income (loss) | $ | 154,481 | | | $ | (488,719) | | | $ | 94,497 | |
| Basic and diluted earnings (loss) per share: | | | | | |
| Basic earnings (loss) per share | $ | 2.12 | | | $ | (6.77) | | | $ | 1.28 | |
| Diluted earnings (loss) per share | $ | 2.00 | | | $ | (6.77) | | | $ | 1.27 | |
| Weighted average shares used in per share calculations: | | | | | |
| Basic shares | 73,024 | | | 72,198 | | | 73,602 | |
| Diluted shares | 77,268 | | | 72,198 | | | 74,605 | |
| | | | | | | | | | | | | | | | | |
| (in thousands, except per share amounts) | 2023 | | 2022 | | 2021 |
| Net sales | $ | 3,074,976 | | | $ | 3,315,428 | | | $ | 3,196,583 | |
| Cost of sales | (2,100,090) | | | (2,236,203) | | | (2,127,946) | |
| Gross profit | 974,886 | | | 1,079,225 | | | 1,068,637 | |
| Operating expenses | (907,041) | | | (896,382) | | | (870,682) | |
| Income from equity investments | 9,390 | | | 8,864 | | | 8,986 | |
| Impairment charges | (4,834) | | | (4,317) | | | (1,720) | |
| Operating profit | 72,401 | | | 187,390 | | | 205,221 | |
| | | | | |
| | | | | |
| Interest expense, net | (32,171) | | | (14,874) | | | (32,129) | |
| Loss on extinguishment of debt and write-off of debt issuance costs | — | | | (12,862) | | | — | |
| Non-operating expenses, net | (33) | | | (130) | | | (67) | |
| Income before income taxes | 40,197 | | | 159,524 | | | 173,025 | |
| Income tax benefit (provision) | (10,981) | | | 3,142 | | | (18,544) | |
| Net income | 29,216 | | | 162,666 | | | 154,481 | |
| Net loss (income) attributable to redeemable noncontrolling interest | (154) | | | 10 | | | — | |
| Net income attributable to Designer Brands Inc. | $ | 29,062 | | | $ | 162,676 | | | $ | 154,481 | |
| Earnings per share attributable to Designer Brands Inc.: | | | | | |
| Basic earnings per share | $ | 0.47 | | | $ | 2.41 | | | $ | 2.12 | |
| Diluted earnings per share | $ | 0.46 | | | $ | 2.26 | | | $ | 2.00 | |
| Weighted average shares used in per share calculations: | | | | | |
| Basic shares | 61,296 | | | 67,603 | | | 73,024 | |
| Diluted shares | 63,375 | | | 72,101 | | | 77,268 | |
The accompanying notes are an integral part of the consolidated financial statements.
CONSOLIDATED STATEMENTS OF COMPREHENSIVE INCOME (LOSS)
| | | | | | | | | | | | | | | | | |
| (in thousands) | 2021 | | 2020 | | 2019 |
| Net income (loss) | $ | 154,481 | | | $ | (488,719) | | | $ | 94,497 | |
| Other comprehensive income (loss), net of income taxes: | | | | | |
| Foreign currency translation loss | (331) | | | (618) | | | (340) | |
| Unrealized net gain on debt securities | — | | | 195 | | | 609 | |
| Reclassification adjustment for net gains realized in net income (loss) | — | | | (368) | | | (58) | |
| Total other comprehensive income (loss), net of income taxes | (331) | | | (791) | | | 211 | |
| Total comprehensive income (loss) | $ | 154,150 | | | $ | (489,510) | | | $ | 94,708 | |
| | | | | | | | | | | | | | | | | |
| (in thousands) | 2023 | | 2022 | | 2021 |
| Net income | $ | 29,216 | | | $ | 162,666 | | | $ | 154,481 | |
| Other comprehensive income loss- | | | | | |
| Foreign currency translation loss | (289) | | | (1,733) | | | (331) | |
| | | | | |
| | | | | |
| | | | | |
| Comprehensive income | 28,927 | | | 160,933 | | | 154,150 | |
| Comprehensive loss (income) attributable to redeemable noncontrolling interest | (154) | | | 10 | | | — | |
| Comprehensive income attributable to Designer Brands Inc. | $ | 28,773 | | | $ | 160,943 | | | $ | 154,150 | |
The accompanying notes are an integral part of the consolidated financial statements.
CONSOLIDATED BALANCE SHEETS
| | | | | | | | | | | |
| (in thousands) | January 29, 2022 | | January 30, 2021 |
| ASSETS | | | |
| Current assets: | | | |
| Cash and cash equivalents | $ | 72,691 | | | $ | 59,581 | |
| Receivables, net | 199,826 | | | 196,049 | |
| Inventories | 586,429 | | | 473,183 | |
| Prepaid expenses and other current assets | 55,270 | | | 51,772 | |
| Total current assets | 914,216 | | | 780,585 | |
| Property and equipment, net | 256,786 | | | 296,469 | |
| Operating lease assets | 647,221 | | | 700,481 | |
| Goodwill | 93,655 | | | 93,655 | |
| Intangible assets, net | 15,527 | | | 15,635 | |
| | | |
| Equity investment | 55,578 | | | 58,598 | |
| Other assets | 31,651 | | | 31,172 | |
| Total assets | $ | 2,014,634 | | | $ | 1,976,595 | |
| LIABILITIES AND SHAREHOLDERS' EQUITY | | | |
| Current liabilities: | | | |
| Accounts payable | $ | 340,877 | | | $ | 245,071 | |
| Accrued expenses | 215,812 | | | 200,326 | |
| Current maturities of long-term debt | — | | | 62,500 | |
| Current operating lease liabilities | 202,228 | | | 244,786 | |
| Total current liabilities | 758,917 | | | 752,683 | |
| Long-term debt | 225,536 | | | 272,319 | |
| Non-current operating lease liabilities | 593,429 | | | 677,735 | |
| Other non-current liabilities | 24,356 | | | 30,841 | |
| Total liabilities | 1,602,238 | | | 1,733,578 | |
| Commitments and contingencies | 0 | | 0 |
| Shareholders' equity: | | | |
| Common shares paid in-capital, no par value | 1,005,382 | | | 990,153 | |
| Treasury shares, at cost | (515,065) | | | (515,065) | |
| Retained deficit | (74,304) | | | (228,785) | |
| Accumulated other comprehensive loss | (3,617) | | | (3,286) | |
| Total shareholders' equity | 412,396 | | | 243,017 | |
| Total liabilities and shareholders' equity | $ | 2,014,634 | | | $ | 1,976,595 | |
| | | | | | | | | | | |
| (in thousands) | February 3, 2024 | | January 28, 2023 |
| ASSETS | | | |
| Current assets: | | | |
| Cash and cash equivalents | $ | 49,173 | | | $ | 58,766 | |
| Receivables, net | 83,590 | | | 77,763 | |
| Inventories | 571,331 | | | 605,652 | |
| Prepaid expenses and other current assets | 73,338 | | | 47,750 | |
| Total current assets | 777,432 | | | 789,931 | |
| Property and equipment, net | 219,939 | | | 235,430 | |
| Operating lease assets | 721,335 | | | 700,373 | |
| Goodwill | 123,759 | | | 97,115 | |
| Intangible assets, net | 82,827 | | | 31,866 | |
| Deferred tax assets | 39,067 | | | 48,285 | |
| Equity investments | 62,857 | | | 63,820 | |
| Other assets | 49,016 | | | 42,798 | |
| Total assets | $ | 2,076,232 | | | $ | 2,009,618 | |
| LIABILITIES, REDEEMABLE NONCONTROLLING INTEREST, AND SHAREHOLDERS' EQUITY | | | |
| Current liabilities: | | | |
| Accounts payable | $ | 289,368 | | | $ | 255,364 | |
| Accrued expenses | 159,622 | | | 190,676 | |
| Current maturities of long-term debt | 6,750 | | | — | |
| Current operating lease liabilities | 166,531 | | | 190,086 | |
| Total current liabilities | 622,271 | | | 636,126 | |
| Long-term debt | 420,344 | | | 281,035 | |
| Non-current operating lease liabilities | 646,161 | | | 631,412 | |
| Other non-current liabilities | 24,948 | | | 24,989 | |
| Total liabilities | 1,713,724 | | | 1,573,562 | |
| Commitments and contingencies | | | |
| Redeemable noncontrolling interest | 3,288 | | | 3,155 | |
| Shareholders' equity: | | | |
| Common shares paid in-capital, no par value | 1,030,765 | | | 1,018,872 | |
| Treasury shares, at cost | (764,802) | | | (662,614) | |
| Retained earnings | 98,896 | | | 81,993 | |
| Accumulated other comprehensive loss | (5,639) | | | (5,350) | |
| Total shareholders' equity | 359,220 | | | 432,901 | |
| Total liabilities, redeemable noncontrolling interest, and shareholders' equity | $ | 2,076,232 | | | $ | 2,009,618 | |
The accompanying notes are an integral part of the consolidated financial statements.
CONSOLIDATED STATEMENTS OF SHAREHOLDERS' EQUITY
| | | | | | | | | | | | | | | | | | | | | | | | | | | | | | | | | | | | | | | | | | | | | | | |
| Number of Shares | | Amounts |
| (in thousands, except per share amounts) | Class A
Common
Shares | | Class B
Common
Shares | | Treasury Shares | | Common Shares Paid in Capital | | Treasury Shares | | Retained Earnings (Deficit) | | Accumulated Other Comprehensive Loss | |
Total |
| Balance, February 2, 2019 | 70,672 | | | 7,733 | | | 15,091 | | | $ | 953,801 | | | $ | (373,436) | | | $ | 254,718 | | | $ | (2,706) | | | $ | 832,377 | |
| Cumulative effect of accounting change | — | | | — | | | — | | | — | | | — | | | (9,556) | | | — | | | (9,556) | |
| Net income | — | | | — | | | — | | | — | | | — | | | 94,497 | | | — | | | 94,497 | |
| Stock-based compensation activity | 439 | | | — | | | — | | | 17,579 | | | — | | | — | | | — | | | 17,579 | |
| Repurchase of Class A common shares | (7,078) | | | — | | | 7,078 | | | — | | | (141,629) | | | — | | | — | | | (141,629) | |
| Dividends paid ($1.00 per share) | — | | | — | | | — | | | — | | | — | | | (72,565) | | | — | | | (72,565) | |
| Other comprehensive income | — | | | — | | | — | | | — | | | — | | | — | | | 211 | | | 211 | |
| Balance, February 1, 2020 | 64,033 | | | 7,733 | | | 22,169 | | | 971,380 | | | (515,065) | | | 267,094 | | | (2,495) | | | 720,914 | |
| Net loss | — | | | — | | | — | | | — | | | — | | | (488,719) | | | — | | | (488,719) | |
| Stock-based compensation activity | 633 | | | — | | | — | | | 18,773 | | | — | | | — | | | — | | | 18,773 | |
| Dividends paid ($0.10 per share) | — | | | — | | | — | | | — | | | — | | | (7,160) | | | — | | | (7,160) | |
| Other comprehensive loss | — | | | — | | | — | | | — | | | — | | | — | | | (791) | | | (791) | |
| Balance, January 30, 2021 | 64,666 | | | 7,733 | | | 22,169 | | | 990,153 | | | (515,065) | | | (228,785) | | | (3,286) | | | 243,017 | |
| Net income | — | | | — | | | — | | | — | | | — | | | 154,481 | | | — | | | 154,481 | |
| Stock-based compensation activity | 958 | | | — | | | — | | | 15,229 | | | — | | | — | | | — | | | 15,229 | |
| | | | | | | | | | | | | | | |
| | | | | | | | | | | | | | | |
| Foreign currency translation adjustment | — | | | — | | | — | | | — | | | — | | | — | | | (331) | | | (331) | |
| Balance, January 29, 2022 | 65,624 | | | 7,733 | | | 22,169 | | | $ | 1,005,382 | | | $ | (515,065) | | | $ | (74,304) | | | $ | (3,617) | | | $ | 412,396 | |
The accompanying notes are an integral part of the consolidated financial statements.
CONSOLIDATED STATEMENTS OF CASH FLOWS
| | | | | | | | | | | | | | | | | |
| (in thousands) | 2021 | | 2020 | | 2019 |
| Cash flows from operating activities: | | | | | |
| Net income (loss) | $ | 154,481 | | | $ | (488,719) | | | $ | 94,497 | |
| Adjustments to reconcile net income (loss) to net cash provided by (used in) operating activities: | | | | | |
| Depreciation and amortization | 77,923 | | | 88,026 | | | 86,649 | |
| Stock-based compensation expense | 23,923 | | | 20,236 | | | 17,059 | |
| Deferred income taxes | (1,001) | | | 34,485 | | | (2,931) | |
| Income from equity investment | (8,986) | | | (9,329) | | | (10,149) | |
| Distributions received from equity investment | 12,006 | | | 8,491 | | | 10,514 | |
| Impairment charges | 1,720 | | | 153,606 | | | 7,771 | |
| Gain on settlement | — | | | (8,990) | | | — | |
| Other | 2,775 | | | 695 | | | 3,957 | |
| Change in operating assets and liabilities: | | | | | |
| Accounts receivables | 8,703 | | | 23,179 | | | 265 | |
| Income tax receivable | (12,415) | | | (149,824) | | | — | |
| Inventories | (113,248) | | | 160,312 | | | 9,290 | |
| Prepaid expenses and other current assets | (3,859) | | | 17,166 | | | (14,994) | |
| Accounts payable | 92,894 | | | (47,014) | | | 36,995 | |
| Accrued expenses | 10,735 | | | 30,144 | | | (26,595) | |
| Operating lease assets and liabilities, net | (74,222) | | | 13,743 | | | (15,621) | |
| Net cash provided by (used in) operating activities | 171,429 | | | (153,793) | | | 196,707 | |
| Cash flows from investing activities: | | | | | |
| Cash paid for property and equipment | (33,030) | | | (31,114) | | | (77,820) | |
| Purchases of available-for-sale investments | — | | | — | | | (20,973) | |
| Sales of available-for-sale investments | — | | | 24,755 | | | 66,389 | |
| Proceeds from settlements | — | | | 8,990 | | | 4,965 | |
| Other | (1,998) | | | — | | | — | |
| Net cash provided by (used in) investing activities | (35,028) | | | 2,631 | | | (27,439) | |
| Cash flows from financing activities: | | | | | |
| Borrowing on revolving line of credit | — | | | 276,000 | | | 463,300 | |
| Payments on revolving line of credit | — | | | (466,000) | | | (433,300) | |
| Borrowing under ABL Revolver | 349,653 | | | 150,000 | | | — | |
| Payments on borrowings under ABL Revolver | (449,653) | | | (50,000) | | | — | |
| Proceeds from issuance of Term Loan | — | | | 250,000 | | | — | |
| Payments on borrowings under Term Loan | (12,500) | | | (6,263) | | | — | |
| Payments of debt issuance costs | — | | | (21,422) | | | — | |
| Cash paid for treasury shares | — | | | — | | | (141,629) | |
| Dividends paid | — | | | (7,160) | | | (72,565) | |
| Cash paid for income taxes for stock-based compensation shares withheld | (8,694) | | | (1,463) | | | (1,588) | |
| Other | (296) | | | (738) | | | 2,429 | |
| Net cash provided by (used in) financing activities | (121,490) | | | 122,954 | | | (183,353) | |
| Effect of exchange rate changes on cash balances | (33) | | | 1,225 | | | 81 | |
| Net increase (decrease) in cash, cash equivalents, and restricted cash | 14,878 | | | (26,983) | | | (14,004) | |
| Cash, cash equivalents, and restricted cash, beginning of period | 59,581 | | | 86,564 | | | 100,568 | |
| Cash, cash equivalents, and restricted cash, end of period | $ | 74,459 | | | $ | 59,581 | | | $ | 86,564 | |
| Supplemental disclosures of cash flow information: | | | | | |
| Cash paid (received) for income taxes | $ | 28,419 | | | $ | (11,822) | | | $ | 39,450 | |
| Cash paid for interest on debt | $ | 23,341 | | | $ | 19,523 | | | $ | 8,323 | |
| Cash paid for operating lease liabilities | $ | 273,080 | | | $ | 198,400 | | | $ | 236,506 | |
| Non-cash investing and financing activities: | | | | | |
| Property and equipment purchases not yet paid | $ | 4,365 | | | $ | 1,590 | | | $ | 12,164 | |
| Operating lease liabilities arising from lease asset additions | $ | 15,123 | | | $ | 9,407 | | | $ | 24,137 | |
| Net increase to operating lease assets and lease liabilities for modifications | $ | 94,992 | | | $ | 36,109 | | | $ | 71,945 | |
| | | | | | | | | | | | | | | | | | | | | | | | | | | | | | | | | | | | | | | | | | | | | | | |
| Number of Shares | | Amounts |
| (in thousands, except per share amounts) | Class A
Common
Shares | | Class B
Common
Shares | | Treasury Shares | | Common Shares Paid in Capital | | Treasury Shares | | Retained Earnings (Deficit) | | Accumulated Other Comprehensive Loss | |
Total |
| Balance, January 30, 2021 | 64,666 | | | 7,733 | | | 22,169 | | | $ | 990,153 | | | $ | (515,065) | | | $ | (228,785) | | | $ | (3,286) | | | $ | 243,017 | |
| Net income attributable to Designer Brands Inc. | — | | | — | | | — | | | — | | | — | | | 154,481 | | | — | | | 154,481 | |
| Stock-based compensation activity | 958 | | | — | | | — | | | 15,229 | | | — | | | — | | | — | | | 15,229 | |
| | | | | | | | | | | | | | | |
| | | | | | | | | | | | | | | |
| Foreign currency translation adjustment | — | | | — | | | — | | | — | | | — | | | — | | | (331) | | | (331) | |
| Balance, January 29, 2022 | 65,624 | | | 7,733 | | | 22,169 | | | 1,005,382 | | | (515,065) | | | (74,304) | | | (3,617) | | | 412,396 | |
| Net income attributable to Designer Brands Inc. | — | | | — | | | — | | | — | | | — | | | 162,676 | | | — | | | 162,676 | |
| Stock-based compensation activity | 1,010 | | | — | | | — | | | 20,587 | | | — | | | — | | | — | | | 20,587 | |
| Repurchase of Class A common shares | (10,713) | | | — | | | 10,713 | | | — | | | (147,549) | | | — | | | — | | | (147,549) | |
| Dividends paid ($0.20 per share) | — | | | — | | | — | | | (7,097) | | | — | | | (6,379) | | | — | | | (13,476) | |
| Foreign currency translation adjustment | — | | | — | | | — | | | — | | | — | | | — | | | (1,733) | | | (1,733) | |
| Balance, January 28, 2023 | 55,921 | | | 7,733 | | | 32,882 | | | 1,018,872 | | | (662,614) | | | 81,993 | | | (5,350) | | | 432,901 | |
| Net income attributable to Designer Brands Inc. | — | | | — | | | — | | | — | | | — | | | 29,062 | | | — | | | 29,062 | |
| Stock-based compensation activity | 3,248 | | | — | | | — | | | 11,893 | | | — | | | — | | | — | | | 11,893 | |
| Repurchase of Class A common shares | (9,678) | | | — | | | 9,678 | | | — | | | (102,188) | | | — | | | — | | | (102,188) | |
| Dividends paid ($0.20 per share) | — | | | — | | | — | | | — | | | — | | | (12,159) | | | — | | | (12,159) | |
| Foreign currency translation adjustment | — | | | — | | | — | | | — | | | — | | | — | | | (289) | | | (289) | |
| Balance, February 3, 2024 | 49,491 | | | 7,733 | | | 42,560 | | | $ | 1,030,765 | | | $ | (764,802) | | | $ | 98,896 | | | $ | (5,639) | | | $ | 359,220 | |
The accompanying notes are an integral part of the consolidated financial statements.
CONSOLIDATED STATEMENTS OF CASH FLOWS
| | | | | | | | | | | | | | | | | |
| (in thousands) | 2023 | | 2022 | | 2021 |
| Cash flows from operating activities: | | | | | |
| Net income | $ | 29,216 | | | $ | 162,666 | | | $ | 154,481 | |
| Adjustments to reconcile net income to net cash provided by operating activities: | | | | | |
| Depreciation and amortization | 66,140 | | | 81,315 | | | 77,923 | |
| Stock-based compensation expense | 29,374 | | | 28,502 | | | 23,923 | |
| Deferred income taxes | 9,124 | | | (51,891) | | | (1,001) | |
| Income from equity investments | (9,390) | | | (8,864) | | | (8,986) | |
| Distributions received from equity investments | 10,353 | | | 8,850 | | | 12,006 | |
| Impairment charges | 4,834 | | | 4,317 | | | 1,720 | |
| Loss on extinguishment of debt and write-off of debt issuance costs | — | | | 12,862 | | | — | |
| | | | | |
| Other | 333 | | | 2,017 | | | 2,775 | |
| Change in operating assets and liabilities, net of acquired amounts: | | | | | |
| Accounts receivables | 3,345 | | | 7,962 | | | 8,703 | |
| Income tax receivable | (455) | | | 118,219 | | | (12,415) | |
| Inventories | 76,223 | | | (15,995) | | | (113,248) | |
| Prepaid expenses and other current assets | (29,203) | | | (5,398) | | | (3,859) | |
| Accounts payable | 36,113 | | | (92,728) | | | 92,894 | |
| Accrued expenses | (29,884) | | | (20,098) | | | 10,735 | |
| Operating lease assets and liabilities, net | (33,724) | | | (30,310) | | | (74,222) | |
| Net cash provided by operating activities | 162,399 | | | 201,426 | | | 171,429 | |
| Cash flows from investing activities: | | | | | |
| Cash paid for property and equipment | (54,997) | | | (54,974) | | | (33,030) | |
| | | | | |
| Cash paid for business acquisition | (127,496) | | | (19,062) | | | — | |
| | | | | |
| | | | | |
| Equity investment in Le Tigre | — | | | (8,228) | | | — | |
| Other | — | | | (5,853) | | | (1,998) | |
| Net cash used in investing activities | (182,493) | | | (88,117) | | | (35,028) | |
| Cash flows from financing activities: | | | | | |
| Borrowing on revolving credit facility | 1,232,013 | | | 1,705,235 | | | 349,653 | |
| Payments on revolving credit facility | (1,211,978) | | | (1,424,200) | | | (449,653) | |
| Proceeds from the issuance of the Term Loan | 135,000 | | | — | | | — | |
| Payments for borrowings under the Term Loan | (1,875) | | | — | | | — | |
| Payments for borrowings and prepayment premium under Previous Term Loan | — | | | (238,196) | | | (12,500) | |
| Payments of debt issuance costs | (10,701) | | | (2,316) | | | — | |
| Cash paid for treasury shares | (102,188) | | | (147,549) | | | — | |
| Dividends paid | (12,159) | | | (13,476) | | | — | |
| Cash paid for taxes for stock-based compensation shares withheld | (17,481) | | | (7,915) | | | (8,694) | |
| Other | (152) | | | (62) | | | (296) | |
| Net cash provided by (used in) financing activities | 10,479 | | | (128,479) | | | (121,490) | |
| Effect of exchange rate changes on cash balances | 22 | | | (523) | | | (33) | |
| Net increase (decrease) in cash, cash equivalents, and restricted cash | (9,593) | | | (15,693) | | | 14,878 | |
| Cash, cash equivalents, and restricted cash, beginning of period | 58,766 | | | 74,459 | | | 59,581 | |
| Cash, cash equivalents, and restricted cash, end of period | $ | 49,173 | | | $ | 58,766 | | | $ | 74,459 | |
| Supplemental disclosures of cash flow information: | | | | | |
| Cash paid for interest on debt | $ | 29,564 | | | $ | 14,820 | | | $ | 23,341 | |
| Cash paid for operating lease liabilities | $ | 230,059 | | | $ | 222,956 | | | $ | 273,080 | |
| Non-cash investing and financing activities: | | | | | |
| Property and equipment purchases not yet paid | $ | 5,056 | | | $ | 10,150 | | | $ | 4,365 | |
| Operating lease liabilities arising from lease asset additions | $ | 22,826 | | | $ | 23,496 | | | $ | 15,123 | |
| Net increase to operating lease assets and lease liabilities for modifications | $ | 166,992 | | | $ | 204,424 | | | $ | 94,992 | |
The accompanying notes are an integral part of the consolidated financial statements.
NOTES TO THE CONSOLIDATED FINANCIAL STATEMENTS
| | | | | | | | | | | | | | |
| 1. DESCRIPTION OF BUSINESS AND SIGNIFICANT ACCOUNTING POLICIES |
GENERALDESCRIPTION OF BUSINESS
Business Operations- Designer Brands Inc. ("we," "us," "our," and the "Company") is one of North America'sthe world's largest designers, producers, and retailers of footwear and accessories. We operate in 3three reportable segments: the U.S. Retail segment, the Canada Retail segment, and the Brand Portfolio segment. The U.S. Retail segment operates the DSW Designer Shoe Warehouse ("DSW") banner through its direct-to-consumer U.S. stores and e-commerce site. The Canada Retail segment operates The Shoe Company and DSW banners through its direct-to-consumer Canada stores and e-commerce sites. The Brand Portfolio segment earns revenue from the salewholesale of wholesale products to retailers and international distributors, commissions for serving retailers as the design and buying agent for products under private labels, (which we refer to as "First Cost"), and the sale of our branded products through the direct-to-consumer e-commerce site at www.vincecamuto.com. Anfor the Vince Camuto, Keds, Hush Puppies, and Topo brands. Our equity investments in ABG-Camuto, LLC ("ABG-Camuto") and Le Tigre 360 Global LLC ("Le Tigre") are an integral part of the Brand Portfolio segment is our equity investment in ABG-Camuto LLC ("ABG-Camuto"), which issegment.
We have a partnership between Camuto LLC, a wholly-owned subsidiary doing business as "Camuto Group," and Authentic Brands Group LLC, a global brand management and marketing company. Camuto Group has a 40% ownership interest in ABG-Camuto, a joint venture that owns severalthe intellectual property rights including, among others,of Vince Camuto and Louise et Cie, and focuses on licensing and developing new category extensionsother brands. We are party to support the global growth of these brands. Camuto Group has a licensing agreement with ABG-Camuto, whereby we pay royalties on our net sales fromwhich provides for the exclusive right to design, source, and sell footwear and handbags under the brands owned bythat ABG-Camuto subjectowns. In July 2022, we acquired a 33.3% ownership interest in Le Tigre, which manages the Le Tigre brand. We are also party to guaranteed minimums. Camuto Group also ownsa license agreement with Le Tigre, which provides for the exclusive right to design, source, and sell Le Tigre-branded footwear. In addition, we own the licensing rights for footwear and certain handbag licensing rightshandbags of Jessica Simpson,the Lucky Brand and the licensing rights for footwear of the Jessica Simpson brand and, beginning in 2023, the Hush Puppies brand.
On December 13, 2022, we acquired a 79.4% ownership interest in Topo Athletic LLC ("Topo"), a designer of specialty athletic footwear that sells its Topo branded products at wholesale to retailers and international distributors and through a joint venture, JLO Jennifer Lopez. Our other operating segment,its direct-to-consumer e-commerce site. The Topo acquisition provides us with expanded capabilities within the athletic footwear market. On February 4, 2023, we completed the acquisition of the Keds business ("Keds") from Wolverine World Wide, Inc. This expanded the reach of our Owned Brands offerings, which refers to those brands that we exited during 2020, is belowhave rights to sell through ownership or license arrangements, into casual and athleisure footwear in the quantitativewholesale and qualitative thresholds for a reportable segmentdirect-to-consumer e-commerce channels. Topo and is aggregated into Other for segment reporting purposes.Keds are included within our Brand Portfolio segment.
Fiscal Year- Our fiscal year ends on the Saturday nearest to January 31. References to a fiscal year (e.g., "2021""2023") refer to the calendar year in which the fiscal year begins. This reporting schedule is followed by many national retail companies and typically results in a 52-week fiscal year (including 2021 and 2022), but occasionally will contain an additional week resulting in a 53-week fiscal year. The periods presented in these consolidated financial statements each consisted of 52 weeks.
IMPACTS OF THE COVID-19 PANDEMIC
In March 2020, the World Health Organization declared the coronavirus ("COVID-19") outbreak a pandemic. On March 18, 2020, to help control the spread of the virus and protect the health and safety of our customers, associates, and the communities we serve, we temporarily closed all of our stores in the U.S. and Canada. In addition, we took several actions in late March 2020 to reduce costs and operations to levels that were more commensurate with then-current sales, including furloughs and pay reductions. During the second quarter and into the third quarter of 2020, we re-opened all of our stores, discontinued the furlough program, and restored pay for our associates that had taken pay reductions. Beginning in July 2020, we initiated an internal reorganization and reduction of our workforce with additional actions taken throughout 2020 and into the first quarter of 2021, resulting in the elimination of approximately 1,000 associate positions. The charges recorded as a result of this reorganization are included in our integration and restructuring costs discussed below.
As a result of the material reduction in net sales and cash flows during 2020, we updated our impairment analyses for our U.S. Retail and Canada Retail segments at the store-level, which represents the lowest level for which identifiable cash flows are independent of the cash flows of other assets. The carrying amount of the store asset group, primarily made up of operating lease assets, leasehold improvements and fixtures, is considered impaired when the carrying value of the asset group exceeds the expected future cash flows from the asset group. The impairment loss recognized is the excess of the carrying value of the asset or asset group over its fair value (categorized as Level 3 under the fair value hierarchy). Fair value at the store level is typically based on projected discounted cash flows over the remaining lease term. In addition, we evaluated other long-lived assets based on our intent to use such assets going forward. During 2020, we recorded impairment charges of $127.1 million ($104.2 million and $22.9 million for the U.S. Retail segment and Canada Retail segment, respectively). Also, during 2020, we recorded an impairment charge of $6.5 million for the Brand Portfolio segment customer relationship intangible asset resulting in a full impairment due to the lack of projected cash flows over the remaining useful life (categorized as Level 3 under the fair value hierarchy).
As a result of the material reduction in net sales and cash flows due to the temporary closure of all of our stores, the decrease in net sales from our retailer customers and the decrease in the Company's market capitalization due to the impact of the COVID-19 pandemic on macroeconomic conditions, we performed an impairment analysis for goodwill and other indefinite-lived intangible assets during the first quarter of 2020. We calculated the fair value of the reporting units with goodwill primarily based on a discounted cash flow analysis (categorized as Level 3 under the fair value hierarchy). Our analysis concluded that the fair value of the First Cost reporting unit within the Brand Portfolio segment did not exceed its carrying
value. Accordingly, during 2020, we recorded an impairment charge of $20.0 million for the First Cost reporting unit in the Brand Portfolio segment, resulting in a full impairment.
On March 27, 2020, the U.S. government enacted the Coronavirus Aid, Relief, and Economic Security Act (the "CARES Act"), which, among other things, provided employer payroll tax credits for wages paid to associates who were unable to work over a defined period and options to defer payroll tax payments. Based on our evaluation of the CARES Act, we qualified for certain employer payroll tax credits, which were treated as government subsidies to offset related operating expenses, as well as the deferral of payroll and other tax payments in the future. Similar credits were also available in Canada. During 2021 and 2020, the qualified government credits reduced our operating expenses by $4.0 million and $11.4 million, respectively, on our consolidated statements of operations. As of January 29, 2022, we had $5.3 million of deferred qualified payroll and other tax obligations, which is included in accrued expenses on the consolidated balance sheets that we expect to pay at the end of 2022.
We recorded our income tax expense, income tax receivable, and deferred tax assets and related liabilities based on management's best estimates. Additionally, we assessed the likelihood of realizing the benefits of our deferred tax assets. Our ability to recover these deferred tax assets depends on several factors, including our ability to project future taxable income. One of the provisions of the CARES Act allows net operating losses generated within tax years 2018 through 2020 to be carried back up to five years, including years in which the U.S. federal statutory tax rate was 35%, as opposed to the current rate of 21%. In evaluating future taxable income, significant weight is given to positive and negative evidence that is objectively verifiable. As a result of the losses incurred in 2020 due to the impacts of the COVID-19 pandemic, we were in a three-year cumulative loss position as of January 29, 2022 and January 30, 2021, which was significant objective negative evidence in considering whether deferred tax assets are realizable. Such objective evidence limits the ability to consider other subjective evidence, such as the projection of future taxable income. A valuation allowance has been recognized as a reserve on the total deferred tax asset balance due to the uncertainty of realization of our loss carry forwards and other deferred tax assets. For 2021, 2020 and 2019, our effective tax rate was 10.7%, 19.7% and 21.1%, respectively. The rate for 2021 was the result of maintaining a full valuation allowance on deferred tax assets while also recording net discrete tax benefits, primarily as a result of adjustments to our estimated 2020 return reflecting implemented tax strategies. The decrease in the rate for 2020 compared to 2019 was the result of recording an additional valuation allowance of $87.6 million partially offset by the ability to carry back current year losses to a tax year where the U.S. federal statutory tax rate was 35%(including 2023).
While trends improved during 2021 as compared to 2020, we cannot reasonably estimate the extent to which our business will continue to be affected by the COVID-19 pandemic and to what extent the recent improved trends will continue. For instance, we have continued to experience reduced customer in-store traffic and net sales when compared to pre-COVID-19 periods, and it is unclear when customer behavior will return to pre-COVID-19 patterns, if at all. The ongoing and prolonged nature of the COVID-19 pandemic may lead to further adjustments to our operations. As such, the ultimate impacts of the COVID-19 pandemic on our businesses will depend on future developments, including the availability of labor, global supply chain disruptions, new variants of COVID-19 and the severity thereof, and the global availability and use of vaccines or palliatives, all of which are highly uncertain and cannot be predicted. As a result, we may have future write-downs or adjustments to inventories, receivables, long-lived assets, intangibles, goodwill, and the valuation allowance on deferred tax assets.
SIGNIFICANT ACCOUNTING POLICIES
Variable Interest Entity- In 2019, we formed a joint venture with an entity affiliated with performing artist and celebrity Jennifer Lopez. This partnership was formed in order to design, source and sell the JLO Jennifer Lopez collection, a line of footwear and handbags. Our Camuto Group business is responsible for design and sourcing, and DSW is the exclusive retailer of the brand. Jennifer Lopez and her team lead the creative directive for marketing and product design, with our technical expertise and guidance. Jennifer Lopez earns fixed licensing fees and also has the opportunity to earn the Company's Class A common shares based on the expansion of our VIP rewards programs from her fan base, which no common shares have been earned yet under this arrangement. Based on certain terms within the joint venture operating agreement, we have determined that we have overall control of the joint venture. In addition, we provide a revolving line of credit to the joint venture and a guarantee for funding in excess of the joint venture's equity. As a result, we are considered the primary beneficiary of the joint venture and it is consolidated within our financial statements. Assets and liabilities of the joint venture are immaterial. We recognize all of the losses of the joint venture up to the amounts guaranteed and share any profits between the partners under the terms of the joint venture operating agreement.
Principles of Consolidation- The consolidated financial statements include the accounts of Designer Brands Inc. and its subsidiaries, including the variable interest entity.entities. All intercompany accounts and transactions have been eliminated in consolidation. All amounts are in United States ("U.S.") dollars.
Use of Estimates- The preparation of financial statements in conformity with accounting principles generally accepted in the U.S. requires management to make estimates and assumptions that affect the reported amounts of assets and liabilities and disclosure of contingent assets and liabilities at the dates of the financial statements and reported amounts of net sales and expenses during the reportingreporting periods. Certain estimates and assumptions use forecasted financial information based on information reasonably available to us, along with the estimated, but uncertain, future impacts of the COVID-19 pandemic.us. Significant estimates and assumptions are required as a part of accounting for salescustomer returns allowances, customer allowances and discounts, allowance for doubtful accounts,allowances, gift card breakage income, deferred revenue associated with loyalty programs, valuation of inventories, depreciation and amortization, impairments of long-lived assets, intangibles and goodwill, lease accounting, redeemable noncontrolling interest, income taxes and valuation allowances on deferred tax assets, self-insurance reserves.reserves, and acquisitions. Although we believe that these estimates and assumptions are reasonable, they are based on management's knowledge of current events and actions we may undertake in the future. Changes in facts and circumstances may result in revised estimates and assumptions, and actual results could differ from these estimates.
Revenue Recognition- Sales from the U.S. Retail and Canada Retail segments are recognized upon customer receipt of merchandise, net of estimated returns and exclude sales tax. Customers can purchase products from one of our stores, online or from our mobile application. For products shipped directly to our customers, we recognize the sale upon the estimated customer receipt date based on historical delivery transit times. Revenue from shipping and handling is recorded in net sales while the related costs are included in cost of sales inon the consolidated statements of operations. For products shipped directly to our customers from our suppliersvendors (referred to as "drop ship"), we record gross sales upon customer receipt based on the price paid by the customers as we have determined that we are the principal party responsible for the sale transaction.
Sales from the Brand Portfolio segment are recognized upon transfer of control. Generally, our wholesale customers arrange their own transportation of merchandise and control is transferred at the time of shipment. Sales are recorded at the transaction price, excluding sales tax, net of estimated reserves for customer returns allowances and discounts.allowances. Direct-to-consumer online sales are recognized upon the estimated customer receipt date based on historical delivery transit times and are net of estimated returns and exclude sales tax. First Cost commissionCommission income is recognized at the point in time when thea customer's freight forwarder takes control of the related merchandise.
Gift Cards- Amounts received from the sale of gift cards are recorded as a liability and are recognized as sales when the cards are redeemed for merchandise. Based on historical information, the likelihood of a gift card remaining unredeemed (referred to as "breakage") can be reasonably estimated at the time of gift card issuance. Breakage income is recognized over the estimated average redemption period of redeemed gift cards.
Loyalty Programs- We offer loyalty programs to our customers in the U.S. and Canada.direct-to-consumer customers. Members under the programs earn points based on their level of spending, as well as for various other activities. Upon reaching a specified point threshold, members receive reward certificates that may be redeemed for purchases made within the stated expiration date. We record a reduction of net sales when points are awarded based on an allocation of the initial customer purchase and the stand-alone value of the points earned. We maintain a deferred liability for the outstanding points and certificates based on historical conversion and redemption rates. The deferred liability is reduced and sales are recognized when certificates are redeemed or when points and certificates expire.
Cost of Sales- Cost of sales from the U.S. Retail and Canada Retail segments is recognized net of estimated returns. In addition to the cost of merchandise sold, which includes freight and the impact of markdowns, shrink and other inventory valuation adjustments, we include expenses associated with distribution and fulfillment and store occupancy in cost of sales. Distribution and fulfillment expenses comprise of labor costs, third-party fees, rent, depreciation, insurance, utilities, maintenance, and other operating costs. Store occupancy expenses include rent, utilities, repairs, maintenance, insurance, janitorial costs, and occupancy-related taxes, but exclude depreciation.
Cost of sales from the Brand Portfolio segment is recognized net of estimated returns. In addition to the cost of merchandise sold, which includes freight and the impact of inventory valuation adjustments, we include royalty expense for licensed brands in cost of sales.
Operating Expenses- Operating expenses include expenses related to store management and store payroll costs, advertising,marketing, store depreciation, new store costs, design, sourcing and distribution costs associated with the Brand Portfolio segment, and corporate expenses. Corporate expenses include expenses related to buying, information technology, rent (net of sublease income), depreciation and amortization expense for corporate assets, marketing, legal, finance, outside professional services, customer service center expenses, and payroll-related costs for associates.
Interest Expense, Net-net- Interest expense, net, is summarized in the following table:
| | (in thousands) | (in thousands) | 2021 | | 2020 | | 2019 | (in thousands) | 2023 | | 2022 | | 2021 |
| Interest expense | Interest expense | $ | (32,198) | | | $ | (24,032) | | | $ | (8,914) | |
| Interest income | Interest income | 69 | | | 338 | | | 1,559 | |
| $ | (32,129) | | | $ | (23,694) | | | $ | (7,355) | |
| $ | |
Stock-Based Compensation- We recognize compensation expense for awards of stock options, restricted stock units ("RSUs"), and director stock units based on the fair value on the grant date and on a straight-line basis over the requisite service period for the awards that are expected to vest, with forfeitures estimated based on our historical experience and future expectations. Stock-based compensation is included in operating expenses inon the consolidated statements of operations.
Chief Executive Officer Transition- In January 2023, we announced our succession process relating to the Company's Chief Executive Officer ("CEO") role, whereby our former CEO, Roger Rawlins, stepped down from his role as CEO and Restructuring Costs-as a member of the Board of Directors (the "Board") effective April 1, 2023, at which time, Doug Howe, who previously served as Executive Vice President of the Company and President of DSW, assumed the CEO role and joined the Board. Mr. Rawlins commenced service as a strategic advisor to the Company and the Board effective April 1, 2023 through April 1, 2024 under the terms of a transition and consulting agreement. In conjunction with the CEO transition, we recorded $8.1 million of CEO transition costs consisting of $2.2 million in severance costs, $2.8 million in accelerated stock-based compensation (net of stock awards forfeited), and $3.1 million in retention stock awards to certain members of our leadership team and other related professional fees. During 2023 and 2022, we recognized CEO transition costs of $4.4 million and $3.7 million, respectively, in operating expenses on the consolidated statements of operations.
Severance- During 2023, we incurred severance costs, excluding the severance related to the CEO transition, of $5.1 million ($3.4 million, $0.2 million and $1.5 million for the U.S. Retail, Canada Retail and Brand Portfolio segments, respectively). During 2022, we incurred severance costs, excluding the severance related to the CEO transition, of $2.8 million ($1.8 million, $0.2 million and $0.8 million for the U.S. Retail, Canada Retail and Brand Portfolio segments, respectively). During 2021, we incurred severance costs of $3.3 million ($($1.5 million and $1.8 million for the U.S. Retail segment and Brand Portfolio segment,segments, respectively). During 2020,As of February 3, 2024 and January 28, 2023, we incurred restructuring costs, which consisted primarily of severance of $15.2 million ($5.5 million, $0.8had $3.9 million and $8.9 million for the U.S. Retail segment, Canada Retail segment and Brand Portfolio segment, respectively), and professional fees of $2.4 million. During 2019, we incurred integration and restructuring costs related to our prior year acquisition activity, which consisted primarily of severance of $3.9 million, fees for terminating joint ventures of $7.2 million, and professional fees and other integration costs of $6.6 million. Integration and restructuring costs are recorded as operating expenses on the consolidated statements of operations. As of January 29, 2022 and January 30, 2021, we had $1.9 million and $6.5$5.7 million, respectively, of severance liability, including the severance related to the CEO transition, included in accrued expenses on the consolidated balance sheets.
Gain on Settlement- During 2020, we collected $9.0 million, net of legal costs incurred, and recorded a gain to operating expenses in the consolidated statements of operations that was due to a settlement with a vendor related to costs incurred on an internal-use software project that was capitalized and then impaired in a previous year.
New Store Opening Costs- Costs associated with the opening of new stores are expensed as incurred. During 2021, 2020 and 2019, new store opening costs, primarily pre-opening rent and marketing expenses, were $1.6 million, $2.7 million and $2.6 million, respectively.
Marketing Expense- The cost of advertising is generally expensed when the advertising first takes place or when mailed. During 2021, 20202023, 2022 and 2019,2021, marketing costs were $176.4 million, $167.1 million and $163.0 million, $131.7 million and $123.9 million, respectively.
Non-Operating Income (Expenses), Net- Non-operating income (expenses), net, includes gains and losses from foreign currency revaluation and realized gains and losses related to our investment portfolio.
Income Taxes- We account for income taxes under the asset and liability method. We determine the aggregate amount of income tax expense to accrue and the amount that will be currently payable based upon tax statutes of each jurisdiction in which we do business. Deferred tax assets and liabilities are recognized for the future tax consequences attributable to temporary differences between the financial statement carrying amounts of existing assets and liabilities and respective tax bases and operating loss and tax credit carryforwards, as measured using enacted tax rates expected to be in effect in the periods when temporary differences are expected to be realized or settled. The effect on deferred tax assets and liabilities of a change in tax rates is recognized in income in the period that includes the enactment date. A valuation allowance is provided when it is more likely than not that some portion or all of a deferred tax asset will not be realized. The ultimate realization of deferred tax assets is dependent upon the generation of future taxable income during the periods in which those temporary differences become realizable.
We review and update our tax positions as necessary to add any new uncertain tax positions taken, or to remove previously
identified uncertain positions that have been adequately resolved. Additionally, uncertain positions may be remeasured as
warranted by changes in facts or law. Accounting for uncertain tax positions requires estimating the amount, timing and
likelihood of ultimate settlement. Although we believe that these estimates are reasonable, actual results could differ from
these estimates.
Cash, Cash Equivalents, and Restricted Cash- Cash and cash equivalents represent cash, money market funds, and credit card receivables that generally settle within three days. Restricted cash representsrepresented cash that iswas restricted as to withdrawal or usage and consistsconsisted of a mandatory cash deposit maintained for certain insurance policies and letters of credit.
The following table provides a reconciliation of cash and cash equivalents and restricted cash reported within the consolidated balance sheets that sum to the total of the same such amounts shown inon the consolidated statements of cash flows:
| | (in thousands) | (in thousands) | January 29, 2022 | | January 30, 2021 | | February 1, 2020 | (in thousands) | February 3, 2024 | | January 28, 2023 | | January 29, 2022 |
| Cash and cash equivalents | Cash and cash equivalents | $ | 72,691 | | | $ | 59,581 | | | $ | 86,564 | |
| Restricted cash, included in prepaid expenses and other current assets | Restricted cash, included in prepaid expenses and other current assets | 1,768 | | | — | | | — | |
| Total cash, cash equivalents, and restricted cash shown in the consolidated statements of cash flows | Total cash, cash equivalents, and restricted cash shown in the consolidated statements of cash flows | $ | 74,459 | | | $ | 59,581 | | | $ | 86,564 | |
Investments- We determine the balance sheet classification of investments at the time of purchase and evaluate the classification at each balance sheet date. For the balance sheet dates presented, we did not hold any investments in securities other than cash equivalents. We account for investments using the equity method of accounting when we exercise significant influence over the investment. If we do not exercise significant influence, we account for the investment using the cost method of accounting. Cost method investments are included in other assets on the consolidated balance sheets. We evaluate our investments for impairment and whether impairment is other-than-temporary at each balance sheet date.
The following table presents activity related to our equity investment in ABG-Camuto:investments:
| | (in thousands) | (in thousands) | 2021 | | 2020 | | 2019 | (in thousands) | 2023 | | 2022 | | 2021 |
| Balance at beginning of period | Balance at beginning of period | $ | 58,598 | | | $ | 57,760 | | | $ | 58,125 | |
| Investment in Le Tigre | |
| Share of net earnings | Share of net earnings | 8,986 | | | 9,329 | | | 10,149 | |
| Distributions received | Distributions received | (12,006) | | | (8,491) | | | (10,514) | |
| Balance at end of period | Balance at end of period | $ | 55,578 | | | $ | 58,598 | | | $ | 57,760 | |
Receivables, net- Receivables are classified as current assets because the average collection period is generally shorter than one year. We monitor our exposure for credit losses based upon specific receivable balances and we record related allowances for doubtful accounts for estimated losses resulting from the inability of our customers to make required payments. We utilize an unrelated third-party provider for credit and collection services for receivables from the sale of wholesale products to certain retailers. This third-party provider guarantees payment for the majority of the serviced receivables.
Inventories- All of our inventory is made up of finished goods. The U.S. Retail segment inventory is accounted for using the retail inventory method and is stated at the lower of cost or market. Under the retail inventory method, the valuation of inventories at cost and the resulting gross profits are determined by applying a calculated cost-to-retail ratio to the retail value of inventories. The cost basis of inventories is decreased by charges to cost of sales at the time the retail value of the inventory is lowered by markdowns. As a result, earnings are negatively impacted as the merchandise is marked down prior to sale. The Canada Retail segment and the Brand Portfolio segment inventory is accounted for using the moving average cost method and is stated at the lower of cost or net realizable value. We monitor aged inventory for obsolete and slow-moving inventory that may need to be liquidated in the future at amounts below cost. Reductions to inventory values establish a new cost basis. Favorable changes in facts or circumstances do not result in an increase in the newly established cost basis.
We perform physical inventory counts or cycle counts on all inventory on hand throughout the year and adjust the recorded balance to reflect the results. We record estimated shrink between physical inventory counts, based on historical experience and recent results, less amounts realized.
Inherent in the calculation of inventories are certain significant judgments and estimates, including setting the original merchandise retail value, markdowns, shrink, and liquidation values. The ultimate amount realized from the sale of inventory and write offswrite-offs from counts could differ from management estimates.
Concentration of Risks- We are subject to risks due to concentration of our merchandise coming from China. All of the products manufactured through the Brand Portfolio segment come from third-party facilities outside of the U.S., with 75%76% of units sourced from China. In addition to the merchandise sourced through our Brand Portfolio segment, our U.S. Retail segment and Canada Retail segment also sources merchandise from both domestic and foreign third-party vendors. Many of our domestic vendors import a large portion of their merchandise from China.
We are also subject to risks due to the concentration of vendors within the U.S. Retail and Canada Retail segments. During 2021,2023, three key third-partynational brand vendors together supplied approximately 20%21% of our retail merchandise, with no individual vendor providing more than 10% of our retail merchandise.
Financial instruments, which principally subject us to concentration of credit risk, consist of cash and cash equivalents. We invest excess cash when available through financial institutions in money market accounts. At times, such amounts invested through banks may be in excess of Federal Deposit Insurance Corporation insurance limits, and we mitigate the risk by utilizing multiple banks.
Fair Value- Fair value is defined as the price that would be received in the sale of an asset or paid to transfer a liability in an orderly transaction between market participants at the measurement date. Assets and liabilities recorded at fair value are categorized using defined hierarchical levels related to the subjectivity associated with the inputs to fair value measurements as follows:
• Level 1 - Quoted prices in active markets for identical assets or liabilities.
• Level 2 - Quoted prices for similar assets or liabilities in active markets or inputs that are observable.
• Level 3 - Unobservable inputs in which little or no market activity exists.
The carrying value of cash and cash equivalents, restricted cash, receivables, and accounts payables approximated their fair values due to their short-term nature. The faircarrying value of borrowings under our senior secured asset-based revolving credit facility ("ABL Revolver") approximated the carrying value. As of January 29, 2022, the fair value of borrowings underand our senior secured term loan credit agreement, as amended, ("Term Loan") was $237.6 million compared to the carrying value of $231.3 million. Theapproximated fair value of debt borrowings was estimated based on currentthe terms and variable interest rates offered for similar instruments (categorized as Level 2 under the fair value hierarchy).rates.
Property and Equipment, net- Property and equipment, net, are stated at cost less accumulated depreciation determined by the straight-line method over the expected useful life of assets. The net book value of property or equipment sold or retired is removed from the asset and related accumulated depreciation accounts with any resulting net gain or loss included in results of operations.
Internal Use Software Costs- Costs related to software developed or obtained for internal use are expensed as incurred until the application development stage has been reached. Once the application development stage has been reached, certain qualifying costs are capitalized until the software is ready for its intended use. If aCapitalized software costs and the related accumulated amortization are included in property and equipment, net, on the consolidated balance sheets.
Cloud Computing Arrangements- Capitalized implementation costs, net of accumulated amortization, for cloud computing arrangement includes a software license, the software license element of the arrangement is accounted for in a manner consistent with the acquisition of other software licenses. If the arrangement does not include a software license, the arrangement isarrangements accounted for as a service contract.contracts are included in other assets on the consolidated balance sheets. Capitalized implementation costs are amortized, once the implementation is complete, over the term of the service contract to operating expenses on the consolidated statements of operations. As of February 3, 2024 and January 28, 2023, we had $16.4 million and $9.5 million, respectively, of unamortized capitalized costs, and $4.5 million and $2.5 million, respectively, of accumulated amortization related to the capitalized costs. During 2023, 2022 and 2021, we had amortization expense related to capitalized costs of $2.4 million, $0.9 million and $0.2 million, respectively.
Leases- A lease liability for new and modified leases is recorded based on the present value of future fixed lease commitments with a corresponding lease asset. For leases classified as operating leases, we recognize a single lease cost on a straight-line basis based on the combined amortization of the lease liability and the lease asset. Other leases will be accounted for as finance arrangements. For real estate leases, we are generally required to pay base rent, real estate taxes, and insurance, which are considered lease components, and maintenance, which is a non-lease component. We have elected to not separate non-lease payment components from the associated lease component for all new and modified real estate leases. We determine the discount rate for each lease by estimating the rate that we would be required to pay on a secured borrowing for an amount equal to the lease payments over the lease term.term when the rate implicit in the lease cannot be readily determined. The majority of our real estate leases provide for renewal options, which are typically not included in the lease term used for measuring the lease assets and lease liabilities as it is not reasonably certain we will exercise renewal options.
We monitor for events or changes in circumstances that may require a reassessment of our leases and determine if a remeasurement is required. In response to the COVID-19 pandemic, we negotiated deferrals of lease payments to be repaid over various periods, with no substantive changes to the total consideration without a change in the terms. We have elected to treat these changes as modifications to our leases, resulting in remeasuring the related lease assets and liabilities and including non-lease components per our policy.
Impairment of Long-Lived Assets- We periodically evaluate the carrying amount of our long-lived assets, primarily operating lease assets, property and equipment and definite-lived intangible assets, when events and circumstances warrant such a review to ascertain if any assets have been impaired. The reviews are conducted at the lowest identifiable level. The carrying amount of a long-lived asset or asset group is considered impaired when the carrying value of the asset or asset group exceeds the expected future cash flows from the asset or asset group. The impairment loss recognized is the excess of the carrying value of the asset or asset group over its fair value (categorized as Level 3 under the fair value hierarchy). Fair value at the store level is typicallyprimarily based on projected discounted cash flows over the remaining lease term.
During 2023, we recorded impairment charges of $4.8 million, primarily in the Brand Portfolio segment resulting from an abandoned leased space. During 2022, we recorded impairment charges of $4.3 million, primarily in the Brand Portfolio segment resulting from subleases of vacated leased spaces. During 2021, we recorded impairment charges of $1.7 million, including $1.2 million in the U.S. Retail segment for abandoned equipment we are replacingreplaced and $0.5 million in the Brand Portfolio segment for the sublease of an abandoneda vacated leased space. Refer to section above, Impacts of the COVID-19 Pandemic, regarding impairment charges of long-lived assets during 2020. During 2019, we recorded impairment charges of $7.8 million, including $4.8 million for operating lease assets and other property and equipment in the Brand Portfolio segment related to the planned consolidation of certain locations as part of our integration efforts and $3.0 million primarily for operating lease assets related to under-performing stores ($2.3 million and $0.7 million for the U.S. Retail segment and Canada Retail segment, respectively).
Goodwill and Other Indefinite LivedIndefinite-Lived Intangible Assets- We evaluate goodwill and other indefinite lived intangible assets for impairment annually during our fourth quarter, or more frequently if an event occurs or circumstances change that would indicate that impairment may exist. When evaluating for impairment, we may first perform a qualitative assessment to determine whether it is more likely than not that there is an impairment. If we do not perform a qualitative assessment, or if we determine that it is more likely than not that the carrying value exceeds its fair value, we will calculate the estimated fair value. Fair value is typically calculated using a discounted cash flow analysis. Where deemed appropriate, we may also utilize a market approach for estimating fair value. Impairment charges are calculated as the amount by which the carrying amount exceeds its fair value, but not to exceed the carrying value for goodwill.Refer to section above, Impacts of the COVID-19 Pandemic, regarding impairment charges of goodwill during 2020.
Self-Insurance Reserves- We record estimates for certain health and welfare, workers' compensation and casualty insurance costs that are self-insured programs. Self-insurance reserves include actuarial estimates of both claims filed, carried at their expected ultimate settlement value, and claims incurred but not yet reported. The liability represents an estimate of the ultimate cost of claims incurred as of the balance sheet date. Estimates for self-insurance reserves are calculated utilizing claims development estimates based on historical experience and other factors. We have purchased stop loss insurance to limit our exposure on a per person basis for health and welfare and on a per claim basis for workers' compensation and general liability, as well as on an aggregate annual basis.
Redeemable noncontrolling interest- As discussed in more detail in Note 2, Acquisitions, we have an exclusive call option and the noncontrolling interest holders have a put option with respect to our purchase of the remaining 20.6% ownership interest in Topo upon the occurrence of certain events or after a period of three years following the transaction close. The redemption price is based on the future performance of Topo. As a result of the redemption feature, we record the remaining interest in Topo as a redeemable noncontrolling interest in temporary equity on the consolidated balance sheets. The noncontrolling interest is adjusted each reporting period for the net income (loss) attributable to the noncontrolling interest. Each reporting period, a measurement period adjustment, if any, is then recorded to adjust the noncontrolling interest to the higher of either the redemption value, assuming it was redeemable at the reporting date, or its carrying value. Any adjustments are also recorded as net income (loss) attributable to the noncontrolling interest.
The following table presents activity related to our redeemable noncontrolling interest:
| | | | | | | | | | | | | |
| (in thousands) | 2023 | | 2022 | | |
| Balance at beginning of period | $ | 3,155 | | | $ | — | | | |
| Acquisition fair value of redeemable noncontrolling interest | — | | | 3,165 | | | |
| Net income (loss) attributable to redeemable noncontrolling interest | 154 | | | (10) | | | |
| Distributions attributable to redeemable noncontrolling interest | (21) | | | — | | | |
| Balance at end of period | $ | 3,288 | | | $ | 3,155 | | | |
Foreign Currency Translation and Transactions- Our wholly-ownedwholly owned Canadian subsidiary has Canadian dollars as its functional currency. Assets and liabilities of this business are translated into U.S. dollars at exchange rates in effect at the balance sheet date or historical rates as appropriate. Each quarter, amounts included in ourthe consolidated statements of operations from this business are translated at the average exchange rate for the period. The cumulative translation adjustments resulting from changes in exchange rates are included in the consolidated balance sheets as a component of accumulated other comprehensive loss.loss on the consolidated balance sheets. Transaction gains and losses are included in non-operating expenses, net, on the consolidated statements of operations.
Deferred Compensation Plans- We provide deferred compensation plans, including defined contribution plans to eligible associates and a non-qualified deferred compensation plan for certain executives and members of the Board of Directors.Board. Participants may elect to defer and contribute a portion of their eligible compensation to the plans up to limits stated in the plan documents, not to exceed the dollar amounts set by applicable laws. During 2021, 20202023, 2022 and 2019,2021, we recognized costs associated with matching contributions of $5.9$6.9 million, $5.3$6.2 million and $5.9 million, respectively.
Variable Interest Entity- During 2022, we dissolved a consolidated variable interest entity joint venture along with related licensing and design and sourcing arrangements, which resulted in recording a termination fee of $5.2 million to operating expenses on the consolidated statements of operations. Assets and liabilities of the joint venture were immaterial.
Recently Issued Accounting Pronouncements- In November 2023, the Financial Accounting Standards Board (the "FASB") issued Accounting Standards Update ("ASU") 2023-07, Improvements to Reportable Segment Disclosures, which updates reportable segment disclosure requirements including, among other things, enhanced disclosures about significant segment expenses and information used to assess segment performance. ASU 2023-07 is effective on a retrospective basis to all prior periods presented beginning with our 2024 Annual Report on Form 10-K and subsequent interim periods. We are currently evaluating the impact of adopting ASU 2023-07 to the notes of the consolidated financial statements.
In December 2023, the FASB issued ASU 2023-09, Improvements to Income Tax Disclosures, which requires a tabular effective tax rate reconciliation, using both percentages and amounts, with specific categories provided as well as information regarding income taxes paid, net of refunds received, disaggregated by federal, state, and foreign. We early adopted ASU 2023-09 on a retrospective basis for this 2023 Annual Report on Form 10-K, as presented in Note 15, Income Taxes.
2. ACQUISITIONS
ACQUISITION OF TOPO
On December 13, 2022, we acquired a 79.4% ownership interest in Topo for $19.3 million in cash. We have an exclusive call option and the noncontrolling interest holders have a put option with respect to our purchase of the remaining 20.6% ownership interest upon the occurrence of certain events or after a period of three years following the close of the transaction. The redemption price is defined in the operating agreement and is based primarily on a fixed multiple of Topo's trailing 12 months of adjusted earnings before interest, taxes, depreciation, amortization, and other agreed upon adjustments.
The final purchase price and the allocation of the total consideration to the fair values of the assets, liabilities, and redeemable noncontrolling interest consisted of the following:
| | | | | | | | | | | | | | | | | |
| (in thousands) | Preliminary Purchase Price and Allocation as of December 13, 2022 | | Measurement Period Adjustments | | Final Purchase Price and Allocation as of April 29, 2023 |
| Purchase price cash consideration | $ | 19,062 | | | $ | 193 | | | $ | 19,255 | |
| Fair value of assets and liabilities acquired: | | | | | |
| Accounts receivables | $ | 3,195 | | | $ | (150) | | | $ | 3,045 | |
| Inventories | 5,612 | | | (20) | | | 5,592 | |
| Goodwill | 3,460 | | | 868 | | | 4,328 | |
| Intangible assets | 12,500 | | | (500) | | | 12,000 | |
| Other assets | 1,898 | | | — | | | 1,898 | |
| Accounts payable and other liabilities | (4,438) | | | (5) | | | (4,443) | |
| Redeemable noncontrolling interest | (3,165) | | | — | | | (3,165) | |
| $ | 19,062 | | | $ | 193 | | | $ | 19,255 | |
The fair value of the intangible assets relates to customer relationships and a tradename, which are amortized over a useful life of 10 and 15 years, respectively, and are based on the excess earnings method under the income approach with the relief from royalty method for the tradename. The fair value measurements are based on significant unobservable inputs, including discounted future cash flows, market-based assumed royalty rates, and customer attrition rates. The fair value measurement of the redeemable noncontrolling interest was calculated by considering the implied fair value of Topo using the purchase price and an estimated amount to redeem the noncontrolling interest. The goodwill represents the excess of the purchase price over the fair value of the net assets acquired and was primarily attributable to acquiring an established design and sourcing process for athletic footwear. Goodwill is expected to be deductible for income tax purposes. During 2022, we incurred $1.3 million of acquisition-related costs in connection with the acquisition of Topo, which were included in operating expenses on the consolidated statements of operations.
ACQUISITION OF KEDS
On February 4, 2023, we acquired Keds, including the Keds brand, inventory, and inventory-related accounts payable, from Wolverine World Wide, Inc. ("Seller"). The cash consideration was funded with available cash and borrowings on the ABL Revolver.
The final purchase price and the allocation of the total consideration to the fair values of the assets and liabilities consisted of the following:
| | | | | | | | | | | | | | | | | |
| (in thousands) | Preliminary Purchase Price and Allocation as of February 4, 2023 | | Measurement Period Adjustments | | Final Purchase Price and Allocation as of February 3, 2024 |
| Purchase price: | | | | | |
| Cash Consideration | $ | 128,400 | | | $ | (1,096) | | | $ | 127,304 | |
| Due from Seller for estimated contingent consideration | (3,500) | | | (5,399) | | | (8,899) | |
| $ | 124,900 | | | $ | (6,495) | | | $ | 118,405 | |
| Fair value of assets and liabilities acquired: | | | | | |
| Inventories | $ | 46,700 | | | $ | (4,184) | | | $ | 42,516 | |
| Goodwill | 36,787 | | | (11,011) | | | 25,776 | |
| Intangible assets | 44,800 | | | 8,700 | | | 53,500 | |
| Accounts payable | (3,387) | | | — | | | (3,387) | |
| $ | 124,900 | | | $ | (6,495) | | | $ | 118,405 | |
The purchase price was subject to adjustments primarily based upon estimated contingent considerations as provided by the purchase agreement, which are based on recognized sales and incurred marketing costs for certain identified aged inventories and may result in the Seller paying us up to $15.0 million by March 2024. We recorded an estimated amount due from Seller at fair value based on our estimated probability of the conditions being met requiring payment. Changes to the estimated amount due from Seller after we have finalized the purchase price and the allocation of the total consideration are recorded to earnings and have been immaterial.
The fair value of inventories, which is made up of finished goods, was determined based on market assumptions for realizing a reasonable profit after selling costs. The fair value of the intangible assets relates to $46.9 million of an indefinite-lived tradename and $6.6 million of customer relationships, which is amortized over a useful life of 10 years, and are based on the excess earnings method under the income approach with the relief from royalty method for the tradename. The fair value measurements are based on significant unobservable inputs, including discounted future cash flows, market-based assumed royalty rates, and customer attrition rates. The goodwill represents the excess of the purchase price over the fair value of the net assets acquired and was primarily attributable to acquiring an established design and sourcing process for casual footwear, including kids' footwear, with international distribution. Goodwill is expected to be deductible for income tax purposes. We incurred $2.9 million of acquisition-related costs in connection with the acquisition of Keds, which was included in operating expenses on the consolidated statements of operations.
COMBINED RESULTS OF ACQUIRED ENTITIES
As of February 3, 2024, the results of operations for Topo and Keds were not material and are included in the consolidated statements of operations within the Brand Portfolio segment. Supplemental pro forma results of operations reflecting the acquisitions are not presented as the impact on our consolidated financial results would not have been material.
DISAGGREGATION OF NET SALES
Net Sales by Brand Categories- The following table presents net sales disaggregated by brand categories for each segment:
| | | | | | | | | | | | | | | | | | | | | | | | | | | | | |
| (in thousands) | U.S. Retail | | Canada Retail(2) | | Brand Portfolio | | Eliminations | | Consolidated |
| 2023 | | | | | | | | | |
Owned Brands:(1) | | | | | | | | | |
| Direct-to-consumer | $ | 471,197 | | | $ | 45,025 | | | $ | 65,724 | | | $ | — | | | $ | 581,946 | |
| External customer wholesale, commission income and other | — | | | — | | | 211,174 | | | — | | | 211,174 | |
| Intersegment wholesale and commission income | — | | | — | | | 72,078 | | | (72,078) | | | — | |
| Total Owned Brands | 471,197 | | | 45,025 | | | 348,976 | | | (72,078) | | | 793,120 | |
| National brands | 2,062,652 | | | 219,204 | | | — | | | — | | | 2,281,856 | |
| Total net sales | $ | 2,533,849 | | | $ | 264,229 | | | $ | 348,976 | | | $ | (72,078) | | | $ | 3,074,976 | |
| 2022 | | | | | | | | | |
Owned Brands:(1) | | | | | | | | | |
| Direct-to-consumer | $ | 569,741 | | | $ | 34,734 | | | $ | 37,840 | | | $ | — | | | $ | 642,315 | |
| External customer wholesale, commission income and other | — | | | — | | | 202,834 | | | — | | | 202,834 | |
| Intersegment wholesale and commission income | — | | | — | | | 87,041 | | | (87,041) | | | — | |
| Total Owned Brands | 569,741 | | | 34,734 | | | 327,715 | | | (87,041) | | | 845,149 | |
| National brands | 2,221,772 | | | 248,507 | | | — | | | — | | | 2,470,279 | |
| Total net sales | $ | 2,791,513 | | | $ | 283,241 | | | $ | 327,715 | | | $ | (87,041) | | | $ | 3,315,428 | |
| 2021 | | | | | | | | | |
Owned Brands:(1) | | | | | | | | | |
| Direct-to-consumer | $ | 421,398 | | | $ | 14,612 | | | $ | 27,876 | | | $ | — | | | $ | 463,886 | |
| External customer wholesale, commission income and other | — | | | — | | | 164,192 | | | — | | | 164,192 | |
| Intersegment wholesale and commission income | — | | | — | | | 93,956 | | | (93,956) | | | — | |
| Total Owned Brands | 421,398 | | | 14,612 | | | 286,024 | | | (93,956) | | | 628,078 | |
| National brands | 2,348,308 | | | 220,197 | | | — | | | — | | | 2,568,505 | |
| Total net sales | $ | 2,769,706 | | | $ | 234,809 | | | $ | 286,024 | | | $ | (93,956) | | | $ | 3,196,583 | |
(1) "Owned Brands" refers to those brands we have rights to sell through ownership or license arrangements. Beginning in the first quarter of 2023, sales of the Keds brand are included in Owned Brands as a result of our acquisition of Keds. Sales of the Keds brand in periods prior to the first quarter of 2023 are not recast as this brand was considered a national brand during those periods.
(2) Beginning with this Form 10-K, we are providing a breakout of Canada Retail segment net sales by brand categories and we have recast 2022 and 2021 on a consistent basis.
Net Sales by Product and Service Categories- The following table presents net sales disaggregated by product and service category
categories for each segment:
| | (in thousands) | (in thousands) | 2021 | | 2020 | | 2019 | (in thousands) | 2023 | | 2022 | | 2021 |
| Net sales: | Net sales: | |
| U.S. Retail segment: | U.S. Retail segment: | |
| U.S. Retail segment: | |
| U.S. Retail segment: | |
| Women's footwear | |
| Women's footwear | |
| Women's footwear | Women's footwear | $ | 1,772,729 | | | $ | 1,161,836 | | | $ | 1,853,265 | |
| Men's footwear | Men's footwear | 620,631 | | | 386,338 | | | 539,917 | |
| Kids' footwear | Kids' footwear | 234,806 | | | 151,121 | | | 158,261 | |
| Accessories and other | Accessories and other | 141,540 | | | 101,028 | | | 193,952 | |
| 2,769,706 | | | 1,800,323 | | | 2,745,395 | |
| 2,533,849 | |
| Canada Retail segment: | Canada Retail segment: | |
| Women's footwear | |
| Women's footwear | |
| Women's footwear | Women's footwear | 117,045 | | | 92,623 | | | 133,762 | |
| Men's footwear | Men's footwear | 60,972 | | | 45,665 | | | 63,140 | |
| Kids' footwear | Kids' footwear | 48,503 | | | 37,233 | | | 40,995 | |
| Accessories and other | Accessories and other | 8,289 | | | 7,138 | | | 11,120 | |
| 234,809 | | | 182,659 | | | 249,017 | |
| 264,229 | |
| Brand Portfolio segment: | Brand Portfolio segment: | |
| Wholesale | Wholesale | 240,491 | | | 197,940 | | | 379,698 | |
| Commission income | 17,657 | | | 18,509 | | | 26,424 | |
| Wholesale | |
| Wholesale | |
| Commission income and other | |
| Direct-to-consumer | Direct-to-consumer | 27,876 | | | 32,197 | | | 42,163 | |
| 286,024 | | | 248,646 | | | 448,285 | |
| Other | — | | | 62,909 | | | 122,090 | |
| 348,976 | |
| Total segment net sales | Total segment net sales | 3,290,539 | | | 2,294,537 | | | 3,564,787 | |
| Elimination of intersegment sales | Elimination of intersegment sales | (93,956) | | | (59,818) | | | (72,100) | |
| Total net sales | Total net sales | $ | 3,196,583 | | | $ | 2,234,719 | | | $ | 3,492,687 | |
DEFERRED REVENUE LIABILITIES
We record deferred revenue liabilities, included in accrued expenses on the consolidated balance sheets, for remaining obligations we have to our customers. The following table presents the changes and total balances for gift cards and loyalty programs:
| | (in thousands) | (in thousands) | 2021 | | 2020 | | 2019 | (in thousands) | 2023 | | 2022 | | 2021 |
| Gift cards: | Gift cards: | |
| Beginning of period | |
| Beginning of period | |
| Beginning of period | Beginning of period | $ | 34,442 | | | $ | 35,461 | | | $ | 34,998 | |
| Gift cards redeemed and breakage recognized to net sales | Gift cards redeemed and breakage recognized to net sales | (75,352) | | | (59,173) | | | (91,000) | |
| Gift cards issued | Gift cards issued | 77,693 | | | 58,154 | | | 91,463 | |
| End of period | End of period | $ | 36,783 | | | $ | 34,442 | | | $ | 35,461 | |
| Loyalty programs: | Loyalty programs: | |
| Beginning of period | Beginning of period | $ | 11,379 | | | $ | 16,138 | | | $ | 16,151 | |
| Beginning of period | |
| Beginning of period | |
| Loyalty certificates redeemed and expired and other adjustments recognized to net sales | Loyalty certificates redeemed and expired and other adjustments recognized to net sales | (30,453) | | | (25,049) | | | (37,311) | |
| Deferred revenue for loyalty points issued | Deferred revenue for loyalty points issued | 34,810 | | | 20,290 | | | 37,298 | |
| End of period | End of period | $ | 15,736 | | | $ | 11,379 | | | $ | 16,138 | |
CUSTOMER RETURNS AND ALLOWANCES
We reduce sales by the amount of actual and remaining expected customer allowances, discountsreturns and returns,allowances, and cost of sales by the amount of merchandise we expect to recover. Customer allowances aremay be provided to our wholesale customers for margin assistance, co-op advertising support, and various other deductions. We estimate the reserves needed for margin assistance by reviewing inventory levels held by retailers, expected markdowns, gross margins realized, and other performance indicators. ProductCustomer returns and other customer deductionsallowances are estimated based on anticipated future returnsactivity using historical experience and trends. Co-op advertising allowances are estimated based ontrends and existing arrangements with customers.
The following table presents the changes and total balances for sales reserves:customer returns and allowances:
| | | | | | | | | | | | | | | | | |
| (in thousands) | 2021 | | 2020 | | 2019 |
| Sales returns allowances: | | | | | |
| Beginning of period | $ | 17,333 | | | $ | 21,408 | | | $ | 17,743 | |
| Net sales reduced for estimated returns | 424,402 | | | 279,923 | | | 448,886 | |
| Actual returns during the period | (423,161) | | | (283,998) | | | (445,221) | |
| End of period | $ | 18,574 | | | $ | 17,333 | | | $ | 21,408 | |
| Customer allowances and discounts reserve: | | | | | |
| Beginning of period | $ | 4,579 | | | $ | 11,528 | | | $ | 13,094 | |
| Acquisition adjustments during measurement period | — | | | — | | | (3,267) | |
| Net sales reduced for estimated allowances and discounts | 8,709 | | | 14,363 | | | 43,733 | |
| Actual allowances and discounts during the period | (11,191) | | | (21,312) | | | (42,032) | |
| End of period | $ | 2,097 | | | $ | 4,579 | | | $ | 11,528 | |
| | | | | | | | | | | | | | | | | |
| (in thousands) | 2023 | | 2022 | | 2021 |
| Beginning of period | $ | 19,337 | | | $ | 20,671 | | | $ | 21,912 | |
| Net sales reduced for estimated returns and allowances | 489,375 | | | 483,418 | | | 433,111 | |
| Actual returns and allowances during the period | (489,143) | | | (484,752) | | | (434,352) | |
| End of period | $ | 19,569 | | | $ | 19,337 | | | $ | 20,671 | |
As of January 29, 2022February 3, 2024 and January 30, 2021,28, 2023, the asset for recovery of merchandise returns was $9.4$10.0 million and $8.4$8.8 million, respectively, and is included in prepaid expenses and other current assets on the consolidated balance sheets.
| | | | | | | | | | | | | | |
3.4. RELATED PARTY TRANSACTIONS |
SCHOTTENSTEIN AFFILIATES
We have transactions with entities owned or controlled by Jay L. Schottenstein, the executive chairman of our Board, of Directors, and members of his family (the "Schottenstein Affiliates"). As of January 29, 2022,February 3, 2024, the Schottenstein Affiliates beneficially owned approximately 19%26% of the Company's outstanding common shares, representing approximately 54%62% of the combined voting power, consisting of, in the aggregate, 6.57.1 million Class A common shares and 7.7 million Class B common shares. The following summarizes the related party transactions with the Schottenstein Affiliates for the relevant periods:
Leases- We lease our fulfillment center and certain store and office locations that are owned by the Schottenstein Affiliates. We also leased a fulfillment center from a Schottenstein Affiliate through September 2022 that was not renewed. See Note 1213, Leases, for rent expense and future minimum lease payment requirements associated with the Schottenstein Affiliates.
Other Purchases and Services- During 2021, 20202023, 2022 and 2019,2021, we had other purchases and services we incurred from the Schottenstein Affiliates of $4.9$2.7 million, $4.8$4.3 million and $6.0$4.9 million, respectively.
Due to Related Parties- Amounts due to the Schottenstein Affiliates, other than operating lease liabilities, were immaterial for all periods presented.
ABG-CAMUTOEQUITY METHOD INVESTMENTS
ABG-Camuto- We have a 40%40.0% ownership interest in our equity investment in ABG-Camuto. We have a licensing agreement with ABG-Camuto, pursuant to which we pay royalties on the net sales of the brands owned by ABG-Camuto, subject to guaranteed minimums. For each fiscal year2023, 2022 and 2021, 2020 and 2019, we recorded royalty expense for amounts paid to ABG-Camuto of $18.1 million, $18.3 million and $18.2 million. See Note 13, Commitments and Contingencies - Contractual Obligations, for future guaranteed minimum royalty payment requirements to ABG-Camuto.million, respectively. Amounts due to ABG-Camuto were immaterial for all periods presented.
Le Tigre- We have a 33.3% ownership interest in Le Tigre. During 2022, we entered into a license agreement with Le Tigre, whereby we pay royalties on our net sales of the Le Tigre brand, subject to guaranteed minimums. The license agreement provides for the exclusive right to design and source Le Tigre branded footwear. Activity with Le Tigre was immaterial for all periods presented.
| | | | | | | | | | | | | | |
4.5. EARNINGS (LOSS) PER SHARE |
Basic earnings (loss) per share is based on net income (loss)attributable to Designer Brands Inc. and the weighted average of Class A and Class B common shares outstanding. Diluted earnings per share reflects the potential dilution of common shares adjusted for outstanding stock options and RSUs calculated using the treasury stock method.
The following is a reconciliation between basic and diluted weighted average shares outstanding, as used in the calculation of earnings (loss) per share:share attributable to Designer Brands Inc.:
| | (in thousands) | (in thousands) | 2021 | | 2020 | | 2019 | (in thousands) | 2023 | | 2022 | | 2021 |
| Weighted average basic shares outstanding | Weighted average basic shares outstanding | 73,024 | | | 72,198 | | | 73,602 | |
| Dilutive effect of stock-based compensation awards | Dilutive effect of stock-based compensation awards | 4,244 | | | — | | | 1,003 | |
| Weighted average diluted shares outstanding | Weighted average diluted shares outstanding | 77,268 | | | 72,198 | | | 74,605 | |
For 2021, 20202023, 2022 and 2019,2021, the number of shares relating to potentially dilutive stock-based compensation awards that were excluded from the computation of diluted earnings (loss) per share due to their anti-dilutive effect was 3.12.6 million, 5.92.9 million and 3.23.1 million, respectively.
| | | | | | | | | | | | | | |
5.6. STOCK-BASED COMPENSATION |
The DSW Inc. 2014 Long-Term Incentive Plan (the "Plan") provides for the issuance of stock-based compensation awards to eligible recipients. The Plan replaced the DSW Inc. 2005 Equity Incentive Plan but did not affect outstanding awards granted under that plan. Eligible recipients include associates, including executive officers, and non-employee directors. The maximum number of shares of Class A common shares underlying awards whichthat may be issued over the term of the Plan cannot exceed 11.0 million shares. As of January 29, 2022, 8.6February 3, 2024, 6.1 million shares of Class A common shares remain available for future stock-based compensation grants under the Plan.
Stock-based During 2023, 2022 and 2021, we recorded stock-based compensation expense consisted of the following:
| | | | | | | | | | | | | | | | | |
| (in thousands) | 2021 | | 2020 | | 2019 |
| Stock options | $ | 643 | | | $ | 1,467 | | | $ | 2,079 | |
| Restricted and director stock units | 23,280 | | | 18,769 | | | 14,980 | |
| $ | 23,923 | | | $ | 20,236 | | | $ | 17,059 | |
STOCK OPTIONS
Stock options were granted with an exercise price per share equal to the fair market value of our Class A common shares on the grant date. Stock options generally vest 20% per year on a cumulative basis and remain exercisable for a period of 10 years from the date of grant. StockAs of February 3, 2024, there were no unvested stock options and stock option activity for the periods presented and unvested options as of January 29, 2022 werewas immaterial.
RESTRICTED STOCK UNITS
Grants of time-based RSUs generally cliff vest after three years, and performance-based RSUs generally cliff vest after three years based upon the achievement of pre-established goals as of the end of the first year of the term. RSUs receive dividend equivalents in the form of additional RSUs, which are subject to the same restrictions and forfeiture provisions as the original award. The grant date fair value of RSUs is based on the closing market price of the Class A common shares on the date of the grant.
The following table summarizes the RSU activity for unvested RSUs for 2021:2023:
| | Time-Based RSUs | | Performance-Based RSUs |
| Time-Based RSUs | | | Time-Based RSUs | | Performance-Based RSUs |
| (shares in thousands) | (shares in thousands) | Number of Shares | | Weighted Average Grant Date Fair Value | | Number of Shares | | Weighted Average Grant Date Fair Value | (shares in thousands) | Number of Shares | | Weighted Average Grant Date Fair Value | | Number of Shares | | Weighted Average Grant Date Fair Value |
| Outstanding - beginning of period | Outstanding - beginning of period | 6,445 | | $ | 9.20 | | | 540 | | | $ | 21.84 | |
| Granted | Granted | 1,161 | | | $ | 15.40 | | | 595 | | | $ | 15.38 | |
| Vested | Vested | (1,165) | | | $ | 13.39 | | | (366) | | | $ | 21.79 | |
| Forfeited | Forfeited | (383) | | | $ | 9.28 | | | (25) | | | $ | 15.38 | |
| Outstanding - end of period | Outstanding - end of period | 6,058 | | | $ | 9.60 | | | 744 | | | $ | 17.39 | |
The total fair value of time-based RSUs that vested during 2023, 2022 and 2021, 2020 and 2019 was $15.1$35.5 million, $6.5$17.0 million and $3.8$15.1 million, respectively. As of January 29, 2022,February 3, 2024, the total compensation cost related to unvested time-based RSUs not yet recognized was $23.3$21.2 million, with a weighted average expense recognition period remaining of 1.71.9 years.
The total fair value of performance-based RSUs that vested during 2023, 2022 and 2021 2020 and 2019 was $7.4$4.6 million, $4.0$3.7 million and $3.9$7.4 million, respectively. As of January 29, 2022,February 3, 2024, the total compensation cost related to unvested performance-based RSUs not yet recognized was approximately $6.5$1.3 million, with a weighted average expense recognition period remaining of 2.1 years.1.0 year.
DIRECTOR STOCK UNITS
We issue stock units to non-employee directors. Stock units are automatically granted to each director on the date of each annual meeting of shareholders based on the closing market price of the Class A common shares. In addition, each director that is eligible to receive compensation for board service may elect to have the cash portion of such compensation paid in the form of stock units. StockDirector stock units granted to directors vest immediately, and directors are given the option to settle their units 30 days after the grant date, at a specified date more than 30 days following the grant date, or defer receipt until completion of board service. StockDirector stock units granted to directors not yet settled, which are not subject to forfeiture, are considered to be outstanding for the purposes of computing basic earnings (loss) per share. As of January 29, 2022,February 3, 2024, we had 0.5 million director stock units not yet settled.
| | | | | | | | | | | | | | |
6.7. SHAREHOLDERS' EQUITY |
SHARES
Our Class A common shares are listed for trading under the ticker symbol "DBI" on the New York Stock Exchange. There is currently no public market for the Company's Class B common shares, but the Class B common shares can be exchanged forconverted into the Company's Class A common shares at the election of the holder on a share for share basis. Holders of Class A common shares are entitled to 1one vote per share and holders of Class B common shares are entitled to 8eight votes per share on matters submitted to shareholders for approval.
The following table provides additional information for our common shares:
| | (in thousands) | (in thousands) | January 29, 2022 | | January 30, 2021 | (in thousands) | February 3, 2024 | | January 28, 2023 |
| Class A | | Class B | | Class A | | Class B |
| Class A | | | Class A | | Class B | | Class A | | Class B |
| Authorized shares | Authorized shares | 250,000 | | | 100,000 | | | 250,000 | | | 100,000 | |
| Issued shares | Issued shares | 87,793 | | | 7,733 | | | 86,835 | | | 7,733 | |
| Outstanding shares | Outstanding shares | 65,624 | | | 7,733 | | | 64,666 | | | 7,733 | |
| Treasury shares | Treasury shares | 22,169 | | | — | | | 22,169 | | | — | |
We have authorized 100 million shares of no par value preferred shares, with no shares issued for any of the periods presented.
On March 14, 2024, the Board declared a quarterly cash dividend payment of $0.05 per share for both Class A and Class B common shares. The dividend will be paid on April 12, 2024 to shareholders of record as of the close of business on March 29, 2024.
SHARE REPURCHASES
On August 17, 2017, the Board of Directors authorized the repurchase of an additional $500$500.0 million of Class A common shares under our share repurchase program, which was added to the $33.5 million remaining from the previous authorization,authorization. On June 8, 2023, we commenced a modified "Dutch Auction" tender offer (the "Tender Offer"), to purchase up to $100.0 million of the Company's Class A common shares. The Tender Offer expired on July 7, 2023 and on July 12, 2023, we repurchased 1.5 million Class A common shares under the Tender Offer at a purchase price of $10.00 per share and at an aggregate cost of $15.1 million, including transaction costs. During with2023, we repurchased an aggregate of 9.7 million Class A common shares, including open market purchases and the 1.5 million Class A common shares purchased under the Tender Offer, at an aggregate cost of $334.9102.2 million, including transaction costs and excise tax. Share repurchases were funded from the proceeds from our Term Loan. As of February 3, 2024, $87.7 million of Class A common shares that remain authorizedremained available for repurchase under the program as of January 29, 2022.share repurchase program. The share repurchase program is subject to the ABL Revolver and Term Loan restrictions and may be suspended, modified, or discontinued at any time, and we have no obligation to repurchase any amount of our Class A common shares under the program. AnyUnder the share repurchasesrepurchase program, shares will be completedrepurchased in the open market at times and in amounts considered appropriate based on price and market conditions.
ACCUMULATED OTHER COMPREHENSIVE LOSS
For 2021, the change in accumulated other comprehensive loss was due to foreign currency translation adjustments as shown in the consolidated statements of shareholders' equity. For 2020 and 2019, changes for the balances of each component of accumulated other comprehensive loss, net of tax, were as follows:
| | | | | | | | | | | | | | | | | |
| (in thousands) | Foreign Currency Translation | | Available-for-Sale Securities | | Total |
| Balance, February 2, 2019 | $ | (2,328) | | | $ | (378) | | | $ | (2,706) | |
| Other comprehensive income (loss) before reclassifications | (340) | | | 609 | | | 269 | |
| Amounts reclassified to non-operating expenses, net | — | | | (58) | | | (58) | |
| Other comprehensive income (loss) | (340) | | | 551 | | | 211 | |
| Balance, February 1, 2020 | (2,668) | | | 173 | | | (2,495) | |
| Other comprehensive income (loss) before reclassifications | (618) | | | 195 | | | (423) | |
| Amounts reclassified to non-operating income, net | — | | | (368) | | | (368) | |
| Other comprehensive loss | (618) | | | (173) | | | (791) | |
| Balance, January 30, 2021 | $ | (3,286) | | | $ | — | | | $ | (3,286) | |
Receivables, net, consisted of the following:
| | (in thousands) | (in thousands) | January 29, 2022 | | January 30, 2021 | (in thousands) | February 3, 2024 | | January 28, 2023 |
| Customer accounts receivables: | Customer accounts receivables: | |
| Serviced by third-party provider with guaranteed payment | $ | 27,827 | | | $ | 29,615 | |
| Serviced by third-party provider without guaranteed payment | 82 | | | 363 | |
| Serviced in-house | 2,783 | | | 4,576 | |
| Receivables with payment guarantee by third-party provider | |
| Receivables with payment guarantee by third-party provider | |
| Receivables with payment guarantee by third-party provider | |
| | Receivables without payment guarantee | |
| Receivables without payment guarantee | |
| Receivables without payment guarantee | |
| Income tax receivable | Income tax receivable | 162,240 | | | 149,824 | |
| Other receivables | Other receivables | 8,026 | | | 12,865 | |
| Total receivables | Total receivables | 200,958 | | | 197,243 | |
| Allowance for doubtful accounts | Allowance for doubtful accounts | (1,132) | | | (1,194) | |
| $ | 199,826 | | | $ | 196,049 | |
| $ | |
The following table presents the activityActivity for the allowance for doubtful accounts:
| | | | | | | | | | | | | | | | | | | | | |
| (in thousands) | 2021 | | 2020 | | 2019 | | | | |
| Allowance for doubtful accounts - beginning of period | $ | (1,194) | | | $ | (1,219) | | | $ | (939) | | | | | |
| Provision for bad debts | (40) | | | (1,041) | | | (1,446) | | | | | |
| | | | | | | | | |
| Recoveries and other adjustments | 102 | | | 1,066 | | | 1,166 | | | | | |
| Allowance for doubtful accounts - end of period | $ | (1,132) | | | $ | (1,194) | | | $ | (1,219) | | | | | |
| | | | | | | | | | | | | | |
8.9. PROPERTY AND EQUIPMENT |
Property and equipment, net, consisted of the following:
| | (dollars in thousands) | (dollars in thousands) | Useful Life (years) | | January 29, 2022 | | January 30, 2021 | (dollars in thousands) | Useful Life (years) | | February 3, 2024 | | January 28, 2023 |
| Land | Land | Indefinite | | $ | 1,110 | | | $ | 1,110 | |
| Buildings | Buildings | 39 | | 12,485 | | | 12,485 | |
| Building and leasehold improvements | Building and leasehold improvements | 3-20 or the lease term if shorter | | 447,158 | | | 446,937 | |
| Furniture, fixtures and equipment | Furniture, fixtures and equipment | 3-15 | | 466,405 | | | 471,586 | |
| Software | Software | 3-5 | | 206,579 | | | 194,064 | |
| Construction in progress | | 17,239 | | | 10,659 | |
| Construction-in-progress | |
| Total property and equipment | Total property and equipment | | 1,150,976 | | | 1,136,841 | |
| Accumulated depreciation and amortization | Accumulated depreciation and amortization | | (894,190) | | | (840,372) | |
| $ | 256,786 | | | $ | 296,469 | |
| | | $ | |
| | | | | | | | | | | | | | |
9.
10. GOODWILL AND INTANGIBLE ASSETS |
GOODWILL
The following table presents the changes to goodwill by segment:
| | (in thousands) | (in thousands) | January 29, 2022 | | January 30, 2021 | (in thousands) | February 3, 2024 | | January 28, 2023 |
| Goodwill | | Accumulated Impairments | | Net | | Goodwill | | Accumulated Impairments | | Net |
| Goodwill | | | Goodwill | | Accumulated Impairments | | Net | | Goodwill | | Accumulated Impairments | | Net |
| Beginning of period by segment: | Beginning of period by segment: | |
| U.S. Retail | |
| U.S. Retail | |
| U.S. Retail | U.S. Retail | $ | 93,655 | | | $ | — | | | $ | 93,655 | | | $ | 93,655 | | | $ | — | | | $ | 93,655 | |
| Canada Retail | Canada Retail | 43,086 | | | (43,086) | | | — | | | 41,610 | | | (41,610) | | | — | |
| Brand Portfolio | Brand Portfolio | 19,989 | | | (19,989) | | | — | | | 19,989 | | | — | | | 19,989 | |
| 156,730 | | | (63,075) | | | 93,655 | | | 155,254 | | | (41,610) | | | 113,644 | |
| 158,461 | |
| Activity by segment: | Activity by segment: | |
| | Canada Retail- | Canada Retail- | |
| Currency translation adjustment | 28 | | | (28) | | | — | | | 1,476 | | | (1,476) | | | — | |
| Brand Portfolio- | |
| Impairment charges | — | | | — | | | — | | | — | | | (19,989) | | | (19,989) | |
| | Canada Retail- | |
| | 28 | | | (28) | | | — | | | 1,476 | | | (21,465) | | | (19,989) | |
| | Canada Retail- | |
| Currency translation adjustment | |
| Currency translation adjustment | |
| Currency translation adjustment | |
| Brand Portfolio: | |
| Purchase price and allocation adjustments for acquisition of Topo | |
| Purchase price and allocation adjustments for acquisition of Topo | |
| Purchase price and allocation adjustments for acquisition of Topo | |
| Acquired Keds goodwill | |
| 26,215 | |
| End of period by segment: | End of period by segment: | |
| U.S. Retail | |
| U.S. Retail | |
| U.S. Retail | U.S. Retail | 93,655 | | | — | | | 93,655 | | | 93,655 | | | — | | | 93,655 | |
| Canada Retail | Canada Retail | 43,114 | | | (43,114) | | | — | | | 43,086 | | | (43,086) | | | — | |
| Brand Portfolio | Brand Portfolio | 19,989 | | | (19,989) | | | — | | | 19,989 | | | (19,989) | | | — | |
| $ | 156,758 | | | $ | (63,103) | | | $ | 93,655 | | | $ | 156,730 | | | $ | (63,075) | | | $ | 93,655 | |
| $ | |
INTANGIBLE ASSETS
Intangible assets, net, consisted of the following:
| | (in thousands) | (in thousands) | January 29, 2022 | | January 30, 2021 | (in thousands) | February 3, 2024 | | January 28, 2023 |
| Cost | | Accumulated Amortization | | Net | | Cost | | Accumulated Amortization | | Net |
| Cost | | | Cost | | Accumulated Amortization | | Net | | Cost | | Accumulated Amortization | | Net |
| Definite-lived customer relationships | Definite-lived customer relationships | $ | 1,409 | | | $ | (1,409) | | | $ | — | | | $ | 2,909 | | | $ | (2,791) | | | $ | 118 | |
| Definite-lived tradename | |
| Indefinite-lived trademarks and tradenames | Indefinite-lived trademarks and tradenames | 15,527 | | | — | | | 15,527 | | | 15,517 | | | — | | | 15,517 | |
| $ | 16,936 | | | $ | (1,409) | | | $ | 15,527 | | | $ | 18,426 | | | $ | (2,791) | | | $ | 15,635 | |
| $ | |
Definite-lived customer relationships and tradenames have a useful life of 10 and 15 years, respectively. During 2023, 2022 and 2021, amortization expense for intangible assets was $1.9 million, $0.4 million and $0.1 million, respectively, included within operating expenses on the consolidated statements of operations. As of February 3, 2024, the estimated future annual amortization expense for the intangible assets is $1.9 million over the next 5 years.
Accrued expenses consisted of the following:
| | (in thousands) | (in thousands) | January 29, 2022 | | January 30, 2021 | (in thousands) | February 3, 2024 | | January 28, 2023 |
| Gift cards | Gift cards | $ | 36,783 | | | $ | 34,442 | |
| Accrued compensation and related expenses | Accrued compensation and related expenses | 41,603 | | | 49,864 | |
| Accrued taxes | Accrued taxes | 28,327 | | | 24,206 | |
| Loyalty programs deferred revenue | Loyalty programs deferred revenue | 15,736 | | | 11,379 | |
| Sales returns allowances | 18,574 | | | 17,333 | |
| Customer allowances and discounts | 2,097 | | | 4,579 | |
| Customer returns and allowances | |
| | Other | Other | 72,692 | | | 58,523 | |
| $ | 215,812 | | | $ | 200,326 | |
| Other | |
| Other | |
| $ | |
Debt consisted of the following:
| | (in thousands) | (in thousands) | January 29, 2022 | | January 30, 2021 | (in thousands) | February 3, 2024 | | January 28, 2023 |
| ABL Revolver | ABL Revolver | $ | — | | | $ | 100,000 | |
| Term Loan | Term Loan | 231,250 | | | 243,750 | |
| Total debt | Total debt | 231,250 | | | 343,750 | |
| Less unamortized Term Loan debt issuance costs | Less unamortized Term Loan debt issuance costs | (5,714) | | | (8,931) | |
| Less current maturities of long-term debt | Less current maturities of long-term debt | — | | | (62,500) | |
| Long-term debt | Long-term debt | $ | 225,536 | | | $ | 272,319 | |
As of January 29, 2022, the total borrowings under the Term Loan were classifiedFebruary 3, 2024, future maturities of debt are as long-term debt since we had the ability and intent to refinance the Term Loan using borrowings from our ABL Revolver, which we classify as long-term debt. See Note 16, Subsequent Event, for additional information.follows:
| | | | | |
| (in thousands) | |
| 2024 | $ | 6,750 | |
| 2025 | 6,750 | |
| 2026 | 6,750 | |
| 2027 | 413,945 | |
| |
| |
| Total | $ | 434,195 | |
ABL REVOLVER
On August 7, 2020,March 30, 2022, we replaced our previous senior unsecuredsecured asset-based revolving credit agreementfacility with theour current ABL Revolver, which was subsequently amended on February 28, 2023 and June 23, 2023. The amended ABL Revolver provides a revolving line of credit of up to $400.0$600.0 million, including a Canadian sub-limit of up to $20.0$60.0 million, a $50.0$75.0 million sub-limit for the issuance of letters of credit, a $40.0$60.0 million sub-limit for swing loanswing-loan advances for U.S. borrowings, and a $2.0$6.0 million sub-limit for swing loanswing-loan advances for Canadian borrowings. In addition, the ABL Revolver includes a first-in last-out term loan ("FILO Term Loan") of up to $30.0 million, which was drawn in full on February 28, 2023. The FILO Term Loan may be repaid in full, but not in part, so long as certain payment conditions are satisfied. Once repaid, no portion of the FILO Term Loan may be reborrowed. Our ABL Revolver matures in August 2025March 2027 and as of January 29, 2022, wasis secured by a first-priority lien on substantially all of our personal property assets, including a first priority lien on credit card receivables and inventoryinventory. The ABL Revolver may be used to provide funds for working capital, capital expenditures, share repurchases, other expenditures, and a second priority lien on personal property assets that constituted first priority collateral forpermitted acquisitions as defined by the Term Loan.credit facility agreement. The amount of credit available is limited to a borrowing base basedformulated on, among other things, a percentage of the book value of eligible inventory and credit card receivables, as reduced by certain reserves. As of January 29, 2022,February 3, 2024, the ABL
Revolverrevolving line of credit (excluding the FILO Term Loan) had a borrowing base of $400.0$437.0 million, with no$271.1 million in outstanding borrowings and $4.9$5.0 million in letters of credit issued, resulting in $395.1$160.9 million available for borrowings.
Borrowings under the revolving line of credit and letters of credit issued under the ABL Revolver accrue interest, at our option, at a rate equal to: (A) a base rate per annum equal to the greatest of (i) the prime rate, (ii) the overnight bank funding rateFed Funds Rate (as defined in the credit facility agreement and subject to a floor of 0%) plus 0.5%, and (iii) Adjusted Term SOFR (as defined in the adjusted one-month London Interbank Offered Rate ("LIBOR") (as defined)credit facility agreement) plus 1.0%; or (B) an adjusted LIBORa one-month, three-month or six-month Adjusted Term SOFR per annum (subject to a floor of 0.75%0%), plus, in each instance, an applicable rate to be determined based on average availability, with anavailability. The FILO Term Loan accrues interest, at our option, at a rate equal to: (A) a fluctuating interest rate per annum equal to the greatest of 3.00% as of January 29, 2022.(i) the prime rate, (ii) the Fed Funds Rate plus 0.5%, or (iii) Adjusted Term SOFR plus 1.0%, plus 2.5%; or (B) Adjusted Term SOFR for the interest period in effect for such borrowing plus 3.5%. Commitment fees are based on the unused portion of the ABL Revolver.Revolver available for borrowings. Interest expense related to the ABL Revolver includes interest on borrowings and letters of credit, with an interest rate of 7.6% as of February 3, 2024, commitment fees, and the amortization of debt issuance costs.
TERM LOAN
On August 7, 2020,June 23, 2023, we also entered into a $250.0the Term Loan and have since borrowed the maximum aggregate amount of $135.0 million Term Loan.during 2023, consisting of $121.5 million in U.S. loans and $13.5 million in Canadian loans (denominated in USD). The Term Loan required minimum quarterly principal payments withmatures at the remaining outstanding balance due in August 2025.earliest of the date the ABL Revolver matures (currently March 2027) or five years from closing of the Term Loan (June 2028). The Term Loan had limited prepayment requirements under certain conditions. The Term Loan wasis collateralized by a first priority lien on substantially all of our personal, and real, property (subject to certain exceptions), including investment property and intellectual property and by a second priority lien on certain other personal property,the assets used as collateral for the ABL revolver, primarily credit card receivables, accounts receivable, and inventory, that constitute first priority collateral for the ABL Revolver.inventory.
Borrowings under the Term Loan accruedbear interest at our option, at a per annum rate equal to: (A) an adjusted three-month SOFR per annum (subject to a floor of 2.0%), plus 7.0%; or if (A) is not available, then (B) a base rate per annum equal to the greater of (i) 3.25%2.0%, (ii) the prime rate, (iii) the overnight bank funding rateFed Funds Rate plus 0.5%, and (iv) the adjusted one-month LIBORAdjusted Term SOFR plus 1.0%,; plus, in each instance, 7.5%; or (B) an adjusted LIBOR per annum (subject to a floor of 1.25%), plus 8.5%6.0%, with an interest rate of 9.75%12.4% (effective interest rate of 11.77%13.8% when including the amortization of debt issuance costs) as of January 29, 2022.February 3, 2024.
DEBT COVENANTS
The ABL Revolver containsrequires us to maintain a minimum availabilityfixed charge coverage ratio covenant where an event of default shall occur ifnot less than 1:1 when availability is less than the greater of $30.0$47.3 million or 10.0% of the maximum creditborrowing amount. The Term Loan included a springing covenant imposing a minimum earnings before interest, taxes, depreciation, and amortization covenant, which arises whenAt any time that liquidity is less than $150.0 million. In addition,$100.0 million, the Term Loan requires a maximum consolidated net leverage ratio as of the last day of each fiscal month, calculated on a trailing twelve-month basis, of (1) 2.25 to 1.00 for any trailing twelve-month period through February 3, 2024, and (2) 2.50 to 1.00 thereafter. Testing of the consolidated net leverage ratio ends after liquidity has been greater than or equal to $100.0 million for a period of 45 consecutive days. The ABL Revolver and the Term Loan eachalso contain customary covenants restricting ourcertain activities, including limitations on theour ability to sell assets, engage in acquisitions, enter into transactions involving related parties, incur additional debt, grant liens on assets, pay dividends or repurchase stock, and make certain other changes. There are specific exceptions to these covenants including, in some cases, upon satisfying specified payment conditions. As of January 29, 2022, we were limited in our ability to pay dividends, repurchase stock, and make certain restricted payments above a maximum of $10.0 million over the term of the Term Loan. Both theconditions based on availability. The ABL Revolver and the Term Loan contain customary events of default, including failure to comply with cross-default provisions.certain financial and other covenants. Upon an event of default that is not cured or waived within the cure periods, in addition to other remedies that may be available to the lenders, theour obligations may be accelerated, outstanding letters of credit may be required to be cash collateralized, and remedies may be exercised against the collateral. As of January 29, 2022,February 3, 2024, we were in compliance with all financial covenants.covenants contained in the ABL Revolver and the Term Loan.
TERMINATION OF PREVIOUS TERM LOAN
On February 8, 2022, we settled in full the $231.3 million principal amount outstanding on that date under our previous senior secured term loan agreement ("Previous Term Loan"). In connection with this settlement, during 2022 we incurred a $12.7 million loss on extinguishment of debt, composed of a $6.9 million prepayment premium and a $5.7 million write-off of unamortized debt issuance costs.
We lease our stores, fulfillmentour distribution center located in New Jersey, and other facilities under operating lease arrangements with unrelated parties and related parties owned by the Schottenstein Affiliates. We pay variable amounts for certain lease and non-lease components, as well as for contingent rent based on sales for certain leases where the sales are in excess of specified levels, and for leases that have certain contingent triggering events that are in effect. We also lease equipment under operating leases. We receive operating sublease income from unrelated third parties for leasing portions or all of certain properties. Operating sublease income and operating expenses for these properties are included in operating expenses in our consolidated statements of operations.
LeaseOperating sublease income and lease expense consisted of the following:
| | (in thousands) | (in thousands) | 2021 | | 2020 | | 2019 | (in thousands) | 2023 | | 2022 | | 2021 |
| Operating sublease income | Operating sublease income | $ | 11,879 | | | $ | 12,219 | | | $ | 9,601 | |
| Operating lease expense: | Operating lease expense: | |
| Lease expense to unrelated parties | Lease expense to unrelated parties | $ | 192,146 | | | $ | 199,729 | | | $ | 213,156 | |
| Lease expense to unrelated parties | |
| Lease expense to unrelated parties | |
| Lease expense to related parties | Lease expense to related parties | 9,273 | | | 9,239 | | | 9,486 | |
| Variable lease expense to unrelated parties | Variable lease expense to unrelated parties | 73,159 | | | 63,881 | | | 53,239 | |
| Variable lease expense to related parties | Variable lease expense to related parties | 1,520 | | | 1,341 | | | 1,283 | |
| $ | 276,098 | | | $ | 274,190 | | | $ | 277,164 | |
| $ | |
Lease term and discount rate for our operating leases were as follows:
| | | | | | | | | | | |
| January 29, 2022 | | January 30, 2021 |
| Other operating lease information: | | | |
| Weighted-average remaining lease term | 5.1 years | | 5.3 years |
| Weighted-average discount rate | 4.0 | % | | 4.0 | % |
As of January 29, 2022, our future fixed minimum lease payments are as follows:
| | | | | | | | | | | | | | | | | |
| (in thousands) | Unrelated Parties | | Related Parties | | Total |
| 2022 | $ | 221,933 | | | $ | 7,118 | | | $ | 229,051 | |
| 2023 | 185,069 | | | 4,573 | | | 189,642 | |
| 2024 | 140,140 | | | 4,139 | | | 144,279 | |
| 2025 | 103,219 | | | 3,919 | | | 107,138 | |
| 2026 | 75,748 | | | 3,596 | | | 79,344 | |
| Future fiscal years thereafter | 130,377 | | | 3,838 | | | 134,215 | |
| 856,486 | | | 27,183 | | | 883,669 | |
| Less discounting impact on operating leases | (85,380) | | | (2,632) | | | (88,012) | |
| Total operating lease liabilities | 771,106 | | | 24,551 | | | 795,657 | |
| Less current operating lease liabilities | (195,944) | | | (6,284) | | | (202,228) | |
| Non-current operating lease liabilities | $ | 575,162 | | | $ | 18,267 | | | $ | 593,429 | |
| | | | | | | | | | | |
| February 3, 2024 | | January 28, 2023 |
| Other operating lease information: | | | |
| Weighted-average remaining lease term | 5.9 years | | 5.7 years |
| Weighted-average discount rate | 4.9 | % | | 4.2 | % |
As of January 29, 2022,February 3, 2024, our future fixed minimum lease payments are as follows:
| | | | | | | | | | | | | | | | | |
| (in thousands) | Unrelated Parties | | Related Parties | | Total |
| 2024 | $ | 186,425 | | | $ | 4,856 | | | $ | 191,281 | |
| 2025 | 179,374 | | | 5,637 | | | 185,011 | |
| 2026 | 148,711 | | | 5,241 | | | 153,952 | |
| 2027 | 120,796 | | | 4,742 | | | 125,538 | |
| 2028 | 84,216 | | | 3,075 | | | 87,291 | |
| Future fiscal years thereafter | 203,883 | | | 6,398 | | | 210,281 | |
| 923,405 | | | 29,949 | | | 953,354 | |
| Less discounting impact on operating leases | (134,879) | | | (5,783) | | | (140,662) | |
| Total operating lease liabilities | 788,526 | | | 24,166 | | | 812,692 | |
| Less current operating lease liabilities | (160,886) | | | (5,645) | | | (166,531) | |
| Non-current operating lease liabilities | $ | 627,640 | | | $ | 18,521 | | | $ | 646,161 | |
As of February 3, 2024, we havehad entered into lease commitments for 1four new store locationlocations, four store relocations, and 3 store relocationsone new distribution center where the leases have not yet commenced, and therefore the lease liabilities have not yet been recorded. We expect the lease commencementcommencements to begin over the next threefive fiscal quarters for these locations, and we will record additional operating lease liabilities of approximately $8.8$31.8 million. As it relates to the new distribution center, we have also entered into lease commitments for the equipment that will be used to operate the distribution center, which are expected to commence over the next five fiscal quarters and we will record additional finance lease liabilities of approximately $33.4 million.
| | | | | | | | | | | | | | |
13.14. COMMITMENTS AND CONTINGENCIES |
LEGAL PROCEEDINGS
We are involved in various legal proceedings that are incidental to the conduct of our business. Although it is not possible to predict with certainty the eventual outcome of any litigation, we believe the amount of any potential liability with respect to current legal proceedings will not be material to the results of operations or financial condition. As additional information becomes available, we will assess any potential liability related to pending litigation and revise the estimates as needed.
During 2020, a third-party vendor experienced a shutdown of services to us that impacted our ability to fulfill orders from customers for a limited period of time. This incident is covered under an insurance policy that provides for reimbursement of lost profits and recognized losses as a result of the outage. During 2020, we recognized an insurance recovery receivable of $3.0 million, recorded as an offset to cost of sales, for recognized losses that we believe are probable of being reimbursed through the insurance policy. Reimbursement for lost profits and any additional recoveries in excess of recognized losses are treated as gain contingencies and will be recognized when realized or realizable. We continue to work with the insurance carrier to reach an agreement on the total amount to be recovered.
GUARANTEES
We provide guarantees for lease obligations that are scheduled to expire in 20232025 for locations that have been leased to third parties. If a third party does not pay the rent or vacates the premise,premises, we may be required to make full rent payments to the landlord. As of January 29, 2022,February 3, 2024, the total future minimum lease payment requirements for these guarantees were approximately $13.7$4.1 million.
CONTRACTUAL OBLIGATIONS
As of January 29, 2022,February 3, 2024, we havehad entered into various noncancelable purchase and service agreements, including agreements with remaining terms in excess of one year and construction commitments for capital items to be purchased for projects that were under construction or for which a lease has been signed. In addition, we have license agreements that allow us to use third-partybrands owned brands,by third parties, including a license agreement with ABG-Camuto (a related party)our equity investments (related parties), that have guaranteed minimum royalty payments.
As of January 29, 2022,February 3, 2024, our noncancelable purchase obligations and future guaranteed minimum royalty payments arewere as follows:
| | (in thousands) | (in thousands) | Noncancelable Purchase Obligations | | Guaranteed Minimum Royalties | (in thousands) | Noncancelable Purchase Obligations | | Guaranteed Minimum Royalties |
| | Unrelated Parties | | Related Party | | Total |
| 2022 | $ | 9,101 | | | $ | 16,309 | | | $ | 18,350 | | | $ | 34,659 | |
| 2023 | 7,306 | | | 15,309 | | | 18,350 | | | 33,659 | |
| | | Unrelated Parties | | | | | Unrelated Parties | | Related Parties | | Total |
| 2024 | 2024 | 2,331 | | | 14,884 | | | 19,650 | | | 34,534 | |
| 2025 | 2025 | 691 | | | 12,184 | | | 19,650 | | | 31,834 | |
| 2026 | 2026 | 691 | | | 12,184 | | | 19,650 | | | 31,834 | |
| Future fiscal years thereafter | 1,266 | | | 50,868 | | | 39,300 | | | 90,168 | |
| 2027 | |
| 2028 | |
| | $ | 21,386 | | | $ | 121,738 | | | $ | 134,950 | | | $ | 256,688 | |
| $ | |
| $ | |
| $ | |
Income (loss) before income taxes consisted of the following:
| | | | | | | | | | | | | | | | | |
| (in thousands) | 2021 | | 2020 | | 2019 |
| Domestic income (loss) | $ | 161,409 | | | $ | (559,120) | | | $ | 111,021 | |
| Foreign income (loss) | 11,616 | | | (49,527) | | | 8,753 | |
| $ | 173,025 | | | $ | (608,647) | | | $ | 119,774 | |
| | | | | | | | | | | | | | | | | |
| (in thousands) | 2023 | | 2022 | | 2021 |
| Domestic income | $ | 19,499 | | | $ | 131,131 | | | $ | 161,409 | |
| Foreign income | 20,698 | | | 28,393 | | | 11,616 | |
| $ | 40,197 | | | $ | 159,524 | | | $ | 173,025 | |
Income tax provision (benefit) consisted of the following:
| | | | | | | | | | | | | | | | | |
| (in thousands) | 2021 | | 2020 | | 2019 |
| Current: | | | | | |
| Federal | $ | 16,696 | | | $ | (151,931) | | | $ | 21,196 | |
| Foreign | 1,774 | | | 1,451 | | | 205 | |
| State and local | 1,061 | | | (3,840) | | | 6,596 | |
| Total current tax expense (benefit) | 19,531 | | | (154,320) | | | 27,997 | |
| Deferred: | | | | | |
| Federal | (555) | | | 23,601 | | | (620) | |
| Foreign | (556) | | | 1,504 | | | (1,241) | |
| State and local | 124 | | | 9,287 | | | (859) | |
| Total deferred tax expense (benefit) | (987) | | | 34,392 | | | (2,720) | |
| Income tax provision (benefit) | $ | 18,544 | | | $ | (119,928) | | | $ | 25,277 | |
| | | | | | | | | | | | | | | | | |
| (in thousands) | 2023 | | 2022 | | 2021 |
| Current: | | | | | |
| Federal | $ | (594) | | | $ | 36,018 | | | $ | 16,696 | |
| State and local | 547 | | | 12,120 | | | 1,061 | |
| Foreign | 1,904 | | | 449 | | | 1,774 | |
| Total current tax expense | 1,857 | | | 48,587 | | | 19,531 | |
| Deferred: | | | | | |
| Federal | 3,766 | | | (29,025) | | | (555) | |
| State and local | 5,362 | | | (10,591) | | | 124 | |
| Foreign | (4) | | | (12,113) | | | (556) | |
| Total deferred tax expense (benefit) | 9,124 | | | (51,729) | | | (987) | |
| Income tax provision (benefit) | $ | 10,981 | | | $ | (3,142) | | | $ | 18,544 | |
The following presents a reconciliation of the income tax provision (benefit) based on the U.S. federal statutory tax rate to the total effective tax provision (benefit):rate:
| | | | | | | | | | | | | | | | | |
| (in thousands) | 2021 | | 2020 | | 2019 |
| Income tax provision (benefit) at federal statutory rate | $ | 36,335 | | | $ | (127,816) | | | $ | 25,152 | |
| State and local taxes, net of federal benefit (provision) | 7,870 | | | (23,678) | | | 4,809 | |
| Foreign tax rate differential | 1,111 | | | (3,000) | | | 546 | |
| | | | | |
| Change in valuation allowance | (29,950) | | | 87,579 | | | (3,949) | |
| Non-deductible compensation | 6,799 | | | 3,617 | | | 344 | |
| CARES Act rate differential | (1,697) | | | (57,894) | | | — | |
| | | | | |
| | | | | |
| Other | (1,924) | | | 1,264 | | | (1,625) | |
| $ | 18,544 | | | $ | (119,928) | | | $ | 25,277 | |
| | | | | | | | | | | | | | | | | | | | | | | | | | | | | | | | | | | |
| (dollars in thousands) | 2023 | | 2022 | | 2021 |
| Amount | | % | | Amount | | % | | Amount | | % |
| U.S. federal tax at statutory rate | $ | 8,441 | | | 21.0 | % | | $ | 33,502 | | | 21.0 | % | | $ | 36,335 | | | 21.0 | % |
State and local income taxes, net of federal income tax effect (1) | (92) | | | (0.2) | | | 242 | | | 0.2 | | | (3,041) | | | (1.8) | |
| Foreign tax effects: | | | | | | | | | | | |
| Statutory tax rate difference between Canada and U.S. | 882 | | | 2.2 | | | 1,162 | | | 0.6 | | | 607 | | | 0.4 | |
| Changes in valuation allowances | — | | | — | | | (19,408) | | | (12.2) | | | (584) | | | (0.3) | |
| Other | 190 | | | 0.5 | | | 419 | | | 0.4 | | | (795) | | | (0.5) | |
| Effects of changes in tax laws or rates enacted in the current period | — | | | — | | | — | | | — | | | (1,697) | | | (1.0) | |
| Changes in valuation allowances | (588) | | | (1.5) | | | (28,870) | | | (18.1) | | | (16,832) | | | (9.7) | |
| Nontaxable or nondeductible items: | | | | | | | | | | | |
| Share-based payment awards | (2,205) | | | (5.5) | | | 1,470 | | | 0.9 | | | 1,268 | | | 0.7 | |
| Limitation on executive compensation | 5,783 | | | 14.4 | | | 4,683 | | | 2.9 | | | 5,531 | | | 3.2 | |
| Federal interest income | (2,474) | | | (6.2) | | | (3,029) | | | (1.9) | | | (502) | | | (0.3) | |
| Other | (258) | | | (0.6) | | | 772 | | | 0.5 | | | (1,383) | | | (0.8) | |
| Changes in unrecognized tax benefits | 1,540 | | | 3.8 | | | 6,045 | | | 3.8 | | | 1,361 | | | 0.8 | |
| Other adjustments | (238) | | | (0.6) | | | (130) | | | (0.1) | | | (1,724) | | | (1.0) | |
| Effective tax rate | $ | 10,981 | | | 27.3 | % | | $ | (3,142) | | | (2.0) | % | | $ | 18,544 | | | 10.7 | % |
(1) State taxes in New York and California made up the majority (greater than 50%) of the tax effect in this category.
See Note 1, Description of Business and Significant Accounting Policies - Impacts of the COVID-19 Pandemic, for discussion of the CARES Act rate differential and the change in valuation allowance.
The tax effects of temporary differences that give rise to significant portions of the deferred tax assets and liabilities are as follows:
| | (in thousands) | (in thousands) | January 29, 2022 | | January 30, 2021 | (in thousands) | February 3, 2024 | | January 28, 2023 |
| Deferred tax assets: | Deferred tax assets: | |
| Operating lease liabilities | Operating lease liabilities | $ | 202,683 | | | $ | 232,910 | |
| Operating lease liabilities | |
| Operating lease liabilities | |
| Net operating losses | Net operating losses | 27,516 | | | 34,917 | |
| | Stock-based compensation | Stock-based compensation | 10,334 | | | 11,782 | |
| Stock-based compensation | |
| Stock-based compensation | |
| Inventories | Inventories | 9,250 | | | 9,103 | |
| Interest | |
| Accrued expenses | Accrued expenses | 4,832 | | | 5,567 | |
| Loyalty programs deferred revenue | Loyalty programs deferred revenue | 3,714 | | | 2,406 | |
| State bonus depreciation | State bonus depreciation | 3,253 | | | 4,654 | |
| Intangible assets | 2,994 | | | 5,031 | |
| | Gift cards | |
| Gift cards | |
| Gift cards | |
| | Other | Other | 2,738 | | | 5,977 | |
| 267,314 | | | 312,347 | |
| Other | |
| Other | |
| 261,982 | |
| Less: valuation allowance | Less: valuation allowance | (70,762) | | | (101,185) | |
| Total deferred tax assets, net of valuation allowance | Total deferred tax assets, net of valuation allowance | 196,552 | | | 211,162 | |
| Deferred tax liabilities: | Deferred tax liabilities: | |
| Operating lease assets | Operating lease assets | (170,421) | | | (187,398) | |
| Operating lease assets | |
| Operating lease assets | |
| Property and equipment | Property and equipment | (26,527) | | | (23,306) | |
| | Other | Other | (3,210) | | | (5,065) | |
| (200,158) | | | (215,769) | |
| Net deferred tax liabilities | $ | (3,606) | | | $ | (4,607) | |
| Other | |
| Other | |
| Total deferred tax liabilities | |
| Net deferred tax assets | |
Net deferred income taxes are reported within the consolidated balance sheets as follows:
| | | | | | | | | | | |
| (in thousands) | January 29, 2022 | | January 30, 2021 |
| Deferred tax assets included in other assets | $ | 356 | | | $ | — | |
| Deferred tax liabilities included in other non-current liabilities | (3,962) | | | (4,607) | |
| $ | (3,606) | | | $ | (4,607) | |
As of January 29, 2022,February 3, 2024, the remaining valuation allowance iswas primarily related to federal, state and foreign deferred tax assets. Additionally, there are $9.1were $12.8 million state, and $14.4$4.4 million foreign, and $0.7 million federal net operating losses, which, if not utilized, a portion of the carryovers will begin to expire in 2025, 2038, and 2038,2036, respectively. During 2020, a valuation allowance was recognized as a reserve on the total deferred tax asset balance and was maintained until the end of 2022. This valuation allowance was the result of losses incurred in 2020 due to the impacts of the coronavirus pandemic that resulted in a three-year cumulative loss position, which was significant objective negative evidence in considering whether deferred tax assets were realizable. During 2022, we released the valuation allowance on the majority of the U.S. and Canada deferred tax assets given the continued realization of income since 2020, being in a three-year cumulative adjusted earnings position, and having projected future income. These factors provided sufficient evidence to conclude that it is more likely than not that the majority of the U.S. and Canada deferred tax assets are realizable.
The following table presents the changes in valuation allowance:
| | (in thousands) | (in thousands) | 2021 | | 2020 | | 2019 | (in thousands) | 2023 | | 2022 | | 2021 |
| Valuation allowance - beginning of period | Valuation allowance - beginning of period | $ | 101,185 | | | $ | 9,472 | | | $ | 14,097 | |
| Additions charged to income tax provision (benefit) | — | | | 87,579 | | | — | |
| | Allowances taken or written off | |
| | Allowances taken or written off | |
| | Allowances taken or written off | Allowances taken or written off | (29,950) | | | — | | | (3,949) | |
| Other adjustments | Other adjustments | (473) | | | 4,134 | | | (676) | |
| Valuation allowance - end of period | Valuation allowance - end of period | $ | 70,762 | | | $ | 101,185 | | | $ | 9,472 | |
We intend to continue to invest all of the earnings of foreign subsidiaries, as well as our capital in these subsidiaries indefinitely outside of the U.S. and we do not expect to incur any significant additional taxes related to such amounts.
Net cash paid (refunds received) for income taxes consisted of the following:
| | | | | | | | | | | | | | | | | |
| (in thousands) | 2023 | | 2022 | | 2021 |
| Federal | $ | 15,500 | | | $ | (83,316) | | | $ | 28,859 | |
| Aggregated state and local jurisdictions | 1,853 | | | 6,629 | | | (907) | |
| Disaggregated state and local jurisdictions: | | | | | |
| California | 941 | | | — | | | — | |
| New York | (2,534) | | | — | | | — | |
| City of Columbus, Ohio | 1,005 | | | — | | | — | |
| Foreign | 307 | | | 555 | | | 467 | |
| Net cash paid (refunds received) for income taxes | $ | 17,072 | | | $ | (76,132) | | | $ | 28,419 | |
The following table presents the changes in gross unrecognized tax benefits:
| | (in thousands) | (in thousands) | 2021 | | 2020 | | 2019 | (in thousands) | 2023 | | 2022 | | 2021 |
| Unrecognized tax benefits - beginning of period | Unrecognized tax benefits - beginning of period | $ | 10,087 | | | $ | 10,764 | | | $ | 11,608 | |
| Additions for tax positions taken in the current year | Additions for tax positions taken in the current year | 1,021 | | | 603 | | | 1,692 | |
| Reductions for tax positions taken in prior years: | |
| Changes in estimates | — | | | — | | | (340) | |
| | Settlements | — | | | (1,280) | | | (2,196) | |
| | Lapses of applicable statues of limitations | |
| | Lapses of applicable statues of limitations | |
| | Lapses of applicable statues of limitations | |
| Settlements of tax positions taken in prior years | |
| Unrecognized tax benefits - end of period | Unrecognized tax benefits - end of period | $ | 11,108 | | | $ | 10,087 | | | $ | 10,764 | |
Of the total unrecognized tax benefits at January 29, 2022, January 30, 2021 and February 1, 2020, approximately $9.5 million, $8.7 million and $9.2 million, respectively, represent the amount of unrecognized tax benefits that, if recognized, would affect the effective tax rate in future periods. While it is expected that the amount of unrecognized tax benefits will change in the next 12 months, any changes are not expected to have a material impact on our financial position, results of operations, or cash flows. We recognize interest and penalties related to unrecognized tax benefits as a component of the income tax provision (benefit). As of February 3, 2024, January 28, 2023 and January 29, 2022, January 30, 2021 and February 1, 2020, interest and penalties were $3.1were $5.6 million, $2.6 $4.7 million and $2.3$3.1 million, respectively.
We are no longer subject to U.S. federal or state income tax examinations for years prior to 2015. We have a federal and three state income tax returns in the process of examination at this time. We estimate the range of possible changes that may result from any future tax examinations to be insignificant at this time.
16. SEGMENT REPORTING
Our three reportable segments, which are also operating segments, are the U.S. Retail segment, the Canada Retail segment, and the Brand Portfolio segment. We have determined that the Chief Operating Decision Maker ("CODM") is our CEO and we have identified such segments based on internal management reporting and responsibilities. The performance of each segment is based primarily on net sales and gross profit. As a result, we do not allocate operating expenses to the segments. Total assets
by segment are not presented in the table below as the CODM does not evaluate, manage, or measure performance of segments using total assets.
The following table provides certain financial data by segment reconciled to the consolidated financial statements:
| | | | | | | | | | | | | | | | | | | | | | | | | | | | | | | | | | | |
| (in thousands) | U.S. Retail | | Canada Retail | | Brand Portfolio | | Other | | Corporate / Eliminations | | Total |
| 2021 | | | | | | | | | | | |
| Net sales: | | | | | | | | | | | |
| External customer sales | $ | 2,769,706 | | | $ | 234,809 | | | $ | 192,068 | | | $ | — | | | $ | — | | | $ | 3,196,583 | |
| Intersegment sales | — | | | — | | | 93,956 | | | — | | | (93,956) | | | — | |
| Total net sales | $ | 2,769,706 | | | $ | 234,809 | | | $ | 286,024 | | | $ | — | | | $ | (93,956) | | | $ | 3,196,583 | |
| Gross profit | $ | 933,555 | | | $ | 76,728 | | | $ | 66,774 | | | $ | — | | | $ | (8,420) | | | $ | 1,068,637 | |
| Income from equity investment | $ | — | | | $ | — | | | $ | 8,986 | | | $ | — | | | $ | — | | | $ | 8,986 | |
| Cash paid for property and equipment | $ | 15,296 | | | $ | 3,225 | | | $ | 630 | | | $ | — | | | $ | 13,879 | | | $ | 33,030 | |
| Depreciation and amortization | $ | 40,693 | | | $ | 7,378 | | | $ | 5,262 | | | $ | — | | | $ | 24,590 | | | $ | 77,923 | |
| 2020 | | | | | | | | | | | |
| Net sales: | | | | | | | | | | | |
| External customer sales | $ | 1,800,323 | | | $ | 182,659 | | | $ | 188,828 | | | $ | 62,909 | | | $ | — | | | $ | 2,234,719 | |
| Intersegment sales | — | | | — | | | 59,818 | | | — | | | (59,818) | | | — | |
| Total net sales | $ | 1,800,323 | | | $ | 182,659 | | | $ | 248,646 | | | $ | 62,909 | | | $ | (59,818) | | | $ | 2,234,719 | |
| Gross profit | $ | 242,786 | | | $ | 28,651 | | | $ | 36,393 | | | $ | 962 | | | $ | 2,449 | | | $ | 311,241 | |
| Income from equity investment | $ | — | | | $ | — | | | $ | 9,329 | | | $ | — | | | $ | — | | | $ | 9,329 | |
| Cash paid for property and equipment | $ | 9,997 | | | $ | 3,420 | | | $ | 1,194 | | | $ | 67 | | | $ | 16,436 | | | $ | 31,114 | |
| Depreciation and amortization | $ | 47,083 | | | $ | 7,817 | | | $ | 5,433 | | | $ | 42 | | | $ | 27,651 | | | $ | 88,026 | |
| | (in thousands) | (in thousands) | U.S. Retail | | Canada Retail | | Brand Portfolio | | Other | | Corporate / Eliminations | | Total | (in thousands) | U.S. Retail | | Canada Retail | | Brand Portfolio | | Corporate / Eliminations | | Consolidated |
| 2019 | |
| 2023 | |
| Net sales: | Net sales: | |
| Net sales: | |
| Net sales: | |
| External customer sales | |
| External customer sales | |
| External customer sales | |
| Intersegment sales | |
| Total net sales | |
| Gross profit | |
| Income from equity investments | |
| Cash paid for property and equipment | |
| Depreciation and amortization | |
| 2022 | |
| Net sales: | |
| Net sales: | |
| Net sales: | |
| External customer sales | |
| External customer sales | |
| External customer sales | |
| Intersegment sales | |
| Total net sales | |
| Gross profit | |
| Income from equity investments | |
| Cash paid for property and equipment | |
| Depreciation and amortization | |
| 2021 | |
| Net sales: | |
| Net sales: | |
| Net sales: | |
| External customer sales | |
| External customer sales | |
| External customer sales | External customer sales | $ | 2,745,395 | | | $ | 249,017 | | | $ | 376,185 | | | $ | 122,090 | | | $ | — | | | $ | 3,492,687 | |
| Intersegment sales | Intersegment sales | — | | | — | | | 72,100 | | | — | | | (72,100) | | | — | |
| Total net sales | Total net sales | $ | 2,745,395 | | | $ | 249,017 | | | $ | 448,285 | | | $ | 122,090 | | | $ | (72,100) | | | $ | 3,492,687 | |
| Gross profit | Gross profit | $ | 786,976 | | | $ | 79,850 | | | $ | 114,170 | | | $ | 26,065 | | | $ | (7,391) | | | $ | 999,670 | |
| Income from equity investment | Income from equity investment | $ | — | | | $ | — | | | $ | 10,149 | | | $ | — | | | $ | — | | | $ | 10,149 | |
| Cash paid for property and equipment | Cash paid for property and equipment | $ | 36,302 | | | $ | 7,600 | | | $ | 3,574 | | | $ | 178 | | | $ | 30,166 | | | $ | 77,820 | |
| Depreciation and amortization | Depreciation and amortization | $ | 47,282 | | | $ | 9,583 | | | $ | 5,644 | | | $ | 372 | | | $ | 23,768 | | | $ | 86,649 | |
The U.S. Retail and Brand Portfolio segments and Other net sales recognized arewere primarily based on sales to customers in the U.S., and the Canada Retail segment net sales recognized arewere based on sales to customers in Canada. Net sales realized from geographic markets outside of the U.S. and Canada havewere collectively been immaterial.
As of January 29, 2022February 3, 2024 and January 30, 2021,28, 2023, long-lived assets, consisting of property and equipment and operating lease assets, included $835.9$879.2 million and $917.5$875.7 million, respectively, in the U.S. and $66.1$61.1 million and $78.9$58.6 million, respectively, in Canada, with only an immaterial amount in other countries.countries. No single customer accountsaccounted for 10% or more of consolidated total net sales. However, the Brand Portfolio segment has fourfive customers that make up approximately 57%40% of its totalsegment net sales, excluding intersegment net sales, and the loss of any or all of these customers could have a material adverse effect on the Brand Portfolio segment.
On February 8, 2022, we settled in full the $231.3 million principal amount outstanding under our Term Loan. In connection with this settlement, we incurred a $12.7 million loss on extinguishment of debt, comprised of a $6.9 million prepayment premium and a $5.7 million write-off of unamortized debt issuance costs, which will be recorded in the first quarter of 2022. The settlement of the Term Loan was made using proceeds from borrowings under the ABL Revolver.
| | | | | | | | | | | | | | |
| ITEM 9. CHANGES IN AND DISAGREEMENTS WITH ACCOUNTANTS ON ACCOUNTING AND FINANCIAL DISCLOSURE |
None.
| | | | | | | | | | | | | | |
| ITEM 9A. CONTROLS AND PROCEDURES |
EVALUATION OF DISCLOSURE CONTROLS AND PROCEDURES
We, under the supervision and with the participation of our management, including our Chief Executive Officer and Chief Financial Officer, performed an evaluation of the effectiveness of our disclosure controls and procedures (as defined in Rules 13a-15(e) and 15d-15(e) under the Securities Exchange Act of 1934, as amended (the "Exchange Act")). Based on that evaluation, our Chief Executive Officer and Chief Financial Officer concluded, as of the end of the period covered by this Form 10-K, that such disclosure controls and procedures were effective.
MANAGEMENT'S REPORT ON INTERNAL CONTROL OVER FINANCIAL REPORTING
Management is responsible for establishing and maintaining adequate internal control over financial reporting for us (as defined in Rules 13a-15(f) and 15d-15(f) under the Exchange Act). Our internal control over financial reporting is designed to provide reasonable assurance regarding the reliability of financial reporting and the preparation of financial statements in accordance with accounting principles generally accepted in the United States of America.U.S. Management assessed the effectiveness of our internal control system as of January 29, 2022.February 3, 2024. In making its assessment, we used the criteria set forth by the Committee of Sponsoring Organizations of the Treadway Commission in Internal Control - Integrated Framework (2013). Based on this assessment, management concluded that our internal control over financial reporting was effective to provide reasonable assurance regarding the reliability of financial reporting.
Deloitte & Touche LLP (PCAOB ID No. 34), our independent registered public accounting firm, has issued an attestation report covering our internal control over financial reporting, as stated in its report which is included herein.
CHANGES IN INTERNAL CONTROL OVER FINANCIAL REPORTING
No change was made in our internal control over financial reporting, as such term is defined in Exchange Act Rules 13a-15(f) and 15d -15(e), during our last fiscal quarter that has materially affected, or is reasonably likely to materially affect, our internal control over financial reporting.
| | | | | | | | | | | | | | |
| ITEM 9B. OTHER INFORMATION |
The information set forth below is included herein, byDuring the three months ended February 3, 2024, none of our option,directors or executive officers adopted or terminated any contract, instruction, or written plan for the purpose of providing disclosure under "Item 1.02 - Termination of a Material Definitive Agreement" of Form 8-K.
On March 15, 2022, we terminated our Equity Distribution Agreement (the "ATM Agreement") with BMO Capital Markets Corp., pursuant to which we were entitled, but not required, to offer and sell up to $100 million of our Class A common shares. The termination was effective March 15, 2022. Aspurchase or sale of the dateCompany’s securities that was intended to satisfy the affirmative defense conditions of the termination, we had not soldRule 10b5-1(c) or any shares under the ATM Agreement. We will not incur any termination penalties as a result“non-Rule 10b5-1 trading arrangement” (as defined in Item 408(c) of this termination.Regulation S-K).
| | | | | | | | | | | | | | |
| ITEM 9C. DISCLOSURES REGARDING FOREIGN JURISDICTIONS THAT PREVENT INSPECTIONS |
Not applicable.
PART III
| | | | | | | | | | | | | | |
| ITEM 10. DIRECTORS, EXECUTIVE OFFICERS AND CORPORATE GOVERNANCE |
The information contained under the captions "INFORMATION ABOUT OUR EXECUTIVE OFFICERS," "PROPOSAL 1- ELECTION OF DIRECTORS" and "OTHER DIRECTOR INFORMATION, BOARD COMMITTEES, AND CORPORATE GOVERNANCE INFORMATION" in our definitiveDefinitive Proxy Statement on Schedule 14A for the 20222024 Annual Meeting of Shareholders, to be filed with the SECSecurities and Exchange Commission pursuant to Regulation 14A promulgated under the Exchange Act (the "Proxy Statement"), is incorporated herein by reference.
| | | | | | | | | | | | | | |
| ITEM 11. EXECUTIVE COMPENSATION |
The information contained under the captions "OTHER DIRECTOR INFORMATION, BOARD COMMITTEES, AND CORPORATE GOVERNANCE INFORMATION," "REPORT OF THE HUMAN CAPITAL AND COMPENSATION COMMITTEE," "COMPENSATION DISCUSSION AND ANALYSIS" and the related tabular disclosure, and "FISCAL YEAR 20212023 DIRECTOR COMPENSATION" in the Proxy Statement is incorporated herein by reference. Notwithstanding the foregoing, the information contained in the Proxy Statement under the caption "REPORT OF THE HUMAN CAPITAL AND COMPENSATION COMMITTEE" shall be deemed furnished, and not filed, in this Form 10-K and shall not be deemed incorporated by reference into any filing we make under the Securities Act of 1933, as amended, or the Exchange Act.
| | | | | | | | | | | | | | |
| ITEM 12. SECURITY OWNERSHIP OF CERTAIN BENEFICIAL OWNERS AND MANAGEMENT AND RELATED STOCKHOLDERS MATTERS |
The information contained under the caption "SECURITY OWNERSHIP OF CERTAIN BENEFICIAL OWNERS AND MANAGEMENT" and "EQUITY COMPENSATION PLAN INFORMATION" in the Proxy Statement is incorporated herein by reference.
| | | | | | | | | | | | | | |
| ITEM 13. CERTAIN RELATIONSHIPS AND RELATED TRANSACTIONS, AND DIRECTOR INDEPENDENCE |
The information contained under the captions "CERTAIN RELATIONSHIPS AND RELATED TRANSACTIONS" and "OTHER DIRECTOR INFORMATION, BOARD COMMITTEES, AND CORPORATE GOVERNANCE INFORMATION" in the Proxy Statement is incorporated herein by reference.
| | | | | | | | | | | | | | |
| ITEM 14. PRINCIPAL ACCOUNTING FEES AND SERVICES |
The information contained under the caption "AUDIT AND OTHER SERVICE FEES" in the Proxy Statement is incorporated herein by reference.
PART IV
| | | | | | | | | | | | | | |
| ITEM 15. EXHIBITS AND FINANCIAL STATEMENTS SCHEDULES |
(a) The following documents are filed as a part of this Form 10-K:
(1) CONSOLIDATED FINANCIAL STATEMENTS
The following consolidated financial statements are included in Part II, Item 8 of this Form 10-K:
•Report of Independent Registered Public Accounting Firm
•Consolidated Statements of Operations for the years ended February 3, 2024, January 28, 2023, and January 29, 2022 January 30, 2021 and February 1, 2020
•Consolidated Statements of Comprehensive Income (Loss) for the years ended February 3, 2024, January 28, 2023, and January 29, 2022 January 30, 2021 and February 1, 2020
•Consolidated Balance Sheets as of January 29, 2022February 3, 2024 and January 30, 202128, 2023
•Consolidated Statements of Shareholders' Equity for the years ended February 3, 2024, January 28, 2023, and January 29, 2022 January 30, 2021 and February 1, 2020
•Consolidated Statements of Cash Flows for the years ended February 3, 2024, January 28, 2023, and January 29, 2022 January 30, 2021 and February 1, 2020
•Notes to the Consolidated Financial Statements
(2) CONSOLIDATED FINANCIAL STATEMENTSTATEMENTS SCHEDULES
Schedules not filed are omitted because of the absence of the conditions under which they are required or because the required information is included in the financial statements or the notes thereto.
(3) and (b) EXHIBITS
| | | | | | | | | | | | | | | | | | | | | | | | | | | | | | | | |
| | | | Incorporated by Reference |
| Exhibit Number | | Exhibit Description | | Form | | File No. | | Date of Filing | | Exhibit Number |
| | Agreement and Plan of Merger, dated February 8, 2011, among DSW Inc., DSW MS LLC, and Retail Ventures, Inc. | | 8-K/A | | 001-32545 | | 2/25/2011 | | 2.1 |
| | Agreement of Purchase and Sale, dated October 31, 2012, among DSW Inc., 4300 East Fifth Avenue LLC, 4300 Venture 34910 LLC, and 4300 Venture 6729 LLC. | | 8-K | | 001-32545 | | 11/1/2012 | | 2.1 |
| | Securities Purchase Agreement, dated as of October 10, 2018, by and among DSW Shoe Warehouse, Inc., ABG-Camuto, LLC, Camuto Group LLC, Camuto Consulting, Inc., Camuto Owners (as defined therein), Clear Thinking Group LLC, in the person of Stuart H. Kessler, solely in its capacity as Sellers' Representative (as defined therein) and Buyer Parents (as defined therein), solely with respect to the Parent Specified Sections. | | 8-K | | 001-32545 | | 10/11/2018 | | 2.1 |
| | Amendment to Securities Purchase Agreement, dated October 10, 2018, by and among DSW Shoe Warehouse, Inc., ABG-Camuto, LLC, Camuto Group LLC, Camuto Consulting, Inc., Camuto Owners (as defined therein), Clear Thinking Group LLC, in the person of Stuart H. Kessler, solely in its capacity as Sellers' Representative (as defined therein) and Buyer Parents (as defined therein), solely with respect to the Parent Specified Sections. | | 10-K | | 001-32545 | | 03/26/2019 | | 2.4.1 |
| | Side Letter to Securities Purchase Agreement, dated January 31, 2019, by and among DSW Shoe Warehouse, Inc., ABG-Camuto, LLC, Camuto Group LLC, Camuto Consulting, Inc., Camuto Owners (as defined therein), Clear Thinking Group LLC, in the person of Stuart H. Kessler, solely in its capacity as Sellers' Representative (as defined therein) and Buyer Parents (as defined therein), solely with respect to the Parent Specified Sections. | | 10-K | | 001-32545 | | 03/26/2019 | | 2.4.2 |
| | Amended and Restated Articles of Incorporation of Designer Brands Inc. dated March 19, 2019. | | 10-K | | 001-32545 | | 03/26/2019 | | 3.1 |
| | Amended and Restated Code of Regulations. | | 10-K | | 001-32545 | | 04/13/2006 | | 3.2 |
| | Specimen Class A Common Shares Certificate. | | 10-Q | | 001-32545 | | 06/4/2019 | | 4.1 |
| | Description of Designer Brands Inc.'s Securities Registered Under Section 12 of the Securities Exchange Act of 1934. | | 10-K | | 001-32545 | | 05/01/2020 | | 4.2 |
| | Corporate Services Agreement, dated June 12, 2002, between Retail Ventures and Schottenstein Stores Corporation. | | 10-Q | | 001-10767 | | 06/18/2002 | | 10.6 |
| | | | | | | | | | | | | | | | | | | | | | | | | | | | | | | | |
| | | | Incorporated by Reference |
| Exhibit Number | | Exhibit Description | | Form | | File No. | | Date of Filing | | Exhibit Number |
| | Amendment to Corporate Services Agreement, dated July 5, 2005, among Retail Ventures, Schottenstein Stores Corporation and Schottenstein Management Company, together with Side Letter Agreement, dated July 5, 2005, among Schottenstein Stores Corporation, Retail Ventures, Inc., Schottenstein Management Company and DSW Inc. related thereto. | | 8-K | | 001-10767 | | 07/11/2005 | | 10.5 |
| | Employment Agreement, dated March 4, 2005, between Deborah L. Ferrée and DSW Inc. | | S-1 | | 333-123289 | | 03/14/2005 | | 10.4 |
| | First Amendment to Employment Agreement, dated December 31, 2007, between Deborah L. Ferrée and DSW Inc. | | 10-K | | 001-32545 | | 4/17/2008 | | 10.2.1 |
| | Second Amendment to Employment Agreement, dated February 12, 2016, between Deborah L. Ferrée and DSW Inc. | | 10-K | | 001-32545 | | 3/24/2016 | | 10.2.2 |
| | DSW Inc. 2014 Long-Term Incentive Plan. | | Schedule 14A | | 001-32545 | | 4/30/2014 | | Appendix C |
| | First Amendment to DSW Inc. 2014 Long-Term Incentive Plan, dated January 31, 2018. | | 10-K | | 001-32545 | | 3/26/2019 | | 10.3.1 |
| | Designer Brands Inc. 2014 Long-Term Incentive Plan (as Amended and Restated). | | S-8 | | 333-239853 | | 7/14/2020 | | 99.1 |
| | Form of Restricted Stock Units Award Agreement for Employees (2020). | | 10-K | | 001-32545 | | 5/1/2020 | | 10.3.2 |
| | Form of Stock Units for Automatic Grants to Non-employee Directors (2020). | | 10-K | | 001-32545 | | 5/1/2020 | | 10.3.3 |
| | Form of Nonqualified Stock Option Award Agreement for Employees (2020). | | 10-K | | 001-32545 | | 5/1/2020 | | 10.3.4 |
| | Form of Performance-Based Restricted Stock Units Award Agreement for Employees (2020). | | 10-K | | 001-32545 | | 5/1/2020 | | 10.3.5 |
| | Form of Restricted Stock Units Award Agreement for Canada Employees (2020). | | 10-K | | 001-32545 | | 5/1/2020 | | 10.3.6 |
| | Form of Performance Share Agreement (2021). | | - | | - | | - | | - |
| | Form of Director Stock Unit Agreement (2021). | | - | | - | | - | | - |
| | Credit Agreement, dated August 25, 2017, among DSW Inc., as the lead borrower, certain of its Canadian subsidiaries that may become borrowers thereunder, Designer Brand Inc.'s domestic subsidiaries as guarantors, the lenders party thereto, and PNC Bank, National Association, as administrative agent for the lenders. | | 8-K | | 001-32545 | | 8/31/2017 | | 10.1 |
| | First Amendment to Credit Agreement, dated as of January 30, 2018, by and among DSW Inc., the guarantors party thereto, the lenders party thereto and PNC Bank, National Association, as administrative agent. | | 10-K | | 001-32545 | | 5/1/2020 | | 10.4.1 |
| | Second Amendment to Credit Agreement, dated as of October 10, 2018, by and among DSW Inc., the guarantors party thereto, the lenders party thereto and PNC Bank, National Association, as administrative agent. | | 8-K | | 001-32545 | | 10/11/2018 | | 10.1 |
| | Third Amendment to Credit Agreement, dated as of March 16, 2020, by and among Designer Brands Inc., the lenders party thereto and PNC Bank, National Association, as administrative agent. | | 10-K | | 001-32545 | | 5/1/2020 | | 10.4.3 |
| | | | | | | | | | | | | | | | | | | | | | | | | | | | | | | | |
| | | | Incorporated by Reference |
| Exhibit Number | | Exhibit Description | | Form | | File No. | | Date of Filing | | Exhibit Number |
| | Fourth Amendment to Credit Agreement, dated as of April 30, 2020, by and among Designer Brands Inc., the guarantors party thereto, the lenders party thereto and PNC Bank, National Association, as administrative agent. | | 10-K | | 001-32545 | | 5/1/2020 | | 10.4.4 |
| | Pledge and Security Agreement, dated April 30, 2020, by and among each of the Grantors referred to therein, in favor of PNC Bank, National Association, in its capacity as administrative and collateral agent for the Secured Parties referred to therein. | | 10-K | | 001-32545 | | 5/1/2020 | | 10.4.5 |
| | Cost Sharing Agreement, dated November 1, 2012, between 4300 East Fifth Avenue LLC and 810 AC LLC, a wholly owned subsidiary of DSW. | | 8-K | | 001-32545 | | 11/2/2012 | | 10.1 |
| | Designer Brands Inc. Cash Incentive Plan. | | - | | - | | - | | - |
| | Form of Indemnification Agreement between Designer Brands Inc. and its officers and directors. | | 10-K | | 001-32545 | | 5/1/2020 | | 10.7 |
| | Management Agreement, dated November 1, 2012, between Schottenstein Property Group, LLC and 810 AC LLC, a wholly owned subsidiary of DSW. | | 8-K | | 001-32545 | | 11/01/2012 | | 10.2 |
| | Master Separation Agreement, dated July 5, 2005, between DSW Inc. and Retail Ventures, Inc. | | 8-K | | 001-10767 | | 7/11/2005 | | 10.1 |
| | Amendment to Master Separation Agreement between DSW Inc. and Retail Ventures, Inc., dated May 26, 2011. | | 8-K | | 001-32545 | | 5/26/2011 | | 10.1 |
| | Amended and Restated Supply Agreement dated May 30, 2006, between DSW Inc. and Stein Mart, Inc. | | 8-K | | 001-32545 | | 6/5/2006 | | 10.1 |
| | First Amendment to Amended and Restated Supply Agreement dated May 30, 2006, between DSW Inc. and Stein Mart, Inc. Entered into August 26, 2008. | | 10-K | | 001-32545 | | 3/23/2018 | | 10.11.1 |
| | Second Amendment to Amended and Restated Supply Agreement dated May 30, 2006, between DSW Inc. and Stein Mart, Inc. Entered into February 23, 2012. | | 10-K | | 001-32545 | | 3/23/2018 | | 10.11.2 |
| | Third Amendment to Amended and Restated Supply Agreement dated May 30, 2006, between DSW Inc. and Stein Mart, Inc. Entered into September 10, 2013. | | 10-K | | 001-32545 | | 3/23/2018 | | 10.11.3 |
| | Fourth Amendment to Amended and Restated Supply Agreement dated May 30, 2006, between DSW Inc. and Stein Mart, Inc. Entered into on July 31, 2014. | | 10-K | | 001-32545 | | 3/23/2018 | | 10.11.4 |
| | Fifth Amendment to Amended and Restated Supply Agreement dated May 30, 2006, between DSW Inc. and Stein Mart, Inc. Entered into on March 14, 2017. | | 10-K | | 001-32545 | | 3/23/2018 | | 10.11.5 |
| | Sixth Amendment to Amended and Restated Supply Agreement dated May 30, 2006, between DSW Inc. and Stein Mart, Inc. Entered into on December 6, 2017. | | 10-K | | 001-32545 | | 3/23/2018 | | 10.11.6 |
| | Seventh Amendment to Amended and Restated Supply Agreement dated May 30, 2006, between Designer Brands Inc. and Stein Mart Inc. Entered into on May 13, 2020. | | 10-Q | | 001-32545 | | 6/19/2020 | | 10.5 |
| | Nonqualified Deferred Compensation Plan. | | 10-Q | | 001-32545 | | 12/13/2007 | | 10.1 |
| | | | | | | | | | | | | | | | | | | | | | | | | | | | | |
| | | Incorporated by Reference |
| Exhibit Number | Exhibit Description | | Form | | File No. | | Date of Filing | | Exhibit Number |
| Agreement and Plan of Merger, dated February 8, 2011, among DSW Inc., DSW MS LLC, and Retail Ventures, Inc. | | 8-K/A | | 001-32545 | | 2/25/2011 | | 2.1 |
| Securities Purchase Agreement, dated October 10, 2018, among DSW Shoe Warehouse, Inc., ABG-Camuto, LLC, Camuto Group LLC, Camuto Consulting, Inc., Camuto Owners (as defined therein), Clear Thinking Group LLC, in the person of Stuart H. Kessler, solely in its capacity as Sellers' Representative (as defined therein) and Buyer Parents (as defined therein), solely with respect to the Parent Specified Sections. | | 8-K | | 001-32545 | | 10/11/2018 | | 2.1 |
| Amendment to Securities Purchase Agreement, dated October 10, 2018, among DSW Shoe Warehouse, Inc., ABG-Camuto, LLC, Camuto Group LLC, Camuto Consulting, Inc., Camuto Owners (as defined therein), Clear Thinking Group LLC, in the person of Stuart H. Kessler, solely in its capacity as Sellers' Representative (as defined therein) and Buyer Parents (as defined therein), solely with respect to the Parent Specified Sections. | | 10-K | | 001-32545 | | 03/26/2019 | | 2.4.1 |
| Side Letter to Securities Purchase Agreement, dated January 31, 2019, among DSW Shoe Warehouse, Inc., ABG-Camuto, LLC, Camuto Group LLC, Camuto Consulting, Inc., Camuto Owners (as defined therein), Clear Thinking Group LLC, in the person of Stuart H. Kessler, solely in its capacity as Sellers' Representative (as defined therein) and Buyer Parents (as defined therein), solely with respect to the Parent Specified Sections. | | 10-K | | 001-32545 | | 03/26/2019 | | 2.4.2 |
| Amended and Restated Articles of Incorporation of Designer Brands Inc. dated March 19, 2019. | | 10-K | | 001-32545 | | 03/26/2019 | | 3.1 |
| Amended and Restated Code of Regulations. | | 10-K | | 001-32545 | | 04/13/2006 | | 3.2 |
| Specimen Class A Common Shares Certificate. | | 10-Q | | 001-32545 | | 06/4/2019 | | 4.1 |
| Description of Designer Brands Inc.'s Securities Registered Under Section 12 of the Securities Exchange Act of 1934. | | 10-K | | 001-32545 | | 5/1/2020 | | 4.2 |
| Corporate Services Agreement, dated June 11, 2002, between Retail Ventures, Inc. and Schottenstein Stores Corporation. | | 10-Q | | 001-10767 | | 06/18/2002 | | 10.6 |
| Amendment to Corporate Services Agreement, dated July 5, 2005, among Retail Ventures, Inc., Schottenstein Stores Corporation and Schottenstein Management Company, together with Side Letter Agreement, dated July 5, 2005, among Schottenstein Stores Corporation, Retail Ventures, Inc., Schottenstein Management Company and DSW Inc. related thereto. | | 8-K | | 001-10767 | | 07/11/2005 | | 10.5 |
| Employment Agreement, dated March 24, 2005, between Deborah Ferrée and DSW Inc. | | S-1 | | 333-123289 | | 03/14/2005 | | 10.4 |
| First Amendment to Employment Agreement, dated December 31, 2007, between Deborah Ferrée and DSW Inc. | | 10-K | | 001-32545 | | 4/17/2008 | | 10.2.1 |
| Second Amendment to Employment Agreement, dated February 12, 2016, between Deborah Ferrée and DSW Inc. | | 10-K | | 001-32545 | | 3/24/2016 | | 10.2.2 |
| | | | | | | | | | | | | | | | | | | | | | | | | | | | | | | | |
| | | | Incorporated by Reference |
| Exhibit Number | | Exhibit Description | | Form | | File No. | | Date of Filing | | Exhibit Number |
| | Agreement of Lease, dated October 1, 2007, between 4300 Venture 34910 LLC, an affiliate of Schottenstein Stores Corporation and eTailDirect LLC re: fulfillment center. | | 8-K | | 001-32545 | | 3/6/2008 | | 10.1 |
| | Lease Amendment to Agreement of Lease, dated September 29, 2009, between 4300 Venture 34910 LLC, an affiliate of Schottenstein Stores Corporation and eTailDirect LLC re: fulfillment center. | | 10-Q | | 001-32545 | | 12/3/2009 | | 10.1 |
| | Second Lease Amendment to Agreement of Lease, dated November 30, 2010, between 4300 Venture 34910 LLC, an affiliate of Schottenstein Stores Corporation and eTailDirect LLC re: fulfillment center. | | 10-K | | 001-32545 | | 3/22/2011 | | 10.56.2 |
| | Third Lease Amendment to Agreement of Lease, dated March 1, 2013, between 4300 Venture 34910 LLC, a Schottenstein Affiliate, and eTailDirect LLC re: fulfillment center. | | 10-Q | | 001-32545 | | 6/7/2013 | | 10.1 |
| | Fourth Lease Amendment to Agreement of Lease, dated December 23, 2016, between 4300 Venture 34910 LLC, an affiliate of Schottenstein Stores Corporation and eTailDirect LLC re: fulfillment center. | | 10-K | | 001-32545 | | 3/26/2019 | | 10.12.4 |
| | Guaranty by DSW Inc. to 4300 Venture 34910 LLC, an affiliate of Schottenstein Stores Corporation re: Lease, dated October 1, 2007 between 4300 Venture 34910 LLC, an affiliate of Schottenstein Stores Corporation and eTailDirect LLC re: new fulfillment center for the business of dsw.com. | | 8-K | | 001-32545 | | 3/6/2008 | | 10.5 |
| | Employment Agreement, dated March 27, 2009, between William L. Jordan and DSW Inc. | | 10-K | | 001-32545 | | 4/1/2009 | | 10.61 |
| | First Amendment to Employment Agreement, dated November 9, 2015, between William L. Jordan and DSW Inc. | | 10-K | | 001-32545 | | 3/24/2016 | | 10.29.1 |
| | Amended and Restated Standard Executive Severance Agreement, dated December 6, 2019, between Designer Brands Inc. and Roger Rawlins. | | 10-Q | | 001-32545 | | 12/10/2019 | | 10.1 |
| | Standard Executive Severance Agreement, dated July 20, 2016, between Jared Poff and DSW Inc. | | 10-Q | | 001-32545 | | 9/1/2016 | | 10.1 |
| | Standard Executive Severance Agreement, dated April 9, 2020, between Mary Turner and Designer Brands Inc. | | 10-K | | 001-32545 | | 5/1/2020 | | 10.21 |
| | Standard Executive Severance Agreement, dated January 30, 2022, between James Weinberg and Designer Brands Inc. | | - | | - | | - | | - |
| | Term Loan Credit Agreement, dated August 7, 2020, among Designers Brands Inc., as the lead borrower, Designer Brands Canada Inc., as the Canadian Borrower, certain of its domestic and Canadian subsidiaries as guarantors, the lenders party thereto, and Sixth Street Specialty Lending, Inc. as Administrative Agent and Lead Arranger. | | 8-K | | 001-32545 | | 8/7/2020 | | 10.1 |
| | | | | | | | | | | | | | | | | | | | | | | | | | | | | |
| | | Incorporated by Reference |
| Exhibit Number | Exhibit Description | | Form | | File No. | | Date of Filing | | Exhibit Number |
| DSW Inc. 2014 Long-Term Incentive Plan. | | Schedule 14A | | 001-32545 | | 4/30/2014 | | Appendix C |
| First Amendment to DSW Inc. 2014 Long-Term Incentive Plan, dated January 31, 2018. | | 10-K | | 001-32545 | | 3/26/2019 | | 10.3.1 |
| Designer Brands Inc. 2014 Long-Term Incentive Plan (as Amended and Restated). | | S-8 | | 333-239853 | | 7/14/2020 | | 99.1 |
| Form of Restricted Stock Units Award Agreement for Employees (2020). | | 10-K | | 001-32545 | | 5/1/2020 | | 10.3.2 |
| Form of Stock Units for Automatic Grants to Non-employee Directors (2020). | | 10-K | | 001-32545 | | 5/1/2020 | | 10.3.3 |
| Form of Nonqualified Stock Option Award Agreement for Employees (2020). | | 10-K | | 001-32545 | | 5/1/2020 | | 10.3.4 |
| Form of Performance-Based Restricted Stock Units Award Agreement for Employees (2020). | | 10-K | | 001-32545 | | 5/1/2020 | | 10.3.5 |
| Form of Restricted Stock Units Award Agreement for Canada Employees (2020). | | 10-K | | 001-32545 | | 5/1/2020 | | 10.3.6 |
| Form of Performance Share Agreement (2021). | | 10-K | | 001-32545 | | 3/16/2023 | | 10.3.8 |
| Form of Director Stock Unit Agreement (2021). | | 10-K | | 001-32545 | | 3/16/2023 | | 10.3.9 |
| Form of Performance Share Agreement (2022). | | — | | — | | — | | — |
| Form of Restricted Stock Units Agreement for Employees (2022). | | — | | — | | — | | — |
| Designer Brands Inc. Cash Incentive Plan. | | 10-K | | 001-32545 | | 3/16/2023 | | 10.4 |
| Form of Indemnification Agreement between Designer Brands Inc. and its officers and directors. | | 10-K | | 001-32545 | | 5/1/2020 | | 10.7 |
| Management Agreement, dated October 30, 2012, between Schottenstein Property Group, LLC and 810 AC LLC, a wholly owned subsidiary of DSW Inc. | | 8-K | | 001-32545 | | 11/1/2012 | | 10.2 |
| Standard Executive Employment Agreement, dated March 27, 2009, between William Jordan and DSW Inc. | | 10-K | | 001-32545 | | 4/1/2009 | | 10.61 |
| First Amendment to Standard Executive Employment Agreement, dated November 9, 2015, between William Jordan and DSW Inc. | | 10-K | | 001-32545 | | 3/24/2016 | | 10.29.1 |
| Amended and Restated Standard Executive Severance Agreement, dated December 6, 2019, between Designer Brands Inc. and Roger Rawlins. | | 10-Q | | 001-32545 | | 12/10/2019 | | 10.1 |
| Standard Executive Severance Agreement, dated July 20, 2016, between Jared Poff and DSW Inc. | | 10-Q | | 001-32545 | | 9/1/2016 | | 10.1 |
| Standard Executive Severance Agreement, dated April 9, 2020, between Mary Turner and Designer Brands Inc. | | 10-K | | 001-32545 | | 5/1/2020 | | 10.21 |
| Standard Executive Severance Agreement, dated January 22, 2022, between James Weinberg and Designer Brands Inc. | | 10-K | | 001-32545 | | 3/16/2023 | | 10.11 |
| Amended and Restated Executive Severance Agreement, dated January 4, 2023, between Douglas M. Howe and Designer Brands Inc. | | 10-Q | | 001-32545 | | 6/8/2023 | | 10.1 |
| Standard Executive Agreement, dated August 4, 2023, between Laura Denk and Designer Brands Inc. | | 10-K | | 001-32545 | | 9/7/2023 | | 10.1 |
| Standard Executive Agreement, dated August 4, 2023, between Andrea O'Donnell and Designer Brands Inc. | | — | | — | | — | | — |
| | | | | | | | | | | | | | | | | | | | | | | | | | | | | |
| | | Incorporated by Reference |
| Exhibit Number | Exhibit Description | | Form | | File No. | | Date of Filing | | Exhibit Number |
| Amended and Restated Nonqualified Deferred Compensation Plan. | | — | | — | | — | | — |
| Transition and Consulting Agreement, dated August 4, 2023, between Roger L. Rawlins and Designer Brands Inc. | | 10-K | | 001-32545 | | 3/16/2023 | | 10.14 |
| Credit Agreement, dated March 30, 2022, among Designer Brands Inc., Designer Brands Canada Inc., certain domestic and Canadian subsidiaries as borrowers, other loan parties thereto, the lenders party thereto, The Huntington National Bank, as Administrative Agent, The Huntington National Bank, Bank of Montreal and Bank of America, N.A., as Joint Bookrunners and Joint Lead Arrangers, and PNC Bank, National Association, as Documentation Agent. | | 8-K | | 001-32545 | | 4/5/2022 | | 10.1 |
| First Amendment to Credit Agreement, dated February 28, 2023, among Designer Brands Inc., Designer Brands Canada Inc., certain domestic and Canadian subsidiaries as borrowers, other loan parties thereto, the lenders party thereto, The Huntington National Bank, as Administrative Agent, The Huntington National Bank, Bank of Montreal and Bank of America, N.A., as Joint Bookrunners and Joint Lead Arrangers, and PNC Bank, National Association, as Documentation Agent. | | 8-K | | 001-32545 | | 3/3/2023 | | 10.1 |
| Joinder and Second Amendment to Credit Agreement, dated June 23, 2023, among Designer Brand Inc., Designer Brands Canada Inc., certain domestic and Canadian subsidiaries as borrowers, other loan parties thereto, the lenders party thereto, The Huntington National Bank, as Administrative Agent, The Huntington National Bank, Bank of Montreal and Bank of America, N.A., as Joint Bookrunners and Joint Lead Arrangers, and PNC Bank, National Association, as Documentation Agent. | | 10-Q | | 001-32545 | | 9/7/2023 | | 10.3 |
| Term Credit Agreement, dated June 23, 2023, among Designer Brands Inc., Designer Brands Canada Inc., certain domestic subsidiaries as guarantors, the lenders party thereto, and PLC Agent LLC, as Administrative Agent and Lead Arranger. | | 8-K | | 001-32545 | | 6/23/2023 | | 10.1 |
| First Amendment to Term Credit Agreement, dated September 21, 2023, among Designer Brands Inc., Designer Brands Canada Inc., certain domestic subsidiaries as guarantors, the lenders party thereto, and PLC Agent LLC, as Administrative Agent and Lead Arranger. | | 10-Q | | 001-32545 | | 12/5/2023 | | 10.1 |
| List of Subsidiaries. | | - | | - | | - | | - |
| Consent of Independent Registered Public Accounting Firm. | | - | | - | | - | | - |
| Powers of Attorney. | | - | | - | | - | | - |
| Rule 13a-14(a)/15d-14(a) Certification - Principal Executive Officer. | | - | | - | | - | | - |
| Rule 13a-14(a)/15d-14(a) Certification - Principal Financial Officer. | | - | | - | | - | | - |
| | | | | | | | | | | | | | | | | | | | | | | | | | | | | | | | |
| | | | Incorporated by Reference |
| Exhibit Number | | Exhibit Description | | Form | | File No. | | Date of Filing | | Exhibit Number |
| | ABL Credit Agreement, dated August 7, 2020, among Designer Brands Inc., as the lead borrower, Designer Brands Canada Inc., as the Canadian Borrower, certain of its domestic and Canadian subsidiaries that may become borrowers thereunder, the Designer Brand Inc.'s domestic and Canadian subsidiaries as guarantors, the lenders party thereto, and PNC Bank, National Association as administrative agent of the lenders. | | 8-K | | 001-32545 | | 8/7/2020 | | 10.2 |
| | List of Subsidiaries. | | - | | - | | - | | - |
| | Consent of Independent Registered Public Accounting Firm. | | - | | - | | - | | - |
| | Powers of Attorney. | | - | | - | | - | | - |
| | Rule 13a-14(a)/15d-14(a) Certification - Principal Executive Officer. | | - | | - | | - | | - |
| | Rule 13a-14(a)/15d-14(a) Certification - Principal Financial Officer. | | - | | - | | - | | - |
| | Section 1350 Certification - Principal Executive Officer. | | - | | - | | - | | - |
| | Section 1350 Certification - Principal Financial Officer. | | - | | - | | - | | - |
| Policy Relating to Recover of Erroneously Awarded Compensation | | - | | - | | - | | - |
| 101* | | The following materials from the Designer Brands Inc. Annual Report on Form 10-K for the year ended January 29, 2022,February 3, 2024, formatted in iXBRL (Inline eXtensible Business Reporting Language): (i) Consolidated Statements of Operations; (ii) Consolidated Statements of Comprehensive Income (Loss);Income; (iii) Consolidated Balance Sheets; (iv) Consolidated Statements of Shareholders' Equity; (v) Consolidated Statements of Cash Flows; and (vi) Notes to Consolidated Financial Statements. | | - | | - | | - | | - |
| 104* | | Cover Page Interactive Data File, formatted in iXBRL and contained in Exhibit 101. | | - | | - | | - | | - |
* Filed herewith
** Furnished herewith
# Management contract or compensatory plan or arrangement
(c) Additional Financial Statement Schedules
None.
| | | | | | | | | | | | | | |
| ITEM 16. FORM 10-K SUMMARY |
None.
SIGNATURES
Pursuant to the requirements of Section 13 or 15(d) of the Exchange Act, the Registrant has duly caused this report to be signed on its behalf by the undersigned, thereunto duly authorized.
| | | | | | | | |
| DESIGNER BRANDS INC. |
| | |
March 21, 202225, 2024 | By: | /s/ Jared A. Poff |
| | Jared A. Poff,
Executive Vice President, Chief Financial Officer and Chief FinancialAdministrative Officer |
Pursuant to the requirements of the Exchange Act, this report has been signed by the following persons in the capacities and on the dates indicated.
| | | | | | | | | | | | | | |
| Signature | | Title | | Date |
| | | | |
/s/ Roger RawlinsDouglas M. Howe | | Chief Executive Officer and Director | | March 21, 202225, 2024 |
Roger RawlinsDouglas M. Howe | | (Principal Executive Officer) | | |
| | | | |
| /s/ Jared A. Poff | | Executive Vice President, and Chief Financial Officer and Chief Administrative Officer | | March 21, 202225, 2024 |
| Jared A. Poff | | (Principal Financial Officer) | | |
| | | | |
| /s/ Mark Haley | | Senior Vice President and Controller | | March 21, 202225, 2024 |
| Mark Haley | | (Principal Accounting Officer) | | |
| | | | |
| * | | Executive Chairman of the Board and Director | | March 21, 202225, 2024 |
| Jay L. Schottenstein | | | | |
| | | | |
| * | | Director | | March 21, 202225, 2024 |
| Peter S. Cobb | | | | |
| | | | |
| * | | Director | | March 21, 2022 |
Joanne Zaiac | | | | |
| | | | |
* | | Director | | March 21, 202225, 2024 |
| Elaine J. Eisenman | | | | |
| | | | |
| * | | Director | | March 21, 202225, 2024 |
| Tami J. Fersko | | | | |
| | | | |
| * | | Director | | March 25, 2024 |
| Joanna T. Lau | | | | |
| | | | |
| * | | Director | | March 21, 202225, 2024 |
| Richard A. Paul | | | | |
| | | | |
| * | | Director | | March 25, 2024 |
| Joseph A. Schottenstein | | | | |
| | | | |
| * | | Director | | March 21, 202225, 2024 |
| Harvey L. Sonnenberg | | | | |
| | | | |
| * | | Director | | March 21, 202225, 2024 |
| Allan J. Tanenbaum | | | | |
| | | | |
| * | | Director | | March 21, 202225, 2024 |
Ekta Singh-BushellJoanne Zaiac | | | | |
| | | | | |
| *By: | /s/ Jared A. Poff |
| Jared A. Poff (Attorney-in-fact) |