UNITED STATES
SECURITIES AND EXCHANGE COMMISSION
Washington, D.C. 20549
FORM 10-K
(Mark one)
| | | | | |
| ☒ | ANNUAL REPORT PURSUANT TO SECTION 13 OR 15(d) OF THE SECURITIES EXCHANGE ACT OF 1934 |
For the fiscal year ended December 31, 20202023
OR
| | | | | |
| ☐ | TRANSITION REPORT PURSUANT TO SECTION 13 OR 15(d) OF THE SECURITIES EXCHANGE ACT OF 1934 |
For the transition period from to
Commission file number 001-36127
COOPER-STANDARD HOLDINGS INC.
(Exact name of registrant as specified in its charter)
| | | | | | | | |
| Delaware | | 20-1945088 |
(State or other jurisdiction of
| | (I.R.S. Employer
|
40300 Traditions Drive
Northville, Michigan 48168
(Address of principal executive offices) (Zip Code)Code)
Registrant’s telephone number, including area code: (248) 596-5900
Securities registered pursuant to Section 12(b) of the Act:
| | | | | | | | | | | | | | |
Title of Each Classeach class | | Trading Symbol(s) | | Name of Exchangeeach exchange on Which Registeredwhich registered |
| Common Stock, par value $0.001 per share | | CPS | | New York Stock Exchange |
| Preferred Stock Purchase Rights | | - | | New York Stock Exchange |
Securities registered pursuant to Section 12(g) of the Act: None
IndicateIndicate by check mark if the registrant is a well-known seasoned issuer, as defined in Rule 405 of the Securities Act. Yes ☒☐ No ☐☒
Indicate by check mark if the registrant is not required to file reports pursuant to Section 13 or Section 15(d) of the Act. Yes ☐ No ☒
Indicate by check mark whether the registrant (1) has filed all reports required to be filed by Section 13 or 15(d) of the Securities Exchange Act of 1934 during the preceding 12 months (or for such shorter period that the registrant was required to file such reports), and (2) has been subject to such filing requirements for the past 90 days. Yes ☒ No ☐
Indicate by check mark whether the registrant has submitted electronically every Interactive Data File required to be submitted pursuant to Rule 405 of Regulation S-T (§232.405 of this chapter) during the preceding 12 months (or for such shorter period that the registrant was required to submit such files). Yes ☒ No ☐
Indicate by check mark whether the registrant is a large accelerated filer, an accelerated filer, a non-accelerated filer, a smaller reporting company, or an emerging growth company. See the definitions of “large accelerated filer,” “accelerated filer,” “smaller reporting company,” and “emerging growth company” in Rule 12b-2 of the Exchange Act.
| | | | | | | | | | | |
| Large accelerated filer | ☐ | Accelerated filer | ☒ |
| Non-accelerated filer | ☐ | Smaller reporting company | ☒ |
| | Emerging growth company | ☐ |
If an emerging growth company, indicate by check mark if the registrant has elected not to use the extended transition period for complying with any new or revised financial accounting standards provided pursuant to Section 13(a) of the Exchange Act. ☐
Indicate by check mark whether the registrant has filed a report on and attestation to its management's assessment of the effectiveness of its internal control over financial reporting under Section 404(b) of the Sarbanes-Oxley Act (15 U.S.C. 7262(b)) by the registered public accounting firm that prepared or issued its audit report. ☒
If securities are registered pursuant to Section 12(b) of the Act, indicate by check mark whether the financial statements of the registrant included in the filing reflect the correction of an error to previously issued financial statements. ☐
Indicate by check mark whether any of those error corrections are restatements that required a recovery analysis of incentive-based compensation received by any of the registrant’s executive officers during the relevant recovery period pursuant to §240.10D-1(b). ☐
Indicate by check mark whether the registrant is a shell company (as defined in Rule 12b-2 of the Exchange Act). Yes ☐ No ☒
The aggregate market value of voting and non-voting common stock held by non-affiliates as of June 30, 20202023 was $187,153,693.$192,207,617.
The number of the registrant’s shares of common stock, $0.001 par value per share, outstanding as of February 10, 20219, 2024 was 16,897,08517,197,479 shares.
Documents Incorporated by Reference
Certain portions, as expressly described in this report, of the Registrant’s Proxy Statement for the 20212024 Annual Meeting of Stockholders are incorporated by reference into Part III of this Annual Report on Form 10-K.
TABLE OF CONTENTS
| | | | | | | | |
| | | Page |
| PART I |
| | |
| Item 1. | Business | |
| Item 1A. | Risk Factors | |
| Item 1B. | Unresolved Staff Comments | |
| Item 1C. | Cybersecurity | |
| Item 2. | Properties | |
| Item 3. | Legal Proceedings | |
| Item 4. | Mine Safety Disclosures | |
|
| PART II |
| Item 5. | Market for Registrant’s Common Equity, Related Stockholder Matters and Issuer Purchases of Equity Securities | |
| Item 6. | Selected Financial Data[Reserved] | |
| Item 7. | Management’s Discussion and Analysis of Financial Condition and Results of Operations | |
| Item 7A. | Quantitative and Qualitative Disclosures About Market Risk | |
| Item 8. | Financial Statements and Supplementary Data | |
| Item 9. | Changes in and Disagreements with Accountants on Accounting and Financial Disclosure | |
| Item 9A. | Controls and Procedures | |
| Item 9B. | Other Information | |
| Item 9C. | Disclosure Regarding Foreign Jurisdictions that Prevent Inspections | |
|
| PART III |
| Item 10. | Directors, Executive Officers and Corporate Governance | |
| Item 11. | Executive Compensation | |
| Item 12. | Security Ownership of Certain Beneficial Owners and Management and Related Stockholder Matters | |
| Item 13. | Certain Relationships and Related Transactions, and Director Independence | |
| Item 14. | Principal Accounting Fees and Services | |
|
| PART IV |
| Item 15. | Exhibits and Financial Statement Schedules | |
| Signatures | |
PART I
Item 1. Business
Cooper-Standard Holdings Inc. (together with its consolidated subsidiaries, the “Company,” “Cooper Standard,” “we,” “our” or “us”) is a leading manufacturer of sealing and fluid handling systems (consisting of fuel and brake delivery and fluid transfer systems.systems). Our products are primarily for use in passenger vehicles and light trucks that are manufactured by global automotive original equipment manufacturers (“OEMs”) and replacement markets. We conduct substantially all of our activities through our subsidiaries.
Cooper Standard is listed on the New York Stock Exchange (“NYSE”) under the ticker symbol “CPS.” The Company has approximately 25,00023,000 employees, including 3,1003,000 contingent workers, with 121128 facilities in 21 countries. We believe that we are the largest global producer of sealing systems, the second largest global producer of the types of fuel and brake delivery products that we manufacture and the third largest global producer of the types of fluid transfer systems.systems that we manufacture. We design and manufacture our products in each major region of the world through a disciplined and sustained approach to engineering and operational excellence. We operate in 7278 manufacturing locations and 4950 design, engineering, administrative and logistics locations.
On January 1, 2020, we changedApproximately 84% of our sales in 2023 were to OEMs, including Ford Motor Company (“Ford”), General Motors Company (“GM”), Stellantis, Volkswagen Group, Daimler, Renault-Nissan, BMW, Toyota, Volvo, Jaguar/Land Rover, Honda and various other OEMs based in China. The remaining 16% of our 2023 sales were primarily to Tier I and Tier II automotive suppliers, non-automotive customers, and replacement market distributors. The Company’s products can be found on over 440 nameplates globally.
Our organizational structure and createdprimarily consists of a global automotive business (“Automotive”) and Advanced Technologythe Industrial and Specialty Group (“ATG”ISG”). OurFor the periods presented herein, our business is nowwas organized in the following reportable segments: North America, Europe, Asia Pacific and South America. ATGISG and all other business activities arewere reported in Corporate, eliminations and other. This operating structure allowsallowed us to offer our full portfolio of products and support our global and regional customers with complete engineering and manufacturing expertise in all major regions of the world. We haveOn an ongoing basis, we undertake restructuring, expansion and cost reduction initiatives to improve competitiveness.
Approximately 83%Consistent with our strategy to drive future profitable growth, the Company has increased and intensified management focus on its two global automotive product line businesses. Effective January 1, 2024, the Company appointed a senior executive to lead each of our salessealing and fluid handling systems businesses, and the chief operating decision maker will prospectively begin to assess operating performance by product line rather than geography. As a result, beginning with the first quarter of 2024, the Company expects to report its financial results in 2020 were to OEMs, including Ford Motor Company (“Ford”), General Motors Company (“GM”), Fiat Chrysler Automobiles (“FCA”), PSA Peugeot Citroën, Volkswagen Group, Daimler, Renault-Nissan, BMW, Toyota, Volvo, Jaguar/Land Rover, Hondatwo reportable segments based on product line: Sealing Systems and various other OEMs based in China. The remaining 17% of our 2020 sales were primarily to Tier I and Tier II automotive suppliers, non-automotive customers, and replacement market distributors. The Company’s products can be found on over 500 nameplates globally.Fluid Handling Systems.
Corporate History and Business Developments
Cooper-Standard Holdings Inc. was established in 2004 as a Delaware corporation and began operating on December 23, 2004 when it acquired the automotive segment of Cooper Tire & Rubber Company. Cooper-Standard Holdings Inc. operates the business primarily through its principal operating subsidiary, Cooper-Standard Automotive Inc. (“CSA U.S.”). Since the 2004 acquisition, the Company has expanded and diversified its customer base through a combination of organic growth and strategic acquisitions.
In 2018, we established ATG, which incorporated our IndustrialOur ISG business accelerates and Specialty Group, to accelerate and maximizemaximizes the value stream of Cooper Standard’s materials science technologyand manufacturing expertise in industrial and specialty markets. We furthered the expansion of our Industrial and Specialty GroupISG business through the acquisition of Lauren Manufacturing and Lauren Plastics andin 2018.
Cooper Standard signed multiple joint development agreements for our Fortrex™ chemistry platform throughout 2018 to 2020.2021. In 2021, the Company reached a long-term commercial agreement to license its Fortrex™ technology to NIKE, Inc., with the footwear manufacturer launching the first related mass production programs in 2023.
In 2019,2023, we finalized the divestiture of our anti-vibration systemsEuropean technical rubber products business (“AVS”) product line within our North America, Europe and sold the Company’s entire controlling equity interest in a joint venture in the Asia Pacific segments. In 2020, we completed the divestiture of our European rubber fluid transfer and specialty sealing businesses, as well as our Indian operations.region.
We have set a clear vision for achieving profitable growth with a defined, focused plan to return to double-digit return on invested capital (“ROIC”). Our visionCooper Standard’s Purpose statement - Driving Value Through Culture, Innovation and ResultsCreating Sustainable Solutions Together - represents the evolutionCompany’s focus on creating solutions for the long-term health of the Company’s innovation culture providingbusiness as a whole and the basis for delivering even greater value.sustained value that we work each day to deliver to our stakeholders (customers, investors, employees, suppliers and communities). Our key strategic pillarsimperatives are defined as:
| | | | | |
| Financial Strength: | | | | | Execute our business plans achieving and sustaining double-digit EBITDA margins, ROIC and strong free cash flow generation. |
| Voice of the Customer: | We design and develop our products to meet the current and future needs of our customers. We listen intently and adjust to customer feedback to ensure we are consistently providing customer-focused products to meet their evolving needs. Customers support and trust us.
| |
Superior Products: | With a focus on our core products, we provide customers with market-leading solutions with predicable quality that meet or exceed their expectations. |
| |
World-Class Operations:Execution: | Attain world-class results across all our business allowing the Company to Be the First Choice of the Stakeholders We are committed to driving sustained excellence through the Cooper Standard Operating System (“CSOS”), our customized set of global best business practices. It is how we will continue to optimize performance on a global scale.Serve. |
| |
| Profitable Growth Driven by Innovation: | Leverage our materials science and product knowledge, innovation and manufacturing expertise across our product groups in the pursuit of organic and inorganic growth. |
| |
Engaged Employees:Corporate Responsibility: | Our employees areDeliver value to all our stakeholders through our environmental, social and governance initiatives to ensure the foundationlong-term sustainability of the Company and the key factor to our success. Committed to excellence and driven to succeed, our employees are focused on the Company’s overall vision and strategy.Company. |
Cooper Standard’s global alignment around these strategic pillarsimperatives continues to drive further value in many areas of the business, including:business.
Operational and Strategic Initiatives
As part of Cooper Standard’s world-class operations, the Company implementedrelies upon its CSOS (Cooper Standard Operating System) to fully position the Company for growth and ensure global consistency in engineering design, program management, manufacturing process, purchasing and IT systems. Standardization across all regions is especially critical in support of customers’ global platforms that require the same design, quality and delivery standards everywhere across the world. Cooper Standard operates Global Councils focused on technology, customer and manufacturing initiatives to better leverage the scale of the Company, identify best practices and transfer them around the world. As a result of these initiatives, the Company has leveraged CSOS to drive an average savings from improved operating efficiency of approximately $75$60 million each of the past five years.
In addition, as part of our continued focus on sustainability and corporate responsibility, the Company’s Global Sustainability Council provides executive level oversight for the Company’s sustainability strategy to help ensure alignment and integration with business goals and stakeholder priorities. The council maintains a holistic look at the Company’s ESG (environmental, social and governance) initiatives, tracks rapidly-evolving best practices and further develops long-term goals as the Company strives for ESG excellence.
Cooper Standard continues to progress its diversification strategy through its Advanced Technology GroupISG business, which is charged with accelerating and maximizing expertise in the Company’s core processproduct types for applications in the industrial and specialty markets. This businessCooper Standard also drives growth and diversification through the Company’s applied materials science offerings, which include the Fortrex™ chemistry platform that provides performance advantages over many other materials.materials, as well as a significantly reduced carbon footprint.
Leveraging Technology and Materials Science for Innovative Solutions
We use our technical and materials science expertise to provide customers with innovative and sustainable product solutions. Our engineers use the results of advanced computational simulations and incorporate a broad understanding of materials science to design products which meet or exceed our customers’ stringent requirements. We believe our reputation for successful innovation in product design and materials is the reason our customers consult us early in the development and design process of their next-generation vehicles or products.
The Company’s CS Open Innovation is an initiative that aims to position Cooper Standard as the partner of choice for start-ups, universities and other suppliers through a proactive outreach program. The initiative is focused in the areas of materials science, manufacturing and process technology, digital/artificial intelligence and advanced product technology.
In addition, the Company has recently implemented a defined, focused plan to return to double-digit ROIC to help deliver sustained value for all of our stakeholders.
Leverage Technology and Materials Science for Innovative Solutions
We utilize our technical and materials science expertise to provide customers with innovative solutions. Our engineers combine product design with a broad understanding of materials science for enhanced vehicle performance. We believe our reputation for successful innovation in product design and materials is the reason our customers consult us early in their vehicle development and design process of their next generation vehicles.
Cooper Standard utilizesuses its i3 Innovation Process (Imagine, Initiate and Innovate) and CS Open Innovation as mechanisms to capture novel ideas while promoting a culture of innovation. Ideas are carefully evaluated by our global technology council,product line teams and Global Technology Council, and those that are selected are put on an accelerated development cycle. We are developing innovative technologies based on materials expertise, process know-how, and application vision, which may drive future product direction. An example is Fortrex™, the
Company’s synthetic elastomer chemistry platform, offersoffering reduced weight while delivering superior material performance and aesthetics. We have also developed several other significant technologies,
especially related to advanced materials, processing and weight reduction. These include: FlushSeal™, an advanced integrated solution for frame under glass static sealing systems offering better appearance, improved aerodynamics, quieter ride and reduced weight; TPV body seal, a next generation body seal that replaces traditionally less sustainable EPDM and metal with recyclable thermoplastic materials which save significant component weight; MagAlloy™, a processing technology for brake lines that increases long term durability through superior corrosion resistanceresistance; and Easy-Lock™, a small package coolant and fuel vapor quick connect. Given the trajectory and anticipated future growth of electric vehicles, Cooper Standard has developed innovations to provide lightweight plastic tubing with our PC2000PlastiCool® 2000 multilayer tubing, smooth and CVT mid temperatureclear vinyl tubing (“CVT”) mid-temperature multilayer tubing, and our next generation ErgoLock™next-generation Ergo-Lock™ and Ergo-Lock™ + VDA quick connectors for glycol thermal management needs.
Cooper Standard is strategically integrating digital tools and advanced analysis to help deliver the best solutions. We offer advanced computer-aided engineering and digital simulations for engineered solutions. In addition, our team of experts has developed digital tools that enable them to conduct prototype testing without the need for physical samples, resulting in sustainability benefits. We can provide up to 100% virtual testing for certain products.
Among our newer technologies is Cooper Standard’s artificial intelligence (A.I.)-enhanced development cycle for polymer compounds that has shortened material development times while realizing rapid discovery of new compounds that offer superior performance properties, which yield superior products. We have also developed proprietary technology for A.I.-enhanced continuousA.I. automated processes controls.control improvements, called Liveline Technologies, a wholly owned subsidiary of Cooper Standard. This technology enables full automation of polymer extrusion and other complex continuous processes, reducing process variation (a top driver of scrap), increasing product quality, improving operational metrics and reducing our carbon footprint. In addition, the Company is piloting multiple A.I. applications to help drive efficiencies in various functions.
Our innovations are receiving industry recognition. Cooper Standard earned an Environment + Energy Leader Award in 2022 for our Fortrex™ chemistry platform, in addition to being named a General Motors Overdrive Award winner in the category of ‘Sustainability’ in 2021, a 2018 Automotive News PACE Award winner, and a 2018, 2019, and 2023 Society of Plastics Engineers Innovation Award finalist. Also, Cooper Standard’s artificial intelligence-enhanced development cycle for polymer compound development was named a finalist for the 2019 Automotive News PACE Awards. In addition, Fortrex™ was named a 2018 PACE Award winner and a 2018 and 2019
Cooper Standard’s fluid handling products were selected as the Society of Plastics Engineers 2022 Automotive Innovation Award finalist.winner for the Material category for our innovative battery electric vehicle thermoplastic thermal management solution utilizing PlastiCool
Pursue Acquisitions® 2000 multilayer tube and Alliances to Enhance Capabilities and Accelerate Growth
Our strong balance sheet allows us to selectively pursue complementary acquisitions and joint ventures to enhance our customer base, geographic penetration, scale and technology. Consolidation is an industry trend, which has been encouraged by the OEMs’ desire for global automotive suppliers. We believe we have a strong platform for growth through acquisitions based on our past integration successes, experienced management team, global presence and operational excellence.Ergo-Lock® connectors.
Industry
The automotive industry is one of the world’s largest and most competitive.competitive markets. Consumer demand for new vehicles largely determines sales and production volumes of global OEMs. The business and commercial environment in each region also plays a role in vehicle demand as it relates to fleet vehicle sales and industrial useindustrial-use vehicles such as light and heavy trucks.
OEMs compete for market share in a variety of ways including pricing and incentives, the development of new, more attractive models, branding and advertising, and the ability to customize vehicle features and options to meet specific customerconsumer needs or demands. They rely heavily on thousands of specialized suppliers to provide the many distinct components and systems that comprise the modern vehicle. They also rely on these automotive suppliers to develop technological innovations that will help them meet internal and consumer demands as well as regulatory requirements.
The supplier industry is a highly competitive industry and is generally characterized by high barriers to entry, significant start-up costs and long-standing customer relationships. The criteria by which OEMs judge automotive suppliers include quality, price, service, launch performance, design and engineering capabilities, innovation, timely delivery, financial stability and global footprint. Over the last decade, suppliers that have been able to achieve manufacturing scale globally, reduce structural costs, diversify their customer base and provide innovative, value-added technologies have been the most successful.
The technology of today’s vehicles is evolving rapidly. This evolution is being driven by many factors including consumer preferences and social behaviors, a competitive drive for differentiation, regulatory requirements and environmental impact and safety. Cooper Standard supports these trends by providing innovations that reduce weight, increase life-cycle and durability, reduce interior noise, enhance exterior appearance, and simplify the manufacturing and assembly process.process, and help reduce a vehicle’s environmental impact. These are innovations that can be applicable and valuable to virtually any vehicle (including fuel,internal combustion, hybrid or electric-poweredbattery electric powertrains) or vehicle manufacturer and, in many cases, can also be transferred to non-automotive applications in adjacent markets. Cooper Standard remains closely aligned with our customers and is prepared to meet their evolving needs as they shift their fleets and offer more electric vehicle (“EV”) options. We are focused on growing
our business in thisthe EV segment by leveraging our technology and innovation to provide value-add solutions for increasingly specialized technical requirements.
Markets Served
Our automotive business is focused on the passenger car and light truck market, up to and including Class 3 full-size, full-frame trucks, better known as the global light vehicle market. This is our largest market and accounts for approximately 92%94% of our global sales.
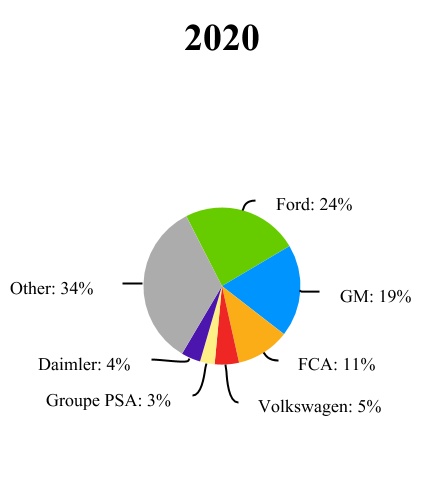
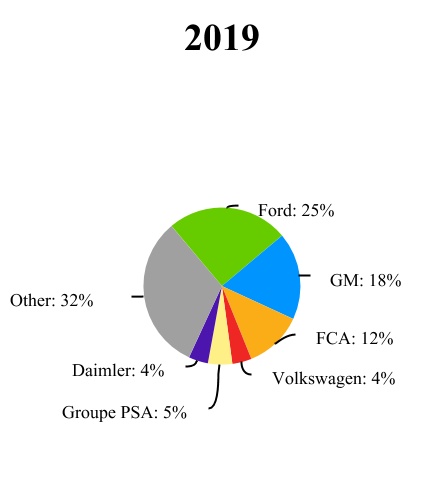
Customers
We are a leading supplier to the following OEMs and are increasing our presence with major OEMs throughout the world. The following charts show the percentage of sales to our top customers for the years ended December 31, 2020, 20192023, 2022 and 2018:2021:
Our other customers include OEMs such as Renault-Nissan, BMW, Toyota, Volvo, Jaguar/Land Rover, Honda and various other OEMs based in China. Our business with any given customer is typically split among several contracts for different parts on a number of platforms.
Subsequent Events
In January 2021, one of the Company’s top customers announced restructuring activities in South America including their intention to cease manufacturing operations in Brazil. As a result, Cooper Standard’s Brazil manufacturing operations and sales attributable to that customer will be significantly impacted. The Company is assessing the impact of this announcement on our 2021 financial results, but does not expect the action to have a material impact on the business, results of operations, financial condition or cash flows.
In January 2021, two of the Company’s top customers, FCA and Groupe PSA, completed a merger. The combined business was renamed Stellantis. The Company does not expect this merger to have a material impact on the business, results of operations, financial condition or cash flows.
Products
We currently have three distinctOur product lines:lines include sealing systems;systems and fluid handling systems (consisting of fuel and brake delivery systems; and fluid transfer systems.systems). These products are produced and supplied globally to a broad range of customers in multiple markets. On April 1, 2019, we completed the divestiture of the AVS product line within our North America, Europe and Asia Pacific segments. On July 1, 2020, we completed the divestiture of the European rubber fluid transfer and specialty sealing businesses, as well as our Indian operations.
In addition to these product lines, we also have sales tosell our core products into other adjacent markets. The percentage of sales by product line and other markets for the years ended December 31, 2020, 20192023, 2022 and 20182021 are as follows: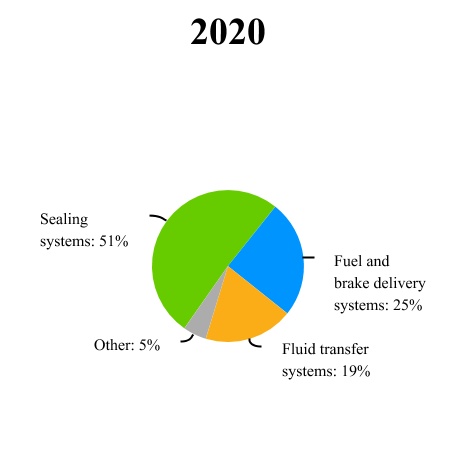
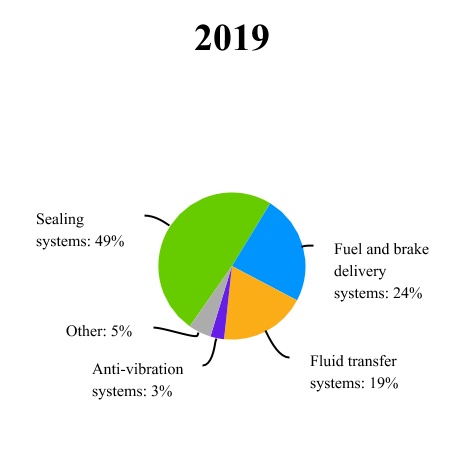
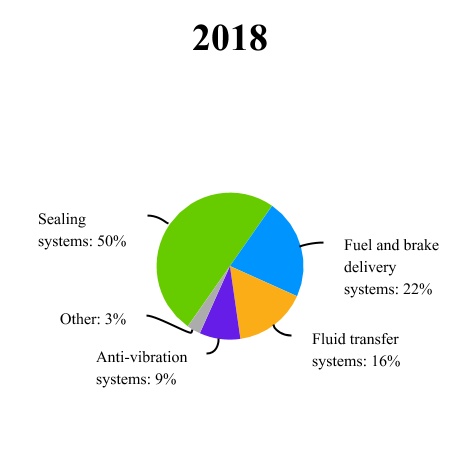
| | | | | | | | | | | | | | | | | | | | | | | |
| Product Lines | | | | | | | Market Position* |
| SEALING SYSTEMS | | Protect vehicle interiors from weather, dust and noise intrusion for improved driving experience; provide aesthetic and functional class-A exterior surface treatment | | Global leader |
| | Products: | – | Obstacle detection sensor system | | |
| | – | Fortrex™ | – | Flush glass systems | | |
| | – | Dynamic seals | – | Variable extrusion | | |
| | – | Static seals | – | Specialty sealing products | | |
| | – | Encapsulated glass | – | Tex-A-Fib (Textured Surface with Cloth Appearance) | | |
| | – | Stainless steel trim | | | | |
| | | | | |
| FUEL & BRAKE DELIVERY SYSTEMS | | Sense, deliver and control fluids to fuel and brake systems | | Top 2 globally |
| Products: | | | | |
| | – | Chassis and tank fuel lines and bundles (fuel lines, vapor lines and bundles) | – | Direct injection & port fuel rails (fuel rails and fuel charging assemblies) | | |
| | – | Metallic brake lines and bundles | – | MagAlloy™ tube coatings | | |
| | – | Quick connects | – | Gen III Posi-Lock™ quick connects | | |
| | – | Low Oligomer MLT CVT | – | Series 300 S300LT | | |
| | – | Brake jounce lines | | | | |
| | | | | |
| FLUID TRANSFER SYSTEMS | | Sense, deliver, connect and control fluid and vapors for optimal thermal management, powertrain & HVAC operation | | Top 3 globally |
| | Products: | | | | |
| | – | Heater/coolant hoses | – | Turbo charger hoses | | |
| | – | Quick connects (SAE and VDA) | – | Charged air cooler ducts/assemblies | | |
| | – | DPF and SCR emission lines | – | Secondary air hoses | | |
| | – | Degas tanks | – | Brake and clutch hoses | | |
| | – | Air intake and charge | – | ArmorHose™ family of products | | |
| | – | Transmission Oil Cooling Hoses | – | Easy-Lock™ quick connect | | |
| | – | Multilayer tubing for glycol thermal management | – | Ergo-Lock™ VDA quick connect | | |
| | – | PC5000 high temperature MLT | – | PC2000 | | |
| | | | | |
*Market position data from PwC (2019) and company estimates | | | | | | | | | | | | | | | | | | | | | | | |
| Product Lines | | | | | | | Market Position |
| SEALING SYSTEMS | | Protect vehicle interiors from weather, dust and noise intrusion for improved driving experience; provide aesthetic and functional class-A exterior surface treatment | | Global leader |
| | Products: | | | | |
| | – | Fortrex® | – | FlushSeal™ systems | | |
| | – | Dynamic seals | – | Variable extrusion | | |
| | – | Static seals | – | Specialty sealing products | | |
| | – | Encapsulated glass | – | Stainless steel trim | | |
| | – | Tex-A-Fib (Textured Surface with Cloth Appearance) | – | Frameless Systems | | |
| | – | Obstacle detection sensor system | | | | |
| | | | | |
| FUEL & BRAKE DELIVERY SYSTEMS | | Sense, deliver and control fluid and fluid vapors for fuel and brake systems | | Top 2 globally |
| | Products: | | | | |
| | – | Chassis and tank fuel lines and bundles (fuel lines, vapor lines and bundles) | – | Direct injection & port fuel rails (fuel rails and fuel charging assemblies) | | |
| | – | Metallic brake lines and bundles | – | MagAlloy™ break tube coating | | |
| | – | Quick connects | – | ArmorTube™ brake tube coating | | |
| | – | Low oligomer multi-layer convoluted tube | – | Series 300 and S300LT (low temperature) quick connects | | |
| | – | Brake jounce lines | – | Gen III Posi-Lock® quick connects | | |
| | | | | |
| FLUID TRANSFER SYSTEMS | | Sense, deliver, connect and control fluid delivery for optimal thermal management, powertrain & HVAC operation | | Top 3 globally |
| | Products: | | | | |
| | – | Heater/coolant hoses | – | Turbo charger hoses | | |
| | – | Quick connects (SAE and VDA) | – | Charged air cooler ducts/assemblies | | |
| | – | Diesel particulate filter (DPF) lines | – | Secondary air hoses | | |
| | – | Degas tanks and deaerators | – | Brake and clutch hoses | | |
| | – | Charged air cooling (air intake and discharge) | – | Easy-Lock™ quick connect | | |
| | – | Transmission oil cooling hoses | – | Ergo-Lock™ VDA quick connect | | |
| | – | Multilayer tubing for glycol thermal management | – | Ergo-Lock™ + VDA quick connect | | |
| | – | PlastiCool® 5000 high temperature MLT | – | PlastiCool® 2000 multi-layer tubing for glycol thermal management | | |
| | | | | |
Competition
We believe that the principal competitive factors in our industry are quality, price, service, launch performance, design and engineering capabilities, innovation, timely delivery, financial stability and global footprint. We believe that our capabilities in these core competencies are integral to our position as a market leader in each of our product lines. Our sealing systems products compete with Toyoda Gosei, Henniges, Hutchinson Standard Profil, HSR&A, SaarGummi and JianXin, among others. Our fuel and brake delivery products compete with TI Automotive, Sanoh, Martinrea, Maruyasu and SeAH, among others. Our fluid transfer products compete with Conti-Tech, Hutchinson, Teklas, Tristone, Akwel and Fränkische, among others.
Joint Ventures and Strategic Alliances
Joint ventures represent an important part of our business, both operationally and strategically. We have utilized joint ventures to enter into and expand in geographic markets such as China, India and Thailand, to acquire new customers and to develop new technologies. When entering new geographic markets, teaming with a local partner can reduce capital investment
by leveraging pre-existing infrastructure. In addition, local partners in these markets can provide knowledge and insight into local practices and access to local suppliers of raw materials and components.
The following table shows our significant unconsolidated joint ventures:ventures as of December 31, 2023:
| | | | | | | | | | | | | | |
| Country | | Name | Product Line | Ownership Percentage |
United States | Thailand | Nishikawa Tachaplalert Cooper LLCLtd. | Sealing systems | 40%20% |
| India | | Polyrub Cooper Standard FTS Private Limited | Fluid transfer systems | 35% |
Thailand | United States | Nishikawa Tachaplalert Cooper Ltd.LLC | Sealing systems | 20%40% |
| China | | Yantai Leading Solutions Auto Parts Co., Ltd. | Fuel and brake delivery systems | 50% |
| China | Shenya Sealing (Guangzhou) Company Limited | Sealing and fluid transfer systems | 51% |
On April 1, 2019, the Company sold its equity interest in Sujan Cooper Standard AVS Private Limited in connection with the divestiture of its AVS product line.
Research and Development
We have a dedicated team of technical and engineering resources for each product line, some of which are located at our customers’ facilities. We utilize simulation, digital tools, best practices, standardization and track key process indicators to drive efficiency in execution with an emphasis on manufacturability and quality. Our development teams work closely with our customers to design and deliver innovative solutions, unique for their applications. Amounts spent on engineering, research and development, and program management were as follows:
| | | | | | | | | | | | | | |
| Year | | Amount | | Percentage of Sales |
| (Dollar amounts in millions) |
| 2020 | | $ | 101.6 | | | 4.3 | % |
| 2019 | | $ | 114.9 | | | 3.7 | % |
| 2018 | | $ | 122.5 | | | 3.4 | % |
| | | | | | | | | | | | | | |
| Year | | Amount | | Percentage of Sales |
| (Dollar amounts in millions) |
| 2023 | | $84.1 | | 3.0% |
| 2022 | | $80.5 | | 3.2% |
| 2021 | | $90.0 | | 3.9% |
Intellectual Property
We believe that one of our key competitive advantages is our ability to translate customer needs and our ideas into innovation through the development of intellectual property. We hold a significant number of patents and trademarks worldwide.
Our patents are grouped into two major categories: (1) specific product invention claims and (2) specific manufacturing processes that are used for producing products. The vast majority of our patents fall within the product invention category. We consider these patents to be of value and seek to protect our rights throughout the world against infringement. While in the aggregate these patents are important to our business, we do not believe that the loss or expiration of any one patent would materially affect our Company. We continue to seek patent protection for our new products and we develop significant technologies that we treat as trade secrets and choose not to disclose to the public through the patent process. These technologies nonetheless provide significant competitive advantages and contribute to our global leadership position in various markets. We believe that our trademarks, including FlushSeal™, Gen III Posi-Lock™Posi-Lock®, Easy-Lock™Easy-Lock®, MagAlloy™MagAlloy®, Ergo-Lock™, PC2000Ergo-Lock® +, PlastiCool® and Fortrex™, help differentiate us and lead customers to seek our partnership.
We also have technology sharing and licensing agreements with various third parties, including Nishikawa Rubber Company, one of our joint venture partners in sealing products. We have mutual agreements with Nishikawa Rubber Company for sales, marketing and engineering services on certain sealing products. Under those agreements, each party pays for services provided by the other and royalties on certain products for which the other party provides design or development services. We also have licensing and joint development agreements for commercial applications of our Fortrex™ chemistry platform in non-automotive industries. A joint development agreement has also been put in place for the collaborative creation of novel dynamic fluid control products and systems.
Innovation, Materials, and Product Lifecycle
The international response to risks and opportunities of climate change is transforming our global economy. Our most significant opportunity to contribute to this low-carbon and circular economy is through reducing the environmental impact of our products and manufacturing processes. We purposefully apply sustainable principles in the design and production of our
products, reducing the environmental impact from sourcing through end-of-life. These efforts also enable our customers to reduce their environmental impacts.
When obtaining or innovating materials for our products, we seek to sustainably source raw materials, increase the use of recycled content or recyclable material where feasible, decrease our use of hazardous chemicals where possible, and properly disclose restricted materials to customers and regulators. We believe our culture of innovation is a key differentiator, allowing us to compete and succeed within our dynamic global markets.
Supplies and Raw Materials
Cooper Standard is committed to building strong relationships with our supply partners. We recognize the importance of engaging with suppliers to create value for our customers.
The principleprincipal raw materials for our business include synthetic and natural rubber, carbon black, process oils, and plastic resins. PrinciplePrincipal procured components are primarily made from plastic, carbon steel, aluminum and stainless steel. We manage the procurement of our direct and indirect materials to assure supply continuity and to obtain the most favorable total cost.
Procurement arrangements include short-term and long-term supply agreements that may contain formula-based pricing based on commodity indices. These arrangements provide quantities needed to satisfy normal manufacturing demands. We believe we have adequate sources for the supply of raw materials and components for our products with suppliers located around the world, although we continue to manage, with our supplier partners, short-term disruptions in production and logistics throughout our supply chain caused by the COVID-19 pandemic.world.
Raw material prices are susceptible to fluctuations which may place operational and profitability burdens on the entire supply chain. Costs related toFollowing the pandemic, market prices for key raw materials, such as steel, aluminum, and oiloil-derived
commodities, experienced a period of extreme volatility, which led to significant cost increases for our business in 2021 and oil-derived commodities, continue to be volatile. As such,
2022. In response, we have implemented strategiesworked with both our suppliers and our customers throughout 2022 and 2023 to help manage these fluctuations. These actions include material substitutions and leveraging global purchases. Our global supply chain optimization efforts include using benchmarks and selective sourcing from strategic suppliers. Weimplement or expand index-based commercial
agreements that have also made process improvementsenabled us to ensure the efficient use of materials through scrap reduction, as well as standardization of material specifications to maximize leverage over higher volume purchases. With some customers, on certain raw materials, we have implemented indices that allow price changes as underlyingpartially recover incremental material costs fluctuate.incurred and significantly reduced our exposure
and risk related to commodity price fluctuations going forward. Global commodity markets and pricing have stabilized to a
large degree in 2023 and into the beginning of 2024.
Seasonality
Our principal operations are directly related toWithin the automotive industry. Salesindustry, sales to OEMs are lowest during the months prior to model changeovers or during assembly plant shutdowns. Automotive production is traditionally reduced during July, August and year-end holidays, and our quarterly results may reflect these trends. However, economic conditions and consumer demand may change the traditional seasonality of the industry. In recent years, for example, global light vehicle production, inventory and consumer demand all experienced extreme dislocations from historic norms due to the global COVID-19 pandemic and related restrictions on production and consumer activity. Post-pandemic, global light vehicle production continued to be negatively impacted by widespread supply chain disruptions, limiting the global automotive OEM’s ability to rebuild inventory and meet pent-up consumer demand.
Backlog
Our OEM sales are generally based upon purchase orders issued by the OEMs, with updated releases for volume adjustments. As such, we typically do not have a firm and definitive backlog of orders at any point in time. Once selected to supply products for a particular platform, we typically supply those products for the platform life, which is normally sixfive to seveneight years, although there is no guarantee that this will occur. In addition, when we are the incumbent supplier to a given platform, we believe we have a competitive advantage in winning the redesign or replacement platform, although there is no guarantee that this will occur.
Human Capital and Safety
As of December 31, 2020,2023, we had approximately 25,00023,000 employees, including 3,1003,000 contingent workers. We maintain good relations with both our union and non-union employees and, in the past ten years, have not experienced any major work stoppages.
Our people have always been the driving force of value at Cooper Standard. We renegotiated somecontinue to embrace new ways of working, a growing international movement for civil rights, and our domestic and non-domestic union agreements in 2020, and have several contracts setunwavering dedication to expire in the next twelve months.
The attraction, retention and development ofkeeping our employees ishealthy and safe has only made them more critical to our success. We accomplish this by developing the capabilities of our employees through continuous learning and performance management processes. Additionally, building an internal talent pipeline supports the achievement of this priority. In 2020,2023, our internal fill rate was approximately 56%36%. This metric, which is based on salaried, director leveldirector-level positions and above, helps us to understand where employees are advancing in their careercareers and the effectiveness of our internal development programs. OurFor 2023, our voluntary employee turnover rate was approximately 13%15%. We believe that our culture and continued effort to provide our employees with growth opportunities contributes to retaining our strong talent.
In addition, we aim to diversify our workforce because we recognize the value of engaging different opinions and backgrounds in a global company. We are committed to recruiting, developing and retaining a high-performing and diverse workforce. A global measurement for our diversity is women in the company and women in leadership. In 2020,2023, women made up approximately 36%40% of our workforce. Of our leadership positions, defined as vice president positions and above, women held approximately 20%24% of such roles.
Safety continues to be a top priority and primary focus of management. An emphasis on reducing workplace incidents helps Cooper Standard to maintain a safe workforce and continue to deliver world class results for product quality. In 2020,2023, our total incident rate (“TIR”) was 0.32, which represents an Occupational Safety and Health Administration measurement of on-the-job injuries in relation to total hours worked. Based on our review of industry peer sustainability reports, we have a lower TIR relative to our peer group. Additionally, throughout the COVID-19 pandemic, we have remained focused on protecting the health and safety of our employees while meeting the needs of our customers. After the onset of COVID-19, we adopted enhanced safety measures and practices across our facilities to protect employee health and safety and ensure a reliable supply of products to our customers. We monitor and track the impact of the pandemic on our employees and within our operations and proactively modify or adopt new practices to promote their health and safety.
Also in 2020, the Company was named to Newsweek’s list of America’s Most Responsible Companies for the second consecutive year and was recognized as one of the 2020 World’s Most Ethical Companies by Ethisphere. These awards are further testament to Cooper Standard’s commitment to ESG (environmental, social and governance) topics, including our core value of integrity.
Community Involvement
Supported by the Cooper Standard Foundation, our employees are highly engaged in their local communities. The Foundation’s mission is to strengthen the communities where Cooper Standard employees work and live through the passionate support of children’s charities, education, health and wellness, and community revitalization. The Cooper Standard Foundation is a 501(c)(3) organization with oversight by our Philanthropic Committee andits Board of Trustees.Directors, Board of Trustees and Philanthropic Committee. For more information on the Company’s community involvement, please visit our Corporate Responsibility Report located on the Cooper Standard website.
Environmental, Social and Governance (ESG)
In 2023, the Company was named to Newsweek’s list of America’s Most Responsible Companies for the fifth consecutive year and achieved Ecovadis Silver Status for sustainability efforts that also earned the Company recognition from Nissan for sustainability and social responsible practices. These awards are a further testament to Cooper Standard’s commitment to ESG topics, including our core value of integrity.
Cooper Standard considers itself a steward of the environment, and we monitor the environmental impact of our business and products. We prioritize our environmental management as a means of driving and sustaining excellence. We are subject to a broad range of federal, state, and local environmental and occupational safety and health laws and regulations in the United States and other countries, including regulations governing: emissions to air, discharges to water, noise and odor emissions; the generation, handling, storage, transportation, treatment, reclamation and disposal of chemicals and waste materials; the cleanup of contaminated properties; and human health and safety. We have made, and will continue to make, expenditures to comply with environmental requirements. While our costs to defend and settle known claims arising under environmental laws have not been material in the past and are not currently estimated to have a material adverse effect on our financial condition, such costs could be material to our financial statements in the future. Further details regarding our commitments and contingencies are provided in Note 23.20. “Contingent Liabilities” to the consolidated financial statements included in Item 8. “Financial Statements and Supplementary Data” of this Annual Report on Form 10-K (the “Report”).
Market Data
SomeCertain market data and other statistical information used throughout this Annual Report on Form 10-K is based on data from independent firms such as IHS Markit and PwC.S&P Global. Other data is based on good faith estimates, which are derived from our review of internal analyses, as well as third partythird-party sources. Although we believe these third partythird-party sources are reliable, we have not independently verified the information and cannot guarantee its accuracy and completeness. To the extent that we have been unable to obtain information from third partythird-party sources, we have expressed our belief on the basis of our own internal analyses of our products and capabilities in comparison to our competitors.
Available Information
We make available free of charge on our website (www.cooperstandard.com) our Annual Report on Form 10-K, Quarterly Reports on Form 10-Q, Current Reports on Form 8-K and amendments to those reports filed or furnished pursuant to Section 13(a) or 15(d) of the Securities Exchange Act of 1934, as amended, (the “Exchange Act”), as soon as reasonably practicable after we electronically file such material with, or furnish it to, the U.S. Securities and Exchange Commission (“SEC”). Our reports filed with the SEC also may be found on the SEC’s website at www.sec.gov. We may also use our website as a distribution channel of material company information. Neither the information on our website nor the information on the SEC’s website is incorporated by reference into this Report unless expressly noted.
Forward-Looking Statements
This Annual Report on Form 10-K includes “forward-looking statements” within the meaning of U.S. federal securities laws, and we intend that such forward-looking statements be subject to the safe harbor created thereby. Our use of words “estimate,” “expect,” “anticipate,” “project,” “plan,” “intend,” “believe,” “outlook,” “guidance,” “forecast,” or future or conditional verbs, such as “will,” “should,” “could,” “would,” or “may,” and variations of such words or similar expressions are intended to identify forward-looking statements. All forward-looking statements are based upon our current expectations and various assumptions. Our expectations, beliefs, and projections are expressed in good faith and we believe there is a reasonable basis for them. However, we cannot assure you that these expectations, beliefs and projections will be achieved. Forward-looking statements are not guarantees of future performance and are subject to significant risks and uncertainties that may cause actual results or achievements to be materially different from the future results or achievements expressed or implied by the forward-looking statements. Among other items, such factors may include: volatility or decline of the impact,Company’s stock price, or absence of stock price appreciation; impacts and expected continueddisruptions related to the wars in Ukraine and the Middle East; our ability to achieve commercial recoveries and to offset the adverse impact of the recent COVID-19 outbreak onhigher commodity and other costs through pricing and other negotiations with our financial condition and results of operations; significant risks tocustomers; work stoppages or other labor disruptions with our liquidity presented by the COVID-19 pandemic risk;employees or our customers’ employees; prolonged or material contractions in automotive sales and production volumes; our inability to realize sales represented by awarded business; escalating pricing pressures; loss of large customers or significant platforms; our ability to successfully compete in the automotive parts industry; availability and increasing volatility in costs of manufactured
components and raw materials; disruption in our supply base; competitive threats and commercial risks associated with our diversification strategy through Advanced Technology Group;strategy; possible variability of our working capital requirements; risks associated with our international operations, including changes in laws, regulations, and policies governing the terms of foreign trade such as increased trade restrictions and tariffs; foreign currency exchange rate fluctuations; our ability to control the operations of our joint ventures for our sole benefit; our substantial amount of indebtedness and variable rates of interest; our ability to obtain adequate financing sources in the future; operating and financial restrictions imposed on us under our debt instruments; the underfunding of our pension plans; significant changes in discount rates and the actual return on pension assets; effectiveness of continuous improvement programs and other cost savings plans; significant costs related to manufacturing facility closings or consolidation; our ability to execute new program launches; our ability to meet customers’ needs for new and improved products; the possibility that our acquisitions and divestitures may not be successful; product liability, warranty and recall claims brought against us; laws and regulations, including environmental, health and safety laws and regulations; legal and regulatory proceedings, claims or investigations against us; work stoppages or other labor disruptions;the potential impact of any future public health events on our financial condition and results of operations; the ability of our intellectual property to withstand legal challenges; cyber-attacks, data privacy concerns, other disruptions in, or the inability to implement upgrades to, our information technology systems; the possible volatility of our annual effective tax rate; changes in our assumptions as a result of IRS issuing guidance on the Tax Cuts and Jobs Act; the possibility of a failure to maintain effective controls and procedures; the possibility of future impairment charges to our goodwill and long-lived assets; our ability to identify, attract, develop and retain a skilled, engaged and diverse workforce; our ability to procure insurance at reasonable rates; and our dependence on our subsidiaries for cash to satisfy our obligations.
You should not place undue reliance on these forward-looking statements. Our forward-looking statements speak only as of the date of this Annual Report on Form 10-K and we undertake no obligation to publicly update or otherwise revise any forward-looking statement, whether as a result of new information, future events or otherwise, except where we are expressly required to do so by law.
This Annual Report on Form 10-K also contains estimates and other information that is based on industry publications, surveys and forecasts. This information involves a number of assumptions and limitations, and we have not independently verified the accuracy or completeness of the information.
Item 1A. Risk Factors
We have listed below (not necessarily in order of importance or probability of occurrence) the most significant risk factors that could cause our actual results to vary materially from recent or anticipated results and could materially and adversely affect our business, results of operations, financial condition and cash flows.
Operational Risks
Our business, financial condition and results of operations have been, and are expected to continue tomay be adversely affectedimpacted by the recent COVID-19 outbreak.effects of inflation.
We face risks relatedInflation has the potential to public health issues, including epidemics and pandemics such as the global outbreak of COVID-19. The COVID-19 outbreak and preventative measures taken to contain or mitigate the COVID-19 outbreak have caused, and are continuing to cause,adversely affect our business, slowdowns or shutdowns and significant disruption in the financial markets both in the United States and globally. The continued spread of COVID-19 and efforts to contain the virus (including, but not limited to, vaccination, social distancing policies, restrictions on travel and reduced operations and extended closures of many businesses and institutions) may materially impact our financial condition and results of operations.
•Facilities. For example, beginning inoperations by increasing our overall cost structure. Other inflationary pressures could affect wages, the first quartercost and availability of 2020, we experienced the shutdown of effectively all of our facilities in Asia Pacific, North America, Europecomponents and South America, coinciding with the shutdown of our customer facilities in those regions. While facilities gradually reopenedraw materials and production resumed over the course of 2020, reopening was gradualother inputs and at times, at lower capacities. A resurgence of the virus could cause another shutdown of our and our customers’ facilities. Although our automotive operations generally do not realize revenue while our facilities are shut down, we continue to incur significant operating and non-operating expenses associated with these facilities. In addition, government regulations and safety and social distancing procedures that we have implemented in our facilities have increased our operating costs, and we may not be able to pass along these increased costs to our customers.
•Supply chain. Our business relies on a number of third parties, including suppliers and distribution and logistics providers. One or more of these third parties may experience financial distress, staffing shortages or liquidity challenges, file for bankruptcy protection, go out of business, or suffer disruptions in their business due to the COVID-19 pandemic. These supply chain effects may have an adverse effect on our ability to meet customer demanddemand. Inflation may further exacerbate other risk factors, including supply chain disruptions, risks related to international operations and may result in an increase in our coststhe recruitment and retention of production and distribution, including increased freight and logistics costs and other expenses. A continued significant disruption to our production schedule will have an adverse effect on our financial condition, liquidity and results of operations.qualified employees. If we are
•Workforce. If a significant percentageunsuccessful in negotiating pricing adjustments with our customers to raise the prices of our workforce, orproducts sufficiently to keep up with the workforcesrate of inflation, our suppliersprofit margins and other third-party partners, is unable to work, whether because of illness, quarantine, limitations on travel or other government restrictions in connection with COVID-19, our operationscash flows may be negatively impacted. We also depend on senior management and other key personnel and consultants, and the illness of certain personnel or consultants could resultadversely affected.
Increases in the losscosts, or reduced availability, of expertiseraw materials and negatively affect our operations.
•Demand. The economic slowdown attributable to COVID-19 has also led to a global decrease in vehicle sales in markets around the world. Based on current weak consumer confidence, rising unemployment levels, risks to small businesses and overall economic uncertainty, it is likely that global demand for light vehicles will be significantly lower than both historical and previously projected levels for an extended period, even as the COVID-19 pandemic begins to abate. As described in more detail under the risk factor entitled “We are highly dependent on the automotive industry. A prolonged or material contraction in automotive sales and production volumes couldmanufactured components may adversely affect our business,profitability.
Raw material costs can be volatile. The principal raw materials to produce our products include synthetic and natural rubber, carbon black, process oils, and plastic resins. Principal procured components are primarily made from plastic, carbon steel, aluminum and stainless steel. Material costs represented approximately 51% of our total cost of products sold in 2023. The costs and availability of raw materials and manufactured components can fluctuate due to factors beyond our control, including as a result of existing and potential changes to U.S. policies related to global trade and tariffs. Further, climate change may have an adverse impact on global temperatures, weather patterns, and the frequency and severity of extreme weather and natural disasters, which may adversely affect the availability or pricing for certain raw materials including natural rubber. A significant increase in the price of raw materials, or a restriction in their availability, could materially increase our operating costs and adversely affect our profitability because it is generally difficult to pass through these increased costs to our customers. While we entered into index pricing agreements with some of our customers which provide for a price adjustment based on quoted market prices to attempt to address some of these risks (notably with respect to steel and rubber), there can be no assurance that commodity price fluctuations will not adversely affect our results of operations and financial condition”, a sustained declinecash flows. In addition, while the use of index pricing adjustments may provide us with some protection from adverse fluctuations in vehicle sales would adversely affect our business, results of operations and financial condition.
•Liquidity. The COVID-19 pandemic has also caused significant disruptions to global financial markets. Such disruptions, together withcommodity prices, by utilizing these instruments, we potentially forego the impact of COVID-19 on the automotive industry, may have a negative impact on our ability to access capitalbenefits that might result from favorable fluctuations in the future on favorable terms or at all.
The full impact of the COVID-19 pandemic on our financial condition and results of operations will depend on future developments, such as the ultimate duration and scope of the outbreak, its impact on our customers, suppliers and logistics partners, how quickly normal operations can resume and the duration and magnitude of the economic downturn caused by the pandemic in our key markets. In particular, a delay in wide distribution of a vaccine, or a lack of public acceptance of a vaccine, could lead people to continue to self-isolate and not participate in the economy at pre-pandemic levels for a prolonged period of time. Further, even if a vaccine is widely distributed and accepted, the vaccine may not be successful in limiting or stopping the spread of COVID-19. Government-sponsored liquidity or stimulus programs in response to the COVID-19 pandemic may not be available to our customers, suppliers or us and, if available, may nevertheless be insufficient to address the impacts of COVID-19. Therefore, it remains difficult to predict the extent or nature of these impacts at this time. The COVID-19 pandemic may also exacerbate the other risks disclosed in this Item 1A. Risk Factors.
A disruption in, or the inability to successfully implement upgrades to, our information technology systems, including disruptions relating to cybersecurity as well as data privacy concerns, could adversely affect our business and financial performance.
We rely upon information technology networks, systems and processes, including the information technology networks of third parties such as suppliers and joint venture partners, to manage and support our business. We have implemented a number of procedures and practices designed to protect against breaches or failures of our systems. Despite the security measures that we have implemented, including those measures to prevent cyber-attacks, our systems could be breached or damaged by computer viruses or unauthorized physical or electronic access. A breach of our information technology systems, or those of the third parties on whom we rely, could result in theft of our intellectual property, disruption to business or unauthorized access to customer or personal information. Such a breach could adversely impact our operations and/or our reputation and may cause us to incur significant time and expense to cure or remediate the breach.
Further, we continually update and expand our information technology systems to enable us to more efficiently run our business. If these systems are not implemented successfully, our operations and business could be disrupted and our ability to report accurate and timely financial results could be adversely affected.price.
Disruptions in the supply chain could have an adverse effect on our business, financial condition, results of operations and cash flows.
We obtain components and other products and services from numerous suppliers and other vendors throughout the world. We are responsible for managing our supply chain, including suppliers that may be the sole sources of products that we require, that our customers direct us to use or that have unique capabilities that would make it difficult and/or expensive to re-source. In certain instances, entire industries may experience short-term capacity constraints. Any significant disruptiondisruptions in the automotive industry due to industry-wide parts shortages and global supply chain constraints could adversely affect our operations and financial performance. Furthermore, unfavorableUncertain economic or industry conditions resulting from such supply chain constraints could result in financial distress within our supply base, thereby further increasing the risk of supply disruption. Although market conditions generally have improved in recent years, uncertainty remains, and anFurthermore, any economic downturn or other unfavorable conditions in one or more of the regions in which we operate could cause a supply disruptiondisruptions and thereby adversely affect our financial condition, operating results and cash flows.
Work stoppages orother disruptions to our operations could negatively affect our operations and financial performance.
We may experience work stoppages caused by labor disputes under existing collective bargaining agreements or in connection with the negotiation of new agreements given that we have a number of agreements that expire in any given year. Further, there is no certainty that we will be successful in negotiating new collective bargaining agreements that extend beyond the current expiration dates or that new agreements will be on terms as favorable to us as past labor agreements. In addition, it is possible that our workforce will become more unionized in the future. Unionization activities could increase our costs, which could negatively affect our results of operations.
Our operations may also be disrupted by other labor issues, including absenteeism, public health events and government restrictions; major equipment failure with prolonged downtime or a complete loss of critical equipment where either no other comparable equipment exists or the remaining equipment does not have enough capacity to pick up the demand; or natural disaster-related plant closures or disruptions. In particular, natural disasters and adverse weather conditions can be caused or exacerbated by climate change.
Regardless of the cause, any significant disruption to our production could negatively affect our operations, customer relationships and financial performance. Similar disruptions at one or more of our suppliers or our customers’ suppliers could adversely affect our operations if an alternative source of supply were not readily available. Additionally, similar disruptions at our customers’ facilities could result in reduced demand for our products causing us to delay or cancel production and could have an adverse effect on our business.
A disruption in, or the inability to successfully implement upgrades to, our information technology systems, including disruptions relating to cybersecurity as well as data privacy concerns, could adversely affect our business and financial performance.
We rely upon information technology networks, systems and processes, including the information technology networks of third parties such as suppliers and joint venture partners, to manage and support our business. We have implemented a number
If a customer experiences a material supply shortage, either directlyof procedures and practices designed to protect against breaches or as a result of a supply shortage at another supplier, that customer may halt or limit the purchasefailures of our products,systems. Despite the security measures that we have implemented, including those measures to prevent cyber-attacks, our systems could be breached or damaged by computer viruses or unauthorized physical or electronic access. Like other public companies, our computer systems and those of our third-party vendors, partners and service providers are regularly subject to, and will continue to be the target of, computer viruses, malware or other malicious codes (including ransomware), unauthorized access, cyber-attacks or other computer-related penetrations which may cause disruptions to our operations. While we have experienced threats to our data and systems, to date, we are not aware that we have experienced a cybersecurity incident that has materially affected our business strategy, results of operations, or financial condition. Over time, however, the sophistication of these threats continues to increase. The preventative actions we take to reduce the risk of cyber incidents and protect our information may be insufficient. A breach of our information technology systems, or those of the third parties on whom we rely, could result in theft of our intellectual property, disruption to business or unauthorized access to customer or personal information. Such a breach could adversely affectimpact our operations and/or our reputation and may cause us to incur significant time and expense to cure or remediate the breach.
Further, we continually update and expand our information technology systems to enable us to run our business more efficiently, including the potential incorporation of traditional and generative A.I. solutions into our information systems and processes. The increasing use and evolution of this technology creates potential risks for loss or misuse of sensitive Company data that forms part of any data set that was collected, used, stored, or transferred to run our business, and unintentional dissemination or intentional destruction of confidential information stored in our or our third party providers' systems, portable media or storage devices, which may result in significantly increased business and security costs, a damaged reputation, administrative penalties, or costs related to defending legal claims. In addition, if the content, analyses, or recommendations that A.I. programs assist in producing are or are alleged to be deficient, inaccurate, or biased, our business, financial condition, and results of operations and financial condition.
Increases in the costs, or reduced availability, of raw materials and manufactured components may adversely affect our profitability.
Raw material costs can be volatile. The principle raw materials to produce our products include synthetic and natural rubber, carbon black, process oils, and plastic resins. Principal procured components are primarily made from plastic, carbon steel, aluminum and stainless steel. Material costs represented approximately 46% of our total cost of products sold in 2020. The costs and availability of raw materials and manufactured components can fluctuate due to factors beyond our control, including as a result of existing and potential changes to U.S. policies related to global trade and tariffs. A significant increase in the price of raw materials, or a restriction in their availability, could materially increase our operating costs and adversely affect our profitability because it is generally difficult to pass through these increased costs to our customers.
Our diversification strategy through the Advanced Technology Group poses new competitive threats and commercial risks.
Our diversification strategy through the Advanced Technology Group is to leverage our core products in adjacent markets and license our innovation technology in non-automotive markets. Wereputation may be unsuccessfuladversely affected. If these systems are not implemented successfully and in leveraginga timely, cost-effective, compliant and responsible manner, our existing productsoperations and technology into new marketsbusiness could be disrupted and thus in meeting the needs of these new customersour ability to report accurate and competing favorably in these new markets.timely financial results could be adversely affected.
OurAn inability to effectively manage the timing, quality and costs of new program launches could adversely affect our financial performance.
In connection with the award of new business, we may obligate ourselves to deliver new products that are subject to our customers’ timing, performance and quality standards. Given the number and complexity of new program launches, we may experience difficulties managing product quality, timeliness and associated costs. In addition, new program launches require a significant ramp up of costs. However, ourOur sales related to these new programs generally are dependent upon the timing and success of our customers’ introduction of new vehicles. OurAn inability to effectively manage the timing, quality and costs of these new program launches could adversely affect our financial condition, operating results and cash flows.
Our success depends in part on our development of improved products, and our efforts may fail to meet the needs of customers on a timely or cost-effective basis.
Our continued success depends on our ability to maintain advanced technological capabilities and knowledge necessary to adapt to changing market demands, as well as to develop and commercialize innovative products. We may be unable to develop new products successfully or to keep pace with technological developments by our competitors and the industry in general.general, which in recent years includes the rapid development and rising use of digital, A.I. and machine learning technologies. In addition, we may develop specific technologies and capabilities in anticipation of customers’ demands for new innovations and technologies. If such demand does not materialize, we may be unable to recover the costs incurred in the development of such technologies and capabilities. If we are unable to recover these costs or if any such programs do not progress as expected, our business, results of operations and financial condition could be adversely affected.
We may incur material losses and costs as a result of product liability and warranty and recall claims that may be brought against us.
We may be exposed to product liability and warranty claims in the event that our products actually or allegedly fail to perform as specified or expected or the use of our products results, or is alleged to result, in bodily injury and/or property damage. Accordingly, we could experience material warranty or product liability expenses in the future and incur significant costs to defend against these claims. In addition, if any of our products are, or are alleged to be, defective, we may be required to participate in a recall of that product if the defect or the alleged defect relates to automotive safety. Product recalls could cause us to incur material costs and could harm our reputation or cause us to lose customers, particularly if any such recall causes customers to question the safety or reliability of our products. Also, while we possess considerable historical warranty and recall data with respect to the products we currently produce, we do not have such data relating to new products, assembly programs or
technologies, including any new fuel and emissions technology and systems being brought into production, to allow us to accurately estimate future warranty or recall costs.
In addition, the increased focus on systems integration platforms utilizing fuel and emissions technology with more sophisticated components from multiple sources could result in an increased risk of component warranty costs over which we have little or no control and for which we may be subject to an increasing share of liability to the extent any of the other component suppliers are in financial distress or are otherwise incapable of fulfilling their warranty or product recall
obligations. Our costs associated with providing product warranties and responding to product recall claims could be material. Product liability, warranty and recall costs may adversely affect our business, results of operations and financial condition.
Work stoppages or similar difficulties could disrupt our operations and negatively affect our operations and financial performance.
We may be subject to work stoppages and may be affected by other labor disputes. A number of our collective bargaining agreements expire in any given year. There is no certainty that we will be successful in negotiating new agreements with these unions that extend beyond the current expiration dates or that these new agreements will be on terms as favorable to us as past labor agreements. Failure to renew these agreements when they expire or to establish new collective bargaining agreements on terms acceptable to us and the unions could result in work stoppages or other labor disruptions which may have an adverse effect on our operations, customer relationships and financial results. Additionally, a work stoppage at one or more of our suppliers or our customers’ suppliers could adversely affect our operations if an alternative source of supply were not readily available. Work stoppages by our customers’ employees could result in reduced demand for our products and could have an adverse effect on our business. In addition, it is possible that our workforce will become more unionized in the future. Unionization activities could increase our costs, which could negatively affect our results of operations.
Our commitment to drive value through culture, innovation and results is dependent on our ability to identify, attract, develop and retain a skilled, engaged and diverse workforce.
Our people are the driving force behind our success at Cooper Standard. Our ability to pursue breakthrough technology innovations, implement cutting-edge manufacturing and business processes, and achieve our operating and strategic goals is dependent on the engagement, skills, experience and knowledge of our employees. Any failure or delay in attracting, retaining and developing such a workforce, including the loss of key technological and leadership personnel, could adversely impact our business, financial condition and operating results.
We could face risks related to public health events, including epidemics and pandemics like the recent COVID-19 pandemic. Preventative measures taken to contain or mitigate public health events (including, but not limited to, vaccination, social distancing policies, restrictions on travel and reduced operations and extended closures of many businesses and institutions) may materially impact our financial condition and operations results due to shutdowns of our and our customers’ and suppliers’ facilities; increased operating and production costs; disruptions and financial distress in the supply chain; disruptions in our production cycle; lost or absent members of the workforce; a decline in demand due to an economic downturn; and inability to access capital due to disruptions in the global financial markets.
The full impact of another public health event on our financial condition and operations results will depend on various factors, such as the ultimate duration and scope of the crisis, its impact on our customers, suppliers and logistics partners, how quickly normal operations can resume and the duration and magnitude of the economic downturn caused by the health crisis in our key markets. A public health event may also exacerbate the other risks disclosed in this Item 1A. Risk Factors.
Strategic Risks
We are highly dependent on the automotive industry. A prolonged or material contraction in automotive sales and production volumes could adversely affect our business, results of operations and financial condition.
Automotive sales and production are cyclical and depend on, among other things, general economic conditions and consumer spending, vehicle demand and preferences (which can be affected by a number of factors, including fuel costs, employment levels and the availability of consumer financing). These factors could make it difficult for us, our suppliers and our customers to forecast accurately and plan future business activities. As the volume of automotive production and the mix of vehicles produced fluctuate, the demand for our products also fluctuates. Prolonged or material contraction in automotive sales and production volumes, or significant changes in the mix of vehicles produced, could cause our customers to reduce orders of our products, which could adversely affect our business, results of operations and financial condition.conditionand our ability to provide accurate forecasts and guidance.
We may not realize sales represented by awarded business, which could adversely affect our business, financial condition, results of operations and cash flows.
The realization of future sales from awarded business is subject to risks and uncertainties inherent in the cyclicality of vehicle production. In addition, our customers generally have the right to resource awarded business without penalty. Therefore, the ultimate amount of our sales is not guaranteed. If actual production orders from our customers are not consistent with the projections we use in calculating the amount of awarded business, we could realize substantially less sales and profit over the life of these awards than currently projected.
Escalating pricingPricing pressures may adversely affect our business.
Pricing pressure in the automotive supply industry has been substantial and is likely to continue. Nearly all vehicleVehicle manufacturers often seek price reductions in both the initial bidding process and during the term of the contract. Price reductions historically have adversely impacted our sales and profit margins and are expected tomay do so in the future. If we are not able
to offset continued price reductions through improved operating efficiencies and reduced expenditures, those price reductions may have a negative impact on our financial condition.
Our business could be adversely affected if we lose any of our largest customers or significant platforms.
While we provide parts to virtually every major global OEM for use on a wide range of different platforms, sales to our three largest customers, Ford, GM, and FCA,Stellantis, on a worldwide basis represented approximately 54%55% of our sales for the year ended December 31, 2020.2023. Our ability to reduce the risks inherent in certain concentrations of business will depend, in part, on our ability to continue to diversify our sales on a customer, product, platform and geographic basis. Although business with each customer is typically split among numerous contracts, the loss of a major customer, significant reduction in purchases of our
products by such customer, or any discontinuance or resourcing of a significant platform could adversely affect our business, results of operations and financial condition.
We operate in a highly competitive industry and efforts by our competitors to gain market share could adversely affect our financial performance.
The automotive parts industry is highly competitive. We face numerous competitors in each of our product lines. In general, there are three or more significant competitors and numerous smaller competitors for most of the products we offer. We also face competition for certain of our products from suppliers producing in lower-cost regions such as Asia and Eastern Europe. Our competitors’ efforts to grow market share could exert downward pressure on the pricing of our products and our margins.
The benefits of our continuous improvement programprograms and other cost savings plans may not be fully realized.
Our operations strategy includes continuous improvement programs and implementation of lean manufacturing tools across all facilities to achieve cost savings and increased performance. Further, we have and may continue to initiate restructuring actions designed to improve future profitability and competitiveness. The cost savings that we anticipate from these initiatives may not be achieved on schedule or at the level we anticipate. If we are unable to realize these anticipated savings, our operating results and financial condition may be adversely affected.
We may continue to incur significant costs related to manufacturing facility closings or consolidation which could have an adverse effect on our financial condition.
If we close or consolidate manufacturing locations, the exit costs associated with such closures or consolidation, including employee termination costs, may be significant. Such costs could negatively affect our cash flows, results of operations and financial condition.
We are subject to other risks associated with our international operations.
We have significant manufacturing operations outside the United States, including joint ventures and other alliances. Our operations are located in 21 countries, and we export to several other countries. In 2020,2023, approximately 78% of our sales were attributable to products manufactured outside the United States. Risks inherent in our international operations include:
•currency exchange rate fluctuations, currency controls and restrictions, and the ability to hedge currencies;
•changes in local economic conditions;
•repatriation restrictions or requirements, including tax increases on remittances and other payments by our foreign subsidiaries;
•global sovereign fiscal uncertainty and hyperinflation in certain foreign countries;
•changes in laws and regulations, including laws or policies governing the terms of foreign trade, and in particular increased trade restrictions, tariffs, or taxes or the imposition of embargoes on imports from countries where we manufacture products;
•operating in foreign jurisdictions where the ability to protect and enforce rights overour intellectual property rights is limited as a statutory or practical matter;
•continued political, economic and regulatory uncertainty as a result of the United Kingdom’s withdrawal from the European Union (“Brexit”) on January 31, 2020, and the expiration of the transition period on December 31, 2020, including with respect to potential import/export restrictions that would affect products we ship to U.K. customers primarily from continental Europe;
•exposure to possible expropriation or other government actions;
•disease, pandemics or other severe public health events; and
•exposure to local political or social unrest including resultant acts of war, terrorism, or similar events.events, including the wars in Ukraine and the Middle East and the related sanctions imposed on Russia.
The occurrence of any of these risks may adversely affect the results of operations and financial condition of our international operations and our business as a whole.
Expanding our sales and manufacturing operations in the Asia Pacific region, particularly in China, is an integral part of our strategy, and, as a result, our exposure to the risks described above is substantial.
In addition, we are subject to the Foreign Corrupt Practices Act (the “FCPA”) and other laws which prohibit improper payments to foreign governments and their officials by U.S. and other business entities. Certain of the countries in which we operate present heightened corruption risks, which therefore increases the risks of our exposure under the FCPA and other applicable anti-bribery and corruption laws and regulations.
We may continue to incur significant costs related to manufacturing facility closings or consolidation which could have an adverse effect on our financial condition.
If we must close or consolidate manufacturing locations, the exit costs associated with such closures or consolidation, including employee termination costs, may be significant. Such costs could negatively affect our cash flows, results of operations and financial condition.
A portion of our operations are conducted by joint ventures which have unique risks.
Certain of our operations are carried out by joint ventures. In joint ventures, we share the management of the company with one or more partners who may not have the same goals, resources or priorities as we do. The operations of our joint ventures are subject to agreements with our partners, which typically include additional organizational formalities as well as requirements to share information and decision making and may also limit our ability to sell our interest. Additional risks include one or more partners failing to satisfy contractual obligations, a change in ownership of any of our partners and our limited ability to control our partners’ compliance with applicable laws, including the FCPA. Any such occurrences could adversely affect our financial condition, operating results, cash flow or reputation.
Any acquisitions or divestitures we make may be unsuccessful, may take longer than anticipated or may negatively impact our business, financial condition, results of operations and cash flows.
We may pursue acquisitions or divestitures in the future as part of our strategy. Acquisitions and divestitures involve numerous risks, including identifying attractive target acquisitions, undisclosed risks affecting the target, difficulties integrating acquired businesses, the assumption of unknown liabilities, potential adverse effects on existing customer or supplier relationships, and the diversion of management’s attention from day-to-day business. We may not have, or be able to raise on acceptable terms, sufficient financial resources to make acquisitions. Our ability to make investments may also be limited by the terms of our existing or future financing arrangements. Any acquisitions or divestitures we pursue may not be successful or prove to be beneficial to our operations and cash flow.
Financial Risks
FailureGlobal, market and economic conditions could impact our ability to maintain effective controlsaccess liquidity sources.
Our continued access to sources of liquidity depends on multiple factors, including global economic conditions, public health events and proceduresany global supply chain disruptions on our customers and their production rates, the costs of raw materials, the state of the overall automotive industry, the condition of global financial markets, the availability of sufficient amounts of financing, our operating performance and cash flows and our credit ratings. In particular, the global automotive industry is susceptible to uncertain economic conditions that could adversely impact new vehicle demand and production, and business conditions may vary significantly from period to period or region to region. In recent years, global automotive production was negatively impacted by lingering impacts of the COVID-19 pandemic and broad supply chain challenges stemming, in part, from a sharp rebound in overall industrial demand. Further, rising inflation, interest rates and supply chain challenges contributed to global economic uncertainty. In addition, continuing military actions in Eastern Europe and the Middle East are having broad negative impacts on key sectors of the global economy. Our business is also directly affected by the automotive vehicle production rates in North America, Europe, Asia Pacific and South America which have been adversely impacted by a series of events in recent years.
Our ability to borrow against our senior asset-based revolving credit facility (the “ABL Facility”) is limited to our borrowing base, which consists primarily of our U.S. and Canadian accounts receivable and inventory. Production shutdowns or disruptions in both the United States and Canada could lead to significant reductions in these working capital balances and significantly decrease our ability to borrow under our ABL Facility.
In addition, if the Company has borrowing availability under its ABL Facility less than the greater of (i) $15.0 million and (ii) 10% of the Borrowing Base (as defined in the ABL Facility), it must be in compliance with a springing Fixed Charge Coverage Ratio maintenance covenant of 1.00:1.00. Any adverse effects on the Company’s business financial conditiondue to global, market and economic conditions may adversely impact the Company’s ability to satisfy such covenant. As of December 31, 2023, there were no obligations outstanding under the ABL Facility, the Company’s borrowing base was $169.5 million and the monthly fixed charge coverage ratio was at a level that provided the Company full access to the borrowing base. Net of $7.1 million of outstanding letters of credit, the Company effectively had $162.4 million available for borrowing under its ABL Facility.
Furthermore, production shutdowns or disruptions will result in working capital swings which could result in increased outflows. As a result of current ecomonic conditions and global supply chain disruptions, we may be required to raise additional capital, and our access to and cost of financing will depend on, among other things, our performance, changing global economic conditions, conditions in the global financing markets, the availability of sufficient amounts of financing, our prospects and our credit ratings. Such capital may not be available on favorable terms or at all.
The ongoing situations in Ukraine and Russia and the Middle East and related disruptions could adversely affect our liquidity, business, and results of operations.
Regulatory provisions governingThe ongoing military conflict between Russia and Ukraine and the resulting sanctions have caused, and are currently expected to continue to cause, significant disruptions to the global financial reportingsystem, international trade, and the transportation and energy sectors, among others. The impacts of the conflict on the supply chain and commodity prices are expected to be profound and have resulted and may continue to result in substantial inflation in one or more countries (or globally). In addition, the recent Israel-Hamas war and escalating tensions in the Middle East could affect oil prices and have other, potentially recessionary, effects on the global economy. Prolonged inflationary conditions and periods of high interest rates could further negatively affect U.S. public companies require that we establish and maintain disclosure controlsinternational commerce and internal controls overexacerbate or further extend the period of high energy prices and supply chain constraints. These and other issues resulting from the global economic slowdown and financial reporting acrossmarket turmoil have adversely affected and may continue to adversely affect the automotive industry, which may lead to a decline in the general demand for our products and erosion of their procurement or sale prices. We do not have operations in 21 countries. Any controlsUkraine, Russia or the Middle East, nor do we sell into these markets. Nonetheless, if the global economic slowdown and procedures, no matter how well designedthe Russia-Ukraine and operated, can provide only reasonable assurance of achieving the desired control objectives; as such, they can be susceptible to human error, circumvention or override,Israel-Hamas wars continue, our liquidity, business, and fraud. Failure to maintain adequate, effective controls and procedures could result in potential financial misstatements or other forms of noncompliance that could have an adverse impact on our business, results of operations financial condition or organizational reputation.
Foreign currency exchange rate fluctuations could materially impact our operating results.
Our sales and manufacturing operations outside the United States expose usmay continue to currency risks. For our consolidated financial statements, our sales and earnings denominated in foreign currencies are translated into U.S. dollars. This translation is calculated based on average exchange rates during the reporting period. Accordingly, our reported international sales and earnings could be adversely impacted in periods of a strengthening U.S. dollar.
Although we generally produce in the same geographic region as our products are sold, we also produce in countries that predominately sell in another currency. Further, some of our commodities are purchased in or tied to the U.S. dollar; therefore our earnings could be adversely impacted during the periods of a strengthening U.S. dollar relative to other foreign currencies. While we employ financial instruments to hedge certain portions of our foreign currency exposures, our efforts to manage these risks may not be successful and may not completely insulate us from the effects of currency fluctuation.
Impairment charges relating to our goodwill, long-lived assets or intangible assets could adversely affect our results of operations.
We regularly monitor our goodwill, long-lived assets and intangible assets for impairment indicators. In conducting our goodwill impairment testing, we compare the fair value of our North America reporting unit to its related net book value. In conducting our impairment analysis of long-lived and intangible assets, we compare the undiscounted cash flows expected to be generated from the long-lived or intangible assets to the related net book values. Changes in economic or operating conditions impacting our estimates and assumptions could result in the impairment of our goodwill, long-lived assets or intangible assets. In the event that we determine that our goodwill, long-lived assets or intangible assets are impaired, we may be required to record a significant charge to earnings, which could adversely affect our results of operations.affected.
We have a substantial amount of indebtedness, which could have a material adverse effect on our financial condition and our ability to obtain financing in the future and to react to changes in our business.
For discussionWe have a significant amount of our debt and financing arrangements, including our senior term loan facility (“Term Loan Facility”), 5.625% Senior Notes due 2026 (“Senior Notes”), 13.0% Senior Secured Notes due 2024 (“Senior Secured Notes”), our senior
asset-based revolving credit facility (“ABL Facility”) and debtindebtedness. As of certain foreign subsidiaries, see “Liquidity and Capital Resources - Financing Arrangements” in Item 7. “Management’s Discussion and AnalysisDecember 31, 2023, we had total indebtedness of Financial Condition and Results of Operations” and Note 11. “Debt” to the consolidated financial statements included under Item 8. “Financial Statements and Supplementary Data” of this Report.
$1,095 million. Our substantial amount of debt and our debt service obligations could limit our ability to satisfy our obligations, limit our ability to operate our business and impair our competitive position. For example, it could:
•make it more difficult for us to satisfy our obligations;
•increase our vulnerability to general adverse economic and general industry conditions, including interest rate fluctuations, because a portion of our borrowings accrues interest at variable rates;
•require us to dedicate a substantial portion of our cash flows from operations to payments on our debt and debt service obligations, which would reduce the availability of cash to fund working capital, capital expenditures, research and development efforts, acquisitions or other general corporate purposes;
•limit our flexibility in planning for, or reacting to, changes in our business and industry;the markets in which we compete;
•place us at a disadvantage compared to competitors that may have proportionately less debt; and
•limit our ability to obtain additional debt or equity financing due to applicable financialfor working capital, capital expenditures, research and restrictive covenants in ourdevelopment efforts, debt agreements;service requirements, acquisitions and
•increase our cost of borrowing. general corporate purposes.
Our ability to make scheduled payments on our debt or to refinance these obligations depends on our financial condition, operating performance and our ability to generate cash in the future. If our cash flows and capital resources are insufficient to fund our debt service obligations, we may be forced to reduce or delay investments and capital expenditures, sell material assets, seek additional capital or restructure or refinance our indebtedness, any of which could have a material adverse effect on our business, results of operations and financial condition. In addition, we may not be able to effect any of these actions, if necessary, on commercially reasonable terms or at all. Our ability to restructure or refinance our indebtedness will depend on the condition of the capital markets and our financial condition at such time. Any refinancing of our debt could be at higher interest rates and may require us to comply with more onerous covenants, which could further restrict our business operations. The terms of existing or future debt instruments, including the credit agreementsagreement governing the Term Loan Facility and the ABL Facility and the indentures governing the 13.50% Cash Pay / PIK Toggle Senior Secured First Lien Notes due 2027 (the “First Lien Notes”) and the 5.625% Cash Pay / 10.625% PIK Toggle Senior Secured Third Lien Notes due 2027 (the “Third Lien Notes”), may limit or prevent us from taking any of these actions. In addition, a reduction of our credit rating could harm our ability to incur additional indebtedness on commercially reasonable terms or at all. An inability to generate sufficient cash flow to satisfy our debt service obligations, or to refinance or restructure our obligations on commercially reasonable terms or at all, would have an adverse effect, which could be material, on our business, financial condition and results of operations, as well as on our ability to satisfy our obligations in respect of the Term Loan Facility, the5.625% Senior Notes due 2026 (the “2026 Senior Notes”), the Senior SecuredFirst Lien Notes, the Third Lien Notes, or the ABL Facility.
In addition, we and our subsidiaries may be able to incur other substantial additional indebtedness in the future. Although the credit agreementsagreement governing the Term Loan Facility and the ABL Facility and the indentures governing the SeniorFirst Lien Notes and the Senior SecuredThird Lien Notes contain certain limitations on our ability to incur additional indebtedness, they do not prohibit us from incurring obligations that do not constitutesuch restrictions are subject to a number of qualifications and exceptions, and the indebtedness as defined therein.incurred in compliance with these restrictions could be substantial. To the extent that we incur additional indebtedness or incur such other obligations that may be permitted under our debt instruments, the
risks associated with our substantial indebtedness described above, including our potential inability to service our debt, will increase.
Our variable rate indebtedness subjects us to interest rate risk, which could cause our indebtedness service obligations to increase significantly.
The borrowings under the ABL Facility and the Term Loan Facility are at variable rates of interest and expose us to interest rate risk. If interest rates increase, our debt service obligations on the variable rate indebtedness would increase even though the amount borrowed remained the same, and our net income and cash flows, including cash available for servicing our indebtedness, would correspondingly decrease.
LIBORSecured overnight financing rate (“SOFR”) and other interest rates that are indices deemed to be “benchmarks” are the subject of recent and ongoing national, international and other regulatory guidance and proposals for reform. Some of these reforms are already effective, while others are still to be implemented. These reforms may cause such benchmarks to perform differently than in the past, to be replaced or to disappear entirely, or have other consequences that cannot be predicted. Any such consequence could have a material adverse effect on our existing facilities our interest rate swap agreement or our future debt linked to such a “benchmark” and our ability to service debt that bears interest at floating rates of interest.
Our debt instruments impose significant operating and financial restrictions on us and our subsidiaries.
The credit agreements governing the Term Loan Facility and the ABL Facility and the indentures governing the SeniorFirst Lien Notes and the Senior SecuredThird Lien Notes impose significant operating and financial restrictions and limit our ability, among other things, to:
•incur, assume or permit to exist additional indebtedness (including guarantees thereof);
•pay dividends or certain other distributions on our capital stock or repurchase our capital stockstock;
•prepay, redeem or prepay subordinatedrepurchase indebtedness;
•incur liens on assets;
•make certain investments or other restricted payments;
•allow to exist certain restrictions on the ability of our restricted subsidiaries to pay dividends or make other payments to us;
•engage in transactions with affiliates;
•alter the business that we conduct; and
•sell certain assets or merge or consolidate with or into other companies.
Moreover, our ABL Facility provides the agent considerable discretion to impose reserves, which could materially reduce the amount of borrowings that would otherwise be available to us.
As a result of these covenants and restrictions (including borrowing base availability), we are limited in how we conduct our business, and we may be unable to raise additional debt or equity financing to compete effectively or to take advantage of new business opportunities or acquisitions. The terms of any future indebtedness we may incur could include more restrictive covenants. We may not be able to maintain compliance with these covenants in the future and, if we fail to do so, we may not be able to obtain waivers from the lenders and/or amend the covenants in such agreements. Our failure to comply with the restrictive covenants described above as well as others contained in our future debt instruments from time to time could result in an event of default, which, if not cured or waived, could result in our being required to repay these borrowings before their due date. If we are forced to refinance these borrowings on less favorable terms or if we are unable to refinance such borrowings at all, our financial condition, results of operations and cash flows could be adversely affected.
If there were an event of default under any of the agreements relating to our outstanding indebtedness whether as a result of a payment default, covenant breach or otherwise, the holders of the defaulted debt could cause all amounts outstanding with respect to that debt to be due and payable immediately. Our assets or cash flow may not be sufficient to fully repay borrowings under our outstanding debt instruments if accelerated upon occurrence of an event of default. Further, if we are unable to repay, refinance or restructure our indebtedness under our secured debt, the holders of such debt could exercise remedies against the collateral securing that indebtedness.indebtedness with the holders of the First Lien Notes receiving full recovery on applicable collateral before the holders of the Third Lien Notes. In addition, any event of default or declaration of acceleration under one debt instrument could also result in an event of default under one or more of our other debt instruments. As a result, any default by us on our indebtedness could have a material adverse effect on our business, financial condition and results of operation.
Our expected annual effective tax rate and cash tax liability could be volatile and could materially change as a result of changes in many items including mix of earnings, debt and capital structure and other factors.
Many items could impact our effective tax rate and cash tax liability including changes in our debt and capital structure, mix of earnings and many other factors. Our overall effective tax rate is based upon the consolidated tax expense as a percentage of consolidated earnings before tax. However, tax expenses and benefits are not recognized on a consolidated or global basis, but rather on a jurisdictional, legal entity basis. Further, certain jurisdictions in which we operate generate losses where no current financial statement tax benefit is realized. In addition, certain jurisdictions have statutory rates greater than or less than the United States statutory rate. As such, changes in the mix and source of earnings between jurisdictions could have a significant impact on our overall effective tax rate and cash tax liability in future years. Changes in rules related to accounting for income taxes, changes in tax laws and rates or adverse outcomes from tax audits that occur regularly in any of our jurisdictions could also have a significant impact on our overall effective tax rate and cash tax liability in future periods.
Our pension plans are currently underfunded, and we may have to make cash contributions to the plans, reducing the cash available for our business.
We sponsor various pension plans worldwide that are underfunded and will require cash contributions. Additionally, if the performance of the assets in our pension plans does not meet our expectations, or if other actuarial assumptions are modified, our required contributions may be higher than we expect. As of December 31, 2020, our pension plans were underfunded by $144.9 million. If our cash flow from operations is insufficient to fund our worldwide pension liabilities, it could have an adverse effect on our financial condition and results of operations.
Our working capital requirements may negatively affect our liquidity and capital resources.
Our working capital requirements can vary significantly, depending in part on the level, variability and timing of our customers’ worldwide vehicle production and the payment terms with our customers and suppliers. If our working capital needs exceed our cash provided by operating activities, we would look to our cash balances and availability under our borrowing arrangements to satisfy those needs, as well as potential sources of additional capital, which may not be available on satisfactory terms and in adequate amounts, if at all.
Foreign currency exchange rate fluctuations could materially impact our operating results.
Our sales and manufacturing operations outside the United States expose us to currency risks. For our consolidated financial statements, our sales and earnings denominated in foreign currencies are translated into U.S. dollars. This translation is calculated based on average exchange rates during the reporting period. Accordingly, our reported international sales and earnings could be adversely impacted in periods of a strengthening U.S. dollar.
Although we generally produce in the same geographic region as our products are sold, we also produce in countries that predominately sell in another currency. Further, some of our commodities are purchased in or tied to the U.S. dollar; therefore our earnings could be adversely impacted during the periods of a strengthening U.S. dollar relative to other foreign currencies. While we employ financial instruments to hedge certain portions of our foreign currency exposures, our efforts to manage these risks may not be successful and may not completely insulate us from the effects of currency fluctuations.
Impairment charges relating to our goodwill, long-lived assets or intangible assets could adversely affect our results.
We regularly monitor our goodwill, long-lived assets and intangible assets for impairment indicators. In conducting our goodwill impairment testing, we compare the fair value of our reporting units to their related net book value. In conducting our impairment analysis of long-lived and intangible assets, we compare the undiscounted cash flows expected to be generated from the long-lived or intangible assets to the related net book values if indicators of impairment are identified. Changes in economic or operating conditions impacting our estimates and assumptions could result in the impairment of our goodwill, long-lived assets or intangible assets. In the event that we determine that our goodwill, long-lived assets or intangible assets are impaired, we may be required to record a significant charge to earnings, which could adversely affect our results.
Certain of our pension plans are currently underfunded, and we may have to make cash contributions to the plans, reducing the cash available for our business.
We sponsor various pension plans worldwide that are underfunded and will require cash contributions. Additionally, if the performance of the assets in our pension plans does not meet our expectations, or if other actuarial assumptions are modified, our required contributions may be higher than we expect. As of December 31, 2023, our U.S. pension plans were underfunded by $14.4 million and our non-U.S. pension plans (which typically are pay-as-you-go plans) were underfunded by $92.2 million. If our cash flow from operations is insufficient to fund our worldwide pension liabilities, it could have an adverse effect on our financial condition and results of operations.
As further described in Note 12. “Pension” to the consolidated financial statements in Item 8. “Financial Statements and Supplementary Data” of this Report, our Board of Directors approved a resolution to merge certain of the U.S. pension plans, and terminate the resulting merged plan effective December 31, 2022. As part of the termination process, we expect to settle benefit obligations under the terminated plan through a combination of lump sum payments to eligible plan participants and the purchase of a group annuity contract, under which future benefit obligations and administration will be transferred to a third-party insurance company. Such settlements will be funded primarily from plan assets, but may also require funding from the Company. In the fourth quarter of 2023, the Company paid $48.6 million of lump sum payments to eligible participants from
plan assets, resulting in a settlement loss of $16.3 million during the year ended December 31, 2023. Ultimate settlement of the remaining benefit obligations is dependent upon market conditions at the time of settlement.
Significant changes in discount rates, the actual return on pension assets and other factors could adversely affect our liquidity, results of operations and financial condition.
Our earnings may be positively or negatively impacted by the amount of income or expense recorded related to our pension plans. Generally accepted accounting principles in the United States (“U.S. GAAP”) require that income or expense related to the pension plans be calculated at the annual measurement date using actuarial calculations, which reflect certain assumptions. Because these assumptions have fluctuated and will continue to fluctuate in response to changing market conditions, the amount of gains or losses that will be recognized in subsequent periods, the impact on the funded status of the pension plans and the future minimum required contributions, if any, could adversely affect our liquidity, results of operations and financial condition.
Failure to maintain effective controls and procedures could adversely impact our business, financial condition and results of operations.
Regulatory provisions governing the financial reporting of U.S. public companies require that we establish and maintain disclosure controls and internal controls over financial reporting across our operations in 21 countries. Any controls and procedures, no matter how well designed and operated, can provide only reasonable assurance of achieving the desired control objectives; as such, they can be susceptible to human error, circumvention or override, and fraud. Failure to maintain adequate, effective controls and procedures could result in potential financial misstatements or other forms of noncompliance that could have an adverse impact on our business, results of operations, financial condition or organizational reputation.
We operate as a holding company and depend on our subsidiaries for cash to satisfy the obligations of the holding company.
Cooper-Standard Holdings Inc. is a holding company. Our subsidiaries conduct all of our operations and own substantially all of our assets. Our cash flow and our ability to meet our obligations depend on the cash flow of our subsidiaries. In addition, the payment of funds in the form of dividends, intercompany payments, tax sharing payments and otherwiseother payments may be subject to restrictions under the laws of the countries of incorporation of our subsidiaries or their governing documents.
We may not be able to procure insurance at reasonable rates to fully meet our needs.
Integral to our risk management strategy and due to requirements under certain of our contracts, we procure insurance coverage from third partythird-party insurers. There can be no assurance that any of our existing insurance coverage will be renewable upon the expiration of the coverage period or that future coverage will be affordable at needed limits. Such circumstances will lead to an increase in both our overall risk exposure and our operational expenses, disrupt the management of our business, and could have a material adverse effect on our business, financial condition and results of our operations.
The COVID-19 pandemic risk presents significant risks to our liquidity.
Our continued access to sources of liquidity depends on multiple factors, including global economic conditions, the effects of the COVID-19 pandemic on our customers and their production rates, the condition of global financial markets, the availability of sufficient amounts of financing, our operating performance and our credit ratings. While we currently have no outstanding borrowings under our ABL facility, our ability to borrow against the ABL facility is limited to our borrowing base, which consists primarily of our U.S. and Canadian accounts receivable and inventory. Production shutdowns in both the US and Canada could lead to significant reductions in these working capital balances and significantly decrease our ability to borrow under our ABL facility.
In addition, if the Company has availability for borrowing under its ABL facility less than the greater of (i) $15.0 million and (ii) 10% of the Borrowing Base (as defined in the ABL facility), it must be in compliance with a springing Fixed Charge Coverage Ratio maintenance covenant of 1.00:1.00. The Company currently would not be able to satisfy such covenant and does not expect to be able to for the foreseeable future due to the impact of the COVID-19 pandemic on its business. Accordingly, the Company intends to manage any borrowings under its ABL facility to avoid triggering this maintenance covenant, which would further constrain its ability to utilize the ABL facility. As of December 31, 2020, there were no obligations outstanding under the ABL Facility. The Company’s borrowing base was $173.7 million. Net the greater of 10% of the borrowing base or $15.0 million that cannot be borrowed without triggering the fixed charge coverage ratio maintenance covenant and $5.5 million of outstanding letters of credit, the Company effectively had $150.9 million available for borrowing under its ABL facility.
Furthermore, production shutdowns will result in working capital swings which could result in increased outflows. As a result of the impacts of the COVID-19 pandemic, we may be required to raise additional capital, and our access to and cost of financing will depend on, among other things, global economic conditions, conditions in the global financing markets, the availability of sufficient amounts of financing, our prospects and our credit ratings. Such capital may not be available on favorable terms or at all.
Legal and Compliance Risks
We are involved from time to time in legal and regulatory proceedings, claims or investigations which could have an adverse impact on our results of operations and financial condition.
We are involved in legal and regulatory proceedings, claims or investigations that, from time to time, may be significant. These matters typically arise in the normal course of business including, without limitation, commercial or contractual disputes, including warranty claims and other disputes with customers and suppliers; intellectual property matters; personal injury claims; environmental issues; tax matters; employment matters; antitrust matters; anti-corruption matters; or allegations relating to legal compliance by us or our employees.
For further information regarding our legal matters, see Item 3. “Legal Proceedings.” The industries in which we operate are also periodically reviewed or investigated by regulators, which could lead to enforcement actions, fines and penalties or the assertion of private litigation claims. It is not possible to predict with certainty the outcome of claims, investigations and lawsuits, and we could in the future incur judgments, fines or penalties or enter into settlements of lawsuits and claims that could have an adverse effect on our business, results of operations and financial condition in any particular period.
If we are unable to protect our intellectual property or if a third party challenges our intellectual property rights, our business could be adversely affected.
We own or have rights to proprietary technology that is important to our business. We rely on intellectual property laws, patents, trademarks and trade secrets to protect such technology. Such protections, however, vary among the countries in which we market and sell our products, and as a result, we may be unable to prevent third parties from using our intellectual property without authorization. Any infringement or misappropriation of our technology could have an adverse effect on our business and
results of operations. We also face exposure to claims by others for infringement of intellectual property rights and could incur significant costs or losses related to such claims. In addition, many of our supply agreements require us to indemnify our customers from third-party infringement claims. These claims, regardless of their merit or resolution, are frequently costly to prosecute, defend or settle and divert the efforts and attention of our management and employees. If any such claim were to result in an adverse outcome, we could be required to take actions which may include: ceasing the manufacture, use or sale of the infringing products; paying substantial damages to third parties, including to customers, to compensate them for the discontinued use of a product or to replace infringing technology with non-infringing technology; or expending significant resources to develop or license non-infringing products, any of which could adversely affect our operations, business and financial condition.
We may be adversely affected by laws and regulations, including environmental, health and safety laws and regulations.
We are subject to various U.S. federal, state and local, and non-U.S. laws and regulations, including those related to environmental, health and safety, financial, tax, customs and other matters. We cannot predict the substance or impact of pending or future legislation or regulations, or the application thereof. The introduction of new laws or regulations or changes in existing laws or regulations, or the interpretations thereof, could increase the costs of doing business for us or our customers or suppliers or restrict our actions and adversely affect our financial condition, results of operations and cash flows.
In particular, we are subject to a broad range of laws and regulations governing emissions to air; discharges to water; noise and odor emissions; the generation, handling, storage, transportation, treatment, reclamation and disposal of chemicals and waste materials; the cleanup of contaminated properties; and health and safety. We may incur substantial costs in complying with these laws and regulations. Many of our current and former facilities have been subject to certain environmental investigations and remediation activities, and we maintain environmental reserves for certain of these sites. Through various acquisitions, we have acquired a number of manufacturing facilities, and we cannot assure that we will not incur material costs or liabilities relating to activities that predate our ownership. Material future expenditures may be necessary if compliance standards change or material unknown conditions that require remediation are discovered. Environmental laws could also restrict our ability to expand our facilities or could require us to acquire costly equipment or to incur other significant expenses. In addition, climate change poses regulatory risks that could harm our results of operations or affect the way we conduct our businesses. For example, new or modified regulations could require us to spend substantial funds to enhance our environmental compliance efforts. If we fail to comply with present and future environmental laws and regulations, we could be subject to future liabilities, which could adversely affect our financial condition, operating results and cash flows.
Item 1B. Unresolved Staff Comments
None.
Item 1C. Cybersecurity
Risk Management and Strategy
One of our organization’s top priorities is protecting Cooper Standard’s digital assets, and we increasingly rely on data and digital transactions to operate efficiently and effectively. We take action to prevent potential impacts related to system outages, data breaches, cyber-attacks and other threats to avoid disruption to our daily operations. Cooper Standard prioritizes increasing efficiency and efficacy as we design and refresh prescriptive incident response procedures to minimize impacts of potential cyber-attacks or outages. From time to time, the Company engages in table-top exercises, which involve cross-functional business leaders. Our information technology (“IT”) professionals focus on improving existing controls as outlined by ISO/IEC 27001:2022 (an internationally recognized information security framework), which is the foundation of our cybersecurity program. In recent years, we made advancements in this space by conducting a risk assessment carried out by an independent third-party and adding new cyber advisory services as described further below.
We annually contract with a well-known third-party to conduct a comprehensive, enterprise-wide risk assessment. In addition to other mandates, this assessment evaluates Cooper Standard’s cybersecurity program from a risk perspective and assesses our IT controls for alignment with the ISO/IEC 27001:2022 information security framework. Based on the assessment results, we refresh the roadmap for our cybersecurity program, focusing on the highest-risk vulnerabilities first and monitoring for significant changes and emerging risks, continuously adjusting the roadmap as needed.
Our cybersecurity program is built on a collection of fundamental security controls, focused on the overall protection of company and stakeholder data. Company leadership has defined the following objectives for information security:
•Governance: Establish proper governance for the cybersecurity program.
•Security Operations & Data Protection: Create a secure digital operating environment (apps, networks, systems, etc.) designed to protect critical data and to prevent business disruption.
•Response and Recovery: Develop and practice incident response, business continuity and disaster recovery processes to minimize the impact of a major incident.
•Compliance & Effectiveness: Meet all compliance requirements and develop program metrics to ensure effectiveness.
To achieve these objectives, we emphasize fundamental security measures, such as access controls, cyber hygiene (e.g., patching and malware protection) and employee awareness training.
Third-party risk management is an important focus of the Cooper Standard cybersecurity program. Cybersecurity is evaluated and considered throughout the lifecycle (onboarding, ongoing operations, offboarding) of third-party relationships as we conduct business with them. We review the security posture of each third-party prior to initiation of the relationship, and periodically throughout the relationship. We evaluate several aspects of information security, utilizing guidance from globally recognized frameworks (e.g., ISO 27000:2022). Critical service providers are also required to submit independently certified assurance of their security controls based on internationally recognized standards (e.g., ISEA 3402, SOC 1, SOC 2, etc.). Finally, upon relationship termination, we ensure each third party is properly offboarded, addressing critical cybersecurity concerns such as eliminating access and obtaining and/or deleting Company data.
Cooper Standard continuously works to update and strengthen our Incident Response (“IR”) program, which defines response procedures and prescriptive controls designed to streamline response to incidents, when and if they occur. Our designated cross-functional Incident Response Team (“IRT”) consists of leaders from human resources, global communications, legal, internal audit and information technology. Cooper Standard’s IRT is dedicated to maintaining a culture of continuous improvement, taking into consideration lessons learned from table-top exercises and feedback from the third-party expert with whom we annually contract.
While we have experienced threats to our data and systems, to date, we have not experienced a cybersecurity incident that has materially affected our business strategy, results of operations, or financial condition. That said, a significant cybersecurity incident may materially impact the Company’s business strategy, results of operations and financial condition in the future. For further information regarding cybersecurity risks to the Company, see Part 1, Item 1A, Risk Factors, “A disruption in, or the inability to successfully implement upgrades to, our information technology systems, including disruptions relating to cybersecurity as well as data privacy concerns, could adversely affect our business and financial performance.”
Governance
We align our cybersecurity and IT compliance programs to take advantage of natural synergies and our IT controls environment. Our Senior Vice President, Chief Information Technology Officer, who has more than 25 years of experience in technology and information security risk management in our industry and across a number of organizations, is responsible for overseeing the risks related to cybersecurity. Our cybersecurity team holds several cybersecurity industry certifications such as ISC2 CISSP, ISACA CISM and EC-Council CEH.
The Cooper Standard IT leadership team manages the global cybersecurity and IT compliance organization, and the Senior Vice President, Chief Information Technology Officer directly reports updates to the Audit Committee of the Board of Directors at least twice annually and the full Board of Directors at least annually. Further, our cybersecurity team periodically reports to our Global Leadership Team (“GLT”). Data privacy, cybersecurity and digitization is also managed as a material topic as a part of our Enterprise Risk Management (“ERM”) Committee which ensures cybersecurity risks are integrated into our overall risk management. From an accountability perspective, our internal audit team independently assesses the cybersecurity program by evaluating the design and effectiveness of our controls. We have an Architecture Review Board (“ARB”) which reviews new IT initiatives to ensure they align with our digital strategy. Similarly, our Project Management Office (“PMO”) monitors those initiatives throughout implementation to ensure proper communication and seamless transition. The ARB and PMO processes include cybersecurity requirements designed to ensure this topic is considered from the beginning.
Item 2. Properties
As of December 31, 2020,2023, our operations were conducted through 121128 wholly-owned, leased and consolidated joint venture facilities in 21 countries (North and Central America: Canada, Costa Rica, Mexico, United States; Asia Pacific: China, India, Japan, South Korea, Thailand; Europe: Czech Republic, France, Germany, Italy, Netherlands, Poland, Romania, Serbia, Spain, Sweden, United Kingdom; South America: Brazil), of which 7278 are predominantly manufacturing facilities and 4950 have design, engineering, administrative or logistics designations. Our corporate headquarters are located in Northville, Michigan. Our manufacturing facilities are located in North America, Central America, Europe, Asia and South America. We believe that substantially all of our properties are in generally good condition and there is sufficient capacity to meet current and projected manufacturing, product development and logistics requirements. The following table summarizes our key property holdings:
| | Segment | Segment | | Type | | Total Facilities* | | Owned Facilities | Segment | | Type | | Total Facilities* | | Owned Facilities |
| North America | North America | | Manufacturing (a) | | 32 | | | 19 | | North America | | Manufacturing (a) | | 35 | | 21 |
| Other (b) | | 26 | | | 1 | |
| | Other (b) | | | | Other (b) | | 24 | | 1 |
| Europe | | Europe | | Manufacturing (a) | | 21 | | 12 |
| | Other (b) | | | | Other (b) | | 17 | | 2 |
| Asia Pacific | Asia Pacific | | Manufacturing (a) | | 17 | | | 6 | | Asia Pacific | | Manufacturing (a) | | 19 | | 6 |
| Other (b) | | 5 | | | — | |
| Europe | | Manufacturing (a) | | 19 | | | 10 | |
| Other (b) | | 17 | | | — | |
| | Other (b) | | | | Other (b) | | 9 | | — |
| South America | South America | | Manufacturing (a) | | 4 | | | 1 | | South America | | Manufacturing (a) | | 3 | | 1 |
| | Other (b) | | 1 | | | — | |
(a)Includes multi-activity sites which are predominantly manufacturing.
(b)Includes design, engineering, R&D, administrative and logistics locations.
(*) Excludes 32 unutilized facilities: 2 Europe; 1 in North America
(*) Includes 13 R&D facilities worldwide. and 1 in Europe.
Item 3. Legal Proceedings
The litigation process is subject to many uncertainties, and the outcome of individual matters is not predictable with assurance. See Note 23.20. “Contingent Liabilities” to the consolidated financial statements included in Item 8. “Financial Statements and Supplementary Data” of this Report for discussion of loss contingencies.
Item 4. Mine Safety Disclosures
Not applicable.
PART II
Item 5. Market for Registrant's Common Equity, Related Stockholder Matters and Issuer Purchases of Equity
Securities
Market Information
Our common stock has been traded on the NYSE since October 17, 2013 under the symbol “CPS.”
Holders of Common Stock
As of February 10, 2021,9, 2024, there were approximately 76 holders of record of our common stock. This stockholder figure does not include a substantially greater number of holders whose shares are held of record by banks, brokers and other financial institutions.
Dividends
Cooper-Standard Holdings Inc. has never paid or declared a dividend on its common stock. The declaration of any prospective dividends is at the discretion of the Board of Directors and would be dependent upon sufficient earnings, capital requirements, financial position, general economic conditions, state law requirements and other relevant factors. Additionally, our credit agreements governing our ABL Facility and Term Loan Facility and our indentures governing our SeniorNew Notes and 2026 Senior Secured Notes contain covenants that, among other things, restrict our ability to pay certain dividends and distributions subject to certain qualifications and limitations. See “Liquidity and Capital Resources” under Item 7. “Management’s Discussion and Analysis of Financial Condition and Results of Operations” of this Report. We do not anticipate paying any dividends on our common stock in the foreseeable future.
Securities Repurchase Program
In June 2018, our Board of Directors approved a common stock repurchase program (the “2018 Program”) authorizing us to repurchase, in the aggregate, up to $150.0 million of our outstanding common stock. Under the 2018 Program, repurchases may be made on the open market, through private transactions, accelerated share repurchases, round lot or block transactions on the New York Stock Exchange or otherwise, as determined by our management and in accordance with prevailing market conditions and federal securities laws and regulations. We expect to fund any future repurchases from cash on hand and future cash flows from operations. We are not obligated to acquire a particular amount of securities, and the 2018 Program may be discontinued at any time at the Company’s discretion. The 2018 Program was effective beginning November 2018.
We did not repurchase any shares during the years ended December 31, 2023, 2022, or 2021 under the 2018 Program. As of December 31, 2020,2023, we had approximately $98.7 million of repurchase authorization remaining.
A summary of shares of our common stock repurchased during the three months ended December 31, 2020 is shown below:
| | | | | | | | | | | | | | | | | | | | | | | | | | |
| Period | | Total Number of Shares Purchased (1) | | Average Price Paid per Share | | Total Number of Shares Purchased as Part of Publicly Announced Plans or Programs | | Approximate Dollar Value of Shares that May Yet be Purchased Under the Program (in millions) |
| October 1, 2020 through October 31, 2020 | | 74 | | | $ | 18.23 | | | — | | | $ | 98.7 | |
| November 1, 2020 through November 30, 2020 | | 132 | | | $ | 15.69 | | | — | | | $ | 98.7 | |
| December 1, 2020 through December 31, 2020 | | — | | | $ | — | | | — | | | $ | 98.7 | |
| Total | | 206 | | | | | — | | | $ | 98.7 | |
(1) Represents shares repurchased by the Company to satisfy employee tax withholding requirements due upon the vesting of restricted stock awards.
Performance Graph
The following graph comparesand corresponding table compare the cumulative total stockholder return for Cooper-Standard Holdings Inc. to the Standard & Poor’s 500 Index and the Standard & Poor’s Supercomposite Auto Parts & Equipment Index based on currently available data. The graphanalysis assumes an initial investment of $100 on December 31, 20152018 and reflects the cumulative total return on that investment, including the reinvestment of all dividends where applicable, through December 31, 2020.2023.
Comparison of Cumulative Return
| | | | | | | | | | | | | | | | | | | | | | | | | | | | | | | | | | | | | | | | | | | | |
| | Ticker | | 12/31/2015 | | 12/30/2016* | | 12/29/2017* | | 12/31/2018 | | 12/31/2019 | | 12/31/2020 |
| Cooper-Standard Holdings Inc. | | CPS | | $ | 100.00 | | | $ | 133.24 | | | $ | 157.88 | | | $ | 80.06 | | | $ | 42.74 | | | $ | 44.68 | |
| S&P 500 | | SPX | | $ | 100.00 | | | $ | 109.63 | | | $ | 133.27 | | | $ | 127.40 | | | $ | 167.18 | | | $ | 197.23 | |
| S&P Supercomposite Auto Parts & Equipment Index | | S15AUTP | | $ | 100.00 | | | $ | 103.81 | | | $ | 136.36 | | | $ | 94.12 | | | $ | 124.98 | | | $ | 153.59 | |

| | | | | | | | | | | | | | | | | | | | | | | | | | | | | | | | | | | | | | | | | | | | |
| | Ticker | | 12/31/2018 | | 12/31/2019 | | 12/31/2020 | | 12/31/2021 | | 12/30/2022* | | 12/29/2023* |
| Cooper-Standard Holdings Inc. | | CPS | | $100.00 | | $53.38 | | $55.81 | | $36.08 | | $14.58 | | $31.46 |
| S&P 500 | | SPX | | $100.00 | | $128.63 | | $151.90 | | $194.80 | | $159.15 | | $200.92 |
| S&P Supercomposite Auto Parts & Equipment Index | | S15AUTP | | $100.00 | | $130.84 | | $161.12 | | $197.29 | | $133.20 | | $141.72 |
* Represents last trading day of the yearyear.
Item 6. Selected Financial Data
The selected financial data previously required by Item 301 of Regulation S-K has been omitted in reliance on SEC Release No. 33-10890, Management’s Discussion and Analysis, Selected Financial Data, and Supplementary Financial Information.[Reserved]
Item 7. Management’s Discussion and Analysis of Financial Condition and Results of Operations
This management’s discussion and analysis of financial condition and results of operations is intended to assist in understanding and assessing the trends and significant changes in our results of operations and financial condition. Our historical results may not indicate, and should not be relied upon as an indication of, our future performance. Our forward-looking statements reflect our current views about future events, are based on assumptions and are subject to known and unknown risks and uncertainties that could cause actual results to differ materially from those contemplated by these statements. See Item 1. “Business—Forward-Looking Statements” for a discussion of risks associated with reliance on forward-looking statements. Factors that may cause differences between actual results and those contemplated by forward-looking statements include, but are not limited to, those discussed below and in Item 1A. “Risk Factors.” Management’s discussion and analysis of financial condition and results of operations should be read in conjunction with our consolidated financial statements and the notes to those statements included in Item 8. “Financial Statements and Supplementary Data” of this Report. References in this Annual Report on Form 10-K (the “Report”) to “we”, “our”, or the “Company” refer to Cooper-Standard Holdings Inc., together with its consolidated subsidiaries.
Executive Overview
Our Business
We design, manufacture and sell sealing and fluid handling (consisting of fuel and brake delivery, and fluid transfertransfer) systems for use in passenger vehicles and light trucks manufactured by global OEMs. Prior to its divestiture on April 1, 2019, the Company also operated an AVS business. In 2020,2023, approximately 83%84% of our sales consisted of original equipment sold directly to OEMs for installation on new vehicles. The remaining 17%16% of our sales were primarily to Tier I and Tier II suppliers and non-automotive manufacturers. Accordingly, sales of our products are directly affected by the annual vehicle production of OEMs and, in particular, the production levels of the vehicles for which we provide specific parts. Most of our products are custom designed and engineered for a specific vehicle platform. Our sales and product development personnel frequently work directly with the OEMs’ engineering departments in the design and development of our various products.
Although each OEM may emphasize different requirements as the primary criteria for judging its suppliers, we believe success as an automotive supplier generally requires outstanding performance with respect to quality, price, service, launch performance, design and engineering capabilities, innovation, timely delivery, financial stability and an extensive global footprint. Also, we believe our continued commitment to invest in global common processes is an important factor in servicing global customers with the same quality and consistency of product wherever we produce in the world. This is especially important when supplying products for global platforms.
In addition, to remain competitive and offset continued customer pricing pressure, we must also consistently achieve and sustain cost savings. In an ongoing effort to reduce our cost structure, we run a global continuous improvement program which includes training for our employees, as well as implementation of lean tools, structured problem solving, best business practices, standardized processes and change management. We also continually evaluate opportunities to consolidateoptimize our manufacturing footprint by consolidating facilities and to relocate certain operations to lower cost countries.relocating production as appropriate. We believe we will continue to be successful in our efforts to improve our design and engineering capabilitycapabilities and manufacturing processes while achieving cost savings, including through our continuous improvement initiatives.
Our OEM sales are generally based upon purchase orders issued by the OEMs, with updated releases for volume adjustments. As such, we typically do not have a defined backlog of orders at any point in time. Once selected to supply products for a particular platform, we typically supply those products for the platform life, which is normally sixfive to seveneight years, although there is no guarantee that this will occur. In addition, when we are the incumbent supplier to a given platform, we believe we have a competitive advantage in winning the redesign or replacement platform.
In 2020,2023, approximately 51%55% of our sales were generated in North America. Because of our significant international operations, we are subject to the risks associated with doing business in other countries, such as currency volatility, high interest and inflation rates, and the general political and economic risk that are associated with some of these markets.
Recent Trends and Conditions
General Economic Conditions and Outlook
The global automotive industry is susceptible to uncertain economic conditions that could adversely impact new vehicle demand and production. Business conditions may vary significantly from period to period or region to region.
The In 2022, global automotive production was negatively impacted by broad supply chain challenges, labor market disruptions and other lingering impacts of the COVID-19 pandemicpandemic. In 2023, light vehicle production showed resilience and strong growth, supported by sustained consumer demand and OEM efforts to replenish depleted inventory levels. This resilience and growth was despite continued uncertainty in the global economy created an unusuallyby continued inflation, rising interest rates and increased geopolitical tension in key regions of the world. In 2024, we expect production growth will moderate as inventory levels normalize, interest rates remain relatively high, degree of economic disruption and uncertainty during 2020. A considerable amount ofthe geopolitical tensions driving global economic uncertainty remains heading into 2021 despite advances in vaccine technology and availability. Many industries remain significantly impacted by reduced labor availability as well as policies, regulations, risks
and concerns surrounding the novel coronavirus. The result is continued uncertainty for the broader economic outlook and for the automotive industry around the world. Economists at the World Bank Group expect global economic output to increase by approximately 4% in 2021, remaining approximately 5% below pre-pandemic levels.persist.
In North America, economic conditions andU.S. consumer confidence have improvedhas been trending downward since July of 2023 and remains well below historical averages. The softening labor market, increasing consumer debt and higher interest rates are key drivers of this trend. Lagged effects of interest rate increases and expected slow down of government spending are expected to contribute to modestly slower economic growth in in the coming year. Economists at the International Monetary Fund (IMF) are expecting the economies of the United States, Canada and Mexico to grow by 2.1 percent, 1.4 percent and 2.7 percent, respectively, in 2024.
In Europe, the war in Ukraine, related sanctions imposed on Russia, higher energy costs and infrastructure disruptions continue to impact the regional economy. This is translating into lower industrial output and investment, higher inflation and lower average real household income for most Eurozone countries. To reignite economic growth, the European Central Bank is expected to begin reducing policy interest rates as early as the second quarter of 2020 but continue to be negatively impacted by concerns over2024. In the COVID-19 pandemic and related government-imposed restrictions in certain states. Uncertainty related tocurrent uncertain environment, economists at the implementation of economic policies by the new administration in the United States will also likely weigh on consumer confidence in the region through the first half of 2021.
The United States government has taken historic measures to provide fiscal stimulus toIMF are expecting the economy in an effortthe Eurozone region to sustain businesses, limit job lossesgrow by approximately 0.9 percent in 2024.
In the Asia Pacific region, China’s post-Covid economy has been burdened by a protracted property crisis, weak consumer and preempt deeper declines in consumerbusiness confidence, duringmounting local government debts, and weak global demand for the pandemic. Further stimulus actions are considered likely. In view of these efforts, World Bank economists now expect economic expansion of approximately 3.5% in the United States and 3.7% economiccountry’s exports. Economic growth in Mexico in 2021.
In Europe, the World Bank is projecting economic growth of approximately 3.6% for 2021. Current2024 and potential future impactsbeyond will likely be dependent on a stabilization of the COVID-19 pandemic will continuereal estate market, which has been significantly overbuilt in past years. In order to weigh onbring housing supply in line with actual demand, the economies of the region. Due to the resurgence of COVID-19 in various regions, certain European governments have again mandated temporary closures of broad segments of their economies. While automotive production is continuing, on-going health risks, geopolitical concerns and the implementation of new environmental regulations in the automotive industrygovernment will likely continuehave to impact vehicle demand and economic growth.
In Asia Pacific,reduce its past levels of infrastructure investment. As a result, economists at the World Bank expects China’s economic growth rateIMF are expecting the Chinese economy to rebound to 7.9%grow at a more modest 4.6 percent in 2021, reflecting the release of pent-up domestic consumer demand and continuation of production and exports. In addition, continued fixed asset investment in industrial technology and infrastructure, aided by more liberal credit policies, will likely support near-term economic growth.2024.
In South America, the World Bank estimates thatBrazilian economy will likely be impacted by a slowdown in agricultural exports as global demand moderates. While the nation’s central bank has begun to reduce interest rates, more cuts may be necessary to stimulate domestic consumer activity and industrial investment. Fiscal stimulus is seen as a less likely option owing the continued risk of elevated inflation. As a result, economists at the IMF are now estimating the Brazilian economy will grow by approximately 3.0%1.7 percent in 2021. The rebound is expected to be stronger in industrial and agriculture sectors while recovery in the services sector will be more subdued due to lingering consumer concerns and risk aversion impacting travel and tourism. In addition, the discontinuation of the government’s 2020 fiscal stimulus program will likely weigh on consumption. We remain cautious for the mid to long-term outlook given the long history of political instability and economic volatility in the region.2024.
Production Levels
Our business is directly affected by the automotive vehicle production rates in North America, Europe, Asia Pacific and South America.America which have been adversely affected by a series of significant events in recent years. Beginning in the first quarter of 2020, as a result of COVID-19, we experienced production shutdowns related to the shutdown of effectively all of our facilities in Asia Pacific coinciding with the shutdown of our customer facilities in that region. Facility shutdowns then occurred in March 2020 for a majority of our facilities in North America, EuropeCOVID-19 pandemic. In 2021 and South America.
Production resumed in Asia Pacific2022, OEM production volumes were negatively impacted by the endglobal shortage of the first quarter of 2020, albeit at a lower capacity,semiconductors and has steadily increased inother supply chain disruptions stemming from pandemic-related shutdowns and constraints. In 2023, light vehicle production capacity throughout the year. For our North Americarebounded as supply chain disruptions were resolved and Europe facilities, production resumed in May 2020 at a lower capacity and has increased through the subsequent months. Finally, for our South America facilities, production resumed in the second quarter, but has increased more slowly compared to the other regions. We are collaborating closely with our customers as production volume continuesOEMs worked to increase and approach pre-COVID-19inventory levels while also adhering to enhanced safety standards and measures to protect our employees.meet continued consumer demand.
According to the forecasting firm S&P Global (formerly IHS Markit,Markit), global light vehicle production was approximately 74.590.1 million units in 2020.2023. This reflects a declinean increase of approximately 16.2% globally.9.4% globally compared to 2022.
Light vehicle production in certain regions for 20202023 and 2019,2022, as well as projections for 2021,2024, are provided in the following table:
| | | | | | | | | | | | | | | | | | | | | | | | | | | | | |
| (In millions of units) | 2021(1) | | 2020(1) | | 2019(1) | | Projected % Change 2020-2021 | | % Change 2019-2020 |
| North America | 16.3 | | 13.0 | | 16.3 | | 25.1 | % | | (20.1) | % |
| Europe | 19.0 | | 16.6 | | 21.2 | | 14.3 | % | | (21.6) | % |
| Asia Pacific | 44.5 | | 41.0 | | 46.2 | | 8.7 | % | | (11.4) | % |
| Greater China | 25.1 | | 23.6 | | 24.7 | | 6.1 | % | | (4.2) | % |
| South America | 3.0 | | 2.2 | | 3.3 | | 32.8 | % | | (31.4) | % |
| | | | | | | | | | | | | | | | | | | | | | | | | | | | | |
| (in millions of units) | 2024(1) | | 2023(1) | | 2022(1) | | Projected % Change 2023-2024 | | % Change 2022-2023 |
| North America | 15.8 | | 15.6 | | 14.3 | | 1.1% | | 9.5% |
| Europe | 17.4 | | 17.8 | | 15.8 | | (2.0)% | | 12.5% |
| Asia Pacific | 51.1 | | 51.4 | | 47.2 | | (0.6)% | | 9.0% |
| Greater China | 28.9 | | 28.9 | | 26.4 | | —% | | 9.4% |
| South America | 3.0 | | 2.9 | | 2.8 | | 3.0% | | 3.1% |
(1) Production data based on IHS Markit,S&P Global, January 2021.2024.
The COVID-19 pandemic has emerged as the biggest risk factor facing the automotive industry. In the first half of 2020, total vehicle production decreased substantially across the globe. Plant shutdowns have greatly slowed production and have been accompanied by decreased demand for vehicles, as new vehicle sales are highly dependent on strong consumer confidence and low unemployment. While the outlook for the full year 2021 remains uncertain, the global economy has begun to rebound from the impacts of the pandemic. Additionally, continued distribution of vaccine treatments could improve consumer confidence. Lower unemployment rates and lower than normal light vehicle inventory levels could also have a positive impact on light vehicle production going forward.
Industry Overview
Competition in the automotive supplier industry is intense and has increased in recent years as OEMs have demonstrated a preference for stronger relationships with fewer suppliers. Because of a growing emphasis on global vehicle platforms, automotive suppliers with a global manufacturing footprint capable of fully servicing customers around the world will typically have a competitive advantage over smaller, regional competitors. This dynamic is likely to result in further consolidation of competing suppliers within our industry over time.
OEMs have shifted some research and development, design and testing responsibility to suppliers, while at the same time shortening new product cycle times. To remain competitive, suppliers must have state-of-the-art engineering and design capabilities and must be able to continuously improve their engineering, design and manufacturing processes to effectively service the customer. Suppliers are increasingly expected to collaborate on, or assume the product design and development of, key automotive components and to provide innovative solutions to meet evolving technologies aimed at improved emissions and fuel economy.
Increased competitiveness in the industry, as well as customer focus on costs, has resulted in continued pressure on suppliers for price reductions, reducingeven in an inflationary environment, which reduces the overall profitability of the supply industry. Consolidations and market share shifts among vehicle manufacturers continue to put additional pressures on the supply chain. These pricing and market pressures will continue to drive our focus on reducing our overall cost structure through continuous improvement initiatives, capital redeployment, restructuring and other cost management processes. In 2023, with continued inflationary pressures on wages, energy, transportation and other general costs, in order to remain competitive, we worked with our customers to offset the costs associated with this inflation. We actively negotiated pricing adjustments on current business and considered the impact of inflationary and other costs in our quotes for new business.
In addition to the above, other factors will present opportunities for automotive suppliers who are positioned forto meet the changingdemands of evolving automotive markets and operating environment, including autonomous and connected vehicles, evolving government regulation, and consumer preference for environmentally friendly products and technology, includingsuch as hybrid and electric vehicle (“EV”) architectures.
Raw Materials
Our business is susceptible to inflationary pressures with respect to raw materials which may place operational and profitability burdens on the entire supply chain. Costs related to raw materials, such as steel, aluminum, and oil and oil-derived commodities, continuehave historically been volatile. In 2021 and 2022, global commodity markets experienced a period of hyperinflation as economic activity rebounded from pandemic related shutdowns and supply chains were strained and disrupted. As a result, we worked with our customers beginning in late 2021 and throughout 2022 to be volatile.establish index-based agreements which enable us to pass on a significant portion of commodity-related inflation to the customer. These agreements have reduced our exposure to commodity related risk and volatility beginning in 2023 and going forward. In addition, we continue to expect commodity cost volatilitysee significant inflationary pressure on wages, energy, transportation and other general costs. As such, we will continue to have a continual impact on future earnings and operating cash flows. As such,work on an ongoing basis we work with our customers and suppliers to mitigate both inflationary pressures and our material-related cost exposures.exposures through a combination of expanded index-based agreements mentioned above and other commercial enhancements.
Critical Accounting Policies and Estimates
Our significant accounting policies are more fully described in Note 2. “Basis of Presentation and Summary of Significant Accounting Policies” to the consolidated financial statements included in Item 8. “Financial Statements and Supplementary Data” of this Report. Certain of our accounting policies require the application of significant judgment by management in selecting the appropriate assumptions for calculating financial estimates. These policies require the most difficult, subjective or complex judgments that management makes in the preparation of the financial statements and accompanying notes. We consider an accounting estimate to be critical if (i) it requires us to make assumptions about matters that were uncertain at the time we were making the estimate, and (ii) changes in the estimate or different estimates that we could have selected could have had a material impact on our financial condition or results of operations. Such critical accounting estimates are discussed below. For these, materially different amounts could be reported under varied conditions and assumptions. While other items in our consolidated financial statements require estimation, however, in our judgment, they are not as critical as those discussed below.
Goodwill. The Company’s organizational structure changed on January 1, 2020. See Note 24. “Business Segments” to the consolidated financial statements included in Item 8. “Financial Statements and Supplementary Data” of this Report for further detail on this reorganization of our business. Prior to this change in organizational structure, the Company’s North America operating segment was the only reporting unit in which goodwill was recorded. As a result of the change in organizational structure, a portion of the goodwill that was previously attributable to the North America reporting unit was reallocated to the Industrial Specialty Group reporting unit based on the relative fair value approach. The Industrial Specialty
Group reporting unit is a component of the Advanced Technology Group operating segment, which is reflected in “Corporate, eliminations and other”. The change in organizational structure of the business represented a triggering event to test goodwill for impairment as of January 1, 2020. No impairment was identified as a result of completing the goodwill impairment test.
Goodwill is tested for impairment by reporting unit as of October 1 of each year or more frequently if events or circumstances indicate that an impairment may exist. Other than the change in organizational structure noted above, there were no other indicators of potential impairment during the year ended December 31, 2020.
For our goodwill analysis, fair value is based on the cash flows projected in the reporting units’ strategic plans and long-range planning forecasts, discounted at a risk-adjusted rate of return. Our long-range planning forecasts are based on our assessment of revenue growth rates generally based on industry specific data, external
vehicle build assumptions published by widely used external sources, and customer market share data based on known and targeted awards over a three-year period. The projected profit margin assumptions included in the plans are based on the current cost structure and adjustments for anticipated cost reductions or increases. If different assumptions were used in these plans, the related cash flows used in measuring fair value could be different and impairment of goodwill might be recorded. The annual goodwill impairment analysis for 20202023 resulted in no impairment. impairment for the North America and Industrial Specialty Group reporting units. Additionally, a hypothetical 10 percent decrease in the fair value of these reporting units would not impact our conclusion that goodwill was not impaired. See Note 10.9. “Goodwill and Intangible Assets” to the consolidated financial statements included in Item 8. “Financial Statements and Supplementary Data” of this Report for additional information.
Long-Lived Assets. We monitor our long-lived assets for impairment indicators on an ongoing basis. If impairment indicators exist, we analyze the undiscounted cash flows expected to be generated from the long-lived assets compared to the related net book values. If the net book value exceeds the undiscounted cash flows, an impairment loss is measured and recognized. An impairment loss is measured as the difference between the net book value and the fair value of the long-lived assets. Fair value of machinery and equipment is based upon either estimated salvage value or estimated orderly liquidation value. Fair value of leased buildings is based on a discounted cash flow approach. Fair value of owned buildings is based on a sales comparison approach or cost approach. Cash flows are estimated using internal budgets based on recent sales data, independent automotive production volume estimates and customer commitments, as well as assumptions related to discount rates. Changes in economic or operating conditions impacting these estimates and assumptions could result in the impairment of long-lived assets. In 2020,2023, 2022 and 2021, we recorded impairment charges related to buildings and machinery and equipment in North America, Europe, Asia Pacific, and Corporate and other segments. In 2019, we recorded impairment charges related to machinery and equipment in our Europe, Asia Pacific, and Corporate and other segments.equipment. See Note 9.8. “Property, Plant and Equipment” to the consolidated financial statements included in Item 8. “Financial Statements and Supplementary Data” of this Report for additional information.
Restructuring. Specific accruals have been recorded in connection with restructuring initiatives. These accruals include estimates principally related to employee separation costs, the closure and/or consolidation of facilities and contractual obligations. Actual amounts recognized could differ from the original estimates. Restructuring-related reserves are reviewed on a quarterly basis, and changes to plans are appropriately recognized when identified. Changes to plans associated with the restructuring of existing businesses are generally recognized as employee separation and plant closure costs in the period the change occurs. See Note 7. “Restructuring” to the consolidated financial statements included in Item 8. “Financial Statements and Supplementary Data” of this Report for additional information.
Revenue Recognition and Sales Commitments. We generally enter into agreements with customers to produce products at the beginning of a vehicle’s life. Although such contracts do not usually include minimum quantities, fulfillment of customers’ purchasing requirements can be our obligation for the entire production life of the vehicle. These agreements generally may be terminated by our customer at any time, but such cancellations have historically been minimal. In limited cases, we may be committed to supply products at selling prices that do not cover our costs. In such situations, we recognize losses as they are incurred.
We receive blanket purchase orders from many customers annually. Generally, such purchase orders and related documents establish the annual terms, including pricing, related to a vehicle model. However, purchase orders generally do not specify quantities. We recognize revenue based on a point in time, generally when products are shipped or delivered to customers. As part of certain agreements, customers ask for price reductions. We accrue for such concessions by reducing revenue as products are shipped. We also generally have ongoing adjustments to customer pricing arrangements based on the content and cost of our products. Such pricing accruals are adjusted as they are settled with customers.
Income Taxes. In determining the provision for income taxes for financial statement purposes, we make estimates and judgments which affect our evaluation of the carrying value of our deferred tax assets as well as our calculation of certain tax liabilities. We evaluate the carrying value of our deferred tax assets on a quarterly basis. In completing this evaluation, we consider all available positive and negative evidence. Such evidence includes historical operating results, the existence of cumulative earnings and losses in the most recent fiscal years, taxable income in prior carryback year(s) if permitted under the tax law, expectations for future pretax operating income which considers forecasted revenue trends within the automotive
industry, the time period over which our temporary differences will reverse, and the implementation of feasible and prudent tax planning strategies. Deferred tax assets are reduced by a valuation allowance if, based on the weight of this evidence, it is more likely than not that all or a portion of the recorded deferred tax assets will not be realized in future periods.
Concluding that a valuation allowance is not required is difficult when there is significant negative evidence which is objective and verifiable, such as cumulative losses in recent years. We utilize three years’ cumulative pre-tax book results adjusted for significant permanent book to tax differences as a measure of cumulative results in recent years. In certain jurisdictions, our analysis indicates that we have cumulative three-year historical losses on this basis. This is considered significant negative evidence which is difficult to overcome. However, the three-year loss position is not solely determinative, and, accordingly, management considers all other available positive and negative evidence in its analysis. Although we are in a three-year cumulative loss inIn the U.S. and certain jurisdictions as of December 31, 2020, we have a recent history of earnings prior to the onset of the COVID-19 pandemic. We expect to return to profitability in jurisdictions where a valuation allowance is not recorded as the effects of the pandemic subside and we begin to generate sufficient taxable income to utilize our deferred tax assets. In other foreign jurisdictions, and U.S. states we concluded that it is more likely than not that the net deferred tax assets may not be realized in the future. Accordingly, we continue to maintain and adjust as appropriate the valuation allowance related to those net deferred tax assets. However, since future financial results may differ from previous estimates, periodic adjustments to our valuation allowances may be necessary.
In addition, the calculation of our tax benefits and liabilities includes uncertainties in the application of complex tax regulations in a multitude of jurisdictions across our global operations. We recognize tax benefits and liabilities based on our estimate of whether, and the extent to which, additional taxes will be due. We adjust these liabilities based on changing facts and circumstances; however, due to the complexity of some of these uncertainties and the impact of any tax audits, the ultimate resolutions may be materially different from our estimated liabilities. See Note 17.15. “Income Taxes” to the consolidated financial statements included in Item 8. “Financial Statements and Supplementary Data” of this Report for additional information.
Pensions and Postretirement Benefits Other Than Pensions. Included in our results of operations are significant pension and postretirement benefit costs, which are measured using actuarial valuations. Inherent in these valuations are key assumptions, including discount rates, mortality rates, expected returns on plan assets and health care cost trend rates. These assumptions are determined as of the current year measurement date. We consider current market conditions, including changes in interest rates, in making these assumptions. Changes in pension and postretirement benefit costs may occur in the future due to changes in these assumptions. Experience gains and losses as well as the effects of changes in actuarial assumptions are recognized in other comprehensive income. Cumulative actuarial gains and losses in excess of 10% of the projected benefit obligations or the fair value of plan assets for a particular plan are amortized over the average future service period of the
employees in that plan. Our net pension and postretirement benefit costs (income), which included non-cash net pension settlement chargeslosses of $0.2$16.0 million, were approximately $5.7$26.1 million and $0.4$(0.7) million, respectively, for the year ended December 31, 2020.2023. Note that the settlement charge primarily resulted from the approved termination of a certain U.S. pension plan and the resulting partial settlement of that plan through lump sum payments to eligible plan participants. See Note 12. “Pension” to the consolidated financial statements included in Item 8. “Financial Statements and Supplementary Data” of this Report for additional information.
To develop the discount rate for each pension plan, the expected cash flows underlying the plan’s benefit obligations were discounted using a December 31, 20202023 pension index to determine a single equivalent rate. To develop our expected return on plan assets, we considered historical long-term asset return experience, the expected investment portfolio mix of plan assets and an estimate of long-term investment returns. To develop our portfolio of plan assets, we considered the duration of the plan liabilities and gave more weight to equity positions, including both public and private equity investments, than to fixed-income securities.
Weighted average assumptions used to determine pension benefit obligations as of December 31, 20202023 were as follows: | | | | | | | | | | | |
| |
| | U.S. | | Non-U.S. |
| Discount rate | 4.70% | | 4.00% |
| Rate of compensation increase | N/A (*) | | 3.20% |
| Cash balance interest credit rate | 2.41% | | N/A |
| | | | | | | | | | | | | | | |
| | | |
| | U.S. | | Non-U.S. | | | | |
| Discount rate | 2.48 | % | | 1.36 | % | | | | |
| Rate of compensation increase | N/A (*) | | 1.23 | % | | | | |
| Cash balance interest credit rate | 4.50 | % | | N/A | | | | |
Weighted average assumptions used to determine net periodic benefit costs for the year ended December 31, 20202023 were as follows: | | | | | | | | | | | |
| |
| | U.S. | | Non-U.S. |
| Discount rate | 4.55% | | 4.45% |
| Expected return on plan assets | 4.50% | | 3.84% |
| Rate of compensation increase | N/A (*) | | 3.01% |
| | | | | | | | | | | | | | | | | | | |
| | | | | |
| | U.S. | | Non-U.S. | | | | | | | | |
| Discount rate | 3.28 | % | | 2.33 | % | | | | | | | | |
| Expected return on plan assets | 5.75 | % | | 3.73 | % | | | | | | | | |
| Rate of compensation increase | N/A (*) | | 3.99 | % | | | | | | | | |
*As the U.S. plans are frozen, the rate of compensation increase was not applicable.
The sensitivity of our pension cost and obligations to changes in key assumptions, holding all other assumptions constant, is as follows:
| | | | | | | | | | | | | | |
| Change in assumption | | Impact on 20212024 net periodic benefit cost | | Impact on PBO as of December 31, 20202023 |
| 1% increase in discount rate | | -$1.2 $8.1 million | | -$54.8 $26.1 million |
| 1% decrease in discount rate | | +$1.4 $12.2 million | | +$67.9 $31.2 million |
| 1% increase in expected return on plan assets | | -$3.1 $0.7 million | | — - | |
| 1% decrease in expected return on plan assets | | +$3.1 $0.7 million | | — - | |
AggregateExcluding the impact of any future potential settlement charges associated with the termination of a certain U.S. pension plan (which the Company estimates will range from $50 million to $60 million), aggregate pension net periodic benefit cost is forecasted to be approximately $3.6$7.4 million in 2021.2024. Refer to Note 12. “Pension” to the consolidated financial statements included in Item 8. “Financial Statements and Supplementary Data” of this Report for further information regarding the expected termination of a certain U.S. pension plan.
Health care cost trend rates are assumed to reflect market trend, actual experience and future expectations. Health care cost trend rate assumptions used to determine the postretirement benefit obligationobligations as of December 31, 20202023 were as follows:
| | | | | | | | | | | |
| U.S. | | Non-U.S. |
| Health care cost trend rate | 5.34 | % | | 5.00 | % |
| Ultimate health care cost trend rate | 4.50 | % | | 5.00 | % |
| Year that the rate reaches the ultimate trend rate | 2027 | | N/A |
| | | | | | | | | | | |
| U.S. | | Non-U.S. |
| Health care cost trend rate | 6.50% | | 5.00% |
| Ultimate health care cost trend rate | 4.50% | | 5.00% |
| Year that the rate reaches the ultimate trend rate | 2031 | | N/A |
Aggregate other postretirement net periodic benefit costincome is forecasted to be approximately $1.1$1.3 million in 2021.2024.
The Company’s policy is to fund pension plans such that sufficient assets will be available to meet future benefit requirements and contribute amounts deductible for United States federal income tax purposes or amounts required by local statute. The Company estimates it will make funding cash contributions to its U.S. and non-U.S. pension plans of approximately $1.0
$10.0 million and $4.5$0.4 million, respectively in 2021.2024. The expected cash contributions to the Company’s U.S. pension plans primarily relates to the expected termination of a certain U.S. pension plan.
The Company does not prefund its postretirement benefit obligations. Rather, payments are made as costs are incurred by covered retirees. We expect net other postretirement benefit payments to be approximately $2.6$2.1 million in 2021.
Historical Periods
| | | | | | | | | | | | | | | | | | | | | | | |
| | Year Ended December 31, | | Change |
| | 2020 | | 2019 | | | | 2020 vs. 2019 | | |
| | (Dollar amounts in thousands) |
| Sales | $ | 2,375,439 | | | $ | 3,108,400 | | | | | $ | (732,961) | | | |
| Cost of products sold | 2,227,892 | | | 2,749,278 | | | | | (521,386) | | | |
| Gross profit | 147,547 | | | 359,122 | | | | | (211,575) | | | |
| Selling, administration & engineering expenses | 263,611 | | | 302,496 | | | | | (38,885) | | | |
| Gain on sale of business, net | (2,834) | | | (191,571) | | | | | 188,737 | | | |
| | | | | | | | | |
| Amortization of intangibles | 11,611 | | | 17,966 | | | | | (6,355) | | | |
| Impairment of assets held for sale | 86,470 | | | — | | | | | 86,470 | | | |
| | | | | | | | | |
| Other impairment charges | 17,893 | | | 23,139 | | | | | (5,246) | | | |
| Restructuring charges | 39,482 | | | 51,102 | | | | | (11,620) | | | |
| Operating (loss) profit | (268,686) | | | 155,990 | | | | | (424,676) | | | |
| Interest expense, net of interest income | (59,167) | | | (44,113) | | | | | (15,054) | | | |
| Equity in earnings of affiliates | 396 | | | 6,504 | | | | | (6,108) | | | |
| | | | | | | | | |
| Pension settlement charges | (184) | | | (15,819) | | | | | 15,635 | | | |
| Other expense, net | (2,580) | | | (4,260) | | | | | 1,680 | | | |
| (Loss) income before income taxes | (330,221) | | | 98,302 | | | | | (428,523) | | | |
| Income tax (benefit) expense | (60,847) | | | 36,089 | | | | | (96,936) | | | |
| Net (loss) income | (269,374) | | | 62,213 | | | | | (331,587) | | | |
| Net loss attributable to noncontrolling interests | 1,769 | | | 5,316 | | | | | (3,547) | | | |
| Net (loss) income attributable to Cooper-Standard Holdings Inc. | $ | (267,605) | | | $ | 67,529 | | | | | $ | (335,134) | | | |
| | | | | | | | | | | | | | | | | |
| | Year Ended December 31, | | Change |
| | 2023 | | 2022 | | 2023 vs. 2022 |
| | (Dollar amounts in thousands) |
| Sales | $ | 2,815,879 | | | $ | 2,525,391 | | | $ | 290,488 | |
| Cost of products sold | 2,525,103 | | | 2,395,600 | | | 129,503 | |
| Gross profit | 290,776 | | | 129,791 | | | 160,985 | |
| Selling, administration & engineering expenses | 215,741 | | | 199,455 | | | 16,286 | |
| Gain on sale of businesses, net | (586) | | | — | | | (586) | |
| Gain on sale of fixed assets, net | — | | | (33,391) | | | 33,391 | |
| Amortization of intangibles | 6,804 | | | 6,715 | | | 89 | |
| Restructuring charges | 18,018 | | | 18,304 | | | (286) | |
| Impairment charges | 4,768 | | | 43,710 | | | (38,942) | |
| Operating profit (loss) | 46,031 | | | (105,002) | | | 151,033 | |
| Interest expense, net of interest income | (130,077) | | | (78,514) | | | (51,563) | |
| Equity in earnings (losses) of affiliates | 3,281 | | | (8,817) | | | 12,098 | |
| Loss on refinancing and extinguishment of debt | (81,885) | | | — | | | (81,885) | |
| Pension settlement and curtailment charges | (16,035) | | | (2,682) | | | (13,353) | |
| Other expense, net | (15,698) | | | (5,485) | | | (10,213) | |
| Loss before income taxes | (194,383) | | | (200,500) | | | 6,117 | |
| Income tax expense | 8,933 | | | 17,291 | | | (8,358) | |
| Net loss | (203,316) | | | (217,791) | | | 14,475 | |
| Net loss attributable to noncontrolling interests | 1,331 | | | 2,407 | | | (1,076) | |
| Net loss attributable to Cooper-Standard Holdings Inc. | $ | (201,985) | | | $ | (215,384) | | | $ | 13,399 | |
Year Ended December 31, 20202023 Compared to Year Ended December 31, 2019.2022.
Sales
| | | | | | | | | | | | | | | | | | | | | | | | | | | | | | | | | | | | | | |
| Year Ended December 31, | | | Variance Due To: |
| 2023 | | 2022 | | Change | | | Volume / Mix* | | Foreign Exchange | | Divestitures |
| (Dollar amounts in thousands) |
| Total sales | $ | 2,815,879 | | | $ | 2,525,391 | | | $ | 290,488 | | | | $ | 315,220 | | | $ | (4,644) | | | $ | (20,088) | |
* Net of customer price adjustments, including recoveries and the impact of work stoppages initiated by certain labor unions in North America in 2023.
Sales for the year ended December 31, 2020 decreased 23.6%2023 increased 11.5%, compared to the year ended December 31, 2019.2022. The declineincrease in sales was mainly driven by the decrease involume and mix, mainly higher vehicle production volume due to government imposed global shutdownsthe stabilization of the supply environment, elimination of prior year COVID-19 related to the COVID-19 pandemic,restrictions in China and net divestitures, foreign exchange and customer price reductions.
| | | | | | | | | | | | | | | | | | | | | | | | | | | | | | | | | | | | | | |
| Year Ended December 31, | | | Variance Due To: |
| 2020 | | 2019 | | Change | | | Volume / Mix* | | Foreign Exchange | | Divestitures |
| (Dollar amounts in thousands) |
| Total sales | $ | 2,375,439 | | | $ | 3,108,400 | | | $ | (732,961) | | | | $ | (550,103) | | | $ | (2,207) | | | $ | (180,651) | |
* Net of customer price reductionsadjustments including
recovery of cost increases. This increase was partially offset by the negative impact of work stoppages initiated by certain labor unions in North America in 2023, foreign exchange and the divestitures of our European technical rubber products business and a joint venture in the Asia Pacific region. See Note 4. “Divestitures and Deconsolidations” to the consolidated financial statements included in Item 8. “Financial Statements and Supplementary Data” of this Report for additional information.
Gross Profit
| | | | | | | | | | | | | | | | | | | | | | | | | | | | | | | | | | | | | | |
| Year Ended December 31, | | | Variance Due To: |
| 2020 | | 2019 | | Change | | | Volume / Mix* | | Foreign Exchange | | Cost (Decreases) / Increases |
| (Dollar amounts in thousands) |
| Cost of products sold | $ | 2,227,892 | | | $ | 2,749,278 | | | $ | (521,386) | | | | $ | (296,967) | | | $ | (613) | | | $ | (223,806) | |
| Gross profit | 147,547 | | | 359,122 | | | (211,575) | | | | (253,136) | | | (1,594) | | | 43,155 | |
| Gross profit percentage of sales | 6.2 | % | | 11.6 | % | | | | | | | | | |
| | | | | | | | | | | | | | | | | | | | | | | | | | | | | | | | | | | | | | |
| Year Ended December 31, | | | Variance Due To: |
| 2023 | | 2022 | | Change | | | Volume / Mix* | | Foreign Exchange | | Cost (Decreases) / Increases** |
| (Dollar amounts in thousands) |
| Cost of products sold | $ | 2,525,103 | | | $ | 2,395,600 | | | $ | 129,503 | | | | $ | 144,071 | | | $ | 6,278 | | | $ | (20,846) | |
| Gross profit | 290,776 | | | 129,791 | | | 160,985 | | | | 171,149 | | | (10,922) | | | 758 | |
| Gross profit percentage of sales | 10.3 | % | | 5.1 | % | | | | | | | | | |
* Net of customer price reductionsadjustments, including recoveries and the impact of work stoppages initiated by certain labor unions in North America in 2023.
** Net of divestitures.
Cost of products sold is primarily comprised of material,materials, labor, manufacturing overhead, freight, depreciation, warranty costs and other direct operating expenses. Cost of products sold for the year ended December 31, 2020 decreased $521.42023 increased $129.5 million, or 19.0%5.4%, compared to the year ended December 31, 2019.2022. Materials comprise the largest component of our cost of products sold and represented approximately 46% and 51% of total cost of products sold for each of the years ended December 31, 20202023 and December 31, 2019, respectively.2022. The change in the cost of products sold was drivenimpacted by higher volume and mix, inflation of labor and overhead cost, higher compensation-related costs, increased energy costs and the decrease in production volumes due to government imposed global shutdowns related tonegative impact of foreign exchange. These costs were partially offset by manufacturing and purchasing savings through lean initiatives, favorable commodity costs and the COVID-19 pandemic, the sale of our AVS product line in 2019, the divestituredivestitures of our European technical rubber fluid transferproducts business and specialty sealing businesses and Indian operationsa joint venture in 2020, continuous improvement and lean manufacturing, material cost reductions, commodity price fluctuations, restructuring savings, foreign exchange, and wage inflation.the Asia Pacific region.
Gross profit for the year ended December 31, 2020 decreased $211.62023 increased $161.0 million compared to the year ended December 31, 2019.2022. As a percentage of sales, gross profit was 6.2%10.3% and 11.6%5.1% for the years ended December 31, 20202023 and 2019,2022, respectively. The decreasechange was driven by the decline in vehicle production volume due to government imposed global shutdowns related to the COVID-19 pandemic,and mix, net of customer price reductions, variable employee compensation expensesadjustments including recovery of cost increases, manufacturing and wage inflation. These items werepurchasing savings through lean initiatives and favorable commodity costs, partially offset by net favorable operational performance, restructuring savings, the non-recurrence of prior period commercial settlements in China,labor, overhead and energy inflation and unfavorable foreign exchange and material cost reductions.exchange.
Selling, Administration and Engineering.Engineering Expenses. Selling, administration and engineering expenseexpenses include administrative expenses as well as product engineering and design and development costs. Selling, administration and engineering expenses for the year ended December 31, 2020 was $263.62023 were $215.7 million, or 11.1%7.7% of sales, compared to $302.5$199.5 million, or 9.7%7.9% of sales, for the year ended December 31, 2019. 2022. The decrease in expenseincrease was primarily due to savings generated from salaried headcount initiatives including net divestitures and lower travel expenses,higher compensation-related costs, partially offset by general inflationsalaried headcount initiative savings and higher variable employee compensation expenses.foreign exchange.
Gain on Sale of Business, net. Businesses, Net.The gain Gain on sale of business of $2.8 millionbusinesses, net for the year ended December 31, 2020 related2023 was $0.6 million, due to the net effect of our 20202023 divestitures, which included the sale of our European fluid transfertechnical rubber products business and specialty sealing business,the sale of our Indian operations, the deconsolidationentire controlling equity interest of a joint venture in ourthe Asia Pacific region, and the finalized adjustments related to the saleregion.
Gain on Sale of our AVS product line. Fixed Assets, Net. Gain on sale of business of $191.6 millionfixed assets, net for the year ended December 31, 2019 related2022 was $33.4 million, due to the salenet gain on the sale-leaseback of our AVS product line within our North America, Europe and Asia Pacific segments.a European facility.
Amortization of Intangibles. IntangibleIntangibles amortization for the year ended December 31, 2020 decreased $6.4 million2023 was relatively consistent compared to the year ended December 31, 2019. The decrease was primarily driven by a customer relationship intangible asset in the North America region that was fully amortized during the second quarter of 2020.2022.
Impairment of Assets Held for Sale. Non-cash impairment charges for the year ended December 31, 2020 increased $86.5 million compared to the year ended December 31, 2019. The increase related to reducing the carrying value of the divested assets to fair value less costs to sell. Fair value was determined using a market approach, estimated based on expected proceeds.
Other Impairment Charges. Non-cash asset impairment charges of $4.8 million and $43.7 million for the yearyears ended December 31, 2020 decreased $5.2 million compared to the year ended December 31, 2019. The charges2023 and 2022, respectively, related to property, plant and equipment impairment charges and building operating lease impairment charges.
Restructuring Charges. Restructuring charges for the year ended December 31, 20202023 decreased $11.6$0.3 million compared to the year ended December 31, 2019.2022. Our restructuring actions include plant and other facility closures and workforce reductions and are initiated to maintain our competitive footprint or in response to changes in global and regional automotive markets. The decreases attributable todecrease was primarily driven by lower restructuring charges in Asia Pacific and Europe, and Corporate and other were primarily due to footprint rationalization actions and salaried employee initiatives that were completedpartially offset by higher restructuring charges in 2019. During 2020, the increases attributable to North America were primarily due to plantAmerica.
closures. We will continue to incur additional restructuring costs related to plans for ongoing footprint consolidation, primarily in Europe and North America.
Interest Expense, net.Net. Net interest expense for the year ended December 31, 20202023 increased $15.1$51.6 million compared to the year ended December 31, 2019,2022, primarily due to higher outstandingan increase in interest rates on the new debt balances includingsubsequent to the Senior Secured Notes that we issued during 2020.Refinancing Transactions (as further described in Liquidity and Capital Resources).
Loss on Refinancing and Extinguishment of Debt. Loss on refinancing and extinguishment of debt for the year
ended December 31, 2023 was $81.9 million, which resulted from certain fees and the partial write off of new and unamortized
debt issuance costs and unamortized original issue discount related to the Refinancing Transactions (as further described in Liquidity and Capital Resources).
Pension Settlement and Curtailment Charges.Non-cash pension settlement charges of $0.2$16.0 million for the year ended December 31, 20202023 primarily related to non-U.S.lump sum payments paid to eligible participants from plan assets as part of the approved termination of a U.S. pension plans. Settlementplan. Non-cash settlement and curtailment charges of $15.8$2.7 million for the year ended December 31, 20192022 primarily related primarilyto a curtailment regarding the approved termination of the aforementioned U.S. pension plan and settlements related to our non-U.S. pension plans. See Note 12. “Pension” to the purchaseconsolidated financial statements included in Item 8. “Financial Statements and Supplementary Data” of a bulk annuity policy to de-risk a portion of our pension obligations in the U.S.this Report for additional information.
Other Expense, net.Net. Other expense, net for the year ended December 31, 2020 decreased $1.72023 increased $10.2 million compared to the year ended December 31, 2019. The decrease was2022, primarily due to lowerthe unfavorable impact of foreign currency lossesexchange and increased net periodic benefit cost other than service cost, partially offset by a loss on deconsolidation of a joint venture in the prior year ended December 31, 2020.period.
Income Tax Expense (Benefit).Expense. Income tax benefitexpense for the year ended December 31, 20202023 was $60.8$8.9 million on losses before taxes of $330.2$194.4 million. This comparescompared to an income tax expense of $36.1$17.3 million on earningslosses before taxes of $98.3$200.5 million for the year ended December 31, 2019.2022. The tax benefitexpense in 20202023 and 2022 differed from the statutory rate primarily due to incremental valuation allowances recorded on tax losses generated in the U.S. and certain foreign jurisdictions, and U.S. states, permanent benefits generated by the ability to carry back net operating losses in the U.S. up to five years at the tax rates in effect during those periods under the business tax provisions of the Coronavirus Aid, Relief, and Economic Security Act (“CARES Act”) enacted during 2020, the mix of income between the U.S. and foreign sources, permanent impacts from the divestiture of our European rubber, fluid transfer, and specialty sealing businesses as well as our Indian operations, tax credits and incentives, and other nonrecurring discrete items. Tax expense in 2019 differed from the statutory rate due to incremental valuation allowance recorded on tax losses generated in certain foreign jurisdictions, permanent impacts from the sale of the AVS product line, the mix of income between U.S. and foreign sources, tax incentives, other tax credits, and other nonrecurring discrete items.
Year Ended December 31, 2019 Compared to Year Ended December 31, 2018.
2019 compared to the year ended December 31, 2018, which is incorporated by reference herein.
Segment Results of Operations
OurFor the periods presented herein, our business iswas organized into the following reportable segments: North America, Europe, Asia Pacific and South America. All other business activities arewere reported in Corporate, eliminations and other. Effective January 1, 2024, we changed our management reporting structure with the launch of global product line-focused business segments and the chief operating decision maker will prospectively begin to assess operating performance by product line rather than geography. As a result, beginning with the first quarter of 2024, we expect to report our financial results in two reportable segments based on product line: Sealing Systems and Fluid Handling Systems.
We use Segmentsegment adjusted EBITDA as the measure of earnings to assess the performance of each segment and determine the resources to be allocated to the segments. We have defined adjusted EBITDA as net income before interest, taxes, depreciation, amortization, restructuring expense, and special items.
The following tables presents sales and segment adjusted EBITDA for each of the reportable segments.
Year Ended December 31, 20202023 Compared with Year Ended December 31, 2019
Sales
| | | | | | | | | | | | | | | | | | | | | | | | | | | | | | | | | | | | | | |
| Year Ended December 31, | | | Variance Due To: |
| 2020 | | 2019 | | Change | | | Volume / Mix* | | Foreign Exchange | | Divestitures |
| (Dollar amounts in thousands) |
| Sales to external customers | | | | | | | | | | | | |
| North America | $ | 1,141,368 | | | $ | 1,543,845 | | | $ | (402,477) | | | | $ | (345,398) | | | $ | (2,248) | | | $ | (54,831) | |
| Europe | 586,739 | | | 826,335 | | | (239,596) | | | | (156,374) | | | 13,047 | | | (96,269) | |
| Asia Pacific | 468,042 | | | 503,953 | | | (35,911) | | | | (9,814) | | | 3,454 | | | (29,551) | |
| South America | 60,754 | | | 94,535 | | | (33,781) | | | | (16,785) | | | (16,996) | | | — | |
| Total Automotive | 2,256,903 | | | 2,968,668 | | | (711,765) | | | | (528,371) | | | (2,743) | | | (180,651) | |
| Corporate, eliminations and other | 118,536 | | | 139,732 | | | (21,196) | | | | (21,732) | | | 536 | | | — | |
| Consolidated | $ | 2,375,439 | | | $ | 3,108,400 | | | $ | (732,961) | | | | $ | (550,103) | | | $ | (2,207) | | | $ | (180,651) | |
Sales | | | | | | | | | | | | | | | | | | | | | | | | | | | | | | | | | | | | | | |
| Year Ended December 31, | | | Variance Due To: |
| 2023 | | 2022 | | Change | | | Volume / Mix* | | Foreign Exchange | | Divestitures |
| (Dollar amounts in thousands) |
| Sales to external customers | | | | | | | | | | | | |
| North America | $ | 1,486,100 | | | $ | 1,341,099 | | | $ | 145,001 | | | | $ | 150,423 | | | $ | (5,422) | | | $ | — | |
| Europe | 648,256 | | | 503,672 | | | 144,584 | | | | 128,224 | | | 16,360 | | | — | |
| Asia Pacific | 452,441 | | | 443,126 | | | 9,315 | | | | 31,221 | | | (19,510) | | | (2,396) | |
| South America | 125,629 | | | 100,420 | | | 25,209 | | | | 21,396 | | | 3,813 | | | — | |
| Total Automotive | 2,712,426 | | | 2,388,317 | | | 324,109 | | | | 331,264 | | | (4,759) | | | (2,396) | |
| Corporate, eliminations and other | 103,453 | | | 137,074 | | | (33,621) | | | | (16,044) | | | 115 | | | (17,692) | |
| Consolidated | $ | 2,815,879 | | | $ | 2,525,391 | | | $ | 290,488 | | | | $ | 315,220 | | | $ | (4,644) | | | $ | (20,088) | |
* Net of customer price reductionsadjustments, including recoveries and the impact of work stoppages initiated by certain labor unions in North America in 2023.
•Volume and mix, net of customer price reductions,adjustments including recoveries, was mainly driven by the impact of the decline in vehicle production volume caused by government imposed global shutdowns relatedincreases due to the stabilization of the supply environment and elimination of prior year COVID-19 pandemic.related restrictions in China. It was partially offset by the negative impact of work stoppages initiated by certain labor unions in North America in 2023.
•The net impact of foreign currency exchange was primarily related to the Brazilian RealChinese Renminbi, Euro and the Euro.Canadian Dollar.
Segment adjusted EBITDA
| | | | | | | | | | | | | | | | | | | | | | | | | | | | | | | | | | | | | | | | | | | | |
| Year Ended December 31, | | | Variance Due To: |
| 2020 | | 2019 | | Change | | | Volume / Mix* | | Foreign Exchange | | Cost Decreases / (Increases) | | Divestitures |
| (Dollar amounts in thousands) |
| Segment adjusted EBITDA | | | | | | | | | | | | | | |
| North America | $ | 90,638 | | | $ | 213,250 | | | $ | (122,612) | | | | $ | (156,091) | | | $ | 900 | | | $ | 36,548 | | | $ | (3,969) | |
| Europe | (39,004) | | | 22,922 | | | (61,926) | | | | (72,877) | | | 1,829 | | | 12,333 | | | (3,211) | |
| Asia Pacific | 12,472 | | | (27,497) | | | 39,969 | | | | (12,102) | | | 4,634 | | | 45,432 | | | 2,005 | |
| South America | (13,841) | | | (3,446) | | | (10,395) | | | | (1,148) | | | (7,477) | | | (1,770) | | | — | |
| Total Automotive | 50,265 | | | 205,229 | | | (154,964) | | | | (242,218) | | | (114) | | | 92,543 | | | (5,175) | |
| Corporate, eliminations and other | (14,588) | | | (3,621) | | | $ | (10,967) | | | | (10,918) | | | (1,488) | | | (759) | | | 2,198 | |
| Consolidated adjusted EBITDA | $ | 35,677 | | | $ | 201,608 | | | $ | (165,931) | | | | $ | (253,136) | | | $ | (1,602) | | | $ | 91,784 | | | $ | (2,977) | |
| | | | | | | | | | | | | | | | | | | | | | | | | | | | | | | | | | | | | | |
| Year Ended December 31, | | | Variance Due To: |
| 2023 | | 2022 | | Change | | | Volume / Mix* | | Foreign Exchange | | Cost (Increases)/Decreases** |
| (Dollar amounts in thousands) |
| Segment adjusted EBITDA | | | | | | | | | | | | |
| North America | $ | 125,580 | | | $ | 70,819 | | | $ | 54,761 | | | | $ | 89,441 | | | $ | (19,736) | | | $ | (14,944) | |
| Europe | 25,258 | | | (37,137) | | | 62,395 | | | | 64,711 | | | (175) | | | (2,141) | |
| Asia Pacific | 26,429 | | | 1,556 | | | 24,873 | | | | 9,888 | | | (888) | | | 15,873 | |
| South America | 10,692 | | | 97 | | | 10,595 | | | | 6,858 | | | 3,037 | | | 700 | |
| Total Automotive | 187,959 | | | 35,335 | | | 152,624 | | | | 170,898 | | | (17,762) | | | (512) | |
| Corporate, eliminations and other | (20,883) | | | 2,533 | | | (23,416) | | | | 251 | | | (217) | | | (23,450) | |
| Consolidated adjusted EBITDA | $ | 167,076 | | | $ | 37,868 | | | $ | 129,208 | | | | $ | 171,149 | | | $ | (17,979) | | | $ | (23,962) | |
* Net of customer price reductionsadjustments, including recoveries and the impact of work stoppages initiated by certain labor unions in North America in 2023.
** Net of divestitures.
•Volume and mix, net of customer price reductions,adjustments including recoveries, was mainly driven by the impact of the decline in vehicle production volume caused by government imposed global shutdowns relatedincreases due to the COVID-19 pandemic.stabilization of the supply environment.
•The impact of foreign currency exchange was impacted by the Brazilian Real, the Chinese Renminbi, Canadian Dollar, the Euro, the Polish Zloty, and the Czech Koruna.
•The Cost Decreases / (Increases) category above includes:
◦Reduction in compensation-related expenses, due to salaried headcount initiatives, purchasing savings through lean initiatives, and restructuring savings;
◦Commodity cost fluctuations, wage increases and variable employee compensation increases;
◦The non-recurrence of the prior year one-time impact of commercial settlements in Asia Pacific and tax settlements in Brazil;
◦Net manufacturing efficiencies of $63 million, weakened by the impact of COVID-19, primarily driven by our European, North America and Asia Pacific segments.
Year Ended December 31, 2019 Compared with Year Ended December 31, 2018
Sales
| | | | | | | | | | | | | | | | | | | | | | | | | | | | | | | | | | | | | | |
| Year Ended December 31, | | | Variance Due To: |
| 2019 | | 2018 | | Change | | | Volume / Mix* | | Foreign Exchange | | Acquisitions / Divestiture, Net
|
| (Dollar amounts in thousands) |
| Sales to external customers | | | | | | | | | | | | |
| North America | $ | 1,543,845 | | | $ | 1,872,938 | | | $ | (329,093) | | | | $ | (165,118) | | | $ | (5,589) | | | $ | (158,386) | |
| Europe | 826,335 | | | 982,967 | | | (156,632) | | | | (58,348) | | | (44,866) | | | (53,418) | |
| Asia Pacific | 503,953 | | | 571,160 | | | (67,207) | | | | (81,777) | | | (22,623) | | | 37,193 | |
| South America | 94,535 | | | 98,063 | | | (3,528) | | | | 4,393 | | | (7,921) | | | — | |
| Total Automotive | 2,968,668 | | | 3,525,128 | | | (556,460) | | | | (300,850) | | | (80,999) | | | (174,611) | |
| Corporate, eliminations and other | 139,732 | | | 98,914 | | | 40,818 | | | | (9,366) | | | (5,866) | | | 56,050 | |
| Consolidated | $ | 3,108,400 | | | $ | 3,624,042 | | | $ | (515,642) | | | | $ | (310,216) | | | $ | (86,865) | | | $ | (118,561) | |
* Net of customer price reductions
•The impact of foreign currency exchange primarily related to the Euro, the Chinese Renminbi, and the Brazilian Real.
Segment adjusted EBITDA
| | | | | | | | | | | | | | | | | | | | | | | | | | | | | | | | | | | | | | | | | | | | |
| Year Ended December 31, | | | Variance Due To: |
| 2019 | | 2018 | | Change | | | Volume / Mix* | | Foreign Exchange | | Cost Decreases / (Increases) | | Acquisitions / Divestiture, Net
|
| (Dollar amounts in thousands) |
| Segment adjusted EBITDA | | | | | | | | | | | | | | |
| North America | $ | 213,250 | | | $ | 319,653 | | | $ | (106,403) | | | | $ | (103,403) | | | $ | (6,828) | | | $ | 15,196 | | | $ | (11,368) | |
| Europe | 22,922 | | | 40,980 | | | (18,058) | | | | (25,169) | | | (3,221) | | | 14,819 | | | (4,487) | |
| Asia Pacific | (27,497) | | | 14,118 | | | (41,615) | | | | (50,919) | | | (1,274) | | | 10,752 | | | (174) | |
| South America | (3,446) | | | (7,138) | | | 3,692 | | | | 2,261 | | | (866) | | | 2,297 | | | — | |
| Total Automotive | 205,229 | | | 367,613 | | | (162,384) | | | | (177,230) | | | (12,189) | | | 43,064 | | | (16,029) | |
| Corporate, eliminations and other | (3,621) | | | 5,045 | | | (8,666) | | | | (3,680) | | | 1,539 | | | (13,379) | | | 6,854 | |
| Consolidated adjusted EBITDA | $ | 201,608 | | | $ | 372,658 | | | $ | (171,050) | | | | $ | (180,910) | | | $ | (10,650) | | | $ | 29,685 | | | $ | (9,175) | |
* Net of customer price reductions
•The unfavorablenet impact of foreign currency exchange was primarily driven by the Canadian Dollar, the Euro, the Chinese Renminbi, the Polish Zloty, the Czech Korunarelated to Mexican Peso and the Brazilian Real.
•The Cost Decreases(Increases) / (Increases)Decreases category above includes:
◦The increase in commodity, general inflation,Commodity cost and tariffs;
���Tax settlements in South America and the one-time impact of commercial settlements in Asia Pacific;inflationary economics;
◦Net operational efficiencies of $80.9 million primarily driven by our North America, Europe,Manufacturing and Asia Pacific segments;purchasing savings through lean initiatives; and
◦The decrease in selling, administrative and engineering expense due to efficiencies related to cost improvement initiatives.Increased compensation-related expenses.
Liquidity and Capital Resources
Short and Long-Term Liquidity Considerations and Risks
We intendThe sources to fund our ongoing working capital, capital expenditures, debt service and other funding requirements throughare a combination of cash flows from operations, cash on hand, borrowings under our senior asset-based revolving credit facility (“ABL Facility”) and receivables factoring. We utilize intercompany loans and equity contributions to fund our worldwide operations. There may be country-specific regulations which may restrict or result in increased costs in the repatriation of these funds. See Note 11. “Debt”10. “Debt and Other Financing” to the consolidated financial statements in Item 8. “Financial Statements and Supplementary Data” of this Report for a detailed discussion of terms and conditions related to our debt.additional information.
We continue to take aggressive action toactively preserve cash and enhance liquidity, including significantly decreasing our capital expenditures. In the second quarterexpenditures as a percent of 2020, we issued $250 million in 13% Senior Secured Notes to provide additional liquidity due to the financial uncertainties resulting from the COVID-19 pandemic. Based on those actions and current projections for increasing OEM customer production, we believe that our cash flows from operations, cash on hand, borrowings under our ABL Facility and receivables factoring will enable us to meet our ongoing working capital, capital expenditures, debt service and other funding requirements for the next twelve months, despite the challenges presented by the COVID-19 pandemic.sales. We continuously monitor and forecast our liquidity situation in light of automotive industry, customer and economic factors, and take the necessary actions to preserve our liquidity and evaluate other financial alternatives that may be available to us should the need arise. Our ability to fund our working capital needs, debt payments and other obligations, and to comply with the financial covenants, including borrowing base limitations, under our ABL Facility, depend on our future operating performance and cash flows and many factors outside of our control, including the costs of raw materials, the state of the overall automotive industry and financial and economic conditions, including work stoppages and the continued impact of COVID-19,public health events, and other factors. Based on those actions and current projections of light vehicle production and customer demand for our products, we believe that our cash flows from operations, cash on hand, availability under our ABL Facility and receivables factoring will enable us to meet our ongoing working capital requirements, capital expenditures, debt service and other funding requirements for the foreseeable future, despite the challenges facing the industry.
Cash Flows
Operating Activities. Net cash used inprovided by operating activities was $15.9$117.3 million for the year ended December 31, 2020,2023, compared to net cash provided byused in operating activities of $97.7$36.2 million for the year ended December 31, 2019.2022. The net change was primarily due to decreased cash earnings,improved operating performance partially offset by collections on receivables and changes in other working capital items.
Netbalances, including the receipt of $54.3 million in cash provided bypayments from the United States Internal Revenue Service for tax refunds related to net operating activities was $97.7 million forloss carrybacks in the year ended December 31, 2019, compared to $149.4 million for the year ended December 31, 2018. The lower inflow was primarily due to decreased cash earnings, and timing of customer payments, partially offset by payments to suppliers and changes in accrued liabilities.2022.
Investing Activities. Net cash used in investing activities was $106.9$65.0 million for the year ended December 31, 2020, compared to net cash provided by investing activities of $84.0 million for the year ended December 31, 2019. Cash used in investing activities consisted primarily of capital spending of $91.8 million for the year ended December 31, 2020. For the year ended December 31, 2019, cash provided by investing activities consisted primarily of gross proceeds of $243.4 million from the sale of our AVS product line, partially offset by capital spending of $164.5 million. Significant decreases in capital expenditures occurred throughout 2020, in order to preserve liquidity in response to the COVID-19 pandemic. We anticipate that we will spend approximately $100 million to $125 million on capital expenditures in 2021.
Net cash provided by investing activities was $84.0 million for the year ended December 31, 2019,2023, compared to net cash used in investing activities of $383.0$17.9 million for the year ended December 31, 2018.2022. The net change was primarily related to proceeds of $50.0 million related to the sale-leaseback of a certain European facility which were received in the year ended December 31, 2022, compared with net proceeds of $15.4 million related to our 2023 divestitures which were received in the year ended December 31, 2023. We expect capital expenditures in 2024 to be relatively consistent with 2023, primarily as part of initiatives to consistently lower overall capital spending. We anticipate that we will spend approximately $75 - $85 million on capital expenditures in 2024.
Financing Activities. Net cash provided byused in financing activities totaled $207.7$81.1 million for the year ended December 31, 2020,2023, compared to net cash used inprovided by financing activities of $84.0$4.3 million for the year ended December 31, 2019.2022. The inflowchange was primarily due to the impact of the Refinancing Transactions (as defined below).
Refinancing Transactions
On January 27, 2023 (the “Settlement Date”), the Company, Cooper-Standard Automotive Inc. (the “Issuer”), a wholly-owned subsidiary of the Company, and certain other of the Company’s direct and indirect subsidiaries completed certain refinancing transactions (the “Refinancing Transactions”) consisting of: (i) the exchange (the “Exchange Offer”) of $357.4 million aggregate principal amount of the Issuer’s then existing 5.625% Senior Notes due 2026 (the “2026 Senior Notes”) (representing 89.36% of the aggregate principal amount outstanding of the 2026 Senior Notes) for $357.4 million aggregate principal amount of the Issuer’s newly issued 5.625% Cash Pay / 10.625% PIK Toggle Senior Secured Third Lien Notes due 2027 (the “Third Lien Notes”), (ii) the issuance by the Issuer (the “Concurrent Notes Offering”) of $580.0 million aggregate principal amount of 13.50% Cash Pay / PIK Toggle Senior Secured First Lien Notes due 2027 (the “First Lien Notes” and, together with the Third Lien Notes, the “New Notes”) to holders of 2026 Senior Notes or their designees who participated in the Exchange Offer, including to certain backstop commitment parties who committed to purchase the First Lien Notes not otherwise subscribed for, (iii) the related consent solicitation (the “Consent Solicitation”) to remove substantially all of the covenants, certain events of default and certain other provisions contained in the 2026 Senior Notes and the indenture governing the 2026 Senior Notes and to release and discharge the guarantee of the 2026 Senior Notes by the Company, (iv) the effectiveness of the Third Amendment (as defined below) to the ABL Facility and (v) the use of proceeds from issuance of the Senior SecuredConcurrent Notes duringOffering, together with cash on hand, to prepay all amounts outstanding under the year ended December 31, 2020 There were also no share repurchases during the year ended December 31, 2020.Term Loan Facility (as defined below)
Net cash used in financing activities totaled $84.0 million forat par, plus any accrued and unpaid interest thereon, to redeem the year ended December 31, 2019, compared to $14.4 million forIssuer’s existing 2024 Senior Secured Notes (as defined below), including the year ended December 31, 2018. The change was primarily due to repayment of borrowings under our revolving credit facilityprepayment premium and local borrowing lines. Cash used for share repurchases was $36.6 millionany accrued and $60.0 million for the years ended December 31, 2019 and 2018, respectively.
Senior Notes
On November 2, 2016, the Company’s wholly-owned subsidiary, CSA Inc. (the “Issuer”) completed a private offering of debt securities consisting of the issuance of $400.0 million aggregate principal amount of its 5.625% notes due 2026 (the “Senior Notes”). The proceeds from the sale of the Senior Notes were used to repay the non-extended term loans outstanding under the Term Loan Facilityunpaid interest thereon, and to pay fees and expenses related to the refinancing.Refinancing Transactions. As a result of the Refinancing Transactions, the Issuer extended the maturities of its indebtedness and reduced the amount of cash interest it is required to pay on such indebtedness for the next two years. The Company recognized a loss on the refinancing and extinguishment of debt of $81.9 million during the year ended December 31, 2023. Additionally, the Company incurred total fees of $91.8 million associated with the Refinancing Transactions, of which $87.6 million were paid during the year ended December 31, 2023 and $4.2 million were paid during 2022. The fees paid during the year ended December 31, 2023 are reflected as a financing outflow in the consolidated statement of cash flows. Of the fees paid during the year ended December 31, 2023, $73.4 million was included in the loss on the refinancing and extinguishment of debt referenced above, $13.2 million is presented as a direct deduction from the principal balance in the consolidated balance sheet, and $1.0 million related to amending the ABL Facility is recorded in other long-term assets in the consolidated balance sheet.
New Notes
On the Settlement Date, the Issuer issued $580.0 million aggregate principal amount of First Lien Notes pursuant to an indenture, dated as of the Settlement Date (the “First Lien Notes Indenture”), by and among the Issuer, the guarantors party thereto and U.S. Bank Trust Company, National Association, as trustee and collateral agent (the “First Lien Collateral Agent”).
The First Lien Notes will mature on March 31, 2027. The First Lien Notes bear interest at the rate of 13.50% per annum, payable in cash; provided, however, that for the first four interest periods after the Settlement Date, the Issuer has the option, in its sole discretion, to pay up to 4.50% of such interest on the First Lien Notes, in such amount as specified by the Issuer, by increasing the principal amount of the outstanding First Lien Notes or, in limited circumstances as described in the First Lien Notes Indenture, by issuing additional First Lien Notes. As of December 31, 2023, the aggregate principal amount of the First Lien Notes of $596.0 million recognized in the consolidated balance sheet reflects the election that was made by the Company to pay 4.50% of the first three interest payments (June 2023, December 2023 and June 2024) as payment-in-kind. Interest on the First Lien Notes is payable semi-annually in arrears on June 15 and December 15 of each year, and commenced on June 15, 2023.
As of December 31, 2023, the Company had $8.2 million of unamortized debt issuance costs and $0.3 million of unamortized original issue discount related to the First Lien Notes, which are presented as direct deductions from the principal balance in the consolidated balance sheet. Both the debt issuance costs and the original issue discount are amortized into interest expense over the term of the First Lien Notes.
On the Settlement Date, the Issuer issued $357.4 million aggregate principal amount of Third Lien Notes pursuant to an indenture, dated as of the Settlement Date (the “Third Lien Notes Indenture”), by and among the Issuer, the guarantors party thereto and U.S. Bank Trust Company, National Association, as trustee and collateral agent (the “Third Lien Collateral Agent”).
The Third Lien Notes will mature on May 15, 2027. The Third Lien Notes bear interest at the rate of 5.625% per annum, payable in cash; provided, however, that for the first four interest periods after the Settlement Date, the Issuer has the option, in its sole discretion, to instead pay such interest at 10.625% per annum either by increasing the principal amount of the outstanding Third Lien Notes or, in limited circumstances as described the Third Lien Notes Indenture, by issuing additional Third Lien Notes. As of December 31, 2023, the aggregate principal amount of the Third Lien Notes of $386.7 million recognized in the consolidated balance sheet reflects the election that was made by the Company to fully pay the first two interest payments (June 2023 and December 2023) on the Third Lien Notes as payment-in-kind. The Company has elected to pay the third interest payment, due June 15, 2024, on the Third Lien Notes in cash. Interest on the Third Lien Notes is payable semi-annually in arrears on June 15 and December 15 of each year, and commenced on June 15, 2023.
Debt issuance costs related to the Third Lien Notes are amortized into interest expense over the term of the Third Lien Notes. As of December 31, 2023, the Company had $5.1 million of unamortized debt issuance costs related to the Third Lien Notes, which are presented as a direct deduction from the principal balance in the consolidated balance sheet.
In connection with the issuance of the New Notes, the First Lien Collateral Agent, the Third Lien Collateral Agent, the collateral agent under the ABL Facility (the “ABL Facility Collateral Agent”), the Issuer, Holdings and the several other parties named therein entered into the First Lien and Third Lien Intercreditor Agreement, providing for the relative priorities of their respective security interests in the assets securing the First Lien Notes, the Third Lien Notes and the ABL Facility, and certain other matters relating to the administration of security interests.
For additional information regarding the guarantees, covenants and events of default with respect to the New Notes, see Note 10. “Debt and Other Financing” to the consolidated financial statements in Item 8. “Financial Statements and Supplementary Data” of this Report.
2026 Senior Notes
On November 2, 2016, the Issuer issued $400.0 million aggregate principal amount of 2026 Senior Notes. On the Settlement Date, in connection with the Refinancing Transactions, the Issuer completed the Exchange Offer and delivered $357.4 million aggregate principal amount of the exchanged 2026 Senior Notes to the trustee for cancellation. Following the completion of the Exchange Offer, $42.6 million aggregate principal amount of the 2026 Senior Notes remain outstanding.
The 2026 Senior Notes are guaranteed by us, as well as each of CSA Inc.’sthe Issuer’s wholly-owned existing or subsequently organized U.S. subsidiaries, subject to certain exceptions, to the extent such subsidiary guarantees the ABL Facility and the Term Loan Facility. The Issuer may, at its option, redeem all or part of the 2026 Senior Notes at various points in time prior to maturity, as described in the indenture.indenture governing the 2026 Senior Notes. The 2026 Senior Notes will mature on November 15, 2026. Interest on the 2026 Senior Notes is payable semi-annually in arrears in cash on May 15 and November 15 of each year.
IfThe Company paid approximately $7.1 million of debt issuance costs in connection with the issuance of the 2026 Senior Notes. The debt issuance costs are being amortized into interest expense over the term of the 2026 Senior Notes. As of December 31, 2023 and December 31, 2022, the Company had $0.2 million and $2.7 million, respectively, of unamortized debt issuance costs related to the 2026 Senior Notes, which is presented as a Change of Control (as defineddirect deduction from the principal balance in the indenture) occurs, we will be required to make an offer to repurchase all of the Senior Notes at a price equal to 101% of the principal amount, plus accrued and unpaid interest, if any, to, but excluding, the repurchase date.consolidated balance sheets.
2024 Senior Secured Notes
On May 29, 2020, Cooper Standard Automotive Inc. (the “Issuer”),the Issuer issued $250.0 million aggregate principal amount of its 13.0%13.000% Senior Secured Notes due 2024 (the “Senior“2024 Senior Secured Notes”), pursuant to the Indenture,an indenture, dated as of May 29, 2020, (the “Indenture”), by and among the Issuer, the other guarantors party thereto and U.S. Bank National Association, as trustee,trustee. In the first quarter of 2023, in a transaction exempt from registration under Rule 144A and Regulation Sconnection with the Refinancing Transactions, the Issuer redeemed all of the Securities Actoutstanding 2024 Senior Secured Notes on the Settlement Date at the redemption price of 1933. Proceeds from106.500% of the principal amount thereof, plus accrued and unpaid interest thereon.
The Company paid approximately $6.4 million of debt issuance costs in connection with the issuance of the 2024 Senior Secured Notes. Additionally, the 2024 Senior Secured Notes were usedissued at a discount of $5.0 million. As of December 31, 2022, the Company had $3.0 million of unamortized debt issuance costs and $2.5 million of unamortized original issue discount related to provide additional liquidity for the Company. The2024 Senior Secured Notes, are guaranteed on a senior secured basis by CS Intermediate HoldCo 1 LLCwhich were presented as direct deductions from the principal balance in the consolidated balance sheet. Both the debt issuance costs and eachthe original issue discount were amortized into interest expense over the term of the Issuer’s present and future subsidiaries that are obligors or guarantee the Term Loan Facility and each of the Issuer’s wholly owned domestic subsidiaries that are obligors under, or guarantee, certain other indebtedness, subject to certain exceptions. The notes are also guaranteed on a senior unsecured basis by Cooper-Standard Latin America B.V.
The Issuer may redeem all or part of the2024 Senior Secured Notes prior to maturity at the prices set forth in the Indenture. The Senior Secured Notes mature on June 1, 2024. Interest on the Senior Secured Notes is payable semi-annually in arrears in cash on June 1 and December 1 of each year, commencing on December 1, 2020.Notes.
ABL Facility
On November 2, 2016, CS Intermediate Holdco 1 LLC (“Parent”), CSA U.S.Holdings, Cooper-Standard Automotive Inc. (the “U.S. Borrower”), Cooper-Standard Automotive Canada Limited (the “Canadian Borrower”), Cooper-Standard Automotive International Holdings B.V. (the “Dutch Borrower”, and, together with the U.S. Borrower and the Canadian Borrower, the “Borrowers”) and certain subsidiaries of the U.S. Borrower, entered into a third amendment and restatement of ourthe ABL Facility. In March 2020, the CompanyBorrowers entered into the First Amendment ofNo. 1 to the Third Amended and Restated Loan Agreement (“the First Amendment”). As a result of the First Amendment, the senior asset-based revolving credit facility (“ABL Facility”)Facility maturity was extended to March 2025 and the aggregate revolving loan commitment was reduced to $180.0 million.
In addition, ourMay 2020, the Borrowers entered into Amendment No. 2 to the Third Amended and Restated Loan Agreement (the “Second Amendment”), which Second Amendment modified certain covenants under the ABL Facility. In December 2022, the Borrowers entered into Amendment No. 3 to the Third Amended and Restated Loan Agreement (the “Third Amendment”), which became effective on the Settlement Date. The Third Amendment provides for the ABL Facility to be amended to:
•permit the U.S. Borrower to issue the New Notes in the Concurrent Notes Offering and Exchange Offer, including the granting of liens, subject to the restrictions set forth in the ABL Facility;
•provide for certain of the U.S. Borrower’s wholly-owned subsidiaries organized in Costa Rica, France, Mexico, the Netherlands, Romania and certain other jurisdictions specified from time to time to become guarantors under the ABL Facility;
•authorize the ABL Facility Collateral Agent to enter into an intercreditor agreement with the collateral trustees for the New Notes; and
•remove the Dutch Borrower as a borrower under the ABL Facility.
The aggregate revolving loan availability includes a $100.0 million letter of credit sub-facility and a $25.0 million swing line sub-facility. The ABL Facility also provides for an uncommitted $100.0 million incremental loan facility, for a potential total ABL Facility of $280.0 million.million (if requested by the Borrowers and the lenders agree to fund such increase). No consent of any lender (other than those participating in the increase) is required to effect any such increase.The Company’s borrowing base as of December 31, 2023 was $169.5 million and the monthly fixed charge coverage ratio was at a level that provided the Company full access to the borrowing base. Net of $7.1 million of outstanding letters of credit, the Company effectively had $162.4 million available for borrowing under its ABL Facility.
TheAs of December 31, 2023 and December 31, 2022, there were no borrowings under the ABL Facility.
Maturity. Any borrowings then outstanding under our ABL Facility includes affirmativewill mature, and negative covenants that impose substantial restrictions onthe commitments of the lenders under our financial and business operations. The ABL Facility also contains various eventswill terminate, on March 24, 2025.
Borrowing Base. As of default that are customary for comparable facilities.
Loanthe Settlement Date, the loan and letter of credit availability under the agreementABL Facility is subject to a borrowing base, which at any time is limited to the lesser of: (A) the maximum facility amount (subject to certain adjustments) and (B) (i) up to 85% of eligible accounts receivable; plus (ii) the lesser of 70% of eligible inventory or 85% of the appraised net orderly liquidation value of eligible inventory; plus (iii) up to the lesser of $30.0 million and 85% of eligible tooling accounts receivable; minus reserves established by the agent.ABL Facility Collateral Agent. The obligationsaccounts receivable portion of the borrowing base is subject to certain formulaic limitations (including concentration limits). The inventory portion of the borrowing base is limited to eligible inventory, as determined by the ABL Facility Collateral Agent. The borrowing base is also subject to certain reserves, which are established by the ABL Facility Collateral Agent (which may include changes to the advance rates indicated above). Loan availability under the ABL Facility and the related guarantees are secured by various assets,is apportioned as detailed in Note 11. “Debt”follows: $160.0 million to the consolidated financial statements in Item 8. “Financial StatementsU.S. Borrower and Supplementary Data” of this Report.$20.0 million to the Canadian Borrower.
Interest. Borrowings under the ABL Facility bear interest at a rate equal to, at the Borrowers’ option:
•in the case of borrowings by the U.S. Borrower, London Inter-Bank Offered Ratethe forward-looking secured overnight funding rate for the applicable interest period (“LIBOR”Term SOFR”) (including a credit spread adjustment of 0.11448% or 0.26161%, depending on the applicable interest period) or the base rate plus, in each case, an applicable margin; or
•in the case of borrowings by the Canadian Borrower, bankers’ acceptance (“BA”) rate, Canadian prime rate or Canadian base rate plus, in each case, an applicable margin; or
•in the case of borrowings by the Dutch Borrower, LIBOR plus an applicable margin.
The applicable margin may vary between 1.50%2.00% and 2.00%2.50% with respect to the LIBORTerm SOFR or Canadian BA rate-based borrowings and between 0.50%1.00% and 1.00%1.50% with respect to U.S. base rate, Canadian prime rate and Canadian base rate borrowings. The applicable margin is subject, in each case, to quarterly pricing adjustments (based on average facility availability).
Fees. The Borrowers are required to pay a fee in respect of committed but unutilized commitments. The ABL Facility also requires the payment of customary agency and administrative fees.
Voluntary Prepayments. The Borrowers are able to voluntarily reduce the unutilized portion of the commitment amount and repay outstanding loans, in each case, in whole or in part, at any time without premium or penalty (other than customary breakage and related reemployment costs with respect to repayments of SOFR-based borrowings).
Debt Issuance Costs. As of December 31, 2020,2023 and December 31, 2022, the Company had $150.9 million in availability. As of December 31, 2020 and 2019, the Company had $1.0$0.9 million and $0.7$0.5 million, respectively, inof unamortized debt issuance costs.costs related to the ABL Facility recorded in other long-term assets in the consolidated balance sheets.
For additional information regarding the guarantees, covenants and events of default with respect to the ABL Facility, see Note 10. “Debt and Other Financing” to the consolidated financial statements in Item 8. “Financial Statements and Supplementary Data” of this Report.
Term Loan Facility– Amendments
On November 2, 2016, CSA U.S.Cooper-Standard Automotive Inc., as borrower, entered into the first amendment of our TermAmendment No. 1 to its senior term loan facility (the “Term Loan Facility. The Term Loan Facility providesFacility”), which provided for loans in an aggregate principal amount of $340.0 million. Subject to certain conditions,In connection with the Refinancing Transactions, Cooper-Standard Automotive Inc. repaid the Term Loan Facility withoutin full on the consent of the then existing lenders (but subject to the receipt of commitments), may be expanded (or a new term loan or revolving facility added) by an amount that will not cause the consolidated secured net debt ratio to exceed 2.25 to 1.00, plus $400.0 million, plus any voluntary prepayments (including revolving facilitySettlement Date and ABL Facility to the extent commitments are reduced) not funded from proceeds of long-term indebtedness. The Term Loan Facility matures on November 2, 2023, unless earlier terminated.
The Term Loan Facility contains incurrence-based negative covenants customary for high yield senior secured debt securities. These negative covenants are subject to exceptions, qualifications and certain carveouts.
On May 2, 2017, CSA U.S. entered into Amendment No. 2 to the Term Loan Facility to modify the interest rate. Subsequently, on March 6, 2018,was terminated.
As of December 31, 2022, the Company entered into Amendment No. 3 to the Term Loan Facility to further modify the interest rate. In accordance with this amendment, borrowings under the Term Loan Facility bear interest, at the Company’s option, at either (1) with respect to Eurodollar rate loans, the greaterhad $0.5 million of the applicable Eurodollar rate and 0.75% plus 2.0% per annum, or (2) with respect to base rate loans, the base rate, (which is the highest of the then current federal funds rate plus 0.5%, the prime rate most recently announced by the administrative agent under the term loan, and the one-month Eurodollar rate plus 1.0%) plus 1.0% per annum. As a result of the Amendment No. 3, the Company recognized a loss on refinancing and extinguishment of debt of $0.8 million in the first quarter of 2018, which was due to the partial write off of new and unamortized debt issuance costs and unamortized original issue discount.
All obligations of the borrower under the Term Loan Facility are guaranteed jointly and severally on a senior secured basis by us and the wholly-owned U.S. restricted subsidiaries of CSA U.S.
As of December 31, 2020, the principal amount of $326.4 million was outstanding, and the Company had $1.7 million unamortized debt issuance costs and $1.1$0.3 million of unamortized original issue discount.discount related to the Term Loan Facility. Both the debt issuance costs and the original issue discount were amortized into interest expense over the term of the Term Loan Facility.
For a further description of the Term Loan Facility, see Note 10. “Debt and Other Financing” to the consolidated financial statements in Item 8. “Financial Statements and Supplementary Data” of this Report.
Off-Balance Sheet Arrangements
As a part of our working capital management, we sell accounts receivable from certain European customers accounts receivable through a third partythird-party financial institution in off-balance sheet arrangements. The amount sold varies each month based on the amount of underlying receivables and cash flow needs. As of December 31, 20202023 and 2019,2022, we had $85.1$47.9 million and $103.8$52.5 million, respectively, of receivables outstanding under receivable transfer agreements entered into by various locations. For the years ended December 31, 20202023 and 2019,2022, total accounts receivable factored were $476.4$420.1 million and $556.1$355.3 million, respectively. Costs incurred on the sale of receivables were $0.8$2.2 million, $1.0$0.7 million and $1.2$0.5 million for the years ended December 31, 2020, 20192023, 2022 and 2018,2021, respectively. These amounts are recorded in other expense, net in the consolidated statements of operations. These are permitted transactions under the credit agreements governing ourthe ABL Facility and Term Loan Facilitythe indentures governing the New Notes and the indenture governing the2026 Senior Notes and Senior Secured Notes.
As of December 31, 2020, we had no other off-balance sheet arrangements.
Other Capital Transactions Impacting Liquidity
Share Repurchase Program
In June 2018, our Board of Directors approved a common stock repurchase program (the “2018 Program”) authorizing us to repurchase, in the aggregate, up to $150.0 million of our outstanding common stock. Under the 2018 Program, repurchases may be made on the open market, through private transactions, accelerated share repurchases, round lot or block transactions on
the New York Stock Exchange or otherwise, as determined by management and in accordance with prevailing market conditions and federal securities laws and regulations. We expect to fund any future repurchases from cash on hand and future cash flows from operations. We are not obligated to acquire a particular amount of securities, and the 2018 Program may be discontinued at any time at our discretion. The 2018 Program was effective beginning November 2018. As of December 31, 2020,2023, we had approximately $98.7 million of repurchase authorization under the 2018 Program.
We did not make any repurchases under the 2018 Program during the yearyears ended December 31, 2020.
2019 Repurchases
In May 2019, we entered into an accelerated share repurchase (“ASR”) agreement with a third-party financial institution to repurchase our common stock pursuant to the 2018 Program. Under the ASR agreement, we made an up-front payment of $30.0 million and received an initial delivery of 626,305 shares of our common stock in the second quarter of 2019. The repurchase was completed in the third quarter of 2019 when we received final delivery of an additional 72,875 shares. A total of 699,180 shares were repurchased under the ASR agreement at a weighted average purchase price of $42.91 per share.
In addition to the repurchase under the ASR agreement, during the year ended December 31, 2019, we utilized $5.9 million of cash on hand to repurchase 85,000 shares of common stock at an average purchase price of $69.85 per share.
See Item 5. “Market for Registrant’s Common Equity, Related Stockholder Matters and Issuer Purchases of Equity” and Note 20. “Equity” to the consolidated financial statements included in Item 8. “Financial Statements and Supplementary Data” of this Report for additional information.2023, 2022 or 2021.
Contractual Obligations
Our contractual obligations consist of legal commitments requiring us to make fixed or determinable cash payments, regardless of the contractual requirements of the vendor to provide future goods or services. Except as otherwise disclosed, this table does not include information on our recurring purchase of materials for use in production because our raw materials purchase contracts typically do not require fixed or minimum quantities.
The following table summarizes the total amounts due as of December 31, 2020in future periods under all debt agreements at nominal value, undiscounted finance lease commitments and other contractual obligations.obligations as of December 31, 2023: | | | | | | | | | | | | | | | | | | | | | | | | | | | | | |
| | Payment due by period |
| | Total | | Less than
1 year | | 1-3 years | | 3-5 years | | More than
5 years |
| | (Dollar amounts in millions) |
| Debt obligations (a) | $ | 1,134.1 | | | $ | 48.2 | | | $ | 42.6 | | | $ | 1,043.3 | | | $ | — | |
| Interest on debt obligations (b) | 326.4 | | | 70.1 | | | 221.5 | | | 34.8 | | | — | |
| Operating lease obligations | 119.4 | | | 24.1 | | | 33.9 | | | 20.6 | | | 40.8 | |
| Finance lease obligations | 28.2 | | | 3.7 | | | 7.1 | | | 6.1 | | | 11.3 | |
| Total | $ | 1,608.1 | | | $ | 146.1 | | | $ | 305.1 | | | $ | 1,104.8 | | | $ | 52.1 | |
| | | | | | | | | | | | | | | | | | | | | | | | | | | | | |
| | Payment due by period |
| | Total | | Less than
1 year | | 1-3 years | | 3-5 years | | More than
5 years |
| | (Dollar amounts in millions) |
| Debt obligations | $ | 1,012.4 | | | $ | 39.4 | | | $ | 323.0 | | | $ | 250.0 | | | $ | 400.0 | |
| Interest on debt obligations | 275.7 | | | 65.5 | | | 126.5 | | | 61.2 | | | 22.5 | |
| Operating lease obligations | 141.0 | | | 26.8 | | | 38.9 | | | 24.2 | | | 51.1 | |
| Finance lease obligations | 38.5 | | | 3.5 | | | 6.4 | | | 7.0 | | | 21.6 | |
| Total | $ | 1,467.6 | | | $ | 135.2 | | | $ | 494.8 | | | $ | 342.4 | | | $ | 495.2 | |
(b) Assumes (i) the Third Lien Notes interest payment on June 15, 2024 will be paid in cash and the interest payment on December 15, 2024 will be paid in payment-in-kind and (ii) 4.50% of the interest on the First Lien Notes payable on June 15, 2024 and December 15, 2024 will be paid in payment-in-kind. Payment of interest on the Third Lien Notes and the First Lien Notes in payment-in-kind is at the Company’s discretion for the first four interest payments.
In addition to our contractual obligations and commitments set forth in the table above, we have employment arrangements with certain key executives that provide for continuity of management. These arrangements include payments of multiples of annual salary, certain incentives and continuation of benefits upon the occurrence of specified events in a manner
believed to be consistent with comparable companies. As of December 31, 2020,2023, the Company had additional operating leases, primarily for real estate, that have not yet commenced with undiscounted lease payments of approximately $1.4$1.2 million.
We also have funding requirements with respect to our pension obligations. We expect to make cash contributions to our U.S. and foreign pension plans of approximately $1.0$10.0 million and $4.5$0.4 million, respectively, in 2021.2024. The expected cash contributions to the Company’s U.S. pension plans primarily relates to the expected termination of a certain U.S. pension plan. Our minimum funding requirements after 20212024 will depend on several factors, including the investment performance of our retirement plans and prevailing interest rates. Our funding obligations may also be affected by changes in applicable legal requirements. We also have payments due with respect to our postretirement benefit obligations. We do not prefund our postretirement benefit obligations. Rather, payments are made as costs are incurred by covered retirees. We expect net other postretirement benefit payments to be approximately $2.6$2.1 million in 2021.2024.
We may be required to make significant cash outlays due to our unrecognized tax benefits. However, due to the uncertainty of the timing of future cash flows associated with our unrecognized tax benefits, we are unable to make reasonably reliable estimates of the period of cash settlement, if any, with the respective taxing authorities. Accordingly, unrecognized tax
benefits of $11.3$6.3 million as of December 31, 20202023 have been excluded from the contractual obligations table above. See Note 17.15. “Income Taxes” to the consolidated financial statements included in Item 8. “Financial Statements and Supplementary Data” of this Report for additional information.
Excluded from the contractual obligations table above are open purchase orders as of December 31, 20202023 for raw materials, supplies and capital expenditures in the normal course of business, supply contracts with customers, distribution agreements, joint venture agreements and other contracts without express funding requirements.
Other Matters
In the third quarter of 2023, we designated Liveline Technologies, Inc. (“Liveline”) an unrestricted subsidiary under the terms of certain of its debt agreements, but Liveline remains a wholly-owned subsidiary of Cooper-Standard Automotive Inc. Since being designated as an unrestricted subsidiary, Liveline had $0.6 million of net expenses in 2023. As of December 31, 2023, Liveline had less than $0.1 million of gross assets. Liveline will look to Cooper Standard for necessary funding until it is able to sustain itself through sales of its products and services.
Non-GAAP Financial Measures
In evaluating our business, management considers EBITDA and Adjusted EBITDA to be key indicators of our operating performance. Our management also uses EBITDA and Adjusted EBITDA:
•because similar measures are utilized in the calculation of the financial covenants and ratios contained in our financing arrangements;
•in developing our internal budgets and forecasts;
•as a significant factor in evaluating our management for compensation purposes;
•in evaluating potential acquisitions;
•in comparing our current operating results with corresponding historical periods and with the operational performance of other companies in our industry; and
•in presentations to the members of our board of directors to enable our board of directors to have the same measurement basis of operating performance as is used by management in their assessments of performance and in forecasting and budgeting for our company.
In addition, we believe EBITDA and Adjusted EBITDA and similar measures are widely used by investors, securities analysts and other interested parties in evaluating our performance. We define Adjusted EBITDA as net income (loss) plus income tax expense (benefit), interest expense, net of interest income, depreciation and amortization (or “EBITDA”),or EBITDA, as adjusted for items that management does not consider to be reflective of our core operating performance. These adjustments include, but are not limited to, restructuring costs, impairment charges, non-cash fair value adjustments and acquisition relatedacquisition-related costs.
EBITDA and Adjusted EBITDA are not financial measurements recognized under U.S. GAAP, and when analyzing our operating performance, investors should use EBITDA and Adjusted EBITDA as a supplement to, and not as alternatives for, net income (loss), operating income, or any other performance measure derived in accordance with U.S. GAAP, nor as an alternative to cash flow from operating activities as a measure of our liquidity. EBITDA and Adjusted EBITDA have limitations as analytical tools, and they should not be considered in isolation or as substitutes for analysis of our results of operations as reported under U.S. GAAP. These limitations include the following:
•they do not reflect our cash expenditures or future requirements for capital expenditure or contractual commitments;
•they do not reflect changes in, or cash requirements for, our working capital needs;
•they do not reflect interest expense or cash requirements necessary to service interest or principal payments under our ABL Facility, Term Loan Facility, SeniorNew Notes, and 2026 Senior Secured Notes;
•they do not reflect certain tax payments that may represent a reduction in cash available to us;
•although depreciation and amortization are non-cash charges, the assets being depreciated or amortized may have to be replaced in the future, and EBITDA and Adjusted EBITDA do not reflect cash requirements for such replacements; and
•other companies, including companies in our industry, may calculate these measures differently and, as the number of differences in the way companies calculate these measures increases, the degree of their usefulness as a comparative measure correspondingly decreases.
In addition, in evaluating Adjusted EBITDA, it should be noted that in the future, we may incur expenses similar to the adjustments in the below presentation. Our presentation of Adjusted EBITDA should not be construed as an inference that our future results will be unaffected by special items.
The following table provides a reconciliation of EBITDA and Adjusted EBITDA from net income (loss),loss, which is the most comparable financial measure in accordance with U.S. GAAP:
| | | | | | | | | | | | | | | | | |
| Year Ended December 31, |
| 2020 | | 2019 | | 2018 |
| (Dollar amounts in thousands) |
| Net (loss) income attributable to Cooper-Standard Holdings Inc. | $ | (267,605) | | | $ | 67,529 | | | $ | 103,601 | |
| Income tax (benefit) expense | (60,847) | | | 36,089 | | | (29,400) | |
| Interest expense, net of interest income | 59,167 | | | 44,113 | | | 41,004 | |
| Depreciation and amortization | 154,229 | | | 151,953 | | | 146,698 | |
| EBITDA | $ | (115,056) | | | $ | 299,684 | | | $ | 261,903 | |
| Impairment of assets held for sale | 86,470 | | | — | | | — | |
Gain on sale of business, net (1) | (2,834) | | | (191,571) | | | — | |
Restructuring charges (2) | 39,482 | | | 51,102 | | | 29,722 | |
Other impairment charges (3) | 17,417 | | | 23,139 | | | 43,706 | |
Pension settlement charges (4) | 184 | | | 15,997 | | | 775 | |
Project costs (5) | 5,648 | | | 2,090 | | | 4,881 | |
Lease termination costs (6) | 771 | | | 1,167 | | | — | |
| Divested noncontrolling interest debt extinguishment | 3,595 | | | — | | | — | |
Goodwill impairment charges (7) | — | | | — | | | 39,818 | |
Gain on sale of land (8) | — | | | — | | | (10,377) | |
Amortization of inventory write-up (9) | — | | | — | | | 1,460 | |
Loss on refinancing and extinguishment of debt (10) | — | | | — | | | 770 | |
| Adjusted EBITDA | $ | 35,677 | | | $ | 201,608 | | | $ | 372,658 | |
| | | | | | | | | | | | | | | | | |
| Year Ended December 31, |
| 2023 | | 2022 | | 2021 |
| (Dollar amounts in thousands) |
| Net loss attributable to Cooper-Standard Holdings Inc. | $ | (201,985) | | | $ | (215,384) | | | $ | (322,835) | |
| Income tax expense | 8,933 | | | 17,291 | | | 39,392 | |
| Interest expense, net of interest income | 130,077 | | | 78,514 | | | 72,511 | |
| Depreciation and amortization | 109,931 | | | 122,476 | | | 139,008 | |
| EBITDA | $ | 46,956 | | | $ | 2,897 | | | $ | (71,924) | |
| Restructuring charges | 18,018 | | | 18,304 | | | 36,950 | |
Deconsolidation of joint venture (1) | — | | | 2,257 | | | — | |
Impairment charges (2) | 4,768 | | | 43,710 | | | 25,609 | |
Gain on sale of businesses, net (3) | (586) | | | — | | | (696) | |
Gain on sale of fixed assets, net (4) | — | | | (33,391) | | | — | |
Lease termination costs (5) | — | | | — | | | 748 | |
Indirect tax adjustments (6) | — | | | 1,409 | | | — | |
Loss on refinancing and extinguishment of debt (7) | 81,885 | | | — | | | — | |
Pension settlement and curtailment charges (8) | 16,035 | | | 2,682 | | | 1,279 | |
| Adjusted EBITDA | $ | 167,076 | | | $ | 37,868 | | | $ | (8,034) | |
(1)(2)Non-cash impairment charges in 2023 related to certain assets in Europe and Asia Pacific. Non-cash impairment charges in 2022 related to operating performance and idle assets in certain locations in North America, Europe and Asia Pacific. Impairment charges in 2021 related to fixed assets and goodwill.
(3)Gain on sale of business primarilybusinesses related to divestitures in 2023. In 2021, the Company recorded subsequent adjustments to the net gain on sale of businesses, which related to the 2020 and divestiture of AVS product line in 2019. See Note 5. “Divestitures” to the consolidated financial statements included in Item 8. “Financial Statementsour European rubber fluid transfer and Supplementary Data” of this Report for additional information.
(2)Includes non-cash impairment charges related to restructuring.
(3)Other non-cash impairment charges in 2020 of $17,417 related to fixed assets and right-of-use operating lease assets, net of approximately $476 attributable to our noncontrolling interest. Impairment charges in 2019 related to fixed assets of $23,139. Impairment charges in 2018 related to intangible assets of $791 and fixed assets of $42,915.specialty sealing businesses, as well as its Indian operations.
(4)In 2022, the Company recognized a gain on a sale-leaseback agreement on one of its European facilities.
(5)Lease termination costs no longer recorded as restructuring charges in accordance with ASC 842, Leases.
(6)Impact of indirect tax adjustments in 2022.
(7)Loss on refinancing and extinguishment of debt related to refinancing transactions in 2023.
(8)Non-cash net pension settlement and curtailment charges and administrative fees incurred related to certain of our U.S. and non-U.S. pension plans.
(5)Project costs recorded in selling, administration and engineering expense related to acquisitions and divestitures.
(6)Lease termination costs no longer recorded as restructuring charges in accordance with ASC 842.
(7)Non-cash goodwill impairment charges in 2018 related to impairments at our Europe and Asia Pacific reporting units, net of approximately $5,463 attributable to our noncontrolling interests.
(8)Gain on sale of land in Europe that was contemplated in conjunction with our restructuring plan. See Note 9. “Property, Plant and Equipment” to the consolidated financial statements included in Item 8. “Financial Statements and Supplementary Data” of this Report for additional information.
(9)Amortization of write-up of inventory to fair value for the 2018 acquisitions.
(10)Loss on refinancing and extinguishment of debt relating to the March 2018 amendment and May 2017 amendment of the Term Loan Facility.
Recent Accounting Pronouncements
See Note 3. “New Accounting Pronouncements” to the consolidated financial statements included in Item 8. “Financial Statements and Supplementary Data” of this Report for additional information.
Item 7A. Quantitative and Qualitative Disclosures About Market Risk
We are exposed to fluctuations in interest rates, currency exchange rates and commodity prices. We actively manage our exposure to risk from changes in foreign currency exchange rates through the use of derivative financial instruments in accordance with management’s guidelines. We do not enter into derivative instruments for trading or speculative purposes. See Item 8. “Financial Statements and Supplementary Data,” specifically Note 12.11. “Fair Value Measurements and Financial Instruments” to the consolidated financial statements.
Foreign Currency Exchange Rate Risk. We use forward foreign exchange contracts to reduce the effect of fluctuations in foreign exchange rates on a portion of forecasted sales, material purchases and operating expenses. As of December 31, 2020,2023, the notional amount of these contracts was $97.5$207.1 million. As of December 31, 2020,2023, the fair value of the Company’s forward foreign exchange contracts was an asset of $1.1$0.3 million. The potential fair value of the forward foreign exchange contracts from a hypothetical 10% adverse or favorable movement in the foreign currency exchange rates in relation to the U.S. Dollar is as follows:
| | | | | | | | | | | | | | |
| | December 31, 20202023 | | December 31, 20192022 |
| 10% strengthening of U.S. Dollar | | ($5.6)- $16.4 million | | ($7.8)- $1.6 million |
| 10% weakening of U.S. Dollar | | + $21.2 million | | + $7.3 million | | + $10.5$21.4 million |
These estimates assume a parallel shift in all currency exchange rates and, as a result, may overstate the potential impact to earnings because currency exchange rates do not typically move all in the same direction.
In addition to transactional exposures, our operating results are impacted by the translation of our foreign operating income into U.S. dollars. In 2020,2023, net sales outside of the United States accounted for 78% of our consolidated net sales, although certain non-U.S. sales are U.S. dollar denominated. We do not enter into foreign exchange contracts to mitigate this exposure.
Interest Rates. The Company historically used interest rate swap contracts through the third quarter of 2018 to manage cash flow variability associated with its variable rate Term Loan Facility. Such interest rate swap contractscreate fixed the interest payments ofon variable rate debt instruments in order to manage exposure to fluctuations in interest rates. We did not enter into any interest rate swap contracts in 2020.2023 or 2022. As of December 31, 20202023, we did not have any outstanding debt at variable interest rates, and 2019,as of December 31, 2022, approximately 37.9% and 50.9%, respectively,38.1% of our total debt was at variable interest rates. The pre-tax earnings and cash flow impact of a 100 basis points increase or decrease in the interest rates on our variable rate debt outstanding at December 31, 2020 would be a $3.6 million increase or decrease, respectively, on an annualized basis.
Commodity Prices. We have commodity price risk with respect to purchases of certain raw materials, including natural gas and carbon black. Raw material, energy and commodity costs have been extremely volatile over the past several years. Historically, we have used derivative instruments to reduce our exposure to fluctuations in certain commodity prices. We did not enter into any commodity derivative instruments in 2020.2023 or 2022. We will continue to evaluate, and may use, derivative financial instruments to manage our exposure to raw material, energy and commodity price fluctuations in the future.
Item 8. Financial Statements and Supplementary Data
INDEX TO CONSOLIDATED FINANCIAL STATEMENTS
Annual Financial Statements
| | | | | |
| |
| | Page |
| Report of Ernst & Young LLP, Independent Registered Public Accounting Firm (PCAOB ID: 42) | |
| Report of Ernst & Young LLP, Independent Registered Public Accounting Firm, Internal Control over Financial Reporting | |
Consolidated statements of operations for the years ended December 31, 2020, 20192023, 2022 and 20182021 | |
Consolidated statements of comprehensive income (loss) for the years ended December 31, 2020, 20192023, 2022 and 20182021 | |
Consolidated balance sheets as of December 31, 20202023 and December 31, 20192022 | |
Consolidated statements of changes in equity for the years ended December 31, 2020, 20192023, 2022 and 20182021 | |
Consolidated statements of cash flows for the years ended December 31, 2020, 20192023, 2022 and 20182021 | |
| Notes to consolidated financial statements | |
| Schedule II—Valuation and Qualifying Accounts | |
Report of Independent Registered Public Accounting Firm
To the ShareholdersStockholders and the Board of Directors of Cooper-Standard Holdings Inc.
Opinion on the Financial Statements
We have audited the accompanying consolidated balance sheets of Cooper-Standard Holdings Inc. (the Company) as of December 31, 20202023 and 2019,2022, the related consolidated statements of operations, comprehensive income (loss), changes in equity and cash flows for each of the three years in the period ended December 31, 2020,2023, and the related notes and financial statement schedule listed in the Index at Item 15(a)2 (collectively referred to as the “financial“consolidated financial statements”). In our opinion, the consolidated financial statements present fairly, in all material respects, the financial position of the Company at December 31, 20202023 and 2019,2022, and the results of its operations and its cash flows for each of the three years in the period ended December 31, 2020,2023, in conformity with U.S. generally accepted accounting principles.
We also have audited, in accordance with the standards of the Public Company Accounting Oversight Board (United States) (PCAOB), the Company’s internal control over financial reporting as of December 31, 2020,2023, based on criteria established in Internal Control-Integrated Framework issued by the Committee of Sponsoring Organizations of the Treadway Commission (2013 framework), and our report dated February 22, 202116, 2024 expressed an unqualified opinion thereon.
Basis for Opinion
These financial statements are the responsibility of the Company’s management. Our responsibility is to express an opinion on the Company’s financial statements based on our audits. We are a public accounting firm registered with the PCAOB and are required to be independent with respect to the Company in accordance with the U.S. federal securities laws and the applicable rules and regulations of the Securities and Exchange Commission and the PCAOB.
We conducted our audits in accordance with the standards of the PCAOB. Those standards require that we plan and perform the audit to obtain reasonable assurance about whether the financial statements are free of material misstatement, whether due to error or fraud. Our audits included performing procedures to assess the risks of material misstatement of the financial statements, whether due to error or fraud, and performing procedures that respond to those risks. Such procedures included examining, on a test basis, evidence regarding the amounts and disclosures in the financial statements. Our audits also included evaluating the accounting principles used and significant estimates made by management, as well as evaluating the overall presentation of the financial statements. We believe that our audits provide a reasonable basis for our opinion.
Critical Audit MattersMatter
The critical audit mattersmatter communicated below are mattersis a matter arising from the current period audit of the financial statements that werewas communicated or required to be communicated to the audit committee and that: (1) relaterelates to accounts or disclosures that are material to the financial statements and (2) involved our especially challenging, subjective or complex judgments. The communication of the critical audit mattersmatter does not alter in any way our opinion on the consolidated financial statements, taken as a whole, and we are not, by communicating the critical audit mattersmatter below, providing a separate opinionsopinion on the critical audit mattersmatter or on the accounts or disclosures to which they relate.it relates.
Impairment of property, plant and equipment
| | | | | |
Description of the Matter
| As of December 31, 2020,2023, the Company’s property, plant and equipment balance was $892$608 million. As discussed in Note 98 to the consolidated financial statements, during 20202023 the Company recordedestimated the fair value of property, plant and equipment impairment charges at certain locations within itsin Europe North America and Asia Pacific segments due to the deterioration of their financial results.recent operating performance. The Company evaluated its property, plant and equipment in these locations for recoverability and concluded that certain machinery and equipment assets were impaired. The Companyimpaired at one location and recognized a $13$2.4 million impairment charge, which is the amount by which the carrying value exceeded the estimated fair value of these assets. The carrying value of the real property was below the estimated fair value for each of these locations.
Auditing the Company’s impairment measurement involved a high degree of judgment as estimates underlying the determination of fair value of the long-lived assets were based on assumptions affected by current market and economic conditions. The Company determined fair value of machinery and equipment using the estimated orderly liquidation value orand fair value of real property using the estimated value-in-exchange cost method, which were deemed the highest and best use of the assets.value. |
How We Addressed the Matter in Our Audit
| We obtained an understanding, evaluated the design and tested the operating effectiveness of controls over the Company’s process to measure impairments of property, plant and equipment. Our audit procedures included among others, testing controls over the Company’s review of the significant assumptions and methodologies used in the calculation of the fair value of the related assets.
Our testing of the Company’s impairment of property, plant and equipment included, among other procedures, evaluating the assumptions used to estimate the fair value of the property, plant and equipment. We reviewed the valuation methodology to assess whether the methodology is widely recognized and appropriate for use in the valuation of the property, plant and equipment, tested significant assumptions and the data used in the valuation, and recalculated the valuation estimate based on the applicable inputs. We also involved our valuation specialists to assist in our assessment of the valuation approach and assumptions used to estimate the fair value.
|
Income Taxes - Realizability of Deferred Tax Assets
| | | | | |
Description of the Matter
| As described in Note 17, as of December 31, 2020, the Company had consolidated deferred tax assets of $129 million (net of valuation allowances of $234 million). Valuation allowances are established when management estimates that it is more likely than not the tax benefit associated with the deferred tax asset will not be realized in future tax periods. In making such determination, the Company considers all available evidence, both positive and negative, regarding the realization of the deferred tax assets and the assessment of the likelihood of sufficient future taxable income. Sources of taxable income include taxable income in prior carryback year(s) if permitted under the tax law, future reversals of existing deferred tax assets and liabilities, tax planning strategies that are prudent and feasible, and projections of future taxable income (exclusive of the reversals of existing deferred tax assets and liabilities).
Auditing management’s assessment of recoverability of deferred tax assets of $63 million for the U.S. federal jurisdiction involved complex auditor judgment in determining whether the reversal of temporary differences and the Company’s estimate of future taxable income that may be affected by future market and economic conditions are sufficient to support the realization of the existing deferred tax assets before expiration, if applicable. |
How We Addressed the Matter in Our Audit
| We obtained an understanding, evaluated the design, and tested the operating effectiveness of controls relating to the realizability of deferred tax assets. This included controls over management’s projections of future taxable income and the future reversal of existing taxable temporary differences related to the U.S federal jurisdiction.
To test the realizability of the Company’s deferred tax assets for the U.S. federal jurisdiction, our audit procedures included evaluating the time period over which temporary differences are expected to reverse, evaluating the assumptions used by the Company to develop projections of future taxable income, and testing the calculations of existing temporary book-tax differences. We evaluated the assumptions used by the Company to develop projections of future taxable income for the U.S. federal jurisdiction and tested the completeness and accuracy of the underlying data used in its projections. We compared the projections of future taxable income for the U.S. federal jurisdiction with the actual results of prior periods and considered external data sources and historical trends, to the extent applicable. We also reconciled the projections of future income with other forecasted financial information prepared by the Company. Professionals with specialized skill and knowledge were used to assist in the evaluation of the realizability of the Company’s deferred tax assets for the U.S. federal jurisdiction, including consideration of applicable tax statutes and related interpretations and precedents.
|
/s/ Ernst & Young LLP
We have served as the Company’s auditor since 2005.
Detroit, Michigan
February 22, 202116, 2024
Report of Independent Registered Public Accounting Firm
To the ShareholdersStockholders and the Board of Directors of Cooper-Standard Holdings Inc.
Opinion on Internal Control overOver Financial Reporting
We have audited Cooper-Standard Holdings Inc.’s internal control over financial reporting as of December 31, 2020,2023, based on criteria established in Internal Control-IntegratedControl—Integrated Framework issued by the Committee of Sponsoring Organizations of the Treadway Commission (2013 framework) (the COSO criteria). In our opinion, Cooper-Standard Holdings Inc. (the Company) maintained, in all material respects, effective internal control over financial reporting as of December 31, 2020,2023, based on the COSO criteria.
We also have audited, in accordance with the standards of the Public Company Accounting Oversight Board (United States) (PCAOB), the consolidated balance sheets of the Company as of December 31, 20202023 and 2019,2022, the related consolidated statements of operations, comprehensive income (loss), changes in equity and cash flows for each of the three years in the period ended December 31, 2020,2023, and the related notes and financial statement schedule listed in the Index at Item 15(a)2 and our report dated February 22, 202116, 2024 expressed an unqualified opinion thereon.
Basis for Opinion
The Company’s management is responsible for maintaining effective internal control over financial reporting and for its assessment of the effectiveness of internal control over financial reporting included in the accompanying Management’s Report on Internal Control over Financial Reporting. Our responsibility is to express an opinion on the Company’s internal control over financial reporting based on our audit. We are a public accounting firm registered with the PCAOB and are required to be independent with respect to the Company in accordance with the U.S. federal securities laws and the applicable rules and regulations of the Securities and Exchange Commission and the PCAOB.
We conducted our audit in accordance with the standards of the PCAOB. Those standards require that we plan and perform the audit to obtain reasonable assurance about whether effective internal control over financial reporting was maintained in all material respects.
Our audit included obtaining an understanding of internal control over financial reporting, assessing the risk that a material weakness exists, testing and evaluating the design and operating effectiveness of internal control based on the assessed risk, and performing such other procedures as we considered necessary in the circumstances. We believe that our audit provides a reasonable basis for our opinion.
Definition and Limitations of Internal Control Over Financial Reporting
A company’s internal control over financial reporting is a process designed to provide reasonable assurance regarding the reliability of financial reporting and the preparation of financial statements for external purposes in accordance with generally accepted accounting principles. A company’s internal control over financial reporting includes those policies and procedures that (1) pertain to the maintenance of records that, in reasonable detail, accurately and fairly reflect the transactions and dispositions of the assets of the company; (2) provide reasonable assurance that transactions are recorded as necessary to permit preparation of financial statements in accordance with generally accepted accounting principles, and that receipts and expenditures of the company are being made only in accordance with authorizations of management and directors of the company; and (3) provide reasonable assurance regarding prevention or timely detection of unauthorized acquisition, use, or disposition of the company’s assets that could have a material effect on the financial statements.
Because of its inherent limitations, internal control over financial reporting may not prevent or detect misstatements. Also, projections of any evaluation of effectiveness to future periods are subject to the risk that controls may become inadequate because of changes in conditions, or that the degree of compliance with the policies or procedures may deteriorate.
/s/ Ernst & Young LLP
Detroit, Michigan
February 22, 202116, 2024
COOPER-STANDARD HOLDINGS INC.
CONSOLIDATED STATEMENTS OF OPERATIONS
(Dollar amounts in thousands except per share amounts)
| | | | | | | | | | | | | | | | | |
| | Year Ended December 31, |
| | 2020 | | 2019 | | 2018 |
| Sales | $ | 2,375,439 | | | $ | 3,108,400 | | | $ | 3,624,042 | |
| Cost of products sold | 2,227,892 | | | 2,749,278 | | | 3,075,737 | |
| Gross profit | 147,547 | | | 359,122 | | | 548,305 | |
| Selling, administration & engineering expenses | 263,611 | | | 302,496 | | | 314,805 | |
| Gain on sale of business, net | (2,834) | | | (191,571) | | | 0 | |
| Gain on sale of land | 0 | | | 0 | | | (10,377) | |
| Amortization of intangibles | 11,611 | | | 17,966 | | | 14,844 | |
| Impairment of assets held for sale | 86,470 | | | 0 | | | 0 | |
| Goodwill impairment charges | 0 | | | 0 | | | 45,281 | |
| Other impairment charges | 17,893 | | | 23,139 | | | 43,706 | |
| Restructuring charges | 39,482 | | | 51,102 | | | 29,722 | |
| Operating (loss) profit | (268,686) | | | 155,990 | | | 110,324 | |
| Interest expense, net of interest income | (59,167) | | | (44,113) | | | (41,004) | |
| Equity in earnings of affiliates | 396 | | | 6,504 | | | 6,718 | |
| Loss on refinancing and extinguishment of debt | 0 | | | 0 | | | (770) | |
| Pension settlement charges | (184) | | | (15,819) | | | (775) | |
| Other expense, net | (2,580) | | | (4,260) | | | (4,838) | |
| (Loss) income before income taxes | (330,221) | | | 98,302 | | | 69,655 | |
| Income tax (benefit) expense | (60,847) | | | 36,089 | | | (29,400) | |
| Net (loss) income | (269,374) | | | 62,213 | | | 99,055 | |
| Net loss attributable to noncontrolling interests | 1,769 | | | 5,316 | | | 4,546 | |
| Net (loss) income attributable to Cooper-Standard Holdings Inc. | $ | (267,605) | | | $ | 67,529 | | | $ | 103,601 | |
| | | | | |
| (Loss) earnings per share: | | | | | |
| Basic | $ | (15.82) | | | $ | 3.94 | | | $ | 5.79 | |
| Diluted | $ | (15.82) | | | $ | 3.92 | | | $ | 5.66 | |
| | | | | | | | | | | | | | | | | |
| | Year Ended December 31, |
| | 2023 | | 2022 | | 2021 |
| Sales | $ | 2,815,879 | | | $ | 2,525,391 | | | $ | 2,330,191 | |
| Cost of products sold | 2,525,103 | | | 2,395,600 | | | 2,242,963 | |
| Gross profit | 290,776 | | | 129,791 | | | 87,228 | |
| Selling, administration & engineering expenses | 215,741 | | | 199,455 | | | 227,110 | |
| Gain on sale of businesses, net | (586) | | | — | | | (696) | |
| Gain on sale of fixed assets, net | — | | | (33,391) | | | — | |
| Amortization of intangibles | 6,804 | | | 6,715 | | | 7,347 | |
| Restructuring charges | 18,018 | | | 18,304 | | | 36,950 | |
| Impairment charges | 4,768 | | | 43,710 | | | 25,609 | |
| Operating profit (loss) | 46,031 | | | (105,002) | | | (209,092) | |
| Interest expense, net of interest income | (130,077) | | | (78,514) | | | (72,511) | |
| Equity in earnings (losses) of affiliates | 3,281 | | | (8,817) | | | (1,728) | |
| Loss on refinancing and extinguishment of debt | (81,885) | | | — | | | — | |
| Pension settlement and curtailment charges | (16,035) | | | (2,682) | | | (1,279) | |
| Other expense, net | (15,698) | | | (5,485) | | | (4,842) | |
| Loss before income taxes | (194,383) | | | (200,500) | | | (289,452) | |
| Income tax expense | 8,933 | | | 17,291 | | | 39,392 | |
| Net loss | (203,316) | | | (217,791) | | | (328,844) | |
| Net loss attributable to noncontrolling interests | 1,331 | | | 2,407 | | | 6,009 | |
| Net loss attributable to Cooper-Standard Holdings Inc. | $ | (201,985) | | | $ | (215,384) | | | $ | (322,835) | |
| | | | | |
| Loss per share: | | | | | |
| Basic | $ | (11.64) | | | $ | (12.53) | | | $ | (18.94) | |
| Diluted | $ | (11.64) | | | $ | (12.53) | | | $ | (18.94) | |
The accompanying notes are an integral part of these consolidated financial statements.
COOPER-STANDARD HOLDINGS INC.
CONSOLIDATED STATEMENTS OF COMPREHENSIVE INCOME (LOSS)
(Dollar amounts in thousands)
| | | | | | | | | | | | | | | | | |
| | Year Ended December 31, |
| | 2020 | | 2019 | | 2018 |
| Net (loss) income | $ | (269,374) | | | $ | 62,213 | | | $ | 99,055 | |
| Other comprehensive income (loss): | | | | | |
| Currency translation adjustment | 18,429 | | | (13,308) | | | (46,902) | |
| Benefit plan liabilities adjustment, net of tax | (5,919) | | | 4,215 | | | 4,943 | |
| Fair value change of derivatives, net of tax | 410 | | | 810 | | | 1,009 | |
| Other comprehensive income (loss), net of tax | 12,920 | | | (8,283) | | | (40,950) | |
| Comprehensive (loss) income | (256,454) | | | 53,930 | | | 58,105 | |
| Comprehensive loss attributable to noncontrolling interests | 694 | | | 5,795 | | | 6,172 | |
| Comprehensive (loss) income attributable to Cooper-Standard Holdings Inc. | $ | (255,760) | | | $ | 59,725 | | | $ | 64,277 | |
| | | | | | | | | | | | | | | | | |
| | Year Ended December 31, |
| | 2023 | | 2022 | | 2021 |
| Net loss | $ | (203,316) | | | $ | (217,791) | | | $ | (328,844) | |
| Other comprehensive (loss) income: | | | | | |
| Currency translation adjustment | (214) | | | (18,856) | | | (2,290) | |
| Benefit plan liabilities adjustment, net of tax | 16,102 | | | 5,052 | | | 40,776 | |
| Fair value change of derivatives, net of tax | (8,163) | | | 9,433 | | | (1,892) | |
| Other comprehensive income (loss), net of tax | 7,725 | | | (4,371) | | | 36,594 | |
| Comprehensive loss | (195,591) | | | (222,162) | | | (292,250) | |
| Comprehensive loss attributable to noncontrolling interests | 1,913 | | | 1,991 | | | 6,127 | |
| Comprehensive loss attributable to Cooper-Standard Holdings Inc. | $ | (193,678) | | | $ | (220,171) | | | $ | (286,123) | |
The accompanying notes are an integral part of these consolidated financial statements.
COOPER-STANDARD HOLDINGS INC.
CONSOLIDATED BALANCE SHEETS
(Dollar amounts in thousands except share amounts)
| | | | | | | | | | | |
| | December 31, |
| | 2020 | | 2019 |
| Assets | | | |
| Current assets: | | | |
| Cash and cash equivalents | $ | 438,438 | | | $ | 359,536 | |
| Accounts receivable, net | 379,564 | | | 423,155 | |
| Tooling receivable, net | 82,150 | | | 148,175 | |
| Inventories | 143,742 | | | 143,439 | |
| Prepaid expenses | 29,748 | | | 34,452 | |
| Income tax receivable and refundable credits | 85,977 | | | 32,763 | |
| Other current assets | 100,110 | | | 60,750 | |
| | | |
| Total current assets | 1,259,729 | | | 1,202,270 | |
| Property, plant and equipment, net | 892,309 | | | 988,277 | |
| Operating lease right-of-use assets, net | 109,795 | | | 83,376 | |
| Goodwill | 142,250 | | | 142,187 | |
| Intangible assets, net | 67,679 | | | 84,369 | |
| Deferred tax assets | 66,111 | | | 56,662 | |
| Other assets | 74,071 | | | 78,441 | |
| Total assets | $ | 2,611,944 | | | $ | 2,635,582 | |
| | | |
| Liabilities and Equity | | | |
| Current liabilities: | | | |
| Debt payable within one year | $ | 40,731 | | | $ | 61,449 | |
| Accounts payable | 385,284 | | | 426,055 | |
| Payroll liabilities | 112,727 | | | 88,486 | |
| Accrued liabilities | 110,827 | | | 119,841 | |
| Current operating lease liabilities | 21,711 | | | 24,094 | |
| | | |
| Total current liabilities | 671,280 | | | 719,925 | |
| Long-term debt | 982,760 | | | 746,179 | |
| Pension benefits | 152,230 | | | 140,010 | |
| Postretirement benefits other than pensions | 49,613 | | | 48,313 | |
| Long-term operating lease liabilities | 90,517 | | | 60,234 | |
| Deferred tax liabilities | 8,638 | | | 10,785 | |
| Other liabilities | 32,795 | | | 34,154 | |
| Total liabilities | 1,987,833 | | | 1,759,600 | |
| 7% Cumulative participating convertible preferred stock, $0.001 par value, 10,000,000 shares authorized; no shares issued and outstanding | 0 | | | 0 | |
| Equity: | | | |
| Common stock, $0.001 par value, 190,000,000 shares authorized; 18,962,894 shares issued and 16,897,085 outstanding as of December 31, 2020 and 18,908,566 shares issued and 16,842,757 outstanding as of December 31, 2019 | 17 | | | 17 | |
| Additional paid-in capital | 498,719 | | | 490,451 | |
| Retained earnings | 350,270 | | | 619,448 | |
| Accumulated other comprehensive loss | (241,896) | | | (253,741) | |
| Total Cooper-Standard Holdings Inc. equity | 607,110 | | | 856,175 | |
| Noncontrolling interests | 17,001 | | | 19,807 | |
| Total equity | 624,111 | | | 875,982 | |
| Total liabilities and equity | $ | 2,611,944 | | | $ | 2,635,582 | |
| | | | | | | | | | | |
| | December 31, |
| | 2023 | | 2022 |
| Assets | | | |
| Current assets: | | | |
| Cash and cash equivalents | $ | 154,801 | | | $ | 186,875 | |
| Accounts receivable, net | 380,562 | | | 358,700 | |
| Tooling receivable, net | 80,225 | | | 95,965 | |
| Inventories | 146,846 | | | 157,756 | |
| Prepaid expenses | 28,328 | | | 31,170 | |
| Income tax receivable and refundable credits | 11,225 | | | 13,668 | |
| Value added tax receivable | 69,684 | | | 44,402 | |
| Other current assets | 28,915 | | | 57,113 | |
| | | |
| Total current assets | 900,586 | | | 945,649 | |
| Property, plant and equipment, net | 608,431 | | | 642,860 | |
| Operating lease right-of-use assets, net | 91,126 | | | 94,571 | |
| Goodwill | 140,814 | | | 142,023 | |
| Intangible assets, net | 40,568 | | | 47,641 | |
| Deferred tax assets | 23,792 | | | 19,852 | |
| Other assets | 66,982 | | | 70,933 | |
| Total assets | $ | 1,872,299 | | | $ | 1,963,529 | |
| | | |
| Liabilities and Equity | | | |
| Current liabilities: | | | |
| Debt payable within one year | $ | 50,712 | | | $ | 54,130 | |
| Accounts payable | 334,578 | | | 338,210 | |
| Payroll liabilities | 132,422 | | | 99,029 | |
| Accrued liabilities | 116,954 | | | 119,463 | |
| Current operating lease liabilities | 18,577 | | | 20,786 | |
| | | |
| Total current liabilities | 653,243 | | | 631,618 | |
| Long-term debt | 1,044,736 | | | 982,054 | |
| Pension benefits | 100,578 | | | 98,481 | |
| Postretirement benefits other than pensions | 28,940 | | | 31,014 | |
| Long-term operating lease liabilities | 76,482 | | | 77,617 | |
| Deferred tax liabilities | 5,208 | | | 7,052 | |
| Other liabilities | 52,845 | | | 34,501 | |
| Total liabilities | 1,962,032 | | | 1,862,337 | |
| | | |
| Preferred stock, $0.001 par value, 10,000,000 shares authorized; no shares issued and outstanding | — | | | — | |
| Equity: | | | |
| Common stock, $0.001 par value, 190,000,000 shares authorized; 19,263,288 shares issued and 17,197,479 outstanding as of December 31, 2023, and 19,173,838 shares issued and 17,108,029 outstanding as of December 31, 2022 | 17 | | | 17 | |
| Additional paid-in capital | 512,164 | | | 507,498 | |
| Retained deficit | (391,816) | | | (189,831) | |
| Accumulated other comprehensive loss | (201,665) | | | (209,971) | |
| Total Cooper-Standard Holdings Inc. equity | (81,300) | | | 107,713 | |
| Noncontrolling interests | (8,433) | | | (6,521) | |
| Total equity | (89,733) | | | 101,192 | |
| Total liabilities and equity | $ | 1,872,299 | | | $ | 1,963,529 | |
The accompanying notes are an integral part of these consolidated financial statements.
COOPER-STANDARD HOLDINGS INC.
CONSOLIDATED STATEMENTS OF CHANGES IN EQUITY
(Dollar amounts in thousands except share amounts)
| | | | | | | | | | | | | | | | | | | | | | | | | | | |
| | | Total Equity |
| | | Common Shares | Common Stock | Additional Paid-In Capital | Retained Earnings | Accumulated Other Comprehensive Loss | Cooper-Standard Holdings Inc. Equity | Noncontrolling Interest | Total Equity |
| Balance as of December 31, 2017 | | 17,914,599 | | $ | 18 | | $ | 512,815 | | $ | 508,722 | | $ | (197,974) | | $ | 823,581 | | $ | 28,520 | | $ | 852,101 | |
| Cumulative effect of change in accounting principle | | — | | — | | — | | 8,639 | | (8,639) | | — | | — | | — | |
| Repurchase of common stock | | (549,019) | | (1) | | (14,259) | | (46,306) | | — | | (60,566) | | — | | (60,566) | |
| | | | | | | | | |
| Share-based compensation, net | | 189,157 | | 0 | | 5,637 | | (5,441) | | — | | 196 | | — | | 196 | |
| Purchase of noncontrolling interest | | — | | — | | (2,682) | | — | | — | | (2,682) | | 312 | | (2,370) | |
| Contribution from noncontrolling interests | | — | | — | | — | | — | | — | | — | | 1,377 | | 1,377 | |
| Acquisition | | — | | — | | — | | — | | — | | — | | 6,246 | | 6,246 | |
| Dividends declared to noncontrolling interests | | — | | — | | — | | — | | — | | — | | (3,614) | | (3,614) | |
| Net income (loss) for 2018 | | — | | — | | — | | 103,601 | | — | | 103,601 | | (4,546) | | 99,055 | |
| Other comprehensive loss | | — | | — | | — | | — | | (39,324) | | (39,324) | | (1,626) | | (40,950) | |
| Balance as of December 31, 2018 | | 17,554,737 | | 17 | | 501,511 | | 569,215 | | (245,937) | | 824,806 | | 26,669 | | 851,475 | |
| Cumulative effect of change in accounting principle | | — | | — | | — | | (2,607) | | — | | (2,607) | | — | | (2,607) | |
| Repurchase of common stock | | (817,954) | | 0 | | (21,459) | | (14,478) | | — | | (35,937) | | — | | (35,937) | |
| Share-based compensation, net | | 105,974 | | — | | 9,101 | | (211) | | — | | 8,890 | | — | | 8,890 | |
| Purchase of noncontrolling interest | | — | | — | | 1,298 | | — | | — | | 1,298 | | (6,057) | | (4,759) | |
| Contribution from noncontrolling interests | | — | | — | | — | | — | | — | | — | | 6,048 | | 6,048 | |
| | | | | | | | | |
| Dividends declared to noncontrolling interests | | — | | — | | — | | — | | — | | — | | (1,058) | | (1,058) | |
| Net income (loss) for 2019 | | — | | — | | — | | 67,529 | | — | | 67,529 | | (5,316) | | 62,213 | |
| Other comprehensive loss | | — | | — | | — | | — | | (7,804) | | (7,804) | | (479) | | (8,283) | |
| Balance as of December 31, 2019 | | 16,842,757 | | 17 | | 490,451 | | 619,448 | | (253,741) | | 856,175 | | 19,807 | | 875,982 | |
| Cumulative effect of change in accounting principle | | — | | — | | — | | (1,573) | | — | | (1,573) | | — | | (1,573) | |
| | | | | | | | | |
| Share-based compensation, net | | 54,328 | | 0 | | 8,268 | | 0 | | — | | 8,268 | | — | | 8,268 | |
| Deconsolidation of noncontrolling interest | | — | | — | | 0 | | — | | — | | 0 | | (2,112) | | (2,112) | |
| | | | | | | | | |
| | | | | | | | | |
| Net loss for 2020 | | — | | — | | — | | (267,605) | | — | | (267,605) | | (1,769) | | (269,374) | |
| Other comprehensive income | | — | | — | | — | | — | | 11,845 | | 11,845 | | 1,075 | | 12,920 | |
| Balance as of December 31, 2020 | | 16,897,085 | | $ | 17 | | $ | 498,719 | | $ | 350,270 | | $ | (241,896) | | $ | 607,110 | | $ | 17,001 | | $ | 624,111 | |
| | | | | | | | | | | | | | | | | | | | | | | | | | | |
| | | Total Equity |
| | | Common Shares | Common Stock | Additional Paid-In Capital | Retained Earnings (Deficit) | Accumulated Other Comprehensive Loss | Cooper-Standard Holdings Inc. Equity | Noncontrolling Interests | Total Equity |
| Balance as of December 31, 2020 | | 16,897,085 | | $ | 17 | | $ | 498,719 | | $ | 350,270 | | $ | (241,896) | | $ | 607,110 | | $ | 17,001 | | $ | 624,111 | |
| | | | | | | | | |
| | | | | | | | | |
| | | | | | | | | |
| Share-based compensation, net | | 94,894 | | — | | 5,778 | | — | | — | | 5,778 | | — | | 5,778 | |
| Purchase of noncontrolling interest | | — | | — | | — | | (1,882) | | — | | (1,882) | | (4,397) | | (6,279) | |
| | | | | | | | | |
| | | | | | | | | |
| | | | | | | | | |
| Net loss for 2021 | | — | | — | | — | | (322,835) | | — | | (322,835) | | (6,009) | | (328,844) | |
| Other comprehensive income (loss) | | — | | — | | — | | — | | 36,712 | | 36,712 | | (118) | | 36,594 | |
| Balance as of December 31, 2021 | | 16,991,979 | | $ | 17 | | $ | 504,497 | | $ | 25,553 | | $ | (205,184) | | $ | 324,883 | | $ | 6,477 | | $ | 331,360 | |
| | | | | | | | | |
| | | | | | | | | |
| Share-based compensation, net | | 116,050 | | — | | 3,001 | | — | | — | | 3,001 | | — | | 3,001 | |
| Deconsolidation of noncontrolling interest | | — | | — | | — | | — | | — | | — | | (11,007) | | (11,007) | |
| | | | | | | | | |
| | | | | | | | | |
| | | | | | | | | |
| Net loss for 2022 | | — | | — | | — | | (215,384) | | — | | (215,384) | | (2,407) | | (217,791) | |
| Other comprehensive (loss) income | | — | | — | | — | | — | | (4,787) | | (4,787) | | 416 | | (4,371) | |
| Balance as of December 31, 2022 | | 17,108,029 | | $ | 17 | | $ | 507,498 | | $ | (189,831) | | $ | (209,971) | | $ | 107,713 | | $ | (6,521) | | $ | 101,192 | |
| | | | | | | | | |
| | | | | | | | | |
| Share-based compensation, net | | 89,450 | | — | | 4,666 | | — | | — | | 4,666 | | — | | 4,666 | |
| | | | | | | | | |
| | | | | | | | | |
| | | | | | | | | |
| Net loss for 2023 | | — | | — | | — | | (201,985) | | — | | (201,985) | | (1,331) | | (203,316) | |
| Other comprehensive income (loss) | | — | | — | | — | | — | | 8,306 | | 8,306 | | (581) | | 7,725 | |
| Balance as of December 31, 2023 | | 17,197,479 | | $ | 17 | | $ | 512,164 | | $ | (391,816) | | $ | (201,665) | | $ | (81,300) | | $ | (8,433) | | $ | (89,733) | |
The accompanying notes are an integral part of these consolidated financial statements.
COOPER-STANDARD HOLDINGS INC.
CONSOLIDATED STATEMENTS OF CASH FLOWS
(Dollar amounts in thousands)
| | | | | | | | | | | | | | | | | |
| | Year Ended December 31, |
| | 2020 | | 2019 | | 2018 |
| Operating Activities: | | | | | |
| Net (loss) income | $ | (269,374) | | | $ | 62,213 | | | $ | 99,055 | |
| Adjustments to reconcile net income (loss) to net cash (used in) provided by operating activities: | | | | | |
| Depreciation | 142,618 | | | 133,987 | | | 131,854 | |
| Amortization of intangibles | 11,611 | | | 17,966 | | | 14,844 | |
| Gain on sale of business, net | (2,834) | | | (191,571) | | | 0 | |
| Gain on sale of land | 0 | | | 0 | | | (10,377) | |
| Impairment of assets held for sale | 86,470 | | | 0 | | | 0 | |
| Goodwill and other impairment charges | 17,893 | | | 23,139 | | | 88,987 | |
| Pension settlement charges | 184 | | | 15,819 | | | 775 | |
| Share-based compensation expense | 10,435 | | | 11,865 | | | 8,520 | |
| Equity in earnings, net of dividends related to earnings | 6,847 | | | (1,587) | | | (1,856) | |
| Loss on refinancing and extinguishment of debt | 0 | | | 0 | | | 770 | |
| Deferred income taxes | (8,722) | | | 15,874 | | | (38,931) | |
| Other | 5,232 | | | 5,230 | | | 2,652 | |
| Changes in operating assets and liabilities: | | | | | |
| Accounts and tooling receivable | 94,125 | | | (26,534) | | | 17,916 | |
| Inventories | (15,236) | | | 29,430 | | | 1,410 | |
| Prepaid expenses | 2,099 | | | (150) | | | (4,647) | |
| Income tax receivable and refundable credits | (52,374) | | | (3,620) | | | 8,469 | |
| Accounts payable | (18,370) | | | (14,643) | | | (32,502) | |
| Payroll and accrued liabilities | 40,413 | | | (1,258) | | | (61,800) | |
| Other | (66,951) | | | 21,537 | | | (75,751) | |
| Net cash (used in) provided by operating activities | (15,934) | | | 97,697 | | | 149,388 | |
| Investing activities: | | | | | |
| Capital expenditures | (91,794) | | | (164,466) | | | (218,071) | |
| Proceeds from sale of business, net of cash divested | (17,006) | | | 243,362 | | | 0 | |
| Acquisition of businesses, net of cash acquired | 0 | | | (452) | | | (171,653) | |
| Proceeds from sale of fixed assets and other | 1,920 | | | 5,586 | | | 6,733 | |
| Net cash (used in) provided by investing activities | (106,880) | | | 84,030 | | | (382,991) | |
| Financing activities: | | | | | |
| Proceeds from issuance of long-term debt, net of discount | 245,000 | | | 0 | | | 0 | |
| Principal payments on long-term debt | (6,192) | | | (4,494) | | | (3,437) | |
| (Decrease) increase in short term debt, net | (22,372) | | | (40,406) | | | 65,198 | |
| Debt issuance costs | (7,249) | | | 0 | | | (667) | |
| Purchase of noncontrolling interest | 0 | | | (4,797) | | | (2,450) | |
| Repurchase of common stock | 0 | | | (36,550) | | | (59,955) | |
| | | | | |
| Taxes withheld and paid on employees' share-based payment awards | (544) | | | (2,787) | | | (11,618) | |
| Contribution from noncontrolling interests and other | (928) | | | 5,042 | | | (1,511) | |
| Net cash provided by (used in) financing activities | 207,715 | | | (83,992) | | | (14,440) | |
| Effects of exchange rate changes on cash, cash equivalents and restricted cash | (3,065) | | | (3,392) | | | (3,019) | |
| Changes in cash, cash equivalents and restricted cash | 81,836 | | | 94,343 | | | (251,062) | |
| Cash, cash equivalents and restricted cash at beginning of period | 361,742 | | | 267,399 | | | 518,461 | |
| Cash, cash equivalents and restricted cash at end of period | $ | 443,578 | | | $ | 361,742 | | | $ | 267,399 | |
| Reconciliation of cash, cash equivalents and restricted cash to the consolidated balance sheet: | | |
| Cash and cash equivalents | $ | 438,438 | | | $ | 359,536 | | | $ | 264,980 | |
| Restricted cash included in other current assets | 4,089 | | | 12 | | | 18 | |
| Restricted cash included in other assets | 1,051 | | | 2,194 | | | 2,401 | |
| Total cash, cash equivalents and restricted cash shown in the statement of cash flows | $ | 443,578 | | | $ | 361,742 | | | $ | 267,399 | |
| Supplemental Disclosure: | | | | | |
| Cash paid for interest | $ | 55,685 | | | $ | 47,580 | | | $ | 44,877 | |
| Cash paid for income taxes, net of refunds | 1,679 | | | 23,599 | | | 32,299 | |
| | | | | | | | | | | | | | | | | |
| | Year Ended December 31, |
| | 2023 | | 2022 | | 2021 |
| Operating activities: | | | | | |
| Net loss | $ | (203,316) | | | $ | (217,791) | | | $ | (328,844) | |
| Adjustments to reconcile net loss to net cash provided by (used in) operating activities: | | | | | |
| Depreciation | 103,127 | | | 115,761 | | | 131,661 | |
| Amortization of intangibles | 6,804 | | | 6,715 | | | 7,347 | |
| Gain on sale of businesses, net | (586) | | | — | | | (696) | |
| Gain on sale of fixed assets, net | — | | | (33,391) | | | — | |
| Impairment charges | 4,768 | | | 43,710 | | | 25,609 | |
| Pension settlement and curtailment charges | 16,035 | | | 2,682 | | | 1,279 | |
| Share-based compensation expense | 7,718 | | | 3,259 | | | 5,574 | |
| Equity in (earnings) losses of affiliates, net of dividends related to earnings | (982) | | | 12,450 | | | 4,872 | |
| Loss on refinancing and extinguishment of debt | 81,885 | | | — | | | — | |
| Payment-in-kind interest | 58,808 | | | — | | | — | |
| Deferred income taxes | (5,813) | | | 5,653 | | | 35,756 | |
| Other | 4,838 | | | (10,887) | | | 3,222 | |
| Changes in operating assets and liabilities: | | | | | |
| Accounts and tooling receivable | (12,333) | | | (65,712) | | | 52,677 | |
| Inventories | 6,412 | | | (2,221) | | | (18,527) | |
| Prepaid expenses | 2,924 | | | (5,658) | | | 2,951 | |
| Income tax receivable and refundable credits | 2,603 | | | 68,251 | | | 2,221 | |
| Accounts payable | 6,743 | | | 20,591 | | | (25,501) | |
| Payroll and accrued liabilities | 16,924 | | | 46,177 | | | (45,392) | |
| Other | 20,718 | | | (25,739) | | | 30,281 | |
| Net cash provided by (used in) operating activities | 117,277 | | | (36,150) | | | (115,510) | |
| Investing activities: | | | | | |
| Capital expenditures | (80,743) | | | (71,150) | | | (96,107) | |
| Proceeds from sale of businesses, net of cash divested | 15,351 | | | — | | | — | |
| | | | | |
| Proceeds from sale of fixed assets | — | | | 53,288 | | | 4,615 | |
| Other | 424 | | | (30) | | | 230 | |
| Net cash used in investing activities | (64,968) | | | (17,892) | | | (91,262) | |
| Financing activities: | | | | | |
| Proceeds from issuance of long-term debt, net of debt issuance costs | 924,299 | | | — | | | — | |
| Repayment and refinancing of long-term debt | (927,046) | | | — | | | — | |
| Principal payments on long-term debt | (2,127) | | | (4,178) | | | (5,533) | |
| (Decrease) increase in short-term debt, net | (1,234) | | | 4,093 | | | 14,935 | |
| Debt issuance costs and other fees | (74,376) | | | (4,229) | | | — | |
| Purchase of noncontrolling interest | — | | | — | | | (6,279) | |
| | | | | |
| | | | | |
| Taxes withheld and paid on employees' share-based payment awards | (214) | | | (607) | | | (799) | |
| Contribution from noncontrolling interests and other | (439) | | | 655 | | | 885 | |
| Net cash (used in) provided by financing activities | (81,137) | | | (4,266) | | | 3,209 | |
| Effects of exchange rate changes on cash, cash equivalents and restricted cash | (918) | | | (13) | | | 11,113 | |
| Changes in cash, cash equivalents and restricted cash | (29,746) | | | (58,321) | | | (192,450) | |
| Cash, cash equivalents and restricted cash at beginning of period | 192,807 | | | 251,128 | | | 443,578 | |
| Cash, cash equivalents and restricted cash at end of period | $ | 163,061 | | | $ | 192,807 | | | $ | 251,128 | |
| Reconciliation of cash, cash equivalents and restricted cash to the consolidated balance sheet: | | |
| Cash and cash equivalents | $ | 154,801 | | | $ | 186,875 | | | $ | 248,010 | |
| Restricted cash included in other current assets | 7,244 | | | 4,650 | | | 961 | |
| Restricted cash included in other assets | 1,016 | | | 1,282 | | | 2,157 | |
| Total cash, cash equivalents and restricted cash shown in the statement of cash flows | $ | 163,061 | | | $ | 192,807 | | | $ | 251,128 | |
| Supplemental disclosure: | | | | | |
| Cash paid for interest | $ | 78,699 | | | $ | 80,163 | | | $ | 73,221 | |
| Cash paid (received) for income taxes, net of refunds | 10,301 | | | (56,393) | | | 6,741 | |
The accompanying notes are an integral part of these consolidated financial statements.
NOTES TO CONSOLIDATED FINANCIAL STATEMENTS
(Dollar amounts in thousands except per share and share amounts)
1. Description of Business
Cooper-Standard Holdings Inc. (together with its consolidated subsidiaries, the “Company” or “Cooper Standard”), through its wholly-owned subsidiary, Cooper-Standard Automotive Inc. (“CSA U.S.”), is a leading manufacturer of sealing and fuel handling systems (consisting of fuel and brake delivery, and fluid transfer systems.systems). The Company’s products are primarily for use in passenger vehicles and light trucks that are manufactured by global automotive original equipment manufacturers (“OEMs”) and replacement markets. The Company conducts substantially all of its activities through its subsidiaries.
Prior to its divestiture on April 1, 2019, the Company also operated an anti-vibration systems (“AVS”) product line. See Note 5. “Divestitures” for additional information.
The Company believes it is the largest global producer of sealing systems, the second largest global producer of the types of fuel and brake delivery products that it manufactures and the third largest global producer of the types of fluid transfer systems.systems that it manufactures. The Company designs and manufactures its products in each major region of the world through a disciplined and sustained approach to engineering and operational excellence. The Company operates in 7278 manufacturing locations and 4950 design, engineering, administrative and logistics locations in 21 countries around the world.
Subsequent Event
In January 2021, one of the Company’s top customers announced restructuring activities in South America, including its intention to cease manufacturing operations in Brazil. As a result, Cooper Standard’s Brazil manufacturing operations and sales attributable to that customer will be significantly impacted. The Company is assessing the impact of this announcement on its 2021 financial results, but does not expect the action to have a material impact on its business, results of operations, financial condition or cash flows.
In January 2021, two of the Company’s top customers, FCA and Groupe PSA, completed a merger. The combined business was renamed Stellantis. The Company does not expect this merger to have a material impact on the business, results of operations, financial condition or cash flows.
2. Basis of Presentation and Summary of Significant Accounting Policies
Basis of Presentation
The consolidated financial statements are prepared in accordance with generally accepted accounting principles in the United States (“U.S. GAAP”). Certain balances in prior periods have been conformed to the current presentation.
Summary of Significant Accounting Policies
Principles of Consolidation – The consolidated financial statements include the accounts of the Company and the wholly-owned and, as applicable, less than wholly-owned subsidiaries controlled by the Company. All material intercompany accounts and transactions have been eliminated. Acquired businesses are included in the consolidated financial statements from the dates of acquisition or when the Company gained control.
The equity method of accounting is followed for investments in which the Company does not have control, but does have the ability to exercise significant influence over operating and financial policies. Generally, this occurs when ownership is between 20% to 50%.
Foreign Currency – The financial statements of foreign subsidiaries are translated to United States (“U.S.”) dollars at the end-of-period exchange rates for assets and liabilities and at a weighted average exchange rate for each period for revenues and expenses. Translation adjustments for those subsidiaries whose local currency is their functional currency are recorded as a component of accumulated other comprehensive income (loss) in stockholders’ equity (“AOCI”). Transaction related gains and losses arising from fluctuations in currency exchange rates on transactions denominated in currencies other than the functional currency are recognized in earnings as incurred, except for those intercompany balances which are designated as long-term.
Cash and Cash Equivalents – The Company considers highly liquid investments with an original maturity of three months or less to be cash equivalents.equivalents, for which the book value approximates fair value.
Accounts Receivable – The Company records trade accounts receivable when revenue is recorded in accordance with its revenue recognition policy and relieves accounts receivable when payments are received from customers. Accounts receivable are written off when it is apparent such amounts are not collectible. Generally, the Company does not require collateral for its accounts receivable, nor is interest charged on accounts receivable balances.
NOTES TO CONSOLIDATED FINANCIAL STATEMENTS (Continued)
(Dollar amounts in thousands except per share and share amounts)
The Company receives bank notes from certain of its customers, which are classified as other current assets in the consolidated balance sheets, for certain amounts of accounts receivable, primarily in China. The Company may elect to hold such bank notes until maturity, exchange them with suppliers to settle liabilities, or sell them to third partythird-party financial institutions in exchange for cash.
Allowance for Credit Losses – An allowance for credit losses is established through charges to the provision for credit losses when it is probable that the outstanding receivable or reimbursable tooling will not be collected. The Company evaluates the adequacy of the allowance for credit losses on a periodic basis, including historical trends in collections and write-offs, management’s judgment of the probability of collecting accounts and management’s evaluation of business risk. This evaluation is inherently subjective, as it requires estimates that are susceptible to revision as more information becomes available. The allowance for credit losses was $7,100$5,944 and $9,149$17,193 as of December 31, 20202023 and 2019,2022, respectively.
Advertising Expense
– Expenses incurred for advertising are generally expensed when incurred. Advertising expense was $425, $711
NOTES TO CONSOLIDATED FINANCIAL STATEMENTS (Continued)
(Dollar amounts in thousands except per share and $1,493 for the years ended December 31, 2020, 2019 and 2018, respectively.share amounts)
Inventories – Inventories are valued at lower of cost or net realizable value. Cost is determined using the first-in, first-out method. Finished goods and work-in-process inventories include material, labor and manufacturing overhead costs. The Company records inventory reserves for inventory in excess of production and/or forecasted requirements and for obsolete inventory.
| | | | December 31, | | December 31, |
| | | 2020 | | 2019 | | 2023 | | 2022 |
| Finished goods | Finished goods | $ | 39,136 | | | $ | 57,070 | |
| Work in process | Work in process | 35,477 | | | 33,753 | |
| Raw materials and supplies | Raw materials and supplies | 69,129 | | | 52,616 | |
| $ | 143,742 | | | $ | 143,439 | |
| $ | |
Derivative Financial Instruments – Derivative financial instruments are utilized by the Company to reduce exposure to foreign currency exchange.exchange fluctuations. The Company has established policies and procedures for risk assessment and the approval, reporting and monitoring of derivative financial instrument activities. On the date the derivative is established, the Company designates the derivative as either a fair value hedge, a cash flow hedge or a net investment hedge in accordance with its established policy. The Company does not enter into derivative financial instruments for trading or speculative purposes.
Income Taxes – Deferred tax assets or liabilities are determined based on differences between financial reporting and tax bases of assets and liabilities and are measured using enacted tax laws and rates. A valuation allowance is provided on deferred tax assets if the Company determines that it is more likely than not that the asset will not be realized.
Long-lived Assets – Property, plant and equipment are recorded at cost and depreciated using primarily the straight-line method over estimated useful lives. Leasehold improvements are amortized over the expected life of the asset or term of the lease, whichever is shorter. Intangibles with finite lives, which include technologycustomer relationships, supply agreements and customer relationships,land use rights, are amortized over estimated useful lives. The Company evaluates the recoverability of long-lived assets when events and circumstances indicate that the assets may be impaired and the undiscounted net cash flows estimated to be generated by those assets are less than their carrying value. If the net carrying value exceeds the fair value, an impairment loss exists and is calculated based on either estimated salvage value, or estimated orderly liquidation value.value or a value-in-exchange approach.
Pre-production Costs Related to Long Term Supply Arrangements – Costs for molds, dies and other tools owned by the Company to produce products under long-term supply arrangements are recorded at cost in property, plant and equipment and amortized over the lesser of three years or the term of the related supply agreement. The amounts capitalized were $5,131$3,897 and $3,994$4,356 as of December 31, 20202023 and 2019,2022, respectively. The Company expenses all pre-production tooling costs related to customer-owned tools for which reimbursement is not contractually guaranteed by the customer. Reimbursable tooling costs are recorded in tooling receivable in the accompanying consolidated balance sheets if considered to be receivable in the next twelve months, and in other assets if considered to be receivable beyond twelve months. Tooling receivable for customer-owned tooling as of December 31, 20202023 and 20192022 was $82,150$80,225 and $148,175,$95,965, respectively. Reimbursable tooling costs included in other assets in the accompanying consolidated balance sheets were $15,219$16,007 and $19,185$17,233 as of December 31, 20202023 and 2019,2022, respectively.
Goodwill – The Company tests goodwill for impairment on an annual basis in the fourth quarter, or more frequently if an event occurs or circumstances indicate the carrying amount may be impaired. Goodwill impairment testing is performed at the reporting unit level. The impairment test involves first qualitatively assessing goodwill for impairment. If the qualitative
NOTES TO CONSOLIDATED FINANCIAL STATEMENTS (Continued)
(Dollar amounts in thousands except per share and share amounts)
assessment is not met, a quantitative assessment is performed by comparing the estimated fair value of each reporting unit to its carrying value. If the carrying value exceeds the fair value, an impairment charge is recorded based on that difference.
The Company’s organizational structure changed on January 1, 2020. See Note 24. “Business Segments” for further detail on this reorganization of our business. The change in organizational structure of the business represented a triggering event to test goodwill for impairment as of January 1, 2020. No impairment was identified as a result of completing the goodwill impairment test. Other than the change in organizational structure event noted above, there were no other indicators of potential impairment during the year ended December 31, 2020.
In the fourth quarter of 2020,2023 and 2022, the Company completed a quantitative goodwill impairment assessment, and after evaluating the results, events and circumstances, the Company concluded that sufficient evidence existed to assert quantitatively that the estimated fair value of the North America and Industrial Specialty Group reporting units remained in excess of their carrying values. In the fourth quarter of 2019, the Company completed a quantitative goodwill impairment assessmentSee Note 9. “Goodwill and Intangible Assets” for its North America reporting unit, and no impairment was identified as a result of completing the goodwill impairment test.additional information.
Business Combinations – The purchase price of an acquired business is allocated to its identifiable assets and liabilities based on estimated fair values. The excess of the purchase price over the amount allocated to the assets and liabilities, if any, is recorded as goodwill. Determining the fair values of assets acquired and liabilities assumed requires management’s judgment, the utilization of independent appraisal firms and often involves the use of significant estimates and assumptions with respect to the timing and amount of future cash flows, market rate assumptions, actuarial assumptions, and appropriate discount rates, among other items.
NOTES TO CONSOLIDATED FINANCIAL STATEMENTS (Continued)
(Dollar amounts in thousands except per share and share amounts)
Revenue Recognition and Sales Commitments – In accordance with ASC 606, Revenue from Contracts with Customers, revenue is recognized when the performance obligations are satisfied. A performance obligation is a promise in a contract to transfer a distinct good or service to the customer and is the unit of account in ASC 606. The Company has one major performance obligation category: manufactured parts.
A contract’s transaction price is allocated to each distinct performance obligation and recognized when the performance obligation is satisfied. The Company’s contracts may include multiple performance obligations. For such contracts, the Company generally allocates the contract’s transaction price to each performance obligation based on the purchase order or other arranged pricing.
Revenue is recognized for manufactured parts at a point in time, generally when products are shipped or delivered. The point at which revenue is recognized often depends on the shipping terms.
The Company usually enters into agreements with customers to produce products at the beginning of a vehicle’s life. Blanket purchase orders received from customers and related documents generally establish the annual terms, including pricing, related to a vehicle model. Although purchase orders do not usually specify quantities, fulfillment of customers’ purchasing requirements can be the Company’s obligation for the entire production life of the vehicle. These agreements generally may be terminated by the Company’s customer at any time, but such cancellations have historically been minimal. Customers typically pay for parts based on customary business practices with payment terms generally between 30 and 90 days. The Company has no significant financing arrangements with customers.
The Company applies the optional exemption to forgo disclosing information about its remaining performance obligations because its contracts usually have an original expected duration of one year or less. It also applies an accounting policy to treat shipping and handling costs that are incurred after revenue is recognizable as a fulfillment activity by expensing such costs as incurred, instead of as a separate performance obligation. This is consistent with the Company’s historical accounting practices. The Company has chosen to present revenue net of sales and other similar taxes, which is also consistent with its historical accounting practices.
Shipping and Handling – Amounts billed to customers related to shipping and handling are included in sales in the Company’s consolidated statements of operations. Shipping and handling costs are included in cost of products sold in the Company’s consolidated statements of operations.
Research and Development – Engineering, research and development, and program management costs are charged to selling, administration and engineering expenses as incurred and totaled $101,607, $114,854$84,112, $80,528 and $122,529$89,956 for the years ended December 31, 2020, 20192023, 2022 and 2018,2021, respectively.
Share-based Compensation – The Company measures share-based compensation expense at fair value and generally recognizes such expenses on a straight-line basis over the vesting period of the share-based employee awards. See Note 21.19. “Share-Based Compensation” for additional information.
NOTES TO CONSOLIDATED FINANCIAL STATEMENTS (Continued)
(Dollar amounts in thousands except per share and share amounts)
Use of Estimates – The preparation of financial statements in conformity with U.S. GAAP requires management to make estimates and judgments that affect amounts reflected in the consolidated financial statements, as well as disclosure of contingent assets and liabilities. Considerable judgment is often involved in making such estimates, and the use of different assumptions could result in different conclusions. Management believes its assumptions and estimates are reasonable and appropriate. However, actual results could differ from those estimates.
3. New Accounting Pronouncements
Recently Adopted Accounting Pronouncements
The Company adopted the following Accounting Standards Updates (“ASU”) in 2020:
ASU 2016-13, Financial Instruments — Credit Losses (Topic 326)
On January 1, 2020, the Company adopted Accounting Standards Codification (“ASC”) 326, Financial Instruments – Credit Losses, and all related amendments using the modified retrospective method whereby the cumulative effect of adopting the standard was recognized in equity at the date of initial application. Comparative information has2023, which did not been restated and continues to be reported under the accounting standards in effect for those periods. The most prominent among the changes in the standard is the consideration of losses not yet incurred, but expected, based on current conditions and future forecasts. Adoption of the new standard resulted in an immaterial increase in the allowance for credit losses, which decreased the tooling receivable on the Company’s condensed consolidated balance sheet in 2020. The increase in credit loss expense was recorded as an adjustment to the opening balance of retained earnings. Adoption of the new standard had no impact on the Company’s condensed consolidated statement of operations or on cash provided by (used in) operating, financing or investing activities on its condensed consolidated cash flow statements.
The cumulative effects of the changes made to the Company’s condensed consolidated balance sheet as of January 1, 2020 were as follows:
| | | | | | | | | | | | | | | | | |
| Balance as of December 31, 2019 | | Adjustments due to adoption of ASC 326 | | Balance as of January 1, 2020 |
| Tooling receivable, net | $ | 148,175 | | | $ | (1,573) | | | $ | 146,602 | |
| Retained earnings | 619,448 | | (1,573) | | | 617,875 |
The Company adopted the recently issued accounting pronouncement summarized as follows, which had an immaterialhave a material impact on its consolidated financial statements and disclosures:
statements: | | | | | | | | | | | | | | |
| Standard | | Description | | ImpactEffective Date |
ASU 2018-14,2022-04, Compensation—Retirement Benefits—Defined Benefit Plans—GeneralLiabilities - Supplier Finance Programs (Subtopic 715-20)405-50): Disclosure Framework—Changes to the Disclosure Requirements for Defined Benefit Plans
| | Modifies the disclosure requirements for ASC Topic 715 by removing and modifying existing disclosure requirements whileRequires enhanced disclosures about a buyer’s use of supplier finance programs. Supplier finance programs may also adding new disclosures.be referred to as reverse factoring, payables finance, or structured payables arrangements. | | Adoption of this standard resulted in additional pension disclosures while also removing certain other disclosures. Specifically, the weighted-average interest crediting rate for the U.S. cash balance plan was added while accumulated other comprehensive income expected to be recognized as components of net periodic benefit cost over the next fiscal year and the effects of a one-percentage-point change in the assumed health care cost trend rate were removed.December 31, 2020January 1, 2023 |
NOTES TO CONSOLIDATED FINANCIAL STATEMENTS (Continued)
(Dollar amounts in thousands except per share and share amounts)
The Company adopted the following ASUs in 2020, which did not have a material impact on its consolidated financial statements:
| | | | | | | | |
Standard | Description | Effective Date |
ASU 2018-15, Intangibles - Goodwill and Other - Internal-Use Software (Subtopic 350-40): Customer’s Accounting for Implementation Costs Incurred in a Cloud Computing Arrangement that is a Service Contract
| Aligns the requirements for capitalizing implementation costs incurred in a hosting arrangement that is a service contract with the requirements for capitalizing implementation costs incurred to develop or obtain internal-use software. | January 1, 2020 |
ASU 2020-04, Reference Rate Reform (Topic 848): Facilitation of the Effects of Reference Rate Reform on Financial Reporting
| Provides temporary optional guidance to ease the potential burden in accounting for reference rate reform. The new guidance provides optional expedients and exceptions for applying generally accepted accounting principles to contract modifications and hedging relationships, subject to meeting certain criteria, that reference LIBOR or another reference rate expected to be discontinued. | January 1, 2020 |
Recently Issued Accounting Pronouncements
The Company considered the recently issued accounting pronouncements summarized as follows, which will notcould have a material impact on its consolidated financial statements or disclosures:
| | | | | | | | | | | | | | | | | | | | |
| Standard | | Description | | Impact | | Effective Date |
ASU 2019-12,2023-07, Segment Reporting (Topic 280): Improvements to Reportable Segment Disclosures | | Requires disclosure of significant segment
expenses that are regularly provided to the chief operating decision maker (“CODM”) and included within each
reported measure of segment profit or loss, an amount and description of its composition for other segment items to
reconcile to segment profit or loss, and the title and position of the entity’s CODM beginning with annual disclosures in 2024. The amendments in this update also require all annual segment disclosures to be included in interim periods beginning in 2025. | | The Company is currently evaluating the impact of this
update on its consolidated
financial statements and disclosures. | | January 1, 2024 |
ASU 2023-09, Income Taxes (Topic 740): Simplifying the Accounting forImprovements to Income TaxesTax Disclosures | | Modifies ASC Topic 740 by removing certain exceptionsRequires disaggregated information about a reporting entity’s effective tax rate reconciliation as well as information on income taxes paid. | | The Company is currently evaluating the impact of this
update on its consolidated
financial statements and amending existing guidance in order to simplify the accounting for income taxes.disclosures. | | January 1, 20212025 |
ASU 2021-01, 2023-05,Reference Rate Reform (Topic 848) Business Combinations - Joint Venture Formations (Subtopic 805-60): ScopeRecognition and Initial Measurement | | Clarifies that certain optional expedientsRequires joint ventures to apply a new basis of accounting upon formation, and as a result, initially measure all assets and liabilities at fair value (with exceptions in Topic 848 for contract modifications and hedge accounting apply to derivativesfair value measurement that are affected byconsistent with the discounting transitionbusiness combinations guidance). | | The Company is currently evaluating the impact of this
update on its consolidated
financial statements and tailors the existing guidance to derivative instruments affected by the discounting transition.disclosures. | | January 1, 20212025 |
4. AcquisitionsDivestitures and Deconsolidations
AMI Acquisition2023 Divestiture
In the firstsecond quarter of 2018,2023, the Company finalizedsigned a share purchase and assignment agreement to sell its purchase of 100% equity interest of the China fuel and brake business of AMI Industries (“AMI China”) for cash consideration of $3,900. The results of operations of AMI China are included in the Company’s consolidated financial statements from the date of acquisition and reported within the Asia Pacific segment.
INOAC Acquisition
In the first quarter of 2018, the Company purchased the remaining 49% equity interest of Cooper-Standard INOAC Pte. Ltd., a fluid transfer systems joint venture, at a purchase price of $2,450. This acquisition was accounted for as an equity transaction. Subsequent to the transaction, the Company owns 100% of the equity interests of Cooper-Standard INOAC Pte. Ltd.
Lauren Acquisition
European technical rubber products business. In the third quarter of 2018,2023, the Company acquiredclosed the assetstransaction and liabilities of Lauren Manufacturing and Lauren Plastics (together “Lauren”), extruders and molders of organic, silicone, thermoplastic and engineered polymer products with expertise in sealing solutions. The base purchase price of the acquisition was $92,700. The results of operations of Lauren are includedreceived cash proceeds in the Company’s consolidated financial statements from the dateamount of acquisition and reported within Corporate, eliminations and other.
NOTES TO CONSOLIDATED FINANCIAL STATEMENTS (Continued)
(Dollar amounts in thousands except per share and share amounts)
LS Mtron Automotive Parts Acquisition
$15,009. In the fourth quarter of 2018,2023, the Company acquired 80.1%finalized computations of LS Mtron Ltd.’s automotive parts business, now named Cooper Standard Automotive and Industrial, Inc. The acquisition added jounce brake lines and charge air cooling technology to the Company’s automotive fluid transfer and fuel and brake delivery systems product lines and further expands core product offerings. The base purchase price was $25,750. The noncontrolling interest was determined to haveadjustments. Incremental proceeds of $665 resulting from final net purchase price adjustments were received in the first quarter of 2024.
Upon finalization of the sale, during the year ended December 31, 2023, the Company recorded a fair valuegain of $6,400. The results of operations of Cooper Standard Automotive and Industrial, Inc., are$477, included in the Company’s consolidated financial statements fromof operations. The gain included the datewrite off of acquisition and reported within the Asia Pacific segment. In 2019, the Company recorded insignificant measurement period adjustments primarily due to working capital adjustments, which resulted in an increase to the base purchase price.goodwill of $1,300.
Hutchings Automotive Products Acquisition
In the fourth quarter of 2018, the Company acquired the assets and liabilities of Hutchings Automotive Products, LLC (“Hutchings”), a North American supplier of high quality fluid carrying products for automotive powertrain and coolant systems applications. The base purchase price was $42,100. The results of operations of Hutchings are included in the Company's consolidated financial statements from the date of acquisition and reported within the North America segment.
5. Divestitures
20202023 Joint Venture Divestiture
In the fourth quarter of 2019, managementManagement approved a plan to sell its European rubber fluid transfer and specialty sealing businesses, as well as its Indian operations. The entitiesthe Company’s entire controlling equity interest of a joint venture in the Asia Pacific region, and the associated assets and liabilities metsale was completed in the criteria for presentation as held for sale asthird quarter of March 31, 2020, and depreciation of long-lived assets ceased. The divestiture did not meet the criteria for presentation as a discontinued operation.
2023. Upon meeting the criteria for held for sale classification, the Company recorded non-cash impairment charges of $86,470 during the six months ended June 30, 2020$787 to reduce the carrying value of the held for sale entitiesentity to fair value less costs to sell. Fair value, which is categorized within Level 3 of the fair value hierarchy, was determined using a market approach, estimated based on expected proceeds. The fair value less costs to sell were assessed each reporting period that the asset group remained classified as held for sale. The difference between the impairment
On completion of the carrying value on the divested assets compared to the impairment recorded in the consolidated statements of operations is due to foreign currency translation offset by costs to sell incurred in the second quarter. The impairment charge includes the non-cash cumulative foreign currency translation losses recorded in equity related to the divested entities.
On July 1, 2020, the Company completed the divestiture of its European rubber fluid transfer and specialty sealing businesses, as well as its Indian operations, to Mutares SE & Co. KGaA (“Mutares”). The transaction included payment denominated in Euro of €9,000, which consisted of €6,500 in cash paid and €2,500 in deferred payment obligations, payable in December 2021.
Upon finalizing the sale, in the third quarter of 2020 and including subsequent adjustments in the fourth quarter of 2020, the Company recorded a net gain on deconsolidation of the businesses of $353 during the year ended December 31, 2020. In addition, at closing,2023, the Company recorded a gain of $109. Both the non-cash impairment charges and Mutares entered into certain ancillary agreements providing forgain on sale were included in the transitionconsolidated statements of the European rubber fluid transfer and specialty sealing businesses and Indian operations.
NOTES TO CONSOLIDATED FINANCIAL STATEMENTS (Continued)
(Dollar amounts in thousands except per share and share amounts)
The major classes of assets and liabilities divested were as follows:
| | | | | |
| July 1, 2020 |
Cash and cash equivalents | $ | 11,162 | |
Accounts receivable, net | 18,825 | |
Tooling receivable, net | 4,770 | |
Inventories | 17,022 | |
Prepaid expenses | 2,728 | |
Other current assets | 8,873 | |
Property, plant and equipment, net | 39,913 | |
Operating lease right-of-use assets, net | 2,946 | |
Intangible assets, net | 4,992 | |
Other assets | 4,114 | |
Impairment of carrying value | (85,622) | |
Total assets divested | $ | 29,723 | |
| |
Accounts payable | $ | 13,219 | |
Payroll liabilities | 7,135 | |
Accrued liabilities | 5,744 | |
Current operating lease liabilities | 918 | |
Pension benefits | 3,574 | |
Postretirement benefits other than pensions | 2,778 | |
Long-term operating lease liabilities | 2,286 | |
Other liabilities | 1,934 | |
Total liabilities divested | $ | 37,588 | |
20202022 Joint Venture Deconsolidation
In the thirdfirst quarter of 2020, management approved and completed a plan to sell the Company’s entire controlling equity interest of2022, a joint venture in the Asia Pacific region. Upon finalizingregion that was previously consolidated with a noncontrolling interest amended the sale,governing document underlying the Company recordedjoint venture. The amendment to the agreement did not change the Company’s 51% ownership. However, as a gain on deconsolidationresult of the businessamendment and effective as of $1,334.
2019 Divestiture
DuringJanuary 1, 2022, the first quarter of 2019joint venture was deconsolidated and in prior periods,accounted for as an investment under the equity method. The Company also operated an AVS product line. On April 1, 2019,remeasured the Company completed its saleretained investment using the income approach method and performed a discounted cash flow analysis of the AVS product line to Continental AG. The total sale priceprojected free cash flows of the transaction was $265,000, subject to certain adjustments. Cash proceeds received injoint venture. As a result of the second quarter of 2019 were $243,362 after adjusting for certain liabilities assumed by the purchaser. The Company recognized a gain on the divestiture of $191,571deconsolidation, during the year ended December 31, 2019. In the third quarter of 2020,2022, the Company finalized adjustments torecorded a loss of $2,257, included in other expense, net in the gain recorded in 2019 by recording an additional gain on divestitureconsolidated statements of $1,147, primarily due to working capital adjustments.
operations.
NOTES TO CONSOLIDATED FINANCIAL STATEMENTS (Continued)
(Dollar amounts in thousands except per share and share amounts)
6.5. Revenue
The Company recognizes revenue in accordance with ASC 606, Revenue from Contracts with Customers, which was adopted on January 1, 2018 using the modified retrospective method.
The passenger and light duty group consists of sales to automotive OEMs and automotive suppliers, while the commercial group represents sales to OEMs of on- and off-highway commercial equipment and vehicles. The other customer group includes sales related to specialty and adjacent markets.
Revenue by customer group for the year ended December 31, 20202023 was as follows: | | | | | | | | | | | | | | | | | | | | | | | | | | | | | | | | | | | |
| North America | | Europe | | Asia Pacific | | South America | | Corporate, Eliminations and Other | | Consolidated |
| Passenger and Light Duty | $ | 1,453,777 | | | $ | 623,038 | | | $ | 452,016 | | | $ | 125,621 | | | $ | — | | | $ | 2,654,452 | |
| Commercial | 16,419 | | | 24,674 | | | 422 | | | 8 | | | 7,416 | | | 48,939 | |
| Other | 15,904 | | | 544 | | | 3 | | | — | | | 96,037 | | | 112,488 | |
| Revenue | $ | 1,486,100 | | | $ | 648,256 | | | $ | 452,441 | | | $ | 125,629 | | | $ | 103,453 | | | $ | 2,815,879 | |
| | | | | | | | | | | | | | | | | | | | | | | | | | | | | | | | | | | |
| North America | | Europe | | Asia Pacific | | South America | | Corporate, Eliminations and Other | | Consolidated |
| Passenger and Light Duty | $ | 1,110,294 | | | $ | 554,349 | | | $ | 463,586 | | | $ | 60,676 | | | $ | 0 | | | $ | 2,188,905 | |
| Commercial | 11,291 | | | 18,134 | | | 4,338 | | | 22 | | | 3,731 | | | 37,516 | |
| Other | 19,783 | | | 14,256 | | | 118 | | | 56 | | | 114,805 | | | 149,018 | |
| Revenue | $ | 1,141,368 | | | $ | 586,739 | | | $ | 468,042 | | | $ | 60,754 | | | $ | 118,536 | | | $ | 2,375,439 | |
Revenue by customer group for the year ended December 31, 20192022 was as follows: | | | | | | | | | | | | | | | | | | | | | | | | | | | | | | | | | | | |
| North America | | Europe | | Asia Pacific | | South America | | Corporate, Eliminations and Other | | Consolidated |
| Passenger and Light Duty | $ | 1,309,786 | | | $ | 481,510 | | | $ | 441,841 | | | $ | 100,400 | | | $ | — | | | $ | 2,333,537 | |
| Commercial | 15,518 | | | 21,862 | | | 1,283 | | | 20 | | | 6,620 | | | 45,303 | |
| Other | 15,795 | | | 300 | | | 2 | | | — | | | 130,454 | | | 146,551 | |
| Revenue | $ | 1,341,099 | | | $ | 503,672 | | | $ | 443,126 | | | $ | 100,420 | | | $ | 137,074 | | | $ | 2,525,391 | |
| | | | | | | | | | | | | | | | | | | | | | | | | | | | | | | | | | | |
| North America | | Europe | | Asia Pacific | | South America | | Corporate, Eliminations and Other | | Consolidated |
| Passenger and Light Duty | $ | 1,504,136 | | | $ | 765,766 | | | $ | 503,676 | | | $ | 94,310 | | | $ | 5 | | | $ | 2,867,893 | |
| Commercial | 17,784 | | | 28,068 | | | 73 | | | 114 | | | 1,213 | | | 47,252 | |
| Other | 21,925 | | | 32,501 | | | 204 | | | 111 | | | 138,514 | | | 193,255 | |
| Revenue | $ | 1,543,845 | | | $ | 826,335 | | | $ | 503,953 | | | $ | 94,535 | | | $ | 139,732 | | | $ | 3,108,400 | |
Revenue by customer group for the year ended December 31, 20182021 was as follows:
| | | | | | | | | | | | | | | | | | | | | | | | | | | | | | | | | | | |
| North America | | Europe | | Asia Pacific | | South America | | Corporate, Eliminations and Other | | Consolidated |
| Passenger and Light Duty | $ | 1,834,780 | | | $ | 917,877 | | | $ | 571,137 | | | $ | 97,484 | | | $ | 15 | | | $ | 3,421,293 | |
| Commercial | 20,625 | | | 34,336 | | | 19 | | | 439 | | | 2,409 | | | 57,828 | |
| Other | 17,533 | | | 30,754 | | | 4 | | | 140 | | | 96,490 | | | 144,921 | |
| Revenue | $ | 1,872,938 | | | $ | 982,967 | | | $ | 571,160 | | | $ | 98,063 | | | $ | 98,914 | | | $ | 3,624,042 | |
| | | | | | | | | | | | | | | | | | | | | | | | | | | | | | | | | | | |
| North America | | Europe | | Asia Pacific | | South America | | Corporate, Eliminations and Other | | Consolidated |
| Passenger and Light Duty | $ | 1,119,736 | | | $ | 496,169 | | | $ | 455,445 | | | $ | 61,683 | | | $ | — | | | $ | 2,133,033 | |
| Commercial | 14,092 | | | 21,417 | | | 2,855 | | | 30 | | | 5,165 | | | 43,559 | |
| Other | 14,429 | | | 659 | | | 6 | | | — | | | 138,505 | | | 153,599 | |
| Revenue | $ | 1,148,257 | | | $ | 518,245 | | | $ | 458,306 | | | $ | 61,713 | | | $ | 143,670 | | | $ | 2,330,191 | |
Substantially all the Company’s revenues are generated from sealing and fluid handing (consisting of fuel and brake delivery,and fluid transfer and anti-vibrationtransfer) systems for use in passenger vehicles and light trucks manufactured by global OEMs. On April 1, 2019, the Company completed the divestiture of its AVS product line. See Note 5. “Divestitures” for additional information.
A summary of the Company’s products is as follows:
| | | | | | | | |
| Product Line | | Description |
| Sealing Systems | | Protect vehicle interiors from weather, dust and noise intrusion for improved driving experience; provide aesthetic and functional class-A exterior surface treatment |
| Fuel & Brake Delivery Systems | | Sense, deliver and control fluids to fuel and brake systems |
| Fluid Transfer Systems | | Sense, deliver and control fluids and vapors for optimal powertrain & HVAC
|
Anti-Vibration Systems (Divested on April 1, 2019) | | Control and isolate vibration and noise in the vehicle to improve ride and
handling |
NOTES TO CONSOLIDATED FINANCIAL STATEMENTS (Continued)
(Dollar amounts in thousands except per share and share amounts)
Revenue by product line for the year ended December 31, 20202023 was as follows: | | | | | | | | | | | | | | | | | | | | | | | | | | | | | | | | | | | |
| North America | | Europe | | Asia Pacific | | South America | | Corporate, Eliminations and Other | | Consolidated |
| Sealing systems | $ | 551,346 | | | $ | 515,059 | | | $ | 287,580 | | | $ | 93,588 | | | $ | — | | | $ | 1,447,573 | |
| Fluid handling: | | | | | | | | | | | |
| Fuel and brake delivery systems | 495,993 | | | 116,511 | | | 91,178 | | | 24,703 | | | — | | | 728,385 | |
| Fluid transfer systems | 438,761 | | | 16,686 | | | 73,683 | | | 7,338 | | | — | | | 536,468 | |
| Total fluid handling | 934,754 | | | 133,197 | | | 164,861 | | | 32,041 | | | — | | | 1,264,853 | |
| Other | — | | | — | | | — | | | — | | | 103,453 | | | 103,453 | |
| Revenue | $ | 1,486,100 | | | $ | 648,256 | | | $ | 452,441 | | | $ | 125,629 | | | $ | 103,453 | | | $ | 2,815,879 | |
| | | | | | | | | | | | | | | | | | | | | | | | | | | | | | | | | | | |
| North America | | Europe | | Asia Pacific | | South America | | Corporate, Eliminations and Other | | Consolidated |
| Sealing systems | $ | 433,291 | | | $ | 438,012 | | | $ | 298,028 | | | $ | 39,354 | | | $ | 0 | | | $ | 1,208,685 | |
| Fuel and brake delivery systems | 371,397 | | | 95,516 | | | 110,403 | | | 16,968 | | | 0 | | | 594,284 | |
| Fluid transfer systems | 336,680 | | | 41,102 | | | 59,611 | | | 4,432 | | | 0 | | | 441,825 | |
| | | | | | | | | | | |
| Other | 0 | | | 12,109 | | | 0 | | | 0 | | | 118,536 | | | 130,645 | |
| Consolidated | $ | 1,141,368 | | | $ | 586,739 | | | $ | 468,042 | | | $ | 60,754 | | | $ | 118,536 | | | $ | 2,375,439 | |
Revenue by product line for the year ended December 31, 20192022 was as follows: | | | | | | | | | | | | | | | | | | | | | | | | | | | | | | | | | | | |
| North America | | Europe | | Asia Pacific | | South America | | Corporate, Eliminations and Other | | Consolidated |
| Sealing systems | $ | 516,391 | | | $ | 405,605 | | | $ | 281,848 | | | $ | 77,309 | | | $ | — | | | $ | 1,281,153 | |
| Fluid handling: | | | | | | | | | | | |
| Fuel and brake delivery systems | 432,606 | | | 85,400 | | | 96,744 | | | 15,796 | | | — | | | 630,546 | |
| Fluid transfer systems | 392,102 | | | 12,667 | | | 64,534 | | | 7,315 | | | — | | | 476,618 | |
| Total fluid handling | 824,708 | | | 98,067 | | | 161,278 | | | 23,111 | | | — | | | 1,107,164 | |
| Other | — | | | — | | | — | | | — | | | 137,074 | | | 137,074 | |
| Revenue | $ | 1,341,099 | | | $ | 503,672 | | | $ | 443,126 | | | $ | 100,420 | | | $ | 137,074 | | | $ | 2,525,391 | |
| | | | | | | | | | | | | | | | | | | | | | | | | | | | | | | | | | | | | | |
| North America | | Europe | | Asia Pacific | | South America | | Corporate, Eliminations and Other | | Consolidated | |
| Sealing systems | $ | 553,901 | | | $ | 563,529 | | | $ | 334,056 | | | $ | 69,111 | | | $ | 0 | | | $ | 1,520,597 | | (1) |
| Fuel and brake delivery systems | 479,962 | | | 124,803 | | | 112,253 | | | 23,871 | | | 0 | | | 740,889 | | |
| Fluid transfer systems | 453,064 | | | 87,375 | | | 56,180 | | | 1,553 | | | 0 | | | 598,172 | | |
| Anti-vibration systems | 56,457 | | | 20,807 | | | 1,464 | | | 0 | | | 0 | | | 78,728 | | |
| Other | 461 | | | 29,821 | | | 0 | | | 0 | | | 139,732 | | | 170,014 | | (1) |
| Consolidated | $ | 1,543,845 | | | $ | 826,335 | | | $ | 503,953 | | | $ | 94,535 | | | $ | 139,732 | | | $ | 3,108,400 | | |
Revenue by product line for the year ended December 31, 20182021 was as follows:
| | | | | | | | | | | | | | | | | | | | | | | | | | | | | | | | | | | | | | |
| North America | | Europe | | Asia Pacific | | South America | | Corporate, Eliminations and Other | | Consolidated | |
| Sealing systems | $ | 626,450 | | | $ | 646,213 | | | $ | 442,774 | | | $ | 73,256 | | | $ | 0 | | | $ | 1,788,693 | | (1) |
| Fuel and brake delivery systems | 545,907 | | | 138,557 | | | 87,131 | | | 24,440 | | | 0 | | | 796,035 | | |
| Fluid transfer systems | 442,392 | | | 87,593 | | | 32,990 | | | 367 | | | 0 | | | 563,342 | | |
| Anti-vibration systems | 256,846 | | | 74,792 | | | 8,265 | | | 0 | | | 0 | | | 339,903 | | |
| Other | 1,343 | | | 35,812 | | | 0 | | | 0 | | | 98,914 | | | 136,069 | | (1) |
| Consolidated | $ | 1,872,938 | | | $ | 982,967 | | | $ | 571,160 | | | $ | 98,063 | | | $ | 98,914 | | | $ | 3,624,042 | | |
(1)Insignificant reclassifications between the sealing systems and other product lines were made as part of our reorganization. | | | | | | | | | | | | | | | | | | | | | | | | | | | | | | | | | | | |
| North America | | Europe | | Asia Pacific | | South America | | Corporate, Eliminations and Other | | Consolidated |
| Sealing systems | $ | 425,388 | | | $ | 406,677 | | | $ | 287,117 | | | $ | 46,748 | | | $ | — | | | $ | 1,165,930 | |
| Fluid handling: | | | | | | | | | | | |
| Fuel and brake delivery systems | 364,309 | | | 94,751 | | | 107,137 | | | 9,789 | | | — | | | 575,986 | |
| Fluid transfer systems | 358,560 | | | 16,817 | | | 64,052 | | | 5,176 | | | — | | | 444,605 | |
| Total fluid handling | 722,869 | | | 111,568 | | | 171,189 | | | 14,965 | | | — | | | 1,020,591 | |
| Other | — | | | — | | | — | | | — | | | 143,670 | | | 143,670 | |
| Revenue | $ | 1,148,257 | | | $ | 518,245 | | | $ | 458,306 | | | $ | 61,713 | | | $ | 143,670 | | | $ | 2,330,191 | |
Contract Estimates
The amount of revenue recognized is usually based on the purchase order price and adjusted for variable consideration, including pricing concessions. The Company accrues for pricing concessions by reducing revenue as products are shipped or delivered. The accruals are based on historical experience, anticipated performance and management’s best judgment. The Company also generally has ongoing adjustments to customer pricing arrangements based on the content and cost of its products. Such pricing accruals are adjusted as they are settled with customers. Customer returns, which are infrequent, are usually related to quality or shipment issues and are recorded as a reduction of revenue. The Company generally does not recognize significant return obligations due to their infrequent nature.
Contract Balances
The Company’s contract assets consist of unbilled amounts associated with variable pricing arrangements in itsthe Asia Pacific region. Once pricing is finalized, contract assets are transferred to accounts receivable. As a result, the timing of revenue recognition and billings, as well as changes in foreign exchange rates, will impact contract assets on an ongoing basis. Changes during the year ended December 31, 2020Contract assets were not materially impacted by any other factors.factors during the year ended December 31, 2023.
NOTES TO CONSOLIDATED FINANCIAL STATEMENTS (Continued)
(Dollar amounts in thousands except per share and share amounts)
The Company’s contract liabilities consist of advance payments received and due from customers. NetAs of December 31, 2023 and 2022, there were no significant contract assets (liabilities) consisted of the following:
| | | | | | | | | | | | | | | | | | | | |
| | December 31, 2020 | | December 31, 2019 | | Change |
| Contract assets | | $ | 777 | | | $ | 1,100 | | | $ | (323) | |
| Contract liabilities | | (27) | | | (61) | | | 34 | |
| Net contract assets | | $ | 750 | | | $ | 1,039 | | | $ | (289) | |
Other
The Company at times enters into agreements that provide for lump sum payments to customers. These payment agreements are recorded as a reduction of revenue during the period the commitment is made.made, unless the payment is contractually recoverable. Amounts related to commitments of future payments to customers on the condensed consolidated balance sheets as of December 31, 20202023 and December 31, 20192022 were current liabilities of $16,932$10,164 and $12,916,$9,325, respectively, and long-term liabilities of $6,828$4,293 and $9,502,$5,899, respectively.
The Company provides assurance-type warranties to its customers. Such warranties provide customers with assurance that the related product will function as intended and complies with any agreed-upon specifications, and are recognized in costscost of products sold.
7.6. Restructuring
On an ongoing basis, the Company evaluates its business and objectives to ensure that it is properly configured and sized based on changing market conditions. Accordingly, the Company has implemented several restructuring initiatives, including closure or consolidation of facilities throughout the world and the reorganization of its operating structure.
The Company’s restructuring charges consist of severance, retention and outplacement services, and severance-related postemployment benefits (collectively, “employee separation costs”), along with other related exit costs and asset impairments related to restructuring activities.activities (collectively, “other exit costs”). Employee separation costs are recorded based on existing union and employee contracts, statutory requirements, completed negotiations and Company policy.
Restructuring expensecharges (reversals) by segment for the years ended December 31, 2020, 20192023, 2022 and 20182021 were as follows: | | | | | | | | | | | | | | | | | |
| Year Ended December 31, |
| 2023 | | 2022 | | 2021 |
| North America | $ | 5,415 | | | $ | (96) | | | $ | 5,710 | |
| Europe | 10,924 | | | 12,969 | | | 27,986 | |
| Asia Pacific | 1,372 | | | 4,695 | | | 2,013 | |
| South America | 212 | | | 615 | | | 580 | |
| Total Automotive | $ | 17,923 | | | $ | 18,183 | | | $ | 36,289 | |
| Corporate and other | 95 | | | 121 | | | 661 | |
| Total | $ | 18,018 | | | $ | 18,304 | | | $ | 36,950 | |
Restructuring activity for all restructuring initiatives for the years ended December 31, 2023 and 2022 was as follows: | | | | | | | | | | | | | | | | | | | |
| Employee Separation Costs | | Other Exit Costs | | | | Total |
| Balance as of December 31, 2021 | $ | 20,957 | | | $ | 5,627 | | | | | $ | 26,584 | |
| Expense | 12,648 | | | 5,656 | | | | | 18,304 | |
| Cash payments | (19,186) | | | (4,560) | | | | | (23,746) | |
| Non-cash fixed asset impairments included in expense | — | | | (362) | | | | | (362) | |
| Foreign exchange translation and other | (1,234) | | | 22 | | | | | (1,212) | |
| Balance as of December 31, 2022 | $ | 13,185 | | | $ | 6,383 | | | | | $ | 19,568 | |
| Expense | 13,946 | | | 4,072 | | | | | 18,018 | |
| Cash payments | (8,677) | | | (5,201) | | | | | (13,878) | |
| | | | | | | |
| Foreign exchange translation and other | 506 | | | 79 | | | | | 585 | |
| Balance as of December 31, 2023 | $ | 18,960 | | | $ | 5,333 | | | | | $ | 24,293 | |
| | | | | | | | | | | | | | | | | |
| Year Ended December 31, |
| 2020 | | 2019 | | 2018 |
| North America | $ | 16,499 | | | $ | 10,831 | | | $ | 5,413 | |
| Europe | 14,573 | | | 23,525 | | | 17,765 | |
| Asia Pacific | 4,773 | | | 6,781 | | | 6,290 | |
| South America | 2,129 | | | 37 | | | 254 | |
| Total Automotive | 37,974 | | | 41,174 | | | 29,722 | |
| Corporate and other | 1,508 | | | 9,928 | | | 0 | |
| Total | $ | 39,482 | | | $ | 51,102 | | | $ | 29,722 | |
NOTES TO CONSOLIDATED FINANCIAL STATEMENTS (Continued)
(Dollar amounts in thousands except per share and share amounts)
Restructuring activity for all restructuring initiativesexpense for the yearsyear ended December 31, 2020 and 2019 was as follows:
| | | | | | | | | | | | | | | | | | | |
| Employee Separation Costs | | Other Exit Costs | | | | Total |
| Balance as of December 31, 2018 | $ | 9,398 | | | $ | 3,829 | | | | | $ | 13,227 | |
| Expense | 34,354 | | | 16,748 | | | | | 51,102 | |
| Cash payments | (20,661) | | | (13,285) | | | | | (33,946) | |
| Non-cash fixed asset impairments included in expense | 0 | | | (2,997) | | | | | (2,997) | |
| Foreign exchange translation and other | (101) | | | (290) | | | | | (391) | |
| Balance as of December 31, 2019 | $ | 22,990 | | | $ | 4,005 | | | | | $ | 26,995 | |
| Expense | 17,926 | | | 21,556 | | | | | 39,482 | |
| Cash payments | (25,261) | | | (15,071) | | | | | (40,332) | |
| Non-cash fixed asset and intangible impairments included in expense | 0 | | | (2,558) | | | | | (2,558) | |
| Foreign exchange translation and other | (626) | | | 474 | | | | | (152) | |
| Balance as of December 31, 2020 | $ | 15,029 | | | $ | 8,406 | | | | | $ | 23,435 | |
2022 primarily includes expenses incurred related to employee separation costs associated with workforce reduction initiatives to optimize the Company’s cost structure. Other exit costs and employee separation costs for the year ended December 31, 20202022 include non-cash settlement charges, fixed asset and intangible impairment charges related to divested or closed facilities, andan immaterial gain on sale of fixed assets and non-cash fixed asset impairment charges related to a closed facility.facilities in the Asia Pacific region.
8.7. Leases
The Company primarily has operating and finance leases for certain manufacturing facilities, corporate offices and certain equipment. Operating leases are included in operating lease right-of-use assets, net, current operating lease liabilities and long-term operating lease liabilities on the Company’s consolidated balance sheets. Finance leases are included in property, plant and equipment, net, debt payable within one year, and long-term debt on the Company’s consolidated balance sheets.
Lease right-of-use assets are recognized at commencement date based upon the present value of the remaining future minimum lease payments over the lease term. The Company’s lease terms include options to renew or terminate the lease when it is reasonably certain that itthe Company will exercise the option. As most of the Company’s leases do not provide an implicit rate, the Company uses its incremental borrowing rate based upon information available at the lease commencement date to determine the present value of the remaining future lease payments.
The Company has lease agreements with lease and non-lease components. For real estate leases, these components are accounted for separately, while for equipment leases, the Company accounts for the lease and non-lease components are accounted for as a single lease component.
Variable lease expense includes payments based upon changes in a rate or index, such as consumer price indexes, as well as usage of the leased asset. Short-term lease expense includes leases with terms, at lease commencement, of 12 months or less and no purchase option reasonably certain to be exercised. The Company’s lease agreements do not contain any material residual value guarantees or material restrictive covenants.
The components of lease expense were as follows: | | | | | | | | | | | | | | | | | | | | |
| | Year Ended December 31, |
| | 2023 | | 2022 | | 2021 |
| Operating lease expense | | $ | 28,128 | | | $ | 28,273 | | | $ | 31,912 | |
| Short-term lease expense | | 5,037 | | | 4,948 | | | 6,736 | |
| Variable lease expense | | 2,310 | | | 1,136 | | | 907 | |
| Finance lease expense: | | | | | | |
| Amortization of right-of-use assets | | 2,216 | | | 2,017 | | | 2,102 | |
| Interest on lease liabilities | | 1,292 | | | 1,316 | | | 1,444 | |
| Total lease expense | | $ | 38,983 | | | $ | 37,690 | | | $ | 43,101 | |
The Company recorded sublease income of $1,213, $669 and $256 for the years ended December 31, 2023, 2022 and 2021 respectively.
NOTES TO CONSOLIDATED FINANCIAL STATEMENTS (Continued)
(Dollar amounts in thousands except per share and share amounts)
The components of lease expense were as follows:
| | | | | | | | | | | | | | |
| | Year Ended December 31, 2020 | | Year Ended December 31, 2019 |
| Operating lease expense | | $ | 32,053 | | | $ | 33,360 | |
| Short-term lease expense | | 5,069 | | | 3,557 | |
| Variable lease expense | | 942 | | | 1,619 | |
| Finance lease expense: | | | | |
| Amortization of right-of-use assets | | 2,564 | | | 2,550 | |
| Interest on lease liabilities | | 1,551 | | | 1,438 | |
| Total lease expense | | $ | 42,179 | | | $ | 42,524 | |
The Company recorded impairment charges of $647 due to the deterioration of financial results at a certain location in North America during the year ended December 31, 2020. The fair value was determined using estimated market rate for the leased right-of-use asset. Additionally, the Company recorded sublease income of $374 and $431 for the years ended December 31, 2020 and 2019, respectively.
Other information related to leases was as follows: | | | | | | | | | | | | | | | | | | | | | | |
| | Year Ended December 31, | | |
| | 2023 | | 2022 | | 2021 | | |
| Supplemental Cash Flows Information | | | | | | | | |
| Cash paid for amounts included in the measurement of lease liabilities: | | | | | | | | |
| Operating cash flows for operating leases | | $ | 28,432 | | $ | 28,603 | | $ | 33,402 | | |
| Operating cash flows for finance leases | | 1,292 | | 1,316 | | 1,440 | | |
| Financing cash flows for finance leases | | 2,247 | | 1,958 | | 2,133 | | |
| Non-cash right-of-use assets obtained in exchange for lease obligations: | | | | | | | | |
| Operating leases | | 8,653 | | 14,326 | | 25,010 | | |
| Finance leases | | 540 | | 595 | | 644 | | |
| | | | | | | | |
| Weighted Average Remaining Lease Term (in years) | | | | | | | | |
| Operating leases | | 7.3 | | 7.1 | | 7.5 | | |
| Finance leases | | 7.9 | | 8.7 | | 9.7 | | |
| | | | | | | | |
| Weighted Average Discount Rate | | | | | | | | |
| Operating leases | | 6.7 % | | 6.1 % | | 5.9 % | | |
| Finance leases | | 6.0 % | | 5.9 % | | 5.8 % | | |
| | | | | | | | | | | | | | | | |
| | Year Ended December 31, 2020 | | Year Ended December 31, 2019 | | |
| Supplemental Cash Flows Information | | | | | | |
| Cash paid for amounts included in the measurement of lease liabilities: | | | | | | |
| Operating cash flows for operating leases | | $ | 30,830 | | | $ | 34,235 | | | |
| Operating cash flows for finance leases | | 1,563 | | | 1,438 | | | |
| Financing cash flows for finance leases | | 2,081 | | | 1,284 | | | |
| Non-cash right-of-use assets obtained in exchange for lease obligations: | | | | | | |
| Operating leases | | 50,663 | | | 11,143 | | | |
| Finance leases | | 549 | | | 22,671 | | | |
| | | | | | |
| Weighted Average Remaining Lease Term (in years) | | | | | | |
| Operating leases | | 8.0 | | 5.2 | | |
| Finance leases | | 10.5 | | 11.3 | | |
| | | | | | |
| Weighted Average Discount Rate | | | | | | |
| Operating leases | | 5.4 | % | | 4.7 | % | | |
| Finance leases | | 5.7 | % | | 6.1 | % | | |
| | | | | | | | | | | | | | | | | | |
| Year | | | | | | Operating Leases | | Finance Leases |
| 2024 | | | | | | $ | 24,066 | | | $ | 3,739 | |
| 2025 | | | | | | 19,508 | | | 3,771 | |
| 2026 | | | | | | 14,401 | | | 3,309 | |
| 2027 | | | | | | 10,813 | | | 3,233 | |
| 2028 | | | | | | 9,856 | | | 2,822 | |
| Thereafter | | | | | | 40,795 | | | 11,301 | |
| Total future lease payments | | | | | | $ | 119,439 | | | $ | 28,175 | |
| Less: imputed interest | | | | | | (24,380) | | | (5,932) | |
| Total | | | | | | $ | 95,059 | | | $ | 22,243 | |
Amounts recognized on the consolidated balance sheets as of December 31, 2023 and December 31, 2022 were as follows: | | | | | | | | | | | | | | | | | | |
| | | | | | December 31, 2023 | | December 31, 2022 |
| Operating Leases | | | | | | | | |
| Operating lease right-of-use assets, net | | | | | | $ | 91,126 | | | $ | 94,571 | |
| Current operating lease liabilities | | | | | | 18,577 | | | 20,786 | |
| Long-term operating lease liabilities | | | | | | 76,482 | | | 77,617 | |
| | | | | | | | |
| Finance Leases | | | | | | | | |
| Property, plant and equipment, net | | | | | | 21,239 | | | 22,942 | |
| Debt payable within one year | | | | | | 2,492 | | | 2,228 | |
| Long-term debt | | | | | | 19,751 | | | 21,537 | |
NOTES TO CONSOLIDATED FINANCIAL STATEMENTS (Continued)
(Dollar amounts in thousands except per share and share amounts)
Future minimum lease payments under non-cancellable leases as of December 31, 2020 were as follows:
| | | | | | | | | | | | | | | | | | |
| Year | | | | | | Operating Leases | | Finance Leases |
| 2021 | | | | | | $ | 26,766 | | | $ | 3,530 | |
| 2022 | | | | | | 21,467 | | | 3,265 | |
| 2023 | | | | | | 17,388 | | | 3,172 | |
| 2024 | | | | | | 13,703 | | | 3,448 | |
| 2025 | | | | | | 10,501 | | | 3,516 | |
| Thereafter | | | | | | 51,164 | | | 21,608 | |
| Total future minimum lease payments | | | | | | 140,989 | | | 38,539 | |
| Less imputed interest | | | | | | (28,761) | | | (10,087) | |
| Total | | | | | | $ | 112,228 | | | $ | 28,452 | |
Amounts recognized on the consolidated balance sheets as of December 31, 2020 and December 31, 2019 were as follows:
| | | | | | | | | | | | | | | | | | |
| | | | | | December 31, 2020 | | December 31, 2019 |
| Operating Leases | | | | | | | | |
| Operating lease right-of-use assets, net | | | | | | $ | 109,795 | | | $ | 83,376 | |
| Current operating lease liabilities | | | | | | 21,711 | | | 24,094 | |
| Long-term operating lease liabilities | | | | | | 90,517 | | | 60,234 | |
| | | | | | | | |
| Finance Leases | | | | | | | | |
| Debt payable within one year | | | | | | 2,300 | | | 2,343 | |
| Long-term debt | | | | | | 26,152 | | | 27,430 | |
As of December 31, 2020 and December 31, 2019, assets recorded under finance leases, net of accumulated depreciation were $30,847 and $32,571, respectively. As of December 31, 2020,2023, the Company had additional operating leases, primarily for real estate, that have not yet commenced with undiscounted lease payments of approximately $1,404.$1,191. These operating leases will commence in 20212024 with lease terms up to threeeight years.
9.8. Property, Plant and Equipment
Property, plant and equipment consists of the following:
| | | | | | | | | | | | | | | | | |
| | December 31, | | Estimated |
| | 2023 | | 2022 | | Useful Lives |
| Land and improvements | $ | 43,950 | | | $ | 42,939 | | | 10 to 25 years |
| Buildings and improvements | 270,890 | | | 262,694 | | | 10 to 40 years |
| Machinery and equipment | 1,191,792 | | | 1,144,310 | | | 5 to 10 years |
| Construction in progress | 71,706 | | | 76,048 | | | |
| $ | 1,578,338 | | | $ | 1,525,991 | | | |
| Accumulated depreciation | (969,907) | | | (883,131) | | | |
| Property, plant and equipment, net | $ | 608,431 | | | $ | 642,860 | | | |
| | | | | | | | | | | | | | | | | |
| | December 31, | | Estimated |
| | 2020 | | 2019 | | Useful Lives |
| Land and improvements | $ | 61,226 | | | $ | 66,670 | | | 10 to 25 years |
| Buildings and improvements | 298,431 | | | 310,797 | | | 10 to 40 years |
| Machinery and equipment | 1,277,624 | | | 1,204,457 | | | 5 to 10 years |
| Construction in progress | 96,706 | | | 161,951 | | | |
| $ | 1,733,987 | | | $ | 1,743,875 | | | |
| Accumulated depreciation | (841,678) | | | (755,598) | | | |
| Property, plant and equipment, net | $ | 892,309 | | | $ | 988,277 | | | |
TheFor the years ended December 31, 2023, 2022 and 2021, the Company recorded impairment charges of $13,084$2,348, $40,248 and $20,118, respectively, related to machinery and equipment due to the deterioration of financial results atoperating performance in certain locations in North America, Europe, and Asia Pacific for the year ended December 31, 2020.Pacific. The fair value of buildings was determined using a value-in-exchange cost method while the fair value of machinery and equipment was determined using estimated orderly liquidation value, which was deemed the highest and best use of the assets. The fair value of real estate assets were determined using a value-in-exchange approach and the fair value was higher than carrying value.
For the years ended December 31, 2023, 2022 and 2021, the Company also recorded impairment charges of $4,162 related$1,633, $3,462 and $3,326, respectively, due to equipment no longer being utilized atidle assets in certain locations in North America, Europe, and Asia Pacific, and Corporate and other for the year ended December 31, 2020.Pacific. The fair value of equipment was determined using estimated salvage value, which was deemed the highest and best use of the assets.
For the year ended December 31, 2022, the Company closed on a sale-leaseback transaction related to one of its European facilities and recorded a gain on the sale transaction of $33,391. The transaction included the removal of property, plant and equipment with a gross carrying value of $16,890 and accumulated depreciation of $4,013, which is reflected in the balance sheet as of December 31, 2022.
The deconsolidation of a joint venture during the three months ended March 31, 2022 included the removal of property, plant and equipment with gross carrying value of $29,590 and accumulated depreciation of $11,625, which is reflected in the balance sheet as of December 31, 2022.
For the year ended December 31, 2021, the Company also recorded impairment charges of $1,775 related to a leased building. The fair value of owned buildings was determined using a value-in-exchange approach
A summary of these asset impairment charges is as follows: | | | | | | | | | | | | | | | | | |
| Year Ended December 31, |
| 2023 | | 2022 | | 2021 |
| North America | $ | — | | | $ | 11,140 | | | $ | 8,479 | |
| Europe | 2,348 | | | 30,173 | | | 9,179 | |
| Asia Pacific | 1,633 | | | 2,359 | | | 7,071 | |
| | | | | |
| Total Automotive | 3,981 | | | 43,672 | | | 24,729 | |
| Corporate and other | — | | | 38 | | | 490 | |
| Total (a) | $ | 3,981 | | | $ | 43,710 | | | $ | 25,219 | |
(a) Excludes $787 of non-cash impairment charges for the year ended December 31, 2023 associated with a joint venture in the Asia Pacific region as disclosed in Note 4. “Divestitures and Deconsolidations”, and $390 of goodwill impairment for the year ended December 31, 2021 as disclosed in Note 9. “Goodwill and Intangible Assets”.
NOTES TO CONSOLIDATED FINANCIAL STATEMENTS (Continued)
(Dollar amounts in thousands except per share and share amounts)
For the year ended December 31, 2019, the Company recorded impairment charges for property, plant and equipment of $21,968 due to the deterioration of financial results at certain locations in Europe and Asia Pacific and the termination of certain customer programs in the Asia Pacific region and recorded impairment charges of $1,171 related to equipment no longer being utilized at certain locations in Europe and Corporate and other.
For the year ended December 31, 2018, the Company recorded impairment charges for property, plant and equipment of $42,915 due to the deterioration of financial results and equipment no longer being utilized at certain locations in Europe and Asia Pacific. Also during the year ended December 31, 2018, the Company realized a gain on sale of land of $10,377 in its Europe segment. The net book value of the land was $5,446.
A summary of these asset impairment charges is as follows:
| | | | | | | | | | | | | | | | | |
| Year Ended December 31, |
| 2020 | | 2019 | | 2018 |
| North America | $ | 947 | | | $ | 0 | | | $ | 0 | |
| Europe | 11,938 | | | 9,943 | | | 30,978 | |
| Asia Pacific | 4,080 | | | 13,146 | | | 11,937 | |
| South America | 0 | | | 0 | | | 0 | |
| Total Automotive | 16,965 | | | 23,089 | | | 42,915 | |
| Corporate and other | 281 | | | 50 | | | 0 | |
| Total | $ | 17,246 | | | $ | 23,139 | | | $ | 42,915 | |
The Company continues to monitor the significant global economic uncertainty as a result of COVID-19 to assess the outlook for demand for products and the impact on the Company’s business and overall financial performance. A lack of recovery or further deterioration in market conditions and production volumes, among other factors, as a result of the COVID-19 pandemic could result in an impairment charge in future periods.
10.9. Goodwill and Intangible Assets
Goodwill
Changes in the carrying amount of goodwill by reporting unit for the years ended December 31, 20202023 and 20192022 were as follows:
| | | | | | | | | | | | | | | | | | | | | |
| North America | | Industrial Specialty Group | | | | | | Total |
| Balance as of December 31, 2018 | $ | 143,681 | | | $ | 0 | | | | | | | $ | 143,681 | |
| Adjustments related to recent acquisitions | (1,689) | | | 0 | | | | | | | (1,689) | |
| | | | | | | | | |
| Foreign exchange translation | 195 | | | 0 | | | | | | | 195 | |
| | | | | | | | | |
| Balance as of December 31, 2019 | $ | 142,187 | | | $ | 0 | | | | | | | $ | 142,187 | |
| Change in organizational structure | (14,036) | | | 14,036 | | | | | | | 0 | |
| | | | | | | | | |
| Foreign exchange translation | 63 | | | 0 | | | | | | | 63 | |
| Balance as of December 31, 2020 | $ | 128,214 | | | $ | 14,036 | | | | | | | $ | 142,250 | |
The Company’s organizational structure changed on January 1, 2020. See Note 24. “Business Segments” for further detail on this reorganization of the Company’s business. Prior to this change in organizational structure, the Company’s North America operating segment was the only reporting unit in which goodwill was recorded. As a result of the change in organizational structure, a portion of the goodwill that was previously attributable to the North America reporting unit was reallocated to the Industrial Specialty Group reporting unit based on the relative fair value approach. The Industrial Specialty Group reporting unit is a component of the Advanced Technology Group operating segment, which is reflected in “Corporate, eliminations and other”.
The change in organizational structure of the business represented a triggering event to test goodwill for impairment as of January 1, 2020. No impairment was identified as a result of completing the goodwill impairment test.
NOTES TO CONSOLIDATED FINANCIAL STATEMENTS (Continued)
(Dollar amounts in thousands except per share and share amounts)
| | | | | | | | | | | | | | | | | | | | | |
| North America | | Industrial Specialty Group | | | | | | Total |
| Balance as of December 31, 2021 | $ | 128,246 | | | $ | 14,036 | | | | | | | $ | 142,282 | |
| | | | | | | | | |
| | | | | | | | | |
| Foreign exchange translation | (259) | | | — | | | | | | | (259) | |
| | | | | | | | | |
| Balance as of December 31, 2022 | $ | 127,987 | | | $ | 14,036 | | | | | | | $ | 142,023 | |
| | | | | | | | | |
| Divestiture | — | | | (1,300) | | | | | | | (1,300) | |
| Foreign exchange translation | 91 | | | — | | | | | | | 91 | |
| Balance as of December 31, 2023 | $ | 128,078 | | | $ | 12,736 | | | | | | | $ | 140,814 | |
The Company performed its annual impairment analysis of goodwill during the fourth quarterquarters of 2020.2023, 2022 and 2021. The fair value of each reporting unit is determined and compared to the carrying value. If the carrying value exceeds the fair value, an impairment charge is recorded based on that difference. The Company's annual goodwill impairment analysis resulted in no impairment for 2020.
The Company continues to monitor the significant global economic uncertainty as a result of COVID-19 to assess the outlook for demand for products2023 and the impact on the Company’s business and overall financial performance. A lack of recovery or further deterioration in market conditions and production volumes, among other factors, as a result of the COVID-19 pandemic could result in an impairment charge in future periods.
2022. The Company's annual goodwill impairment analysis for 2021 resulted in an impairment for the Europe reporting unit of $390 for goodwill recorded during 2021 as a result of purchasing a supplier in its Europe reporting unit for an immaterial purchase consideration. The annual impairment analysis for 2021 resulted in no impairment for 2019.the North America and Industrial Specialty Group reporting units.
DuringThe write off of goodwill of $1,300 during the fourth quarter of 2018,year ended December 31, 2023 is related to the Company noted potential adverse changes in operating conditions. The Company tested goodwill for impairment and recorded a goodwill impairment charge of $45,281 after determining the carrying valuesale of the EuropeEuropean technical rubber products business. Refer to Note. 4 “Divestitures and Asia Pacific reporting units exceeded their fair value.Deconsolidations” for additional information.
Intangible Assets
Definite-lived intangible assets and accumulated amortization balances as of December 31, 20202023 and 20192022 were as follows:
| | | | | | | | | | | | | | | | | |
| Gross Carrying Amount | | Accumulated Amortization | | Net Carrying Amount |
| Customer relationships | $ | 155,409 | | | $ | (122,657) | | | $ | 32,752 | |
| Other | 44,826 | | | (9,899) | | | 34,927 | |
| Balance as of December 31, 2020 | $ | 200,235 | | | $ | (132,556) | | | $ | 67,679 | |
| | | | | |
| Customer relationships | $ | 156,557 | | | $ | (113,871) | | | $ | 42,686 | |
| Other | 49,556 | | | (7,873) | | | 41,683 | |
| Balance as of December 31, 2019 | $ | 206,113 | | | $ | (121,744) | | | $ | 84,369 | |
During the fourth quarter of 2018, the Company recorded an impairment loss of $791 for customer relationships in its Europe operating segment. | | | | | | | | | | | | | | | | | |
| Gross Carrying Amount | | Accumulated Amortization | | Net Carrying Amount |
| Customer relationships | $ | 152,403 | | | $ | (133,698) | | | $ | 18,705 | |
| Other | 38,090 | | | (16,227) | | | 21,863 | |
| Balance as of December 31, 2023 | $ | 190,493 | | | $ | (149,925) | | | $ | 40,568 | |
| | | | | |
| Customer relationships | $ | 152,578 | | | $ | (129,317) | | | $ | 23,261 | |
| Other | 38,479 | | | (14,099) | | | 24,380 | |
| Balance as of December 31, 2022 | $ | 191,057 | | | $ | (143,416) | | | $ | 47,641 | |
Estimated amortization expense for the next five years is shown in the table below:
| | | | | | | | |
| Year | | Expense |
| 2021 | | $ | 7,320 | |
| 2022 | | 7,320 | |
| 2023 | | 7,307 | |
| 2024 | | 7,048 | |
| 2025 | | 6,593 | |
| | | | | | | | |
| Year | | Expense |
| 2024 | | $ | 6,899 | |
| 2025 | | 6,458 | |
| 2026 | | 4,684 | |
| 2027 | | 4,695 | |
| 2028 | | 4,035 | |
NOTES TO CONSOLIDATED FINANCIAL STATEMENTS (Continued)
(Dollar amounts in thousands except per share and share amounts)
11.10. Debt and Other Financing
A summary of outstanding debt as of December 31, 20202023 and 20192022 was as follows:
| | | | | | | | | | | |
| | December 31, |
| | 2020 | | 2019 |
| Senior Notes | $ | 395,829 | | | $ | 395,114 | |
| Senior Secured Notes | 239,567 | | | 0 | |
| Term Loan Facility | 323,636 | | | 326,061 | |
| | | |
| Finance Leases | 28,452 | | | 29,773 | |
| Other borrowings | 36,007 | | | 56,680 | |
| Total debt | 1,023,491 | | | 807,628 | |
| Less current portion | (40,731) | | | (61,449) | |
| Total long-term debt | $ | 982,760 | | | $ | 746,179 | |
| | | | | | | | | | | |
| | December 31, |
| | 2023 | | 2022 |
| First Lien Notes | $ | 595,966 | | | $ | — | |
| Third Lien Notes | 386,681 | | | — | |
| 2026 Senior Notes | 42,338 | | | 397,259 | |
| 2024 Senior Secured Notes | — | | | 244,471 | |
| Term Loan | — | | | 318,787 | |
| | | |
| Finance leases | 22,243 | | | 23,765 | |
| Other borrowings | 48,220 | | | 51,902 | |
| Total debt | 1,095,448 | | | 1,036,184 | |
| Less: current portion | (50,712) | | | (54,130) | |
| Total long-term debt | $ | 1,044,736 | | | $ | 982,054 | |
The principal maturities of debt, at nominal value, as of December 31, 20202023 are as follows:
| | | | | | | | |
| Year | | Debt and Finance Lease Obligations |
| 2021 | | $ | 42,236 | |
| 2022 | | 5,969 | |
| 2023 | | 322,078 | |
| 2024 | | 252,607 | |
| 2025 | | 2,610 | |
| Thereafter | | 415,286 | |
| Total | | $ | 1,040,786 | |
| | | | | | | | |
| Year | | Debt and Finance Lease Obligations* |
| 2024 | | $ | 51,959 | |
| 2025 | | 3,771 | |
| 2026 | | 45,863 | |
| 2027 | | 1,046,546 | |
| 2028 | | 2,822 | |
| Thereafter | | 11,301 | |
| Total | | $ | 1,162,262 | |
*Inclusive of imputed interest on finance leases as well as future payment-in-kind assumptions as described below.The weighted average interest rate of our short-term debt payable within one year was 3.7% as of December 31, 2023 and 4.1% as of December 31, 2020 and 4.6% as of December 31, 2019.2022.
5.625% Senior Notes due 2026Refinancing Transactions
On November 2, 2016,January 27, 2023 (the “Settlement Date”), the Company’s wholly-owned subsidiary, CSACompany, Cooper-Standard Automotive Inc. (the “Issuer”), issued $400,000a wholly-owned subsidiary of the Company, and certain other of the Company’s direct and indirect subsidiaries completed certain refinancing transactions (the “Refinancing Transactions”) consisting of: (i) the exchange (the “Exchange Offer”) of $357,446 aggregate principal amount of itsthe Issuer’s then existing 5.625% Senior Notes due 2026 (the “Senior“2026 Senior Notes”) (representing 89.36% of the aggregate principal amount outstanding of the 2026 Senior Notes) for $357,446 aggregate principal amount of the Issuer’s newly issued 5.625% Cash Pay / 10.625% PIK Toggle Senior Secured Third Lien Notes due 2027 (the “Third Lien Notes”), pursuant to(ii) the Indenture, dated November 2, 2016 (the “Indenture”),issuance by and among the Issuer (the “Concurrent Notes Offering”) of $580,000 aggregate principal amount of 13.50% Cash Pay / PIK Toggle Senior Secured First Lien Notes due 2027 (the “First Lien Notes” and, together with the CompanyThird Lien Notes, the “New Notes”) to holders of 2026 Senior Notes or their designees who participated in the Exchange Offer, including to certain backstop commitment parties who committed to purchase the First Lien Notes not otherwise subscribed for, (iii) the related consent solicitation (the “Consent Solicitation”) to remove substantially all of the covenants, certain events of default and certain other provisions contained in the 2026 Senior Notes and the other guarantors party thereto (collectively,indenture governing the “Guarantors”)2026 Senior Notes and U.S. Bank National Association, as trustee, in a transaction exempt from registration under Rule 144Ato release and Regulation Sdischarge the guarantee of the Securities Act of 1933 (“the Securities Act”). The net proceeds from the2026 Senior Notes were used to repay the non-extended term loan outstanding under the Term Loan Facility, defined below, and to pay fees and expenses related to the refinancing.
The Senior Notes are guaranteed by the Company, CS Intermediate HoldCo 1 LLC, as well as each(iv) the effectiveness of the Issuer’s wholly-owned existing or subsequently organized U.S. subsidiaries, subjectThird Amendment (as defined below) to certain exceptions, to the extent such subsidiary guarantees the senior asset-based revolving credit facility (“ABL Facility”) and (v) the senior term loan facility (“use of proceeds from the Concurrent Notes Offering, together with cash on hand, to prepay all amounts outstanding under the Term Loan Facility”Facility at par, plus any accrued and unpaid interest thereon, to redeem the Issuer’s existing 2024 Senior Secured Notes (as defined below), including the prepayment premium and any accrued and unpaid interest thereon, and to pay fees and expenses related to the Refinancing Transactions. As a result of the Refinancing Transactions, the Issuer extended the maturities of its indebtedness and reduced the amount of cash interest it is required to pay on such indebtedness for the next two years. The Company recognized a loss on the refinancing and extinguishment of debt of $81,885 during the year ended December 31, 2023. Additionally, the Company incurred total fees of $91,800 associated with the Refinancing Transactions, of which $87,571 were paid during the
NOTES TO CONSOLIDATED FINANCIAL STATEMENTS (Continued)
(Dollar amounts in thousands except per share and share amounts)
year ended December 31, 2023 and $4,229 were paid during 2022. The fees paid during the year ended December 31, 2023 are reflected as a financing outflow in the consolidated statement of cash flows. Of the fees paid during the year ended December 31, 2023, $73,384 was included in the loss on the refinancing and extinguishment of debt referenced above, $13,187 is presented as a direct deduction from the principal balance in the consolidated balance sheet, and $1,000 related to amending the ABL Facility is recorded in other long-term assets in the consolidated balance sheet.
New Notes
On the Settlement Date, the Issuer issued $580,000 aggregate principal amount of First Lien Notes pursuant to an indenture, dated as of the Settlement Date (the “First Lien Notes Indenture”), by and among the Issuer, the guarantors party thereto and U.S. Bank Trust Company, National Association, as trustee and collateral agent (the “First Lien Collateral Agent”).
The First Lien Notes are senior secured obligations of the Issuer and are guaranteed by CS Intermediate Holdco 1 LLC (“Holdings”), each of the Issuer’s wholly owned domestic subsidiaries that guarantee certain other indebtedness, subject to certain exceptions (the “Domestic Guarantors”), and certain of the Issuer’s wholly owned subsidiaries organized in Costa Rica, France, Mexico, the Netherlands and Romania (the “Foreign Guarantors”). The First Lien Notes are guaranteed by Holdings and the Domestic Guarantors on a senior secured basis and by the Foreign Guarantors on a senior unsecured basis. The guarantees of the subsidiaries organized in France are limited guarantees.
The First Lien Notes will mature on March 31, 2027. The First Lien Notes bear interest at the rate of 13.50% per annum, payable in cash; provided, however, that for the first four interest periods after the Settlement Date, the Issuer has the option, in its sole discretion, to pay up to 4.50% of such interest on the First Lien Notes, in such amount as specified by the Issuer, by increasing the principal amount of the outstanding First Lien Notes or, in limited circumstances as described in the First Lien Notes Indenture, by issuing additional First Lien Notes. As of December 31, 2023, the aggregate principal amount of the First Lien Notes of $595,966 recognized in the consolidated balance sheet reflects the election that was made by the Company to pay 4.50% of the first three interest payments (June 2023, December 2023 and June 2024) as payment-in-kind. Interest on the First Lien Notes is payable semi-annually in arrears on June 15 and December 15 of each year, and commenced on June 15, 2023.
The Issuer may, at its option, redeem all or part of the SeniorFirst Lien Notes at various points in time prior to maturity as describedat the prices set forth in the First Lien Notes Indenture. The Senior Notes mature on November 15, 2026. Interest on the Senior Notes is payable semi-annually in arrears in cash on May 15 and November 15 of each year.
Upon the occurrence of certain events constituting a Change of Control (as defined in the First Lien Notes Indenture), the Issuer will be required to make an offer to repurchase all of the SeniorFirst Lien Notes at a price equal to 101% of the principal amount thereof, plus accrued and unpaid interest, if any.any, to, but excluding, the repurchase date.
As of December 31, 2023, the Company had $8,184 of unamortized debt issuance costs and $337 of unamortized original issue discount related to the First Lien Notes, which are presented as direct deductions from the principal balance in the consolidated balance sheet. Both the debt issuance costs and the original issue discount are amortized into interest expense over the term of the First Lien Notes.
The First Lien Notes Indenture contains certain customary covenants that limit the Issuer’s and its restricted subsidiaries’ ability to, among other things, incur or guarantee additional indebtedness or issue certain preferred stock; incur liens on assets; pay dividends or make other distributions in respect of, or repurchase or redeem, its capital stock or make other restricted payments; sell assets; createprepay, redeem or incur liens;repurchase certain debt; make certain loans and investments; enter into saleagreements restricting certain subsidiaries’ ability to pay dividends; enter into transactions with affiliates; and lease-back transactions; andsell certain assets or merge or consolidate with or into other entities.companies. These covenants are subject to a number of important limitations and exceptions. The First Lien Notes Indenture also provides for customary events of default, which, if any occur, would permit or require the principal, premium, if any, interest and any other monetary obligations on all of the then-outstanding Seniorthen outstanding First Lien Notes to be due and payable immediately.
On the Settlement Date, the Issuer issued $357,446 aggregate principal amount of Third Lien Notes pursuant to an indenture, dated as of the Settlement Date (the “Third Lien Notes Indenture”), by and among the Issuer, the guarantors party thereto and U.S. Bank Trust Company, National Association, as trustee and collateral agent (the “Third Lien Collateral Agent”).
The Third Lien Notes are senior secured obligations of the Issuer and are guaranteed by Holdings, each of the Domestic Guarantors, and each of the Foreign Guarantors. The Third Lien Notes are guaranteed by Holdings and the Domestic Guarantors on a senior secured basis and by the Foreign Guarantors on a senior unsecured basis. The guarantees of the subsidiaries organized in France are limited guarantees.
The Third Lien Notes will mature on May 15, 2027. The Third Lien Notes bear interest at the rate of 5.625% per annum, payable in cash; provided, however, that for the first four interest periods after the Settlement Date, the Issuer has the option, in its sole discretion, to instead pay such interest at 10.625% per annum either by increasing the principal amount of the outstanding Third Lien Notes or, in limited circumstances as described the Third Lien Notes Indenture, by issuing additional Third Lien
NOTES TO CONSOLIDATED FINANCIAL STATEMENTS (Continued)
(Dollar amounts in thousands except per share and share amounts)
Notes. As of December 31, 2023, the aggregate principal amount of the Third Lien Notes of $386,681 recognized in the consolidated balance sheet reflects the election that was made by the Company to fully pay the first two interest payments (June 2023 and December 2023) on the Third Lien Notes as payment-in-kind. The Company has elected to pay the third interest payment, due June 15, 2024, on the Third Lien Notes in cash. Interest on the Third Lien Notes is payable semi-annually in arrears on June 15 and December 15 of each year, and commenced on June 15, 2023.
The Issuer may, at its option, redeem all or part of the Third Lien Notes prior to maturity at the prices set forth in the Third Lien Notes Indenture. Upon the occurrence of certain events constituting a Change of Control (as defined in the Third Lien Notes Indenture), the Issuer will be required to make an offer to repurchase all of the Third Lien Notes at a price equal to 101% of the principal amount thereof, plus accrued and unpaid interest, if any, to, but excluding, the repurchase date.
Debt issuance costs related to the Third Lien Notes are amortized into interest expense over the term of the Third Lien Notes. As of December 31, 2023, the Company had $5,087 of unamortized debt issuance costs related to the Third Lien Notes, which are presented as a direct deduction from the principal balance in the consolidated balance sheet.
The Third Lien Notes Indenture contains certain customary covenants that limit the Issuer’s and its restricted subsidiaries’ ability to, among other things, incur or guarantee additional indebtedness or issue certain preferred stock; incur liens on assets; pay dividends or make other distributions in respect of, or repurchase or redeem, its capital stock or make other restricted payments; prepay, redeem or repurchase certain debt; make certain loans and investments; enter into agreements restricting certain subsidiaries’ ability to pay dividends; enter into transactions with affiliates; and sell certain assets or merge or consolidate with or into other companies. These covenants are subject to a number of important limitations and exceptions. The Third Lien Notes Indenture also provides for customary events of default, which, if any occur, would permit or require the principal, premium, if any, interest and any other monetary obligations on all of the then outstanding Third Lien Notes to be due and payable immediately.
In connection with the issuance of the New Notes, the First Lien Collateral Agent, the Third Lien Collateral Agent, the collateral agent under the ABL Facility (the “ABL Facility Collateral Agent”), the Issuer, Holdings and the several other parties named therein entered into the First Lien and Third Lien Intercreditor Agreement, providing for the relative priorities of their respective security interests in the assets securing the First Lien Notes, the Third Lien Notes and the ABL Facility, and certain other matters relating to the administration of security interests.
2026 Senior Notes
On November 2, 2016, the Issuer issued $400,000 aggregate principal amount of 2026 Senior Notes. On the Settlement Date, in connection with the Refinancing Transactions, the Issuer completed the Exchange Offer and delivered $357,446 aggregate principal amount of the exchanged 2026 Senior Notes to the trustee for cancellation. Following the completion of the Exchange Offer, $42,554 aggregate principal amount of the 2026 Senior Notes remain outstanding.
Following receipt of the requisite consents in the Consent Solicitation, on January 20, 2023, the Issuer, the guarantors named therein and U.S. Bank Trust Company, National Association (successor in interest to U.S. Bank National Association), as trustee, entered into a supplemental indenture to the indenture governing the 2026 Senior Notes, which became effective on the Settlement Date. The supplemental indenture provides for the elimination of substantially all of the covenants, certain events of default and certain other provisions contained in the 2026 Senior Notes and the indenture governing the 2026 Senior Notes and released and discharged the guarantee of the 2026 Senior Notes by the Company.
The 2026 Senior Notes are guaranteed by each of the Issuer’s wholly-owned existing or subsequently organized U.S. subsidiaries, subject to certain exceptions, to the extent such subsidiary guarantees the ABL Facility. The Issuer may, at its option, redeem all or part of the 2026 Senior Notes at various points in time prior to maturity, as described in the indenture governing the 2026 Senior Notes. The 2026 Senior Notes will mature on November 15, 2026. Interest on the 2026 Senior Notes is payable semi-annually in arrears in cash on May 15 and November 15 of each year.
The Company paid approximately $7,055 of debt issuance costs in connection with the transaction.issuance of the 2026 Senior Notes. The debt issuance costs are being amortized into interest expense over the term of the 2026 Senior Notes. As of December 31, 20202023 and 2019,2022, the Company had $4,171$216 and $4,886,$2,741, respectively, of unamortized debt issuance costs related to the 2026 Senior Notes, which is classifiedpresented as a discountdirect deduction from the principal balance in the consolidated balance sheet.sheets.
13.0%2024 Senior Secured Notes due 2024
On May 29, 2020, Cooper Standard Automotive Inc. (the “Issuer”), a wholly-owned subsidiary of the Company,Issuer issued $250,000 aggregate principal amount of its 13.0%13.000% Senior Secured Notes due 2024 (the “Senior“2024 Senior Secured Notes”), pursuant to the Indenture,an indenture, dated as of May 29, 2020, (the “Indenture”), by and among the Issuer, the other guarantors party thereto and U.S. Bank National Association, as trustee,trustee. In the first quarter of 2023, in a transaction exempt from registration under Rule 144Aconnection with the
NOTES TO CONSOLIDATED FINANCIAL STATEMENTS (Continued)
(Dollar amounts in thousands except per share and Regulation Sshare amounts)
Refinancing Transactions, the Issuer redeemed all of the Securities Act of 1933. Proceeds from theoutstanding 2024 Senior Secured Notes were used to provide additional liquidity foron the Company, as a resultSettlement Date at the redemption price of uncertainty from the COVID-19 pandemic.
The Senior Secured Notes are guaranteed on a senior secured basis by CS Intermediate HoldCo 1 LLC and each106.500% of the Issuer’s presentprincipal amount thereof, plus accrued and future subsidiaries that are obligors or guarantee the Term Loan Facility and each of the Issuer’s wholly owned domestic subsidiaries that are obligors under, or guarantee, certain other indebtedness, subject to certain exceptions. The notes are also guaranteed on a senior unsecured basis by Cooper-Standard Latin America B.V.
The Issuer may redeem all or part of the Senior Secured Notes prior to maturity at the prices set forth in the Indenture. The Senior Secured Notes mature on June 1, 2024. Interest on the Senior Secured Notes is payable semi-annually in arrears in cash on June 1 and December 1 of each year, commencing on December 1, 2020.
The Indenture contains certain covenants that limit the Issuer’s and its subsidiaries’ ability to, among other things, incur or guarantee additional indebtedness or issue certain preferred stock; make restricted payments; sell assets; create or incur liens; and merge or consolidate with other entities. These covenants are subject to a number of important limitations and exceptions. The Indenture also provides for customary events of default for non-investment grade debt securities, which, if any occur, would permit or require the principal,unpaid interest and any other monetary obligations on all the then-outstanding Senior Secured Notes to be due and payable immediately.thereon.
The Company paid approximately $6,431 of debt issuance costs in connection with the transaction.issuance of the 2024 Senior Secured Notes. Additionally, the 2024 Senior Secured Notes were issued at a discount of $5,000. As of December 31, 2020,2022, the Company had $5,828$3,021 of unamortized debt issuance costs and $4,605$2,508 of unamortized original issue discount related to the 2024 Senior Secured Notes, which arewere presented as direct deductions from the principal balance in the condensed consolidated balance sheets.sheet. Both the debt issuance costs and the original issue discount arewere amortized into interest expense over the term of the 2024 Senior Secured Notes.
ABL Facility
On November 2, 2016, CS Intermediate Holdco 1 LLC (“Parent”), CSA U.S.Holdings, Cooper-Standard Automotive Inc. (the “U.S. Borrower”), Cooper-Standard Automotive Canada Limited (the “Canadian Borrower”), Cooper-Standard Automotive International Holdings B.V. (the “Dutch Borrower”, and, together with the U.S. Borrower and the Canadian Borrower, the “Borrowers”) and certain subsidiaries of the U.S. Borrower, entered into a $210,000 Third Amendedthird amendment and Restated Loan Agreement with certain lenders, subject to borrowing base availability.restatement of the ABL Facility. In March 2020, the CompanyBorrowers entered into the First Amendment ofNo. 1 to the Third Amended and Restated Loan Agreement (“the First Amendment”). As a result of the First Amendment, the senior asset-based revolving credit facility (“ABL Facility”)Facility maturity was extended to March 2025 and the aggregate revolving loan commitment was reduced to $180,000. In May 2020, the Borrowers entered into Amendment No. 2 to the Third Amended and Restated Loan Agreement (the “Second Amendment”), which Second Amendment modified certain covenants under the ABL Facility. In December 2022, the Borrowers entered into Amendment No. 3 to the Third Amended and Restated Loan Agreement (the “Third Amendment”), which became effective on the Settlement Date. The Third Amendment provides for the ABL Facility to be amended to:
•permit the U.S. Borrower to issue the New Notes in the Concurrent Notes Offering and Exchange Offer, including the granting of liens, subject to the restrictions set forth in the ABL Facility;
•provide for certain of the U.S. Borrower’s wholly-owned subsidiaries organized in Costa Rica, France, Mexico, the Netherlands, Romania and certain other jurisdictions specified from time to time to become guarantors under the ABL Facility;
•authorize the ABL Facility Collateral Agent to enter into an intercreditor agreement with the collateral trustees for the New Notes; and
•remove the Dutch Borrower as a borrower under the ABL Facility.
The aggregate revolving loan availability includes a $100,000 letter of credit sub-facility and a $25,000 swing line sub-facility. The ABL Facility also provides for an uncommitted $100,000 incremental loan facility, for a potential total ABL Facility of $280,000 (if requested by the Borrowers and the lenders agree to fund such increase). No consent of any lender (other than those participating in the increase) is required to effect any such increase. As of December 31, 2020, there were no obligations outstanding under the ABL Facility. The Company’s borrowing base as of December 31, 2023 was $173,745. Net$169,543 and the greater of 10% of the borrowing base or $15,000 that cannot be borrowed without triggering themonthly fixed charge coverage ratio maintenance covenant and $5,517was at a level that provided the Company full access to the borrowing base. Net of $7,110 of outstanding letters of credit, the Company effectively had $150,854$162,433 available for borrowing under its ABL facility.Facility.
As of December 31, 2023 and December 31, 2022, there were no borrowings under the ABL Facility.
Maturity. Any borrowings then outstanding under our ABL Facility will mature, and the commitments of the lenders under our ABL Facility will terminate, on March 24, 2025.
Borrowing Base. LoanAs of the Settlement Date, the loan and letter of credit availability under the ABL Facility is subject to a borrowing base, which at any time is limited to the lesser of: (A) the maximum facility amount (subject to certain adjustments) and (B) (i) up to 85% of eligible accounts receivable; plus (ii) the lesser of 70% of eligible inventory or 85% of the appraised net orderly liquidation value of eligible inventory; plus (iii) up to the lesser of $30.0 million$30,000 and 85% of eligible tooling accounts receivable; minus reserves established by the ABL Facility Collateral Agent. The accounts receivable portion of the borrowing base is subject to certain formulaic limitations
NOTES TO CONSOLIDATED FINANCIAL STATEMENTS (Continued)
(Dollar amounts in thousands except per share and share amounts)
(including (including concentration limits). The inventory portion of the borrowing base is limited to eligible inventory, as determined by the ABL Facility Collateral Agent. The borrowing base is also subject to certain reserves, which are established by the ABL Facility Collateral Agent (which may include changes to the advance rates indicated above). Loan availability under the ABL Facility is apportioned as follows: $180,000$160,000 to the U.S. Borrower, which includes a $40,000 sublimit to the Dutch Borrower and $20,000 to the Canadian Borrower.
Guarantees; Security. The obligations of the U.S. Borrower the Canadian Borrower and the DutchCanadian Borrower under the ABL Facility, as well as certain cash management arrangements and interest rate, foreign currency or commodity swaps entered into by the such Borrowers and their subsidiaries, and certain credit lines entered into by non-U.S. subsidiaries, in each case with the lenders and their affiliates (collectively, “Additional ABL Secured Obligations”) are guaranteed on a senior secured basis by the CompanyHoldings and
NOTES TO CONSOLIDATED FINANCIAL STATEMENTS (Continued)
(Dollar amounts in thousands except per share and share amounts)
its U.S. subsidiaries (with certain exceptions), and certain wholly-owned subsidiaries organized in Costa Rica, France, Mexico, the Netherlands, Romania and certain other jurisdictions specified from time to time, and the obligations of the Canadian Borrower under the ABL Facility and Additional ABL Secured Obligations of the Canadian Borrower and its Canadian subsidiaries are, in addition, guaranteed on a senior secured basis by the Canadian subsidiaries of the Canadian Borrower. The obligations under the ABL Facility and related guarantees are secured by (1) a first priority lien on all of each Borrower’s and each U.S. and Canadian guarantor’s existing and future personal property consisting of certain accounts receivable, payment intangibles, inventory, documents, instruments, chattel paper, and investment property, certain money, deposit accounts and securities accounts and certain related assets and proceeds of the foregoing, with various enumerated exceptions, including that: (i) the collateral owned by Canadian Borrower or any of its Canadian subsidiaries that are Guarantors only secure the obligations of Canadian Borrower and such subsidiaries arising under the ABL Facility and Additional ABL Secured Obligations and (ii) no liens have been granted on any assets or properties of the Dutch Borrower or any other non-U.S. subsidiaries of the Company (other than the Canadian Borrower and Canadian Guarantors, as otherwise specified above) in connection with the ABL Facility, and (2) a second priority lien on all the capital stock in restricted subsidiaries directly held by the U.S. Borrower and each of the U.S. Guarantors,guarantors, and equipment of the U.S. Borrower and the U.S.-domiciled guarantors and all other material personal property of the U.S. Borrower and the U.S.-domiciled guarantors.guarantors and (3) a 65% pledge of the equity interest in the first-tier foreign subsidiaries of the U.S. Guarantors.
Interest. Borrowings under the ABL Facility bear interest at a rate equal to, at the Borrowers’ option:
•in the case of borrowings by the U.S. Borrower, LIBORthe forward-looking secured overnight funding rate for the applicable interest period (“Term SOFR”) (including a credit spread adjustment of 0.11448% or 0.26161%, depending on the applicable interest period) or the base rate plus, in each case, an applicable margin; or
•in the case of borrowings by the Canadian Borrower, bankers’ acceptance (“BA”) rate, Canadian prime rate or Canadian base rate plus, in each case, an applicable margin; or
•in the case of borrowings by the Dutch Borrower, LIBOR plus an applicable margin.
The initial applicable margin was 1.50% with respect to the LIBOR or Canadian BA rate-based borrowings and 0.50% with respect to U.S. base rate, Canadian prime rate and Canadian base rate borrowings, until April 1, 2020. The applicable margin may vary between 1.50%2.00% and 2.00%2.50% with respect to the LIBORTerm SOFR or Canadian BA rate-based borrowings and between 0.50%1.00% and 1.00%1.50% with respect to U.S. base rate, Canadian prime rate and Canadian base rate borrowings. The applicable margin is subject, in each case, to quarterly pricing adjustments (based on average facility availability).
Fees. The Borrowers are required to pay a fee in respect of committed but unutilized commitments. The ABL Facility also requires the payment of customary agency and administrative fees.
Voluntary Prepayments. The Borrowers are able to voluntarily reduce the unutilized portion of the commitment amount and repay outstanding loans, in each case, in whole or in part, at any time without premium or penalty (other than customary breakage and related reemployment costs with respect to repayments of LIBOR-basedSOFR-based borrowings).
Covenants; Events of Default. The ABL Facility includes affirmative and negative covenants that will impose substantial restrictions on the Company’s financial and business operations, including its ability to incur and secure debt, make investments, sell assets, pay dividends or make acquisitions. The ABL Facility also includes a requirement to maintain a monthly fixed charge coverage ratio of no less than 1.0 to 1.0 when availability under the ABL Facility is less than specified levels. As of December 31, 2023, availability under the ABL Facility was at a level that did not trigger this requirement. The ABL Facility also contains various events of default that are customary for comparable facilities.
Debt Issuance Costs. As of December 31, 20202023 and 2019,2022, the Company had $1,029$862 and $657,$535, respectively, of unamortized debt issuance costs related to the ABL Facility.
Term Loan Facility
On November 2, 2016, CSA U.S.Cooper-Standard Automotive Inc., as borrower, entered into Amendment No. 1 to the Termits senior term loan facility (the “Term Loan Facility,Facility”), which providesprovided for loans in an aggregate principal amount of $340,000. Subject to certain conditions, the Term Loan Facility, without the consent of the then-existing lenders (but subject to the receipt of commitments), may becould have been expanded (or a new term loan or revolving facility added) by an amount that willwould not cause the consolidated secured net debt ratio to exceed 2.25 to 1.00 plus $400,000 plus any voluntary prepayments (including revolving facility and ABL Facility to the extent commitments are reduced) not funded from proceeds of long-term indebtedness.
NOTES TO CONSOLIDATED FINANCIAL STATEMENTS (Continued)
(Dollar amounts in thousands except per share and share amounts)
On May 2, 2017, the Company entered into Amendment No. 2 to the Term Loan Facility to modify the interest rate. Subsequently, on March 6, 2018, the Company entered into Amendment No. 3 to the Term Loan Facility to further modify the interest rate. In accordance with this amendment, borrowings under the Term Loan Facility bearbore interest, at the Company’s option, at either (1) with respect to Eurodollar rate loans, the greater of the applicable Eurodollar rate and 0.75% plus 2.00% per annum, or (2) with respect to base rate loans, the base rate, (which is the highest of the then current federal funds rate plus
NOTES TO CONSOLIDATED FINANCIAL STATEMENTS (Continued)
(Dollar amounts in thousands except per share and share amounts)
0.50%, the prime rate most recently announced by the administrative agent under the term loan, and the one-month Eurodollar rate plus 1.0%) plus 1.0% per annum. As a result of Amendment No. 3, the Company recognized a loss on refinancing and extinguishment of debt of $770 in the twelve months ended December 31, 2018, which was due to the partial write off of new and unamortized debt issuance costs and unamortized original issue discount
Maturity. The Term Loan Facility matureswould have matured on November 2, 2023, unless earlier terminated.2023.
GuaranteesVoluntary Prepayment.. All obligations of In connection with the borrower underRefinancing Transactions, Cooper-Standard Automotive Inc. repaid the Term Loan Facility are guaranteed jointlyin full on the Settlement Date and severally on a senior secured basis by the direct parent company of the borrower and each existing and subsequently acquired or organized direct or indirect wholly owned U.S. restricted subsidiary of the borrower.
Security. The obligations under the Term Loan Facility are secured by (a) a first priority security interest (subject to permitted liens and other customary exceptions) on (i) all the capital stock in restricted subsidiaries directly held by the borrower and each of the guarantors, (ii) substantially all plant, material owned real property located in the U.S. and equipment of the borrower and the guarantors and (iii) all other personal property of the borrower and the guarantors, including, without limitation, accounts and investment property, contracts, patents, copyrights, trademarks, other general intangibles, intercompany notes and proceeds of the foregoing, and (b) a second priority security interest (subject to permitted liens and other customary exceptions) in accounts receivable of the borrowers and the guarantors arising from the sale of goods and services, inventory, tax refunds, cash, deposit accounts and books and records related to the foregoing and, in each case, proceeds thereof, in each case, excluding certain collateral and subject to certain limitations.
Interest. Borrowings under the Term Loan Facility bear interest, at the Company’s option, at either (1) with respect to Eurodollar rate loans, the greater of the applicable Eurodollar rate and 0.75%, plus 2.00% per annum, or (2) with respect to base rate loans, the base rate (which is the highest of the then-current federal funds rate plus 0.50%, the prime rate most recently announced by the administrative agent under the term loan, and the one-month Eurodollar rate plus 1.0%), plus 1.0% per annum.
Voluntary Prepayments. The borrower may voluntarily prepay loans in whole or in part, with prior notice and without premium or penalty, subject to the actual LIBOR breakage costs, payment of accrued and unpaid interest, and customary limitations as to minimum amounts of prepayments.
Covenants. The Term Loan Facility contains incurrence-based negative covenants customary for high yield senior secured debt securities, including, but not limited to, restrictions on the ability of the borrower and its restricted subsidiaries to merge and consolidate with other companies, incur indebtedness, grant liens or security interests on assets, pay dividends or make other restricted payments, sell or otherwise transfer assets, or enter into transactions with affiliates. These negative covenants are subject to exceptions, qualifications and certain carveouts.
Events of Default. The Term Loan Facility provides that, upon the occurrence of certain events of default, obligations thereunder may be accelerated. Such events of default include payment defaults to the lenders, material inaccuracies of representations and warranties, covenant defaults, cross-defaults to other material indebtedness, voluntary and involuntary bankruptcy proceedings, material money judgments, material pension-plan events, certain change of control events and other customary events of default.was terminated.
Debt Issuance Costs. As of December 31, 2020 and 2019,2022, the Company had $1,680 and $2,273, respectively,$494 of unamortized debt issuance costs and $1,084 and $1,466, respectively,$319 of unamortized original issue discount related to the Term Loan Facility. Both the debt issuance costs and the original issue discount arewere amortized into interest expense over the term of the Term Loan Facility.
Debt Covenants
The Company was in compliance with all applicable covenants of the ABL Facility, Term Loan Facility,New Notes, the 2026 Senior Notes, and Senior Secured Notes,ABL Facility as of December 31, 2020.2023.
Other Financing
Finance leases and other.Other borrowings as of December 31, 20202023 and 20192022 reflect finance leases and other borrowings under local bank lines classified in debt payable within one year onin the consolidated balance sheet.sheets.
Receivables factoring. As a part of its working capital management, the Company sells certain receivables through a single third-party financial institution (the “Factor”) in a pan-European program. The amount sold varies each month based on the amount of underlying receivables and cash flow needs of the Company. These are permitted transactions under the Company’s credit agreements governing the ABL Facility and the indentures governing the New Notes and 2026 Secured Notes. The European factoring facility allows the Company to factor up to €70 million of its Euro-denominated accounts receivable, accelerating access to cash and reducing credit risk. The factoring facility expires on December 31, 2026.
Costs incurred on the sale of receivables are recorded in other expense, net in the consolidated statements of operations. The sale of receivables under this contract is considered an off-balance sheet arrangement to the Company and is accounted for as a true sale and is excluded from accounts receivable in the consolidated balance sheets. Amounts outstanding under receivable transfer agreements entered into by various locations as of the period end were as follows:
| | | | | | | | | | | |
| December 31, 2023 | | December 31, 2022 |
| Off-balance sheet arrangements | $ | 47,903 | | | $ | 52,491 | |
| | | |
Accounts receivable factored and related costs throughout the period were as follows:
| | | | | | | | | | | | | | | |
| Off-Balance Sheet Arrangements | | |
| Year Ended December 31, | | |
| 2023 | | 2022 | | | | |
| Accounts receivable factored | $ | 420,119 | | | $ | 355,295 | | | | | |
| | | | | | | | | | | | | | | | | | | | | | | |
| Off-Balance Sheet Arrangements | | |
| Year Ended December 31, | | |
| 2023 | | 2022 | | 2021 | | | | | | |
| Costs | $ | 2,226 | | | $ | 710 | | | $ | 528 | | | | | | | |
As of December 31, 2023 and 2022, cash collections on behalf of the Factor that had yet to be remitted were $6,466 and $3,772, respectively, and are reflected in other current assets as restricted cash in the consolidated balance sheets.
NOTES TO CONSOLIDATED FINANCIAL STATEMENTS (Continued)
(Dollar amounts in thousands except per share and share amounts)
12.11. Fair Value Measurements and Financial Instruments
Fair Value Measurements
Fair value is defined as an exit price, representing the amount that would be received to sell an asset or paid to transfer a liability in an orderly transaction between market participants. As such, fair value is a market-based measurement that should be determined based upon assumptions that market participants would use in pricing an asset or liability. As a basis for considering such assumptions, a three-tier fair value hierarchy is utilized, which prioritizes the inputs used in measuring fair value as follows:
| | | | | |
| Level 1: | Observable inputs such as quoted prices in active markets; |
| Level 2: | Inputs, other than quoted prices in active markets, that are observable either directly or indirectly; and |
| Level 3: | Unobservable inputs in which there is little or no market data, which require the reporting entity to develop its own assumptions. |
Items Measured at Fair Value on a Recurring Basis
Estimates of the fair value of foreign currency and interest rate derivative instruments are determined using exchange traded prices and rates. The Company also considers the risk of non-performance in the estimation of fair value and includes an adjustment for non-performance risk in the measure of fair value of derivative instruments. In certain instances where market data is not available, the Company uses management judgment to develop assumptions that are used to determine fair value. Fair value measurements and the fair value hierarchy level for the Company’s assets and liabilities measured or disclosed at fair value on a recurring basis as of December 31, 20202023 and 2019,2022, was as follows:
| | | | | | | | | | | | | | | | | | | | |
| | December 31, 2020 | | December 31, 2019 | | Input |
| Forward foreign exchange contracts - other current assets | | $ | 1,826 | | | $ | 467 | | | Level 2 |
| | | | | | |
| Forward foreign exchange contracts - accrued liabilities | | $ | (750) | | | $ | (42) | | | Level 2 |
| | | | | | |
| | | | | | |
| | | | | | |
| | | | | | |
| | | | | | | | | | | | | | | | | | | | |
| | December 31, 2023 | | December 31, 2022 | | Input |
| Forward foreign exchange contracts - other current assets | | $ | 1,285 | | | $ | 8,643 | | | Level 2 |
| | | | | | |
| Forward foreign exchange contracts - accrued liabilities | | $ | (998) | | | $ | — | | | Level 2 |
| | | | | | |
| | | | | | |
| | | | | | |
| | | | | | |
Items Measured at Fair Value on a Nonrecurring Basis
In addition to items that are measured at fair value on a recurring basis, the Company measures certain assets and liabilities at fair value on a nonrecurring basis, which are not included in the table above. As these nonrecurring fair value measurements are generally determined using unobservable inputs, these fair value measurements are classified within Level 3 of the fair value hierarchy. For furtheradditional information on assets and liabilities measured at fair value on a nonrecurring basis see Note 2. “Basis of Presentation and Summary of Significant Accounting Policies,”Policies”, Note 4. “Acquisitions”“Divestitures and Deconsolidations”, Note 5. “Divestitures”8. “Property, Plant and Equipment”, and Note 9. “Property, Plant“Goodwill and Equipment.”Intangible Assets”.
Items Not Carried at Fair Value
Fair values of the Company’s New Notes, 2026 Senior Notes, 2024 Senior Secured Notes, and Term Loan Facility were as follows:
| | | | | | | | | | | |
| December 31, 2020 | | December 31, 2019 |
| Aggregate fair value | $ | 965,052 | | | $ | 693,600 | |
Aggregate carrying value (1) | $ | 976,400 | | | $ | 729,800 | |
| | | | | | | | | | | | | | |
| | December 31, 2023 | | December 31, 2022 |
| Aggregate fair value | | $ | 984,448 | | | $ | 744,010 | |
Aggregate carrying value (1) | | $ | 1,038,808 | | | $ | 969,600 | |
(1) Excludes unamortized debt issuance costs and unamortized original issue discount.
Fair values were based on quoted market prices and are classified within Level 1 of the fair value hierarchy.
Derivative Instruments and Hedging Activities
The Company is exposed to fluctuations in foreign currency exchange rates, interest rates and commodity prices. The Company enters into derivative instruments primarily to hedge portions of its forecasted foreign currency denominated cash flows and designates these derivative instruments as cash flow hedges in order to qualify for hedge accounting.
The Company formally documents its hedge relationships, including the identification of the hedging instruments and the hedged items, as well as its risk management objectives and strategies for undertaking the cash flow hedges. The Company also formally assesses whether a cash flow hedge is highly effective in offsetting changes in the cash flows of the hedged item. Derivatives are recorded at fair value in other current assets, other assets, accrued liabilities and other long-term liabilities. For a cash flow hedge, the effective portion of the change in fair value of the derivative is recorded in accumulated other comprehensive income (loss) (“AOCI”) in the consolidated balance sheet, to the extent that the hedges are effective, and reclassified into earnings when the underlying hedged transaction is realized. The realized gains and losses are recorded on the same line as the hedged transaction
NOTES TO CONSOLIDATED FINANCIAL STATEMENTS (Continued)
(Dollar amounts in thousands except per share and share amounts)
hedged transaction is realized. The realized gains and losses are recorded on the same line as the hedged transaction in the consolidated statements of operations. Cash flows from derivatives used to manage foreign exchange risks designated as cash flow hedges are classified as operating activities within the consolidated statements of cash flows.
The Company is exposed to credit risk in the event of nonperformance by its counterparties on its derivative financial instruments. The Company mitigates this credit risk exposure by entering into agreements directly with major financial institutions with high credit standards that are expected to fully satisfy their obligations under the contracts.
Cash Flow Hedges
Forward Foreign Exchange ContractsContracts. – The Company uses forward contracts to mitigate the potential volatility to earnings and cash flow arising from changes in currency exchange rates that impact the Company’s foreign currency transactions. The principal currencies hedged by the Company include various European currencies, the Canadian Dollar, and the Mexican Peso, and the Brazilian Real.Peso. As of December 31, 20202023 and 2019,2022, the notional amount of these contracts was $97,503$207,131 and $92,150,$135,285, respectively, and consisted of hedges of transactions up to December 2021.2024.
Pretax amounts related to the Company’s cash flow hedges that were recognized in other comprehensive income (loss) (“OCI”) were as follows:
| | | | | | | | | | | |
| Gain (Loss) Recognized in OCI |
| Year Ended December 31, |
| 2020 | | 2019 |
| Forward foreign exchange contracts | $ | (6,280) | | | $ | 3,812 | |
| | | |
| | | |
| | | | | | | | | | | |
| Gain Recognized in OCI |
| Year Ended December 31, |
| 2023 | | 2022 |
| Forward foreign exchange contracts | $ | 10,202 | | | $ | 11,808 | |
| | | |
| | | |
Pretax amounts related to the Company’s cash flow hedges that were reclassified from AOCI and recognized in cost of products sold were as follows:
| | | | | | | | | | | | | | | | | |
| | | Gain (Loss) Reclassified from AOCI to Income |
| | | Year Ended December 31, |
| Classification | | 2020 | | 2019 |
| Forward foreign exchange contracts | Cost of products sold | | $ | (6,945) | | | $ | 2,773 | |
| | | | | |
| | | | | |
| | | | | | | | | | | |
| Gain Reclassified from AOCI to Income |
| Year Ended December 31, |
| 2023 | | 2022 |
| Forward foreign exchange contracts | $ | 18,550 | | | $ | 2,287 | |
| | | |
| | | |
13. Accounts Receivable Factoring
As a part of its working capital management, the Company sells certain receivables through a third-party financial institution in a pan-European program (the “Factor”). The amount sold varies each month based on the amount of underlying receivables and cash flow needs of the Company. These are permitted transactions under the Company’s credit agreements governing the ABL Facility and Term Loan Facility and the indentures governing the Senior Notes and Senior Secured Notes. The European factoring facility, which was renewed in March 2020, allows the Company to factor up to €120 million of its Euro-denominated accounts receivable, accelerating access to cash and reducing credit risk. The factoring facility expires in December 2023.
Costs incurred on the sale of receivables are recorded in other expense, net in the consolidated statements of operations. Liabilities related to the factoring program are recorded in accrued liabilities in the consolidated balance sheet. The sale of receivables under this contract is considered an off-balance sheet arrangement to the Company and is accounted for as a true sale and excluded from accounts receivable in the consolidated balance sheet.
Amounts outstanding under receivable transfer agreements entered into by various locations as of the period end were as follows:
| | | | | | | | | | | |
| December 31, 2020 | | December 31, 2019 |
| Off-balance sheet arrangements | $ | 85,108 | | | $ | 103,818 | |
| | | |
NOTES TO CONSOLIDATED FINANCIAL STATEMENTS (Continued)
(Dollar amounts in thousands except per share and share amounts)
Accounts receivable factored and related costs throughout the period were as follows:
| | | | | | | | | | | | | | | |
| Off-Balance Sheet Arrangements | | |
| Year Ended December 31, | | |
| 2020 | | 2019 | | | | |
| Accounts receivable factored | $ | 476,405 | | | $ | 556,102 | | | | | |
| | | | | | | | | | | | | | | | | | | | | | | |
| Off-Balance Sheet Arrangements | | |
| Year Ended December 31, | | |
| 2020 | | 2019 | | 2018 | | | | | | |
| Costs | $ | 776 | | | $ | 1,007 | | | $ | 1,248 | | | | | | | |
During 2020, the Factor changed to an alternative remittance and settlement process provided for under the factoring agreement, which resulted in the Company having lower amounts due to the Factor. As of December 31, 2020, cash collections on behalf of the Factor that had yet to be remitted were $1,786 and are reflected in other current assets as restricted cash in the consolidated balance sheet. As of December 31, 2019, cash collections on behalf of the Factor that had yet to be remitted were $21,485 and are reflected in cash and cash equivalents in the consolidated balance sheet.
14.12. Pension
The Company maintains defined benefit pension plans covering certain employees located in the United States as well as certain international locations. The majority of these plans are frozen, and all are closed to new employees. Benefits generally are based on compensation, length of service and age for salaried employees and on length of service for hourly employees. The Company’s policy is to fund pension plans such that sufficient assets will be available to meet future benefit requirements and contribute amounts deductible for United States federal income tax purposes or amounts required by local statute.
The Company also sponsors voluntary defined contribution plans forPension Plan Termination
On October 11, 2022, the Company’s Board of Directors (the “Board”) approved a resolution to merge certain salaried and hourly U.S. employees of the Company.Company’s U.S. defined benefit pension plans and terminate the resulting merged plan (“U.S. Pension Plan”) effective December 31, 2022. The Company matches contributionstermination of participants, upthe U.S. Pension Plan is expected to various limits in all plans. The Company also sponsors retirement plans that include Company non-elective contributions. Non-elective and matching contributions under these plans totaled $13,537, $14,514 and $16,076 forbe completed during the yearsyear ended December 31, 2020, 20192024. As part of the termination process, the Company expects to settle benefit obligations under the U.S. Pension Plan through a combination of lump sum payments to eligible plan participants and 2018, respectively.the purchase of a group annuity contract, under which future benefit obligations and administration will be transferred to a third-party insurance company. Such settlements are being funded primarily from plan assets. In the fourth quarter of 2023, the Company paid $48,553 of lump sum payments to eligible participants from plan assets, resulting in a settlement loss of $16,285 during the year ended December 31, 2023. Ultimate settlement of the remaining benefit obligations is dependent upon market conditions at the time of settlement. The Company recognized a curtailment loss of $3,092 during the year ended December 31, 2022 associated with the planned termination of the U.S. Pension Plan, primarily due to prior service cost resulting from a 2022 plan amendment impacting the benefits of certain participants in the U.S. Pension Plan. The U.S. Pension Plan was underfunded by $3,948 as of December 31, 2023 and underfunded by $5,759 as of December 31, 2022 under U.S. generally accepted accounting principles.
NOTES TO CONSOLIDATED FINANCIAL STATEMENTS (Continued)
(Dollar amounts in thousands except per share and share amounts)
Pension Plan Funded Status Reconciliation
Information related to the Company’s defined benefit pension plans was as follows: | | | | | | | | | | | | | | | | | | | | | | | |
| | Year Ended December 31, |
| | 2023 | | 2022 |
| | U.S. | | Non-U.S. | | U.S. | | Non-U.S. |
| Change in projected benefit obligations: | | | | | | | |
| Projected benefit obligations at beginning of period | $ | 212,688 | | | $ | 116,653 | | | $ | 257,108 | | | $ | 164,957 | |
| Service cost | — | | | 2,161 | | | 771 | | | 2,755 | |
| Interest cost | 9,254 | | | 5,198 | | | 7,062 | | | 2,782 | |
| Net actuarial (gain) loss | (112) | | | 5,876 | | | (41,026) | | | (34,354) | |
| Benefits paid | (11,464) | | | (5,633) | | | (14,283) | | | (5,535) | |
| Foreign exchange translation | — | | | 4,417 | | | — | | | (10,012) | |
| Settlements | (48,553) | | | (1,935) | | | — | | | (1,760) | |
| | | | | | | |
| Plan amendments | — | | | — | | | 3,056 | | | — | |
| Other | — | | | 58 | | | — | | | (2,180) | |
| Projected benefit obligations at end of period | $ | 161,813 | | | $ | 126,795 | | | $ | 212,688 | | | $ | 116,653 | |
| | | | | | | |
| Change in plan assets: | | | | | | | |
| Fair value of plan assets at beginning of period | $ | 196,434 | | | $ | 32,811 | | | $ | 273,448 | | | $ | 48,047 | |
| Actual return on plan assets | 10,004 | | | 3,013 | | | (63,769) | | | (9,774) | |
| Employer contributions | 1,036 | | | 5,523 | | | 1,038 | | | 4,970 | |
| Benefits paid | (11,464) | | | (5,633) | | | (14,283) | | | (5,535) | |
| Foreign exchange translation | — | | | 771 | | | — | | | (3,138) | |
| Settlements | (48,553) | | | (1,935) | | | — | | | (1,759) | |
| | | | | | | |
| | | | | | | |
| Fair value of plan assets at end of period | $ | 147,457 | | | $ | 34,550 | | | $ | 196,434 | | | $ | 32,811 | |
| | | | | | | |
| Funded status of the plans | $ | (14,356) | | | $ | (92,245) | | | $ | (16,254) | | | $ | (83,842) | |
| | | | | | | | | | | | | | | | | | | | | | | |
| | Year Ended December 31, |
| | 2020 | | 2019 |
| | U.S. | | Non-U.S. | | U.S. | | Non-U.S. |
| Change in projected benefit obligations: | | | | | | | |
| Projected benefit obligations at beginning of period | $ | 255,935 | | | $ | 184,364 | | | $ | 288,223 | | | $ | 183,850 | |
| Service cost | 853 | | | 3,992 | | | 809 | | | 3,893 | |
| Interest cost | 8,132 | | | 3,200 | | | 10,955 | | | 4,037 | |
| Net actuarial loss | 19,755 | | | 8,704 | | | 28,771 | | | 17,756 | |
| Benefits paid | (13,278) | | | (6,925) | | | (14,625) | | | (6,038) | |
| Foreign exchange translation | 0 | | | 11,582 | | | 0 | | | 11 | |
| Settlements | 0 | | | (5,170) | | | (58,198) | | | (2,263) | |
| Divestiture | 0 | | | (4,392) | | | 0 | | | (16,953) | |
| Other | 0 | | | 52 | | | 0 | | | 71 | |
| Projected benefit obligations at end of period | $ | 271,397 | | | $ | 195,407 | | | $ | 255,935 | | | $ | 184,364 | |
| | | | | | | |
| Change in plan assets: | | | | | | | |
| Fair value of plan assets at beginning of period | $ | 244,613 | | | $ | 54,806 | | | $ | 265,019 | | | $ | 47,692 | |
| Actual return on plan assets | 34,971 | | | 5,313 | | | 50,488 | | | 6,948 | |
| Employer contributions | 1,037 | | | 5,673 | | | 1,929 | | | 6,646 | |
| Benefits paid | (13,278) | | | (6,925) | | | (14,625) | | | (6,038) | |
| Foreign exchange translation | 0 | | | 940 | | | 0 | | | 2,399 | |
| Settlements | 0 | | | (5,170) | | | (58,198) | | | (2,841) | |
| Divestiture | 0 | | | (108) | | | 0 | | | 0 | |
| Other | 0 | | | 19 | | | 0 | | | 0 | |
| Fair value of plan assets at end of period | $ | 267,343 | | | $ | 54,548 | | | $ | 244,613 | | | $ | 54,806 | |
| | | | | | | |
| Funded status of the plans | $ | (4,054) | | | $ | (140,859) | | | $ | (11,322) | | | $ | (129,558) | |
| | | | | | | | | | | | | | | | | | | | | | | |
| | December 31, 2023 | | December 31, 2022 |
| | U.S. | | Non-U.S. | | U.S. | | Non-U.S. |
| Amounts recognized in the consolidated balance sheet: | | | | | | | |
| Other assets | $ | — | | | $ | 3,039 | | | $ | — | | | $ | 3,239 | |
| Accrued liabilities | (4,958) | | | (4,104) | | | (1,005) | | | (3,849) | |
| Pension benefits (long term) | (9,398) | | | (91,180) | | | (15,249) | | | (83,232) | |
| | | | | | | | | | | | | | | | | | | | | | | |
| | December 31, 2020 | | December 31, 2019 |
| | U.S. | | Non-U.S. | | U.S. | | Non-U.S. |
| Amounts recognized in the consolidated balance sheet: | | | | | | | |
| Other assets | $ | 10,513 | | | $ | 1,921 | | | $ | 2,677 | | | $ | 1,887 | |
| Accrued liabilities | (1,020) | | | (4,097) | | | (1,021) | | | (4,413) | |
| Pension benefits (long term) | (13,547) | | | (138,683) | | | (12,978) | | | (127,032) | |
Pre-tax amounts included in accumulated other comprehensive loss that have not yet been recognized in net periodic benefit
cost (income)
cost as of December 31,
20202023 and
20192022 were as follows:
| | | | | | | | | | | | | | | | | | | | | | | |
| December 31, 2023 | | December 31, 2022 |
| U.S. | | Non-U.S. | | U.S. | | Non-U.S. |
| Prior service cost | $ | — | | | $ | (11) | | | $ | — | | | $ | (31) | |
| Actuarial losses | (53,684) | | | (11,714) | | | (74,744) | | | (6,910) | |
| | | | | | | | | | | | | | | | | | | | | | | |
| December 31, 2020 | | December 31, 2019 |
| U.S. | | Non-U.S. | | U.S. | | Non-U.S. |
| Prior service costs | $ | (76) | | | $ | (497) | | | $ | (96) | | | $ | (351) | |
| Actuarial losses | (57,731) | | | (53,657) | | | (61,184) | | | (49,682) | |
NOTES TO CONSOLIDATED FINANCIAL STATEMENTS (Continued)
(Dollar amounts in thousands except per share and share amounts)
The Company uses the corridor approach when amortizing actuarial gains or losses. Under the corridor approach, net unrecognized actuarial losses in excess of 10% of the greater of i) the projected benefit obligationobligations or ii) the fair value of plan assets for a particular plan are amortized over the average future periods. service period of the employees in that plan.
NOTES TO CONSOLIDATED FINANCIAL STATEMENTS (Continued)
(Dollar amounts in thousands except per share and share amounts)
The accumulated benefit obligationobligations for all domestic and international defined benefit pension plans was $271,397$161,813 and $186,652$118,760 as of December 31, 20202023 and $255,935$212,688 and $174,273$112,963 as of December 31, 2019,2022, respectively. As of December 31, 2020,2023, the fair value of plan assets for threeone of the Company’s defined benefit plans exceeded the projected benefit obligations of $286,102$19,422 by $12,434.$3,039.
The components of net periodic benefit cost (income) cost for the Company’s defined benefit plans were as follows: | | | | | | | | | | | | | | | | | | | | | | | | | | | | | | | | | | | |
| | Year Ended December 31, |
| | 2023 | | 2022 | | 2021 |
| | U.S. | | Non-U.S. | | U.S. | | Non-U.S. | | U.S. | | Non-U.S. |
| Service cost | $ | — | | | $ | 2,161 | | | $ | 771 | | | $ | 2,755 | | | $ | 891 | | | $ | 3,345 | |
| Interest cost | 9,254 | | | 5,198 | | | 7,062 | | | 2,782 | | | 6,516 | | | 2,558 | |
| Expected return on plan assets | (8,451) | | | (1,230) | | | (9,293) | | | (949) | | | (14,257) | | | (1,320) | |
| Amortization of prior service cost and actuarial loss | 3,110 | | | 24 | | | 886 | | | 1,574 | | | 1,670 | | | 2,635 | |
| Settlement loss (gain) | 16,285 | | | (248) | | | — | | | (410) | | | — | | | 1,279 | |
| Curtailment loss | — | | | — | | | 3,092 | | | — | | | — | | | — | |
| Other | — | | | — | | | — | | | — | | | — | | | 118 | |
| Net periodic benefit cost (income) | $ | 20,198 | | | $ | 5,905 | | | $ | 2,518 | | | $ | 5,752 | | | $ | (5,180) | | | $ | 8,615 | |
| | | | | | | | | | | | | | | | | | | | | | | | | | | | | | | | | | | |
| | Year Ended December 31, |
| | 2020 | | 2019 | | 2018 |
| | U.S. | | Non-U.S. | | U.S. | | Non-U.S. | | U.S. | | Non-U.S. |
| Service cost | $ | 853 | | | $ | 3,992 | | | $ | 809 | | | $ | 3,893 | | | $ | 852 | | | $ | 4,383 | |
| Interest cost | 8,132 | | | 3,200 | | | 10,955 | | | 4,037 | | | 10,824 | | | 4,207 | |
| Expected return on plan assets | (13,683) | | | (2,415) | | | (16,353) | | | (2,400) | | | (17,414) | | | (2,178) | |
| Amortization of prior service cost and actuarial loss | 1,940 | | | 3,478 | | | 2,914 | | | 2,373 | | | 2,403 | | | 2,646 | |
| Settlements | 0 | | | 184 | | | 15,247 | | | 572 | | | 0 | | | 775 | |
| Other | 0 | | | (11) | | | 0 | | | 956 | | | 0 | | | 0 | |
| Net periodic benefit (income) cost | $ | (2,758) | | | $ | 8,428 | | | $ | 13,572 | | | $ | 9,431 | | | $ | (3,335) | | | $ | 9,833 | |
Pension Settlements
In addition to the settlements shown in the table above, the Company recognized $744 of Non-U.S. pension net settlement and curtailment charges due to the divestiture of certain businesses in Europe and India during the year ended December 31, 2020 that are recorded as a reduction to gain on sale of business, net in the consolidated statements of operations. The Company also recognized $836 of Non-U.S. pension settlement charges during the year ended December 31, 2020 that are recorded as restructuring in the consolidated statements of operations.
The Company recognized $2,730 of Non-U.S. pension settlement charges due to the divestiture of the Company’s AVS product line during the year ended December 31, 2019. The charges are recorded as a reduction to gain on sale of business, net in the consolidated statements of operations.
During the year ended December 31, 2019, the Company undertook an initiative to de-risk pension obligations in the U.S. by purchasing a bulk annuity policy utilizing plan assets, which was designed to match the liabilities of the plan. The resulting non-cash settlement charge of $15,247 was recorded in pension settlement charges, and administrative expenses of $178 were recorded in selling, administration & engineering expenses in the consolidated statements of operations. As a result of the settlement, the Company’s overall projected benefit obligation as of December 31, 2019 was reduced by $58,198.
Plan Assumptions
Weighted average assumptions used to determine benefit obligations as of December 31, 20202023 and 20192022 were as follows:
| | | | | | | | | | | | | | | | | | | | | | | |
| | December 31, 2023 | | December 31, 2022 |
| | U.S. | | Non-U.S. | | U.S. | | Non-U.S. |
| Discount rate | 4.70% | | 4.00% | | 4.55% | | 4.45% |
| Rate of compensation increase | N/A | | 3.20% | | N/A | | 1.58% |
| Cash balance interest credit rate | 2.41% | | N/A | | 2.41% | | N/A |
| | | | | | | | | | | | | | | | | | | | | | | |
| | 2020 | | 2019 |
| | U.S. | | Non-U.S. | | U.S. | | Non-U.S. |
| Discount rate | 2.48 | % | | 1.36 | % | | 3.28 | % | | 1.79 | % |
| Rate of compensation increase | N/A | | 1.23 | % | | N/A | | 1.33 | % |
| Cash balance interest credit rate | 4.50 | % | | N/A | | 4.50 | % | | N/A |
NOTES TO CONSOLIDATED FINANCIAL STATEMENTS (Continued)
(Dollar amounts in thousands except per share and share amounts)
Weighted average assumptions used to determine net periodic benefit costscost (income) for the years ended December 31, 2020, 20192023, 2022 and 20182021 were as follows:
| | | | | | | | | | | | | | | | | | | | | | | | | | | | | | | | | | | |
| | 2020 | | 2019 | | 2018 |
| | U.S. | | Non-U.S. | | U.S. | | Non-U.S. | | U.S. | | Non-U.S. |
| Discount rate | 3.28 | % | | 2.33 | % | | 4.25 | % | | 2.40 | % | | 3.55 | % | | 2.17 | % |
| Expected return on plan assets | 5.75 | % | | 3.73 | % | | 6.50 | % | | 4.63 | % | | 6.50 | % | | 5.82 | % |
| Rate of compensation increase | N/A | | 3.99 | % | | N/A | | 3.31 | % | | N/A | | 3.17 | % |
| | | | | | | | | | | | | | | | | | | | | | | | | | | | | | | | | | | |
| Year Ended December 31, |
| | 2023 | | 2022 | | 2021 |
| | U.S. | | Non-U.S. | | U.S. | | Non-U.S. | | U.S. | | Non-U.S. |
| Discount rate | 4.55% | | 4.45% | | 2.84% | | 2.39% | | 2.48% | | 1.63% |
| Expected return on plan assets | 4.50% | | 3.84% | | 3.50% | | 2.15% | | 5.50% | | 2.48% |
| Rate of compensation increase | N/A | | 3.01% | | N/A | | 2.39% | | N/A | | 1.99% |
To develop the expected return on plan assets assumption, the Company considered the historical returns and the future expected returns for each asset class, as well as the target asset allocation of the pension portfolio. As the U.S. plans are frozen, the rate of compensation increase was not applicable in determining net periodic benefit cost.cost (income).
Plan Assets
The goals and investment objectives of the asset strategy are to ensure that there is an adequate level of assets to meet benefit obligations to participants and retirees over the life of the participants and maintain liquidity in the plan assets sufficient to cover monthly benefit obligations. Risk is managed by investing in a broad range of investment vehicles, e.g., equity mutual funds, bond mutual funds, real estate mutual funds, hedge funds, etc. There are no equity securities of the Company in the equity asset category.
Investments in equity securities and debt securities are valued at fair value using a market approach and observable inputs, such as quoted market prices in active markets (Level 1). Investments in balanced funds are valued at fair value using a market approach and inputs that are primarily directly or indirectly observable (Level 2). Investments in equity securities and balanced funds in which the Company holds participation units in a fund, the net asset value of which is based on the underlying
NOTES TO CONSOLIDATED FINANCIAL STATEMENTS (Continued)
(Dollar amounts in thousands except per share and share amounts)
assets and liabilities of the respective fund, are considered an unobservable input (Level 3). Investments in real estate funds are primarily valued at net asset value depending on the investment.
The fair value of the Company’s pension plan assets by category using the three-level hierarchy (see Note 12.11. “Fair Value Measurements and Financial Instruments”) as of December 31, 20202023 and 20192022 was as follows: | | | | | | | | | | | | | | | | | | | | | | | | | | | | |
| December 31, 2023 | | Level 1 | | Level 2 | | | | Assets measured at NAV (1) | | Total |
| Equity funds | | $ | — | | | $ | 7,167 | | | | | $ | — | | | $ | 7,167 | |
| | | | | | | | | | |
| Bond funds | | — | | | 25,236 | | | | | — | | | 25,236 | |
| Bond funds measured at net asset value | | — | | | — | | | | | 123,366 | | | 123,366 | |
| Real estate measured at net asset value | | — | | | — | | | | | 8,121 | | | 8,121 | |
| | | | | | | | | | |
| | | | | | | | | | |
| | | | | | | | | | |
| Cash and cash equivalents | | 18,117 | | | — | | | | | — | | | 18,117 | |
| Total | | $ | 18,117 | | | $ | 32,403 | | | | | $ | 131,487 | | | $ | 182,007 | |
| | | | | | | | | | | | | | | | | | | | | | | | | | | | |
| 2020 | | Level 1 | | Level 2 | | | | Assets measured at NAV (1) | | Total |
| Equity funds | | $ | 18,218 | | | $ | 16,647 | | | | | $ | — | | | $ | 34,865 | |
| Equity funds measured at net asset value | | — | | | — | | | | | 117,309 | | | 117,309 | |
| Bond funds | | 0 | | | 37,901 | | | | | — | | | 37,901 | |
| Bond funds measured at net asset value | | — | | | — | | | | | 104,880 | | | 104,880 | |
| Real estate measured at net asset value | | — | | | — | | | | | 25,070 | | | 25,070 | |
| | | | | | | | | | |
| | | | | | | | | | |
| | | | | | | | | | |
| Cash and cash equivalents | | 1,866 | | | 0 | | | | | — | | | 1,866 | |
| Total | | $ | 20,084 | | | $ | 54,548 | | | | | $ | 247,259 | | | $ | 321,891 | |
| | 2019 | | Level 1 | | Level 2 | | | Assets measured at NAV (1) | | Total |
| December 31, 2022 | |
| December 31, 2022 | |
| December 31, 2022 | | | Level 1 | | Level 2 | | | | Assets measured at NAV (1) | | Total |
| Equity funds | Equity funds | | $ | 16,613 | | | $ | 20,126 | | | | $ | — | | | $ | 36,739 | |
| Equity funds measured at net asset value | Equity funds measured at net asset value | | — | | | — | | | | 101,053 | | | 101,053 | |
| Bond funds | Bond funds | | 0 | | | 34,680 | | | | — | | | 34,680 | |
| Bond funds measured at net asset value | Bond funds measured at net asset value | | — | | | — | | | | 98,967 | | | 98,967 | |
| Real estate measured at net asset value | Real estate measured at net asset value | | — | | | — | | | | 25,425 | | | 25,425 | |
| | Cash and cash equivalents | Cash and cash equivalents | | 2,555 | | | 0 | | | | — | | | 2,555 | |
| | Cash and cash equivalents | |
| | Cash and cash equivalents | |
| Total | Total | | $ | 19,168 | | | $ | 54,806 | | | | $ | 225,445 | | | $ | 299,419 | |
(1) Certain assets that are measured at fair value using the NAV per share (or its equivalent) practical expedient have not been classified in the fair value hierarchy. These assets are included in this table to present total pension plan assets at fair value.value
NOTES TO CONSOLIDATED FINANCIAL STATEMENTS (Continued)
(Dollar amounts in thousands except per share and share amounts)
.There were no transfers of Level 3 assets and no Level 3 assets in the ending balance for the years ended December 31, 20202023 and December 31, 2019.2022.
Expected Future Benefit Payments
The Company estimates its benefit payments for domestic and foreign pension plans during the next ten years to be as follows: | | | | | | | | | | | | | | | | | | | | |
| Years Ending December 31, | | U.S. | | Non-U.S. | | Total |
| 2024 | | $ | 154,179 | | | $ | 6,144 | | | $ | 160,323 | |
| 2025 | | 1,016 | | | 6,381 | | | 7,397 | |
| 2026 | | 996 | | | 6,521 | | | 7,517 | |
| 2027 | | 974 | | | 7,345 | | | 8,319 | |
| 2028 | | 950 | | | 8,414 | | | 9,364 | |
| 2029 - 2033 | | 4,315 | | | 49,837 | | | 54,152 | |
| | | | | | | | | | | | | | | | | |
| Years Ending December 31, | U.S. | | Non-U.S. | | Total |
| 2021 | $ | 17,250 | | | $ | 6,196 | | | $ | 23,446 | |
| 2022 | 15,775 | | | 6,253 | | | 22,028 | |
| 2023 | 14,700 | | | 28,144 | | | 42,844 | |
| 2024 | 15,400 | | | 7,896 | | | 23,296 | |
| 2025 | 15,134 | | | 8,004 | | | 23,138 | |
| 2026 - 2030 | 75,540 | | | 42,708 | | | 118,248 | |
Contributions
The Company estimates it will make minimum funding cash contributions of approximately $1,000$9,955 to its U.S. pension plans and minimum funding cash contributions of approximately $4,500$357 to its non-U.S. pension plans in 2021.2024. The expected cash contributions to the Company’s U.S. pension plans primarily relates to the expected plan termination as described above.
NOTES TO CONSOLIDATED FINANCIAL STATEMENTS (Continued)
(Dollar amounts in thousands except per share and share amounts)
The Company also sponsors voluntary defined contribution plans for certain salaried and hourly U.S. employees of the Company. The Company matches contributions of participants, up to various limits in all plans. The Company also sponsors retirement plans that include Company non-elective contributions. Non-elective and matching contributions under these plans totaled $13,919, $12,015 and $12,809 for the years ended December 31, 2023, 2022 and 2021, respectively.
15.13. Postretirement Benefits Other Than Pensions
The Company provides certain retiree health care and life insurance benefits covering certain U.S. salaried and hourly employees and employees in Canada. Employees are generally eligible for benefits upon retirement and completion of a specified number of years of creditable service. The Company’s policy is to fund the cost of these postretirement benefits as these benefits become payable.
Information related to the Company’s postretirement benefit plans was as follows: | | | | | | | | | | | | | | | | | | | | | | | |
| | Year Ended December 31, |
| | 2023 | | 2022 |
| | U.S. | | Non-U.S. | | U.S. | | Non-U.S. |
| Change in benefit obligations: | | | | | | | |
| Benefit obligations at beginning of year | $ | 15,812 | | | $ | 15,473 | | | $ | 21,211 | | | $ | 22,476 | |
| Service cost | 52 | | | 150 | | | 89 | | | 216 | |
| Interest cost | 821 | | | 788 | | | 561 | | | 628 | |
| Net actuarial (gain) loss | (3,759) | | | 1,230 | | | (4,924) | | | (5,663) | |
| Benefits paid | (1,163) | | | (748) | | | (1,125) | | | (722) | |
| | | | | | | |
| Other | — | | | 107 | | | — | | | 14 | |
| Foreign currency exchange rate effect | — | | | 408 | | | — | | | (1,476) | |
| Benefit obligations at end of year | $ | 11,763 | | | $ | 17,408 | | | $ | 15,812 | | | $ | 15,473 | |
| | | | | | | |
| Funded status of the plan | $ | (11,763) | | | $ | (17,408) | | | $ | (15,812) | | | $ | (15,473) | |
| | | | | | | |
| Net amount recognized as of December 31 | $ | (11,763) | | | $ | (17,408) | | | $ | (15,812) | | | $ | (15,473) | |
| | | | | | | | | | | | | | | | | | | | | | | |
| | Year Ended December 31, |
| | 2020 | | 2019 |
| | U.S. | | Non-U.S. | | U.S. | | Non-U.S. |
| Change in benefit obligation: | | | | | | | |
| Benefit obligations at beginning of year | $ | 22,436 | | | $ | 23,949 | | | $ | 25,633 | | | $ | 21,981 | |
| Service cost | 103 | | | 404 | | | 118 | | | 397 | |
| Interest cost | 680 | | | 726 | | | 864 | | | 752 | |
| Net actuarial loss | 1,603 | | | 2,221 | | | 1,697 | | | 1,705 | |
| Benefits paid | (1,403) | | | (663) | | | (1,491) | | | (570) | |
| Divestiture | 0 | | | 0 | | | (4,405) | | | (1,513) | |
| Other | 0 | | | 0 | | | 20 | | | 61 | |
| Foreign currency exchange rate effect | 0 | | | 395 | | | 0 | | | 1,136 | |
| Benefit obligation at end of year | $ | 23,419 | | | $ | 27,032 | | | $ | 22,436 | | | $ | 23,949 | |
| | | | | | | |
| Funded status of the plan | $ | (23,419) | | | $ | (27,032) | | | $ | (22,436) | | | $ | (23,949) | |
| | | | | | | |
| Net amount recognized as of December 31 | $ | (23,419) | | | $ | (27,032) | | | $ | (22,436) | | | $ | (23,949) | |
| | | | | | | | | | | | | | | | | | | | | | | |
| December 31, 2023 | | December 31, 2022 |
| U.S. | | Non-U.S. | | U.S. | | Non-U.S. |
| Amounts recognized in the consolidated balance sheet: | | | | | | | |
| Accrued liabilities | $ | (1,264) | | | $ | (761) | | | $ | (1,452) | | | $ | (709) | |
| Postretirement benefits other than pension (long term) | (10,499) | | | (16,647) | | | (14,360) | | | (14,764) | |
| | | | | | | | | | | | | | | | | | | | | | | |
| December 31, 2020 | | December 31, 2019 |
| U.S. | | Non-U.S. | | U.S. | | Non-U.S. |
| Amounts recognized in the consolidated balance sheet: | | | | | | | |
| Accrued liabilities | $ | (1,648) | | | $ | (968) | | | $ | (1,686) | | | $ | (840) | |
| Postretirement benefits other than pension (long term) | (21,771) | | | (26,064) | | | (20,750) | | | (23,109) | |
| | | | | | | | | | | | | | | | | | | | | | | |
| December 31, 2023 | | December 31, 2022 |
| U.S. | | Non-U.S. | | U.S. | | Non-U.S. |
| Prior service cost | $ | — | | | $ | (122) | | | $ | — | | | $ | (14) | |
| Actuarial gains | 16,008 | | | 1,041 | | | 14,686 | | | 2,328 | |
NOTES TO CONSOLIDATED FINANCIAL STATEMENTS (Continued)
(Dollar amounts in thousands except per share and share amounts)
Pre-tax amounts included in accumulated other comprehensive loss that have not yet been recognized in net periodic benefit (income) cost as of December 31, 2020 and 2019 were as follows:
| | | | | | | | | | | | | | | | | | | | | | | |
| December 31, 2020 | | December 31, 2019 |
| U.S. | | Non-U.S. | | U.S. | | Non-U.S. |
| Prior service credits | $ | 0 | | | $ | 0 | | | $ | 55 | | | $ | 93 | |
| Actuarial gains (losses) | 11,018 | | | (9,563) | | | 14,496 | | | (7,753) | |
The components of net periodic benefit (income) costscost for the Company’s other postretirement benefit plans were as follows:
| | | | | | | | | | | | | | | | | | | | | | | | | | | | | | | | | | | |
| | Year Ended December 31, |
| | 2020 | | 2019 | | 2018 |
| | U.S. | | Non-U.S. | | U.S. | | Non-U.S. | | U.S. | | Non-U.S. |
| Service cost | $ | 103 | | | $ | 404 | | | $ | 118 | | | $ | 397 | | | $ | 308 | | | $ | 495 | |
| Interest cost | 680 | | | 726 | | | 864 | | | 752 | | | 1,198 | | | 789 | |
| Amortization of prior service credit and recognized actuarial (gain) loss | (1,930) | | | 448 | | | (2,441) | | | 320 | | | (1,672) | | | 308 | |
| Other | 0 | | | 0 | | | 0 | | | 48 | | | 5 | | | 0 | |
| Net periodic benefit (income) cost | $ | (1,147) | | | $ | 1,578 | | | $ | (1,459) | | | $ | 1,517 | | | $ | (161) | | | $ | 1,592 | |
During the year ended December 31, 2019, the Company recognized a gain of $3,452 for the U.S. plan and a net charge of $453 for the Non-U.S. plan, related to settlements and curtailments due to the divestiture of the Company’s AVS product line. See Note 5. “Divestitures.” The amounts are recorded in gain on sale of business, net in the consolidated statements of operations. | | | | | | | | | | | | | | | | | | | | | | | | | | | | | | | | | | | |
| | Year Ended December 31, |
| | 2023 | | 2022 | | 2021 |
| | U.S. | | Non-U.S. | | U.S. | | Non-U.S. | | U.S. | | Non-U.S. |
| Service cost | $ | 52 | | | $ | 150 | | | $ | 89 | | | $ | 216 | | | $ | 105 | | | $ | 357 | |
| Interest cost | 821 | | | 788 | | | 561 | | | 628 | | | 531 | | | 701 | |
| Amortization of prior service credit and actuarial (gain) loss | (2,437) | | | (85) | | | (1,577) | | | 157 | | | (1,396) | | | 752 | |
| | | | | | | | | | | |
| Net periodic benefit (income) cost | $ | (1,564) | | | $ | 853 | | | $ | (927) | | | $ | 1,001 | | | $ | (760) | | | $ | 1,810 | |
Plan Assumptions
Weighted average assumptions used to determine benefit obligations as of December 31, 20202023 and 20192022 were as follows:
| | | | | | | | | | | | | | | | | | | | | | | |
| | 2020 | | 2019 |
| | U.S. | | Non-U.S. | | U.S. | | Non-U.S. |
| Discount rate | 2.35 | % | | 2.65 | % | | 3.15 | % | | 3.05 | % |
| | | | | | | | | | | | | | | | | | | | | | | |
| | 2023 | | 2022 |
| | U.S. | | Non-U.S. | | U.S. | | Non-U.S. |
| Discount rate | 5.10% | | 4.65% | | 5.45% | | 5.20% |
Weighted average assumptions used to determine net periodic benefit costscost for the years ended December 31, 2020, 20192023, 2022 and 20182021 were as follows:
| | | | | | | | | | | | | | | | | | | | | | | | | | | | | | | | | | | |
| | 2023 | | 2022 | | 2021 |
| | U.S. | | Non-U.S. | | U.S. | | Non-U.S. | | U.S. | | Non-U.S. |
| Discount rate | 5.45% | | 5.20% | | 2.75% | | 3.05% | | 2.35% | | 2.65% |
| | | | | | | | | | | | | | | | | | | | | | | | | | | | | | | | | | | |
| | 2020 | | 2019 | | 2018 |
| | U.S. | | Non-U.S. | | U.S. | | Non-U.S. | | U.S. | | Non-U.S. |
| Discount rate | 3.15 | % | | 3.05 | % | | 4.20 | % | | 3.65 | % | | 3.55 | % | | 3.40 | % |
The assumed health care cost trend rates used to measure the postretirement benefit obligationobligations as of December 31, 20202023 were as follows: | | | | | | | | | | | |
| U.S. | | Non-U.S. |
| Health care cost trend rate | 6.50% | | 5.00% |
| Ultimate health care cost trend rate | 4.50% | | 5.00% |
| Year that the rate reaches the ultimate trend rate | 2031 | | N/A |
| | | | | | | | | | | |
| U.S. | | Non-U.S. |
| Health care cost trend rate | 5.34 | % | | 5.00 | % |
| Ultimate health care cost trend rate | 4.50 | % | | 5.00 | % |
| Year that the rate reaches the ultimate trend rate | 2027 | | N/A |
The Company estimates its benefit payments for its postretirement benefit plans during the next ten years to be as follows: | | | | | | | | | | | | | | | | | | | | |
| Years Ending December 31, | | U.S. | | Non-U.S. | | Total |
| 2024 | | $ | 1,296 | | | $ | 778 | | | $ | 2,074 | |
| 2025 | | 1,261 | | | 790 | | | 2,051 | |
| 2026 | | 1,218 | | | 811 | | | 2,029 | |
| 2027 | | 1,156 | | | 827 | | | 1,983 | |
| 2028 | | 1,114 | | | 850 | | | 1,964 | |
| 2029 - 2033 | | 4,646 | | | 4,782 | | | 9,428 | |
Other
Other postretirement benefits recorded in the Company’s consolidated balance sheets include $1,794 and $1,890 as of December 31, 2023 and 2022, respectively, for termination indemnity plans in Europe.
NOTES TO CONSOLIDATED FINANCIAL STATEMENTS (Continued)
(Dollar amounts in thousands except per share and share amounts)
14. Other Expense, Net
The components of other expense, net were as follows: | | | | | | | | | | | | | | | | | |
| | Year Ended December 31, |
| | 2023 | | 2022 | | 2021 |
Deconsolidation of joint venture (1) | $ | — | | | $ | (2,257) | | | $ | — | |
| Foreign currency losses | (7,300) | | | (1,131) | | | (6,887) | |
| Components of net periodic benefit cost other than service cost | (6,992) | | | (1,831) | | | 1,610 | |
| | | | | |
| Factoring costs | (2,226) | | | (710) | | | (528) | |
| Miscellaneous income | 820 | | | 444 | | | 963 | |
| | | | | |
| Other expense, net | $ | (15,698) | | | $ | (5,485) | | | $ | (4,842) | |
(1) Loss attributable to deconsolidation of a joint venture in the Asia Pacific region, which required adjustment to fair value.
15. Income Taxes
Components of the Company’s loss before income taxes and adjustment for noncontrolling interests were as follows: | | | | | | | | | | | | | | | | | |
| | Year Ended December 31, |
| | 2023 | | 2022 | | 2021 |
| Domestic | $ | (249,582) | | | $ | (154,779) | | | $ | (142,883) | |
| Foreign | 55,199 | | | (45,721) | | | (146,569) | |
| Total | $ | (194,383) | | | $ | (200,500) | | | $ | (289,452) | |
The Company’s income tax expense consists of the following: | | | | | | | | | | | | | | | | | |
| | Year Ended December 31, |
| | 2023 | | 2022 | | 2021 |
| Current: | | | | | |
| Federal | $ | 848 | | | $ | (2,280) | | | $ | 5,158 | |
| State | 41 | | | 154 | | | 68 | |
| Foreign | 13,857 | | | 13,764 | | | (1,590) | |
| | | | | |
| Deferred: | | | | | |
| Federal | (123) | | | 74 | | | 12,217 | |
| State | (13) | | | 106 | | | (484) | |
| Foreign | (5,677) | | | 5,473 | | | 24,023 | |
| Total | $ | 8,933 | | | $ | 17,291 | | | $ | 39,392 | |
NOTES TO CONSOLIDATED FINANCIAL STATEMENTS (Continued)
(Dollar amounts in thousands except per share and share amounts)
Expected Future Postretirement Benefit Payments
The Company estimates its benefit payments for its postretirement benefit plans duringA reconciliation of the next ten yearsU.S. statutory federal rate to bethe income tax provision was as follows: | | | | | | | | | | | | | | | | | |
| | Year Ended December 31, |
| | 2023 | | 2022 | | 2021 |
| Tax at U.S. statutory rate | $ | (40,820) | | | $ | (42,105) | | | $ | (60,785) | |
| State and local taxes | (4,122) | | | (2,700) | | | (3,276) | |
| Tax credits and incentives | (8,137) | | | (8,413) | | | (7,634) | |
| Changes in tax law, other | (433) | | | (17) | | | (361) | |
| U.S. tax reform/Global Intangible Low-Taxed Income ("GILTI")/foreign derived intangible income | 10,923 | | | 1,382 | | | — | |
| Effect of foreign tax rates | (474) | | | (1,614) | | | (13,525) | |
| Nonrecurring permanent items | — | | | (2,189) | | | (3,710) | |
| | | | | |
| | | | | |
| Foreign branch | 486 | | | 279 | | | 1,641 | |
| Stock compensation (ASU 2016-09) | 1,212 | | | 1,258 | | | 1,257 | |
| Non-deductible expenses | 6,367 | | | 7,192 | | | 6,618 | |
| Tax reserves/audit settlements | 9 | | | 3,854 | | | (5,043) | |
| Valuation allowance | 47,293 | | | 65,559 | | | 124,228 | |
| Other, net | (3,371) | | | (5,195) | | | (18) | |
| Income tax expense | $ | 8,933 | | | $ | 17,291 | | | $ | 39,392 | |
| Effective income tax rate | (4.6) | % | | (8.6) | % | | (13.6) | % |
| | | | | | | | | | | | | | | | | |
| U.S. | | Non-U.S. | | Total |
| 2021 | $ | 1,667 | | | $ | 981 | | | $ | 2,648 | |
| 2022 | 1,666 | | | 975 | | | 2,641 | |
| 2023 | 1,648 | | | 978 | | | 2,626 | |
| 2024 | 1,608 | | | 1,011 | | | 2,619 | |
| 2025 | 1,572 | | | 1,019 | | | 2,591 | |
| 2026 - 2030 | 7,108 | | | 5,211 | | | 12,319 | |
OtherOn August 16, 2022, the U.S. enacted the Inflation Reduction Action of 2022, which, among other things, implements a 15% minimum tax on financial statement income of certain large corporations, a 1% excise tax on net stock repurchases and several tax incentives to promote clean energy. The provisions were effective in the first quarter of 2023 and did not have a
Other postretirement benefits recorded insignificant impact on the Company’s consolidated balance sheets include $1,778 and $4,454 as of December 31, 2020 and 2019, respectively, for termination indemnity plansfinancial statements.
Numerous countries have agreed to a statement in Europe.
16. Other Expense, net
The components of other expense, net were as follows:
| | | | | | | | | | | | | | | | | |
| | Year Ended December 31, |
| | 2020 | | 2019 | | 2018 |
| Foreign currency losses | $ | (1,429) | | | $ | (3,022) | | | $ | (3,170) | |
| Components of net periodic benefit cost other than service cost | (576) | | | (1,069) | | | (1,116) | |
| | | | | |
| Factoring costs | (776) | | | (1,007) | | | (1,248) | |
| Miscellaneous income | 201 | | | 838 | | | 696 | |
| | | | | |
| Other expense, net | $ | (2,580) | | | $ | (4,260) | | | $ | (4,838) | |
17. Income Taxes
Componentssupport of the Company’s income (loss) before Organization for Economic Co-operation and
Development (“OECD”) model rules that propose a global minimum tax rate of 15%, and European Union member states have
agreed to implement the global minimum tax. Certain countries, including European Union member states, have enacted or are
expected to enact legislation to be effective as early as 2024, with widespread implementation of a global minimum tax
expected by 2025. As the legislation becomes effective in countries in which the Company does business, its provision for
income taxes could be impacted. The Company will continue to monitor pending legislation and adjustment for noncontrolling interests were as follows:implementation by individual
| | | | | | | | | | | | | | | | | |
| | Year Ended December 31, |
| | 2020 | | 2019 | | 2018 |
| Domestic | $ | (235,574) | | | $ | 53,425 | | | $ | 103,228 | |
| Foreign | (94,647) | | | 44,877 | | | (33,573) | |
| $ | (330,221) | | | $ | 98,302 | | | $ | 69,655 | |
Nonrecurring permanent item in 2022 relates to a withholding tax refund related to prior periods. In 2021, the nonrecurring permanent item relates to an intercompany legal entity sale.
NOTES TO CONSOLIDATED FINANCIAL STATEMENTS (Continued)
(Dollar amounts in thousands except per share and share amounts)
The Company’s income tax (benefit) expense consists of the following:
| | | | | | | | | | | | | | | | | |
| | Year Ended December 31, |
| | 2020 | | 2019 | | 2018 |
| Current | | | | | |
| Federal | $ | (65,565) | | | $ | (227) | | | $ | (11,153) | |
| State | (196) | | | (171) | | | (33) | |
| Foreign | 13,636 | | | 20,613 | | | 20,717 | |
| | | | | |
| Deferred | | | | | |
| Federal | (15,060) | | | 4,405 | | | (4,532) | |
| State | 1,297 | | | (767) | | | 2,074 | |
| Foreign | 5,041 | | | 12,236 | | | (36,473) | |
| $ | (60,847) | | | $ | 36,089 | | | $ | (29,400) | |
A reconciliation of the U.S. statutory federal rate to the income tax provision was as follows:
| | | | | | | | | | | | | | | | | |
| | Year Ended December 31, |
| | 2020 | | 2019 | | 2018 |
| Tax at U.S. statutory rate | $ | (69,346) | | | $ | 20,643 | | | $ | 14,627 | |
| State and local taxes | (4,933) | | | 209 | | | 1,273 | |
| Tax credits and incentives | (5,750) | | | (8,034) | | | (11,702) | |
| Changes in tax law, other | 352 | | | 2,909 | | | (3,008) | |
| U.S. tax reform/Global Intangible Low-Taxed Income ("GILTI")/foreign derived intangible income | (1,046) | | | 1,102 | | | (6,860) | |
| Effect of foreign tax rates | (15,432) | | | (1,656) | | | (10,388) | |
| Nonrecurring permanent items | (3,069) | | | (5,250) | | | 0 | |
| Goodwill impairment | 0 | | | 0 | | | 6,887 | |
| CARES Act | (27,844) | | | 0 | | | 0 | |
| Foreign branch | (1,215) | | | (2,258) | | | (3,753) | |
| Stock compensation (ASU 2016-09) | 1,640 | | | 1,596 | | | (2,097) | |
| Non deductible expenses | 9,335 | | | 2,820 | | | 2,451 | |
| Tax reserves/audit settlements | 1,071 | | | (206) | | | (3,760) | |
| Valuation allowance | 51,609 | | | 24,625 | | | (7,844) | |
| Other, net | 3,781 | | | (411) | | | (5,226) | |
| Income tax provision | $ | (60,847) | | | $ | 36,089 | | | $ | (29,400) | |
| Effective income tax rate | 18.4 | % | | 36.7 | % | | (42.2) | % |
On December 22, 2017, the U.S. Tax Cuts and Jobs Act (the “Act”) was enacted into law. The Act reduced the U.S. federal corporate tax rate from 35% to 21% effective January 1, 2018. The Act required companies to pay a one-time transition tax on earnings of certain foreign subsidiaries that were previously deferred. In 2018 and 2017, the Company recorded tax expense related to the enactment-date effects of the Act that included recording the one-time transition tax liability related to undistributed earnings of certain foreign subsidiaries that were not previously taxed and adjusting deferred tax assets and liabilities. Our accounting for the income tax effects of the Act was complete as of December 31, 2018. Additionally, on March 27, 2020 the Coronavirus Aid, Relief, and Economic Security Act (the “CARES Act”) was enacted into law. The CARES Act allows net operating losses generated by the Company to be carried back up to five years at the tax rates in effect during those periods, rather than carried forward at current federal tax rates of 21%. The Company has included a $27,844 benefit for this CARES Act provision in the period ended December 31, 2020.
Nonrecurring permanent items in 2020 were the result of the divestiture of our European rubber, fluid transfer, and specialty sealing businesses as well as our Indian operation, including a worthless security deduction and in 2019 a result of the sale of the AVS product line.
NOTES TO CONSOLIDATED FINANCIAL STATEMENTS (Continued)
(Dollar amounts in thousands except per share and share amounts)
Deferred tax assets and liabilities reflect the estimated tax effect of accumulated temporary differences between the basis of assets and liabilities for tax and financial reporting purposes, as well as net operating losses, tax credit and other carryforwards. Significant components of the Company’s deferred tax assets and liabilities as of December 31, 20202023 and 20192022 were as follows:
| | | | | | | | | | | |
| 2020 | | 2019 |
| Deferred tax assets: | | | |
| Pension, postretirement and other benefits | $ | 53,229 | | | $ | 48,589 | |
| Capitalized expenditures | 14,411 | | | 2,908 | |
| Net operating loss and tax credit carryforwards | 215,980 | | | 167,719 | |
| Operating lease | 26,160 | | | 20,817 | |
| | | |
| All other items | 53,290 | | | 53,614 | |
| Total deferred tax assets | 363,070 | | | 293,647 | |
| Deferred tax liabilities: | | | |
| Property, plant and equipment | (29,415) | | | (19,479) | |
| Operating lease right-of-use | (26,160) | | | (20,817) | |
| All other items | (15,597) | | | (12,680) | |
| Total deferred tax liabilities | (71,172) | | | (52,976) | |
| Valuation allowances | (234,425) | | | (194,794) | |
| Net deferred tax assets | $ | 57,473 | | | $ | 45,877 | |
| | | | | | | | | | | |
| December 31, 2023 | | December 31, 2022 |
| Deferred tax assets: | | | |
| Pension, postretirement and other benefits | $ | 43,627 | | | $ | 40,060 | |
| Capitalized expenditures | 42,293 | | | 31,746 | |
| Net operating loss and tax credit carryforwards | 282,373 | | | 279,755 | |
| Operating lease liabilities | 22,978 | | | 24,059 | |
| Interest expense carryforwards | 54,442 | | | 28,610 | |
| All other items | 50,740 | | | 37,392 | |
| Total deferred tax assets | 496,453 | | | 441,622 | |
| Deferred tax liabilities: | | | |
| Property, plant and equipment | (4,764) | | | (9,896) | |
| Operating lease right-of-use assets | (22,018) | | | (23,106) | |
| All other items | (12,360) | | | (11,028) | |
| Total deferred tax liabilities | (39,142) | | | (44,030) | |
| Valuation allowances | (438,727) | | | (384,792) | |
| Net deferred tax assets | $ | 18,584 | | | $ | 12,800 | |
As of December 31, 2020,2023, the Company’s U.S. and foreign subsidiaries, primarily in France, Brazil, Italy and Germany, had operating loss carryforwards aggregating $520,000,$664,000, with indefinite expiration periods. Other foreign subsidiaries in China, Mexico, Netherlands, Spain, Czech Republic and Korea had operating lossesloss carryforwards aggregating $263,000,$322,000, with expiration dates beginning in 2021.2024. The Company has research tax credit carryforwards and foreign tax credit carryforwards totaling $20,800$50,000 in the U.S. with expiration dates beginning in 2029. The Company and its domestic subsidiaries have anticipated tax benefits of state net operating losses and credit carryforwards of $10,400$12,000 with expiration dates beginning in 2021.2024.
As of December 31, 2020,2023, the Company has consolidated deferred tax assets of $363,070, of which $62,535 relate to the U.S. federal jurisdiction,$496,453 with valuation allowances of $234,425$438,727 related to tax losses, credit carryforwards, and other deferred tax assets in the U.S. and certain foreign and U.S. state jurisdictions. The Company’s valuation allowance increased in 20202023 primarily from current year losses generated in the U.S. and certain foreign jurisdictions as well as new valuation allowances in additional foreign and U.S. state jurisdictions. Current and future provision for income taxes is significantly impacted by the initial recognition of and changes in valuation allowances in certain countries. The Company intends to maintain these allowances until it is more likely than not that the deferred tax assets will be realized. In the future, provision for income taxes will include no tax benefit with respect to losses incurred and no tax expense with respect to income generated in these countries until the respective valuation allowance is eliminated.
As of December 31, 2020,2023, no material deferred income taxes have been recorded on the undistributed earnings of foreign subsidiaries, since a majority of these earnings will not be taxable upon repatriation to the United States. These earnings will be primarily treated as previously taxed income from either the one time transition tax or GILTI, or they will be offset with a 100% dividends received deduction. The Company has not recorded a deferred tax liability for foreign withholding taxes or state income taxes that may be incurred upon repatriation in the future as such undistributed foreign earnings are considered permanently reinvested or could be remitted with no tax implications.
As of December 31, 2020,2023, the Company had $11,272$6,296 ($12,5506,475 including interest and penalties) of total unrecognized tax benefits, all of which represented$3,777 represents the amount of unrecognized tax benefits that, if recognized, would affectimpact the effective income tax rate.
NOTES TO CONSOLIDATED FINANCIAL STATEMENTS (Continued)
(Dollar amounts in thousands except per share and share amounts)
A reconciliation of the beginning and ending amount of unrecognized tax benefits was as follows:
| | | | |
| | | 2020 | | 2019 | | 2023 | | 2022 |
| Balance at beginning of period | Balance at beginning of period | $ | 10,123 | | | $ | 9,631 | |
| Tax positions related to the current period | Tax positions related to the current period | |
| Gross additions | Gross additions | 1,115 | | | 895 | |
| Gross reductions | 0 | | | 0 | |
| Gross additions | |
| Gross additions | |
| | Tax positions related to prior years | Tax positions related to prior years | |
| Tax positions related to prior years | |
| Tax positions related to prior years | |
| Gross additions | |
| Gross additions | |
| Gross additions | Gross additions | 342 | | | 0 | |
| Gross reductions | Gross reductions | 0 | | | (52) | |
| Settlements | Settlements | (232) | | | 0 | |
| Lapses on statutes of limitations | (76) | | | (351) | |
| | Balance at end of period | Balance at end of period | $ | 11,272 | | | $ | 10,123 | |
| Balance at end of period | |
| Balance at end of period | |
The Company, or one of its subsidiaries, files income tax returns in the United States and other foreign jurisdictions. TheDuring the examination of our 2015 and 2016 U.S. federal income tax filings, the IRS asserted that income earned by a Netherlands subsidiary from its Mexican branch operations should be categorized as foreign based company sales income under Section 954(d) of the Internal Revenue Service completedCode and should be recognized currently as taxable income on our 2015 and 2016 U.S. federal income tax filings. As a result of this assertion, the IRS issued a Notice of Proposed Adjustment (“NOPA”). A similar NOPA has been issued for 2017 and 2018 as well. The Company believes the proposed adjustment is without merit and are in the the process of contesting the matter. During 2023, the Company had an examinationopening conference with the IRS’s administrative appeals office and the Company is in continuing discussion on the issue. The Company believes, after consultation with tax and legal counsel, that it is more likely than not that it will ultimately be successful in defending its position. As such, the Company has not recorded any impact of the Company’s U.S.IRS’s proposed adjustment in its consolidated financial statements as of and for the year ended December 31, 2023. In the event the Company is not successful in defending its position, the potential income tax returnsexpense impact, including interest, related to tax years 2015 through 2011. 2023 is less than $10 million. The Company intends to vigorously contest the conclusions reached in the NOPA through the IRS’s administrative appeals process, and, if necessary, through litigation.
The statute of limitations for U.S. state and local jurisdictions is closed for taxable years ending prior to 2014.2015. The Company’s major foreign jurisdictions are Brazil, Canada, China, France, Germany, Italy, Mexico, and Poland. The Company is no longer subject to income tax examinations in major foreign jurisdictions for years prior to 2016.2018.
During the next twelve months, it is reasonably possible that, as a result of audit settlements and the conclusioncompletion of current examinations, the Company may decrease the amount of its gross unrecognized tax benefits by approximately $10,229,$3,141, all of which, if recognized, would impact the effective tax rate.
The Company classifies all income tax related interest and penalties as income tax expense. The Company has recorded in liabilities $1,277of $179 and $1,052$170 recorded as of December 31, 20202023 and 2019,2022, respectively, for tax related interest and penalties on its consolidated balance sheet.
18.16. Net (Loss) IncomeLoss Per Share Attributable to Cooper-Standard Holdings Inc.
Basic net (loss) incomeloss per share attributable to Cooper-Standard Holdings Inc. was computed by dividing net (loss) incomeloss attributable to Cooper-Standard Holdings Inc. by the weighted average number of shares of common stock outstanding during the period. Diluted net (loss) incomeloss per share attributable to Cooper-Standard Holdings Inc. was computed using the treasury stock method by dividing diluted net (loss) incomeloss available to Cooper-Standard Holdings Inc. by the weighted average number of shares of common stock outstanding, including the dilutive effect of common stock equivalents, using the average share price during the period.
Information used to compute basic and diluted net (loss) income per share attributable to Cooper-Standard Holdings Inc. was as follows:
| | | | | | | | | | | | | | | | | |
| | Year Ended December 31, |
| | 2020 | | 2019 | | 2018 |
| | | | | |
| Net (loss) income available to Cooper-Standard Holdings Inc. common stockholders | $ | (267,605) | | | $ | 67,529 | | | $ | 103,601 | |
| | | | | |
| Basic weighted average shares of common stock outstanding | 16,913,850 | | | 17,146,124 | | | 17,894,718 | |
| Dilutive effect of common stock equivalents | 0 | | | 62,644 | | | 395,484 | |
| Diluted weighted average shares of common stock outstanding | 16,913,850 | | | 17,208,768 | | | 18,290,202 | |
| | | | | |
| Basic net (loss) income per share attributable to Cooper-Standard Holdings Inc. | $ | (15.82) | | | $ | 3.94 | | | $ | 5.79 | |
| | | | | |
| Diluted net (loss) income per share attributable to Cooper-Standard Holdings Inc. | $ | (15.82) | | | $ | 3.92 | | | $ | 5.66 | |
NOTES TO CONSOLIDATED FINANCIAL STATEMENTS (Continued)
(Dollar amounts in thousands except per share and share amounts)
Information used to compute basic and diluted net loss per share attributable to Cooper-Standard Holdings Inc. was as follows: | | | | | | | | | | | | | | | | | |
| | Year Ended December 31, |
| | 2023 | | 2022 | | 2021 |
| | | | | |
| Net loss available to Cooper-Standard Holdings Inc. common stockholders | $ | (201,985) | | | $ | (215,384) | | | $ | (322,835) | |
| | | | | |
| Basic weighted average shares of common stock outstanding | 17,355,392 | | | 17,190,958 | | | 17,045,353 | |
| Dilutive effect of common stock equivalents | — | | | — | | | — | |
| Diluted weighted average shares of common stock outstanding | 17,355,392 | | | 17,190,958 | | | 17,045,353 | |
| | | | | |
| Basic net loss per share attributable to Cooper-Standard Holdings Inc. | $ | (11.64) | | | $ | (12.53) | | | $ | (18.94) | |
| | | | | |
| Diluted net loss per share attributable to Cooper-Standard Holdings Inc. | $ | (11.64) | | | $ | (12.53) | | | $ | (18.94) | |
Approximately 71,00091,000, 24,000, and 1,000166,000 securities were excluded from the calculation of diluted (loss) earningsnet loss per share for the years ended December 31, 20202023, 2022 and 2018,2021, respectively, because the inclusion of such securities in the calculation would have been anti-dilutive. There were no anti-dilutive securities during the year ended December 31, 2019.
19.17. Accumulated Other Comprehensive Income (Loss)Loss
Changes in accumulated other comprehensive income (loss)loss by component, net of related tax, were as follows:
| | | | | | | | | | | | | | | | | | | | | | | |
| Cumulative currency translation adjustment | | Benefit plan
liabilities | | Fair value change of derivatives | | Total |
| Balance as of December 31, 2018 | $ | (141,104) | | | $ | (104,375) | | | $ | (458) | | | $ | (245,937) | |
| Other comprehensive income (loss) before reclassifications | (16,653) | | (1) | (10,536) | | (2) | 2,858 | | (3) | (24,331) | |
| Amounts reclassified from accumulated other comprehensive income (loss) | 3,824 | | | 14,751 | | (4) | (2,048) | | (5) | 16,527 | |
| Balance as of December 31, 2019 | (153,933) | | | (100,160) | | | 352 | | | (253,741) | |
| Other comprehensive income (loss) before reclassifications | 15,708 | | (1) | (11,254) | | (2) | (4,700) | | (3) | (246) | |
| Amounts reclassified from accumulated other comprehensive income (loss) | 1,646 | | | 5,335 | | (6) | 5,110 | | (5) | 12,091 | |
| Balance as of December 31, 2020 | $ | (136,579) | | | $ | (106,079) | | | $ | 762 | | | $ | (241,896) | |
| | | | | | | | | | | | | | | | | | | | | | | |
| Cumulative currency translation adjustment | | Benefit plan
liabilities | | Fair value change of derivatives | | Total |
| Balance as of December 31, 2021 | $ | (138,751) | | | $ | (65,303) | | | $ | (1,130) | | | $ | (205,184) | |
| Other comprehensive (loss) income before reclassifications | (18,978) | | (1) | 4,419 | | (2) | 11,029 | | (3) | (3,530) | |
| Amounts reclassified from accumulated other comprehensive (loss) income | (294) | | | 633 | | (4) | (1,596) | | (5) | (1,257) | |
| Balance as of December 31, 2022 | (158,023) | | | (60,251) | | | 8,303 | | | (209,971) | |
| Other comprehensive (loss) income before reclassifications | (2,602) | | (1) | (542) | | (2) | 10,387 | | (3) | 7,243 | |
| Amounts reclassified from accumulated other comprehensive income (loss) | 2,969 | | (7) | 16,644 | | (6) | (18,550) | | | 1,063 | |
| Balance as of December 31, 2023 | $ | (157,656) | | | $ | (44,149) | | | $ | 140 | | | $ | (201,665) | |
(1)Includes $4,430$2,000 and $(823)$(15,619) of other comprehensive income (loss) for the years ended December 31, 20202023 and 2019,2022, respectively, that are related to intra-entity foreign currency balances that are of a long-term investment nature.
(2)Net of tax benefitexpense of $571$105 and $457$250 for the years ended December 31, 20202023 and 2019,2022, respectively.
(3)Net of tax (benefit) expense of $(1,580)$(185) and $954$779 for the years ended December 31, 20202023 and 2019,2022, respectively.
(4)Includes the effect of the U.S. pension settlement loss of $15,247, other settlement losses of $572, curtailment losses of $539, and the amortization of actuarial losses of $3,383, offset by $269$862, net settlement gains related to the AVS divestitureof $(416), and the amortization of prior service creditscosts of $185,$190, net of tax of $4,536.$3.
(5)Net of tax (benefit) expense of $(1,835) and $725 for the years ended December 31, 2020 and 2019, respectively.$691.
(6)Includes the effect of the amortization of actuarial losses of $3,851,$586, net settlement losses of $1,020, net losses of $744 related to the divestiture of certain businesses in Europe and India,$16,035, and the amortization of prior service costs of $106,$25, net of tax of $386.$2.
(7)Net accumulated currency translation adjustment losses reclassified to net income related to the divestitures of our European technical rubber products business and a joint venture in the Asia Pacific region.
20.18. Equity
Shareholder Rights Plan
On November 7, 2022, the Company’s Board of Directors adopted a Section 382 rights plan and declared a dividend of one right (a “Right”) for each outstanding share of the Company’s common stock, par value $0.001 per share (the “Common
NOTES TO CONSOLIDATED FINANCIAL STATEMENTS (Continued)
(Dollar amounts in thousands except per share and share amounts)
Stock”), to stockholders of record at the close of business on November 17, 2022 (“Shareholder Rights Plan”). Each Right entitles its holder, under certain circumstances described below, to purchase from the Company one one-thousandth of a share of Series A Junior Participating Preferred Stock of the Company, par value $0.001 per share (the “Series A Preferred Stock”), at an exercise price of $50.00 per Right, subject to adjustment.
If the Rights become exercisable, each Right would allow its holder to purchase from the Company one one-hundredth of a share of the Series A Preferred Stock for a purchase price of $50.00. Each fractional share of Series A Preferred Stock would give the stockholder approximately the same dividend, voting and liquidation rights as does one share of Common Stock. Prior to exercise, however, a Right does not give its holder any dividend, voting or liquidation rights. The exercisability of the Rights are described in further detail in the rights agreement.
Preferred Stock
The Company is authorized to issue up to 10,000,000 shares of preferred stock, par value $0.001 per share, of which 2,000,000 shares were designated as 7% Cumulative Participating Convertible Preferred Stock (the “7% Preferred Stock”).On November 7, 2022, the Company filed a Certificate of Elimination to its Third Amended and Restated Certificate of Incorporation (the “Certificate of Incorporation”) with the Secretary of State of the State of Delaware eliminating from the Certificate of Incorporation all matters set forth in the Certificate of Designation with respect to the Company’s 7% Preferred Stock. No shares of the 7% Preferred Stock were outstanding and none will be issued subject to the Certificate of Designation for the 7% Preferred Stock. All shares that were designated as 7% Preferred Stock have been returned to the status of authorized but unissued shares of preferred stock of the Company, without designation as to series.
On November 7, 2022, in connection with the adoption of the Shareholder Rights Plan, the Company filed a Certificate of Designation of Series A Junior Participating Preferred Stock of Cooper-Standard Holdings Inc. (the “Certificate of Designation”) to its Certificate of Incorporation with the Secretary of State of the State of Delaware, designating 2,000,000 shares of preferred stock as Series A Preferred Stock. As of December 31, 2023, no shares of Series A Preferred Stock were issued or outstanding.
Common Stock
The Company is authorized to issue up to 190,000,000 shares of common stock,Common Stock, par value $0.001 per share. As of December 31, 2020, an aggregate of 18,962,8942023, 19,263,288 shares of its common stockCommon Stock were issued, and 16,897,08517,197,479 shares were outstanding.
Holders of shares of common stockCommon Stock are entitled to 1one vote for each share on each matter on which holders of common stockCommon Stock are entitled to vote. Holders of common stockCommon Stock are entitled to ratably receive dividends and other distributions when, as and if declared by the Company’s board of directorsBoard out of assets or funds legally available therefore. The ABL Facility, the Term Loan Facility, the SeniorNew Notes, and the 2026 Senior Secured Notes each contain covenants that restrict the Company’s ability to pay dividends or make distributions on the common stock,Common Stock, subject to certain exceptions.
In the event of the liquidation, dissolution or winding up of the Company, holders of common stockCommon Stock are entitled to share ratably in the Company assets, if any, remaining after the payment of all the Company’s debts and liabilities.
Share Repurchase Program
In June 2018, the Company’s Board of Directors approved a common stock repurchase program (the “2018 Program”) authorizing the Company to repurchase, in the aggregate, up to $150.0 million$150,000 of its outstanding common stock. Under the 2018 Program, repurchases may be made on the open market, through private transactions, accelerated share repurchases, round lot or block transactions on the New York Stock Exchange or otherwise, as determined by management and in accordance with
NOTES TO CONSOLIDATED FINANCIAL STATEMENTS (Continued)
(Dollar amounts in thousands except per share and share amounts)
prevailing market conditions and federal securities laws and regulations. The Company expects to fund any future repurchases from cash on hand and future cash flows from operations. The Company is not obligated to acquire a particular amount of securities, and the 2018 Program may be discontinued at any time at the Company’s discretion. The 2018 Program was effective beginning November 2018. As of December 31, 2020,2023, the Company had approximately $98,720 of repurchase authorization under the 2018 Program.
The Company did not make any repurchases under the 2018 Program during the yearyears ended December 31, 2020.
2019 Repurchases
In May 2019, the Company entered into an accelerated share repurchase (“ASR”) agreement with a third-party financial institution to repurchase the Company’s common stock pursuant to the 2018 Program. Under the ASR agreement, the Company made an up-front payment of $30,000 and received an initial delivery of 626,305 shares of its common stock in the second quarter of 2019. The repurchase was completed in the third quarter of 2019 when the Company received an additional 72,875 shares. A total of 699,180 shares were repurchased at a weighted average purchase price of $42.91 per share.
In addition to the repurchase under the ASR agreement, during the year ended December 31, 2019, the Company repurchased 85,000 shares at an average purchase price of $69.85 per share, excluding commissions, for a total cost of $5,937.2023, 2022, or 2021.
21.19. Share-Based Compensation
The Company’s long-term incentive plans allow for the grant of various types of share-based awards to key employees and directors of the Company and its affiliates. The Company generally awards grants on an annual basis. There are 2,300,0001,661,639 shares of common stock authorized for awards granted under the current plan. Under previous plans, a total of 5,873,103 shares
NOTES TO CONSOLIDATED FINANCIAL STATEMENTS (Continued)
(Dollar amounts in thousands except per share and share amounts)
were authorized for awards. The plans provide for the grant of stock options, stock appreciation rights, shares of common stock, restricted stock, restricted stock units (“RSUs”), performance-vested restricted stock units (“PUs”), incentive awards and certain other types of awards to key employees and directors of the Company and its affiliates.
The Company measures share-based compensation expense at fair value and recognizes such expense on a straight-line basis over the vesting period of the share-based employee awards. The compensation expense related to stock options, restricted stock and performance units granted to key employees and directors of the Company, which is quantified below, does not represent payments actually made to these employees. Rather, the amounts represent the non-cash compensation expense recognized by the Company in connection with these awards for financial reporting purposes. The actual value of these awards to the recipients will depend on the trading price of the Company’s stock when the awards vest. In accordance with the Company’s long-term incentive plans, share-based compensation awards that settle in shares of Company stock may be delivered on a gross settlement basis or a net settlement basis, as determined by the recipient.
Share-based compensation expense (income) was as follows:
| | | | | | | | | | | | | | | | | |
| Year Ended December 31, |
| 2020 | | 2019 | | 2018 |
| PUs | $ | 916 | | | $ | 277 | | | $ | (3,925) | |
| RSUs | 6,994 | | | 8,432 | | | 9,241 | |
| Stock options | 2,525 | | | 3,156 | | | 3,204 | |
| Total | $ | 10,435 | | | $ | 11,865 | | | $ | 8,520 | |
NOTES TO CONSOLIDATED FINANCIAL STATEMENTS (Continued)
(Dollar amounts in thousands except per share and share amounts)
| | | | | | | | | | | | | | | | | |
| Year Ended December 31, |
| 2023 | | 2022 | | 2021 |
| PUs | $ | 3,755 | | | $ | 248 | | | $ | (916) | |
| RSUs | 3,272 | | | 1,738 | | | 4,201 | |
| Stock options | 691 | | | 1,273 | | | 2,289 | |
| Total | $ | 7,718 | | | $ | 3,259 | | | $ | 5,574 | |
Stock Options
Stock option awards are granted at the fair market value of the Company’s stock price at the date of the grant and have a 10 year10-year term. The stock option grants vest over three years from the date of grant.
Stock option transactions and related information for the year ended December 31, 20202023 was as follows: | | | | | | | | | | | | | | | | | | | | | | | |
| Options | | Weighted Average Exercise Price | | Weighted Average Remaining Contractual Life (Years) | | Aggregate Intrinsic Value |
| Outstanding as of January 1, 2023 | 785,844 | | | $ | 59.41 | | | | | |
| | | | | | | |
| | | | | | | |
| Forfeited | (2,629) | | | $ | 37.28 | | | | | |
| Expired | (99,271) | | | $ | 55.23 | | | | | |
| Outstanding as of December 31, 2023 | 683,944 | | | $ | 58.16 | | | 3.6 | | $ | — | |
| Exercisable as of December 31, 2023 | 645,572 | | | $ | 59.51 | | | 3.4 | | $ | — | |
| | | | | | | | | | | | | | | | | | | | | | | |
| Options | | Weighted Average Exercise Price | | Weighted Average Remaining Contractual Life (Years) | | Aggregate Intrinsic Value |
| Outstanding as of January 1, 2020 | 548,770 | | | $ | 77.68 | | | | | |
| Granted | 233,732 | | | $ | 25.19 | | | | | |
| Exercised | 0 | | | $ | 0 | | | | | |
| Forfeited | (21,757) | | | $ | 49.53 | | | | | |
| Expired | (19,326) | | | $ | 51.62 | | | | | |
| Outstanding as of December 31, 2020 | 741,419 | | | $ | 62.64 | | | 6.1 | | $ | 2,103 | |
| Exercisable as of December 31, 2020 | 408,316 | | | $ | 78.37 | | | 5.0 | | $ | 0 | |
There were no stock options granted during the years ended December 31, 2023 and 2022. The weighted-average grant date fair value of stock options granted during the years ended December 31, 2020, 2019 and 2018 was $8.85, $24.22 and $36.22, respectively. There were no stock options exercised during the year ended December 31, 2020.2021 was $16.46. The total intrinsic value of stock options exercised during the year ended December 31, 2021 was $142. There were no stock options exercised during the years ended December 31, 2019 and 2018 was $243 and $12,422, respectively.2023 or 2022.
As of December 31, 2020,2023, unrecognized compensation expense for stock options amounted to $2,728.$110. Such cost is expected to be recognized over a weighted average period of approximately 1.70.3 years.
The fair value of the stock options was estimated at the date of the grant using the Black-Scholes option pricing model. Expected volatility was based on the historical volatility of the Company’s common stock. The expected stock option life was calculated using the simplified method. The risk-free rate is based on the U.S. Treasury zero-coupon issues with a term equal to the expected stock option life on the date the stock options were granted. The fair value of each stock option was estimated using the following assumptions:
| | | | | | | | | | | | | | | | | |
| 2020 | | 2019 | | 2018 |
| Expected volatility | 33.74% | | 29.48% - 31.10% | | 27.17% - 27.19% |
| Dividend yield | 0.00 | % | | 0.00 | % | | 0.00 | % |
| Expected option life - years | 6.0 | | 6.0 | | 6.0 |
| Risk-free rate | 1.5% | | 1.8% - 2.5% | | 2.6% |
| | | | | | | |
| | | 2021 |
| Expected volatility | | | 48.65% - 50.50% |
| Dividend yield | | | 0.00 | % |
| Expected option life - years | | | 6.0 |
| Risk-free rate | | | 0.6% - 0.9% |
NOTES TO CONSOLIDATED FINANCIAL STATEMENTS (Continued)
(Dollar amounts in thousands except per share and share amounts)
Restricted Stock and Restricted Stock Units
The fair value of the restricted stock and restricted stock units is determined based on the closing price of the common stock on the date of grant. The restricted stock and restricted stock units vest over one or three years.
Restricted stock and restricted stock units transactions and related information for the year ended December 31, 20202023 was as follows:
| | | | | | | | | | | |
| Restricted Stock and Restricted Units | | Weighted Average Grant Date Fair Value |
| Non-vested as of January 1, 2020 | 332,981 | | | $ | 83.60 | |
| Granted | 169,038 | | | $ | 17.62 | |
| Vested | (86,976) | | | $ | 99.41 | |
| Forfeited | (29,408) | | | $ | 73.75 | |
| Non-vested as of December 31, 2020 | 385,635 | | | $ | 54.10 | |
| | | | | | | | | | | |
| Restricted Stock and Restricted Units | | Weighted Average Grant Date Fair Value |
| Non-vested as of January 1, 2023 | 389,036 | | | $ | 11.98 | |
| Granted | 308,612 | | | $ | 16.11 | |
| Vested | (260,790) | | | $ | 6.30 | |
| Forfeited | (27,624) | | | $ | 19.40 | |
| Non-vested as of December 31, 2023 | 409,234 | | | $ | 23.06 | |
The weighted-average grant date fair value of restricted stock and restricted stock units granted during the years ended December 31, 2020, 20192023, 2022 and 20182021 was $17.62, $66.12$16.11, $9.46 and $110.34,$32.38, respectively. The total fair value of restricted stock and
NOTES TO CONSOLIDATED FINANCIAL STATEMENTS (Continued)
(Dollar amounts in thousands except per share and share amounts)
restricted stock units vested during the years ended December 31, 2020, 20192023, 2022 and 20182021 was $7,786, $9,859$1,642, $9,153 and $7,418,$9,299, respectively.
As of December 31, 2020,2023, unrecognized compensation expense for restricted stock and restricted stock units amounted to $5,973.$3,855. Such cost is expected to be recognized over a weighted-average period of approximately 1.21.8 years.
Performance-Vested Restricted Stock Units
The actual number of performance units that will vest depends on the Company’s achievement of target performance goals related to the Company’s ROIC and total shareholder return over a performance period, which may range from 0% to 200% of the target award amount. The PUs cliff vest at the end of their three-year performance period or vest ratably over three years after their initial two-year performance period. PUs that are expected to be settled in shares of the Company’s common stock are accounted for as equity awards, and the fair value is determined based on the closing price of the common stock on the date of grant.grant and a contemporaneous valuation by an independent valuation specialist with respect to the total shareholder return performance units. PUs that are expected to be settled in cash are accounted for as liability awards.
A summary of activity for performance-vested restricted stock units transactions and related information for the year ended December 31, 20202023 was as follows:
| | | | | | | | | | | |
| Performance Units | | Weighted Average Grant Date Fair Value |
| Non-vested as of January 1, 2020 | 194,053 | | | $ | 93.86 | |
| Granted | 130,346 | | | $ | 10.10 | |
| Vested | (48,772) | | | $ | 107.50 | |
| Forfeited | (17,387) | | | $ | 57.57 | |
| Non-vested as of December 31, 2020 | 258,240 | | | $ | 51.45 | |
| | | | | | | | | | | | | | | | | |
| Stock Settled Performance Units | | Cash Settled Performance Units | | Weighted Average Grant Date Fair Value |
| Non-vested as of January 1, 2023 | 195,657 | | | 83,816 | | | $ | 18.50 | |
| Granted | — | | | 324,604 | | | $ | 19.54 | |
| Vested at 0% payout | (64,099) | | | (83,816) | | | $ | 22.50 | |
| Forfeited | (10,434) | | | (27,468) | | | $ | 15.88 | |
| Non-vested as of December 31, 2023 | 121,124 | | | 297,136 | | | $ | 15.69 | |
The weighted-average grant date fair value of performance units granted during the years ended December 31, 2020, 20192023, 2022 and 20182021 was $10.10, $78.41$19.54, $9.41 and $110.40,$39.70, respectively. The total fair value of PUs vested during the years ended December 31, 2020, 20192023, 2022 and 20182021 was $5,243, $5,450,$3,328, $10,578, and $8,256,$4,864, respectively. Actual payout of units vested was 0% during the year ended December 31, 2020 and no cash was paid to settle PUs during the year ended December 31, 2020. Cash paid to settle PUs during the years ended December 31, 20192023, 2022 and 2018 was $3,345 and $13,302, respectively.2021.
As of December 31, 2020,2023, unrecognized compensation expense for the PUs granted in 20202023 and 2022 was $1,448.$3,672 and $1,118, respectively. Such cost is expected to be recognized over a weighted-average period of approximately 2.01.9 years.
NOTES TO CONSOLIDATED FINANCIAL STATEMENTS (Continued)
(Dollar amounts in thousands except per share and share amounts)
The fair value of thecertain performance units is estimated using a Monte Carlo simulation. Expected volatility was calculated based on historical stock price volatility over the previous year. The risk-free rate was based on the U.S. Treasury yield curve, generally represented by U.S. Treasury securities, with a term equal to the expected life of the performance units. The dividend yield was assumed to be zero based on Company’s historical patterns and future expectation. The fair value of the performance units granted in 2020 waswere estimated using the following assumptions:
| | | | | | | |
| 2020 | | |
Expected volatility | 116.60 | % | | |
Dividend yield | 0.00 | % | | |
| | | |
Risk-free rate | 0.10 | % | | |
NOTES TO CONSOLIDATED FINANCIAL STATEMENTS (Continued)
(Dollar amounts in thousands except per share and share amounts)
22. Related Party Transactions
A summary of the material related party transactions with affiliates accounted for under the equity method was as follows:
| | | | | | | | | | | | | | | | | |
| December 31, 2020 | | December 31, 2019 | | December 31, 2018 |
Sales (1) | $ | 21,736 | | | $ | 28,925 | | | $ | 30,826 | |
Purchases (2) | 339 | | | 880 | | | 687 | |
Dividends received (3) | 7,243 | | | 4,917 | | | 4,862 | |
(1) Relates to transactions with Nishikawa Cooper LLC (“NISCO”)
(2) Relates to transactions with NISCO and Polyrub Cooper Standard FTS Private Limited
(3) From NISCO and Nishikawa Tachaplalert Cooper Ltd. inclusive of any gross up of dividend related to withholding tax
Amounts receivable from NISCO as of December 31, 2020 and December 31, 2019 were $3,561 and $4,297, respectively. | | | | | | | | | | | |
| 2023 | | 2022 |
| Expected volatility | 100.42 | % | | 88.24 | % |
| Dividend yield | 0.00 | % | | 0.00 | % |
| | | |
| Risk-free rate | 4.60 | % | | 1.71 | % |
23.20. Contingent Liabilities
Litigation and Claims
Various legal actions, proceedings, and claims (generally, “matters”) are pending or may be instituted or asserted against the Company. The Company accrues for matters when losses are deemed probable and reasonably estimable. Any resulting adjustments, which could be material, are recorded in the period the adjustments are identified. As of December 31, 2020,2023, the Company does not believe that there is a reasonable possibility that any material loss exceeding the amounts already accrued for matters, if any, has been incurred. However, the ultimate resolutions of these matters are inherently unpredictable and could require payment substantially in excess of the amounts that have been accrued or disclosed.
Environmental
The Company is subject to a broad range of federal, state and local environmental and occupational safety and health laws and regulations in the United States and other countries, including those governing: emissions to air, discharges to water, noise and odor emissions; the generation, handling, storage, transportation, treatment, reclamation and disposal of chemicals and waste materials; the cleanup of contaminated properties; and human health and safety. The Company may incur substantial costs associated with hazardous substance contamination or exposure, including cleanup costs, fines, and civil or criminal sanctions, third party property or natural resource damage, personal injury claims or costs to upgrade or replace existing equipment as a result of violations of or liabilities under environmental laws or the failure to maintain or comply with environmental permits required at their locations. In addition, many of the Company’s current and former facilities are located on properties with long histories of industrial or commercial operations, and some of these properties have been subject to certain environmental investigations and remediation activities. The Company maintains environmental reserves for certain of these sites. As of December 31, 20202023 and 2019,2022, the Company had $13,302$11,354 and $6,104,$10,817, respectively, reserved in accrued liabilities and other liabilities on the consolidated balance sheet on an undiscounted basis, which it believes are adequate. Because some environmental laws (such as the Comprehensive Environmental Response, Compensation and Liability Act and analogous state laws) can impose liability retroactively and regardless of fault on potentially responsible parties for the entire cost of cleanup at currently or formerly owned or operated facilities, as well as sites at which such parties disposed or arranged for disposal of hazardous waste, the Company could become liable for investigating or remediating contamination at their current or former properties or other properties (including offsite waste disposal locations). The Company may not always be in complete compliance with all applicable requirements of environmental laws or regulation, and the Company may receive notices of violation or become subject to enforcement actions or incur material costs or liabilities in connection with such requirements. In addition, new environmental requirements or changes to interpretations of existing requirements, or in their enforcement, could have a material adverse effect on the Company’s business, results of operations, and financial condition. The Company has made and will continue to make expenditures to comply with environmental requirements. While the Company’s costs to defend and settle known claims arising under environmental laws have not been material in the past and are not currently estimated to have a material adverse effect on the Company’s financial condition, such costs may be material to the Company’s financial statements in the future.
NOTES TO CONSOLIDATED FINANCIAL STATEMENTS (Continued)
(Dollar amounts in thousands except per share and share amounts)
Brazil Indirect Tax Claim
In 2019, the Superior Judicial Court of Brazil rendered a favorable decision on a case challenging whether a certain state value-added tax should be included in the calculation of federal gross receipts taxes. The decision will allow the Company the right to recover, through offset of federal tax liabilities, amounts collected by the government. As a result of the favorable decision, the Company recorded pre-tax recoveries of $8,000 in the South America segment and in cost of products sold for the year ended December 31, 2019. As of December 31, 2020,2023, the Company had $6,277$640 of pre-tax recoveries remaining. Timing on realization of these remaining recoveries is dependent upon generation of federal tax liabilities eligible for offset.
24.
NOTES TO CONSOLIDATED FINANCIAL STATEMENTS (Continued)
(Dollar amounts in thousands except per share and share amounts)
21. Business Segments
TheFor the periods presented herein, the Company’s organizational structure changed on January 1, 2020, creating a global automotive business (“Automotive”) and Advanced Technology Group (“ATG”). The Company’s business is nowwas organized in the following reportable segments: North America, Europe, Asia Pacific and South America. ATG and allAll other business activities arewere reported in Corporate, eliminations and other. The Corporate, eliminations and other External Sales and Intersegment Sales amounts previously reported during the years ended December 31, 2019 and 2018 have been reclassified from North America and Europe from the table below. The other metrics previously reported during the years ended December 31, 2019 and 2018 and as of December 31, 2019 have been reclassified from North America, Europe, Asia Pacific and South America from the tables below.
The accounting policiesCompany’s principal products within each of the Company’sreportable segments are consistent with those described in Note 2. “Basis of Presentationsealing, fuel and Summary of Significant Accounting Policies.”
brake delivery, and fluid transfer systems. Effective January 1, 2019,2024, the Company changed its management reporting structure with the measurementlaunch of global product line-focused business segments and the chief operating decision maker will prospectively begin to assess operating performance by product line rather than geography. As a result, beginning with the first quarter of 2024, the Company expects to report its operatingfinancial results in two reportable segments based on product line: Sealing Systems and Fluid Handling Systems.
The Company uses Segment adjusted EBITDA as the measure of earnings to assess the performance of each segment adjusted EBITDA.and determine the resources to be allocated to the segments. The results of each segment include certain allocations for general, administrative and other shared costs. Segment adjusted EBITDA may not be comparable to similarly titled measures reported by other companies.
The accounting policies of the Company’s segments are consistent with those described in Note 2. “Basis of Presentation and Summary of Significant Accounting Policies.”
Certain financial information on the Company’s reportable segments was as follows:
| | | | | | | | | | | | | | | | | |
| | Year Ended December 31, |
| | 2020 | | 2019 | | 2018 |
| Sales to external customers | | | | | |
| North America | $ | 1,141,368 | | | $ | 1,543,845 | | | $ | 1,872,938 | |
| Europe | 586,739 | | | 826,335 | | | 982,967 | |
| Asia Pacific | 468,042 | | | 503,953 | | | 571,160 | |
| South America | 60,754 | | | 94,535 | | | 98,063 | |
| Total Automotive | 2,256,903 | | | 2,968,668 | | | 3,525,128 | |
| Corporate, eliminations and other | 118,536 | | | 139,732 | | | 98,914 | |
| Consolidated | $ | 2,375,439 | | | $ | 3,108,400 | | | $ | 3,624,042 | |
| | | | | |
| Intersegment sales | | | | | |
| North America | $ | 12,267 | | | $ | 19,701 | | | $ | 18,624 | |
| Europe | 9,569 | | | 11,744 | | | 15,185 | |
| Asia Pacific | 2,406 | | | 3,050 | | | 5,115 | |
| South America | 72 | | | 193 | | | 103 | |
| Total Automotive | 24,314 | | | 34,688 | | | 39,027 | |
| Corporate, eliminations and other | (24,314) | | | (34,688) | | | (39,027) | |
| Consolidated | $ | 0 | | | $ | 0 | | | $ | 0 | |
| | | | | |
| | | | | |
| | | | | |
| | | | | |
| | | | | |
| | | | | |
| | | | | | | | | | | | | | | | | |
| | Year Ended December 31, |
| | 2023 | | 2022 | | 2021 |
| Sales to external customers | | | | | |
| North America | $ | 1,486,100 | | | $ | 1,341,099 | | | $ | 1,148,257 | |
| Europe | 648,256 | | | 503,672 | | | 518,245 | |
| Asia Pacific | 452,441 | | | 443,126 | | | 458,306 | |
| South America | 125,629 | | | 100,420 | | | 61,713 | |
| Total Automotive | 2,712,426 | | | 2,388,317 | | | 2,186,521 | |
| Corporate, eliminations and other | 103,453 | | | 137,074 | | | 143,670 | |
| Consolidated | $ | 2,815,879 | | | $ | 2,525,391 | | | $ | 2,330,191 | |
| | | | | |
| Intersegment sales | | | | | |
| North America | $ | 10,780 | | | $ | 11,979 | | | $ | 9,775 | |
| Europe | 8,195 | | | 7,272 | | | 9,502 | |
| Asia Pacific | 10,101 | | | 3,847 | | | 1,863 | |
| South America | 12 | | | 54 | | | 15 | |
| Total Automotive | 29,088 | | | 23,152 | | | 21,155 | |
| Corporate, eliminations and other | (29,088) | | | (23,152) | | | (21,155) | |
| Consolidated | $ | — | | | $ | — | | | $ | — | |
| | | | | |
| | | | | |
| | | | | |
| | | | | |
| | | | | |
| | | | | |
| Adjusted EBITDA | | | | | |
| North America | $ | 125,580 | | | $ | 70,819 | | | $ | 54,616 | |
| Europe | 25,258 | | | (37,137) | | | (49,599) | |
| Asia Pacific | 26,429 | | | 1,556 | | | (16,756) | |
| South America | 10,692 | | | 97 | | | (9,852) | |
| Total Automotive | 187,959 | | | 35,335 | | | (21,591) | |
| Corporate, eliminations and other | (20,883) | | | 2,533 | | | 13,557 | |
| Consolidated | $ | 167,076 | | | $ | 37,868 | | | $ | (8,034) | |
| | | | | |
NOTES TO CONSOLIDATED FINANCIAL STATEMENTS (Continued)
(Dollar amounts in thousands except per share and share amounts)
| | | | | | | | | | | | | | | | | |
| | Year Ended December 31, |
| | 2020 | | 2019 | | 2018 |
| Adjusted EBITDA | | | | | |
| North America | $ | 90,638 | | | $ | 213,250 | | | $ | 319,653 | |
| Europe | (39,004) | | | 22,922 | | | 40,980 | |
| Asia Pacific | 12,472 | | | (27,497) | | | 14,118 | |
| South America | (13,841) | | | (3,446) | | | (7,138) | |
| Total Automotive | 50,265 | | | 205,229 | | | 367,613 | |
| Corporate, eliminations and other | (14,588) | | | (3,621) | | | 5,045 | |
| Consolidated | $ | 35,677 | | | $ | 201,608 | | | $ | 372,658 | |
| | | | | |
| Net interest expense (income) | | | | | |
| North America | $ | 504 | | | $ | 96 | | | $ | (380) | |
| Europe | 1,082 | | | 318 | | | 616 | |
| Asia Pacific | 2,205 | | | 4,139 | | | 2,355 | |
| South America | 225 | | | 3 | | | (62) | |
| Total Automotive | 4,016 | | | 4,556 | | | 2,529 | |
| Corporate, eliminations and other | 55,151 | | | 39,557 | | | 38,475 | |
| Consolidated | $ | 59,167 | | | $ | 44,113 | | | $ | 41,004 | |
| | | | | |
| Depreciation and amortization expense | | | | | |
| North America | $ | 60,193 | | | $ | 62,604 | | | $ | 61,589 | |
| Europe | 36,707 | | | 38,572 | | | 41,855 | |
| Asia Pacific | 31,789 | | | 31,881 | | | 28,822 | |
| South America | 2,392 | | | 2,658 | | | 2,087 | |
| Total Automotive | 131,081 | | | 135,715 | | | 134,353 | |
| Corporate, eliminations and other | 23,148 | | | 16,238 | | | 12,345 | |
| Consolidated | $ | 154,229 | | | $ | 151,953 | | | $ | 146,698 | |
| | | | | |
| Capital expenditures | | | | | |
| North America | $ | 30,921 | | | $ | 64,887 | | | $ | 72,315 | |
| Europe | 25,369 | | | 34,587 | | | 53,104 | |
| Asia Pacific | 21,809 | | | 40,214 | | | 70,672 | |
| South America | 2,476 | | | 7,340 | | | 5,734 | |
| Total Automotive | 80,575 | | | 147,028 | | | 201,825 | |
| Corporate, eliminations and other | 11,219 | | | 17,438 | | | 16,246 | |
| Consolidated | $ | 91,794 | | | $ | 164,466 | | | $ | 218,071 | |
| | | | | | | | | | | | | | | | | |
| | Year Ended December 31, |
| | 2023 | | 2022 | | 2021 |
| Net interest expense | | | | | |
| North America | $ | (331) | | | $ | 365 | | | $ | 470 | |
| Europe | 2,251 | | | 560 | | | 1,274 | |
| Asia Pacific | 1,677 | | | 1,602 | | | 1,445 | |
| South America | (232) | | | 1,659 | | | 362 | |
| Total Automotive | 3,365 | | | 4,186 | | | 3,551 | |
| Corporate, eliminations and other | 126,712 | | | 74,328 | | | 68,960 | |
| Consolidated | $ | 130,077 | | | $ | 78,514 | | | $ | 72,511 | |
| | | | | |
| Depreciation and amortization expense | | | | | |
| North America | $ | 50,964 | | | $ | 51,592 | | | $ | 54,779 | |
| Europe | 20,567 | | | 26,694 | | | 32,655 | |
| Asia Pacific | 25,448 | | | 27,509 | | | 32,426 | |
| South America | 3,317 | | | 2,701 | | | 2,531 | |
| Total Automotive | 100,296 | | | 108,496 | | | 122,391 | |
| Corporate, eliminations and other | 9,635 | | | 13,980 | | | 16,617 | |
| Consolidated | $ | 109,931 | | | $ | 122,476 | | | $ | 139,008 | |
| | | | | |
| Capital expenditures | | | | | |
| North America | $ | 51,185 | | | $ | 39,276 | | | $ | 36,370 | |
| Europe | 10,568 | | | 7,965 | | | 27,384 | |
| Asia Pacific | 14,036 | | | 15,374 | | | 20,473 | |
| South America | 3,268 | | | 6,107 | | | 3,959 | |
| Total Automotive | 79,057 | | | 68,722 | | | 88,186 | |
| Corporate, eliminations and other | 1,686 | | | 2,428 | | | 7,921 | |
| Consolidated | $ | 80,743 | | | $ | 71,150 | | | $ | 96,107 | |
NOTES TO CONSOLIDATED FINANCIAL STATEMENTS (Continued)
(Dollar amounts in thousands except per share and share amounts)
| | | | | | | | | | | | | | | | | |
| Year Ended December 31, |
| 2020 | | 2019 | | 2018 |
| Adjusted EBITDA | $ | 35,677 | | | $ | 201,608 | | | $ | 372,658 | |
| Impairment of assets held for sale | (86,470) | | | 0 | | | 0 | |
| Gain on sale of business, net | 2,834 | | | 191,571 | | | 0 | |
| Restructuring charges | (39,482) | | | (51,102) | | | (29,722) | |
| Other impairment charges | (17,417) | | | (23,139) | | | (43,706) | |
| Pension settlement charges | (184) | | | (15,997) | | | (775) | |
| Project costs | (5,648) | | | (2,090) | | | (4,881) | |
| Lease termination costs | (771) | | | (1,167) | | | 0 | |
| Divested noncontrolling interest debt extinguishment | (3,595) | | | 0 | | | 0 | |
| Goodwill impairment charges | 0 | | | 0 | | | (39,818) | |
| Gain on sale of land | 0 | | | 0 | | | 10,377 | |
| Amortization of inventory write-up | 0 | | | 0 | | | (1,460) | |
| Loss on refinancing and extinguishment of debt | 0 | | | 0 | | | (770) | |
| EBITDA | $ | (115,056) | | | $ | 299,684 | | | $ | 261,903 | |
| Income tax (expense) benefit | 60,847 | | | (36,089) | | | 29,400 | |
| Interest expense, net of interest income | (59,167) | | | (44,113) | | | (41,004) | |
| Depreciation and amortization | (154,229) | | | (151,953) | | | (146,698) | |
| Net (loss) income attributable to Cooper-Standard Holdings Inc. | $ | (267,605) | | | $ | 67,529 | | | $ | 103,601 | |
| | | | | | | | | | | | | | | | | |
| Year Ended December 31, |
| 2023 | | 2022 | | 2021 |
| Adjusted EBITDA | $ | 167,076 | | | $ | 37,868 | | | $ | (8,034) | |
| Impairment charges | (4,768) | | | (43,710) | | | (25,609) | |
| Restructuring charges | (18,018) | | | (18,304) | | | (36,950) | |
| Pension settlement and curtailment charges | (16,035) | | | (2,682) | | | (1,279) | |
| Lease termination costs | — | | | — | | | (748) | |
| Gain on sale of businesses, net | 586 | | | — | | | 696 | |
| Gain on sale of fixed assets, net | — | | | 33,391 | | | — | |
| Deconsolidation of joint venture | — | | | (2,257) | | | — | |
| | | | | |
| Indirect tax adjustments | — | | | (1,409) | | | — | |
| Loss on refinancing and extinguishment of debt | (81,885) | | | — | | | — | |
| | | | | |
| EBITDA | $ | 46,956 | | | $ | 2,897 | | | $ | (71,924) | |
| Income tax expense | (8,933) | | | (17,291) | | | (39,392) | |
| Interest expense, net of interest income | (130,077) | | | (78,514) | | | (72,511) | |
| Depreciation and amortization | (109,931) | | | (122,476) | | | (139,008) | |
| Net loss attributable to Cooper-Standard Holdings Inc. | $ | (201,985) | | | $ | (215,384) | | | $ | (322,835) | |
| | | | | | | | | | | |
| December 31, |
| 2023 | | 2022 |
| Segment assets | | | |
| North America | $ | 837,615 | | | $ | 851,623 | |
| Europe | 306,248 | | | 338,225 | |
| Asia Pacific | 435,653 | | | 447,257 | |
| South America | 89,075 | | | 73,403 | |
| Total Automotive | 1,668,591 | | | 1,710,508 | |
| Corporate, eliminations and other | 203,708 | | | 253,021 | |
| Consolidated | $ | 1,872,299 | | | $ | 1,963,529 | |
| | | | | | | | | | | |
| December 31, |
| 2020 | | 2019 |
| Segment assets | | | |
| North America | $ | 907,652 | | | $ | 1,040,650 | |
| Europe | 465,031 | | | 553,977 | |
| Asia Pacific | 587,610 | | | 614,952 | |
| South America | 64,800 | | | 65,438 | |
| Total Automotive | 2,025,093 | | | 2,275,017 | |
| Corporate, eliminations and other | 586,851 | | | 360,565 | |
| Consolidated | $ | 2,611,944 | | | $ | 2,635,582 | |
The decrease in asset amounts in Europe and Asia Pacific as of December 31, 2020 was primarily attributable to the Company’s recent divestitures in those regions. See Note 5. “Divestitures” for further detail on these transactions.
NOTES TO CONSOLIDATED FINANCIAL STATEMENTS (Continued)
(Dollar amounts in thousands except per share and share amounts)
Geographic Information
Geographic information for revenues, based on country of origin, and property, plant and equipment, net, is as follows:
| | | | | | | | | | | | | | | | | |
| | Year Ended December 31, |
| | 2020 | | 2019 | | 2018 |
| Revenues | | | | | |
| Mexico | $ | 578,790 | | | $ | 723,228 | | | $ | 763,094 | |
| United States | 518,497 | | | 729,866 | | | 883,273 | |
| China | 364,207 | | | 355,667 | | | 466,119 | |
| Poland | 191,530 | | | 270,197 | | | 245,853 | |
| Canada | 125,729 | | | 188,652 | | | 278,349 | |
| Germany | 114,221 | | | 151,441 | | | 187,374 | |
| France | 97,289 | | | 159,859 | | | 305,416 | |
| Other | 385,176 | | | 529,490 | | | 494,564 | |
| Consolidated | $ | 2,375,439 | | | $ | 3,108,400 | | | $ | 3,624,042 | |
| | | | | |
| | | December 31, |
| | | 2020 | | 2019 |
| Property, plant and equipment, net | | | | | |
| China | | | $ | 192,005 | | | $ | 196,502 | |
| United States | | | 188,246 | | | 218,640 | |
| Mexico | | | 145,452 | | | 153,414 | |
| Poland | | | 77,789 | | | 88,162 | |
| Germany | | | 72,979 | | | 78,967 | |
| France | | | 33,087 | | | 32,938 | |
| Canada | | | 29,500 | | | 31,568 | |
| Other | | | 153,251 | | | 188,086 | |
| Consolidated | | | $ | 892,309 | | | $ | 988,277 | |
| | | | | | | | | | | | | | | | | |
| | Year Ended December 31, |
| | 2023 | | 2022 | | 2021 |
| Revenues | | | | | |
| Mexico | $ | 774,357 | | | $ | 696,755 | | | $ | 592,777 | |
| United States | 616,883 | | | 589,801 | | | 539,528 | |
| China | 354,492 | | | 354,741 | | | 371,811 | |
| Poland | 226,254 | | | 166,114 | | | 168,357 | |
| Canada | 168,738 | | | 144,890 | | | 116,854 | |
| Germany | 112,686 | | | 116,153 | | | 116,509 | |
| France | 98,915 | | | 90,711 | | | 94,334 | |
| Other | 463,554 | | | 366,226 | | | 330,021 | |
| Consolidated | $ | 2,815,879 | | | $ | 2,525,391 | | | $ | 2,330,191 | |
| | | | | |
| | | December 31, |
| | | 2023 | | 2022 |
| Property, plant and equipment, net | | | | | |
| Mexico | | | $ | 134,442 | | | $ | 132,956 | |
| United States | | | 124,240 | | | 134,978 | |
| China | | | 118,306 | | | 140,182 | |
| Poland | | | 44,535 | | | 45,100 | |
| Germany | | | 27,945 | | | 30,606 | |
| Canada | | | 27,375 | | | 26,416 | |
| France | | | 18,161 | | | 18,834 | |
| Other | | | 113,427 | | | 113,788 | |
| Consolidated | | | $ | 608,431 | | | $ | 642,860 | |
Customer Concentration
Sales to customers of the Company which contributed 10% or more of its total consolidated sales and the related percentage of consolidated Company sales for 2020, 20192023, 2022 and 20182021 are as follows:
| | | | | | | | | | | | | | | | | |
| 2020 Percentage of Net Sales | | 2019 Percentage of Net Sales | | 2018 Percentage of Net Sales |
| Customer | | | | | |
| Ford | 24 | % | | 25 | % | | 27 | % |
| General Motors | 19 | % | | 18 | % | | 19 | % |
| Fiat Chrysler Automobiles* | 11 | % | | 12 | % | | 11 | % |
* Subsequent to December 31, 2020, Fiat Chrysler Automobiles merged with Groupe PSA. | | | | | | | | | | | | | | | | | |
| 2023
% of Net Sales | | 2022
% of Net Sales | | 2021
% of Net Sales |
| Customer | | | | | |
| Ford | 25 | % | | 25 | % | | 24 | % |
| General Motors | 17 | % | | 19 | % | | 17 | % |
| Stellantis | 13 | % | | 14 | % | | 14 | % |
SCHEDULE II
Valuation and Qualifying Accounts
(dollarsDollars amounts in millions)
| | | | | | | | | | | | | | | | | | | | | | | | | | | | | | | | |
| Description | | Balance at beginning of period | | Charged to Expenses | | Charged (credited) to other accounts (1) | | Deductions (2) | | Balance at end of period |
| Allowance for credit losses | | | | | | | | | | |
| Year ended December 31, 2020 | | $ | 10.7 | | (3) | 0.7 | | | 0.5 | | | (4.8) | | | $ | 7.1 | |
| Year ended December 31, 2019 | | $ | 5.6 | | | 5.5 | | (4) | (0.1) | | | (1.9) | | | $ | 9.1 | |
| Year ended December 31, 2018 | | $ | 4.2 | | | 4.2 | | | (0.1) | | | (2.7) | | | $ | 5.6 | |
| | | | | | | | | | | | | | | | | | | | | | | | | | | | | | | | |
| Description | | Balance at beginning of period | | Charged to Expenses | | Charged (credited) to other accounts (1) | | Deductions (2) | | Balance at end of period |
| Allowance for credit losses: | | | | | | | | | | |
| Year ended December 31, 2023 | | $ | 17.2 | | | 1.9 | | | (12.4) | | | (0.8) | | | $ | 5.9 | |
| Year ended December 31, 2022 | | $ | 20.3 | | | (0.2) | | | (2.1) | | | (0.8) | | | $ | 17.2 | |
| Year ended December 31, 2021 | | $ | 7.1 | | | 16.4 | | (3) | (0.3) | | | (2.9) | | | $ | 20.3 | |
(1) Primarily usage of a previously recorded allowance for credit loss resulting from the bankruptcy proceedings of a divested joint venture for the year ended December 31, 2023, and foreign currency translation.translation for the years ended December 31, 2022 and 2021.
(2)Includes impact of divestitures.
(3) Includes $1.6 adjustment due to adoption$11.2 resulting from the bankruptcy proceedings of ASU 2016-13 as of January 1, 2020.a divested joint venture.
(4) Increase in 2019 relates to commercial settlements in China.
| | | | | | | | | | | | | | | | | | | | | | | | | | | | | | | | |
| Description | | Balance at beginning of period | | Additions | | | | Balance at end of period |
| Charged to Income | | Charged to Equity (5) | | Deductions | |
| Tax valuation allowance | | | | | | | | | | |
| Year ended December 31, 2020 | | $ | 194.8 | | | 51.6 | | (6) | 7.3 | | | (19.3) | | (7) | $ | 234.4 | |
| Year ended December 31, 2019 | | $ | 171.2 | | | 24.6 | | (8) | (1.0) | | | 0 | | | $ | 194.8 | |
| Year ended December 31, 2018 | | $ | 189.4 | | | 33.1 | | (9) | (10.4) | | | (40.9) | | (10) | $ | 171.2 | |
| | | | | | | | | | | | | | | | | | | | | | | | | | | | | | | | |
| Description | | Balance at beginning of period | | Additions | | | | Balance at end of period |
| Charged to Income | | Charged to Equity (4) | | Deductions | |
| Tax valuation allowance: | | | | | | | | | | |
| Year ended December 31, 2023 | | $ | 384.8 | | | 47.3 | | (5) | 6.6 | | | — | | | $ | 438.7 | |
| Year ended December 31, 2022 | | $ | 335.0 | | | 65.6 | | (6) | (15.8) | | | — | | | $ | 384.8 | |
| Year ended December 31, 2021 | | $ | 234.4 | | | 124.2 | | (7) | (23.6) | | | — | | | $ | 335.0 | |
(5)(4) Includes foreign currency translation.
(5) Primarily related to 2023 losses with no benefit in the U.S. and certain foreign jurisdictions.
(6) Primarily related to 20202022 losses with no benefit in the U.S. and certain foreign jurisdictions and U.S. states andin addition to new valuation allowancesallowance in foreign jurisdictions and U.S. states.Poland.
(7) Deductions a result of the divestiture of our European rubber, fluid transfer, and specialty sealing businesses as well as our Indian operations.
(8) Primarily related to 20192021 losses with no benefit in the U.S. and certain foreign jurisdictions.
(9) Primarily relatedjurisdictions in addition to 2018 losses with no benefit in certain foreign jurisdictions.
(10) Primarily related to release ofnew valuation allowance in the U.S., France and France.Canada.
Item 9. Changes in and Disagreements with Accountants on Accounting and Financial Disclosure
Not applicable.
Item 9A. Controls and Procedures
Evaluation of Disclosure Controls and Procedures
The Company has evaluated, under the supervision and with the participation of the Company’s management, including the Company’s Chief Executive Officer and Chief Financial Officer, the effectiveness of the Company’s disclosure controls and procedures (as defined in Rule 13a-15(e) under the Securities Exchange Act of 1934, as amended (the “Exchange Act”)) as of December 31, 2020.2023. Because of the inherent limitations in all control systems, no evaluation of controls can provide absolute assurance that all control issues and instances of fraud, if any, within the Company have been detected. However, based on that evaluation, the Company’s Chief Executive Officer along with the Chief Financial Officer have concluded that the Company’s disclosure controls and procedures were effective at a reasonable assurance level as of December 31, 2020.2023.
Management’s Report on Internal Control over Financial Reporting
The Company’s management is responsible for establishing and maintaining adequate internal control over financial reporting, as such term is defined in Exchange Act Rule 13a-15(f). Under the supervision and with the participation of the Company’s management, including the Company’s Chief Executive Officer and Chief Financial Officer, the Company conducted an evaluation of the effectiveness of internal control over financial reporting based on the framework in Internal Control—Integrated Framework issued by the Committee of Sponsoring Organizations of the Treadway Commission in 2013. Based on the evaluation under the framework in Internal Control—Integrated Framework, management concluded that the Company’s internal control over financial reporting was effective as of December 31, 2020.2023.
The attestation report of the Company’s independent registered public accounting firm regarding internal control over financial reporting is set forth in Item 8. “Financial Statements and Supplementary Data” of this Report under the caption “Report of Independent Registered Public Accounting Firm on Internal Control over Financial Reporting” and incorporated herein by reference.
Changes in Internal Control over Financial Reporting
There was no change in the Company’s internal control over financial reporting that occurred during the fourth quarter ended December 31, 20202023 that has materially affected, or is reasonably likely to materially affect, the Company’s internal control over financial reporting.
Item 9B. Other Information
None.Rule 10b5-1 Trading Arrangements
During the three months ended December 31, 2023, none of the Company's directors or officers (as defined in Rule 16a-1(f) of the Securities Exchange Act of 1934, as amended), adopted, terminated or modified a Rule 10b5-1 trading arrangement or non-Rule 10b5-1 trading arrangement (as such terms are defined in Item 408 of Regulation S-K of the Securities Act of 1933, as amended).
Item 9C. Disclosure Regarding Foreign Jurisdictions that Prevent Inspections
Not applicable.
PART III
Item 10. Directors, Executive Officers and Corporate Governance
Directors and Executive Officers
The information required by Item 10 regarding the Company’s directors is incorporated by reference from the information under the headings “Proposals - Proposal 1: Election of Directors” in the Company’s definitive Proxy Statement for its 20212024 Annual Meeting of Stockholders (the “2021“2024 Proxy Statement”). The information required by Item 10 regarding the Company’s executive officers is incorporated by reference from the information under the headings “Corporate Governance, Board and Committee Matters - Executive Officers” in the 20212024 Proxy Statement.
Audit Committee
The information required by Item 10 regarding the Audit Committee, including the identification of the Audit Committee members and the “audit committee financial expert,” is incorporated by reference from the information in the 20212024 Proxy Statement under the heading “Corporate Governance, Board and Committee Matters - Board Committees and Their Functions - Audit Committee.”
Compliance with Section 16(a) of The Exchange Act
The information required by Item 10 regarding compliance with Section 16(a) of the Exchange Act, if any, is incorporated by reference from the information in the 20212024 Proxy Statement under the heading “Corporate Governance, Board and Committee Matters - Delinquent Section 16(a) Reports.”
Code of Conduct
The information required by Item 10 regarding our code of ethics is incorporated by reference from the information in the 20212024 Proxy Statement under the heading “Corporate Governance.”Statement. The Company’s Code of Conduct applies to all of the Company’s officers, directors and employees and is available on the Company’s website at www.cooperstandard.com. To access the Code of Conduct, first click on “Investors” and then click on “Corporate Governance.”
Item 11. Executive Compensation
The information required by Item 11 regarding executive and director compensation, Compensation Committee Interlocks and Insider Participation, and the Compensation Committee Report is incorporated by reference from the information in the 2021to our 2024 Proxy Statement under the headings “Corporate Governance, Board and Committee Matters - Director Compensation,” “Proposal 2: Advisory Vote on Named Executive Officer Compensation - Compensation Discussion and Analysis,” “Proposal 2: Advisory Vote on Named Executive Officer Compensation - Compensation Committee Report” and “Proposal 2: Advisory Vote on Named Executive Officer Compensation - Executive Compensation.”Statement.
Item 12. Security Ownership of Certain Beneficial Owners and Management and Related Stockholder Matters
The information required by Item 12 is incorporated by reference from the information in the 2021to our 2024 Proxy Statement under the heading “Corporate Governance, Board and Committee Matters - Stock Ownership and Related Stockholder Matters.”Statement.
Item 13. Certain Relationships and Related Transactions, and Director Independence
The information required by Item 13 regarding transactions with related persons is incorporated by reference from the information in 2021to our 2024 Proxy Statement under the heading “Transactions with Related Persons.” The information required by Item 13 regarding the independence of the Company’s directors is incorporated by reference from the information in the 2021 Proxy Statement under the heading “Corporate Governance - Board of Directors - Independence of Directors.”Statement.
Item 14. Principal Accounting Fees and Services
The information required underby Item 14 is incorporated by reference from the information in the 2021to our 2024 Proxy Statement under the heading “Fees and Services of Independent Registered Public Accounting Firm.”Statement.
PART IV
Item 15. Exhibits and Financial Statement Schedules
(a) Documents Filed as Part of this Annual Report on Form 10-K:
| | | | | |
| |
| | 10-K
Report
page(s) Page(s) |
| 1. Financial Statements | |
| Report of Ernst & Young LLP, Independent Registered Public Accounting Firm | |
| Report of Ernst & Young LLP, Independent Registered Public Accounting Firm, Internal Control over Financial Reporting | |
Consolidated statements of operations for the years ended December 31, 2020, 20192023, 2022 and 20182021 | |
Consolidated statements of comprehensive income (loss) for the years ended December 31, 2020, 20192023, 2022 and 20182021 | |
Consolidated balance sheets as of December 31, 20202023 and December 31, 20192022 | |
Consolidated statements of changes in equity for the years ended December 31, 2020, 20192023, 2022 and 20182021 | |
Consolidated statements of cash flows for the years ended December 31, 2020, 20192023, 2022 and 20182021 | |
| Notes to consolidated financial statements | |
| |
| 2. Financial Statement Schedules | |
| |
| Schedule II—Valuation and Qualifying Accounts | |
| |
| All other financial statement schedules are not required under the related instructions or are inapplicable and therefore have been omitted. | |
| |
| 3. Exhibits listed on the “Index to Exhibits” | |
Index to Exhibits
Unless otherwise provided, the SEC File Number under which each document incorporated by reference herein was filed is 001-36127.
| | | | | | | | |
| | |
| Exhibit No. | | Description of Exhibit |
| 2.1* | | |
| |
| 3.1* | | |
| |
| 3.2* | | |
| |
| 3.3* | | |
| |
| 3.4* | | |
| | |
| 3.5* | | |
| | |
| 4.1* | | |
| |
| 4.2* | | |
| | |
| 4.3* | | |
| | |
| 4.4* | | |
| 4.5* | | |
| | |
| | | | | | | | |
| | |
| Exhibit No. | | Description of Exhibit |
| 4.6* | | |
| | |
| 4.7* | | |
| | |
| 4.8* | | |
| | |
| 10.1* | | Third Amended and Restated Loan Agreement, dated as of November 2, 2016, among Cooper-Standard Automotive Inc., Cooper-Standard Automotive Canada Limited, Cooper-Standard Automotive International Holdings B.V., and certain subsidiaries of Cooper-Standard Automotive Inc., as guarantors, CS Intermediate HoldCo 1 LLC, as Holdings, the lenders party thereto and Bank of America, N.A. as agent for such lenders (incorporated by reference to Exhibit 10.1 to Cooper-Standard Holdings Inc.’s Current Report on Form 8-K filed November 7, 2016). |
| |
| 10.2* | | |
| | |
| 10.3* | | Amendment No. 1, dated as of November 2, 2016, to the Term Loan Credit Agreement, among Cooper-Standard Automotive Inc., as the borrower, certain subsidiaries of Cooper-Standard Automotive Inc., as guarantors, CS Intermediate HoldCo 1 LLC, as Holdings, Deutsche Bank AG New York Branch, as Administrative Agent and Collateral Agent and other lenders party thereto (incorporated by reference to Exhibit 10.2 to Cooper-Standard Holdings Inc.’s Current Report on Form 8-K filed November 7, 2016). |
| | | | | | | | |
| | |
Exhibit No. | | Description of Exhibit |
| | |
| 10.4* | | Amendment No. 2, dated as of May 2, 2017 to the Term Loan Credit Agreement, among Cooper-Standard Automotive Inc., as the borrower, certain subsidiaries of Cooper-Standard Automotive Inc., as guarantors, CS Intermediate Holdco 1 LL, as Holdings, Deutsche Bank AG New York Branch, as Administrative Agent and Collateral Agent and the other lenders party thereto (incorporated by reference to Exhibit 10.2 to Cooper-Standard Holdings Inc.’s Quarterly Report on Form 10-Q for the fiscal quarter ended June 30, 2017). |
| | |
| 10.5* | | Amendment No. 3, dated as of March 6, 2018 to the Term Loan Credit Agreement, among Cooper-Standard Automotive Inc., as the borrower, certain subsidiaries of Cooper-Standard Automotive Inc., as guarantors, CS Intermediate Holdco 1 LL, as Holdings, Deutsche Bank AG New York Branch, as Administrative Agent and Collateral Agent and the other lenders party thereto (incorporated by reference to Exhibit 10.1 to Cooper-Standard Holdings Inc.’s Quarterly Report on Form 10-Q for the fiscal quarter ended March 31, 2018).
|
| | |
| 10.6* | | Amendment No. 1, dated as of March 24, 2020, to the Third Amended and Restated Loan Agreement and Limited Waiver by and among CS Intermediate Holdco 1 LLC, Cooper-Standard Automotive Inc., Cooper-Standard Automotive Canada Limited, Cooper-Standard Automotive International Holdings B.V., certain subsidiaries of Cooper-Standard Automotive Inc., the lenders party thereto and Bank of America, N.A. as agent for such lenders(incorporated (incorporated by reference to Exhibit 10.410.4 to Cooper-Standard Holdings Inc.’s Quarterly Report on Form 10-Q for the fiscal quarter ended March 31, 2020)2020). |
| | |
| | | | | | | | |
| | |
| Exhibit No. | | Description of Exhibit |
| 10.7* | | |
| | |
10.8*† | | |
| |
| 10.9* | | |
| | |
| 10.10* | | Third Amendment, dated as of December 19, 2022, to the Third Amended and Restated Loan Agreement, among CS Intermediate Holdco 1 LLC, Cooper-Standard Automotive Inc., Cooper-Standard Automotive Canada Limited, Cooper-Standard Automotive International Holdings B.V., certain subsidiaries of Cooper-Standard Automotive Inc., the lenders party thereto and Bank of America, N.A. as agent for such lenders (incorporated by reference to Exhibit 10.2 to Cooper-Standard Holdings Inc.’s Current Report on Form 8-K filed December 20, 2022). |
| | |
| 10.11* | | |
| | |
| 10.12*† | | |
| |
10.10*10.13*† | | |
| |
10.11*† | | |
| |
10.12*† | | |
| |
10.13*† | | |
| |
| 10.14*† | | |
| | |
| | | | | | | | |
| | |
Exhibit No. | | Description of Exhibit |
| 10.15*† | | |
| | |
| | |
| |
10.16*† | | |
| |
10.17*† | | |
| |
10.18*† | | |
| |
10.19*† | | |
| |
10.20*10.17*† | | |
| |
10.21*† | | |
| |
10.22*† | | |
| | |
10.23*† | | |
| | |
10.24*† | | |
| | |
10.25*† | | |
| | |
| | | | | | | | |
| | |
| Exhibit No. | | Description of Exhibit |
10.26*10.18*† | | |
| | |
10.27*† | | |
| | | | | | | | |
| | |
Exhibit No. | | Description of Exhibit |
| | |
10.28*10.19*† | | |
| |
10.29*10.20*† | | |
| | |
10.30*10.21*† | | |
| | |
10.31*† | | |
| | |
10.32*† | | |
| | |
10.33*† | | |
| | |
10.34*10.22*† | | |
| | |
10.35*† | | |
| | |
10.36*† | | |
| | |
10.37*10.23*† | | |
| | |
10.38*10.24*† | | |
| | |
10.39*† | | |
| | |
| | | | | | | | |
| | |
Exhibit No. | | Description of Exhibit |
10.40*10.25*† | |
|
| | |
| | |
| | |
| | |
| | |
| | |
| | |
| | |
| | |
10.41*10.26*† | |
|
| | |
10.42*† | | |
| | |
10.43*† | | |
| | |
10.44*† | | |
| | |
10.45*† | | |
| | |
10.46*10.27*† | | |
| | |
10.47*† | | |
| | |
10.48*† | | |
| | |
10.49*† | | |
| | |
10.50*† | | |
| | |
10.51*† | | |
| | |
| | | | | | | | |
| | |
Exhibit No. | | Description of Exhibit |
10.52*10.28*† | | |
| | |
10.53*† | | |
| | |
10.54*† | | |
| | |
| 10.29*† | | |
| | |
| 10.30*† | | |
| | |
| | | | | | | | |
| | |
| Exhibit No. | | Description of Exhibit |
10.55*10.31*† | | |
| | |
| 10.32*† | | |
| | |
| 10.33*† | | |
| | |
| 10.34*† | | |
| | |
10.56*10.35*† | | |
| | |
10.57*10.36*† | | |
| | |
10.58*10.37*† | | |
| | |
10.59*10.38*† | | |
| | |
10.60*10.39*† | | |
| | |
10.61**10.40*† | | |
| 10.41*† | | |
| | |
| 10.42*† | | |
| | |
| 10.43*† | | |
| | | | | | | | |
| | |
| Exhibit No. | | Description of Exhibit |
| | |
| 10.44*† | | |
| | |
| 10.45*† | | |
| | |
| 21.1** | | |
| |
| 23.1** | | |
| |
| 31.1** | | |
| |
| 31.2** | | |
| |
| | | | | | | | |
| | |
Exhibit No. | | Description of Exhibit |
| 32*** | | |
| |
| 97.1** | | |
| | |
| 101.SCH**** | | Inline XBRL Taxonomy Extension Schema Document |
| |
| 101.CAL**** | | Inline XBRL Taxonomy Extension Calculation Linkbase Document |
| |
| 101.DEF**** | | Inline XBRL Taxonomy Extension Definition Linkbase Document |
| |
| 101.LAB**** | | Inline XBRL Taxonomy Label Linkbase Document |
| |
| 101.PRE**** | | Inline XBRL Taxonomy Extension Presentation Linkbase Document |
| | |
| 104**** | | Cover Page Interactive Data File, formatted in Inline XBRL |
* Incorporated by reference as an exhibit to this Report.
** Filed with this Report.
*** Furnished with this Report
**** Submitted electronically with this Report in accordance with the provisions of Regulation S-T.
† Management contract or compensatory plan or arrangement.
The agreements and other documents filed as exhibits to this report are not intended to provide factual information or other disclosure other than with respect to the terms of the agreements or other documents themselves, and you should not rely on them for that purpose. In particular, any representations and warranties made by us in these agreements or other documents were made solely within the specific context of the relevant agreement or document and may not describe the actual state of affairs as of the date they were made or at any other time.
SIGNATURES
Pursuant to the requirements of Section 13 or 15(d) of the Securities Exchange Act of 1934, the Registrant has duly caused this Report to be signed on its behalf by the undersigned, thereunto duly authorized.
| | | | | | | | |
| | COOPER-STANDARD HOLDINGS INC. |
| |
Date: February 22, 202116, 2024 | | /s/ Jeffrey S. Edwards |
| | |
| | Jeffrey S. Edwards |
| | Chairman and Chief Executive Officer |
| | (Principal Executive Officer) |
Pursuant to the requirements of the Securities Exchange Act of 1934, this Report has been signed below on February 22, 202116, 2024 by the following persons on behalf of the Registrant in the capacities indicated.
| | | | | | | | |
| Signature | | Title |
| |
| /s/ Jeffrey S. Edwards | | Chairman and Chief Executive Officer (Principal Executive Officer) |
| Jeffrey S. Edwards | | |
| |
| /s/ Jonathan P. Banas | | Executive Vice President and Chief Financial Officer (Principal Financial Officer) |
| Jonathan P. Banas | | |
| |
/s/ Peter C. BrusateAmy B. Kulikowski | | Chief Accounting Officer (Principal Accounting Officer) |
Peter C. BrusateAmy B. Kulikowski | | |
| |
| /s/ David J. Mastrocola | | Lead Director |
| David J. Mastrocola | | |
| | |
/s/ JustinJohn G. Boss | | Director |
| John G. Boss | | |
| | |
| /s/ Richard J. Freeland | | Director |
| Richard J. Freeland | | |
| | |
/s/ Adriana E. MirroMacouzet-Flores | | Director |
JustinAdriana E. MirroMacouzet-Flores | | |
| | |
| /s/ Christine M. Moore | | Director |
| Christine M. Moore | | |
| | |
| /s/ Robert J. Remenar | | Director |
| Robert J. Remenar | | |
| | |
| /s/ Sonya F. Sepahban | | Director |
| Sonya F. Sepahban | | |
| |
| /s/ Thomas W. Sidlik | | Director |
| Thomas W. Sidlik | | |
| |
| /s/ Stephen A. Van Oss | | Director |
| Stephen A. Van Oss | | |
| | |
/s/ John G. Boss | | Director |
John G. Boss | | |
| | |
/s/ Richard J. Freedland | | Director |
Richard J. Freedland | | |
| | |
/s/ Adriana E. Macouzet Flores | | Director |
Adriana E. Macouzet Flores | | |