GlobalProtect Subscription.•GlobalProtect. This appliance-based subscription provides protection for mobile users of both traditional laptop devices and mobile devices. It expands the boundaries of the end-users’ physical network, effectively establishing a logical perimeter that encompasses remote laptop and mobile device users irrespective of their location. When a remote user logs into the device, GlobalProtect automatically determines the closest gateway available to the roaming device and establishes a secure connection. Windows and AppleRegardless of the operating systems, laptops, as well as mobile devices, such as Android phones and tablets, and Apple iPhones and iPads,phones will stay connected to the corporate network wheneverwhen they are on a network of any kind. Askind and, as a result, they are protected as if they never left the corporate campus. GlobalProtect ensures that the same secure application enablement policies that protect users at the corporate site are enforced for all users, independent of their location.
•Enterprise DLP.This cloud-delivered security service provides consistent, reliable protection of sensitive data, such as personally identifiable information (“PII”) and intellectual property, for all traffic types, applications, and users. Native integration with our products makes it simple to deploy, and advanced machine learning minimizes management complexity. Enterprise DLP allows organizations to consistently discover, classify, monitor, and protect sensitive data, wherever it may reside. It helps minimize the risk of a data breach both on-premises and in the cloud—such as in Office/Microsoft 365™, Salesforce®, and Box—and assists in meeting stringent data privacy and compliance regulations, including GDPR, CCPA, PCI DSS, HIPAA, and others.
VM-Series Subscription. VM-Series,•AIOps:AIOps is available in both free and licensed premium versions. AIOps redefines network operational experience by empowering security teams to proactively strengthen security posture and resolve network disruptions. AIOps provides continuous best practice recommendations powered by machine learning (“ML”) based on industry standards, security policy context, and advanced telemetry data collected from our network security customers to improve security posture. It also intelligently predicts health, performance, and capacity problems up to seven days in advance and provides actionable insights to resolve the software form factorpredicted disruptions.
Secure Access Service Edge:
•Prisma Access. Prisma Access is a cloud-delivered security offering that helps organizations deliver consistent security to remote networks and mobile users. Located in more than 100 locations around the world, Prisma Access consistently inspects all traffic across all ports and provides bidirectional networking to enable branch-to-branch and branch-to-headquarter traffic. Prisma Access consolidates point-products into a single converged cloud-delivered offering, transforming network security and allowing organizations to enable secure hybrid workforces. Prisma Access protects all application traffic with complete, best-in-class security while ensuring an exceptional user experience with industry-leading service-level agreements (“SLA”s).
•Prisma SD-WAN.Our Prisma SD-WAN solution is a next-generation SD-WAN solution that makes the secure cloud-delivered branch possible. Prisma SD-WAN enables organizations to replace traditional Multiprotocol Label Switching (“MPLS”) based WAN architectures with affordable broadband and internet transport types that promote improved bandwidth availability, redundancy and performance at a reduced cost. Prisma SD-WAN leverages real-time application performance SLAs and visibility to control and intelligently steer application traffic to deliver an exceptional user experience. Prisma SD-WAN also provides the flexibility of our Next-Generation Firewall,deploying with an on-premises controller to help businesses meet their industry-specific security compliance requirements and manage deployments with application-defined policies. Our Prisma SD-WAN simplifies network and security operations using machine learning and automation.
Cloud Security:
•Prisma Cloud. Prisma Cloud is offered asa comprehensive Cloud-Native Application Protection Platform (“CNAPP”), securing both cloud-native and lift-and-shift applications across multi- and hybrid-cloud environments. With broad security and compliance coverage and a perpetual licenseflexible agentless, as well as agent-based, architecture, Prisma Cloud protects cloud-native applications across their lifecycle from code to cloud. The platform helps developers prevent risks as they code and build the application, secures the software supply chain and the continuous integration and continuous development (“CI/CD”) pipeline, and provides complete visibility and real-time protection for applications in the cloud.
With its code-to-cloud security capabilities, Prisma Cloud uniquely stitches together a term-based subscription. The VM-Series provides allcomplete security picture by tracing back thousands of cloud risks and vulnerabilities that occur in the application runtime to their origin in the code-and-build phase of the sameapplication. The platform enables organizations to “shift security left” and fix issues at the source (in code) before they proliferate as a large number of risks in the cloud. The contextualized visibility to alerts, attack paths, and vulnerabilities delivered by Prisma Cloud facilitates collaboration between security and development teams to drive down risks and deliver better security outcomes. The context helps security teams block attacks in the cloud runtime and developers fix risks in source code.
A comprehensive library of compliance frameworks included in Prisma Cloud vastly simplifies the task of maintaining compliance. Seamless integration with security orchestration tools ensures rapid remediation of vulnerabilities and security issues.
With a flexible, integrated platform that enables customers to license and activate cloud security capabilities that match their need, Prisma Cloud helps secure organizations at every stage in their cloud adoption journey. The platform enables security teams to consolidate multiple products that address individual risks with an integrated solution that also delivers best-in-class capabilities. Including the recently launched CI/CD security module, Prisma Cloud’s code-to-cloud CNAPP delivers comprehensive protection for applications and their code, infrastructure (workloads, network, and storage), data, APIs, and associated identities.
Security Operations:
•Cortex XSIAM. This cloud-based subscription is the AI security automation platform for the modern SOC, harnessing the power of AI to radically improve security outcomes and transform security operations. Cortex XSIAM customers can consolidate multiple products into a single unified platform, including EDR, XDR, SOAR, ASM, user behavior analytics (“UBA”), threat intelligence platform (“TIP”), and security information and event management (“SIEM”). Using a security-specific data model and applying AI, Cortex XSIAM automates data integration, analysis, and triage to respond to most alerts, enabling analysts to focus on only the incidents that require human intervention.
•Cortex XDR. This cloud-based subscription enables organizations to collect telemetry from endpoint, network, identity and cloud data sources and apply advanced analytics and machine learning, to quickly find and stop targeted attacks, insider abuse, and compromised endpoints. Cortex XDR has two product tiers: XDR Prevent and XDR Pro. XDR Prevent delivers enterprise-class endpoint security focused on preventing attacks. XDR Pro extends endpoint detection and response (“EDR”) to include cross-data analytics, including network, cloud, and identity data. Going beyond EDR, Cortex XDR detects the most complex threats using analytics across key data sources and reveals the root cause, which can significantly reduce investigation time as compared to siloed tools and manual processes.
•Cortex XSOAR. Available as a cloud-based subscription or an on-premises appliance, Cortex XSOAR is a comprehensive security orchestration automation and response (“SOAR”) offering that unifies playbook automation, case management, real-time collaboration, and threat intelligence management to serve security teams across the incident lifecycle. With Cortex XSOAR, security teams can standardize processes, automate repeatable tasks, and manage incidents across their security product stack to improve response time and analyst productivity. It learns from the real-life analyst interactions and past investigations to help SOC teams with analyst assignment suggestions, playbook enhancements, and best next steps for investigations. Many of our hardware appliances, but is delivered ascustomers see significantly faster SOC response times and a software package that can be deployed on VMware’s NSX and ESXi, Microsoft’s Hyper-V, and Red Hat KVM hypervisors, as well as nativelysignificant reduction in Amazon Web Services cloud and Microsoft Azure cloud.
the number of SOC alerts which require human intervention.Traps Endpoint Protection Subscription. This subscription provides protection for endpoints against cyberattacks that aim to run malicious code or exploit software vulnerabilities. It prevents known and previously unknown attacks through its unique capability of stopping the underlying exploit techniques and can prevent cyberattacks without relying on prior knowledge of the attack. Through its integration with WildFire, it is also capable of preventing cyberattacks that rely on malware.
AutoFocus Subscription.•Cortex Xpanse. This cloud-based subscription provides threat intelligence capabilitiesattack surface management (“ASM”), which is the ability for an organization to our end-customers’ security operations teams. Indicatorsidentify what an attacker would see among all of compromiseits sanctioned and anomaliesunsanctioned Internet-facing assets. In addition, Cortex Xpanse detects risky or out-of-policy communications between Internet-connected assets that occur on an end-customer’s network can be correlatedexploited for data breaches or ransomware attacks. Cortex Xpanse continuously identifies Internet assets, risky services, or misconfigurations in third parties to help secure a supply chain or identify risks for mergers and acquisitions due diligence. Finally, compliance teams use Cortex Xpanse to improve their audit processes and stay in compliance by assessing their access controls against regulatory frameworks.
SUPPORT
Customer Support.Global customer support helps our customers achieve their security outcomes with similar data that has been centrally collected by us inservices and support capabilities covering the customer's entire journey with Palo Alto Networks. This post-sales, global organization advances our Threat Intelligence Cloud from among all our participating end-customers. This offers our end-customers priority alerts, deep attack context,customers’ security maturity, supporting them when, where, and high-fidelity threat intelligence across millions of malware samples and tens of billions of file artifacts.
Aperture Subscription. This cloud-based subscription provides content control for IT-sanctioned SaaS applications that are used to store and share end-customer’s data. It offers end-customers the capability to safely use these SaaS applications and avert risks associated with improper sharing of confidential data and risks associated with sharing of malicious content.
GlobalProtect Cloud Service Subscription. This cloud-based subscription, expected to be released in September 2017, enables our end-customers to utilize the preventive capabilities of our Next-Generation Security Platform to secure remote offices and mobile users, providing consistent protection across globally distributed network and cloud environments without thehow they need for firewall appliances or software in the remote locations. With this offering, our end-
customers can quickly and easily add or remove remote locations and users, and establish and adjust security policies as needed, using a multi-tenant, cloud-based security infrastructure that we operate on their behalf.
Logging Service Subscription. This cloud-based subscription, expected to be released in September 2017, allows our end-customers to collect large amounts of context-rich enhanced network logs generated by our security offerings, including those of our firewalls and GlobalProtect Cloud-Based Security subscription, without needing to plan for local compute and storage.
Support.it. We offer Standard Support, Premium Support, and four-hour PremiumPlatinum Support to our end-customers and channel partners. Our channel partners that operate a Palo Alto Networks Authorized Support Center (“ASC”) typically deliver level-one and level-two support. We provide level-three support 24 hours a day, seven days a week through regional support centers that are located worldwide. We also offer an annual subscription-based Technical Account Managementa service offering called Focused Services that includes Customer Success Managers (“TAM”CSM”) service that provides dedicatedto provide support for end-customers with unique or complex support requirements. We offer our end-customers ongoing support for both hardware, software, and software in order to receivecertain cloud offerings, which includes ongoing security updates, PAN-OS upgrades, bug fixes, and repair.repairs. End-customers typically purchase these services for a one-year or longer term at the time of the initial product sale and typically renew for successive one-year or longer periods. Additionally, we provide expedited replacement for any defective hardware. We use a third-party logistics provider to manage our worldwide deployment of spare appliances and other accessories.
Threat Intelligence, Incident Response and Security Consulting. Unit 42 brings together world-renowned threat researchers, incident responders, and security consultants to create an intelligence-driven, response-ready organization that is passionate about helping clients proactively manage cyber risk. We help security leaders assess and test their security controls, transform their security strategy with a threat-informed approach, and respond to incidents rapidly. The Unit 42 Threat Intelligence team provides threat research that enables security teams to understand adversary intent and attribution, while enhancing protections offered by our products and services to stop advanced attacks. Our security consultants serve as trusted partners with state-of-the-art cyber risk expertise and incident response capabilities, helping customers focus on their business before, during, and after a breach.
Professional Services.Professional services are primarily delivered directly by Palo Alto Networks and through oura global network of authorized channel partners to our end-customers and include on-location and remote, hands-on experts who plan, design, and deploy effective security solutions tailored to our end-customers’ specific requirements. These services include application traffic management, solutionarchitecture design and planning, implementation, configuration, and firewall migration.migrations for all our products, including Prisma and Cortex deployments. Customers can also purchase on-going technical experts to be part of customer’s security teams to aid in the implementation and operation of their Palo Alto Networks capabilities. Our education services provideinclude certifications, as well as free online technical courses and classroom-stylein-classroom training, andwhich are also primarily delivered through our authorized training partners.
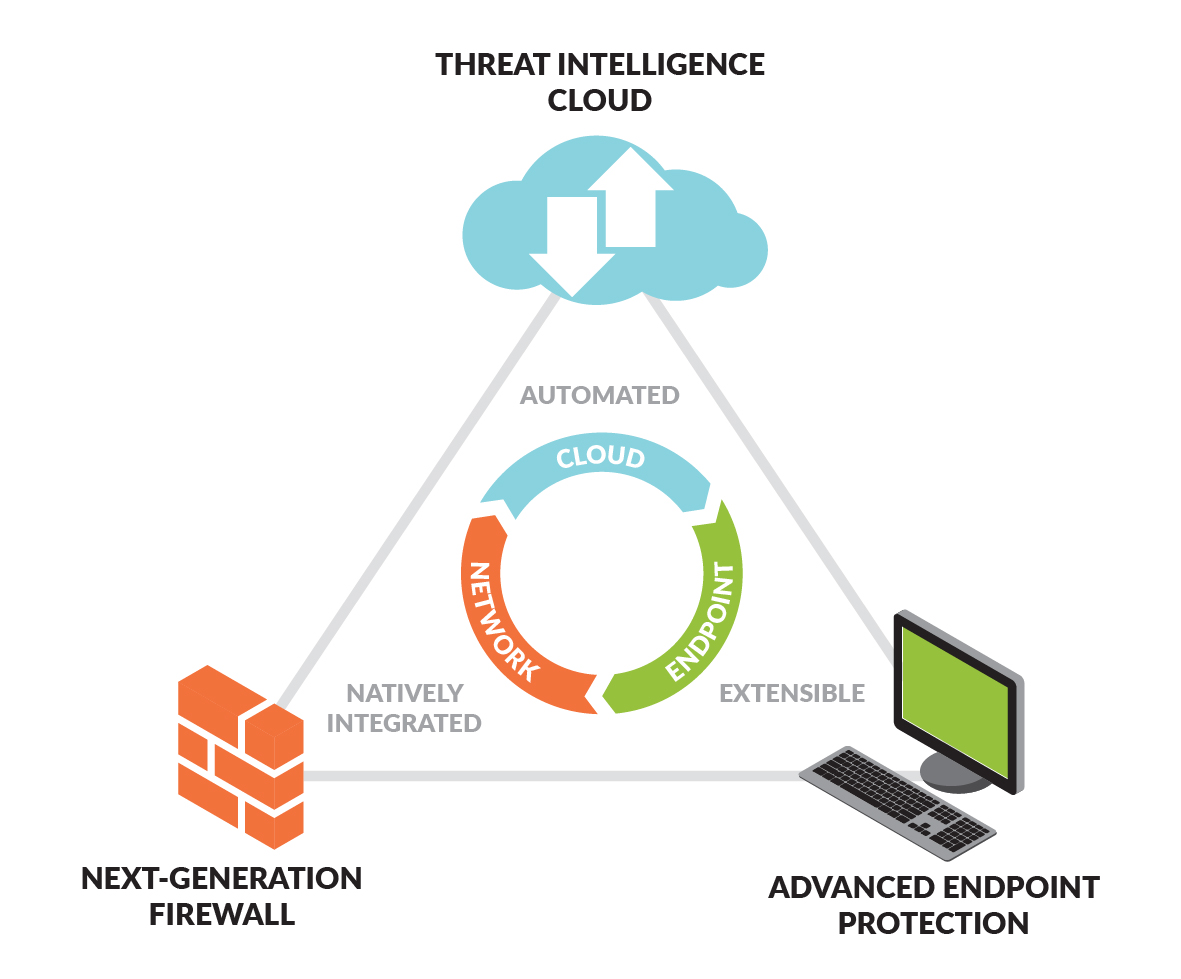
We combine our proprietary hardware and software architecture, PAN-OS operating system, Traps, and Threat Intelligence Cloud to provide a comprehensive security platform. Our Next-Generation Firewall integrates application visibility and control and is comprised
App-ID. App-ID is our application classification engine that uses multiple identification techniques to determine the exact identity of applications traversing the network. App-ID is the foundational classification engine that provides the core traffic classification to all other functions in our platform. The App-ID classification is used to invoke other security functions.
App-ID uses a series of classification techniques to accurately identify an application. When traffic first enters the network, App-ID applies an initial policy check based on Internet Protocol (“IP”) and port. Signatures are then applied to the traffic to identify the application based on application properties and related transaction characteristics. If the traffic is encrypted and a decryption policy is in place, the application is first decrypted, then application signatures are applied. Additional context-based signature analysis is then performed to identify known protocols that may be hiding other applications. Encrypted traffic that was decrypted is then re-encrypted before being sent back into the network. For evasive applications that cannot be identified through advanced signature and protocol analysis, heuristics or behavioral analysis are used to determine the identity of the application. When an application is accurately identified during this series of successive techniques, the policy check determines how to treat the application and associated functions. The policy check can block the application, allow it and scan for threats, inspect it for unauthorized file transfer and data patterns, or shape its use of network resources by applying a quality-of-service policy.
App-ID consistently classifies all network traffic, including business applications, consumer applications, and network protocols, across all ports. Consequently, there is no need to perform a series of signature checks to look for an application that is thought to be on the network. App-ID continually monitors the state of the application to determine if the application changes. Our platform allows only those applications within the policy to enter the network, while all other applications are blocked.
Internally developed or custom applications can be managed using either an application override or custom App-IDs. End-customers can use either of these mechanisms to apply the same level of control over their internal or custom applications that they apply to common applications. Because the application landscape is constantly changing, our research teams are constantly updating our App-ID classification engine. We deliver updated App-IDs automatically to our end-customers through our weekly update service.
User-ID.User-ID integrates our platform with a wide range of enterprise user directories and technologies, including Active Directory, eDirectory, Open LDAP, Citrix Terminal Server, Microsoft Exchange, Microsoft Terminal Server, and ZENworks. A network-based, User-ID agent communicates with the domain controllers, directories, or supported enterprise applications, mapping information such as user, role, and current IP address to the firewall, making the policy integration transparent. In cases
where user repository information does not include the current IP address of the user, a transparent, captive portal authentication or challenge/response mechanism can be used to tie users into the security policy. In cases where a user repository or application is in place that already has knowledge of users and their current IP address, a standards-based application programming interface (“API”) can be used to tie the repository to our platform.
Content-ID. Content-ID is a collection of technologies that enables many of our subscription services. Content-ID combines a real-time threat prevention engine, a cloud-based analysis service, and a comprehensive URL categorization database to limit unauthorized data and file transfers, detect and block a wide range of threats, and control non-work related web surfing.
The threat prevention engine blocks several common types of attacks, including vulnerability exploits, buffer overflows, and port scans from compromising and damaging enterprise information resources. It includes mechanisms such as protocol decoder-based analysis, protocol anomaly-based protection, stateful pattern matching, statistical anomaly detection, heuristic-based analysis, custom vulnerability, and spyware “phone home” signatures.
Our cloud-based threat analysis service, WildFire, provides a near real-time analysis engine for detecting previously unseen targeted malware. The core component of WildFire is a sandbox environment that can be deployed in a customer’s private cloud or on our cloud where files can be run and monitored for more than 100 behavioral characteristics that identify the file as malware. Once identified, signatures are automatically generated and delivered to all end-customers that subscribe to the WildFire service. By providing WildFire as a cloud-based service, all of our end-customers benefit from malware found on any network or endpoint. Refer to the “WildFire” section below for a more detailed discussion of our WildFire technology.
Our URL filtering database consists of millions of URLs across many categories and is designed to monitor and control employee web surfing activities. The on-appliance URL database can be augmented to suit the traffic patterns of the local user community with a custom URL database. URLs that are not categorized by the local URL database can be pulled into an on-appliance data cache from a very extensive, cloud-based URL database. The data filtering features in our platform enable policies that reduce the risks associated with the transfer of unauthorized files and data. This can be achieved by blocking files by type, by controlling sensitive data, such as credit card and social security numbers in application content or attachments, and by controlling file transfers within applications.
SP3. SP3 is our proprietary software and hardware architecture that is comprised of two elements: single-pass software and parallel processing hardware.
Our single-pass software accomplishes two key functions in our platform. First, it performs operations once per packet. As a packet is processed, the networking functions, the policy lookup, the application identification and decoding, and the signature matching for any and all threats and content are all performed simultaneously. This significantly reduces the amount of processing required to perform multiple functions in one security device. Second, the content scanning step is stream-based and uses uniform signature matching to detect and block threats. Instead of using multiple scanning passes and file proxies, which require download prior to scanning, our single-pass software scans content once in a stream-based fashion to minimize latency. This results in very high throughput and low latency, even with all security functions active. It also offers a single, fully integrated policy, thus enabling easier management of security.
Our parallel processing hardware is designed to optimize single-pass software performance through the use of separate data and control planes, which means that heavy utilization of one does not negatively impact the performance of the other. Our hardware also uses discrete, specialized processing groups to perform critical functions. On the data plane, this includes functions such as networking, policy enforcement, encryption and decryption, decompression, and content scanning. On the control plane, this includes configuration management, logging, and reporting.
We believe that the combination of single-pass software and parallel processing hardware is unique in the enterprise security industry and allows our platform to safely enable applications and prevent cyberthreats at very high levels of performance and throughput.
PAN-OS Operating System. Our PAN-OS operating system provides the foundation for our security platform and contains App-ID, User-ID, and Content-ID. PAN-OS performs the core functions of our platform while also providing the networking, security, and management functions needed for implementation. The PAN-OS networking functions include dynamic routing, switching, high availability, and VPN support, which enables deployment into a broad range of networking environments.
We have the ability to enable a series of virtual firewall instances or virtual systems. Each virtual system is an independent (virtual) firewall within the device that is managed separately and cannot be accessed or viewed by any other administrator of any other virtual system. This capability allows enterprises and service providers to separate firewall instances in departmental and multi-tenant managed services scenarios.
The security functions in PAN-OS are implemented in a single security policy and include application, application function, user, group, port, and service-based elements. Policy responses can range from open (allow but monitor for activity), to moderate
(enabling certain applications or functions), to closed (deny). The tight integration of application control, users, and groups, and the ability to scan the allowed traffic for a wide range of threats minimizes the number of policies.
PAN-OS also includes attack protection capabilities, such as blocking invalid or malformed packets, IP defragmentation, Transmission Control Protocol (“TCP”) reassembly, and network traffic normalization. PAN-OS eliminates invalid and malformed packets, while TCP reassembly and IP defragmentation is performed to ensure the utmost accuracy and protection despite any attack evasion techniques.
WildFire. WildFire is our cloud-based malware analysis environment that offers a completely new approach to cybersecurity. Through native integration with our Next-Generation Firewall, the service brings advanced threat detection and prevention to every system deployed throughout the network, automatically sharing protections with all WildFire subscribers globally.
The service offers a unified, hybrid cloud architecture deployed via either a Palo Alto Networks run cloud, a private cloud appliance that maintains all data on the local network, or a combination of the two. This allows us to perform dynamic analysis of suspicious content in a cloud-based virtual environment to discover unknown threats, automatic creation and enforcement of best-in-class, content-based malware protections, and link detection in email, proactively blocking access to malicious websites.
Advanced attacks are not point-in-time events. Adversaries deliver attacks persistently, often using non-standard ports, protocols or encryption for subsequent attack stages. Like our Next-Generation Firewall, WildFire provides complete visibility into unknown threats within all traffic across thousands of applications, including Web traffic, email protocols (SMTP, IMAP, POP), and FTP, regardless of ports or encryption (SSL).
Once WildFire discovers a new threat, the service automatically generates protections across the attack lifecycle, blocking malicious files and command-and-control traffic. Uniquely, many of these protections are content-based, not relying on easily changed attributes such as hash, filename or URL, allowing the service to block the initial malware and future variants without any additional action or analysis. WildFire informs the protection of our other security services, blocking threats in-line through Threat Prevention (anti-malware, DNS, command-and-control), Web Security (malicious URLs in PAN-DB), and GlobalProtect (anti-malware for mobile devices).
Traps. Traps is our Advanced Endpoint Protection product that prevents advanced attacks originating from either exploits or malicious executables before any malicious activity can successfully run, regardless of software patches in place. If an attack attempt is made, Traps will immediately block the technique or techniques, terminate the process, and notify both the user and the administrator that an attack was thwarted. Whenever a block does occur, Traps will collect detailed forensics, including the offending process, the memory state when it was prevented, and many other details that are reported to the Endpoint Security Manager (“ESM”).
The Traps agent injects itself into each process as it is started. When an attacker attempts to exploit a software vulnerability, the Traps protection modules cause the exploit attempt to fail because Traps has already made the process impervious to those techniques. When the attempt is prevented, the Traps agent kills the process and reports all of the details to the ESM.
Traps policy is configured to protect over 100 processes - each one with dozens of proprietary exploit prevention modules (“EPMs”). However, unlike other products, Traps is not limited to protecting only those processes or applications. Our end-customers use Traps to protect all manner of processes and applications by simply adding them to the policy configuration. Processes that have been run on the endpoint automatically show up in the ESM console, making it easy to protect those processes with the click of a button. This is especially useful for those end-customers running industry-specific applications. In addition to protecting workstations, laptops, and servers, Traps can protect point-of-sale (“POS”) systems, automated teller machines(“ATMs”), supervisory control and data acquisition (“SCADA”), and any other applications from exploitation.
Certifications. Many of our products have been awarded Federal Information Processing Standard(“FIPS”) 140-2 Level 2, Common Criteria/National Information Assurance Partnership (“NIAP”) Evaluation Assurance Level (“EAL”) 2, Common Criteria/NIAP EAL4+, Network Equipment-Building System (“NEBS”), and ICSA Firewall certifications.
Research and DevelopmentRESEARCH AND DEVELOPMENT
Our research and development effort isefforts are focused on developing new hardware and software and on enhancing and improving our existing product and subscription offerings. We believe that hardware and software are both critical to expanding our leadership in the enterprise security market.industry. Our engineering team has deep networking, endpoint, and security expertise and works closely with end-customers to identify their current and future needs. In additionOur scale and position in multiple areas of the security market enable us to our focus onleverage core competencies across hardware, software, and software, ourSaaS and also share expertise and research and development team is focused on research into applications andaround threats, which allows us to respond to the rapidly changing application and threat landscape. We supplement our own research and development effortefforts with technologies and products that we license from third parties. We test our products thoroughly to certify and ensure interoperability with third-party hardware and software products. Our research and development expense was $347.4 million, $284.2 million, and $185.8 million in fiscal 2017, 2016, and 2015, respectively.
We believe that innovation and timely development of new features and products is essential to meeting the needs of our end-customers and improving our competitive position. In February 2017,During fiscal 2023, we expanded our family of firewalls with the launch ofintroduced several new appliances: our PA-220, which is designed for small branch offices and remote locations; our PA-800 series, which are ideal for medium-sized networks and branch and remote office environments; our PA-5200 series, which deliver security for high throughput environments in a compact form factor; andofferings, including: Cortex XSIAM 1.0, major updates to Prisma Cloud (including three new VM-Series virtual firewall models,security modules), Prisma Access 4.0, PAN-OS 11.0, Cloud NGFW for AWS, and Cloud NGFW for Azure. Additionally, we acquired productive investments that fit well within our long-term strategy. For example, we acquired Cider Security Ltd. (“Cider”), which we expect will support cloud and virtualization initiatives ranging from virtualized branch officesour Prisma Cloud’s platform approach to data center and service provider deployments. We also delivered PAN-OS 8.0, an important software release that expands security for public and private clouds, provides new SaaSsecuring the entire application security functionality, and also provides the capabilitieslifecycle from code to prevent the theft and abuse of stolen credentials. Additionally, in February 2017 we acquired LightCyber Ltd. (“LightCyber”), a privately-held cybersecurity company. LightCyber’s technology expands the functionality of our platform through the addition of behavioral analytics, and will be the foundation for a new future subscription offering. We also expect to release two new cloud-based subscription offerings in September 2017: our GlobalProtect cloud service subscription, which provides our Next Generation Security Platform as a cloud-based service for remote offices and mobile users; and our Logging Service subscription, which functions as the central cloud-based repository for all application data and logs, and allows end-customers to collect data without needing to plan for local processing power and storage.cloud.
We plan to continue to significantly invest in our research and development effortefforts as we evolve and extend the capabilities of our platform. For example, in June 2017, we announced the next phase in the evolution of our Next-Generation Security Platform: our Palo Alto Networks Application Framework. Our cloud-based Application Framework will extend the capabilities of our Next-Generation Security Platform and will introduce a new SaaS consumption model that will allow our end-customers to evaluate and deploy new capabilities via security applications developed by our engineering team, as well as those built by third-party developers and other security industry vendors. Under this new model, our end-customers will be able to rapidly implement these cloud-based security applications without having to deploy or manage additional products. We expect our Application Framework to become generally available in the early 2018 calendar year, with continuous and ongoing introduction of new security applications.portfolio.
Intellectual Property
INTELLECTUAL PROPERTY
Our industry is characterized by the existence of a large number of patents and frequent claims and related litigation regarding patent and other intellectual property rights. In particular, leading companies in the enterprise security industry have extensive patent portfolios and are regularly involved in both offensive and defensive litigation. We continue to grow our patent portfolio and own intellectual property and related intellectual property rights around the world that relate to our products, services, research and development, and other activities, and our success depends in part upon our ability to protect our core technology and intellectual property. We file patent applications to protect our intellectual property and believe that the duration of our issued patents is sufficient when considering the expected lives of our products.
We actively seek to protect our global intellectual property rights and to deter unauthorized use of our intellectual property by controlling access to, and use of, our proprietary software and other confidential information through the use of internal and external controls, including contractual protections with employees, contractors, end-customers, and partners, and our software is protected by U.S. and international copyright laws. Despite our efforts to protect our intellectual property rights, our rights may not be successfully asserted in the future or may be invalidated, circumvented, or challenged. In addition, the laws of various foreign countries where our offerings are distributed may not protect our intellectual property rights to the same extent as laws in the United States. See “Risk Factors-Claims by others that we infringe their proprietary technology or otherintellectual property rights could harm our business,” “Risk Factors-Our proprietary rights may be difficult to enforce or protect, which could enable others to copy or use aspects of our products or subscriptions without compensating us,” and “Legal Proceedings” below for additional information.
Competition
GOVERNMENT REGULATION
We are subject to numerous U.S. federal, state, and foreign laws and regulations covering a wide variety of subject matters. Like other companies in the technology industry, we face scrutiny from both U.S. and foreign governments with respect to our compliance with laws and regulations. Our compliance with these laws and regulations may be onerous and could, individually or in the aggregate, increase our cost of doing business, impact our competitive position relative to our peers, and/or otherwise have an adverse impact on our business, reputation, financial condition, and operating results. For additional information about government regulation applicable to our business, see Part I, Item 1A “Risk Factors” in this Form 10-K.
COMPETITION
We operate in the intensely competitive enterprise security marketindustry that is characterized by constant change and innovation. Changes in the application, threat, and technology landscape result in evolving customer requirements for the protection from threats and the safe enablement of applications. Our main competitors fall into threefour categories:
•large networking vendorscompanies that incorporate security features in their products, such as Cisco Systems, Inc. (“Cisco”) and Juniper Networks, Inc. (“Juniper”), Microsoft, or those that have acquired, or may acquire, large network and endpoint security specialist vendors and have the technical and financial resources to bring competitive solutions to the market;
•independent security vendors, such as Symantec Corporation (“Symantec”), Check Point Software Technologies Ltd. (“Check Point”), Fortinet, Inc. (“Fortinet”), and FireEye,Crowdstrike, Inc. (“FireEye”Crowdstrike”), and Zscaler, Inc. (“Zscaler”), that offer a mix of networksecurity products;
•startups and endpoint security products; and
small and large companiespoint-product vendors that offer pointindependent or emerging solutions and/oracross various areas of security; and
•public cloud vendors and startups that offer solutions for cloud security services that compete with some of the features present in our platform.
(private, public, and hybrid cloud).
As our market grows, it will attract more highly specialized vendors, as well as larger vendors that may continue to acquire or bundle their products more effectively.
The principal competitive factors in our market include:
•product features, reliability, performance, and effectiveness;
•product line breadth, diversity, and applicability;
•product extensibility and ability to integrate with other technology infrastructures;
•price and total cost of ownership;
•adherence to industry standards and certifications;
•strength of sales and marketing efforts; and
•brand awareness and reputation.
We believe we generally compete favorably with our competitors on the basis of these factors as a result of the features and performance of our platform,portfolio, the ease of integration of our productssecurity solutions with technological infrastructures, and the relatively low total cost of ownership of our products. However, many of our competitors have substantially greater financial, technical, and other resources, greater name recognition, larger sales and marketing budgets, broader distribution, more diversified product lines, and larger and more mature intellectual property portfolios.
Sales, Customer Support and Marketing
SALES, MARKETING, SERVICES, AND SUPPORT
Customers.Our end-customers are predominantly medium to large enterprises, service providers, and government entities. Our end-customers operate in a variety of industries, including education, energy, financial services, government entities, healthcare, Internet and media, manufacturing, public sector, and telecommunications. Our end-customers deploy our platformportfolio of solutions for a variety of security functions across a variety of deployment scenarios. Typical deployment scenarios include the enterprise perimeter,network, the enterprise data center, cloud locations, and the distributed enterprise perimeter. Our end-customer deployments typically involve at least one pair of our products along with onebranch or more of our subscriptions, depending on size, security needs and requirements, and network complexity. As of July 31, 2017, we had more than 42,500 end-customers worldwide.remote locations. No single end-customer accounted for more than 10% of our total revenue in fiscal 2017, 2016,2023, 2022, or 2015.2021.
Distribution. We primarily sell our products and subscription and support offerings to end-customers through our channel partners utilizing a two-tier, indirect fulfillment model whereby we sell our products and subscription and support offerings to our distributors, which, in turn, sell to our resellers, which then sell to our end-customers. Sales are generally subject to our standard, non-exclusive distributor agreement, which provides for an initial term of one year, one-year renewal terms, termination by us with 30-9030 to 90 days written notice prior to the renewal date, and payment to us from the channel partner within 30-4530 to 45 calendar days of the date we issue an invoice for such sales. For fiscal 2017, 65.7%2023, 49.7% of our total revenue was derived from sales to three distributors.
We also sell our VM-Series virtual firewalls directly to end-customers through Amazon’s AWS Marketplace, and Microsoft’s Azure Marketplace, and Google’s Cloud Platform Marketplace under a usage-based licensing model.
Sales. Our sales organization is responsible for large-account acquisition and overall market development, which includes the management of the relationships with our channel partners, working with our channel partners in winning and supporting end-customers through a direct-touch approach, and acting as the liaison between our end-customers and our marketing and product development organizations. We pursue sales opportunities both through our direct sales force and as assisted by our channel partners, including leveraging cloud service provider marketplaces. We expect to continue to grow our sales headcount to expand our reach in all of our principal markets and expand our presence into countries where we currently do not have a direct sales presence.key growth sectors.
Our sales organization is supported by sales engineers with responsibility for pre-sales technical support, solutions engineering for our end-customers, and technical training for our channel partners.
Channel Program.Our NextWave Channel Partner program is focused on building in-depth relationships with solutions-oriented distributors and resellers that have strong security expertise. The program rewards these partners based on a number of attainment goals, as well as provides them access to marketing funds, technical and sales training, and support. To ensurepromote optimal productivity, we operate a formal accreditation program for our channel partners’ sales and technical professionals. As of July 31, 2017,2023, we had more than 4,4007,100 channel partners.
Global Customer Support.Success.Our customer supportGlobal Customer Success (“GCS”) organization is responsible for delivering support, professional, educational, and educationalsupport services directly to our channel partners and to end-customers. We leverage the capabilities of our channel partners and train them in the delivery of support, professional, educational, and educationalsupport services to ensureenable these services areto be locally delivered. We believe that a broad range of support services is essential to the successful customer deployment and ongoing support of our products, and we have hired support engineers with proven experience to provide those services.
Marketing. Our marketing is focused on building our brand reputation and the market awareness of our platformportfolio and driving pipeline and end-customer demand. Our marketing team consists primarily of product marketing, programs marketing,brand, demand generation, field marketing, channeldigital marketing, communications, analyst relations, and public relationsmarketing analytics functions. Marketing activities include pipeline development through demand generation, social media and advertising programs, managing the corporate web sitewebsite and partner portal, trade shows and conferences, press, analyst andrelationships, customer relations,advocacy, and customer awareness. Every year we organize multiple signature events, such as our end-customer conference “Ignite.“Ignite” and focused conferences such as “Cortex Symphony” and “SASE Converge.” We also publish major marketthreat intelligence research, papers such as the “Application UsageUnit 42 Cloud Threat Report and the Unit 42 Network Threat Trends Research Report,” which are based on the application and cyberthreat landscape ofdata from our end-customers.global threat intelligence team, Unit 42. These activities and tools benefit both our direct and indirect channels and are available at no cost to our channel partners.
Backlog.Orders for subscription and support offerings for multiple years are generally billed upfront shortly afterupon fulfillment of an order and are included in deferred revenue. Timing ofContract amounts that are not recorded in deferred revenue recognition foror revenue are considered backlog. We expect backlog related to subscription and support offerings may vary depending onwill change from period to period for various reasons, including the contractual period or when the subscriptiontiming and support offerings are rendered.duration of customer orders and varying billing cycles of those orders. Products are shipped and billed shortly after receiptupon hardware shipment or delivery of an order.software license. The majority of our product revenue comes from orders that are received and shipped in the same quarter. However, insufficient supply and inventory may delay our hardware product shipments. As such, we do not believe that our product backlog at any particular time is meaningful and it is not necessarily indicative of our future operating results.
Seasonality.Our business is affected by seasonal fluctuations in customer spending patterns. We have begun to see seasonal patterns in our business, which we expect to become more pronounced as we continue to grow, with our strongest sequential revenue growth generally occurring in our fiscal second and fourth quarters.
Manufacturing
MANUFACTURING
We outsource the manufacturing of our security products to various manufacturing partners, which include our electronics manufacturing services provider (“EMS provider”) and original design manufacturers. This approach allows us to reduce our costs as it reduces our manufacturing overhead and inventory and also allows us to adjust more quickly to changing end-customer demand. Our EMS provider is Flextronics International, Ltd. (“Flex”), who assembles our products using design specifications, quality assurance programs, and standards that we establish, and procures components and assembles our products based on our demand forecasts. These forecasts represent our estimates of future demand for our products based upon historical trends and analysis from our sales and product management functions as adjusted for overall market conditions.
The component parts within our products are either sourced by our manufacturing partners or by us from various component suppliers. WeOur manufacturing and supply contracts, generally, do not have any long-term manufacturing contracts that guarantee us anya certain level of supply or fixed capacity or pricing, which could increaseincreases our exposure to supply shortages or price fluctuations relatedincreases.
HUMAN CAPITAL
We believe our ongoing success depends on our employees. Development and investment in our people is central to raw materials.
Employees
Aswho we are, and will continue to be so. With a global workforce of 13,948 as of July 31, 2017,2023, our People Strategy is a critical element of our overall company strategy. Our People Strategy is a comprehensive approach to source, hire, onboard, develop, engage, and reward employees. Our approach is grounded on core tenants: respect each employee as an individual, demonstrate fairness and equity in all we had 4,562 employees. Competitiondo, facilitate flexibility, personalization, and choice whenever possible, and nurture a culture where employees are supported in doing the best work of their careers. Our values of disruption, execution, collaboration, inclusion, and integrity were co-created with employees and serve as the foundation of our culture.
Source & Hire.Sourcing diverse talent who possess the skills and capabilities to execute and add value to our culture form the cornerstone of our comprehensive approach to talent acquisition—a philosophy we call “The Way We Hire.” We utilize an array of methods to identify subject matter experts in their respective fields, emphasizing sourcing channels that connect us with underrepresented talents.
In an effort to foster career growth within Palo Alto Networks, we prioritize internal mobility. This allows current employees to progress either through a traditional career path or by exploring roles across various business functions, often culminating in promotions. We encourage existing employees to refer qualified individuals for qualified personnelour open positions, thus leveraging the collective networks of our team to attract a diverse range of expertise and perspectives.
We have made strides to understand job requirements and implement structured interviewing practices to identify candidates of the highest quality. By conducting thorough job analyses and creating success profiles, we have developed a deeper understanding of what is required for success in critical roles. We equip our hiring managers with essential training to identify and mitigate potential unconscious biases. Our interviewing process emphasizes values and competencies that we believe enhance our culture. This commitment extends to conducting interviews with diverse panelists and providing a balanced evaluation and quality interview experience for a diverse slate of candidates. We remain steadfast in our industrycommitment to fairness, bias reduction, and equal opportunities for all potential hires.
A key to our hiring process is intense,the Global Hiring Committees, introduced in fiscal 2023. These committees play a significant role in elevating our hiring standards by promoting shared understanding, reducing biases, enhancing objectivity, and ensuring the recruitment of diverse talent. The Committees foster effective collaboration using a common language and consensus-driven decision-making.
Onboard & Develop.We believe that each member of our workforce is unique, and that their integration into Palo Alto Networks and their career journey involve unique needs, interests, and goals. That is why our development programs are grounded on individualization, flexibility, and choice. From onboarding to ongoing development, our FLEXLearn philosophy offers multiple paths to assess, develop, and grow.
Our onboarding experience starts with “pre-boarding.” Before an employee’s start date, they are provided access to foundational tools to help them prepare to join Palo Alto Networks. We view pre-boarding as fundamental to introducing new employees to our culture, building trust, and facilitating rapid productivity. Welcome Day is a combination of in-person, virtual learning platforms and communication channels that provide new employees with inspirational, often personalized, onboarding experiences that carry on through the first year of employment. We have specialized learning tracks for interns and new graduates that have been recognized as best in class externally to support early-in-career individuals in acclimating to our culture as they progress on their career journey. As part of our merger and acquisition strategy, we have also established a robust integration program with the goal to enable individuals joining our teams to feel part of our culture at speed.
Following onboarding, there are a variety of ways that employees can assess their interests and skills, build a development plan specific to those insights, and continue to grow. Our development initiatives are delivered to employees through a comprehensive platform, FLEXLearn. The platform contains curated content and programs, such as assessment instruments, thousands of courses, workshops, and mentoring and coaching services. Leaders and executives also have access to specialized learning tracks that help them strategize, mobilize, and deliver maximum personal and team performance. Employees have full agency to direct their growth at their pace and choosing. Development information about core business elements, working in a distributed hybrid environment, as well as required company-wide compliance training, such as Code of Conduct, privacy and security, anti-discrimination, anti-harassment, and anti-bribery training, is also deployed through the FLEXLearn platform for all employees. In addition, FLEXLearn provides employees with events and activities that motivate and spark critical thinking, on topics ranging from inclusion to well-being and collaboration. On average, employees had completed 33 hours of development through the FLEXLearn platform during fiscal 2023.
Engage & Reward.We aim to foster engagement through a multifaceted approach to collect, understand, and act on employee feedback. Our comprehensive communication and listening strategy utilizes in-person and technology-enabled channels. We share and collect information through corporate and functional “All Hands” meetings, including several meetings specifically focused on employee-centered topics in an “Ask Me Anything” format. Digital Displays across our sites, our intranet platform, monthly and weekly email communications, and an active Slack platform provide a regular flow of information to and between employees and leadership. In addition to these channels that reach large audiences, we conduct regular executive listening sessions, including small group convenings with our CEO and other C-suite leaders, and ad-hoc pulse surveys to better understand employee engagement, sentiment, well-being, and the ability to transition to a hybrid work model.
Employee sentiment is also collected from external sources, such as web platforms that crowdsource feedback. Employees provide commentary to platforms such as Glassdoor, Comparably, and others and insights from those platforms are used to measure engagement. In addition, based on employee participation in an anonymous survey, the Best Practice Institute has certified Palo Alto Networks as a “most loved workplace” (2021, 2022, and 2023). Palo Alto Networks has been recognized by Glassdoor, Comparably, Human Rights Campaign, Disability Index, and others as an employer of choice. Our CEO has also earned a 92% employee approval rating on Glassdoor, a top percentile score.
In addition to a comprehensive compensation and diverse benefits program, we believe in an always-on feedback and rewards philosophy. From recurring 1:1 sessions, quarterly performance feedback, semi-annual performance reviews to use of our Cheers for Peers peer recognition program, employees get continuous input about the value they bring to the organization.
These engagement and recognition strategies have informed our holistic People Strategy, including our Inclusion and Diversity (“I&D”) initiatives and Internal Mobility program. Based on the outcomes from external sources, insights from internal sources, our modest attrition rate (compared to market trends), and strong participation in our Internal Mobility program, we believe employees at Palo Alto Networks feel engaged and rewarded.
Inclusion & Diversity. We are intentional about including diverse points of view, perspectives, experiences, backgrounds, and ideas in our decision-making processes. We deeply believe that true diversity exists when we have representation of all ethnicities, genders, orientations and identities, and cultures in our workforce. Our corporate I&D programs focus on five principles—our workforce should feel psychologically safe, they should understand, listen, and support one another, and they should elevate others. These principles are the foundation of our approach to I&D, which we call P.U.L.S.E.
We have eleven employee network groups (“ENG”s) that play a vital role in building understanding and awareness. Over 29% of our global workforce was involved in at least one ENG as of July 31, 2023. ENGs are also allocated funding to make charitable grants to organizations advancing their causes. We involve our ENGs in listening sessions with executive teams and we work in partnership to develop our annual I&D plans because we believe thatinvolvement is critical.
Our I&D philosophy is fully embedded in our future success depends in part ontalent acquisition, learning and development, performance elevation, and rewards and recognition programs. The diversity of our continued abilityboard of directors, with women representing 40% of our board as of July 31, 2023, is an example of our commitment to hire, motivate,inclusion and retain such personnel.diversity.
Segment and Geographic InformationENVIRONMENTAL, SOCIAL, AND GOVERNANCE
We recognize our duty to address environmental, social, and governance (“ESG”) practices. From our science-based approach to emissions reductions and our social impact programs to our Supplier Responsibility initiatives and Code of Business Conduct and Ethics, we value the opportunity to have meaningful outcomes that reinforce our intention to respect our planet, uplift our communities, and advance our industry.
Environmental. We recognize climate change is a global crisis and are organizedcommitted to doing our part to reduce environmental impacts. We remain committed to our goals of utilizing 100% renewable energy by 2030, reducing our greenhouse gas (“GHG”) emissions and operateworking across our value chain, and with coalitions, to address climate change. We made progress towards our goals in fiscal 2023 through several milestones. We engaged with a single reportable segment,local utility provider to power our Santa Clara, California headquarters with 70.2%100% renewable energy effective January 1, 2023. Our near-term scope 1, 2, and 3 emissions reduction goals, aligned to a warming scenario of 1.5° Celsius, were verified by the Science Based Targets initiative. We were recognized by Carbon Disclosure Project (“CDP”) as an “A-List” company and a “Supplier Engagement Leader.” We remain committed to being transparent about our progress over time through annual reporting.
Social. In addition to our People Strategy described in the section titled “Human Capital” above, we prioritized the health and safety of our total revenueglobal workforce. Through the deployment of our Global Supplier Code of Conduct, we continued to reach across our supply chain to communicate our expectations regarding labor standards, business practices, and workplace health and safety conditions. During fiscal 2023, we maintained our affiliate membership in the Responsible Business Alliance and maintained our commitment to Supplier Diversity. We value our role as a good corporate citizen and in fiscal 20172023 continued to execute our social impact programs. We made charitable grants to support organizations providing services in our core funding areas of education, including academic scholarships, diversity, and basic needs. We expanded our work to provide cybersecurity curriculum to schools, universities, and nonprofit organizations to help individuals of all ages protect their digital way of life and to prepare diverse adults for careers in cybersecurity. Employees continued to participate in our giving, matching, and volunteer programs to make impacts in their local communities.
Governance. Integrity is one of our core values. Our corporate behavior and leadership practices model ethical decision-making. All employees are informed about our governance expectations through our Codes of Conduct, compliance training programs, and ongoing communications. Our board of directors is governed by Corporate Governance Guidelines, which are amended from time to time to incorporate best practices in corporate governance. Reinforcing the Americas, 18.2% from Europe,importance of our ESG performance, the Middle East,charter of the ESG and Africa (“EMEA”), and 11.6% from Asia Pacific and Japan (“APAC”). Refer to Note 16. Segment InformationNominating Committee of Notes to Consolidated Financial Statements included in Part II, Item 8the board of this Annual Report on Form 10-K for more information about segments and revenue and assets by geographic region.directors includes the primary oversight of ESG.
Available Information
AVAILABLE INFORMATION
Our website is located at www.paloaltonetworks.com, and our investor relations website is located at investors.paloaltonetworks.com. Our Annual Reports on Form 10-K, Quarterly Reports on Form 10-Q, Current Reports on Form 8-K, and amendments to reports filed or furnished pursuant to Sections 13(a) and 15(d) of the Securities Exchange Act of 1934, as amended (the “Exchange Act”), are available free of charge on the Investors portion of our web sitewebsite as soon as reasonably practicable after we electronically file such material with, or furnish it to, the Securities and Exchange Commission (“SEC”). We also provide a link to the section of the SEC’s website at www.sec.gov that has all of our public filings, including Annual Reports on Form 10-K, Quarterly Reports on Form 10-Q, Current Reports on Form 8-K, all amendments to those reports, our Proxy Statements, and other ownership relatedownership-related filings. Further, a copy of this Annual Report on Form 10-K is located at the SEC’s Public Reference Room at 100 F Street, NE, Washington, D.C. 20549. Information on the operation of the Public Reference Room can be obtained by calling the SEC at 1-800-SEC-0330.
We also use our investor relations website as a channel of distribution for important company information. For example, webcasts of our earnings calls and certain events we participate in or host with members of the investment community are on our investor relations website. Additionally, we announce investor information, including news and commentary about our business and financial performance, SEC filings, notices of investor events, and our press and earnings releases, on our investor relations
website. Investors and others can receive notifications of new information posted on our investor relations website in real time by signing up for email alerts and RSS feeds. Further corporate governance information, including our corporate governance guidelines, board committee charters, and code of conduct, is also available on our investor relations website under the heading “Governance.” The contents of our websites are not incorporated by reference into this Annual Report on Form 10-K or in any other report or document we file with the SEC, and any references to our websites are intended to be inactive textual references only. All trademarks, trade names, or service marks used or mentioned herein belong to their respective owners.
Item 1A. Risk Factors
Our operations and financial results are subject to various risks and uncertainties including those described below. The risks and uncertainties described below are not the only ones we face. Additional risks and uncertainties that we are unaware of, or that we currently believe are not material, also may become important factors that affect us. If any of the following risks or others not specified below materialize, our business, financial condition, and operating results could be materially adversely affected, and the market price of our common stock could decline. In addition, the impacts of any worsening of the economic environment may exacerbate the risks described below, any of which could have a material impact on us.
Risk Factor Summary
Our business is subject to numerous risks and uncertainties. These risks include, but are not limited to, the following:
•Our operating results may be adversely affected by unfavorable economic and market conditions and the uncertain geopolitical environment.
•Our business and operations have experienced growth in recent periods, and if we do not effectively manage any future growth or are unable to improve our systems, processes, and controls, our operating results could be adversely affected.
•Our revenue growth rate in recent periods may not be indicative of our future performance, and we may not be able to maintain profitability, which could cause our business, financial condition, and operating results to suffer.
•Our operating results may vary significantly from period to period, which makes our results difficult to predict and could cause our results to fall short of expectations, and such results may not be indicative of future performance.
•Seasonality may cause fluctuations in our revenue.
•If we are unable to sell new and additional product, subscription, and support offerings to our end-customers, especially to large enterprise customers, our future revenue and operating results will be harmed.
•We rely on revenue from subscription and support offerings, and because we recognize revenue from subscription and support over the term of the relevant service period, downturns or upturns in sales or renewals of these subscription and support offerings are not immediately reflected in full in our operating results.
•The sales prices of our products, subscriptions, and support offerings may decrease, which may reduce our revenue and gross profits and adversely impact our financial results.
•We rely on our channel partners to sell substantially all of our products, including subscriptions and support, and if these channel partners fail to perform, our ability to sell and distribute our products and subscriptions will be limited and our operating results will be harmed.
•We are exposed to the credit and liquidity risk of our customers, and to credit exposure in weakened markets, which could result in material losses.
•A portion of our revenue is generated by sales to government entities, which are subject to a number of challenges and risks.
•We face intense competition in our market and we may lack sufficient financial or other resources to maintain or improve our competitive position.
•We may acquire other businesses, which could subject us to adverse claims or liabilities, require significant management attention, disrupt our business, adversely affect our operating results, may not result in the expected benefits of such acquisitions, and may dilute stockholder value.
•If we do not accurately predict, prepare for, and respond promptly to rapidly evolving technological and market developments and successfully manage product and subscription introductions and transitions to meet changing end-customer needs in the enterprise security industry, our competitive position and prospects will be harmed.
•Issues in the development and deployment of Artificial Intelligence (“AI”) may result in reputational harm and legal liability and could adversely affect our results of operations.
•A network or data security incident may allow unauthorized access to our network or data, harm our reputation, create additional liability, and adversely impact our financial results.
•Defects, errors, or vulnerabilities in our products, subscriptions, or support offerings, the failure of our products or subscriptions to block a virus or prevent a security breach or incident, misuse of our products, or risks of product liability claims could harm our reputation and adversely impact our operating results.
•Our ability to sell our products and subscriptions is dependent on the quality of our technical support services and those of our channel partners, and the failure to offer high-quality technical support services could have a material adverse effect on our end-customers’ satisfaction with our products and subscriptions, our sales, and our operating results.
•Claims by others that we infringe their intellectual property rights could harm our business.
•Our proprietary rights may be difficult to enforce or protect, which could enable others to copy or use aspects of our products or subscriptions without compensating us.
•Our use of open source software in our products and subscriptions could negatively affect our ability to sell our products and subscriptions and subject us to possible litigation.
•We license technology from third parties, and our inability to maintain those licenses could harm our business.
•Because we depend on manufacturing partners to build and ship our hardware products, we are susceptible to manufacturing and logistics delays and pricing fluctuations that could prevent us from shipping customer orders on time, if at all, or on a cost-effective basis, which may result in the loss of sales and end-customers.
•Managing the supply of our hardware products and product components is complex. Insufficient supply and inventory would result in lost sales opportunities or delayed revenue, while excess inventory would harm our gross margins.
•Because some of the key components in our hardware products come from limited sources of supply, we are susceptible to supply shortages or supply changes, which, in certain cases, have disrupted or delayed our scheduled product deliveries to our end-customers, increased our costs and may result in the loss of sales and end-customers.
•If we are unable to attract, retain, and motivate our key technical, sales, and management personnel, our business could suffer.
•We generate a significant amount of revenue from sales to distributors, resellers, and end-customers outside of the United States, and we are therefore subject to a number of risks associated with international sales and operations.
•We are exposed to fluctuations in foreign currency exchange rates, which could negatively affect our financial condition and operating results.
•We face risks associated with having operations and employees located in Israel.
•We are subject to governmental export and import controls that could subject us to liability or impair our ability to compete in international markets.
•Our actual or perceived failure to adequately protect personal data could have a material adverse effect on our business.
•We may have exposure to greater than anticipated tax liabilities.
•If our estimates or judgments relating to our critical accounting policies are based on assumptions that change or prove to be incorrect, our operating results could fall below our publicly announced guidance or the expectations of securities analysts and investors, resulting in a decline in the market price of our common stock.
•We are obligated to maintain proper and effective internal control over financial reporting. We may not complete our analysis of our internal control over financial reporting in a timely manner, or our internal control may not be determined to be effective, which may adversely affect investor confidence in our company and, as a result, the value of our common stock.
•Our reputation and/or business could be negatively impacted by environmental, social, and governance (“ESG”) matters and/or our reporting of such matters.
•Failure to comply with governmental laws and regulations could harm our business.
•We may not have the ability to raise the funds necessary to settle conversions of our Notes, repurchase our Notes upon a fundamental change, or repay our Notes in cash at their maturity, and our future debt may contain limitations on our ability to pay cash upon conversion or repurchase of our Notes.
•We may still incur substantially more debt or take other actions that would diminish our ability to make payments on our Notes when due.
•The market price of our common stock historically has been volatile, and the value of an investment in our common stock could decline.
•The convertible note hedge and warrant transactions may affect the value of our common stock.
•The issuance of additional stock in connection with financings, acquisitions, investments, our stock incentive plans, the conversion of our Notes or exercise of the related Warrants, or otherwise will dilute stock held by all other stockholders.
•We cannot guarantee that our share repurchase program will be fully consummated or that it will enhance shareholder value, and share repurchases could affect the price of our common stock.
•We do not intend to pay dividends for the foreseeable future.
•Our charter documents and Delaware law, as well as certain provisions contained in the indentures governing our Notes, could discourage takeover attempts and lead to management entrenchment, which could also reduce the market price of our common stock.
•Our business is subject to the risks of earthquakes, fire, power outages, floods, health risks, and other catastrophic events, and to interruption by man-made problems, such as terrorism.
•Our failure to raise additional capital or generate the significant capital necessary to expand our operations and invest in new products and subscriptions could reduce our ability to compete and could harm our business.
Risks Related to Global Economic and Geopolitical Conditions
Our operating results may be adversely affected by unfavorable economic and market conditions and the uncertain geopolitical environment.
We operate globally, and as a result, our business and revenues are impacted by global economic and geopolitical conditions. The instability in the global credit markets, inflation, changes in public policies such as domestic and international regulations, taxes, any increases in interest rates, fluctuations in foreign currency exchange rates, or international trade agreements, international trade disputes, geopolitical turmoil, and other disruptions to global and regional economies and markets continue to add uncertainty to global economic conditions. Military actions or armed conflict, including Russia’s invasion of Ukraine and any related political or economic responses and counter-responses, and uncertainty about, or changes in, government and trade relationships, policies, and treaties could also lead to worsening economic and market conditions and geopolitical environment. In response to Russia’s invasion of Ukraine, the United States, along with the European Union, has imposed restrictive sanctions on Russia, Russian entities, and Russian citizens (“Sanctions on Russia”). We are subject to these governmental sanctions and export controls, which may subject us to liability if we are not in full compliance with applicable laws. Any continued or further uncertainty, weakness or deterioration in economic and market conditions or the geopolitical environment could have a material and adverse impact on our business, financial condition, and results of operations, including reductions in sales of our products and subscriptions, longer sales cycles, reductions in subscription or contract duration and value, slower adoption of new technologies, alterations in the spending patterns or priorities of current and prospective customers (including delaying purchasing decisions), increased costs for the chips and components to manufacture our products, and increased price competition.
Risks Related to Our Business and Our Industry
RISKS RELATED TO OUR GROWTH
Our business and operations have experienced rapid growth in recent periods, and if we do not effectively manage any future growth or are unable to improve our systems, processes, and controls, our operating results could be adversely affected.
We have experienced rapid growth and increased demand for our products and subscriptions over the last few years. As a result, our employee headcount and number of end-customers havehas increased, significantly, and we expect bothit to continue to grow over the next year. For example, from the end of fiscal 20162022 to the end of fiscal 2017,2023, our headcount increased from 3,79512,561 to 4,562 employees, and our number of end-customers increased from approximately 34,000 to more than 42,500.13,948 employees. In addition, as we have grown, the number of end-customers has also increased, and we have increasingly managed more complex deployments of our products and subscriptions with larger end-customers. The growth and expansion of our business and product, subscription, and support offerings places a significant strain on our management, operational, and financial resources. To manage any future growth effectively, we must continue to improve and expand our information technology and financial infrastructure, our operating and administrative systems and controls, and our ability to manage headcount, capital, and processes in an efficient manner.
We may not be able to successfully implement, scale, or scalemanage improvements to our systems, processes, and controls in an efficient or timely manner.manner, which could result in material disruptions of our operations and business. In addition, our existing systems, processes, and controls may not prevent or detect all errors, omissions, or fraud. We may also experience difficulties in managing improvements to our systems, processes, and controls, or in connection with third-party software licensed to help us with such improvements. Any future growth would add complexity to our organization and require effective coordination throughout our organization. Failure to manage any future growth effectively could result in increased costs, disrupt our existing end-customer relationships, reduce demand for or limit us to smaller deployments of our platform,products, or materially harm our business performance and operating results.
Our operating results may vary significantly from period to period and be unpredictable, which could cause the market price of our common stock to decline.
Our operating results, in particular, our revenues, gross margins, operating margins, and operating expenses, have historically varied from period to period, and even though we have experienced growth, we expect variation to continue as a result of a number of factors, many of which are outside of our control and may be difficult to predict, including:
our ability to attract and retain new end-customers or sell additional products and subscriptions to our existing end-customers;
the budgeting cycles, seasonal buying patterns, and purchasing practices of end-customers;
changes in end-customer, distributor or reseller requirements, or market needs;
price competition;
the timing and success of new product and service introductions by us or our competitors or any other change in the competitive landscape of our industry, including consolidation among our competitors or end-customers and strategic partnerships entered into by and between our competitors;
changes in the mix of our products, subscriptions, and support, including changes in multi-year subscriptions and support;
our ability to successfully and continuously expand our business domestically and internationally;
changes in the growth rate of the enterprise security market;
deferral of orders from end-customers in anticipation of new products or product enhancements announced by us or our competitors;
the timing and costs related to the development or acquisition of technologies or businesses or strategic partnerships;
lack of synergy or the inability to realize expected synergies, resulting from acquisitions or strategic partnerships;
our inability to execute, complete or integrate efficiently any acquisitions that we may undertake;
increased expenses, unforeseen liabilities, or write-downs and any impact on our operating results from any acquisitions we consummate;
our ability to increase the size and productivity of our distribution channel;
decisions by potential end-customers to purchase security solutions from larger, more established security vendors or from their primary network equipment vendors;
changes in end-customer penetration, attach, and renewal rates for our subscriptions;
timing of revenue recognition and revenue deferrals;
our ability to manage production and manufacturing related costs, global customer service organization costs, inventory excess and obsolescence costs, and warranty costs;
insolvency or credit difficulties confronting our end-customers, which could adversely affect their ability to purchase or pay for our products and subscription and support offerings, or confronting our key suppliers, including our sole source suppliers, which could disrupt our supply chain;
any disruption in our channel or termination of our relationships with important channel partners, including as a result of consolidation among distributors and resellers of security solutions;
our inability to fulfill our end-customers’ orders due to supply chain delays or events that impact our manufacturers or their suppliers;
the cost and potential outcomes of litigation, which could have a material adverse effect on our business;
seasonality or cyclical fluctuations in our markets;
future accounting pronouncements or changes in our accounting policies, including the potential impact of the adoption and implementation of the Financial Accounting Standards Board’s new standard regarding revenue recognition;
increases or decreases in our expenses or fluctuations in our sales cycle caused by fluctuations in foreign currency exchange rates, as an increasing amount of our expenses is incurred and paid in currencies other than the U.S. dollar;
political, economic and social instability, such as those caused by the upcoming elections in Europe, the recent referendum in which voters in the United Kingdom (the “U.K.”) approved an exit from the European Union (the “E.U.”), continued hostilities in the Middle East, terrorist activities, and any disruption these events may cause to the broader global industrial economy; and
general macroeconomic conditions, both domestically and in our foreign markets that could impact some or all regions where we operate.
Any one of the factors above, or the cumulative effect of some of the factors referred to above, may result in significant fluctuations in our financial and other operating results. This variability and unpredictability could result in our failure to meet our revenue, margin, or other operating result expectations or those of securities analysts or investors for a particular period. If we fail to meet or exceed such expectations for these or any other reasons, the market price of our common stock could fall substantially, and we could face costly lawsuits, including securities class action suits.
Uncertain or weakened global economic conditions could have an adverse effect on our business and operating results.
We operate globally and as a result our business and revenues are impacted by global macroeconomic conditions. The global macroeconomic environment has been and may continue to be inconsistent and challenging due to instability in the global credit markets, the current economic challenges in China, falling demand for oil and other commodities, uncertainties regarding the effects of the “Brexit” decision, uncertainties related to changes in public policies such as domestic and international regulations, taxes, or international trade agreements, geopolitical turmoil and other disruptions to global and regional economies and markets. As a result, any continued or further uncertainty, weakness or deterioration in global macroeconomic and market conditions may cause our end-customers to modify spending priorities or delay purchasing decisions, and result in lengthened sales cycles, all of which could harm our business and operating results.
Our revenue growth rate in recent periods may not be indicative of our future performance.performance, and we may not be able to maintain profitability, which could cause our business, financial condition, and operating results to suffer.
We have experienced revenue growth rates of 27.8%25.3% and 48.5%29.3% in fiscal 20172023 and fiscal 2016,2022, respectively. Our revenue for any prior quarterly or annual period should not be relied upon as an indication of our future revenue or revenue growth for any future period. If we are unable to maintain consistent or increasing revenue or revenue growth, the market price of our common stock could be volatile, and it may be difficult for us to achieve and maintain profitability or maintain or increase cash flow on a consistent basis.
Other than fiscal 2012,In addition, we have incurred losses in all fiscal years since our inception. Asprior to fiscal 2023 and, as a result, we had an accumulated deficit of $836.7 million at$1.2 billion as of July 31, 2017.2023. We anticipate that our operating expenses will continue to increase in the foreseeable future as we continue to grow our business. Our growth efforts may prove more expensive than we currently anticipate, and we may not succeed in increasing our revenues sufficiently, or at all, to offset increasing expenses. Revenue growth may slow or revenue may decline for a number of possible reasons, including slowing demand for our products or subscriptions, increasing competition, a decrease in the growth of, or a demand shift in, our overall market, or a failure to capitalize on growth opportunities. We have also entered into a substantial amount of capital commitments for operating lease obligations and other purchase commitments. Any failure to increase our revenue as we grow our business could prevent us from achieving or maintaining profitability or maintaining or increasing cash flow on a consistent basis. In addition, we may have difficulty achieving profitability under U.S. generally accepted accounting principles (“GAAP”) due to share-based compensation expense and other non-cash charges.basis, or satisfying our capital commitments. If we are unable to navigate these challenges as we encounter them, our business, financial condition, and operating results may suffer.
Our operating results may vary significantly from period to period, which makes our results difficult to predict and could cause our results to fall short of expectations, and such results may not be indicative of future performance.
Our operating results have fluctuated in the past, and will likely continue to fluctuate in the future, as a result of a number of factors, many of which are outside of our control and may be difficult to predict, including those factors described in this Risk Factor section. For example, we have historically received a substantial portion of sales orders and generated a substantial portion of revenue during the last few weeks of each fiscal quarter. If expected revenue at the end of any fiscal quarter is delayed for any reason, including the failure of anticipated purchase orders to materialize (particularly for large enterprise end-customers with lengthy sales cycles), our logistics partners’ inability to ship products prior to fiscal quarter-end to fulfill purchase orders received near the end of a fiscal quarter, our failure to manage inventory to meet demand, any failure of our systems related to order review and processing, or any delays in shipments based on trade compliance requirements (including new compliance requirements imposed by new or renegotiated trade agreements), our revenue could fall below our expectations and the estimates of analysts for that quarter. Due to these fluctuations, comparing our revenue, margins, or other operating results on a period-to-period basis may not be meaningful, and our past results should not be relied on as an indication of our future performance.
This variability and unpredictability could also result in our failure to meet our revenue, margin, or other operating result expectations contained in any forward-looking statements (including financial or business expectations we have provided) or those of securities analysts or investors for a particular period. If we fail to meet or exceed such expectations for these, or any other, reasons, the market price of our common stock could fall substantially, and we could face costly lawsuits, including securities class action suits.
Seasonality may cause fluctuations in our revenue.
We believe there are significant seasonal factors that may cause our second and fourth fiscal quarters to record greater revenue sequentially than our first and third fiscal quarters. We believe that this seasonality results from a number of factors, including:
•end-customers with a December 31 fiscal year-end choosing to spend remaining unused portions of their discretionary budgets before their fiscal year-end, which potentially results in a positive impact on our revenue in our second fiscal quarter;
•our sales compensation plans, which are typically structured around annual quotas and commission rate accelerators, which potentially results in a positive impact on our revenue in our fourth fiscal quarter; and
•the timing of end-customer budget planning at the beginning of the calendar year, which can result in a delay in spending at the beginning of the calendar year, potentially resulting in a negative impact on our revenue in our third fiscal quarter.
As we continue to grow, seasonal or cyclical variations in our operations may become more pronounced, and our business, operating results, and financial position may be adversely affected.
RISKS RELATED TO OUR PRODUCTS AND TECHNOLOGY
If we are unable to sell new and additional product, subscription, and support offerings to our end-customers, especially to large enterprise customers, our future revenue and operating results will be harmed.
Our future success depends, in part, on our ability to expand the deployment of our platformportfolio with existing end-customers. This may require increasingly sophisticatedend-customers, especially large enterprise customers, and costly sales efforts that may not result in additional sales.create demand for our new offerings, The rate at which our end-customers purchase additional products, subscriptions, and support depends on a number of factors, including the perceived need for additional security products, including subscription and support offerings, as well as general economic conditions. Further, existingIf our efforts to sell additional products and subscriptions to our end-customers are not successful, our revenues may grow more slowly than expected or decline.
Sales to large enterprise end-customers, which is part of our growth strategy, involve risks that may not be present, or that are present to a lesser extent, with sales to smaller entities, such as (a) longer sales cycles and the associated risk that substantial time and resources may be spent on a potential end-customer that elects not to purchase our products, subscriptions, and support, and (b) increased purchasing power and leverage held by large end-customers in negotiating contractual arrangements. Deployments for large enterprise end-customers are also more complex, require greater product functionality, scalability, and a broader range of services, and are more time-consuming. All of these factors add further risk to business conducted with these end-customers. Failure to realize sales from large enterprise end-customers could materially and adversely affect our business, operating results, and financial condition.
We rely on revenue from subscription and support offerings, and because we recognize revenue from subscription and support over the term of the relevant service period, downturns or upturns in sales or renewals of these subscription and support offerings are not immediately reflected in full in our operating results.
Subscription and support revenue accounts for a significant portion of our revenue, comprising 77.1% of total revenue in fiscal 2023, 75.2% of total revenue in fiscal 2022, and 73.7% of total revenue in fiscal 2021. Sales and renewals of subscription and support contracts may decline and fluctuate as a result of a number of factors, including end-customers’ level of satisfaction with our products and subscriptions, the frequency and severity of subscription outages, our product uptime or latency, the prices of our products and subscriptions, and reductions in our end-customers’ spending levels. Existing end-customers have no contractual obligation to, and may not, renew their subscription and support contracts after the completion of their initial contract period. Our end-customers’ renewal rates may decline or fluctuate as a result of a number of factors, including their satisfaction with our subscriptions and our support offerings, the frequency and severity of subscription outages, our product uptime or latency, and the pricing of our, or competing, subscriptions. Additionally, our end-customers may renew their subscription and support agreements for shorter contract lengths or on other terms that are less economically beneficial to us. If our sales of new or renewal subscription and support contracts decline, our total revenue and revenue growth rate may decline, and our business will suffer. In addition, because we recognize subscription and support revenue over the term of the relevant service period, which is typically one to five years, a decline in subscription or support contracts in any one fiscal quarter will not be fully or immediately reflected in revenue in that fiscal quarter but will negatively affect our revenue in future fiscal quarters.
The sales prices of our products, subscriptions, and support offerings may decrease, which may reduce our revenue and gross profits and adversely impact our financial results.
The sales prices for our products, subscriptions, and support offerings may decline for a variety of reasons, including competitive pricing pressures, discounts, a change in our mix of products, subscriptions, and support offerings, anticipation of the introduction of new products, subscriptions, or support offerings, or promotional programs or pricing pressures. Furthermore, we anticipate that the sales prices and gross profits for our products could decrease over product life cycles. Declining sales prices could adversely affect our revenue, gross profits, and profitability.
We rely on our channel partners to sell substantially all of our products, including subscriptions and support, and if these channel partners fail to perform, our ability to sell and distribute our products and subscriptions will be limited and our operating results will be harmed.
Substantially all of our revenue is generated by sales through our channel partners, including distributors and resellers. For fiscal 2023, three distributors individually represented 10% or more of our total revenue and in the aggregate represented 49.7% of our total revenue. As of July 31, 2023, two distributors individually represented 10% or more of our gross accounts receivable and in the aggregate represented 37.6% of our gross accounts receivable.
We provide our channel partners with specific training and programs to assist them in selling our products, including subscriptions and support offerings, but there can be no assurance that these steps will be utilized or effective. In addition, our channel partners may be unsuccessful in marketing, selling, and supporting our products and subscriptions. We may not be able to incentivize these channel partners to sell our products and subscriptions to end-customers and, in particular, to large enterprises. These channel partners may also have incentives to promote our competitors’ products and may devote more resources to the marketing, sales, and support of competitive products. Our agreements with our channel partners may generally be terminated for any reason by either party with advance notice prior to each annual renewal date. We cannot be certain that we will retain these channel partners or that we will be able to secure additional or replacement channel partners. In addition, any new channel partner requires extensive training and may take several months or more to achieve productivity. Our channel partner sales structure could subject us to lawsuits, potential liability, and reputational harm if, for example, any of our channel partners misrepresent the functionality of our products or subscriptions to end-customers will renew their subscription and support agreements.or violate laws or our corporate policies. If we fail to effectively manage our effortssales channels or channel partners, our ability to sell additionalour products and subscriptions and operating results will be harmed.
We are exposed to the credit and liquidity risk of our end-customerscustomers, and to credit exposure in weakened markets, which could result in material losses.
Most of our sales are not successfulmade on an open credit basis. Beyond our open credit arrangements, we have also experienced demands for customer financing and deferred payments due to, among other things, macro-economic conditions. To respond to this demand, our customer financing activities have increased and will likely continue to increase in the future. Increases in deferred payments result in payments being made over time, negatively impacting our short-term cash flows, and subject us to risk of non-payment by our customers, including as a result of insolvency. We monitor customer payment capability in granting such financing arrangements, seek to limit the amounts to what we believe customers can pay and maintain reserves we believe are adequate to cover exposure for doubtful accounts to mitigate credit risks of these customers. However, there can be no assurance that these programs will be effective in reducing our credit risks. To the degree that turmoil in the credit markets makes it more difficult for some customers to obtain financing, those customers’ ability to pay could be adversely impacted, which in turn could have a material adverse impact on our business, operating results, and financial condition.
Our exposure to the credit risks relating to the financing activities described above may increase if our customers are adversely affected by a global economic downturn or periods of economic uncertainty. If we are unable to adequately control these risks, our business, operating results, and financial condition could be harmed. In addition, in the past, we have experienced non-material losses due to bankruptcies among customers. If these losses increase due to global economic conditions, they could harm our business and financial condition.
A portion of our revenue is generated by sales to government entities, which are subject to a number of challenges and risks.
Sales to government entities are subject to a number of risks. Selling to government entities can be highly competitive, expensive, and time-consuming, often requiring significant upfront time and expense without any assurance that these efforts will generate a sale. The substantial majority of our sales to date to government entities have been made indirectly through our channel partners. Government certification requirements for products and subscriptions like ours may change, thereby restricting our ability to sell into the federal government sector until we have attained the revised certification. If our products and subscriptions are late in achieving or fail to achieve compliance with these certifications and standards, or our end-customers do not renew their subscriptioncompetitors achieve compliance with these certifications and standards, we may be disqualified from selling our products, subscriptions, and support agreementsofferings to such governmental entity, or renew on less favorable terms,be at a competitive disadvantage, which would harm our revenuesbusiness, operating results, and financial condition. Government demand and payment for our products, subscriptions, and support offerings may grow more slowly than expectedbe impacted by government shutdowns, public sector budgetary cycles, contracting requirements, and funding authorizations, with funding reductions or decline.delays adversely affecting public sector demand for our products, subscriptions, and support offerings. Government entities may have statutory, contractual, or other legal rights to terminate contracts with our distributors and resellers for convenience or due to a default, and any such termination may adversely impact our future operating results. Governments routinely investigate and audit government contractors’ administrative processes, and any unfavorable audit could result in the government refusing to continue buying our products, subscriptions, and support offerings, a reduction of revenue, or fines or civil or criminal liability if the audit uncovers improper or illegal activities, which could adversely impact our operating results in a material way. Additionally, the U.S. government may require certain of the products that it purchases to be manufactured in the United States and other relatively high-cost manufacturing locations, and we may not manufacture all products in locations that meet such requirements, affecting our ability to sell these products, subscriptions, and support offerings to the U.S. government.
We face intense competition in our market especially from larger, well-established companies, and we may lack sufficient financial or other resources to maintain or improve our competitive position.
The marketindustry for enterprise security products is intensely competitive, and we expect competition to increase in the future from established competitors and new market entrants. Our main competitors fall into threefour categories:
•large companies that incorporate security features in their products, such as Cisco, and Juniper,Microsoft, or those that have acquired, or may acquire, large network and endpoint security vendors and have the technical and financial resources to bring competitive solutions to the market;
•independent security vendors, such as Symantec, Check Point, Fortinet, Crowdstrike, and FireEye,Zscaler, that offer a mix of networksecurity products;
•startups and endpoint security products; and
small and large companiespoint-product vendors that offer pointindependent or emerging solutions and/oracross various areas of security; and
•public cloud vendors and startups that offer solutions for cloud security services that compete with some(private, public, and hybrid cloud).
Many of our existing competitors have greater financial, technical, marketing, sales, and some of our potential competitors could have, substantial competitive advantages such as:
other resources, greater name recognition, and longer operating histories;
histories, and a larger sales and marketing budgets and resources;
broader distribution and established relationships with distribution partners and end-customers;
greater customer support resources;
base of customers than we do. They may be able to devote greater resources to make strategic acquisitions or enter into strategic partnerships;
the promotion and sale of products and services than we can, and they may offer lower laborpricing than we do. Further, they may have greater resources for research and development costs;
of new technologies, the provision of customer support, and the pursuit of acquisitions. They may also have larger and more mature intellectual property portfolios;portfolios, and
substantially greater financial, technical, and other resources.
In addition, some of our larger competitors have substantially broader and more diverse product and servicesservice offerings, which may make them less susceptible to downturns in a particular market and allow them to leverage their relationships based on other products or incorporate functionality into existing products to gain business in a manner that discourages users from purchasing our products and subscriptions, including throughincorporating cybersecurity features into their existing products or services and product bundling, selling at zero or negative margins, and offering concessions product bundling, or a closed technology platforms. Many of our smalleroffering. Some competitors thatmay have broader distribution and established relationships with distribution partners and end-customers. Other competitors specialize in providing protection from a single type of security threat, are often ablewhich may allow them to deliver these specialized security products to the market more quickly than we can.
OrganizationsWe also face competition from companies that usehave entrenched legacy products and services may believe that these products and services are sufficient to meet their security needs or that our platform only serves the needs of a portion of the enterprise security market. Accordingly, these organizations may continue allocating their information technology budgets for legacy products and services and may not adopt our security platform. Further, many organizationsofferings at end-user customers. End-user customers have also often invested substantial personnel and financial resources to design and operate their networks and have established deep relationships with other providers of networking and security products. As a result, these organizations may prefer to purchase from their existing suppliers rather than add or switch to a new supplier such as us regardless of product performance, features,us. In addition, as our customers refresh the security products bought in prior years, they may seek to consolidate vendors, which may result in current customers choosing to purchase products from our competitors. Due to budget constraints or greater services offerings oreconomic downturns, organizations may be more willing to incrementally add solutions to their existing network security infrastructure from existing suppliersrather than to replacereplacing it wholesale with our solutions.products and subscriptions.
Conditions in our market could change rapidly and significantly as a result of technological advancements, partnering or acquisitions by our competitors, or continuing market consolidation. New start-up companies that innovateOur competitors and largepotential competitors may be able to develop new or disruptive technologies, products, or services, and leverage new business models that are making significant investments in research and development may invent similarequal or superior to ours, achieve greater market acceptance of their products and services, disrupt our markets, and increase sales by utilizing different distribution channels than we do. In addition, new and enhanced technologies, thatincluding AI and machine learning, continue to increase our competition. To compete with oursuccessfully, we must accurately anticipate technology developments and deliver innovative, relevant, and useful products, services, and subscriptions.technologies in a timely manner. Some of our competitors have made or could make acquisitions of businesses that may allow them to offer more directly competitive and comprehensive solutions than they had previously offered and adapt more quickly to new technologies and end-customer needs. Our current and potential competitors may also establish cooperative relationships among themselves or with third parties that may further enhance their resources.
These competitive pressures in our market or our failure to compete effectively may result in price reductions, fewer orders, reduced revenue and gross margins, and loss of market share. AnyIf we are unable to compete successfully, or if competing successfully requires us to take aggressive pricing or other actions, our business, financial condition, and results of operations would be adversely affected.
We may acquire other businesses, which could subject us to adverse claims or liabilities, require significant management attention, disrupt our business, adversely affect our operating results, may not result in the expected benefits of such acquisitions, and may dilute stockholder value.
As part of our business strategy, we acquire and make investments in complementary companies, products, or technologies. The identification of suitable acquisition candidates is difficult, and we may not be able to complete such acquisitions on favorable terms, if at all. In addition, we may be subject to claims or liabilities assumed from an acquired company, product, or technology; acquisitions we complete could be viewed negatively by our end-customers, investors, and securities analysts; and we may incur costs and expenses necessary to address an acquired company’s failure to meetcomply with laws and addressgovernmental rules and regulations. Additionally, we may be subject to litigation or other claims in connection with the acquired company, including claims from terminated employees, customers, former stockholders, or other third parties, which may differ from or be more significant than the risks our business faces.
If we are unsuccessful at integrating past or future acquisitions in a timely manner, or the technologies and operations associated with such acquisitions, into our company, our revenue and operating results could be adversely affected. Any integration process may require significant time and resources, which may disrupt our ongoing business and divert management’s attention, and we may not be able to manage the integration process successfully or in a timely manner. We may have difficulty retaining key personnel of the acquired business. We may not successfully evaluate or utilize the acquired technology or personnel, realize anticipated synergies from the acquisition, or accurately forecast the financial impact of an acquisition transaction and integration of such acquisition, including accounting charges and any potential impairment of goodwill and intangible assets recognized in connection with such acquisitions. In addition, any acquisitions may be viewed negatively by our customers, financial markets, or investors and may not ultimately strengthen our competitive position or achieve our goals and business strategy.
We may have to pay cash, incur debt, or issue equity or equity-linked securities to pay for any future acquisitions, each of which could adversely affect our financial condition or the market price of our common stock. Furthermore, the sale of equity or issuance of equity-linked debt to finance any future acquisitions could result in dilution to our stockholders. The occurrence of any of these factorsrisks could seriously harm our business, operating results, and financial condition.
If we do not accurately predict, prepare for, and respond promptly to rapidly evolving technological and market developments and successfully manage product and subscription introductions and transitions to meet changing end-customer needs in the enterprise security industry, our competitive position and prospects will be harmed.
The enterprise security industry has grown quickly and continues to evolve rapidly. Moreover, many of our end-customers operate in markets characterized by rapidly changing technologies and business plans, which require them to add numerous network access points and adapt increasingly complex enterprise networks, incorporating a variety of hardware, software applications, operating systems, and networking protocols. If we fail to effectively anticipate, identify, and respond to rapidly evolving technological and market developments in a timely manner, our business will be harmed.
In order to anticipate and respond effectively to rapid technological changes and market developments, as well as evolving security threats, we must invest effectively in research and development to increase the reliability, availability, and scalability of our existing products and subscriptions and introduce new products and subscriptions. Our investments in research and development, including investments in AI, may not result in design or performance improvements, marketable products, subscriptions, or features, or may not achieve the cost savings or additional revenue that we expect. In addition, new and evolving products and services, including those that use AI, require significant investment and raise ethical, technological, legal, regulatory, and other challenges, which may negatively affect our brands and demand for our products and services. Because all of these investment areas are inherently risky, no assurance can be given that such strategies and offerings will be successful or will not harm our reputation, financial condition, and operating results.
In addition, we must continually change our products and expand our business strategy in response to changes in network infrastructure requirements, including the expanding use of cloud computing. For example, organizations are moving portions of their data to be managed by third parties, primarily infrastructure, platform, and application service providers, and may rely on such providers’ internal security measures. While we have historically been successful in developing, acquiring, and marketing new products and product enhancements that respond to technological change and evolving industry standards, we may not be able to continue to do so, and there can be no assurance that our new or future offerings will be successful or will achieve widespread market acceptance. If we fail to accurately predict and address end-customers’ changing needs and emerging technological trends in the enterprise security industry, including in the areas of AI, mobility, virtualization, cloud computing, and software-defined networks, our business could be harmed.
The technology in our portfolio is especially complex because it needs to effectively identify and respond to new and increasingly sophisticated methods of attack, while minimizing the impact on network performance. Additionally, some of our new features and related enhancements may require us to develop new hardware architectures that involve complex, expensive, and time-consuming research and development processes. The development of our portfolio is difficult and the timetable for commercial release and availability is uncertain as there can be long time periods between releases and availability of new features. If we experience unanticipated delays in the availability of new products, features, and subscriptions, and fail to meet customer expectations for such availability, our competitive position and business prospects will be harmed.
The success of new features depends on several factors, including appropriate new product definition, differentiation of new products, subscriptions, and features from those of our competitors, and market acceptance of these products, services, and features. Moreover, successful new product introduction and transition depends on a number of factors, including our ability to manage the risks associated with new product production ramp-up issues, the availability of application software for new products, the effective management of purchase commitments and inventory, the availability of products in appropriate quantities and costs to meet anticipated demand, and the risk that new products may have quality or other defects or deficiencies, especially in the early stages of introduction. There can be no assurance that we will successfully identify opportunities for new products and subscriptions, develop and bring new products and subscriptions to market in a timely manner, achieve market acceptance of our products and subscriptions, or that products, subscriptions, and technologies developed by others will not render our products, subscriptions, and technologies obsolete or noncompetitive.
Issues in the development and deployment of AI may result in reputational harm and legal liability and could adversely affect our results of operations.
We have incorporated, and are continuing to develop and deploy, AI into many of our products and solutions, including services that support our products and solutions. AI presents challenges and risks that could affect our products and solutions, and therefore our business. For example, AI algorithms may have flaws, and datasets used to train models may be insufficient or contain biased information. These potential issues could subject us to regulatory risk, legal liability, including under new proposed legislation regulating AI in jurisdictions such as the EU and regulations being considered in other jurisdictions, and brand or reputational harm.
The rapid evolution of AI, including potential government regulation of AI, requires us to invest significant resources to develop, test, and maintain AI in our products and services in a manner that meets evolving requirements and expectations. The rules and regulations adopted by policymakers over time may require us to make changes to our business practices. Developing, testing, and deploying AI systems may also increase the cost profile of our offerings due to the nature of the computing costs involved in such systems.
The intellectual property ownership and license rights surrounding AI technologies, as well as data protection laws related to the use and development of AI, are currently not fully addressed by courts or regulators. The use or adoption of AI technologies in our products may result in exposure to claims by third parties of copyright infringement or other intellectual property misappropriation, which may require us to pay compensation or license fees to third parties. The evolving legal, regulatory, and compliance framework for AI technologies may also impact our ability to protect our own data and intellectual property against infringing use.
A network or data security incident may allow unauthorized access to our network or data, harm our reputation, create additional liability, and adversely impact our financial results.
Increasingly, companies are subject to a wide variety of attacks on their networks on an ongoing basis. In addition to traditional computer “hackers,” malicious code (such as viruses and worms), phishing attempts, employee theft or misuse, and denial of service attacks, sophisticated nation-state and nation-state supported actors now engage in intrusions and attacks (including advanced persistent threat intrusions)intrusions and supply chain attacks), and add to the risks to our internal networks, cloud-deployed enterprise and customer-facing environments and the information they store and process. Incidences of cyberattacks and other cybersecurity breaches and incidents have increased and are likely to continue to increase. We and our third-party service providers face security threats and attacks from a variety of sources. Despite significantour efforts and processes to createprevent breaches of our internal networks, systems, and websites, our data, corporate systems, and security barriersmeasures, as well as those of our third-party service providers, are still vulnerable to such threats, it is virtually impossible for uscomputer viruses, break-ins, phishing attacks, ransomware attacks, or other types of attacks from outside parties, or breaches due to entirely mitigate these risks.employee error, malfeasance, or some combination of these. We cannot guarantee that the measures we have taken to protect our networks, systems, and websites will provide adequate security. Furthermore, as a well-known provider of security solutions, we may be a more attractive target for such attacks. The conflict in Ukraine and associated activities in Ukraine and Russia may increase the risk of cyberattacks on various types of infrastructure and operations, and the United States government has warned companies to be prepared for a significant increase in Russian cyberattacks in response to the Sanctions on Russia.
A security breach inor incident, or an attack against our data securityservice availability suffered by us, or our third-party service providers, could compromiseimpact our networks or networks secured by our products and subscriptions, creating system disruptions or slowdowns and exploiting security vulnerabilities of our products, andproducts. In addition, the information stored or otherwise processed on our networks, or those of our third-party service providers, could be accessed, publicly disclosed, altered, lost, stolen, rendered unavailable, or stolen,otherwise used or processed without authorization, which could subject us to liability and cause us financial harm. Although we have not yet experienced significant damages from unauthorized access by a third party of our internal network, anyAny actual or perceived breach of network security in our internal systems or networks, or any other actual or perceived data security incident we or our third-party service providers suffer, could result in significant damage to our reputation, negative publicity, loss of channel partners, end-customers, and sales, loss of competitive advantages over our competitors, increased costs to remedy any problems and otherwise respond to any incident, regulatory investigations and enforcement actions, demands, costly litigation.litigation, and other liability. In addition, we may incur significant costs and operational consequences of investigating, remediating, eliminating, and putting in place additional tools, devices, and other measures designed to prevent actual or perceived security breaches and other security incidents, as well as the costs to comply with any notification obligations resulting from any security incidents. Any of these negative outcomes could adversely impact the market perception of our products and subscriptions and end-customer and investor confidence in our company and could seriously harm our business or operating results.
Reliance on shipments at the end of the quarter could cause our revenue for the applicable period to fall below expected levels.
As a result of end-customer buying patterns and the efforts of our sales force and channel partners to meet or exceed their sales objectives, we have historically received a substantial portion of sales orders and generated a substantial portion of revenue during the last few weeks of each fiscal quarter. If expected revenue at the end of any fiscal quarter is delayed for any reason, including the failure of anticipated purchase orders to materialize (particularly for large enterprise end-customers with lengthy sales cycles), our logistics partners’ inability to ship products prior to fiscal quarter-end to fulfill purchase orders received near the end of the fiscal quarter, our failure to manage inventory to meet demand, any failure of our systems related to order review and processing, or any delays in shipments based on trade compliance requirements (including new compliance requirements imposed
by new or renegotiated trade agreements), revenue could fall below our expectations and the estimates of analysts for that quarter, which could adversely impact our business and operating results and cause a decline in the market price of our common stock.
Seasonality may cause fluctuations in our revenue.
We believe there are significant seasonal factors that may cause our second and fourth fiscal quarters to record greater revenue sequentially than our first and third fiscal quarters. We believe that this seasonality results from a number of factors, including:
end-customers with a December 31 fiscal year-end choosing to spend remaining unused portions of their discretionary budgets before their fiscal year-end, which potentially results in a positive impact on our revenue in our second fiscal quarter;
our sales compensation plans, which are typically structured around annual quotas and commission rate accelerators, which potentially results in a positive impact on our revenue in our fourth fiscal quarter;
seasonal reductions in business activity during August in the United States, Europe and certain regions, which potentially results in a negative impact on our first fiscal quarter revenue; and
the timing of end-customer budget planning at the beginning of the calendar year, which can result in a delay in spending at the beginning of the calendar year potentially resulting in a negative impact on our revenue in our third fiscal quarter.
As we continue to grow, seasonal or cyclical variations in our operations may become more pronounced, and our business, operating results and financial position may be adversely affected.
If we are unable to hire, integrate, train, retain, and motivate qualified personnel and senior management, our business could suffer.
Our future success depends, in part, on our ability to continue to attract, integrate, train, and retain qualified and highly skilled personnel. We are substantially dependent on the continued service of our existing engineering personnel because of the complexity of our platform. Additionally, any failure to hire, train, and adequately incentivize our sales personnel or the inability of our recently hired sales personnel to effectively ramp to target productivity levels could negatively impact our growth and operating margins. Competition for highly skilled personnel, particularly in engineering, is often intense, especially in the San Francisco Bay Area, where we have a substantial presence and need for such personnel. Additionally, potential changes in U.S. immigration policy may make it difficult to renew or obtain visas for any highly skilled personnel that we have hired or are actively recruiting.
In addition, the industry in which we operate generally experiences high employee attrition. Although we have entered into employment offer letters with our key personnel, these agreements have no specific duration and constitute at-will employment. We do not maintain key person life insurance policies on any of our employees. The loss of one or more of our key employees could seriously harm our business. If we are unable to attract, integrate, train, or retain the qualified and highly skilled personnel required to fulfill our current or future needs, our business, financial condition, and operating results could be harmed.
Our future performance also depends on the continued services and continuing contributions of our senior management to execute on our business plan and to identify and pursue new opportunities and product innovations. The loss of services of senior management or the ineffective management of any leadership transitions, especially within our sales organization, could significantly delay or prevent the achievement of our development and strategic objectives, which could adversely affect our business, financial condition, and operating results. Additionally, our chief financial officer recently advised us of his intent to retire from his position and if we are unable to timely attract, identify, hire and integrate a successor, our business and operating results could be harmed.
Further, we believe that a critical contributor to our success and our ability to retain highly skilled personnel has been our corporate culture, which we believe fosters innovation, teamwork, passion for end-customers, focus on execution, and the facilitation of critical knowledge transfer and knowledge sharing. As we grow and change, we may find it difficult to maintain these important aspects of our corporate culture. Any failure to preserve our culture as we grow could limit our ability to innovate and could negatively affect our ability to retain and recruit personnel, continue to perform at current levels or execute on our business strategy.
If we are not successful in executing our strategy to increase sales of our products and subscriptions to new and existing medium and large enterprise end-customers, our operating results may suffer.
Our growth strategy is dependent, in part, upon increasing sales of our products to new and existing medium and large enterprise end-customers. Sales to these end-customers involve risks that may not be present, or that are present to a lesser extent, with sales to smaller entities. These risks include:
competition from larger competitors, such as Cisco, Check Point, and Juniper, that traditionally target larger enterprises, service providers, and government entities and that may have pre-existing relationships or purchase commitments from those end-customers;
increased purchasing power and leverage held by large end-customers in negotiating contractual arrangements with us;
more stringent requirements in our worldwide support contracts, including stricter support response times and penalties for any failure to meet support requirements; and
longer sales cycles, in some cases over 12 months, and the associated risk that substantial time and resources may be spent on a potential end-customer that elects not to purchase our products and subscriptions.
At the beginning of fiscal 2017, we experienced execution challenges with respect to certain elements of our go-to-market strategy. While we have and will continue to implement changes to our go-to-market strategy that are designed to address these challenges, such changes may be difficult to implement and result in further disruptions to our sales organization or, once implemented, fail to resolve these challenges, which could impact our results of operations. In addition, product purchases by large enterprises are frequently subject to budget constraints, multiple approvals, and unplanned administrative, processing, and other delays. Finally, large enterprises typically have longer implementation cycles, require greater product functionality and scalability and a broader range of services, demand that vendors take on a larger share of risks, sometimes require acceptance provisions that can lead to a delay in revenue recognition, and expect greater payment flexibility from vendors. All of these factors can add further risk to business conducted with these end-customers. If we fail to realize an expected sale from a large end-customer in a particular quarter or at all, our business, operating results, and financial condition could be materially and adversely affected.
We rely on revenue from subscription and support offerings, and because we recognize revenue from subscription and support over the term of the relevant service period, downturns or upturns in sales of these subscription and support offerings are not immediately reflected in full in our operating results.
Subscription and support revenue accounts for a significant portion of our revenue, comprising 59.7% of total revenue in fiscal 2017, 51.3% of total revenue in fiscal 2016, and 46.9% of total revenue in fiscal 2015. Sales of new or renewal subscription and support contracts may decline and fluctuate as a result of a number of factors, including end-customers’ level of satisfaction with our products and subscriptions, the prices of our products and subscriptions, the prices of products and services offered by our competitors, and reductions in our end-customers’ spending levels. If our sales of new or renewal subscription and support contracts decline, our total revenue and revenue growth rate may decline and our business will suffer. In addition, we recognize subscription and support revenue monthly over the term of the relevant service period, which is typically one to five years. As a result, much of the subscription and support revenue we report each fiscal quarter is the recognition of deferred revenue from subscription and support contracts entered into during previous fiscal quarters. Consequently, a decline in new or renewed subscription or support contracts in any one fiscal quarter will not be fully or immediately reflected in revenue in that fiscal quarter but will negatively affect our revenue in future fiscal quarters. Also, it is difficult for us to rapidly increase our subscription and support revenue through additional subscription and support sales in any period, as revenue from new and renewal subscription and support contracts must be recognized over the applicable service period.
Defects, errors, or vulnerabilities in our products, subscriptions, or support offerings, the failure of our products or subscriptions to block a virus or prevent a security breach or incident, misuse of our products, or risks of product liability claims could harm our reputation and adversely impact our operating results.
Because our products and subscriptions are complex, they have contained and may contain design or manufacturing defects or errors that are not detected until after their commercial release and deployment by our end-customers. For example, from time to time, certain of our end-customers have reported defects in our products related to performance, scalability, and compatibility. Additionally, defects may cause our products or subscriptions to be vulnerable to security attacks, cause them to fail to help secure networks, or temporarily interrupt end-customers’ networking traffic. Because the techniques used by computer hackers to access or sabotage networks change frequently and generally are not recognized until launched against a target, we may be unable to anticipate these techniques and provide a solution in time to protect our end-customers’ networks. Furthermore, as a well-known providerIn addition, due to the Russian invasion of security solutions, our networks, products, including cloud-based technology, and subscriptionsUkraine, there could be targeted by attacks specifically designed to disrupta significant increase in Russian cyberattacks against our business and harmcustomers, resulting in an increased risk of a security breach of our reputation. In addition,end-customers’ systems. Furthermore, defects or errors in our subscription updates or our products could result in a failure of our subscriptions to effectively update end-customers’ hardware and cloud-based products. Our data centers and networks may experience technical failures and downtime may fail to distribute appropriate
updates, or may fail to meet the increased requirements of a growing installed end-customer base, any of which could temporarily or permanently expose our end-customers’ networks, leaving their networks unprotected against the latest security threats. Moreover, our products must interoperate with our end-customers’ existing infrastructure, which often have differentvaried specifications, utilize multiple protocol standards, deploy products from multiple vendors, and contain multiple generations of products that have been added over time. As a result, when problems occur in a network, it may be difficult to identify the sources of these problems.
The occurrence of any such problem in our products and subscriptions, whether real or perceived, could result in:
•expenditure of significant financial and product development resources in efforts to analyze, correct, eliminate, or work-around errors or defects or to address and eliminate vulnerabilities;
•loss of existing or potential end-customers or channel partners;
•delayed or lost revenue;
•delay or failure to attain market acceptance;
•an increase in warranty claims compared with our historical experience, or an increased cost of servicing warranty claims, either of which would adversely affect our gross margins; and
•litigation, regulatory inquiries, investigations, or investigations thatother proceedings, each of which may be costly and harm our reputation.
Further, our products and subscriptions may be misused by end-customers or third parties that obtain access to our products and subscriptions. For example, our products and subscriptions could be used to censor private access to certain information on the Internet. Such use of our products and subscriptions for censorship could result in negative press coverage and negatively affect our reputation.
The limitation of liability provisions in our standard terms and conditions of sale may not fully or effectively protect us from claims as a result of federal, state, or local laws or ordinances, or unfavorable judicial decisions in the United States or other countries. The sale and support of our products and subscriptions also entails the risk of product liability claims. Although we may be indemnified by our third-party manufacturers for product liability claims arising out of manufacturing defects, because we control the design of our products and subscriptions, we may not be indemnified for product liability claims arising out of design defects. WeWhile we maintain insurance to protect againstcoverage for certain claims associated with the usetypes of our products and subscriptions, butlosses, our insurance coverage may not adequately cover any claim asserted against us.us, if at all. In addition, even claims that ultimately are unsuccessful could result in our expenditure of funds in litigation, divert management’s time and other resources, and harm our reputation.
False detection of applications, viruses, spyware, vulnerability exploits, data patterns, or URL categories could adversely affectIn addition, our business.
Our classifications of application type, virus, spyware, vulnerability exploits, data, or URL categories may falsely detect, report, and act on applications, content, or threats that do not actually exist. This risk is heightened by the inclusion of a “heuristics” feature in our products and subscriptions, which attempts to identify applications and other threats not based on any known signatures but based on characteristics or anomalies which indicate that a particular item may be a threat. These false positives may impair the perceived reliability of our products and subscriptions and may therefore adversely impact market acceptance of our products and subscriptions. If our productssubscriptions and subscriptions restrict important files or applications based on falsely identifying them as malware or some other item that should be restricted, this could adversely affect end-customers’ systems and cause material system failures. Any such false identification of important files or applications could result in damage to our reputation, negative publicity, loss of channel partners, end-customers and sales, increased costs to remedy any problem, and costly litigation.
We rely on our channel partners to sell substantially all of our products, including subscriptions and support, and if these channel partners fail to perform, our ability to sell and distribute our products and subscriptions will be limited, and our operating results will be harmed.
Substantially all of our revenue is generated by sales through our channel partners, including distributors and resellers. We provide our channel partners with specific training and programs to assist them in selling our products, including subscriptions and support offerings, but there can be no assurance that these steps will be utilized or effective. In addition, our channel partners may be unsuccessful in marketing, selling, and supporting our products and subscriptions. We may not be able to incentivize these channel partners to sell our products and subscriptions to end-customers and, in particular, to large enterprises. These channel partners may also have incentives to promote our competitors’ products and may devote more resources to the marketing, sales, and support of competitive products. Our agreements with our channel partners may generally be terminated for any reason by either party with advance notice prior to each annual renewal date. We cannot be certain that we will retain these channel partners or that we will be able to secure additional or replacement channel partners. In addition, any new channel partner requires
extensive training and may take several months or more to achieve productivity. Our channel partner sales structure could subject us to lawsuits, potential liability, and reputational harm if, for example, any of our channel partners misrepresent the functionality of our products or subscriptions to end-customers or violate laws or our corporate policies. If we fail to effectively manage our sales channels or channel partners, our ability to sell our products and subscriptions and operating results will be harmed.
If we do not accurately predict, prepare for, and respond promptly to the rapidly evolving technological and market developments and successfully manage product and subscription introductions and transitions to meet changing end-customer needs in the enterprise security market, our competitive position and prospects will be harmed.
The enterprise security market has grown quickly and is expected to continue to evolve rapidly. Moreover, many of our end-customers operate in markets characterized by rapidly changing technologies and business plans, which require them to add numerous network access points and adapt increasingly complex enterprise networks, incorporating a variety of hardware, software applications, operating systems, and networking protocols. If we fail to accurately predict end-customers’ changing needs and emerging technological trends in the enterprise security industry, including in the areas of mobility, virtualization, cloud computing, and software defined networks (“SDN”), our business could be harmed. The technology in our platform is especially complex because it needs to effectively identify and respond to new and increasingly sophisticated methods of attack, while minimizing the impact on network performance. Additionally, some of our new platform features and related platform enhancements may require us to develop new hardware architectures that involve complex, expensive, and time-consuming research and development processes. The development of our platform is difficult and the timetable for commercial release and availability is uncertain as there can be long time periods between releases and availability of new platform features. If we experience unanticipated delays in the availability of new products, platform features, and subscriptions, and fail to meet customer expectations for such availability, our competitive position and business prospects will be harmed.
Additionally, we must commit significant resources to developing new platform features before knowing whether our investments will result in products, subscriptions, and platform features the market will accept. The success of new platform features depends on several factors, including appropriate new product definition, differentiation of new products, subscriptions, and platform features from those of our competitors, and market acceptance of these products, services and platform features. Moreover, successful new product introduction and transition depends on a number of factors including, our ability to manage the risks associated with new product production ramp-up issues, the availability of application software for new products, the effective management of purchase commitments and inventory, the availability of products in appropriate quantities and costs to meet anticipated demand, and the risk that new products may have quality or other defects or deficiencies in the early stages of introduction. There can be no assurance that we will successfully identify opportunities for new products and subscriptions, develop and bring new products and subscriptions to market in a timely manner, or achieve market acceptance of our products and subscriptions, or that products, subscriptions, and technologies developed by others will not render our products, subscriptions, or technologies obsolete or noncompetitive.
Our current research and development efforts may not produce successful products, subscriptions, or platform features that result in significant revenue, cost savings or other benefits in the near future, if at all.
Developing our products, subscriptions, platform features, and related enhancements is expensive. Our investments in research and development may not result in significant design improvements, marketable products, subscriptions, or platform features, or may result in products, subscriptions, or platform features that are more expensive than anticipated. Additionally, we may not achieve the cost savings or the anticipated performance improvements we expect, and we may take longer to generate revenue, or generate less revenue, than we anticipate. Our future plans include significant investments in research and development and related product and subscription opportunities. We believe that we must continue to dedicate a significant amount of resources to our research and development efforts to maintain our competitive position. However, we may not receive significant revenue from these investments in the near future, if at all, or these investments may not yield the expected benefits, either of which could adversely affect our business and operating results.
Because we depend on manufacturing partners to build and ship our products, we are susceptible to manufacturing and logistics delays and pricing fluctuations that could prevent us from shipping customer orders on time, if at all, or on a cost-effective basis, which may result in the loss of sales and end-customers.
We depend on manufacturing partners, primarily a subsidiary of Flex, our EMS provider, as sole source manufacturers for our product lines. Our reliance on these manufacturing partners reduces our control over the manufacturing process and exposes us to risks, including reduced control over quality assurance, product costs, product supply, timing and transportation risk. Our products are primarily manufactured by our manufacturing partners at facilities located in the United States. Over time, we intend to decrease the portion of our products that are manufactured outside the United States. The remaining portion of our products that are manufactured outside the United States may subject us to additional logistical risks or risks associated with complying with local rules and regulations in foreign countries. Significant changes to existing international trade agreements could lead to
manufacturing or logistics disruption resulting from import delays or the imposition of increased tariffs on our manufacturing partners which could severely impair our ability to fulfill orders.
In addition, we are subject to requirements under the Dodd-Frank Wall Street Reform and Consumer Protection Act of 2010 (the “Dodd-Frank Act”) to diligence, disclose, and report whether or not our products contain minerals originating from the Democratic Republic of the Congo and adjoining countries, or conflict minerals. Although the SEC has recently provided guidance with respect to a portion of the conflict minerals filing requirements that may somewhat reduce our reporting practices, we have incurred and expect to incur additional costs to comply with these disclosure requirements, including costs related to determining the source of any of the relevant minerals and metals used in our products. These requirements could adversely affect the sourcing, availability, and pricing of minerals used in the manufacture of semiconductor devices or other components used in our products. We may also encounter end-customers who require that all of the components of our products be certified as conflict free. If we are not able to meet this requirement, such end-customers may choose not to purchase our products.
Our manufacturing partners typically fulfill our supply requirements on the basis of individual orders. We do not have long-term contracts with these manufacturers that guarantee capacity, the continuation of particular pricing terms, or the extension of credit limits. Accordingly, they are not obligated to continue to fulfill our supply requirements and the prices we pay for manufacturing services could be increased on short notice. Our contract with Flex permits them to terminate the agreement for their convenience, subject to prior notice requirements. If we are required to change manufacturing partners, our ability to meet our scheduled product deliveries to our end-customers could be adversely affected, which could cause the loss of sales to existing or potential end-customers, delayed revenue or an increase in our costs which could adversely affect our gross margins. Any production interruptions for any reason, such as a natural disaster, epidemic, capacity shortages, or quality problems, at one of our manufacturing partners would negatively affect sales of our product lines manufactured by that manufacturing partner and adversely affect our business and operating results.
Managing the supply of our products and product components is complex. Insufficient supply and inventory may result in lost sales opportunities or delayed revenue, while excess inventory may harm our gross margins.
Our manufacturing partners procure components and build our products based on our forecasts, and we generally do not hold inventory for a prolonged period of time. These forecasts are based on estimates of future demand for our products, which are in turn based on historical trends and analyses from our sales and product management organizations, adjusted for overall market conditions. In order to reduce manufacturing lead times and plan for adequate component supply, from time to time we may issue forecasts for components and products that are non-cancelable and non-returnable.
Our inventory management systems and related supply chain visibility tools may be inadequate to enable us to forecast accurately and effectively manage supply of our products and product components. If we ultimately determine that we have excess supply, we may have to reduce our prices and write-down inventory, which in turn could result in lower gross margins. If our actual component usage and product demand are lower than the forecast we provide to our manufacturing partners, we accrue for losses on manufacturing commitments in excess of forecasted demand. Alternatively, insufficient supply levels may lead to shortages that result in delayed product revenue or loss of sales opportunities altogether as potential end-customers turn to competitors’ products that are readily available. If we are unable to effectively manage our supply and inventory, our operating results could be adversely affected.
Because some of the key components in our products come from limited sources of supply, we are susceptible to supply shortages or supply changes, which could disrupt or delay our scheduled product deliveries to our end-customers and may result in the loss of sales and end-customers.
Our products rely on key components, including integrated circuit components, which our manufacturing partners purchase on our behalf from a limited number of component suppliers, including sole source providers. The manufacturing operations of some of our component suppliers are geographically concentrated in Asia and elsewhere, which makes our supply chain vulnerable to regional disruptions, such as natural disasters, fire, political instability, civil unrest, a power outage, or a localized health risk, and as a result could impair the volume of components that we are able to obtain.
Further, we do not have volume purchase contracts with any of our component suppliers, and they could cease selling to us at any time. If we are unable to obtain a sufficient quantity of these components in a timely manner for any reason, sales of our products could be delayed or halted or we could be forced to expedite shipment of such components or our products at dramatically increased costs. Our component suppliers also change their selling prices frequently in response to market trends, including industry-wide increases in demand, and because we do not have volume purchase contracts with these component suppliers, we are susceptible to price fluctuations related to raw materials and components and may not be able to adjust our prices accordingly. Additionally, poor quality in any of the sole-sourced components in our products could result in lost sales or sales opportunities.
If we are unable to obtain a sufficient volume of the necessary components for our products on commercially reasonable terms or the quality of the components do not meet our requirements, we could also be forced to redesign our products and qualify new components from alternate component suppliers. The resulting stoppage or delay in selling our products and the expense of redesigning our products could result in lost sales opportunities and damage to customer relationships, which would adversely affect our business and operating results.
The sales prices of our products and subscriptions may decrease, which may reduce our gross profits and adversely impact our financial results.
The sales prices for our products and subscriptions may decline for a variety of reasons, including competitive pricing pressures, discounts, a change in our mix of products and subscriptions, anticipation of the introduction of new products or subscriptions, or promotional programs. Competition continues to increase in the market segments in which we participate, and we expect competition to further increase in the future, thereby leading to increased pricing pressures. Larger competitors with more diverse product and service offerings may reduce the price of products or subscriptions that compete with ours or may bundle them with other products and subscriptions. Additionally, although we price our products and subscriptions worldwide in U.S. dollars, currency fluctuations in certain countries and regions may negatively impact actual prices that channel partners and end-customers are willing to pay in those countries and regions. Furthermore, we anticipate that the sales prices and gross profits for our products will decrease over product life cycles. We cannot guarantee that we will be successful in developing and introducing new offerings with enhanced functionality on a timely basis, or that our product and subscription offerings, if introduced, will enable us to maintain our prices and gross profits at levels that will allow us to achieve and maintain profitability.
We generate a significant amount of revenue from sales to distributors, resellers, and end-customers outside of the United States, and we are therefore subject to a number of risks associated with international sales and operations.
We have a limited history of marketing, selling, and supporting our products and subscriptions internationally. We may experience difficulties in recruiting, training, managing, and retaining an international staff, and specifically staff related to sales management and sales personnel. We also may not be able to maintain successful strategic distributor relationships internationally or recruit additional companies to enter into strategic distributor relationships. Business practices in the international markets that we serve may differ from those in the United States and may require us in the future to include terms other than our standard terms related to payment, warranties, or performance obligations in end-customer contracts.
Additionally, our international sales and operations are subject to a number of risks, including the following:
political, economic and social uncertainty around the world, macroeconomic challenges in Europe, terrorist activities, and continued hostilities in the Middle East;
greater difficulty in enforcing contracts and accounts receivable collection and longer collection periods;
the uncertainty of protection for intellectual property rights in some countries;
greater risk of unexpected changes in foreign and domestic regulatory practices, tariffs, and tax laws and treaties, including regulatory and trade policy changes adopted by the new administration;
risks associated with trade restrictions and foreign legal requirements, including the importation, certification, and localization of our products required in foreign countries;
greater risk of a failure of foreign employees, channel partners, distributors, and resellers to comply with both U.S. and foreign laws, including antitrust regulations, the U.S. Foreign Corrupt Practices Act, the U.K. Bribery Act, U.S. or foreign sanctions regimes and export or import control laws, and any trade regulations ensuring fair trade practices;
heightened risk of unfair or corrupt business practices in certain geographies and of improper or fraudulent sales arrangements;
increased expenses incurred in establishing and maintaining office space and equipment for our international operations;
management communication and integration problems resulting from cultural and geographic dispersion; and
fluctuations in exchange rates between the U.S. dollar and foreign currencies in markets where we do business and related impact on sales cycles.
These and other factors could harm our ability to gain future international revenues and, consequently, materially impact our business, operating results, and financial condition. The expansion of our existing international operations and entry into additional international markets will require significant management attention and financial resources. Our failure to successfully manage our international operations and the associated risks effectively could limit the future growth of our business.
Further, we are subject to risks associated with changes in economic and political conditions in countries in which we operate or sell our products and subscriptions. For instance, on June 23, 2016, the U.K. held a referendum in which voters approved an exit from the E.U., commonly referred to as “Brexit.” As a result of the referendum, it is expected that the British government will begin negotiating the terms of the U.K.’s withdrawal from the E.U. A withdrawal could, among other outcomes, disrupt the free movement of goods, services and people between the U.K. and the E.U., undermine bilateral cooperation in key policy areas and significantly disrupt trade between the U.K. and the E.U.; however, the full effects of Brexit are uncertain and will depend on any agreements the U.K. makes to retain access to E.U. markets either during a transitional period or more permanently. In addition, Brexit could lead to legal uncertainty and potentially divergent national laws and regulations as the U.K. determines which E.U. laws to replace or replicate. Given these possibilities and others we may not anticipate, as well as the lack of comparable precedent, the full extent to which our business, operating results and financial condition could be adversely affected by Brexit is uncertain.
The announcement of Brexit and the withdrawal of the U.K. from the E.U. may also create global economic uncertainty, which may cause our end-customers to closely monitor their costs and reduce their spending budgets. Any of these effects of Brexit, among others noted above, could adversely affect our business, financial condition, operating results and cash flows.
We are exposed to fluctuations in currency exchange rates, which could negatively affect our financial condition and operating results.
Our sales contracts are primarily denominated in U.S. dollars, and therefore, substantially all of our revenue is not subject to foreign currency risk. However, including as a result of concerns regarding the impact of Brexit, there has been, and may continue to be, significant volatility in global stock markets and foreign currency exchange rates that result in the strengthening of the U.S. dollar against foreign currencies in which we conduct business. The strengthening of the U.S. dollar increases the real cost of our platform to our end-customers outside of the United States and may lead to delays in the purchase of our products, subscriptions, and support, and the lengthening of our sales cycle. If the U.S. dollar continues to strengthen, this could adversely affect our financial condition and operating results. In addition, increased international sales in the future, including through our channel partners and other partnerships, may result in greater foreign currency denominated sales, increasing our foreign currency risk.
Our operating expenses incurred outside the United States and denominated in foreign currencies are increasing and are subject to fluctuations due to changes in foreign currency exchange rates. If we are not able to successfully hedge against the risks associated with foreign currency fluctuations, our financial condition and operating results could be adversely affected. We have entered into forward contracts in an effort to reduce our foreign currency exchange exposure related to our foreign currency denominated expenditures. Refer to Note 4. Derivative Instruments in Part II, Item 8 of this Annual Report on Form 10-K for more information on our hedging transactions. The effectiveness of our existing hedging transactions and the availability and effectiveness of any hedging transactions we may decide to enter into in the future may be limited and we may not be able to successfully hedge our exposure, which could adversely affect our financial condition and operating results.
A small number of channel partners represent a large percentage of our revenue and gross accounts receivable. We are exposed to the credit and liquidity risk of some of our channel partners and to credit exposure in weakened markets, which could result in material losses.
For fiscal 2017, three distributors represented 65.7% of our total revenue, and as of July 31, 2017, four distributors represented 75.9% of our gross accounts receivable. Most of our sales to our channel partners are made on an open credit basis. Although we have programs in place that are designed to monitor and mitigate these risks, we cannot guarantee these programs will be effective in reducing our credit risks, especially as we expand our business internationally. If we are unable to adequately control these risks, our business, operating results, and financial condition could be harmed.
A portion of our revenue is generated by sales to government entities, which are subject to a number of challenges and risks.
Sales to government entities are subject to a number of risks. Selling to government entities can be highly competitive, expensive, and time-consuming, often requiring significant upfront time and expense without any assurance that these efforts will generate a sale. The substantial majority of our sales to date to government entities have been made indirectly through our channel partners. Government certification requirements for products and subscriptions like ours may change, thereby restricting our ability to sell into the federal government sector until we have attained the revised certification. If our products and subscriptions are late in achieving or fail to achieve compliance with these certifications and standards, or our competitors achieve compliance with these certifications and standards, we may be disqualified from selling our products and subscriptions to such governmental entity, or be at a competitive disadvantage, which would harm our business, operating results, and financial condition. Government demand and payment for our products and subscriptions may be impacted by public sector budgetary cycles, contracting requirements, and funding authorizations, with funding reductions or delays adversely affecting public sector demand for our products and subscriptions. Government entities may have statutory, contractual, or other legal rights to terminate contracts with our distributors and resellers for convenience or due to a default, and any such termination may adversely impact our future
operating results. Governments routinely investigate and audit government contractors’ administrative processes, and any unfavorable audit could result in the government refusing to continue buying our products and subscriptions, a reduction of revenue, or fines or civil or criminal liability if the audit uncovers improper or illegal activities, which could adversely impact our operating results in a material way. Finally, for purchases by the U.S. government, the U.S. government may require certain products to be manufactured in the United States and other relatively high cost manufacturing locations, and we may not manufacture all products in locations that meet such requirements, affecting our ability to sell these products and subscriptions to the U.S. government.
Our ability to sell our products and subscriptions is dependent on the quality of our technical support services and those of our channel partners, and the failure to offer high-quality technical support services could have a material adverse effect on our end-customers’ satisfaction with our products and subscriptions, our sales, and our operating results.
After our products and subscriptions are deployed within our end-customers’ networks, our end-customers depend on our technical support services, as well as the support of our channel partners, to resolve any issues relating to our products. Our channel partners often provide similar technical support for third parties’ products, and may therefore have fewer resources to dedicate to the support of our products and subscriptions. If we or our channel partners do not effectively assist our end-customers in deploying our products and subscriptions, succeed in helping our end-customers quickly resolve post-deployment issues, or provide effective ongoing support, our ability to sell additional products and subscriptions to existing end-customers would be adversely affected and our reputation with potential end-customers could be damaged. Many larger enterprise, service provider, and government entity end-customers have more complex networks and require higher levels of support than smaller end-customers. If we or our channel partners fail to meet the requirements of these larger end-customers, it may be more difficult to execute on our strategy to increase our coverage with larger end-customers. Additionally, if our channel partners do not effectively provide support to the satisfaction of our end-customers, we may be required to provide direct support to such end-customers, which would require us to hire additional personnel and to invest in additional resources. It can take several months to recruit, hire, and train qualified technical support employees. We mayIf we are not be able to hire such resources fast enough to keep up with unexpected demand, particularly if the sales of our products exceed our internal forecasts. As a result, our ability, and the ability of our channel partners to provide adequate and timely support to our end-customers will be negatively impacted, and our end-customers’ satisfaction with our products and subscriptions will be adversely affected. Additionally, to the extent that we may need to rely on our sales engineers to provide post-sales support while we are ramping up our support resources, our sales productivity will be negatively impacted, which would harm our revenues. OurAccordingly, our failure, or our channel partners’ failure, to provide and maintain high-quality support services could have a material adverse effect on our business, financial condition, and operating results.
We may acquire other businesses, which could require significant management attention, disrupt our business, dilute stockholder value, and adversely affect our operating results.
As part of our business strategy, we may acquire or make investments in complementary companies, products, or technologies. For example, in April 2014, we acquired Cyvera Ltd. (“Cyvera”), in May 2015, we acquired CirroSecure, Inc. (“CirroSecure”), and in February 2017 we acquired LightCyber. Our ability as an organization to acquire and integrate other companies, products, or technologies in a successful and timely manner is still relatively unproven. The identification of suitable acquisition candidates is difficult, and we may not be able to complete such acquisitions on favorable terms, if at all. If we do complete future acquisitions, we may not ultimately strengthen our competitive position or achieve our goals and business strategy, we may be subject to claims or liabilities assumed from an acquired company, product, or technology, and any acquisitions we complete could be viewed negatively by our end-customers, investors, and securities analysts. In addition, if we are unsuccessful at integrating past or future acquisitions, or the technologies associated with such acquisitions, into our company, the revenue and operating results of the combined company could be adversely affected. Any integration process may require significant time and resources, which may disrupt our ongoing business and divert management’s attention, and we may not be able to manage the integration process successfully. We may not successfully evaluate or utilize the acquired technology or personnel, realize anticipated synergies from the acquisition, or accurately forecast the financial impact of an acquisition transaction and integration of such acquisition, including accounting charges and any potential impairment of goodwill and intangible assets recognized in connection with such acquisitions. We may have to pay cash, incur debt, or issue equity or equity-linked securities to pay for any future acquisitions, each of which could adversely affect our financial condition or the market price of our common stock. Furthermore, the sale of equity or issuance of equity-linked debt to finance any future acquisitions could result in dilution to our stockholders. See the risk factors entitled “Our failure to raise additional capital or generate the significant capital necessary to expand our operations and invest in new products and subscriptions could reduce our ability to compete and could harm our business” and “The issuance of additional stock in connection with financings, acquisitions, investments, our stock incentive plans, the conversion of our Notes or exercise of the related warrants, or otherwise will dilute all other stockholders.” The occurrence of any of these risks could harm our business, operating results, and financial condition.
RISKS RELATED TO INTELLECTUAL PROPERTY AND TECHNOLOGY LICENSING
Claims by others that we infringe their proprietary technology or otherintellectual property rights could harm our business.
Companies in the enterprise security industry own large numbers of patents, copyrights, trademarks, domain names, and trade secrets and frequently enter into litigation based on allegations of infringement, misappropriation, or other violations of intellectual property or otherrights. In addition, non-practicing entities also frequently bring claims of infringement of intellectual property rights. Third parties are asserting, have asserted, and may in the future assert claims of infringement of intellectual property rights against us. For example, in December 2011, Juniper, one
Third parties may also assert such claims against our end-customers or channel partners, whom our standard license and other agreements obligate us to indemnify against claims that our products and subscriptions infringe the intellectual property rights of third parties. In addition, to the extent we hire personnel from competitors, we may be subject to allegations that they have been improperly solicited, that they have divulged proprietary or other confidential information, or that their former employers own their inventions or other work product. Furthermore, we may be unaware of the intellectual property rights of others that may cover some or all of our technology, or products, subscriptions, and subscriptions.services. As the number of products and competitorswe expand our footprint, both in our market increasesplatforms, products, subscriptions, and services and geographically, more overlaps occur and we may face more infringement claims may increase. both in the United States and abroad.
While we intend to increasehave been increasing the size of our patent portfolio, our competitors and others may now and in the future have significantly larger and more mature patent portfolios than we have. In addition, litigation mayhas involved and will likely continue to involve patent holdingpatent-holding companies or other adverse patent owners who have no relevant product revenue and against whom our own patents may therefore provide little or no deterrence or protection. In addition, we have not registered our trademarks in all of our geographic markets and failure to secure those registrations could adversely affect our ability to enforce and defend our trademark rights. Any claim of infringement by a third party, even those without merit, could cause us to incur substantial costs defending against the claim, could distract our management from our business, and could require us to cease use of such intellectual property. Furthermore, because of the substantial amount of discovery required in connection with intellectual property litigation, there is a risk that some of our confidential information could be compromised by disclosure during this type of litigation. A successful claimant could secure a judgment, or we may agree to a settlement that prevents us from distributing certain products or performing certain services or that requires us to pay substantial damages, royalties, or other fees. Any of these events could seriously harm our business, financial condition, and operating results.
Our proprietary rights may be difficult to enforce or protect, which could enable others to copy or use aspects of our products or subscriptions without compensating us.
We rely and expect to continue to rely on a combination of confidentiality and license agreements with our employees, consultants, and third parties with whom we have relationships, as well as trademark, copyright, patent, and trade secret protection laws, to protect our proprietary rights. We have filed various applications for certain aspects of our intellectual property. Valid patents may not issue from our pending applications, and the claims eventually allowed on any patents may not be sufficiently broad to protect our technology or products and subscriptions. We cannot be certain that we were the first to make the inventions claimed in our pending patent applications or that we were the first to file for patent protection, which could prevent our patent applications from issuing as patents or invalidate our patents following issuance. Additionally, the process of obtaining patent protection is expensive and time-consuming, and we may not be able to prosecute all necessary or desirable patent applications at a reasonable cost or in a timely manner. Any issued patents may be challenged, invalidated or circumvented, and any rights granted under these patents may not actually provide adequate defensive protection or competitive advantages to us. Additional uncertainty may result from changes to patent-related laws and court rulings in the United States and other jurisdictions. As a result, we may not be able to obtain adequate patent protection or effectively enforce any issued patents.
Despite our efforts to protect our proprietary rights, unauthorized parties may attempt to copy aspects of our products or subscriptions or obtain and use information that we regard as proprietary. We generally enter into confidentiality or license agreements with our employees, consultants, vendors, and end-customers, and generally limit access to and distribution of our proprietary information. However, we cannot be certain that we have entered into such agreements with all parties who may have or have had access to our confidential information or that the agreements we have entered into will not be breached. We cannot guarantee that any of the measures we have taken will prevent misappropriation of our technology. Because we may be an attractive target for computer hackers, we may have a greater risk of unauthorized access to, and misappropriation of, our proprietary information. In addition, the laws of some foreign countries do not protect our proprietary rights to as great an extent as the laws of the United States, and many foreign countries do not enforce these laws as diligently as government agencies and private parties in the United States. From time to time, we may need to take legal action to enforce our patents and other intellectual property rights, to protect our trade secrets, to determine the validity and scope of the proprietary rights of others, or to defend against claims of infringement or invalidity. Such litigation could result in substantial costs and diversion of resources and could negatively affect our business, operating results, and financial condition. Attempts to enforce our rights against third parties could also provoke these third parties to assert their own intellectual property or other rights against us or result in a holding that invalidates or narrows the scope of our rights, in whole or in part. If we are unable to protect our proprietary rights (including aspects of our software and products protected other than by patent rights), we may find ourselves at a competitive disadvantage to
others who need not incur the additional expense, time, and effort required to create the innovative products that have enabled us to be successful to date. Any of these events would have a material adverse effect on our business, financial condition, and operating results.
Our use of open source software in our products and subscriptions could negatively affect our ability to sell our products and subscriptions and subject us to possible litigation.
Our products and subscriptions contain software modules licensed to us by third-party authors under “open source” licenses. Some open source licenses contain requirements that we make available applicable source code for modifications or derivative works we create based upon the type of open source software we use. If we combine our proprietary software with open source software in a certain manner, we could, under certain open source licenses, be required to release the source code of our proprietary software to the public. This would allow our competitors to create similar products or subscriptions with lower development effort and time and ultimately could result in a loss of product sales for us.
Although we monitor our use of open source software to avoid subjecting our products and subscriptions to conditions we do not intend, the terms of many open source licenses have not been interpreted by United States courts, and there is a risk that these licenses could be construed in a way that could impose unanticipated conditions or restrictions on our ability to commercialize our products and subscriptions. From time to time, there have been claims against companies that distribute or use open source software in their products and subscriptions, asserting that open source software infringes the claimants’ intellectual property rights. We could be subject to suits by parties claiming infringement of intellectual property rights in what we believe to be licensed open source software. If we are held to have breached the terms of an open source software license, we could be required to seek licenses from third parties to continue offering our products and subscriptions on terms that are not economically feasible, to re-engineerreengineer our products and subscriptions, to discontinue the sale of our products and subscriptions if re-engineeringreengineering could not be accomplished on a timely basis, or to make generally available, in source code form, our proprietary code, any of which could adversely affect our business, operating results, and financial condition.
In addition to risks related to license requirements, usage of open source software can lead to greater risks than use of third-party commercial software, as open source licensors generally do not provide warranties or assurance of title or controls on origin of the software. In addition, many of the risks associated with usage of open source software, such as the lack of warranties or assurances of title, cannot be eliminated, and could, if not properly addressed, negatively affect our business. We have established processes to help alleviate these risks, including a review process for screening requests from our development organizations for the use of open source software, but we cannot be sure that our processes for controlling our use of open source software in our products and subscriptions will be effective.
We license technology from third parties, and our inability to maintain those licenses could harm our business.
We incorporate technology that we license from third parties, including software, into our products and subscriptions. We cannot be certain that our licensors are not infringing the intellectual property rights of third parties or that our licensors have sufficient rights to the licensed intellectual property in all jurisdictions in which we may sell our products and subscriptions. In addition, some licenses may be non-exclusive, and therefore our competitors may have access to the same technology licensed to us. Some of our agreements with our licensors may be terminated for convenience by them. We may also be subject to additional fees or be required to obtain new licenses if any of our licensors allege that we have not properly paid for such licenses or that we have improperly used the technologies under such licenses, and such licenses may not be available on terms acceptable to us or at all. If we are unable to continue to license any of this technology because of intellectual property infringement claims brought by third parties against our licensors or against us, or claims against us by our licensors, or if we are unable to continue our license agreements or enter into new licenses on commercially reasonable terms, our ability to develop and sell products and subscriptions containing such technology would be severely limited and our business could be harmed. Additionally, if we are unable to license necessary technology from third parties, we may be forced to acquire or develop alternative technology, which we may be unable to do in a commercially feasible manner or at all, and we may be required to use alternative technology of lower quality or performance standards. This would limit and delay our ability to offer new or competitive products and subscriptions and increase our costs of production. As a result, our margins, market share, and operating results could be significantly harmed.
RISKS RELATED TO OPERATIONS
Because we depend on manufacturing partners to build and ship our hardware products, we are susceptible to manufacturing and logistics delays and pricing fluctuations that could prevent us from shipping customer orders on time, if at all, or on a cost-effective basis, which may result in the loss of sales and end-customers.
We depend on manufacturing partners, primarily our EMS provider, Flex, to manufacture our hardware product lines. Our reliance on these manufacturing partners reduces our control over the manufacturing process and exposes us to risks, including reduced control over quality assurance, product costs, product supply, timing, and transportation risk. Our hardware products are manufactured by our manufacturing partners at facilities located primarily in the United States. Some of the components in our products are sourced either through Flex or directly by us from component suppliers outside the United States. The portion of our hardware products that are sourced outside the United States may subject us to geopolitical risks, additional logistical risks or risks associated with complying with local rules and regulations in foreign countries.
Significant changes to existing international trade agreements could lead to sourcing or logistics disruption resulting from import delays or the imposition of increased tariffs on our sourcing partners. For example, the United States and Chinese governments have each enacted, and discussed additional, import tariffs. Some components that we import for final manufacturing in the United States have been impacted by these tariffs. As a result, our costs have increased and we have raised, and may be required to further raise, prices on our hardware products, all of which could severely impair our ability to fulfill orders.
Our manufacturing partners typically fulfill our supply requirements on the basis of individual purchase orders. We do not have long-term contracts with these manufacturers that guarantee capacity, the continuation of particular pricing terms, or the extension of credit limits. Accordingly, they are not obligated to continue to fulfill our supply requirements and the prices we pay for manufacturing services could be increased on short notice. Our contract with Flex permits them to terminate the agreement for their convenience, subject to prior notice requirements. If we are required to change manufacturing partners, our ability to meet our scheduled product deliveries to our end-customers could be adversely affected, which could cause the loss of sales to existing or potential end-customers, delayed revenue or an increase in our costs which could adversely affect our gross margins. Any production interruptions for any reason, such as a natural disaster, epidemic or pandemic, capacity shortages, or quality problems at one of our manufacturing partners would negatively affect sales of our product lines manufactured by that manufacturing partner and adversely affect our business and operating results.
Managing the supply of our hardware products and product components is complex. Insufficient supply and inventory would result in lost sales opportunities or delayed revenue, while excess inventory would harm our gross margins.
Our manufacturing partners procure components and build our hardware products based on our forecasts, and we generally do not hold inventory for a prolonged period of time. These forecasts are based on estimates of future demand for our products, which are in turn based on historical trends and analyses from our sales and product management organizations, adjusted for overall market conditions. In order to reduce manufacturing lead times and plan for adequate component supply, from time to time we may issue forecasts for components and products that are non-cancelable and non-returnable.
Our inventory management systems and related supply chain visibility tools may be inadequate to enable us to forecast accurately and effectively manage supply of our hardware products and product components. If we ultimately determine that we have excess supply, we may have to reduce our prices and write-down inventory, which in turn could result in lower gross margins. If our actual component usage and product demand are lower than the forecast we provide to our manufacturing partners, we accrue for losses on manufacturing commitments in excess of forecasted demand. Alternatively, insufficient supply levels may lead to shortages that result in delayed hardware product revenue or loss of sales opportunities altogether as potential end-customers turn to competitors’ products that are readily available. If we are unable to effectively manage our supply and inventory, our operating results could be adversely affected.
Because some of the key components in our hardware products come from limited sources of supply, we are susceptible to supply shortages or supply changes, which, in certain cases, have disrupted or delayed our scheduled product deliveries to our end-customers, increased our costs and may result in the loss of sales and end-customers.
Our hardware products rely on key components, including integrated circuit components, which our manufacturing partners purchase on our behalf from a limited number of component suppliers, including sole source providers. The manufacturing operations of some of our component suppliers are geographically concentrated in Asia and elsewhere, which makes our supply chain vulnerable to regional disruptions, such as natural disasters, fire, political instability, civil unrest, power outages, or health risks. In addition, we continue to experience supply chain disruption and have incurred increased costs resulting from inflationary pressures. We are also monitoring the tensions between China and Taiwan, and between the U.S. and China, which could have an adverse impact on our business or results of operations in future periods.
Further, we do not have volume purchase contracts with any of our component suppliers, and they could cease selling to us at any time. If we are unable to obtain a sufficient quantity of these components in a timely manner for any reason, sales of our hardware products could be delayed or halted, or we could be forced to expedite shipment of such components or our hardware products at dramatically increased costs. Our component suppliers also change their selling prices frequently in response to market trends, including industry-wide increases in demand. Because we do not have, for the most part, volume purchase contracts with our component suppliers, we are susceptible to price fluctuations related to raw materials and components and may not be able to adjust our prices accordingly. Additionally, poor quality in any of the sole-sourced components in our products could result in lost sales or sales opportunities.
If we are unable to obtain a sufficient volume of the necessary components for our hardware products on commercially reasonable terms or the quality of the components do not meet our requirements, we could also be forced to redesign our products and qualify new components from alternate component suppliers. The resulting stoppage or delay in selling our hardware products and the expense of redesigning our hardware products would result in lost sales opportunities and damage to customer relationships, which would adversely affect our business and operating results.
If we are unable to attract, retain, and motivate our key technical, sales, and management personnel, our business could suffer.
Our future success depends, in part, on our ability to continue to attract, retain, and motivate the members of our management team and other key employees. For example, we are substantially dependent on the continued service of our engineering personnel because of the complexity of our offerings. Competition for highly skilled personnel, particularly in engineering, including in the areas of AI and machine learning, is often intense, especially in the San Francisco Bay Area, where we have a substantial presence and need for such personnel. In addition, the industry in which we operate generally experiences high employee attrition. Our future performance depends on the continuing services and contributions of our senior management to execute on our business plan and to identify and pursue new opportunities and product innovations. If we are unable to hire, integrate, train, or retain the qualified and highly skilled personnel required to fulfill our current or future needs, our business, financial condition, and operating results could be harmed.
Further, we believe that a critical contributor to our success and our ability to retain highly skilled personnel has been our corporate culture, which we believe fosters innovation, inclusion, teamwork, passion for end-customers, focus on execution, and the facilitation of critical knowledge transfer and knowledge sharing. As we grow and change, we may find it difficult to maintain these important aspects of our corporate culture. While we are taking steps to develop a more inclusive and diverse workforce, there is no guarantee that we will be able to do so. Any failure to preserve our culture as we grow could limit our ability to innovate and could negatively affect our ability to retain and recruit personnel, continue to perform at current levels or execute on our business strategy.
We generate a significant amount of revenue from sales to distributors, resellers, and end-customers outside of the United States, and we are therefore subject to a number of risks associated with international sales and operations.
Our ability to grow our business and our future success will depend to a significant extent on our ability to expand our operations and customer base worldwide. Many of our customers, resellers, partners, suppliers, and manufacturers operate around the world. Operating in a global marketplace, we are subject to risks associated with having an international reach and compliance and regulatory requirements. We may experience difficulties in attracting, managing, and retaining an international staff, and we may not be able to recruit and maintain successful strategic distributor relationships internationally. Business practices in the international markets that we serve may differ from those in the United States and may require us in the future to include terms other than our standard terms related to payment, warranties, or performance obligations in end-customer contracts.
Additionally, our international sales and operations are subject to a number of risks, including the following:
•political, economic, and social uncertainty around the world, health risks such as epidemics and pandemics like COVID-19, macroeconomic challenges in Europe, terrorist activities, Russia’s invasion of Ukraine, tensions between China and Taiwan, and continued hostilities in the Middle East;
•unexpected changes in, or the application of, foreign and domestic laws and regulations (including intellectual property rights protections), regulatory practices, trade restrictions, and foreign legal requirements, including those applicable to the importation, certification, and localization of our products, tariffs, and tax laws and treaties, including regulatory and trade policy changes adopted by the current administration, such as the Sanctions on Russia, or foreign countries in response to regulatory changes adopted by the current administration; and
•non-compliance with U.S. and foreign laws, including antitrust regulations, anti-corruption laws, such as the U.S. Foreign Corrupt Practices Act and the U.K. Bribery Act, U.S. or foreign sanctions regimes and export or import control laws, and any trade regulations ensuring fair trade practices.
These and other factors could harm our future international revenues and, consequently, materially impact our business, operating results, and financial condition. The expansion of our existing international operations and entry into additional international markets will require significant management attention and financial resources. Our failure to successfully manage our international operations and the associated risks effectively could limit the future growth of our business.
We are exposed to fluctuations in foreign currency exchange rates, which could negatively affect our financial condition and operating results.
Our sales contracts are denominated in U.S. dollars, and therefore, our revenue is not subject to foreign currency risk; however, in the event of a strengthening of the U.S. dollar against foreign currencies in which we conduct business, the cost of our products to our end-customers outside of the United States would increase, which could adversely affect our financial condition and operating results. In addition, increased international sales in the future, including through our channel partners and other partnerships, may result in foreign currency denominated sales, increasing our foreign currency risk.
Our operating expenses incurred outside the United States and denominated in foreign currencies are generally increasing and are subject to fluctuations due to changes in foreign currency exchange rates. If we are not able to successfully hedge against the risks associated with foreign currency fluctuations, our financial condition and operating results could be adversely affected. We have entered into forward contracts in an effort to reduce our foreign currency exchange exposure related to our foreign currency denominated expenditures. As of July 31, 2023, the total notional amount of our outstanding foreign currency forward contracts was $957.5 million. For more information on our hedging transactions, refer to Note 6. Derivative Instruments in Part II, Item 8 of this Annual Report on Form 10-K. The effectiveness of our existing hedging transactions and the availability and effectiveness of any hedging transactions we may decide to enter into in the future may be limited, and we may not be able to successfully hedge our exposure, which could adversely affect our financial condition and operating results.
We face risks associated with having operations and employees located in Israel.
As a result of various of our acquisitions, of Cyveraincluding Cider, Cyber Secdo Ltd. (“Secdo”), PureSec Ltd. (“PureSec”), and LightCyber,Twistlock Ltd. (“Twistlock”), we have offices and employees located in Israel. As a result,Accordingly, political, economic, and military conditions in Israel directly affect our operations.operations, including the recent political unrest in Israel. The future of peace efforts between Israel and its Arab neighbors remains uncertain. There has been a significant increase in hostilities and political unrest between Hamas and Israel in the past few years. The effects of these hostilities and violence on the Israeli economy and our operations in Israel are unclear, and we cannot predict the effect on us of further increases in these hostilities or future armed conflict, political instability, or violence in the region. Current or future tensions and conflicts in the Middle East could adversely affect our business, operating results, financial condition, and cash flows.
In addition, many of our employees in Israel are obligated to perform annual reserve duty in the Israeli military and are subject to being called for active duty under emergency circumstances. We cannot predict the full impact of these conditions on us
in the future, particularly if emergency circumstances or an escalation in the political situation occurs. If many of our employees in Israel are called for active duty for a significant period of time, our operations and our business could be disrupted and may not be able to function at full capacity. Any disruption in our operations in Israel could adversely affect our business.
Our failure to adequately protect personal information could have a material adverse effect on our business.
A wide variety of provincial, state, national, and international laws and regulations apply to the collection, use, retention, protection, disclosure, transfer, and other processing of personal data. These data protection and privacy-related laws and regulations are evolving and being tested in courts and may result in ever-increasing regulatory and public scrutiny as well as escalating levels of enforcement and sanctions. Further, the interpretation and application of foreign laws and regulations in many cases is uncertain, and our legal and regulatory obligations in foreign jurisdictions are subject to frequent and unexpected changes, including the potential for various regulatory or other governmental bodies to enact new or additional laws or regulations, to issue rulings that invalidate prior laws or regulations, or to increase penalties significantly. For example, the recently adopted E.U. General Data Protection Regulation, effective in May 2018, imposes more stringent data protection requirements, and provides for greater penalties for noncompliance. Our failure to comply with applicable laws and regulations, or to protect personal data, could result in enforcement action against us, including fines, imprisonment of company officials and public censure, claims for damages by end-customers and other affected individuals, damage to our reputation and loss of goodwill (both in relation to existing end-customers and prospective end-customers), any of which could have a material adverse effect on our operations, financial performance, and business. Evolving and changing definitions of personal data and personal information, within the E.U., the United States, and elsewhere, especially relating to classification of IP addresses, machine identification, location data, and other information, may limit or inhibit our ability to operate or expand our business, including limiting strategic partnerships that may involve the sharing of data. Even the perception of privacy concerns, whether or not valid, may harm our reputation and inhibit adoption of our products and subscriptions by current and future end-customers.
We are subject to governmental export and import controls that could subject us to liability or impair our ability to compete in international markets.
Because we incorporate encryption technology into our products, certain of our products are subject to U.S. export controls and may be exported outside the United States only with the required export license or through an export license exception. If we were to fail to comply with U.S. export licensing requirements, U.S. customs regulations, U.S. economic sanctions, or other laws, we could be subject to substantial civil and criminal penalties, including fines, incarceration for responsible employees and managers, and the possible loss of export or import privileges. Obtaining the necessary export license for a particular sale may be time-consuming and may result in the delay or loss of sales opportunities. Furthermore, U.S. export control laws and economic sanctions prohibit the shipment of certain products to U.S. embargoed or sanctioned countries, governments, and persons. Even though we take precautions to ensure that our channel partners comply with all relevant regulations, any failure by our channel partners to comply with such regulations could have negative consequences for us, including reputational harm, government investigations, and penalties.
In addition, various countries regulate the import of certain encryption technology, including through import permit and license requirements, and have enacted laws that could limit our ability to distribute our products or could limit our end-customers’ ability to implement our products in those countries. Changes in our products or changes in export and import regulations may create delays in the introduction of our products into international markets, prevent our end-customers with international operations from deploying our products globally or, in some cases, prevent or delay the export or import of our products to certain countries, governments, or persons altogether. Any change in export or import regulations, economic sanctions, such as the Sanctions on Russia, or related legislation, shift in the enforcement or scope of existing regulations, or change in the countries, governments, persons, or technologies targeted by such regulations could result in decreased use of our products by, or in our decreased ability to export or sell our products to, existing or potential end-customers with international operations. Any decreased use of our products or limitation on our ability to export to or sell our products in international markets would likely adversely affect our business, financial condition, and operating results.
RISKS RELATED TO PRIVACY AND DATA PROTECTION
Our actual or perceived failure to raise additional capital or generate the significant capital necessary to expand our operations and invest in new products and subscriptionsadequately protect personal data could reduce our ability to compete and could harmhave a material adverse effect on our business.
We intendA wide variety of laws and regulations apply to continuethe collection, use, retention, protection, disclosure, transfer, and other processing of personal data in jurisdictions where we and our customers operate. Compliance with these laws and regulations is difficult and costly. These laws and regulations are also subject to make investmentsfrequent and unexpected changes, new or additional laws or regulations may be adopted, and rulings that invalidate prior laws or regulations may be issued. For example, we are subject to support our business growththe E.U. General Data Protection Regulation (“E.U. GDPR”) and may require additional fundsthe U.K. General Data Protection Regulation (‘U.K. GDPR,” and collectively the “GDPR”), both of which impose stringent data protection requirements, provide for costly penalties for noncompliance (up to respondthe greater of (a) €20 million under the “E.U. GDPR” or £17.5 million under the “U.K. GDPR,” and (b) 4% of annual worldwide turnover), and confer the right upon data subjects and consumer associations to business challenges, includinglodge complaints with supervisory authorities, seek judicial remedies, and obtain compensation for damages resulting from violations.
The GDPR requires, among other things, that personal data be transferred outside of the needE.U. (or, in the case of the U.K. GDPR, the U.K.) to develop new featuresthe United States and other jurisdictions only where adequate safeguards are implemented or a derogation applies. In practice, we rely on standard contractual clauses approved under the GDPR to enhance our platform, improve our operating infrastructure,carry out such transfers and to receive personal data subject to the GDPR (directly or acquire complementary businesses and technologies. Accordingly,indirectly) in the United States. In the future, we may needself-certify to engagethe EU-U.S. Data Privacy Framework (“EU-U.S. DPF”), which has been approved for transfers of personal data subject to the GDPR to the United States and requires public disclosures of adherence to data protection principles and the submission of jurisdiction to European regulatory authorities. Following the “Schrems II” decision by the Court of Justice of the European Union, transfers of personal data to recipients in equity or debt financingsthird countries are also subject to secure additional funds. Ifassessments and safeguards beyond the implementation of approved transfer mechanisms. The decision imposed a requirement for companies to carry out an assessment of the laws and practices governing access to personal data in the third country to ensure an essentially equivalent level of data protection to that afforded in the E.U.
Among other effects, we raise additional equity or equity-linked financing, our stockholders may experience significant dilution of their ownership interestsadditional costs associated with increased compliance burdens, reduced demand for our offerings from current or prospective customers in the European Economic Area (“EEA”), Switzerland, and the market price ofU.K. (collectively, “Europe”) to use our common stock could decline. For example, in June 2014, we issued 0.0% Convertible Senior Notes due 2019 (the “Notes”) and any conversion of some or allproducts, on account of the Notes into common stock will diluterisks identified in the ownership interests of existing stockholders to the extent we deliver shares upon conversion of any of the Notes. See the risk factor entitled “The issuance of additional stock in connection with financings, acquisitions, investments, our stock incentive plans, the
conversion of our Notes, or otherwise will dilute all other stockholders.” Furthermore, if we engage in additional debt financing, the holders of our debt would have priority over the holders of our common stock,Schrems II decision, and we may be requiredfind it necessary or desirable to accept terms that restrictmake further changes to our abilityprocessing of personal data of European residents. The regulatory environment applicable to the handling of European residents’ personal data, and our actions taken in response, may cause us to assume additional liabilities or incur additional indebtedness. We may also be required to take other actions that would otherwise becosts, including in the interests ofevent we self-certify to the debt holdersEU-U.S. DPF. Moreover, much like with Schrems II, we anticipate future legal challenges to the approved data transfer mechanisms between Europe and would require usthe United States, including a challenge to maintain specified liquidity or other ratios, any of whichthe EU-U.S. DPF. Such legal challenges could harmresult in additional legal and regulatory risk, compliance costs, and in our business, operating results, and financial condition being harmed. Additionally, we and our customers may face risk of enforcement actions by data protection authorities in Europe relating to personal data transfers to us and by us from Europe. Any such enforcement actions could result in substantial costs and diversion of resources, and distract management and technical personnel. These potential liabilities and enforcement actions could also have an overall negative affect on our business, operating results, and financial condition.
We are also subject to the California Consumer Privacy Act, as amended by the California Privacy Rights Act (collectively, the “CCPA”). The CCPA requires, among other things, covered companies to provide enhanced disclosures to California consumers and to afford such consumers certain rights regarding their personal data, including the right to opt out of data sales for targeted advertising, and creates a private right of action to individuals affected by a data breach, if the breach was caused by a lack of reasonable security. The effects of the CCPA have been significant, requiring us to modify our data processing practices and policies and to incur substantial costs and expenses for compliance. Moreover, additional state privacy laws have been passed and will require potentially substantial efforts to obtain compliance. These include laws enacted in at least ten states, which all go into effect by January 1, 2026.
We may notalso from time to time be ablesubject to obtain additional financing on terms favorableobligations relating to us, if at all. Ifpersonal data by contract, or face assertions that we are unablesubject to obtain adequate financingself-regulatory obligations or financing on terms satisfactoryindustry standards. Additionally, the Federal Trade Commission and many state attorneys general are more regularly bringing enforcement actions in connection with federal and state consumer protection laws for false or deceptive acts or practices in relation to us whenthe online collection, use, dissemination, and security of personal data. Internationally, data localization laws may mandate that personal data collected in a foreign country be processed and stored within that country. New legislation affecting the scope of personal data and personal information where we require it,or our customers and partners have operations, especially relating to classification of Internet Protocol (“IP”) addresses, machine identification, AI, location data, and other information, may limit or inhibit our ability to continue to supportoperate or expand our business, growthincluding limiting strategic partnerships that may involve the sharing or uses of data, and may require significant expenditures and efforts in order to respondcomply. Notably, public perception of potential privacy, data protection, or information security concerns—whether or not valid—may harm our reputation and inhibit adoption of our products and subscriptions by current and future end-customers. Each of these laws and regulations, and any changes to business challengesthese laws and regulations, or new laws and regulations, could be significantly impaired, andimpose significant limitations, or require changes to our business model or practices or growth strategy, which may be adversely affected.
We have a corporate structure aligned with the international nature ofincrease our compliance expenses and make our business activities,more costly or less efficient to conduct.
Tax, Accounting, Compliance, and if we do not achieve increased tax benefits as a result of our corporate structure, our financial condition and operating results could be adversely affected.
We have reorganized our corporate structure and intercompany relationships to more closely align with the international nature of our business activities. This corporate structure may allow us to reduce our overall effective tax rate through changes in how we use our intellectual property, international procurement, and sales operations. This corporate structure may also allow us to obtain financial and operational efficiencies. These efforts require us to incur expenses in the near term for which we may not realize related benefits. If the structure is not accepted by the applicable tax authorities, if there are any changes in domestic and international tax laws that negatively impact the structure, including proposed and potential new legislation to reform U.S. taxation of international business activities, and recent guidance regarding base erosion and profit shifting (“BEPS”) provided by the Organisation for Economic Co-operation and Development, or if we do not operate our business consistent with the structure and applicable tax provisions, we may fail to achieve the reduction in our overall effective tax rate and the other financial and operational efficiencies that we anticipate as a result of the structure and our future financial condition and operating results may be negatively impacted.Regulatory Risks
We may have exposure to greater than anticipated tax liabilities.
Our income tax obligations are based in part on our corporate structure and intercompany arrangements, including the manner in which we develop, value, and use our intellectual property and the valuations of our intercompany transactions. The tax laws applicable to our business, including the laws of the United States and various other jurisdictions, are subject to interpretation and certain jurisdictions may aggressively interpret their laws, regulations, and policies, including in an effort to raise additional tax revenue. The tax authorities of the jurisdictions in which we operate may challenge our methodologies for valuing developed or acquired technology or determining the proper charges for intercompany arrangements, which could increase our worldwide effective tax rate and harm our financial position and operating results. Some tax authorities of jurisdictions other than the United States may seek to assert extraterritorial taxing rights on our transactions or operations. It is possible that domestic or international tax authorities may subject us to tax examinations, or audits, and such tax authorities may disagree with certain positions we have taken, and any adverse outcome of such aan examination, review or audit could result in additional tax liabilities and penalties and otherwise have a negative effect on our financial position and operating results. Further, the determination of our worldwide provision for or benefit from income taxes and other tax liabilities requires significant judgment by management, and there are transactions where the ultimate tax determination is uncertain. Although we believe that our estimates are reasonable, the ultimate tax outcome may differ from the amounts recorded inon our consolidated financial statements and may materially affect our financial results in the period or periods for which such determination is made.
In addition, our future income tax obligations could be adversely affected by changes in, or interpretations of, tax laws, regulations, policies, or decisions in the United States or in the other jurisdictions in which we operate.
If our estimates or judgments relating to our critical accounting policies are based on assumptions that change or prove to be incorrect, our operating results could fall below our publicly announced guidance or the expectations of securities analysts and investors, resulting in a decline in the market price of our common stock.
The preparation of consolidated financial statements in conformity with U.S. GAAP requires management to make estimates and assumptions that affect the amounts reported inon our consolidated financial statements and accompanying notes. We base our estimates on historical experience and on various other assumptions that we believe to be reasonable under the circumstances, the results of which form the basis for making judgments about the carrying values of assets, liabilities, equity, revenue, and expenses that are not readily apparent from other sources. For more information, refer to the section entitled “Critical Accounting Estimates” in “Management’s Discussion and Analysis of Financial Condition and Results of Operations” in Part II, Item 7 of this Annual Report on Form 10-K. Additionally, as we work toward adopting and implementing the new revenueIn general, if our estimates, judgments, or assumptions relating to our critical accounting standard, management will make judgments and assumptions based on our interpretation of the new standard. The new revenue standard is principle based and interpretation of those principles may vary from company to company based on their unique circumstances. It is possible that interpretation, industry practice, and guidance may evolve as we work toward implementing the new standard. If our assumptionspolicies change or if actual circumstances differ from our estimates, judgments, or assumptions, our operating results may be adversely affected and could fall below our publicly announced guidance or the expectations of securities analysts and investors, resulting in a decline in the market price of our common stock.
We are obligated to maintain proper and effective internal control over financial reporting. We may not complete our analysis of our internal control over financial reporting in a timely manner, or our internal control may not be determined to be effective, which may adversely affect investor confidence in our company and, as a result, the value of our common stock.
If we are unable to assert that our internal controls are effective, our independent registered public accounting firm may not be able to formally attest to the effectiveness of our internal control over financial reporting. If, in the future, our chief executive officer, chief financial officer, or independent registered public accounting firm determines that our internal control over financial reporting is not effective as defined under Section 404, we could be subject to one or more investigations or enforcement actions by state or federal regulatory agencies, stockholder lawsuits, or other adverse actions requiring us to incur defense costs, pay fines, settlements, or judgments, causing investor perceptions to be adversely affected and potentially resulting in a decline in the market price of our stock.
Our reputation and/or business could be negatively impacted by ESG matters and/or our reporting of such matters.
There is an increasing focus from regulators, certain investors, and other stakeholders concerning ESG matters, both in the United States and internationally. We communicate certain ESG-related initiatives, goals, and/or commitments regarding environmental matters, diversity, responsible sourcing and social investments, and other matters in our annual ESG Report, on our website, in our filings with the SEC, and elsewhere. These initiatives, goals, or commitments could be difficult to achieve and costly to implement. We could fail to achieve, or be perceived to fail to achieve, our ESG-related initiatives, goals, or commitments. In addition, we could be criticized for the timing, scope or nature of these initiatives, goals, or commitments, or for any revisions to them. To the extent that our required and voluntary disclosures about ESG matters increase, we could be criticized for the accuracy, adequacy, or completeness of such disclosures. Our actual or perceived failure to achieve our ESG-related initiatives, goals, or commitments could negatively impact our reputation, result in ESG-focused investors not purchasing and holding our stock, or otherwise materially harm our business.
Failure to comply with governmental laws and regulations could harm our business.
Our business is subject to regulation by various federal, state, local, and foreign governmental agencies, including agencies responsible for monitoring and enforcing employment and labor laws, workplace safety, product safety, environmental laws, consumer protection laws, privacy, data security, and data-protection laws, anti-bribery laws (including the U.S. Foreign Corrupt Practices Act and the U.K. Anti-Bribery Act), import/export controls, federal securities laws, and tax laws and regulations. These laws and regulations may also impact our innovation and business drivers in developing new and emerging technologies (e.g., AI and machine learning). In certain jurisdictions, these regulatory requirements may be more stringent than those in the United States. Noncompliance with applicable regulations or requirements could subject us to investigations, sanctions, mandatory product recalls, enforcement actions, disgorgement of profits, fines, damages, civil and criminal penalties, or injunctions. If any governmental sanctions are imposed, or if we do not prevail in any possible civil or criminal litigation resulting from any alleged noncompliance, our business, operating results, and financial condition could be materially adversely affected. In addition, responding to any action will likely result in a significant diversion of management’s attention and resources and an increase in professional fees. Enforcement actions, litigation, and sanctions could harm our business, operating results, and financial condition.
If we fail to comply with environmental requirements, our business, financial condition, operating results, and reputation could be adversely affected.
We are subject to various environmental laws and regulations including laws governing the hazardous material content of our products and laws relating to the collection of and recycling of electrical and electronic equipment. Examples of these laws and regulations include the E.U. Restriction on the Use of Certain Hazardous Substances in Electrical and Electronic Equipment Directive (“RoHS”) and the E.U. Waste Electrical and Electronic Equipment Directive (“WEEE Directive”), as well as the implementing legislation of the E.U. member states. Similar laws and regulations have been passed or are pending in China, South Korea, Norway, and Japan and may be enacted in other regions, including in the United States, and we are, or may in the future be, subject to these laws and regulations.
The E.U. RoHS and the similar laws of other jurisdictions limit the content of certain hazardous materials such as lead, mercury, and cadmium in the manufacture of electrical equipment, including our products. Our current products comply with the E.U. RoHS requirements. However, if there are changes to this or other laws (or their interpretation) or if new similar laws are passed in other jurisdictions, we may be required to reengineer our products to use components compatible with these regulations. This reengineering and component substitution could result in additional costs to us or disrupt our operations or logistics.
The WEEE Directive requires electronic goods producers to be responsible for the collection, recycling, and treatment of such products. Changes in interpretation of the directive may cause us to incur costs or have additional regulatory requirements to meet in the future in order to comply with this directive, or with any similar laws adopted in other jurisdictions.
We are also subject to environmental laws and regulations governing the management of hazardous materials, which we use in small quantities in our engineering labs. Our failure to comply with past, present, and future similar laws could result in reduced sales of our products, substantial product inventory write-offs, reputational damage, penalties, and other sanctions, any of which could harm our business and financial condition. We also expect that our products will be affected by new environmental laws and regulations on an ongoing basis. To date, our expenditures for environmental compliance have not had a material impact on our operating results or cash flows, and although we cannot predict the future impact of such laws or regulations, they will likely result in additional costs and may increase penalties associated with violations or require us to change the content of our products or how they are manufactured, which could have a material adverse effect on our business, operating results, and financial condition.
Our business is subject to the risks of earthquakes, fire, power outages, floods, and other catastrophic events, and to interruption by man-made problems such as terrorism.
Both our corporate headquarters and the location where our products are manufactured are located in the San Francisco Bay Area, a region known for seismic activity. In addition, other natural disasters, such as fire or floods, a significant power outage, terrorism, or other geo-political unrest could affect our supply chain, manufacturers, logistics providers, channel partners, or end-customers or the economy as a whole and such disruption could impact our shipments and sales. These risks may be further increased if the disaster recovery plans for us and our suppliers prove to be inadequate. To the extent that any of the above should result in delays or cancellations of customer orders, the loss of customers, or the delay in the manufacture, deployment, or shipment of our products, our business, financial condition, and operating results would be adversely affected.
Risks Related to Our Notes and Common Stock
We may not have the ability to raise the funds necessary to settle conversions of theour Notes, or to repurchase theour Notes upon a fundamental change, or repay our Notes in cash at their maturity, and our future debt may contain limitations on our ability to pay cash upon conversion or repurchase of theour Notes.
HoldersIn June 2020, we issued our 2025 Notes (the “2025 Notes”). We will need to make cash payments (a) if holders of theour 2025 Notes will have the right to require us to repurchase all, or a portion of, their 2025 Notes upon the occurrence of a fundamental change (e.g., a change of control of Palo Alto Networks, Inc.) before the maturity date, (b) upon conversion of our 2025 Notes, or (c) to repay our 2025 Notes in cash at a repurchase price equal to 100%their maturity unless earlier converted or repurchased. Effective August 1, 2023 through October 31, 2023, all of the 2025 Notes are convertible. If all of the note holders decided to convert their 2025 Notes, we would be obligated to pay the $2.0 billion principal amount of the 2025 Notes to be repurchased, plus accrued and
unpaid special interest, if any, to, but excluding,in cash. Under the fundamental change repurchase date. In addition, upon conversionterms of the 2025 Notes, we will be requiredalso have the option to make cash payments for each $1,000settle the amount of our conversion obligation in excess of the aggregate principal amount of the 2025 Notes convertedin cash or shares of at least the lesserour common stock. If our cash provided by operating activities, together with our existing cash, cash equivalents, and investments, and existing sources of $1,000 and the sum of the daily conversion values. However,financing, are inadequate to satisfy these obligations, we will need to obtain third-party financing, which may not have enoughbe available cashto us on commercially reasonable terms or be ableat all, to obtain financing at the time we are required to make repurchases of Notes surrendered therefor or pay cash with respect to Notes being converted.meet these payment obligations.
In addition, our ability to repurchase or to pay cash upon conversion of theour 2025 Notes may be limited by law, regulatory authority, or agreements governing our future indebtedness. Our failure to repurchase theour 2025 Notes at a time when the repurchase is required by the applicable indenture governing thesuch 2025 Notes or to pay cash upon conversion of thesuch 2025 Notes as required by the applicable indenture would constitute a default under the indenture. A default under the applicable indenture or the fundamental change itself could also lead to a default under agreements governing our future indebtedness. If the payment of the related indebtedness were to be accelerated after any applicable notice or grace periods, we may not have sufficient funds to repay the indebtedness and repurchase theour 2025 Notes or to pay cash upon conversion of theour 2025 Notes.
We may still incur substantially more debt or take other actions that would diminish our ability to make payments on theour Notes when due.
We and our subsidiaries may be able to incur substantial additional debt in the future, subject to the restrictions contained in our debt instruments, some of which may be secured debt. We are not restricted under the terms of the indenture governing the Notes from incurring additional debt, securing existing or future debt, recapitalizing our debt or taking a number of other actions that are not limited by the terms of the indenture governing the Notes that could have the effect of diminishing our ability to make payments on theour Notes when due. While the terms of any future indebtedness we may incur could restrict our ability to incur additional indebtedness, any such restrictions will indirectly benefit holders of the Notes only to the extent any such indebtedness or credit facility is not repaid or does not mature while the Notes are outstanding.
Risks Related to Ownership of Our Common Stock
Our actual operating results may differ significantly from our guidance.
From time to time, we have released, and may continue to release, guidance in our quarterly earnings releases, quarterly earnings conference calls, or otherwise, regarding our future performance that represents our management’s estimates as of the date of release. This guidance, which includes forward-looking statements, has been and will be based on projections prepared by our management. These projections are not prepared with a view toward compliance with published guidelines of the American Institute of Certified Public Accountants, and neither our registered public accountants nor any other independent expert or outside party compiles or examines the projections. Accordingly, no such person expresses any opinion or any other form of assurance with respect to the projections.
Projections are based upon a number of assumptions and estimates that, while presented with numerical specificity, are inherently subject to significant business, economic and competitive uncertainties and contingencies, many of which are beyond our control and are based upon specific assumptions with respect to future business decisions, some of which will change. The rapidly evolving market in which we operate may make it difficult to evaluate our current business and our future prospects, including our ability to plan for and model future growth. We intend to state possible outcomes as high and low ranges which are intended to provide a sensitivity analysis as variables are changed. However, actual results will vary from our guidance and the variations may be material. The principal reason that we release guidance is to provide a basis for our management to discuss our business outlook as of the date of release with analysts and investors. We do not accept any responsibility for any projections or reports published by any such persons. Investors are urged not to rely upon our guidance in making an investment decision regarding our common stock.
Any failure to successfully implement our operating strategy or the occurrence of any of the events or circumstances set forth in this “Risk Factors” section in this Annual Report on Form 10-K could result in our actual operating results being different from our guidance, and the differences may be adverse and material.
The market price of our common stock historically has been volatile, and the value of youran investment in our common stock could decline.
The market price of our common stock has historically been, and is likely to continue to be, volatile since our initial public offering (“IPO”). Since shares of our common stock were sold in our IPO in July 2012 at a price of $42.00 per share, the reported high and low sales prices of our common stock has ranged from $200.55could be subject to $39.08, through August 24, 2017. The market price of our common stock may fluctuate widelywide fluctuations in response to various factors, some of which are beyond our control.control and unrelated to our business, operating results, or financial condition. These factors include:fluctuations could cause a loss of all or part of an investment in our common stock. Factors that could cause fluctuations in the market price of our common stock include, but are not limited to:
•announcements of new products, subscriptions or technologies, commercial relationships, strategic partnerships, acquisitions, or other events by us or our competitors;
•price and volume fluctuations in the overall stock market from time to time;
•news announcements that affect investor perception of our industry, including reports related to the discovery of significant cyberattacks;
•significant volatility in the market price and trading volume of technology companies in general and of companies in our industry;
•fluctuations in the trading volume of our shares or the size of our public float;
•actual or anticipated changes in our operating results or fluctuations in our operating results;
•whether our operating results meet the expectations of securities analysts or investors;
•actual or anticipated changes in the expectations of securities analysts or investors, whether as a result of our forward- lookingforward-looking statements, our failure to meet such expectationexpectations or otherwise;
•inaccurate or unfavorable research reports about our business and industry published by securities analysts or reduced coverage of our company by securities analysts;
•litigation involving us, our industry, or both;
•actions instituted by activist shareholders or others;
•regulatory developments in the United States, foreign countries, or both;
•major catastrophic events;
•sales or repurchases of large blocks of our common stock or substantial future sales by our directors, executive officers, employees, and significant stockholders;
sales of our common stock by investors who view the Notes as a more attractive means of equity participation in us;
hedging or arbitrage trading activity involving our common stock as a result of the existence of the Notes;
•departures of key personnel; or
•geopolitical or economic uncertainty around the world, in particular, macroeconomic challenges in Europe.world.
The market price of our common stock could decline for reasons unrelated to our business, operating results, or financial condition and as a result of events that do not directly affect us. In the past, following periods of volatility in the market price of a company’s securities, securities class action litigation has often been brought against that company. Securities litigation could result in substantial costs, and divert our management’s attention and resources from our business. This couldbusiness, and have a material adverse effect on our business, operating results, and financial condition.
The convertible note hedge and warrant transactions may affect the value of our common stock.
In connection with the sale of our 2025 Notes, we entered into convertible note hedge transactions (the “2025 Note Hedges”) with certain counterparties. In connection with each such sale of the 2025 Notes, we also entered into warrant transactions with the counterparties pursuant to which we sold warrants (the “2025 Warrants”) for the purchase of our common stock. In addition, we also entered into warrant transactions in connection with our 2023 Notes (together with the 2025 Warrants, the “Warrants”). The Note Hedges for our 2025 Notes are generally expected to reduce the potential dilution to our common stock upon any conversion of our 2025 Notes. The Warrants could separately have a dilutive effect to the extent that the market price per share of our common stock exceeds the applicable strike price of the Warrants unless, subject to certain conditions, we elect to cash settle such Warrants.
The applicable counterparties or their respective affiliates may modify their hedge positions by entering into or unwinding various derivatives with respect to our common stock and/or purchasing or selling our common stock or other securities of ours in secondary market transactions prior to the maturity of the outstanding 2025 Notes (and are likely to do so during any applicable observation period related to a conversion of our 2025 Notes). This activity could also cause or prevent an increase or a decrease in the market price of our common stock or our 2025 Notes, which could affect a note holder’s ability to convert its 2025 Notes and, to the extent the activity occurs during any observation period related to a conversion of our 2025 Notes, it could affect the amount and value of the consideration that the note holder will receive upon conversion of our 2025 Notes.
We do not make any representation or prediction as to the direction or magnitude of any potential effect that the transactions described above may have on the price of our 2025 Notes or our common stock. In addition, we do not make any representation that the counterparties or their respective affiliates will engage in these transactions or that these transactions, once commenced, will not be discontinued without notice.
The issuance of additional stock in connection with financings, acquisitions, investments, our stock incentive plans, the conversion of our Notes or exercise of the related warrants,Warrants, or otherwise will dilute stock held by all other stockholders.
Our amended and restated certificate of incorporation authorizes us to issue up to 1.0 billion shares of common stock and up to 100.0 million shares of preferred stock with such rights and preferences as may be determined by our board of directors. Subject to compliance with applicable rules and regulations, we may issue shares of common stock or securities convertible into shares of our common stock from time to time in connection with a financing, acquisition, investment, our stock incentive plans, the conversion of our Notes, the settlement of our warrants,Warrants related to each such series of the Notes, or otherwise. Any such issuance could result in substantial dilution to our existing stockholders and cause the market price of our common stock to decline.
We cannot guarantee that our recently announced share repurchase program will be fully consummated or that it will enhance shareholder value, and share repurchases could affect the price of our common stock.
On February 24, 2017,As of July 31, 2023, we had $750.0 million available under our board of directors authorized a $500.0 million increase to our existing share repurchase program bringing the total authorization to $1.0 billion, funded from available working capital. This authorization is an increase to the existing $500.0 million repurchase authorization previously approved by our board of directors in August 2016. Additionally, our board of directors extended the term of the repurchase authorization, which will now expire on December 31, 2018.2023. Such share repurchase program may be suspended or discontinued by the Company at any time without prior notice. Although our board of directors has authorized a share repurchase program, the share repurchase program doeswe are not obligate usobligated to repurchase any specific dollar amount or to acquire any specific number of shares.shares under the program. The share repurchase program could affect the price of our common stock, increase volatility, and diminish our cash reserves. In addition, itthe program may be suspended or terminated at any time, which may result in a decrease in the price of our common stock.
We are subject to risks associated with our strategic investments. Other-than-temporary impairments in the value of our investments could negatively impact our financial results.
In June 2017, we announced our plans to form the $20.0 million Palo Alto Networks Venture Fund. The fund is aimed at seed-, early-, and growth-stage security companies with a cloud-based application approach. We may not realize a return on our
capital investments. Many such private companies generate net losses and the market for their products, services or technologies may be slow to develop, and, therefore, are dependent on the availability of later rounds of financing from banks or investors on favorable terms to continue their operations. The financial success of our investment in any company is typically dependent on a liquidity event, such as a public offering, acquisition or other favorable market event reflecting appreciation to the cost of our initial investment. The capital markets for public offerings and acquisitions are dynamic and the likelihood of liquidity events for the companies we have and intend to invest in could significantly change. Further, valuations of privately-held companies are inherently complex due to the lack of readily available market data and as such, the basis for these valuations is subject to the timing and accuracy of the data received from these companies. If we determine that any of our investments in such companies have experienced a decline in value, we may be required to record an other-than-temporary impairment, which could be material and negatively impact our financial results. All of our investments are subject to a risk of a partial or total loss of investment capital.
The convertible note hedge and warrant transactions may affect the value of our common stock.
In connection with the sale of the Notes, we entered into convertible note hedge transactions with certain counterparties. We also entered into warrant transactions with the counterparties pursuant to which we sold warrants for the purchase of our common stock. The convertible note hedge transactions are expected generally to reduce the potential dilution to our common stock upon any conversion of Notes and/or offset any cash payments we are required to make in excess of the principal amount of any converted Notes. The warrants could separately have a dilutive effect to the extent that the market price per share of our common stock exceeds the strike price of the warrants unless, subject to certain conditions, we elect to cash settle the warrants.
The counterparties or their respective affiliates may modify their hedge positions by entering into or unwinding various derivatives with respect to our common stock and/or purchasing or selling our common stock or other securities of ours in secondary market transactions prior to the maturity of the Notes (and are likely to do so during any observation period related to a conversion of Notes). This activity could also cause or avoid an increase or a decrease in the market price of our common stock or the Notes, which could affect a Note holder’s ability to convert the Notes and, to the extent the activity occurs during any observation period related to a conversion of Notes, it could affect the amount and value of the consideration that such Note holder will receive upon conversion of the Notes.
We do not make any representation or prediction as to the direction or magnitude of any potential effect that the transactions described above may have on the price of the Notes or our common stock. In addition, we do not make any representation that the counterparties or their respective affiliates will engage in these transactions or that these transactions, once commenced, will not be discontinued without notice.
We do not intend to pay dividends for the foreseeable future.
We have never declared or paid any dividends on our common stock. We intend to retain any earnings to finance the operation and expansion of our business, and we do not anticipate paying any cash dividends in the future. As a result, youstockholders may only receive a return on your investmenttheir investments in our common stock if the market price of our common stock increases.
The requirements of being a public company may strain our resources, divert management’s attention, and affect our ability to attract and retain qualified board members.
As a public company, we are subject to the reporting requirements of the Exchange Act, the Sarbanes-Oxley Act, the Dodd-Frank Act, the listing requirements of the New York Stock Exchange (“NYSE”), and other applicable securities rules and regulations. Compliance with these rules and regulations have increased our legal and financial compliance costs, made some activities more difficult, time-consuming or costly, and increased demand on our systems and resources. Among other things, the Exchange Act requires that we file annual, quarterly, and current reports with respect to our business and operating results. In addition, the Sarbanes-Oxley Act requires, among other things, that we maintain effective disclosure controls and procedures and internal control over financial reporting. In order to meet the requirements of this standard, significant resources and management oversight may be required. As a result, management’s attention may be diverted from other business concerns, which could harm our business and operating results. Although we have already hired additional employees to comply with these requirements, we may need to hire even more employees in the future, which will increase our costs and expenses.
In addition, changing laws, regulations, and standards related to corporate governance and public disclosure are creating uncertainty for public companies, increasing legal and financial compliance costs, and making some activities more time-consuming. These laws, regulations, and standards are subject to varying interpretations, in many cases due to their lack of specificity, and, as a result, their application in practice may evolve over time as new guidance is provided by regulatory and governing bodies. This could result in continuing uncertainty regarding compliance matters and higher costs necessitated by ongoing revisions to disclosure and governance practices. We intend to invest resources to comply with evolving laws, regulations, and standards, and this investment may result in increased general and administrative expense and a diversion of management’s time and attention from revenue-generating activities to compliance activities. If our efforts to comply with new laws, regulations,
and standards differ from the activities intended by regulatory or governing bodies, regulatory authorities may initiate legal proceedings against us and our business may be harmed.
We also expect that being a public company and these new rules and regulations will make it more expensive for us to obtain and maintain director and officer liability insurance, and in the future, we may be required to accept reduced coverage or incur substantially higher costs to obtain coverage. These factors could also make it more difficult for us to attract and retain qualified members of our board of directors, particularly to serve on our Audit Committee and Compensation Committee, and qualified executive officers.
We are obligated to maintain proper and effective internal control over financial reporting. We may not complete our analysis of our internal control over financial reporting in a timely manner, or this internal control may not be determined to be effective, which may adversely affect investor confidence in our company and, as a result, the value of our common stock.
While we were able to determine in our management’s report for fiscal 2017 that our internal control over financial reporting is effective, as well as provide an unqualified attestation report from our independent registered public accounting firm to that effect, we may not be able to complete our evaluation, testing, and any required remediation in a timely fashion, may be unable to assert that our internal controls are effective, or our independent registered public accounting firm may not be able to formally attest to the effectiveness of our internal control over financial reporting in the future. In the event that our chief executive officer, chief financial officer, or independent registered public accounting firm determines in the future that our internal control over financial reporting is not effective as defined under Section 404, we could be subject to one or more investigations or enforcement actions by state or federal regulatory agencies, stockholder lawsuits or other adverse actions requiring us to incur defense costs, pay fines, settlements or judgments and causing investor perceptions to be adversely affected and potentially resulting in a decline in the market price of our stock.
Our charter documents and Delaware law, as well as certain provisions ofcontained in the indentures governing our Notes, could discourage takeover attempts and lead to management entrenchment, which could also reduce the market price of our common stock.
Provisions in our amended and restated certificate of incorporation and amended and restated bylaws may have the effect of delaying or preventing a change in control of our company or changes in our management. Our amended and restated certificate of incorporation and amended and restated bylaws include provisions that:
•establish that our board of directors is divided into three classes, Class I, Class II, and Class III, with three-year staggered terms;
•authorize our board of directors to issue shares of preferred stock and to determine the price and other terms of those shares, including preferences and voting rights, without stockholder approval;
•provide our board of directors with the exclusive right to elect a director to fill a vacancy created by the expansion of our board of directors or the resignation, death, or removal of a director;
•prohibit our stockholders from taking action by written consent;
•specify that special meetings of our stockholders may be called only by the chairman of our board of directors, our president, our secretary, or a majority vote of our board of directors;
•require the affirmative vote of holders of at least 66 2/3% of the voting power of all of the then outstanding shares of the voting stock, voting together as a single class, to amend the provisions of our amended and restated certificate of incorporation relating to the issuance of preferred stock and management of our business or our amended and restated bylaws;
•authorize our board of directors to amend our bylaws by majority vote; and
•establish advance notice procedures with which our stockholders must comply to nominate candidates to our board of directors or to propose matters to be acted upon at a stockholders’ meeting.
These provisions may frustrate or prevent any attempts by our stockholders to replace or remove our current management by making it more difficult for our stockholders to replace members of our board of directors, which is responsible for appointing the members of management. In addition, as a Delaware corporation, we are subject to Section 203 of the Delaware General Corporation Law. These provisions may prohibit large stockholders, in particular those owning 15% or more of our outstanding voting stock, from merging or combining with us for a certain period of time. Additionally, certain provisions ofcontained in the indenture governing our Notes could make it more difficult or more expensive for a third party to acquire us. The application of Section 203 or certain provisions ofcontained in the indenture governing our Notes also could have the effect of delaying or preventing a change in control of us. Any of these provisions could, under certain circumstances, depress the market price of our common stock.
General Risk Factors
Our business is subject to the risks of earthquakes, fire, power outages, floods, health risks, and other catastrophic events, and to interruption by man-made problems, such as terrorism.
Both our corporate headquarters and the location where our products are manufactured are located in the San Francisco Bay Area, a region known for seismic activity. In addition, other natural disasters, such as fire or floods, a significant power outage, telecommunications failure, terrorism, an armed conflict, cyberattacks, epidemics and pandemics such as COVID-19, or other geo-political unrest could affect our supply chain, manufacturers, logistics providers, channel partners, end-customers, or the economy as a whole, and such disruption could impact our shipments and sales. These risks may be further increased if the disaster recovery plans for us and our suppliers prove to be inadequate. To the extent that any of the above should result in delays or cancellations of customer orders, the loss of customers, or the delay in the manufacture, deployment, or shipment of our products, our business, financial condition, and operating results would be adversely affected.
Our failure to raise additional capital or generate the significant capital necessary to expand our operations and invest in new products and subscriptions could reduce our ability to compete and could harm our business.
We intend to continue to make investments to support our business growth and may require additional funds to respond to business challenges, including the need to develop new features to enhance our portfolio, improve our operating infrastructure, or acquire complementary businesses and technologies. Accordingly, we may need to engage in equity or debt financings to secure additional funds. If we engage in future debt financings, the holders of such additional debt would have priority over the holders of our common stock. Current and future indebtedness may also contain terms that, among other things, restrict our ability to incur additional indebtedness. In addition, we may be required to take other actions that would otherwise be in the interests of the debt holders and would require us to maintain specified liquidity or other ratios, any of which could harm our business, operating results, and financial condition. If we are unable to obtain adequate financing or financing on terms satisfactory to us when we require it, our ability to continue to support our business growth and to respond to business challenges could be significantly impaired, and our business may be adversely affected.
| |
ITEM 1B. | UNRESOLVED STAFF COMMENTS |
None.Item 1B. Unresolved Staff Comments
Item 2. Properties
Our corporate headquarters is located in Santa Clara, California, where we lease approximately 941,000 square feet of space under three lease agreements that expire in July 2028, with options to extend the lease terms through July 2046. We also lease a total of approximately 422,000 square feet of space at two other locations in Santa Clara, which collectively served as our previous corporate headquarters through August 2017, when we relocated to our current campus. The leases for our previous corporate headquarters expire in April 2021 and July 2023. We also lease space for personnel in locations throughoutaround the United States and various international locations,world, including Israel the Netherlands, Singapore, Australia, and Japan.India. In addition, we provide our cloud-based subscription offerings through data centers operated under co-location arrangements in the United States, Europe, and Asia. Refer to Note 9. Commitments and Contingencies of Notes to Consolidated Financial Statements included11. Leases in Part II, Item 8 of this Annual Report on Form 10-K for more information on our operating leases. Additionally, we own 10.4 acres of land adjacent to our headquarters in Santa Clara, California, which we intend to develop to accommodate future expansion, the speed of which development has been slowed due to the current environment.
We believe that our current facilities are adequate to meet our current needs. We intend to expand our facilities or add new facilities as we add employees and enter new geographic markets, and we believe that suitable additional or alternative space will be available as needed to accommodate ongoing operations and any such growth. However, we expect to incur additional expenses in connection with such new or expanded facilities.
Item 3. Legal Proceedings
The information set forth under the “Litigation” subheading in Note 9.12. Commitments and Contingencies of Notes to Consolidated Financial Statements in Part II, Item 8 of this Annual Report on Form 10-K is incorporated herein by reference.
Item 4. Mine Safety Disclosures
Not applicable.
| | | | | |
ITEM 4. | MINE SAFETY DISCLOSURES |
Not applicable.
PARTPart II
| |
ITEM 5. | MARKET FOR REGISTRANT’S COMMON EQUITY, RELATED STOCKHOLDER MATTERS AND ISSUER PURCHASES OF EQUITY SECURITIES |
Item 5. Market for Registrant’s Common Equity, Related Stockholder Matters and Issuer Purchases of Equity Securities
Market Information
Our common stock, $0.0001 par value per share, began tradingis traded on the NYSENasdaq Global Select Market under the symbol “PANW.” Prior to October 22, 2021, our common stock traded on July 20, 2012, where its prices are quotedthe New York Stock Exchange (“NYSE”) under the symbol “PANW.”
Holders of Record
As of August 24, 2017,18, 2023, there were 88414 holders of record of our common stock. Because many of our shares of common stock are held by brokers and other institutions on behalf of stockholders, we are unable to estimate the total number of stockholders represented by these record holders.
Price Range of Our Common Stock
The following table sets forth the reported high and low sales prices of our common stock for the periods indicated, as regularly quoted on the NYSE:
|
| | | | | | | |
| | High | | Low |
| Year Ended July 31, 2016 | | | |
| First Quarter | $ | 191.00 |
| | $ | 140.39 |
|
| Second Quarter | $ | 194.73 |
| | $ | 135.89 |
|
| Third Quarter | $ | 165.29 |
| | $ | 111.09 |
|
| Fourth Quarter | $ | 151.99 |
| | $ | 114.64 |
|
| Year Ended July 31, 2017 | | | |
| First Quarter | $ | 163.01 |
| | $ | 124.74 |
|
| Second Quarter | $ | 165.69 |
| | $ | 123.57 |
|
| Third Quarter | $ | 157.65 |
| | $ | 107.31 |
|
| Fourth Quarter | $ | 143.90 |
| | $ | 108.15 |
|
Dividend Policy
We have never declared or paid, and do not anticipate declaring or paying in the foreseeable future, any cash dividends on our capital stock. Any future determination as to the declaration and payment of dividends, if any, will be at the discretion of our board of directors, subject to applicable laws, and will depend on then existing conditions, including our financial condition, operating results, contractual restrictions, capital requirements, business prospects, and other factors our board of directors may deem relevant.
Securities Authorized for Issuance under Equity Compensation Plans
See Part III, Item 12 “Security Ownership of Certain Beneficial Owners and Management and Related Stockholder Matters” of this Annual Report on Form 10-K for more information regarding securities authorized for issuance.
Recent SaleSales of Unregistered Equity Securities
ThereDuring the three months ended July 31, 2023, we issued a total of 3,569 shares of our unregistered common stock in connection with certain of our acquisitions (the “Transactions”).
The Transactions did not involve any underwriters, any underwriting discounts or commissions, or any public offering. The issuances of the securities pursuant to the Transactions were no salesexempt from registration under the Securities Act of unregistered securities during fiscal 2017.
1933, as amended (the “Act”) by virtue of Section 4(a)(2) of the Act and Rule 506 of Regulation D promulgated thereunder.
Purchases of Equity Securities by the Issuer and Affiliated Purchasers
In February 2019, we announced that our board of directors authorized a $1.0 billion share repurchase program, which is funded from available working capital. In December 2020, August 2021, and August 2022, we announced additional $700.0 million, $676.1 million, and $915.0 million increases to this share repurchase program, respectively, bringing the total authorization to $3.3 billion, with $750.0 million remaining as of July 31, 2023. The following table summarizes stock repurchases duringexpiration date of this repurchase authorization was extended to December 31, 2023, and our repurchase program may be suspended or discontinued at any time. Repurchases under our program are to be made at management’s discretion on the open market, through privately negotiated transactions, transactions structured through investment banking institutions, block purchase techniques, 10b5-1 trading plans, or a combination of the foregoing. During the three months ended July 31, 2017 (in millions, except2023, we did not repurchase any shares pursuant to our share repurchase program.
Between June 1, 2023 and June 30, 2023 and July 1, 2023 and July 31, 2023, shares of restricted stock were delivered by certain employees upon vesting of equity awards to satisfy tax withholding requirements. The average value of shares delivered to satisfy tax withholding requirements during these periods were $246.53 per share amounts):and $243.33 per share, respectively. The number of shares delivered to satisfy tax withholding requirements during these periods was not significant.
|
| | | | | | | | | | | | | | |
| Period | | Total Number of Shares Purchased | | Average Price Paid per Share | | Total Number of Shares Purchased as Part of Publicly Announced Plans or Programs(1) | | Approximate Dollar Value of Shares that May Yet Be Purchased Under the Plans or Programs(1) |
May 1, 2017 to May 31, 2017(2) | | — |
| | $ | 116.50 |
| | — |
| | $ | 704.9 |
|
June 1, 2017 to June 30, 2017(3) | | 0.5 |
| | $ | 133.82 |
| | 0.5 |
| | $ | 636.1 |
|
July 1, 2017 to July 31, 2017(3) | | 0.4 |
| | $ | 135.57 |
| | 0.4 |
| | $ | 580.0 |
|
| Total | | 0.9 |
| | $ | 133.91 |
| | 0.9 |
| | |
______________
| |
(1) | On August 26, 2016, our board of directors authorized a $500.0 million share repurchase which is funded from available working capital. On February 24, 2017, our board of directors authorized a $500.0 million increase to our repurchase program, bringing the total authorization to $1.0 billion. Repurchases may be made at management’s discretion from time to time on the open market, through privately negotiated transactions, transactions structured through investment banking institutions, block purchase techniques, 10b5-1 trading plans, or a combination of the foregoing. The repurchase authorization will expire on December 31, 2018, and may be suspended or discontinued at any time. |
| |
(2) | Repurchases during the month ended May 31, 2017 include shares of restricted common stock delivered by certain employees upon vesting of equity awards to satisfy tax withholding requirements. The number of shares delivered by these employees to satisfy tax withholding requirements during the period was not significant. |
| |
(3) | Repurchases during the months ended June 30, 2017 and July 31, 2017 consisted of repurchases under our share repurchase program, for which the average price paid per share excludes costs associated with the repurchases. |
Stock Price Performance Graph
This performance graph shall not be deemed “filed” for purposes of Section 18 of the Securities Exchange Act of 1934, as amended (the “Exchange Act”), or incorporated by reference into any filing of Palo Alto Networks, Inc. under the Securities Act of 1933, as amended, or the Exchange Act, except as shall be expressly set forth by specific reference in such filing.
This performance graph compares the cumulative total return on our common stock with that of the NYSE CompositeNasdaq 100 Index, the Standard & Poor’s 500 Index, and the NYSE Arca Tech 100Standard & Poor’s 500 Information Technology Index for the five years ended July 31, 2017.2023. This performance graph assumes $100 was invested on July 31, 2012,2018, in each of the common stock of Palo Alto Networks, Inc., the NYSE CompositeNasdaq 100 Index, the Standard & Poor’s 500 Index, and the NYSE Arca Tech 100Standard & Poor’s 500 Information Technology Index, and assumes the reinvestment of any dividends. The stock price performance on this performance graph is not necessarily indicative of future stock price performance.
Palo Alto Networks, Inc. Comparison of Total Return Performance
| | | | | | | | | | | | | | | | | | | | | | | | | | | | | | | | | | | | | | |
| Company/Index | | 7/31/2018 | | 7/31/2019 | | 7/31/2020 | | 7/31/2021 | | 7/31/2022 | | 7/31/2023 |
| Palo Alto Networks, Inc. | | $ | 100.00 | | | $ | 114.26 | | | $ | 129.08 | | | $ | 201.28 | | | $ | 251.74 | | | $ | 378.23 | |
| Nasdaq 100 Index | | $ | 100.00 | | | $ | 109.74 | | | $ | 154.04 | | | $ | 212.86 | | | $ | 185.61 | | | $ | 227.88 | |
| S&P 500 Index | | $ | 100.00 | | | $ | 107.99 | | | $ | 120.90 | | | $ | 164.96 | | | $ | 157.31 | | | $ | 177.78 | |
| S&P 500 Information Technology Index | | $ | 100.00 | | | $ | 115.72 | | | $ | 160.75 | | | $ | 225.10 | | | $ | 212.69 | | | $ | 269.79 | |
Item 6. [Reserved]
|
| | | | | | | | | | | | | | | | | | | | | | | |
| Company/Index | 7/31/2012 | | 7/31/2013 | | 7/31/2014 | | 7/31/2015 | | 7/31/2016 | | 7/31/2017 |
| Palo Alto Networks, Inc. | $ | 100.00 |
| | $ | 85.65 |
| | $ | 141.51 |
| | $ | 325.22 |
| | $ | 229.07 |
| | $ | 230.63 |
|
| NYSE Composite Index | $ | 100.00 |
| | $ | 121.55 |
| | $ | 136.40 |
| | $ | 138.38 |
| | $ | 137.15 |
| | $ | 152.18 |
|
| NYSE Arca Tech 100 Index | $ | 100.00 |
| | $ | 125.69 |
| | $ | 152.74 |
| | $ | 169.47 |
| | $ | 171.17 |
| | $ | 211.12 |
|
| |
ITEM 6. | SELECTED FINANCIAL DATA |
The selected consolidated statementTable of operations data for fiscal 2017, 2016, and 2015 and the consolidated balance sheet data as of July 31, 2017 and 2016 are derived from our audited consolidated financial statements included elsewhere in this Annual Report on Form 10-K. The selected consolidated statement of operations data for fiscal 2014 and 2013 and the consolidated balance sheet data as of July 31, 2015, 2014, and 2013 are derived from audited financial statements not included in this Annual Report on Form 10-K. Our historical results are not necessarily indicative of the results that may be expected in the future. The selected consolidated financial data below should be read in conjunction with the section entitled “Management’s Discussion and Analysis of Financial Condition and Results of Operations” included in Part II, Item 7 of this Annual Report on Form 10-K and our consolidated financial statements and related notes included in Part II, Item 8 of this Annual Report on Form 10-K. |
| | | | | | | | | | | | | | | | | | | |
| | Year Ended July 31, |
| | 2017 | | 2016 | | 2015 | | 2014 | | 2013 |
| | (in millions) |
| Selected Consolidated Statements of Operations Data: | | | | | | | | | |
| Total revenue | $ | 1,761.6 |
| | $ | 1,378.5 |
| | $ | 928.1 |
| | $ | 598.2 |
| | $ | 396.1 |
|
| Total gross profit | 1,285.0 |
| | 1,008.5 |
| | 676.6 |
| | 438.6 |
| | 286.4 |
|
Operating loss(1) | (179.8 | ) | | (157.3 | ) | | (99.8 | ) | | (196.2 | ) | | (9.9 | ) |
Net loss(1) | $ | (216.6 | ) | | $ | (192.7 | ) | | $ | (131.3 | ) | | $ | (207.4 | ) | | $ | (20.5 | ) |
Net loss per share, basic and diluted(1) | $ | (2.39 | ) | | $ | (2.21 | ) | | $ | (1.61 | ) | | $ | (2.79 | ) | | $ | (0.30 | ) |
| Weighted-average shares used to compute net loss per share, basic and diluted | 90.6 |
| | 87.1 |
| | 81.6 |
| | 74.3 |
| | 68.7 |
|
|
| | | | | | | | | | | | | | | | | | | |
| | July 31, |
| | 2017 | | 2016 | | 2015 | | 2014 | | 2013 |
| | (in millions) |
| Selected Consolidated Balance Sheet Data: | | | | | | | | | |
| Cash and cash equivalents | $ | 744.3 |
| | $ | 734.4 |
| | $ | 375.8 |
| | $ | 653.8 |
| | $ | 310.6 |
|
| Investments | 1,420.0 |
| | 1,204.0 |
| | 952.0 |
| | 320.6 |
| | 126.3 |
|
Working capital(1)(2)(3) | 775.0 |
| | 927.2 |
| | 79.3 |
| | 630.9 |
| | 334.5 |
|
Total assets(1) | 3,438.3 |
| | 2,858.2 |
| | 2,026.1 |
| | 1,502.6 |
| | 603.9 |
|
| Total deferred revenue | 1,773.5 |
| | 1,240.8 |
| | 713.7 |
| | 422.6 |
| | 249.2 |
|
Convertible senior notes, net(2)(3) | 524.7 |
| | 500.2 |
| | 476.8 |
| | 454.6 |
| | — |
|
| Common stock and additional paid-in capital | 1,599.7 |
| | 1,515.5 |
| | 988.7 |
| | 804.4 |
| | 381.6 |
|
Total stockholders’ equity(1) | $ | 759.6 |
| | $ | 894.9 |
| | $ | 559.7 |
| | $ | 506.7 |
| | $ | 291.4 |
|
______________
| |
(1) | Prior period amounts have been adjusted due to our voluntary change in accounting policy for sales commissions. Refer to Note 1. Description of Business and Summary of Significant Accounting Policies in Part II, Item 8 of this Annual Report on Form 10-K for more information. |
| |
(2) | Prior period amounts have been adjusted due to our adoption of new accounting guidance related to the presentation of debt issuance costs. Refer to Note 1. Description of Business and Summary of Significant Accounting Policies in Part II, Item 8 of this Annual Report on Form 10-K for more information. |
| |
(3) | The convertible senior notes, net balance was classified as a current liability in our consolidated balance sheets as of July 31, 2015, and classified as a long-term liability for all other periods presented. |
| |
ITEM 7. | MANAGEMENT’S DISCUSSION AND ANALYSIS OF FINANCIAL CONDITION AND RESULTS OF OPERATIONS |
Item 7. Management’s Discussion and Analysis of Financial Condition and Results of Operations
The following discussion and analysis of our financial condition and results of operations should be read in conjunction with our consolidated financial statements and related notes appearing elsewhere in this Annual Report on Form 10-K. The following discussion and analysis contains forward-looking statements based on current expectations and assumptions that are subject to risks and uncertainties, which could cause our actual results to differ materially from those anticipated or implied by any forward-looking statements. Factors that could cause or contribute to such differences include, but are not limited to, those discussed in this Annual Report on Form 10-K, and in particular, the risks discussed under the caption “Risk Factors” in Part I, Item 1A of this report.
Our Management’s Discussion and Analysis of Financial Condition and Results of Operations (“MD&A”) is organized as follows:
•Overview.A discussion of our business and overall analysis of financial and other highlights in order to provide context for the remainder of MD&A.
•Key Financial Metrics.A summary of our U.S. GAAP and non-GAAP key financial metrics, which management monitors to evaluate our performance.
•Results of Operations.A discussion of the nature and trends in our financial results and an analysis of our financial results comparing fiscal 20172023 to 2016fiscal 2022. For discussion and analysis related to our financial results comparing fiscal 20162022 to 2015.
2021, refer to Part II, Item 7. Management’s Discussion and Analysis of Financial Condition and Results of Operations in our Annual Report on Form 10-K for fiscal 2022, which was filed with the Securities and Exchange Commission on September 6, 2022.•Liquidity and Capital Resources. An analysis of changes inon our balance sheets and cash flows, and a discussion of our financial condition and our ability to meet cash needs.
Contractual Obligations and Commitments. An overview of our contractual obligations, contingent liabilities, commitments, and off-balance sheet arrangements outstanding as of July 31, 2017, including expected payment schedules.
•Critical Accounting Estimates.A discussion of our accounting policies that require critical estimates, assumptions, and judgments.
Recent Accounting Pronouncements. A discussion of expected impacts of impending accounting changes on financial information to be reported in the future.
Overview
We have pioneered the next generation of security through our innovative platform that allowsempower enterprises, organizations, service providers, and government entities to protect themselves against today’s most sophisticated cyber threats. Our cybersecurity platforms and services help secure their organizationsenterprise users, networks, clouds, and endpoints by safely enablingdelivering comprehensive cybersecurity backed by industry-leading artificial intelligence and automation. We are a leading provider of zero trust solutions, starting with next-generation zero trust network access to secure today’s remote hybrid workforces and extending to securing all users, applications, running on their networks and by preventing successful breaches that stem from targeted cyberattacks.infrastructure with zero trust principles. Our platform uses an innovative traffic classification engine that identifies network traffic by application, user, and content and provides consistent security across the network, endpoint, and cloud. Accordingly, our platform enables our end-customerssolutions are designed to maintain the visibility and control needed to protect their valued data and critical control systems while pursuing technology initiatives, like cloud and mobility, that grow their business. We believe our platform offers superior performance compared to legacy approaches and reduces thereduce customers’ total cost of ownership for organizations by simplifying their security operations and infrastructureimproving operational efficiency and eliminating the need for multiple, stand-alonesiloed point products. Our company focuses on delivering value in four fundamental areas:
Network Security:
•Our network security appliancesplatform, designed to deliver complete zero trust solutions to our customers, includes our hardware and software products.
OurML-Powered Next-Generation Security Platform consists of three major elements: our Next-Generation Firewall, our Advanced Endpoint Protection, and our Threat Intelligence Cloud. Our Next-Generation Firewall comes in several physical and cloud-based software form-factors and delivers application, user, and content visibility and controlFirewalls, as well as protection against network-based cyberthreats integrated withina cloud-delivered Secure Access Service Edge (“SASE”). Prisma® Access, our Security Services Edge (“SSE”) solution, when combined with Prisma SD-WAN, provides a comprehensive single-vendor SASE offering that is used to secure remote workforces and enable the firewallcloud-delivered branch. We have been recognized as a leader in network firewalls, SSE, and SD-WAN. Our network security platform also includes our cloud-delivered security services, such as Advanced Threat Prevention, Advanced WildFire®, Advanced URL Filtering, DNS Security, IoT/OT Security, GlobalProtect®, Enterprise Data Loss Prevention (“Enterprise DLP”), Artificial Intelligence for Operations (“AIOps”), SaaS Security API, and SaaS Security Inline. Through these add-on security services, our customers are able to secure their content, applications, users, and devices across their entire organization. Panorama®, our network security management solution, can centrally manage our network security platform irrespective of form factor, location, or scale.
Cloud Security:
•We enable cloud-native security through our proprietary hardwarePrisma Cloud platform. As a comprehensive Cloud Native Application Protection Platform (“CNAPP”), Prisma Cloud secures multi- and hybrid-cloud environments for applications, data, and the entire cloud native technology stack across the full development lifecycle; from code to runtime. For inline network security on multi- and hybrid-cloud environments, we also offer our VM-Series and CN-Series Firewall offerings.
Security Operations:
•We deliver the next generation of security automation, security analytics, endpoint security, and attack surface management solutions through our Cortex portfolio. These include Cortex XSIAM, our AI security automation platform, Cortex XDR® for the prevention, detection, and response to complex cybersecurity attacks on the endpoint, Cortex XSOAR® for security orchestration, automation, and response (“SOAR”), and Cortex XpanseTM for attack surface management (“ASM”). These products are delivered as SaaS or software architecture. Our Advanced Endpoint Protection software prevents cyberattacks that aim to run malicious code or exploit software vulnerabilities on a broad variety of fixed, mobile, and virtual endpoints and servers. Our subscriptions.
Threat Intelligence Cloud provides central intelligence capabilities,and Security Consulting (Unit 42):
•Unit 42 brings together world-renowned threat researchers with an elite team of incident responders and security for SaaS applications,consultants to create an intelligence-driven, response-ready organization to help customers proactively manage cyber risk. Our consultants serve as trusted advisors to our customers by assessing and automated deliverytesting their security controls against the right threats, transforming their security strategy with a threat-informed approach, and responding to security incidents on behalf of preventative measures against cyberattacks.our clients.
For fiscal 2017, 2016,2023 and 2015,2022, total revenue was $1.8 billion, $1.4$6.9 billion and $928.1 million,$5.5 billion, respectively, representing year-over-year growth of 27.8% for fiscal 2017 and 48.5% for fiscal 2016.25.3%. Our growth reflects the increased adoption of our hybrid SaaS revenue model,portfolio, which consists of product, subscriptions, and support. We believe this modelour portfolio will enable us to benefit from recurring revenues and new revenues as we continue to grow our installed end-customer base. As of July 31, 2017,2023, we had more than 42,500 end-customers in over 150180 countries. Our end-customers represent a broad range of industries, including education, energy, financial services, government entities, healthcare, Internet and media, manufacturing, public sector, and telecommunications, and include somealmost all of the largest Fortune 100 companies and a majority of the Global 2000 companies in the world.companies. We maintain a field sales force that works
closely with our channel partners in developing sales opportunities. We primarily use a two-tiered, indirect fulfillment model whereby we sell our products, subscriptions, and servicessupport to our distributors, which, in turn, sell to our resellers, which then sell to our end-customers.
Our product revenue grew to $709.1 million$1.6 billion or 40.3%22.9% of total revenue for fiscal 2017,2023, representing year-over-year growth of 5.7%15.8%. Product revenue is generatedderived from sales of our appliances, primarily our ML-Powered Next-Generation Firewall, which is available in physicalFirewall. Product revenue also includes revenue derived from software licenses of Panorama, SD-WAN, and virtualized form.the VM-Series. Our ML-Powered Next-Generation Firewall incorporates our proprietary PAN-OS operating system, which provides a consistent set of capabilities across our entire network security product line. Our appliances and software licenses include a broad set of built-in networking and security features and functionalities. Our products are designed for different performance requirements throughout an organization, ranging from our PA-200,PA-410, which is designed for enterprisesmall organizations and remote or branch offices, to our top-of-the-line PA-7080, which is especially suiteddesigned for very large enterprise deploymentslarge-scale data centers and service provider customers.use. The same firewall functionality that is delivered in our physical appliances is also available in our VM-Series virtual firewalls, which secure virtualized and cloud-based computing environments.environments, and in our CN-Series container firewalls, which secure container environments and traffic.
Our subscription and support revenue grew to $1.1$5.3 billion or 59.7%77.1% of total revenue for fiscal 2017,2023, representing year-over-year growth of 48.7%28.4%. Our subscriptions provide our end-customers with near real-time access to the latest antivirus, intrusion prevention, web filtering, and modern malware prevention, data loss prevention, and cloud access security broker capabilities across fixedthe network, endpoints, and mobile devices.the cloud. When end-customers purchase an appliance,our physical, virtual, or container firewall appliances, or certain cloud offerings, they typically purchase one or more of our subscriptions for additional functionality, as well as support in order to receive ongoing security updates, upgrades, bug fixes, and repairs. In addition to the subscriptions purchased with these appliances, end-customers may also purchase other subscriptions on a per-user, per-endpoint, or capacity-based basis. We also offer professional services, including incident response, risk management, and digital forensic services.
We continue to invest in innovation as we evolve and further extend the capabilities of our platform,portfolio, as we believe that innovation and timely development of new features and products isare essential to meeting the needs of our end-customers and improving our competitive position. In February 2017,During fiscal 2023, we expanded our family of firewalls with the launch ofintroduced several new appliances: our PA-220, which is designed for small branch offices and remote locations; our PA-800 series, which are ideal for medium-sized networks and branch and remote office environments; our PA-5200 series, which deliver security for high throughput environments in a compact form factor; andofferings, including: Cortex XSIAM 1.0, major updates to Prisma Cloud (including three new VM-Series virtual firewall models, which support cloudsecurity modules), Prisma Access 4.0, PAN-OS 11.0, Cloud NGFW for AWS, and virtualization initiatives ranging from virtualized branch offices to data center and service provider deployments. We also delivered PAN-OS 8.0, an important software release that expands securityCloud NGFW for public and private clouds, provides new SaaS application security functionality, and also provides the capabilities to prevent the theft and abuse of stolen credentials.Azure. Additionally, in February 2017, we acquired LightCyber Ltd. (“LightCyber”), a privately-held cybersecurity company. LightCyber’s technology expands the functionality ofproductive investments that fit well within our platform through the addition of behavioral analytics, and will be the foundation for a new future subscription offering. We also expect to release two new cloud-based subscription offerings in September 2017: our GlobalProtect cloud service subscription, which provides our Next Generation Security Platform as a cloud-based service for remote offices and mobile users; and our Logging Service subscription, which functions as the central cloud-based repository for all application data and logs, and allows end-customers to collect data without needing to plan for local processing power and storage.
We plan to continue our investment in innovation as we evolve and further extend the capabilities of our platform.long-term strategy. For example, in June 2017,December 2022, we announcedacquired Cider, which we expect will support our Prisma Cloud’s platform approach to securing the next phase in the evolution of our Next-Generation Security Platform: our Palo Alto Networks Application Framework. Our cloud-based Application Framework will introduce a new SaaS consumption model under which our end-customers will be ableentire application security lifecycle from code to rapidly implement cloud-based security applications developed by us, third-party developers, or other security vendors, without having to deploy or manage additional products. We expect our Application Framework to become generally available in the early 2018 calendar year, with continuous and ongoing introduction of new security applications.cloud.
We believe that the growth of our business and our short-term and long-term success are dependent upon many factors, including our ability to extend our technology leadership, grow our base of end-customers, expand deployment of our platformportfolio and support offerings within existing end-customers, and focus on end-customer satisfaction. To manage any future growth effectively, we must continue to improve and expand our information technology and financial infrastructure, our operating and administrative systems and controls, and our ability to manage headcount, capital, and processes in an efficient manner. While these areas present significant opportunities for us, they also pose challenges and risks that we must successfully address in order to sustain the growth of our business and improve our operating results. For additional information regarding the challenges and risks we face, see the “Risk Factors” section in Part I, Item 1A of this Annual Report on Form 10-K.
Impact of Macroeconomic Developments and Other Factors on Our Business
Our overall performance depends in part on worldwide economic and geopolitical conditions and their impact on customer behavior. Worsening economic conditions, including inflation, higher interest rates, slower growth, fluctuations in foreign exchange rates, and other conditions, may adversely affect our results of operations and financial performance.
We continue to experience supply chain disruption and incur increased costs resulting from inflationary pressures. We are monitoring the tensions between China and Taiwan, and between the U.S. and China, which could have an adverse impact on our business or results of operations in future periods.
Key Financial Metrics
We monitor the key financial metrics set forth in the tables below to help us evaluate growth trends, establish budgets, measure the effectiveness of our sales and marketing efforts, and assess operational efficiencies. We discuss revenue, gross margin, and the components of operating lossincome (loss) and margin below under “—Results“Results of Operations.”
| | | | | | | | | | | |
| July 31, |
| 2023 | | 2022 |
| | | |
| (in millions) |
| Total deferred revenue | $ | 9,296.4 | | | $ | 6,994.0 | |
| Cash, cash equivalents, and investments | $ | 5,437.9 | | | $ | 4,686.4 | |
| | | | | | | | | | | | | | | | | |
| Year Ended July 31, |
| 2023 | | 2022 | | 2021 |
| | | | | |
| (dollars in millions) |
| Total revenue | $ | 6,892.7 | | | $ | 5,501.5 | | | $ | 4,256.1 | |
| Total revenue year-over-year percentage increase | 25.3 | % | | 29.3 | % | | 24.9 | % |
| Gross margin | 72.3 | % | | 68.8 | % | | 70.0 | % |
| Operating income (loss) | $ | 387.3 | | | $ | (188.8) | | | $ | (304.1) | |
| Operating margin | 5.6 | % | | (3.4) | % | | (7.1) | % |
| Billings | $ | 9,194.4 | | | $ | 7,471.5 | | | $ | 5,452.2 | |
| Billings year-over-year percentage increase | 23.1 | % | | 37.0 | % | | 26.7 | % |
| Cash flow provided by operating activities | $ | 2,777.5 | | | $ | 1,984.7 | | | $ | 1,503.0 | |
| Free cash flow (non-GAAP) | $ | 2,631.2 | | | $ | 1,791.9 | | | $ | 1,387.0 | |
|
| | | | | | | |
| | July 31, |
| | 2017 | | 2016 |
| | (in millions) |
| Total deferred revenue | $ | 1,773.5 |
| | $ | 1,240.8 |
|
| Cash, cash equivalents, and investments | $ | 2,164.3 |
| | $ | 1,938.4 |
|
|
| | | | | | | | | | | |
| | Year Ended July 31, |
| | 2017 | | 2016 | | 2015 |
| | (dollars in millions) |
| Total revenue | $ | 1,761.6 |
| | $ | 1,378.5 |
| | $ | 928.1 |
|
| Total revenue year-over-year percentage increase | 27.8 | % | | 48.5 | % | | 55.1 | % |
| Gross margin | 72.9 | % | | 73.2 | % | | 72.9 | % |
Operating loss(1) | $ | (179.8 | ) | | $ | (157.3 | ) | | $ | (99.8 | ) |
Operating margin(1) | (10.2 | )% | | (11.4 | )% | | (10.8 | )% |
| Billings | $ | 2,293.4 |
| | $ | 1,905.6 |
| | $ | 1,219.1 |
|
| Billings year-over-year percentage increase | 20.4 | % | | 56.3 | % | | 58.0 | % |
Cash flow provided by operating activities(2) | $ | 868.5 |
| | $ | 658.6 |
| | $ | 352.8 |
|
Free cash flow (non-GAAP)(2) | $ | 705.1 |
| | $ | 586.1 |
| | $ | 319.0 |
|
______________
| |
(1) | Prior period amounts have been adjusted due to our voluntary change in accounting policy for sales commissions. Refer to Note 1. Description of Business and Summary of Significant Accounting Policies in Part II, Item 8 of this Annual Report on Form 10-K for more information. |
| |
(2) | Prior period amounts have been adjusted due to our early adoption of new share-based payment accounting guidance. Refer to Note 1. Description of Business and Summary of Significant Accounting Policies in Part II, Item 8 of this Annual Report on Form 10-K for more information. |
•Deferred Revenue.Our deferred revenue primarily consists of amounts that have been invoiced but have not been recognized as revenue as of the period end. The majority of our deferred revenue balance consists of subscription and support revenue that is recognized ratably over the contractual service period. We monitor our deferred revenue balance because it represents a significant portion of revenue to be recognized in future periods.
•Billings.We define billings as total revenue plus the change in total deferred revenue, net of acquired deferred revenue, during the period. We consider billings to be a key measuremetric used by management to manage our business given our hybrid SaaS revenue model, andbusiness. We believe billings provides investors with an important indicator of the health and visibility of our business because it includes subscription and support revenue, which is recognized ratably over the contractual service period, and product revenue, which is recognized at the time of hardware shipment or delivery of software license, provided that all other conditions for revenue recognition criteria have been met. We consider billings to be a useful metric for management and investors, particularly if we continue to experience increased sales of subscriptions and strong renewal rates for subscription and support offerings, and as we monitor our near termnear-term cash flows. While we believe that billings provides useful information to investors and others in understanding and evaluating our operating results in the same manner as our management, it is important to note that other companies, including companies in our industry, may not use billings, may calculate billings differently, may have different billing frequencies, or may use other financial measures to evaluate their performance, all of which could reduce the usefulness of billings as a comparative measure. We calculate billings in the following manner:
| | | | | | | | | | | | | | | | | |
| Year Ended July 31, |
| 2023 | | 2022 | | 2021 |
| | | | | |
| (in millions) |
| Billings: | | | | | |
| Total revenue | $ | 6,892.7 | | | $ | 5,501.5 | | | $ | 4,256.1 | |
| Add: change in total deferred revenue, net of acquired deferred revenue | 2,301.7 | | | 1,970.0 | | | 1,196.1 | |
| Billings | $ | 9,194.4 | | | $ | 7,471.5 | | | $ | 5,452.2 | |
|
| | | | | | | | | | | |
| | Year Ended July 31, |
| | 2017 | | 2016 | | 2015 |
| | (in millions) |
| Billings: | | | | | |
| Total revenue | $ | 1,761.6 |
| | $ | 1,378.5 |
| | $ | 928.1 |
|
| Add: change in total deferred revenue, net of acquired deferred revenue | 531.8 |
| | 527.1 |
| | 291.0 |
|
| Billings | $ | 2,293.4 |
| | $ | 1,905.6 |
| | $ | 1,219.1 |
|
•Cash Flow Provided by Operating Activities.We monitor cash flow provided by operating activities as a measure of our overall business performance. Our cash flow provided by operating activities is driven in large part by sales of our products and from up-front payments for subscription and support offerings. Monitoring cash flow provided by operating activities enables us to analyze our financial performance without the non-cash effects of certain items such as depreciation, amortization, and share-based compensation costs, depreciation and amortization, thereby allowing us to better understand and manage the cash needs of our business.
•Free Cash Flow (non-GAAP).We define free cash flow, a non-GAAP financial measure, as cash provided by operating activities less purchases of property, equipment, and other assets. We consider free cash flow to be a profitability and liquidity measure that provides useful information to management and investors about the amount of cash generated by the business after necessary capital expenditures. A limitation of the utility of free cash flow as a measure of our financial performance and liquidity is that it does not represent the total increase or decrease in our cash balance for the period. In addition, it is important to note that other companies, including companies in our industry, may not use free cash flow, may calculate free cash flow in a different manner than we do, or may use other financial measures to evaluate their performance, all of which could reduce the usefulness of free cash flow as a comparative measure. A reconciliation of free cash flow to cash flow provided by operating activities, the most directly comparable financial measure calculated and presented in accordance with U.S. GAAP, is provided below:
| | | | | | | | | | | | | | | | | |
| Year Ended July 31, |
| 2023 | | 2022 | | 2021 |
| | | | | |
| (in millions) |
| Free cash flow (non-GAAP): | | | | | |
| Net cash provided by operating activities | $ | 2,777.5 | | | $ | 1,984.7 | | | $ | 1,503.0 | |
| Less: purchases of property, equipment, and other assets | 146.3 | | | 192.8 | | | 116.0 | |
| Free cash flow (non-GAAP) | $ | 2,631.2 | | | $ | 1,791.9 | | | $ | 1,387.0 | |
| Net cash used in investing activities | $ | (2,033.8) | | | $ | (933.4) | | | $ | (1,480.6) | |
| Net cash used in financing activities | $ | (1,726.3) | | | $ | (806.6) | | | $ | (1,104.0) | |
|
| | | | | | | | | | | |
| | Year Ended July 31, |
| | 2017 | | 2016 | | 2015 |
| | (in millions) |
| Free cash flow (non-GAAP): | | | | | |
Net cash provided by operating activities(1) | $ | 868.5 |
| | $ | 658.6 |
| | $ | 352.8 |
|
| Less: purchases of property, equipment, and other assets | 163.4 |
| | 72.5 |
| | 33.8 |
|
Free cash flow (non-GAAP)(1) | $ | 705.1 |
| | $ | 586.1 |
| | $ | 319.0 |
|
| Net cash used in investing activities | $ | (472.6 | ) | | $ | (338.9 | ) | | $ | (679.0 | ) |
Net cash provided by (used in) financing activities(1) | $ | (386.0 | ) | | $ | 38.9 |
| | $ | 48.2 |
|
______________
| |
(1) | Prior period amounts have been adjusted due to our early adoption of new share-based payment accounting guidance. Refer to Note 1. Description of Business and Summary of Significant Accounting Policies in Part II, Item 8 of this Annual Report on Form 10-K for more information. |
Results of Operations
The following table summarizes our results of operations for the periods presented and as a percentage of our total revenue for those periods based on our consolidated statements of operations data. The period to periodperiod-to-period comparison of results is not necessarily indicative of results for future periods.
| | | | | | | | | | | | | | | | | | | | | | | | | | | | | | | | | | | |
| Year Ended July 31, |
| 2023 | | 2022 | | 2021 |
| Amount | | % of Revenue | | Amount | | % of Revenue | | Amount | | % of Revenue |
| | | | | | | | | | | |
| (dollars in millions) |
| Revenue: | | | | | | | | | | | |
| Product | $ | 1,578.4 | | | 22.9 | % | | $ | 1,363.1 | | | 24.8 | % | | $ | 1,120.3 | | | 26.3 | % |
| Subscription and support | 5,314.3 | | | 77.1 | % | | 4,138.4 | | | 75.2 | % | | 3,135.8 | | | 73.7 | % |
| Total revenue | 6,892.7 | | | 100.0 | % | | 5,501.5 | | | 100.0 | % | | 4,256.1 | | | 100.0 | % |
| Cost of revenue: | | | | | | | | | | | |
| Product | 418.3 | | | 6.1 | % | | 455.5 | | | 8.3 | % | | 308.5 | | | 7.2 | % |
| Subscription and support | 1,491.4 | | | 21.6 | % | | 1,263.2 | | | 22.9 | % | | 966.4 | | | 22.8 | % |
Total cost of revenue(1) | 1,909.7 | | | 27.7 | % | | 1,718.7 | | | 31.2 | % | | 1,274.9 | | | 30.0 | % |
| Total gross profit | 4,983.0 | | | 72.3 | % | | 3,782.8 | | | 68.8 | % | | 2,981.2 | | | 70.0 | % |
| Operating expenses: | | | | | | | | | | | |
| Research and development | 1,604.0 | | | 23.3 | % | | 1,417.7 | | | 25.8 | % | | 1,140.4 | | | 26.8 | % |
| Sales and marketing | 2,544.0 | | | 36.9 | % | | 2,148.9 | | | 39.0 | % | | 1,753.8 | | | 41.1 | % |
| General and administrative | 447.7 | | | 6.5 | % | | 405.0 | | | 7.4 | % | | 391.1 | | | 9.2 | % |
Total operating expenses(1) | 4,595.7 | | | 66.7 | % | | 3,971.6 | | | 72.2 | % | | 3,285.3 | | | 77.1 | % |
| Operating income (loss) | 387.3 | | | 5.6 | % | | (188.8) | | | (3.4) | % | | (304.1) | | | (7.1) | % |
| Interest expense | (27.2) | | | (0.4) | % | | (27.4) | | | (0.5) | % | | (163.3) | | | (3.8) | % |
| Other income, net | 206.2 | | | 3.0 | % | | 9.0 | | | 0.1 | % | | 2.4 | | | — | % |
| Income (loss) before income taxes | 566.3 | | | 8.2 | % | | (207.2) | | | (3.8) | % | | (465.0) | | | (10.9) | % |
| Provision for income taxes | 126.6 | | | 1.8 | % | | 59.8 | | | 1.1 | % | | 33.9 | | | 0.8 | % |
| Net income (loss) | $ | 439.7 | | | 6.4 | % | | $ | (267.0) | | | (4.9) | % | | $ | (498.9) | | | (11.7) | % |
(1)Includes share-based compensation as follows:
| | | | | | | | | | | | | | | | | |
| Year Ended July 31, |
| 2023 | | 2022 | | 2021 |
| | | | | |
| (in millions) |
| Cost of product revenue | $ | 9.8 | | | $ | 9.3 | | | $ | 6.2 | |
| Cost of subscription and support revenue | 123.4 | | | 110.2 | | | 93.0 | |
| Research and development | 488.4 | | | 471.1 | | | 428.9 | |
| Sales and marketing | 335.3 | | | 304.7 | | | 269.9 | |
| General and administrative | 130.4 | | | 118.1 | | | 128.9 | |
| Total share-based compensation | $ | 1,087.3 | | | $ | 1,013.4 | | | $ | 926.9 | |
|
| | | | | | | | | | | | | | | | | | | | |
| | Year Ended July 31, |
| | 2017 | | 2016 | | 2015 |
| | Amount | | % of Revenue | | Amount(1) | | % of Revenue(1) | | Amount(1) | | % of Revenue(1) |
| | (dollars in millions) |
| Revenue: | | | | | | | | | | | |
| Product | $ | 709.1 |
| | 40.3 | % | | $ | 670.8 |
| | 48.7 | % | | $ | 492.7 |
| | 53.1 | % |
| Subscription and support | 1,052.5 |
| | 59.7 | % | | 707.7 |
| | 51.3 | % | | 435.4 |
| | 46.9 | % |
| Total revenue | 1,761.6 |
| | 100.0 | % | | 1,378.5 |
| | 100.0 | % | | 928.1 |
| | 100.0 | % |
| Cost of revenue: | | | | | | | | | | | |
| Product | 201.4 |
| | 11.4 | % | | 175.4 |
| | 12.7 | % | | 131.1 |
| | 14.1 | % |
| Subscription and support | 275.2 |
| | 15.7 | % | | 194.6 |
| | 14.1 | % | | 120.4 |
| | 13.0 | % |
Total cost of revenue(2) | 476.6 |
| | 27.1 | % | | 370.0 |
| | 26.8 | % | | 251.5 |
| | 27.1 | % |
| Total gross profit | 1,285.0 |
| | 72.9 | % | | 1,008.5 |
| | 73.2 | % | | 676.6 |
| | 72.9 | % |
| Operating expenses: | | | | | | | | | | | |
| Research and development | 347.4 |
| | 19.7 | % | | 284.2 |
| | 20.6 | % | | 185.8 |
| | 20.0 | % |
| Sales and marketing | 919.1 |
| | 52.2 | % | | 743.2 |
| | 53.9 | % | | 489.0 |
| | 52.7 | % |
| General and administrative | 198.3 |
| | 11.2 | % | | 138.4 |
| | 10.1 | % | | 101.6 |
| | 11.0 | % |
Total operating expenses(2) | 1,464.8 |
| | 83.1 | % | | 1,165.8 |
| | 84.6 | % | | 776.4 |
| | 83.7 | % |
| Operating loss | (179.8 | ) | | (10.2 | )% | | (157.3 | ) | | (11.4 | )% | | (99.8 | ) | | (10.8 | )% |
| Interest expense | (24.5 | ) | | (1.4 | )% | | (23.4 | ) | | (1.7 | )% | | (22.3 | ) | | (2.4 | )% |
| Other income, net | 10.2 |
| | 0.6 | % | | 8.4 |
| | 0.6 | % | | 0.2 |
| | — | % |
| Loss before income taxes | (194.1 | ) | | (11.0 | )% | | (172.3 | ) | | (12.5 | )% | | (121.9 | ) | | (13.2 | )% |
| Provision for income taxes | 22.5 |
| | 1.3 | % | | 20.4 |
| | 1.5 | % | | 9.4 |
| | 1.0 | % |
| Net loss | $ | (216.6 | ) | | (12.3 | )% | | $ | (192.7 | ) | | (14.0 | )% | | $ | (131.3 | ) | | (14.2 | )% |
______________
| |
(1) | Certain prior period amounts have been adjusted due to our voluntary change in accounting policy for sales commissions. Refer to Note 1. Description of Business and Summary of Significant Accounting Policies in Part II, Item 8 of this Annual Report on Form 10-K for more information. |
| |
(2) | Includes share-based compensation as follows: |
|
| | | | | | | | | | | |
| | Year Ended July 31, |
| | 2017 | | 2016 | | 2015 |
| | (in millions) |
| Cost of product revenue | $ | 7.3 |
| | $ | 6.2 |
| | $ | 3.9 |
|
| Cost of subscription and support revenue | 56.2 |
| | 40.9 |
| | 20.4 |
|
| Research and development | 152.6 |
| | 132.9 |
| | 74.8 |
|
| Sales and marketing | 186.5 |
| | 152.4 |
| | 84.1 |
|
| General and administrative | 73.1 |
| | 60.5 |
| | 38.2 |
|
| Total share-based compensation | $ | 475.7 |
| | $ | 392.9 |
| | $ | 221.4 |
|
RevenueREVENUE
Our revenue consists of product revenue and subscription and support revenue. Revenue is recognized when persuasive evidenceupon transfer of control of the corresponding promised products and subscriptions and support to our customers in an arrangement exists, delivery has occurred,amount that reflects the fee is fixed or determinable,consideration we expect to be entitled to in exchange for those products and collectability is reasonably assured.subscriptions and support. We expect our revenue to vary from quarter to quarter based on seasonal and cyclical factors.
Product RevenuePRODUCT REVENUE
Product revenue is derived primarily from sales of our appliances.appliances, primarily our ML-Powered Next-Generation Firewall. Product revenue also includes revenue derived from software licenses of Panorama, SD-WAN, and the VM-Series. Our appliances and software licenses include a broad set of built-in networking and security features and functionalities. We recognize product revenue at the time of hardware shipment provided that all other revenue recognition criteria have been met.or delivery of software license.
|
| | | | | | | | | | | | | | | | | | | | | | | | | | | | | |
| | Year Ended July 31, | | | | Year Ended July 31, | | |
| | 2017 | | 2016 | | Change | | 2016 | | 2015 | | Change |
| | Amount | | Amount | | Amount | | % | | Amount | | Amount | | Amount | | % |
| | (dollars in millions) |
| Product | $ | 709.1 |
| | $ | 670.8 |
| | $ | 38.3 |
| | 5.7 | % | | $ | 670.8 |
| | $ | 492.7 |
| | $ | 178.1 |
| | 36.2 | % |
| | | | | | | | | | | | | | | | | | | | | | | | | | | | | | | | | | | | | | | | | | | | | | | |
| Year Ended July 31, | | | | Year Ended July 31, | | |
| | 2023 | | 2022 | | Change | | 2022 | | 2021 | | Change |
| Amount | | Amount | | Amount | | % | | Amount | | Amount | | Amount | | % |
| | | | | | | | | | | | | | | |
| | (dollars in millions) |
| Product | $ | 1,578.4 | | | $ | 1,363.1 | | | $ | 215.3 | | | 15.8 | % | | $ | 1,363.1 | | | $ | 1,120.3 | | | $ | 242.8 | | | 21.7 | % |
Product revenue increased year-over-year for fiscal 2017 due2023 compared to demand for our newly introduced appliances. Product revenue increased year-over-year for fiscal 2016 due to2022 driven by increased demand for our higher end appliances. The change in productnew generation of hardware products, increased software revenue primarily due to pricing was not significanta new go-to-market strategy for either period.certain Network Security offerings and an increased demand for our VM-Series virtual firewalls, partially offset by decreased revenue from our prior generation of hardware products.
Subscription and Support RevenueSUBSCRIPTION AND SUPPORT REVENUE
Subscription and support revenue is derived primarily from sales of our subscription and support offerings. Our contractual subscription and support termscontracts are typically one to five years. We recognize revenue from subscriptions and support over time as the contractual service period.services are performed. As a percentage of total revenue, we expect our subscription and support revenue to vary from quarter to quarter and increase over the long term as we introduce new subscriptions, renew existing subscription and support contracts, and expand our installed end-customer base. Prior to fiscal 2017, subscription and support revenue was referred to as services revenue. The composition of subscription and support revenue has not been modified.
| | | | | | | | | | | | | | | | | | | | Year Ended July 31, | | | | Year Ended July 31, | | |
| | Year Ended July 31, | | | | Year Ended July 31, | | | | 2023 | | 2022 | | Change | | 2022 | | 2021 | | Change |
| | 2017 | | 2016 | | Change | | 2016 | | 2015 | | Change | | Amount | | Amount | | Amount | | % | | Amount | | Amount | | Amount | | % |
| | Amount | | Amount | | Amount | | % | | Amount | | Amount | | Amount | | % | | | | | | | | | | | | | | | | |
| | (dollars in millions) | | (dollars in millions) |
| Subscription | $ | 550.8 |
| | $ | 357.0 |
| | $ | 193.8 |
| | 54.3 | % | | $ | 357.0 |
| | $ | 212.7 |
| | $ | 144.3 |
| | 67.8 | % | Subscription | $ | 3,335.4 | | | $ | 2,539.0 | | | $ | 796.4 | | | 31.4 | % | | $ | 2,539.0 | | | $ | 1,898.8 | | | $ | 640.2 | | | 33.7 | % |
| Support | 501.7 |
| | 350.7 |
| | 151.0 |
| | 43.1 | % | | 350.7 |
| | 222.7 |
| | 128.0 |
| | 57.5 | % | Support | 1,978.9 | | | 1,599.4 | | | 379.5 | | | 23.7 | % | | 1,599.4 | | | 1,237.0 | | | 362.4 | | | 29.3 | % |
| Total subscription and support | $ | 1,052.5 |
| | $ | 707.7 |
| | $ | 344.8 |
| | 48.7 | % | | $ | 707.7 |
| | $ | 435.4 |
| | $ | 272.3 |
| | 62.5 | % | Total subscription and support | $ | 5,314.3 | | | $ | 4,138.4 | | | $ | 1,175.9 | | | 28.4 | % | | $ | 4,138.4 | | | $ | 3,135.8 | | | $ | 1,002.6 | | | 32.0 | % |
Subscription and support revenue increased year-over-year for both fiscal 2017 and2023 compared to fiscal 2016. The increases in both periods were2022 due to increased demand for our subscription and support offerings from both new and existingour end-customers. The mix between subscription revenue and support revenue will fluctuate over time, depending on the introduction of new subscription
offerings, renewals of support services, and our ability to increase sales to new and existing customers. The change in subscription and support revenue due to changes in pricing was not significant for either period.end-customers.
REVENUE BY GEOGRAPHIC THEATER
| | | | | | | | | | | | | | | | | | | | | | | | | | | | | | | | | | | | | | | | | | | | | | | |
| Year Ended July 31, | | | | Year Ended July 31, | | |
| | 2023 | | 2022 | | Change | | 2022 | | 2021 | | Change |
| Amount | | Amount | | Amount | | % | | Amount | | Amount | | Amount | | % |
| | | | | | | | | | | | | | | |
| | (dollars in millions) |
| Americas | $ | 4,719.9 | | | $ | 3,802.6 | | | $ | 917.3 | | | 24.1 | % | | $ | 3,802.6 | | | $ | 2,937.5 | | | $ | 865.1 | | | 29.5 | % |
| EMEA | 1,359.6 | | | 1,055.8 | | | 303.8 | | | 28.8 | % | | 1,055.8 | | | 817.3 | | | 238.5 | | | 29.2 | % |
| APAC | 813.2 | | | 643.1 | | | 170.1 | | | 26.5 | % | | 643.1 | | | 501.3 | | | 141.8 | | | 28.3 | % |
| Total revenue | $ | 6,892.7 | | | $ | 5,501.5 | | | $ | 1,391.2 | | | 25.3 | % | | $ | 5,501.5 | | | $ | 4,256.1 | | | $ | 1,245.4 | | | 29.3 | % |
Revenue by Geographic Theater
|
| | | | | | | | | | | | | | | | | | | | | | | | | | | | | |
| | Year Ended July 31, | |
| | Year Ended July 31, | |
|
| | 2017 | | 2016 | | Change | | 2016 | | 2015 | | Change |
| | Amount | | Amount | | Amount | | % | | Amount | | Amount | | Amount | | % |
| | (dollars in millions) |
| Americas | $ | 1,237.4 |
| | $ | 973.2 |
| | $ | 264.2 |
| | 27.1 | % | | $ | 973.2 |
| | $ | 639.4 |
| | $ | 333.8 |
| | 52.2 | % |
| EMEA | 320.1 |
| | 247.1 |
| | 73.0 |
| | 29.5 | % | | 247.1 |
| | 178.7 |
| | 68.4 |
| | 38.2 | % |
| APAC | 204.1 |
| | 158.2 |
| | 45.9 |
| | 29.0 | % | | 158.2 |
| | 110.0 |
| | 48.2 |
| | 43.8 | % |
| Total revenue | $ | 1,761.6 |
| | $ | 1,378.5 |
| | $ | 383.1 |
| | 27.8 | % | | $ | 1,378.5 |
| | $ | 928.1 |
| | $ | 450.4 |
| | 48.5 | % |
With respectfrom the Americas, Europe, the Middle East, and Africa (“EMEA”) and Asia Pacific and Japan (“APAC”) increased year-over-year for fiscal 2023 as we continued to increase investment in our global sales force in order to support our growth and innovation. Our three geographic theaters had similar year-over-year revenue growth rates for fiscal 2023, with the Americas contributedcontributing the largest portion of the year-over-year increaseshighest increase in revenue for both fiscal 2017 and fiscal 2016 due to its larger and more established sales force compared to our other theaters. Revenue from both EMEA and APAC increased year-over-year for both fiscal 2017 and fiscal 2016 due to our investment in increasing the size of our sales force and number of channel partners in these theaters.scale.
Cost of Revenue
COST OF REVENUE
Our cost of revenue consists of cost of product revenue and cost of subscription and support revenue.
Cost of Product RevenueCOST OF PRODUCT REVENUE
Cost of product revenue primarily includes costs paid to our manufacturing partners.partners for procuring components and manufacturing our products. Our cost of product revenue also includes personnel costs, which consist of salaries, benefits, bonuses, share-based compensation, and travel and entertainment associated with our operations organization, amortization of intellectual property licenses, product testing costs, shipping and tariff costs, and allocatedshared costs. AllocatedShared costs consist of certain facilities, depreciation, benefits, recruiting, and information technology costs that we allocate based on headcount. We expect our cost of product revenue to increase asfluctuate with our product revenue increases.from hardware products.
|
| | | | | | | | | | | | | | | | | | | | | | | | | | | | | |
| | Year Ended July 31, | | | | Year Ended July 31, | | |
| | 2017 | | 2016 | | Change | | 2016 | | 2015 | | Change |
| | Amount | | Amount | | Amount | | % | | Amount | | Amount | | Amount | | % |
| | (dollars in millions) |
| Cost of product revenue | $ | 201.4 |
| | $ | 175.4 |
| | $ | 26.0 |
| | 14.8 | % | | $ | 175.4 |
| | $ | 131.1 |
| | $ | 44.3 |
| | 33.8 | % |
| Number of employees at period end | 96 |
| | 91 |
| | 5 |
| | 5.5 | % | | 91 |
| | 67 |
| | 24 |
| | 35.8 | % |
| | | | | | | | | | | | | | | | | | | | | | | | | | | | | | | | | | | | | | | | | | | | | | | |
| | Year Ended July 31, | | | | Year Ended July 31, | | |
| | 2023 | | 2022 | | Change | | 2022 | | 2021 | | Change |
| Amount | | Amount | | Amount | | % | | Amount | | Amount | | Amount | | % |
| | | | | | | | | | | | | | | |
| | (dollars in millions) |
| Cost of product revenue | $ | 418.3 | | | $ | 455.5 | | | $ | (37.2) | | | (8.2) | % | | $ | 455.5 | | | $ | 308.5 | | | $ | 147.0 | | | 47.6 | % |
| | | | | | | | | | | | | | | |
Cost of product revenue increaseddecreased for fiscal 20172023 compared to fiscal 2016 primarily2022 due to highera favorable hardware product costs related to our newly introduced appliances.mix.
Cost of product revenue increased for fiscal 2016 compared to fiscal 2015 primarily due to an increase in product unit volume for our higher end appliances.
Cost of Subscription and Support RevenueCOST OF SUBSCRIPTION AND SUPPORT REVENUE
Cost of subscription and support revenue includes personnel costs for our global customer support and technical operations organizations, customer support and repair costs, third-party professional services costs, data center and cloud hosting service costs, amortization of acquired intangible assets and allocatedcapitalized software development costs, and shared costs. We expect our cost of subscription and support revenue to increase as our installed end-customer base grows. Prior to fiscal 2017, costgrows and adoption of our cloud-based subscription and support revenue was referred to as cost of services revenue. The composition of cost of subscription and support revenue has not been modified.offerings increases.
|
| | | | | | | | | | | | | | | | | | | | | | | | | | | | | |
| | Year Ended July 31, | | | | Year Ended July 31, | | |
| | 2017 | | 2016 | | Change | | 2016 | | 2015 | | Change |
| | Amount | | Amount | | Amount | | % | | Amount | | Amount | | Amount | | % |
| | (dollars in millions) |
| Cost of subscription and support revenue | $ | 275.2 |
| | $ | 194.6 |
| | $ | 80.6 |
| | 41.4 | % | | $ | 194.6 |
| | $ | 120.4 |
| | $ | 74.2 |
| | 61.7 | % |
| Number of employees at period end | 725 |
| | 539 |
| | 186 |
| | 34.5 | % | | 539 |
| | 357 |
| | 182 |
| | 51.0 | % |
| | | | | | | | | | | | | | | | | | | | | | | | | | | | | | | | | | | | | | | | | | | | | | | |
| | Year Ended July 31, | | | | Year Ended July 31, | | |
| | 2023 | | 2022 | | Change | | 2022 | | 2021 | | Change |
| Amount | | Amount | | Amount | | % | | Amount | | Amount | | Amount | | % |
| | | | | | | | | | | | | | | |
| | (dollars in millions) |
| Cost of subscription and support revenue | $ | 1,491.4 | | | $ | 1,263.2 | | | $ | 228.2 | | | 18.1 | % | | $ | 1,263.2 | | | $ | 966.4 | | | $ | 296.8 | | | 30.7 | % |
| | | | | | | | | | | | | | | |
Cost of subscription and support revenue increased for fiscal 20172023 compared to fiscal 20162022 primarily due to an increase in personnelincreased costs which grew $45.3 million to $155.4 million, largely due to headcount growth. The remaining increase was primarily driven by costs to expand our customer service capabilities and infrastructure, customer support costs, and allocated costs. The increase in allocated costs was primarily due to our expansion of facilities to support the growth of our business.
Cost of subscription and support revenueofferings. Cloud hosting service costs, which support our cloud-based subscription offerings, increased $101.0 million for fiscal 20162023 compared to fiscal 20152022. Personnel costs grew $97.0 million for fiscal 2023 compared to fiscal 2022 primarily due to an increase in personnel costs, which grew $42.1 million to $104.1 million, largely due to headcount growth. The remaining increase was due to expansion
Gross MarginGROSS MARGIN
Gross margin or gross profit as a percentage of revenue, has been and will continue to be affected by a variety of factors, including the introduction of new products, manufacturing costs, the average sales price of our products, manufacturingcloud hosting service costs, the introduction of new products,personnel costs, the mix of products sold, and the mix of revenue between product and subscription and support offerings. For sales of our products, our higher endOur virtual and higher-end firewall products generally have higher gross margins than our lower endlower-end firewall products within each product series. For sales of our subscription and support offerings, our subscription offerings typically have higher gross margins than our support offerings. We expect our gross margins to fluctuatevary over time depending on the factors described above.
| | | | | | | | | | | | | | | | | | | | | | | | | | | | | | | | | | | |
| | Year Ended July 31, |
| | 2023 | | 2022 | | 2021 |
| | Amount | | Gross
Margin | | Amount | | Gross
Margin | | Amount | | Gross
Margin |
| | | | | | | | | | | |
| | (dollars in millions) |
| Product | $ | 1,160.1 | | | 73.5 | % | | $ | 907.6 | | | 66.6 | % | | $ | 811.8 | | | 72.5 | % |
| Subscription and support | 3,822.9 | | | 71.9 | % | | 2,875.2 | | | 69.5 | % | | 2,169.4 | | | 69.2 | % |
| Total gross profit | $ | 4,983.0 | | | 72.3 | % | | $ | 3,782.8 | | | 68.8 | % | | $ | 2,981.2 | | | 70.0 | % |
|
| | | | | | | | | | | | | | | | | | | | |
| | Year Ended July 31, |
| | 2017 | | 2016 | | 2015 |
| | Amount | | Gross Margin | | Amount | | Gross Margin | | Amount | | Gross
Margin |
| | (dollars in millions) |
| Product | $ | 507.7 |
| | 71.6 | % | | $ | 495.4 |
| | 73.9 | % | | $ | 361.6 |
| | 73.4 | % |
| Subscription and support | 777.3 |
| | 73.9 | % | | 513.1 |
| | 72.5 | % | | 315.0 |
| | 72.3 | % |
| Total gross profit | $ | 1,285.0 |
| | 72.9 | % | | $ | 1,008.5 |
| | 73.2 | % | | $ | 676.6 |
| | 72.9 | % |
Product gross margin decreased for fiscal 2017 compared to fiscal 2016 due to higher product costs related to our newly introduced appliances, which will have lower product margins. Product gross margin increased for fiscal 20162023 compared to fiscal 20152022 primarily due to our continued focus on material cost reductions.increased software revenue and a favorable hardware product mix.
Subscription and support gross margin increased for fiscal 20172023 compared to fiscal 20162022, primarily due to contributions from our higher margingrowth in subscription offerings. Subscription and support gross margin was flat for fiscal 2016 compared to fiscal 2015.revenue, which outpaced the subscription and support costs.
Operating Expenses
OPERATING EXPENSES
Our operating expenses consist of research and development, sales and marketing, and general and administrative expense.expenses. Personnel costs are the most significant component of operating expenses and consist of salaries, benefits, bonuses, share-based compensation, travel and entertainment, and with regard to sales and marketing expense, sales commissions. Our operating expenses also include allocatedshared costs, which consist of certain facilities, depreciation, benefits, recruiting, and information technology costs that we allocate based on headcount.headcount to each department. We expect operating expenses generally to increase in absolute dollars and decrease over the long term as a percentage of revenue as we continue to scale our business. As of July 31, 2017,2023, we expect to recognize approximately $906.8 million$2.0 billion of share-based compensation expense over a weighted-average period of approximately 2.6 years,
excluding additional share-based compensation expense related to any future grants of share-based awards. Share-based compensation expense is generally recognized on a straight-line basis over the requisite service periods of the awards.
Research and Development
RESEARCH AND DEVELOPMENT
Research and development expense consists primarily of personnel costs. Research and development expense also includes prototype relatedprototype-related expenses and allocatedshared costs. We expect research and development expense to increase in absolute dollars as we continue to invest in our future products and services, although our research and development expense may fluctuate as a percentage of total revenue.
|
| | | | | | | | | | | | | | | | | | | | | | | | | | | | | |
| | Year Ended July 31, | | | | Year Ended July 31, | | |
| | 2017 | | 2016 | | Change | | 2016 | | 2015 | | Change |
| | Amount | | Amount | | Amount | | % | | Amount | | Amount | | Amount | | % |
| | (dollars in millions) |
| Research and development | $ | 347.4 |
| | $ | 284.2 |
| | $ | 63.2 |
| | 22.2 | % | | $ | 284.2 |
| | $ | 185.8 |
| | $ | 98.4 |
| | 52.9 | % |
| Number of employees at period end | 766 |
| | 637 |
| | 129 |
| | 20.3 | % | | 637 |
| | 475 |
| | 162 |
| | 34.1 | % |
| | | | | | | | | | | | | | | | | | | | | | | | | | | | | | | | | | | | | | | | | | | | | | | |
| | Year Ended July 31, | | | | Year Ended July 31, | | |
| | 2023 | | 2022 | | Change | | 2022 | | 2021 | | Change |
| Amount | | Amount | | Amount | | % | | Amount | | Amount | | Amount | | % |
| | | | | | | | | | | | | | | |
| | (dollars in millions) |
| Research and development | $ | 1,604.0 | | | $ | 1,417.7 | | | $ | 186.3 | | | 13.1 | % | | $ | 1,417.7 | | | $ | 1,140.4 | | | $ | 277.3 | | | 24.3 | % |
| | | | | | | | | | | | | | | |
Research and development expense increased year-over-year for both fiscal 2017 and2023 compared to fiscal 2016. The increases in both periods were driven by increases in2022 primarily due to increased personnel costs, which grew $46.4$154.2 million, to $286.0 million for fiscal 2017 compared to fiscal 2016 and grew $86.8 million to $236.4 million for fiscal 2016 compared to fiscal 2015. The increases in personnel costs in both periods were primarilylargely due to headcount growth. The remaining increase for fiscal 2017 was primarily driven by an increase in allocated costs, due to our expansion
Sales and MarketingSALES AND MARKETING
Sales and marketing expense consists primarily of personnel costs, including commission expense. Sales and marketing expense also includes costs for market development programs, promotional and other marketing costs, professional services, and allocatedshared costs. We continue to thoughtfullystrategically invest in headcount and have substantially grown our sales presence internationally.presence. We expect sales and marketing expense to continue to increase in absolute dollars as we increase the size of our sales and marketing organizations to grow our customer base, increase touch points with end-customers, and to expand our internationalglobal presence, although our sales and marketing expense may fluctuate as a percentage of total revenue.
| | | | | | | | | | | | | | | | | | | | | | | | | | | | | | | | | | | | | | | | | | | | | | | |
| | Year Ended July 31, | | | | Year Ended July 31, | | |
| | 2023 | | 2022 | | Change | | 2022 | | 2021 | | Change |
| Amount | | Amount | | Amount | | % | | Amount | | Amount | | Amount | | % |
| | | | | | | | | | | | | | | |
| | (dollars in millions) |
| Sales and marketing | $ | 2,544.0 | | | $ | 2,148.9 | | | $ | 395.1 | | | 18.4 | % | | $ | 2,148.9 | | | $ | 1,753.8 | | | $ | 395.1 | | | 22.5 | % |
| | | | | | | | | | | | | | | |
|
| | | | | | | | | | | | | | | | | | | | | | | | | | | | | |
| | Year Ended July 31, | | | | Year Ended July 31, | | |
| | 2017 | | 2016 | | Change | | 2016 | | 2015 | | Change |
| | Amount | | Amount | | Amount | | % | | Amount | | Amount | | Amount | | % |
| | (dollars in millions) |
Sales and marketing(1) | $ | 919.1 |
| | $ | 743.2 |
| | $ | 175.9 |
| | 23.7 | % | | $ | 743.2 |
| | $ | 489.0 |
| | $ | 254.2 |
| | 52.0 | % |
| Number of employees at period end | 2,418 |
| | 2,092 |
| | 326 |
| | 15.6 | % | | 2,092 |
| | 1,443 |
| | 649 |
| | 45.0 | % |
______________
| |
(1) | Prior period amounts have been adjusted due to our voluntary change in accounting policy for sales commissions. Refer to Note 1. Description of Business and Summary of Significant Accounting Policies in Part II, Item 8 of this Annual Report on Form 10-K for more information. |
Sales and marketing expense increased year-over-year for both fiscal 2017 and2023 compared to fiscal 2016. The increases in both periods were driven by increases in2022 primarily due to increased personnel costs, which grew $145.0$290.7 million, to $716.1 million for fiscal 2017 compared to fiscal 2016 and grew $186.1 million to $520.2 million for fiscal 2016 compared to fiscal 2015. The increases in personnel costs in both periods were primarilylargely due to headcount growth.growth and increased travel and entertainment expenses. The remaining increase for fiscal 2017in sales and marketing expense was primarilyfurther driven by an increase in allocatedincreased costs due to our expansion of facilities to support the growth of our business,associated with sales and an increase in demand generation activitiesmarketing events and sales related events to support our revenue growth.go-to-market initiatives.
General and Administrative
GENERAL AND ADMINISTRATIVE
General and administrative expense consists primarily of personnel costs and shared costs for our executive, finance, human resources, legal,information technology, and information technologylegal organizations, and professional services costs, which consist primarily of legal, auditing, accounting, and other consulting costs. General and administrative expense also includes certain non-recurring general expenses and
impairment losses. Certain facilities, depreciation, benefits, recruiting, and information technology costs are allocated to other organizations based on headcount. We expect general and administrative expense to increase in absolute dollars due toover time as we increase the size of our general and administrative organizations and incur additional costs associated with accounting, compliance, insurance, and investor relations,to support our business growth, although our general and administrative expense may fluctuate as a percentage of total revenue.
|
| | | | | | | | | | | | | | | | | | | | | | | | | | | | | |
| | Year Ended July 31, | | | | Year Ended July 31, | | |
| | 2017 | | 2016 | | Change | | 2016 | | 2015 | | Change |
| | Amount | | Amount | | Amount | | % | | Amount | | Amount | | Amount | | % |
| | (dollars in millions) |
| General and administrative | $ | 198.3 |
| | $ | 138.4 |
| | $ | 59.9 |
| | 43.3 | % | | $ | 138.4 |
| | $ | 101.6 |
| | $ | 36.8 |
| | 36.2 | % |
| Number of employees at period end | 557 |
| | 436 |
| | 121 |
| | 27.8 | % | | 436 |
| | 295 |
| | 141 |
| | 47.8 | % |
| | | | | | | | | | | | | | | | | | | | | | | | | | | | | | | | | | | | | | | | | | | | | | | |
| | Year Ended July 31, | | | | Year Ended July 31, | | |
| | 2023 | | 2022 | | Change | | 2022 | | 2021 | | Change |
| Amount | | Amount | | Amount | | % | | Amount | | Amount | | Amount | | % |
| | | | | | | | | | | | | | | |
| | (dollars in millions) |
| General and administrative | $ | 447.7 | | | $ | 405.0 | | | $ | 42.7 | | | 10.5 | % | | $ | 405.0 | | | $ | 391.1 | | | $ | 13.9 | | | 3.6 | % |
| | | | | | | | | | | | | | | |
General and administrative expenseexpenses increased for fiscal 20172023 compared to fiscal 20162022 primarily due to an increase inincreased personnel costs, which grew $29.3 million to $128.1$23.2 million, largely due to headcount growth, and a fiscal 2017 impairment loss of $20.9 million on property and equipmentshare-based compensation related to the relocation of our corporate headquarters. We expect to recognize a loss of approximately $15.4 million on the lease of our previous headquarter facilities in the first quarter of fiscal 2018, when we officially cease use of such facilities. Refer to Note 9. Commitmentsrecent acquisitions and Contingencies and Note 18. Subsequent Events in Part II, Item 8 of this Annual Report on Form 10-K for more information.headcount growth. The remaining increase for fiscal 2017 was primarily driven by an increase in allocated costs due to our expansion of facilities to support the growth of our business.
Generalgeneral and administrative expense was further driven by slightly higher reserves due to increased receivables as a result of our business growth.
INTEREST EXPENSE
Interest expense primarily consists of interest expense related to our 0.75% Convertible Senior Notes due 2023 (the “2023 Notes”) and the 0.375% Convertible Senior Notes due 2025 (the “2025 Notes,” and together with “2023 Notes,” the “Notes”).
| | | | | | | | | | | | | | | | | | | | | | | | | | | | | | | | | | | | | | | | | | | | | | | |
| | Year Ended July 31, | | | | Year Ended July 31, | | |
| | 2023 | | 2022 | | Change | | 2022 | | 2021 | | Change |
| Amount | | Amount | | Amount | | % | | Amount | | Amount | | Amount | | % |
| | | | | | | | | | | | | | | |
| | (dollars in millions) |
| Interest expense | $ | 27.2 | | | $ | 27.4 | | | $ | (0.2) | | | (0.7) | % | | $ | 27.4 | | | $ | 163.3 | | | $ | (135.9) | | | (83.2) | % |
Interest expense remained relatively flat for fiscal 20162023 compared to fiscal 2015 primarily due to an increase in personnel costs, which grew $32.9 million to $96.5 million, largely due to headcount growth.2022.
OTHER INCOME, NET
Other income, net includes interest income earned on our cash, cash equivalents, and investments, and gains and losses from foreign currency remeasurement gains and losses, and foreign currency transaction gains and losses.transactions.
|
| | | | | | | | | | | | | | | | | | | | | | | | | | | |
| | Year Ended July 31, | | | | Year Ended July 31, | | |
| | 2017 | | 2016 | | Change | | 2016 | | 2015 | | Change |
| | Amount | | Amount | | Amount | | % | | Amount | | Amount | | Amount | | % |
| | (dollars in millions) |
| Other income, net | $ | 10.2 |
| | $ | 8.4 |
| | $ | 1.8 |
| | NM | | $ | 8.4 |
| | $ | 0.2 |
| | $ | 8.2 |
| | NM |
| | | | | | | | | | | | | | | | | | | | | | | | | | | | | | | | | | | | | | | | | | | | | | | |
| | Year Ended July 31, | | | | Year Ended July 31, | | |
| | 2023 | | 2022 | | Change | | 2022 | | 2021 | | Change |
| Amount | | Amount | | Amount | | % | | Amount | | Amount | | Amount | | % |
| | | | | | | | | | | | | | | |
| | (dollars in millions) |
| Other income, net | $ | 206.2 | | | $ | 9.0 | | | $ | 197.2 | | | 2,191.1 | % | | $ | 9.0 | | | $ | 2.4 | | | $ | 6.6 | | | 275.0 | % |
Other income, net increased for fiscal 20172023 compared to fiscal 20162022 primarily due to an increase inhigher interest income partially offset by increased foreign currency remeasurement losses.
Other income, net increasedas a result of higher interest rates and higher average cash, cash equivalent, and investments balances for fiscal 20162023 compared to fiscal 2015 due to an increase in interest income and higher foreign currency remeasurement gains.2022.
Provision for Income Taxes
PROVISION FOR INCOME TAXES
Provision for income taxes consists primarily of U.S. taxes driven by capitalization of research and development expenditures, foreign income taxes, in foreign jurisdictions in which we conduct business,and withholding taxes, federal and state income taxes in the United States, and amortization of our deferred tax charges.taxes. We maintain a full valuation allowance for domestic and certain foreign deferred tax assets, including net operating loss carryforwards and certain domestic tax credits.
In recent years, we reorganized our corporate structure and intercompany relationships to more closely align with the international nature of our business activities. Our corporate structurevaluation allowance has caused, and may continue to cause, disproportionate relationships between our overall effective tax rate and other jurisdictional measures. We regularly evaluate the need for a valuation allowance. Due to recent profitability, a reversal of our valuation allowance in certain jurisdictions in the foreseeable future is reasonably possible.
| | | | | | | | | | | | | | | | | | | | | | | | | | | | | | | | | | | | | | | | | | | | | | | |
| | Year Ended July 31, | | | | | | Year Ended July 31, | | | | |
| | 2023 | | 2022 | | Change | | 2022 | | 2021 | | Change |
| | Amount | | Amount | | Amount | | % | | Amount | | Amount | | Amount | | % |
| | | | | | | | | | | | | | | |
| | (dollars in millions) |
| Provision for income taxes | $ | 126.6 | | | $ | 59.8 | | | $ | 66.8 | | | 111.7 | % | | $ | 59.8 | | | $ | 33.9 | | | $ | 25.9 | | | 76.4 | % |
| Effective tax rate | 22.4 | % | | (28.9) | % | | | | | | (28.9) | % | | (7.3) | % | | | | |
|
| | | | | | | | | | | | | | | | | | | | | | | | | | | | | |
| | Year Ended July 31, | | | | | | Year Ended July 31, | | | | |
| | 2017 | | 2016 | | Change | | 2016 | | 2015 | | Change |
| | Amount | | Amount | | Amount | | % | | Amount | | Amount | | Amount | | % |
| | (dollars in millions) |
Provision for income taxes(1) | $ | 22.5 |
| | $ | 20.4 |
| | $ | 2.1 |
| | 10.3 | % | | $ | 20.4 |
| | $ | 9.4 |
| | $ | 11.0 |
| | 117.0 | % |
Effective tax rate(1) | (11.6 | )% | | (11.8 | )% | | | | | | (11.8 | )% | | (7.7 | )% | | | | |
______________
| |
(1) | Prior period amounts have been adjusted due to our voluntary change in accounting policy for sales commissions. Refer to Note 1. Description of Business and Summary of Significant Accounting Policies in Part II, Item 8 of this Annual Report on Form 10-K for more information. |
We recorded an income taxOur provision for income taxes for fiscal 20172023 was primarily due to foreignU.S. federal and state income taxes, withholding taxes, and amortization of our deferredforeign income taxes. Our effective tax charges. The provision for income taxes increasedrate varied for fiscal 20172023 compared to fiscal 20162022, primarily due to increases in foreign withholding taxes and U.S. income taxes related to intercompany transactions, offset by tax benefits from our adoption of new share-based payment accounting guidanceprofitability in fiscal 2017.
We recorded an income tax provision for fiscal 2016 due to federal, state,2023 and foreign income taxes, withholding taxes, and amortization of our deferred tax charges. The provision for income taxes increased for fiscal 2016 compared to fiscal 2015 primarily due to an increase in foreignU.S. taxes driven by capitalization of research and amortizationdevelopment expenditures with no offsetting deferred benefit due to our valuation allowance. This increase was offset by releases of our deferreduncertain tax charges.positions during fiscal 2023 resulting from tax settlements. Refer to Note 15. Income Taxes in Part II, Item 8 of this Annual Report on Form 10-K for more information.
Liquidity and Capital Resources
| | | | | | | | July 31, |
| | July 31, | | 2023 | | 2022 |
| | 2017 | | 2016 | | | | |
| | (in millions) | | (in millions) |
Working capital(1) | $ | 775.0 |
| | $ | 927.2 |
| Working capital(1) | $ | (1,689.5) | | | $ | (1,891.4) | |
| Cash, cash equivalents, and investments: | | | | Cash, cash equivalents, and investments: | |
| Cash and cash equivalents | $ | 744.3 |
| | $ | 734.4 |
| Cash and cash equivalents | $ | 1,135.3 | | | $ | 2,118.5 | |
| Investments | 1,420.0 |
| | 1,204.0 |
| Investments | 4,302.6 | | | 2,567.9 | |
| Total cash, cash equivalents, and investments | $ | 2,164.3 |
| | $ | 1,938.4 |
| Total cash, cash equivalents, and investments | $ | 5,437.9 | | | $ | 4,686.4 | |
______________
| |
(1) | Prior period amount has been adjusted due to our voluntary change in accounting policy for sales commissions. Refer to Note 1. Description(1)Current liabilities included net carrying amounts of convertible senior notes of $2.0 billion and $3.7 billion as of Business and Summary of Significant Accounting Policies in Part II, Item 8 of this Annual Report on Form 10-K for more information. |
At July 31, 2017,2023 and 2022, respectively. Refer to Note 10. Debt in Part II, Item 8 of this Annual Report on Form 10-K for information on the Notes.
As of July 31, 2023, our total cash, cash equivalents, and investments of $2.2$5.4 billion were held for general corporate purposes, of which approximately $223.0 million was held outside of the United States.purposes. As of July 31, 2017,2023, we had no unremitted earnings when evaluating our outside basis differencesdifference relating to our U.S. investment in foreign subsidiaries; accordingly,subsidiaries. However, there is no restrictioncould be local withholding taxes due to various foreign countries if certain lower tier earnings are distributed. Withholding taxes that would be payable upon remittance of these lower tier earnings are not expected to be material.
DEBT
In July 2018, we issued the 2023 Notes with an aggregate principal amount of $1.7 billion. The 2023 Notes were converted prior to or settled on the use of these funds.
Asmaturity date of July 31, 2017, all1, 2023. During fiscal 2023, we repaid in cash $1.7 billion in aggregate principal amount of the 2023 Notes remained outstanding.and issued 11.4 million shares of common stock to the holders for the conversion value in excess of the principal amount of the 2023 Notes converted, which were fully offset by shares we received from our exercise of the associated note hedges. In June 2020, we issued the 2025 Notes with an aggregate principal amount of $2.0 billion. The 2025 Notes mature on JulyJune 1, 2019,2025; however, prior to January 1, 2019,under certain circumstances, holders may surrender their 2025 Notes for early conversion under certain circumstances.prior to the applicable maturity date. Upon conversion of the 2025 Notes, we will pay cash equal to the aggregate principal amount of the 2025 Notes to be converted, and, at our election, will pay or deliver cash and/or shares of our common stock for the amount of our conversion obligation in excess of the aggregate principal amount of the 2025 Notes being converted. The sale price condition for the 2025 Notes was met during the fiscal quarter ended July 31, 2023, and as a result, holders may convert their 2025 Notes during the fiscal quarter ending October 31, 2023. If all of the holders convert their 2025 Notes during this period, we would be obligated to settle the $2.0 billion principal amount of the 2025 Notes in cash. We believe that our cash provided by operating activities, our existing cash, cash equivalents and investments, and existing sources of and access to financing will be sufficient to meet our anticipated cash needs should the holders choose to convert their 2025 Notes during the fiscal quarter ending October 31, 2023 or hold the 2025 Notes until maturity on June 1, 2025. As of July 31, 2023, substantially all of our 2025 Notes remained outstanding. Refer to Note 8. Convertible Senior Notes included10. Debt in Part II, Item 8 of this Annual Report on Form 10-K for more information on the Notes.
In August 2016,April 2023, we entered into a new credit agreement (the “2023 Credit Agreement”) that provides for a $400.0 million unsecured revolving credit facility (the “2023 Credit Facility”), with an option to increase the amount of the 2023 Credit Facility by up to an additional $350.0 million, subject to certain conditions. The interest rates and commitment fees are also subject to upward and downward adjustments based on our progress towards the achievement of certain sustainability goals related to greenhouse gas emissions. As of July 31, 2023, there were no amounts outstanding, and we were in compliance with all covenants under the 2023 Credit Agreement. Refer to Note 10. Debt in Part II, Item 8 of this Annual Report on Form 10-K for more information on the Credit Agreement.
CAPITAL RETURN
In February 2019, our board of directors authorized a $500.0 million$1.0 billion share repurchase program. In December 2020, August 2021, and in February 2017,August 2022, our board of directors authorized a $500.0additional $700.0 million, increase$676.1 million, and $915.0 million increases to ourthis share repurchase program, respectively, bringing the total authorization under this share repurchase program to $1.0$3.3 billion. Repurchases arewill be funded from available working capital and may be made at management’s discretion from time to time. The expiration date of this repurchase authorization will expire onwas extended to December 31, 2018,2023, and our repurchase program may be suspended or discontinued at any time. As of July 31, 2017, $580.02023, $750.0 million wasremained available for future share repurchases under thethis repurchase authorization.program. Refer to Note 10.13. Stockholders’ Equity in Part II, Item 8 of this Annual Report on Form 10-K for information on these repurchase programs.
LEASES AND OTHER MATERIAL CASH REQUIREMENTS
We have entered into various non-cancelable operating leases primarily for our facilities with original lease periods expiring through the repurchase authorization.year ending July 31, 2033, with the most significant leases relating to our corporate headquarters in Santa Clara, California. As of July 31, 2023, we have total operating lease obligations of $339.4 million recorded on our consolidated balance sheet.
As of July 31, 2023, our commitments to purchase products, components, cloud and other services totaled $1.8 billion. Refer to Note 12. Commitments and Contingencies in Part II, Item 8 of this Annual Report on Form 10-K for more information on these commitments.
CASH FLOWS
The following table summarizes our cash flows for the years ended July 31, 2017, 2016,2023, 2022, and 2015:2021:
| | | | | | | | | | | | | | | | | |
| Year Ended July 31, |
| 2023 | | 2022 | | 2021 |
| | | | | |
| (in millions) |
| Net cash provided by operating activities | $ | 2,777.5 | | | $ | 1,984.7 | | | $ | 1,503.0 | |
| Net cash used in investing activities | (2,033.8) | | | (933.4) | | | (1,480.6) | |
| Net cash used in financing activities | (1,726.3) | | | (806.6) | | | (1,104.0) | |
| Net increase (decrease) in cash, cash equivalents, and restricted cash | $ | (982.6) | | | $ | 244.7 | | | $ | (1,081.6) | |
|
| | | | | | | | | | | |
| | Year Ended July 31, |
| 2017 | | 2016 | | 2015 |
| | (in millions) |
Net cash provided by operating activities(1) | $ | 868.5 |
| | $ | 658.6 |
| | $ | 352.8 |
|
| Net cash used in investing activities | (472.6 | ) | | (338.9 | ) | | (679.0 | ) |
Net cash provided by (used in) financing activities(1) | (386.0 | ) | | 38.9 |
| | 48.2 |
|
| Net increase (decrease) in cash and cash equivalents | $ | 9.9 |
| | $ | 358.6 |
| | $ | (278.0 | ) |
______________
| |
(1) | Prior period amounts have been adjusted due to our early adoption of new share-based payment accounting guidance. Refer to Note 1. Description of Business and Summary of Significant Accounting Policies in Part II, Item 8 of this Annual Report on Form 10-K for more information. |
Cash from operations could be affected by various risks and uncertainties detailed in Part I, Item 1A “Risk Factors” in this Form 10-K. We believe that our cash flow from operations with existing cash and cash equivalents will be sufficient to meet our anticipated cash needs for at least the next 12 months and thereafter for the foreseeable future. Our future capital requirements will depend on many factors including our growth rate, the timing and extent of spending to support development efforts, the expansion of sales and marketing activities, the introduction of new and enhanced products and subscription and support offerings, the costs to acquire or invest in complementary businesses and technologies, the costs to ensure access to adequate manufacturing capacity, the investments in our new corporate headquarters, andinfrastructure to support the adoption of our cloud-based subscription offerings, the repayment obligations associated with our Notes, the continuing market acceptance of our products and subscription and support offerings.offerings and macroeconomic events. In addition, from time to time, we may incur additional tax liability in connection with certain corporate structuring decisions.
We may also choose to seek additional equity or debt financing. In the event that additional financing is required from outside sources, we may not be able to raise it on terms acceptable to us or at all. If we are unable to raise additional capital when desired, our business, operating results, and financial condition may be adversely affected.
Operating ActivitiesOPERATING ACTIVITIES
Our operating activities have consisted of net lossesincome (losses) adjusted for certain non-cash items and changes in assets and liabilities. Our largest source of cash provided by our operations is receipts from our billings.
Cash provided by operating activities induring fiscal 20172023 was $868.5 million,$2.8 billion, an increase of $209.9$792.8 million compared to fiscal 2016.2022. The increase was primarily due to growth of our business as reflected by an increase in billings, and an increaseincreases in collections onaccounts receivable during fiscal 2017.
Cash provided by operating activities in fiscal 2016 was $658.6 million, an increase of $305.8 million compared to fiscal 2015. The increase was due to growth of our business and changes in our assets and liabilities during fiscal 2016, which included an increase in sales of subscription and support contracts to new and existing customers as reflected by an increase in deferred revenue, and was2023, partially offset by an increase in accounts receivable duehigher cash expenditure to an increase in sales near the end of the period.support our business growth.
Investing ActivitiesINVESTING ACTIVITIES
Our investing activities have consisted of capital expenditures, net investment purchases, sales, and maturities, and business acquisitions. We expect to continue such activities as our business grows.
Cash used in investing activities during fiscal 20172023 was $472.6 million,$2.0 billion, an increase of $133.7 million$1.1 billion compared to fiscal 2016,2022. The increase was primarily due to increased investmentan increase in facilities to support the growthpurchases of our businessinvestments and aan increase in net cash payment of $90.7 millionpayments for our acquisition of LightCyber,business acquisitions, partially offset by lower net purchasesan increase in proceeds from sales and maturities of available-for-sale investments during fiscal 2017.2023.
Cash used in investing activities during fiscal 2016 was $338.9 million, a decrease of $340.1 million compared to fiscal 2015, due to lower net purchases of available-for-sale investments and a payment of $15.1 million related to our acquisition of CirroSecure in fiscal 2015, partially offset by increased investment in infrastructure and facilities to support the growth of our business.
Financing ActivitiesFINANCING ACTIVITIES
Our financing activities have consisted of cash used to repurchase shares of our common stock, proceeds from sales of shares through employee equity incentive plans, cash used to repurchase shares of our common stock, and payments for tax withholding obligations of certain employees related to the net share settlement of equity awards.
Cash used in financing activities during fiscal 20172023 was $386.0 million, a change$1.7 billion, an increase of $424.9$919.7 million compared to fiscal 2016,2022. The increase was primarily due to the repurchaserepayments of $411.0 millionour 2023 Notes upon maturity, partially offset by a decrease in repurchases of our common stock and payments for tax withholding obligations of certain employees related to the net share settlement of equity awards of $21.4 million during fiscal 2017.2023.
Cash provided by financing activities during fiscal 2016 was $38.9 million, a decrease of $9.3 million compared to fiscal 2015, due to a payment of deferred consideration related to our acquisition of Cyvera and lower proceeds from the sale of shares through employee equity incentive plans.
Contractual Obligations and Commitments
The following summarizes our contractual obligations and commitments as of July 31, 2017:
|
| | | | | | | | | | | | | | | | | | | |
| | Payments Due by Period |
| | Total | | Less Than 1
Year | | 1-3 Years | | 3-5 Years | | More Than 5
Years |
| | | | (in millions) | | |
| 0.0% Convertible Senior Notes due 2019 | $ | 575.0 |
| | $ | — |
| | $ | 575.0 |
| | $ | — |
| | $ | — |
|
Operating lease obligations(1) | 517.5 |
| | 31.0 |
| | 110.8 |
| | 111.2 |
| | 264.5 |
|
Purchase obligations(2) | 104.1 |
| | 98.5 |
| | 5.6 |
| | — |
| | — |
|
Total(3) | $ | 1,196.6 |
| | $ | 129.5 |
| | $ | 691.4 |
| | $ | 111.2 |
| | $ | 264.5 |
|
______________
| |
(1) | Consists of contractual obligations from our non-cancelable operating leases. Excludes contractual sublease proceeds of $2.1 million, which will be received in less than one year. Refer to Note 9. Commitments and Contingencies of Notes to Consolidated Financial Statements included in Part II, Item 8 of this Annual Report on Form 10-K for more information on our operating leases. |
| |
(2) | Consists of minimum purchase commitments of products and components with our manufacturing partners and component suppliers. Obligations under contracts that we can cancel without a significant penalty are not included in the table above. |
| |
(3) | No amounts related to income taxes are included. As of July 31, 2017, we had approximately $62.2 million of tax liabilities recorded related to uncertainty in income tax positions. |
Off-Balance Sheet Arrangements
Through July 31, 2017, we did not have any relationships with unconsolidated organizations or financial partnerships, such as structured finance or special purpose entities that would have been established for the purpose of facilitating off-balance sheet arrangements or other contractually narrow or limited purposes.
Critical Accounting Estimates
Our consolidated financial statements have been prepared in accordance with U.S. GAAP. The preparation of these consolidated financial statements requires us to make estimates and assumptions that affect the reported amounts of assets, liabilities, revenue, expenses, and related disclosures. We base our estimates on historical experience and on various other assumptions that we believe are reasonable under the circumstances. We evaluate our estimates and assumptions on an ongoing basis. Actual results maycould differ materially from these estimates.those estimates due to risks and uncertainties, including uncertainty in the current economic environment. To the extent that there are material differences between these estimates and our actual results, our future consolidated financial statements will be affected.
TheWe believe that of our significant accounting policies described in Note 1. Description of Business and Summary of Significant Accounting Policies in Part II, Item 8 of this Annual Report on Form 10-K, the critical accounting policies requiring estimates, assumptions, and judgments that we believe have the most significant impact on our consolidated financial statements are described below.
We recognize revenue when persuasive evidence
REVENUE RECOGNITION
The majority of our arrangements, other than renewalscontracts with our customers include various combinations of our products and subscriptions and support. Our appliances and software licenses have significant standalone functionalities and capabilities. Accordingly, these appliances and software licenses are distinct from our subscriptions and support contracts,services as the customer can benefit from the product without these services and such services are multiple-element arrangementsseparately identifiable within the contract. We account for multiple agreements with a combinationsingle customer as a single contract if the contractual terms and/or substance of hardware, software, subscriptions, support, and other services. For multiple-element arrangements,those agreements indicate that they may be so closely related that they are, in effect, parts of a single contract. The amount of consideration we allocate revenueexpect to receive in exchange for delivering on the contract is allocated to each unit of accountingperformance obligation based on an estimatedits relative standalone selling price at the arrangement inception. The estimated selling price for each element is based upon the following hierarchy:
Vendor-specific objective evidence (“VSOE”) of selling price, if available,
Third-party evidence (“TPE”) of selling price, if VSOE of selling price is not available, or
Best estimate of selling price (“BESP”), if neither VSOE of selling price nor TPE of selling price are available.price.
We establish VSOE ofstandalone selling price using the prices charged for a deliverable when sold separately. We establish TPE ofIf the standalone selling price by evaluating similar and interchangeable competitor products or services inis not observable through past transactions, we estimate the standalone arrangements with similarly situated partners. We establish BESP primarily based on historical transaction pricing, whereby historical transactions are segregatedselling price based on our pricing model and our go-to-market strategy, which include factors such as type of sales channel (reseller, distributor,(channel partner or end-customer), the geographies in which our products and servicesofferings were sold (domestic or international), and offering type (products, subscriptions, or services)support). To further support BESP as determined by the historical transaction pricing or when such information is unavailable, such as when there are limited sales of a new product or service, we consider the same factors we have established through our pricing model and go-to-market strategy. The determination of BESP is made through consultation with and approval by our management. In determining BESP, we rely on certain assumptions and apply significant judgment. As our business offerings evolve over time, we may be required to modify our estimated standalone selling prices, in subsequent periods, and as a result the timing and classification of our revenue recognition could be affected.
Income Taxes
INCOME TAXES
We account for income taxes using the asset and liability method, which requires the recognition of deferred tax assets and liabilities for the expected future tax consequences of events that have been recognized in our consolidated financial statements or tax returns. In addition, deferred tax assets are recorded for theall future benefit of utilizingbenefits including, but not limited to, net operating losses, and research and development credit carryforwards.carryforwards, and basis differences relating to our global intangible low-taxed income. Valuation allowances are provided when necessary to reduce deferred tax assets to the amount expectedmore likely than not to be realized.
Significant judgment is required in determining any valuation allowance recorded against deferred tax assets. In assessing the need for a valuation allowance, we consider all available evidence, including past operating results, estimates of future taxable income, and the feasibility of tax planning strategies. In the event that we change our determination as to the amount of deferred tax assets that can be realized, we will adjust our valuation allowance with a corresponding impact to the provision for income taxes in the period in which such determination is made.
We apply the authoritative accounting guidance prescribing a threshold and measurement attribute for the financial recognition and measurement of a tax position taken or expected to be taken in a tax return. We recognize liabilities for uncertain tax positions based on a two-step process. The first step is to evaluate the tax position for recognition by determining if the weight of available evidence indicates that it is more likely than not that the position will be sustained on audit, including resolution of related appeals or litigation processes, if any. The second step requires us to estimate and measure the tax benefit as the largest amount that is more likely than not to be realized upon ultimate settlement.
Significant judgment is also required in evaluating our uncertain tax positions and determining our provision for income taxes. Although we believe our reserves are reasonable, no assurance can be given that the final tax outcome of these matters will not be different from that which is reflected in our historical income tax provisions and accruals. We adjust these reserves in light of changing facts and circumstances, such as the closing of a tax audit or the refinement of an estimate. To the extent that the final tax outcome of these matters is different than the amounts recorded, such differences may impact the provision for income taxes in the period in which such determination is made.
Manufacturing Partner and Supplier Liabilities
MANUFACTURING PARTNER AND SUPPLIER LIABILITIES
We outsource most of our manufacturing, repair, and supply chain management operations to our EMS provider, which procures components and assembles our products based on our demand forecasts. These forecasts of future demand are based upon historical trends and analysis from our sales and product management functions as adjusted for overall market conditions. We accrue for costs for manufacturing purchase commitments in excess of our forecasted demand, including costs for excess components or for carrying costs incurred by our manufacturing partners and component suppliers. Actual component usage and product demand may be materially different from our forecast and could be caused by factors outside of our control, which could have an adverse impact on our results of operations. To date,Through July 31, 2023, we have not accrued significant costs associated with this exposure.
Loss Contingencies
LOSS CONTINGENCIES
We are subject to the possibility of various loss contingencies arising in the ordinary course of business. We accrue for loss contingencies when it is probable that an asset has been impaired or a liability has been incurred and the amount of loss can be reasonably estimated. If we determine that a loss is possible and the range of the loss can be reasonably determined,possible, then we disclose the possible loss or range of the possible loss.loss or state that such an estimate cannot be made. We regularly evaluate current information available to us to determine whether an accrual is required, an accrual should be adjusted, or a range of possible loss should be disclosed.
From time to time, we are involved in disputes, litigation, and other legal actions. However, there are many uncertainties associated with any litigation, and these actions or other third-party claims against us may cause us to incur substantial settlement charges, which are inherently difficult to estimate and could adversely affect our results of operations. The actual liability in any such matters may be materially different from our estimates, which could result in the need to adjust our liability and record additional expenses.
Goodwill, Intangibles, and Other Long-Lived Assets
We make significant estimates, assumptions, and judgments when valuing goodwill and other purchased intangible assets in connection with the initial purchase price allocation of an acquired entity, as well as when evaluating impairment of goodwill and other purchased intangible assets on an ongoing basis. These estimates are based upon a number of factors, including historical experience, market conditions, and information obtained from the management of the acquired company. Critical estimates in valuing certain intangible assets include, but are not limited to, cash flows that an asset is expected to generate in the future, discount rates, the time and expense that would be necessary to recreate the assets, and the profit margin a market participant would receive. The amounts and useful lives assigned to identified intangible assets impacts the amount and timing of future amortization expense.
We evaluate goodwill for impairment on an annual basis in our fourth fiscal quarter or more frequently if we believe impairment indicators exist. We have elected to first assess qualitative factors to determine whether it is more likely than not that the fair value of our reporting unit is less than its carrying amount, including goodwill. The qualitative assessment includes our evaluation of relevant events and circumstances affecting our single reporting unit, including macroeconomic, industry, and market conditions, our overall financial performance, and trends in the market price of our common stock. If qualitative factors indicate that it is more likely than not that our reporting unit’s fair value is less than its carrying amount, then we will perform the quantitative impairment test by comparing our reporting unit’s carrying amount, including goodwill, to its fair value. If the carrying amount of our reporting unit exceeds its fair value, an impairment loss will be recognized in an amount equal to that excess. To date, the results of our qualitative assessment have indicated that the quantitative goodwill impairment test is not necessary.
We evaluate long-lived assets, such as property, equipment, and purchased intangible assets for impairment whenever events or changes in circumstances indicate that the carrying amount of the assets may not be recoverable. Such events or changes in circumstances include, but are not limited to, a significant decrease in the fair value of the underlying asset or asset group, a significant decrease in the benefits realized from the acquired assets, difficulty and delays in integrating the business, or a significant change in the operations of the acquired assets or use of an asset or asset group. A long-lived asset is considered impaired if its carrying amount exceeds the estimated future undiscounted cash flows the asset or asset group is expected to generate. Critical estimates in determining whether a long-lived asset is considered impaired include the amount and timing of future cash flows that the asset or asset group is expected to generate. If a long-lived asset is considered to be impaired, the impairment to be recognized is the amount by which the carrying amount of the asset exceeds the fair value of the asset or asset group, which is estimated using a present value technique. Critical estimates in determining the fair value of an asset or asset group and the amount of impairment to recognize include, but are not limited Refer to the amount and timing of future cash flows that the asset or asset group is expected to generate and the discount rate. Determining the fair value of an asset or asset group is highly judgmental in nature and involves the use of significant estimates and assumptions for market participants. We base our fair value estimates on assumptions we believe to be reasonable but that are unpredictable and inherently uncertain. Actual future results may differ from those estimates.
To date, we have not recognized any impairment losses on our goodwill and intangible assets. In fiscal 2017, we recognized an impairment loss of $20.9 million on property and equipment related to the relocation of our corporate headquarters. We did not recognize any impairment losses on our other long-lived assets prior to fiscal 2017.
Recent Accounting Pronouncements
Refer to “Recently Issued Accounting Pronouncements”“Litigation” subheading in Note 1. Description of Business12. Commitments and Summary of Significant Accounting Policies of Notes to Consolidated Financial Statements includedContingencies in Part II, Item 8 of this Annual Report on Form 10-K.10-K for more information regarding our litigation.
| |
ITEM 7A. | QUANTITATIVE AND QUALITATIVE DISCLOSURES ABOUT MARKET RISK |
Item 7A. Quantitative and Qualitative Disclosures About Market Risk
Foreign Currency Exchange Risk
Our sales contracts are primarily denominated in U.S. dollars. A portion of our operating expensesexpenditures are incurred outside of the United States and are denominated in foreign currencies and are subject to fluctuations due to changes in foreign currency exchange rates, particularly changes in the euro, British pound, Singapore dollar, Israeli shekel, and Japanese yen.rates. Additionally, fluctuations in
foreign currency exchange rates may cause us to recognize transaction gains and losses in our statement of operations. The effect of an immediate 10% adverse change in foreign exchange rates on monetary assets and liabilities at July 31, 20172023 would not be material to our financial condition or results of operations. As of July 31, 2017,2023, foreign currency transaction gains and losses and exchange rate fluctuations have not been material to our consolidated financial statements. We enter into foreign currency derivative contracts with maturities of 1224 months or less, which we designate as cash flow hedges, to manage the foreign currency exchange rate risk associated with our foreign currency denominated operating expenditures. The effectiveness of our existing hedging transactions and the availability and effectiveness of any hedging transactions we may decide to enter into in the future may be limited, and we may not be able to successfully hedge our exposure, which could adversely affect our financial condition and operating results. Refer to Note 4.6. Derivative Instruments in Part II, Item 8 of this Annual Report on Form 10-K for more information.
As our international operations grow, our risks associated with fluctuationfluctuations in foreign currency exchange rates will become greater, and we will continue to reassess our approach to managing this risk. In addition, a weakening U.S. dollar can increase the costs of our international expansion and a strengthening U.S. dollar can increase the real cost of our products and services to our end-customers outside of the United States, leading to delays in the purchase of our products and services. For additional information, see the risk factor entitled “We“We are exposed to fluctuations in foreign currency exchange rates, which could negatively affect our financial condition and operating results”results.” in Part 1, Item 1A of this Annual Report on Form 10-K.
Interest Rate Risk
The primary objectives of our investment activities are to preserve principal, provide liquidity, and maximize income without significantly increasing risk. SomeMost of the securities we invest in are subject to interest rate risk. To minimize this risk, we maintain oura diversified portfolio of cash, cash equivalents, and short-term investments, inconsisting only of investment-grade securities. To assess the interest rate risk, we performed a variety of securities, including commercial paper, money market funds, U.S. government and agency securities, and corporate debt securities. Duesensitivity analysis to determine the short duration and conservative nature of our investment portfolio,impact a movement of 10%change in market interest rates would not have on the value of the investment portfolio. Based on investment positions as of July 31, 2023, a material impact on our operating results andhypothetical 100 basis point increase in interest rates across all maturities would result in a $55.5 million decline in the totalfair market value of the portfolio. The effect of an immediate 10% changeSuch losses would only be realized if we sold the investments prior to maturity. Conversely, a hypothetical 100 basis point decrease in interest rates at July 31, 2017 would not have been materiallead to our operating results anda $55.5 million increase in the totalfair market value of the portfolio assuming consistent investment levels.
Market Risk and Market Interest Riskportfolio.
In June 2014,2020, we issued $575.0 million$2.0 billion aggregate principal amount of 0.0%0.375% Convertible Senior Notes due 20192025 (the “Notes”“2025 Notes”). We carry this instrumentthese instruments at face value less unamortized discount and unamortized issuance costs on our consolidated balance sheets. As this instrument does not bearthese instruments have a fixed annual interest rate, we have no financial and economic interest exposure associated with changes in interest rates. However, the fair value of fixed rate debt instruments fluctuates when interest rates change, and additionally, in the case of the 2025 Notes, when the market price of our common stock fluctuates.
Item 8. Financial Statements and Supplementary Data
| |
ITEM 8. | FINANCIAL STATEMENTS AND SUPPLEMENTARY DATA |
INDEX TO CONSOLIDATED FINANCIAL STATEMENTS
Index To Consolidated Financial Statements
Report of Independent Registered Public Accounting Firm
REPORT OF INDEPENDENT REGISTERED PUBLIC ACCOUNTING FIRM
TheTo the Stockholders and the Board of Directors and Stockholders
of Palo Alto Networks, Inc.
Opinion on the Financial Statements
We have audited the accompanying consolidated balance sheets of Palo Alto Networks, Inc. (the Company) as of July 31, 20172023 and 2016, and2022, the related consolidated statements of operations, comprehensive loss,income (loss), stockholders’ equity and cash flows for each of the three years in the period ended July 31, 2017. These2023, and the related notes (collectively referred to as the “consolidated financial statements are the responsibility of the Company’s management. Our responsibility is to express an opinion on these financial statements based on our audits.
We conducted our audits in accordance with the standards of the Public Company Accounting Oversight Board (United States)statements”). Those standards require that we plan and perform the audit to obtain reasonable assurance about whether the financial statements are free of material misstatement. An audit includes examining, on a test basis, evidence supporting the amounts and disclosures in the financial statements. An audit also includes assessing the accounting principles used and significant estimates made by management, as well as evaluating the overall financial statement presentation. We believe that our audits provide a reasonable basis for our opinion.
In our opinion, the consolidated financial statements referred to above present fairly, in all material respects, the consolidated financial position of Palo Alto Networks, Inc.the Company at July 31, 20172023 and 2016,2022, and the consolidated results of its operations and its cash flows for each of the three years in the period ended July 31, 2017,2023, in conformity with U.S. generally accepted accounting principles.
As discussed in Note 1 to the consolidated financial statements, in the second quarter of fiscal 2017, the Company changed its method of accounting for share-based payments as a result of the adoption of the amendments to the FASB Accounting Standards Codification resulting from Accounting Standards Update No. 2016-09, “Improvements to Employee Share-Based Payment Accounting”.
As discussed in Note 1 to the consolidated financial statements, in the first quarter of fiscal 2017, the Company elected to change its method of accounting for sales commissions that are incremental and directly related to non-cancelable customer sales contracts from recording an expense when incurred, to deferral and amortization of the sales commissions over the term of the related contracts in proportion to the recognized revenue.
We also have audited, in accordance with the standards of the Public Company Accounting Oversight Board (United States) (PCAOB), Palo Alto Networks, Inc.’sthe Company’s internal control over financial reporting as of July 31, 2017,2023, based on criteria established in Internal Control-Integrated Framework issued by the Committee of Sponsoring Organizations of the Treadway Commission (2013 framework) and our report dated September 7, 20171, 2023 expressed an unqualified opinion thereon.
Basis for Opinion
These financial statements are the responsibility of the Company’s management. Our responsibility is to express an opinion on the Company’s financial statements based on our audits. We are a public accounting firm registered with the PCAOB and are required to be independent with respect to the Company in accordance with the U.S. federal securities laws and the applicable rules and regulations of the Securities and Exchange Commission and the PCAOB.
We conducted our audits in accordance with the standards of the PCAOB. Those standards require that we plan and perform the audit to obtain reasonable assurance about whether the financial statements are free of material misstatement, whether due to error or fraud. Our audits included performing procedures to assess the risks of material misstatement of the financial statements, whether due to error or fraud, and performing procedures that respond to those risks. Such procedures included examining, on a test basis, evidence regarding the amounts and disclosures in the financial statements. Our audits also included evaluating the accounting principles used and significant estimates made by management, as well as evaluating the overall presentation of the financial statements. We believe that our audits provide a reasonable basis for our opinion.
Critical Audit Matter
The critical audit matter communicated below is a matter arising from the current period audit of the financial statements that was communicated or required to be communicated to the audit committee and that: (1) relates to accounts or disclosures that are material to the financial statements and (2) involved our especially challenging, subjective, or complex judgments. The communication of the critical audit matter does not alter in any way our opinion on the consolidated financial statements, taken as a whole, and we are not, by communicating the critical audit matter below, providing a separate opinion on the critical audit matter or on the accounts or disclosures to which it relates.
REVENUE RECOGNITION
| | | | | |
Description
of the Matter | As described in Note 1 to the consolidated financial statements, the Company’s contracts with customers sometimes contain multiple performance obligations, which are accounted for separately if they are distinct. In such cases, the transaction price is then allocated to the distinct performance obligations on a relative standalone selling price basis, and revenue is recognized when control of the distinct performance obligation is transferred. For example, product revenue is recognized at the time of hardware shipment or delivery of software license, and subscription and support revenue is recognized over time as the services are performed. Auditing the Company’s revenue recognition was complex, including the identification and determination of distinct performance obligations and the timing of revenue recognition. For example, there were nonstandard terms and conditions that required judgment to determine the distinct performance obligations and the impact on the timing of revenue recognition. |
How We Addressed
the Matter in Our Audit | We obtained an understanding, evaluated the design and tested the operating effectiveness of the Company’s process and controls to identify and determine the distinct performance obligations and the timing of revenue recognition. To test the identification and determination of the distinct performance obligations and the timing of revenue recognition, our audit procedures included, among others, reading the executed contract and purchase order to understand the contract, identifying the performance obligation(s), determining the distinct performance obligations, and evaluating the timing of revenue recognition for a sample of individual sales transactions. We evaluated the accuracy of the Company’s contract summary documentation, specifically related to the identification and determination of distinct performance obligations and the timing of revenue recognition. |
| |
| |
| |
/s/ Ernst & Young LLP
We have served as the Company’s auditor since 2009.
San Jose, California
September 1, 2023
Report of Independent Registered Public Accounting Firm
REPORT OF INDEPENDENT REGISTERED PUBLIC ACCOUNTING FIRM
TheTo the Stockholders and the Board of Directors and Stockholders
of Palo Alto Networks, Inc.
Opinion on Internal Control Over Financial Reporting
We have audited Palo Alto Networks, Inc.’s internal control over financial reporting as of July 31, 2017,2023, based on criteria established in Internal Control—Integrated Framework issued by the Committee of Sponsoring Organizations of the Treadway Commission (2013 framework) (the COSO criteria). In our opinion, Palo Alto Networks, Inc.’s (the Company) maintained, in all material respects, effective internal control over financial reporting as of July 31, 2023, based on the COSO criteria.
We also have audited, in accordance with the standards of the Public Company Accounting Oversight Board (United States) (PCAOB), the consolidated balance sheets of the Company as of July 31, 2023 and 2022, the related consolidated statements of operations, comprehensive income (loss), stockholders’ equity and cash flows for each of the three years in the period ended July 31, 2023, and the related notes and our report dated September 1, 2023 expressed an unqualified opinion thereon.
Basis for Opinion
The Company’s management is responsible for maintaining effective internal control over financial reporting and for its assessment of the effectiveness of internal control over financial reporting included in the accompanying Management’s Report on Internal Control Overover Financial Reporting. Our responsibility is to express an opinion on the company’sCompany’s internal control over financial reporting based on our audit. We are a public accounting firm registered with the PCAOB and are required to be independent with respect to the Company in accordance with the U.S. federal securities laws and the applicable rules and regulations of the Securities and Exchange Commission and the PCAOB.
We conducted our audit in accordance with the standards of the Public Company Accounting Oversight Board (United States).PCAOB. Those standards require that we plan and perform the audit to obtain reasonable assurance about whether effective internal control over financial reporting was maintained in all material respects.
Our audit included obtaining an understanding of internal control over financial reporting, assessing the risk that a material weakness exists, testing and evaluating the design and operating effectiveness of internal control based on the assessed risk, and performing such other procedures as we considered necessary in the circumstances. We believe that our audit provides a reasonable basis for our opinion.
Definition and Limitations of Internal Control Over Financial Reporting
A company’s internal control over financial reporting is a process designed to provide reasonable assurance regarding the reliability of financial reporting and the preparation of financial statements for external purposes in accordance with generally accepted accounting principles. A company’s internal control over financial reporting includes those policies and procedures that (1) pertain to the maintenance of records that, in reasonable detail, accurately and fairly reflect the transactions and dispositions of the assets of the company; (2) provide reasonable assurance that transactions are recorded as necessary to permit preparation of financial statements in accordance with generally accepted accounting principles, and that receipts and expenditures of the company are being made only in accordance with authorizations of management and directors of the company; and (3) provide reasonable assurance regarding prevention or timely detection of unauthorized acquisition, use, or disposition of the company’s assets that could have a material effect on the financial statements.
Because of its inherent limitations, internal control over financial reporting may not prevent or detect misstatements. Also, projections of any evaluation of effectiveness to future periods are subject to the risk that controls may become inadequate because of changes in conditions, or that the degree of compliance with the policies or procedures may deteriorate.
In our opinion, Palo Alto Networks, Inc. maintained, in all material respects, effective internal control over financial reporting as of July 31, 2017, based on the COSO criteria.
We also have audited, in accordance with the standards of the Public Company Accounting Oversight Board (United States), the consolidated balance sheets of Palo Alto Networks, Inc. as of July 31, 2017 and 2016, and the related consolidated statements of operations, comprehensive loss, stockholders’ equity and cash flows for each of the three years in the period ended July 31, 2017 of Palo Alto Networks, Inc. and our report dated September 7, 2017 expressed an unqualified opinion thereon.
/s/ Ernst & Young LLP
San Jose, California
September 1, 2023
MANAGEMENT’S REPORT ON INTERNAL CONTROL OVER FINANCIAL REPORTING
Management’s Report on Internal Control Over Financial Reporting
The management of Palo Alto Networks, Inc. (the “Company”) is responsible for establishing and maintaining adequate internal control over financial reporting as defined in Rules 13a-15(f) and 15d-15(f) under the Securities Exchange Act of 1934 for the Company. The Company’s internal control over financial reporting is a process designed under the supervision of the Company’s principal executive and principal financial officers to provide reasonable assurance regarding the reliability of financial reporting and the preparation of the Company’s financial statements for external purposes in accordance with U.S. generally accepted accounting principles.
The Company’s internal control over financial reporting includes those policies and procedures that: (i) pertain to the maintenance of records that, in reasonable detail, accurately and fairly reflect the transactions and dispositions of the assets of the Company; (ii) provide reasonable assurance that transactions are recorded as necessary to permit preparation of financial statements in accordance with U.S. generally accepted accounting principles, and that receipts and expenditures of the Company are being made only in accordance with authorizations of management and directors of the Company; and (iii) provide reasonable assurance regarding prevention or timely detection of unauthorized acquisition, use, or disposition of the Company’s assets that could have a material effect on the Consolidated Financial Statements.
Because of its inherent limitations, internal control over financial reporting may not prevent or detect misstatements. Also, projections of any evaluation of effectiveness to future periods are subject to the risk that controls may become inadequate because of changes in conditions, or that the degree of compliance with the policies or procedures may deteriorate.
Management assessed the effectiveness of the Company’s internal control over financial reporting as of July 31, 2017, based on the framework set forth by the Committee of Sponsoring Organizations of the Treadway Commission (“COSO”) in Internal Control - Integrated Framework (2013 framework). Based on that assessment, management concluded that, as of July 31, 2017, the Company’s internal control over financial reporting was effective.
The effectiveness of the Company’s internal control over financial reporting as of July 31, 2017, has been audited by Ernst & Young LLP, the independent registered public accounting firm that audits the Company’s Consolidated Financial Statements, as stated in their report preceding this report, which expresses an unqualified opinion on the effectiveness of the Company’s internal control over financial reporting as of July 31, 2017.
PALOALTO NETWORKS, INC.
CONSOLIDATED BALANCE SHEETS
(In millions, except per share data)
| | | | July 31, | |
CONSOLIDATED BALANCE SHEETS
(In millions, except per share data) | | CONSOLIDATED BALANCE SHEETS
(In millions, except per share data) |
| | 2017 | | 2016 | | July 31, |
| | | | (As Adjusted) | | 2023 | | 2022 |
| Assets | | | | Assets | | | |
| Current assets: | | | | Current assets: | |
| Cash and cash equivalents | $ | 744.3 |
| | $ | 734.4 |
| Cash and cash equivalents | $ | 1,135.3 | | | $ | 2,118.5 | |
| Short-term investments | 630.7 |
| | 551.2 |
| Short-term investments | 1,254.7 | | | 1,516.0 | |
| Accounts receivable, net of allowance for doubtful accounts of $0.7 and $2.4 at July 31, 2017 and July 31, 2016, respectively | 432.1 |
| | 348.7 |
| |
| Accounts receivable, net of allowance for credit losses of $7.8 and $8.9 at July 31, 2023 and July 31, 2022, respectively | | Accounts receivable, net of allowance for credit losses of $7.8 and $8.9 at July 31, 2023 and July 31, 2022, respectively | 2,463.2 | | | 2,142.5 | |
| Short-term financing receivables, net | | Short-term financing receivables, net | 388.8 | | | 111.3 | |
| Short-term deferred contract costs | | Short-term deferred contract costs | 339.2 | | | 317.7 | |
| Prepaid expenses and other current assets | 169.2 |
| | 139.7 |
| Prepaid expenses and other current assets | 466.8 | | | 208.9 | |
| Total current assets | 1,976.3 |
| | 1,774.0 |
| Total current assets | 6,048.0 | | | 6,414.9 | |
| Property and equipment, net | 211.1 |
| | 117.2 |
| Property and equipment, net | 354.5 | | | 357.8 | |
| Operating lease right-of-use assets | | Operating lease right-of-use assets | 263.3 | | | 242.0 | |
| Long-term investments | 789.3 |
| | 652.8 |
| Long-term investments | 3,047.9 | | | 1,051.9 | |
| Long-term financing receivables, net | | Long-term financing receivables, net | 653.3 | | | 192.1 | |
| Long-term deferred contract costs | | Long-term deferred contract costs | 547.1 | | | 550.1 | |
| Goodwill | 238.8 |
| | 163.5 |
| Goodwill | 2,926.8 | | | 2,747.7 | |
| Intangible assets, net | 53.7 |
| | 44.0 |
| Intangible assets, net | 315.4 | | | 384.5 | |
| Other assets | 169.1 |
| | 106.7 |
| Other assets | 344.8 | | | 312.6 | |
| Total assets | $ | 3,438.3 |
| | $ | 2,858.2 |
| Total assets | $ | 14,501.1 | | | $ | 12,253.6 | |
| Liabilities and stockholders’ equity | | | | Liabilities and stockholders’ equity | | | |
| Current liabilities: | | | | Current liabilities: | |
| Accounts payable | $ | 35.5 |
| | $ | 30.2 |
| Accounts payable | $ | 132.3 | | | $ | 128.0 | |
| Accrued compensation | 117.5 |
| | 73.5 |
| Accrued compensation | 548.3 | | | 461.1 | |
| Accrued and other liabilities | 79.9 |
| | 39.2 |
| Accrued and other liabilities | 390.8 | | | 399.2 | |
| Deferred revenue | 968.4 |
| | 703.9 |
| Deferred revenue | 4,674.6 | | | 3,641.2 | |
| Convertible senior notes, net | | Convertible senior notes, net | 1,991.5 | | | 3,676.8 | |
| Total current liabilities | 1,201.3 |
| | 846.8 |
| Total current liabilities | 7,737.5 | | | 8,306.3 | |
| Convertible senior notes, net | 524.7 |
| | 500.2 |
| |
| | Long-term deferred revenue | 805.1 |
| | 536.9 |
| Long-term deferred revenue | 4,621.8 | | | 3,352.8 | |
| Long-term operating lease liabilities | | Long-term operating lease liabilities | 279.2 | | | 276.1 | |
| Other long-term liabilities | 147.6 |
| | 79.4 |
| Other long-term liabilities | 114.2 | | | 108.4 | |
| Commitments and contingencies (Note 9) |
|
| |
|
| |
| Total liabilities | | Total liabilities | 12,752.7 | | | 12,043.6 | |
| Commitments and contingencies (Note 12) | | Commitments and contingencies (Note 12) | | | |
| | Stockholders’ equity: | | | | Stockholders’ equity: | |
| Preferred stock; $0.0001 par value; 100.0 shares authorized; none issued and outstanding at July 31, 2017 and July 31, 2016 | — |
| | — |
| |
| Common stock and additional paid-in capital; $0.0001 par value; 1,000.0 shares authorized; 91.5 and 90.5 shares issued and outstanding at July 31, 2017 and July 31, 2016, respectively | 1,599.7 |
| | 1,515.5 |
| |
| Accumulated other comprehensive income (loss) | (3.4 | ) | | 1.0 |
| |
| Preferred stock; $0.0001 par value; 100.0 shares authorized; none issued and outstanding at July 31, 2023 and July 31, 2022 | | Preferred stock; $0.0001 par value; 100.0 shares authorized; none issued and outstanding at July 31, 2023 and July 31, 2022 | — | | | — | |
| Common stock and additional paid-in capital; $0.0001 par value; 1,000.0 shares authorized; 308.3 and 298.8 shares issued and outstanding at July 31, 2023 and July 31, 2022, respectively | | Common stock and additional paid-in capital; $0.0001 par value; 1,000.0 shares authorized; 308.3 and 298.8 shares issued and outstanding at July 31, 2023 and July 31, 2022, respectively | 3,019.0 | | | 1,932.7 | |
| Accumulated other comprehensive loss | | Accumulated other comprehensive loss | (43.2) | | | (55.6) | |
| Accumulated deficit | (836.7 | ) | | (621.6 | ) | Accumulated deficit | (1,227.4) | | | (1,667.1) | |
| Total stockholders’ equity | 759.6 |
| | 894.9 |
| Total stockholders’ equity | 1,748.4 | | | 210.0 | |
| Total liabilities and stockholders’ equity | $ | 3,438.3 |
| | $ | 2,858.2 |
| Total liabilities and stockholders’ equity | $ | 14,501.1 | | | $ | 12,253.6 | |
|
See notes to consolidated financial statements.
PALO ALTO NETWORKS, INC.
CONSOLIDATED STATEMENTS OF OPERATIONS
(In millions, except per share data)
|
| | | | | | | | | | | |
| | Year Ended July 31, |
| | 2017 | | 2016 | | 2015 |
| | | | (As Adjusted) | | (As Adjusted) |
| Revenue: | | | | | |
| Product | $ | 709.1 |
| | $ | 670.8 |
| | $ | 492.7 |
|
| Subscription and support | 1,052.5 |
| | 707.7 |
| | 435.4 |
|
| Total revenue | 1,761.6 |
| | 1,378.5 |
| | 928.1 |
|
| Cost of revenue: | | | | | |
| Product | 201.4 |
| | 175.4 |
| | 131.1 |
|
| Subscription and support | 275.2 |
| | 194.6 |
| | 120.4 |
|
| Total cost of revenue | 476.6 |
| | 370.0 |
| | 251.5 |
|
| Total gross profit | 1,285.0 |
| | 1,008.5 |
| | 676.6 |
|
| Operating expenses: | | | | | |
| Research and development | 347.4 |
| | 284.2 |
| | 185.8 |
|
| Sales and marketing | 919.1 |
| | 743.2 |
| | 489.0 |
|
| General and administrative | 198.3 |
| | 138.4 |
| | 101.6 |
|
| Total operating expenses | 1,464.8 |
| | 1,165.8 |
| | 776.4 |
|
| Operating loss | (179.8 | ) | | (157.3 | ) | | (99.8 | ) |
| Interest expense | (24.5 | ) | | (23.4 | ) | | (22.3 | ) |
| Other income, net | 10.2 |
| | 8.4 |
| | 0.2 |
|
| Loss before income taxes | (194.1 | ) | | (172.3 | ) | | (121.9 | ) |
| Provision for income taxes | 22.5 |
| | 20.4 |
| | 9.4 |
|
| Net loss | $ | (216.6 | ) | | $ | (192.7 | ) | | $ | (131.3 | ) |
| Net loss per share, basic and diluted | $ | (2.39 | ) | | $ | (2.21 | ) | | $ | (1.61 | ) |
| Weighted-average shares used to compute net loss per share, basic and diluted | 90.6 |
| | 87.1 |
| | 81.6 |
|
See notes to consolidated financial statements.
PALO ALTO NETWORKS, INC.
CONSOLIDATED STATEMENTS OF COMPREHENSIVE LOSS
(In millions)
|
| | | | | | | | | | | |
| | Year Ended July 31, |
| | 2017 | | 2016 | | 2015 |
| | | | (As Adjusted) | | (As Adjusted) |
| Net loss | $ | (216.6 | ) | | $ | (192.7 | ) | | $ | (131.3 | ) |
| Other comprehensive income (loss), net of tax: | | | | | |
| Change in unrealized gains (losses) on investments | (4.3 | ) | | 1.1 |
| | — |
|
| Change in unrealized gains (losses) on cash flow hedges | (0.1 | ) | | — |
| | — |
|
| Other comprehensive income (loss) | (4.4 | ) | | 1.1 |
| | — |
|
| Comprehensive loss | $ | (221.0 | ) | | $ | (191.6 | ) | | $ | (131.3 | ) |
See notes to consolidated financial statements.
PALO ALTO NETWORKS, INC.
CONSOLIDATED STATEMENTS OF STOCKHOLDERS’ EQUITY
(In millions)
|
| | | | | | | | | | | | | | | | | | |
| | Common Stock and Additional Paid-In Capital | | Accumulated Other Comprehensive Income (Loss) | | Accumulated Deficit | | Total Stockholders’ Equity |
| | Shares | | Amount | |
| | | | | | | | (As Adjusted) | | (As Adjusted) |
| Balance as of July 31, 2014 | 79.5 |
| | $ | 804.4 |
| | $ | (0.1 | ) | | $ | (297.6 | ) | | $ | 506.7 |
|
| Net loss | — |
| | — |
| | — |
| | (131.3 | ) | | (131.3 | ) |
| Issuance of common stock in connection with employee equity incentive plans and related excess tax benefit | 5.3 |
| | 50.9 |
| | — |
| | — |
| | 50.9 |
|
| Share-based compensation for equity based awards | — |
| | 221.3 |
| | — |
| | — |
| | 221.3 |
|
| Temporary equity reclassification | — |
| | (87.9 | ) | | — |
| | — |
| | (87.9 | ) |
| Balance as of July 31, 2015 | 84.8 |
| | 988.7 |
| | (0.1 | ) | | (428.9 | ) | | 559.7 |
|
| Net loss | — |
| | — |
| | — |
| | (192.7 | ) | | (192.7 | ) |
| Other comprehensive income | — |
| | — |
| | 1.1 |
| | — |
| | 1.1 |
|
| Issuance of common stock in connection with employee equity incentive plans and related excess tax benefit | 5.7 |
| | 45.8 |
| | — |
| | — |
| | 45.8 |
|
| Share-based compensation for equity based awards | — |
| | 393.1 |
| | — |
| | — |
| | 393.1 |
|
| Temporary equity reclassification | — |
|
| 87.9 |
|
| — |
|
| — |
|
| 87.9 |
|
| Balance as of July 31, 2016 | 90.5 |
| | 1,515.5 |
| | 1.0 |
| | (621.6 | ) | | 894.9 |
|
Cumulative-effect adjustment from adoption of new accounting pronouncement
| — |
| | 2.0 |
| | — |
| | 1.5 |
| | 3.5 |
|
| Net loss | — |
| | — |
| | — |
| | (216.6 | ) | | (216.6 | ) |
| Other comprehensive loss | — |
| | — |
| | (4.4 | ) | | — |
| | (4.4 | ) |
| Issuance of common stock in connection with employee equity incentive plans | 4.3 |
| | 46.3 |
| | — |
| | — |
| | 46.3 |
|
| Repurchase and retirement of common stock | (3.3 | ) | | (420.1 | ) | | — |
| | — |
| | (420.1 | ) |
| Taxes paid related to net share settlement of equity awards | — |
| | (21.4 | ) | | — |
| | — |
| | (21.4 | ) |
| Share-based compensation for equity based awards | — |
| | 477.4 |
| | — |
| | — |
| | 477.4 |
|
| Balance as of July 31, 2017 | 91.5 |
| | $ | 1,599.7 |
| | $ | (3.4 | ) | | $ | (836.7 | ) | | $ | 759.6 |
|
| | | | | | | | | | | | | | | | | |
CONSOLIDATED STATEMENTS OF OPERATIONS (In millions, except per share data) |
| Year Ended July 31, |
| 2023 | | 2022 | | 2021 |
| Revenue: | | | | | |
| Product | $ | 1,578.4 | | | $ | 1,363.1 | | | $ | 1,120.3 | |
| Subscription and support | 5,314.3 | | | 4,138.4 | | | 3,135.8 | |
| Total revenue | 6,892.7 | | | 5,501.5 | | | 4,256.1 | |
| Cost of revenue: | | | | | |
| Product | 418.3 | | | 455.5 | | | 308.5 | |
| Subscription and support | 1,491.4 | | | 1,263.2 | | | 966.4 | |
| Total cost of revenue | 1,909.7 | | | 1,718.7 | | | 1,274.9 | |
| Total gross profit | 4,983.0 | | | 3,782.8 | | | 2,981.2 | |
| Operating expenses: | | | | | |
| Research and development | 1,604.0 | | | 1,417.7 | | | 1,140.4 | |
| Sales and marketing | 2,544.0 | | | 2,148.9 | | | 1,753.8 | |
| General and administrative | 447.7 | | | 405.0 | | | 391.1 | |
| Total operating expenses | 4,595.7 | | | 3,971.6 | | | 3,285.3 | |
| Operating income (loss) | 387.3 | | | (188.8) | | | (304.1) | |
| Interest expense | (27.2) | | | (27.4) | | | (163.3) | |
| Other income, net | 206.2 | | | 9.0 | | | 2.4 | |
| Income (loss) before income taxes | 566.3 | | | (207.2) | | | (465.0) | |
| Provision for income taxes | 126.6 | | | 59.8 | | | 33.9 | |
| Net income (loss) | $ | 439.7 | | | $ | (267.0) | | | $ | (498.9) | |
| Net income (loss) per share, basic | $ | 1.45 | | | $ | (0.90) | | | $ | (1.73) | |
| Net income (loss) per share, diluted | $ | 1.28 | | | $ | (0.90) | | | $ | (1.73) | |
| Weighted-average shares used to compute net income (loss) per share, basic | 303.2 | | | 295.6 | | | 289.1 |
| Weighted-average shares used to compute net income (loss) per share, diluted | 342.3 | | | 295.6 | | | 289.1 |
| | | | | |
See notes to consolidated financial statements.
PALO ALTO NETWORKS, INC.
| | | | | | | | | | | | | | | | | |
CONSOLIDATED STATEMENTS OF COMPREHENSIVE INCOME (LOSS)
(In millions) |
| Year Ended July 31, |
| 2023 | | 2022 | | 2021 |
| Net income (loss) | $ | 439.7 | | | $ | (267.0) | | | $ | (498.9) | |
| Other comprehensive income (loss), net of tax: | | | | | |
| Change in unrealized gains (losses) on investments | (13.0) | | | (25.0) | | | (3.0) | |
| Cash flow hedges: | | | | | |
| Change in unrealized gains (losses) | (0.2) | | | (54.0) | | | 1.1 | |
| Net realized (gains) losses reclassified into earnings | 25.6 | | | 33.3 | | | (18.5) | |
| Net change on cash flow hedges | 25.4 | | | (20.7) | | | (17.4) | |
| Other comprehensive income (loss) | 12.4 | | | (45.7) | | | (20.4) | |
| Comprehensive income (loss) | $ | 452.1 | | | $ | (312.7) | | | $ | (519.3) | |
CONSOLIDATED STATEMENTS OF CASH FLOWS
(In millions)
|
| | | | | | | | | | | |
| | Year Ended July 31, |
| | 2017 | | 2016 | | 2015 |
| | | | (As Adjusted) | | (As Adjusted) |
| Cash flows from operating activities | | | | | |
| Net loss | $ | (216.6 | ) | | $ | (192.7 | ) | | $ | (131.3 | ) |
| Adjustments to reconcile net loss to net cash provided by operating activities: | | | | | |
| Share-based compensation for equity based awards | 474.5 |
| | 392.8 |
| | 221.3 |
|
| Depreciation and amortization | 59.8 |
| | 42.8 |
| | 28.9 |
|
| Asset impairment related to facility exit | 20.9 |
| | — |
| | — |
|
| Amortization of investment premiums, net of accretion of purchase discounts | 2.7 |
| | 3.0 |
| | 3.2 |
|
| Amortization of debt discount and debt issuance costs | 24.5 |
| | 23.4 |
| | 22.3 |
|
| Changes in operating assets and liabilities, net of effects of acquisitions: | | | | | |
| Accounts receivable, net | (82.9 | ) | | (136.4 | ) | | (76.8 | ) |
| Prepaid expenses and other assets | (48.1 | ) | | (31.2 | ) | | (69.0 | ) |
| Accounts payable | 5.9 |
| | 15.1 |
| | (3.5 | ) |
| Accrued compensation | 42.8 |
| | (6.3 | ) | | 31.1 |
|
| Accrued and other liabilities | 53.2 |
| | 21.0 |
| | 35.6 |
|
| Deferred revenue | 531.8 |
| | 527.1 |
| | 291.0 |
|
| Net cash provided by operating activities | 868.5 |
| | 658.6 |
| | 352.8 |
|
| Cash flows from investing activities | | | | | |
| Purchases of investments | (995.9 | ) | | (1,037.0 | ) | | (987.6 | ) |
| Proceeds from sales of investments | — |
| | 141.9 |
| | 18.5 |
|
| Proceeds from maturities of investments | 777.4 |
| | 628.7 |
| | 339.0 |
|
| Business acquisitions, net of cash acquired | (90.7 | ) | | — |
| | (15.1 | ) |
| Purchases of property, equipment, and other assets | (163.4 | ) | | (72.5 | ) | | (33.8 | ) |
| Net cash used in investing activities | (472.6 | ) | | (338.9 | ) | | (679.0 | ) |
| Cash flows from financing activities | | | | | |
| Repurchases of common stock | (411.0 | ) | | — |
| | — |
|
| Proceeds from sales of shares through employee equity incentive plans | 46.4 |
| | 45.3 |
| | 48.2 |
|
| Payments for taxes related to net share settlement of equity awards | (21.4 | ) | | — |
| | — |
|
| Payment of deferred consideration related to prior year business acquisition | — |
| | (6.4 | ) | | — |
|
| Net cash provided by (used in) financing activities | (386.0 | ) | | 38.9 |
| | 48.2 |
|
| Net increase (decrease) in cash and cash equivalents | 9.9 |
| | 358.6 |
| | (278.0 | ) |
| Cash and cash equivalents—beginning of period | 734.4 |
| | 375.8 |
| | 653.8 |
|
| Cash and cash equivalents—end of period | $ | 744.3 |
| | $ | 734.4 |
| | $ | 375.8 |
|
| Supplemental disclosures of cash flow information | | | | | |
| Cash paid for income taxes | $ | 9.0 |
| | $ | 7.1 |
| | $ | 17.5 |
|
See notes to consolidated financial statements.statements.
NOTES TO CONSOLIDATED FINANCIAL STATEMENTS
| | | | | | | | | | | | | | | | | | | | | | | | | | | | | |
CONSOLIDATED STATEMENTS OF STOCKHOLDERS’ EQUITY (In millions) |
| | Common Stock
and
Additional Paid-In Capital | | Accumulated Other Comprehensive Income (Loss) | | Accumulated Deficit | | Total Stockholders’ Equity |
| | Shares | | Amount | |
| Balance as of July 31, 2020 | 288.8 | | | $ | 2,259.2 | | | $ | 10.5 | | | $ | (1,167.9) | | | $ | 1,101.8 | |
| | | | | | | | | |
| Net loss | — | | | — | | | — | | | (498.9) | | | (498.9) | |
| Other comprehensive loss | — | | | — | | | (20.4) | | | — | | | (20.4) | |
| Issuance of common stock in connection with employee equity incentive plans | 11.1 | | | 104.0 | | | — | | | — | | | 104.0 | |
| Taxes paid related to net share settlement of equity awards | — | | | (28.9) | | | — | | | — | | | (28.9) | |
| Share-based compensation for equity-based awards | — | | | 943.4 | | | — | | | — | | | 943.4 | |
| Repurchase and retirement of common stock | (12.0) | | | (1,178.1) | | | — | | | — | | | (1,178.1) | |
| | | | | | | | | |
| | | | | | | | | |
| | | | | | | | | |
| | | | | | | | | |
| Issuance of common and restricted common stock in connection with acquisitions | 4.0 | | | 340.7 | | | — | | | — | | | 340.7 | |
| Temporary equity reclassification | — | | | (129.1) | | | — | | | — | | | (129.1) | |
| | | | | | | | | |
| | | | | | | | | |
| Balance as of July 31, 2021 | 291.9 | | | 2,311.2 | | | (9.9) | | | (1,666.8) | | | 634.5 | |
| Cumulative-effect adjustment from adoption of new accounting pronouncement | — | | | (581.9) | | | — | | | 266.7 | | | (315.2) | |
| Net loss | — | | | — | | | — | | | (267.0) | | | (267.0) | |
| Other comprehensive loss | — | | | — | | | (45.7) | | | — | | | (45.7) | |
| Issuance of common stock in connection with employee equity incentive plans | 12.3 | | | 137.3 | | | — | | | — | | | 137.3 | |
| Taxes paid related to net share settlement of equity awards | — | | | (50.3) | | | — | | | — | | | (50.3) | |
| Share-based compensation for equity-based awards | — | | | 1,031.4 | | | — | | | — | | | 1,031.4 | |
| Repurchase and retirement of common stock | (5.4) | | | (915.0) | | | — | | | — | | | (915.0) | |
| | | | | | | | | |
| | | | | | | | | |
| | | | | | | | | |
| | | | | | | | | |
| | | | | | | | | |
| | | | | | | | | |
| | | | | | | | | |
| | | | | | | | | |
| Balance as of July 31, 2022 | 298.8 | | | 1,932.7 | | | (55.6) | | | (1,667.1) | | | 210.0 | |
| | | | | | | | | |
| Net income | — | | | — | | | — | | | 439.7 | | | 439.7 | |
| Other comprehensive income | — | | | — | | | 12.4 | | | — | | | 12.4 | |
| Issuance of common stock in connection with employee equity incentive plans | 11.3 | | | 259.7 | | | — | | | — | | | 259.7 | |
| Taxes paid related to net share settlement of equity awards | — | | | (20.4) | | | — | | | — | | | (20.4) | |
| Share-based compensation for equity-based awards | — | | | 1,097.0 | | | — | | | — | | | 1,097.0 | |
| Repurchase and retirement of common stock | (1.8) | | | (250.0) | | | — | | | — | | | (250.0) | |
| | | | | | | | | |
| | | | | | | | | |
| | | | | | | | | |
| | | | | | | | | |
| Settlement of convertible notes | 11.4 | | | — | | | — | | | — | | | — | |
| Settlement of note hedges | (11.4) | | | — | | | — | | | — | | | — | |
| | | | | | | | | |
| | | | | | | | | |
| Balance as of July 31, 2023 | 308.3 | | | $ | 3,019.0 | | | $ | (43.2) | | | $ | (1,227.4) | | | $ | 1,748.4 | |
See notes to consolidated financial statements.
PALO ALTO NETWORKS, INC.
| | | | | | | | | | | | | | | | | |
CONSOLIDATED STATEMENTS OF CASH FLOWS (In millions) |
| Year Ended July 31, |
| 2023 | | 2022 | | 2021 |
| Cash flows from operating activities | | | | | |
| Net income (loss) | $ | 439.7 | | | $ | (267.0) | | | $ | (498.9) | |
| Adjustments to reconcile net income (loss) to net cash provided by operating activities: | | | | | |
| Share-based compensation for equity-based awards | 1,074.5 | | | 1,011.1 | | | 894.5 | |
| Depreciation and amortization | 282.2 | | | 282.6 | | | 260.4 | |
| | | | | |
| Amortization of deferred contract costs | 413.4 | | | 362.1 | | | 298.0 | |
| Amortization of debt discount and debt issuance costs | 6.7 | | | 7.2 | | | 142.9 | |
| Reduction of operating lease right-of-use assets | 49.9 | | | 54.4 | | | 44.5 | |
| Amortization of investment premiums, net of accretion of purchase discounts | (52.2) | | | 13.5 | | | 13.1 | |
| | | | | |
| Repayments of convertible senior notes attributable to debt discount | — | | | — | | | (0.1) | |
| Changes in operating assets and liabilities, net of effects of acquisitions: | | | | | |
| Accounts receivable, net | (320.3) | | | (902.0) | | | (172.4) | |
| Financing receivables, net | (738.7) | | | (30.1) | | | (272.6) | |
| Deferred contract costs | (431.9) | | | (458.8) | | | (440.8) | |
| Prepaid expenses and other assets | (265.3) | | | (110.9) | | | (26.5) | |
| Accounts payable | 1.0 | | | 69.3 | | | (11.8) | |
| Accrued compensation | 84.4 | | | 30.4 | | | 105.1 | |
| Accrued and other liabilities | (67.6) | | | (47.1) | | | (28.5) | |
| Deferred revenue | 2,301.7 | | | 1,970.0 | | | 1,196.1 | |
| Net cash provided by operating activities | 2,777.5 | | | 1,984.7 | | | 1,503.0 | |
| Cash flows from investing activities | | | | | |
| Purchases of investments | (5,460.4) | | | (2,271.7) | | | (1,958.9) | |
| Proceeds from sales of investments | 965.9 | | | 449.2 | | | 131.1 | |
| Proceeds from maturities of investments | 2,811.5 | | | 1,118.9 | | | 1,240.5 | |
| Business acquisitions, net of cash acquired | (204.5) | | | (37.0) | | | (777.3) | |
| Purchases of property, equipment, and other assets | (146.3) | | | (192.8) | | | (116.0) | |
| Net cash used in investing activities | (2,033.8) | | | (933.4) | | | (1,480.6) | |
| | | | | | | | | | | | | | | | | |
CONSOLIDATED STATEMENTS OF CASH FLOWS (In millions) |
| Year Ended July 31, |
| 2023 | | 2022 | | 2021 |
| Cash flows from financing activities | | | | | |
| Repayments of convertible senior notes | (1,692.0) | | | (0.6) | | | (0.9) | |
| Payments for debt issuance costs | — | | | — | | | (0.2) | |
| | | | | |
| | | | | |
| | | | | |
| Repurchases of common stock | (272.7) | | | (892.3) | | | (1,178.1) | |
| Proceeds from sales of shares through employee equity incentive plans | 258.8 | | | 136.6 | | | 104.0 | |
| Payments for taxes related to net share settlement of equity awards | (20.4) | | | (50.3) | | | (28.8) | |
| | | | | |
| Net cash used in financing activities | (1,726.3) | | | (806.6) | | | (1,104.0) | |
| Net increase (decrease) in cash, cash equivalents, and restricted cash | (982.6) | | | 244.7 | | | (1,081.6) | |
| Cash, cash equivalents, and restricted cash—beginning of period | 2,124.8 | | | 1,880.1 | | | 2,961.7 | |
| Cash, cash equivalents, and restricted cash—end of period | $ | 1,142.2 | | | $ | 2,124.8 | | | $ | 1,880.1 | |
| Reconciliation of cash, cash equivalents, and restricted cash to the consolidated balance sheets | | | | | |
| Cash and cash equivalents | $ | 1,135.3 | | | $ | 2,118.5 | | | $ | 1,874.2 | |
| Restricted cash included in prepaid expenses and other current assets | 6.9 | | | 6.3 | | | 5.4 | |
| Restricted cash included in other assets | — | | | — | | | 0.5 | |
| Total cash, cash equivalents, and restricted cash | $ | 1,142.2 | | | $ | 2,124.8 | | | $ | 1,880.1 | |
| | | | | |
| Non-cash investing and financing activities | | | | | |
| Equity consideration for business acquisitions | $ | (0.3) | | | $ | (2.5) | | | $ | (365.4) | |
| | | | | |
| Supplemental disclosures of cash flow information | | | | | |
| Cash paid for income taxes | $ | 147.1 | | | $ | 34.6 | | | $ | 24.9 | |
| Cash paid for contractual interest | $ | 20.2 | | | $ | 20.2 | | | $ | 20.0 | |
See notes to consolidated financial statements.
Notes To Consolidated Financial Statements
1. Description of Business and Summary of Significant Accounting Policies
Description of Business
Palo Alto Networks, Inc. (the “Company,” “we,” “us,” or “our”), locatedheadquartered in Santa Clara, California, was incorporated in March 2005 under the laws of the State of Delaware and commenced operations in April 2005. We offer a next-generation security platform that empowersempower enterprises, organizations, service providers, and government entities to secure their organizationsusers, networks, clouds and endpoints by safely enabling applications running on their networksdelivering comprehensive cybersecurity enabled by artificial intelligence and by preventing breaches that stem from targeted cyberattacks.automation.
Basis of Presentation
The accompanying consolidated financial statements have been prepared in conformity with U.S. generally accepted accounting principles (“U.S. GAAP”). The consolidated financial statements include all adjustments necessary for a fair presentation of our annual results. All adjustments are of a normal recurring nature. Certain prior period amounts have been adjusted due to our voluntary change in accounting policy for sales commissions, our early adoption of new accounting guidance related to share-based payments, and our adoption of new accounting guidance related to debt issuance costs. Refer to “Change in Accounting Policy for Sales Commissions” and “Recently Adopted Accounting Pronouncements” below for more information.
Principles of Consolidation
The consolidated financial statements include our accounts and our wholly owned subsidiaries. All significant intercompany balances and transactions have been eliminated in consolidation.
Reclassification
Certain prior period amounts in the consolidated financial statements and accompanying notes have been reclassified to conform to the current period presentation.
Use of Estimates
The preparation of consolidated financial statements in conformity with U.S. GAAP requires management to make estimates and assumptions that affect the amounts reported amounts of assets and liabilities and disclosure of contingent assets and liabilities at the date ofdisclosed in the consolidated financial statements and the reported amounts of revenues and expenses during the reporting period. Such managementaccompanying notes. We evaluate our estimates on an ongoing basis. Management estimates include, but are not limited to, the best estimate ofstandalone selling price for our products and services, share-based compensation, fair value of assets acquired and liabilities assumed in business combinations, the assessment of recoverability of our property and equipment, identified intangibles and goodwill, future taxable income,valuation allowance against deferred tax assets, manufacturing partner and supplier liabilities, deferred contract cost benefit period, and loss contingencies. We base our estimates on assumptions, both historical experience and also on assumptionsforward looking, that we believe are reasonable. Actual results could differ materially from those estimates.estimates due to risks and uncertainties, including uncertainty in the current economic environment.
Stock Split Effected in the Form of a Stock Dividend (“Stock Split”)
On September 13, 2022, we executed a three-for-one stock split of our common stock, effected in the form of a stock dividend. The par value per share of our common stock remains unchanged at $0.0001 per share after the Stock Split. All references made to share or per share amounts on the accompanying consolidated financial statements and applicable disclosures have been retroactively adjusted to reflect the effects of the Stock Split.
Concentrations
Financial instruments that subject us to concentrations of credit risk consist primarily of cash and cash equivalents, investments, derivative contracts, accounts receivable and derivative contracts.financing receivables.
We invest only in high-quality credit instruments and maintain our cash and cash equivalents and available-for-sale investments inconsist primarily of fixed income securities. Management believes that the financial institutions that hold our investments are financially sound and, accordingly, are subject to minimal credit risk. Deposits held with banks may exceed the amount of insurance provided on such deposits.
Our derivative contracts expose us to credit risk to the extent that the counterparties may be unable to meet the terms of the arrangement. We mitigate this credit risk by transacting with major financial institutions with high credit ratings and also enter into master netting arrangements, which permit net settlement of transactions with the same counterparty. We are not required to pledge, and are not entitled to receive, cash collateral related to these derivative instruments. We do not enter into derivative contracts for trading or speculative purposes.
Our accounts receivablesreceivable are primarily derived from our distributors representingin various geographical locations. Our financing receivables are with qualified end-customers and channel partners. We perform ongoing credit evaluations and generally do not require collateral on accounts receivable. We maintain an allowance for doubtful accounts for estimated potential credit losses. receivable or financing receivables.
As of July 31, 2017, four2023, two distributors individually represented 28.5%, 21.2%, 15.0%,10% or more of our gross accounts receivable, and 11.2%in the aggregate represented 37.6% of our gross accounts receivable. As of July 31, 2023, no end-customers or channel partners represented 10% or more of our gross financing receivables.
For fiscal 2017,2023, three distributors represented 32.4%, 23.3%, and 10.0%10% or more of our total revenue.revenue, representing 25.0%, 12.8%, and 11.9%, respectively. No single end-customer accounted for more than 10% of our total revenue in fiscal 2023, 2022, or 2021.
We rely on an electronics manufacturing services provider (“EMS provider”) to assemble most of our products and sole source component suppliers for a certain number of our components.
Comprehensive LossIncome (Loss)
Comprehensive lossincome (loss) is comprised of net lossincome (loss) and other comprehensive income (loss). Our other comprehensive income (loss) includes unrealized gains and losses on available-for-sale investments and unrealized gains and losses on cash flow hedges.
Foreign Currency Transactions
The functional currency of our foreign subsidiaries is the U.S. dollar. Monetary assets and liabilities denominated in foreign currencies have been remeasured into U.S. dollars using the exchange rates in effect at the balance sheet dates. Foreign currency denominated income and expenses have been remeasured using the average exchange rates in effect during each period. Foreign currency remeasurement gains and losses and foreign currency transaction gains and losses are not significant to the consolidated financial statements.
Fair Value
We define fair value as the price that would be received from selling an asset or paid to transfer a liability in an orderly transaction between market participants at the measurement date. When determining the fair value measurements for assets and liabilities which are required to be recorded at fair value, we consider the principal or most advantageous market in which to transact and the market-based risk.
We applycategorize assets and liabilities recorded or disclosed at fair value accountingon our consolidated balance sheets based upon the level of judgment associated with inputs used to measure their fair value. The categories are as follows:
•Level 1—Inputs are unadjusted quoted prices in active markets for allidentical assets or liabilities.
•Level 2—Inputs are quoted prices for similar assets and liabilities in active markets or inputs that are observable for the assets or liabilities, either directly or indirectly through market corroboration, for substantially the full term of the financial instruments.
•Level 3—Inputs are unobservable inputs based on our own assumptions used to measure assets and liabilities at fair value. The inputs require significant management judgment or estimation.
Our financial assets and liabilities that are recognized or disclosedmeasured at fair value in the financial statements on a recurring basis.basis include marketable securities and derivative financial instruments. Goodwill, intangible assets, and other long-lived assets are measured at fair value on a nonrecurring basis, only if impairment is indicated. The carrying amounts reported in the consolidated financial statements approximate the fair value for cash and cash equivalents, accounts receivable, accounts payable, and accrued liabilities due to their short-term nature.
Cash, Cash Equivalents, and Investments
We classify our investments as available-for-sale at the time of purchase since it is our intent that these investments are available for current operations, and include these investments on our consolidated balance sheets as cash equivalents, short-term investments, or long-term investments depending on their maturity.
We consider all highly liquid investments with original maturities of three months or less at the date of purchase to be cash equivalents. Investments not considered cash equivalents and with maturities of one year or less from the consolidated balance sheet date are classified as short-term investments. Investments with maturities greater than one year from the consolidated balance sheet date are classified as long-term investments.
Investments are considered impaired when a decline in fair value is judged to be other-than-temporary. We consult with our investment managers and consider available quantitative and qualitative evidence in evaluating potential impairmentdetermine the classification of our investments on a quarterly basis. Ifin marketable debt securities at the costtime of purchase and reevaluate such determination at each balance sheet date. Our marketable debt securities are classified as available-for-sale. Debt securities in an individual investment exceedsunrealized loss position are written down to its fair value with the corresponding charge recorded in other income, net on our consolidated statements of operations, if it is more likely than not that we evaluate, among other factors, general marketwill be required to sell the impaired security before recovery of its amortized cost basis, or we have the intention to sell the security. If neither of these conditions are met, we determine whether a credit loss exists by comparing the duration and extent to whichpresent value of the fair value is less thanexpected cash flows of the security with its amortized cost and our intent and ability to hold the investment. Once a decline in fair value is determined to be other-than-temporary, an impairment chargebasis. An allowance for credit losses is recorded and a new cost basis in other income, net on our consolidated statements of operations for an amount not to exceed the investment is established.unrealized loss. Unrealized losses that are not credit-related are included in accumulated other comprehensive income (loss) (“AOCI”) in stockholders’ equity.
Accounts Receivable
Trade accounts receivable are recorded at the invoiced amount, net of allowances for doubtful accounts.credit losses. The allowance for doubtful accountscredit losses is based on our assessment of the collectability of accounts.collectability. Management regularly reviews the adequacy of the allowance for doubtful accountscredit losses on a collective basis by considering the age of each outstanding invoice, each channel partner’scustomer’s expected ability to pay and the collection history, with each channel partner, when applicable, to determine whether a specific allowance is appropriate.current market conditions, and, where appropriate, reasonable and supportable forecasts of future economic conditions. Accounts receivable deemed uncollectible are charged against the allowance for doubtful accounts when identified. As ofcredit losses. For the years ended July 31, 20172023 and 2016,2022, the allowance for doubtful accountscredit losses activity was not significant.
Financing Receivables
We provide financing arrangements for certain qualified end-customers and channel partners to purchase our products and services. Payment terms on these financing arrangements are up to five years. Financing receivables are recorded at amortized cost, which approximates fair value. We may sell, in certain instances, these financing arrangements on a non-recourse basis to third-party financial institutions. The financing receivables are derecognized upon transfer as these sales qualify as true sales.
We evaluate the allowance for credit losses by assessing the risks and losses inherent in our financing receivables on either an individual or a collective basis. Our assessment considers various factors, including lifetime expected losses determined using customer risk profile, current economic conditions that may affect a customer’s ability to pay, and forward-looking economic considerations. Financing receivables deemed uncollectible are charged against the allowance for credit losses.
Derivatives
We are exposed to foreign currency exchange risk. Our revenue is transacted in U.S. dollars, however, a portion of our operating expenditures are incurred outside of the United States and are denominated in foreign currencies, making them subject to fluctuations in foreign currency exchange rates. We enter into foreign currency derivative contracts with maturities of 24 months or less, which we designate as cash flow hedges, to manage the foreign currency exchange risk associated with our operating expenditures.
Our derivative financial instruments are recorded at fair value, on a gross basis, as either assets or liabilities inon our consolidated balance sheets. Gains or losses related to the effective portion of our cash flow hedges are recorded as a component of accumulated other comprehensive income (“AOCI”) inAOCI on our consolidated balance sheets and are reclassified into the financial statement line item associated with the underlying hedged transaction inon our consolidated statements of operations when the underlying hedged transaction is recognized in earnings. Any gains or losses related to the ineffective portion of our cash flow hedges are recorded immediately in other income (expense), net in our consolidated statements of operations. If it becomes probable that the hedged transaction will not occur, the cumulative unrealized gain or loss is reclassified immediately from AOCI into other income (expense), net. Gains or losses related to non-designated derivative instruments are recognized in other income, (expense), net on our consolidated statements of operations for each period until the instrument matures, is terminated, is re-designated as a qualified cash flow hedge, or is sold. Derivatives designated as cash flow hedges are classified inon our consolidated statements of cash flows in the same manner as the underlying hedged transaction, primarily within cash flows from operating activities.
Property and Equipment
Property and equipment are stated at cost, less accumulated depreciation. Depreciation is computed using the straight-line method over the estimated useful lives of the assets, generally three to ten years. Leasehold improvements are depreciated over the shorter of theassets. Land is not depreciated. The estimated useful lives of the improvements or the remaining lease term.our depreciable assets are as follows:
| | | | | | | | |
| Asset category | | Useful life |
| Computers, equipment, and software | | 3 - 5 years |
| Demonstration units | | 3 - 4 years |
| Furniture and fixtures | | 5 years |
| Leasehold improvements | | Lesser of 10 years or remaining lease term |
Business Combinations
We include the results of operations of the businesses that we acquire as of the respective dates of acquisition. We allocate the fair value of the purchase price of our acquisitions to the tangible assets acquired and liabilities assumed, and intangible assets acquired,generally based on their estimated fair values. The excess of the purchase price over the fair values of these identifiable assets and liabilities is recorded as goodwill. Additional information existing as of the acquisition date but unknown to us may become known during the remainder of the measurement period, not to exceed 12 months from the acquisition date, which may result in changes to the amounts and allocations recorded.
Intangible Assets
Purchased intangible assets with finite lives are carried at cost, less accumulated amortization. Amortization is computed using the straight-line method over the estimated useful lives of the respective assets. Acquisition-related in-process research and development represents the fair value of incomplete research and development projects that have not reached technological feasibility as of the date of acquisition. Initially, these assets are not subject to amortization. Assets related to projects that have been completed are transferred to developed technology, which are subject to amortization.
Impairment of Goodwill, Intangible Assets, and Other Long-Lived Assets
Goodwill is evaluated for impairment on an annual basis in the fourth quarter of our fiscal year, and whenever events or changes in circumstances indicate the carrying amount of goodwill may not be recoverable. We have elected to first assess qualitative factors to determine whether it is more likely than not that the fair value of our single reporting unit is less than its carrying amount, including goodwill. If we determine that it is more likely than not that the fair value of our single reporting unit is less than its carrying amount, then the quantitative impairment test will be performed. Under the quantitative impairment test, if the carrying amount of our single reporting unit exceeds its fair value, we will recognize an impairment loss in an amount equal to that excess but limited to the total amount of goodwill.
We evaluate events and changes in circumstances that could indicate carrying amounts of purchased intangible assets and other long-lived assets may not be recoverable. When such events or changes in circumstances occur, we assess the recoverability of these assets or asset groups by determining whether or not the carrying amount will be recovered through undiscounted expected future cash flows. If the total of the future undiscounted cash flows is less than the carrying amount of an asset or asset group, we record an impairment loss for the amount by which the carrying amount of the asset exceeds the fair value of the asset.asset or asset group.
Through July 31, 2017, we have not recognized any impairment losses on our goodwill and intangible assets. During the year ended July 31, 2017, we recognized an impairment loss of $20.9 million on property and equipment related to the relocation of our corporate headquarters. We did not recognize any impairment losses on our goodwill, intangible assets, or other long-lived assets prior to fiscal 2017.during the years ended July 31, 2023, 2022, and 2021.
Manufacturing Partner and Supplier Liabilities
We outsource most of our manufacturing, repair, and supply chain management operations to our EMS provider and payments to it are a significant portion of our cost of product revenue. Although we could beare contractually obligated to purchase manufactured products and components, we generally do not own the components and manufactured products and components.products. Product title transfers from our EMS provider to us and immediately to our channel partnerscustomers upon shipment. Our EMS provider assembles our products using design specifications, quality assurance programs, and standards that we establish, and it procures components and assembles our products based on our demand forecasts. These forecasts represent our estimates of future demand for our products based upon historical trends and analysis from our sales and product management functions as adjusted for overall market conditions. If the actual component usage and product demand are significantly lower than forecast, we record a liability for manufacturing purchase commitments in excess of our forecasted demand, including costs for excess components or for carrying costs incurred by our manufacturing partners and component suppliers. Through July 31, 2017,2023, we have not accrued any significant costs associated with this exposure.
Convertible Senior Notes
On June 30, 2014, we issued $575.0 million aggregate principal amount of 0.0% Convertible Senior Notes due 2019 (the “Notes”). In accounting for the issuance of the Notes, wePrior to August 1, 2021, our convertible senior notes were separated the Notes into a liability and an equity components.component. The carrying amount of the liability component was calculated by measuring the fair value of a similar liability that doesdid not have an associated convertible feature.feature, using a discounted cash flow model with a risk-adjusted yield. The carrying amount of the equity component representing the conversion option was determined by deducting the fair value of the liability component from the par value of the Notesnotes as a whole. This difference representsrepresented a debt discount that iswas amortized to interest expense using the effective interest method over the term of the Notes.notes. The equity component iswas not remeasured
as long as it continuescontinued to meet the conditions for equity classification. In accounting for the transactionTransaction costs related to the issuance of the Notes, wenotes were allocated the total amount incurred to the liability and equity components using the same proportions as the proceeds from the Notes.notes. Transaction costs attributable to the liability component arewere netted with the liability component and are being amortized to interest expense using the effective interest method over the term of the Notes.notes. Transaction costs attributable to the equity component arewere netted with the equity component of the Notesnotes in additional paid-in capital incapital. Upon the consolidated balance sheets. When the Notes arenotes becoming convertible, the net carrying amount of the Notes will beliability component was classified as a current liability and a portion of the equity component representing the conversion option will bewas reclassified to temporary equity. The portion of the equity incomponent classified as temporary equity was measured as the difference between the principal and net carrying amount of the notes, excluding debt issuance costs.
Upon adoption of the new debt guidance on August 1, 2021, our consolidated balance sheets.convertible senior notes are accounted for entirely as a liability and measured at their amortized cost. Transaction costs related to the issuance of the notes are netted with the liability and are amortized on a straight-line basis, which approximates the effective interest rate method, to interest expense over the term of the notes.
Revenue Recognition
We generateOur revenue from the salesconsists of hardwareproduct revenue and software products, subscriptions,subscription and support and other services primarily through a direct sales force and indirect relationships with channel partners, and, to a lesser extent, directly to end-customers.
revenue. Revenue is recognized when allcontrol of promised products, subscriptions and support services are transferred to customers, in an amount that reflects the expected consideration in exchange for those products and services.
We determine revenue recognition through the following steps:
•Identification of the following criteriacontract, or contracts, with a customer.
•Identification of the performance obligations in the contract.
•Determination of the transaction price.
•Allocation of the transaction price to the performance obligations in the contract.
•Recognition of revenue when, or as, we satisfy a performance obligation.
Revenues are met:reported net of sales taxes. Shipping charges billed to our customers are included in revenue and related costs are included in cost of revenue.
Product Revenue
Persuasive EvidenceProduct revenue is derived primarily from sales of an Arrangement Exists. We rely upon non-cancelable sales agreementsour appliances. Product revenue also includes revenue derived from software licenses of Panorama, SD-WAN, and purchase orders to determine the existenceVM-Series. Our appliances and software licenses include a broad set of an arrangement.
Delivery has Occurred. We use shipping documents or transmissions of product or subscriptionbuilt-in networking and support contract registration codes to determine delivery.
The Fee is Fixed or Determinable. We assess whether the fee is fixed or determinable based on the payment terms associated with the transaction.
Collectability is Reasonably Assured. We assess collectability based on credit analysissecurity features and payment history.
functionalities. We recognize product revenue at the time of hardware shipment provided that all otheror delivery of software license.
Subscription and Support Revenue
Subscription and support revenue recognition criteria have been met. Our channel partners generally receive an orderis derived primarily from an end-customer prior to placing an order with us. In addition, payment fromsales of our channel partners is not contingent on the partner’s success in sales to end-customers. Our channel partners generally do not stock appliancessubscription and only have limited stock rotation rights and no price protection rights. When necessary, we make certain estimates and maintain allowances for sales returns and other programs based on our historical experience. To date, these estimates have not been significant.support offerings. We recognize subscription and support revenue ratably over time as the services are performed. Our contractual service period, which issubscription and support contracts are typically one to five years. Other services revenue is recognized as the services are rendered.
MostContracts with Multiple Performance Obligations
The majority of our arrangements, other than renewalscontracts with our customers include various combinations of our products and subscriptions and support. Our appliances and software licenses have significant standalone functionalities and capabilities. Accordingly, these appliances and software licenses are distinct from our subscriptions and support contracts, are multiple-element arrangements with a combination of hardware, software, subscriptions, support, and other services. Products, subscriptions, support, and other services generally qualify as separate units of accounting. Our hardware deliverables typically include proprietary operating system software, which together deliver the essential functionality of our products. For multiple-element arrangements, we allocate revenue to each unit of accounting based on an estimated selling price at the arrangement inception. The estimated selling price for each element is based upon the following hierarchy: vendor-specific objective evidence (“VSOE”) of selling price, if available, third-party evidence (“TPE”) of selling price, if VSOE of selling price is not available, or best estimate of selling price (“BESP”), if neither VSOE of selling price nor TPE of selling price are available. The total arrangement consideration is allocated to each separate unit of accounting using the relative estimated selling prices of each unit based on the aforementioned selling price hierarchy. We limit the amount of revenue recognized for delivered elements to an amount that is not contingent upon future delivery of additional products or services or meeting of any specified performance conditions.
In multiple-element arrangements where software deliverables are included, revenue is allocated to each separate unit of accounting for each of the non-software deliverables and to the software deliverables as a group using the relative estimated selling prices of each of the deliverables in the arrangement based on the aforementioned estimated selling price hierarchy. The arrangement consideration allocated to the software deliverables as a group is then allocated to each software deliverable using the residual method when VSOE of fair value of the undelivered items exists. Under the residual method, the amount of revenue allocated to delivered elements equals the total arrangement consideration less the aggregate fair value of any undelivered elements. In determining VSOE of fair value, we evaluate whether a substantial majority of the historical prices charged for a product or service sold on a standalone basis, as represented by a percentage of list price, fall within a reasonably narrow range. If VSOE of fair value of one or more undelivered items does not exist, revenuecustomer can benefit from the software portion ofproduct without these services and such services are separately identifiable within the arrangement is deferred and recognized at the earlier of: (i) delivery of those elements or (ii) when fair value can be established unless support is the only undelivered element, in which case, the entire software arrangement fee is recognized ratably over the contractual service period.
contract. We account for multiple agreements with a single partnercustomer as one arrangementa single contract if the contractual terms and/or substance of those agreements indicate that they may be so closely related that they are, in effect, parts of a single arrangement.contract. The amount of consideration we expect to receive in exchange for delivering on the contract is allocated to each performance obligation based on its relative standalone selling price.
Revenues are reported netWe establish standalone selling price using the prices charged for a deliverable when sold separately. If the standalone selling price is not observable through past transactions, we estimate the standalone selling price based on our pricing model and our go-to-market strategy, which include factors such as type of sales taxes. Shipping charges billed to channel partners are included(channel partner or end-customer), the geographies in revenueswhich our offerings were sold (domestic or international), and related costs are included in cost of revenue. After receipt of a partner order, any amounts billed in excess of revenue recognized are recorded as deferred revenue.
offering type (products, subscriptions, or support).
Deferred CommissionsRevenue
We record deferred revenue when cash payments are received or due in advance of our performance. Our payment terms typically require payment within 30 to 45 days of the date we issue an invoice. The current portion of deferred revenue represents the amounts that are expected to be recognized as revenue within one year of the consolidated balance sheet date.
Deferred Contract Costs
We defer contract costs that are recoverable and incremental to obtaining customer sales contracts. Contract costs, which primarily consist of sales commissions, are amortized on a systematic basis that is consistent with the transfer to the customer of the goods or services to which the asset relates. Sales commissions paid for initial contracts are generally not commensurate with the commissions paid for renewal contracts, given the substantive difference in commission rates in proportion to their respective contract values. Sales commissions for initial contracts that are incrementalnot commensurate are amortized over a benefit period of five years. The benefit period is determined by taking into consideration contract length, expected renewals, technology life, and directly related to non-cancelable customerother quantitative and qualitative factors. Sales commissions for initial contracts that are commensurate and sales commissions for renewal contracts are deferred and amortized over the termrelated contractual period.
We classify deferred contract costs as short-term or long-term based on when we expect to recognize the expense. The amortization of the relateddeferred contract in proportion to the recognized revenue. Refer to “Change in Accounting Policy for Sales Commissions” below for more information.
Advertising Costs
Advertising costs which are expensed andis included in sales and marketing expense when incurred, were $13.7 million, $6.6 million, and $4.8 million,on our consolidated statements of operations. Deferred contract costs are periodically reviewed for impairment. We did not recognize any impairment losses on our deferred contract costs during the years ended July 31, 2017, 2016, and 2015, respectively.2023, 2022, or 2021.
Software Development Costs
Internally developed software includes security software developed to meetdeliver our internal needs to provide cloud-based subscription servicesofferings to our end-customers and business software that we customize to meet our specific operational needs.end-customers. These capitalized costs consist of internal compensation relatedcompensation-related costs and external direct costs incurred during the application development stage and will be amortized over a useful life of three years. As of July 31, 2023 and 2022, we capitalized as other assets on our consolidated balance sheets $132.1 million and $130.9 million in costs, respectively, net of accumulated amortization, for security software developed to five years.deliver our cloud-based subscription offerings. We recognized amortization expense of $79.5 million, $62.4 million, and $47.8 million related to these capitalized costs as cost of subscription and support revenue on our consolidated statements of operations during the years ended July 31, 2023, 2022, and 2021, respectively.
The costs to develop software that is marketed externally have not been capitalized as we believe our current software development process is essentially completed concurrent with the establishment of technological feasibility. As such, all related software development costs are expensed as incurred and included in research and development expense inon our consolidated statements of operations.
Share-Based Compensation
Compensation expense related to share-based transactions including employee and non-employee director awards, is measured and recognized in the financial statements based onat fair value on the grant date. We recognize share-based compensation expense for awards with only service conditions on a straight-line basis over the requisite service period of the related award andperiod. We recognize share-based compensation expense for awards with market conditions and awards with performance conditions on a straight-line basis over the requisite service period for each separately vesting portion of the awardaward. We recognize share-based compensation expense for awards with performance conditions when it is probable that the performance condition will be achieved. We account for forfeitures of all share-based payment awards when they occur.
Leases
We rent our facilities underdetermine if an arrangement is a lease at inception. We evaluate the classification of leases at commencement and, as necessary, at modification. Operating lease related balances are included in operating lease agreementsright-of-use assets, accrued and recognizeother liabilities, and long-term operating lease liabilities on our consolidated balance sheets. We did not have any material finance leases in any of the periods presented.
Operating lease right-of-use assets represent our right to use an underlying asset for the lease term. Operating lease liabilities represent our obligation to make payments arising from the lease. Operating lease right-of-use assets and liabilities are recognized at the present value of the future lease payments at the lease commencement date. The interest rate used to determine the present value of the future lease payments is our incremental borrowing rate, because the interest rates implicit in most of our leases are not readily determinable. Our incremental borrowing rate is estimated to approximate the interest rate on a collateralized basis with similar terms and payments, and in economic environments where the leased asset is located. Operating lease right-of-use assets also include adjustments related to lease incentives, prepaid or accrued rent expenseand initial direct lease costs. Operating lease right-of-use assets are subject to evaluation for impairment or disposal on a basis consistent with other long-lived assets.
Our lease terms may include periods under options to extend or terminate the lease when it is reasonably certain that we will exercise that option. We generally use the base, non-cancelable lease term when determining the lease right-of-use assets and lease liabilities. Operating lease cost is recognized on a straight-line basis over the lease term.
We account for lease and non-lease components as a single lease component and do not recognize right-of-use assets and lease liabilities for leases with a term of the lease. Some of12 months or less. Payments under our lease arrangements are primarily fixed, however, certain lease agreements contain rent holidays, scheduled rent increases, lease incentives,variable payments, which are expensed as incurred and renewal options. Rent holidays and scheduled rent increases arenot included in the determinationoperating lease right-of-use assets and liabilities. Variable lease payments are primarily comprised of rent expense to be recorded over the lease term. Lease incentives are recognized as a reduction of rent expense on a straight-line basis over the term of the lease. Renewals are not assumed in the determination of the lease term unless they are deemed to be reasonably assured at the inception of the lease. We begin recognizing rent expense on the date that we obtain the legal right to usereal estate taxes, common area maintenance charges, and control the leased space.insurance costs.
Income Taxes
We account for income taxes using the asset and liability method, which requires the recognition of deferred tax assets and liabilities for the expected future tax consequences of events that have been recognized in our consolidated financial statements or tax returns. In addition, deferred tax assets are recorded for theall future benefit of utilizingbenefits including, but not limited to, net operating losses, and research and development credit carryforwards.carryforwards, and basis differences relating to our global intangible low-taxed income. Valuation allowances are provided when necessary to reduce deferred tax assets to the amount expectedmore likely than not to be realized.
Significant judgment is required in determining any valuation allowance recorded against deferred tax assets. In assessing the need for a valuation allowance, we consider all available evidence, including past operating results, estimates of future taxable income, and the feasibility of tax planning strategies. In the event that we change our determination as to the amount of deferred tax assets that can be realized, we will adjust our valuation allowance with a corresponding impact to the provision for income taxes in the period in which such determination is made.
We apply the authoritative accounting guidance prescribing a threshold and measurement attribute for the financial recognition and measurement
We recognize liabilities for uncertain tax positions based on a two-step process. The first step is to evaluate the tax position for recognition by determining if the weight of available evidence indicates that it is more likely than not that the position will be sustained on audit, including resolution of related appeals or litigation processes, if any. The second step requires us to estimate and measure the tax benefit as the largest amount that is more likely than not to be realized upon ultimate settlement.
We record deferred tax charges in prepaid expenses and other current assets and other assets on our consolidated balance sheets. These deferred tax charges are amortized on a straight-line basis over the life of the associated assets as a component of provision for income taxes in our consolidated statements of operations.
Loss Contingencies
We are subject to the possibility of various loss contingencies arising in the ordinary course of business. In determining loss contingencies, we consider the likelihood of loss or impairment of an asset, or the incurrence of a liability, as well as our ability to reasonably estimate the amount of loss. An estimated loss contingency is accrued when it is probable that an asset has been impaired or a liability has been incurred and the amount of loss can be reasonably estimated. If we determine that a loss is possible and the range of the loss can be reasonably determined,possible, then we disclose the possible loss or range of the possible loss.loss or state that such an estimate cannot be made. We regularly evaluate current information available to us to determine whether an accrual is required, an accrual should be adjusted, or a range of possible loss should be disclosed.
Change in Accounting Policy for Sales Commissions
Effective August 1, 2016, we voluntarily changed our accounting policy for sales commissions that are incremental and directly related to non-cancelable customer sales contracts from recording an expense when incurred to deferral and amortization2. Revenue
Disaggregation of the sales commissions over the term of the related contract in proportion to the recognized revenue. We believe this change in accounting policy is preferable as the direct and incremental commission costs are closely related to the associated revenue, and therefore should be deferred and recognized as an expense over the same period that the related revenue is recognized.
Short-term deferred commissions are included in prepaid expenses and other current assets, while long-term deferred commissions are included in other assets in our consolidated balance sheets. The amortization of deferred commissions is included in sales and marketing expense in our consolidated statements of operations.
The adoption of this accounting policy change has been applied retrospectively to all prior periods presented in this Annual Report on Form 10-K, in which the cumulative effect of the change of $38.1 million has been reflected in accumulated deficit as of August 1, 2014, the beginning of the earliest period presented.Revenue
The following tables present the changes to financial statement line items as a resulttable presents revenue by geographic theater (in millions):
| | | | | | | | | | | | | | | | | |
| Year Ended July 31, |
| 2023 | | 2022 | | 2021 |
| Revenue: | | | | | |
| Americas | | | | | |
| United States | $ | 4,424.2 | | | $ | 3,560.3 | | | $ | 2,747.8 | |
| Other Americas | 295.7 | | | 242.3 | | | 189.7 | |
| Total Americas | 4,719.9 | | | 3,802.6 | | | 2,937.5 | |
| Europe, the Middle East, and Africa (“EMEA”) | 1,359.6 | | | 1,055.8 | | | 817.3 | |
| Asia Pacific and Japan (“APAC”) | 813.2 | | | 643.1 | | | 501.3 | |
| Total revenue | $ | 6,892.7 | | | $ | 5,501.5 | | | $ | 4,256.1 | |
The following table presents revenue for groups of the accounting policy change for the periods presented in our consolidated financial statementssimilar products and services (in millions, except per share data)millions):
| | | | | | | | | | | | | | | | | |
| Year Ended July 31, |
| 2023 | | 2022 | | 2021 |
| Revenue: | | | | | |
| Product | $ | 1,578.4 | | | $ | 1,363.1 | | | $ | 1,120.3 | |
| Subscription and support | | | | | |
| Subscription | 3,335.4 | | | 2,539.0 | | | 1898.8 |
| Support | 1,978.9 | | | 1,599.4 | | | 1,237.0 | |
| Total subscription and support | 5,314.3 | | | 4,138.4 | | | 3,135.8 | |
| Total revenue | $ | 6,892.7 | | | $ | 5,501.5 | | | $ | 4,256.1 | |
|
| | | | | | | | | | | | | | | | | | | | | | | |
| | July 31, 2017 | | July 31, 2016 |
| | Computed under Prior Method | | Impact of Commission Adjustment | | As Reported | | As Previously Reported | | Impact of Commission Adjustment | | As Adjusted |
| Consolidated Balance Sheets | | | | | | | | | | | |
| Prepaid expenses and other current assets | $ | 95.8 |
| | $ | 73.4 |
| | $ | 169.2 |
| | $ | 84.8 |
| | $ | 54.9 |
| | $ | 139.7 |
|
| Other assets | 97.8 |
| | 71.3 |
| | 169.1 |
| | 64.6 |
| | 50.1 |
| | 114.7 |
|
| Accumulated deficit | $ | (981.4 | ) | | $ | 144.7 |
| | $ | (836.7 | ) | | $ | (726.6 | ) | | $ | 105.0 |
| | $ | (621.6 | ) |
|
| | | | | | | | | | | |
| | Year Ended July 31, 2017 |
| | Computed under Prior Method | | Impact of Commission Adjustment | | As Reported |
| Consolidated Statements of Operations | | | | | |
| Sales and marketing | $ | 958.4 |
| | $ | (39.3 | ) | | $ | 919.1 |
|
| Operating loss | (219.1 | ) | | 39.3 |
| | (179.8 | ) |
| Provision for income taxes | 22.9 |
| | (0.4 | ) | | 22.5 |
|
| Net loss | $ | (256.3 | ) | | $ | 39.7 |
| | $ | (216.6 | ) |
| Net loss per share, basic and diluted | $ | (2.83 | ) | | $ | 0.44 |
| | $ | (2.39 | ) |
| Weighted-average shares used to compute net loss per share, basic and diluted | 90.6 |
| | — |
| | 90.6 |
|
| | | | | | |
| Consolidated Statements of Comprehensive Loss | | | | | |
| Net loss | $ | (256.3 | ) | | $ | 39.7 |
| | $ | (216.6 | ) |
| Comprehensive loss | $ | (260.7 | ) | | $ | 39.7 |
| | $ | (221.0 | ) |
|
| | | | | | | | | | | |
| | Year Ended July 31, 2016 |
| | As Previously Reported | | Impact of Commission Adjustment | | As Adjusted |
| Consolidated Statements of Operations | | | | | |
| Sales and marketing | $ | 776.0 |
| | $ | (32.8 | ) | | $ | 743.2 |
|
| Operating loss | (190.1 | ) | | 32.8 |
| | (157.3 | ) |
| Provision for income taxes | 20.8 |
| | (0.4 | ) | | 20.4 |
|
| Net loss | $ | (225.9 | ) | | $ | 33.2 |
| | $ | (192.7 | ) |
| Net loss per share, basic and diluted | $ | (2.59 | ) | | $ | 0.38 |
| | $ | (2.21 | ) |
| Weighted-average shares used to compute net loss per share, basic and diluted | 87.1 |
| | — |
| | 87.1 |
|
| | | | | | |
| Consolidated Statements of Comprehensive Loss | | | | | |
| Net loss | $ | (225.9 | ) | | $ | 33.2 |
| | $ | (192.7 | ) |
| Comprehensive loss | $ | (224.8 | ) | | $ | 33.2 |
| | $ | (191.6 | ) |
|
| | | | | | | | | | | |
| | Year Ended July 31, 2015 |
| | As Previously Reported | | Impact of Commission Adjustment | | As Adjusted |
| Consolidated Statements of Operations | | | | | |
| Sales and marketing | $ | 522.7 |
| | $ | (33.7 | ) | | $ | 489.0 |
|
| Operating loss | (133.5 | ) | | 33.7 |
| | (99.8 | ) |
| Provision for income taxes | 9.4 |
| | — |
| | 9.4 |
|
| Net loss | $ | (165.0 | ) | | $ | 33.7 |
| | $ | (131.3 | ) |
| Net loss per share, basic and diluted | $ | (2.02 | ) | | $ | 0.41 |
| | $ | (1.61 | ) |
| Weighted-average shares used to compute net loss per share, basic and diluted | 81.6 |
| | — |
| | 81.6 |
|
| | | | | | |
| Consolidated Statements of Comprehensive Loss | | | | | |
| Net loss | $ | (165.0 | ) | | $ | 33.7 |
| | $ | (131.3 | ) |
| Comprehensive loss | $ | (165.0 | ) | | $ | 33.7 |
| | $ | (131.3 | ) |
This change in accounting policy does not affect our balance of cash and cash equivalents and, as a result, did not change net cash flows from operating, investing, or financing activities, or materially impact any individual line items presented in our consolidated statement of cash flows forDuring the years ended July 31, 20162023 and 2015.
Recently Adopted Accounting Pronouncements
Goodwill Impairment
In January 2017, the Financial Accounting Standards Board (“FASB”) issued authoritative guidance simplifyingthe subsequent measurement2022, we recognized approximately $3.6 billion and $2.7 billion of goodwill. The standard eliminates Step 2 of the current goodwill impairment test, which requires companiesrevenue pertaining to determine the implied fair value of goodwill when measuring the amount of impairment loss. Under the new standard, goodwill impairment will be measured as the amount by which a reporting unit’s carrying value exceeds its fair value, with the loss limited to the total amount of goodwill allocated toamounts that reporting unit. We elected to early adopt the standard in our fourth quarter of fiscal 2017 on a prospective basis. Our adoption of this standard did not have an impact on our consolidated financial statements.
Share-Based Payment Accounting
In March 2016, the FASB issued authoritative guidance simplifying several aspects of the accounting for employee share-based payment transactions. The new standard requires us to recognize excess tax benefits or deficiencies as income tax expense or benefit in the period in which they occur, rather than additional paid-in capital, and also requires us to recognize excess tax benefits regardless of whether the benefit reduces taxes payable in the current period. In addition, excess tax benefits should be classified as an operating activity, along with other income tax cash flows, instead of a financing activity in our consolidated statements of cash flows. The
standard also allows us to make an accounting policy election to account for forfeitures of share-based payment awards when they occur, rather than estimate expected forfeitures.
We elected to early adopt the standard in our second quarter of fiscal 2017, which required us to reflect any adjustments related to the adoption as of the beginning of the fiscal year. The impact of the adoption on our consolidated financial statements was as follows:
Income tax accounting - We adopted the guidance related to the timing of when excess tax benefits are recognized on a modified retrospective basis. As a result, we recorded the cumulative effect of the change as a $3.5 million reduction to accumulated deficit as of August 1, 2016, to reflect the recognition of excess tax benefits in prior years, with a corresponding adjustment towere deferred tax assets and long-term tax liabilities. We adopted the guidance related to the recognition of excess tax benefits and deficiencies as income tax expense or benefit on a prospective basis.
Cash flow presentation of excess tax benefits - We elected to adopt the guidance related to the presentation of excess tax benefits in our consolidated statements of cash flows on a retrospective basis, which increased net cash provided by operating activities by $0.5 million and $2.5 million for the years ended July 31, 2016 and 2015, respectively, with corresponding decreases to net cash provided by financing activities.
Forfeitures - We elected to account for forfeitures when they occur and adopted this change on a modified retrospective basis. As a result, we recorded the cumulative effect of the change as a $2.0 million increase to accumulated deficit as of August 1, 2016.
The adoption of the standard also impacted our previously reported results for the three months ended October 31, 2016, as presented in the following tables (in millions, except per share data):
|
| | | | | | | | | | | |
| | October 31, 2016 |
| | As Previously Reported | | Impact of Adoption | | As Adjusted |
| Consolidated Balance Sheets | | | | | |
| Other assets | $ | 102.0 |
| | $ | 1.7 |
| | $ | 103.7 |
|
| Other long-term liabilities | 85.8 |
| | (5.6 | ) | | 80.2 |
|
| Common stock and additional paid-in capital | 1,542.2 |
| | 0.9 |
| | 1,543.1 |
|
| Accumulated deficit | $ | (683.4 | ) | | $ | 6.4 |
| | $ | (677.0 | ) |
|
| | | | | | | | | | | |
| | Three Months Ended October 31, 2016 |
| | As Previously Reported | | Impact of Adoption | | As Adjusted |
| Consolidated Statements of Operations | | | | | |
Total cost of revenue(1) | $ | 101.3 |
| | $ | (0.1 | ) | | $ | 101.2 |
|
Total operating expenses(1) | 346.7 |
| | (0.8 | ) | | 345.9 |
|
| Provision for income taxes | 8.4 |
| | (4.0 | ) | | 4.4 |
|
| Net loss | $ | (61.8 | ) | | $ | 4.9 |
| | $ | (56.9 | ) |
| Net loss per share, basic and diluted | $ | (0.69 | ) | | $ | 0.06 |
| | $ | (0.63 | ) |
| Weighted-average shares used to compute net loss per share, basic and diluted | 89.8 |
| | — |
| | 89.8 |
|
| | | | | | |
| Consolidated Statements of Comprehensive Loss | | | | | |
| Net loss | $ | (61.8 | ) | | $ | 4.9 |
| | $ | (56.9 | ) |
| Comprehensive loss | $ | (64.7 | ) | | $ | 4.9 |
| | $ | (59.8 | ) |
| | | | | | |
| Consolidated Statements of Cash Flows | | | | | |
| Net cash provided by operating activities | $ | 203.3 |
| | $ | 0.2 |
| | $ | 203.5 |
|
| Net cash used in financing activities | $ | (27.1 | ) | | $ | (0.2 | ) | | $ | (27.3 | ) |
______________
| |
(1) | Adjustments consist of share-based compensation, which was impacted by our policy election to account for forfeitures when they occur. The impact of adoption on each cost and expense line item within these subtotals was not significant. |
Cloud Computing Arrangements
In April 2015, the FASB issued new authoritative guidance on fees paid in a cloud computing arrangement. The standard requires customers in a cloud computing arrangement to evaluate whether the arrangement includes a software license. If the arrangement includes a software license, the customer should account for the software license element of the arrangement consistent with the acquisition of other software licenses. If the arrangement does not include a software license, the customer should account for the arrangement as a service contract. We adopted the standard in our first quarter of fiscal 2017 on a prospective basis. Our adoption of this standard did not have a material impact on our consolidated financial statements.
Debt Issuance Costs
In April 2015, the FASB issued updated authoritative guidance to simplify the presentation of debt issuance costs. The amended standard requires that debt issuance costs related to a recognized debt liability be presented in the balance sheet as a direct deduction from the carrying amount of the related debt liability, consistent with the presentation of debt discounts, instead of being presented as an asset. We adopted the standard in our first quarter of fiscal 2017 on a retrospective basis, and as a result, we reduced other assets and convertible senior notes, net by $8.0 million on our consolidated balance sheets as of July 31, 2016.2022 and 2021, respectively.
Recently Issued Accounting PronouncementsRemaining Performance Obligations
Business Combinations - DefinitionRemaining performance obligations were $10.6 billion as of a Business
In January 2017, the FASB issued authoritative guidance clarifying the definitionJuly 31, 2023, of a business to assist companies with evaluating whether transactions should be accounted for as acquisitions (or disposals) of assets or businesses. The standard is effective for us for our first quarter of fiscal 2019 and will be applied on a prospective basis. Early adoption is permitted. We do notwhich we expect the adoption of the standard will have a material impact on our consolidated financial statements.
Statement of Cash Flows - Restricted Cash
In November 2016, the FASB issued authoritative guidance on the presentation of restricted cash or restricted cash equivalents in the statement of cash flows. Under the new standard, restricted cash or restricted cash equivalents should be included with cash and cash equivalents when reconciling the beginning-of-period and end-of-period total amounts shown on the statement of cash flows. The standard is effective for us for our first quarter of fiscal 2019 and will be applied on a retrospective basis. Early adoption is permitted. We do not expect the adoption of the standard will have a material impact on our consolidated financial statements because our restricted cash balance has not been material.
Income Taxes - Intra-Entity Asset Transfers
In October 2016, the FASB issued authoritative guidance requiring the recognition of income tax consequences of an intra-entity transfer of an asset, other than inventory, when the transfer occurs. The standard is effective for us for our first quarter of fiscal 2019 and will be applied on a modified retrospective basis. Early adoption is permitted. We plan to adopt the standard in our first quarter of fiscal 2019 and are currently evaluating whether this standard will have a material impact on our consolidated financial statements.
Statement of Cash Flows - Classification of Certain Cash Receipts and Cash Payments
In August 2016, the FASB issued new authoritative guidance addressing eight specific cash flow issues with the objective of reducing the existing diversity in practice in how certain transactions are presented and classified in the statement of cash flows. The standard is effective for us for our first quarter of fiscal 2019 and will be applied on a retrospective basis. Early adoption is permitted. We do not expect the adoption of the standard will have a material impact on our consolidated financial statements.
Financial Instruments - Credit Losses
In June 2016, the FASB issued new authoritative guidance on the accounting for credit losses on most financial assets and certain financial instruments. The standard replaces the existing incurred loss model with an expected credit loss model for financial assets measured at amortized cost, including trade receivables, and requires that credit losses on available-for-sale debt securities be presented as an allowance rather than as a write-down. The standard is effective for us for our first quarter of fiscal 2021 and will be applied on a modified retrospective basis. Early adoption is permitted beginning our first quarter of fiscal 2020. We are currently evaluating whether this standard will have a material impact on our consolidated financial statements.
Leases
In February 2016, the FASB issued new authoritative guidance on lease accounting. Among its provisions, the standard requires lessees to recognize right-of-use assets and lease liabilities onas revenue approximately $5.1 billion over the balance sheet for operating leases and also requires additional qualitative and quantitative disclosures about lease arrangements. The standard is effective for us for our first quarter of fiscal 2020 and will be applied on a modified retrospective basis, with the option to elect certain practical expedients. Early adoption is permitted. We are currently evaluating whether this standard will have a material impact on our consolidated financial statements.
Revenue Recognition
In May 2014, the FASB issued new authoritative guidance on revenue from contracts with customers. The new standard provides principles for recognizing revenue for the transfer of promised goods or services to customers with the consideration to which the entity expects to be entitled in exchange for those goods or services. The standard also requires significantly expanded disclosures about revenue recognition. The FASB subsequently delayed the effective date of the standard by one year and as a result, the standard is now effective for us for our first quarter of fiscal 2019 using either of two methods: (i) retrospective to each prior reporting period presented with the option to elect certain practical expedients as defined within the guidance (“full retrospective method”); or (ii) retrospective with the cumulative effect of initially applying the guidance recognized at the date of initial application and providing certain additional disclosures as defined per the guidance (“modified retrospective method”). Early adoption as of the original effective date is permitted.
We do not plan to early adopt the new standard, and accordingly, we will adopt the standard in our first quarter of fiscal 2019. We currently plan to adopt using the full retrospective method, however, our ability to apply the full retrospective method is dependent on system readinessnext 12 months and the completionremainder thereafter.
We are continuing to evaluate the impact of the new standard on our accounting policies, processes, internal controls over financial reporting, and system requirements, and have assigned cross-functional internal resources and engaged third-party service providers to assist in our evaluation and system implementation. Furthermore, we have made and will continue to make investments in systems to enable timely and accurate reporting under the new standard.
We are also continuing to evaluate the impact the standard will have on our consolidated financial statements, including reviewing the provisions of our customer contracts and identifying performance obligations under the requirements of the new standard and comparing to our current accounting policies and practices. Although we have not yet determined whether the effect will be material, we believe the new standard will impact our accounting for revenue arrangements in the following areas:
removal of the current limitation on contingent revenue may result in revenue being recognized earlier for certain contracts;
term license revenue associated with our virtual firewalls will be recognized upfront;
allocation of revenue related to software due to the removal of the residual method of revenue recognition; and
amortization period for deferred commissions.
We will continue to assess the new standard along with industry trends and additional interpretive guidance, and may adjust our implementation plan accordingly.
2.3. Fair Value Measurements
We categorize assets and liabilities recorded or disclosed at fair value on our consolidated balance sheets based upon the level of judgment associated with inputs used to measure their fair value. The categories are as follows:
Level 1—Inputs are unadjusted quoted prices in active markets for identical assets or liabilities.
Level 2—Inputs are quoted prices for similar assets and liabilities in active markets or inputs that are observable for the assets or liabilities, either directly or indirectly through market corroboration, for substantially the full term of the financial instruments.
Level 3—Inputs are unobservable inputs based on our own assumptions used to measure assets and liabilities at fair value. The inputs require significant management judgment or estimation.
The following table presents the fair value of our financial assets and liabilities measured at fair value on a recurring basis using the above input categories as of July 31, 20172023 and July 31, 20162022 (in millions):
| | | | | | | | | | | | | | | | | | | | | | | | | | | | | | | | | | | | | | | | | | | | | | | | | | |
| | July 31, 2023 | | July 31, 2022 |
| | Level 1 | | Level 2 | | Level 3 | | Total | | Level 1 | | Level 2 | | Level 3 | | Total |
| Cash equivalents: | | | | | | | | | | | | | | | | |
| Money market funds | | $ | 476.1 | | | $ | — | | | $ | — | | | $ | 476.1 | | | $ | 1,205.2 | | | $ | — | | | $ | — | | | $ | 1,205.2 | |
| Certificates of deposit | | — | | | — | | | — | | | — | | | — | | | 155.3 | | | — | | | 155.3 | |
| Commercial paper | | — | | | 151.4 | | | — | | | 151.4 | | | — | | | 69.1 | | | — | | | 69.1 | |
| Corporate debt securities | | — | | | — | | | — | | | — | | | — | | | 19.5 | | | — | | | 19.5 | |
| U.S. government and agency securities | | — | | | — | | | — | | | — | | | — | | | 10.0 | | | — | | | 10.0 | |
| Non-U.S. government and agency securities | | — | | | — | | | — | | | — | | | — | | | 5.1 | | | — | | | 5.1 | |
| Total cash equivalents | | 476.1 | | | 151.4 | | | — | | | 627.5 | | | 1,205.2 | | | 259.0 | | | — | | | 1,464.2 | |
| Short-term investments: | | | | | | | | | | | | | | | | |
| Certificates of deposit | | — | | | 48.1 | | | — | | | 48.1 | | | — | | | 116.4 | | | — | | | 116.4 | |
| Commercial paper | | — | | | 213.8 | | | — | | | 213.8 | | | — | | | 79.0 | | | — | | | 79.0 | |
| Corporate debt securities | | — | | | 798.0 | | | — | | | 798.0 | | | — | | | 505.0 | | | — | | | 505.0 | |
| U.S. government and agency securities | | — | | | 190.6 | | | — | | | 190.6 | | | — | | | 798.2 | | | — | | | 798.2 | |
| Non-U.S. government and agency securities | | — | | | — | | | — | | | — | | | — | | | 17.4 | | | — | | | 17.4 | |
| Asset-backed securities | | — | | | 4.2 | | | — | | | 4.2 | | | — | | | — | | | — | | | — | |
| Total short-term investments | | — | | | 1,254.7 | | | — | | | 1,254.7 | | | — | | | 1,516.0 | | | — | | | 1,516.0 | |
| Long-term investments: | | | | | | | | | | | | | | | | |
| | | | | | | | | | | | | | | | |
| Corporate debt securities | | — | | | 2,484.3 | | | — | | | 2,484.3 | | | — | | | 761.2 | | | — | | | 761.2 | |
| U.S. government and agency securities | | — | | | 22.0 | | | — | | | 22.0 | | | — | | | 118.2 | | | — | | | 118.2 | |
| Non-U.S. government and agency securities | | — | | | 36.6 | | | — | | | 36.6 | | | — | | | — | | | — | | | — | |
| Asset-backed securities | | — | | | 505.0 | | | — | | | 505.0 | | | — | | | 172.5 | | | — | | | 172.5 | |
| Total long-term investments | | — | | | 3,047.9 | | | — | | | 3,047.9 | | | — | | | 1,051.9 | | | — | | | 1,051.9 | |
| Prepaid expenses and other current assets: | | | | | | | | | | | | | | | | |
| Foreign currency forward contracts | | — | | | 19.1 | | | — | | | 19.1 | | | — | | | 2.4 | | | — | | | 2.4 | |
| Total prepaid expenses and other current assets | | — | | | 19.1 | | | — | | | 19.1 | | | — | | | 2.4 | | | — | | | 2.4 | |
| Other assets: | | | | | | | | | | | | | | | | |
| Foreign currency forward contracts | | — | | | 1.7 | | | — | | | 1.7 | | | — | | | 0.7 | | | — | | | 0.7 | |
| Total other assets | | — | | | 1.7 | | | — | | | 1.7 | | | — | | | 0.7 | | | — | | | 0.7 | |
| Total assets measured at fair value | | $ | 476.1 | | | $ | 4,474.8 | | | $ | — | | | $ | 4,950.9 | | | $ | 1,205.2 | | | $ | 2,830.0 | | | $ | — | | | $ | 4,035.2 | |
| | | | | | | | | | | | | | | | |
|
| | | | | | | | | | | | | | | | | | | | | | | | | | | | | | | | |
| | | July 31, 2017 | | July 31, 2016 |
| | | Level 1 | | Level 2 | | Level 3 | | Total | | Level 1 | | Level 2 | | Level 3 | | Total |
| Short-term investments: | | | | | | | | | | | | | | | | |
| Commercial paper | | $ | — |
| | $ | — |
| | $ | — |
| | $ | — |
| | $ | — |
| | $ | 3.0 |
| | $ | — |
| | $ | 3.0 |
|
| Corporate debt securities | | — |
| | 159.4 |
| | — |
| | 159.4 |
| | — |
| | 121.4 |
| | — |
| | 121.4 |
|
| U.S. government and agency securities | | — |
| | 471.3 |
| | — |
| | 471.3 |
| | — |
| | 426.8 |
| | — |
| | 426.8 |
|
| Total short-term investments | | — |
| | 630.7 |
| | — |
| | 630.7 |
| | — |
| | 551.2 |
| | — |
| | 551.2 |
|
| Long-term investments: | | | | | | | | | | | | | | | | |
| Certificates of deposit | | — |
| | 5.4 |
| | — |
| | 5.4 |
| | — |
| | 5.4 |
| | — |
| | 5.4 |
|
| Corporate debt securities | | — |
| | 186.5 |
| | — |
| | 186.5 |
| | — |
| | 166.1 |
| | — |
| | 166.1 |
|
| U.S. government and agency securities | | — |
| | 597.4 |
| | — |
| | 597.4 |
| | — |
| | 481.3 |
| | — |
| | 481.3 |
|
| Total long-term investments | | — |
| | 789.3 |
| | — |
| | 789.3 |
| | — |
| | 652.8 |
| | — |
| | 652.8 |
|
| Total assets measured at fair value | | $ | — |
| | $ | 1,420.0 |
| | $ | — |
| | $ | 1,420.0 |
| | $ | — |
| | $ | 1,204.0 |
| | $ | — |
| | $ | 1,204.0 |
|
As of July 31, 2017, we determined that certain property and equipment related to our prior corporate headquarters were impaired. In connection with our planned relocation to our new corporate headquarters, we assessed the recoverability of certain leasehold improvements and other long-lived assets associated with our previous headquarter facilities and determined that the carrying amount of these assets exceeded their fair value of $4.2 million. The resulting impairment loss of $20.9 million was recorded as general and administrative expense in our consolidated statements of operations during the year ended July 31, 2017. We calculated the fair value of the leasehold improvements and other long-lived assets based on estimated future discounted cash flows and classified the fair value as a Level 3 measurement due to the significance of unobservable inputs, which included the amount and timing of estimated sublease rental receipts that we could reasonably obtain over the remaining lease term and the discount rate. Refer to Note 9. Commitments and Contingencies for more information on the relocation of our corporate headquarters. | | | | | | | | | | | | | | | | | | | | | | | | | | | | | | | | | | | | | | | | | | | | | | | | | | |
| | July 31, 2023 | | July 31, 2022 |
| | Level 1 | | Level 2 | | Level 3 | | Total | | Level 1 | | Level 2 | | Level 3 | | Total |
| Accrued and other liabilities: | | | | | | | | | | | | | | | | |
| Foreign currency forward contracts | | $ | — | | | $ | 18.7 | | | $ | — | | | $ | 18.7 | | | $ | — | | | $ | 32.4 | | | $ | — | | | $ | 32.4 | |
| Total accrued and other liabilities | | — | | | 18.7 | | | — | | | 18.7 | | | — | | | 32.4 | | | — | | | 32.4 | |
| Other long-term liabilities: | | | | | | | | | | | | | | | | |
| Foreign currency forward contracts | | — | | | 1.6 | | | — | | | 1.6 | | | — | | | 0.8 | | | — | | | 0.8 | |
| Total other long-term liabilities | | — | | | 1.6 | | | — | | | 1.6 | | | — | | | 0.8 | | | — | | | 0.8 | |
| Total liabilities measured at fair value | | $ | — | | | $ | 20.3 | | | $ | — | | | $ | 20.3 | | | $ | — | | | $ | 33.2 | | | $ | — | | | $ | 33.2 | |
| | | | | | | | | | | | | | | | |
Refer to Note 8. Convertible Senior Notes10. Debt, for the carrying amount and estimated fair value of our convertible senior notes as of July 31, 20172023 and July 31, 2016.2022.
3.4. Cash Equivalents and Investments
Available-for-sale Debt Securities
The following tables summarize the amortized cost, unrealized gains and losses, and fair value of our available-for-sale investments asdebt securities (in millions):
| | | | | | | | | | | | | | | | | | | | | | | |
| July 31, 2023 |
| Amortized Cost | | Unrealized Gains | | Unrealized Losses | | Fair Value |
| Cash equivalents: | | | | | | | |
| | | | | | | |
| Commercial paper | $ | 151.4 | | | $ | — | | | $ | — | | | $ | 151.4 | |
| | | | | | | |
| | | | | | | |
| | | | | | | |
| Total available-for-sale cash equivalents | $ | 151.4 | | | $ | — | | | $ | — | | | $ | 151.4 | |
| | | | | | | |
| Investments: | | | | | | | |
| Certificates of deposit | $ | 48.1 | | | $ | — | | | $ | — | | | $ | 48.1 | |
| Commercial paper | 214.1 | | | — | | | (0.3) | | | 213.8 | |
| Corporate debt securities | 3,313.5 | | | 1.3 | | | (32.5) | | | 3,282.3 | |
| U.S. government and agency securities | 214.2 | | | — | | | (1.6) | | | 212.6 | |
| Non-U.S. government and agency securities | 37.2 | | | — | | | (0.6) | | | 36.6 | |
| Asset-backed securities | 512.0 | | | 0.2 | | | (3.0) | | | 509.2 | |
| Total available-for-sale investments | $ | 4,339.1 | | | $ | 1.5 | | | $ | (38.0) | | | $ | 4,302.6 | |
| | | | | | | | | | | | | | | | | | | | | | | |
| July 31, 2022 |
| Amortized Cost | | Unrealized Gains | | Unrealized Losses | | Fair Value |
| Cash equivalents: | | | | | | | |
| Certificates of deposit | $ | 155.3 | | | $ | — | | | $ | — | | | $ | 155.3 | |
| Commercial paper | 69.1 | | | — | | | — | | | 69.1 | |
| Corporate debt securities | 19.5 | | | — | | | — | | | 19.5 | |
| U.S. government and agency securities | 10.0 | | | — | | | — | | | 10.0 | |
| Non-U.S. government and agency securities | 5.0 | | | 0.1 | | | — | | | 5.1 | |
| Total available-for-sale cash equivalents | $ | 258.9 | | | $ | 0.1 | | | $ | — | | | $ | 259.0 | |
| | | | | | | |
| Investments: | | | | | | | |
| Certificates of deposit | $ | 116.5 | | | $ | — | | | $ | (0.1) | | | $ | 116.4 | |
| Commercial paper | 79.1 | | | — | | | (0.1) | | | 79.0 | |
| Corporate debt securities | 1,276.8 | | | 1.3 | | | (11.9) | | | 1,266.2 | |
| U.S. government and agency securities | 928.1 | | | 0.1 | | | (11.8) | | | 916.4 | |
| Non-U.S. government and agency securities | 17.6 | | | — | | | (0.2) | | | 17.4 | |
| Asset-backed securities | 173.4 | | | 0.2 | | | (1.1) | | | 172.5 | |
| Total available-for-sale investments | $ | 2,591.5 | | | $ | 1.6 | | | $ | (25.2) | | | $ | 2,567.9 | |
As of July 31, 20172023, the gross unrealized losses that have been in a continuous unrealized loss position for less than 12 months were $30.7 million, which were related to $3.4 billion of available-for-sale debt securities, and the gross unrealized losses that have been in a continuous unrealized loss position for more than 12 months were $7.3 million, which were related to $481.8 million of available-for-sale debt securities. As of July 31, 2016 (in millions):
|
| | | | | | | | | | | | | | | |
| | July 31, 2017 |
| | Amortized Cost | | Unrealized Gains | | Unrealized Losses | | Estimated Fair Value |
| Certificates of deposit | $ | 5.4 |
| | $ | — |
| | $ | — |
| | $ | 5.4 |
|
| Corporate debt securities | 346.1 |
| | 0.3 |
| | (0.5 | ) | | 345.9 |
|
| U.S. government and agency securities | 1,071.2 |
| | 0.1 |
| | (2.6 | ) | | 1,068.7 |
|
| Total | $ | 1,422.7 |
| | $ | 0.4 |
| | $ | (3.1 | ) | | $ | 1,420.0 |
|
|
| | | | | | | | | | | | | | | |
| | July 31, 2016 |
| | Amortized Cost | | Unrealized Gains | | Unrealized Losses | | Estimated Fair Value |
| Certificates of deposit | $ | 5.4 |
| | $ | — |
| | $ | — |
| | $ | 5.4 |
|
| Commercial paper | 3.0 |
| | — |
| | — |
| | 3.0 |
|
| Corporate debt securities | 286.7 |
| | 0.8 |
| | — |
| | 287.5 |
|
| U.S. government and agency securities | 907.3 |
| | 0.9 |
| | (0.1 | ) | | 908.1 |
|
| Total | $ | 1,202.4 |
| | $ | 1.7 |
| | $ | (0.1 | ) | | $ | 1,204.0 |
|
2022 the gross unrealized losses that have been in a continuous unrealized loss position for less than 12 months were $24.8 million, which were related to $2.0 billion of available-for-sale debt securities, and the gross unrealized losses that have been in a continuous unrealized loss position for more than 12 months were not material.
Unrealized losses related to these investmentsour available-for-sale debt securities are primarily due to interest rate fluctuations as opposed to credit quality. In addition, weWe do not intend to sell any of the securities in an unrealized loss position and it is not likely that we would be required to sell these investmentssecurities before recovery of their amortized cost basis, which may be at maturity. As a result, there were no other-than-temporary impairments for these investments at July 31, 2017 and 2016.
We received proceeds of $141.9 million and $18.5 million from sales of investmentsdid not recognize any credit losses related to our available-for-sale debt securities during the years ended July 31, 20162023 and 2015, respectively. We did not sell any investments during the year ended July 31, 2017. We use the specific identification method to determine the cost basis of investments sold.2022.
The following table summarizes the amortized cost and fair value of our available-for-sale investmentsdebt securities as of July 31, 2017,2023, by contractual years-to-maturity (in millions):
| | | | | | | | | | | |
| Amortized Cost | | Fair Value |
| Due within one year | $ | 1,414.8 | | | $ | 1,406.1 | |
| Due between one and three years | 2,478.8 | | | 2,456.0 | |
| Due between three and five years | 523.4 | | | 518.8 | |
| Due between five and ten years | 52.5 | | | 52.3 | |
| Due after ten years | 21.0 | | | 20.8 | |
| Total | $ | 4,490.5 | | | $ | 4,454.0 | |
Marketable Equity Securities
Marketable equity securities consist of money market funds and are included in cash and cash equivalents on our consolidated balance sheets. As of July 31, 2023 and 2022, the carrying value of our marketable equity securities were $476.1 million and $1.2 billion, respectively. There were no unrealized gains or losses recognized for these securities during the years ended July 31, 2023, 2022, and 2021.
|
| | | | | | | |
| | Amortized Cost | | Fair Value |
| Due within one year | $ | 631.6 |
| | $ | 630.7 |
|
| Due between one and three years | 791.1 |
| | 789.3 |
|
| Total | $ | 1,422.7 |
| | $ | 1,420.0 |
|
4.The following table summarizes our short-term and long-term financing receivables (in millions):
| | | | | | | | | | | |
| July 31, |
| 2023 | | 2022 |
| Short-term financing receivables, gross | $ | 435.1 | | | $ | 115.0 | |
| Unearned income | (42.9) | | | (2.4) | |
| Allowance for credit losses | (3.4) | | | (1.3) | |
| Short-term financing receivables, net | $ | 388.8 | | | $ | 111.3 | |
| Long-term financing receivables, gross | $ | 698.6 | | | $ | 196.1 | |
| Unearned income | (39.2) | | | (1.5) | |
| Allowance for credit losses | (6.1) | | | (2.5) | |
| Long-term financing receivables, net | $ | 653.3 | | | $ | 192.1 | |
Our financing receivables portfolio primarily consists of high-quality investment-grade receivables as of July 31, 2023 and 2022. There was no significant activity in allowance for credit losses during the years ended July 31, 2023 and 2022. Past due amounts on financing receivables were not material as of July 31, 2023 and 2022.
6. Derivative Instruments
As a global business, we are exposed to currency exchange rate risk. Substantially allof July 31, 2023 and 2022, the total notional amount of our revenue is transacted in U.S. dollars, however, a portion of our operating expenditures are incurred outside of the United States and are denominated in foreign currencies, making them subject to fluctuations in foreign currency exchange rates. We enter into foreign currency derivative contracts with maturities of 12 months or less which we designate as cash flow hedges to manage the foreign currency exchange rate risk associated with these expenditures.
Beginning August 2016, we entered into forward contracts to hedge the foreign currency exchange rate risk arising from our foreign currency denominated expenditures to be incurred during the year ended July 31, 2017. All of theseoutstanding foreign currency forward contracts maturedwas $957.5 million and were settled during$856.9 million, respectively. Refer to Note 3. Fair Value Measurements for the year ended July 31, 2017. Accordingly, we did not have any forward contracts outstandingfair value of our derivative instruments as reported on our consolidated balance sheets as of July 31, 2017. During the year ended2023.
As of July 31, 2017, both2023, unrealized gains and losses recognized in AOCI related to the effective portion of our cash flow hedges and amounts reclassifiedwere a $0.7 million net gain, of which $2.7 million in gains are expected to be recognized into earnings within the next 12 months. As of July 31, 2022, unrealized gains and losses in AOCI related to our cash flow hedges were not material.a $24.8 million net loss.
5.7. Acquisitions
Fiscal 20172023
LightCyberCider Security Ltd.
On February 27, 2017,December 20, 2022, we completed our acquisition of all outstanding shares of LightCyberCider Security Ltd. (“LightCyber”Cider”), a privately-held cybersecurity company,cloud security company. We expect the acquisition will support Prisma Cloud’s platform approach to securing the entire application security lifecycle from code to cloud. The total purchase consideration for total considerationthe acquisition of $103.1Cider was $198.3 million, in cash. Thewhich consisted of the following (in millions):
| | | | | |
| Amount |
| Cash | $ | 198.0 | |
| Fair value of replacement awards | 0.3 | |
| Total | $ | 198.3 | |
As part of the acquisition, expands the functionalitywe issued replacement equity awards, which included 0.2 million shares of our next-generation security platform withrestricted common stock. The total fair value of the additionreplacement equity awards was $48.6 million, of LightCyber’s behavioral analytics technology. which the portion attributable to services performed prior to the acquisition date was allocated to purchase consideration. The remaining fair value was allocated to future services and will be expensed over the remaining service periods as share-based compensation.
We have accounted for this transaction as a business combination and allocated the purchase consideration to assets acquired and liabilities assumed based on their preliminary estimated fair values, as presented in the following table (in millions):
| | | | | |
| Amount |
| Goodwill | $ | 164.6 | |
| Identified intangible assets | 27.8 | |
| Cash | 12.4 | |
| Net liabilities assumed | (6.5) | |
| Total | $ | 198.3 | |
|
| | | |
| | Amount |
| Cash | $ | 12.4 |
|
| Goodwill | 75.3 |
|
| Identified intangible assets | 19.5 |
|
| Net liabilities assumed | (4.1 | ) |
| Total | $ | 103.1 |
|
The following table presents the identified intangible asset acquired (in millions, except years):
| | | | | | | | | | | |
| Fair Value | | Estimated Useful Life |
| Developed technology | $ | 27.8 | | | 5 years |
Other acquisition
In April 2023, we completed an acquisition for total purchase consideration of $18.9 million in cash. We have accounted for this transaction as a business combination and recorded goodwill of $14.5 million. The goodwill is not deductible for income tax purposes.
Fiscal 2022
During the year ended July 31, 2022, we completed acquisitions for a combined total purchase consideration of $40.1 million, which was primarily cash. We have accounted for these transactions as business combinations, and recorded goodwill of $37.6 million. The goodwill is not deductible for income tax purposes.
Fiscal 2021
Bridgecrew Inc.
On March 2, 2021, we completed our acquisition of Bridgecrew Inc. (“Bridgecrew”), a privately-held cloud security company. We expect the acquisition will expand our Prisma Cloud offering to deliver security across the full application lifecycle. The total purchase consideration for the acquisition of Bridgecrew was $156.9 million, which consisted of the following (in millions):
| | | | | |
| Amount |
| Cash | $ | 155.9 | |
| |
| Fair value of replacement awards | 1.0 | |
| Total | $ | 156.9 | |
As part of the acquisition, we issued $42.5 million of replacement awards, of which the portion attributable to services performed prior to the acquisition date was allocated to purchase consideration. The remaining fair value was allocated to future services and will be expensed over the remaining service periods as share-based compensation.
We have accounted for this transaction as a business combination and allocated the purchase consideration to assets acquired and liabilities assumed based on estimated fair values, as presented in the following table (in millions):
| | | | | |
| Amount |
| Goodwill | $ | 129.6 | |
| Identified intangible assets | 21.6 | |
| Cash | 9.0 | |
| Net liabilities assumed | (3.3) | |
| Total | $ | 156.9 | |
Goodwill generated from this business combination is primarily attributable to the assembled workforce and expected post-acquisition synergies from integrating Bridgecrew technology into our platforms. The goodwill is not deductible for income tax purposes.
The following table presents the identified intangible asset acquired (in millions, except years):
| | | | | | | | | | | |
| Fair Value | | Estimated Useful Life |
| Developed technology | $ | 21.6 | | | 6 years |
| | | |
| | | |
Expanse Inc.
On December 15, 2020, we completed our acquisition of Expanse Inc. (“Expanse”), a privately-held company specializing in attack surface management. We expect the acquisition will enrich our Cortex offerings and provide organizations an integrated view of the enterprise to combine external, internal, and threat data. The total purchase consideration for the acquisition of Expanse was $797.2 million, which consisted of the following (in millions):
| | | | | |
| Amount |
| Cash | $ | 434.9 | |
| Common stock (1.1 million shares) | 340.7 | |
| Fair value of replacement awards | 21.6 | |
| Total | $ | 797.2 | |
As part of the acquisition, we issued replacement equity awards, which included 0.2 million shares of our restricted common stock. The total fair value of the replacement equity awards was $160.0 million, of which the portion attributable to services performed prior to the acquisition date was allocated to purchase consideration. The remaining fair value was allocated to future services and will be expensed over the remaining service periods as share-based compensation.
We have accounted for this transaction as a business combination and allocated the purchase consideration to assets acquired and liabilities assumed based on estimated fair values, as presented in the following table (in millions):
| | | | | |
| Amount |
| Goodwill | $ | 598.2 | |
| Identified intangible assets | 160.3 | |
| Cash | 51.1 | |
| Net liabilities assumed | (12.4) | |
| Total | $ | 797.2 | |
Goodwill generated from this business combination is primarily attributable to the assembled workforce and expected post-acquisition synergies from integrating Expanse technology into our platforms. The goodwill is not deductible for income tax purposes.
The following table presents details of the identified intangible assets acquired (in millions, except years):
| | | | | | | | | | | |
| Fair Value | | Estimated Useful Life |
| Developed technology | $ | 123.4 | | | 6 years |
| Customer relationships | 36.9 | | | 10 years |
| Total | $ | 160.3 | | | |
Sinefa Group, Inc.
On November 24, 2020, we completed our acquisition of Sinefa Group, Inc. and its wholly owned subsidiaries (“Sinefa”), a privately-held digital experience monitoring company. We expect the acquisition will extend our Prisma Access offering. The total purchase consideration for the acquisition of Sinefa was $27.0 million, which consisted of the following (in millions):
| | | | | |
| Amount |
| Cash | $ | 26.9 | |
| Fair value of replacement awards | 0.1 | |
| Total | $ | 27.0 | |
As part of the acquisition, we issued $11.5 million of replacement equity awards, of which the portion attributable to services performed prior to the acquisition date was allocated to purchase consideration. The remaining fair value was allocated to future services and will be expensed over the remaining service periods as share-based compensation.
We have accounted for this transaction as a business combination and allocated the purchase consideration to assets acquired and liabilities assumed based on estimated fair values, as presented in the following table (in millions):
| | | | | |
| Amount |
| Goodwill | $ | 13.7 | |
| Identified intangible assets | 20.4 | |
| |
| Net liabilities assumed | (7.1) | |
| Total | $ | 27.0 | |
Goodwill generated from this business combination is primarily attributable to the assembled workforce and expected post-acquisition synergies from integrating Sinefa technology into our platforms. The goodwill is deductible for income tax purposes.
The following table presents details of the identified intangible assets acquired (in millions, except years):
| | | | | | | | | | | |
| Fair Value | | Estimated Useful Life |
| Developed technology | $ | 18.6 | | | 6 years |
| Customer relationships | 1.8 | | | 8 years |
| Total | $ | 20.4 | | | |
The Crypsis Group
On September 17, 2020, we completed our acquisition of The Crypsis Group (“Crypsis”), an incident response, risk management, and digital forensics consulting firm. We expect the acquisition will expand our capabilities and strengthen our Cortex strategy. The total purchase consideration for the acquisition of Crypsis was $227.7 million, which consisted of the following (in millions):
| | | | | |
| Amount |
| Cash | $ | 225.7 | |
| Fair value of replacement awards | 2.0 | |
| Total | $ | 227.7 | |
As part of the acquisition, we issued $27.1 million of replacement awards, of which the portion attributable to services performed prior to the acquisition date was allocated to purchase consideration. The remaining fair value was allocated to future services and will be expensed over the remaining service periods as share-based compensation.
We have accounted for this transaction as a business combination and allocated the purchase consideration to assets acquired and liabilities assumed based on estimated fair values, as presented in the following table (in millions):
| | | | | |
| Amount |
| Goodwill | $ | 157.6 | |
| Identified intangible assets | 54.4 | |
| Net assets acquired | 15.7 | |
| Total | $ | 227.7 | |
Goodwill generated from this business combination is primarily attributable to the assembled workforce and expected post-acquisition synergies from integrating Crypsis technology into our platforms. The goodwill is deductible for income tax purposes.
The following table presents details of the identified intangible assets acquired (in millions, except years):
| | | | | | | | | | | |
| Fair Value | | Estimated Useful Life |
| Developed technology | $ | 6.9 | | | 3 years |
| Customer relationships | 47.5 | | | 7 years |
| Total | $ | 54.4 | | | |
Additional Acquisition-Related Information
Pro forma results of operations have not been presented because the effects of the acquisitions were not material to our consolidated statements of operations.
Additional information related to our acquisitions completed in fiscal 2023, such as that related to income tax and other contingencies, existing as of the acquisition date but unknown to us may become known during the remainder of the measurement period, not to exceed 12 months from the respective acquisition date, which may result in changes to the amounts and allocations recorded.
The following table presents details of the identified intangible assets acquired (in millions, except years):
|
| | | | | |
| | Fair Value | | Estimated Useful Life |
| Developed technology | $ | 16.6 |
| | 8 years |
| Customer relationships | 2.9 |
| | 8 years |
| Total | $ | 19.5 |
| | |
Goodwill generated from this business combination is primarily attributable to the assembled workforce and expected synergies from integrating the LightCyber technology into our platform. The goodwill is not deductible for income tax purposes.
LightCyber’s operating results are included in our consolidated statements of operations from the date of acquisition. Pro forma results of operations have not been presented as the impact to our consolidated statements of operations is not material.
Fiscal 2015
CirroSecure, Inc.
On May 22, 2015, we completed our acquisition of CirroSecure, Inc. (“CirroSecure”), a privately-held cybersecurity company. The acquisition expands the functionality of our next-generation security platform by providing additional security for SaaS applications. We accounted for this transaction as a business combination in exchange for total cash consideration of $15.3 million.
We allocated the purchase consideration to the assets acquired and liabilities assumed based on their estimated fair values and as a result, recorded a developed technology intangible asset of $11.0 million, goodwill of $8.1 million, and net liabilities of $3.8 million in our consolidated balance sheets as of the acquisition date. The developed technology is being amortized over an estimated useful life of seven years. The goodwill is attributable to the assembled workforce and expected post-acquisition synergies and is not deductible for income tax purposes.
6.8. Goodwill and Intangible Assets
Goodwill
The following table presents details of our goodwill during the year ended July 31, 20172023 (in millions):
|
| | | |
| | Amount |
| Balance as of July 31, 2016 | $ | 163.5 |
|
| Goodwill acquired | 75.3 |
|
| Balance as of July 31, 2017 | $ | 238.8 |
|
Through July 31, 2017, we have not recognized any impairment losses on our goodwill. | | | | | |
| Amount |
| Balance as of July 31, 2022 | $ | 2,747.7 | |
| Goodwill acquired | 179.1 | |
| |
| Balance as of July 31, 2023 | $ | 2,926.8 | |
Purchased Intangible Assets
The following table presents details of our purchased intangible assets as of July 31, 2017 and July 31, 2016 (in millions):
| | | | | | | | | | | | | | | | July 31, |
| | July 31, | | 2023 | | 2022 |
| | 2017 | | 2016 | | Gross Carrying Amount | | Accumulated Amortization | | Net Carrying Amount | | Gross Carrying Amount | | Accumulated Amortization | | Net Carrying Amount |
| | Gross Carrying Amount | | Accumulated Amortization | | Net Carrying Amount | | Gross Carrying Amount | | Accumulated Amortization | | Net Carrying Amount | |
| Intangible assets subject to amortization: | | Intangible assets subject to amortization: | | | | | | | | | | | |
| Developed technology | $ | 69.7 |
| | $ | (23.8 | ) | | $ | 45.9 |
| | $ | 53.1 |
| | $ | (15.4 | ) | | $ | 37.7 |
| Developed technology | $ | 633.2 | | | $ | (429.4) | | | $ | 203.8 | | | $ | 600.7 | | | $ | (347.9) | | | $ | 252.8 | |
| Customer relationships | | Customer relationships | 172.7 | | | (73.9) | | | 98.8 | | | 172.7 | | | (52.2) | | | 120.5 | |
| Acquired intellectual property | 8.9 |
| | (3.8 | ) | | 5.1 |
| | 8.9 |
| | (2.9 | ) | | 6.0 |
| Acquired intellectual property | 14.6 | | | (6.2) | | | 8.4 | | | 11.3 | | | (4.8) | | | 6.5 | |
| Customer relationships | 2.9 |
| | (0.2 | ) | | 2.7 |
| | — |
| | — |
| | — |
| |
| Trade name and trademarks | | Trade name and trademarks | 9.4 | | | (9.4) | | | — | | | 9.4 | | | (9.4) | | | — | |
| Other | 2.4 |
| | (2.4 | ) | | — |
| | 2.4 |
| | (2.1 | ) | | 0.3 |
| Other | 0.9 | | | (0.4) | | | 0.5 | | | 0.9 | | | (0.1) | | | 0.8 | |
| Total intangible assets subject to amortization | | Total intangible assets subject to amortization | 830.8 | | | (519.3) | | | 311.5 | | | 795.0 | | | (414.4) | | | 380.6 | |
| Intangible assets not subject to amortization: | | Intangible assets not subject to amortization: | |
| In-process research and development | | In-process research and development | 3.9 | | — | | | 3.9 | | | 3.9 | | — | | | 3.9 | |
| Total purchased intangible assets | $ | 83.9 |
| | $ | (30.2 | ) | | $ | 53.7 |
| | $ | 64.4 |
| | $ | (20.4 | ) | | $ | 44.0 |
| Total purchased intangible assets | $ | 834.7 | | | $ | (519.3) | | | $ | 315.4 | | | $ | 798.9 | | | $ | (414.4) | | | $ | 384.5 | |
We recognized amortization expense of $9.8$104.9 million, $9.4$126.9 million, and $7.9$117.8 million for the years ended July 31, 2017, 2016,2023, 2022, and 2015,2021, respectively.
The following table summarizes our estimated future amortization expense of our intangible assets subject to amortization as of July 31, 20172023 (in millions):
| | | | | | | | | | | | | | | | | | | | | | | | | | | | | | | | | | | | | | | | | |
| | | Fiscal years ending July 31, |
| Total | | 2024 | | 2025 | | 2026 | | 2027 | | 2028 | | 2029 and Thereafter |
| Future amortization expense | $ | 311.5 | | | $ | 97.9 | | | $ | 84.2 | | | $ | 62.4 | | | $ | 35.3 | | | $ | 13.7 | | | $ | 18.0 | |
|
| | | |
| | Amount |
| Years ending July 31: | |
| 2018 | $ | 10.7 |
|
| 2019 | 10.6 |
|
| 2020 | 10.6 |
|
| 2021 | 8.9 |
|
| 2022 | 4.4 |
|
| 2023 and thereafter | 8.5 |
|
| Total future amortization expense | $ | 53.7 |
|
7.9. Property and Equipment
The following table presents details of our property and equipment, net as of (in millions):
| | | | | | | | | | | |
| | July 31, |
| | 2023 | | 2022 |
| Computers, equipment, and software | $ | 432.9 | | | $ | 404.3 | |
| Leasehold improvements | 268.9 | | | 249.3 | |
| Land | 87.2 | | | 87.2 | |
| Demonstration units | 46.9 | | | 41.6 | |
| Furniture and fixtures | 46.9 | | | 45.1 | |
| Total property and equipment, gross | 882.8 | | | 827.5 | |
| Less: accumulated depreciation | (528.3) | | | (469.7) | |
| Total property and equipment, net | $ | 354.5 | | | $ | 357.8 | |
During the year ended July 31, 2017 and July 31, 2016 (in millions):
|
| | | | | | | |
| | July 31, |
| | 2017 | | 2016 |
| Computers, equipment, and software | $ | 156.6 |
| | $ | 102.7 |
|
| Leasehold improvements | 110.1 |
| | 58.0 |
|
| Demonstration units | 26.3 |
| | 20.1 |
|
| Furniture and fixtures | 20.4 |
| | 14.6 |
|
| Total property and equipment | 313.4 |
| | 195.4 |
|
| Less: accumulated depreciation | (102.3 | ) | | (78.2 | ) |
| Total property and equipment, net | $ | 211.1 |
| | $ | 117.2 |
|
We recognized depreciation expense of $48.6$95.9 million, $33.1$92.8 million, and $20.3$94.2 million related to property and equipment during the years ended July 31, 2017, 2016,2023, 2022, and 2015,2021, respectively. During the year ended July 31, 2017, we impaired certain property and equipment related to the relocation of our corporate headquarters and recognized a loss of $20.9 million in general and administrative expense on our consolidated statements of operations. Refer to Note 9. Commitments and Contingencies for more information.
8. Convertible Senior Notes10. Debt
Convertible Senior Notes
On June 30, 2014,In July 2018, we issued $575.0 million$1.7 billion aggregate principal amount of 0.0%0.75% Convertible Senior Notes due 20192023 (the “2023 Notes”) and in June 2020, we issued $2.0 billion aggregate principal amount of 0.375% Convertible Senior Notes due 2025 (the “2025 Notes,” and together with the 2023 Notes, the “Notes”). The 2023 Notes arebear interest at a fixed rate of 0.75% per year, payable semi-annually in arrears on January 1 and July 1 of each year, beginning on January 1, 2019. The 2025 Notes bear interest at a fixed rate of 0.375% per year, payable semi-annually in arrears on June 1 and December 1 of each year, beginning on December 1, 2020. Each series of the convertible notes is governed by an indenture between us, as the issuer, and U.S. Bank National Association, as Trustee (the “Indenture”(individually, each an “Indenture,” and together, the “Indentures”). The Notes of each series are unsecured, unsubordinated obligations that doand the applicable Indenture governing each series of Notes does not contain any financial covenants or restrictions on the payments of dividends, the incurrence of indebtedness, or the issuance or repurchase of securities by us or any of our subsidiaries. The 2023 Notes maturewere converted prior to or settled on the maturity date of July 1, 2019 unless converted or repurchased2023 in accordance with their termsterms. The 2025 Notes mature on June 1, 2025. We may redeem for cash all or any portion of the 2025 Notes, at our option, on or after June 5, 2023 and prior to such date. We cannot redeem the Notes prior to maturity.
The Notes are convertible for up to 5.2 million shares31st scheduled trading day immediately preceding the maturity date if the last reported sale price of our common stock has been at an initialleast 130% of the conversion rateprice then in effect for at least 20 trading days during any 30 consecutive trading day period ending on and including the trading day preceding the date on which we provide notice of approximately 9.068 sharesredemption. The redemption will be at a price equal to 100% of common stock per $1,000the principal amount which is equalof the 2025 Notes and adjusted for interest. If we call any or all of the 2025 Notes for redemption, holders may convert such 2025 Notes called for redemption at any time prior to an initial conversion pricethe close of approximately $110.28 per sharebusiness on the second scheduled trading day immediately preceding the redemption date.
The following table presents details of common stock, subjectour Notes (number of shares in millions):
| | | | | | | | | | | | | | | | | | | | | | | |
| | Conversion Rate per $1,000 Principal | | Initial Conversion Price | | Convertible Date | | Initial Number of Shares |
| | | | | | | |
2023 Notes(1) | 11.2635 | | | $ | 88.78 | | | April 1, 2023 | | 19.1 | |
| 2025 Notes | 10.0806 | | | $ | 99.20 | | | March 1, 2025 | | 20.1 | |
(1)The 2023 Notes were converted prior to adjustment. or settled on the maturity date of July 1, 2023.
Holders of the Notes may surrender their Notes for conversion at their option at any time prior to the close of business on the business day immediately preceding January 1, 2019,their respective convertible dates only under the following circumstances:
•during any fiscal quarter commencing after the fiscal quarterquarters ending on October 31, 20142018 and October 31, 2020 for the 2023 Notes and the 2025 Notes, respectively (and only during such fiscal quarter), if the last reported sale price of our common stock for at least 20 trading days (whether or not consecutive) during a period of 30 consecutive trading days ending on the last trading day of the immediately preceding fiscal quarter is greater than or equal to 130% of the applicable conversion price for the respective Notes on each applicable trading day (the “sale price condition”);
•during the five business day period after any five consecutive trading day period (the “measurement period”) in which the trading price per $1,000 principal amount of the applicable series of Notes for each trading day of the measurement period was less than 98% of the product of the last reported sale price of our common stock and the applicable conversion rate for the respective Notes on each such trading day; or
•upon the occurrence of specified corporate events.
On or after January 1, 2019,the respective convertible date, holders may convertsurrender all or any portion of their Notes for conversion at any time prior to the close of business on the second scheduled trading day immediately preceding the applicable maturity date regardless of the foregoing conditions.conditions, and such conversions will be settled upon the applicable maturity date. Upon conversion, holders of the Notes of a series will receive cash equal to the aggregate principal amount of the Notes of such series to be converted, and, at our election, cash and/or shares of our common stock for any amounts in excess of the aggregate principal amount of the Notes of such series being converted.
The conversion price will be subject to adjustment in some events. Holders of the Notes of a series who convert their Notes of such series in connection with certain corporate events that constitute a “make-whole fundamental change” perunder the applicable Indenture are, under certain circumstances, entitled to an increase in the conversion rate.rate for such series of Notes. Additionally, upon the occurrence of a corporate event that constitutes a “fundamental change” perunder the applicable Indenture, holders of the Notes of such series may require us to repurchase for cash all or a portion of the Notes of such series at a purchaserepurchase price equal to 100% of the principal amount of the Notes of such series plus accrued and unpaid contingent interest.interest to, but excluding, the fundamental change repurchase date.
Holders of the 2023 Notes were able to early convert their 2023 Notes in fiscal 2023 up to April 1, 2023 as the sales price condition had been met. Conversion requests for the 2023 Notes received on or after April 1, 2023 were settled upon maturity of the 2023 Notes. Holders of the 2025 Notes were able to early convert their 2025 Notes in fiscal 2023 as the sales price condition was met. During the year ended July 31, 2023, we repaid in cash $1.7 billion in aggregate principal amount of the Notes and issued 11.4 million shares of common stock to the holders of the Notes for the conversion value in excess of the principal amount. These shares were fully offset by shares we received from the corresponding exercise of the associated note hedges.
The sale price condition for the 2025 Notes was not met during the fiscal quartersquarter ended July 31, 20172023, and as a result, holders may convert their 2025 Notes during the fiscal quarter ending October 31, 2023. The net carrying amount of the 2025 Notes was classified as a current liability on our consolidated balance sheet as of July 31, 2016. Since2023.
The sale price condition for the Notes were not convertible,was met during the fiscal quarter ended July 31, 2022, and as a result, holders could convert their Notes during the fiscal quarter ended October 31, 2022. The net carrying amount of the Notes was classified as a long-termcurrent liability and the equity component was included in additional paid-in capital inon our consolidated balance sheetssheet as of July 31, 2017 and July 31, 2016.2022.
The following table sets forth the componentsnet carrying amount of theour Notes as of July 31, 2017 and July 31, 2016 (in millions):
|
| | | | | | | |
| | July 31, |
| | 2017 | | 2016 |
| Liability: | | | |
| Principal | $ | 575.0 |
| | $ | 575.0 |
|
| Less: debt discount and debt issuance costs, net of amortization | 50.3 |
| | 74.8 |
|
| Net carrying amount | $ | 524.7 |
| | $ | 500.2 |
|
| | | | |
| Equity | $ | 109.8 |
| | $ | 109.8 |
|
| | | | | | | | | | | | | | | | | | | | | | | | | | | | | | | | | | | |
| July 31, 2023 | | July 31, 2022 |
| 2023 Notes | | 2025 Notes | | Total | | 2023 Notes | | 2025 Notes | | Total |
| Principal | $ | — | | | $ | 1,999.3 | | | $ | 1,999.3 | | | $ | 1,691.9 | | | $ | 1,999.4 | | | $ | 3,691.3 | |
| Less: debt issuance costs, net of amortization | — | | | (7.8) | | | (7.8) | | | (2.6) | | | (11.9) | | | (14.5) | |
| Net carrying amount | $ | — | | | $ | 1,991.5 | | | $ | 1,991.5 | | | $ | 1,689.3 | | | $ | 1,987.5 | | | $ | 3,676.8 | |
| | | | | | | | | | | |
| | | | | | | | | | | |
The total estimated fair value of the 2025 Notes was $747.5 million and $761.9 million$5.0 billion at July 31, 20172023. The total estimated fair value of the 2023 Notes and 2025 Notes were $3.2 billion and $3.5 billion at July 31, 2016,2022, respectively. The fair value was determined based on the closing trading price per $100 of the applicable series of the Notes as of the last day of trading for the period. We consider the fair value of the Notes at July 31, 20172023 and July 31, 20162022 to be a Level 2 measurement. The fair value of the Notes is primarily affected by the trading price of our common stock and market interest rates. As
The following table sets forth interest expense recognized related to the Notes (dollars in millions):
| | | | | | | | | | | | | | | | | | | | | | | | | | | | | | | | | | | | | | | | | | | | | | | | | | | | | |
| Year Ended July 31, 2023 | | Year Ended July 31, 2022 | | Year Ended July 31, 2021 |
| 2023 Notes | | 2025 Notes | | Total | | 2023 Notes | | 2025 Notes | | Total | | 2023 Notes | | 2025 Notes | | Total |
| Contractual interest expense | $ | 11.6 | | | $ | 7.5 | | | $ | 19.1 | | | $ | 12.7 | | | $ | 7.5 | | | $ | 20.2 | | | $ | 12.7 | | | $ | 7.5 | | | $ | 20.2 | |
Amortization of debt discount(1) | — | | | — | | | — | | | — | | | — | | | — | | | 63.5 | | | 74.3 | | | 137.8 | |
| Amortization of debt issuance costs | 2.6 | | | 4.1 | | | 6.7 | | | 2.8 | | | 4.4 | | | 7.2 | | | 2.3 | | | 2.8 | | | 5.1 | |
| Total interest expense recognized | $ | 14.2 | | | $ | 11.6 | | | $ | 25.8 | | | $ | 15.5 | | | $ | 11.9 | | | $ | 27.4 | | | $ | 78.5 | | | $ | 84.6 | | | $ | 163.1 | |
| Effective interest rate of the liability component | 0.9 | % | | 0.6 | % | | | | 0.9 | % | | 0.6 | % | | | | 5.2 | % | | 5.4 | % | | |
|
| | | | | | | | | | | |
| | Year Ended July 31, |
| | 2017 | | 2016 | | 2015 |
| Amortization of debt discount | $ | 22.0 |
| | $ | 21.1 |
| | $ | 20.2 |
|
| Amortization of debt issuance costs | 2.5 |
| | 2.3 |
| | 2.1 |
|
| Total interest expense recognized | $ | 24.5 |
| | $ | 23.4 |
| | $ | 22.3 |
|
| | | | | | |
| Effective interest rate of the liability component | 4.8 | % | | 4.8 | % | | 4.8 | % |
Note Hedges
To minimize the impact of potential economic dilution upon conversion of the Notes,our convertible senior notes, we entered into separate convertible note hedge transactions (the “2023 Note Hedges,” with respect to the 2023 Notes, the “2025 Note Hedges,” with respect to the 2025 Notes, and the 2023 Notes Hedges together with 2025 Note Hedges, the “Note Hedges”) with respect to our common stock concurrent with the issuance of each series of the Notes.
The following table presents details of our Note Hedges (in millions):
| | | | | | | | | | | |
| Initial Number of Shares | | Aggregate Purchase |
| | | |
2023 Note Hedges(1) | 19.1 | | | $ | 332.0 | |
| 2025 Note Hedges | 20.1 | | | $ | 370.8 | |
(1)The 2023 Note Hedges were settled as a result of the conversions of the 2023 Notes prior to or on July 1, 2023.
The Note Hedges cover up to 5.2 million shares of our common stock at a strike price per share that corresponds to the initial applicable conversion price of the applicable series of the Notes, which are also subject to adjustment, and are exercisable upon conversion of the applicable series of the Notes. The Note Hedges will expire upon maturity of the applicable series of the Notes. The Note Hedges are separate transactions and are not part of the terms of the applicable series of the Notes. Holders of the Notes of either series will not have any rights with respect to the Note Hedges. TheAny shares of our common stock receivable related toby us under the Note Hedges are excluded from the calculation of diluted earnings per share as they are antidilutive. WeThe aggregate amounts paid an aggregate amount of $111.0 million for the Note Hedges which isare included in additional paid-in capital inon our consolidated balance sheets.
As a result of the conversions of the 2023 Notes settled during the year ended July 31, 2023, we exercised the corresponding portion of our 2023 Note Hedges and received 11.4 million shares of our common stock during the period. As of July 31, 2023, none of our 2023 Note Hedges were outstanding.
Warrants
Separately, but concurrently with ourthe issuance of the Notes,each series of our convertible senior notes, we entered into transactions whereby we sold warrants (the “2023 Warrants,” with respect to the 2023 Notes, the “2025 Warrants,” with respect to the 2025 Notes, and the 2023 Warrants together with the 2025 Warrants, the “Warrants”) to acquire up to 5.2 million shares of our common stock, at a strike pricesubject to anti-dilution adjustments. The 2023 Warrants and 2025 Warrants are exercisable over 60 scheduled trading days beginning October 2023 and September 2025, respectively.
The following table presents details of approximately $137.85our Warrants (in millions, except per share subject todata):
| | | | | | | | | | | | | | | | | |
| Initial Number of Shares | | Strike Price per Share | | Aggregate Proceeds |
| | | | | |
| 2023 Warrants | 19.1 | | | $ | 139.27 | | | $ | 145.4 | |
| 2025 Warrants | 20.1 | | | $ | 136.16 | | | $ | 202.8 | |
The shares issuable under the Warrants will beare included in the calculation of diluted earnings per share when the average market value per share of our common stock for the reporting period exceeds the applicable strike price for such series of the Warrants. The Warrants are separate transactions and are not part of theeither series of Notes or Note Hedges and are not remeasured through earnings each reporting period. Holders of the Notes and Note Hedgesof either series will not have any rights with respect to the Warrants. We receivedThe aggregate proceeds of $78.3 millionreceived from the sale of the Warrants which isare included in additional paid-in capital inon our consolidated balance sheets.
Revolving Credit Facility 9. CommitmentsOn September 4, 2018, we entered into a credit agreement (the “2018 Credit Agreement”) with certain institutional lenders that provides for a $400.0 million unsecured revolving credit facility (the “2018 Credit Facility”), with an option to increase the amount of the 2018 Credit Facility by up to an additional $350.0 million, subject to certain conditions. The 2018 Credit Facility expired in April 2023.
On April 13, 2023, we entered into a new credit agreement (the “2023 Credit Agreement”) with certain institutional lenders that provides for a $400.0 million unsecured revolving credit facility (the “2023 Credit Facility”), with an option to increase the amount by up to an additional $350.0 million, subject to certain conditions. The 2023 Credit Facility matures on April 13, 2028.
The borrowings under the 2023 Credit Facility bear interest, at our option, at a base rate plus a spread of 0.000% to 0.375%, or an adjusted term Secured Overnight Financing Rate (“SOFR”) plus a spread of 1.000% to 1.375%, in each case with such spread being determined based on our leverage ratio. We are obligated to pay an ongoing commitment fee on undrawn amounts at a rate of 0.090% to 0.150%, depending on our leverage ratio. The interest rates and Contingenciescommitment fees are also subject to upward and downward adjustments based on our progress towards the achievement of certain sustainability goals related to greenhouse gas emissions.
As of July 31, 2023, there were no amounts outstanding and we were in compliance with all covenants under the 2023 Credit Agreement.
11. Leases
We lease our facilities underhave entered into various non-cancelable operating leases which expireprimarily for our facilities with original lease periods expiring through the year ending July 31, 2028.2033, with the most significant leases relating to our corporate headquarters in Santa Clara.
In May 2015 and October 2015, we entered into twoa total of three lease agreements for a total of approximately 631,000941,000 square feet of corporate office space in Santa Clara, California, which serves as our newcurrent corporate headquarters. The leases commenced in August 2017 and expire in July 2028. In October 2015, we entered into a third lease agreement for approximately 310,000 square feet of additional office space, which is also part of our new corporate headquarters. This lease will commence in April 2018 and expires in July 2028. The leases contain a rent holiday period,periods, scheduled rent increases, lease incentives, and renewal options which allow the lease terms to be extended beyond their expiration dates of July 2028 through July 2046. Rental payments under the three lease agreements are approximately $373.8$412.0 million over the lease term.
In May 2015, we also entered into a lease agreement for approximately 122,000 square feet of space in Santa Clara, California to serve as an extension of our previous corporate headquarters. The lease commenced in February 2016 and expires in April 2021. The lease contains scheduled rent increases, lease incentives, and renewal options which allow the lease term to be extended through July 2046. Rental payments under the lease agreement is approximately $23.1 million over the lease term.
In September 2012, we entered into two lease agreements for a total of approximately 300,000 square feet of space in Santa Clara, California, which served as our previous corporate headquarters through August 2017, when we relocated to our new corporate campus. The leases commenced in November 2012 and August 2013, expire in July 2023, and allow for two separate five-year options to extend the lease term. Payments under these leases are approximately $94.3 million over the lease term. Each lease has a rent holiday, which was included in the determination of rent expense.
In July 2013, we entered into a 51-month sub-lease agreement for our prior corporate headquarters with a commencement date of January 2014. Net proceeds from this sub-lease are approximately $10.7 million over the lease term.
We recognized rent expense of $35.9 million, $20.2 million, and $15.4 million forDuring the years ended July 31, 2017, 2016,2023, 2022, and 2015,2021, our net cost for operating leases was $91.3 million, $89.7 million, and $75.2 million, respectively, primarily consisting of operating lease costs of $64.2 million, $67.6 million, and $59.3 million, respectively. Rent expense is recognized on a straight-line basis overOur net cost for operating leases also included variable lease costs, short-term lease costs, and sublease income in the termperiods presented.
The following tables present additional information for our operating leases (in millions, except for years and percentages):
| | | | | | | | | | | | | | | | | | | | | | | |
| Year Ended July 31, | | | | | | |
| 2023 | | 2022 | | 2021 | | | | | | |
| Operating cash flows used in payments of operating lease liabilities | $ | 82.7 | | | $ | 81.5 | | | $ | 81.7 | | | | | | | |
| Right-of-use assets obtained in exchange for new operating lease liabilities | $ | 71.1 | | | $ | 33.0 | | | $ | 48.6 | | | | | | | |
| | | | | | | | | | | | | | | | | |
| July 31, 2023 | | July 31, 2022 | | | | | | |
| Weighted-average remaining lease term | 5.7 years | | 5.5 years | | | | | | |
| Weighted-average discount rate | 4.7 | % | | 4.0 | % | | | | | | |
The following table presents detailsmaturities of the aggregate future non-cancelable minimum rental payments under our operating leaseslease liabilities as of July 31, 20172023 (in millions):
| | | | | |
| Amount |
| Fiscal years ending July 31: | |
| 2024 | $ | 74.3 | |
| 2025 | 73.4 | |
| 2026 | 67.8 | |
| 2027 | 60.5 | |
| 2028 | 59.6 | |
| 2029 and thereafter | 57.2 | |
| Total operating lease payments | 392.8 | |
| Less: imputed interest | (53.4) | |
| Present value of operating lease liabilities | $ | 339.4 | |
Current portion of operating lease liabilities(1) | $ | 60.2 | |
| Long-term operating lease liabilities | $ | 279.2 | |
|
| | | |
| | Amount |
| Years ending July 31: | |
| 2018 | $ | 31.0 |
|
| 2019 | 50.7 |
|
| 2020 | 60.1 |
|
| 2021 | 57.3 |
|
| 2022 | 53.9 |
|
| 2023 and thereafter | 264.5 |
|
| Committed gross lease payments | 517.5 |
|
| Less: proceeds from sublease rental | 2.1 |
|
| Net operating lease obligation | $ | 515.4 |
|
Facility Exit Costs
To support the growth of our business, in the fourth quarter of fiscal 2017, we committed to plans to relocate our corporate headquarters and sublet our previous headquarter facilities. In connection with the planned relocation, we determined, asAs of July 31, 2017,2023, we had additional non-cancelable operating leases for office space that certain leasehold improvementshad been signed but had not yet commenced with total future minimum lease payments of $72.1 million. These leases are expected to commence on or after fiscal 2024, with lease terms ranging from two to twelve years.
12. Commitments and other long-lived assets associated with our previous facilities were impaired and recognized a loss of $20.9 million in general and administrative expense in our consolidated statements of operations during the year ended July 31, 2017. Refer to Note 2. Fair Value Measurements for more information on our impairment assessment.Contingencies
We exited our previous headquarter facilities and relocated to our new corporate campus in August 2017. Refer to Note 18. Subsequent Events for more information.
Purchase Commitments
Manufacturing Purchase Commitments
Our EMS provider procures components and assembles our products based on our forecasts. These forecasts are based on estimates of demand for our products primarily for the next 12 months, which are in turn based on historical trends and an analysis from our sales and product management organizations, adjusted for overall market conditions. In order to reduce manufacturing lead times and plan for adequate supply, we may issue non-cancelable orders for products and components to ourenter into agreements with manufacturing partners and component suppliers to procure inventory based on our demand forecasts. The following table presents details of the aggregate future minimum or component suppliers. As of July 31, 2017, ourfixed purchase commitments under such orders were $104.1 million, of which $5.6 million represent long-term purchase commitments through the year ending July 31, 2019,these arrangements excluding obligations under contracts that we can cancel withoutas of July 31, 2023 (in millions):
| | | | | | | | | | | | | | | | | | | | | | | | | | | | | | | | | | | | | | | | | | | |
| | | Fiscal years ending July 31, |
| Total | | 2024 | | 2025 | | 2026 | | 2027 | | 2028 | | 2029 and Thereafter | | |
| Manufacturing purchase commitments | $ | 157.4 | | | $ | 82.4 | | | $ | 35.0 | | | $ | 40.0 | | | $ | — | | | $ | — | | | $ | — | | | |
Other Purchase Commitments
We have entered into various non-cancelable agreements with certain service providers, under which we are committed to minimum or fixed purchases. The following table presents details of the aggregate future non-cancelable purchase commitments under these agreements as of July 31, 2023 (in millions):
| | | | | | | | | | | | | | | | | | | | | | | | | | | | | | | | | | | | | | | | | | | |
| | | Fiscal years ending July 31, |
| Total | | 2024 | | 2025 | | 2026 | | 2027 | | 2028 | | 2029 and Thereafter | | |
| Other purchase commitments | $ | 1,519.2 | | | $ | 94.0 | | | $ | 420.6 | | | $ | 519.4 | | | $ | 483.8 | | | $ | 0.6 | | | $ | 0.8 | | | |
Additionally, we have a significant penalty.$155.6 million minimum purchase commitment with a service provider through September 2027 with no specified annual commitments.
Mutual Covenant Not to Sue and Release Agreement
In January 2020, we executed a Mutual Covenant Not to Sue and Release Agreement for $50.0 million to extend an existing covenant not to sue for seven years. As the primary benefit of the arrangement was attributable to future use, the amount was recorded in other assets on our consolidated balance sheets and is amortized to cost of product revenue on our consolidated statements of operations over the estimated period of benefit of seven years.
Litigation
We are subject to legal proceedings, claims, tax matters, and litigation arising in the ordinary course of business, including, for instance, intellectual property litigation. Such matters are subject to many uncertainties and outcomes are not predictable with assurance.patent litigation. We accrue for contingencies when we believe that a loss is probable and that we can reasonably estimate the amount of any such loss. As of July 31, 2023, we have not recorded any significant accruals for loss contingencies associated with such matters.
Legal matters could include speculative, substantial or indeterminate monetary amounts. Significant judgment is required to determine both the likelihood of there being a loss and the estimated amount of a loss related to such matters, and we may be unable to estimate the reasonably possible loss or range of loss. The outcomes of outstanding legal matters are inherently unpredictable, and could, either individually or in aggregate, have a material adverse effect on us and our results of operations. To the extent there is a reasonable possibility that a loss exceeding amounts already recognized may be incurred, and the amount of such additional loss would be material, we will either disclose the estimated additional loss or state that such an estimate cannot be made. As
The following matters arose in the ordinary course of July 31, 2017,business.
Centripetal Networks, Inc. v. Palo Alto Networks
On March 12, 2021, Centripetal Networks, Inc., filed a lawsuit against us in the United States District Court for the Eastern District of Virginia. The lawsuit alleges that our products infringe multiple Centripetal patents. We successfully challenged certain of these patents, which were found unpatentable by the U.S. Patent and Trademark Office. The complaint requests injunctive relief, monetary damages, and attorneys fees. In addition, Centripetal filed infringement contentions on certain of their patents in the European Patent Office in Germany, to which we have not recorded any significant accruals forfiled invalidity challenges. Those matters are still pending. The court has set a trial date of January 22, 2024 on the remaining patents. We are unable, at this time, to reasonably estimate a possible loss contingencies associated with such legal proceedings, determined that an unfavorable outcome is probable or reasonably possible, or determined that the amount orpotential range of anyloss, if any.
Finjan, Inc. v. Palo Alto Networks
On November 4, 2014, Finjan, Inc., filed a lawsuit against us in the United States District Court for the Northern District of California. The lawsuit alleges that our products infringe multiple Finjan patents. The complaint requests injunctive relief, monetary damages, and attorneys fees. The court has set a trial date of April 8, 2024. We are unable, at this time, to reasonably estimate a possible loss or potential range of loss, if any.
Taasera v. Palo Alto Networks
On March 22, 2022, we filed a declaratory judgment action in the United States District Court for the Southern District of New York (“S.D.N.Y”) seeking a ruling that we are not infringing various Taasera patents. Taasera challenged jurisdiction in S.D.N.Y, which issue is currently on appeal with the Federal Circuit. Pursuant to an order of the Judicial Panel on Multidistrict Litigation, this matter has been consolidated in the United States District Court for the Eastern District of Texas with several other patent infringement matters brought by Taasera. The court has set April 1, 2024 as the date for the start of consecutive trials of these consolidated matters. The complaint requests injunctive relief, monetary damages, and attorneys fees. We are unable, at this time, to reasonably estimable.estimate a possible loss or potential range of loss, if any.
Indemnification
Under the indemnification provisions of our standard sales related contracts, we agree to defend our end-customers against third-party claims asserting infringement of certain intellectual property rights, which may include patents, copyrights, trademarks, or trade secrets, and to pay judgments entered on such claims. Our exposure under these indemnification provisions is generally limited to payments made to us for the alleged infringing products over the preceding twelve months under the agreement. However, certain agreements include indemnification provisions that could potentially expose us to losses in excess of these payments. In addition, we indemnify our officers, directors, and certain key employees while they are serving in good faith in their company capacities. To date, we have not recorded any accruals for loss contingencies associated with indemnification claims or determined that an unfavorable outcome is probable or reasonably possible.
10.13. Stockholders’ Equity
Share Repurchase Program
On August 26, 2016,In February 2019, our board of directors authorized a $500.0 million$1.0 billion share repurchase program, which is funded from available working capital. On February 24, 2017,In December 2020, August 2021, and August 2022, our board of directors authorized a $500.0additional $700.0 million, increase$676.1 million, and $915.0 million increases to ourthis share repurchase program, respectively, bringing the total authorization under this share repurchase program to $1.0 billion.$3.3 billion (our “current authorization”). The expiration date of our current authorization was extended to December 31, 2023, and our repurchase program may be suspended or discontinued at any time. Repurchases may be made at management’s discretion from time to time on the open market, through privately negotiated transactions, transactions structured through investment banking institutions, block purchase techniques, 10b5-1 trading plans, or a combination of the foregoing.
The following table summarizes the share repurchase authorization will expire on December 31, 2018, and may be suspended or discontinued at any time.activity under our share repurchase program (in millions, except per share amounts):
During the year ended | | | | | | | | | | | | | | | | | |
| Year Ended July 31, |
| 2023 | | 2022 | | 2021 |
| Number of shares repurchased | 1.8 | | | 5.4 | | | 12.0 | |
Weighted-average price per share (1) | $ | 138.65 | | | $ | 170.83 | | | $ | 98.29 | |
Aggregate purchase price (1) | $ | 250.0 | | | $ | 915.0 | | | $ | 1,178.1 | |
(1)Includes transaction costs
As of July 31, 2017, we repurchased and retired 3.32023, $750.0 million shares ofremained available for future share repurchases under our common stock under the authorization for an aggregate purchase price of $420.1 million, including transaction costs.current repurchase authorization. The total price of the shares repurchased and related transaction costs are reflected as a reduction to common stock and additional paid-in capital on our consolidated balance sheets. As of July, 31, 2017, $580.0 million remained available for future share repurchases under the repurchase authorization.
11.14. Equity Award Plans
Share-Based Compensation Plans
2012Equity Incentive Plans
Our 2021 Equity Incentive Plan
Our (our “2021 Plan”) became effective in December 2021 and replaced our 2012 Equity Incentive Plan (our “2012 Plan”) was adopted by our board of directors and approved by the stockholders on June 5, 2012 and was effective one business day prior to the effectiveness of our registration statement for our initial public offering (“IPO”). Our 2012 Plan replaced our 2005 Equity Incentive Plan (our “2005 Plan”), which terminated upon the completion of our IPO, however, awards that were outstanding upon termination remained outstanding pursuant to their original terms. Our 20122021 Plan provides for the granting of stock options, stock appreciation rights, restricted stock awards (“RSAs”), restricted stock units (“RSUs”), stock appreciation rights, performance units, and performance shares (“PSAs”), performance-based stock units (“PSUs”) and performance stock options (“PSOs”) to our employees, directors, and consultants.
Upon effectiveness of the 2021 Plan, the 2012 Plan was terminated and no further awards will be granted under the 2012 Plan. Awards grantedthat were outstanding upon such termination remained outstanding pursuant to their original terms, and any subsequent expiration, cancellation or forfeiture of awards under our 2012 Plan are returned to our 2021 Plan.
The majority of our equity awards are RSUs, which generally vest over the periods determined by the boarda period of directors, generally three to four years from the date of grant, and our options expire no more than ten years after the date of grant. Since our IPO in 2012, awards granted
under our 2012 Plan consist primarily of RSUs. Until vested, RSUs do not have the voting and dividend participation rights of common stock and the shares underlying the awards are not considered issued and outstanding.
In October 2016, we granted PSAs to certain employees, which willOur PSUs generally vest over a period ofone to four years from the date of grant. The actual number of PSAs earned andPSUs eligible to vest is determined based on the level of achievement against certain performance conditions, market conditions, and a pre-established billingscombination thereof.
During the year ended July 31, 2023, we granted 0.9 million shares of PSUs with both service and market conditions. The market conditions are satisfied when the price of our common stock is equal to or exceeds stock price targets of $233.33, $266.67, $300.00, and $333.33 based on the average closing price for 30 consecutive trading days during the three- or four-year period following the date of grant. To the extent the market conditions have been met, one-fourth of the awards will vest on each anniversary date of the grant date, subject to continued service. During the year ended July 31, 2023, the first stock price target for these PSU awards was met, and the related shares will vest when the underlying service conditions are satisfied.
During the year ended July 31, 2023, we granted 0.8 million shares of PSUs, which contain service and market conditions. The service conditions are satisfied after a period of five years. The market condition is measured based on our TSR relative to the TSR of the companies listed in the Standard & Poor’s 500 index.
During the years ended July 31, 2023 and 2022, we granted 1.6 million and 0.6 million shares of PSUs, respectively, which contain service, performance and market conditions. The service conditions are satisfied after a period of one to three years. The performance conditions are based on revenue growth or billing growth. The market condition is measured based on our total shareholder return (“TSR”) relative to the TSR of the companies listed in the Standard & Poor’s 500 index. As of July 31, 2023, we have approved 2.3 million shares of PSUs, which will be granted upon the performance condition being established during the next two years.
We have also granted PSOs with both service and market conditions. The market condition for PSOs granted in the fiscal years 2018 and 2019 requires the price of our common stock to equal or exceed $99.25, $132.33, $165.42, and $198.50 based on the average closing price for 30 consecutive trading days during the four-, five-, six-, and seven-and-a-half-year periods following the date of grant in fiscal year 2018 and 2019, respectively. The market condition for PSOs granted in the fiscal year ending2021 requires the price of our common stock to equal or exceed $132.33, $165.42, $198.50 and $233.33 based on the average closing price for 30 consecutive trading days during the three-, four-, five-, and six-and-a-half-year periods following the date of grant. All of the PSOs granted in the fiscal year 2021 were forfeited in the same fiscal year and are no longer outstanding. To the extent that the market conditions are met, one-fourth of the PSOs vest on each anniversary date of the grant date for such PSOs, subject to continued service. The maximum contractual term of our outstanding PSOs is seven and a half years from the date of grant, depending on vesting period. As of July 31, 2017.2023, all of our outstanding PSOs have been fully vested.
In February 2017, we began to
We net-share settle equity awards held by certain employees by withholding shares upon vesting to satisfy tax withholding obligations. The shares withheld to satisfy employee tax withholding obligations are returned to our 20122021 Plan and will be available for future issuance. Payments for employees’ tax obligations to the tax authorities are recognized as a reduction to additional paid-in capital and reflected as financing activities inon our consolidated statements of cash flows.
A total of 16.935.6 million shares of our common stock are reserved for issuance pursuant to our 2012 Planequity incentive plans as of July 31, 2017. This includes shares that are (i) reserved but unissued under our 2005 Plan on the effective date of our 2012 Plan or (ii) returned to our 2005 Plan as a result of expiration or termination of options. On the first day of each fiscal year, the number of shares in the reserve may be increased by the lesser of (i) 8,000,000 shares, (ii) 4.5% of the outstanding shares of common stock on the last day of our immediately preceding fiscal year, or (iii) such other amount as determined by our board of directors.2023.
2012 Employee Stock Purchase Plan
Our 2012 Employee Stock Purchase Plan (our “2012 ESPP”) was adopted by our board of directors and approved by the stockholders on June 5, 2012, and was effective upon completion of our IPO.initial public offering (“IPO”). On August 29, 2017, we amended and restated our 2012 Employee Stock Purchase Plan (our “2012 ESPP”) to extend the length of our offering periods from 6 to 24 months.
Our 2012 ESPP permits eligible employees to acquire shares of our common stock at 85% of the lower of the fair market value of our common stock on the first trading day of each offering period or on the exercisepurchase date. EachIf the fair market value of our common stock on the purchase date is lower than the first trading day of the offering period, the current offering period will be approximately six months startingcancelled after purchase and a new 24-month offering period will begin. Under our 2012 ESPP, each 24-month offering period consists of four consecutive 6-month purchase periods, with purchase dates on the first trading dateday on or after March 15February 28 and September 15August 31 of each year. Participants may purchase shares of common stock through payroll deductions of up to 15% of their eligible compensation, subject to purchase limits of 6251,875 shares during aper six-month purchase period orand $25,000 worth of stock for each calendar year. DuringShares purchased under our 2012 ESPP during the yearfiscal years ended July 31, 2017, employees purchased 0.42023, 2022 and 2021 were 1.2 million, shares of common stock under our 2012 ESPP2.1 million and 1.9 million, at an average exercise price of $110.13$138.30 per share.share, $64.27 per share, and $53.69 per share, respectively.
A total of 2.916.4 million shares of our common stock are available for sale under our 2012 ESPP as of July 31, 2017.2023. On the first day of each fiscal year, the number of shares in the reserve may be increased by the lesser of (i) 2,000,0006,000,000 shares, (ii) 1% of the outstanding shares of our common stock on the first day of the fiscal year, or (iii) such other amount as determined by our board of directors.
Assumed Share-Based Compensation Plans
In connection with our acquisitions, we have assumed equity incentive plans of certain acquired companies (collectively “the Assumed Plans”). The equity awards assumed in connection with each acquisition were granted from their respective assumed plans. The assumed equity awards will be settled in shares of our common stock and will retain the terms and conditions under which they were originally granted. No additional equity awards will be granted under and forfeited awards will not be returned to the Assumed Plans. Refer to Note 7. Acquisitions for more information on our acquisitions and the related equity awards assumed.
Stock Option Activities
The following table summarizes the stock option and PSO activity under our stock plans during the reporting periodyears ended July 31, 2023, 2022, and 2021 (in millions, except per share amounts):
| | | | | | | | | | | | | | | | | | | | | | | | | | | | | | | | | | | | | | | | | | | | | | | |
| Stock Options Outstanding | | PSOs Outstanding |
| Number of Shares | | Weighted-Average Exercise Price Per Share | | Weighted-Average Remaining Contractual Term
(Years) | | Aggregate Intrinsic Value | | Number of Shares | | Weighted-Average Exercise Price Per Share | | Weighted-Average Remaining Contractual Term
(Years) | | Aggregate Intrinsic Value |
| Balance—July 31, 2020 | 0.4 | | | $ | 6.53 | | | 1.5 | | $ | 34.2 | | | 8.3 | | | $ | 64.71 | | | 5.2 | | $ | 170.9 | |
| Granted | — | | | $ | — | | | | | | | 0.5 | | | $ | 101.43 | | | | | |
| Exercised | (0.2) | | | $ | 4.27 | | | | | | | — | | | $ | — | | | | | |
| Forfeited | 0.0 | | | $ | 2.61 | | | | | | | (0.5) | | | $ | 101.43 | | | | | |
| Balance—July 31, 2021 | 0.2 | | | $ | 8.74 | | | 0.8 | | $ | 27.4 | | | 8.3 | | | $ | 64.71 | | | 4.2 | | $ | 566.8 | |
| | | | | | | | | | | | | | | |
| Exercised | (0.2) | | | $ | 6.24 | | | | | | | — | | | $ | — | | | | | |
| Forfeited | — | | | $ | — | | | | | | | (0.3) | | | $ | 61.41 | | | | | |
| Balance—July 31, 2022 | 0.0 | | | $ | 18.45 | | | 0.5 | | $ | 6.7 | | | 8.0 | | | $ | 64.85 | | | 3.2 | | $ | 809.3 | |
| | | | | | | | | | | | | | | |
| Exercised | 0.0 | | | $ | 18.45 | | | | | | | (1.6) | | | $ | 63.39 | | | | | |
| | | | | | | | | | | | | | | |
| Balance—July 31, 2023 | — | | | $ | — | | | 0.0 | | $ | — | | | 6.4 | | | $ | 65.20 | | | 2.2 | | $ | 1,184.6 | |
| Exercisable—July 31, 2023 | — | | | $ | — | | | 0.0 | | $ | — | | | 6.4 | | | $ | 65.20 | | | 2.2 | | $ | 1,184.6 | |
|
| | | | | | | | | | | | |
| | Options Outstanding |
| | Number
of
Shares | | Weighted-
Average
Exercise
Price Per Share | | Weighted-
Average
Remaining
Contractual
Term (Years) | | Aggregate
Intrinsic
Value |
| Balance—July 31, 2016 | 2.1 |
| | $ | 13.42 |
| | 5.2 | | $ | 244.9 |
|
| Options granted | — |
| | — |
| | | | |
| Options forfeited | — |
| | — |
| | | | |
| Options exercised | (0.5 | ) | | 14.44 |
| | | | |
| Balance—July 31, 2017 | 1.6 |
| | $ | 13.11 |
| | 4.2 | | $ | 190.6 |
|
| Options exercisable—July 31, 2017 | 1.6 |
| | $ | 13.11 |
| | 4.2 | | $ | 190.6 |
|
The intrinsic value of options exercised during the years ended July 31, 2017, 2016,2023, 2022, and 20152021 was $61.2$237.7 million, $176.1$29.2 million, and $301.1$22.2 million, respectively. The grant-date fair value of options vested during the years ended July 31, 2016 and 2015 was $8.1 million and $14.6 million, respectively. All options were fully vested as of July 31, 2016.
RSU RSA, and PSAPSU Activities
The following table summarizes the RSU RSA, and PSAPSU activity under our stock plans during the reporting periodyears ended July 31, 2023, 2022, and 2021 (in millions, except per share amounts):
| | | | | | | | | | | | | | | | | | | | | | | | | | | | | | | | | | | | | | | |
| RSUs Outstanding | | PSUs Outstanding |
| Number of Shares | | Weighted-Average Grant-Date Fair Value Per Share | | | | Aggregate Intrinsic Value | | Number of Shares | | Weighted-Average Grant-Date Fair Value Per Share | | | | Aggregate Intrinsic Value |
| Balance—July 31, 2020 | 19.8 | | | $ | 67.75 | | | | | $ | 1,688.1 | | | 1.7 | | | $ | 77.14 | | | | | $ | 147.2 | |
Granted(1)(2) | 12.3 | | | $ | 99.30 | | | | | | | 2.5 | | | $ | 107.15 | | | | | |
Vested(3) | (8.8) | | | $ | 66.97 | | | | | | | (0.2) | | | $ | 65.20 | | | | | |
| Forfeited | (2.6) | | | $ | 75.60 | | | | | | | (0.2) | | | $ | 78.65 | | | | | |
| Balance—July 31, 2021 | 20.7 | | | $ | 85.85 | | | | | $ | 2,760.2 | | | 3.8 | | | $ | 97.64 | | | | | $ | 498.4 | |
Granted(1) | 5.9 | | | $ | 164.85 | | | | | | | 0.8 | | | $ | 117.05 | | | | | |
Vested(3) | (9.0) | | | $ | 85.69 | | | | | | | (1.1) | | | $ | 83.47 | | | | | |
| Forfeited | (2.8) | | | $ | 95.50 | | | | | | | (0.4) | | | $ | 107.31 | | | | | |
| Balance—July 31, 2022 | 14.8 | | | $ | 115.51 | | | | | $ | 2,456.9 | | | 3.1 | | | $ | 106.38 | | | | | $ | 513.7 | |
Granted(1) | 5.8 | | | $ | 169.04 | | | | | | | 3.6 | | | $ | 142.88 | | | | | |
Vested(3) | (7.0) | | | $ | 110.93 | | | | | | | (1.3) | | | $ | 112.72 | | | | | |
| Forfeited | (1.5) | | | $ | 128.05 | | | | | | | (0.4) | | | $ | 136.95 | | | | | |
| Balance—July 31, 2023 | 12.1 | | | $ | 142.61 | | | | | $ | 3,013.0 | | | 5.0 | | | $ | 128.64 | | | | | $ | 1,242.3 | |
|
| | | | | | | | | | | | | | | | | | | |
| | RSAs and PSAs Outstanding | | RSUs Outstanding |
| | Number
of
Shares | | Weighted-
Average
Grant-Date Fair Value Per Share | | Number
of
Shares | | Weighted-
Average
Grant-Date Fair Value Per Share | | Weighted-
Average
Remaining
Contractual
Term (Years) | | Aggregate
Intrinsic
Value |
| Balance—July 31, 2016 | 1.1 |
| | $ | 170.97 |
| | 6.5 |
| | $ | 130.14 |
| | 1.1 | | $ | 852.7 |
|
Granted(1) | 0.3 |
| | 148.54 |
| | 3.9 |
| | 141.35 |
| | | | |
| Vested | (0.4 | ) | | 170.97 |
| | (3.3 | ) | | 119.88 |
| | | | |
| Forfeited | — |
| | — |
| | (0.6 | ) | | 139.56 |
| | | | |
| Balance—July 31, 2017 | 1.0 |
| | $ | 163.55 |
| | 6.5 |
| | $ | 141.16 |
| | 1.3 | | $ | 854.1 |
|
______________
(1) The number of PSAsFor PSUs, shares granted representsrepresent the aggregate maximum number of shares that may be earned and issued with
respect to these awards over their full terms.
The(2)Includes 1.2 million RSUs assumed in connection with the acquisitions of Crypsis, Sinefa, Expanse and Bridgecrew, with weighted-average grant-date fair valuevalues of RSAs$80.48, $99.06, $105.82 and PSAs granted during the years ended July 31, 2017 and 2016 was $148.54 and $170.97 per share, respectively. There were no RSAs or PSAs granted during$118.22, respectively, for the year ended July 31, 2015. The aggregate fair value, as of the respective2021.
(3)Includes time-based vesting dates, of RSAs vested during the year ended July 31, 2017 was $62.6 million. No RSAs vested during the years ended July 31, 2016 and 2015, and no PSAs vested during the three years ended July 31, 2017.for PSUs.
The weighted-average grant-date fair value of RSUs granted during the years ended July 31, 2017, 2016, and 2015 was $141.35, $160.60, and $122.36 per share, respectively. The aggregate fair value, as of the respective vesting dates, of RSUs vested during the years ended July 31, 2017, 2016,2023, 2022, and 20152021 was $462.6$1.3 billion, $1.6 billion, and $986.4 million, $513.0respectively. The aggregate fair value, as of the respective vesting dates, of PSUs vested during the years ended July 31, 2023, 2022, and 2021 was $218.9 million, $184.0 million, and $350.4$20.8 million, respectively.
Shares Available for Grant
The following table presents the stock activity and the total number of shares available for grant under our stockequity incentive plans as of July 31, 20172023 (in millions):
|
| | | | |
| Number of shares |
Balance—July 31, 20162022 | 8.213.9 |
|
| Authorized | 4.16.0 |
|
RSUs, RSAs, and PSAs granted | (4.2 | ) |
RSUs and RSAs forfeitedPSUs granted | 0.6(9.4) |
|
| RSUs and PSUs forfeited | 1.8 | |
| Shares withheld for taxes | 0.1 |
|
Balance—July 31, 20172023 | 8.812.4 |
|
Share-Based Compensation
We record share-based compensation awards based on estimated fair value as of the grant date. The fair value of RSUs RSAs, and PSAsPSUs not subject to market conditions is based on the closing market price of our common stock on the date of grant.
The fair value of the PSUs subject to market conditions is estimated on the grant date using a Monte Carlo simulation model. No such PSUs were granted during the year ended July 31, 2021. The following table summarizes the assumptions used and the resulting grant-date fair value of our PSUs subject to market conditions granted during the years ended July 31, 2023 and 2022:
| | | | | | | | | | | |
| Year Ended July 31, |
| 2023 | | 2022 |
| Volatility | 38.3% - 44.8% | | 36.0% - 41.1% |
| Expected term (in years) | 1.0 - 5.0 | | 1.4 - 3.0 |
| Dividend yield | — | % | | — | % |
| Risk-free interest rate | 3.2% - 4.1% | | 0.2% - 2.0% |
| Grant-date fair value per share | $91.77 - $280.41 | | $137.16 - $260.71 |
The expected volatility is based on the historical volatility of our common stock. The expected term is based on the length of each tranche’s performance period from the grant date. The dividend yield assumption is based on our current expectations about our anticipated dividend policy. The risk-free interest rate is based on the implied yield available on U.S. Treasury zero-coupon issues with maturities that approximate the expected term.
The fair value of PSOs is estimated on the grant date using a Monte Carlo simulation model, which predicts settlement of the PSOs midway between the vesting term and the contractual term. No PSOs were granted during the years ended July 31, 2023 and 2022. The following table summarizes the assumptions used and the resulting grant-date fair values of our PSOs granted during the year ended July 31, 2021:
| | | | | | | |
| Year Ended July 31, 2021 | | |
| Volatility | 35.9 | % | | |
| Dividend yield | — | % | | |
| Risk-free interest rate | 0.6 | % | | |
| Weighted-average grant-date fair value per share | $27.37 | | | |
The expected volatility is based on a combination of implied volatility from traded options on our common stock and the historical volatility of our common stock. The dividend yield assumption is based on our current expectations about our anticipated dividend policy. The risk-free interest rate is based on the implied yield available on U.S. Treasury zero-coupon issues with terms equal to the contractual terms of each tranche.
The fair value of shares sold throughissued under our 2012 ESPP are estimated on the grant date using the Black-Scholes option pricing model. The following table summarizes the assumptions used and the resulting grant-date fair values of our ESPP:
| | | | | | | | | | | | | | | | | |
| Year Ended July 31, |
| 2023 | | 2022 | | 2021 |
| Volatility | 38.6% - 44.7% | | 33.6% - 39.4% | | 34.9% - 42.6% |
| Expected term (in years) | 0.5 - 2.0 | | 0.5 - 2.0 | | 0.5 - 2.0 |
| Dividend yield | — | % | | — | % | | — | % |
| Risk-free interest rate | 3.3% - 5.2% | | 0.1% - 1.4% | | 0.1% |
| Grant-date fair value per share | $48.78 - $74.06 | | $37.59 - $74.10 | | $23.16 - $43.02 |
The expected volatility is based on a combination of implied volatility from traded options on our common stock and the historical volatility of our common stock. The expected term represents the term from the first day of the offering period to the purchase dates within each offering period. The dividend yield assumption is based on our current expectations about our anticipated dividend policy. The risk-free interest rate is based on the implied yield available on U.S. Treasury zero-coupon issues with maturities that approximate the expected term.
The following table summarizes share-based compensation included in costs and expenses (in millions):
| | | | | | | | | | | | | | | | | |
| Year Ended July 31, |
| 2023 | | 2022 | | 2021 |
| Cost of product revenue | $ | 9.8 | | | $ | 9.3 | | | $ | 6.2 | |
| Cost of subscription and support revenue | 123.4 | | | 110.2 | | | 93.0 | |
| Research and development | 488.4 | | | 471.1 | | | 428.9 | |
| Sales and marketing | 335.3 | | | 304.7 | | | 269.9 | |
| General and administrative | 130.4 | | | 118.1 | | | 128.9 | |
| Total share-based compensation | $ | 1,087.3 | | | $ | 1,013.4 | | | $ | 926.9 | |
|
| | | | | | | | | | | |
| | Year Ended July 31, |
| | 2017 | | 2016 | | 2015 |
| Cost of product revenue | $ | 7.3 |
| | $ | 6.2 |
| | $ | 3.9 |
|
| Cost of subscription and support revenue | 56.2 |
| | 40.9 |
| | 20.4 |
|
| Research and development | 152.6 |
| | 132.9 |
| | 74.8 |
|
| Sales and marketing | 186.5 |
| | 152.4 |
| | 84.1 |
|
| General and administrative | 73.1 |
| | 60.5 |
| | 38.2 |
|
| Total share-based compensation | $ | 475.7 |
| | $ | 392.9 |
| | $ | 221.4 |
|
AtAs of July 31, 2017,2023, total compensation cost related to unvested share-based awards not yet recognized was $906.8 million.$2.0 billion. This cost is expected to be amortized on a straight-line basis over a weighted-average period of approximately 2.6 years. Future grants will increase the amount of compensation expense to be recorded in these periods.
12.15. Income Taxes
The following table presents the components of income (loss) before income taxes (in millions):
| | | | | | | | | | | | | | | | | |
| | Year Ended July 31, |
| | 2023 | | 2022 | | 2021 |
| United States | $ | 374.3 | | | $ | (152.3) | | | $ | (482.2) | |
| Foreign | 192.0 | | | (54.9) | | | 17.2 | |
| Total | $ | 566.3 | | | $ | (207.2) | | | $ | (465.0) | |
|
| | | | | | | | | | | |
| | Year Ended July 31, |
| | 2017 | | 2016(1) | | 2015(1) |
| United States | $ | (210.0 | ) | | $ | (195.3 | ) | | $ | (21.3 | ) |
| Foreign | 15.9 |
| | 23.0 |
| | (100.6 | ) |
| Total | $ | (194.1 | ) | | $ | (172.3 | ) | | $ | (121.9 | ) |
______________
| |
(1) | Certain amounts have been adjusted due to our voluntary change in accounting policy for sales commissions. Refer to Note 1. Description of Business and Summary of Significant Accounting Policies for more information. |
The following table summarizes our provision for income taxes (in millions):
| | | | | | | | | | | | | | | | | |
| | Year Ended July 31, |
| | 2023 | | 2022 | | 2021 |
| Federal: | | | | | |
| Current | $ | 26.1 | | | $ | 2.6 | | | $ | 3.3 | |
| Deferred | 19.3 | | | (0.3) | | | (5.9) | |
| State: | | | | | |
| Current | 44.0 | | | 1.5 | | | 1.7 | |
| Deferred | 0.4 | | | 0.1 | | | 0.1 | |
| Foreign: | | | | | |
| Current | 44.0 | | | 58.8 | | | 41.3 | |
| Deferred | (7.2) | | | (2.9) | | | (6.6) | |
| Total | $ | 126.6 | | | $ | 59.8 | | | $ | 33.9 | |
|
| | | | | | | | | | | |
| | Year Ended July 31, |
| | 2017 | | 2016(1) | | 2015 |
| Federal: | | | | | |
| Current | $ | 3.4 |
| | $ | 1.9 |
| | $ | 1.8 |
|
| Deferred | — |
| | (0.6 | ) | | (3.0 | ) |
| State: | | | | | |
| Current | 0.9 |
| | 1.1 |
| | 0.7 |
|
| Deferred | — |
| | (0.1 | ) | | (0.4 | ) |
| Foreign: | | | | | |
| Current | 19.7 |
| | 19.1 |
| | 10.7 |
|
| Deferred | (1.5 | ) | | (1.0 | ) | | (0.4 | ) |
| Total | $ | 22.5 |
| | $ | 20.4 |
| | $ | 9.4 |
|
______________
| |
(1) | Certain amounts have been adjusted due to our voluntary change in accounting policy for sales commissions. Refer to Note 1. Description of Business and Summary of Significant Accounting Policies for more information. |
For the year ended July 31, 2017,2023, our provision for income taxes increased compared to the year ended July 31, 20162022, primarily due to increases in foreign withholding taxes and U.S. income taxes related to intercompany transactions, offset by tax benefits from our adoption of new share-based payment accounting guidanceprofitability in fiscal 2017. Refer2023 and an increase in U.S. taxes driven by capitalization of research and development expenditure with no offsetting deferred benefit due to Note 1. Description of Business and Summary of Significant Accounting Policies for more information on our adoption of the accounting guidance.valuation allowance.
For the year ended July 31, 2016,2022, our provision for income taxes increased compared to the year ended July 31, 20152021, primarily due to an increase in foreign taxesincome and amortizationwithholding taxes.
The following table presents the items accounting for the difference between income taxes computed at the federal statutory income tax rate and our provision for income taxes:
| | | | | | | | | | | | | | | | | |
| | Year Ended July 31, |
| 2023 | | 2022 | | 2021 |
| Federal statutory rate | 21.0 | % | | 21.0 | % | | 21.0 | % |
| Effect of: | | | | | |
| State taxes, net of federal tax benefit | 2.8 | | | 2.7 | | | 1.3 | |
| Effects of non-U.S. operations | 9.7 | | | (16.5) | | | (3.1) | |
| Change in valuation allowance | 15.5 | | | (158.7) | | | (40.7) | |
| | | | | |
| Share-based compensation | (12.6) | | | 83.6 | | | 5.0 | |
| | | | | |
| Tax credits | (15.6) | | | 41.5 | | | 9.9 | |
| Non-deductible expenses | 2.3 | | | (2.5) | | | (1.3) | |
| Other, net | (0.7) | | | — | | | 0.6 | |
| Total | 22.4 | % | | (28.9) | % | | (7.3) | % |
|
| | | | | | | | |
| | Year Ended July 31, |
| | 2017 | | 2016(1) | | 2015(1) |
| Federal statutory rate | 35.0 | % | | 35.0 | % | | 35.0 | % |
| Effect of: | | | | | |
| State taxes, net of federal tax benefit | 2.8 |
| | (1.7 | ) | | 4.6 |
|
| Foreign income at other than U.S. rates | (14.4 | ) | | (7.8 | ) | | (6.1 | ) |
| Change in valuation allowance | (39.4 | ) | | (25.4 | ) | | (28.8 | ) |
| Share-based compensation | 1.6 |
| | (15.9 | ) | | (13.0 | ) |
| Amortization of deferred tax charges | (3.6 | ) | | (3.4 | ) | | (2.8 | ) |
| Research credits | 10.1 |
| | 11.3 |
| | 8.6 |
|
| Other, net | (3.7 | ) | | (3.9 | ) | | (5.2 | ) |
| Total | (11.6 | )% | | (11.8 | )% | | (7.7 | )% |
______________
| |
(1) | Certain amounts have been adjusted due to our voluntary change in accounting policy for sales commissions. Refer to Note 1. Description of Business and Summary of Significant Accounting Policies for more information. |
The change in foreign income at other than U.S. rates from the year ended July 31, 2016 to July 31, 2017 was due to current year intercompany transactions.
During the year ended July 31, 2017, we adopted new share-based payment accounting guidance that requires us to recognize excess tax benefits or deficiencies as income tax expense or benefit in the period in which they occur, rather than additional paid-in capital. The effect of the change from this guidance is reflected in the share-based compensation line above.
During the year ended July 31, 2016, we accounted for the outcome of The Gillette Company et al. v. California Franchise Tax Board which disallowed the election to use an evenly weighted, three factor apportionment formula utilized by us on our tax return for the year ended July 31, 2014.The impact for the change in apportionment is reflected in state taxes, net of federal tax benefit above and is fully offset by changes in our valuation allowance.
The following table presents the components of our deferred tax assets and liabilities as of July 31, 20172023 and July 31, 20162022 (in millions):
|
| | | | | | | |
| | July 31, |
| | 2017 | | 2016(1) |
| Deferred tax assets: | | | |
| Accruals and reserves | $ | 35.9 |
| | $ | 43.5 |
|
| Deferred revenue | 123.2 |
| | 62.0 |
|
| Net operating loss carryforwards | 245.3 |
| | 5.4 |
|
| Research and development and foreign tax credits | 69.3 |
| | 41.4 |
|
| Share-based compensation | 45.4 |
| | 55.2 |
|
| Gross deferred tax assets | 519.1 |
| | 207.5 |
|
| Valuation allowance | (464.1 | ) | | (161.3 | ) |
| Total deferred tax assets | 55.0 |
| | 46.2 |
|
| Deferred tax liabilities: | | | |
| Fixed assets and intangible assets | (9.1 | ) | | (14.2 | ) |
| Deferred commissions | (36.8 | ) | | (27.7 | ) |
| Other deferred tax liabilities | (4.0 | ) | | (2.5 | ) |
| Total deferred tax liabilities | (49.9 | ) | | (44.4 | ) |
| Total | $ | 5.1 |
| | $ | 1.8 |
|
______________
| |
(1) | Certain amounts have been adjusted due to our voluntary change in accounting policy for sales commissions. Refer to Note 1. Description of Business and Summary of Significant Accounting Policies for more information. |
During the year ended July 31, 2017, we adopted new share-based payment accounting guidance related to the timing of when excess tax benefits are recognized. We adopted the guidance on a modified retrospective basis and, as a result, our deferred tax assets for the year ended July 31, 2017 reflect additional net operating losses of $385.7 million and research and development credits of $5.3 million that were not included in the balances for the year ended July 31, 2016. In addition, our valuation allowance increased $389.2 million as a result of adopting the new guidance. The increase in net operating losses due to the adoption of the new guidance was partially offset by income in the U.S. due to intercompany transactions. | | | | | | | | | | | |
| | July 31, |
| | 2023 | | 2022 |
| | | |
| Deferred tax assets: | | | |
| Accruals and reserves | $ | 88.5 | | | $ | 141.1 | |
| Operating lease liabilities | 94.1 | | | 86.0 | |
| Deferred revenue | 708.1 | | | 475.5 | |
| Net operating loss carryforwards | 551.0 | | | 759.1 | |
| Tax credits | 338.9 | | | 317.4 | |
| Capitalized research expenditures | 354.8 | | | — | |
| Share-based compensation | 66.0 | | | 59.2 | |
| Fixed assets and intangible assets | 1,698.3 | | | 1,803.6 | |
| Interest carryforward | — | | | 55.8 | |
| Gross deferred tax assets | 3,899.7 | | | 3,697.7 | |
| Valuation allowance | (3,586.7) | | | (3,414.1) | |
| Total deferred tax assets | 313.0 | | | 283.6 | |
| Deferred tax liabilities: | | | |
| | | |
| Operating lease right-of-use assets | (73.5) | | | (61.0) | |
| Deferred contract costs | (186.7) | | | (183.6) | |
| Other deferred tax liabilities | (58.2) | | | (27.8) | |
| Total deferred tax liabilities | (318.4) | | | (272.4) | |
| Net deferred tax assets (liabilities) | $ | (5.4) | | | $ | 11.2 | |
A valuation allowance is provided when it is more likely than not that the deferred tax asset will not be realized. RealizationWe regularly evaluate the need for a valuation allowance. We evaluate and weigh all available positive and negative evidence such as historic results, future reversals of existing deferred tax assets is dependent uponliabilities, projected future taxable income, if any,as well as prudent and feasible tax-planning strategies. The assessment requires significant judgment and is performed in each of the amount and timingapplicable jurisdictions. Due to recent profitability, a reversal of which are uncertain. At such time, if it is determined that it is more likely than not that the deferred tax assets are realizable, theour valuation allowance will be adjusted.in certain jurisdictions in the foreseeable future is reasonably possible. As of July 31, 2017,2023, we have provided a valuation allowance for our federal, state, United Kingdom, and certain other foreign deferred tax assets that we believe will, more likely than not, be unrealizable. The net valuation allowance increased by approximately $302.8$172.6 million from the year ended July 31, 20162022 to the year ended July 31, 2017. The increase was2023, primarily due to the adoptioncapitalization of new share-based payment accounting guidanceresearch and wasdevelopment expenditures and deferred revenue, partially offset by NOL utilization related to intercompany transactions.net operating losses and intangible assets.
As of July 31, 2017,2023, we had federal, state, and foreign NOLnet operating loss carryforwards of approximately $1.1 billion, $806.4$66.2 million, $447.8 million, and $45.8 million,$2.0 billion, respectively, as reported on our tax returns, available to reduce future taxable income, if any. If not utilized, our federal and state NOLnet operating loss carryforwards will expire in various amounts at various dates beginning in the years ending July 31, 20272034 and July 31, 2018,2026, respectively. Our foreign NOLnet operating loss will carry forward indefinitely.
As of July 31, 2017,2023, we had federal and state research and development tax credit carryforwards of approximately $48.6$323.9 million and $49.7$249.3 million, respectively, as reported on our tax returns. If not utilized, the federal credit carryforwards will expire in various amounts at various dates beginning in the year ending July 31, 2026.2028. The state credit will carry forward indefinitely.carryforwards have no expiration.
As of July 31, 2017,2023, we had foreign tax credit carryforwards of $2.5$10.6 million as reported on our tax returns. If not utilized, the foreign tax credit carryforwards will expire in various amounts at various dates beginning in the year ending July 31, 2021.2024.
Utilization of the NOLnet operating loss carryforwards and credits may be subject to a substantial annual limitation due to the ownership change limitations provided by the Internal Revenue Code of 1986, as amended, and similar state provisions. The annual limitation may result in the expiration of NOLsnet operating losses and credits before utilization.
As a result of adopting the new share-based payment guidance, we did not reflect the impact of excess tax benefits in additional paid-in capital for the year ended July 31, 2017. Prior to adopting this guidance, we recorded excess tax benefits of $0.5 million and $2.5 million directly to additional paid-in capital for the years ended July 31, 2016 and 2015, respectively.
During the year ended July 31, 2017, we were awarded a tax incentive by a foreign jurisdiction. The incentive is effective through September 30, 2031, and is conditional upon meeting certain investment and employment thresholds. The impact of this incentive on our provision for income taxes was not material for the year ended July 31, 2017.
As of July 31, 2017,2023, we had $301.3$360.0 million of unrecognized tax benefits, $34.0$70.4 million of which would affect income tax expense if recognized, after consideration of our valuation allowance in the United States and other assets. As of July 31, 2016,2022, we had $127.7$414.0 million of unrecognized tax benefits, $21.9$76.1 million of which would affect income tax expense if recognized, after consideration of our valuation allowance in the United States. As of July 31, 2017, our federal, state,States and foreign returns for the tax years 2008 through the current period remain subject to adjustment due to examination. Fiscal years outside the normal statute of limitation remain open to audit by tax authorities due to tax attributes generated in earlier years, which have been carried forward and may be audited in subsequent years when utilized.other assets. We do not expect the amount of unrecognized tax benefits as of July 31, 20172023 to materially change significantly over the next 12 months.
We file federal, state, and foreign income tax returns in jurisdictions with varying statutes of limitations. Generally, all years remain subject to adjustment due to our net operating loss and credit carryforwards. We currently have ongoing tax audits in various jurisdictions and at various times. The primary focus of these audits is, generally, profit allocation. The ultimate amount and timing of any future settlements cannot be predicted with reasonable certainty.
We recognize both interest and penalties associated with uncertain tax positions as a component of income tax expense. During the year ended July 31, 2023, we recognized a net income tax benefit related to interest and penalties of $4.8 million. During the years ended July 31, 2017, 2016,2022 and 2015,2021, we recognized income tax expense related to interest and penalties of $2.1 million, $1.6$5.2 million and $1.1$3.5 million, respectively. We had accrued interest and penalties on our consolidated balance sheets related to unrecognized tax benefits of $5.4$5.1 million and $3.3$20.9 million as of July 31, 20172023 and 2016,2022, respectively. The ultimate amount and timing of any future cash settlements cannot be predicted with reasonable certainty.
The following table presents a reconciliation of the beginning and ending amount of our gross unrecognized tax benefits (in millions):
| | | | Year Ended July 31, | | Year Ended July 31, |
| | 2017 | | 2016 | | 2015 | | 2023 | | 2022 | | 2021 |
| Unrecognized tax benefits at the beginning of the period | $ | 127.7 |
| | $ | 67.2 |
| | $ | 10.4 |
| Unrecognized tax benefits at the beginning of the period | $ | 414.0 | | | $ | 372.9 | | | $ | 326.4 | |
| Additions for tax positions taken in prior years | 3.1 |
| | 25.2 |
| | 6.1 |
| Additions for tax positions taken in prior years | 7.8 | | | 3.5 | | | 26.5 | |
| Reductions for tax positions taken in prior years | — |
| | — |
| | (0.6 | ) | Reductions for tax positions taken in prior years | (99.8) | | | (7.4) | | | (2.5) | |
| Additions for tax positions taken in the current year | 170.5 |
| | 35.3 |
| | 51.3 |
| Additions for tax positions taken in the current year | 66.9 | | | 45.0 | | | 22.5 | |
| Reduction relating to audit settlement | | Reduction relating to audit settlement | (28.9) | | | — | | | — | |
| Unrecognized tax benefits at the end of the period | $ | 301.3 |
| | $ | 127.7 |
| | $ | 67.2 |
| Unrecognized tax benefits at the end of the period | $ | 360.0 | | | $ | 414.0 | | | $ | 372.9 | |
During the year ended July 31, 2017,2023, our reductions in uncertain tax positions primarily related to settlements with non-U.S. tax authorities and remeasurement of certain unrecognized tax benefits. As a result of our settlement agreements with non-U.S. tax authorities, we paid a total of $39.8 million, including interest and penalties.
Our additions for tax positions taken in the current year were primarily attributable to uncertainties related to intercompany transactions.
During the yearyears ended July 31, 2016, our additions for tax positions taken in prior years2023, 2022 and additions for tax positions taken in the current year2021 were primarily attributable to uncertain tax positions relatingrelated to federal and state research and development credits, adjustments for California apportionment, and transfer pricing methodologies.tax credits.
As of July 31, 2017,2023, we had no unremitted earnings when evaluating our outside basis differencesdifference relating to our U.S. investment in foreign subsidiaries. Accordingly, we haveHowever, there could be local withholding taxes due to various foreign countries if certain lower tier earnings are distributed. Withholding taxes that would be payable upon remittance of these lower tier earnings are not provided a deferred tax liability for any potential U.S. income taxes or foreign withholding taxes.material.
13.
16. Net LossIncome (Loss) Per Share
Basic net lossincome (loss) per share is computed by dividing net lossincome (loss) by basic weighted-average shares outstanding during the period. Diluted net lossincome (loss) per share is computed by dividing net lossincome (loss) by diluted weighted-average shares outstanding includingduring the period giving effect to all potentially dilutive securities.securities to the extent they are dilutive. Potentially dilutive securities include shares issuable upon conversion of our convertible senior notes using the if-converted method, warrants related to the issuance of convertible senior notes, and equity awards under our employee equity incentive plans using the treasury stock method.
The following table presents the computation of basic and diluted net lossincome (loss) per share of common stock (in millions, except per share data):
|
| | | | | | | | | | | |
| | Year Ended July 31, |
| | 2017 | | 2016 | | 2015 |
| Net loss | $ | (216.6 | ) | | $ | (192.7 | ) | | $ | (131.3 | ) |
| Weighted-average shares used to compute net loss per share, basic and diluted | 90.6 |
| | 87.1 |
| | 81.6 |
|
| Net loss per share, basic and diluted | $ | (2.39 | ) | | $ | (2.21 | ) | | $ | (1.61 | ) |
| | | | | | | | | | | | | | | | | |
| | Year Ended July 31, |
| | 2023 | | 2022 | | 2021 |
| Net income (loss) | $ | 439.7 | | | $ | (267.0) | | | $ | (498.9) | |
| Weighted-average shares used to compute net income (loss) per share, basic | 303.2 | | | 295.6 | | | 289.1 |
| Weighted-average effect of potentially dilutive securities: | | | | | |
| Convertible senior notes | 17.9 | | | — | | | — | |
| Warrants related to the issuance of convertible senior notes | 9.3 | | | — | | | — | |
| Employee equity incentive plans | 11.9 | | | — | | | — | |
| Weighted-average shares used to compute net income (loss) per share, diluted | 342.3 | | | 295.6 | | | 289.1 |
| Net income (loss) per share, basic | $ | 1.45 | | | $ | (0.90) | | | $ | (1.73) | |
| Net income (loss) per share, diluted | $ | 1.28 | | | $ | (0.90) | | | $ | (1.73) | |
The following securities were excluded from the computation of diluted net lossincome (loss) per share of common stock for the periods presented as their effect would have been antidilutive (in millions):
| | | | | | | | | | | | | | | | | |
| Year Ended July 31, |
| 2023 | | 2022 | | 2021 |
| Convertible senior notes | — | | | 39.2 | | | 39.2 | |
| Warrants related to the issuance of convertible senior notes | — | | | 39.2 | | | 39.2 | |
| Employee equity incentive plans | 3.9 | | | 26.8 | | | 34.9 | |
| Total | 3.9 | | | 105.2 | | | 113.3 | |
|
| | | | | | | | |
| | Year Ended July 31, |
| | 2017 | | 2016 | | 2015 |
| RSUs | 6.5 |
| | 6.5 |
| | 7.2 |
|
| Convertible senior notes | 5.2 |
| | 5.2 |
| | 5.2 |
|
| Warrants related to the issuance of convertible senior notes | 5.2 |
| | 5.2 |
| | 5.2 |
|
| Options to purchase common stock | 1.6 |
| | 2.1 |
| | 3.3 |
|
| RSAs and PSAs | 1.0 |
| | 1.1 |
| | — |
|
| ESPP shares | 0.2 |
| | 0.1 |
| | 0.1 |
|
| Total | 19.7 |
| | 20.2 |
| | 21.0 |
|
14.17. Other Income, Net
The following table sets forth the components of other income, net (in millions):
| | | | | | | | | | | | | | | | | |
| Year Ended July 31, |
| 2023 | | 2022 | | 2021 |
| Interest income | $ | 224.4 | | | $ | 15.6 | | | $ | 8.5 | |
| Foreign currency exchange gains (losses), net | (7.9) | | | 1.8 | | | (5.4) | |
| Other, net | (10.3) | | | (8.4) | | | (0.7) | |
| Total other income, net | $ | 206.2 | | | $ | 9.0 | | | $ | 2.4 | |
|
| | | | | | | | | | | |
| | Year Ended July 31, |
| | 2017 | | 2016 | | 2015 |
| Interest income | $ | 14.7 |
| | $ | 8.8 |
| | $ | 3.9 |
|
| Foreign currency exchange losses, net | (3.4 | ) | | — |
| | (3.0 | ) |
| Other | (1.1 | ) | | (0.4 | ) | | (0.7 | ) |
| Total other income, net | $ | 10.2 |
| | $ | 8.4 |
| | $ | 0.2 |
|
15. Employee Benefit Plan
We have established a 401(k) tax-deferred savings plan which permits participants to make contributions by salary deduction pursuant to Section 401(k) of the Internal Revenue Code. In fiscal 2016, we began to make matching contributions based upon the amount of employees’ contributions, subject to certain limitations. Our matching contributions to the plan were immaterial for the years ended July 31, 2017 and 2016.
16.18. Segment Information
We conduct business globally and sales are primarily managed on a geographic theater basis. Our chief operating decision maker reviews financial information presented on a consolidated basis accompanied by information about revenue by geographic region for purposes of allocating resources and evaluating financial performance. We have one business activity and there are no segment managers who are held accountable for operations, operating results, and plans for levels, components, or types of products or services below the consolidated unit level. Accordingly, we are considered to be in a single reportable segment and operating unit structure.
The following table presents our long-lived assets, which consist of property and equipment, net and operating lease right-of-use assets, by geographic region (in millions):
| | | | | | | | | | | |
| | Year Ended July 31, |
| | 2023 | | 2022 |
| Long-lived assets: | | | |
| United States | $ | 400.4 | | | $ | 446.1 | |
| Israel | 76.8 | | | 55.4 | |
| Other countries | 140.6 | | | 98.3 | |
| Total long-lived assets | $ | 617.8 | | | $ | 599.8 | |
Refer to Note 2. Revenue for revenue by geographic theater (in millions):
|
| | | | | | | | | | | |
| | Year Ended July 31, |
| | 2017 | | 2016 | | 2015 |
| Revenue: | | | | | |
| Americas | | | | | |
| United States | $ | 1,155.3 |
| | $ | 901.8 |
| | $ | 593.8 |
|
| Other Americas | 82.1 |
| | 71.4 |
| | 45.6 |
|
| Total Americas | 1,237.4 |
| | 973.2 |
| | 639.4 |
|
| Europe, the Middle East, and Africa (“EMEA”) | 320.1 |
| | 247.1 |
| | 178.7 |
|
| Asia Pacific and Japan (“APAC”) | 204.1 |
| | 158.2 |
| | 110.0 |
|
| Total revenue | $ | 1,761.6 |
| | $ | 1,378.5 |
| | $ | 928.1 |
|
The following table presentsand revenue for groups of similar products and services (in millions):
|
| | | | | | | | | | | |
| | Year Ended July 31, |
| | 2017 | | 2016 | | 2015 |
| Revenue: | | | | | |
| Product | $ | 709.1 |
| | $ | 670.8 |
| | $ | 492.7 |
|
| Subscription and support | | | | | |
| Subscription | 550.8 |
| | 357.0 |
| | 212.7 |
|
| Support | 501.7 |
| | 350.7 |
| | 222.7 |
|
| Total subscription and support | 1,052.5 |
| | 707.7 |
| | 435.4 |
|
| Total revenue | $ | 1,761.6 |
| | $ | 1,378.5 |
| | $ | 928.1 |
|
The following table presents our property and equipment, net by geographic region (in millions):
|
| | | | | | | |
| | Year Ended July 31, |
| | 2017 | | 2016 |
| Property and equipment, net: | | | |
| United States | $ | 178.4 |
| | $ | 102.3 |
|
| International | 32.7 |
| | 14.9 |
|
| Total property and equipment, net | $ | 211.1 |
| | $ | 117.2 |
|
17. Selected Quarterly Financial Data (Unaudited)
The following tables set forth selected unaudited quarterly financial data for the years ended July 31, 20172023, 2022, and 2016 (in millions, except per share amounts):2021.
|
| | | | | | | | | | | | | | | |
| | Three Months Ended |
| | Oct. 31, 2016(1) | | Jan. 31, 2017 | | Apr. 30, 2017 | | Jul. 31, 2017 |
| Revenue: | | | | | | | |
| Product | $ | 163.8 |
| | $ | 168.8 |
| | $ | 164.2 |
| | $ | 212.3 |
|
| Subscription and support | 234.3 |
| | 253.8 |
| | 267.6 |
| | 296.8 |
|
| Total revenue | 398.1 |
| | 422.6 |
| | 431.8 |
| | 509.1 |
|
| Cost of revenue: | | | | | | | |
| Product | 42.2 |
| | 45.8 |
| | 49.7 |
| | 63.7 |
|
| Subscription and support | 59.0 |
| | 67.4 |
| | 74.0 |
| | 74.8 |
|
| Total cost of revenue | 101.2 |
| | 113.2 |
| | 123.7 |
| | 138.5 |
|
| Total gross profit | 296.9 |
| | 309.4 |
| | 308.1 |
| | 370.6 |
|
| Operating expenses: | | | | | | | |
| Research and development | 84.2 |
| | 89.9 |
| | 86.0 |
| | 87.3 |
|
| Sales and marketing | 220.1 |
| | 226.7 |
| | 226.9 |
| | 245.4 |
|
| General and administrative | 41.6 |
| | 47.2 |
| | 44.3 |
| | 65.2 |
|
| Total operating expenses | 345.9 |
| | 363.8 |
| | 357.2 |
| | 397.9 |
|
| Operating loss | (49.0 | ) | | (54.4 | ) | | (49.1 | ) | | (27.3 | ) |
| Interest expense | (6.0 | ) | | (6.1 | ) | | (6.2 | ) | | (6.2 | ) |
| Other income, net | 2.5 |
| | 2.7 |
| | 2.1 |
| | 2.9 |
|
| Loss before income taxes | (52.5 | ) | | (57.8 | ) | | (53.2 | ) | | (30.6 | ) |
| Provision for income taxes | 4.4 |
| | 2.8 |
| | 7.7 |
| | 7.6 |
|
| Net loss | $ | (56.9 | ) | | $ | (60.6 | ) | | $ | (60.9 | ) | | $ | (38.2 | ) |
| Net loss per share, basic and diluted | $ | (0.63 | ) | | $ | (0.67 | ) | | $ | (0.67 | ) | | $ | (0.42 | ) |
______________
| |
(1) | Certain amounts have been adjusted due to our early adoption of new share-based payment accounting guidance. Refer to Note 1. Description of Business and Summary of Significant Accounting Policies for more information. |
|
| | | | | | | | | | | | | | | |
| | Three Months Ended |
| | Oct. 31,
2015 | | Jan. 31,
2016 | | Apr. 30,
2016 | | Jul. 31,
2016 |
| Revenue: | | | | | | | |
| Product | $ | 147.7 |
| | $ | 169.9 |
| | $ | 162.1 |
| | $ | 191.1 |
|
| Subscription and support | 149.5 |
| | 164.8 |
| | 183.7 |
| | 209.7 |
|
| Total revenue | 297.2 |
| | 334.7 |
| | 345.8 |
| | 400.8 |
|
| Cost of revenue: | | | | | | | |
| Product | 38.8 |
| | 44.9 |
| | 43.2 |
| | 48.5 |
|
| Subscription and support | 40.4 |
| | 49.3 |
| | 51.7 |
| | 53.2 |
|
| Total cost of revenue | 79.2 |
| | 94.2 |
| | 94.9 |
| | 101.7 |
|
| Total gross profit | 218.0 |
| | 240.5 |
| | 250.9 |
| | 299.1 |
|
| Operating expenses: | | | | | | | |
| Research and development | 59.7 |
| | 74.0 |
| | 74.0 |
| | 76.5 |
|
Sales and marketing(1) | 159.5 |
| | 182.4 |
| | 195.9 |
| | 205.4 |
|
| General and administrative | 30.8 |
| | 34.2 |
| | 33.5 |
| | 39.9 |
|
Total operating expenses(1) | 250.0 |
| | 290.6 |
| | 303.4 |
| | 321.8 |
|
Operating loss(1) | (32.0 | ) | | (50.1 | ) | | (52.5 | ) | | (22.7 | ) |
| Interest expense | (5.8 | ) | | (5.8 | ) | | (5.8 | ) | | (6.0 | ) |
| Other income, net | 2.2 |
| | 2.5 |
| | 1.0 |
| | 2.7 |
|
Loss before income taxes(1) | (35.6 | ) | | (53.4 | ) | | (57.3 | ) | | (26.0 | ) |
Provision for income taxes(1) | 4.3 |
| | 3.9 |
| | 6.8 |
| | 5.4 |
|
Net loss(1) | $ | (39.9 | ) | | $ | (57.3 | ) | | $ | (64.1 | ) | | $ | (31.4 | ) |
Net loss per share, basic and diluted(1) | $ | (0.47 | ) | | $ | (0.66 | ) | | $ | (0.73 | ) | | $ | (0.35 | ) |
______________
| |
(1) | Amounts have been adjusted due to our voluntary change in accounting policy for sales commissions. Refer to Note 1. Description of Business and Summary of Significant Accounting Policies for more information. |
18. Subsequent Events
Facility Exit
In August 2017, we exited our previous headquarter facilities and relocated to our new corporate campus. As a result, we expect to recognize a cease-use loss of approximately $15.4 million during the first quarter of fiscal 2018. The cease-use loss is calculated based on the remaining lease obligation for the vacated facilities, adjusted for the effects of any deferred items recognized under the leases, estimated sublease rentals that could be reasonably obtained, and related costs. The amount of the cease-use loss may vary if the timing or amount of estimated cash flows change. Refer to Note 9. Commitments and Contingencies for more information on the relocation of our corporate headquarters.
| |
ITEM 9. | CHANGES IN AND DISAGREEMENTS WITH ACCOUNTANTS ON ACCOUNTING AND FINANCIAL DISCLOSURE |
None.Item 9. Changes in and Disagreements with Accountants on Accounting and Financial Disclosure
| |
ITEM 9A. | CONTROLS AND PROCEDURESItem 9A. Controls and Procedures |
Evaluation of Disclosure Controls and Procedures
Our management, with the participation of our chief executive officer and chief financial officer, evaluated the effectiveness of our disclosure controls and procedures pursuant to Rule 13a-15 under the Securities Exchange Act of 1934, as amended (the “Exchange Act”). In designing and evaluating the disclosure controls and procedures, management recognizes that any controls and procedures, no matter how well designed and operated, can provide only reasonable assurance of achieving the desired control
objectives. In addition, the design of disclosure controls and procedures must reflect the fact that there are resource constraints and that management is required to apply its judgment in evaluating the benefits of possible controls and procedures relative to their costs.
Based on our evaluation, our chief executive officer and chief financial officer concluded that, as of July 31, 2017,2023, our disclosure controls and procedures are designed at a reasonable assurance level and are effective to provide reasonable assurance that information we are required to disclose in reports that we file or submit under the Exchange Act is recorded, processed, summarized, and reported within the time periods specified in Securities and Exchange Commission (SEC)(“SEC”) rules and forms, and that such information is accumulated and communicated to our management, including our chief executive officer and chief financial officer, as appropriate, to allow timely decisions regarding required disclosure.
Management’s Annual Report on Internal Control Overover Financial Reporting
For “Management’s Annual ReportOur management is responsible for establishing and maintaining adequate internal control over financial reporting as defined in Rules 13a-15(f) under the Exchange Act. Our management assessed the effectiveness of our internal control over financial reporting as of July 31, 2023, based on the framework set forth by the Committee of Sponsoring Organizations of the Treadway Commission (“COSO”) in Internal Control Over Financial Reporting” see- Integrated Framework (2013 framework). Based on that assessment, management concluded that, as of July 31, 2023, our internal control over financial reporting was effective.
The effectiveness of our internal control over financial reporting as of July 31, 2023 has been audited by Ernst & Young LLP, the independent registered public accounting firm that audits our consolidated financial statements, as stated in their report underwhich is included in Part II, Item 8 of this Annual Report on Form 10-K, which report is incorporated herein by reference.
For the “Report of Independent Registered Public Accounting Firm,” see the report under Part II, Item 8 of this Annual Report on Form 10-K, which report is incorporated herein by reference.10-K.
Changes in Internal Control Overover Financial Reporting
There were no changes in our internal control over financial reporting identified in connection with the evaluation required by Rule 13a-15(d) and 15d-15(d) of the Exchange Act that occurred during the quarter ended July 31, 20172023 that have materially affected, or are reasonably likely to materially affect, our internal control over financial reporting.
Item 9B. Other Information
Trading Plans of Directors and Executive Officers
Set forth below is certain information regarding Rule 10b5-1 trading plans adopted by our directors and officers (as defined in Rule 16a-1(f)) during the fourth quarter of fiscal 2023. The Rule 10b5-1 trading plans listed below are each intended to satisfy the affirmative defense of Rule 10b5-1(c).
| | | | | | | | | | | | | | | | | | | | | | | | | | |
ITEM 9B.Name | OTHER INFORMATION | Title | | Date Plan Was Adopted | | Expiration Date | | Total Amount of Common Stock to be Sold Under the Plan |
| Nikesh Arora | | Chairman and Chief Executive Officer | | June 8, 2023 | | August 30, 2024 or when all shares have been sold | | 2,000,000 | |
| William “BJ” Jenkins, Jr. | | President | | May 26, 2023 | | June 29, 2024 or when all shares have been sold | | 13,000 | |
None.
No other officers or directors, as defined in Rule 16a-1(f), adopted, modified and/or terminated a “Rule 10b5-1 trading arrangement” or a “non-Rule 10b5-1 trading arrangement,” as defined in Regulation S-K Item 408, during the fourth quarter of fiscal 2023.
PART
Item 9C. Disclosure Regarding Foreign Jurisdictions That Prevent Inspections
Not applicable.
Part III
| |
ITEM 10. | DIRECTORS, EXECUTIVE OFFICERS AND CORPORATE GOVERNANCE |
Item 10. Directors, Executive Officers and DirectorsCorporate Governance
The information required by this item will be contained in our definitive proxy statement to be filed with the SEC in connection with our 20172023 annual meeting of stockholders (the “Proxy Statement”), which is expected to be filed not later than 120 days after the end of our fiscal year ended July 31, 2017,2023 and is incorporated in this reportherein by reference.
| |
ITEM 11. | EXECUTIVE COMPENSATION |
Item 11. Executive Compensation
The information required by this item will be set forth in the Proxy Statement and is incorporated herein by reference.
| |
ITEM 12. | SECURITY OWNERSHIP OF CERTAIN BENEFICIAL OWNERS AND MANAGEMENT AND RELATED STOCKHOLDER MATTERS |
Item 12. Security Ownership of Certain Beneficial Owners and Management and Related Stockholder Matters
The information required by this item will be set forth in the Proxy Statement and is incorporated herein by reference.
| |
ITEM 13. | CERTAIN RELATIONSHIPS AND RELATED TRANSACTIONS, AND DIRECTOR INDEPENDENCE |
Item 13. Certain Relationships and Related Transactions, and Director Independence
The information required by this item will be set forth in the Proxy Statement and is incorporated herein by reference.
| |
ITEM 14. | PRINCIPAL ACCOUNTANT FEES AND SERVICES |
Item 14. Principal Accountant Fees and Services
The information required by this item will be set forth in the Proxy Statement and is incorporated herein by reference.
PART
Part IV
| |
ITEM 15. | EXHIBITS AND FINANCIAL STATEMENT SCHEDULES |
Item 15. Exhibits and Financial Statement Schedules
Documents filed as part of this Annual Report on Form 10-K are as follows:
| |
1. | Consolidated Financial Statements |
1.Consolidated Financial Statements
Our Consolidated Financial Statements are listed in the “Index to Consolidated Financial Statements” under Part II, Item 8 of this Annual Report on Form 10-K.
| |
2. | Financial Statement Schedules |
2.Financial Statement Schedules
Financial statement schedules have been omitted because they are not required, not applicable, not present in amounts sufficient to require submission of the schedule, or the required information is shown in the Consolidated Financial Statements or Notesthe notes thereto.
3.Exhibits
The following documents listed in the Exhibit Index of this Annual Report on Form 10-K are incorporated by reference or are filed with this Annual Report on Form 10-K, in each case as indicated therein (numbered in accordance with Item 601 of Regulation S-K).
Exhibit Index
SIGNATURES | | | | | | | | | | | | | | | | | | | | | | | | | | | | | | | | | | |
Exhibit
Number | | Exhibit Description | | Incorporated by Reference | | |
| Form | | File No. | | Exhibit | | Filing Date | | |
| | | | | | | | | | | | |
| | Restated Certificate of Incorporation of the Registrant. | | 10-K | | 001-35594 | | 3.1 | | October 4, 2012 | | |
| | | | | | | | | | | | |
| | Amended and Restated Bylaws of the Registrant. | | 8-K | | 001-35594 | | 3.1 | | May 23, 2022 | | |
| | | | | | | | | | | | |
| | Certificate of Change of Location of Registered Agent and/or Registered Office. | | 8-K | | 001-35594 | | 3.1 | | August 30, 2016 | | |
| | | | | | | | | | | | |
| | Indenture between the Registrant and U.S. Bank National Association, dated as of June 8, 2020. | | 8-K | | 001-35594 | | 4.1 | | June 8, 2020 | | |
| | | | | | | | | | | | |
| | Form of Global 0.375% Convertible Senior Note due 2025 (included in Exhibit 4.1). | | 8-K | | 001-35594 | | 4.2 | | June 8, 2020 | | |
| | | | | | | | | | | | |
| | Description of Registrant’s Securities. | | | | | | | | | | |
| | | | | | | | | | | | |
| | Form of Indemnification Agreement between the Registrant and its directors and officers. | | S-1/A | | 333-180620 | | 10.1 | | July 9, 2012 | | |
| | | | | | | | | | | | |
| | 2012 Equity Incentive Plan and related form agreements. | | 10-Q | | 001-35594 | | 10.2 | | November 26, 2019 | | |
| | | | | | | | | | | | |
| | Form of 2012 Equity Incentive Plan Performance-Based Restricted Stock Unit Award Agreement. | | 10-Q | | 001-35594 | | 10.4 | | November 19, 2021 | | |
| | | | | | | | | | | | |
| | 2021 Equity Incentive Plan. | | S-8 | | 333-268930 | | 99.1 | | December 21, 2022 | | |
| | | | | | | | | | | | |
| | Form of 2021 Equity Incentive Plan Global Stock Option Award Agreement. | | S-8 | | 333-261697 | | 99.2 | | December 16, 2021 | | |
| | | | | | | | | | | | |
| | Form of 2021 Equity Incentive Plan Global Restricted Stock Unit Award Agreement. | | S-8 | | 333-261697 | | 99.3 | | December 16, 2021 | | |
| | | | | | | | | | | | |
| | 2012 Employee Stock Purchase Plan, as amended and restated, and related form agreements. | | 10-K | | 001-35594 | | 10.7 | | September 6, 2022 | | |
| | | | | | | | | | | | |
| | RedLock Inc. 2015 Stock Plan, as amended, and related form agreements under RedLock Inc. 2015 Stock Plan, as amended. | | S-8 | | 333-227901 | | 99.1 | | October 19, 2018 | | |
| | | | | | | | | | | | |
| | | | | | | | | | | | | | | | | | | | | | | | | | | | | | | | | | |
Exhibit
Number | | Exhibit Description | | Incorporated by Reference | | |
| Form | | File No. | | Exhibit | | Filing Date | | |
| | | | | | | | | | | | |
| | Aporeto, Inc. Amended and Restated 2015 Stock Option and Grant Plan. | | S-8 | | 333-235854 | | 99.1 | | January 8, 2020 | | |
| | | | | | | | | | | | |
| | CloudGenix Inc. 2013 Equity Incentive Plan. | | S-8 | | 333-238014 | | 99.1 | | May 5, 2020 | | |
| | | | | | | | | | | | |
| | Crypsis Group Holdings, LLC 2017 Equity Incentive Plan. | | S-8 | | 333-249387 | | 99.1 | | October 8, 2020 | | |
| | | | | | | | | | | | |
| | Sinefa Group, Inc. 2020 Stock Plan. | | S-8 | | 333-251423 | | 99.1 | | December 17, 2020 | | |
| | | | | | | | | | | | |
| | Expanse Holding Company, Inc. Amended and Restated 2012 Stock Incentive Plan | | S-8 | | 333-251425 | | 99.1 | | December 17, 2020 | | |
| | | | | | | | | | | | |
| | Gamma Networks, Inc. 2018 Stock Option and Grant Plan. | | S-8 | | 333-259327 | | 99.1 | | September 3, 2021 | | |
| | | | | | | | | | | | |
| | Bridgecrew, Inc. 2019 Stock Incentive Plan. | | S-8 | | 333-254042 | | 99.1 | | March 9, 2021 | | |
| | | | | | | | | | | | |
| | Cider Security Ltd. 2020 Equity Incentive Plan. | | S-8 | | 333-268931 | | 99.1 | | December 21, 2022 | | |
| | | | | | | | | | | | |
| | US Sub-Plan to Cider Security Ltd. 2020 Equity Incentive Plan. | | S-8 | | 333-268931 | | 99.2 | | December 21, 2022 | | |
| | | | | | | | | | | | |
| | Employee Incentive Compensation Plan, as amended and restated. | | 10-Q | | 001-35594 | | 10.2 | | November 25, 2014 | | |
| | | | | | | | | | | | |
| | Clawback Policy, adopted as of August 29, 2017. | | 10-Q | | 001-35594 | | 10.3 | | November 21, 2017 | | |
| | | | | | | | | | | | |
| | Amended and Restated Outside Director Compensation Policy (last amended February 16, 2022). | | 10-Q | | 001-35594 | | 10.4 | | February 23, 2022 | | |
| | | | | | | | | | | | |
| | Continued Service Policy. | | 10-Q | | 001-35594 | | 10.3 | | May 20, 2022 | | |
| | | | | | | | | | | | |
| | Palo Alto Networks, Inc. Deferred Compensation Plan effective June 1, 2022 | | 10-K | | 001-35594 | | 10.23 | | September 6, 2022 | | |
| | | | | | | | | | | | |
| | Employment Agreement between Palo Alto Networks (Israel Analytics) Ltd. and Nir Zuk, dated August 18, 2020. | | 10-Q | | 001-35594 | | 10.1 | | November 19, 2020 | | |
| | | | | | | | | | | | |
| | Offer Letter between the Registrant and Nikesh Arora, dated May 30, 2018. | | 8-K | | 001-35594 | | 10.2 | | June 4, 2018 | | |
| | | | | | | | | | | | |
| | Offer Letter between the Registrant and Josh Paul, dated August 5, 2021. | | 8-K | | 001-35594 | | 10.1 | | September 8, 2021 | | |
| | | | | | | | | | | | |
| | Confirmatory Employment Letter with Updated Change in Control Protection between the Registrant and Lee Klarich, dated December 19, 2011. | | 10-Q | | 001-35594 | | 10.4 | | November 30, 2018 | | |
| | | | | | | | | | | | |
| | Addendum to Employment Offer Letter by and between the Registrant and Dipak Golechha, dated March 17, 2021. | | 8-K | | 001-35594 | | 10.1 | | March 19, 2021 | | |
| | | | | | | | | | | | |
| | Addendum to Employment Offer Letter by and between the Registrant and Dipak Golechha, dated February 18, 2022. | | 10-Q | | 001-35594 | | 10.1 | | May 20, 2022 | | |
| | | | | | | | | | | | |
| | Employment Offer Letter by and between the Registrant and William “BJ” Jenkins, dated July 27, 2021. | | 8-K | | 001-35594 | | 10.1 | | August 12, 2021 | | |
| | | | | | | | | | | | |
| | | | | | | | | | | | | | | | | | | | | | | | | | | | | | | | | | |
Exhibit
Number | | Exhibit Description | | Incorporated by Reference | | |
| Form | | File No. | | Exhibit | | Filing Date | | |
| | | | | | | | | | | | |
| | Addendum to Employment Offer Letter between the Registrant and William “BJ” Jenkins, dated February 18, 2022. | | 10-Q | | 001-35594 | | 10.2 | | May 20, 2022 | | |
| | | | | | | | | | | | |
| | Form of Offer Letter between the Registrant and its directors. | | 10-K | | 001-35594 | | 10.27 | | September 3, 2021 | | |
| | | | | | | | | | | | |
| | Amended and Restated Flextronics Manufacturing Services Agreement, by and between the Registrant and Flextronics Telecom Systems Ltd., dated April 1, 2019. | | 10-Q | | 001-35594 | | 10.1 | | May 30, 2019 | | |
| | | | | | | | | | | | |
| | Vendor Information Security Terms between the Registrant and Flextronics Telecom Systems Ltd., dated July 23, 2021. | | 10-K | | 001-35594 | | 10.29 | | September 3, 2021 | | |
| | | | | | | | | | | | |
| | Form of Convertible Note Hedge Confirmation. | | 8-K | | 001-35594 | | 10.2 | | June 8, 2020 | | |
| | | | | | | | | | | | |
| | Form of Warrant Confirmation. | | 8-K | | 001-35594 | | 10.3 | | June 8, 2020 | | |
| | | | | | | | | | | | |
| | Lease between the Registrant and Santa Clara Campus Property Owner I LLC, dated May 28, 2015. | | 10-K | | 001-35594 | | 10.29 | | September 17, 2015 | | |
| | | | | | | | | | | | |
| | Lease between the Registrant and Santa Clara Campus Property Owner I LLC, dated May 28, 2015. | | 10-K | | 001-35594 | | 10.30 | | September 17, 2015 | | |
| | | | | | | | | | | | |
| | Lease between the Registrant and Santa Clara Campus Property Owner I LLC, dated May 28, 2015. | | 10-K | | 001-35594 | | 10.31 | | September 17, 2015 | | |
| | | | | | | | | | | | |
| | Lease by and between the Registrant and Santa Clara Campus Property Owner I LLC, dated October 7, 2015. | | 8-K/A | | 001-35594 | | 10.1 | | October 19, 2015 | | |
| | | | | | | | | | | | |
| | Amendment No. 1 to Lease by and between the Registrant and Santa Clara Phase I Property LLC, dated November 9, 2015. | | 10-Q | | 001-35594 | | 10.2 | | November 24, 2015 | | |
| | | | | | | | | | | | |
| | Amendment No. 1 to Lease by and between the Registrant and Santa Clara Campus Property Owner I LLC, dated November 9, 2015. | | 10-Q | | 001-35594 | | 10.3 | | November 24, 2015 | | |
| | | | | | | | | | | | |
| | Amendment No. 1 to Lease by and between the Registrant and Santa Clara Campus Property Owner I LLC, dated September 16, 2016. | | 10-Q | | 001-35594 | | 10.1 | | November 22, 2016 | | |
| | | | | | | | | | | | |
| | Amendment No. 1 to Lease by and between the Registrant and Santa Clara Campus Property Owner I LLC, dated September 16, 2016. | | 10-Q | | 001-35594 | | 10.2 | | November 22, 2016 | | |
| | | | | | | | | | | | |
| | Amendment No. 2 to Lease by and between the Registrant and Santa Clara Campus Property Owner I LLC, dated September 16, 2016. | | 10-Q | | 001-35594 | | 10.3 | | November 22, 2016 | | |
| | | | | | | | | | | | |
| | Amendment No. 2 to Lease by and between the Registrant and Santa Clara Campus Property Owner I LLC, dated November 16, 2016. | | 10-Q | | 001-35594 | | 10.1 | | March 1, 2017 | | |
| | | | | | | | | | | | |
| | Amendment No. 2 to Lease by and between the Registrant and Santa Clara Campus Property Owner I LLC, dated November 16, 2016. | | 10-Q | | 001-35594 | | 10.2 | | March 1, 2017 | | |
| | | | | | | | | | | | |
| | Amendment No. 3 to Lease by and between the Registrant and Santa Clara Campus Property Owner I LLC, dated November 16, 2016. | | 10-Q | | 001-35594 | | 10.3 | | March 1, 2017 | | |
| | | | | | | | | | | | |
| | | | | | | | | | | | | | | | | | | | | | | | | | | | | | | | | | |
Exhibit
Number | | Exhibit Description | | Incorporated by Reference | | |
| Form | | File No. | | Exhibit | | Filing Date | | |
| | | | | | | | | | | | |
| | Amendment No. 3 to Lease by and between the Registrant and Santa Clara EFH LLC, dated June 22, 2017. | | 10-K | | 001-35594 | | 10.40 | | September 7, 2017 | | |
| | | | | | | | | | | | |
| | Amendment No. 3 to Lease by and between the Registrant and Santa Clara G LLC, dated June 22, 2017. | | 10-K | | 001-35594 | | 10.41 | | September 7, 2017 | | |
| | | | | | | | | | | | |
| | Amendment No. 4 to Lease by and between the Registrant and Santa Clara EFH LLC, dated June 22, 2017. | | 10-K | | 001-35594 | | 10.42 | | September 7, 2017 | | |
| | | | | | | | | | | | |
| | Amendment No. 4 to Lease by and between the Registrant and Santa Clara Phase III EFH LLC, dated September 29, 2017. | | 10-Q | | 001-35594 | | 10.5 | | November 21, 2017 | | |
| | | | | | | | | | | | |
| | Amendment No. 4 to Lease by and between the Registrant and Santa Clara Phase III G LLC, dated September 29, 2017. | | 10-Q | | 001-35594 | | 10.6 | | November 21, 2017 | | |
| | | | | | | | | | | | |
| | Amendment No. 5 to Lease by and between the Registrant and Santa Clara Phase III EFH LLC, dated September 29, 2017. | | 10-Q | | 001-35594 | | 10.7 | | November 21, 2017 | | |
| | | | | | | | | | | | |
| | Credit Agreement, dated as of April 13, 2023 among the Registrant, the lenders party thereto and Wells Fargo, National Association, as administrative agent. | | 8-K | | 001-35594 | | 10.1 | | April 19, 2023 | | |
| | | | | | | | | | | | |
| | List of subsidiaries of the Registrant. | | | | | | | | | | |
| | | | | | | | | | | | |
| | Consent of Independent Registered Public Accounting Firm. | | | | | | | | | | |
| | | | | | | | | | | | |
| | Power of Attorney (contained in the signature page to this Annual Report on Form 10-K). | | | | | | | | | | |
| | | | | | | | | | | | |
| | Certification of the Chief Executive Officer pursuant to Section 302(a) of the Sarbanes-Oxley Act of 2002. | | | | | | | | | | |
| | | | | | | | | | | | |
| | Certification of the Chief Financial Officer pursuant to Section 302(a) of the Sarbanes-Oxley Act of 2002. | | | | | | | | | | |
| | | | | | | | | | | | |
| | Certification of Chief Executive Officer pursuant to 18 U.S.C. Section 1350, as adopted pursuant to Section 906 of the Sarbanes-Oxley Act of 2002. | | | | | | | | | | |
| | | | | | | | | | | | |
| | Certification of Chief Financial Officer pursuant to 18 U.S.C. Section 1350, as adopted pursuant to Section 906 of the Sarbanes-Oxley Act of 2002. | | | | | | | | | | |
| | | | | | | | | | | | |
| 101.INS | | XBRL Instance Document. | | | | | | | | | | |
| | | | | | | | | | | | |
| 101.SCH | | XBRL Taxonomy Schema Linkbase Document. | | | | | | | | | | |
| | | | | | | | | | | | |
| 101.CAL | | XBRL Taxonomy Calculation Linkbase Document. | | | | | | | | | | |
| | | | | | | | | | | | |
| 101.DEF | | XBRL Taxonomy Definition Linkbase Document. | | | | | | | | | | |
| | | | | | | | | | | | |
| 101.LAB | | XBRL Taxonomy Labels Linkbase Document. | | | | | | | | | | |
| | | | | | | | | | | | |
| 101.PRE | | XBRL Taxonomy Presentation Linkbase Document. | | | | | | | | | | |
| | | | | | | | | | | | | | | | | | | | | | | | | | | | | | | | | | |
Exhibit
Number | | Exhibit Description | | Incorporated by Reference | | |
| Form | | File No. | | Exhibit | | Filing Date | | |
| | | | | | | | | | | | |
| | | | | | | | | | | | |
| 104 | | Cover Page Interactive Data File (formatted as inline XBRL and contained in Exhibit 101) | | | | | | | | | | |
* Indicates a management contract or compensatory plan or arrangement.
** Certain portions of this exhibit have been omitted as the Registrant has determined (i) the omitted information is not material and (ii) the omitted information would likely cause harm to the Registrant if publicly disclosed.
† The certifications attached as Exhibit 32.1 and Exhibit 32.2 that accompany this Annual Report on Form 10-K, are not deemed filed with the Securities and Exchange Commission and are not to be incorporated by reference into any filing of the Registrant under the Securities Act of 1933, as amended, or the Securities Exchange Act of 1934, as amended, whether made before or after the date of this Annual Report on Form 10-K, irrespective of any general incorporation language contained in such filing.
Item 16. Form 10-K Summary
Not applicable.
Signatures
Pursuant to the requirements of Section 13 or 15(d) of the Securities Exchange Act of 1934, the Registrant has duly caused this report to be signed on its behalf by the undersigned, thereunto duly authorized, on September 7, 2017.1, 2023.
|
| | | | |
| PALO ALTO NETWORKS, INC. |
| By: | /s/ MARK D. MCLAUGHLINNIKESH ARORA |
| Mark D. McLaughlinNikesh Arora |
| Chairman and Chief Executive Officer |
POWER OF ATTORNEY
Power of Attorney
KNOW ALL THESE PERSONS BY THESE PRESENTS, that each person whose signature appears below constitutes and appoints Mark D. McLaughlinNikesh Arora, Dipak Golechha, and Steffan C. Tomlinson,Josh Paul, and each of them, as his or her true and lawful attorney-in-fact and agent, with full power of substitution and resubstitution, for him or her and in his or her name, place and stead, in any and all capacities, to sign any and all amendments to this Annual Report on Form 10-K, and to file the same, with all exhibits thereto, and other documents in connection therewith, with the Securities and Exchange Commission, granting unto said attorneys-in-fact and agents, and each of them, full power and authority to do and perform each and every act and thing requisite and necessary to be done in connection therewith, as fully to all intents and purposes as he or she might or could do in person, hereby ratifying and confirming all that said attorneys-in-fact and agents, or any of them, or their, his or hisher substitutes, may lawfully do or cause to be done by virtue thereof.
Pursuant to the requirements of the Securities Exchange Act of 1934, this report has been signed below by the following persons on behalf of the Registrant and in the capacities and on the dates indicated:
| | | | | | | | | | | | | | |
| Signature | | Title | | Date |
| | |
| /s/ NIKESH ARORA | | Chairman, Chief Executive Officer and Director (Principal Executive Officer) | | September 1, 2023 |
| Nikesh Arora | | |
| | | | |
Signature | | Title | | Date |
| | |
/s/ MARK D. MCLAUGHLIN DIPAK GOLECHHA | | Chief Executive Officer and Director (Principal Executive Officer) | | September 7, 2017 |
Mark D. McLaughlin | | |
| | | | |
/s/ STEFFAN C. TOMLINSON
| | Chief Financial Officer (Principal Accounting(Duly Authorized Officer and Principal Financial Officer) | | September 7, 20171, 2023 |
Steffan C. TomlinsonDipak Golechha | | |
| | |
/s/ NIR ZUK
| | Chief Technical Officer and Director | | September 7, 2017 |
Nir Zuk | | |
| | |
/s/ FRANK CALDERONI
| | Director | | September 7, 2017 |
Frank Calderoni | | |
| | | | |
/s/ ASHEEM CHANDNA
| | Director | | September 7, 2017 |
Asheem Chandna | | |
| | |
/s/ JOHN M. DONOVAN
| | Director | | September 7, 2017 |
John M. Donovan | | |
| | | | |
/s/ CARL ESCHENBACH
| | Director | | September 7, 2017 |
Carl Eschenbach | | |
| | | | |
/s/ JAMES J. GOETZ
| | Director | | September 7, 2017 |
James J. Goetz | | |
| | |
/s/ MARY PAT MCCARTHY
| | Director | | September 7, 2017 |
Mary Pat McCarthy | | |
| | |
/s/ STANLEY J. MERESMAN
| | Director | | September 7, 2017 |
Stanley J. Meresman | | |
| | | | |
/s/ SRIDHAR RAMASWAMY
| | Director | | September 7, 2017 |
Sridhar Ramaswamy | | |
| | | | |
/s/ DANIEL J. WARMENHOVEN
| | Director | | September 7, 2017 |
Daniel J. Warmenhoven | | |
EXHIBIT INDEX
|
| | | | | | | | | | |
Exhibit Number | | Exhibit Description | | Incorporated by Reference |
| Form | | File No. | | Exhibit | | Filing Date |
| | | | | | | | | | | |
| | Restated Certificate of Incorporation of the Registrant. | | 10-K | | 001-35594 | | 3.1 | | October 4, 2012 |
| | | | | | | | | | | |
| | Amended and Restated Bylaws of the Registrant. | | 10-K | | 001-35594 | | 3.2 | | October 4, 2012 |
| | | | | | | | | | | |
| | Certificate of Change of Location of Registered Agent and/or Registered Office.
| | 8-K | | 001-35594 | | 3.1 | | August 30, 2016 |
| | | | | | | | | | | |
| | Warrant to Purchase Stock by Juniper Networks, Inc. | | 8-K | | 001-35594 | | 4.1 | | June 4, 2014 |
| | | | | | | | | | | |
| | Indenture between the Registrant and U.S. Bank National Association, dated as of June 30, 2014. | | 8-K | | 001-35594
| | 4.1 | | July 1, 2014 |
| | | | | | | | | | | |
| | Form of Indemnification Agreement between the Registrant and its directors and officers. | | S-1/A | | 333-180620 | | 10.1 | | July 9, 2012 |
| | | | | | | | | | | |
| | 2005 Equity Incentive Plan and related form agreements under 2005 Equity Incentive Plan. | | S-1/A | | 333-180620 | | 10.2 | | July 9, 2012 |
| | | | | | | | | | | |
| | 2012 Equity Incentive Plan and related form agreements under 2012 Equity Incentive Plan, as amended. | | 10-K | | 001-35594 | | 10.3 | | September 18, 2014 |
| | | | | | | | | | | |
| | 2012 Employee Stock Purchase Plan and related form agreements under 2012 Employee Stock Purchase Plan, as amended and restated. | | | | | | | | |
| | | | | | | | | | | |
| | Employee Incentive Compensation Plan, as amended and restated. | | 10-Q | | 001-35594 | | 10.2 | | November 25, 2014 |
| | | | | | | | | | | |
| | Offer Letter between the Registrant and Mark D. McLaughlin, dated July 21, 2011, as amended. | | S-1 | | 333-180620 | | 10.6 | | April 6, 2012 |
| | | | | | | | | | | |
| | Offer Letter between the Registrant and Steffan C. Tomlinson, dated January 17, 2012. | | S-1 | | 333-180620 | | 10.7 | | April 6, 2012 |
| | | | | | | | | | | |
| | Letter Agreement between the Registrant and Nir Zuk, dated December 19, 2011. | | S-1 | | 333-180620 | | 10.8 | | April 6, 2012 |
| | | | �� | | | | | | | |
| | Letter Agreement between the Registrant and René Bonvanie, dated December 19, 2011. | | S-1 | | 333-180620 | | 10.10 | | April 6, 2012 |
| | | | | | | | | | | |
| | Offer Letter between the Registrant and Stanley J. Meresman, dated September 8, 2014. | | 8-K | | 001-35594 | | 10.1 | | September 22, 2014 |
| | | | | | | | | | | |
| | Offer Letter between the Registrant and Daniel J. Warmenhoven, dated February 14, 2012. | | S-1 | | 333-180620 | | 10.13 | | April 6, 2012 |
| | | | | | | | | | | |
| | Offer Letter between the Registrant and Mark F. Anderson, dated May 23, 2012. | | S-1/A | | 333-180620 | | 10.16 | | July 9, 2012 |
| | | | | | | | | | | |
| | Offer Letter between the Registrant and John M. Donovan, dated September 14, 2012. | | 8-K | | 001-35594 | | 10.1 | | September 20, 2012 |
| | | | | | | | | | | |
| | Offer Letter between the Registrant and Carl Eschenbach, dated May 9, 2013. | | 8-K | | 001-35594 | | 10.1 | | May 30, 2013 |
| | | | | | | | | | | |
| | Offer Letter between the Registrant and Frank Calderoni, dated February 24, 2016. | | 8-K | | 001-35594 | | 10.1 | | February 25, 2016 |
| | | | | | | | | | | |
| | Offer Letter between the Registrant and Mary Pat McCarthy, dated October 13, 2016. | | 8-K | | 001-35594 | | 10.1 | | October 24, 2016 |
| | | | | | | | | | | |
| | Lease between the Registrant and Santa Clara Office Partners LLC, dated October 20, 2010, as amended. | | S-1 | | 333-180620 | | 10.14 | | April 6, 2012 |
| | | | | | | | | | | |
| | Amendment No. 2 to Lease between the Registrant and Santa Clara Office Partners LLC, dated July 2, 2013. | | 10-K | | 001-35594 | | 10.17 | | September 25, 2013 |
| | | | | | | | | | | |
|
| | | | | | | | | | |
Exhibit Number | | Exhibit Description | | Incorporated by Reference |
| Form | | File No. | | Exhibit | | Filing Date |
| | Lease between the Registrant and SI 34 LLC, dated September 17, 2012. | | 10-K | | 001-35594 | | 10.16 | | October 4, 2012 |
| | | | | | | | | | | |
| | Lease between the Registrant and SI 34 LLC, dated September 17, 2012. | | 10-K | | 001-35594 | | 10.17 | | October 4, 2012 |
| | | | | | | | | | | |
| | Amended and Restated Flextronics Manufacturing Services Agreement, by and between the Registrant and Flextronics Telecom Systems Ltd., dated December 8, 2015. | | 8-K | | 001-35594 | | 10.1 | | December 14, 2015 |
| | | | | | | | | | | |
| | Settlement, Release and Cross-License Agreement, dated May 27, 2014, by and between the Registrant and Juniper Networks, Inc. | | 8-K | | 001-35594 | | 10.1 | | May 28, 2014 |
| | | | | | | | | | | |
| | Share Purchase Agreement between the Registrant, Cyvera Ltd., Palo Alto Networks Holding B.V., the shareholders of Cyvera Ltd. and Shareholder Representative Services LLC, dated March 22, 2014. | | 10-Q | | 001-35594 | | 10.1 | | June 3, 2014 |
| | | | | | | | | | | |
| | Amendment No. 1 to the Share Purchase Agreement between the Registrant, Cyvera Ltd., Palo Alto Networks Holding B.V., the shareholders of Cyvera Ltd. and Shareholder Representative Services LLC, dated April 9, 2014. | | 10-Q | | 001-35594 | | 10.2 | | June 3, 2014 |
| | | | | | | | | | | |
| | Purchase Agreement, dated June 24, 2014, by and among the Registrant and J.P. Morgan Securities LLC, RBC Capital Markets, LLC and Citigroup Global Markets Inc., as representatives of the initial purchasers named therein. | | 8-K | | 001-35594 | | 10.1 | | June 26, 2014 |
| | | | | | | | | | | |
| | Form of Convertible Note Hedge Confirmation. | | 8-K | | 001-35594 | | 10.2 | | June 26, 2014 |
| | | | | | | | | | | |
| | Form of Warrant Confirmation. | | 8-K | | 001-35594 | | 10.3 | | June 26, 2014 |
| | | | | | | | | | | |
| | Lease between the Registrant and Santa Clara Campus Property Owner I LLC, dated May 28, 2015. | | 10-K | | 001-35594 | | 10.29 | | September 17, 2015 |
| | | | | | | | | | | |
| | Lease between the Registrant and Santa Clara Campus Property Owner I LLC, dated May 28, 2015. | | 10-K | | 001-35594 | | 10.30 | | September 17, 2015 |
| | | | | | | | | | | |
| | Lease between the Registrant and Santa Clara Campus Property Owner I LLC, dated May 28, 2015. | | 10-K | | 001-35594 | | 10.31 | | September 17, 2015 |
| | | | | | | | | | | |
| | Lease by and between the Registrant and Santa Clara Campus Property Owner I LLC, dated October 7, 2015. | | 8-K | | 001-35594 | | 10.1 | | October 19, 2015 |
| | | | | | | | | | | |
| | Amendment No. 1 to Lease by and between the Registrant and Santa Clara Phase I Property LLC, dated November 9, 2015. | | 10-Q | | 001-35594 | | 10.2 | | November 24, 2015 |
| | | | | | | | | | | |
| | Amendment No. 1 to Lease by and between the Registrant and Santa Clara Campus Property Owner I LLC, dated November 9, 2015. | | 10-Q | | 001-35594 | | 10.3 | | November 24, 2015 |
| | | | | | | | | | | |
| | Amendment No. 1 to Lease by and between the Registrant and Santa Clara Campus Property Owner I LLC, dated September 16, 2016. | | 10-Q | | 001-35594 | | 10.1 | | November 22, 2016 |
| | | | | | | | | | | |
| | Amendment No. 1 to Lease by and between the Registrant and Santa Clara Campus Property Owner I LLC, dated September 16, 2016. | | 10-Q | | 001-35594 | | 10.2 | | November 22, 2016 |
| | | | | | | | | | | |
| | Amendment No. 2 to Lease by and between the Registrant and Santa Clara Campus Property Owner I LLC, dated September 16, 2016. | | 10-Q | | 001-35594 | | 10.3 | | November 22, 2016 |
| | | | | | | | | | | |
|
| | | | | | | | | | |
Exhibit Number | | Exhibit Description | | Incorporated by Reference |
| Form | | File No. | | Exhibit | | Filing Date |
| | Amendment No. 2 to Lease by and between the Registrant and Santa Clara Campus Property Owner I LLC, dated November 16, 2016. | | 10-Q | | 001-35594 | | 10.1 | | March 1, 2017 |
| | | | | | | | | | | |
| | Amendment No. 2 to Lease by and between the Registrant and Santa Clara Campus Property Owner I LLC, dated November 16, 2016. | | 10-Q | | 001-35594 | | 10.2 | | March 1, 2017 |
| | | | | | | | | | | |
| | Amendment No. 3 to Lease by and between the Registrant and Santa Clara Campus Property Owner I LLC, dated November 16, 2016. | | 10-Q | | 001-35594 | | 10.3 | | March 1, 2017 |
| | | | | | | | | | | |
| | Amendment No. 3 to Lease by and between the Registrant and Santa Clara EFH LLC, dated June 22, 2017. | | | | | | | | |
| | | | | | | | | | | |
| | Amendment No. 3 to Lease by and between the Registrant and Santa Clara G LLC, dated June 22, 2017. | | | | | | | | |
| | | | | | | | | | | |
| | Amendment No. 4 to Lease by and between the Registrant and Santa Clara EFH LLC, dated June 22, 2017. | | | | | | | | |
| | | | | | | | | | | |
| | List of subsidiaries of the Registrant. | | | | | | | | |
| | | | | | | | | | | |
| | Consent of Independent Registered Public Accounting Firm. | | | | | | | | |
| | | | | | | | | | | |
| | Power of Attorney (contained in the signature page to this Annual Report on Form 10-K). | | | | | | | | |
| | | | | | | | | | | |
| | Certification of the Chief Executive Officer pursuant to Section 302(a) of the Sarbanes-Oxley Act of 2002. | | | | | | | | |
| | | | | | | | | | | |
| | Certification of the Chief Financial Officer pursuant to Section 302(a) of the Sarbanes-Oxley Act of 2002. | | | | | | | | |
| | | | | | | | | | | |
| | Certification of Chief Executive Officer pursuant to 18 U.S.C. Section 1350, as adopted pursuant to Section 906 of the Sarbanes-Oxley Act of 2002. | | | | | | | | |
| | | | | | | | | | | |
| | Certification of Chief Financial Officer pursuant to 18 U.S.C. Section 1350, as adopted pursuant to Section 906 of the Sarbanes-Oxley Act of 2002. | | | | | | | | |
| | | | | | | | | | | |
| 101.INS | | XBRL Instance Document. | | | | | | | | |
| | | | | | | | | | | |
| 101.SCH | | XBRL Taxonomy Schema Linkbase Document. | | | | | | | | |
| | | | | | | | | | | |
| 101.CAL | | XBRL Taxonomy Calculation Linkbase Document. | | | | | | | | |
| | | | | | | | | | | |
| 101.DEF | | XBRL Taxonomy Definition Linkbase Document. | | | | | | | | |
| | | | | | | | | | | |
| 101.LAB | | XBRL Taxonomy Labels Linkbase Document. | | | | | | | | |
| | | | | | | | | | | |
| 101.PRE | | XBRL Taxonomy Presentation Linkbase Document. | | | | | | | | |
| |
* | Indicates a management contract or compensatory plan or arrangement. |
| | |
**/s/ JOSH PAUL | Registrant has omitted portions of the relevant exhibit | Chief Accounting Officer (Duly Authorized Officer and filed such exhibit separately with the Securities and Exchange Commission pursuant to a request for confidential treatment under Rule 406 under the Securities Act of 1933, as amended.Principal Accounting Officer) | | September 1, 2023 |
| Josh Paul | | |
† | The certifications attached as Exhibit 32.1 | |
| /s/ NIR ZUK | | Chief Technology Officer and Exhibit 32.2 that accompany this Annual Report on Form 10-K, are not deemed filed with the Securities and Exchange Commission and are not to be incorporated by reference into any filing of the Registrant under the Securities Act of 1933, as amended, or the Securities Exchange Act of 1934, as amended, whether made before or after the date of this Annual Report on Form 10-K, irrespective of any general incorporation language contained in such filing.Director | | September 1, 2023 |
| Nir Zuk | | |
| | |
| /s/ APARNA BAWA | | Director | | September 1, 2023 |
| Aparna Bawa | | |
| | | | |
| /s/ JOHN M. DONOVAN | | Director | | September 1, 2023 |
| John M. Donovan | | |
| | | | |
| /s/ CARL ESCHENBACH | | Director | | September 1, 2023 |
| Carl Eschenbach | | |
| | | | |
| /s/ DR. HELENE D. GAYLE | | Director | | September 1, 2023 |
| Dr. Helene D. Gayle | | |
| | | | |
| /s/ JAMES J. GOETZ | | Director | | September 1, 2023 |
| James J. Goetz | | |
| | |
| /s/ RT HON SIR JOHN KEY | | Director | | September 1, 2023 |
| Rt Hon Sir John Key | | |
| | | | |
| /s/ MARY PAT MCCARTHY | | Director | | September 1, 2023 |
| Mary Pat McCarthy | | |
| | |
| /s/ LORRAINE TWOHILL | | Director | | September 1, 2023 |
| Lorraine Twohill | | |
| | | | |