UNITED STATES
SECURITIES AND EXCHANGE COMMISSION
Washington, D.C. 20549

FORM 10-K
(Mark One)
[X]ANNUAL REPORT PURSUANT TO SECTION 13 OR 15(d) OF THE SECURITIES EXCHANGE ACT OF 1934
 
For the fiscal year ended December 31, 20082009
OR
[  ]TRANSITION REPORT PURSUANT TO SECTION 13 OR 15(d) OF THE SECURITIES EXCHANGE ACT OF 1934
 For the transition period from                                                  to

Commission file number 0-24960
COVENANT TRANSPORTATION GROUP, INC.
(Exact name of registrant as specified in its charter)

Nevada 88-0320154
(State / other jurisdiction of incorporation or organization) (I.R.S. Employer Identification No.)
400 Birmingham Hwy.  
Chattanooga, TN 37419
(Address of principal executive offices) (Zip Code)

Registrant's telephone number, including area code:423-821-1212423 - 821-1212
 
$0.01 Par Value Class A Common Stock – The NASDAQ StockGlobal Select Market LLC
Securities registered pursuant to Section 12(b) of the Act:(Title of class)
  
Securities registered pursuant to Section 12(g) of the Act:None

Indicate by check mark if the registrant is a well-known seasoned issuer, as defined in Rule 405 of the Securities Act.
[  ] Yes   [X] No

Indicate by check mark if the registrant is not required to file reports pursuant to Section 13 or 15(d) of the Act.
[  ] Yes   [X] No

Indicate by check mark whether the registrant (1) has filed all reports required to be filed by Section 13 or 15(d) of the Securities Exchange Act of 1934 during the preceding 12 months (or for such shorter period that the registrant was required to file such reports), and (2) has been subject to such filing requirements for the past 90 days.
[X] Yes   [  ] No

Indicate by checkmark whether the registrant has submitted electronically and posted on its corporate Website, if any, every Interactive Data File required to be submitted and posted pursuant to Rule 405 of Regulation S-T (§ 232.405 of this chapter) during the preceding 12 months (or for such shorter period that the registrant was required to submit and post such files).
[  ] Yes   [  ] No

Indicate by check mark if disclosure of delinquent filers pursuant to Item 405 of Regulation S-K is not contained herein, and will not be contained, to the best of registrant's knowledge, in definitive proxy or information statements incorporated by reference in Part III of this Form 10-K or any amendments to this Form 10-K.  [  ]

Indicate by check mark whether the registrant is a large accelerated filer, an accelerated filer, or a non-accelerated filer.  See definition of "accelerated filer and large accelerated filer" in rule 12b-2 of the Exchange Act.

[   ] Large Accelerated Filer[   ] Accelerated Filer[ X ] Non-Accelerated Filer

Indicate by check mark whether the registrant is a shell company (as defined in Rule 12b-2 of the Exchange Act).
[  ] Yes  [X] No

The aggregate market value of the common equity held by non-affiliates of the registrant as of June 30, 2008,2009, was approximately $29.5$47 million (based upon the $3.35$5.50 per share closing price on that date as reported by NASDAQ).  In making this calculation the registrant has assumed, without admitting for any purpose, that all executive officers, directors, and affiliated holders of more than 10% of a class of outstanding common stock, and no other persons, are affiliates.

As of March 23, 2009,2010, the registrant had 11,699,18211,840,568 shares of Class A common stock and 2,350,000 shares of Class B common stock outstanding.

Materials from the registrant's definitive proxy statement for the 20092010 Annual Meeting of Stockholders to be held on May 5, 20096, 2010, have been incorporated by reference into Part III of this Form 10-K.


Table of Contents
Part I  
 Item 1.
Business
 Item 1A.
Risk Factors
 Item 1B.
Unresolved Staff Comments
 Item 2.
Properties
 Item 3.
Legal Proceedings
 Item 4.Submission of Matters to a Vote of Security HoldersReserved and Removed
    
Part II  
 Item 5.
Market for Registrant's Common Equity and Related Stockholder Matters
 Item 6.
Selected Financial Data
 Item 7.Management's Discussion and Analysis of Financial Condition and Results of Operations
 Item 7A.
Quantitative and Qualitative Disclosures about Market Risk
 Item 8.
Financial Statements and Supplementary Data
 Item 9.Changes in and Disagreements with Accountants on Accounting and Financial Disclosure
 Item 9A.9A(T).
Controls and Procedures
 Item 9B.
Other Information
    
Part III  
 Item 10.
Directors, Executive Officers, and Corporate Governance
 Item 11.
Executive Compensation
 Item 12.Security Ownership of Certain Beneficial Owners and Management and Related Stockholder Matters
 Item 13.Certain Relationships and Related Transactions, and Director Independence
 Item 14.
Principal Accountant Fees and Services
    
Part IV  
 Item 15.
Exhibits and Financial Statement Schedules

Signatures
  
Report of Independent Registered Public Accounting Firm
  
Financial Data 
 
Consolidated Balance Sheets
Consolidated Statements of Operations
Consolidated Statements of Stockholders' Equity and Comprehensive Income (Loss)
Consolidated Statements of Cash Flows
 Notes to
Consolidated Financial Statements of Operations
Consolidated Statements of Stockholders' Equity and Comprehensive Loss
Consolidated Statements of Cash Flows
Notes to Consolidated Financial Statements


PART I

ITEM 1. 1.                     BUSINESS

This Annual Report on Form 10-K contains certain statements that may be considered forward-looking statements within the meaning of Section 27A of the Securities Act of 1933, as amended and Section 21E of the Securities Exchange Act of 1934, as amended and such statements are subject to the safe harbor created by those sections.  All statements, other than statements of historical fact, are statements that could be deemed forward-looking statements, including without limitation: any projections of earnings, revenues, or other financial items; any statement of plans, strategies, and objectives of management for future operations; any statements concerning proposed new services or developments; any statements regarding future economic conditions or performance; and any statements of belief and any statement of assumptions underlying any of the foregoing.  Such statements may be identified by their use of terms or phrases such as "expects," "estimates," "projects," "believes," "anticipates," "intends," and similar terms and phrases.  Forward-looking statements are inherently subject to risks and uncertainties, some of which cannot be predicted or quantified, which could cause future events and actual results to differ materially from those set forth in, contemplated by, or underlying the forward-looking statements.  Readers should review and consider the factors discussed in "Risk Factors" of this Annual Report on Form 10-K, along with various disclosures in our press releases, stockholder reports, and other filings with the Securities and Exchange Commission.

All such forward-looking statements speak only as of the date of this Annual Report on Form 10-K.  You are cautioned not to place undue reliance on such forward-looking statements.  The Company expressly disclaims any obligation or undertaking to release publicly any updates or revisions to any forward-looking statements contained herein to reflect any change in the Company's expectations with regard thereto or any change in the events, conditions, or circumstances on which any such statement is based.

References in this Annual Report to "we," "us," "our," or the "Company" or similar terms refer to Covenant Transportation Group, Inc. and its subsidiaries.

General

We are the eleventh largest truckload carrier in the United States measured by fiscal 2007 revenue according to Transport Topics, a publication of the American Trucking Associations. We focus on targeted markets throughout the United States where we believe our servicesservice standards can provide a competitive advantage.  We are a major carrier for transportation companies such as freight forwarders, less-than-truckload carriers, and third-party logistics providers that require a high level of service to support their businesses, as well as for traditional truckload customers such as manufacturers, retailers, and retailers.food and beverage shippers.  We also generate revenue through a subsidiary that provides freight brokerage services.

We were founded as a provider of expedited long-haul freight transportation, primarily using two-person driver teams in transcontinental lanes.  Beginning in the late 1990's and continuing into 2001, aA combination of customer demand for additional services and changes in freight distribution patterns a desire to reduce exposure to the more cyclical and seasonal long-haul markets, and a desire for additional growth markets convincedcaused us to offerseek to provide additional services.  Through ourseveral acquisitions of Bud Meyer Truck Linein the late 1990's and Southern Refrigerated Transport ("SRT"),continuing through 2006, we entered the refrigerated, market. Through our acquisitions of Harold Ives Trucking, Con-Way Truckload Services,solo, and Star Transportation ("Star"), we developed a significant solo-driver operation.regional markets.  In addition, over the past several years, we internally developed the capacity to provide dedicated fleet and freight brokerage services.

Our business is operated through four main subsidiaries.  A brief descriptionWe have two reportable segments: Asset-Based Truckload Services ("Truckload") and our Brokerage Services, also known as Covenant Transport Solutions, Inc. ("Solutions").

The Truckload segment consists of eachthree asset-based operating fleets that are aggregated because they have similar economic characteristics and meet the aggregation criteria.  The three operating fleets that comprise our Truckload segment are as follows:
(i) Covenant Transport, Inc. ("Covenant isTransport"), our historical flagship operation, andwhich provides expedited long haul, dedicated, and regional solo-driver service; (ii) Southern Refrigerated Transportation, Inc. ("SRT"), which provides primarily long-haul and regional temperature-controlled service; and (iii) Star Transportation, Inc. ("Star"), which provides regional solo-driver service.  During 2008, we decreased the average fleet size by approximately 5%, while increasing average team-driven tractors by approximately 200, or 20%.  As a result of increasing the percentage of teams in our fleet, average freight revenue per truck per week increased by approximately 3%, with average freight revenue per total mile up approximately 0.4% and miles per truck up approximately 3%.  In late 2008, we stopped adding to our number of teams to evaluate demand.  Our dedicated operations declined by approximately 60 trucks, as we did not renew contracts unless the terms generated an acceptable margin.

The Solutions segment provides freight brokerage service directly and through freight brokerage agents who are paid a commission for the freight they provide.  The brokerage operation has helped us continue to serve customers when we lacked capacity in a given area or when the load has not met the operating profile of our Truckload segment.


3


Southern Refrigerated Transportation, Inc., or SRT. SRT provides primarily temperature-controlled service to food, cosmetics, pharmaceutical, and other companies requiring temperature-protected equipment. At SRT, profitability improved in 2008 as compared to 2007, due to significant improvements in average freight revenue per total mile and fuel expense as SRT reduced the percentage of its freight obtained from freight brokers and improved its utilization of equipment.  In 2008, we decreased the SRT average fleet size by approximately 2%.  Average freight revenue per truck per week decreased slightly, but profitability improved as average freight revenue per total mile increased 1.7%, while miles per truck decreased approximately 2%.
Star Transportation, Inc.  Star provides regional solo-driver service, with operations concentrated in the southeastern United States.  This market has been characterized by weak demand and excess competition for the past two years. During 2008, we decreased the average fleet size by approximately 7%. Average freight revenue per truck per week decreased by approximately 8%, with average freight revenue per total mile decreasing 3% and miles per truck decreasing approximately 5%.  Lack of demand resulted in continued rate pressure, a high percentage of unloaded miles, and lower fuel surcharge collection, related in part, to Star's reliance on brokered freight.
Covenant Transport Solutions, Inc.  Solutions provides freight brokerage service directly and through freight brokerage agents, who are paid a commission for the freight they provide. The brokerage operation has helped us continue to serve customers when we lacked capacity in a given area or when the load has not met the operating profile of one of our subsidiaries.  Our brokerage loads increased to 27,117 in 2008 from 10,743 loads in 2007.  Average revenue per load also increased approximately 10% to $2,017 in 2008 from $1,843 per load in 2007, primarily due to an increase in fuel surcharge collection, much of which is passed on to the third party carriers. 

The following chart reflects the size of each of our subsidiaries measured by 2009 freight revenue:
  

Asset-Based Truckload Services

Our truckload segment comprised approximately 91%, 91%, and 97% of our total operating revenue in 2009, 2008, and 2007, respectively.

We primarily generate revenue by transporting freight for our customers.  Generally, we are paid a predetermined rate per mile for our truckload services.  We enhance our truckload revenue by charging for tractor and trailer detention, loading and unloading activities, and other specialized services, as well as through the collection of fuel surcharges to mitigate the impact of increases in the cost of fuel.  The main factors that affect our truckload revenue are the revenue per mile we receive from our customers, the percentage of miles for which we are compensated, and the number of shipments and miles we generate.  These factors relate, among other things, to the general level of economic activity in the United States, inventory levels, specific customer demand, the level of capacity in the trucking industry, and driver availability.

The main factors that impact our profitability in terms of expenses are the variable costs of transporting freight for our customers.  These costs include fuel expense, driver-related expenses, such as wages, benefits, training, and recruitment, and purchased transportation expenses, which include compensating independent contractors and providers of expedited intermodal rail services.  Expenses that have both fixed and variable components include maintenance and tire expense and our total cost of insurance and claims.  These expenses generally vary with the miles we travel, but also have a controllable component based on safety, fleet age, efficiency, and other factors.  Our main fixed costs include rentals and depreciation of long-term assets, such as revenue equipment and terminal facilities, and the compensation of non-driver personnel.

We operate tractors driven by a single driver and also tractors assigned to two-person driver teams.  Our single driver tractors generally operate in shorter lengths of haul, generate fewer miles per tractor, and experience more non-revenue miles, but the lower productive miles are expected to be offset by generally higher revenue per loaded mile and the reduced employee expense of compensating only one driver.  We expect operating statistics and expenses to shift with the mix of single and team operations.

At December 31, 2009, we operated 3,113 tractors and 8,005 trailers.  Of these tractors, 2,784 were owned, 236 were financed under operating leases, and 93 were provided by independent contractors, who own and drive their own tractors.  Of these trailers, 2,018 were owned, 5,687 were financed under operating leases, and 300 were financed under capital leases.

Independent contractors (owner-operators) provide a tractor and a driver and are responsible for all operating expenses in exchange for a fixed payment per mile.  We do not have the capital outlay of purchasing the tractor.  The payments to independent contractors are recorded in revenue equipment rentals and purchased transportation.  Expenses associated with owned equipment, such as interest and depreciation, are not incurred, and for independent contractor-tractors, driver compensation, fuel, and other expenses are not incurred.  Because obtaining equipment from independent contractors and under operating leases effectively shifts financing expenses from interest to "above the line" operating expenses, we evaluate our efficiency using net margin as well as operating ratio.

4


Distribution of Revenue Among Subsidiaries
Covenant Transport   
58%
SRT Refrigerated22%
Star Regional11%
Solutions Brokerage 
9%

The development of our business has affected our operating metrics over time.  With the exception of our freight brokerage service, weWe measure performance of our Truckload segment and the related subsidiaries’ service offerings in four areas: average length of haul, average freight revenue per total mile (excluding fuel surcharges), average miles per tractor, and average freight revenue per tractor per week (excluding fuel surcharges).  A description of each follows:

4


Average Length of Haul.Haul in Miles.  Our average length of haul has decreased over time as we have increased the use of solo-driver tractors and increased our focus on regional markets.  Shorter lengths of haul frequently involve higher rates per mile from customers, fewer miles per truck, and a greater percentage of non-revenue miles caused by re-positioning of equipment.
 1999200020012002200320042005200620072008
Average Length of Haul in Miles1,4521,2401,1361,1591,055950920908815815

 
Average Freight Revenue Per Total Mile.  Our average freight revenue per mile increased sharply until 2006, and since then has been flat. Averagedropped significantly in 2009 because of overcapacity in our industry in comparison to freight revenue per loaded mile has increased approximately 24% since 2000, while non-revenue miles have also increased. This led todemand in a 20% increase in average freight revenue per total mile.recessionary economic environment.  All freight revenue per mile numbers exclude fuel surcharge revenue.

 1999200020012002200320042005200620072008
Average Freight Revenue Per Total Mile
(excludes fuel surcharge revenue)
1.131.151.141.151.171.271.361.361.361.36
Average Miles Per Tractor.  Average miles per tractor reflects economic demand, our ability to match fleet size to demand, and the percentage of team-driven tractors in our fleet.

 
Average Miles Per Tractor. Our average miles per tractor decreased as our percentage of team-driven tractors decreased, until 2008.
 1999200020012002200320042005200620072008
Average Miles Per Tractor144,601128,754127,714129,906129,656122,899115,765117,621118,159118,992

Average Freight Revenue Per Tractor Per Week.  We use average freight revenue per tractor per week (which excludes fuel surcharges) as our main measure of asset productivity.  This operating metric takes into account the effects of freight rates, non-revenue miles, and miles per tractor. In addition, because we calculate average freight revenue per tractor using all of our trucks, it takes into account the percentage of our fleet that is unproductive due to lack of drivers, repairs, and other factors.
 1999200020012002200320042005200620072008
Average Freight Revenue Per Tractor Per Week
(excludes fuel surcharge revenue)
3,1232,8422,8032,8702,8972,9953,0133,0773,0883,105


5

Brokerage Services

Our Solutions segment comprised approximately 9%, 9%, and 3% of our total operating revenue in 2009, 2008, and 2007, respectively.  Solutions derives revenue from arranging transportation services for customers through relationships with thousands of third-party carriers and integration with our Truckload segment.  Solutions provides freight brokerage services through freight brokerage agents, who are paid a commission for the freight brokerage service they provide, and directly through in-house brokerage personnel working in direct contact with customers.  The main factors that impact profitability in terms of expenses are the variable costs of outsourcing the transportation freight for our customers and managing selling, general, and administrative expenses.  Our brokerage loads decreased to 24,769 in 2009, from 27,117 in 2008.  Average revenue per load also decreased approximately 5% to $1,912 in 2009, from $2,017 in 2008, primarily due to a decrease in fuel surcharge collection and an overall decrease in rates paid to carriers as a result of the weakened economic climate.

Customers and Operations

Our primary customers include manufacturers and retailers, as well as other transportation companies.  In 2008,2009, our five largest customers were Estes Express Lines, Georgia Pacific, Transplace, UPS, and Wal-Mart.  Estes Express Lines, Transplace, Wal-Mart, and Alcoa.UPS are other transportation providers who seek our services when our team-driven tractors or other service capabilities offer them an advantage.  No customer accounted for more than 10% of our consolidated revenue in 2009, 2008, or 2007.  Our top five customers accounted for approximately 26%, 20% of our revenue in 2008. Our top five customers accounted for approximately, and 22% of our revenue in 2007.2009, 2008, and 2007, respectively.

We operate tractors driven by a single driver and also tractors assigned to two-person driver teams.  Over time, the percentage of our revenue generated by driver teams has generally trended down, although the mix will depend on a variety of factors over time.  Our single driver tractors generally operate in shorter lengths of haul, generate fewer miles per tractor, and experience more non-revenue miles, but the lower productive miles are expected to be offset by generally higher revenue per loaded mile and the reduced employee expense of compensating only one driver.

We equip our tractors with a satellite-based tracking and communications system that permits direct communication between drivers and fleet managers.  We believe that this system enhances our operating efficiency and improves customer service and fleet management.  This system also updates the tractor's position every 30thirty (30) minutes, which allows us and our customers to locate freight and accurately estimate pick-up and delivery times.  We also use the system to monitor engine idling time, speed, performance, and other factors that affect operating efficiency.

As an additional service to customers, we offer electronic data interchange and Internet-based communication for customer usage in tendering loads and accessing information such as cargo position, delivery times, and billing information.  These services allow us to communicate electronically with our customers, permitting real-time information flow, reductions or eliminations in paperwork, and the employment of fewer clerical personnel.  We use a document imaging system to reduce paperwork and enhance access to important information.

Our operations generally follow the seasonal norm for the trucking industry.  Equipment utilization is usually at its highest from May to August, maintains high levels through October, and generally decreases during the winter, holiday seasonaround holidays, and as inclement weather impedes operations.

We operate throughout the United States and in parts of Canada and Mexico, with substantially all of our revenue generated from within the United States.  All of our assets are domiciled in the United States, and for the past three years, less than one percent of our revenue has been generated in Canada and Mexico.  We do not separately track domestic and foreign revenue from customers or domestic and foreign long-lived assets, and providing such information would be impracticable.

In 2009, we began a multi-year project to upgrade the hardware and software of our information systems.  The goal upon completion of the project is to have uniform operational and financial systems across the entire company as we believe this will improve customer service, utilization, and enhance our visibility into and across the organization.  The Company incurred approximately $2.6 million in 2009 related to this system upgrade, and all related amounts are included in construction in progress in the consolidated balance sheet as the related systems were not implemented as of December 31, 2009.

Drivers and Other Personnel

Driver recruitment, retention, and satisfaction are essential to our success, and we have made each of these factors a primary element of our strategy.  We recruit both experienced and student drivers as well as independent contractor drivers who own and drive their own tractor and provide their services to us under lease.  We conduct recruiting and/or driver orientation efforts from five of our locations, and we offer ongoing training throughout our terminal network.  We emphasize driver-friendly operations throughout our organization.  We have implemented automated programs to signal when a driver is scheduled to be routed toward home, and we assign fleet managers specific tractor units, regardless of geographic region, to foster positive relationships between the drivers and their principal contact with us.

The truckload industry has periodically experienced difficulty in attracting and retaining enough qualified truck drivers.  It is also common for the driver turnover rate of individual carriers to exceed 100% in a year.  At times, there are driver shortages in the trucking industry.  In past years, when there were driver shortages, the number of qualified drivers had not kept pace with freight growth because of (i) changes in the demographic composition of the workforce; (ii) alternative employment opportunities other than truck driving that became available in a growing economy; and (iii) individual drivers' desire to be home more often.

While the driver recruiting and retention market remained challenging in 2008, it was less difficult than the driver market experienced during 2007.prior years, retention remained challenging in 2009.  We believe weakness in the housing market contributed favorably to our recruiting and retention efforts for much of 2008.  In addition,2009.  Our results of operations could be negatively impacted by the new Comprehensive Safety Analysis regulations that will go into effect in late 2010 and, if adopted, recent rules proposed by the FMCSAFederal Motor Carrier Safety Administration ("FMCSA") requiring additional training for potential drivers to obtain a commercial driver's license, as these regulations could materially impact the number of potential new drivers entering the industry and accordingly, negatively impact our resultsor the qualifications of operation.drivers already in the industry.  We anticipate that competition for qualified drivers will remain high, particularly if the economy improves, and cannot predict whether we will experience future shortages.  If such a shortage werewas to occur and a driver pay rate increase became necessary to attract and retain drivers, our consolidated results of operations could be negatively impacted to the extent that we may be unable to obtain corresponding freight rate increases.

6


We use driver teams in a substantial portion of our tractors.  Driver teams permit us to provide expedited service on selected long-haul lanes because driver teams are able to handle longer routes and drive more miles while remaining within U.S. Department of Transportation ("DOT") safetyhours of service rules.  The use of teams contributes to greater equipment utilization of the tractors they drive than obtained with single drivers.  The use of teams, however, increases personnel costs as a percentage of revenue and the number of drivers we must recruit.  At December 31, 2008,2009, teams operated approximately 31%29% of our tractors.

We are not a party to a collective bargaining agreement.  At December 31, 2008,2009, we employed approximately 4,3444,065 drivers and approximately 935754 non-driver personnel.  At December 31, 2008,2009, we also contracted with approximately 9193 independent contractor drivers.  We believe that we have a good relationship with our personnel.

Revenue Equipment

We believe that operating high quality, late-model equipment contributes to operating efficiency, helps us recruit and retain drivers, and is an important part of providing excellent service to customers.  Our policy is to operate oura low age fleet of tractors, whilewith the majority of units under warranty, to minimize repair and maintenance costs and reduce service interruptions caused by breakdowns.  We also order most of our equipment with uniform specifications to reduce our parts inventory and facilitate maintenance.  At December 31, 2008,2009, our tractor fleet had an average age of approximately 2522 months and our trailer fleet had an average age of approximately 5158 months.  At December 31, 2008,2009, approximately 36%64% of our tractors were equipped with 2007 emission-compliant engines.  Approximately 81%82% of our trailers were dry vans and the remainder were refrigerated vans.

Over the past several years, the price of new tractors has risen dramatically, while the resale value has generally not changed or in the current market,has decreased.  This has substantially increased our costs of operation over the past several years.  ManufacturersTractor manufacturers have indicated that they intend to continue increasing prices prior to and following the introduction of 2010 emission-compliant engines.

Industry and Competition

The U.S. market for truck-based transportation services generates total revenues of greater than an estimated $600 billion and is projected to follow the overall U.S. economy.  The trucking industry includes both private fleets and "for-hire" carriers.  We operate in the highly fragmented for-hire truckload segment of this market, which generates estimated revenues of approximately $300 billion.  Our dedicated business also competes in the estimated $280 billion-plus private fleet portion of the overall trucking market, by seeking to convince private fleet operators to outsource or supplement their private fleets.

7

The United States trucking industry is highly competitive and includes thousands of "for-hire" motor carriers, none of which dominate the market.  Service and price are the principal means of competition in the trucking industry.  We compete to some extent with railroads and rail-truck intermodal service but differentiate ourselfourselves from them on the basis of service.  Rail and rail-truck intermodal movements are more often subject to delays and disruptions arising from rail yard congestion, which reduce the effectiveness of such service to customers with time-definite pick-up and delivery schedules.  In times of high fuel prices or less consumer demand, however, rail-intermodal competition becomes more significant.

We believe that the cost and complexity of operating trucking fleets are increasing and that economic and competitive pressures are likely to force many smaller competitors and private fleets to consolidate or exit the industry.  As a result, we believe that larger, better-capitalized companies, like us, will have opportunities to increase profit margins and gain market share.  In the market for dedicated services, we believe that truckload carriers, like us, have a competitive advantage over truck lessors, who are the other major participants in the market, because we can offer lower prices by utilizing back-haul freight within our network that traditional lessors may not have.

Regulation

Our operations are regulated and licensed by various U.S. agencies.  Our company drivers and independent contractors also must comply with the safety and fitness regulations of the United States Department of Transportation ("DOT"),DOT, including those relating to drug and alcohol testing and hours-of-service.  Such matters as weight and equipment dimensions are also subject to U.S. regulations.  We also may become subject to new or more restrictive regulations relating to fuel emissions, drivers' hours-of-service, ergonomics, or other matters affecting safety or operating methods.  Other agencies, such as the EPAEnvironmental Protection Agency ("EPA") and the Department of Homeland Security ("DHS"), also regulate our equipment, operations, and drivers.


The DOT, through the Federal Motor Carrier Safety Administration ("FMCSA"),FMCSA, imposes safety and fitness regulations on us and our drivers.  New rules that limit driver hours-of-service were adopted effective January 4, 2004, and then modified effective October 1, 2005 (the "2005 Rules").  In July 2007, a federal appeals court vacated portions of the 2005 Rules.  Two of the key portions that were vacated include the expansion of the driving day from 10 hours to 11 hours, and the "34-hour restart," which allowed drivers to restart calculations of the weekly on-duty time limits after the driver had at least 34 consecutive hours off duty.  The court indicated that, in addition to other reasons, it vacated these two portions of the 2005 Rules because FMCSA failed to provide adequate data supporting its decision to increase the driving day and provide for the 34-hour restart.  In November 2008, following the submission of additional data by FMCSA and a series of appeals and related court rulings, FMCSA published its final rule, which retains the 11 hour driving day and the 34-hour restart.restart (the "Final Rule").  However, advocacy groups may continuehave continued to challenge the Final Rule and on October 26, 2009, the FMCSA agreed pursuant to a settlement agreement with certain advocacy groups that the Final Rule on driver hours-of-service would not take effect pending the publication of a new Notice of Proposed Rulemaking.  Under the settlement agreement, the FMCSA will submit the draft Notice of Proposed Rulemaking to the Office of Management and Budget by July 2010, and the FMCSA will issue a final rule.  rule by 2012.  The current hours-of-service rules, adopted in 2005, will remain in effect during the rulemaking proceedings.  In December 2009, the FMCSA issued a notice soliciting data and research information the FMCSA may consider in drafting the forthcoming Notice of Proposed Rulemaking.

We are unable to predict what form the new rules may take, how a court may rule on such challenges to such rules, and to what extent the newFMCSA might attempt to materially revise the rules under the current presidential administration may become involved in this issue.administration.  On the whole, however, we believe a court's decisionany modifications to strike down the final rule wouldcurrent rules will decrease productivity and cause some loss of efficiency, as drivers and shippers may need to be retrained, computer programming may require modifications, additional drivers may need to be employed or engaged, additional equipment may need to be acquired, and some shipping lanes may need to be reconfigured.  We

The FMCSA's new Comprehensive Safety Analysis 2010 initiative introduces a new enforcement and compliance model, which implements driver standards in addition to the Company standards currently in place.  Under the new regulations, the methodology for determining a carrier's DOT safety rating will be expanded to include the on-road safety performance of the carrier's drivers.  Implementation of the new regulations is set for July 1, 2010, and enforcement will begin in late 2010.  As a result of new regulations, including the expanded methodology for determining a carrier's DOT safety rating, there may be an adverse effect on our DOT safety rating.  The Company currently has a satisfactory DOT safety rating, which is the highest available rating.  A conditional or unsatisfactory DOT safety rating could adversely affect our business because some of our customer contracts may require a satisfactory DOT safety rating, and a conditional or unsatisfactory rating could negatively impact or restrict our operations.  The new regulations also may result in a reduced number of eligible drivers.  If current or potential drivers are also unableeliminated due to predict the effect of any new rules that might be proposed if the final rule is stricken by a court, but any such proposed rules could increase costs in our industry or decrease productivity.Comprehensive Safety Analysis 2010 initiative, we may have difficulty attracting and retaining qualified drivers.

The Transportation Security Administration ("TSA") has adopted regulations that require determination by the TSA that each driver who applies for or renews his or her license for carrying hazardous materials is not a security threat.  This could reduce the pool of qualified drivers, which could require us to increase driver compensation, limit our fleet growth, or result in trucks sitting idle.  These regulations also could complicate the matching of available equipment with hazardous material shipments, thereby increasing our response time on customer orders and our non-revenue miles.  As a result, it is possible we could fail to meet the needs of our customers or could incur increased expenses to do so.

SomeCertain states and municipalities have beguncontinue to restrict the locations and amount of time where diesel-powered tractors, such as ours, may idle, in order to reduce exhaust emissions.  These restrictions could force us to alter our drivers' behavior, purchase on-board power units that do not require the engine to idle, or face a decrease in productivity.

We are subject to various environmental laws and regulations dealing with the hauling and handling of hazardous materials, fuel storage tanks, air emissions from our vehicles and facilities, engine idling, and discharge and retention of storm water.water, and other environmental matters that import inherent environmental risks.  We operate in industrial areas, where truck terminals and other industrial activities are located, and where groundwater or other forms of environmental contamination have occurred.  Our operations involve the risks of fuel spillage or seepage, environmental damage, and hazardous waste disposal, among others.  We also maintain above-ground bulk fuel storage tanks and fueling islands at three of our facilities.  A small percentage of our freight consists of low-grade hazardous substances, which subjects us to a wide array of regulations.  Although we have instituted programs to monitor and control environmental risks and promote compliance with applicable environmental laws and regulations, if we are involved in a spill or other accident involving hazardous substances, if there are releases of hazardous substances we transport, or if we are found to be in violation of applicable laws or regulations, we could be subject to liabilities, including substantial fines or penalties or civil and criminal liability, any of which could have a materially adverse effect on our business and operating results.

Regulations further limiting exhaust emissions became effective both in 2002 and in 2007 and become progressively more restrictive in 2010.  Compliance with such regulations has increased the cost of our new tractors and could impair equipment productivity, lower fuel mileage, and increase our operating expenses.  These adverse effects, combined with the uncertainty as to the reliability of the newly designed diesel engines and the residual values of these vehicles, could materially increase our costs or otherwise adversely affect our business or operations.


Fuel Availability and Cost

We actively manage our fuel costs by routing our drivers through fuel centers with which we have negotiated volume discounts.  During the past several years, fuel cost per gallon has increased, though the cost of fuel eased overwas lower in 2009 than 2008 considering the last five months ofhistorical highs for petroleum products in 2008.  We have also reduced the maximum speed of many of our trucks, implemented strict idling guidelines for our drivers, encouraged the use of shore power units in truck stops, and imposed standards for accepting broker freight that include a minimum combined rate and assumed fuel surcharge component.  This combination of initiatives has contributed to significant improvements in fleetwidefleet wide average fuel mileage.  Moreover, we have a fuel surcharge revenue program in place with the majority of our customers, which has historically enabled us to recover some of the higher fuel costs; however, even with the fuel surcharges, the price of fuel has affected our profitability.  Most of these programs automatically adjust weekly depending on the cost of fuel.  There can be timing differences between a change in our fuel cost and the timing of the fuel surcharges billed to our customers.  In addition, we incur additional costs when fuel prices rise that can notcannot be fully recovered due to our engines being idled during cold or warm weather, empty or out-of-route miles, norand for fuel used by refrigerated trailer units that cannot begenerally are not billed to customers.  In addition, during 20072008 and 2008,2009, many customers attempted to modify their surcharge programs, some successfully, which has resulted in recovery of a smaller portion of fuel price increases.  Rapid increases in fuel costs or shortages of fuel could have a material adverse effect on our operations or future profitability.  As

The Company engages in activities that expose it to market risks, including the effects of December 31, 2008,changes in fuel prices.  Financial exposures are evaluated as an integral part of the Company's risk management program, which seeks, from time to time, to reduce potentially adverse effects that the volatility of fuel markets may have on operating results.  In an effort to seek to reduce the variability of the ultimate cash flows associated with fluctuations in diesel fuel prices, we had noperiodically enter into various derivative instruments, including forward futures swap contracts.  The Company does not engage in speculative transactions, nor does it hold or issue financial instruments for trading purposes.

The Company did not enter into any derivatives until the third quarter of 2009; however, in September 2009 we entered into forward futures swap contracts, which pertain to reduce2.5 million gallons of diesel, or approximately 4%, of our exposureprojected January through December 2010 fuel requirements.  Under these contracts, we pay a fixed rate per gallon of heating oil and receive the monthly average price of New York heating oil.  The retrospective and prospective regression analyses provided that changes in the prices of diesel fuel and heating oil were deemed to fuel-price fluctuations.be highly effective based on the relevant authoritative guidance.

Seasonality

Our tractor productivity generally decreases during the winter season because inclement weather impedes operations, and some shippers reduce their shipments after the winter holiday season.  Revenue can also be affected by bad weather and holidays, since revenue is directly related to available working days of shippers.  At the same time, operating expenses increase, with fuel efficiency declining because of engine idling and harsh weather sometimes creating higher accident frequency, increased claims, and more equipment repairs.  We can also suffer short-term impacts from weather-related events such as hurricanes, blizzards, ice storms, and floods that could harm our results or make our results more volatile.

Additional Information

At December 31, 2008,2009, our corporate structure included Covenant Transportation Group, Inc., a Nevada holding company organized in May 1994, and its wholly owned subsidiaries: Covenant Transport, Inc., a Tennessee corporation; Southern Refrigerated Transport, Inc., an Arkansas corporation; Star Transportation, Inc., a Tennessee corporation; Covenant Transport Solutions, Inc., a Nevada corporation; Covenant Logistics, Inc., a Nevada corporation; Covenant Asset Management, Inc., a Nevada corporation; Southern Refrigerated Transport, Inc., an Arkansas corporation; CTG Leasing Company, a Nevada corporation; CVTI Receivables Corp., a Nevada corporation; Star Transportation, Inc., a Tennessee corporation;and Volunteer Insurance Limited, a Cayman Islands company; and Covenant Transport Solutions, Inc., a Nevada corporation.  company.

Our headquarters areis located at 400 Birmingham Highway, Chattanooga, Tennessee 37419, and our website address is www.covenanttransport.com.  Our Annual Report on Form 10-K, quarterly reports on Form 10-Q, current reports on Form 8-K, and all other reports we file with the SEC pursuant to Section 13(a) or 15(d) of the Securities Exchange Act of 1934, as amended (the "Exchange Act") are available free of charge through our website.  Information contained in or available through our website is not incorporated by reference into, and you should not consider such information to be part of, this Annual Report on Form 10-K.


ITEM 1A. 1A.                     RISK FACTORS

Factors That May Affect Future Results

Our future results may be affected by a number of factors over which we have little or no control.  The following discussion of risk factors contains forward looking statements as discussed in Item 1 above.  The following issues, uncertainties, and risks, among others, should be considered in evaluating our business and growth outlook.

Our business is subject to general economic and business factors affecting the trucking industry that are largely out of our control, any of which could have a materially adverse effect on our operating results.

Our business is dependent on a number of factors that may have a materially adverse effect on our results of operations, many of which are beyond our control.  Some of the most significant of these factors include excess tractor and trailer capacity in the trucking industry, declines in the resale value of used equipment, strikes or other work stoppages, increases in interest rates, fuel taxes, tolls, and license and registration fees, and rising costs of healthcare.

We also are affected by recessionary economic cycles, changes in customers' inventory levels, and downturns in customers' business cycles, particularly in market segments and industries, such as retail and manufacturing, where we have a significant concentration of customers, and regions of the country, such as California, Texas, and the Southeast, where we have a significant amount of business.  The risks associated with these factors are heightened in the current, severe recession facing the U.S. economy.  Some of the principal risks are as follows:

We may experience a reduction in overall freight levels, which may impair our asset utilization;
Certain of our customers are facing credit issues and could experience cash flow problems that may lead to payment delays, increased credit risk, bankruptcies, and other financial hardships that could result in even lower freight demand and may require us to increase our allowance for doubtful accounts;
Freight patterns may change as supply chains are redesigned, resulting in an imbalance between our capacity and our customers' freight demand;
Customers may bid out freight or select competitors that offer lower rates from among existing choices in an attempt to lower their costs, and we might be forced to lower our rates or lose freight; and
We may be forced to accept more freight from freight brokers, where freight rates are typically lower, or may be forced to incur more non-revenue miles to obtain loads.

In addition, it is not possible to predict the effects of actual or threatened terrorist attacks, efforts to combat terrorism, military action against any foreign state, heightened security requirements, or other related events.  Such events, however, could negatively impact the economy and consumer confidence in the United States.  Such events could also have a materially adverse effect on our future results of operations.

We may not be successful in improving our profitability.

In mid-2005, we undertook a strategic plan designed to improve our profitability.  Among other things, this plan included changes to items such as the customer base, rate structure, routes served, driver domiciles, management, reporting structure, and operating procedures.  These changes, and others that we did not expect, have presented, and are expected to continue to present, significant challenges, particularly in light of weak freight demand and highincreased fuel prices that have persisted since the second half of 2006.2006, as well as the negative impact economic conditions have had on freight rates and volumes since mid-2008.  Despite our efforts to execute the strategic plan, we experienced a net loss in 20082009 and also may experience a net loss in 2009 also.2010.  If we are unable to improve our profitability, then our liquidity, financial position, and results of operations may be adversely affected.

Our Credit AgreementFacility and other financing arrangements contain certain covenants, restrictions, and requirements, and we may be unable to comply with the covenant, restrictions, and requirements.  A default could result in the acceleration of all or part of our outstanding indebtedness, which could have an adverse effect on our financial condition, liquidity, results of operations, and the price of our common stock.

We have an $85.0 million Credit AgreementFacility with a group of banks and numerous other financing arrangements.  The Credit AgreementFacility contains certain restrictions and covenants relating to, among other things, dividends, liens, acquisitions and dispositions outside of the ordinary course of business, affiliate transactions, and a fixed charge coverage ratio of at least 1.0 to 1.0.ratio.  On March 27, 2009, weFebruary 25, 2010, the Company obtained an amendment to ourits Credit Agreement, thatFacility, which, among other things (i) amended certain defined terms in the Credit Facility, (ii) retroactively to January 1, 20092010, amended the fixed charge coverage ratio covenant for January and February 2009,through June 30, 2010, which cured ourprevented a default of that covenant for January 2009, and reset2010, (iii) restarted the look back requirements of the fixed charge coverage ratio covenant beginning on January 1, 2010, and (iv) required the Company to levels consistent with our 2009 budget.order updated appraisals for certain real estate described in the Credit Facility.  In consideration of these changes, we agreed to certain fees in connection with the amendment and increases in our interest rates and fees under the Credit Agreement.amendment.  We have had difficulty meeting budgeted results in the past.  If we are unable to meet budgeted results or otherwise comply with our Credit Agreement,Facility, we may be unable to obtain a further amendment or waiver under our Credit AgreementFacility, or doing so may result in additional fees.  See "Liquidity and Capital Resources – Material"Material Debt Agreements – Credit Agreement"Agreements" below for additional information on the recent amendment of our Credit Agreement.

information.
10


Certain other financing arrangements contain certain restrictions and covenants, as well.  If we fail to comply with any of our financing arrangement covenants, restrictions, and requirements, we will be in default under the relevant agreement, which could cause cross-defaults under theour other financing arrangements.  In the event of any such default, if we failed to obtain replacement financing, amendments to, or waivers under the applicable financing arrangements, our lenders could cease making further advances, declare our debt to be immediately due and payable, fail to renew letters of credit, impose significant restrictions and requirements on our operations, institute foreclosure procedures against their collateral, or impose significant fees and transaction costs.  If acceleration occurs, the current credit market crisis may make it difficult or expensive to refinance the accelerated debt or we may have to issue equity securities, which would dilute stock ownership.  Even if new financing is made available to us, the current lack of available credit and consequent more stringent borrowing terms may mean that credit is not available to us on acceptable terms.  A default under our financing arrangements could cause a materially adverse effect on our liquidity, financial condition, and results of operations.

Our substantial indebtedness and capital and operating lease obligations could adversely affect our ability to respond to changes in our industry or business.

As a result of our level of debt, capital leases, operating lease obligations, and encumbered assets:

Our vulnerability to adverse economic conditions and competitive pressures is heightened;
We will continue to be required to dedicate a substantial portion of our cash flows from operations to operating lease payments and repayment of debt, limiting the availability of cash for other purposes;
Our flexibility in planning for, or reacting to, changes in our business and industry will be limited;
Our profitability is sensitive to fluctuations in interest rates because some of our debt obligations are subject to variable interest rates, and future borrowings and lease financing arrangements will be affected by any such fluctuations;
Our ability to obtain additional financing in the future for working capital, capital expenditures, acquisitions, or other purposes may be limited; and
We may be required to issue additional equity securities to raise funds, which would dilute the ownership position of our stockholders.

Our financing obligations could negatively impact our future operations, our ability to satisfy our capital needs, or our ability to engage in other business activities.  We also cannot assure you that additional financing will be available to us when required or, if available, will be on terms satisfactory to us.

Fluctuations in the price or availability of fuel, hedging activities, and the volume and terms of diesel fuel purchase commitments, and surcharge collection and surcharge policies approved by customers may increase our costs of operation, which could materially and adversely affect our profitability.

Fuel is one of our largest operating expenses.  Diesel fuel prices fluctuate greatly due to economic, political, weather, and other factors beyond our control each of which may lead to an increase in the cost of fuel.  Fuel also is subject to regional pricing differences and often costs more on the West Coast, where we have significant operations.  From time-to-time, we have useduse hedging contracts and volume purchase arrangements to attempt to limit the effect of price fluctuations.  If we do hedge, weWe may be forced to make cash payments under the hedging arrangements.  We use a fuel surcharge program to recapture a portion of the increases in fuel prices over a base rate negotiated with our customers.  Our fuel surcharge program does not protect us against the full effect of increases in fuel prices.  The terms of each customer's fuel surcharge program vary and certain customers have sought to modify the terms of their fuel surcharge programs to minimize recoverability for fuel price increases.  A failure to improve our fuel price protection through these measures, increases in fuel prices, or a shortage of diesel fuel, could materially and adversely affect our results of operations.

We self-insure for a significant portion of our claims exposure, which could significantly increase the volatility of, and decrease the amount of, our earnings.

Our future insurance and claims expense could reduce our earnings and make our earnings more volatile.  We self-insure for a significant portion of our claims exposure and related expenses.  We accrue amounts for liabilities based on our assessment of claims that arise and our insurance coverage for the periods in which the claims arise, and we evaluate and revise these accruals from time-to-time based on additional information.  We do not currently maintain directors and officers' insurance coverage, although we are obligatedDue to indemnify them against certain liabilities they may incur while serving in such capacities.  Because of our significant self-insured amounts, we have significant exposure to fluctuations in the number and severity of claims and the risk of being required to accrue or pay additional amounts if our estimates are revised or the claims ultimately prove to be more severe than originally assessed.  Historically, we have had to significantly adjust our reserves on several occasions, and future significant adjustments may occur.


We maintain insurance above the amounts for which we self-insure with licensed insurance carriers.  If any claim werewas to exceed our coverage, we would bear the excess, in addition to our other self-insured amounts.  Our insurance and claims expense could increase when our current coverage expires, or we could raise our self-insured retention.  Although we believe our aggregate insurance limits are sufficient to cover reasonably expected claims, it is possible that one or more claims could exceed those limits.  Our insurance and claims expense could increase, or we could find it necessary to again raise our self-insured retention or decrease our aggregate coverage limits when our policies are renewed or replaced.  Our operating results and financial condition may be adversely affected if these expenses increase, if we experience a claim in excess of our coverage limits, if we experience a claim for which we do not have coverage, or if we have to increase our reserves again.

Our minority investment in Transplace has not performed in accordance with our expectations, and we could be subject to a write-down or write-off of our investment if the operations of Transplace fail to improve.
12

 
We own approximately 12.4% of a global transportation logistics service called Transplace. In the formation transaction, we contributed our logistics customer list, logistics business software and software licenses, certain intellectual property, intangible assets totaling approximately $5.1 million, and $5.0 million in cash, in exchange for our ownership.  We account for our investment using the cost method of accounting, with the investment included in other assets. We continue to evaluate our cost method investment in Transplace for impairment due to declines considered to be other than temporary.  This impairment evaluation includes general economic and company-specific evaluations.  If we determine that a decline in the cost value of this investment is other than temporary, then a charge to earnings will be recorded to other (income) expenses in our consolidated condensed statements of operations for all or a portion of the unrealized loss, and a new cost basis in the investment will be established.  If Transplace or we engage in transactions that indicate a value for our interest below our carrying cost, or there are sufficient losses, we may be forced to write down the value of our investment.

We operate in a highly competitive and fragmented industry, and numerous competitive factors could impair our ability to maintain or improve our profitability.

These factors include:

We compete with many other truckload carriers of varying sizes and, to a lesser extent, with less-than-truckload carriers, railroads, intermodal companies, and other transportation companies, many of which have more equipment and greater capital resources than we do.
Many of our competitors periodically reduce their freight rates to gain business, especially during times of reduced growth rates in the economy, which may limit our ability to maintain or increase freight rates or maintain significant growth in our business.
Many of our customers are other transportation companies, and they may decide to transport their own freight.
Many customers reduce the number of carriers they use by selecting "core carriers" as approved service providers, and in some instances we may not be selected.
Many customers periodically accept bids from multiple carriers for their shipping needs, and this process may depress freight rates or result in the loss of some business to competitors.
The trend toward consolidation in the trucking industry may create other large carriers with greater financial resources and other competitive advantages relating to their size.
Advances in technology require increased investments to remain competitive, and our customers may not be willing to accept higher freight rates to cover the cost of these investments.
Competition from non-asset-based logistics and freight brokerage companies may adversely affect our customer relationships and freight rates.
Economies of scale that may be passed on to smaller carriers by procurement aggregation providers may improve their ability to compete with us.

We derive a significant portion of our revenue from our major customers, the loss of one or more of which could have a materially adverse effect on our business.

A significant portion of our revenue is generated from our major customers.  Generally, we do not have long termlong-term contractual relationships with our major customers, and our customers may not continue to use our services or could reduce their use of our services.  For some of our customers, we have entered into multi-year contracts, and the rates we charge may not remain advantageous.  A reduction in or termination of our services by one or more of our major customers could have a materially adverse effect on our business and operating results.


Increases in driver compensation or difficulty in attracting and retaining qualified drivers could adversely affect our profitability.

Like many truckload carriers, we experience substantial difficulty in attracting and retaining sufficient numbers of qualified drivers, including independent contractors.  In addition, due in part to current economic conditions, including the cost of fuel, insurance, and tractors, the available pool of independent contractor drivers has not met demand overbeen declining.  Regulatory requirements, including the past several years, though this trend eased slightly at certain timesnew Comprehensive Safety Analysis 2010 initiative (discussed below), and an improvement in 2008.  Becausethe economy could reduce the number of possible shortageseligible drivers or force us to pay more to attract and retain drivers.  A shortage of qualified drivers the availability of alternative jobs, and intense competition for drivers from other trucking companies we expect to continue to face somewill create difficulties in increasing the number of our drivers, including independent contractor drivers.  The compensation we offer our drivers and independent contractors is subject to market conditions, and we may find it necessary to increase driver and independent contractor compensation in future periods.  In addition, we and our industry suffer from a high turnover rate of drivers.  Our high turnover rate requires us to continually recruit a substantial number of drivers in order to operate existing revenue equipment.  If we are unable to continue to attract and retain a sufficient number of drivers, we could be forced to, among other things, adjust our compensation packages, increase the number of our tractors without drivers, or operate with fewer trucks and face difficulty meeting shipper demands, allany of which wouldcould adversely affect our growth and profitability.

We operate in a highly regulated industry, and changes in regulations or increased costs of compliance with, or liability for violation of, existing or future regulations could have a materially adverse effect on our business.

Our operations are regulated and licensed by various U.S., Canadian, and Mexican agencies.  Our company drivers and independent contractors also must comply with the safety and fitness regulations of the United States DOT, including those relating to drug and alcohol testing and hours-of-service.  Such matters as weight and equipment dimensions also are also subject to U.S. and Canadian regulations.  We also may become subject to new or more restrictive regulations relating to fuel emissions, drivers' hours-of-service, ergonomics, or other matters affecting safety or operating methods.  Other agencies, such as the Environmental Protection Agency, or EPA, and the Department of Homeland Security, or DHS, also regulate our equipment, operations, and drivers.  Future laws and regulations may be more stringent and require changes in our operating practices, influence the demand for transportation services, or require us to incur significant additional costs.  Higher costs incurred by us or by our suppliers who pass the costs onto us through higher prices could adversely affect our results of operations.

The DOT, through the FMCSA, imposes safety and fitness regulations on us and our drivers.  New rules that limit driver hours-of-service were adopted, effective January 4, 2004, and then modified, effective October 1, 2005 (the "2005 Rules").  In July 2007, a federal appeals court vacated portions of the 2005 Rules.  Two of the key portions that were vacated include the expansion of the driving day from 10 hours to 11 hours, and the "34-hour restart," which allowed drivers to restart calculations of the weekly on-duty time limits after the driver had at least 34 consecutive hours off duty.  The court indicated that, in addition to other reasons, it vacated these two portions of the 2005 Rules because FMCSA failed to provide adequate data supporting its decision to increase the driving day and provide for the 34-hour restart.  In November 2008, following the submission of additional data by FMCSA and a series of appeals and related court rulings, FMCSA published its final rule, which retains the 11 hour driving day and the 34-hour restart.restart (the "Final Rule").  However, advocacy groups may continuehave continued to challenge the Final Rule and on October 26, 2009, the FMCSA agreed pursuant to a settlement agreement with certain advocacy groups that the Final Rule on driver hours-of-service would not take effect pending the publication of a new Notice of Proposed Rulemaking.  Under the settlement agreement, the FMCSA will submit the draft Notice of Proposed Rulemaking to the Office of Management and Budget by July 2010, and the FMCSA will issue a final rule.  rule by 2012.  The current hours-of-service rules, adopted in 2005, will remain in effect during the rulemaking proceedings.  In December 2009, the FMCSA issued a notice soliciting data and research information the FMCSA may consider in drafting the forthcoming Notice of Proposed Rulemaking.

We are unable to predict what form the new rules may take, how a court may rule on such challenges to such rules, and to what extent the newFMCSA might attempt to materially revise the rules under the current presidential administration may become involved in this issue.administration.  On the whole, however, we believe a court's decisionany modifications to strike down the final rule wouldcurrent rules will decrease productivity and cause some loss of efficiency, as drivers and shippers may need to be retrained, computer programming may require modifications, additional drivers may need to be employed or engaged, additional equipment may need to be acquired, and some shipping lanes may need to be reconfigured.  We

The FMCSA's new Comprehensive Safety Analysis 2010 initiative introduces a new enforcement and compliance model, which implements driver standards in addition to the Company standards currently in place.  Under the new regulations, the methodology for determining a carrier's DOT safety rating will be expanded to include the on-road safety performance of the carrier's drivers.  Implementation of the new regulation is set for July 1, 2010, and enforcement will begin in late 2010.  As a result of these new regulations, including the expanded methodology for determining a carrier's DOT safety rating, there may be an adverse effect on our DOT safety rating.  The Company currently has a satisfactory DOT rating, which is the highest available rating.  A conditional or unsatisfactory DOT safety rating could adversely affect our business because some of our customer contracts may require a satisfactory DOT safety rating, and a conditional or unsatisfactory rating could negatively impact or restrict our operations.  The new regulations also may result in a reduced number of eligible drivers.  If current or potential drivers are also unableeliminated due to predict the effectComprehensive Safety Analysis 2010 initiative, we may have difficulty attracting and retaining qualified drivers.

On December 26, 2007, the FMCSA published a Notice of any new rules that mightProposed Rule Making in the Federal Register regarding minimum requirements for entry level driver training.  Under the proposed rule, a commercial driver's license applicant would be proposed ifrequired to present a valid driver training certificate obtained from an accredited institution or program.  Entry-level drivers applying for a Class A commercial driver's license would be required to complete a minimum of 120 hours of training, consisting of 76 classroom hours and 44 driving hours.  The current regulations do not require a minimum number of training hours and require only classroom education.  Drivers who obtain their first commercial driver's license during the three-year period after the FMCSA issues a final rule would be exempt.  The FMCSA has not established a deadline for issuing the final rule, but the comment period expired on May 23, 2008.  If the rule is stricken by a court, but any such proposed rulesapproved as written, this rule could increase costs inmaterially affect the number of potential new drivers entering the industry and, accordingly, negatively affect our industry or decrease productivity.results of operations.

In the aftermath of the September 11, 2001 terrorist attacks, federal, state, and municipal authorities have implemented and continue to implement various security measures, including checkpoints and travel restrictions on large trucks.  The Transportation Security Administration, or TSA, of the DHS has adopted regulations that require determination by the TSA that each driver who applies for or renews his license for carrying hazardous materials is not a security threat.  This could reduce the pool of qualified drivers, which could require us to increase driver compensation, limit our fleet growth, or let trucks sit idle.  These regulations also could complicate the matching of available equipment with hazardous material shipments, thereby increasing our response time on customer orders and our non-revenue miles.  As a result, it is possible we may fail to meet the needs of our customers or may incur increased expenses to do so.  These security measures could negatively impact our operating results.


On December 1, 2008, the FMCSA issued a final rule that will require CDL holders to provide an original or current copy of the medical examiners certification to their State Driver Licensing Agency.  This action is the preamble to merge the CDL and the Medical Examination Certificate into a single electronic record.  We are unable to predict the effect of this rule on our industry, but we expect that this rule could increase costs and potentially could decrease productivity and the availability of qualified CDL drivers.

Some states and municipalities have begun to restrict the locations and amount of time where diesel-powered tractors, such as ours, may idle, in order to reduce exhaust emissions.  These restrictions could force us to alter our drivers' behavior, purchase on-board power units that do not require the engine to idle, or face a decrease in productivity.

Regulations further limiting exhaust emissions became effective bothIn general, the increasing burden of regulation raises our costs and lowers our efficiency.  Future laws and regulations may be more stringent and require changes in 2002 and in 2007 and become progressively more restrictive in 2010. Compliance with such regulations has increased the cost of our new tractors and could impair equipment productivity, lower fuel mileage, and increase our operating expenses. These adverse effects, combined withpractices, influence the uncertainty asdemand for transportation services, or require us to incur significant additional costs.  Higher costs incurred by us or by our suppliers who pass the reliability of the newly designed diesel engines and the residual values of these vehicles,costs on to us through higher prices could materially increase our costs or otherwise adversely affect our business orresults of operations.

We have significant ongoing capital requirements that could affect our profitability if we are unable to generate sufficient cash from operations and obtain financing on favorable terms.

The truckload industry is capital intensive, and our policy of operating newer equipment requires us to expend significant amounts annually.  We expect to pay for projected capital expenditures with cash flows from operations, borrowings under our Credit Agreement,Facility, proceeds under our financing facilities, and operating leases of revenue equipment.  If we are unable to generate sufficient cash from operations and obtain financing on favorable terms in the future, we may have to limit our growth,fleet size, enter into less favorable financing arrangements, or operate our revenue equipment for longer periods, any of which could have a materially adverse effect on our profitability.

We currently have trade-in or fixed residual agreements with certain equipment suppliers concerning a portion of our tractor fleet.  If the suppliers refuse or are unable to meet their financial obligations under these agreements or if we decline to purchase the relevant number of replacement units from the suppliers, we may suffer a financial loss upon the disposal of our equipment.

We may not make acquisitions in the future, or if we do, we may not be successful in our acquisition strategy.

We made ten acquisitions between 1996 and 2006.  Accordingly, acquisitions have provided a substantial portion of our growth.  We may not have the financial capacity to or be successful in identifying, negotiating, or consummating any future acquisitions.  If we fail to make any future acquisitions, our historical growth rate could be materially and adversely affected.  Any acquisitions we undertake could involve the dilutive issuance of equity securities and/or incurring indebtedness.  In addition, acquisitions involve numerous risks, including difficulties in assimilating the acquired company's operations, the diversion of our management's attention from other business concerns, risks of entering into markets in which we have had no or only limited direct experience, and the potential loss of customers, key employees, and drivers of the acquired company, all of which could have a materially adverse effect on our business and operating results.  If we make acquisitions in the future, we may not be able to successfully integrate the acquired companies or assets into our business.

Our operations are subject to various environmental laws and regulations, the violation of which could result in substantial fines or penalties.

We are subject to various environmental laws and regulations dealing with the hauling and handling of hazardous materials, fuel storage tanks, air emissions from our vehicles and facilities, engine idling, and discharge and retention of storm water.  We operate in industrial areas where truck terminals and other industrial activities are located, and where groundwater or other forms of environmental contamination have occurred.  Our operations involve the risks of fuel spillage or seepage, environmental damage, and hazardous waste disposal, among others.  We also maintain above-ground bulk fuel storage tanks and fueling islands at three of our facilities.  A small percentage of our freight consists of low-grade hazardous substances, which subjects us to a wide array of regulations.  Although we have instituted programs to monitor and control environmental risks and promote compliance with applicable environmental laws and regulations, if we are involved in a spill or other accident involving hazardous substances, if there are releases of hazardous substances we transport, or if we are found to be in violation of applicable laws or regulations, we could be subject to liabilities, including substantial fines or penalties or civil and criminal liability, any of which could have a materially adverse effect on our business and operating results.


Regulations further limiting exhaust emissions became effective both in 2002 and in 2007 and become progressively more restrictive in 2010.  Engines meeting new emissions standards generally cost more and require additional maintenance compared with earlier models.  Compliance with such regulations has increased the cost of our new tractors and could impair equipment productivity, lower fuel mileage, and increase our operating expenses.  These adverse effects, combined with the uncertainty as to the reliability of the newly designed diesel engines and the residual values of these vehicles, could materially increase our costs or otherwise adversely affect our business or operations.

Concern over climate change, including the impact of global warming, has led to significant legislative and regulatory efforts to limit greenhouse gas emissions, and some form of federal climate change legislation is possible in the relatively near future.  Regulations related to climate change that potentially impose restrictions, caps, taxes, or other controls on emissions of greenhouse gases could adversely affect our operations and financial results.  More specifically, legislative or regulatory actions related to climate change could adversely impact the Company by increasing our fuel costs and reducing fuel efficiency and could result in the creation of substantial additional capital expenditures and operating costs in the form of taxes, emissions allowances, or required equipment upgrades.  Until the timing, scope, and extent of any future regulation becomes known, we cannot predict its effect on our cost structure or our operating results; however, any future regulation could impair our operating efficiency and productivity and result in higher operating costs.

Increased prices, reduced productivity, and scarcity of financing for new revenue equipment may adversely affect our earnings and cash flows.

We are subject to risk with respect to higher prices for new tractors.  Prices may increase, due, in part, to government regulations applicable to newly manufactured tractors and diesel engines and due to the pricing power among equipment manufacturers.  The resale value of theMore restrictive EPA emissions standards have required vendors to introduce new tractors has not increased to the same extent.  Thus, equipment costs have increased significantly over the past several years.  In addition, the engines usedengines.  Additional EPA mandated emissions standards became effective for newly manufactured trucks in our newer tractors are subject to emissions control regulations issued by the Environmental Protection Agency ("EPA"). The regulations require progressive reductions in exhaust emissions from diesel engines for 2007 throughJanuary 2010.  Compliance with such regulations has increased the cost of our new tractors and could impair equipment productivity, lower fuel mileage, and increase our operating expenses.  These adverse effects, combined with the uncertainty as to the reliability of the vehicles equipped with the newly designed diesel engines and the residual values realized from the disposition of these vehicles, could increase our costs or otherwise adversely affect our business or operations as the regulations become effective. Over the past several years, some manufacturers have significantly increased new equipment prices, in part to meet new engine design requirements.

In addition, our financial results and shrinking capacity of lenders and lessors that provide tractor and trailer financing have made it increasingly difficult for us to finance acquisitions of new equipment.  As a result, we expect to continue to pay increased prices for equipment and incur additional expenses and related financing costs for the foreseeable future.

We have a combination of agreements and non-binding statements of indicative trade values covering the terms of trade-in commitments from our primary equipment vendors for disposal of a portion of our revenue equipment.  The prices we expect to receive under these arrangements may be higher than the prices we would receive in the open market.  We may suffer a financial loss upon disposition of our equipment if these vendors refuse or are unable to meet their financial obligations under these agreements, if we fail to enter into definitive agreements consistent with the indicative trade values, if we fail to enter into similar arrangements in the future, or if we do not purchase the required number of replacement units from the vendors.

Near the end of 2008, we lowered our tractor disposal proceeds expectations in response to a combination of sharply lower economic indicators, a worsening credit market, and significantly lower prices received for disposals of our used revenue equipment.  Based on these factors and the expected remaining useful lives of some of our equipment, we recorded impairments of the carrying values of most of the tractors and trailers currentlyrecorded as held for sale that arewere expected to be traded or sold in 2009 as well as most of our in-use tractors that arewere expected to be traded or sold in 2009 andor 2010.  Although we do not expect to be required to make any future cash expenditures as a result of this impairment charge, cash proceeds of future disposals of revenue equipment are anticipated to be lower than expected prior to this impairment charge.  Additional impairments of the carrying values of our revenue equipment could have a materially adverse effect on our business and operating results.

If we are unable to retain our key employees, our business, financial condition, and results of operations could be harmed.

We are highly dependent upon the services of the following key employees: David R. Parker, our Chairman of the Board, Chief Executive Officer, and President; Joey B. Hogan, our Senior Executive Vice President and Chief Operating Officer, as well asand President and Chief Operating Officer of our Covenant subsidiary; Richard B. Cribbs, our Senior Vice President and Chief Financial Officer; Tony Smith, our President of SRT; James Brower, our President of Star; Jerry Eddy, our Covenant subsidiary's Senior Vice President of Operations; M. David Hughes, our Senior Vice President, Corporate Treasurer, and Covenant subsidiary's Senior Vice President of Fleet Management and Procurement; and R.H. Lovin, Jr., our Covenant subsidiary's Executive Vice President of Administration.  We currently do not have employment agreements with any of the employees referenced above.  We do maintain key-man life insurance on David Parker. The loss of any of their services could negatively impact our operations and future profitability.  We must continue to develop and retain a core group of managers if we are to realize our goal of improving our profitability.


Our Chief Executive Officer and President and his wife control a large portion of our stock and have substantial control over us, which could limit yourother stockholders’ ability to influence the outcome of key transactions, including changes of control.

Our Chairman of the Board, Chief Executive Officer, and President, David Parker, and his wife, Jacqueline Parker, beneficially own approximately 40% of our outstanding Class A and Class B common stock and 100% of our Class B common stock.  On all matters with respect to which our stockholders have a right to vote, including the election of directors, each share of Class A common stock is entitled to one vote, while each share of Class B common stock is entitled to two votes.  All outstanding shares of Class B common stock are owned by the Parkers and are convertible to Class A common stock on a share-for-share basis at the election of the Parkers or automatically upon transfer to someone outside of the Parker family.  This voting structure gives the Parkers approximately 48% of the voting power of all of our outstanding stock.  The Parkers are able to substantially influence decisions requiring stockholder approval, including the election of our entire board of directors, the adoption or extension of anti-takeover provisions, mergers, and other business combinations.  This concentration of ownership could limit the price that some investors might be willing to pay for the Class A common stock, and could allow the Parkers to prevent or delay a change of control, which other stockholders may favor.  The interests of the Parkers may conflict with the interests of other holders of Class A common stock, and they may take actions affecting us with which youother stockholders disagree.

We depend on the proper functioning and availability of our information systems and a system failure or inability to effectively upgrade our information systems could cause a significant disruption to our business and have a materially adverse effect on our results of operation.

We depend on the proper functioning and availability of our information systems, including financial reporting and operating systems, in operating our business.  Our operating system is critical to understanding customer demands, accepting and planning loads, dispatching equipment and drivers, and billing and collecting for our services.  Our financial reporting system is critical to producing accurate and timely financial statements and analyzing business information to help us manage effectively.  We have begun a multi-year project to upgrade the hardware and software of our information systems.  If any of our critical information systems fail or become otherwise unavailable, whether as a result of the upgrade project or otherwise, we would have to perform the functions manually, which could temporarily impact our ability to manage our fleet efficiently, to respond to customers' requests effectively, to maintain billing and other records reliably, and to bill for services and prepare financial statements accurately or in a timely manner.  Our business interruption insurance may be inadequate to protect us in the event of an unforeseeable and extreme catastrophe.  Any system failure, delays, or complications in the upgrade, security breach, or other system failure could interrupt or delay our operations, damage our reputation, cause us to lose customers, or impact our ability to manage our operations and report our financial performance, any of which could have a materially adverse effect on our business.

If our stock does not continue to be traded on an established exchange or our public float is diminished, an active trading market may not exist and the trading price of our stock may decline.

Our common stock is listed on Thethe NASDAQ Global Select Market.  Nasdaq's continued listing standards for our common stock require, among other things, that (i) the closing bid price for our common stock not fall below $1.00; (ii) we have at least 400 beneficial holders and/or holders of record of our common stock; (iii) our stockholders' equity not fall below $10 million; and (iii)(iv) we have more than 750,000 shares held by the public (excluding officers, directors, and beneficial holders of 10% or more) with a market value of at least $5.0 million.million; and (v) we have at least two registered and active dealers meeting the requirements set forth in the standards.  A failure to meet these continued listing requirements is generally required to exist for a period of 10 to 30 consecutive business days (depending upon the type of failure) before a deficiency will be determined to exist.  In response to current market conditions, NASDAQ has temporarily suspended the enforcement rules requiring the minimum $1.00 closing bid price and may choose to further extend this suspension.  If our common stock werewas threatened with delisting from Thethe NASDAQ Global Select Market, we may, depending on the circumstances, seek to extend the period for regaining compliance with NASDAQ listing requirements or we may pursue other strategic alternatives to meet the continuing listing standards.

 
In addition, we may chosechoose to voluntarily delist from NASDAQ, or "go dark", in the event we believe we may be subject to a delisting proceeding or for any other reason our Board of Directors determines it to be in the best interest of our stockholders.

If our common stock is delisted by, or we voluntarily delist from, NASDAQ, our common stock may be eligible to trade on the NYSE Alternext U.S., the OTC Bulletin Board, or the Pink OTC Markets.  In such an event, it could become more difficult to dispose of, or obtain accurate quotations for the price of, our common stock, and there also would likely also be a reduction in our coverage by security analysts and the news media, which could cause the price of our common stock to decline further.

The stock market has recently experienced extreme price and volume fluctuations.  This volatility has had a significant effect on the market prices of securities issued by many companies for reasons unrelated to their operating performance.  These broad market fluctuations may materially adversely affect the market price of our common stock, regardless of our operating results.  In addition, as a result of our small public float and limited trading volume, our common stock may be more susceptible to volatility arising from any of these factors.

Seasonality and the impact of weather affect our operations and profitability.

Our tractor productivity decreases during the winter season because inclement weather impedes operations, and some customers reduce their shipments after the winter holiday season.  Revenue also can also be affected by bad weather and holidays, since revenue is directly related to available working days of shippers.  At the same time, operating expenses increase due to declining fuel efficiency because of engine idling and due to harsh weather creating higher accident frequency, increased claims, and more equipment repairs.  We also could also suffer short-term impacts from weather-related events such as hurricanes, blizzards, ice storms, and floods that could harm our results or make our results more volatile.  Weather and other seasonal events could adversely affect our operating results.


ITEM 1B.1B.                      UNRESOLVED STAFF COMMENTS

None.

ITEM 2.2.                      PROPERTIES

Our corporate headquarters and main terminal are located on approximately 180 acres of property in Chattanooga, Tennessee.  This facility includes an office building of approximately 182,000 square feet, a maintenance facility of approximately 65,000 square feet, a body shop of approximately 60,000 square feet, and a truck wash.  Our Solutions segment is also operated and managed out of the Chattanooga facility.  We maintain twelveeleven terminals, which are utilized by our Truckload segment located on our major traffic lanes in or near the cities listed below.  These terminals provide a base for drivers in proximity to their homes, a transfer location for trailer relays on transcontinental routes, parking space for equipment dispatch, and the other uses indicated below.

Terminal LocationsMaintenance
Recruiting/
Orientation
SalesOwnership
Chattanooga, TennesseexxxxLeased
Indianapolis, Indiana   Leased
Texarkana, ArkansasxxxxOwned
Hutchins, Texasxxx Owned
French Camp, CaliforniaLeased
Fontana, Californiax   Leased
Long Beach, California   Owned
Pomona, California x Owned
Allentown, Pennsylvania   Owned
Nashville, TennesseexxxxOwned
Olive Branch, Mississippix x Owned
Orlando, Florida   Leased


ITEM 3. 3.                     LEGAL PROCEEDINGS

From time to time we are a party to routine litigation arising in the ordinary course of business, most of which involves claims for personal injury and property damage incurred in connection with the transportation of freight.  We maintain insurance to cover liabilities arising from the transportation of freight for amounts in excess of certain self-insured retentions.

ITEM 4. SUBMISSION OF MATTERS TO A VOTE OF SECURITY HOLDERS                     (RESERVED AND REMOVED)

During the fourth quarter of the year ended December 31, 2008, no matters were submitted to a vote of security holders.


PART II

ITEM 5.5.                      MARKET FOR REGISTRANT'S COMMON EQUITY AND RELATED STOCKHOLDER MATTERS

Price Range of Common Stock

Our Class A common stock is traded on the NASDAQ NationalGlobal Select Market, under the symbol "CVTI." The following table sets forth, for the calendar periods indicated, the range of high and low sales price for our Class A common stock as reported by NASDAQ from January 1, 20072008, to December 31, 2008.2009.

Period High  Low  High  Low 
      
Calendar Year 2007:      
      
1st Quarter
 $12.50  $10.64 
2nd Quarter
 $11.83  $10.42 
3rd Quarter
 $11.55  $6.18 
4th Quarter
 $8.25  $6.27 
              
Calendar Year 2008:              
              
1st Quarter
 $8.48  $5.10  $8.48  $5.10 
2nd Quarter
 $6.45  $2.90  $6.45  $2.90 
3rd Quarter
 $5.64  $2.70  $5.64  $2.70 
4th Quarter
 $3.22  $1.36  $3.22  $1.36 
        
Calendar Year 2009:        
        
1st Quarter
 $2.38  $1.60 
2nd Quarter
 $5.88  $1.92 
3rd Quarter
 $5.47  $3.40 
4th Quarter
 $5.09  $3.68 

As of March 23, 2009,2010, we had approximately 57113 stockholders of record of our Class A common stock. However,stock; however, we estimate our actual number of stockholders is much higher because a substantial number of our shares are held of record by brokers or dealers for their customers in street names.  As of March 23, 2010, Mr. Parker, together with certain of his family members, owned all of the outstanding Class B common stock.

Dividend Policy

We have never declared and paid a cash dividend on our Class A or Class B common stock.  It is the current intention of our Board of Directors to continue to retain earnings to finance our business and reduce our indebtedness rather than to pay dividends.  The payment of cash dividends is currently limited by our financing arrangements.  Future payments of cash dividends will depend upon our financial condition, results of operations, capital commitments, restrictions under then-existing agreements, and other factors deemed relevant by our Board of Directors.

See "Equity Compensation Plan Information" under Item 12 in Part III of this Annual Report for certain information concerning shares of our Class A common stock authorized for issuance under our equity compensation plans.


ITEM 6. 6.                     SELECTED FINANCIAL DATA


(In thousands, except per share and operating data amounts) 
    
  
Years Ended December 31,
 
  2009  2008  2007  2006  2005 
Statement of Operations Data:               
Freight revenue $520,495  $615,810  $602,629  $572,239  $555,428 
Fuel surcharge revenue  68,192   158,104   109,897   111,589   87,626 
Total revenue
 $588,687  $773,914  $712,526  $683,828  $643,054 
                     
Operating expenses:                    
Salaries, wages, and related expenses
  216,158   263,793   270,435   262,303   242,157 
Fuel expense
  143,835   260,704   211,022��  194,355   170,582 
Operations and maintenance
  35,409   42,459   40,437   36,112   33,625 
Revenue equipment rentals and purchased transportation
  76,484   90,974   66,515   63,532   61,701 
Operating taxes and licenses
  12,113   13,078   14,112   14,516   13,431 
Insurance and claims
  31,955   37,578   36,391   34,104   41,034 
Communications and utilities
  5,740   6,702   7,377   6,727   6,579 
General supplies and expenses
  23,593   26,399   23,377   21,387   17,778 
Depreciation and amortization, including
     net gains on disposition of equipment
     and impairment of assets (1)
  48,122   63,235   53,541   41,150   39,101 
Goodwill impairment charge (2)
  -   24,671   -   -   - 
Total operating expenses  593,409   829,593   723,207   674,186   625,988 
Operating income (loss)  (4,722)  (55,679)  (10,681)  9,642   17,066 
Other (income) expense:                    
   Interest expense  14,184   10,373   12,285   7,166   4,203 
   Interest income  (144)  (435)  (477)  (568)  (273)
   Loss on sale of Transplace investment and note receivable (3)  11,485   -   -   -   - 
Loss on early extinguishment of debt
  -   726   -   -   - 
Other
  (199)  (160)  (183)  (157)  (538)
Other expenses, net  25,326   10,504   11,625   6,441   3,392 
Income (loss) before cumulative effect of
       change in accounting principle
  (30,048)  (66,183)  (22,306)  3,201   13,674 
Income tax expense (benefit)  (5,018)  (12,792)  (5,580)  4,582   8,003 
Income (loss) before cumulative effect of
       change in accounting principle
  (25,030)  (53,391)  (16,726)  (1,381)  5,671 
Cumulative effect of change in accounting
       principle, net of tax (4)
  -   -   -   -   (485)
Net income (loss) $(25,030) $(53,391) $(16,726) $(1,381) $5,186 
(In thousands, except per share and operating data amounts) 
    
  
Years Ended December 31,
 
  2008  2007  2006  2005  2004 
                
Statement of Operations Data:               
Freight revenue $615,810  $602,629  $572,239  $555,428  $558,453 
Fuel surcharges  158,104   109,897   111,589   87,626   45,169 
Total revenue
 $773,914  $712,526  $683,828  $643,054  $603,622 
                     
Operating expenses:                    
Salaries, wages, and related expenses (1)
  263,793   270,435   262,303   242,157   225,778 
Fuel expense
  260,704   211,022   194,355   170,582   127,723 
Operations and maintenance
  42,459   40,437   36,112   33,625   30,555 
Revenue equipment rentals and
purchased transportation
  90,974   66,515   63,532   61,701   69,928 
Operating taxes and licenses
  13,078   14,112   14,516   13,431   14,217 
Insurance and claims expense (2)
  37,578   36,391   34,104   41,034   54,847 
Communications and utilities
  6,702   7,377   6,727   6,579   6,517 
General supplies and expenses
  26,399   23,377   21,387   17,778   15,104 
Depreciation and amortization, including
net gains on disposition of equipment
and impairment of assets (3)
  63,235   53,541   41,150   39,101   45,001 
Goodwill impairment charge (4)
  24,671   -   -   -   - 
Total operating expenses  829,593   723,207   674,186   625,988   589,670 
Operating income (loss)  (55,679)  (10,681)  9,642   17,066   13,952 
Other (income) expense:                    
Interest expense
  10,373   12,285   7,166   4,203   3,098 
Interest income
  (435)  (477)  (568)  (273)  (48)
Loss on early extinguishment of debt
  726   -   -   -   - 
Other
  (160)  (183)  (157)  (538)  (926)
Other expenses, net  10,504   11,625   6,441   3,392   2,124 
Income (loss) before income taxes and
cumulative effect of change in
accounting principle
  (66,183)  (22,306)  3,201   13,674   11,828 
Income tax expense (benefit)  (12,792)  (5,580)  4,582   8,003   8,452 
Income (loss) before cumulative effect of
change in accounting principle
  (53,391)  (16,726)  (1,381)  5,671   3,376 
Cumulative effect of change in accounting
principle, net of tax (5)
  -   -   -   (485)  - 
Net income (loss) $(53,391) $(16,726) $(1,381) $5,186  $3,376 

(1)Includes a $1,500 pre-tax increase to workers' compensation claims reserve in 2004.
(2)Includes an $18,000 pre-tax increase to casualty claims reserve in 2004.
(3)Includes a $1,665 pre-tax impairment charge related to an airplane in 2007 and a $15,791 pretax impairment charge related to revenue equipment in 2008.  See the discussion below under "Additional Information Concerning ImpairmentNon-Cash Charges" for a more extensive description of these impairments.
(4)(2)Represents a $24,700 non-cash impairment charge to write off the goodwill associated with the acquisition of our Star Transportation subsidiary.  See the discussion below under "Additional Information Concerning ImpairmentNon-Cash Charges" for a more extensive description of this impairment.
(5)(3)
Represents a non-cash loss on sale of investment in Transplace and a related receivable.
(4)Represents a $485 adjustment, net of tax, related to the adoption of FIN 47, Accounting for Conditional Asset Retirement Obligations in 2005.


Basic earnings (loss) per share before
cumulative effect of change in accounting principle
 $(3.80) $(1.19) $(0.10) $0.40  $0.23 
                     
Cumulative effect of change in accounting principle  -   -   -   (0.03)  - 
                     
Basic earnings (loss) per share $(3.80) $(1.19) $(0.10) $0.37  $0.23 
                     
Diluted earnings (loss) per share before cumulative
effect of change in accounting principle:
 $(3.80) $(1.19) $(0.10) $0.40  $0.23 
                     
Cumulative effect of change in accounting principle  -   -   -   (0.03)  - 
                     
Diluted earnings (loss) per share $(3.80) $(1.19) $(0.10) $0.37  $0.23 
                     
Basic weighted average common shares outstanding  14,038   14,018   13,996   14,175   14,641 
                     
Diluted weighted average common shares outstanding  14,038   14,018   13,996   14,270   14,833 


  Years Ended December 31, 
  2008  2007  2006  2005  2004 
Selected Balance Sheet Data:               
Net property and equipment $236,018  $247,530  $274,974  $211,158  $209,422 
Total assets $393,676  $439,794  $475,094  $371,261  $357,383 
Long-term debt, less current maturities $107,956  $86,467  $104,900  $33,000  $8,013 
Total stockholders' equity $118,820  $172,266  $188,844  $189,724  $195,699 
                     
Selected Operating Data:                    
Average freight revenue per loaded mile (1) $1.53  $1.52  $1.51  $1.51  $1.40 
Average freight revenue per total mile (1) $1.36  $1.36  $1.36  $1.36  $1.27 
Average freight revenue per tractor per week (1) $3,105  $3,088  $3,077  $3,013  $2,995 
Average miles per tractor per year  118,992   118,159   117,621   115,765   122,899 
Weighted average tractors for year (2)  3,456   3,623   3,546   3,535   3,558 
Total tractors at end of period (2)  3,292   3,555   3,719   3,471   3,476 
Total trailers at end of period (3)  8,277   8,667   9,820   8,565   8,867 

(1)Excludes fuel surcharge revenue.
(2)Includes monthly rental tractors and tractors provided by owner-operators.
(3)Excludes monthly rental trailers.a new accounting standard related to asset retirement obligations.


Basic earnings (loss) per share before
       cumulative effect of change in accounting principle
 $(1.77) $(3.80) $(1.19) $(0.10) $0.40 
                     
Cumulative effect of change in accounting principle  -   -   -   -   (0.03)
                     
Basic earnings (loss) per share $(1.77) $(3.80) $(1.19) $(0.10) $0.37 
                     
Diluted earnings (loss) per share before cumulative
       effect of change in accounting principle:
 $(1.77) $(3.80) $(1.19) $(0.10) $0.40 
 
Cumulative effect of change in accounting principle
  -   -   -   -   (0.03)
                     
Diluted earnings (loss) per share $(1.77) $(3.80) $(1.19) $(0.10) $0.37 
                     
Basic weighted average common shares outstanding  14,124   14,038   14,018   13,996   14,175 
                     
Diluted weighted average common shares outstanding  14,124   14,038   14,018   13,996   14,270 


Years Ended December 31,
 
  2009  2008  2007  2006  2005 
Selected Balance Sheet Data:               
Net property and equipment $278,335  $236,018  $247,530  $274,974  $211,158 
Total assets $398,312  $393,676  $439,794  $475,094  $371,261 
Long-term debt and capital lease obligations, less current maturities $146,556  $107,956  $86,467  $104,900  $33,000 
Total stockholders' equity $94,675  $118,820  $172,266  $188,844  $189,724 
                     
Selected Operating Data:                    
Average freight revenue per loaded mile (1) $1.42  $1.53  $1.52  $1.51  $1.51 
Average freight revenue per total mile (1) $1.27  $1.36  $1.36  $1.36  $1.36 
Average freight revenue per tractor per week (1) $2,920  $3,105  $3,088  $3,077  $3,013 
Average miles per tractor per year  119,836   118,992   118,159   117,621   115,765 
Weighted average tractors for year (2)  3,111   3,456   3,623   3,546   3,535 
Total tractors at end of period (2)  3,113   3,292   3,555   3,719   3,471 
Total trailers at end of period (3)  8,005   8,277   8,667   9,820   8,565 
 (1)Excludes fuel surcharge revenue.
 (2)Includes monthly rental tractors and tractors provided by owner-operators.
 (3)Excludes monthly rental trailers.


ITEM 7. 7.                     MANAGEMENT'S DISCUSSION AND ANALYSIS OF FINANCIAL CONDITION AND RESULTS OF OPERATIONS

EXECUTIVE OVERVIEW

We are the eleventh largest truckload carrier in the United States measured by fiscal 2007 revenue according to Transport Topics, a publication of the American Trucking Associations, Inc.  We focus on targeted markets where we believe our service standards can provide a competitive advantage.  We are a major carrier for transportation companies such as freight forwarders, less-than-truckload carriers, and third-party logistics providers that require a high level of service to support their businesses, as well as for traditional truckload customers such as manufacturers, retailers, and retailers.food and beverage shippers.  We also generate revenue through a subsidiary that provides freight brokerage services.

Outlook for 2009

Our overriding goal for 2009 is to generate a profit.  Toward that end, we are undertaking strict cost controls and managing the size of our fleet to reflect available freight.  We believe our goal is achievable and have made the following assumptions, among others, in establishing our goal:

Industry-wide truckloadconsolidated operating freight tonnage will decline significantly versus 2008 in the first three quarters of 2009, before approaching 2008 levels in the fourth quarter;
Because of expected reduced volumes in our industry and the expected further deterioration of other sectors of the economy, freight rates will continue to suffer from downward pressure;
Uncertainty will persist regarding the availability of credit for our customers, their ability to make payments when due, additional pressures on our customer's cost structures, and additional pressures on our own expenses;
An anticipated reduction of our consolidated fleet size by 150 tractors in the first quarter of 2009, any further reductions required later in the year, and an increase in the full-year average percentage of team-driven tractors in our fleet will limit the negative effects of rate pressure and decreased shipments such that our revenue per tractor per week will be similar to 2007;
Certain cost savings initiatives we have identified are successfully executed and we do not experience upward pressure on driver compensation;
Financing under our Credit Facility, Daimler Facility, and other sources remains available under terms substantially similar to the current terms, taking into account the recent amendment to the Credit Agreement;
Average fuel prices as reported by the Department of Energy for 2009 remain below $2.40 per gallon on a full-year basis and our fuel surcharge recovery percentage does not deteriorate;
Our frequency and severity of accident and workers' compensation claims, and associated accrual amounts, remain consistent with the average level over the past three years;
The used equipment market does not continue to deteriorate below levels seen at the end of 2008; and
The legal and regulatory framework applicable to our business (including applicable tax laws and emissions regulations) remains substantially the same.

Recent Results and Year-End Financial Condition

At December 31, 2008, our total stockholders' equity was $118.8 million and our total balance sheet debt, net of cash, was $160.7 million for a total debt-to-capitalization ratio of 57.5% and a book value of $8.42 per basic and diluted share. At year end, we also had approximately $40.6 million in undrawn letters of credit posted with insurance carriers. At December 31, 2008, we had $38.9 million of available borrowing capacity under our Credit Agreement.  In March 2009, we obtained an amendment to our Credit Agreement, which retroactively to January 1, 2009 amended the fixed charge coverage covenant in exchange for increases in interest rates and fees under the Credit Agreement and the payment of fees.

For the year ended December 31, 2008, total revenue increased 8.6%, to $773.9 million from $712.5 million during 2007. Freight revenue, which excludes revenue from fuel surcharges, increased 2.2%,decreased to $520.5 million for 2009, a 15.5% decrease from $615.8 million in 2008 from $602.62008.  Lower fuel prices resulted in fuel surcharge revenues of $68.2 million in 2007. Including impairment charges discussed below, we experienced a net lossduring 2009, compared with $158.1 million for 2008.  The decreased level of $53.4 million, or ($3.80) per basic and diluted share, for 2008 compared to a net loss of $16.7 million, or ($1.19) per basic and diluted share, for 2007. On a non-GAAP basis, without the impairment charges discussed below, our net loss would have been $19.0 million, or ($1.36) per basic and diluted share for 2008, compared to a net loss of $15.7 million, or ($1.12) per basic and diluted share for 2007.   Our 2008 loss includes impairment charges that did not affect our liquidity or cash flow for the year.  These impairment charges are described in more detail below "Additional Information Concerning Impairment Charges," but included a $24.7 million non-cash charge to write off the goodwill associated with the acquisition of Star Transportation in 2006, and a $9.7 million, after-tax write-down of revenue equipment carrying values for tractors currently held for sale expected to be traded or sold in 2009 and our in-use tractors expected to be traded or sold in 2009 and 2010. There was no tax benefit associated with the nondeductible goodwill impairment charge.


The following tables reconcile our financial results for the years ended December 31, 2008 and December 31, 2007, as reported and, on a non-GAAP basis, excluding the impairment charges:

Items Affecting Net Loss Comparability: Fiscal Year 
(Dollars in Thousands) 2008  2007 
Reported Net Loss $(53,391) $(16,726)
Impairment charge on goodwill
 $24,671   -- 
Impairment charge on assets
 $9,698  $1,024 
Non-GAAP Basis Net Loss, Excluding Impairment Charges $(19,022) $(15,702)

Items Affecting Loss Per Share Comparability: Fiscal Year 
  2008  2007 
Reported Loss Per Share $(3.80) $(1.19)
Impairment charge on goodwill
 $1.75   -- 
Impairment charge on assets
 $0.69  $0.07 
Non-GAAP Basis Loss Per Share, Excluding Impairment Charges $(1.36) $(1.12)

These impairment charges are discussed in more detail below in "Additional Information Concerning Impairment Charges."  We are presenting the non-GAAP financial measures because we believe they better reflect our fundamental business performance. The non-GAAP financial measures exclude items that we believe to be unusual and that affect the comparability of our results from prior periods.

For the year ended December 31, 2008, our average freight revenue per tractor per week, our main measure of asset productivity, increased 0.6%, to $3,105 compared to $3,088 for the year ended December 31, 2007. The increase was primarily generated by a 0.7% increase in average miles per tractor attributable to reduced fleet size, a substantial increasereduction in loads, and continued severe pressure on freight rates as a result of the percentage of our fleet operated by two-person driver teams.

Revenue

We generate substantially all of our revenue by transporting, or arranging transportation of, freight for our customers.  Generally, we are paid by the mile or by the load for our services.  The main factors that affect our revenue are the revenue per mile we receive from our customers, the percentage of miles for which we are compensated, the number of tractors operating, and the number of miles we generate with our equipment.  These factors relate to, among other things, the U.S. economy, inventory levels, the level of truck capacity in our markets, specific customer demand, competition, the percentage of team-driven tractors in our fleet, driver availability, and our average length of haul.

In our trucking operations, we also derive revenue from fuel surcharges, loading and unloading activities, equipment detention, and other accessorial services.economic recession.  We measure freight revenue before fuel surcharges, or "freight revenue," because we believemanagement believes that fuel surcharges tend to be a volatile source of revenue. We believerevenue, and the exclusionremoval of fuelsuch surcharges affords a more consistent basis for comparing the results of operations from period to period. In our brokerage operations, we derive revenue from arranging loads for other carriers.

We operateThe weak economic environment negatively impacted freight volumes and freight rates across each of the subsidiaries when comparing 2009 to 2008, as evidenced by the 6.0% decrease in average freight revenue per truck per week, our primary measure of asset productivity, and a 6.9% or $0.10 decrease in average freight revenue per total mile in our Truckload segment.  Similarly, revenue in our Brokerage segment declined year-over-year because of a 17% reduction in the rate per loaded mile, a 5% reduction in revenue per load, and the closure of a large company store in October 2008.  In anticipation of lower freight volumes, we proactively reduced our fleet size in the first half of 2009 and maintained the decreased level throughout the second half of the year, providing for a decrease in weighted average tractors driven byof 10% to 3,111 in the 2009 period, from 3,456 in the 2008 period.  With the assistance of the fleet reduction, we experienced a single driver and also tractors assigned to two-person driver teams.  Our single driver tractors generally operate0.7% increase in shorter lengths of haul, generate feweraverage miles per tractor and experience more non-revenue miles, but the lower productive miles are expected to be offset by generally higher revenue per loaded mile and the reduced employee expense of compensating only one driver. We expect operating statistics and expenses to shift with the mix of single and team operations.in 2009 versus 2008.

Expenses and ProfitabilityAdditional items of note included the following:

The main factors that impact
Operating loss of $4.7 million and an operating ratio of 100.9%, compared with an operating loss of $55.7 million and an operating ratio of 109.0% in 2008;
Operating expenses, excluding impairments of goodwill and property and equipment, in our asset-based operations declined $0.13 per mile compared with 2008;
A decrease in overall compensation while achieving our highest ratio of tractors per non-driving employee since becoming a public company in 1994;
We finished the year with the lowest number of DOT reportable accidents per million miles since we began tracking the data in 2001;
Non-cash impairment charge of $11.5 million (with no tax benefit) in 2009 relating to the loss on our investment in and note receivable from Transplace, Inc. and non-cash impairments totaling $40.5 million in 2008 related to property and equipment and goodwill; and
Net loss of $25.0 million, or ($1.77) per basic and diluted share, compared with a net loss of $53.4 million, or ($3.80) per basic and diluted share in 2008 (including the impairment charges in both periods).
For information about our profitability oncurrent trends and future outlook, readers are encouraged to review our statements contained in the expense side are the variable costs"Results of transporting freight for our customers. The variable costs include fuel expense, driver-related expenses, such as wages, benefits, training,Consolidated Operations" and recruitment, and independent contractor and third party carrier costs, which we record as purchased transportation. Expenses that have both fixed and variable components include maintenance and tire expense and our total cost"Results of insurance and claims. These expenses generally vary with the miles we travel, but also have a controllable component based on safety, fleet age, efficiency, and other factors. Our main fixed cost is the acquisition and financing of long-term assets, primarily revenue equipment and operating terminals. In addition, we have other mostly fixed costs, such as certain non-driver personnel expenses.Segment Operations" sections below.

Our main measure of profitability is operating ratio, which we define as operating expenses, net of fuel surcharge revenue, divided by total revenue, less fuel surcharge revenue.


Revenue Equipment

At December 31, 2008, we operated approximately 3,292 tractors and 8,277 trailers. Of these tractors, approximately 2,555 were owned, 646 were financed under operating leases, and 91 were provided by independent contractors, who own and drive their own tractors. Of these trailers, approximately 2,571 were owned and approximately 5,706 were financed under operating leases. We finance a portion of our tractor fleet and most of our trailer fleet with off-balance sheet operating leases. These leases generally run for a period of three years for tractors and five to seven years for trailers. During 2008, we continued to have a late model fleet with an average tractor age of 2.1 years and an average trailer age of 4.3 years.

Independent contractors (owner-operators) provide a tractor and a driver and are responsible for all operating expenses in exchange for a fixed payment per mile.  We do not have the capital outlay of purchasing the tractor.  The payments to independent contractors and the financing of equipment under operating leases are recorded in revenue equipment rentals and purchased transportation.  Expenses associated with owned equipment, such as interest and depreciation, are not incurred, and for independent contractor-tractors, driver compensation, fuel, and other expenses are not incurred.  Because obtaining equipment from independent contractors and under operating leases effectively shifts financing expenses from interest to "above the line" operating expenses, we evaluate our efficiency using net margin as well as operating ratio.

Additional Information Concerning Impairment Charges

Pursuant to Financial Accounting Standards Board ("FASB") Statement of Financial Accounting Standard No. 142, Goodwill and Other Intangible Assets, we conducted goodwill impairment testing in light of the current diminished market conditions and declining market outlook for our Star Transportation operating subsidiary, which was acquired in September of 2006. Because we identified a potential impairment, we engaged an independent third party to assist us in the completion of valuations used in the impairment testing process.  The completion of this work concluded that the goodwill previously recorded for the Star acquisition was fully impaired and resulted in a $24.7 million, or $1.75 per basic and diluted share, non-cash goodwill impairment charge. There was no tax benefit associated with this nondeductible charge.

Pursuant to FASB Statement of Financial Accounting Standard No. 144, Accounting for the Impairment or Disposal of Long−Lived Assets, we performed an impairment analysis of the carrying value of our tractors and trailers.  We recently undertook the analysis after lowering our 2009 revenue and tractor disposal proceeds expectations in response to a combination of sharply lower economic indicators, a worsening credit market, and significantly lower prices received for disposals of our own used revenue equipment, all of which deteriorated substantially during the fourth quarter of 2008.  Based on these factors and the expected remaining useful lives of the tractors, we recorded a $6.4 million asset impairment charge ($1.2 million was recorded in the third quarter and $5.2 million was recorded in the fourth quarter) to write down the carrying values of tractors and trailers held for sale andexpected to be traded or sold in 2009.  Although we do not expect to be required to make any current or future cash expenditures as a result of this impairment charge, cash proceeds of future disposals of revenue equipment are anticipated to be lower than expected prior to this impairment charge.

In accordance with the impairment guidance of FAS 144, most of the tractors held and used which are scheduled to be disposed of in 2009 and 2010 were written down to their fair value as of December 31, 2008.  Actual disposition values may be greater or less than expected because of the length of time before disposition and the relatively small amount of market data concerning fair market values of tractors of these model years and mileage.  Also, a portion of these tractors are covered by tradeback agreements with the manufacturer, but the exact number cannot be ascertained because the tradebacks are based on a percentage of the number of new tractors actually purchased.  The carrying values for revenue equipment scheduled for trade in 2011 and beyond were not adjusted because those tractors and trailers were not required to be impaired based on recoverability testing using the expected future cash flows and disposition values of such equipment.

In addition, our 2007 asset impairment charge was related to our decision to sell our corporate aircraft to reduce ongoing operating costs. We recorded an impairment charge of $1.7 million, reflecting the unfavorable fair market value of the airplane as compared to the combination of the estimated payoff of the long-term operating lease and current book value of related airplane leasehold improvements.


RESULTS OF CONSOLIDATED OPERATIONS

For comparison purposes in the table below, we use freight revenue, or total revenue less fuel surcharges, in addition to total revenue when discussing changes as a percentage of revenue.  We believe excluding this sometimes volatile source of revenue affords a more consistent basis for comparing our results of operations from period to period.  Freight revenue excludes $68.2 million, $158.1 million, $109.9 million, and $111.6$109.9 million of fuel surcharges in 2009, 2008, 2007, and 2006,2007, respectively.

The following table sets forth the percentage relationship of certain items to total revenue and freight revenue:

  2009 2008 2007   2009 2008 2007
               
Total revenue 100.0% 100.0% 100.0% 
Freight revenue (1)
 100.0% 100.0% 100.0%
Operating expenses:       Operating expenses:      
Salaries, wages, and related expenses
 36.7 34.1 38.0 
Salaries, wages, and related expenses
 41.5 42.8 44.9
Fuel expense
 24.4 33.7 29.6 
Fuel expense (1)
 14.6 16.7 16.8
Operations and maintenance
 6.0 5.5 5.7 
Operations and maintenance
 6.8 6.9 6.7
Revenue equipment rentals
       and purchased transportation
 13.0 11.8 9.3 
Revenue equipment rentals
       and purchased transportation
 14.7 14.8 11.0
Operating taxes and licenses
 2.1 1.7 2.0 
Operating taxes and licenses
 2.3 2.1 2.3
Insurance and claims
 5.4 4.9 5.1 
Insurance and claims
 6.1 6.1 6.0
Communications and utilities
 1.0 0.9 1.0 
Communications and utilities
 1.1 1.1 1.2
General supplies and expenses
 4.0 3.2 3.3 
General supplies and expenses
 4.5 4.3 3.9
Depreciation and amortization,
including net gains on
disposition of equipment (2)
 8.2 8.2 7.5 
Depreciation and amortization,
including net gains on
disposition of equipment (2)
 9.3 10.3 8.9
Goodwill impairment (3)
 0.0 3.2 0.0 
Goodwill impairment (3)
 0.0 4.0 0.0
Total operating expenses 100.8 107.2 101.5 Total operating expenses 100.9 109.1 101.8
Operating loss (0.8) (7.2) (1.5) Operating loss (0.9) (9.1) (1.8)
Other expense, net (4) 4.3 1.4 1.6 Other expense, net (4) 4.9 1.7 1.9
Loss before income taxes (5.1) (8.6) (3.1) Loss before income taxes (5.8) (10.8) (3.7)
Income tax benefit (0.9) (1.7) (0.8) Income tax benefit (1.0) (2.1) (0.9)
Net loss (4.2)% (6.9)% (2.3)% Net loss (4.8)% (8.7)% (2.8)%
               
  2008 2007 2006   2008 2007 2006
               
Total revenue 100.0% 100.0% 100.0% 
Freight revenue (1)
 100.0% 100.0% 100.0%
Operating expenses:       Operating expenses:      
Salaries, wages, and related expenses
 34.1 38.0 38.4 
Salaries, wages, and related expenses
 42.8 44.9 45.8
Fuel expense
 33.7 29.6 28.4 
Fuel expense (1)
 16.7 16.8 14.5
Operations and maintenance
 5.5 5.7 5.3 
Operations and maintenance
 6.9 6.7 6.3
Revenue equipment rentals
and purchased transportation
 11.8 9.3 9.3 
Revenue equipment rentals
and purchased transportation
 14.8 11.0 11.1
Operating taxes and licenses
 1.7 2.0 2.1 
Operating taxes and licenses
 2.1 2.3 2.5
Insurance and claims
 4.9 5.1 5.0 
Insurance and claims
 6.1 6.0 6.0
Communications and utilities
 0.9 1.0 1.0 
Communications and utilities
 1.1 1.2 1.2
General supplies and expenses
 3.2 3.3 3.1 
General supplies and expenses
 4.3 3.9 3.7
Depreciation and amortization,
including net gains on
disposition of equipment (2)
 8.2 7.5 6.0 
Depreciation and amortization,
including net gains on
disposition of equipment (2)
 10.3 8.9 7.2
  Goodwill impairment (3) 3.2 0.0 0.0   Goodwill impairment (3) 4.0 0.0 0.0
Total operating expenses 107.2 101.5 98.6 Total operating expenses 109.1 101.8 98.3
Operating income (loss) (7.2) (1.5) 1.4 Operating income (loss) (9.1) (1.8) 1.7
Other expense, net 1.4 1.6 0.9 Other expense, net 1.7 1.9 1.1
Income (loss) before income taxes (8.6) (3.1) 0.5 Income (loss) before income taxes (10.8) (3.7) 0.6
Income tax expense (benefit) (1.7) (0.8) 0.7 Income tax expense (benefit) (2.1) (0.9) 0.8
Net loss (6.9)% (2.3)% (0.2)% Net loss (8.7)% (2.8)% (0.2)%

(1)Freight revenue is total revenue less fuel surcharges.  In this table, fuel surcharges are eliminated from revenue and subtracted from fuel expense.  The amounts were $68.2 million, $158.1 million, and $109.9 million in 2009, 2008, and $111.6 million in 2008, 2007, and 2006, respectively.
(2)Includes a $9.4 million pre-tax impairment charge for held and used equipment and $6.4 million of pre-tax impairment charges for equipment held for sale in the year ended December 31, 2008, which together represent 2.0% of total revenue and 2.6% of freight revenue.  Includes a $1.7 million pre-tax impairment charge for equipment held for sale in the year ended December 31, 2007.  See the discussion abovebelow under "Additional Information Concerning ImpairmentNon-Cash Charges" for a more extensive description of these impairments.
(3)Represents a $24.7 million non-cash impairment charge to write off the goodwill associated with the acquisition of our Star Transportation subsidiary.  See the discussion abovebelow under "Additional Information Concerning ImpairmentNon-Cash Charges" for a more extensive description of this impairment.
(4)Includes an $11.5 million non-cash loss on the sale of the investment in and note receivable from Transplace in 2009.  See the discussion below under "Additional Information Concerning Non-Cash Charges" for a more extensive description of the loss.

Comparison of Year Ended December 31, 2009 to Year Ended December 31, 2008

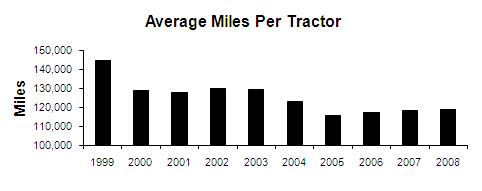
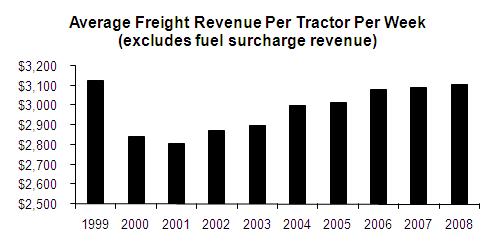
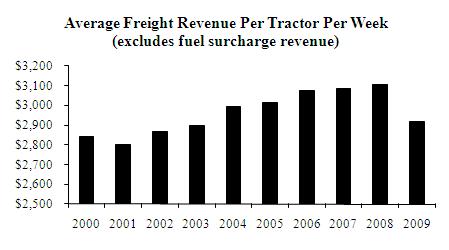
Total revenue decreased $185.2 million, or 23.9%, to $588.7 million in 2009, from $773.9 million in 2008.  Freight revenue excludes $68.2 million of fuel surcharge revenue in 2009 and $158.1 million in 2008.  Freight revenue (total revenue less fuel surcharges) decreased $95.3 million, or 15.5%, to $520.5 million in 2009, from $615.8 million in 2008.  For comparison purposes, we use freight revenue (total revenue less fuel surcharge revenue) when discussing changes as a percentage of revenue.  We believe removing this sometimes volatile source of revenue affords a more consistent basis for comparing the results of operations from period to period.  As previously discussed, the rate environment was difficult in 2009, and freight volumes were significantly lower than 2008 as a result of the overall weak economic environment.  The decreased level of freight revenue was primarily attributable to weak freight demand, excess tractor and trailer capacity in the truckload industry, and significant rate pressure from customers and freight brokers.  Through mid-year 2009, we continued to reduce the size of our tractor fleet to achieve greater utilization of the remaining tractors in our fleet and attempt to improve profitability.  With the assistance of this fleet reduction, we experienced a 0.7% increase in average miles per tractor versus the 2008 period.  Average freight revenue per tractor per week, our primary measure of asset productivity, decreased 6.0% to $2,920 in 2009, from $3,105 in 2008, while total miles were down 9.3% from 2008.  As the economy has begun to show signs of improvement in 2010, we expect customer demand to increase at a modest rate in the second half of the year.

Salaries, wages, and related expenses decreased $47.6 million, or 18.1%, to $216.2 million in 2009, from $263.8 million in 2008.  As a percentage of freight revenue, salaries, wages, and related expenses decreased to 41.5% in 2009, from 42.8% in 2008.  Driver pay decreased $33.7 million to $147.1 million in 2009, from $180.8 million in the 2008 period.  The decrease was attributable to a 38.4 million reduction in truck miles, a decrease in driver pay per mile, and an increase in participation in our driver per diem pay program.  Our payroll expense for employees, other than over-the-road drivers, decreased $6.1 million to $39.4 million from $45.4 million, due to a reduction in our non-driver work force.  Additionally, workers' compensation and group health costs were $3.1 million and $0.9 million lower, respectively, in the 2009 period than the 2008 period, primarily as a result of reduced miles and head count along with favorable development in workers' compensation claims.  If the economy continues to show signs of recovery, our ability to hold in place prior reductions in salaries and wages could be limited.  Accordingly, these expenses could increase in absolute terms (and as a percentage of revenue absent an increase in revenue to offset increased costs).

Fuel expense, net of fuel surcharge revenue of $68.2 million in 2009 and $158.1 million in 2008, decreased $26.9 million to $75.6 million in 2009, from $102.6 million in 2008.  As a percentage of freight revenue, net fuel expense declined to 14.6% in 2009 from 16.7% in 2008.  Lower average fuel prices in 2009 versus 2008, multiple operating improvements, and the continued addition of auxiliary power units and more fuel efficient engines improved fuel efficiency and contributed to these decreases.

During 2009, fuel prices were less volatile than in 2008, contributing to the decrease in net fuel expense and the related percentage of revenue.  After reaching unprecedented record fuel high fuel prices during most of 2008, diesel fuel prices started to fall in the fourth quarter of 2008 and continued through the first quarter of 2009.  Significant fluctuations in fuel prices impact recovery of surcharges because we purchase fuel daily, while the U.S. Department of Energy ("DOE") index on which the surcharges are based resets weekly.

The Company receives a fuel surcharge on its loaded miles from most shippers; however, this may not cover the entire cost of high fuel prices for several reasons, including the following: surcharges cover only loaded miles, surcharges do not cover miles driven out-of-route by our drivers, and surcharges typically do not cover refrigeration unit fuel usage or fuel burned by tractors while idling.  Additionally, fuel surcharges vary in the percentage of reimbursement offered, and not all surcharges fully compensate for fuel price increases even on loaded miles.  The rate of fuel price increases and decreases also can have an impact.  Most fuel surcharges are based on the average fuel price as published by the DOE for the week prior to the shipment.  In times of decreasing fuel prices, the lag time causes under-recovery.  Accordingly, volatility in fuel prices could cause volatility in our results of operations.

Operations and maintenance, consisting primarily of vehicle maintenance, repairs, and driver recruitment expenses, decreased $7.1 million to $35.4 million in 2009, from $42.5 million in 2008.  As a percentage of freight revenue, operations and maintenance decreased to 6.8% in 2009, from 6.9% in 2008.  The decrease resulted from decreased tractor and trailer maintenance costs, as a result of fewer tractors and less miles.  Additionally, tire expense decreased due to a somewhat newer average fleet age.  Finally, expenses related to tolls and unloading were less in the 2009 period than the 2008 period, due to the reduction in miles, and driver recruitment expenses were less as a result of the decreased demand for drivers.  As a percentage of freight revenue, operations and maintenance remained relatively constant, as this mostly variable cost tracked our decrease in revenue, and the modest benefit from a somewhat younger tractor fleet was offset by an older trailer fleet and fixed costs.  With the adverse economic environment in 2009, we had less difficulty recruiting and retaining drivers.  If the economy improves, we could face more difficulty recruiting and retaining drivers, which could impact this expense category going forward.  Further, the new Comprehensive Safety Analysis initiative could limit the pool of available drivers and increase these costs.

Revenue equipment rentals and purchased transportation decreased $14.5 million, or 15.9%, to $76.5 million in 2009, from $91.0 million in 2008.  The decrease was a result of payments to third-party transportation providers associated with our Solutions subsidiary, which decreased to $40.0 million in 2009, from $45.3 million in 2008, primarily due to decreased loads and lower fuel costs passed on to those providers.  In addition, we had a $3.8 million reduction in payments to independent contractors, which decreased to $10.3 million in 2009, from $14.1 million in 2008, mainly due to a decrease in the size of the independent contractor fleet and the reduction in fuel surcharges passed through that are a component of the related expense.  Additionally, tractor and trailer equipment rental and other related expenses decreased to $25.9 million in 2009, compared with $31.2 million in 2008.  We had financed approximately 236 tractors and 5,987 trailers under operating leases at December 31, 2009, compared with 646 tractors and 5,706 trailers under operating leases at December 31, 2008.  As a percentage of freight revenue, revenue equipment rentals and purchased transportation expense remained relatively constant at 14.7% in 2009, and 14.8% in 2008.  This expense category will fluctuate with the number of loads hauled by independent contractors and handled by Solutions and the percentage of our fleet financed with operating leases, as well as the amount of fuel surcharge revenue passed through to the independent contractors and third-party carriers.  Because we anticipate adding new equipment over the next twelve months through on-balance sheet financing, the percentage of our tractor fleet financed with operating leases is expected to decrease in the near term.  If the economy continues to improve, we may need to increase the amounts we pay to independent contractors and third-party transportation providers, which could increase this expense category absent an offsetting increase in revenue.

Operating taxes and licenses decreased $1.0 million, or 7.4%, to $12.1 million in 2009, from $13.1 million in 2008.  As a percentage of freight revenue, operating taxes and licenses increased slightly to 2.3% in the 2009 period, from 2.1% in the 2008 period.  This increase as a percentage of freight revenue resulted from increased costs per tractor as various taxing authorities increased their rates, as well as lower revenue per tractor, which less effectively covered this fixed cost.

Insurance and claims, consisting primarily of premiums and deductible amounts for liability, physical damage, and cargo damage insurance and claims, decreased $5.6 million, or 15.0%, to approximately $32.0 million in 2009, from approximately $37.6 million in 2008.  The costs on a per mile basis were approximately half a cent per mile lower when comparing 2009 to 2008 because of a lower accident rate and slightly higher miles per tractor.  The Company's overall safety performance has improved as our DOT reportable accidents dropped to the lowest level per million miles since 2001, giving us the best overall safety performance in at least nine years (based on DOT reportable accidents per million miles).  As a percentage of freight revenue, insurance and claims remained constant at 6.1% in 2009 and 2008 because the decline in average freight revenue per mile offset the improvements in cost per mile.  With our significant self-insured retention, insurance and claims expense may fluctuate significantly from period to period, and any increase in frequency or severity of claims could adversely affect our financial condition and results of operations.

Communications and utilities decreased to $5.7 million in 2009, from $6.7 million in 2008.  As a percentage of freight revenue, communications and utilities remained constant at 1.1% in 2009 and 2008.

General supplies and expenses, consisting primarily of headquarters and other terminal facilities expenses, decreased $2.8 million to $23.6 million in 2009, from $26.4 million in 2008.  As a percentage of freight revenue, general supplies and expenses increased slightly to 4.5% in 2009, from 4.3% in 2008.  The increase as a percentage of revenue was primarily due to certain of these costs being fixed in nature, which were less efficiently spread over a reduced revenue base when comparing the 2009 period to the 2008 period.

Depreciation and amortization, consisting primarily of depreciation of revenue equipment, decreased $15.1 million or 23.9%, to $48.1 million in 2009, from $63.2 million in 2008.  As a percentage of freight revenue, depreciation and amortization decreased to 9.3% in 2009, from 10.3% in 2008.  The decreases were related to a $15.8 million revenue equipment impairment charge that was recorded in 2008 with no similar charge in 2009.  See "Additional Information Concerning Non-Cash Charges" below for a further description of impairment charges affecting our operating results.  Additionally, included in depreciation and amortization was $1.9 million of losses on the sale of property and equipment in 2008, with only $0.1 million of losses in 2009.  Excluding the impairment charge and the losses on sale of equipment, depreciation and amortization increased $2.5 million in 2009 compared to 2008 as a result of having more owned tractors on our balance sheet as opposed to leased, as we owned 2,784 and 2,555 tractors at December 31, 2009 and 2008, respectively.  Excluding the impairment charge and the losses on sale of equipment, as a percentage of revenue, depreciation and amortization increased to 9.2% in 2009, from 7.5% in 2008, as a result of lower revenue per tractor, which less effectively covered this fixed cost.  We anticipate purchasing additional equipment through on-balance sheet financing over the next twelve months, which will likely cause an increase in depreciation and amortization in the near term.

Goodwill impairment in 2008 related to the $24.7 million write-off of all goodwill associated with our 2006 acquisition of Star Transportation, while there was no similar charge in 2009.  This amount was non-cash and non-deductible for tax purposes.  See "Additional Information Concerning Non-Cash Charges" below for a further description of impairment charges affecting our operating results.

The other expense category includes interest expense, interest income, and other miscellaneous non-operating items.  Other expense, net, increased $14.8 million, to $25.3 million in the 2009 period, from $10.5 million in the 2008 period.  The increase is primarily attributable to the loss on the sale of the investment in and note receivable from Transplace, which provided for $11.5 million of the increase.  The remainder of the increase is a result of higher interest costs in the 2009 period, compared to the 2008 period, resulting from a period-over-period increase in debt and the increase in our average interest rate on our Credit Facility, as amended, compared to the average interest rates in the 2008 period.

Our income tax benefit was $5.0 million in 2009 compared to $12.8 million in 2008.  The effective tax rate is different from the expected combined tax rate as a result of permanent differences primarily related to a per diem pay structure implemented in 2001.  Due to the partial nondeductible effect of the per diem payments, our tax rate will fluctuate in future periods as income fluctuates.  Additionally, the loss on the sale of the investment in Transplace and goodwill impairment in 2009 and 2008, respectively, were not deductible.

Primarily as a result of the factors described above, net loss was approximately $25.0 million in 2009, compared with a net loss of $53.4 million in 2008.  As a result of the foregoing, our net loss as a percentage of freight revenue improved to (4.8%) in 2009, from (8.7%) in 2008.

Comparison of Year Ended December 31, 2008 to Year Ended December 31, 2007

Total revenue increased $61.4 million, or 8.6%, to $773.9 million in 2008, from $712.5 million in 2007.  Freight revenue excludes $158.1 million of fuel surcharge revenue in 2008 and $109.9 million in 2007.  Freight revenue (total revenue less fuel surcharges) increased $13.2 million, or 2.2%, to $615.8 million in 2008, from $602.6 million in 2007. For comparison purposes, we use freight revenue (total revenue less fuel surcharge revenue) when discussing changes as a percentage of revenue.  We believe removing this sometimes volatile source of revenue affords a more consistent basis for comparing the results of operations from period to period.

Average freight revenue per tractor per week our primary measure of asset productivity, increased 0.6% to $3,105 in 2008, from $3,088 in 2007.  The increase was primarily generated by a 0.7% increase in average miles per tractor.  The average miles per tractor increase was attributable to a 7 percentage point increase in the percentage of our fleet operated by driver teams (which usually generate higher miles than a solo-driver truck).  The increase in teams offset aoffsets deterioration in miles per truck in our solo fleets. We continued to constrain the size of our tractor fleet to achieve greater fleet utilization and attempt to improve profitability.  Weighted average tractors decreased 4.6% to 3,456 in 2008, from 3,623 in 2007.

Our Solutions revenue increased approximately 176% to $54.7 million in 2008 from $19.8 million in 2007, primarily due to an increase in fuel surcharge collection, much of which is passed on to the third party carriers, and an increase in brokerage loads to 27,117 in 2008 from 10,743 loads in 2007.  As a result, average revenue per load increased approximately 9.4% to $2,017 in 2008 from $1,843 per load in 2007.


Salaries, wages, and related expenses decreased $6.6 million, or 2.5%, to $263.8 million in 2008, from $270.4 million in 2007.  As a percentage of freight revenue, salaries, wages, and related expenses decreased to 42.8% in 2008 from 44.9% in 2007.  Driver pay decreased $7.7 million to $180.8 million in 2008, from $188.5 million in the 2007 period.  The decrease was attributable to lower driver wages as more drivers have opted onto our driver per diem pay program.  Our payroll expense for employees, other than over-the-road drivers, decreased $1.8 million to $45.4 million from $47.2 million, due to a reduction in non-driver work force comparable to the percentage reduction in tractor fleet.  These reductions were partially offset by an increase in workers' compensation expense related to unfavorable development of some outstanding claims during 2008, as well as increases in our group health expenses and additional office salary expense related to severance payments.

Fuel expense, net of fuel surcharge revenue of $158.1 million in 2008 and $109.9 million in 2007, increased $1.5 million to $102.6 million in 2008, from $101.1 million in 2007.  As a percentage of freight revenue, net fuel expense was essentially constant at 16.7% in 2008 and 16.8% in 2007.  Net fuel expense was highly volatile during the year,2008, however, amounting to 19.0% of freight revenue during the second quarter and dropping to 11.5% of freight revenue in the fourth quarter.  Fuel surcharges amounted to $0.384 per total mile in 2008, compared to $0.257 per total mile in 2007.  We received a fuel surcharge on our loaded miles from most shippers.  However, this does not cover the entire cost of high fuel prices for several reasons, including the following:  surcharges cover only loaded miles, not the approximately 11% of non-revenue miles we operated in 2008; surcharges do not cover miles driven out-of-route by our drivers; and surcharges typically do not cover refrigeration unit fuel usage or fuel burned by tractors while idling.  In addition, fuel surcharges vary in the percentage of reimbursement offered, and not all surcharges fully compensate for fuel price increases even on loaded miles.

The rate of fuel price increases also can have an impact.  Most fuel surcharges are based on the average fuel price as published by the DOE for the week prior to the shipment.  In times of decreasing fuel prices, the lag time causes additional recovery.  Lag time was a factor to additional recovery during the second half of 2008, as fuel prices decreased rapidly during the period.

We have established several initiatives to combat the cost of fuel.  We have invested in auxiliary power units for a percentage of its fleet and is evaluating the payback on additional units where idle time is already lower. We have also reduced the maximum speed of many of our trucks, implemented strict idling guidelines for our drivers, encouraged the use of shore power units in truck stops, and imposed standards for accepting broker freight that include a minimum combined rate and assumed fuel surcharge component.  This combination of initiatives contributed to a significant improvement in fleetwide average fuel mileage.  We will continue to review shipper's overall freight rate and fuel surcharge program.  Fuel costs may continue to be affected in the future by price fluctuations, volume purchase commitments, the terms and collectibility of fuel surcharges, the percentage of miles driven by independent contractors, and lower fuel mileage due to government mandated emissions standards that have resulted in less fuel efficient engines. At December 31, 2008, we had no derivative financial instruments to reduce our exposure to fuel price fluctuations.

Operations and maintenance, consisting primarily of vehicle maintenance, repairs, and driver recruitment expenses, increased $2.0 million to $42.5 million in 2008, from $40.4 million in 2007.  The increase resulted from increased tractor and trailer maintenance costs, as well as increased tire expense associated with a somewhat older average fleet age and the associated tire replacement cycle.  As a percentage of freight revenue, operations and maintenance increased to 6.9% in 2008, from 6.7% in 2007.

Revenue equipment rentals and purchased transportation increased $24.5 million, or 36.8%, to $91.0 million in 2008, from $66.5 million in 2007.  As a percentage of freight revenue, revenue equipment rentals and purchased transportation expense increased to 14.8% in 2008, from 11.0% in 2007.  These increases were primarily driven by increased payments to third-party transportation providers associated with Solutions, our brokerage subsidiary, which increased to $45.7 million in 2008 from $16.3 million in 2007.  This was offset by a $3.7 million reduction in payments to independent contractors, which decreased to $14.1 million in 2008, from $17.8 million in 2007, mainly due to a decrease in the independent contractor fleet and a decrease in tractor and trailer equipment rental and other related expenses to $31.2 million in 2008 compared with $32.5 million in 2007.  We had financed approximately 646 tractors and 5,706 trailers under operating leases at December 31, 2008, compared with 693 tractors and 6,322 trailers under operating leases at December 31, 2007. This expense category will fluctuate with the number of loads hauled by independent contractors and handled by Solutions and the percentage of our fleet financed with operating leases, as well as the amount of fuel surcharge revenue passed through to the independent contractors and third-party carriers.


Operating taxes and licenses decreased $1.0 million, or 7.3%, to $13.1 million in 2008 from $14.1 million in 2007.  As a percentage of freight revenue, operating taxes and licenses remained essentially constant at 2.1% in 2008 and 2.3% in 2007.

Insurance and claims consisting primarily of premiums and deductible amounts for liability, physical damage, and cargo damage insurance and claims, increased $1.2 million, or 3.3%, to approximately $37.6 million in 2008, from approximately $36.4 million in 2007.  As a percentage of freight revenue, insurance and claims remained essentially constant at 6.1% in 2008 and 6.0% in 2007.

The Company's overall safety performance has improved as our DOT reportable accidents dropped to the lowest level per million miles since 2000, giving us the best overall safety performance in at least eight years (based on DOT reportable accidents per million miles).  During 2008, there werewas a small number of severe accidents late in the year that resulted in a negative impact of approximately $5.4 million.  During 2007, there were unfavorable developments on two prior-period claims that increased our accrual for casualty claims in 2007 by $5.2 million.  The 2007 increase was partially offset by the receipt of a $1.0 million refund from our insurance carrier related to achieving certain monetary claim targets for our casualty policy in the 2007 policy year.  The insurance refund in 2008 was approximately $0.4 million.  With our significant self-insured retention, insurance and claims expense may fluctuate significantly from period to period, and any increase in frequency or severity of claims could adversely affect our financial condition and results of operations.

Communications and utilities decreased to $6.7 million in 2008, from $7.4 million in 2007.  As a percentage of freight revenue, communications and utilities remained essentially constant at 1.1% in 2008 and 1.2% in 2007.

General supplies and expenses, consisting primarily of headquarters and other terminal facilities expenses increased $3.0 million to $26.4 million in 2008, from $23.3 million in 2007.  As a percentage of freight revenue, general supplies and expenses increased to 4.3% in 2008, from 3.9% in 2007.  The increase was primarily due to increased sales agent commissions from our growing brokerage subsidiary, which increased $2.5 million to $3.8 million in 2008, compared to $1.3 million in 2007.

Depreciation and amortization, consisting primarily of depreciation of revenue equipment increased $9.7 million or 18.1%, to $63.2 million in 2008, from $53.5 million in 2007.  As a percentage of freight revenue, depreciation and amortization increased to 10.3% in 2008, from 8.9% in 2007.  The increase was related to a $15.8 million revenue equipment impairment charge that was recorded in 2008, as compared to a $1.7 million impairment charge recorded in 2007.  Excluding the impairment charges, depreciation and amortization decreased $4.4 million in 2008 and, as a percentage of freight revenue, decreased to 7.7% in 2008, from 8.6% in 2007.  These decreases were primarily the result of our efforts to eliminate excess equipment and terminals over the past year.  We haveduring 2008, and we reduced theour fleet by approximately 263 tractors and 390 trailers.  Depreciation and amortization expense includes any gain or loss on the disposal of equipment, which was an approximately $1.9 million loss in 2008 and a $1.7 million loss in 2007.  Please seeSee "Additional Information Concerning ImpairmentNon-Cash Charges" abovebelow for a further description of impairment charges affecting our operating results.

Goodwill impairment in 2008 related to the $24.7 million write-off of all goodwill associated with our 2006 acquisition of Star Transportation.  This amount is non-cash and non-deductible.  Please seeSee "Additional Information Concerning ImpairmentNon-Cash Charges" abovebelow for a further description of impairment charges affecting our operating results.

Our income tax benefit was $12.8 million in 2008 compared to $5.6 million in 2007.  The effective tax rate is different from the expected combined tax rate as a result of permanent differences primarily related to a per diem pay structure implemented in 2001.  Due to the nondeductible effect of per diem, our tax rate will fluctuate in future periods as income fluctuates. In addition, weWe reversed a contingent tax accrual during 2007, based on the recommendation by an IRS appeals officer that the IRS concede a case in our favor.  This concession resulted in recognition of approximately $0.4 million of income tax benefit for 2007.

Primarily as a result of the factors described above, net income decreased approximately $36.7 million to a net loss of $53.4 million in 2008, from a net loss of $16.7 million in 2007.  As a result of the foregoing, our net loss as a percentage of freight revenue declined to (8.7%) in 2008, from (2.8%) in 2007.


Comparison of Year Ended December 31, 2007 to Year Ended December 31, 2006SEGMENT OPERATIONS

Total revenue increased $28.7 million, or 4.2%We operate two reportable business segments.  Our Asset-Based Truckload Services ("Truckload") segment consists of Covenant Transport, Inc., SRT, and Star Transportation.  Our Brokerage Services segment consists of Covenant Transport Solutions, Inc. ("Solutions").  The operation of each of these businesses is described in our notes to $712.5 million in 2007, from $683.8 million in 2006. Freight revenue excludes $109.9 millionthe "Business Section."  Unallocated corporate overhead includes costs that are incidental to our activities and are not specifically allocated to one of fuel surcharge revenue in 2007the segments.  The following tables summarize financial and $111.6 million in 2006.operating data by segment:

On September 14, 2006, we acquired 100% of the outstanding stock of Star, a short-to-medium haul dry van regional truckload carrier based in Nashville, Tennessee. The acquisition included 614 tractors and 1,719 trailers. Star's operating results have been accounted for in the Company's results of operations since the acquisition date. Star's total revenue for the year ended December 31, 2007 totaled approximately $96.2 million, which is included in our consolidated statements of operations for the year ended December 31, 2007. Star's cost structure is similar to that of our additional operating subsidiaries, and therefore has a minimal impact on expenses as a percentage of freight revenue.
  
Twelve months ended
December 31,
 
(in thousands) 2009  2008  2007 
Revenues:         
          
Asset-Based Truckload Services $541,325  $719,220  $692,722 
Brokerage Services  47,362   54,694   19,804 
             
Total $588,687  $773,914  $712,526 
Operating Income (Loss):            
             
Asset-Based Truckload Services $10,552  $(37,091) $(7,011)
Brokerage Services  155   466   1,031 
Unallocated Corporate Overhead  (15,429)  (19,054)  (4,701)
             
Total $(4,722) $(55,679) $(10,681)

Freight revenue (total revenue less fuel surcharges) increased $30.4 million, or 5.3%, to $602.6 million in 2007, from $572.2 million in 2006. Average freight revenue per tractor per week, our primary measure of asset productivity, increased 0.4% to $3,088 in 2007 from $3,077 in 2006. The increase was primarily generated by a 0.5% increase in average miles per tractor and a 1.1% increase in our average freight revenue per loaded mile. Excluding the acquisition of Star, we continued to constrain the size of our tractor fleet to achieve greater fleet utilization and improved profitability.  In general, the changes in freight mix as a result of the realignment expanded the portions of our business with longer lengths of haul, more miles per tractor, and generally lower rate structures, while reducing the regional service offering, which had the highest rate structure but significantly lower miles per tractor. The lackluster freight environment continued to impact every subsidiary and service offering.

Salaries, wages, and related expenses increased $8.1 million, or 3.1%, to $270.4 million in 2007, from $262.3 million in 2006. As a percentage of freight revenue, salaries, wages, and related expenses decreased to 44.9% in 2007 from 45.8% in 2006. Driver pay increased $7.5 million to $188.5 million in 2007, from $181.0 million in the 2006 period, as improved driver retention resulted in higher wages for more experienced drivers. This resulted in increased driver pay on a cost per mile basis of 1.0% in the 2007 period over the 2006 period.  Our employee benefits, decreased $1.9 million to $34.7 million in 2007 from $36.6 million in 2006, attributable to favorable health insurance expense of $1.3 million and reduced workers' compensation exposure resulting in a $1.3 million reduction in related expense, offset by increased payroll taxes of $0.8 million related to increased salaries and wages. These benefit expenses decreased to 5.8% of freight revenue in 2007 from 6.4% of freight revenue in 2006.

Fuel expense, net of fuel surcharge revenue of $109.9 million in 2007 and $111.6 million in 2006, increased $18.4 million to $101.1 million in 2007 from $82.8 million in 2006. As a percentage of freight revenue, net fuel expense increased to 16.8% in 2007 from 14.5% in 2006. Fuel surcharges amounted to $0.257 per total mile in 2007 compared to $0.266 per total mile in 2006. In 2007, we had a lower surcharge collection rate due primarily to three factors: 1) the increase in freight obtained through brokers, 2) less compensatory fuel surcharge programs, and 3) an increase in the percentage of non-revenue miles, due to the decrease in freight demand. Our total miles increased approximately 2.7% while our fuel surcharge revenue decreased 1.5%. The resulting net effect was that our fuel expense, net of surcharge, increased approximately $.038 per total mile. Fuel costs may be affected in the future by price fluctuations, volume purchase commitments, the terms and collectibility of fuel surcharges, the percentage of miles driven by independent contractors, and lower fuel mileage due to government mandated emissions standards that have resulted in less fuel efficient engines. At December 31, 2007, we had no derivative financial instruments to reduce our exposure to fuel price fluctuations.

Operations and maintenance, consisting primarily of vehicle maintenance, repairs, and driver recruitment expenses, increased $4.3 million to $40.4 million in 2007 from $36.1 million in 2006. As a percentage of freight revenue, operations and maintenance increased slightly to 6.7% in 2007 from 6.3% in 2006.  The increase resulted in part from higher unloading costs, tractor and trailer maintenance costs, and tire expense, but was offset by reduced driver recruiting expense and tolls.

Revenue equipment rentals and purchased transportation increased $3.0 million, or 4.7%, to $66.5 million in 2007, from $63.5 million in 2006.  As a percentage of freight revenue, revenue equipment rentals and purchased transportation expense remained essentially flat at 11.0% in 2007 and 11.1% in 2006. Payments to third-party transportation providers primarily from Solutions, our brokerage subsidiary, were $16.3 million in 2007, compared to $3.4 million in 2006. Tractor and trailer equipment rental and other related expenses decreased $8.5 million, to $32.5 million in 2007 compared with $41.0 million in 2006. We had financed approximately 693 tractors and 6,322 trailers under operating leases at December 31, 2007, compared with 1,116 tractors and 7,575 trailers under operating leases at December 31, 2006. Payments to independent contractors decreased $1.3 million to $17.8 million in 2007 from $19.1 million in 2006, mainly due to a decrease in the independent contractor fleet.


Operating taxes and licenses decreased $0.4 million, or 2.8%,
Comparison of Year Ended December 31, 2009 to $14.1 million in 2007 from $14.5 million in 2006. As a percentage of freight revenue, operating taxes and licenses remained essentially constant at 2.3% in 2007 and 2.5% in 2006.Year Ended December 31, 2008

Insurance and claims, consisting primarily of premiums and deductible amounts for liability, physical damage, and cargo damage insurance and claims, increased $2.3 million, or 6.7%Our asset-based truckload services segment revenue decreased 24.7%, to approximately $36.4$541.3 million for the twelve-month period ended December 31, 2009, compared to $719.2 million for the comparable period in 2008.  Lower fuel prices resulted in fuel surcharge revenue of $68.2 million in 2007 from approximately $34.1the twelve months ended December 31, 2009, versus $158.1 million in 2006.the 2008 period.  The increase was thedecrease in freight revenue is related to a decrease in rates and miles as a result of unfavorable developments on two separate claims occurringthe weakened economy in 20042009.  In 2009, management decreased the fleet size approximately 10% in response to weak demand.  Excluding unallocated corporate overhead, the segment generated an operating income of $10.6 million for the twelve months ended December 31, 2009, compared to an operating loss of $37.1 million for the same 2008 period, primarily due to certain non-cash charges in 2008 totaling $40.5 million related to the impairment of certain property and 2005,equipment and Star's goodwill, both of which were ultimately settled duringare discussed in more detail below.  Excluding these charges in 2008, the second quarterTruckload segment generated operating income of 2007, increasing our accrual for casualty claims by $5.2 million. Our frequency and severity$3.4 million, representing an increase in operating income in 2009 from 2008, with the exclusion of accidents during 2007 has improved versus 2006, andthe impairments, as a percentageresult of freight revenue, insurancelower net fuel expenses and claims remained essentially constant at 6.0% in 2007 and 2006.cost savings initiatives.

In general,Our brokerage segment revenue decreased 13.4% to $47.3 million for casualty claims, we have insurance coverage upthe twelve months ended December 31, 2009, compared to $50.0$54.7 million per claim. In 2006for the same period in the prior year.  The decreases were primarily attributable to a reduction in the portion of revenue attributable to fuel surcharges given fuel was at historic highs throughout much of 2008 and through February 28, 2007, we were self-insuredless volume due to the closure of a large company store in October 2008.  Excluding unallocated corporate overhead, operating income for personal injury and property damage claimsour brokerage segment was $0.2 million for amounts up to $2.0 million per occurrence, subjectthe twelve-month period ended December 31, 2009, compared to an additional $2.0operating income of $0.5 million self-insured aggregate amount, whichfor the comparable 2008 period.  The decreases are a result of an increase in bad debt expense of $0.3 million from the comparable 2008 period due to several large bankruptcies, an increase in purchased transportation expense per revenue dollar, and an increase in depreciation expense of approximately $0.3 million related to accelerating the depreciation of certain software that will be abandoned in 2010.  These increases were partially off-set by various reductions in selling, general, and administrative expenses as a result of cost savings initiatives.

Comparison of Year Ended December 31, 2008 to Year Ended December 31, 2007

Our asset-based truckload services segment revenue increased 3.9%, to $719.2 million for the twelve-month period ended December 31, 2008, compared to $692.3 million for the comparable period in 2007.  Higher fuel prices resulted in fuel surcharge revenue of $158.1 million in the twelve months ended December 31, 2008, versus $109.9 million in the 2007 period.  The decrease in freight revenue is related to a decrease in rates, total self-insured retentionmiles, and fleet size, specifically in the third and fourth quarters, related to the onset of upthe recession in 2008.  Excluding unallocated corporate overhead, an operating loss of $37.1 million for the twelve months ended December 31, 2008 compared to $4.0operating loss of $7.0 million untilfor the $2.0same 2007 period.  The fluctuations are primarily due to certain non-cash charges in 2008 totaling $40.5 million aggregate threshold was reached. We renewed our casualty program asrelated to the impairment of February 28,certain property and equipment and Star's goodwill and a $1.7 million impairment charge related to a corporate aircraft in 2007, each of which is discussed in more detail below.  Excluding these charges, the Truckload segment generated operating income of $3.4 million in 2008 and an operating loss of $5.3 million in 2007.  In conjunctionThe increase in operating income from 2007 to 2008, with the renewal, we are self-insuredexclusion of the impairments, is primarily a result of a $6.6 million reduction in salaries and wages due to more drivers participating in the per diem plan and a reduction in our non-driving workforce.

Our brokerage segment revenue increased 176.3% to $54.7 million for personal injury and property damage claimsthe twelve months ended December 31, 2008, compared to $19.8 million for amounts upthe same period in the prior year, primarily due to an increase in fuel surcharge collection, much of which is passed on to the first $4.0 million. We are self-insuredthird-party carriers, and an increase in brokerage loads to 27,117 in 2008, from 10,743 loads in 2007.  As a result, average revenue per load increased approximately 9.4% to $2,017 in 2008, from $1,843 per load in 2007.  Excluding unallocated corporate overhead, operating income for cargo loss and damage claimsour brokerage segment was $0.5 million for amounts upthe twelve-month period ended December 31, 2008, compared to an operating income of $1.0 million per occurrence. Insurancefor the comparable 2007 period.  The decrease is a result of an increase in legal expense of $0.8 million related to litigation surrounding the closure of a large Company store in 2008, partially offset by a more efficient spreading of fixed costs due to the increase in loads year-over-year.

Additional Information Concerning Non-Cash Charges

Transplace

From July 2001 to December 2009, we owned approximately 12.4% of Transplace, Inc. ("Transplace"), a global logistics provider.  During the first quarter of 2005, we loaned Transplace approximately $2.6 million through a 6% interest-bearing note receivable.  After receiving an offer to purchase our 12.4% equity ownership and claims expense varies basedrelated note receivable that was accepted by a majority of Transplace's shareholders, we determined, pursuant to the guidance provided by the Financial Accounting Standards Board ("FASB") Accounting Standards Codification 325, that the value of our equity investment had become completely impaired in the third quarter of 2009, and the value of the note receivable had become impaired by approximately $0.9 million.  As a result, we recorded a non-cash impairment charge of $11.6 million during the third quarter of 2009.

The transaction closed in December 2009, whereby the proceeds of $1.9 million provided for a recovery of $0.1 million of the previously impaired amount in the fourth quarter of 2009 and thus an $11.5 million non-cash loss on the frequencysale of our investment and severity of claims,related note receivable.  There was no tax benefit recorded in connection with the premium expense, and the level of self-insured retention, the development of claims over time, and other factors. With our significant self-insured retention, insurance and claims expense may fluctuate significantly from period to period, and any increase in frequency or severity of claims could adversely affect our financial condition and results of operations.

Communications and utilities increased to $7.4 million in 2007 from $6.7 million in 2006. As a percentage of freight revenue, communications and utilities remained constant at 1.2% in 2007 and 2006.

General supplies and expenses, consisting primarily of headquarters and other terminal facilities expenses, increased $1.9 million to $23.3 million in 2007 from $21.4 million in 2006. As a percentage of freight revenue, general supplies and expenses increased to 3.9% in 2007 from 3.7% in 2006. Of this increase, $0.7 million was for additional building rent paidloss on our headquarters building and surrounding property in Chattanooga, Tennessee for which we completed a sale leaseback transaction effective April 2006 as described more fully in the following paragraph.  Sales agent commissions, primarily from our growing brokerage subsidiary, increased $1.1 million to $1.3 million in 2007, compared to $0.2 million in 2006.

In April 2006, we entered into a sale leaseback transaction involving our corporate headquarters, a maintenance facility, and approximately forty-six acres of surrounding property in Chattanooga, Tennessee (collectively, the "Headquarters Facility"). We received proceeds of approximately $29.6 million from the sale of the Headquarters Facility,investment, given a full valuation allowance was established for the related capital loss.

Goodwill

In light of changes in market conditions and the related declining market outlook for the Star Transportation operating subsidiary, which is included in our Truckload segment, noted in the fourth quarter of 2008, we engaged an independent third party to assist us in the completion of valuations used to pay down borrowings under our Credit Facilityin the impairment testing process.  The completion of this work concluded that the goodwill previously recorded for the Star acquisition was fully impaired and to purchase revenue equipment. In the transaction, we entered into a twenty-year lease agreement, whereby we will lease back the Headquarters Facility at an annual rental rate of approximately $2.5 million, subject to annual rent increases of 1.0%, resulting in annual straight-line rental expense of approximately $2.7 million. The transaction resulted in a gain$24.7 million, or $1.75 per basic and diluted share, non-cash goodwill impairment charge, recorded in the fourth quarter of approximately $2.4 million, which is being amortized ratably over2008.  There was no tax benefit associated with this nondeductible charge.  Pursuant to applicable accounting standards, we conducted our 2009 annual impairment test for goodwill in the life of the leasesecond quarter and recorded as an offset to general supplies and expenses (specifically to building rent) on our consolidated statements of operations.did not identify any impairment.

DepreciationRevenue Equipment, including Assets Held For Sale

As a result of sharply lower economic indicators, a worsening credit market, and amortization, consisting primarilysignificantly lower prices received for disposals of depreciationour owned used revenue equipment, all of which deteriorated substantially during the fourth quarter of 2008, we recorded a $9.4 million asset impairment charge to write-down the carrying values of tractors and trailers in-use in our Truckload segment which were expected to be traded or sold in 2009 or 2010.  The carrying values for revenue equipment scheduled for trade in 2011 and beyond were not adjusted because those tractors and trailers were not required to be impaired based on recoverability testing using the expected future cash flows and disposition values of such equipment.

Similarly, we recorded a $6.4 million asset impairment charge ($1.2 million was recorded in the third quarter and $5.2 million was recorded in the fourth quarter) to write down the carrying values of tractors and trailers held for sale in our Truckload segment, which were expected to be traded or sold in future periods.

Although we do not expect to be required to make any current or future cash expenditures as a result of these impairment charges, cash proceeds of future disposals of revenue equipment increased $12.4 million, or 30.1%,are anticipated to $53.5 million in 2007 from $41.2 million in 2006. As a percentagebe lower than expected prior to the impairment charges.

Our evaluation of freight revenue, depreciation and amortization increasedthe future cash flows compared to 8.9% in 2007 from 7.2% in 2006. The increase related to several factors, including an increase in the numbercarrying value of ownedthe tractors and trailers in-use in 2007; a softer market2009 has not resulted in any additional impairment charges.  Additionally, there were no indicators triggering an evaluation for used equipment resulting in a lossimpairment of $1.7 million in 2007 compared to a gain of $2.1 million in 2006;assets held for sale during the 2009 period, as evidenced by our minimal gains and increased amortization expense of $1.5 million related to the identifiable intangibles acquired with our Star acquisition on September 14, 2006. Depreciation and amortization expense is net of any gain or losslosses on the disposal of tractors and trailers.revenue equipment, including assets held for sale.

TheAircraft

In addition, our 2007 asset impairment charge relateswas related to our decision to sell our corporate aircraft to reduce ongoing operating costs.  We recorded an impairment charge of $1.7 million, reflecting the unfavorable fair market value of the airplane as compared to the combination of the estimated payoff of the long-term operating lease and current book value of related airplane leasehold improvements.


The other expense category includes interest expense, interest income, and pre-tax non-cash gains or losses related to the accounting for interest rate derivatives under SFAS No. 133, Accounting for Derivative Instruments and Hedging Activities, as amended ("SFAS No. 133").  Other expense, net, increased $5.2 million, to $11.6 million in 2007 from $6.4 million in 2006.  The increase relates primarily to increased net interest expense of $4.9 million resulting from the additional borrowings related to the Star acquisition, along with increased average interest rates. However a portion of this increase has been offset by a reduction in overall balance sheet debt since the Star acquisition.

Our income tax benefit was $5.6 million in 2007 compared to income tax expense of $4.6 million in 2006. The effective tax rate is different from the expected combined tax rate as a result of permanent differences primarily related to a per diem pay structure implemented in 2001.  Due to the nondeductible effect of per diem, our tax rate will fluctuate in future periods as income fluctuates. In addition, we received a net tax benefit in 2007, as compared with the 2006 period because we reversed a contingent tax accrual effective March 31, 2007, based on the recommendation by an IRS appeals officer that the IRS concede a case in our favor.  This concession resulted in recognition of approximately $0.4 million of income tax benefit in 2007.

Primarily as a result of the factors described above, net income decreased approximately $15.3 million to a net loss of $16.7 million in 2007 from a net loss of $1.4 million in 2006.  As a result of the foregoing, our net loss as a percentage of freight revenue declined to (2.8%) in 2007 from (0.2%) in 2006.

LIQUIDITY AND CAPITAL RESOURCES

Our business requires significant capital investments over the short-term and the long-term.  In recent years,Recently, we have financed our capital requirements with borrowings under our credit facilities,Credit Facility, cash flows from operations, long-term operating leases, capital leases, and secured installment notes with finance companies.  Our primary sources of liquidity at December 31, 2008,2009, were funds provided by operations, proceeds from the sale of used revenue equipment, borrowings under our Credit Agreement,Facility, borrowings from the Daimler Facility, other secured installment notes, (each as defined in Note 7 to our consolidated financial statements contained herein), andcapital leases, operating leases of revenue equipment.  Although turmoil inequipment, and cash and cash equivalents.  We had a working capital (total current assets less total current liabilities) deficit of $17.8 million at December 31, 2009, and a working capital surplus of $16.3 million at December 31, 2008.  Working capital deficits are common to many trucking companies that expand by financing revenue equipment purchases through borrowing or capitalized leases.  When we finance revenue equipment through borrowing or capitalized leases, the economyprincipal amortization scheduled for the next twelve months is categorized as a current liability, although the revenue equipment is classified as a long-term asset.  Consequently, each purchase of revenue equipment financed with borrowing or capitalized leases decreases working capital.  We believe our working capital deficit had little impact on our liquidity.  Based on our expected financial condition, results of operations, net capital expenditures, a material refund of previously paid federal income taxes as a result of net operating loss carry backs pursuant to the Worker, Homeownership, and inBusiness Assistance Act of 2009, and net cash flows during the financial and credit markets has made availability of financing less certain, based upon our assumptions for 2009 described above,next twelve months, which contemplate an improvement compared with the past twelve months, we believe our working capital and sources of financing, together with additional financing we may be able to access and secure with available real estate,liquidity will be adequate to meet our current and projected needs both for at least the shortnext twelve months.  On a longer-term basis, based on our anticipated financial condition, results of operations, and long term.cash flows, and continued availability of our Credit Facility, secured installment notes, and other sources of financing that we expect will be available to us, we do not expect to experience material liquidity constraints in the foreseeable future.

The Company has had significant losses from 2007 through 2009, attributable to operations, impairments, and other charges.  The Company has managed its liquidity during this time through a series of cost reduction initiatives, refinancing, amendments to credit facilities, and sales of assets.  We have had difficulty meeting budgeted results in the past.  If we are unable to meet budgeted results or otherwise comply with our Credit Facility, we may be unable to obtain a further amendment or waiver under our Credit Facility, or we may incur additional fees.

Cash Flows

Net cash provided by operating activities was $30.9 million in 2009 and $40.3 million in 2008.  Excluding the effects of $40.4 million in non-cash charges in 2008 and $33.7$11.5 million in 2007. Our2009, our cash from operating activities was higherlower in 20082009 primarily due to improved collectionan $11.5 million net change from 2009 to 2008 related to cash payments for insurance and claims accruals resulting from the payment of receivables which resulteda large volume of claims in an approximately $14.7 million increase in cash from operating activities in 2008.

Net cash used in investing activities was $62.6 million in 2008 and $11.1 million in 2007. The increase in net cash used in investing activities was primarily the2009, including several large claims.  Additionally, as a result of an increase in our acquisition of revenue equipment using balance sheet debt as opposed to operating leases, accelerated depreciation for tax purposes provided for an increase in the deferred tax provision, which resulted in an $8.7 million adjustment to net loss for the related non-cash activity in 2009 versus $2.5 million in the corresponding 2008 period.  The decrease in our cash from operating activities was partially offset by an increase in our collections of receivables, primarily resulting from the impact of fuel prices on revenue and accounts receivable, which resulted in a $2.9 million increase in cash from operating activities in 2009.

Net cash used in investing activities was $63.0 million in 2009 and $62.6 million in 2008.  In 2009, gross capital expenditures increased approximately $24 million, consistent with proceeds from our Daimler Facility and a decreasedispositions.  The increase in proceeds from the sale of revenue equipment.  We currently project netgross capital expenditures for 2009 will be in the rangewas primarily due to increasing our percentage of $65 to $80 million; however, such projection is subject to a number of uncertainties, including our plans for equipment replacementowned tractors and fleet size for 2009, which are still being finalized, as well as the prices obtained for used equipment.reducing tractors under operating leases.

Net cash provided by financing activities was $38.0 million in 2009, compared to $24.1 million in 2008 compared to $23.5 million used inprovided by financing activities in 2007.  In2008.  The primary contributors to the differences in our net cash provided by financing activities and net borrowings in the 2009 period, as compared to the 2008 we entered intoperiod, were the new Daimler Facility.  At December 31, 2008, the Company had outstandingpurchase of additional tractors in 2009 using balance sheet debt as opposed to operating leases and fluctuations in checks outstanding in excess of $167.0 million, primarily consisting of $159.8 million drawn under the Daimler Facility and approximately $3.8 millionbank balances resulting from the Credit Agreement.  At December 31, 2008, interest rates on thistiming of certain payments, partially off-set by lower debt ranged from 4.0% to 6.2%.  At December 31, 2008, we had approximately $38.9 million of available borrowing remaining under our Credit Agreement.refinancing costs given the Company's new credit facilities in 2008.

We havehad a stock repurchase plan for up to 1.3 million Company shares to be purchased in the open market or through negotiated transactions subject to criteria established by the Board.  No shares were purchased under this plan during 2008.  At December 31, 2008, there were 1,154,100 shares still available to purchase under this plan,2009, which expiresexpired on June 30, 2009.  However, ourwe remitted approximately $0.1 million to the proper taxing authorities in satisfaction of the employees' minimum statutory withholding requirements related to employees' vesting in restricted share grants.  The tax withholding amounts paid by the Company have been accounted for as a repurchase of shares.  Our Credit AgreementFacility now prohibits the repurchase of any shares.

shares, except those purchased to off-set an employee's minimum statutory withholding requirements upon the vesting of equity awards, without obtaining approval from the lenders.
29


Material Debt Agreements

Credit Agreement

In September 2008, Covenant Transport, Inc., a Tennessee corporation ("CTI"), CTGL, Covenant Asset Management, Inc., a Nevada corporation ("CAM"), Southern Refrigerated Transport, Inc., an Arkansas corporation ("SRT"), Covenant Transport Solutions, Inc., a Nevada corporation ("Solutions"), Star Transportation, Inc., a Tennessee corporation ("Star";the Company and collectively with CTI, CTGL, CAM, SRT, and Solutions, the "Borrowers"; and each of which is a direct or indirect wholly-owned subsidiary of Covenant Transportation Group, Inc.), and Covenant Transportation Group, Inc.substantially all its subsidiaries entered into a Third Amended and Restated Credit AgreementFacility with Bank of America, N.A., as agent (the "Agent"), JPMorgan Chase Bank, N.A. ("JPM"), and Textron Financial Corporation ("Textron"; and collectively(collectively with the Agent and JPM, the "Lenders") that matures September 2011 (the "Credit Agreement"Facility").

The Credit AgreementFacility is structured as an $85.0 million revolving credit facility, with an accordion feature that, so long as no event of default exists, allows the BorrowersCompany to request an increase in the revolving credit facility of up to $50.0 million.  Borrowings under the Credit Agreement are classified as either "base rate loans" or "LIBOR loans". As of December 31, 2008, base rate loans accrued interest at a base rate equal to the Agent's prime rate plus an applicable margin that adjusted quarterly between 0.625% and 1.375% based on average pricing availability.  LIBOR loans accrued interest at LIBOR plus an applicable margin that adjusted quarterly between 2.125% and 2.875% based on average pricing availability.  The applicable margin was 2.625% at December 31, 2008.  The Credit AgreementFacility includes, within its $85.0 million revolving credit facility, a letter of credit sub facility in an aggregate amount of $85.0 million and a swing line sub facility in an aggregate amount equal to the greater of $10.0 million or 10% of the Lenders' aggregate commitments under the Credit AgreementFacility from time to time.

Borrowings under the Credit Facility are classified as either "base rate loans" or "LIBOR loans."  Base rate loans accrue interest at a base rate equal to the greater of the prime rate, the federal funds rate plus 0.5%, or LIBOR plus 1.0%, plus an applicable margin that is adjusted quarterly between 2.5% and 3.25% based on average pricing availability.  LIBOR loans accrue interest at the greater of 1.5% or LIBOR, plus an applicable margin that is adjusted quarterly between 3.5% and 4.25% based on average pricing availability.  The unused line fee is adjusted quarterly between 0.25%0.5% and 0.375%0.75% of the average daily amount by which the Lenders' aggregate revolving commitments under the Credit AgreementFacility exceed the outstanding principal amount of revolver loans and the aggregate undrawn amount of all outstanding letters of credit issued under the Credit Agreement.Facility.  The obligations of the Borrowers under the Credit AgreementFacility are guaranteed by Covenant Transportation Group, Inc.the Company and secured by a pledge of substantially all of the Borrowers'Company's assets, with the notable exclusion of any real estate or revenue equipment financed with purchase money debt,pledged under other financing agreements, including without limitation, tractors financed through our $200.0 million line of credit from Daimler Truck Financial.revenue equipment installment notes and capital leases.

Borrowings under the Credit AgreementFacility are subject to a borrowing base limited to the lesser of (A) $85.0 million, minus the sum of the stated amount of all outstanding letters of credit; or (B) the sum of (i) 85% of eligible accounts receivable, plus (ii) the lesser of (a) 85% of the appraised net orderly liquidation value of eligible revenue equipment, (b) 95% of the net book value of eligible revenue equipment, or (c) 35% of the Lenders' aggregate revolving commitments under the Credit Agreement,Facility, plus (iii) the lesser of (a) $25.0 million or (b) 65% of the appraised fair market value of eligible real estate.  The borrowing base is limited by a $15.0 million availability block, plus any other reserves as the Agent may establish in its judgment.  WeThe Company had approximately $3.8$12.7 million in borrowings outstanding under the Credit AgreementFacility as of December 31, 2008, and had2009, undrawn letters of credit outstanding of approximately $40.6$42.0 million, and available borrowing capacity of $27.7 million.  The weighted average interest rate on outstanding borrowings was 6.25%.

The Credit Agreement includes usual and customary events of default for a facility of this nature and provides that, upon the occurrence and continuation of an event of default, payment of all amounts payable under the Credit Agreement may be accelerated, and the Lenders' commitments may be terminated. The Credit Agreement contains certain restrictions and covenants relating to, among other things, dividends, liens, acquisitions and dispositions outside of the ordinary course of business, and affiliate transactions.  The Credit Agreement contains a single financial covenant, which requires us to maintain a consolidated fixed charge coverage ratio of at least 1.0 to 1.0.  The financial covenant became effective October 31, 2008, we were in compliance at December 31, 2008, and such covenant was thereafter amended as described below.


On March 27, 2009, wethe Company obtained an amendment to ourits Credit Agreement,Facility, which among other things, (i) retroactively to January 1, 2009 amended the fixed charge coverage ratio covenant for January and February 2009 to the actual levels achieved, which cured our default of that covenant for January 2009, (ii) restarted the look back requirements of the fixed charge coverage ratio covenant beginning on March 1, 2009, (iii) increased the EBITDAR portion of the fixed charge coverage ratio definition by $3,000,000$3.0 million for all periods between March 1 to December 31, 2009, (iv) increased the base rate applicable to base rate loans to the greater of the prime rate, the federal funds rate plus 0.5%, or LIBOR plus 1.0%, (v) setsets a LIBOR floor of 1.5%, (vi) increased the applicable margin for base rate loans to a range between 2.5% and 3.25%3.25 % and for LIBOR loans to a range between 3.5% and 4.25%, with 3.0% (for base rate loans) and 4.0% (for LIBOR loans) to be used as the applicable margin through September 2009, (vii) increased ourthe Company's letter of credit facility fee by an amount corresponding to the increase in the applicable margin, (viii)(vii) increased the unused line fee to a range between 0.5% and 0.75%, and (ix) increased the maximum number of field examinations per year from three to four.  In exchange for these amendments, wethe Company agreed to the increases in interest rates and fees described above and paid fees of approximately $544,000.  Our$0.5 million.

The Credit Facility includes usual and customary events of default for a facility of this nature and provides that, upon the occurrence and continuation of an event of default, payment of all amounts payable under the Credit Facility may be accelerated, and the Lenders' commitments may be terminated.  The Credit Facility contains certain restrictions and covenants relating to, among other things, dividends, liens, acquisitions and dispositions outside of the ordinary course of business, and affiliate transactions.  The Credit Facility contains a single financial covenant, which required the Company to maintain a consolidated fixed charge coverage ratio will beof at least 1.0 to 1.0.  The fixed charge coverage covenant became effective October 31, 2008, and the Company was in compliance with the covenant as follows after the amendment:of December 31, 2009.

On February 25, 2010, the Company obtained an additional amendment to its Credit Facility, which, among other things (i) amended certain defined terms in the Credit Facility, (ii) retroactively to January 1, 2010, amended the fixed charge coverage ratio covenant through June 30, 2010, to the levels set forth in the table below, which prevented a default of that covenant for January 2010, (iii) restarted the look back requirements of the fixed coverage ratio covenant beginning on January 1, 2010, and (iv) required the Company to order updated appraisals for certain real estate described in the Credit Facility.  In exchange for these amendments, we agreed to pay the Agent, for the pro rata benefit of the Lenders, a fee equal to 0.125% of the Lenders' total commitments under the Credit Facility, or approximately $0.1 million.  Following the effectiveness of the amendment, our fixed charge coverage ratio covenant requirement will be as follows:

One month ending March 31, 20091.00 to 1.0
Two months ending April 30, 20091.00 to 1.0
Three months ending May 31, 20091.00 to 1.0
Four months ending June 30, 20091.00 to 1.0
Five months ending July 31, 20091.00 to 1.0
Six months ending August 31, 20091.00 to 1.0
Seven months ending September 30, 20091.00 to 1.0
Eight months ending October 31, 20091.00 to 1.0
Nine months ending November 30, 20091.00 to 1.0
Ten months ending December 31, 20091.00 to 1.0
Eleven months ending January 31, 20101.00.80 to 1.01.00
TwelveTwo months ending February 28, 2010.65 to 1.00
Three months ending March 31, 2010.72 to 1.00
Four months ending April 30, 2010.80 to 1.00
Five months ending May 31, 2010.85 to 1.00
Six months ending June 30, 2010.90 to 1.00
Seven months ending July 31, 20101.00 to 1.01.00
Eight months ending August 31, 20101.00 to 1.00
Nine months ending September 30, 20101.00 to 1.00
Ten months ending October 31, 20101.00 to 1.00
Eleven months ending November 30, 20101.00 to 1.00
Twelve months ending December 31, 20101.00 to 1.00
Each rolling twelve-month period thereafter1.00 to 1.01.00

Daimler Facility

On June 30, 2008, we securedCapital lease obligations are utilized to finance a $200.0 million lineportion of credit from Daimler Financial (the "Daimler Facility").our revenue equipment and are entered into with certain finance companies who are not parties to our Credit Facility.  The Daimler Facility is securedleases terminate in January 2015 and contain guarantees of the residual value of the related equipment by both newthe Company, and used tractors and is structuredthe residual guarantees are included in the related debt balance as a combinationballoon payment at the end of retail installment contractsthe related term as well as included in the future minimum lease payments.  These lease agreements require us to pay personal property taxes, maintenance, and TRAC leases.operating expenses.

Pricing for the Daimler Facility is (i)revenue equipment installment notes are quoted by Daimlerthe respective financial captives of our primary revenue equipment suppliers at the funding of each group of equipment acquired and consists ofinclude fixed annual rates for new equipment under retail installment contractscontracts.  Approximately $185.6 million and (ii) a rate of 6% annually on used equipment financed on June 30, 2008.  Approximately $159.8 million waswere reflected on our balance sheet under the Daimler Facilityfor these installment notes at December 31, 2008.2009 and 2008, respectively.  The notes included in the Daimler funding are due in monthly installments with final maturities at various dates ranging from DecemberJanuary 2010 to December 2011.June 2013.  The Daimler Facility containsnotes contain certain requirements regarding payment, insurance of collateral, and other matters, but doesdo not have any financial or other material covenants or events of default.

Additional borrowings underfrom the Daimler Facilityfinancial captives of our primary revenue equipment suppliers are available to fund new tractors expected to be delivered in 2009.  Following relatively modest capital expenditures in 2007 and in the first half of 2008, we increased net capital expenditures in the last half of 2008 and we expect net capital expenditures (primarily consisting of revenue equipment) to increase significantly over the next 12 to 18 months consistent with our expected tractor replacement cycle.  The Daimler Facility includes a commitment to fund most or all of the expected tractor purchases.  The annual interest rate on the new equipment is approximately 200 basis points over the like-term rate for U.S. Treasury Bills, and the advance rate is 100% of the tractor cost.  A leasing alternative is also available.2010.


Contractual Obligations and Commercial Commitments (1)

The following table sets forth our contractual cash obligations and commitments as of December 31, 2008:2009:
Payments due by period:
(in thousands)
 Total  2010  2011  2012  2013  2014  There-after 
Credit Facility, including interest (2) $12,686   -  $12,686   -   -   -   - 
                             
Revenue equipment and property installment notes, including interest (3) $207,837  $77,176  $59,409  $67,450  $3,802   -   - 
                             
Operating leases (4) $81,989  $22,898  $9,650  $7,668  $5,358  $3,216  $33,199 
                             
Capital leases (5) $18,052  $2,177  $2,177  $2,177  $2,177  $8,064  $1,280 
                             
Lease residual value guarantees $23,594  $12,714  $10,880   -   -   -   - 
                             
Purchase obligations (6) $98,014  $97,607  $407   -   -   -   - 
Total contractual cash obligations $442,172  $212,572  $95,209  $77,295  $11,337  $11,280  $34,479 

Payments due by period:
(in thousands)
 Total  2009  2010  2011  2012  2013  
There-
after
 
Credit Facility, including interest (2) $3,940  $3,940   -   -   -   -   - 
                             
Revenue equipment installment
notes, including interest (3)
 $175,067  $67,217  $59,405  $36,485  $11,960   -   - 
                             
Operating leases (4) $98,959  $23,857  $19,658  $8,572  $7,290  $4,834  $34,748 
                             
Lease residual value guarantees $26,212   -  $9,864  $16,348   -   -   - 
                             
Diesel fuel and purchase obligations (5) $67,000  $  67,000                     
Total contractual cash obligations $371,178  $162,014  $88,927  $61,405  $19,250  $4,834  $34,748 

(1)Excludes any amounts accrued for unrecognized tax benefits under FIN 48 as we are unable to reasonably predict the ultimate amount or timing of settlement of such unrecognized tax benefits.
(2)Represents principal and interest payments owed at December 31, 2008.2009.  The borrowings consist of draws under the Company's Credit Agreement,Facility, with fluctuating borrowing amounts and variable interest rates.  In determining future contractual interest and principal obligations, for variable interest rate debt, the interest rate and principal amount in place at December 31, 20082009, was utilized.  The table assumes long-term debt is held to maturity.  Refer to Note 7, "Long-Term Debt and Securitization Facility"8, "Debt" of the accompanying consolidated financial statements for further information.
(3)Represents principal and interest payments owed at December 31, 2008.2009.  The borrowings consist of installment notes with a finance company,companies, with fixed borrowing amounts and fixed interest rates.  The table assumes these installment notes are held to maturity.  Refer to Note 7, "Long-Term Debt and Securitization Facility"8, "Debt" of the accompanying consolidated financial statements for further information.
(4)Represents future monthly rental payment obligations under operating leases for over-the-road tractors, day-cabs, trailers, office and terminal properties, and computer and office equipment.  Substantially all lease agreements for revenue equipment have fixed payment terms based on the passage of time.  The tractor lease agreements generally stipulate maximum miles and provide for mileage penalties for excess miles.  Lease termsThese leases generally run for a period of three to five years for tractors and trailers range from 30five to 60 months and 60 to 84 months, respectively.seven years for trailers.  Refer to Item 7, Management's Discussion and Analysis of Financial Condition and Results of Operations – Off Balance Sheet Arrangements and Note 9, "Leases,""Leases" of the accompanying consolidated financial statements for further information.
(5)This amount represents volumeRepresents principal and interest payments owed at December 31, 2009.  The borrowings consist of capital leases with a finance company, with fixed borrowing amounts and fixed interest rates.  Borrowings in 2014 and thereafter include the residual value guarantees on the related equipment as balloon payments.  Refer to Note 8, "Debt" of the accompanying consolidated financial statements for further information.
(6)Represents purchase obligations for revenue equipment and communications equipment totaling approximately $97.2 million in 2010.  These commitments are cancelable, subject to certain adjustments in the underlying obligations and benefits.  The Company also had commitments outstanding at December 31, 2009, to acquire computer software totaling $0.4 million in 2010 and 2011.  These purchase commitments through our truck stop network. We estimate that these amounts represent approximately 80%are expected to be financed by operating leases, capital leases, long-term debt, proceeds from sales of our fuel needsexisting equipment, and/or cash flows from operations.  Refer to Notes 8 and 9, “Debt” and "Leases", respectively, of the accompanying consolidated financial statements for 2009.further information

Off Balance Sheet Arrangements

Operating leases have been an important source of financing for our revenue equipment, computer equipment, and certain real estate.  At December 31, 2008,2009, we had financed approximately 646236 tractors and 5,7065,987 trailers under operating leases.  Vehicles held under operating leases are not carried on our consolidated balance sheets, and lease payments in respect of such vehicles are reflected in our consolidated statements of operations in the line item "Revenue equipment rentals and purchased transportation."  Our revenue equipment rental expense was $25.9 million in 2009, compared to $31.2 million in 2008, compared to $32.5 million in 2007.2008.  The total amount of remaining payments under operating leases as of December 31, 2008,2009, was approximately $99.0$81.9 million.  In connection with various operating leases, we issued residual value guarantees, which provide that if we do not purchase the leased equipment from the lessor at the end of the lease term, we are liable to the lessor for an amount equal to the shortage (if any) between the proceeds from the sale of the equipment and an agreed value.  As of December 31, 2008,2009, the maximum amount of the residual value guarantees was approximately $21.4$23.6 million.  To the extent the expected value at the lease termination date is lower than the residual value guarantee,guarantee; we would accrue for the difference over the remaining lease term.  We believe that proceeds from the sale of equipment under operating leases would exceed the payment obligation on substantially all operating leases.


CRITICAL ACCOUNTING POLICIES AND ESTIMATES

The preparation of financial statements in conformity with accounting principles generally accepted in the United States of America requires us to make decisions based upon estimates, assumptions, and factors we consider as relevant to the circumstances.  Such decisions include the selection of applicable accounting principles and the use of judgment in their application, the results of which impact reported amounts and disclosures.  Changes in future economic conditions or other business circumstances may affect the outcomes of our estimates and assumptions.  Accordingly, actual results could differ from those anticipated.  A summary of the significant accounting policies followed in preparation of the financial statements is contained in Note 1, "Summary of Significant Accounting Policies," of the consolidated financial statements attached hereto.  The following discussion addresses our most critical accounting policies, which are those that are both important to the portrayal of our financial condition and results of operations and that require significant judgment or use of complex estimates.

Revenue Recognition

Revenue, drivers' wages, and other direct operating expenses generated by our Truckload reportable segment are recognized on the date shipments are delivered to the customer.  Revenue includes transportation revenue, fuel surcharges, loading and unloading activities, equipment detention, and other accessorial services.

Revenue generated by our Solutions reportable segment is recognized upon completion of the services provided.  Revenue is recorded on a gross basis, without deducting third party purchased transportation costs, as we act as a principal with substantial risks as primary obligor, except for transactions whereby equipment from our Truckload segment perform the related services, which we record on a net basis in accordance with the related authoritative guidance.

Depreciation of Revenue Equipment

Depreciation is determined using the straight-line method over the estimated useful lives of the assets.  Depreciation of revenue equipment is our largest item of depreciation.  We generally depreciate new tractors (excluding day cabs) over five years to salvage values of 7%5% to 26%31% and new trailers over seven to ten years to salvage values of 22%26% to 39%43%.  We annually review the reasonableness of our estimates regarding useful lives and salvage values of our revenue equipment and other long-lived assets based upon, among other things, our experience with similar assets, conditions in the used revenue equipment market, and prevailing industry practice.  Changes in our useful life or salvage value estimates or fluctuations in market values that are not reflected in our estimates could have a material effect on our results of operations.  Gains and losses on the disposal of revenue equipment are included in depreciation expense in our consolidated statements of operations.

The Company leases certain revenue equipment under capital leases with terms of 60 months.  Amortization of leased assets is included in depreciation and amortization expense.
Revenue
Pursuant to applicable accounting standards, revenue equipment and other long-lived assets are tested for impairment whenever an event occurs that indicates an impairment may exist.  Expected future cash flows are used to analyze whether an impairment has occurred.  If the sum of expected undiscounted cash flows is less than the carrying value of the long-lived asset, then an impairment loss is recognized.  We measure the impairment loss by comparing the fair value of the asset to its carrying value.  Fair value is determined based on a discounted cash flow analysis or the appraised value of the assets, as appropriate. We recorded impairment charges in 2008 and in 2007. During 2008, due to the softening of the market for used equipment, we recorded a $15.8 million asset impairment charge to write down the carrying values of tractors and trailers held for sale expected to be traded or sold in 2009 and tractors that are in-use expected to be traded or sold in 2009 or 2010.   During 2007, related to our decision to sell our corporate aircraft, we recorded an impairment charge of $1.7 million, reflecting the unfavorable market value of the airplane as compared to the combination of the estimated payoff of the long-term operating lease and current net book value of related airplane leasehold improvements.  See the discussion above under "Additional Information Concerning Impairment Charges" for a more extensive description of these impairments.

Although a portion of our tractors are protected by non-binding indicative trade-in values or binding trade-back agreements with the manufacturers, we continue to have some tractors and substantially all of our trailers subject to fluctuations in market prices for used revenue equipment.  Moreover, our trade-back agreements are contingent upon reaching acceptable terms for the purchase of new equipment.  Further declines in the price of used revenue equipment or failure to reach agreement for the purchase of new tractors with the manufacturers issuing trade-back agreements could result in impairment of, or losses on the sale of, revenue equipment.

Assets Held For Sale

Assets held for sale include property and revenue equipment no longer utilized in continuing operations which isare available and held for sale.  Assets held for sale are no longer subject to depreciation, and are recorded at the lower of depreciated book value plus the related costs to sell or fair market value less selling costs.  We periodically review the carrying value of these assets for possible impairment.  We expect to sell the majority of these assets within twelve months. During 2008, due

Goodwill and Other Intangible Assets

Pursuant to applicable accounting standards, we classify intangible assets into two categories: (i) intangible assets with definite lives subject to amortization and (ii) goodwill.  We test intangible assets with definite lives for impairment if conditions exist that indicate the softeningcarrying value may not be recoverable.  Such conditions may include an economic downturn in a geographic market or a change in the assessment of future operations.  We record an impairment charge when the carrying value of the definite lived intangible asset is not recoverable by the cash flows generated from the use of the asset.

We test goodwill for impairment at least annually or more frequently if events or circumstances indicate that such intangible assets or goodwill might be impaired.  We perform our impairment tests of goodwill at the reporting unit level.  The Company's reporting units are defined as its subsidiaries because each is a legal entity that is managed separately.  Such impairment tests for goodwill include comparing the fair value of the respective reporting unit with its carrying value, including goodwill.  We use a variety of methodologies in conducting these impairment tests, including discounted cash flow analyses and market analyses.

We determine the useful lives of our identifiable intangible assets after considering the specific facts and circumstances related to each intangible asset.  Factors we consider when determining useful lives include the contractual term of any agreement, the history of the asset, the Company's long-term strategy for used revenue equipment, we recordedthe use of the asset, any laws or other local regulations which could impact the useful life of the asset, and other economic factors, including competition and specific market conditions.  Intangible assets that are deemed to have definite lives are amortized, generally on a $6.4 million asset impairment charge ($1.2 million was recorded in the third quarter and $5.2 million was recorded in the fourth quarter)straight-line basis, over their useful lives, ranging from 4 to write down the carrying values of tractors and trailers held for sale expected to be traded or sold in 2009.  See the discussion above under "Additional Information Concerning Impairment Charges" for a more extensive description of this impairment.20 years.


Accounting for InvestmentsTransplace

From July 2001 through December 2009, we owned approximately 12.4% of Transplace.  In the formation transaction for Transplace, we contributed our logistics customer list, logistics business software and software licenses, certain intellectual property, intangible assets, and $5.0 million in cash, in exchange for our ownership.  We have an investment in Transplace, Inc. ("Transplace"), a global transportation logistics service. We accountaccounted for this investment, which totaled approximately $10.7 million, using the cost method of accounting, with the investmentand it was historically included in other assets. We continue to evaluate this cost method investment in Transplace for impairment due to declines considered to be other than temporary. This impairment evaluation includes general economic and company-specific evaluations. If we determine that a decline in the cost value of this investment is other than temporary, then a charge to earnings will be recorded to other (income) expensesassets in the consolidated statements of operations for all or a portion of the unrealized loss, and a new cost basis in the investment will be established. As of December 31, 2008, no such charge had been recorded. However, we will continue to evaluate this investment for impairment on a quarterly basis.balance sheet.  Also, during the first quarter of 2005, we loaned Transplace approximately $2.7 million. The 6% interest-bearing$2.6 million, which along with the related accrued interest was historically included in other receivables in the consolidated balance sheet.

Based on an offer to purchase our 12.4% equity ownership and related note receivable matures January 2011, an extensionin Transplace that was accepted by a majority of Transplace's shareholders, we determined that pursuant to the guidance provided by FASB Accounting Standards Codification 325, the value of our equity investment had become completely impaired in the third quarter of 2009, and the value of the original January 2007 maturity date. Basednote receivable had become impaired by approximately $0.9 million.  As a result, we recorded a non-cash impairment charge of $11.6 million during the third quarter of 2009.

The transaction closed in December 2009, whereby the proceeds of $1.9 million provided for a recovery of $0.1 million of the previously impaired amount in the fourth quarter of 2009 and thus an $11.5 million non-cash loss on the borrowing availabilitysale of Transplace, we do not believe there is any impairment of thisour investment and related note receivable.

Accounting for Business Combinations

In accordance  There was no tax benefit recorded in connection with business combination accounting, the Company allocatesloss on the purchase price of acquired companies to the tangible and intangible assets acquired, and liabilities assumed based on their estimated fair values. The Company engages third-party appraisal firms to assist management in determining the fair values of certain assets acquired. Such valuations require management to make significant estimates and assumptions, especially with respect to intangible assets. Management makes estimates of fair value based upon historical experience, as well as information obtained from the managementsale of the acquired companies and are inherently uncertain. Unanticipated events and circumstances may occur which may affectinvestment, given a full valuation allowance was established for the accuracy or validity of such assumptions, estimates or actual results. In certain business combinations that are treated as a stock purchase for income tax purposes, the Company must record deferred taxes relating to the book versus tax basis of acquired assets and liabilities. Generally, such business combinations result in deferred tax liabilities as the book values are reflected at fair values whereas the tax basis is carried over from the acquired company.  Such deferred taxes are initially estimated based on preliminary information and are subject to change as valuations and tax returns are finalized.related capital loss.

Insurance and Other Claims

The primary claims arising against the Company consist of cargo, liability, personal injury, property damage, workers' compensation, and employee medical expenses.  The Company's insurance program involves self-insurance with high risk retention levels.  Because of the Company's significant self-insured retention amounts, it has exposure to fluctuations in the number and severity of claims and to variations between its estimated and actual ultimate payouts.  The Company accrues the estimated cost of the uninsured portion of pending claims.  Its estimatesEstimates require judgments concerning the nature and severity of the claim, historical trends, advice from third-party administrators and insurers, the size of any potential damage award based on factors such as the specific facts of individual cases, the jurisdictions involved, the prospect of punitive damages, future medical costs, and inflation estimates of future claims development, and the legal and other costs to settle or defend the claims.  The Company has significant exposure to fluctuations in the number and severity of claims.  If there is an increase in the frequency and severity of claims, or the Company is required to accrue or pay additional amounts if the claims prove to be more severe than originally assessed, or any of the claims would exceed the limits of its insurance coverage, its profitability would be adversely affected.

In addition to estimates within the Company's self-insured retention layers, it also must make judgments concerning its aggregate coverage limits.  If any claim occurrence werewas to exceed the Company's aggregate coverage limits, it would have to accrue for the excess amount.  The Company's critical estimates include evaluating whether a claim may exceed such limits and, if so, by how much.  Currently, the Company is not aware of any such claims.  If one or more claims were to exceed the Company's then effective coverage limits, its financial condition and results of operations could be materially and adversely affected.

In general for casualty claims, we currently have insurance coverage up to $50.0 million per claim.  We renewed our casualty program as of February 28, 2008.  We are self-insured on an occurrence/per claim basis for personal injury and property damage claims for amounts up to the first $4.0 million, except for Star where we currently have insurance coverage up to $2.0 million per claim after the first $0.3 million for which we are self-insured. We are self-insured on an occurrence/per claim basis for workers' compensation up to the first $1.25 million.  The Company is completely self-insured for physical damage to its own tractors and trailers and is generally completely self-insured for damages to the cargo we haul.  The Company also maintains a self-insured group medical plan for its employees with annual per individual claimant stop-loss deductible of $0.4 million with a maximum lifetime benefit of $0.7 million.

Insurance and claims expense varies based on the frequency and severity of claims, the premium expense, the level of self-insured retention, the development of claims over time, and other factors.  With our significant self-insured retention, insurance and claims expense may fluctuate significantly from period to period, and any increase in frequency or severity of claims could adversely affect our financial condition and results of operations.


Lease Accounting and Off-Balance Sheet Transactions

The Company issues residual value guarantees in connection with the operating leases it enters into for certain of its revenue equipment.  These leases provide that if the Company does not purchase the leased equipment from the lessor at the end of the lease term, then it is liable to the lessor for an amount equal to the shortage (if any) between the proceeds from the sale of the equipment and an agreed value.  To the extent the expected value at the lease termination date is lower than the residual value guarantee,guarantee; the Company would accrue for the difference over the remaining lease term.  The Company believes that proceeds from the sale of equipment under operating leases would exceed the payment obligation on substantially all operating leases.  The estimated values at lease termination involve management judgments.  As leases are entered into, determination as to the classification as an operating or capital lease involves management judgments on residual values and useful lives.

Accounting for Income Taxes

We make important judgments concerning a variety of factors, including the appropriateness of tax strategies expected future tax consequences based on future Company performance, and to the extent tax strategies are challenged by taxing authorities, our likelihood of success.  We utilize certain income tax planning strategies to reduce our overall cost of income taxes.  It is possible that certain strategies might be disallowed, resulting in an increased liability for income taxes.  Significant management judgments are involved in assessing the likelihood of sustaining the strategies and in determining the likely range of defense and settlement costs, and an ultimate result worse than our expectations could adversely affect our results of operations.

Deferred income taxes represent a substantial liability on our consolidated balance sheets and are determined in accordance with SFAS No. 109, Accounting for Income Taxes.applicable accounting standards.  Deferred tax assets and liabilities (tax benefits and liabilities expected to be realized in the future) are recognized for the expected future tax consequences attributable to differences between the financial statement carrying amounts of existing assets and liabilities and their respective tax bases, and operating loss and tax credit carry forwards.

The carrying value of ourthe Company's deferred tax assets assumes that weit will be able to generate, based on certain estimates and assumptions, sufficient future taxable income in certain tax jurisdictions to utilize these deferred tax benefits.  If these estimates and related assumptions change in the future, weit may be required to establish a valuation allowance against the carrying value of the deferred tax assets, which would result in additional income tax expense.  On a periodic basis, we assessthe Company assesses the need for adjustment of the valuation allowance.  Based on forecasted taxable income and prior years' taxable income,tax planning strategies available to the Company, no valuation reserveallowance has been established at December 31, 2008,2009, except for $0.3 million related to certain state net operating loss carryforwards and $1.6 million related to the deferred tax asset associated with the Company's capital loss generated by the loss on the sale of its investment in Transplace.  These valuation allowances were established because we believethe Company believes that it is more likely than not that certain state net operating loss carryforwards and the capital loss carryforward related to Transplace will not be realized.  If these estimates and related assumptions change in the future, benefitit may be required to modify its valuation allowance against the carrying value of the deferred tax assets will be realized. However, there can be no assurance that we will meet our forecasts of future income.assets.

While it is often difficult to predict the final outcome or the timing of resolution of any particular tax matter, the Company believes that its reserves reflect the probable outcome of known tax contingencies.  The Company adjusts these reserves, as well as the related interest, in light of changing facts and circumstances.  Settlement of any particular issue would usually require the use of cash.  Favorable resolution would be recognized as a reduction to the Company's annual tax rate in the year of resolution.

Performance-BasedStock-Based Employee Stock Compensation

Effective January 1, 2006, we adopted the fair value recognition provisions of SFAS No. 123R (revised 2004) Share-Base Payment ("SFAS No. 123R"), under which we estimate compensation expense that is recognized in our consolidated statements of operations for the fair value of employee stock-based compensation related to grants of performance-based stock options and restricted stock awards. This estimate requires various subjective assumptions, including probability of meeting the underlying performance-based earnings per share targets and estimating forfeitures. If any of these assumptions change significantly, stock-based compensation expense may differ materially in the future from the expense recorded in the current period.

The Company issues several types of share-based compensation, including awards that vest based on service, market, and performance conditions or a combination of the conditions.  Performance-based awards vest contingent upon meeting certain performance criteria established by the Compensation Committee.  Market-based awards vest contingent upon meeting certain stock price targets selected by the Compensation Committee.  All awards require future service and thus forfeitures are estimated based on historical forfeitures and the remaining term until the related award vests.  Determining the appropriate amount to expense in each period is based on likelihood and timing of achieving of the stated targets for performance and market based awards, respectively, and requires judgment, including forecasting future financial results and market performance.  The estimates are revised periodically based on the probability and timing of achieving the required performance and market targets, respectively, and adjustments are made as appropriate.  Awards that are only subject to time vesting provisions are amortized using the straight-line method.


New
Recent Accounting Pronouncements

Improving Disclosures About Fair Value Measurements – In May 2008,January 2010, the FASB issued SFAS No. 162, The Hierarchyauthoritative guidance to clarify certain existing disclosure requirements and require additional disclosures for recurring and nonrecurring fair value measurements.  These additional disclosures include amounts and reasons for significant transfers between Level 1 and Level 2 of Generally Accepted Accounting Principles ("SFAS No. 162"), which identifies the sourcesfair value hierarchy; significant transfers in and out of Level 3 of the fair value hierarchy; and framework for selecting the accounting principles to be usedinformation about purchases, sales, issuances, and settlements on a gross basis in the preparationreconciliation of financial statementsrecurring Level 3 measurements.  Further, the guidance amends employer's disclosures about post-retirement benefit plans to require that disclosures be provided by classes of nongovernmental entities thatassets instead of by major categories of assets.  The requirements of this guidance are presented in conformityeffective for periods beginning after December 15, 2009, with the generally accepted accounting principles ("GAAP") hierarchy.  Because the current GAAP hierarchy is set forth in the American Institute of Certified Public Accountants Statement on Auditing Standards No. 69, it is directed to the auditor rather than to the entity responsible for selecting accounting principles for financial statements presented in conformity with GAAP.  Accordingly, the FASB concluded the GAAP hierarchy should reside in the accounting literature established by the FASB and issued this statement to achieve that result.  The provisions of SFAS No. 162 became effective 60 days following the SEC's approvalexception of the Public Company Accounting Oversight Board amendments to AU Section 411, The Meaningrequirement of Present Fairly in Conformity with Generally Accepted Accounting Principles.information about purchases, sales, issuances, and settlements of Level 3 measurements, which becomes effective for periods ending after December 15, 2010.  The Company does not believeexpect the adoption of SFAS No. 162 willthis guidance to have a material impact in theon its consolidated financial statements.

Accounting Standards Codification - In June 2009, the FASB issued authoritative guidance which establishes the FASB Accounting Standards Codification as the single source of authoritative U.S. generally accepted accounting principles recognized by the FASB to be applied by nongovernmental entities.  The FASB Accounting Standards Codification is effective for interim and annual periods ending after September 15, 2009.  The adoption of the FASB Accounting Standards Codification did not have a material effect on the Company's consolidated financial statements.

Fair Value Measurement of Liabilities - In August 2009, the FASB issued authoritative guidance which provides clarification regarding the required techniques for the fair value measurement of liabilities.  This update applies to all entities that measure liabilities at fair value, and is effective for the first interim or annual reporting period beginning after its issuance in August 2009.  The Company does not expect the adoption of this guidance to have a material effect on its consolidated financial statements.

Transfers of Financial Assets - - In June 2009, the FASB issued authoritative guidance which requires entities to provide more information regarding sales of securitized financial assets and similar transactions, particularly if the seller retains some risk with respect to the assets.  This authoritative guidance is effective for fiscal years beginning after November 15, 2009.  The Company does not expect the adoption of this guidance to have a material effect on its consolidated financial statements.

Variable Interest Entities - In June 2009, the FASB issued authoritative guidance designed to improve financial reporting by companies involved with variable interest entities and to provide more relevant and reliable information to users of financial statements.  This authoritative guidance is effective for fiscal years beginning after November 15, 2009.  The Company does not expect the adoption of this guidance to have a material effect on its consolidated financial statements.

Subsequent Events - In May 2009, the FASB issued authoritative guidance that established general standards of accounting for and disclosures of events that occur after the balance sheet date but before financial statements are issued or are available to be issued.  This authoritative guidance was effective for interim or annual financial periods ending after June 15, 2009.  The adoption of this guidance did not affect the Company's consolidated financial statements.

Interim Disclosures about Fair Value of Financial Instruments - In April 2009, the FASB issued authoritative guidance to require disclosures about fair values of financial instruments for interim reporting periods as well as in annual financial statements.  The guidance also amends previous guidance to require those disclosures in summarized financial information at interim reporting periods.  This guidance was effective for interim reporting periods ending after June 15, 2009.  The adoption of this guidance did not affect the Company's consolidated financial statements.

Disclosures about Derivative Instruments and Hedging Activities - In March 2008, the FASB issued SFAS No. 161,authoritative guidance which amends and expands the previous disclosure requirements, of SFAS No. 133, to provide an enhanced understanding of an entity's use of derivative instruments, how they are accounted for, under SFAS No. 133, and their effect on the entity's financial position, financial performance, and cash flows.  The provisions of SFAS No. 161 are effectiveCompany adopted the guidance as of the beginning of ourthe 2009 fiscal year.  We are currently evaluatingyear and its adoption did not have a material impact to the impact of adopting SFAS No. 161 on ourCompany's consolidated financial statements.

In February 2008, the FASB issued SFAS No. 157-1, Application of FASB Statement No. 157 to FASB Statement No. 13 and Other Accounting Pronouncements That Address Fair Value Measurements for Purposes of Lease Classification or Measurement under Statement 13 ("SFAS No. 157-1").  SFAS No. 157-1 amends the scope of FASB Statement No. 157 to exclude FASB Statement No. 13, Accounting for Leases, and other accounting standards that address fair value measurements for purposes of lease classification or measurement under FASB Statement No. 13.  SFAS No. 157-1 is effective on initial adoption of FASB Statement No. 157.  The scope exception does not apply to assets acquired and liabilities assumed in a business combination that are required to be measured at fair value under FASB Statement No. 141, Business Combinations, or SFAS No. 141R (as defined below), regardless of whether those assets and liabilities are related to leases.

Business Combinations - In December 2007, the FASB issued SFAS No. 141R. Business Combinations ("SFAS No. 141R").  This statementauthoritative guidance that establishes requirements for (i) recognizing and measuring in an acquiring company's financial statements the identifiable assets acquired, the liabilities assumed, and any noncontrolling interest in the acquiree; (ii) recognizing and measuring the goodwill acquired in the business combination or a gain from a bargain purchase; and (iii) determining what information to disclose to enable users of the financial statements to evaluate the nature and financial effects of the business combination.  The provisions of SFAS No. 141Rthe guidance are effective for business combinations for which the acquisition date is on or after the beginning of the first annual reporting period beginning on or after December 15, 2008.  The Company doesadopted the guidance as of the beginning of the 2009 fiscal year and its adoption did not believe the adoption of SFAS No. 141R will have a material impact into the Company's consolidated financial statements.

Noncontrolling Interests in Consolidated Financial Statements - In December 2007, the FASB issued SFAS No. 160, Noncontrolling Interests in Consolidated Financial Statements-an amendment of ARB No. 51 ("SFAS No. 160"). This statement amends ARB No. 51 to establishauthoritative guidance that modified accounting and reporting standards for the noncontrolling interest in a subsidiary and for the deconsolidation of a subsidiary.  The provisions of SFAS No. 160the guidance are effective for fiscal years, and interim periods within those fiscal years, beginning on or after December 15, 2008.  The Company does not believeadopted the adoption of SFAS No. 160 will have a material impact in the consolidated financial statements.

In February 2007, the FASB issued SFAS No. 159, The Fair Value Option for Financial Assets and Financial Liabilities ("SFAS No. 159").  SFAS No. 159 permits entities to choose to measure certain financial assets and liabilities at fair value.  Unrealized gains and losses on items for which the fair value option has been elected are reported in earnings.  SFAS No. 159 is effective for fiscal years beginning after November 15, 2007. The Company adopted SFAS No. 159guidance as of the beginning of the 20082009 fiscal year and its adoption did not have a material impact to the Company's consolidated financial statements.

Fair Value Measurements - In September 2006, the FASB issued SFAS No. 157, Fair Value Measurements ("SFAS No. 157"). This Statement definesauthoritative guidance which provides guidance on how to measure assets and liabilities at fair value.  The guidance applies whenever another U.S. GAAP standard requires (or permits) assets or liabilities to be measured at fair value establishes a framework for measuringbut does not expand the use of fair value to any new circumstances.  This standard also requires additional disclosures in generally accepted accounting principles ("GAAP"),both annual and expands disclosures about fair value measurements. The provisions of SFAS No. 157 are effective asquarterly reports.  Portions of the beginning of the firstguidance were effective for financial statements issued for fiscal year that beginsyears beginning after November 15, 2007.2007, and the Company began applying those provisions effective January 1, 2008.  The Company adopted SFAS No. 157 asadoption of the beginning of the 2008 fiscal year and its adoptionguidance did not have a materialsignificant impact toon the Company's consolidated financial statements.

36In February 2008, the FASB amended the scope of the original guidance to exclude accounting for leases, and other accounting standards that address fair value measurements for purposes of lease classification or measurement.  The scope of this exception does not apply to assets acquired and liabilities assumed in a business combination that are required to be measured at fair value.  Also, in February 2008, the FASB delayed the effective date of the aforementioned fair value guidance one year for all nonfinancial assets and nonfinancial liabilities, except those recognized at fair value in the financial statements on a recurring basis.  The Company adopted the remaining provisions as of January 1, 2009.  The adoption of the guidance did not have a significant impact on the Company's consolidated financial statements.


Uncertain Tax Positions - In JulyJune 2006, the FASB issued Interpretation No. 48, Accountingguidance for Uncertaintyaccounting for uncertainty in Income Taxes ("FIN 48").income taxes, which established a single model to address accounting for uncertain tax positions.  The Company was required to adopt the provisions of FIN 48,the new guidance, effective January 1, 2007.  As a result of this adoption, the Company recognized additional tax liabilities of $0.3 million with a corresponding reduction to beginning retained earnings as of January 1, 2007. As of January 1, 2007, the Company had a $2.8 million liability recorded for unrecognized tax benefits, which includes interest and penalties of $0.5 million. The Company recognizes interest and penalties accrued related to unrecognized tax benefits in tax expense.

INFLATION, NEW EMISSIONS CONTROL REGULATIONS, AND FUEL COSTS

Most of our operating expenses are inflation-sensitive, with inflation generally producing increased costs of operations.  During the past three years, the most significant effects of inflation have been on revenue equipment prices and fuel prices.  New emissions control regulations and increases in commodity prices, wages of manufacturing workers, and other items have resulted in higher tractor prices.  The cost of fuel also has risen substantially over the past three years, though prices have eased over the last 6six months.  Although we believe at least some of this increase primarily reflects world events rather than underlying inflationary pressure. We attemptpressure, we have attempted to limit the effects of inflation through increases in freight rates, certain cost control efforts and limiting the effects of fuel prices through fuel surcharges.

The engines used in our tractors are subject to emissions control regulations, which have substantially increased our operating expenses since additional and more stringent regulation began in 2002.  As of December 31, 2008, 36%2009, 82% of our tractor fleet has engines compliant with stricter regulations regarding emissions that became effective in 2007.  Compliance with such regulations is expected to increase the cost of new tractors and could impair equipment productivity, lower fuel mileage, and increase our operating expenses.  These adverse effects combined with the uncertainty as to the reliability of the vehicles equipped with the newly designed diesel engines and the residual values that will be realized from the disposition of these vehicles could increase our costs or otherwise adversely affect our business or operations as the regulations impact our business through new tractor purchases.

Fluctuations in the price or availability of fuel, as well as hedging activities, surcharge collection, the percentage of freight we obtain through brokers, and the volume and terms of diesel fuel purchase commitments may increase our costs of operation, which could materially and adversely affect our profitability.  We impose fuel surcharges on substantially all accounts.  These arrangements may not fully protect us from fuel price increases and also may result in us not receiving the full benefit of any fuel price decreases.  We currently do not have any fuel hedging contracts in place. If we do hedge, we may be forced to make cash payments under the hedging arrangements.  A small portionThe Company did not enter into any derivatives until the third quarter of 2009.  As of December 31, 2009, we entered into forward futures swap contracts, which pertain to 2.5 million gallons or approximately 4% percent of our projected January through December 2010 fuel requirements for 2008 were covered by volume purchase commitments. Based on current market conditions,requirements.  Under these contracts, we have decided to limit our hedgingpay a fixed rate per gallon of heating oil and purchase commitments, but we continue to evaluate such measures.receive the monthly average price of New York heating oil.  The absence of meaningful fuel price protection through these measures could adversely affect our profitability.

SEASONALITY

In the trucking industry, revenue generally decreases as customers reduce shipments during the winter holiday season and as inclement weather impedes operations.  At the same time, operating expenses generally increase, with fuel efficiency declining because of engine idling and weather, creating more equipment repairs.  For the reasons stated, first quarter net income historically has been lower than net income in each of the other three quarters of the year excluding charges.  Our equipment utilization typically improves substantially between May and October of each year because of the trucking industry's seasonal shortage of equipment on traffic originating in California and because of general increases in shipping demand during those months.  The seasonal shortage typically occurs between May and August because California produce carriers' equipment is fully utilized for produce during those months and does not compete for shipments hauled by our dry van operation.  During September and October, business generally increases as a result of increased retail merchandise shipped in anticipation of the holidays.

ITEM 7A.7A.QUANTITATIVE AND QUALITATIVE DISCLOSURES ABOUT MARKET RISK

We experience various market risks, including changes in interest rates and fuel prices.  We do not enter into derivatives or other financial instruments for trading or speculative purposes, or when there are no underlying related exposures.


COMMODITY PRICE RISK

From time-to-time weThe Company is subject to risks associated with the availability and price of fuel, which are subject to political, economic, and market factors that are outside of the Company's control.  We also may be adversely affected by the timing and degree of fluctuations in fuel prices.  The Company's fuel-surcharge program mitigates the effect of rising fuel prices but does not always result in fully recovering the increase in its cost of fuel.  In part, this is due to fuel costs that cannot be billed to customers, including costs such as those incurred in connection with empty and out-of-route miles or when engines are being idled during cold or warm weather and due to fluctuations in the price of fuel between the fuel surcharge's benchmark index reset.

The Company did not enter into derivative financial instrumentsany derivatives until the third quarter of 2009; however, in September 2009 we entered into forward futures swap contracts, which pertain to reduce2.5 million gallons or approximately 4% percent of our exposure toprojected January through December 2010 fuel requirements.  Under these contracts, we pay a fixed rate per gallon of heating oil and receive the monthly average price fluctuations. In accordance with SFAS 133, we adjust any derivative instruments to fair value through earningsof New York heating oil.  Given that the forward futures swap contracts are not significant, a one dollar change in the related price of heating oil or diesel would not have a material impact on a monthly basis. Asthe Company's results of December 31, 2008, we had no derivative financial instruments to reduce our exposure to fuel price fluctuations.operations.

INTEREST RATE RISK

Our market risk is also affected by changes in interest rates.  Historically, we have used a combination of fixed-rate and variable-rate obligations to manage our interest rate exposure.  Fixed-rate obligations expose us to the risk that interest rates might fall.  Variable-rate obligations expose us to the risk that interest rates might rise.

Ourraise.  Of our total $215.0 million of debt, we had $15.9 million of variable rate obligations consist of our Credit Agreement.  Borrowings under the Credit Agreement are classified as either "base rate loans" or "LIBOR loans".  Base rate loans accrued interest at a base rate equal to the Agent's prime rate plus an applicable margin that is adjusted quarterly between 0.625% and 1.375% based on average pricing availability. LIBOR loans accrued interest at LIBOR plus an applicable margin that is adjusted quarterly between 2.125% and 2.875% based on average pricing availability.  The applicable margin was 2.625%debt outstanding at December 31, 2008.  At December 31, 2008, we had $3.8 million in borrowings outstanding under the Credit Agreement.

On March 27, 2009, we obtained an amendment toincluding both our Credit Agreement, which, among other things, (i) retroactively to January 1, 2009 amended the fixed charge coverage ratio covenant for JanuaryFacility and February 2009 to the actual levels achieved, which cured our default of that covenant for January 2009, (ii) restarted the look back requirements of the fixed charge coverage ratio covenant beginning on March 1, 2009, (iii) increased the EBITDAR portion of the fixed charge coverage ratio definition by $3,000,000 for all periods between March 1 to December 31, 2009, (iv) increased the base ratea real-estate note.  The interest rates applicable to base rate loans to the greater ofthese agreements are based on either the prime rate or LIBOR.  Our earnings would be affected by changes in these short-term interest rates.  Risk can be quantified by measuring the federal funds rate plus 0.5%, or LIBOR plus 1.0%, (v) setfinancial impact of a LIBOR floor of 1.5%, (vi) increased the applicable margin for base rate loans to a range between 2.5% and 3.25% and for LIBOR loans to a range between 3.5% and 4.25%, with 3.0% (for base rate loans) and 4.0% (for LIBOR loans) to be used as the applicable margin through September 2009, (vii) increased our letter of credit facility fee by an amount corresponding to thenear-term adverse increase in the applicable margin, (viii) increased the unused line fee toshort-term interest rates.  At our current level of borrowing, a range between 0.5% and 0.75%, and (ix) increased the maximum number of field examinations per year from three to four.  Assuming variable rate borrowings under our Credit Agreement at December 31, 2008 levels, a one percentage point1% increase in our applicable rate would reduce annual pretax earnings by approximately $0.2 million.  Our remaining debt is effectively fixed rate debt, and therefore changes in market interest rates could increasedo not directly impact our annual interest expense by approximately $38,000.expense.

ITEM 8. 8.                     FINANCIAL STATEMENTS AND SUPPLEMENTARY DATA

The consolidated financial statements of Covenant Transportation Group, Inc. and subsidiaries, as of December 31, 20082009 and 2007,2008, and the related consolidated balance sheets, statements of operations, statements of stockholders' equity and comprehensive income,loss, and statements of cash flows for each of the years in the three-year period ended December 31, 2008,2009, together with the related notes, and the report of KPMG LLP, our independent registered public accounting firm for the years ended December 31, 2009, 2008, 2007, and 20062007 are set forth at pages 4447 through 6573 elsewhere in this report.

ITEM 9. 9.                     CHANGES IN AND DISAGREEMENTS WITH ACCOUNTANTS ON ACCOUNTING AND FINANCIAL DISCLOSURE

There has been no change in accountants during our three most recent fiscal years.

ITEM 9A(T).9A.                                CONTROLS AND PROCEDURES

Evaluation of Disclosure Controls and Procedures

We have established disclosure controls and procedures to ensure that material information relating to us and our consolidated subsidiaries is made known to the officers who certify our financial reports and to other members of senior management and the Board of Directors.


Based on their evaluation as of December 31, 2008,2009, our Chief Executive Officer and Chief Financial Officer have concluded that our disclosure controls and procedures (as defined in Rule 13a-15 and 15d-15 under the Exchange Act) are effective to ensure that the information required to be disclosed by us in the reports that we file or submit under the Exchange Act is recorded, processed, summarized, and reported within the time periods specified in SEC rules and forms.

Management's Annual Report on Internal Control Over Financial Reporting

Management is responsible for establishing and maintaining adequate internal control over financial reporting.  Internal control over financial reporting is defined in Rule 13a-15 promulgated under the Exchange Act as a process designed by, or under the supervision of, the principal executive and principal financial officers and effected by the board of directors, management and other personnel, to provide reasonable assurance regarding the reliability of financial reporting and the preparation of financial statements for external purposes in accordance with generally accepted accounting principles and includes those policies and procedures that:

pertain to the maintenance of records, that in reasonable detail, accurately and fairly reflect the transactions and dispositions of our assets;
provide reasonable assurance that transactions are recorded as necessary to permit preparation of financial statements in accordance with generally accepted accounting principles, and that our receipts and expenditures are being made only in accordance with authorizations of our management and directors; and
provide reasonable assurance regarding prevention or timely detection of unauthorized acquisition, use or, disposition of our assets that could have a material effect on our financial statements.

We have confidence in our internal controls and procedures.  Nevertheless, our management, including our Chief Executive Officer and Chief Financial Officer, does not expect that our disclosure procedures and controls or our internal controls will prevent all errors or intentional fraud.  An internal control system, no matter how well-conceived and operated, can provide only reasonable, not absolute, assurance that the objectives of such internal controls are met.  Further, the design of an internal control system must reflect the fact that there are resource constraints, and the benefits of controls must be considered relative to their costs.  Because of the inherent limitations in all internal control systems, no evaluation of controls can provide absolute assurance that all our control issues and instances of fraud, if any, have been detected.

Management assessed the effectiveness of our internal control over financial reporting as of December 31, 2008.2009.  In making this assessment, management used the criteria set forth by the Committee of Sponsoring Organizations of the Treadway Commission (COSO), an Internal Control-Integrated Framework.  Based on its assessment, management believes that, as of December 31, 2008,2009, our internal control over financial reporting is effective based on those criteria.

Attestation Report of Independent Registered Public Accounting Firm

This annual report does not include an attestation report of the company's registered public accounting firm regarding internal control over financial reporting.  Management's report was not subject to attestation by the company's registered public accounting firm pursuant to temporary rules of the Securities and Exchange Commission that permit the company to provide only management's report in this annual report.

Design and Changes in Internal Control over Financial Reporting

Disclosure controls and procedures are controls and other procedures that are designed to ensure that information required to be disclosed in our reports filed or submitted under the Exchange Act is recorded, processed, summarized, and reported within the time periods specified in the Securities and Exchange Commission's rules and forms.  In accordance with these controls and procedures, information is accumulated and communicated to management, including our Chief Executive Officer, as appropriate, to allow timely decisions regarding disclosures.  There were no changes in our internal control over financial reporting that occurred during the quarter ended December 31, 2008,2009, that have materially affected, or are reasonably likely to materially affect, our internal control over financial reporting.

ITEM 9B. 9B.OTHER INFORMATION

Not
Item 5.02Departure of Directors or Certain Officers; Election of Directors; Appointment of Certain Officers; Compensatory Arrangements of Certain Officers
On March 24, 2010, the Compensation Committee of the Board of Directors (the "Committee") of the Company approved revised performance-based bonus opportunities for the Company's senior management group (the "Program") under the Company's 2006 Omnibus Incentive Plan, as amended (the "Plan").

On September 14, 2009, the Committee previously approved consolidated operating income and operating ratio targets for the Program based upon a preliminary consolidated budget for 2010.  The Company's 2010 consolidated budget was finalized and the Committee reset the operating income and operating ratio targets to more difficult levels to achieve based upon the final budget.  Under the Program and consistent with the objectives of the Plan, certain employees, including the Company's named executive officers, may receive bonuses upon satisfaction of the revised consolidated operating income and operating ratio targets and the satisfaction of operating income and operating ratio targets established for the Company's subsidiaries (together, the "Performance Targets"), as applicable.  Each applicable Performance Target corresponds to a percentage bonus opportunity for the employee that is multiplied by the employee's base salary to determine the employee's bonus.  Pursuant to the Program, the performance-based bonus opportunities for David Parker, Joey Hogan, and Richard Cribbs, as named executive officers, will remain the same as previously reported, except that their bonus opportunities depend on the achievement of the revised consolidated Performance Targets.  The Company also finalized subsidiary budgets and the Committee approved the performance-based bonus opportunities for Tony Smith and James Brower, two of the Company's named executive officers.  Messrs. Smith and Brower may receive between 10% and 15% of their respective base salary based on the revised Performance Targets achieved for the consolidated group, if any, and between 40% and 60% of their base salary based on Performance Targets achieved for the Company's subsidiaries, SRT and Star, respectively, if any.

On March 24, 2010, the Committee also clarified that the number of restricted shares of the Company's Class A common stock granted as part of the January 12, 2010, incentive opportunity previously described in the Company's report on Form 8-K filed with the Commission on January 15, 2010, was based on the closing price of the Company's Class A common stock on the date the blackout period lifted following the release of the Company's 2009 year-end earnings, rather than the date the blackout period lifted following the release of the Company's 2010 first quarter earnings.


PART III

ITEM 10.10.DIRECTORS, EXECUTIVE OFFICERS, AND CORPORATE GOVERNANCE

We incorporate by reference the information respecting executive officers and directors set forth under the captions "Proposal 1 - Election of Directors", "Corporate Governance – Section 16(a) Beneficial Ownership Reporting Compliance", "Corporate Governance – Our Executive Officers", "Corporate Governance – Code of Conduct and Ethics", and "Corporate Governance – Committees of the Board of Directors – The Audit Committee" in our Proxy Statement for the 20082010 annual meeting of stockholders, which will be filed with the Securities and Exchange Commission in accordance with Rule 14a-6 promulgated under the Securities Exchange Act of 1934, as amended (the "Proxy Statement"); provided, that the section entitled "Corporate Governance – Committees of the Board of Directors – The Audit Committee – Report of the Audit Committee" contained in the Proxy Statement are not incorporated by reference.

ITEM 11.11.EXECUTIVE COMPENSATION

We incorporate by reference the information set forth under the sections entitled "Executive Compensation", "Corporate Governance – Committees of the Board of Directors – The Compensation Committee – Compensation Committee Interlocks and Insider Participation", and "Corporate Governance – Committees of the Board of Directors – The Compensation Committee –Compensation Committee Report" in our Proxy Statement for the 20082010 annual meeting of stockholders; provided, that the section entitled "Corporate Governance – Committees of the Board of Directors – The Compensation Committee – Compensation Committee Report" contained in the Proxy Statement is not incorporated by reference.

ITEM 12.12.SECURITY OWNERSHIP OF CERTAIN BENEFICIAL OWNERS AND MANAGEMENT AND RELATED STOCKHOLDER MATTERS

We incorporate by reference the information set forth under the section entitled "Security Ownership of Certain Beneficial Owners and Management" in the Proxy Statement.

Summary Description of Equity Compensation Plans Not Approved by Security Holders

Summary of 1998 (1998 Non-Officer Incentive Stock PlanPlan)

In October 1998, our Board of Directors adopted the Non-Officer Plan to attract and retain executive personnel and other key employees and motivate them through incentives that were aligned with our goals of increased profitability and stockholder value.  The Board of Directors authorized 200,000 shares of our Class A common stock for grants or awards pursuant to the Non-Officer Plan.  Awards under the Plan could be in the form of incentive stock options, non-qualified stock options, restricted stock awards, or any other awards of stock consistent with the Non-Officer Plan's purpose.  The Non-Officer Plan was to be administered by the Board of Directors or a committee that could be appointed by the Board of Directors.  All non-officer employees were eligible for participation, and actual participants in the Non-Officer Plan were selected from time-to-time by the administrator.  The administrator could substitute new stock options for previously granted options.  In conjunction with adopting the 2003 Plan, the Board of Directors voted to terminate the Non-Officer Plan effective as of May 31, 2003.  Option grants previously issued continue in effect and may be exercised on the terms and conditions under which the grants were made.

Summary of Grants Outside the Plan

On May 20, 1999, our Board of Directors approved the grant of an option to purchase 2,500 shares of our Class A common stock to each of our four outside directors. The exercise price of the stock was equal to the mean between the lowest reported bid price and the highest reported asked price on the date of the grant. The options have a term of ten years from the date of grant, and the options vested 20% on each of the first through fifth anniversaries of the grant.

ITEM 13.13.CERTAIN RELATIONSHIPS AND RELATED TRANSACTIONS, AND DIRECTOR INDEPENDENCE

We incorporate by reference the information set forth under the sections entitled "Corporate Governance – Board of Directors and Its Committees" and "Certain Relationships and Related Transactions" in the Proxy Statement.

ITEM 14.  14.PRINCIPAL ACCOUNTANT FEES AND SERVICES

We incorporate by reference the information set forth under the section entitled "Relationships with Independent Registered Public Accounting Firm – Principal Accountant Fees and Services" in the Proxy Statement.


PART IV

ITEM 15. 15.EXHIBITS AND FINANCIAL STATEMENT SCHEDULES

(a)1.Financial Statements. 
    
  Our audited consolidated financial statement isstatements are set forth at the following pages of this report: 
  ReportsReport of Independent Registered Public Accounting Firm – KPMG LLP47
  Consolidated Balance Sheets48
  Consolidated Statements of Operations49
  Consolidated Statements of Stockholders' Equity and Comprehensive Income (Loss)Loss50
  Consolidated Statements of Cash Flows51
  Notes to Consolidated Financial Statements52
    
 2.Financial Statement Schedules. 
    
  Financial statement schedules are not required because all required information is included in the financial statements. 
    
 3.Exhibits. 
    
  The exhibits required to be filed by Item 601 of Regulation S-K are listed under paragraph (b) below and on the Exhibit Index appearing at the end of this report.  Management contracts and compensatory plans or arrangements are indicated by an asterisk. 
    
(b) Exhibits. 
    
  The following exhibits are filed with this Form 10-K or incorporated by reference to the document set forth next to the exhibit listed below. 

Exhibit NumberDescription
3.1Amended and Restated Articles of Incorporation (Incorporated by reference to Exhibit 99.2 to the Company's Report on Form 8-K, filed May 29, 2007 (SEC Commission File No. 0-24960))
3.2Amended and Restated Bylaws, dated December 6, 2007 (Incorporated by reference to Exhibit 3.2 to the Company's Form 10-K, filed March 17, 2008 (SEC Commission File No. 0-24960))
4.1Amended and Restated Articles of Incorporation (Incorporated by reference to Exhibit 99.2 to the Company's Report on Form 8-K, filed May 29, 2007 (SEC Commission File No. 0-24960))
4.2Amended and Restated Bylaws, dated December 6, 2007 (Incorporated by reference to Exhibit 3.2 to the Company's Form 10-K, filed March 17, 2008 (SEC Commission File No. 0-24960))
10.1401(k) Plan (Incorporated by reference to Exhibit 10.10 to the Company's Form S-1, Registration No. 33-82978, effective October 28, 1994)
10.2Master Lease Agreement, dated April 15, 2003, between Transport International Pool, Inc. and Covenant Transport, Inc. (Incorporated by reference to Exhibit 10.4 to the Company's Form 10-Q/A, filed October 31, 2003 (SEC Commission File No. 0-24960))
10.3Form of Indemnification Agreement between Covenant Transport, Inc. and each officer and director, effective May 1, 2004 (Incorporated by reference to Exhibit 10.2 to the Company's Form 10-Q, filed August 5, 2004 (SEC Commission file No. 0-24960))*
#Purchase and Sale Agreement, dated April 3, 2006, between Covenant Transport, Inc., a Tennessee corporation, and CT Chattanooga TN, LLC
#Lease Agreement, dated April 3, 2006, between Covenant Transport, Inc., a Tennessee corporation, and CT Chattanooga TN, LLC
10.6Lease Guaranty, dated April 3, 2006, by Covenant Transport, Inc., a Nevada corporation, for the benefit of CT Chattanooga TN, LLC (Incorporated by reference to Exhibit 10.20 to the Company's Report on Form 8-K, filed April 7, 2006 (SEC Commission File. No. 0-24960))
10.7Form of Restricted Stock Award Notice under the Covenant Transport, Inc. 2006 Omnibus Incentive Plan (Incorporated by reference to Exhibit 10.22 to the Company's Form 10-Q, filed August 9, 2006 (SEC Commission File No. 0-24960))*
10.8Form of Restricted Stock Special Award Notice under the Covenant Transport, Inc. 2006 Omnibus Incentive Plan (Incorporated by reference to Exhibit 10.23 to the Company's Form 10-Q, filed August 9, 2006 (SEC Commission File No. 0-24960))*
10.9Form of Incentive Stock Option Award Notice under the Covenant Transport, Inc. 2006 Omnibus Incentive Plan (Incorporated by reference to Exhibit 10.24 to the Company's Form 10-Q, filed August 9, 2006 (SEC Commission File No. 0-24960))*
Exhibit
Number
ReferenceDescription
3.1(1)Amended and Restated Articles of Incorporation
3.2(8)Amended and Restated Bylaws dated December 6, 2007
4.1(1)Amended and Restated Articles of Incorporation
4.2(8)Amended and Restated Bylaws dated December 6, 2007
10.1(2)401(k) Plan, filed as Exhibit 10.10
10.2(3)Master Lease Agreement dated April 15, 2003, between Transport International Pool, Inc. and Covenant Transport, Inc., filed as Exhibit 10.4
10.3(4)Form of Indemnification Agreement between Covenant Transport, Inc. and each officer and director effective May 1, 2004, filed as Exhibit 10.2*
10.4(5)Purchase and Sale Agreement dated April 3, 2006, between Covenant Transport, Inc., a Tennessee corporation, and CT Chattanooga TN, LLC, filed as Exhibit 10.18
10.5(5)Lease Agreement dated April 3, 2006, between Covenant Transport, Inc., a Tennessee corporation, and CT Chattanooga TN, LLC, filed as Exhibit 10.19
10.6(5)Lease Guaranty dated April 3, 2006, by Covenant Transport, Inc., a Nevada corporation, for the benefit of CT Chattanooga TN, LLC, filed as Exhibit 10.20
10.7(6)Covenant Transport, Inc. 2006 Omnibus Incentive Plan*
10.8(7)Form of Restricted Stock Award Notice under the Covenant Transport, Inc. 2006 Omnibus Incentive Plan, filed as Exhibit 10.22*
10.9(7)Form of Restricted Stock Special Award Notice under the Covenant Transport, Inc. 2006 Omnibus Incentive Plan, filed as Exhibit 10.23*
10.10(7)Form of Incentive Stock Option Award Notice under the Covenant Transport, Inc. 2006 Omnibus Incentive Plan, filed as Exhibit 10.24*
10.11(9)Covenant Transport, Inc. 2008 Named Executive Bonus Program dated April 8, 2008, filed as Exhibit 10.1*
10.12(10)Form of Lease Agreement used in connection with Daimler Facility, filed as Exhibit 10.3.
10.13(10)Amendment to Lease Agreement (Open End) dated June 30, 2008, filed as Exhibit 10.4
10.14(10)Form of Direct Purchase Money Loan and Security Agreement used in connection with Daimler Facility, filed as Exhibit 10.5
10.15(10)Amendment to Direct Purchase Money Loan and Security Agreement dated June 30, 2008, filed as Exhibit 10.6


10.16(11)Third Amended and Restated Credit Agreement dated September 23, 2008 among Covenant Transportation Group, Inc., Covenant Transport, Inc., CTG Leasing Company, Covenant Asset Management, Inc., Southern Refrigerated Transport, Inc., Covenant Transport Solutions, Inc., Star Transportation, Inc., Bank of America, N.A., JPMorgan Chase Bank, N.A., and Textron Financial Corporation, filed as Exhibit 10.1
#List of Subsidiaries
#Consent of Independent Registered Public Accounting Firm – KPMG LLP
#Certification pursuant to Item 601(b)(31) of Regulation S-K, as adopted pursuant to Section 302 of the Sarbanes-Oxley Act of 2002, by David R. Parker, the Company's Chief Executive Officer
#Certification pursuant to Item 601(b)(31) of Regulation S-K, as adopted pursuant to Section 302 of the Sarbanes-Oxley Act of 2002, by Richard B. Cribbs, the Company's Chief Financial Officer
#Certification pursuant to 18 U.S.C. Section 1350, as adopted pursuant to Section 906 of the Sarbanes-Oxley Act of 2002, by David R. Parker, the Company's Chief Executive Officer
#Certification pursuant to 18 U.S.C. Section 1350, as adopted pursuant to Section 906 of the Sarbanes-Oxley Act of 2002, by Richard B. Cribbs, the Company's Chief Financial Officer
10.10Form of Lease Agreement used in connection with Daimler Facility (Incorporated by reference to Exhibit 10.3 to the Company's Form 10-Q, filed August 11, 2008 (SEC Commission File No. 0-24960))
10.11Amendment to Lease Agreement (Open End) (Incorporated by reference to Exhibit 10.4 to the Company's Form 10-Q, filed August 11, 2008 (SEC Commission File No. 0-24960))
10.12Form of Direct Purchase Money Loan and Security Agreement used in connection with Daimler Facility (Incorporated by reference to Exhibit 10.5 to the Company's Form 10-Q, filed August 11, 2008 (SEC Commission File No. 0-24960))
10.13Amendment to Direct Purchase Money Loan and Security Agreement (Incorporated by reference to Exhibit 10.6 to the Company's Form 10-Q, filed August 11, 2008 (SEC Commission File No. 0-24960))
#Third Amended and Restated Credit Agreement, dated September 23, 2008, among Covenant Transportation Group, Inc., Covenant Transport, Inc., CTG Leasing Company, Covenant Asset Management, Inc., Southern Refrigerated Transport, Inc., Covenant Transport Solutions, Inc., Star Transportation, Inc., Bank of America, N.A., JPMorgan Chase Bank, N.A., and Textron Financial Corporation
10.15Covenant Transportation Group, Inc. Amended and Restated 2006 Omnibus Incentive Plan (Incorporated by reference to Appendix A to the Company's Schedule 14A, filed April 10, 2009 (SEC Commission File No. 0-24960))*
10.16Amendment No. 1 to Third Amended and Restated Credit Agreement, dated March 27, 2009, among Covenant Transportation Group, Inc., Covenant Transport, Inc., CTG Leasing Company, Covenant Asset Management, Inc., Southern Refrigerated Transport, Inc., Covenant Transport Solutions, Inc., Star Transportation, Inc., Bank of America, N.A., JPMorgan Chase Bank, N.A., and Textron Financial Corporation (Incorporated by reference to Exhibit 10.1 to the Company's Form 10-Q, filed May 15, 2009 (SEC Commission File No. 0-24960))
10.17Description of Covenant Transportation Group, Inc. 2009 Voluntary Incentive Opportunity, dated March 31, 2009 (Incorporated by reference to Exhibit 10.2 to the Company's Form 10-Q, filed May 15, 2009 (SEC Commission File No. 0-24960))*
10.18Description of Covenant Transportation Group, Inc. 2009 Named Executive Officer Bonus Program, dated March 31, 2009 (Incorporated by reference to Exhibit 10.3 to the Company's Form 10-Q, filed May 15, 2009 (SEC Commission File No. 0-24960))*
#List of Subsidiaries
#Consent of Independent Registered Public Accounting Firm – KPMG LLP
#Certification pursuant to Item 601(b)(31) of Regulation S-K, as adopted pursuant to Section 302 of the Sarbanes-Oxley Act of 2002, by David R. Parker, the Company's Chief Executive Officer
#Certification pursuant to Item 601(b)(31) of Regulation S-K, as adopted pursuant to Section 302 of the Sarbanes-Oxley Act of 2002, by Richard B. Cribbs, the Company's Chief Financial Officer
#Certification pursuant to 18 U.S.C. Section 1350, as adopted pursuant to Section 906 of the Sarbanes-Oxley Act of 2002, by David R. Parker, the Company's Chief Executive Officer
#Certification pursuant to 18 U.S.C. Section 1350, as adopted pursuant to Section 906 of the Sarbanes-Oxley Act of 2002, by Richard B. Cribbs, the Company's Chief Financial Officer

References:

#Filed herewith
*Management contract or compensatory plan or arrangement.arrangement

All other footnotes indicate a document previously filed as an exhibit to and incorporated by reference from the following:

(1)Form 8-K, filed May 29, 2007 (SEC Commission File No. 0-24960)
(2)Form S-1, Registration No. 33-82978, effective October 28, 1994
(3)Form 10-Q/A, filed October 31, 2003 (SEC Commission File No. 0-24960)
(4)Form 10-Q, filed August 5, 2004 (SEC Commission File No. 0-24960)
(5)Form 8-K, filed April 7, 2006 (SEC Commission File No. 0-24960)
(6)Schedule 14A, filed April 17, 2006 (SEC Commission File No. 0-24960)
(7)Form 10-Q, filed August 9, 2006 (SEC Commission File No. 0-24960)
(8)Form 10-K, filed March 17, 2008 (SEC Commission File No. 0-24960)
(9)Form 10-Q, filed May 9, 2008 (SEC Commission File No. 0-24960)
(10)Form 10-Q, filed August 11, 2008 (SEC Commission File No. 0-24960)
(11)Form 10-Q, filed November 10, 2008 (SEC Commission File No. 0-24960)


Pursuant to the requirements of Section 13 or 15(d) of the Securities Exchange Act of 1934, the registrant has duly caused this report to be signed on its behalf by the undersigned, thereunto duly authorized.

 COVENANT TRANSPORTATION GROUP, INC.
  
  
Date:  March 31, 200930, 2010By:/s/   /s/Richard B. Cribbs
  Richard B. Cribbs
  Senior Vice President and Chief Financial Officer in his capacity as such and on behalf of the issuer.

Pursuant to the requirements of the Securities Exchange Act of 1934, this report has been signed below by the following persons on behalf of the registrant and in the capacities and on the dates indicated.

Signature and Title Date
   
/s/   /s/David R. Parker March 31, 200930, 2010
David R. Parker  
Chairman of the Board, President, and Chief Executive Officer
(principal executive officer)
  
   
/s/   /s/Richard B. Cribbs March 31, 200930, 2010
Richard B. Cribbs  
Senior Vice President and Chief Financial Officer
(principal financial and accounting officer)
  
   
/s/   /s/Bradley A. Moline March 31, 200930, 2010
Bradley A. Moline  
Director  
   
/s/   /s/William T. Alt March 31, 200930, 2010
William T. Alt  
Director  
   
/s/   /s/Robert E. Bosworth March 31, 200930, 2010
Robert E. Bosworth  
Director  
   
/s/   /s/Niel B. Nielson March 31, 200930, 2010
Niel B. Nielson  
Director  


The Board of Directors and Stockholders
Covenant Transportation Group, Inc.

We have audited the accompanying consolidated balance sheets of Covenant Transportation Group, Inc. and subsidiaries as of December 31, 20082009 and 2007,2008, and the related consolidated statements of operations, stockholders' equity and comprehensive loss, and cash flows for each of the years in the three-year period ended December 31, 2008.2009.  These consolidated financial statements are the responsibility of the Company's management.  Our responsibility is to express an opinion on these consolidated financial statements based on our audits.

We conducted our audits in accordance with the standards of the Public Company Accounting Oversight Board (United States).  Those standards require that we plan and perform the audit to obtain reasonable assurance about whether the financial statements are free of material misstatement.  An audit includes examining, on a test basis, evidence supporting the amounts and disclosures in the financial statements.  An audit also includes assessing the accounting principles used and significant estimates made by management, as well as evaluating the overall financial statement presentation.  We believe that our audits provide a reasonable basis for our opinion.

In our opinion, the consolidated financial statements referred to above present fairly, in all material respects, the financial position of Covenant Transportation Group, Inc. and subsidiaries as of December 31, 20082009 and 2007,2008, and the results of their operations and their cash flows for each of the years in the three-year period ended December 31, 2008,2009, in conformity with U.S. generally accepted accounting principles.

As discussed in Note 1 to the consolidated financial statements, the Company adoptedchanged the provisions of FASB Interpretation No. 48, Accountingmanner in which it accounted for Uncertainty in Income Taxes,tax uncertainties as of January 1, 2007.


KPMG LLP

/s/ KPMG LLP


Atlanta, Georgia
March 31, 200930, 2010


CONSOLIDATED BALANCE SHEETS
DECEMBER 31, 2008 AND 2007
(In thousands, except share data)
 
COVENANT TRANSPORTATION GROUP, INC. AND SUBSIDIARIES
DECEMBER 31, 2009 AND 2008
(In thousands, except share data)
COVENANT TRANSPORTATION GROUP, INC. AND SUBSIDIARIES
DECEMBER 31, 2009 AND 2008
(In thousands, except share data)
 
 2008  2007  2009  2008 
ASSETS            
Current assets:            
Cash and cash equivalents
 $6,300  $4,500  $12,221  $6,300 
Accounts receivable, net of allowance of $1,484 in 2008 and $1,537 in 2007
  72,635   79,207 
Drivers' advances and other receivables, net of allowance of $2,794 in 2008 and $2,706 in 2007
  6,402   5,479 
Accounts receivable, net of allowance of $1,845 in 2009 and $1,484
in 2008
  64,857   72,635 
Drivers' advances and other receivables, net of allowance of $2,608
in 2009 and $2,794 in 2008
  3,311   4,818 
Inventory and supplies
  3,894   4,102   4,004   3,894 
Prepaid expenses
  8,921   7,030   7,172   8,921 
Assets held for sale
  21,292   10,448   9,547   21,292 
Deferred income taxes
  7,129   18,484   458   7,129 
Income taxes receivable
  717   7,500   257   717 
Total current assets  127,290   136,750   101,827   125,706 
                
Property and equipment, at cost  352,857   350,158   399,712   352,857 
Less: accumulated depreciation and amortization  (116,839)  (102,628)  (121,377)  (116,839)
Net property and equipment
  236,018   247,530   278,335   236,018 
                
Goodwill  11,539   36,210   11,539   11,539 
Other assets, net  18,829   19,304   6,611   20,413 
                
Total assets $393,676  $439,794  $398,312  $393,676 
LIABILITIES AND STOCKHOLDERS' EQUITY                
Current liabilities:                
Securitization facility
 $-  $47,964 
Checks outstanding in excess of bank balances
  85   4,572  $4,838  $85 
Current maturities of acquisition obligation
  250   333   -   250 
Accounts payable
  7,528   8,235 
Accrued expenses
  26,789   24,979 
Current maturities of long-term debt
  59,083   2,335   67,365   59,083 
Accounts payable and accrued expenses
  33,214   35,029 
Current portion of capital lease obligations
  1,098   - 
Current portion of insurance and claims accrual
  16,811   19,827   12,055   16,811 
Total current liabilities  109,443   110,060   119,673   109,443 
                
Long-term debt
  107,956   86,467   134,084   107,956 
Insurance and claims accrual, net of current portion
  15,869   10,810 
Long-term portion of capital lease obligations
  12,472   - 
Insurance and claims accrual
  11,082   15,869 
Deferred income taxes
  39,669   57,902   24,525   39,669 
Other long-term liabilities
  1,919   2,289   1,801   1,919 
Total liabilities  274,856   267,528   303,637   274,856 
                
Commitments and contingent liabilities  -   -   -   - 
                
Stockholders' equity:                
Class A common stock, $.01 par value; 20,000,000 shares authorized;
13,469,090 shares issued; 11,699,182 and 11,676,298
outstanding as of December 31, 2008 and 2007, respectively
  135   135 
Class A common stock, $.01 par value; 20,000,000 shares authorized;
13,469,090 shares issued; 11,840,568 and 11,699,182 outstanding as of
December 31, 2009 and 2008, respectively
  136   135 
Class B common stock, $.01 par value; 5,000,000 shares authorized;
2,350,000 shares issued and outstanding
  24   24   24   24 
Additional paid-in-capital
  91,912   92,238   90,679   91,912 
Treasury stock at cost; 1,769,908 and 1,792,792 shares as of December 31,
2008 and 2007, respectively
  (21,007)  (21,278)
Treasury stock at cost; 1,628,522 and 1,769,908 shares as of
December 31, 2009 and 2008, respectively
  (19,195)  (21,007)
Accumulated other comprehensive income
  305   - 
Retained earnings
  47,756   101,147   22,726   47,756 
Total stockholders' equity  118,820   172,266   94,675   118,820 
Total liabilities and stockholders' equity $393,676  $439,794  $398,312  $393,676 
        
The accompanying notes are an integral part of these consolidated financial statements.


CONSOLIDATED STATEMENTS OF OPERATIONS
YEARS ENDED DECEMBER 31, 2008, 2007, AND 2006
(In thousands, except per share data)
 
COVENANT TRANSPORTATION GROUP, INC. AND SUBSIDIARIES
YEARS ENDED DECEMBER 31, 2009, 2008, AND 2007
(In thousands, except per share data)
COVENANT TRANSPORTATION GROUP, INC. AND SUBSIDIARIES
YEARS ENDED DECEMBER 31, 2009, 2008, AND 2007
(In thousands, except per share data)
 
 2008  2007  2006  2009  2008  2007 
Revenues                  
Freight revenue
 $615,810  $602,629  $572,239  $520,495  $615,810  $602,629 
Fuel surcharge revenue
  158,104   109,897   111,589   68,192   158,104   109,897 
Total revenue $773,914  $712,526  $683,828  $588,687  $773,914  $712,526 
                        
Operating expenses:                        
Salaries, wages, and related expenses
  263,793   270,435   262,303   216,158   263,793   270,435 
Fuel expense
  260,704   211,022   194,355   143,835   260,704   211,022 
Operations and maintenance
  42,459   40,437   36,112   35,409   42,459   40,437 
Revenue equipment rentals and purchased transportation
  90,974   66,515   63,532   76,484   90,974   66,515 
Operating taxes and licenses
  13,078   14,112   14,516   12,113   13,078   14,112 
Insurance and claims
  37,578   36,391   34,104   31,955   37,578   36,391 
Communications and utilities
  6,702   7,377   6,727   5,740   6,702   7,377 
General supplies and expenses
  26,399   23,377   21,387   23,593   26,399   23,377 
Depreciation and amortization, including gains and losses on
disposition of equipment and impairment of assets (1)
  63,235   53,511   41,150   48,122   63,235   53,541 
Goodwill impairment charge
  24,671   -   -   -   24,671   - 
Total operating expenses  829,593   723,207   674,186   593,409   829,593   723,207 
Operating income (loss)  (55,679)  (10,681)  9,642 
Operating loss  (4,722)  (55,679)  (10,681)
Other (income) expenses:                        
Interest expense
  10,373   12,285   7,166   14,184   10,373   12,285 
Interest income
  (435)  (477)  (568)  (144)  (435)  (477)
Loss on early extinguishment of debt
  726   -   -   -   726   - 
Loss on sale of Transplace investment and note receivable
  11,485   -   - 
Other
  (160)  (183)  (157)  (199)  (160)  (183)
Other expenses, net  10,504   11,625   6,441   25,326   10,504   11,625 
Income (loss) before income taxes  (66,183)  (22,306)  3,201 
Income tax expense (benefit)  (12,792)  (5,580)  4,582 
Loss before income taxes  (30,048)  (66,183)  (22,306)
Income tax benefit  (5,018)  (12,792)  (5,580)
Net loss $(53,391) $(16,726) $(1,381) $(25,030) $(53,391) $(16,726)

(1)Includes a $15,791 pre-tax impairment charge related to revenue equipment in 2008 and a $1,665 pre-tax impairment charge related to an airplane in 2007.

Loss per share:                  
Basic and diluted loss per share: $(3.80) $(1.19) $(0.10) $(1.77) $(3.80) $(1.19)
                        
Basic and diluted weighted average shares outstanding  14,038   14,018   13,996   14,124   14,038   14,018 

The accompanying notes are an integral part of these consolidated financial statements.

AND COMPREHENSIVE INCOME (LOSS)LOSS
FOR THE YEARS ENDED DECEMBER 31, 2009, 2008, 2007, AND 20062007
(In thousands)

  Common Stock  Additional Paid-  
 
Treasury
  
 
Accumulated
Other
Comprehensive
  
 
Retained
  
 
Total
Stockholders'
 
  Class A  Class B   In Capital   Stock   Income   Earnings   Equity 
                      
Balances at December 31, 2006 $135  $24  $92,053  $(21,582) $-  $118,214  $188,844 
                             
Stock-based employee compensation cost  -   -   189   -   -   -   189 
                             
Cumulative impact of change in accounting for uncertainties income taxes (See Note 1)  -   -   -   -   -   (341)  (341)
                             
Issuance of restricted stock to non-employee directors from treasury stock  -   -   (4)  304   -   -   300 
                             
Net loss and comprehensive loss  -   -   -   -   -   (16,726)  (16,726)
                             
Balances at December 31, 2007 $135  $24  $92,238  $(21,278) $-  $101,147  $172,266 
                             
Reversal of previously recognized stock-based compensation cost  -   -   (414)  -   -   -   (414)
                             
Stock-based employee compensation cost  -   -   260   -   -   -   260 
                             
Issuance of restricted stock to non-employee directors from treasury stock  -   -   (172)  271   -   -   99 
                             
Net loss and comprehensive loss  -   -   -   -   -   (53,391)  (53,391)
                             
Balances at December 31, 2008 $135  $24  $91,912  $(21,007) $-  $47,756  $118,820 
                             
Net loss  -   -   -   -   -   (25,030)  (25,030)
                             
Other comprehensive loss:                            
                             
    Unrealized gain on effective portion of fuel hedge, net of tax of $191  -   -   -   -   305   -   305 
                             
Comprehensive loss  -   -   -   -   305   (25,030)  (24,725)
                             
Issuance of restricted stock to non-employee directors from treasury stock  -   -   (375)  475   -   -   100 
                             
Stock-based employee compensation cost  -   -   595   -   -   -   595 
                             
Issuance of restricted stock to employees from treasury stock, net of shares repurchased to satisfy minimum withholding requirements  1   -   (1,453)  1,337   -   -   (115)
                             
Balances at December 31, 2009 $136  $24  $90,679  $(19,195) $305  $22,726  $94,675 
  Common Stock  
Additional
Paid-In
Capital
  
Treasury
Stock
  
Retained
Earnings
  
Total
Stockholders'
Equity
  
Comprehensive
Income (Loss)
 
  Class A  Class B                
                      
Balances at December 31, 2005 $134  $24  $91,553  $(21,582) $119,595  $189,724    
                            
                            
Exercise of employee stock options  1   -   245   -   -   246    
                            
Income tax benefit arising from the
exercise of stock options
  -   -   17   -   -   17    
                            
SFAS No. 123R stock-based employee
compensation cost
  -   -   238   -   -   238    
                            
Net loss  -   -   -   -   (1,381)  (1,381)  (1,381)
                             
Comprehensive loss for 2006                         $(1,381)
                             
Balances at December 31, 2006 $135  $24  $92,053  $(21,582) $118,214  $188,844     
                             
SFAS No. 123R stock-based employee
compensation cost
  -   -   189   -   -   189     
                             
Cumulative impact of change in
accounting for uncertainties in
income taxes (FIN 48 – See Note 10)
  -   -   -   -   (341)  (341)    
                             
Issuance of restricted stock to non-
employee directors from treasury
stock
  -   -   (4)  304   -   300     
                             
Net loss  -   -   -   -   (16,726)  (16,726)  (16,726)
                             
Comprehensive loss for 2007                         $(16,726)
                             
Balances at December 31, 2007 $135  $24  $92,238  $(21,278) $101,147  $172,266     
                             
Reversal of previously recognized
SFAS No. 123R stock-based
employee compensation cost
  -   -   (414)  -   -   (414)    
                             
SFAS No. 123R stock-based employee
compensation cost
  -   -   260   -   -   260     
                             
Issuance of restricted stock to non-
employee directors from treasury
stock
  -   -   (172)  271   -   99     
                             
Net loss  -   -   -   -   (53,391)  (53,391)  (53,391)
                             
Comprehensive loss for 2008                         $(53,391)
                             
Balances at December 31, 2008 $135  $24  $91,912  $(21,007) $47,756  $118,820     

The accompanying notes are an integral part of these consolidated financial statements.statements.


FOR THE YEARS ENDED DECEMBER 31, 2009, 2008, 2007, AND 20062007
(In thousands)
 2008  2007  2006  2009  2008  2007 
Cash flows from operating activities:                  
Net loss $(53,391) $(16,726) $(1,381) $(25,030) $(53,391) $(16,726)
Adjustments to reconcile net loss to net cash provided by operating activities:                        
Provision for losses on accounts receivable
  987   1,163   590   1,727   987   1,163 
Loss on early extinguishment of debt
  726   -   -   -   726   - 
Depreciation and amortization, including impairment charges
  85,960   51,801   43,234 
Depreciation and amortization, including impairment of
property and equipment
  47,987   61,289   51,801 
Impairment of goodwill
  -   24,671   - 
Amortization of deferred financing fees
  405   281   -   851   405   281 
Loss on sale of Transplace investment and note receivable
  11,485   -   - 
Gain on ineffective portion of fuel hedge
  (31)  -   - 
Deferred income taxes (benefit)
  (2,456)  4,414   3,660   (8,664)  (2,456)  4,414 
Loss (gain) on disposition of property and equipment
  1,946   1,741   (2,071)
Non-cash stock compensation (reversal), net
  (55)  489   239 
Changes in operating assets and liabilities, net of effects from purchase of Star Transportation, Inc.:            
Loss on disposition of property and equipment
  135   1,946   1,741 
Stock-based compensation expense (reversal), net
  695   (55)  489 
Changes in operating assets and liabilities:            
Receivables and advances
  7,023   (7,631)  14,449   9,948   7,023   (7,631)
Prepaid expenses and other assets
  (1,709)  4,386   6,295   1,545   (1,709)  4,386 
Inventory and supplies
  286   865   (283)  (110)  286   865 
Insurance and claims accrual
  2,044   (7,462)  (6,255)  (9,543)  2,044   (7,462)
Accounts payable and accrued expenses
  (1,458)  400   2,187   (97)  (1,458)  400 
Net cash flows provided by operating activities  40,308   33,721   60,664   30,898   40,308   33,721 
                        
Cash flows from investing activities:                        
Acquisition of property and equipment
  (89,024)  (64,261)  (162,750)  (113,063)  (89,024)  (64,261)
Proceeds from disposition of property and equipment
  26,711   53,486   71,652   50,305   26,711   53,486 
Proceeds from building sale leaseback
  -   -   29,630 
Payment of acquisition obligation
  (333)  (333)  (83)  (250)  (333)  (333)
Purchase of Star Transportation, Inc., net of cash acquired
  -   -   (39,061)
Net cash flows used in investing activities  (62,646)  (11,108)  (100,612)  (63,008)  (62,646)  (11,108)
                        
Cash flows from financing activities:                        
Exercise of stock options
  -   -   246 
Excess tax benefits from exercise of stock options
  -   -   17 
Proceeds from disposition of interest rate hedge
  -   -   175 
Repurchase of company stock
  (115)  -   - 
Proceeds from borrowings under revolving credit facility, net
  8,879   (71,193)  (29,900)
Repayments of capital lease obligation
  (298)  -   - 
Change in checks outstanding in excess of bank balances
  (4,487)  292   4,280   4,753   (4,487)  292 
Proceeds from issuance of debt
  450,896   62,839   167,188 
Repayments of debt
  (420,394)  (85,954)  (129,768)
Proceeds from issuance of notes payable
  95,592   188,455   14,339 
Repayments of notes payable
  (70,219)  (38,796)  (537)
Repayments of securitization facility, net
  -   (47,964)  (7,017)
Debt refinancing costs
  (1,877)  (697)  (401)  (561)  (1,877)  (697)
Net cash flows provided by/(used in) financing activities  24,138   (23,520)  41,737   38,031   24,138   (23,520)
                        
Net change in cash and cash equivalents  1,800   (907)  1,789   5,921   1,800   (907)
                        
Cash and cash equivalents at beginning of year $4,500   5,407   3,618   6,300   4,500   5,407 
Cash and cash equivalents at end of year $6,300  $4,500  $5,407  $12,221  $6,300  $4,500 
                        
Supplemental disclosure of cash flow information:                        
Cash paid (received) during the year for:
                        
Interest, net of capitalized interest
 $9,296  $11,969  $7,486  $13,016  $9,296  $11,969 
Income taxes
 $(12,480) $(11,287) $1,485  $239  $(12,480) $(11,287)
Equipment purchased under capital leases
 $14,000   -   - 
Non-cash change in variable rate real-estate note
 $157   -   - 
Accrued property additions
 $811   -   - 

The accompanying notes are an integral part of these consolidated financial statements.


DECEMBER 31, 2009, 2008 2007 AND 20062007


1.           SUMMARY OF SIGNIFICANT ACCOUNTING POLICIES

Nature of Business and Segments

Covenant Transportation Group, Inc., a Nevada holding company, together with its wholly-owned subsidiaries offers truckload transportation and brokerage services to customers throughout the continental United States.

We have two reportable segments: Asset-Based Truckload Services ("Truckload") and our Brokerage Services, also known as Covenant Transport Solutions, Inc. ("Solutions").

The Truckload segment consists of three asset-based operating fleets that are aggregated because they have similar economic characteristics and meet the aggregation criteria.  The three operating fleets that comprise our Truckload segment are as follows: (i) Covenant Transport, Inc., our historical flagship operation, which provides expedited long haul, dedicated, and regional solo-driver service; (ii) Southern Refrigerated Transportation, Inc., or SRT, which provides primarily long-haul and regional temperature-controlled service; and (iii) Star Transportation, Inc., which provides regional solo-driver service.

The Solutions segment provides freight brokerage service directly and through freight brokerage agents who are paid a commission for the freight they provide.  The brokerage operation has helped us continue to serve customers when we lacked capacity in a given area or when the load has not met the operating profile of our Truckload segment.

Principles of Consolidation

The consolidated financial statements include the accounts of Covenant Transportation Group, Inc., a holding company incorporated in the state of Nevada in 1994, and its wholly-owned subsidiaries: Covenant Transport, Inc., a Tennessee corporation; ("Covenant"); Southern Refrigerated Transport, Inc., an Arkansas corporation; ("SRT"); Star Transportation, Inc., a Tennessee corporation; ("Star"); Covenant Transport Solutions, Inc., a Nevada corporation; ("Solutions");Covenant Logistics, Inc., a Nevada corporation; Covenant Asset Management, Inc., a Nevada corporation; CTG Leasing Company, a Nevada corporation, and Volunteer Insurance Limited, a Cayman Islands company; ("Volunteer").company.  Covenant.com, Inc. and CIP, Inc., both of which were Nevada corporations, were dissolved effective December 31, 2007, and Harold Ives Trucking Co., an Arkansas corporation; ("Harold Ives")corporation, was dissolved effective July 7, 2008.  On May 7, 2008, we formed a new subsidiary, CTG Leasing Company, a Nevada corporation ("CTGL").  In September 2008, CVTI Receivables Corp. ("CRC") ceased to exist by virtue of its merger with and into Covenant Transportation Group, Inc., with the Company as the surviving entity.

References in this report to "it," "we," "us," "our," the "Company," and similar expressions refer to Covenant Transportation Group, Inc. and its wholly owned subsidiaries.  All significant intercompany balances and transactions have been eliminated in consolidation.

Revenue Recognition

Revenue,In our Truckload segment, revenue, drivers' wages, and other direct operating expenses are recognized on the date shipments are delivered to the customer.  Revenue includes transportation revenue, fuel surcharges, loading and unloading activities, equipment detention, and other accessorial services.

Revenue generated by our Solutions reportable segment is recognized upon completion of the services provided.  Revenue is recorded on a gross basis, without deducting third party purchased transportation costs, as we act as a principal with substantial risks as primary obligor, except for transactions whereby equipment from our Truckload segment perform the related services, which we record on a net basis in accordance with the related authoritative guidance.

Estimates

The preparation of financial statements in conformity with accounting principles generally accepted in the United States of America requires management to make estimates and assumptions that affect the reported amounts of assets and liabilities and disclosure of contingent assets and liabilities at the date of the financial statements and the reported amounts of revenues and expenses during the reporting periods.  Actual results could differ from those estimates.  Significant items subject to such estimates and assumptions include the useful lives of fixed assets; allowances for doubtful accounts; the valuation of deferred tax assets, fixed assets, note receivable and share-based compensation; reserves for income tax uncertainties and other contingencies.  The current economic environment has increased the degree of uncertainty inherent in those estimates and assumptions.

Cash and Cash Equivalents

The Company considers all highly liquid investments with a maturity of three months or less at acquisition to be cash equivalents.  At December 31, 2008, we had checks outstandingAdditionally, the Company is also subject to concentrations of credit risk related to deposits in banks in excess of cash balances for our primary disbursement accounts totaling $0.1 million, which is recorded in current liabilities on our consolidated balance sheets.the Federal Deposit Insurance Corporation limits.

ConcentrationsAccounts Receivable and Concentration of Credit Risk

The Company extends credit to its customers in the normal course of business.  The Company performs ongoing credit evaluations of our customers and generally does not require collateralcollateral.  Trade accounts receivable are recorded at their invoiced amounts, net of allowance for doubtful accounts.  The Company evaluates the adequacy of its allowance for doubtful accounts receivable.quarterly.  Accounts outstanding longer than contractual payment terms are considered past due and are reviewed individually for collectability.  The Company maintains reserves which management believes are adequate to provide for potential credit losses. The Company'slosses based upon its loss history and specific receivables aging analysis.  Receivable balances are written off when collection is deemed unlikely.

Accounts receivable are comprised of a diversified customer base spans the continental United States with a diversity that results in a lack of a concentration of credit risk forrisk.  During 2009, 2008, and 2007, the Company's top ten customers generated 26%, 20%, and 22% of total revenue, respectively.  During the three year period ended December 31, 2008.2009, no single customer represented more than 10% of total revenue.  The carrying amount reported in the balance sheet for accounts receivable approximates fair value based on the fact that the receivables collection averaged approximately 40 days from the billing date.

The following table provides a summary of the activity in the allowance for doubtful accounts for 2009, 2008, and 2007:

 
Years ended December 31:
 
Beginning
balance
January 1,
  
Additional
provisions
to allowance
  
Write-offs
and other
deductions
  
Ending
balance
December 31,
 
             
2009 $1,484  $1,727  $1,366  $1,845 
                 
2008 $1,537  $987  $1,040  $1,484 
                 
2007 $1,491  $1,163  $1,117  $1,537 

Inventories and supplies

Inventories and supplies consist of parts, tires, fuel, and supplies.  Tires on new revenue equipment are capitalized as a component of the related equipment cost when the tractor or trailer is placed in service and recovered through depreciation over the life of the vehicle.  Replacement tires and parts on hand at year end are recorded at the lower of cost or market with cost determined using the first-in, first-out (FIFO) method.  Replacement tires are expensed when placed in service.


Assets Held for Sale

Assets held for sale include property and revenue equipment no longer utilized in continuing operations which is available and held for sale.  Assets held for sale are no longer subject to depreciation, and are recorded at the lower of depreciated book value plus the related costs to sell or fair market value less selling costs.  The Company periodically reviews the carrying value of these assets for possible impairment. The Company expects to sell the majority of these assets within twelve months. During 2008, due to the softening of the market for used revenue equipment, the Company recorded a $6.4 million asset impairment charge ($1.2 million was recorded in the third quarter and $5.2 million was recorded in the fourth quarter) to write down the carrying values of tractors and trailers held for sale and tractors and trailers that are in use and are expected to be traded or sold in 2009.

Property and Equipment

Property and equipment is stated at cost less accumulated depreciation.  Depreciation for book purposes is determined using the straight-line method over the estimated useful lives of the assets.assets, while depreciation for tax purposes is generally recorded using an accelerated method.  Depreciation of revenue equipment is the Company's largest item of depreciation.  The Company generally depreciates new tractors (excluding day cabs) over five years to salvage values of 7%5% to 26%31% and new trailers over seven to ten years to salvage values of 22%26% to 39%43%.  The Company annually reviews the reasonableness of its estimates regarding useful lives and salvage values of its revenue equipment and other long-lived assets based upon, among other things, its experience with similar assets, conditions in the used revenue equipment market, and prevailing industry practice.  Changes in the useful life or salvage value estimates, or fluctuations in market values that are not reflected in the Company's estimates, could have a material effect on its results of operations.  Gains and losses on the disposal of revenue equipment are included in depreciation expense in the consolidated statements of operations.

Impairment of Long-Lived Assets and Asset Impairment

The Company accountsRevenue equipment, including assets held for impairments of long-livedsale, and definite-lived intangible assets subject to amortization and depreciation in accordance with Statement of Financial Accounting Standards ("SFAS") No. 144, Accounting for Impairment or Disposal of Long-Lived Assets. As such, revenue equipment and other long-lived assets are tested for impairment whenever events or circumstances indicate an impairment may exist.  Expected future cash flows are used to analyze whether an impairment has occurred.  If the sum of expected undiscounted cash flows is less than the carrying value of the long-lived asset, then an impairment loss is recognized.  The Company measures the impairment loss by comparing the fair value of the asset to its carrying value.  Fair value is determined based on a discounted cash flow analysis or the appraised value of the assets, as appropriate. The Company recorded impairment charges in 2008 and in 2007. During 2008, due to the softening of the market for used revenue equipment, the Company recorded a $15.8 million asset impairment charge ($1.2 million was recorded in the third quarter and $14.6 million was recorded in the fourth quarter) to write down the carrying values of tractors and trailers held for sale expected to be traded or sold in 2009 and tractors in use expected to be traded or sold in 2009 or 2010.  During 2007, related to the Company's decision to sell its corporate aircraft, the Company recorded an impairment charge of $1.7 million, reflecting the unfavorable market value of the airplane as compared to the combination of the estimated payoff of the long-term operating lease and current net book value of related airplane leasehold improvements. The sale of the airplane was completed in December 2007.

Accounting for Business Combinations

In accordance with business combination accounting, the Company allocates the purchase price of acquired companies to the tangible and intangible assets acquired, and liabilities assumed based on their estimated fair values. The Company engages third-party appraisal firms to assist management in determining the fair values of certain assets acquired. Such valuations require management to make significant estimates and assumptions, especially with respect to intangible assets. Management makes estimates of fair value based upon historical experience, as well as information obtained from the management of the acquired companies and are inherently uncertain. Unanticipated events and circumstances may occur which may affect the accuracy or validity of such assumptions, estimates or actual results. In certain business combinations that are treated as a stock purchase for income tax purposes, the Company must record deferred taxes relating to the book versus tax basis of acquired assets and liabilities. Generally, such business combinations result in deferred tax liabilities as the book values are reflected at fair values whereas the tax basis is carried over from the acquired company.  Such deferred taxes are initially estimated based on preliminary information and are subject to change as valuations and tax returns are finalized.


Goodwill and Other Intangible Assets

SFAS No. 142, Goodwill and Other Intangible Assets, requires companies toWe evaluate goodwill and other intangible assets with indefinite useful lives for impairment on an annual basis,basis.  Pursuant to applicable accounting standards, we classify intangible assets into two categories: (i) intangible assets with any resultingdefinite lives subject to amortization and (ii) goodwill, noting we have no indefinite lived intangible assets.  As discussed above, we test intangible assets with definite lives for impairment losses being recorded asif conditions exist that indicate the carrying value may not be recoverable.  Such conditions may include an economic downturn in a component of income from operationsgeographic market or a change in the consolidated statementsassessment of future operations. In 2008,

We test goodwill for impairment at least annually or more frequently if events or circumstances indicate that such intangible assets or goodwill might be impaired.  We perform our impairment tests of goodwill at the Company conductedreporting unit level.  The Company's reporting units are its subsidiaries.  Such impairment tests for goodwill impairment testing in lightinclude comparing the fair value of the diminishedrespective reporting unit with its carrying value, including goodwill.  We use a variety of methodologies in conducting these impairment tests, including discounted cash flow analyses and market conditions and declining market outlook for its Star Transportation operating subsidiary, which was acquired in September of 2006. The Company identified and indication of potential impairment and engaged an independent third party to assist in the completion of valuations used in the impairment testing process.  The completion of this work concluded that the goodwill previously recorded for the Star acquisition was fully impaired and resulted in a $24.7 million, non-cash goodwill impairment charge recorded in the fourth quarter of 2008.  There was no tax benefit associated with this nondeductible charge.analyses.

OtherWe determine the useful lives of our identifiable intangible assets are amortized over their estimated lives. Non-compete agreements are amortized byafter considering the straight-line method overspecific facts and circumstances related to each intangible asset.  Factors we consider when determining useful lives include the lifecontractual term of any agreement, the history of the agreements, acquired tradenames are amortized byasset, the straight-line method overCompany's long-term strategy for the expecteduse of the asset, any laws or other local regulations which could impact the useful life of the tradename, acquired customer relationshipsasset, and other economic factors, including competition and specific market conditions.  Intangible assets that are deemed to have definite lives are amortized, by an accelerated method basedgenerally on the estimated future cash inflowsa straight-line basis, over their useful lives, ranging from 4 to be generated by such customers and deferred loan costs are amortized over the life of the loan.20 years.

Insurance and Other Claims

The primary claims arising against the Company consist of cargo, liability, personal injury, property damage, workers' compensation, and employee medical expenses.  The Company's insurance program involves self-insurance with high risk retention levels.  Because of the Company's significant self-insured retention amounts, it has exposure to fluctuations in the number and severity of claims and to variations between its estimated and actual ultimate payouts.  The Company accrues the estimated cost of the uninsured portion of pending claims.  Its estimatesEstimates require judgments concerning the nature and severity of the claim, historical trends, advice from third-party administrators and insurers, the size of any potential damage award based on factors such as the specific facts of individual cases, the jurisdictions involved, the prospect of punitive damages, future medical costs, and inflation estimates of future claims development, and the legal and other costs to settle or defend the claims.  The Company has significant exposure to fluctuations in the number and severity of claims.  If there is an increase in the frequency and severity of claims, or the Company is required to accrue or pay additional amounts if the claims prove to be more severe than originally assessed, or any of the claims would exceed the limits of its insurance coverage, its profitability would be adversely affected.

In addition to estimates within the Company's self-insured retention layers, it also must make judgments concerning its aggregate coverage limits.  If any claim occurrence werewas to exceed the Company's aggregate coverage limits, it would have to accrue for the excess amount.  The Company's critical estimates include evaluating whether a claim may exceed such limits and, if so, by how much.  Currently, the Company is not aware of any such claims.  If one or more claims were to exceed the Company's then effective coverage limits, its financial condition and results of operations could be materially and adversely affected.

In general for casualty claims, we currently have insurance coverage up to $50.0 million per claim.  We renewed our casualty program as of February 28, 2008.  For the years ended December 31, 2008 and 2007, we wereare self-insured on an occurrence/per claim basis for personal injury and property damage claims for amounts up to the first $4.0 million, except for Star where we currently have insurance coverage up to $2.0 million per claim after the first $0.3 million for which we are self-insured. We are self-insured on an occurrence/per claim basis for workers' compensation up to the first $1.25 million.  The Company is completely self-insured for physical damage to its own tractors and trailers and is generally completely self-insured for damages to the cargo we haul.  The Company also maintains a self-insured group medical plan for its employees with annual per individual claimant stop-loss deductible of $0.4 million with a maximum lifetime benefit of $0.7 million.

Insurance and claims expense varies based on the frequency and severity of claims, the premium expense, the level of self-insured retention, the development of claims over time, and other factors.  With our significant self-insured retention, insurance and claims expense may fluctuate significantly from period to period, and any increase in frequency or severity of claims could adversely affect our financial condition and results of operations.

Interest

The Company maintains a workers' compensation plancapitalizes interest on major projects during construction.  Interest is capitalized based on the average interest rate on related debt.  Capitalized interest was less than $0.1 million in 2009, 2008, and group medical plan for its employees with a deductible amount of $1.25 million for each workers' compensation claim and a per claim limit amount of $275,000 for each group medical claim.2007.

Fair Value of Financial Instruments

The Company's financial instruments consist primarily of cash and cash equivalents, accounts receivable, commodity contracts, accounts payable, and long term debt.  The carrying amount of cash and cash equivalents, accounts receivable, and accounts payable, and current debt approximates their fair value because of the short termshort-term maturity of these instruments.  Interest rates that are currently available to the Company for issuance of long termlong-term debt with similar terms and remaining maturities are used to estimate the fair value of the Company's long term debt. The carrying amountlong-term debt, which primarily consists of revenue equipment installment notes.  Borrowings under the Company's short and long term debt at December 31, 2008 and 2007 was approximately $167.0 million and $136.8 million, respectively, including the accounts receivable securitization borrowings in 2007 and approximates the estimatedrevolving credit facility approximate fair value due to the variable interest ratesrate on these instruments.

the facility.  Additionally, commodity contracts, which are accounted for as hedge derivatives, as discussed in Note 14, are valued based on the forward rate of the specific indices upon which the contract is being settled and adjusted for counterparty credit risk using available market information and valuation methodologies.
51


Income Taxes

Income taxes are accounted for using the asset and liability method. Deferred income taxes represent a substantial liability on our consolidated balance sheets and are determined in accordance with SFAS No. 109, Accounting for Income Taxes. Deferred tax assets and liabilities (tax benefits and liabilities expected to be realized in the future) are recognized for the expected future tax consequences attributable to differences between the financial statement carrying amounts of existing assets and liabilities and their respective tax bases,basis.  Deferred tax assets and operating loss andliabilities are measured using enacted tax credit carry over.

rates expected to apply to taxable income in the years in which those temporary differences are expected to be recovered or settled.  The carrying value of the Company'seffect on deferred tax assets assumesand liabilities of a change in tax rates is recognized in income in the period that itincludes the enactment date.  We have reflected the necessary deferred tax assets and liabilities in the accompanying consolidated balance sheets.  We believe the future tax deductions will be able to generate, based on certain estimatesrealized principally through future reversals of existing taxable temporary differences and assumptions, sufficient future taxable income, in certain tax jurisdictions to utilize these deferred tax benefits. If these estimates and related assumptions change in the future, it may be required to establishexcept for when a valuation allowance againsthas been provided as discussed in Note 10.

In the carrying valueordinary course of business there is inherent uncertainty in quantifying our income tax positions.  We assess our income tax positions and record tax benefits for all years subject to examination based upon management's evaluation of the deferredfacts, circumstances, and information available at the reporting dates.  For those tax assets, which would result in additionalpositions where it is more-likely-than-not that a tax benefit will be sustained, we have recorded the largest amount of tax benefit with a greater than 50% likelihood of being realized upon ultimate settlement with a taxing authority that has full knowledge of all relevant information.  For those income tax expense. Onpositions where it is not more-likely-than-not that a periodic basis the Company assesses the need for adjustment of the valuation allowance.  Based on forecasted income and prior years' taxable income,tax benefit will be sustained, no valuation reservetax benefit has been established at December 31, 2008, becauserecognized in the Company believes that it is more likely than not that the future benefitfinancial statements.  Potential accrued interest and penalties related to unrecognized tax benefits are recognized as a component of the deferredincome tax assets will be realized.expense.

Lease Accounting and Off-Balance Sheet Transactions

The Company issues residual value guarantees in connection with the operating leases it enters into for certain of its revenue equipment.  These leases provide that if the Company does not purchase the leased equipment from the lessor at the end of the lease term, then it is liable to the lessor for an amount equal to the shortage (if any) between the proceeds from the sale of the equipment and an agreed value.  To the extent the expected value at the lease termination date is lower than the residual value guarantee,guarantee; the Company would accrue for the difference over the remaining lease term.  The Company believes that proceeds from the sale of equipment under operating leases would exceed the payment obligation on substantially all operating leases.  The estimated values at lease termination involve management judgments.  As leases are entered into, determination as to the classification as an operating or capital lease involves management judgments on residual values and useful lives.

Capital Structure

The shares of Class A and B common stock are substantially identical except that the Class B shares are entitled to two votes per share while beneficially owned by David Parker or certain members of his immediate family and Class A shares are entitled to one vote per share.  The terms of any future issuances of preferred shares will be set by the Company's Board of Directors.

Comprehensive Loss

Comprehensive loss generally includeincludes all changes in equity during a period except those resulting from investments by owners and distributions to owners.  Comprehensive loss for 2009 was comprised of the net loss, partially offset by the unrealized gain on the effective portion of hedged fuel costs, while in 2008 and 2007 comprehensive loss equaled net loss.

Basic and Diluted Earnings (Loss) Per Share

The Company applies the provisions of SFAS No. 128, Earnings per Share, which requires it to present basic EPS and diluted EPS. Basic EPS excludes dilution and is computed by dividing earnings available to common stockholders by the weighted-average number of common shares outstanding for the period.  Diluted EPS reflects the dilution that could occur if securities or other contracts to issue common stock were exercised or converted into common stock or resulted in the issuance of common stock that then shared in the earnings of the Company.  The calculation of diluted loss per share for the years ended December 31, 2009, 2008, 2007 and 20062007 excludes all unexercised options and unvested shares, since the effect of any assumed exercise of the related options would be anti-dilutive.

Stock-Based Employee Compensation
52

The Company issues several types of share-based compensation, including awards that vest based on service, market and performance conditions, or a combination of the conditions.  Performance-based awards vest contingent upon meeting certain performance criteria established by the Compensation Committee.  Market-based awards vest contingent upon meeting certain stock price targets selected by the Compensation Committee.  All awards require future service and thus forfeitures are estimated based on historical forfeitures and the remaining term until the related award vests.  Determining the appropriate amount to expense in each period is based on likelihood and timing of achieving of the stated targets for performance and market based awards, respectively, and requires judgment, including forecasting future financial results and market performance.  The estimates are revised periodically based on the probability and timing of achieving the required performance and market targets, respectively, and adjustments are made as appropriate.  Awards that are only subject to time vesting provisions are amortized using the straight-line method.

The following table sets forth the calculation of net loss per share included in the consolidated statements of operations for each of the three years ended December 31:

(in thousands except per share data)         
  2009  2008  2007 
Numerator:         
          
Net loss
 $(25,030) $(53,391) $(16,726)
             
Denominator:            
             
Denominator for basic loss per share – weighted-average shares
  14,124   14,038   14,018 
Effect of dilutive securities:            
Equivalent shares issuable upon conversion of unvested restricted stock  -   -   - 
Equivalent shares issuable upon conversion of unvested employee stock options  -   -   - 
Denominator for diluted loss per share adjusted weighted-average shares and assumed conversions  14,124   14,038   14,018 
             
Net loss per share:            
Basic and diluted loss per share $(1.77) $(3.80) $(1.19)
(in thousands except per share data)         
  2008  2007  2006 
Numerator:         
          
Net loss $(53,391) $(16,726) $(1,381)
             
Denominator:            
             
Denominator for basic earnings per share – weighted-average shares  14,038   14,018   13,996 
Effect of dilutive securities:
            
Employee stock options
  -   -   - 
Denominator for diluted earnings per share – adjusted weighted-average shares
and assumed conversions
  14,038   14,018   13,996 
             
Net loss per share:            
Basic and diluted loss per share $(3.80) $(1.19) $(0.10)

Derivative Instruments and Hedging Activities

The Company engages in activities that expose itWe periodically utilize derivative instruments to market risks, including the effects ofmanage exposure to changes in interest rates and fuel prices.  Financial exposures are evaluatedAt inception of a derivative contract, we document relationships between derivative instruments and hedged items, as an integral part of the Company's risk management program, which seeks, from time to time, to reduce potentially adverse effects that the volatility of the interest ratewell as our risk-management objective and fuel markets may have on operating results. The Company does not regularly engage in speculativestrategy for undertaking various derivative transactions, nor does it regularly hold or issueand assess hedge effectiveness.  We record derivative financial instruments for trading purposes. At December 31, 2008, there were no outstanding derivatives.

The Company accounts for derivative instruments in accordance with SFAS No. 133, Accounting for Derivative Instruments and Hedging Activities, as amended ("SFAS No. 133").  SFAS No. 133 requires that all derivative instruments be recorded on the balance sheet as either an asset or liability at their fair value.  ChangesIf it is determined that a derivative is not highly effective as a hedge, or if a derivative ceases to be a highly effective hedge, we discontinue hedge accounting prospectively.  The effective portion of changes in the fair value of derivatives are recorded each period in current earnings or in other comprehensive income, depending on whether a derivativeand reclassified into earnings in the same period during which the hedged transaction affects earnings.  The ineffective portion is designated as part of a hedging relationship and, if it is, depending on the type of hedging relationship.recorded in other income or expense.

From time to time, the Company enters into fuel purchase commitments for a notional amount of diesel fuel at prices which are determined when fuel purchases occur.

Segment InformationSubsequent Events

The Company has one reportable segment underconsiders events or transactions that occur after the provisions of Statement of Financial Accounting Standards ("SFAS") No.131, Disclosures about Segments of an Enterprise and Related Information ("SFAS No. 131").  Each ofbalance sheet date but before the Company's transportation service offerings and subsidiariesfinancial statements are issued to provide additional evidence relative to certain estimates or to identify matters that meetrequire additional disclosure.  The Company evaluated subsequent events through the quantitative threshold requirements of SFAS No. 131 provides truckload transportation services that have been aggregated as they have similar economic characteristics and meet the other aggregation criteria of SFAS No. 131. Accordingly, the Company has not presented separate financial information for each of its service offerings and subsidiaries asdate the consolidated financial statements present the Company's one reportable segment. The Company generates other revenue through a subsidiary that provides freight brokerage services. The operations of this subsidiary are not material and are therefore not disclosed separately.were issued.

Reclassifications

Certain reclassifications have been made to the prior years' consolidated financial statements to conform to the 20082009 presentation.  The reclassifications did not effectaffect shareholders' equity or net loss reported.

Recent Accounting Pronouncements

Improving Disclosures About Fair Value Measurements – In January 2010, the FASB issued authoritative guidance to clarify certain existing disclosure requirements and require additional disclosures for recurring and nonrecurring fair value measurements.  These additional disclosures include amounts and reasons for significant transfers between Level 1 and Level 2 of the fair value hierarchy; significant transfers in and out of Level 3 of the fair value hierarchy; and information about purchases, sales, issuances, and settlements on a gross basis in the reconciliation of recurring Level 3 measurements.  Further, the guidance amends employer's disclosures about post-retirement benefit plans to require that disclosures be provided by classes of assets instead of by major categories of assets.  The requirements of this guidance are effective for periods beginning after December 15, 2009, with the exception of the requirement of information about purchases, sales, issuances, and settlements of Level 3 measurements, which becomes effective for periods ending after December 15, 2010.  The Company does not expect the adoption of this guidance to have a material impact on its consolidated financial statements.
Accounting Standards Codification - In June 2009, the Financial Accounting Standards Board ("FASB") issued authoritative guidance which establishes the FASB Accounting Standards Codification as the single source of authoritative U.S. generally accepted accounting principles recognized by the FASB to be applied by nongovernmental entities.  The FASB Accounting Standards Codification is effective for interim and annual periods ending after September 15, 2009.  The adoption of the FASB Accounting Standards Codification during the three months ended September 30, 2009, did not have a material effect on the Company's consolidated financial statements.
Fair Value Measurement of Liabilities - In August 2009, the FASB issued authoritative guidance which provides clarification regarding the required techniques for the fair value measurement of liabilities.  This update applies to all entities that measure liabilities at fair value, and is effective for the first interim or annual reporting period beginning after its issuance in August 2009.  The Company does not expect the adoption of this guidance to have a material effect on its consolidated financial statements.
Transfers of Financial Assets - - In June 2009, the FASB issued authoritative guidance which requires entities to provide more information regarding sales of securitized financial assets and similar transactions, particularly if the seller retains some risk with respect to the assets.  This authoritative guidance is effective for fiscal years beginning after November 15, 2009.  The Company does not expect the adoption of this guidance to have a material effect on its consolidated financial statements.

New Accounting Pronouncements

Variable Interest Entities - In May 2008,June 2009, the Financial Accounting Standards Board ("FASB")FASB issued SFAS No. 162, The Hierarchy of Generally Accepted Accounting Principles ("SFAS No. 162"), which identifies the sources ofauthoritative guidance designed to improve financial reporting by companies involved with variable interest entities and framework for selecting the accounting principles to be used in the preparationprovide more relevant and reliable information to users of financial statements of nongovernmental entities that are presented in conformity with the generally accepted accounting principles ("GAAP") hierarchy.  Because the current GAAP hierarchystatements.  This authoritative guidance is set forth in the American Institute of Certified Public Accountants Statement on Auditing Standards No. 69, it is directed to the auditor rather than to the entity responsibleeffective for selecting accounting principles for financial statements presented in conformity with GAAP.  Accordingly, the FASB concluded the GAAP hierarchy should reside in the accounting literature established by the FASB and issued this statement to achieve that result.  The provisions of SFAS No. 162 became effective 60 days following the SEC's approval of the Public Company Accounting Oversight Board amendments to AU Section 411, The Meaning of Present Fairly in Conformity with Generally Accepted Accounting Principles.fiscal years beginning after November 15, 2009.  The Company does not believeexpect the adoption of SFAS No. 162 willthis guidance to have a material impacteffect on its consolidated financial statements.
Subsequent Events - In May 2009, the FASB issued authoritative guidance that established general standards of accounting for and disclosures of events that occur after the balance sheet date but before financial statements are issued or are available to be issued.  This authoritative guidance was effective for interim or annual financial periods ending after June 15, 2009.  The adoption of this guidance did not affect the Company's consolidated financial statements.
Interim Disclosures about Fair Value of Financial Instruments - In April 2009, the FASB issued authoritative guidance to require disclosures about fair values of financial instruments for interim reporting periods as well as in annual financial statements.  The guidance also amends previous guidance to require those disclosures in summarized financial information at interim reporting periods.  This guidance was effective for interim reporting periods ending after June 15, 2009.  The adoption of this guidance did not affect the Company's consolidated financial statements.

Disclosures about Derivative Instruments and Hedging Activities - In March 2008, the FASB issued SFAS No. 161,authoritative guidance which amends and expands the previous disclosure requirements, of SFAS No. 133, to provide an enhanced understanding of an entity's use of derivative instruments, how they are accounted for, under SFAS No. 133, and their effect on the entity's financial position, financial performance and cash flows.  The provisions of SFAS No. 161 are effectiveCompany adopted the guidance as of the beginning of ourthe 2009 fiscal year.  We are currently evaluatingyear and its adoption did not have a material impact to the impact of adopting SFAS No. 161 on ourCompany's consolidated financial statements.

In February 2008, the FASB issued SFAS No. 157-1, Application of FASB Statement No. 157 to FASB Statement No. 13 and Other Accounting Pronouncements That Address Fair Value Measurements for Purposes of Lease Classification or Measurement under Statement 13 ("SFAS No. 157-1").  SFAS No. 157-1 amends the scope of FASB Statement No. 157 to exclude FASB Statement No. 13, Accounting for Leases, and other accounting standards that address fair value measurements for purposes of lease classification or measurement under FASB Statement No. 13.  SFAS No. 157-1 is effective on initial adoption of FASB Statement No. 157.  The scope exception does not apply to assets acquired and liabilities assumed in a business combination that are required to be measured at fair value under FASB Statement No. 141, Business Combinations, or SFAS No. 141R (as defined below), regardless of whether those assets and liabilities are related to leases.

Business Combinations - In December 2007, the FASB issued SFAS No. 141R. Business Combinations ("SFAS No. 141R").  This statementauthoritative guidance that establishes requirements for (i) recognizing and measuring in an acquiring company's financial statements the identifiable assets acquired, the liabilities assumed, and any noncontrolling interest in the acquiree; (ii) recognizing and measuring the goodwill acquired in the business combination or a gain from a bargain purchase; and (iii) determining what information to disclose to enable users of the financial statements to evaluate the nature and financial effects of the business combination.  The provisions of SFAS No. 141Rthe guidance are effective for business combinations for which the acquisition date is on or after the beginning of the first annual reporting period beginning on or after December 15, 2008.  The Company doesadopted the guidance as of the beginning of the 2009 fiscal year and its adoption did not believe the adoption of SFAS No. 141R will have a material impact into the Company's consolidated financial statements.

Noncontrolling Interests in Consolidated Financial Statements - In December 2007, the FASB issued SFAS No. 160, Noncontrolling Interests in Consolidated Financial Statements-an amendment of ARB No. 51 ("SFAS No. 160"). This statement amends ARB No. 51 to establishauthoritative guidance that modified accounting and reporting standards for the noncontrolling interest in a subsidiary and for the deconsolidation of a subsidiary.  The provisions of SFAS No. 160the guidance are effective for fiscal years, and interim periods within those fiscal years, beginning on or after December 15, 2008.  The Company does not believeadopted the adoption of SFAS No. 160 will have a material impact in the consolidated financial statements.

In February 2007, the FASB issued SFAS No. 159, The Fair Value Option for Financial Assets and Financial Liabilities ("SFAS No. 159").  SFAS No. 159 permits entities to choose to measure certain financial assets and liabilities at fair value.  Unrealized gains and losses on items for which the fair value option has been elected are reported in earnings.  SFAS No. 159 is effective for fiscal years beginning after November 15, 2007. The Company adopted SFAS No. 159guidance as of the beginning of the 20082009 fiscal year and its adoption did not have a material impact to the Company's consolidated financial statements.


54

TABLE OF CONTENTSFair Value Measurements

- In September 2006, the FASB issued SFAS No. 157, Fair Value Measurements ("SFAS No. 157"). This Statement definesauthoritative guidance which provides guidance on how to measure assets and liabilities at fair value.  The guidance applies whenever another U.S. GAAP standard requires (or permits) assets or liabilities to be measured at fair value establishes a framework for measuringbut does not expand the use of fair value to any new circumstances.  This standard also requires additional disclosures in generally accepted accounting principles ("GAAP"),both annual and expands disclosures about fair value measurements. The provisions of SFAS No. 157 are effective asquarterly reports.  Portions of the beginning of the firstguidance were effective for financial statements issued for fiscal year that beginsyears beginning after November 15, 2007.2007, and the Company began applying those provisions effective January 1, 2008.  The Company adopted SFAS No. 157 asadoption of the beginning of the 2008 fiscal year and its adoptionguidance did not have a materialsignificant impact toon the Company's consolidated financial statements.

In JulyFebruary 2008, the FASB amended the scope of the original guidance to exclude accounting for leases, and other accounting standards that address fair value measurements for purposes of lease classification or measurement.  The scope of this exception does not apply to assets acquired and liabilities assumed in a business combination that are required to be measured at fair value.  Also, in February 2008, the FASB delayed the effective date of the aforementioned fair value guidance one year for all nonfinancial assets and nonfinancial liabilities, except those recognized at fair value in the financial statements on a recurring basis.  The Company adopted the remaining provisions as of January 1, 2009.  The adoption of the guidance did not have a significant impact on the Company's consolidated financial statements.

Uncertain Tax Positions - In June 2006, the FASB issued Interpretation No. 48, Accountingguidance for Uncertaintyaccounting for uncertainty in Income Taxes ("FIN 48").income taxes, which established a single model to address accounting for uncertain tax positions.  The Company was required to adopt the provisions of FIN 48,the new guidance effective January 1, 2007.  As a result of this adoption, the Company recognized additional tax liabilities of $0.3 million with a corresponding reduction to beginning retained earnings as of January 1, 2007. As of January 1, 2007, the Company had a $2.8 million liability recorded for unrecognized tax benefits, which includes interest and penalties of $0.5 million. The Company recognizes interest and penalties accrued related to unrecognized tax benefits in tax expense.

2.           LIQUIDITY

As discussed in Note 7,Our business requires significant capital investments over the Company has an $85.0short-term and the long-term.  Recently, we have financed our capital requirements with borrowings under our Credit Facility, cash flows from operations, long-term operating leases, capital leases, and secured installment notes with finance companies.  Our primary sources of liquidity at December 31, 2009, were funds provided by operations, proceeds from the sale of used revenue equipment, borrowings under our Credit Facility, borrowings from secured installment notes, capital leases, operating leases of revenue equipment and cash and cash equivalents.  We had a working capital (total current assets less total current liabilities) deficit of $17.8 million Credit Agreement withat December 31, 2009 and a groupworking capital surplus of banks under which the Company had approximately $40.6$16.3 million in letters of credit and $3.8 million of borrowings outstanding as ofat December 31, 2008.  The Credit Agreement (as defined in Note 7) contains certain restrictions and covenants relatingWorking capital deficits are common to among other things, dividends, liens, acquisitions and dispositions outsidemany trucking companies that expand by financing revenue equipment purchases through borrowing or capitalized leases.  When we finance revenue equipment through borrowing or capitalized leases, the principal amortization scheduled for the next twelve months is categorized as a current liability, although the revenue equipment is classified as a long-term asset.  Consequently, each purchase of the ordinary courserevenue equipment financed with borrowing or capitalized leases decreases working capital.  We believe our working capital deficit had little impact on our liquidity.  Based on our expected financial condition, results of business, affiliate transactions, and total indebtedness. The Company was in compliance with its Credit Agreement covenantsoperations, a material refund of previously paid federal income taxes as a result of December 31, 2008.

On March 27, 2009, the Company obtained an amendment to its Credit Agreement, which, among other things, (i) retroactively to January 1, 2009 amended the fixed charge coverage ratio covenant for January and February 2009net operating loss carry backs pursuant to the actual levels achieved,Worker, Homeownership, and Business Assistance Act of 2009, and net cash flows during the next twelve months, which curedcontemplate an improvement compared with the past twelve months, we believe our defaultworking capital and sources of liquidity will be adequate to meet our current and projected needs for at least the next twelve months.  On a longer-term basis, based on our anticipated financial condition, results of operations, and cash flows, and continued availability of our Credit Facility, secured installment notes, and other sources of financing that covenant for January 2009, (ii) restarted the look back requirements of the fixed charge coverage ratio covenant beginning on March 1, 2009, (iii) increased the EBITDAR portion of the fixed charge coverage ratio definition by $3,000,000 for all periods between March 1we expect will be available to December 31, 2009, (iv) increased the base rate applicableus, we do not expect to base rate loans to the greater of the prime rate, the federal funds rate plus 0.5%, or LIBOR plus 1.0%, (v) set a LIBOR floor of 1.5%, (vi) increased the applicable margin for base rate loans to a range between 2.5% and 3.25% and for LIBOR loans to a range between 3.5% and 4.25%, with 3.0% (for base rate loans) and 4.0% (for LIBOR loans) to be used as the applicable margin through September 2009, (vii) increased our letter of credit facility fee by an amount corresponding to the increaseexperience material liquidity constraints in the applicable margin, (viii) increased the unused line fee to a range between 0.5% and 0.75%, and (ix) increased the maximum number of field examinations per year from three to four.  In exchange for these amendments, the Company agreed to the increases in interest rates and fees described above and paid fees of approximately $544,000.foreseeable future.

The Company has had significant losses from 20062007 through 2008,2009, attributable to operations, restructurings,impairments, and other charges.  The Company has managed its liquidity during this time through a series of cost reduction initiatives, refinancing, amendments to credit facilities, and sales of assets.  As stated, the recent amendment to the Company's Credit Agreement retroactively brought it into compliance with the Credit Agreement's fixed charge coverage covenant and reset the fixed charge coverage ratio to levels consistent with our 2009 budget. We have had difficulty meeting budgeted results in the past.  If we are unable to meet budgeted results or otherwise comply with our Credit Agreement,Facility, we may be unable to obtain a further amendment or waiver under our Credit AgreementFacility or doing sowe may result inincur additional fees.

3.           SHARE-BASED COMPENSATIONFAIR VALUE OF FINANCIAL INSTRUMENTS

Fair value is defined as an exit price, representing the amount that would be received to sell an asset or paid to transfer a liability in an orderly transaction between market participants.  Accordingly, fair value is a market-based measurement that is determined based on assumptions that market participants would use in pricing an asset or liability.  The fair value of the hedge derivative asset was determined based on quotes from the counterparty which were verified by comparing them to the exchange on which the related futures are traded, adjusted for counterparty credit risk.  A three-tier fair value hierarchy is used to prioritize the inputs in measuring fair value as follows:

Level 1.  Observable inputs such as quoted prices in active markets;
Level 2.  Inputs, other than the quoted prices in active markets, that are observable either directly or indirectly; and
Level 3.  Unobservable inputs in which there is little or no market data, which require the reporting entity to develop its own assumptions.

 Assets and Liabilities Measured at Fair Value on a Recurring Basis
(in thousands) 
December 31,
2009
  
 
Quoted Prices
in Active
Markets
(Level 1)
  
Significant
Other
Observable
Inputs
(Level 2)
  
Significant
Unobservable
Inputs
(Level 3)
 
Hedge derivative asset $496     $496    

4.           SHARE-BASED COMPENSATION

On May 5, 2009, at the annual meeting, the Company's stockholders approved an amendment to the Covenant Transportation Group, Inc. 2006 Omnibus Incentive Plan ("2006 Plan"), which among other things, (i) provides that the maximum aggregate number of shares of Class A common stock available for the grant of awards under the 2006 Plan from and after such annual meeting date shall not exceed 700,000, and (ii) limits the shares of Class A common stock that shall be available for issuance or reissuance under the 2006 Plan from and after such annual meeting date to the additional 700,000 shares reserved, plus any expirations, forfeitures, cancellations, or certain other terminations of such shares.

The 2006 Plan permits annual awards of shares of the Company's Class A common stock to executives, other key employees, and non-employee directors and eligible participants under various types of options, restricted stock awards, or other equity instruments.  The number of shares available for issuance under the 2006 Plan is 1,000,000700,000 shares unless adjustment is determined necessary by the Committee as the result of a dividend or other distribution, recapitalization, stock split, reverse stock split, reorganization, merger, consolidation, split-up, spin-off, combination, repurchase or exchange of Class A common stock, or other corporate transaction in order to prevent dilution or enlargement of benefits or potential benefits intended to be made available.  At December 31, 2008, approximately 45,0002009, 533,900 of these 1,000,000700,000 shares were available for award under the 2006 Plan.  No participant in the 2006 Plan may receive awards of any type of equity instruments in any calendar-year that relates to more than 250,000 shares of the Company's Class A common stock.  No awards may be made under the 2006 Plan after May 23, 2016.  To the extent available, the Company has issued treasury stock to satisfy all share-based incentive plans.


Effective January 1, 2006, the Company adopted SFAS No. 123R, Share-Based Payment ("SFAS No. 123R") using the modified prospective method.  Under this method, compensation cost is recognized on our financial statements after the required effective date for the portion of outstanding awards for which the requisite service has not yet been rendered, based on the grant-date fair value of those awards calculated under SFAS No. 123R for either recognition or pro forma disclosures.  Included in salaries, wages, and related expenses within the consolidated statements of operations is stock-based compensation expense for each years ended December 31,(benefit) of $0.7 million, ($0.1) million, and $0.5 million in 2009, 2008, and 2007, respectively.  The benefit recorded in the 2008 period is the result of approximately $0.2reversing $0.4 million of expense when it was determined that certain awards that contained performance conditions were not probable to vest.  Income tax benefits associated with stock compensation expense were $0.3 million and $0.2 million in 2009 and 2007, respectively.  There were no significant tax benefits in 2008 as a result of the aforementioned reversal and related minimal expense.

The 2006 Plan allows participants to pay the Company for the federal and state minimum statutory tax withholding requirements related to awards that vest or allows the participant to deliver to the Company, shares of common stock having a fair market value equal to the minimum amount of such required withholding taxes.  To satisfy withholding requirements for shares that vested in the third quarter, certain participants elected to deliver to the Company 20,982 shares which were withheld at a per share price of $5.50, totaling approximately $0.1 million, net benefit recordedbased on the closing price of our common stock on the date of exercise, in 2008, resulted fromlieu of the reversalfederal and state minimum statutory tax withholding requirements.  We remitted approximately $0.1 million to the proper taxing authorities in satisfaction of $0.4 million of previously recorded stock compensation expense related to prior years' performance-based restricted stock and stock option issuances for whichthe employees' minimum statutory withholding requirements.  The tax withholding amounts paid by the Company now considers it improbablehave been accounted for as a repurchase of meetingshares in the required performance-based criteria foraccompanying consolidated statement of stockholders' equity.  However, these deemed share repurchases are not included as part of the potential future vesting ofCompany's stock repurchase program, noting such securities.program expired on June 30, 2009.

The following table summarizes the Company's stock option activity for the fiscal years ended December 31, 2006, 20072009, 2008 and 2008:2007:

  
Number of
options (in
thousands)
  
Weighted
average
exercise price
 
Weighted average
remaining
contractual term
 
Aggregate intrinsic
value
(in thousands)
 
           
Outstanding at December 31, 2006  1,287  $13.98 68 months $685 
              
Options granted  112  $6.76      
Options exercised  -   -      
Options canceled  (194) $13.93      
Outstanding at December 31, 2007  1,205  $13.33 64 months $- 
              
Options granted  -   -      
Options exercised  -   -      
Options canceled  (109) $12.30      
Outstanding at December 31, 2008  1,096  $13.43 52 months $- 
              
Options granted  -   -      
Options exercised  -   -      
Options canceled  (116) $14.05      
Outstanding at December 31, 2009  980  $13.36 43 months $- 
              
Exercisable at December 31, 2009  821  $14.10 34 months $- 

61

TABLE OF CONTENTS
  
Number of
options (in
thousands)
  
Weighted
average
exercise price
 
Weighted average
remaining
contractual term
 
Aggregate intrinsic
value
(in thousands)
 
           
Outstanding at December 31, 2005  1,454  $14.33 68 months $1,608 
              
Options granted  106  $13.15      
Options exercised  (19) $12.64      
Options canceled  (254) $15.74      
Outstanding at December 31, 2006  1,287  $13.98 68 months $685 
              
Options granted  112  $6.76      
Options exercised  -   -      
Options canceled  (194) $13.93      
Outstanding at December 31, 2007  1,205  $13.33 64 months $- 
              
Options granted  -   -      
Options exercised  -   -      
Options canceled  (109) $12.30      
Outstanding at December 31, 2008  1,096  $13.43      
              
Exercisable at December 31, 2008  984  $13.93 50 months $- 

The fair value of each option award is estimated on the date of grant using the Black-Scholes option-pricing model, which uses a number of assumptions to determine the fair value of the options on the date of grant.  The following weighted-average assumptions were used to determine the fair value of the stock options granted for each of the years ended December 31:in 2007:

  2007  2006 
Expected volatility    57.3%   37.4% 
Risk-free interest rate     4.4%  4.6% - 5.0% 
Expected lives (in years)  5.0   5.0 
2007
Expected volatility57.3%
Risk-free interest rate4.4%
Expected lives (in years)5.0

The expected lives of the options are based on the historical and expected future employee exercise behavior.  Expected volatility is based upon the historical volatility of the Company's common stock.  The risk-free interest rate is based upon the U.S. Treasury yield curve at the date of grant with maturity dates approximately equal to the expected life at the grant date.

The Company issues performance-based restricted stock awards whose vesting is contingent upon meeting certain earnings-per-share targets selected by the Compensation Committee. Determining the appropriate amount to expense is based on likelihood of achievement of the stated targets and requires judgment, including forecasting future financial results. This estimate is revised periodically based on the probability of achieving the required performance targets and adjustments are made as appropriate. The cumulative impact of any revision is reflected in the period of change.


The following tables summarize the Company's restricted stock award activity for the fiscal years ended December 31, 2006, 20072009, 2008, and 2008:2007:

 
Number of
stock
awards
  
Weighted
average grant
date fair value
  
Number of
stock
awards
  
Weighted
average grant
date fair value
 
Unvested at January 1, 2006  -   - 
Granted
  484,984  $12.65 
Vested
  -   - 
Forfeited
  (28,000) $12.65 
 (in thousands)    
Unvested at December 31, 2006  456,984  $12.65   457  $12.65 
                
Granted
  113,533  $10.72   113  $10.72 
Vested
  -   -   -   - 
Forfeited
  (69,933) $12.68   (70) $12.68 
Unvested at December 31, 2007  500,584  $12.21   500  $12.21 
                
Granted
  268,785  $3.44   269  $3.44 
Vested
  -   -   -   - 
Forfeited
  3,170  $5.83   (3) $5.83 
Unvested at December 31, 2008  766,199  $9.14   766  $9.14 
        
Granted
  335  $3.07 
Vested
  (162) $3.15 
Forfeited
  (165) $9.30 
Unvested at December 31, 2009  774  $7.76 

In JulyThe unvested shares at December 31, 2009 will vest based on when and if the related vesting criteria are met for each award.  All awards require continued service to vest, noting that 123,000 of these awards vest solely based on continued service, of which 103,000 are expected to vest in 2010.  Additionally, 162,000 awards vest based on market conditions such that one third of the each employee's awards vests if the Company's Class A Stock trades above $4, $6, and $8, respectively, for thirty trading days beginning January 1, 2010 through December 31, 2011.  Performance based awards account for 489,000 of the unvested shares at December 31, 2009, noting that 384,000 of these shares are not expected to vest based on the expectation that the related performance criteria will not be met.  As such, all previously recognized compensation expense was reversed in 2008, and no related expense was recognized in 2009 given there was no change in the Company issued 258,320expectation regarding the performance targets being met that would trigger the shares to vest.  The remaining 105,000 shares that include a performance target will vest if the Company's fiscal 2010 earnings per share is equal to or greater than $0.05 per share, excluding certain non-cash charges.

The fair value of restricted stock to certain employees, which are only subject to time vesting provisions.  The market value of these shares on the date of issuanceawards that vested in 2009 was $3.51 per share.  The amount is being amortized using the straight-line method over the vesting period from the date of issuance as additional compensation expense.approximately $0.5 million, noting no awards vested in 2007 or 2008.  As of December 31, 2008,2009, the Company had approximately $0.6$1.2 million of unrecognized compensation expense related to restricted stock awards, which is probable to be recognized over a weighted average period of approximately eighteensixteen months.  All restricted shares awarded to executives and other key employees pursuant to the 2006 Plan have voting and other stockholder-type rights, but will not be issued until the relevant restrictions are satisfied.

62

5.           INVESTMENT IN TRANSPLACE

The Company has an investment inFrom July 2001 through December 2009, we owned approximately 12.4% of Transplace, Inc. ("Transplace"), a global transportation logistics service.  The Company accountsIn the formation transaction for itsTransplace, we contributed our logistics customer list, logistics business software and software licenses, certain intellectual property, intangible assets, and $5.0 million in cash, in exchange for our ownership.  We accounted for this investment, which totaled approximately $10.7 million, using the cost method of accounting, with the investmentand it was historically included in other assets. The Company continues to evaluate its cost method investment in Transplace for impairment due to declines considered to be other than temporary. This impairment evaluation includes general economic and company-specific evaluations. If the Company determines that a decline in the cost value of this investment is other than temporary, then a charge to earnings will be recorded to other (income) expensesassets in the consolidated statements of operations for all or a portion of the unrealized loss, and a new cost basis in the investment will be established. As of December 31, 2008, no such charge had been recorded. However, the Company will continue to evaluate this investment for impairment on a quarterly basis.balance sheet.  Also, during the first quarter of 2005, the Companywe loaned Transplace approximately $2.7 million. The 6% interest-bearing$2.6 million, which along with the related accrued interest was historically included in other assets in the consolidated balance sheet.

Based on an offer to purchase our 12.4% equity ownership and related note receivable matures January 2011, an extensionin Transplace that was accepted by a majority of the original January 2007 maturity date. Basedshareholders, we determined that pursuant to the guidance provided by FASB Accounting Standards Codification 325, the value of our equity investment had become completely impaired in the third quarter of 2009, and the value of the note receivable had become impaired by approximately $0.9 million.  As a result, we recorded a non-cash impairment charge of $11.6 million during the third quarter of 2009.

The transaction closed in December 2009, whereby the proceeds of $1.9 million provided for a recovery of $0.1 million of the previously impaired amount in the fourth quarter of 2009 and thus an $11.5 million non-cash loss on the borrowing availabilitysale of Transplace,our investment and related note receivable.  There was no tax benefit recorded in connection with the Companyloss on the sale of the investment, given a full valuation allowance was established for the related capital loss.  Under our credit facility, the non-cash loss is added back in the computation of the Company's fixed charge coverage ratio; and therefore does not believe there is any impairment of this note receivable.unfavorably impact our single financial covenant.

5.6.           PROPERTY AND EQUIPMENT

A summary of property and equipment, at cost, as of December 31, 20082009 and 20072008 is as follows:

(in thousands)
Estimated
Useful Lives
 2008  2007  Estimated Useful Lives  2009  2008 
Revenue equipment3-10 years    $266,148  $266,189  3-10 years  $309,668  $266,148 
Communications equipment5 years     15,602   15,325  5 years   15,606   15,602 
Land and improvements10-24 years     16,690   16,663  10-24 years   17,541   16,690 
Buildings and leasehold improvements10-40 years     37,030   36,503  7-40 years   38,543   37,030 
Construction in-progress   2,054   768   ---------   2,715   2,054 
Other1-5 years     15,333   14,710  1-7 years   15,639   15,333 
  $352,857  $350,158      $399,712  $352,857 


57


Depreciation expense amounts werewas $47.2 million, $60.2 million, and $50.3 million in 2009, 2008, and 2007, respectively.  The 2008 and 2007 amounts include a $15.8 million and a $1.7 million impairment charge, respectively.

Pursuant to Financial Accounting Standard No. 144, Accounting for the Impairment or Disposal of Long−Lived Assets, the Company performed an impairment analysis of the carrying value of its tractors and trailers.  The Company undertookleases certain revenue equipment under capital leases with terms of 60 months.  At December 31, 2009, property and equipment included capitalized leases, which had capitalized costs of $14.0 million and accumulated amortization of $0.2 million.  Amortization of these leased assets is included in depreciation and amortization expense in the analysis after lowering its 2009 revenueconsolidated statement of operations and tractor disposal proceeds expectations in response tototaled $0.2 million during 2009.  There was no equipment held under capital leases during 2008 or 2007.

As a combinationresult of sharply lower economic indicators, a worsening credit market, and significantly lower prices received for disposals of itsour own used revenue equipment, all of which deteriorated substantially during the fourth quarter of 2008.  Based on these factors and the expected remaining useful lives of the tractors, the Company2008, we recorded a $15.8$9.4 million asset impairment charge ($1.2 million was recorded in the third quarter and $14.6 million was recorded in the fourth quarter) to write downwrite-down the carrying values of tractors and trailers held for sale expected to be traded or soldin-use in 2009 and tractors in useour Truckload segment which were expected to be traded or sold in 2009 or 2010.  The carrying values for revenue equipment scheduled for trade in 2011 and beyond were not adjusted because those tractors and trailers were not required to be impaired based on recoverability testing using the expected future cash flows and disposition values of such equipment.
63


Similarly, in 2008 we recorded a $6.4 million asset impairment charge ($1.2 million was recorded in the third quarter and $5.2 million was recorded in the fourth quarter) to write down the carrying values of tractors and trailers held for sale in our Truckload segment which were expected to be traded or sold in future periods.
Although we do not expect to be required to make any current or future cash expenditures as a result of these impairment charges, cash proceeds of future disposals of revenue equipment are anticipated to be lower than expected prior to the impairment charges.
Our evaluation of the future cash flows compared to the carrying value of the tractors and trailers in-use in 2009 has not resulted in any additional impairment charges.  Additionally, there were no indicators triggering an evaluation for impairment of assets held for sale during the 2009 period, as evidenced by our minimal gains and losses on the disposal of revenue equipment, including assets held for sale.
In addition, the Company'sour 2007 asset impairment charge was related to our decision to sell our corporate aircraft to reduce ongoing operating costs.  The CompanyWe recorded an impairment charge of $1.7 million, reflecting the unfavorable fair market value of the airplane as compared to the combination of the estimated payoff of the long-term operating lease and current book value of related airplane leasehold improvements.

In 2009, we began a multi-year project to upgrade the hardware and software of our information systems.  The goal upon completion of the project is to have uniform operational and financial systems across the entire company as we believe this will improve customer service, utilization, and enhance our visibility into and across the organization.  The Company incurred approximately $2.6 million in 2009 related to this system upgrade, and all related amounts are included in construction in progress in the consolidated balance sheet as the related systems were not implemented at December 31, 2009.

6.7.           GOODWILL AND OTHER ASSETS

Goodwill of $11.5 million at December 31, 2009 and 2008 relates to two reporting units within our Truckload segment.  Pursuant to the applicable accounting standards, we conducted our 2009 annual impairment test for goodwill in the second quarter and did not identify any impairment and noted no subsequent indicators of impairment within these reporting units.

While our 2008 annual impairment analysis performed in the second quarter did not provide for impairment, in light of changes in market conditions and the related declining market outlook for the Star Transportation reporting unit, which is included in our Truckload segment, noted in the fourth quarter of 2008, we engaged an independent third party to assist us in the completion of valuations used in the impairment testing process.  The completion of this work concluded that the goodwill previously recorded for the Star acquisition was fully impaired and resulted in a $24.7 million, or $1.75 per basic and diluted share non-cash goodwill impairment charge, recorded in the fourth quarter of 2008.  There was no tax benefit associated with this nondeductible charge.

A summary of other assets as of December 31, 20082009 and 20072008 is as follows:

(in thousands) 2009  2008 
Covenants not to compete $2,690  $2,690 
Trade name  1,250   1,250 
Customer relationships  3,490   3,490 
Less: accumulated amortization of intangibles  (5,541)  (4,712)
Net intangible assets
  1,889   2,718 
Investment in Transplace
  -   10,666 
Note receivable from Transplace
  -   2,748 
Other, net
  4,722   4,281 
  $6,611  $20,413 


(in thousands) 2008  2007 
Covenants not to compete $2,690  $2,690 
Trade name  1,250   1,250 
Customer relationships  3,490   3,490 
Less: accumulated amortization of intangibles  (4,712)  (3,671)
Net intangible assets
  2,718   3,759 
Investment in Transplace
  10,666   10,666 
Note receivable from Transplace
  2,748   2,748 
Other, net
  2,697   2,131 
  $18,829  $19,304 

Amortization expenses of intangible assets was $0.8 million, $1.0 million, and $0.4 million for 2009, 2008, and 2007, respectively.  Approximate intangible amortization expense for the next five years is as follows:

7.        LONG-TERM
  
 
(In thousands)
2010636
2011382
2012317
2013227
201491
Thereafter236

8.           DEBT AND SECURITIZATION FACILITY

Current and long-term debt consisted of the following at December 31, 20082009 and 2007:2008:

(in thousands) December 31, 2008  December 31, 2007 
  Current  Long-Term  Current  Long-Term 
Borrowings under Credit Agreement $-  $3,807  $-  $75,000 
Revenue equipment installment notes; weighted average interest rate of 6.0% and 5.65% at December 31, 2008, and December 31, 2007, respectively, due in monthly installments with final maturities at various dates ranging from December 2010 to December 2011, secured by related revenue equipment  58,718   101,118   2,335   11,467 
Real estate note; interest rate of 4.0%  365   3,031   -   - 
Securitization Facility  -   -   47,964   - 
Total debt $59,083  $107,956  $50,299  $86,467 
(in thousands) December 31, 2009  December 31, 2008 
  Current  Long-Term  Current  Long-Term 
Borrowings under Credit Facility $-  $12,686  $-  $3,807 
Revenue equipment installment notes; weighted average interest rate of 6.5% and 6.0% at December 31, 2009, and December 31, 2008, respectively, due in monthly installments with final maturities at various dates ranging from January 2010 to June 2013, secured by related revenue equipment  67,000   118,574   58,718   101,118 
Real estate note; interest rate of 2.75% and 4.0% at December 31, 2009 and 2008, respectively, due in monthly installments with fixed maturity at October 2013, secured  by related real-estate  365   2,824   365   3,031 
Total debt  67,365   134,084   59,083   107,956 
Capital lease obligations, secured by related revenue  equipment  1,098   12,472   -   - 
                 
Total debt and capital lease obligations $68,463  $146,556  $59,083  $107,956 


In September 2008, Covenant Transport, Inc., a Tennessee corporation ("CTI"), CTGL, Covenant Asset Management, Inc., a Nevada corporation ("CAM"), Southern Refrigerated Transport, Inc., an Arkansas corporation ("SRT"), Covenant Transport Solutions, Inc., a Nevada corporation ("Solutions"), Star Transportation, Inc., a Tennessee corporation ("Star";the Company and collectively with CTI, CTGL, CAM, SRT, and Solutions, the "Borrowers"; and each of which is a direct or indirect wholly-owned subsidiary of Covenant Transportation Group, Inc.), and Covenant Transportation Group, Inc.substantially all its subsidiaries entered into a Third Amended and Restated Credit AgreementFacility with Bank of America, N.A., as agent (the "Agent"), JPMorgan Chase Bank, N.A. ("JPM"), and Textron Financial Corporation ("Textron"); and collectively with the Agent, and JPM, the "Lenders"("Lenders") that matures September 2011 (the "Credit Agreement"Facility").

The Credit AgreementFacility is structured as an $85.0 million revolving credit facility, with an accordion feature that, so long as no event of default exists, allows the BorrowersCompany to request an increase in the revolving credit facility of up to $50.0 million.  Borrowings under the Credit Agreement are classified as either "base rate loans" or "LIBOR loans". As of December 31, 2008, base rate loans accrued interest at a base rate equal to the Agent's prime rate plus an applicable margin that adjusted quarterly between 0.625% and 1.375% based on average pricing availability.  LIBOR loans accrued interest at LIBOR plus an applicable margin that adjusted quarterly between 2.125% and 2.875% based on average pricing availability.  The applicable margin was 2.625% at December 31, 2008.  The Credit AgreementFacility includes, within its $85.0 million revolving credit facility, with an accordion feature that, so long as no event of default exists, allows the Company to request an increase in the revolving credit facility of up to $50.0 million.  The Credit Facility includes, within its $85.0 million revolving credit facility, a letter of credit sub facility in an aggregate amount of $85.0 million and a swing line sub facility in an aggregate amount equal to the greater of $10.0 million or 10% of the Lenders' aggregate commitments under the Credit AgreementFacility from time to time.

Borrowings under the Credit Facility are classified as either "base rate loans" or "LIBOR loans".  Base rate loans accrue interest at a base rate equal to the greater of the prime rate, the federal funds rate plus 0.5%, or LIBOR plus 1.0%, plus an applicable margin that is adjusted quarterly between 2.5% and 3.25% based on average pricing availability.  LIBOR loans accrue interest at the greater of 1.5% or LIBOR, plus an applicable margin that is adjusted quarterly between 3.5% and 4.25% based on average pricing availability.  The unused line fee is adjusted quarterly based between 0.25%0.5% and 0.375%0.75% of the average daily amount by which the Lenders' aggregate revolving commitments under the Credit AgreementFacility exceed the outstanding principal amount of revolver loans and the aggregate undrawn amount of all outstanding letters of credit issued under the Credit Agreement.Facility.  The obligations of the Borrowers under the Credit AgreementFacility are guaranteed by Covenant Transportation Group, Inc.the Company and secured by a pledge of substantially all of the Borrowers'Company's assets, with the notable exclusion of any real estate or revenue equipment financed with purchase money debt,pledged under other financing agreements, including without limitation, tractors financed through the Company's $200.0 million line of credit from Daimler Truck Financial.revenue equipment installment notes and capital leases.

Borrowings under the Credit AgreementFacility are subject to a borrowing base limited to the lesser of (A) $85.0 million, minus the sum of the stated amount of all outstanding letters of credit; or (B) the sum of (i) 85% of eligible accounts receivable, plus (ii) the lesser of (a) 85% of the appraised net orderly liquidation value of eligible revenue equipment, (b) 95% of the net book value of eligible revenue equipment, or (c) 35% of the Lenders' aggregate revolving commitments under the Credit Agreement,Facility, plus (iii) the lesser of (a) $25.0 million or (b) 65% of the appraised fair market value of eligible real estate.  The borrowing base is limited by a $15.0 million availability block, plus any other reserves as the Agent may establish in its judgment.  The Company had approximately $3.8$12.7 million in borrowings outstanding under the Credit AgreementFacility as of December 31, 2008, and had2009, undrawn letters of credit outstanding of approximately $40.6$42.0 million, and available borrowing capacity of $27.7 million.  At December 31, 2007, the Company had undrawn letters of creditThe weighted average interest rate on outstanding of approximately $62.5 million.

The Credit Agreement includes usual and customary events of default for a facility of this nature and provides that, upon the occurrence and continuation of an event of default, payment of all amounts payable under the Credit Agreement may be accelerated, and the Lenders' commitments may be terminated. The Credit Agreement contains certain restrictions and covenants relating to, among other things, dividends, liens, acquisitions and dispositions outside of the ordinary course of business, and affiliate transactions.  The Credit Agreement contains a single financial covenant, which requires the Company to maintain a consolidated fixed charge coverage ratio of at least 1.0 to 1.0.  The financial covenant became effective October 31, 2008 and the Companyborrowings was in compliance at December 31, 2008.6.3%.

On March 27, 2009, the Company obtained an amendment to its Credit Agreement,Facility, which, among other things, (i) retroactively to January 1, 2009 amended the fixed charge coverage ratio covenant for January and February 2009 to the actual levels achieved, which cured our default of that covenant for January 2009, (ii) restarted the look back requirements of the fixed charge coverage ratio covenant beginning on March 1, 2009, (iii) increased the EBITDAR portion of the fixed charge coverage ratio definition by $3,000,000$3.0 million for all periods between March 1 to December 31, 2009, (iv) increased the base rate applicable to base rate loans to the greater of the prime rate, the federal funds rate plus 0.5%, or LIBOR plus 1.0%, (v) sets a LIBOR floor of 1.5%, (vi) increased the applicable margin for base rate loans to a range between 2.5% and 3.25% and for LIBOR loans to a range between 3.5% and 4.25%, with 3.0% (for base rate loans) and 4.0% (for LIBOR loans) to be used as the applicable margin through September 2009, (vii) increased the Company's letter of credit facility fee by an amount corresponding to the increase in the applicable margin, (viii) increased the unused line fee to a range between 0.5% and 0.75%, and (ix) increased the maximum number of field examinations per year from three to four.  In exchange for these amendments, the Company agreed to the increases in interest rates and fees described above and paid fees of approximately $544,000.$0.5 million.

The Credit Facility includes usual and customary events of default for a facility of this nature and provides that, upon the occurrence and continuation of an event of default, payment of all amounts payable under the Credit Facility may be accelerated, and the Lenders' commitments may be terminated.  The Credit Facility contains certain restrictions and covenants relating to, among other things, dividends, liens, acquisitions and dispositions outside of the ordinary course of business, and affiliate transactions.  The Credit Facility contains a single financial covenant, which required the Company to maintain a consolidated fixed charge coverage ratio of at least 1.0 to 1.0.  The fixed charge coverage covenant became effective October 31, 2008, and the Company was in compliance with the covenant as of December 31, 2009.

On February 25, 2010, the Company obtained an additional amendment to its Credit Facility, which, among other things (i) amended certain defined terms in the Credit Facility, (ii) retroactively to January 1, 2010, amended the fixed charge coverage ratio covenant through June 30, 2010, to the levels set forth in the table below, which prevented a default of that covenant for January 2010, (iii) restarted the look back requirements of the fixed coverage ratio covenant beginning on January 1, 2010, and (iv) required the Company to order updated appraisals for certain real estate described in the Credit Facility.  In exchange for these amendments, we agreed to pay the Agent, for the pro rata benefit of the Lenders, a fee equal to 0.125% of the Lenders' total commitments under the Credit Facility, or approximately $0.1 million.  Following the effectiveness of the amendment, our fixed charge coverage ratio covenant requirement will be as follows:

One month ending January 31, 2010.80 to 1.00
Two months ending February 28, 2010.65 to 1.00
Three months ending March 31, 2010.72 to 1.00
Four months ending April 30, 2010.80 to 1.00
Five months ending May 31, 2010.85 to 1.00
Six months ending June 30, 2010.90 to 1.00
Seven months ending July 31, 20101.00 to 1.00
Eight months ending August 31, 20101.00 to 1.00
Nine months ending September 30, 20101.00 to 1.00
Ten months ending October 31, 20101.00 to 1.00
Eleven months ending November 30, 20101.00 to 1.00
Twelve months ending December 31, 20101.00 to 1.00
Each rolling twelve-month period thereafter1.00 to 1.00


On June 30, 2008,
Capital lease obligations are utilized to finance a portion of our revenue equipment and are entered into with certain finance companies who are not parties to our Credit Facility.  The leases terminate in January 2015 and contain guarantees of the residual value of the related equipment by the Company, secured a $200.0 million lineand the residual guarantee's are included in the related debt balance as balloon payment at the end of credit from Daimler Financial (the "Daimler Facility").  The Daimler Facility is secured by both newthe related term as well as included in the future minimum lease payments.  These lease agreements require us to pay personal property taxes, maintenance and used tractors and is structured as a combination of retail installment contracts and TRAC leases.operating expenses.

Pricing for the Daimler Facility is at (i)revenue equipment installment notes are quoted by Daimlerthe respective financial captives of our primary revenue equipment suppliers at the funding of each group of equipment acquired and consists ofinclude fixed annual rates for new equipment under retail installment contractscontracts.  Approximately $185.6 million and (ii) a rate of 6% annually on used equipment financed on June 30, 2008.  Approximately $159.8 million waswere reflected on our balance sheet under the Daimler Facilityfor these installment notes at December 31, 2008.2009 and 2008, respectively.  The notes included in the Daimler funding are due in monthly installments with final maturities at various dates ranging from DecemberJanuary 2010 to December 2011.June 2013.  The Daimler Facility containsnotes contain certain requirements regarding payment, insurance of collateral, and other matters, but doesdo not have any financial or other material covenants or events of default.

Additional borrowings underfrom the Daimler Facilityfinancial captives of our primary revenue equipment suppliers are available to fund new tractors expected to be delivered in 2009.  Following relatively modest capital expenditures in 2007 and in the first half of 2008, we increased net capital expenditures in the last half of 2008 and we expect net capital expenditures (primarily consisting of revenue equipment) to increase significantly over the next 12 to 18 months consistent with our expected tractor replacement cycle.  The Daimler Facility includes a commitment to fund most or all of the expected tractor purchases.  The annual interest rate on the new equipment is approximately 200 basis points over the like-term rate for U.S. Treasury Bills, and the advance rate is 100% of the tractor cost.  A leasing alternative is also available.2010.

8.       ALLOWANCE FOR DOUBTFUL ACCOUNTS

The activityAs of December 31, 2009, the scheduled principal payments of debt, excluding capital leases for which future payments are discussed in allowance for doubtful accounts for accounts receivable  (in thousands) isNote 9 are as follows:

 
Years ended December 31:
 
Beginning
balance
January 1,
 
Additional
provisions
to allowance
 
Write-offs
and other
deductions
 
Ending
balance
December 31,
         
2008 $1,537 $987 $1,040 $1,484
         
2007 $1,491 $1,163 $1,117 $1,537
         
2006 $2,200 $590 $1,299 $1,491
         
  (in thousands) 
2010 $67,365 
2011 $65,572 
2012 $64,851 
2013 $3,661 
2014 $0 
Thereafter $0 

9.           LEASES

The Company has operating lease commitments for office and terminal properties, revenue equipment, and computer and office equipment and capital lease commitments for revenue equipment, exclusive of owner/operator rentals and month-to-month equipment rentals, summarized for the following fiscal years (in thousands):

2009 $23,857 
  Operating  Capital 
2010  19,658  $22,898   $2,177 
2011  8,572   9,650    2,177 
2012  7,290   7,668    2,177 
2013  4,834   5,358    2,177 
2014  3,216    8,064 
Thereafter  34,748   33,199    1,280 

A portion of the Company's operating leases of tractors and trailers contain residual value guarantees under which the Company guarantees a certain minimum cash value payment to the leasing company at the expiration of the lease.  The Company estimates that the residual guarantees are approximately $21.4$23.6 million and $36.3$21.4 million at December 31, 2009 and 2008, respectively.  Approximately $12.7 million and 2007,$10.9 million of the residual guarantees at December 31, 2009 expire in 2010 and 2011, respectively.  The Company expects its residual guarantees to approximate the expected market value at the end of the lease term.  Additionally, certain leases contain cross-default provisions with other financing agreements and additional charges if the unit's mileage exceeds certain thresholds defined in the lease agreement.


Rental expense is summarized as follows for each of the three years ended December 31:

(in thousands) 2009  2008  2007 
          
Revenue equipment rentals $25,863  $31,219  $33,546 
Building and lot rentals  3,976   3,884   4,067 
Other equipment rentals  1,829   2,097   2,759 
  $31,668  $37,200  $40,372 
(in thousands) 2008  2007  2006 
          
Revenue equipment rentals $31,783  $33,546  $42,129 
Building and lot rentals  3,884   4,067   3,508 
Other equipment rentals  2,097   2,759   3,311 
  $37,764  $40,372  $48,948 

In April 2006, the Company entered into a sale leaseback transaction involving our corporate headquarters, a maintenance facility, a body shop, and approximately forty-six acres of surrounding property in Chattanooga, Tennessee. The Company received proceeds of approximately $29.6 million from the sale of the property, which was used to pay down borrowings under its Credit Agreement and to purchase revenue equipment.  In the transaction, the Company entered into a twenty-year lease agreement, whereby it will lease back the property at an annual rental rate of approximately $2.5 million subject to annual rent increases of 1.0%, resulting in annual straight-line rental expense of approximately $2.7 million.million, which comprises a significant portion of building rentals above.  The transaction resulted in a gain of approximately $2.1 million, which is being amortized ratably over the life of the lease.lease, noting $1.8 million of the deferred gain is included in other long-term liabilities in the consolidated balance sheet.

10.           INCOME TAXES

Income tax expense (benefit) from continuing operations for the years ended December 31, 2009, 2008, 2007 and 20062007 is comprised of:

(in thousands) 2008  2007  2006  2009  2008  2007 
                  
Federal, current $(208) $(6,202) $784  $189  $(208) $(6,202)
Federal, deferred  (10,901)  (498)  3,415   (4,547)  (10,901)  (498)
State, current  72   (78)  138   (34)  72   (78)
State, deferred  (1,755)  1,198   245   (626)  (1,755)  1,198 
 $(12,792) $(5,580) $4,582  $(5,018) $(12,792) $(5,580)

Income tax expense from continuing operations varies from the amount computed by applying the federal corporate income tax rate of 35% to income before income taxes for the years ended December 31, 2009, 2008, 2007 and 20062007 as follows:

(in thousands) 2008  2007  2006  2009  2008  2007 
                  
Computed "expected" income tax expense $(23,164) $(7,809) $1,120  $(10,517) $(23,164) $(7,809)
State income taxes, net of federal income tax effect  (2,316)  (781)  96   (1,050)  (2,316)  (781)
Per diem allowances  2,769   2,371   2,233   3,320   2,769   2,371 
Tax contingency accruals  13   (105)  470   (216)  (131)  (105)
Nondeductible foreign operating loss  298   290   294 
Nondeductible foreign operating (income) loss  (504)  298   290 
Nondeductible goodwill impairment  9,498   -   -   -   9,498   - 
Realization of outside basis difference related to Transplace  2,599   -   - 
Valuation allowance  1,896   -   - 
Disallowed interest  (189)  -   - 
Other, net  110   454   369   (357)  254   454 
Actual income tax expense $(12,792) $(5,580) $4,582  $(5,018) $(12,792) $(5,580)


The temporary differences and the approximate tax effects that give rise to the Company's net deferred tax liability at December 31, 20082009 and 20072008 are as follows:

(in thousands)
 2008  2007  2009  2008 
            
Net deferred tax assets:            
Allowance for doubtful accounts
 $412  $378  $702  $412 
Insurance and claims
  11,087   10,469   7,594   11,087 
Net operating loss carryovers
  13,625   2,601   38,398   13,625 
Capital loss carryover related to Transplace  1,671   - 
Investments
  163   163   -   163 
Other accrued liabilities
  988   910   476   988 
Other, net
  2,221   1,245   4,933   2,221 
Valuation allowance  (1,896)  - 
Total net deferred tax assets  28,496   15,766   51,878   28,496 
                
Net deferred tax liabilities:                
Property and equipment
  (56,865)  (51,773)  (71,127)  (56,865)
Intangible and other assets
  (1,797)  (1,952)  (1,899)  (1,797)
Prepaid expenses
  (2,374)  (1,459)  (2,919)  (2,374)
Total net deferred tax liabilities  (61,036)  (55,184)  (75,945)  (61,036)
                
Net deferred tax liability $(32,540) $(39,418) $(24,067) $(32,540)

Based upon
68

The carrying value of the expected reversal ofCompany's deferred tax liabilitiesassets assumes that it will be able to generate, based on certain estimates and the level of historical and projectedassumptions, sufficient future taxable income over periods in whichcertain tax jurisdictions to utilize these deferred tax benefits.  If these estimates and related assumptions change in the future, it may be required to establish a valuation allowance against the carrying value of the deferred tax assets, are deductible,which would result in additional income tax expense.  On a periodic basis, the Company assesses the need for adjustment of the valuation allowance.  There was no valuation allowance in 2008 or 2007.  Based on forecasted taxable income and tax planning strategies available to the Company, no valuation allowance has been established at December 31, 2009, except for $0.3 million related to certain state net operating loss carryforwards and $1.6 million related to the deferred tax asset associated with the Company's managementcapital loss generated by the loss on the sale of its investment in Transplace.  These valuation allowances were established because the Company believes that it is more likely than not that certain state net operating loss carryforwards and the Companycapital loss carryforward related to Transplace will realizenot be realized.  If these estimates and related assumptions change in the benefitsfuture, it may be required to modify its valuation allowance against the carrying value of the deductible differences at December 31, 2008. However, there can be no assurance that the Company will meet our forecasts of future income.deferred tax assets.

In July 2006,The activity in the FASB issued Interpretation No. 48, Accounting for Uncertainty in Income Taxes ("FIN 48"). valuation allowance on deferred tax assets (in thousands) is as follows:


Year ended December 31:
 
Beginning
balance
January 1,
  
Additional
provisions
to allowance
  
Write-offs
and other
deductions
  
Ending
balance
December 31,
 
             
2009 $-  $1,896  $-  $1,896 

The Company was required to adopt the provisions of FIN 48,FASB's new guidance on accounting for uncertain tax positions, effective January 1, 2007.  This Interpretationguidance clarifies the accounting for uncertainty in income taxes recognized in an enterprise's financial statements in accordance with SFAS No. 109 and prescribes a recognition threshold of more-likely-than-not to be sustained upon examination.  As a result of this adoption, the Company recognized additional tax liabilities of $0.3 million with a corresponding reduction to beginning retained earnings as of January 1, 2007.  As of December 31, 2007,2009, the Company had a $2.6$3.1 million liability recorded for unrecognized tax benefits, which includedincludes interest and penaltypenalties of $0.7$1.0 million.  The Company recognizes interest and penalties accrued related to unrecognized tax benefits in tax expense.  As of December 31, 2008, the Company had a $2.8 million liability recorded for unrecognized tax benefits, which includesincluded interest and penaltiespenalty of $0.8 million.  The Company recognizes interestInterest and penalties accrued related to unrecognizedrecognized for uncertain tax benefitspositions were approximately $0.2 million, $0.1 million, and $0.1 million in tax expense.2009, 2008, and 2007, respectively.

The following tables summarize the annual activity related to the Company's gross unrecognized tax benefits (in thousands) for the years ended December 31, 2009, 2008, and 2007:

 2008  2007  2009  2008  2007 
Balance as of January 1, $1,923  $2,295  $1,971  $1,923  $2,295 
Increases related to prior year tax positions
  206   53   67   206   53 
Decreases related to prior year positions
  (3)  (439)  (3)  (3)  (439)
Increases related to current year tax positions
  17   159   279   17   159 
Decreases related to settlements with taxing authorities
  (28)  (69)  (122)  (28)  (69)
Decreases related to lapsing of statute of limitations
  (144)  (76)  (55)  (144)  (76)
Balance as of December 31, $1,971  $1,923  $2,137  $1,971  $1,923 

If recognized, $1.8$2.1 million and $1.7$1.8 million of unrecognized tax benefits would impact the Company's effective tax rate as of December 31, 20082009 and 20072008 respectively.  Any prospective adjustments to the Company's reserves for income taxes will be recorded as an increase or decrease to its provision for income taxes and would impact our effective tax rate. In addition, the Company accrues interest and penalties related to unrecognized tax benefits in its provision for income taxes. The gross amount of interest and penalties accrued was approximately $0.8 million as of December 31, 2008 and 2007, of which $0.1 million and $0.3 million were recognized in 2008 and 2007, respectively.


The Company's 20042006 through 20082009 tax years remain subject to examination by the IRS for U.S. federal tax purposes, the Company's major taxing jurisdiction.  In the normal course of business, the Company is also subject to audits by state and local tax authorities.  While it is often difficult to predict the final outcome or the timing of resolution of any particular tax matter, the Company believes that its reserves reflect the more likely than not outcome of known tax contingencies.  The Company adjusts these reserves, as well as the related interest, in light of changing facts and circumstances.  Settlement of any particular issue would usually require the use of cash.  Favorable resolution would be recognized as a reduction to the Company's annual tax rate in the year of resolution.  The Company does not expect any significant increases or decreases for uncertain income tax positions during the next twelve months.

At December 31, 2008, the Company has
69

The Company's federal net operating loss carryforwards for federal income tax purposes of approximately $10.3 million, which are available to offset future federal taxable income, if any, through 2028.  In addition, the Company has2029, while its state net operating loss carryforwards and state tax credits with potential tax benefits of approximately $3.3 million, net of federal income tax benefit; these carryforwards expire over various periods through 2029 based on jurisdiction.  The capital loss carryforward related to the loss on the investment in Transplace is available to offset future capital gains through 2014.

11.           STOCK REPURCHASE PLAN

In May 2007, the Board of Directors approved an extension of the Company's previously approved stock repurchase plan for up to 1.3 million Company shares to be purchased in the open market or through negotiated transactions subject to criteria established by the Board.  No shares were purchased under this plan during 2009, 2008, 2007 or 2006.2007.  The stock repurchase plan expiresexpired on June 30, 2009.  However, as discussed in Note 4, we remitted approximately $0.1 million to the proper taxing authorities in satisfaction of the employees' minimum statutory withholding requirements related to employees' vesting in restricted share grants.  The tax withholding amounts paid by the Company have been accounted for as a repurchase of shares.  Our Credit AgreementFacility prohibits the repurchase of any shares.shares, except those purchased to off-set an employee's minimum statutory withholding requirements upon the vesting of equity awards, without obtaining approval from the lenders.

12.           DEFERRED PROFIT SHARING EMPLOYEE BENEFIT PLAN

The Company has a deferred profit sharing and savings plan under which all of its employees with at least six months of service are eligible to participate.  Employees may contribute a percentage of their annual compensation up to the maximum amount allowed by the Internal Revenue Code.  The Company may make discretionary contributions as determined by a committee of its Board of Directors.  The Company made minimal contributions in 2009 and contributed approximately $1.3 and $1.2 million in 2008 and approximately $1.2 million in 2007, and 2006,respectively, to the profit sharing and savings plan.  The Board approved the suspension of employee matching "discretionary" contributions to be made beginning early in 2009 for an indefinite time period.

13.           RELATED PARTY TRANSACTIONS

Transactions involvingAs discussed in Note 5, from July 2001 through December 2009, we owned approximately 12.4% of Transplace and had receivables from Transplace related parties are as follows:

Theto a bridge loan made in 2005 and related accrued interest.  In addition, the Company provides transportation services to Transplace. During 2008, 2007, and 2006,Transplace which provided for gross revenue from services provided to Transplace wasrevenues of approximately $18.8 million, $26.2 million, and $16.0 million during 2009, 2008, and $12.9 million,2007, respectively.  The trade accounts receivable balance as of December 31, 2008 was approximately $4.7 million. During the first quarter of 2005, the Company loaned Transplace approximately $2.7 million. Transplace paid down $0.1 million of principal and all accumulated accrued interest through September 14, 2006 during September 2006.  The remaining $2.6 million, 6% interest-bearing note matures January 2009, an extension of the original January 2007 maturity date.

AAdditionally, a company wholly owned by a relative of a significant shareholder and executive officer operated a "company store" on a rent-free basis in the Company's headquarters building, and used Covenant service marks on its products at no cost.  The "company store" ceased operations in 2008.  The Company payspaid fair market value for all supplies that arewere purchased which totaled approximately $45,000, $117,000less than $0.1 million and $163,000$0.1 million in 2008 2007, and 20062007, respectively.

14.           DERIVATIVE INSTRUMENTS

The Company accounts for derivative instrumentsengages in accordance with SFAS No. 133, Accounting for Derivative Instruments and Hedging Activities (as amended, "SFAS No. 133").  SFAS No. 133 requiresactivities that all derivative instruments be recorded onexpose it to market risks, including the balance sheet at their fair value.  Changeseffects of changes in the fair value of derivativesfuel prices.  Financial exposures are recorded each period in current earnings or in other comprehensive income, depending on whether a derivative is designatedevaluated as an integral part of a hedging relationship and, if it is, depending on the type of hedging relationship.


With the Company's acquisitionrisk management program, which seeks, from time to time, to reduce potentially adverse effects that the volatility of Star (see Note 15)fuel markets may have on September 14, 2006, it assumedoperating results.  In an interest rate swap agreement which became effective September 2005.  Under this swap contract,effort to seek to reduce the Company paid interest expense at a fixed ratevariability of 5.36% and receive interest income at a variable rate of LIBOR plus 1.25%. This swap was terminated in December 2006.

In 2001, the Company entered into two $10.0 million notional amount cancelable interest rate swap agreements to manage the risk of variability inultimate cash flows associated with floating-rate debt.  Due to the counter-parties' imbedded options to cancel, these derivatives didfluctuations in diesel fuel prices, we periodically enter into various derivative instruments, including forward futures swap contracts.  The Company does not qualify, and were not designated as hedgingengage in speculative transactions, nor does it hold or issue financial instruments under SFAS No. 133. Consequently, these derivatives were marked to fair value through earnings, in other expense in the accompanying consolidated statements of operations.  At December 31, 2006, the swap agreements had expired and there was no liability. The derivative activity, as reported in the consolidated financial statements for the year ended December 31, 2006 is summarized in the following table:

(in thousands) 2006 
    
Net liability for derivatives at January 1, $(13)
     
Gain in value of derivative instruments that did not qualify as hedging instruments  13 
     
Net liability for derivatives at December 31, $- 

Fromtrading purposes.  Additionally, from time to time, the Company enters into fuel purchase commitments for a notional amount of diesel fuel at prices which are determined when fuel purchases occur. As of December 31, 2008, we had no derivative financial instruments to reduce our exposure to fuel price fluctuations.

15.    ACQUISITION

On September 14, 2006, the Company acquired 100% of the outstanding stock of Star, a short-to-medium haul dry van regional truckload carrier based in Nashville, Tennessee. The acquisition included 614 tractors and 1,719 trailers. The total purchase price of approximately $40.1 million has been allocated to tangible and intangible assets acquired and liabilities assumed based on their fair market values as of the acquisition date in accordance with SFAS No. 141, "Business Combinations". Star's operating results have been accounted for in the Company's consolidated results of operations since the acquisition date.

The following table summarizesCompany did not enter into any derivatives until the Company's fair valuethird quarter of 2009; however, in September 2009, we entered into forward futures swap contracts, which pertain to 2.5 million gallons or approximately 4% percent of our projected January through December 2010 fuel requirements.  Under these contracts, we pay a fixed rate per gallon of heating oil and receive the assets acquiredmonthly average price of New York heating oil, noting the retrospective and liabilities assumed atprospective regression analyses provided that changes in the dateprices of acquisition:diesel fuel and heating oil were deemed to be highly effective based on the relevant authoritative guidance.

(in thousands)
Current assets $10,970 
Property and equipment  62,339 
Deferred tax assets  275 
Other assets – Interest rate swap  252 
Identifiable intangible assets:    
Tradename (4-year estimated useful life)
  920 
Noncompetition agreement (7-year useful life)
  1,000 
Customer relationships (20-year estimated useful life)
  3,490 
Goodwill  24,655 
Total assets
 $103,901 
     
Current liabilities $13,181 
Long-term debt, net of current maturities  36,298 
Deferred tax liabilities  14,361 
Total liabilities
 $63,840 
     
Total purchase price $40,061 


The total purchase price
We perform, at least quarterly, both a prospective and retrospective assessment of $40.1 million included purchase price consideration paidthe effectiveness of our hedge contracts, including assessing the possibility of counterparty default.  If we determine that a derivative is no longer expected to be highly effective, we discontinue hedge accounting prospectively and recognize subsequent changes in the fair value of the hedge in earnings.  As a result of our effectiveness assessment at December 31, 2009, we believe our hedge contracts will continue to be highly effective in offsetting changes in cash flow attributable to the selling shareholdershedged risk.

We recognize all derivative instruments at fair value on our consolidated balance sheet.  The Company's derivative instruments are designated as cash flow hedges, thus the effective portion of Star,the gain or their respective escrow agents, totaling $38.8loss on the derivative is reported as a component of accumulated other comprehensive income and will be reclassified into earnings in the same period during which the hedged transaction affects earnings.  The effective portion of the derivative represents the change in fair value of the hedge that offsets the change in fair value of the hedged item.  To the extent the change in the fair value of the hedge does not perfectly offset the change in the fair value of the hedged item, the ineffective portion of the hedge is immediately recognized in other  income on our consolidated statements of operations. 

As of December 31, 2009, the derivatives had a fair value of approximately $0.5 million, andwhich is included in other assets in the consolidated balance sheet.  Approximately 93% of the related change in fair value or $0.3 million, net of acquisition-related costs, as well as an additional 3-year acquisition obligation note payable totaling $1.0tax of $0.2 million, to onewas deemed effective and thus is included in accumulated other comprehensive income, while the remainder of the selling shareholderschange which represents the ineffective portion of Star related to her 7-year noncompetition agreement.

The following pro forma financial information reflectsthe change in the hedge is included in other expense, net in the Company's consolidated summarized results of operationsfinancial statements.  No amounts were reclassified from accumulated other comprehensive income to earnings given the futures swap contracts are forward starting in 2010 and as if the acquisition of Star had taken place on January 1, 2006. The pro forma financial information is not necessarily indicativesuch there have been no transactions involving purchases of the resultsrelated diesel fuel being hedged.
Based on fair values as it would have been ifof December 31, 2009 and the acquisition had been effectedexpected timing of the purchases of the diesel hedged, we expect to reclassify $0.5 million of gains on derivative instruments from accumulated other comprehensive income to earnings during the next twelve months due to the actual diesel fuel purchases.  However, the amounts actually realized will be dependent on the assumedfair values as of the date and is not necessarily indicative of future results:settlement.

(in thousands, except per share data) Year ended December 31, 2006 
Pro forma revenues $744,813 
Pro forma net income $389 
Pro forma basic and diluted earnings per share $0.03 
     
Outstanding financial derivative instruments expose us to credit loss in the event of nonperformance by the counterparties to the agreements.  However, we do not expect any of the counterparties to fail to meet their obligations.  Our credit exposure related to these financial instruments is represented by the fair value of contracts reported as assets.  To manage credit risk, we review each counterparty's audited financial statements, credit ratings, and obtain references.

Pursuant to FASB Statement of Financial Accounting Standard No. 142, Goodwill and Other Intangible Assets, the Company conducted goodwill impairment testing in light of the current diminished market conditions and declining market outlook for its Star Transportation operating subsidiary, which was acquired in September of 2006. Because we identified an indication of potential impairment, we engaged an independent third party to assist us in the completion of valuations used in the impairment testing process.  The completion of this work concluded that the goodwill previously recorded for the Star acquisition was fully impaired and resulted in a $24.7 million, or $1.75 per basic and diluted share, non-cash goodwill impairment charge, recorded in the fourth quarter of 2008. There was no tax benefit associated with this nondeductible charge.

16.15.           COMMITMENTS AND CONTINGENT LIABILITIES

From time to time, the Company is a party to ordinary, routine litigation arising in the ordinary course of business, most of which involves claims for personal injury and property damage incurred in connection with the transportation of freight.  The Company maintains insurance to cover liabilities arising from the transportation of freight for amounts in excess of certain self-insured retentions.  In management's opinion, the Company's potential exposure under pending legal proceedings is adequately provided for in the accompanying consolidated financial statements.

Financial risks, which potentially subject theThe Company to concentrationshad $42.0 million and $40.6 million of outstanding and undrawn letters of credit risk, consistas of deposits in banks in excessDecember 31, 2009 and 2008, respectively.  The letters of credit are maintained primarily to support the Federal Deposit Insurance Corporation limits. The Company's sales are generally made on account without collateral. Repayment terms vary based on certain conditions. insurance programs.
The Company maintains reserves, which it believeshad commitments outstanding at December 31, 2009, to acquire revenue equipment and communications equipment for totaling approximately $97.2 million in 2010.  These commitments are adequatecancelable, subject to provide for potential credit losses. The majoritycertain adjustments in the underlying obligations and benefits.  These purchase commitments are expected to be financed by operating leases, capital leases, long-term debt, proceeds from sales of its customer base spans the United States.existing equipment, and/or cash flows from operations.  The Company monitors these risksalso had commitments outstanding at December 31, 2009, to acquire computer software totaling $0.4 million in 2010 and believes the risk of incurring material losses is remote.2011.

16.           SEGMENT INFORMATION

As previously discussed, we have two reportable segments: Asset-Based Truckload Services and our Brokerage Services.

The accounting policies of the segments are the same as those described in the summary of significant accounting policies.  Substantially all intersegment sales prices are market based.  The Company uses purchase commitments through suppliers to reduce a portionevaluates performance based on operating income of its cash flow exposure to fuel price fluctuations.the respective business units.

"Unallocated Corporate Overhead" includes expenses that are incidental to our activities and are not specifically allocated to one of the segments.


Year Ended December 31, 2009
 
 
Truckload
  
 
Brokerage
  Unallocated Corporate Overhead  
 
Consolidated
 
Revenue – external customers $541,325  $58,771  $-  $600,096 
Intersegment revenue  -   (11,409)  -   (11,409)
Operating income (loss) (1)  10,552   155   (15,429)  (4,722)
Depreciation and amortization  46,482   374   1,266   48,122 
Goodwill at carrying value  11,539   -   -   11,539 
Total assets  369,979   7,856   20,477   398,312 
Capital expenditures, net  60,946   104   1,958   63,008 
                 
Year Ended December 31, 2008                
Revenue – external customers $719,220  $74,474  $-  $793,694 
Intersegment revenue  -   (19,780)  -   (19,780)
Operating income (loss) (2)  (37,091)  466   (19,054)  (55,679)
Depreciation and amortization (3)  61,888   81   1,266   63,235 
Goodwill at carrying value  11,539   -   -   11,539 
Total assets  351,831   11,770   30,075   393,676 
Capital expenditures, net  58,587   222   3,837   62,646 
                 
Year Ended December 31, 2007                
Revenue – external customers $692,722  $26,716  $-  $719,438 
Intersegment revenue  -   (6,912)  -   (6,912)
Operating income (loss) (4)  (7,011)  1,031   (4,701)  (10,681)
Depreciation and amortization (4)  53,169   18   354   53,541 
Goodwill at carrying value  36,210   -   -   36,210 
Total assets  419,225   726   19,843   439,794 
Capital expenditures, net  10,161   217   730   11,108 

(1)Unallocated corporate overhead includes $11.5 million loss on Transplace discussed in Note 5.
(2)Truckload segment includes $24.7 million goodwill impairment discussed in Note 7 and $15.8 million related to property and equipment impairments discussed in Note 6.
(3)Truckload segment includes $15.8 million related to property and equipment impairments discussed in Note 6.
(4)Truckload segment includes $1.7 million property and impairment discussed in Note 6.

17.           QUARTERLY RESULTS OF OPERATIONS (UNAUDITED)

  (in thousands except per share amounts) 
Quarters ended Mar. 31, 2009  June 30, 2009  Sep. 30, 2009  Dec. 31, 2009 
             
Freight revenue $122,129  $129,247  $133,332  $135,787 
Operating income (loss)  (5,145)  (637)  1,829   (769)
Net loss  (5,543)  (3,146)  (13,600)  (2,741)
Basic and diluted loss per share (1)  (0.39)  (0.22)  (0.96)  (0.19)

  (in thousands except per share amounts) 
             
Quarters ended Mar. 31, 2008  June 30, 2008  Sep. 30, 2008  Dec. 31, 2008 
             
Freight revenue $148,596  $160,451  $162,901  $143,862 
Operating loss  (9,594)  (256)  (720)  (45,109)
Net loss  (7,821)  (2,349)  (3,416)  (39,805)
Basic and diluted loss per share  (0.56)  (0.17)  (0.24)  (2.83)

(1)Quarter totals do not aggregate to annual loss per share due to rounding.
73

(in thousands except per share amounts)          
             
Quarters ended Mar. 31, 2007  June 30, 2007  Sep. 30, 2007  Dec. 31, 2007 
             
Freight revenue $143,542  $151,033  $148,531  $159,524 
Operating income (loss)  (2,744)  (11,072)  (2,168)  5,302 
Net income (loss)  (2,070)  (11,257)  (3,575)  176 
Basic and diluted earnings (loss) per share  (0.15)  (0.80)  (0.25)  0.01 

65