UNITED STATES
SECURITIES AND EXCHANGE COMMISSION
Washington, D.C. 20549
FORM 10-K
|
| |
x☒
| ANNUAL REPORT PURSUANT TO SECTION 13 OR 15(d) OF THE SECURITIES EXCHANGE ACT OF 1934 |
For the Fiscal Year Ended fiscal year ended December 31, 20162019
OR
|
| |
¨☐
| TRANSITION REPORT PURSUANT TO SECTION 13 OR 15(d) OF THE SECURITIES EXCHANGE ACT OF 1934 |
Commission file number: 001-35418
EPAM SYSTEMS, INC.
(Exact Namename of Registrantregistrant as Specifiedspecified in its Charter)charter)
|
| | |
| Delaware | | 22353610422-3536104 |
(State or other jurisdiction of incorporation or organization) | | (I.R.S. Employer Identification No.) |
| | |
| 41 University Drive | Suite 202 | 18940 |
| Newtown | Pennsylvania |
| (Address of principal executive offices) | (Zip code) |
EPAM Systems, Inc.
41 University Drive,
Suite 202
Newtown, Pennsylvania 18940
(Address of principal executive offices, including zip code)
267-759-9000267-759-9000
(Registrant’s telephone number, including area code)
Securities registered pursuant to Section 12(b) of the Act: |
| | |
| Title of Each Class | Trading Symbol | Name of Each Exchange on Whichwhich Registered |
| Common Stock, par value $0.001 per share | EPAM | New York Stock Exchange |
Securities registered pursuant to Section 12(g) of the Act: None.
Indicate by check mark if the registrant is a well-known seasoned issuer, as defined in Rule 405 of the Securities Act. Yesx☒ No ¨☐
Indicate by check mark if the registrant is not required to file reports pursuant to Section 13 or Section 15(d) of the Act. Yes ¨☐Nox☒
Indicate by check mark whether the registrant (1) has filed all reports required to be filed by Section 13 or 15(d) of the Securities Exchange Act of 1934 during the preceding 12 months (or for such shorter period that the registrant was required to file such reports), and (2) has been subject to such filing requirements for the past 90 days. Yesx☒ No ¨☐
Indicate by check mark whether the registrant has submitted electronically and posted on its corporate Web site, if any, every Interactive Data File required to be submitted and posted pursuant to Rule 405 of Regulation S-T (§ 232.405 of this chapter) during the preceding 12 months (or for such shorter period that the registrant was required to submit and post such files). Yesx☒ No ¨
Indicate by check mark if disclosure of delinquent filers pursuant to Item 405 of Regulation S-K is not contained herein and will not be contained, to the best of registrant’s knowledge, in definitive proxy or information statements incorporated by reference in Part III of this Form 10-K or any amendment to this Form 10-K. x☐
Indicate by check mark whether the registrant is a large accelerated filer, an accelerated filer, a non-accelerated filer, or a smaller reporting company, or an emerging growth company. See the definitions of “large accelerated filer,” “accelerated filer”filer,” “smaller reporting company,” and “smaller reporting“emerging growth company” in Rule 12b-2 of the Exchange Act. (Check one):
|
| | | | | | | | | | |
| Large accelerated filer | | x☒ | | Accelerated filer | | ¨ |
| ☐ | | Emerging growth company | | ☐ |
| Non-accelerated filer | | ¨ (Do not check if a smaller reporting company)
☐ | | Smaller reporting company | | ¨☐ | | | | |
If an emerging growth company, indicate by check mark if the registrant has elected not to use the extended transition period for complying with any new or revised financial accounting standards provided pursuant to Section 13(a) of the Exchange Act. ☐
Indicate by check mark whether the registrant is a shell company (as defined in Rule 12b-2 of the Exchange Act). Yes ¨☐ No x☒
As of June 30, 20162019 the aggregate market value of the registrant’s common stock held by non-affiliates of the registrant was approximately $3,092 million$9,127,000,000 based on the closing sale price as reported on the New York Stock Exchange. Solely for purposes of the foregoing calculation, “affiliates” are deemed to consist of each officer and director of the registrant, and each person known to the registrant to own 10% or more of the outstanding voting power of the registrant.
The numberAs of February 12, 2020, there were 55,259,184 shares of common stock $0.001 par value, of the registrant outstanding as of February 10, 2017 was 51,184,697 shares.outstanding.
DOCUMENTS INCORPORATED BY REFERENCE
The registrant intends to file a definitive Proxy Statement for its 20172020 annual meeting of stockholders pursuant to Regulation 14A within 120 days of the end of the registrant’s fiscal year ended December 31, 2016.2019. Portions of the registrant’s Proxy Statement are incorporated by reference into Part III of this Form 10-K. With the exception of the portions of the Proxy Statement expressly incorporated by reference, such document shall not be deemed filed with this Form 10-K.
EPAM SYSTEMS, INC.
FORM 10-K
FOR THE YEAR ENDED DECEMBER 31, 20162019
TABLE OF CONTENTS
In this annual report, “EPAM,” “EPAM Systems, Inc.,” the “Company,” “we,” “us” and “our” refer to EPAM Systems, Inc. and its consolidated subsidiaries.
“EPAM” is a trademark of EPAM Systems, Inc. “CMMI” is a trademark of the Software Engineering Institute of Carnegie Mellon University. “ISO 9001:2008”2015” and “ISO 27001:2013” are trademarks of the International Organization for Standardization. “ISAE” is a trademark of the International Federation of Accountants. All other trademarks and servicemarks used herein are the property of their respective owners.
Unless otherwise indicated, information contained in this annual report concerning our industry and the markets in which we operate, including our general expectations and market position, market opportunity and market share, is based on information from various sources (including industry publications, surveys and forecasts and our internal research), on assumptions that we have made, which we believe are reasonable, based on such data and other similar sources and on our knowledge of the markets for our services. The projections, assumptions and estimates of our future performance and the future performance of the industry in which we operate, are subject to a high degree of uncertainty and risk due to a variety of factors, including those described under “Item 1A. Risk Factors” and elsewhere in this annual report. These and other factors could cause results to differ materially from those expressed in the estimates included in this annual report.
SPECIAL NOTE REGARDING FORWARD-LOOKING STATEMENTS
This annual report on Form 10-K contains estimates and forward-looking statements, principally in “Item 1. Business,”Business”, “Item 1A. Risk Factors” and “Item 7. Management’s Discussion and Analysis of Financial Condition and Results of Operations.” Our estimates and forward-looking statements are mainly based on our current expectations and estimates of future events and trends, which affect or may affect our businesses and operations. Although we believe that these estimates and forward-looking statements are based upon reasonable assumptions, they are subject to several risks and uncertainties and are made in light of information currently available to us. Important factors, in addition to the factors described in this annual report, may materially and adversely affect our results as indicated in forward-looking statements. You should read this annual report and the documents that we have filed as exhibits hereto completely and with the understanding that our actual future results may be materially different from what we expect.
The words “may,” “will,” “should,” “could,” “expect,” “plan,” “anticipate,” “believe,” “estimate,” “predict,” “intend,” “potential,” “might,” “would,” “continue” or the negative of these terms or other comparable terminology and similar words are intended to identify estimates and forward-looking statements. Estimates and forward-looking statements speak only as of the date they were made and, except to the extent required by law, we undertake no obligation to update, to revise or to review any estimate and/or forward-looking statement because of new information, future events or other factors. Estimates and forward-looking statements involve risks and uncertainties and are not guarantees of future performance. As a result of the risks and uncertainties described above, the estimates and forward-looking statements discussed in this annual report might not occur and our future results, level of activity, performance or achievements may differ materially from those expressed in these forward-looking statements due to, including, but not limited to, the factors mentioned above, and the differences may be material and adverse. Because of these uncertainties, you should not place undue reliance on these forward-looking statements. We undertake no obligation to update or revise any forward-looking statements, whether as a result of new information, future events, or otherwise, except as may be required under applicable law.
GEOGRAPHICAL REFERENCES
We use the terms “CIS”, “CEE” and “APAC” to describe a portion of our geographic operations and assets. CIS, which stands for the Commonwealth of Independent States, is comprised of constituents of the former U.S.S.R., including Armenia, Azerbaijan, Belarus, Georgia, Kazakhstan, Kyrgyzstan, Moldova, Russia, Tajikistan, Turkmenistan, Ukraine and Uzbekistan. CEE, which stands for Central and Eastern Europe, includes Albania, Bosnia and Herzegovina, Bulgaria, Croatia, Czech Republic, Estonia, Hungary, Latvia, Lithuania, Poland, Republic of Macedonia, Romania, Serbia, Montenegro, Slovakia and Slovenia. APAC, which stands for Asia Pacific, includes all of Asia (including India) and Australia.
PART I
Item 1. Business
Company Background
EPAM delivers end-to-end value to its customers by combining its core engineering and technology capabilities with business and experience consulting. We aresupport our customers in a leading global providermarket that is constantly challenged by the pressures of software product development and digital platform engineering services to clients located around the world, primarily in North America, Europe, Asia and Australia. With a strong focus ondigitization through our innovative and scalable software solutions, high quality business consulting and experience design, and a continually evolving mix of advanced capabilities, we leverage industry standard and custom developed technology, tools and platforms to deliver results for the most complex business challenges.capabilities. We focus on building long-term partnerships with clients in industries such as financialour customers, enabling them to reimagine their businesses through a digital lens.
Our historical core competency, software development and product engineering services, travel and consumer, software and hi-tech, media and entertainment, life sciences and healthcare, and emerging.
Ourcombined with our work with global leaders in enterprise software platforms and emerging technology companies, has allowed us to develop vertical-specific domain expertise. Our culture of innovation, technology leadership, process excellence and high-quality project delivery has helped us continue to build a strong reputation in the marketplace.
Our historical core competency, software development and product engineering services, created our foundation for the evolution of our other offerings, which include advanced technology software solutions, intelligent enterprise services and digital engagement. Our strategic acquisitions have further expanded our global footprintgeographic reach and service offering portfolio, including our capabilities in the healthcare and financial services industries, as well as into include digital strategy and design, consulting and test automation. Weautomation and we expect our strategic acquisitions will continue to enable us to offer a broader range of services to our clientscustomers from a widerwide variety of locations.
Our ServicesBusiness Strategy
Our service offerings continuously evolve to provide more customized and integrated solutions to our customers where we combine best-in-class software engineering with customer experience design, business consulting and technology innovation services. We are continually expanding our service capabilities, moving beyond traditional services into business consulting, design and physical product development and areas such as artificial intelligence, robotics and virtual reality.
EPAM’s key service offerings and solutions include the following practice areas:
Engineering
Our engineering foundation underpins how we architect, build and scale next-generation software solutions and agile delivery teams. Our engineering expertise allows us to build enterprise technologies that improve business processes, offer smarter analytics and result in greater operational excellence through requirements analysis and platform selection, deep and complex customization, cross-platform migration, implementation and integration.
We use our experience, custom tools and specialized knowledge to integrate our customers’ chosen application platforms with their internal systems and processes and to create custom solutions filling the gaps in their platforms’ functionality in order to address the needs of the customers’ users and customers. We address our customers’ increased need for tighter enterprise integration between software development, testing and maintenance with private, public and mobile infrastructures through our infrastructure management services. These solutions cover the full software product development lifecycle from digital strategyof infrastructure management including application, database, network, server, storage and customer experience design to enterprise application platforms implementationsystems operations management, as well as monitoring, incident notification and programresolution. We deliver maintenance and support services through our proprietary distributed project management servicesprocesses and from complex software development servicestools, which reduce the time and costs related to maintenance, enhancement and support custom application development, application testing, and infrastructure management. Our key service offerings include:
Software Product Development Servicesactivities.
We providehave deep expertise and the ability to offer a comprehensive set of software product development services including product research, customer experience design and prototyping, program management, component design and integration, full lifecycle software testing, product deployment and end-user customization, performance tuning, product support and maintenance, managed services, as well as porting and cross-platform migration. We focus on software products covering a wide range of business applications as well as product development for multiple mobile platforms and embedded software product services.
Custom Application Development ServicesOperations
We offer complete custom application development services to meet the requirementsturn our customers’ operations into intelligent enterprise hubs with our proprietary platforms, integrated engineering practices and smart automation. Developing a digital experience or product from end-to-end requires input and expertise from a variety of businessesprofessionals with sophisticated application development needs not adequately supported by packaged applications or by existing custom solutions. Our custom application development services leverage our experience in software product development as well as our industry expertise, prebuilt application solution frameworks and specific software product assets. Oura broad range of services includes businessskills. Our multidisciplinary teams and technical requirements analysis, user experience design, solution architecture creationglobal delivery framework come together to deliver well-rounded technology solutions that bring a competitive advantage to our customers. In addition to utilizing our dedicated delivery centers, which allow us to deploy key delivery talent, we work closely with leading companies in various industries to enable our customers to better leverage technology and validation, development, component designaddress the simultaneous pressures of driving value for their consumer and integration,offering a more engaging experience.
Optimization
We turn process optimization into real transformation by using process automation and cognitive techniques to transform legacy processes and deliver streamlined operations that increase revenues and reduce costs for our customers. We rely on our teams, methodologies and tools to optimize every stage of software delivery for improved quality assurance and testing, deployment, performance tuning, support and maintenance, legacy applications re-engineering/refactoring, porting and cross-platform migration and documentation.
Application Testing Servicesbetter features with each release.
We maintain a dedicated group of testing and quality assurance professionals with experience across a wide range of technology platforms and industry verticals. Our Quality Management System complies with global quality standards such as ISO 9001:2008 and we employ industry-recognized and proprietary defect tracking tools to deliver a comprehensive range of testing services. Our application testing services include: (i)verticals, who perform software application testing, including test automation tools and frameworks; (ii) testing for enterprise IT, including test management, automation functional and non-functional testing, as well as defect management; and (iii) consulting services focused on helping clientscustomers improve their existing software testing and quality assurance practices. We employ industry-recognized and proprietary defect tracking tools and frameworks to deliver a comprehensive range of testing services that identify threats and close loopholes to protect our customers’ business systems from information loss.
Consulting
Enterprise Application Platforms
AsOver the years, as a proven provider of software product development servicescomplement to major ISVs,our core engineering skills, we have participatedadded capabilities in business consulting to give us an agile, hybrid approach to the development ofmarket. Our consulting services drive deeper relationships as we help our customers with larger and more complex challenges. Our industry, standard technology and experience consulting services are interconnected to deliver maximum impact for our customers. The functional business applicationexpertise of our professionals is supplemented by a thorough understanding of technology platforms and their components in such specific areas as customer relationship management and sales automation, enterprise resource planning, enterprise content management, business intelligence, e-commerce, mobile, Software-as-a-Service and cloud deployment. Our experience in such areas allows us to offer services around Enterprise Application Platforms, which include requirements analysis and platform selection, deep and complex customization, cross-platform migration, implementation and integration,interactions as well as supportapplication of data science and maintenance. We usemachine learning to deliver our experience, custom toolsbest insights into our customers’ business.
Our technical advisory services help customers stay ahead of current technology changes and specialized knowledge to integrate our clients’ chosen application platforms with their internal systemsinnovate, where innovation beyond technology is also delivered through collaborative workshops, challenges and processes and to create custom solutions filling the gaps in their platforms’ functionality necessary to address the needs of the clients’ users and customers.new organizational models.
Application Maintenance and SupportDesign
We deliver application maintenanceapply design thinking to digital and support services throughservice strategy, user experience and the product lifecycle with a dedicated team of IT professionals. Our application maintenancefocus on innovative design ideas and support offerings meet rigorous CMMI and ISAE 3402 Type 2 requirements. Our clients benefit from our proprietary distributed project management processes and tools, which reduce the time and costs related to maintenance, enhancement and support activities. Our services include incident management, fault investigation diagnosis, work-around provision, application bug fixes, release management, application enhancements and third-party maintenance.
Infrastructure Management Services
Given the increased need for tighter enterprise integration between software development, testing and maintenance with private, public and mobile infrastructures, our service offerings also cover infrastructure management services. We have significant expertise in implementing large infrastructure monitoring solutions, providing real-time notification and control from the low-level infrastructure up to and including applications. Our ISAE 3402 Type 2, ISO 27001:2013 and ISO 9001:2008 certifications provide our clients with third-party verification of our information security policies. Our solutions cover the full lifecycle of infrastructure management including application, database, network, server, storage and systems operations management, as well as incident notification and resolution.
We also work closely with leading companies in other industries to enable our clients to better leverage technology and address simultaneous pressures of driving value for the consumer and offering a more engaging experience.product development. Our digital strategy and experienceservice design practice provides strategy, design, creative and program management services for clientscustomers looking to improve their customerthe user experience.
We also offer deep expertise across several domains including business-to-businessare continuously looking to strengthen and business-to-consumer e-commerce, customer/partner self-service, employee portals, online merchandisinggrow our design and sales, web content management, mobile solutionsconsulting practices as evidenced by our 2018 strategic acquisitions of Continuum Innovation LLC, which enhances our consulting, physical design and billing.product development capabilities, and Think Limited, which enhances our global product and design offerings.
Our Vertical MarketsIndustry Expertise
Strong vertical-specificindustry-specific knowledge, backed by extensive experience merging technology with the business processes of our clients,customers, allows us to deliver tailored solutions to various industry verticals. We have categorized ourOur customers intooperate in five main industry verticals andas well as a groupnumber of emerging verticals.other verticals in which we are increasing our presence.
Financial Services. We have significant experience working with global investment banks, firms, and brokerages; commercial and retail banks,lending institutions, credit card and payment solution companies, depositories, corporate treasuries, pension funds,wealth management institutions, fund operators, insurance companies and market data providers.various other providers of financial services. We assist these clientscustomers with challenges stemming from new regulations, compliance requirements, customer-based needs and risk management. Our Capital Markets Competency Center facilitates knowledge exchange, education and collaboration across our organization and develops new software products, frameworks and components to further enhance our financial services domain experts have been recognized with industry awards for engineering and deploying unique applications and business solutions that facilitate growth, competitiveness, and services.customer loyalty while driving cost efficiency for global financial institutions.
Travel and Consumer. Our capabilities span a range of platforms, applications and solutions that businesses in travel and hospitality use to serve their customers, capture management efficiencies, control operating expenses and grow revenues. ManySome of the world’s leading airlines, hotel providers and travel agencies rely on our knowledge in creating the besthigh-quality tools for operating and managing their business. ThroughWithin this vertical, we also serve global, regional and local retailers, online retail brands, consumer goods manufacturers, distributors, and online marketplaces. We deliver a completewide range of digital commerce and marketing services to a global setretail and eCommerce customers from complex system modernizations to leading edge innovations in multi-channel sales and distribution. We have transformed organizations to use technology to expand and revolutionize their business models. Our services directly impact the consumer experience of our customers’ brands, and allow our customers across traditional and online retail, manufacturing and distribution segments.to reach more consumers.
Software and Hi-Tech. Our core competency is in providing We provide complex software product development services to meet software and technology companies’ constant need for innovation and agility. We help some of the most prominent software brands in the world build, what we believe to be, the best software. Through our extensive experience with many industry leaders in Hi-Tech R&D,research and development, software engineering and integration, we have developed proprietary internal processes, methodologies and ITinformation technology infrastructure, which give us an edge when it comes to serving customers in the Hi-Tech and Software Product markets. Our services span the complete software development lifecycle for software product development using our comprehensive development methodologies, testing, performance tuning, deployment, maintenance and support.
MediaBusiness Information and Entertainment.Media. We have established long-term relationships with leadinghelp our business information and media customers build products and entertainment companies which enable us to bring sustainable value creationsolutions for all modern platforms including web media streaming and enhanced return-on-content for organizations within this vertical.mobile information delivery. Our solutions help clientscustomers develop new revenue sources, accelerate the creation, collection, packaging and management of content and reach broader audiences. We serve clientsvaried customers in a range of media sub-sectors,this vertical including search engine providers, entertainment media, news providers, broadcasting companies, financial information providers, content distributors, knowledge management organizations and advertising networks. Our Business Information Competency Center enables us to provide our clients with solutions that help them overcome challenges related to operating legacy systems, manage varied content formats, rationalize their online assets and lower their cost of delivery. In addition, we provide knowledge discovery platform services, which combines custom taxonomy development with web crawling, internal file and e-mail classification, newsletter and feed publication and content trend analysis.
Life Sciences and Healthcare. We help our customers inHealthcare. In the Life Sciences and Healthcare industry address ever changing market conditions and regulatory environments. Our professionals deliver an end-to-end experience that includes strategy, architecture, build and managed services to clients ranging from the traditional healthcare providers to innovative startups. We workcategory, we partner with global Life Sciencespharmaceutical, medical technology and biotechnology companies to deliver sophisticated scientific informatics and innovative enterprise technology solutions. WeOur personnel in Life Sciences leverage their vast technology expertise to offer a combination of deep scientific and mathematical knowledge providing global coverage forto broad-based initiatives. Our Life Sciences solutions enable clientscustomers to speed research discovery, and accelerate time-to-market while improving collaboration, knowledge management and operational excellence. We help our customers in the Healthcare industry respond to changing regulatory environments and improve the quality of care while managing the cost of care. Our professionals deliver an end-to-end experience that includes strategy, architecture, development and managed services to customers ranging from the traditional healthcare providers to innovative startups.
Emerging Verticals. We also serve the diverse technology needs of clientscustomers in the energy, telecommunications, automotive and manufacturing industries, as well the government.as government customers. These industries representcustomers are included in our Emerging verticals.
Our revenues by vertical for the periods presentedVerticals, which are as follows:
|
| | | | | | | | | | | | | | | | | | | | |
| | Year Ended December 31, |
| | 2016 | | 2015 | | 2014 |
| Financial Services | $ | 291,845 |
| | 25.2 | % | | $ | 248,526 |
| | 27.2 | % | | $ | 215,425 |
| | 29.5 | % |
| Travel and Consumer | 259,420 |
| | 22.4 |
| | 215,303 |
| | 23.6 |
| | 157,756 |
| | 21.6 |
|
| Software & Hi-Tech | 237,437 |
| | 20.5 |
| | 192,989 |
| | 21.1 |
| | 157,944 |
| | 21.6 |
|
| Media & Entertainment | 174,017 |
| | 15.0 |
| | 120,616 |
| | 13.2 |
| | 91,726 |
| | 12.6 |
|
| Life Sciences and Healthcare | 105,072 |
| | 9.1 |
| | 73,327 |
| | 8.0 |
| | 42,428 |
| | 5.8 |
|
| Emerging Verticals | 79,820 |
| | 6.7 |
| | 53,856 |
| | 5.9 |
| | 56,338 |
| | 7.7 |
|
| Reimbursable expenses and other revenues | 12,521 |
| | 1.1 |
| | 9,511 |
| | 1.0 |
| | 8,410 |
| | 1.2 |
|
| Revenues | $ | 1,160,132 |
| | 100.0 | % | | $ | 914,128 |
| | 100.0 | % | | $ | 730,027 |
| | 100.0 | % |
ClientsCustomers
Our clients primarily consist of Forbes Global 2000 corporations located in North America, Europe, Asia and the CIS. We maintain a geographically diverse client base with 57.3% of our 2016 revenues from clients located in North America, 35.5% from clients in Europe, 4.0% from clients in the CIS and 2.1% from our clients in APAC. We typically enter into master services agreements with our clients, which provide a framework for services that is then supplemented by statements of work, which specify the particulars of each individual engagement, including the services to be performed, pricing terms and performance criteria.
multiple industries. Our focus on delivering quality to our clientsservice is reflected by an averagein established relationships with many of 96.2%our customers, with 55.9% and 81.9%29.5% of our revenues in 20162019 coming from clientscustomers that had used our services for at least onefive and twoten years, respectively. In addition,Our sustained growth and increased capabilities are furthered by both organic growth and strategic acquisitions. We continually evaluate potential acquisition targets that can expand our vertical-specific domain expertise, geographic footprint, service portfolio, client base and management expertise.
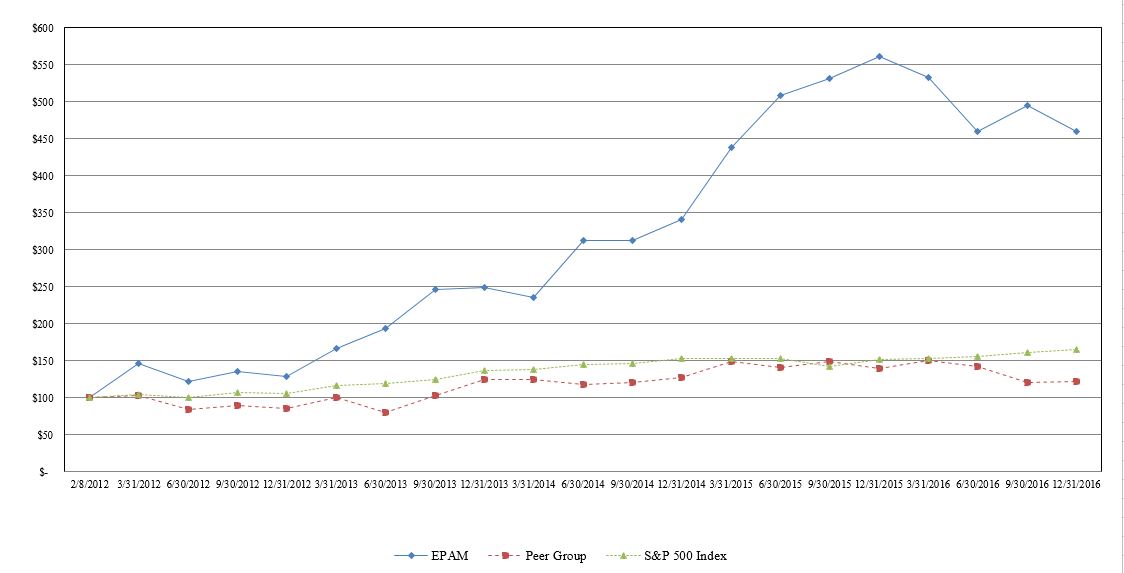
As we have significantly grown the size of existing accounts as a majority ofremain committed to diversifying our topclient base and adding more customers to our client mix, remains consistent over the years. The annualwe expect revenue concentration from our top five clients increased from $107.2 million in 2011customers to $327.1 million in 2016 andcontinue to decrease over the annual revenue from our top ten clients increased from $149.1 million in 2011 to $442.3 million in 2016.
During 2016, 2015 and 2014 one customer, UBS AG, accounted for over 10% of our revenues.
long-term. The following table presentsshows revenues from the top five and ten customers in the respective year as a percentage of our revenues by client location:for that year:
|
| | | | | | | | |
| | % of Revenues for Year Ended December 31, |
Client location | 2016 | | 2015 | | 2014 |
| North America | 57.3 | % | | 53.1 | % | | 50.4 | % |
| Europe | 35.5 |
| | 38.6 |
| | 39.0 |
|
| CIS | 4.0 |
| | 4.7 |
| | 7.6 |
|
| APAC | 2.1 |
| | 2.6 |
| | 1.8 |
|
| Reimbursable expenses and other revenues | 1.1 |
| | 1.0 |
| | 1.2 |
|
| Revenues | 100.0 | % | | 100.0 | % | | 100.0 | % |
Revenues by client location above differ from our segment information. Our operations consist of four reportable segments: North America, Europe, Russia and Other. This determination is based on the unique business practices and market specifics of each region and that each region engages in business activities from which it earns revenues and incurs expenses. Our reportable segments are based on managerial responsibility for a particular client. Because managerial responsibility for a particular client relationship generally correlates with the client’s geographic location, there is a high degree of similarity between client locations and the geographic boundaries of our reportable segments. In some specific cases, however, managerial responsibility for a particular client is assigned to a management team in another region, usually based on the strength of the relationship between client executives and particular members of our senior management team. In such a case, the client’s activity would be reported through the management team’s reportable segment. Particularly, our acquired clients in the APAC region are reported as part of the Europe segment based on the managerial responsibility for those clients. The following table presents the percentage of our revenues by reportable segment: |
| | | | | | | | |
| | % of Segment Revenues for Year Ended December 31, |
Segment | 2016 | | 2015 | | 2014 |
| North America | 55.3 | % | | 51.5 | % | | 51.3 | % |
| Europe | 40.9 |
| | 43.8 |
| | 41.0 |
|
| Russia | 3.8 |
| | 4.2 |
| | 6.9 |
|
| Other | — |
| | 0.5 |
| | 0.8 |
|
| Segment Revenues | 100.0 | % | | 100.0 | % | | 100.0 | % |
|
| | | | | | | | |
| | % of Revenues for Year Ended December 31, |
| | 2019 | | 2018 | | 2017 |
| Top five customers | 19.9 | % | | 22.3 | % | | 24.0 | % |
| Top ten customers | 29.1 | % | | 31.6 | % | | 33.9 | % |
See “Item 7. Management’s Discussion and Analysis of Financial Condition and Results of Operations” in Part II of this annual reportAnnual Report on Form 10-K for additional information related to segments.revenues.
The following table shows the distribution of our clients by revenues for the periods presented: |
| | | | | |
| | Year Ended December 31, |
| Revenues Greater Than or Equal To | 2016 | | 2015 | | 2014 |
| $0.1 million | 431 | | 365 | | 306 |
| $0.5 million | 266 | | 211 | | 181 |
| $1 million | 182 | | 136 | | 116 |
| $5 million | 45 | | 33 | | 24 |
| $10 million | 19 | | 14 | | 12 |
| $20 million | 7 | | 7 | | 6 |
See Note 1815 “Segment Information” in the notes to our consolidated financial statements in this Annual Report on Form 10-K for information regarding totallong-lived assets operating results and othercustomer revenues by geographic location as well as financial information related to our reportable segments.
Sales and Marketing
Our sales and marketing efforts support our business strategy to increase our revenues from new and existing clients through our senior management, sales and business development staff, account managers, and technical specialists. We maintain a dedicated sales force and a marketing team, which coordinates corporate-level branding efforts such as sponsorship of programming competitions and participation in and hosting of industry conferences and events.
Given our focus on providing technical solutions to our clients’ complex challenges, our IT professionals play an integral role in engaging with clients on potential business opportunities. Our account managers maintain direct client relationships and are tasked with identifying new business opportunities and responding to requests-for-proposals, or RFPs. Account managers typically engage technical and other specialists when pursuing opportunities. This sales model has been effective in promoting repeat business and growth from within our existing client base.
In addition to effective client management, we believe that our reputation as a premium provider of software engineering solutions and information technology services drives additional business from inbound requests, referrals and requests for proposal (“RFPs”). We enjoy published recognition from third-party industry observers, such as Forrester Research, Forbes Research, Everest Group, Zinnov, CIO Magazine, Information Week, and Software Magazine.
OurGlobal Delivery Model
We have delivery centers located in Belarus, Ukraine, Russia, Hungary, Kazakhstan, Bulgaria, Armenia, Poland, China, Mexico, Czech Republic and India. We have client management locations in the United States, Canada, the United Kingdom, Germany, Sweden, Switzerland, Netherlands, Russia, United Arab Emirates, Kazakhstan, Singapore, Hong Kong, Austria, Ireland and Australia. We believe the development of a robust global delivery model creates a key competitive advantage, enabling us to better understand and meet our clients’customers’ diverse needs and to provide a compelling value proposition. We continuously grow our delivery platform both organically and through strategically acquired locations and personnel with diversified skills that support our strategy. We had 32,561 delivery centers and client management locations. Our total headcount of revenue generating personnel was 19,670 as of December 31, 2016.2019, which mainly includes our core information technology professionals as well as designers, consultants and scientists.
We serve our customers through on-site, off-site and offshore locations across the world and use strategically located delivery centers to offer a strong, diversified and cost-effective delivery platform. Our primarylargest delivery centers are located in Belarus, where we have 6,390 IT professionals asUkraine and Russia.
As of December 31, 2016.2019, we had 9,314 delivery professionals located in Belarus. The majority of these ITdelivery professionals are located in Minsk, the capital of Belarus, which is well-positioned to serve as a prime IT outsourcing destination given its strong industrial base and established educational infrastructure. Furthermore, the IT industrygovernment in Belarus has been strongly supported bysupports the government, which has taken steps to encouragetechnology industry and encourages investment in the ITthis sector through various long-term tax incentives.
Our locations in Ukraine and Russia offer many of the same benefits as Belarus, including educational infrastructure, availability of qualified software engineers and government support of the IT industry, and, therefore, offer a strong and diversified delivery platform across Europe.technology industry. As of December 31, 2016, our2019, we had 7,478 delivery centersprofessionals in Ukraine have 4,081 IT professionals and 2,834 IT5,394 delivery professionals in Russia. Our delivery model has not been materially affected by the political and economic uncertainty in Ukraine and Russia or Ukraine to date.
Our other significant locations with delivery centersprofessionals are in the United States with 1,127 IT professionals,2,236, Poland with 1,513, Hungary with 1,511 IT professionals,1,498, India with 976 IT professionals1,476, China with 562 and PolandMexico with 946 IT professionals540 as of December 31, 2016. These delivery centers are located strategically to serve clients in North America, Europe and Asia.2019.
Human CapitalSales and Marketing
AttractingWe market and retainingsell our services through our senior management, sales and business development teams, account managers, and professional staff. Our client service professionals and account managers, who maintain direct customer relationships, play an integral role in engaging with current customers to identify and pursue potential business opportunities. This strategy has been effective in promoting repeat business and growth from within our existing client base and we believe that our reputation as a reliable provider of software engineering solutions drives additional business from inbound requests and referrals. In addition to effective client management, our sales model also utilizes an integrated sales and marketing approach that leverages a dedicated sales team to identify and acquire new accounts.
We maintain a marketing team, which coordinates corporate-level branding efforts such as participation in and hosting of industry conferences and events as well as sponsorship of programming competitions. We have been recognized by many top global independent research agencies, such as Forrester, Gartner, Zinnov and HFS and by publications such as Forbes and Fortune.
Employees
Our employees isare a key factor in our ability to grow our revenues and meetserve our clients’ needs. We have dedicated full-time employees that oversee all aspects of our human capital management process. It is critical that we effectively plan our short-term and long-term recruitment needs and deploy the necessary personnel and processes to optimize utilization and quickly satisfy the demands of our clients. As our business grows, we also focus on hiring and retaining individuals with appropriate skills to fill our executive, finance, legal, HR and other key management positions.
At December 31, 2016, 2015 and 2014, we had a total of 22,383, 18,354 and 14,109 employees, respectively. Of these employees, as of December 31, 2016, 2015 and 2014, respectively, 19,670, 16,078 and 11,824 were revenue generating IT professionals.
In our competitive industry,customers, therefore the ability to hire and retain highly-skilled information technology professionals is critical to our success. We believe the quality of our employees serves as a key point of differentiation in how we deliver a superior value proposition to our clients.customers. To attract, retain and motivate our ITdelivery professionals, we offer a challenging work environment, ongoing skills development initiatives, attractive career advancement, and promotion opportunities thus providing an environment and culture that rewards entrepreneurial initiative and performance.
Historically, we have developed our base of IT professionals by hiring highly-qualified, experienced IT professionals from the CIS and CEE region and by recruiting students from leading universities there. The quality and academic prestige of the CIS and CEE educational system is renowned worldwide. We have strong relationships with the leading institutions in these geographies, such as the Belarusian State University, the Moscow State University, and the National Technical University of Ukraine. The participants from these universities are frequent and consistent winners in the ACM International Collegiate Programming Contest (“ICPC”), the oldest, largest, and most prestigious programming contest in the world.
We have established EPAM delivery centers near many of these university campuses. Our ongoing involvement with these universities includes supporting EPAM-branded research labs, developing training courses, providing teaching equipment, actively supporting curriculum development and engaging students to identify their talents and interests. Our relationships with these technical institutions provide us access to a highly-qualified talent pool of programmers, and allow us to consistently attract highly-skilled students from these institutions. We also conduct lateral hiring through a dedicated IT professional talent acquisition team whose objective is to locate and attract qualified and experienced IT professionals within the region and other EPAM locations.
We believe that we maintain a good working relationship with our employees and our employees have not entered into any collective bargaining agreements (other than broad industry-wide agreements as required in Mexico and certain countries in Europe) or engaged in any labor disputes.
In our competitive industry, it is critical that we effectively deploy the necessary personnel and utilization practices to satisfy the demands of our customers. We have dedicated full-time employees who oversee all aspects of our human capital management process including professional talent acquisition teams whose objective is to locate and attract qualified and experienced professionals around the world. We are continuously exploring new markets as sources of talent. TrainingAs our business grows, we also focus on hiring and Developmentretaining individuals with appropriate skills to fill our executive, finance, legal, human resources and other key management positions. At December 31, 2019, 2018 and 2017, we had a total of 36,739, 30,156 and 25,962 employees, respectively. Of these employees, as of December 31, 2019, 2018 and 2017, respectively, 32,561, 26,760 and 22,998 were delivery professionals.
We dedicate significant resources to the training, continuing education and career development programs of our ITentry-level and experienced delivery professionals. We believe in the importance of supporting educational initiatives and we sponsor employees’ participation in internal and external training and certifications. Furthermore, we actively pursue partner engagements with technical institutions in CEE.
We provide training, continuing education and career development programs for both entry-level and experienced IT professionals. Entry-level IT professionalspersonnel undergo a rigorous training program that consists of approximately three to six months of classroom training, as well as numerous hours of hands-on training through actual engagements. This comprehensive program results in employees who are highly proficient and possess deep technical expertise that enables them to immediately serve our clients’customers’ needs. For our mid-level and senior ITdelivery professionals, we offer continuing education programs aimed at helping them advance in their careers. We also provide mentoring opportunities, management and soft skills training, intensive workshops and management and technical advancement programs in order to support the development of middle and senior management through formal leadership training, evaluation, development and promotion.
Quality and Process Management
We have invested resources in developing a proprietary suite of internal applications and tools to manage all aspects of our delivery process. These applications and tools are effective in reducing costs and security risks, while providing control and visibility across all project lifecycle stages both internally and to our clients. In addition, these applications, tools, methodologies and infrastructure allow us to seamlessly deliver services and solutions to global clients, further strengthening our relationships with them.
Our proprietary ISO 9001:2008 and CMMI-certified Quality Management System has been documented, implemented and maintained to ensure the timely delivery of software development services to our clients. We have also developed sophisticated project management techniques facilitated through our Project Management Center, a web-based collaborative environment for software development, which we consider critical to meeting or exceeding the service levels required by our clients.
Our Quality Management System ensures that we provide timely delivery of software development services to enhance client satisfaction by enabling:
objective valuation of the performed process, work products and services against the client’s process descriptions, standards and procedures;
identification, documentation and timely resolution of noncompliance issues;
feedback to the client’s project staff and managers on the results of quality assurance activities;
monitoring and improvement of the software development process to ensure adopted standards and procedures are implemented and flaws are detected and resolved in a timely manner; and
execution of planned and systematic problem prevention activities.
Our proprietary Project Management Center supports our software development delivery model. Our Project Management Center is effective in reducing risks and providing control and visibility across all project lifecycle stages based on the following features:
multi-site, multi-project capabilities;
activity-based software development lifecycle, which fully tracks the software development activities through the project documentation;
project, role-based access control, which can be available to us, clients and third parties;
fully configurable workflow engine with built-in notification and messaging;
extensive reporting capabilities and tracking of key performance indicators; and
integration with Microsoft Project and Outlook.
The transparency and visibility into software development project deliverables, resource management, team messaging and project-related documents and files provided by our Project Management Center promotes collaboration and strengthens our relationships with our clients. Improved traceability enables significant time savings and cost reductions for business users and IT management during change management for the software development lifecycle. The combination of our Project Management Center with our other proprietary internal applications enhances our offering by reducing errors, increasing quality, effectiveness and oversight, and improving maintenance time.
Based on our analysis of publicly available information of IT services providers, we are the only ISAE 3402 Type 2 certified IT services provider with multiple delivery centers in CEE. This certification is a widely recognized auditing standard developed by the American Institute of Certified Public Accountants, or AICPA, and it serves as additional assurance to our clients regarding the control environment and the security of their sensitive data. Furthermore, this is an important certification for firms in data and information-intensive industries, as well as any organization that is subject to the internal controls certification requirements of the Sarbanes-Oxley Act of 2002, as amended, or the Sarbanes-Oxley Act. Our ISAE 3402 Type 2 certification, in addition to our multiple ISO 27001:2013 and ISO 9001:2008 attestations, underscores our focus on establishing stringent security standards and internal controls.
Competition
The markets in which we compete are changing rapidly and we face competition from both global technology solutions providers as well as those based primarily in specific geographies with lower cost labor such as CEE,Eastern Europe, India and China. We believe that the principal competitive factors in our business include technical expertise and industry knowledge, end-to-end solution offerings, a reputation for and a track record forof high-quality and on-time delivery of work, effective employee recruiting, training and retention, responsiveness to clients’customers’ business needs, scale, financial stability and price.
We face competition primarily from:
India-basedfrom various technology outsourcing IT services providers such as Accenture, Atos, Capgemini, Cognizant Technology Solutions, (NASDAQ:CTSH),Deloitte Digital, DXC Technology, Exlservice, Genpact, GlobalLogic, Globant, HCL Technologies, HP Enterprise, IBM Services, Infosys, Technologies (NASDAQ:INFY), Mindtree, Perficient, Tata Consultancy Services, Virtusa Corporation, and Wipro, (NASDAQ:WIT);
U.S.-based technology outsourcing IT services providers, such as Syntel, Inc. (NASDAQ: SYNT), and Virtusa Corporation (NASDAQ: VRTU);
CEE-based technology outsourcing IT services providers such as Luxoft Holding, Inc. (NYSE:LXFT);
China-based technology outsourcing IT services providers such as Camelot Information Services, and Pactera;
Other IT and Software Development services providers located elsewhere, such as Globant S.A. (NASDAQ: GLOB);
Large global consulting and outsourcing firms, such as Accenture, Atos Origin, Capgemini, CSC and IBM; and
In-house IT departments of our clients and potential clients.among others. Additionally, we compete with numerous smaller local companies in the various geographic markets in which we operate.
We believe that our focus on complex and innovative software product development solutions, our technical employee base, and theour development and continuous improvement in process methodologies, applications and tools position us well to compete effectively in the future. Our present
Quality Management and potential competitors may have substantially greater financial, marketing or technical resources; may be ableInformation Security
We are continuously investing in applications, tools and infrastructure to respond more quicklymanage all aspects of our global delivery process in order to new technologies ormanage quality and security risks, while providing control and visibility across all project lifecycle stages both internally and to our customers. We maintain processes and changesinfrastructure to protect our clients’ and their customers’ confidential and sensitive information and allocate resources to ensure information security, cybersecurity and data privacy. We have made significant investments in client demands; may be ablethe appropriate people, processes and technology to devote greater resources towardsestablish and manage compliance with confidentiality policies, laws and regulations governing our activities, such as the European Union data protection legal framework referred to as the General Data Protection Regulation (“GDPR”), the California Consumer Privacy Act (“CCPA”), and others.
We focus on establishing stringent security standards and internal controls and meet the standards of ISO 27001:2013 and ISO 9001:2015. We are an ISAE 3402 Type 2 certified IT services provider. This certification is issued by an auditor in compliance with the globally recognized assurance standard. The certification, along with others we hold, provide our customers with independent third-party verification of our information security, quality management and general controls practices.
We have developed sophisticated project management techniques facilitated through our proprietary Project Management Tools, a web-based collaborative environment for software development, promotionwhich we consider critical for visibility into project deliverables, resource management, team messaging and saleproject-related documents. These tools promote collaboration and effective oversight, reduce work time and costs, and increase quality for our IT management and our customers.
Corporate and Social Responsibility
We are committed to integrating positive social, environmental and ethical practices into our business operations and strategy. This commitment is key to our continual development as a business and drives value for our employees, customers, business partners, the community and other stakeholders. We practice the principles established in our Code of their services thanEthical Conduct by making positive contributions to the communities in which we can;operate and may also make strategic acquisitions or establish cooperative relationships among themselves or with third parties that increase their abilitychampioning corporate social responsibility efforts.
Through our focused efforts in the areas of Education, Environment, and Community, we are committed to addresssharing the expertise and attributes of our highly skilled global workforce to effectively support the needs of, and positively add to the world at large and the communities where we work and live. By understanding our clients.impact on local, regional and global communities, we strive to create positive change and opportunities in areas where it is needed most. Such efforts include our global technology education initiatives, through which we provide innovative, industry-relevant technology training and mentorship programs to students globally as well as through other technology conferences, seminars, and hackathon events where we encourage social innovation and jumpstart collaboration among our local tech communities. We maintain strong relationships with the leading technical institutions in Eastern Europe and we support these universities through EPAM-branded research labs, developing training courses and curriculum, providing teaching equipment and engaging students to identify their talents in information technology.
We believe responsible stewardship of the environment is critical, and we take this responsibility seriously. We continually strive to improve our environmental performance through implementation of sustainable development and environmental practices including recycling and upcycling electronics and computers and designing and releasing a carbon footprint calculator to our employees and the general public. In addition, as an innovation-driven business, EPAM’s success depends on hiring the most talented employees in the industry. We are committed to respecting our employees' fundamental human rights at work. We similarly expect our suppliers, vendors, and subcontractors and all other third-party companies that comprise EPAM’s supply chain to respect human rights and to avoid complicity in human rights abuses. EPAM seeks to provide our customers with exceptional personnel, which includes people with varied and diverse characteristics, to drive the innovation and thought diversity for which we are known. We aim to continuously retain and supply a pipeline of qualified, diverse candidates to foster this goal.
Intellectual Property
Protecting our intellectual property rights is criticalimportant to our business. We have invested, and will continue to invest, in research and development to enhance our domain knowledge and create complex, specialized solutions for our clients.customers. We rely on a combination of intellectual property laws, trade secrets, confidentiality procedures and contractual provisions to protect our intellectual property. We require our employees, vendors and independent contractors to enter into written agreements upon the commencement of their relationships with us, which assign to us all deliverable intellectual property and work product made, developed or conceived by them in connection with their employment with us.or provision of services. These agreements also provide that any confidential or proprietary information disclosed or otherwise made available by us remains confidential.
We also enter into confidentiality and non-disclosure agreements with our clients.customers. These customary agreements cover our use of the clients’our customers’ software systems and platforms as our clientscustomers usually own the intellectual property in the products we develop for them. Furthermore, we usuallyoften grant a perpetual, worldwide, royalty-free, nonexclusive, transferable and non-revocable license to our clientscustomers to use our preexistingpre-existing intellectual property, but only to the extent necessary in order to use the software or systems we developeddevelop for them.
Long-lived Assets
Our long lived-assets disclosed in the table below consist of property and equipment. The table below presents the locations of our long-lived assets: |
| | | | | | | | | | | |
| | Year Ended December 31, |
| | 2016 | | 2015 | | 2014 |
| Belarus | $ | 46,011 |
| | $ | 44,879 |
| | $ | 41,652 |
|
| Russia | 7,203 |
| | 2,084 |
| | 2,196 |
|
| Ukraine | 5,610 |
| | 4,487 |
| | 4,392 |
|
| Hungary | 3,485 |
| | 2,485 |
| | 2,773 |
|
| United States | 2,618 |
| | 1,969 |
| | 2,001 |
|
| Poland | 2,213 |
| | 1,088 |
| | 747 |
|
| China | 1,887 |
| | 514 |
| | 289 |
|
| India | 1,650 |
| | 1,099 |
| | — |
|
| Other | 2,939 |
| | 1,894 |
| | 1,084 |
|
| Total | $ | 73,616 |
| | $ | 60,499 |
| | $ | 55,134 |
|
Acquisitions
Our sustained growth and increased capabilities are furthered by both organic growth and strategic acquisitions. We continually evaluate potential acquisition targets that can expand our vertical-specific domain expertise, geographic footprint, service portfolio, client base and management proficiency.
Regulations
Due to the industry and geographic diversity of our operations and services, our operations are subject to a variety of rules and regulations. Several foreign and U.S. federal and state agencies regulate various aspects of our business. See “Item 1A. Risk Factors — Risks Relating to Our Business —Business.” We are subject to laws and regulations in the United States and other countries in which we operate, including export restrictions, economic sanctions, and the Foreign Corrupt Practices Act or FCPA,(“FCPA”) and similar anti-corruption laws. If we are notlaws and data privacy regulations. Compliance with these laws requires significant resources and non-compliance may result in compliance with applicable legal requirements, we may be subject to civil or criminal penalties and other remedial measures”.measures.
Corporate Information
EPAM Systems, Inc. was incorporated in the State of Delaware on December 18, 2002. Our predecessor entity was founded in 1993. Our principal executive offices are located at 41 University Drive, Suite 202, Newtown, Pennsylvania 18940 and our telephone number is 267-759-9000. We maintain a website at http://www.epam.com. Our website and the information accessible through our website are not incorporated into this annual report.Annual Report on Form 10-K.
We make certain filings with the Securities and Exchange Commission (“SEC”), including our annual reportAnnual Report on Form 10-K, quarterly reports on Form 10-Q, current reports on Form 8-K, and all amendments and exhibits to those reports. We make such filings available free of charge through the Investor Relations section of our website, http://investors.epam.com, as soon as reasonably practicable after they are filed with the SEC. The filings are also available through the SEC at the SEC’s Public Reference Room at 100 F Street, N.E., Washington, D.C. 20549 or by calling 1-800-SEC-0330. In addition, these filings are available on the internetSEC maintains a website at http://www.sec.gov. Our press releasesthat contains reports, proxy and recent analyst presentations are also available on our website. The information on our website does not constitute a part of this annual report.statements, and other information regarding issuers that file electronically through the EDGAR System.
Item 1A. Risk Factors
Risk factors,Our operations and financial results are subject to various risks and uncertainties, which could cause actual results to differ fromadversely affect our expectations and which could negatively impact ourbusiness, financial condition, and results of operations, cash flows, and the trading price of our common stock. Listed below, not necessarily in order of importance or probability of occurrence, are discussed below and elsewhere in this annual report. The risks and uncertainties described below are not the only ones we face. If any of the risks or uncertainties described below or any additional risks and uncertainties actually occur, our business, results of operations and financial condition could be materially and adversely affected. In particular,most significant risk factors applicable to us. Additionally, forward-looking statements are inherently subject to risks and uncertainties, some of which cannot be predicted or quantified. See “Special Note Regarding Forward-Looking Statements”.“Forward-Looking Statements.”
Risks Relating to Our Business
We may be unable to effectively manage our rapid growth or achieve anticipated growth, which could place significant strain on our management, personnel, systems, resources, and resources.results of operations.
We have experienced rapid growthgrown rapidly and significantly expanded our business over the past several years, both organically and through strategic acquisitions. We have also grownOur growth has resulted in part from managing larger and more complex projects for our support function headcount, including finance, legalcustomers, but consequently requires that we invest substantial amounts of cash in new facilities and other areas.physical infrastructure. Our rapid growth has placed and will continue to placeplaces significant demands on our management and our administrative, operational and financial infrastructure. Continued expansion increases theinfrastructure, and creates challenges, we face in:including:
recruiting, training and retaining sufficiently skilled IT professionals and management personnel;
adhering toplanning resource utilization rates on a consistent basis and further improving our high-qualityefficiently using on-site, off-site and process execution standardsoffshore staffing;
maintaining close and maintaining high levels of client satisfaction;
managingeffective relationships with a larger number of clientscustomers in a greater number of industries and locations;
maintaining effective oversight of personnelcontrolling costs and minimizing cost overruns and project delays in new facilities and delivery centers;
coordinating effectively maintaining productivity levels and implementing process improvements across geographies and business units to execute our strategic plan;units; and
developing and improving our internal administrative, infrastructure, particularly ouroperational and financial operational, communications and other internal systems.infrastructure.
Moreover, weWe intend to continue our expansion and pursue available opportunities for the foreseeable future to pursue existing and potential market opportunities.future. As we introduce new services, or enter into new markets, weand take on increasingly large and complex projects, our business may face new market, technological, operational, compliance and administrative risks and challenges,challenges. If customers do not choose us for large and complex projects or we do not effectively manage those projects, our reputation, business, and financial goals may not be abledamaged. We need to mitigate these risksgenerate business and challengesrevenues to successfully grow those services or markets. As a result of these problemssupport new facilities and infrastructure projects. If the challenges associated with expansion we may not be able to achievenegatively impact our anticipated growth and margins, our business, prospects, financial condition and results of operations could be materially adversely affected.
Our failure toWe must successfully attract, hire, train and retain new ITqualified personnel to service our customers’ projects and we must productively utilize those personnel to remain profitable.
Hiring and retaining professionals with diverse skill sets across our broad geography of operations is critical to maintaining existing engagements and obtaining new business. If we do not deploy those professionals and use computers, office space, and other fixed-cost resources productively, our profitability will be significantly impacted. We must manage the qualifications necessaryutilization levels of the professionals that we hire and train by planning for future needs effectively and staffing projects appropriately while accurately predicting the general economy and our customers’ need for our services. If we are unable to fulfill the needs of our existingattract, hire, train, and future clients could materially adversely affectretain highly skilled personnel and productively deploy them on customer projects, we will jeopardize our ability to provide high quality services to those clients.meet and develop ongoing and future business and our financial condition and results of operations could be adversely affected.
The ability to hire and retain highly-skilled information technology
Competition for highly skilled professionals is critical to our success. To maintain and renew existing engagements and obtain new business, we must attract, train and retain skilled IT professionals, including those with management experience. Competition for IT professionals can be intense in the markets where we operate, and accordingly, we may not be able to hire or retain all of the IT professionals necessary to meet our ongoing and future business needs. Consequently, we may have to forgo projectsexperience significant employee turnover rates due to lack of resources or inabilitysuch competition. If we are unable to staff projects optimally.
A significant increase in the attrition rate among ITretain professionals with specialized skills, could decrease our revenues, operating efficiency and productivity and could leadprofitability will decrease. Cost reductions, such as reducing headcount, or voluntary departures that result from our failure to a decline in demand for our services. In addition, any reductions in headcount for economic or business reasons, however temporary,retain the professionals we hire, could negatively affect our reputation as an employer and our ability to hire IT professionalspersonnel to meet our business requirements.
Price increases could lead to a decline in demand for our services.
Increases in wages, for our IT professionalsequity compensation, and other compensation expenseexpenses could prevent us from sustaining our competitive advantage, increase our costs, and result in dilution to our stockholders.
Wage costsWages for ITtechnology professionals in CIS, CEEthe emerging markets where we have significant operations and APAC, and certain other geographies in which we operatedelivery centers are lower than comparable wage costswages in more developed countries. However, wage costswages in the servicetechnology industry in these countries may increase at a faster rate than in the past, which ultimately may make us less competitive unless we are able to increase the efficiency and productivity of our ITpeople. If we increase operations and hiring in more developed economies, our compensation expenses will increase because of the higher wages demanded by technology professionals andin those markets. Wage inflation, whether driven by competition for talent or ordinary course pay increases, may also increase the prices for our services. Increases in wage costs maycost of providing services and reduce our profitability.profitability if we are not able to pass those costs on to our customers or charge premium prices when justified by market demand.
Additionally, we have granted certainWe expect to continue our practice of granting equity-based awards under our stock incentive plans and entered intopaying other stock-based compensation arrangements in the past, and expect to continue this practice.compensation. The expenses associated with stock-based compensation may reduce the attractiveness to us ofmake issuing equity awards under our equity incentive plan. However, if we do not grant equity awards, orplans less attractive to us, but if we reduce the amount or value of equity awards we grant,award grants, we may not be able to attract and retain key personnel. IfConversely, if we grant more or higher value equity awards to attract and retain key personnel, the expenses associated with such additional equity awardscompensation expenses could materially adversely affect our results of operations. The issuance of equity-based compensation also resultsNew regulations, volatility in additionalour stock, and dilution to our stockholders.stockholders could diminish our use and the value of our equity-based awards. This could put us at a competitive disadvantage or cause us to reconsider our compensation practices.
Our success depends substantially on the continuing efforts of our senior executives and other key personnel, and our business may be severely disrupted if we lose their services.
Our future success heavily depends upon the continued services of our senior executives and other key employees. If one or more of our senior executives or key employees are unable or unwilling to continue in their present positions, it could disrupt our business operations, and we may not be able to replace them easily or at all. In addition, competition for senior executives and key personnel in our industry is intense, and we may be unable to retain our senior executives and key personnel or attract and retain new senior executives and key personnel in the future, in which case our business may be severely disrupted.
If any of our senior executives or key personnel such as business development managers, joins a competitor or forms a competing company, we may lose clients,customers, suppliers, know-how and other key IT professionals and staff memberspersonnel to them. Additionally, there could be unauthorized disclosure or use of our technical knowledge, practices or procedures by such personnel.those competitors. If any dispute arises between ourwe are unable to attract new senior executives or key personnel due to the intense competition for talent in our industry, it could disrupt our business operations and us, any non-competition, non-solicitation and non-disclosure agreements we have with our senior executives or key personnel might not provide effective protection to us, especially in CIS and CEE countries where some of our senior executives and key employees reside, in light of uncertainties with local legal systems.growth.
Our profitability will suffer ifoperations in emerging markets subject us to greater economic, financial, and banking risks than we are not able to maintain our resource utilization and productivity levels.would face in more developed markets.
Our profitability is significantly impacted by our utilization levels of fixed-cost resources, such as our professionals as well as other resources such as computers and office space, and our productivity levels. We have expanded oursignificant operations significantly in recent years, which has materially increased both our headcountcertain emerging market economies in Eastern Europe, India and fixed overhead costs. Some of our IT professionalsother Asian countries. Emerging markets are specially trainedvulnerable to work for specific clients or on specific projects and some of our offshore development centers are dedicated to specific clients or specific projects. Our ability to manage our utilization levels depends significantly on our ability to hire and train high-performing IT professionals and to staff projects appropriately, and on the general economy and its effect on our clients and their business decisions regarding the use of our services. If we experience a slowdown or stoppage of work for any client or on any project for which we have dedicated IT professionals or facilities, we may not be able to reallocate these IT professionals and facilities to other clients and projects to keep their utilization and productivity levels high. If we are not able to maintain optimal resource utilization levels without corresponding cost reductions or price increases, our profitability will suffer.
Our global business exposes us to operationalmarket and economic risks.
We arevolatility to a global company with substantial internationalgreater extent than more developed markets, which presents risks to our business and operations. Our revenues from clients outside North America represented 41.6%, 45.9% and 48.5%A majority of our revenues excluding reimbursable expenses for 2016, 2015are generated in North America and 2014, respectively. The majorityWestern Europe. However, most of our employees, along with our developmentpersonnel and delivery centers are located in the CIS and CEE. The global nature of our business creates operational and economic risks.
Risks inherent in conducting international operations include:
foreign exchange fluctuations;
application and imposition of protective legislation and regulations relating to import or export,lower cost locations, including tariffs, quotas and other trade protection measures;
difficulties in enforcing intellectual property and/or contractual rights;
complying with a wide variety of foreign laws;
potentially adverse tax consequences;
competition from companies with more experience in a particular country or with international operations; and
overall foreign policy and variability of foreign economic conditions.
We earn our revenues and incur our expenses in multiple currencies, whichemerging markets. This exposes us to foreign exchange risks relating to revenues, receivables, compensation, purchases, capital expenditures, receivables and capital expenditures.other balance-sheet items. As we continue to leverage and expand our global delivery model into other emerging markets, a larger portion of our revenues and incurred expenses may be in currencies other than U.S. dollars. Currency exchange volatility caused by political or economic instability or other factors could materially impact our results. See “Item 7A. Quantitative and Qualitative Disclosures aboutAbout Market Risk.”
In June 2016, votersThe economies of certain emerging market countries where we operate have experienced periods of considerable instability and have been subject to abrupt downturns. We have cash in banks in countries such as Belarus, Russia, Ukraine, Kazakhstan, Armenia and Uzbekistan, where the U.K. approved an exit frombanking sector generally does not meet the European Union (“Brexit”),banking standards of more developed markets, bank deposits made by corporate entities are not insured, and as a result, it is anticipatedthe banking system remains subject to instability. A banking crisis, or the bankruptcy or insolvency of banks that the U.K. government will negotiate the terms of the U.K’s withdrawal from the European Union. Shortreceive or long term effects of Brexithold our funds, particularly in Belarus, may result in stockthe loss of our deposits or adversely affect our ability to complete banking transactions in that region. In addition, some countries where we operate may impose regulatory or practical restrictions on the movement of cash and the exchange of foreign currencies within their banking systems, which would limit our ability to use cash across our global operations and increase our exposure to currency fluctuations. Emerging market vulnerability, and foreignespecially its impact on currency exchange rate volatility and may also impact other operational areas ofbanking systems, could have a material adverse effect on our business, including immigrationfinancial condition and mobilityresults of our workforce. We are monitoring the developments relating to Brexit, but the related uncertainty may affect our customers’ operations and may result in new operational and financial challenges for us.operations.
The IT services industry is particularly sensitive to the economic environment and the industry tends to decline during general economic downturns. Given our significant revenues from North America and Europe, if those economies weaken or slow, pricing for our services may be depressed and our clients may reduce or postpone their technology spending significantly, which may in turn lower the demand for our services and negatively affect our revenues and profitability.
War, terrorism, other acts of violence or natural or manmade disasters, including the ongoing conflict in Ukraine, may affect the markets in which we operate, our clients,customers, and our service delivery.
Our business may be negatively affected by instability, disruption or destruction in athe geographic region in whichregions where we operate, regardless of cause, including war,operate. War, terrorism, riot, civil insurrection or social unrest; and natural or manmade disasters, including famine, flood, fire, earthquake, pandemics and other regional or global health crises, storm or disease. Such eventsdisease may cause clientscustomers to delay their decisions on spending for ITthe services we provide and give rise to sudden significant changes in regional and global economic conditions and cycles. Our crisis management procedures, business continuity, and disaster recovery plans may not be effective at preventing or mitigating the effects of such disasters, particularly in the case of a catastrophic event. These events also pose significant security risks to our people, and to physical facilities and operations around the world, whether the facilities are ourswhere they work, our operations, electricity and other utilities, communications, travel, and network services, and the disruption of any or thoseall of our clients, whichthem could materially adversely affect our financial results. By disrupting communicationsTravel restrictions resulting from natural or manmade disruptions and travel, giving rise to travel restrictions, and increasingpolitical or social conflict increase the difficulty of obtaining and retaining highly-skilled and qualified IT professionals these eventsand could make it difficult or impossible for us to deliver services to some or all ofunexpectedly increase our clients. Travel restrictions could cause us to incur additional unexpected labor costs and expenses, or could restrain our ability to retain the skilled IT professionals we need for our operations. In addition, any extended disruptionsboth of electricity, other public utilities or network services at our facilities, as well as system failures at, or security breaches in, our facilities or systems,which could also adversely affect our ability to serve our clients.customers.
Emerging markets are subject to greater risks than more developed markets, including significant legal, economic, tax and political risks.
We have significant operations in CIS and CEE countries, India and other Asian countries, which are generally considered to be emerging markets. Investors in emerging markets should be aware that these markets are vulnerable to market downturns and economic slowdowns elsewhere in the world and are subject to greater risks than more developed markets, including foreign laws and regulations and the potential imposition of trade or foreign exchange restrictions or sanctions, tax increases, fluctuations in exchange rates, inflation and unstable political and military situations, and labor issues. The economies of certain countries where we operate have experienced periods of considerable instability and have been subject to abrupt downturns. Moreover, emerging markets have less established legal systems, which can be characterized by gaps in regulatory structures, selective enforcement of laws, and limited judicial and administrative guidance on legislation, among other limitations. Financial problems or an increase in the perceived risks associated with investing in emerging economies could dampen foreign investment in these markets and materially adversely affect their economies. Such economic instability and any future deterioration in the international economic situation could materially adversely affect our business, financial condition and results of operations.
Our operations may be adversely affected by ongoing conflict in Ukraine.
ContinuingIn particular, continuing military activities in Ukraine have combined withand Ukraine’s weak economic conditions to fuelhave fueled ongoing economic uncertainty in Ukraine, Russia and other markets. In response tomarkets, and the actions in Ukraine,uncertainty is exacerbated by existing and threatened economic sanctions imposed by the EU,European Union, United States Canada, Japan, Switzerland and other nations have imposed, and may continue imposing further, economic sanctions, including specific sanctions on certain Russian entities (specifically in the energy, defense and financial sectors). Prolonged political instability in Ukraine, sanctions against Russia and Russia’s potential response to such sanctions could have a material adverse effect on our operations.sectors. We have delivery centers in both Ukraine and Russia and between 35% and 40% of our billable professionals have been located in those two countries since the Ukraine employing 4,081 IT professionals,military activities began in 2014, although none of which are located in the most volatile regions of Eastern Ukraine. WeLong term disputes over Russia’s supply of oil and gas to Belarus have also have delivery centers in Russia, employing 2,834 IT professionals located in various cities including Moscow and St. Petersburg.reemerged. To date we have not experienced any interruption in our office infrastructure, utility supply or Internetinternet connectivity needed to support our clients.customers. We continue to monitor the situation closely. Ourclosely and have developed contingency plans include relocatingto relocate work and/or personnel to other locations and addingadd new locations, as appropriate.appropriate, but prolonged political instability in Ukraine, sanctions against Russia, Russia’s potential response to such sanctions and tension between Russia and Belarus over energy supply could have a material adverse effect on our operations.
The U.S. Congress and Trump administration may make substantial changes to fiscal, political, regulatory and other federal policies that may adversely affect our business and financial results.
Changes in general economic or political conditions in the United States could adversely affect our business. For example, the administration under President Donald Trump has put forth and may continue to propose significant changes with respect to a variety of issues, including international trade agreements and conducting business offshore, import and export regulations, tariffs and customs duties, foreign relations, immigration laws and travel restrictions, and corporate governance laws, that could have a positive or negative impact on our business.
The majority of our professionals are offshore. Companies that outsource services to organizations operating in other countries remains a topic of political discussion in many countries, including the United States, which is our largest source of revenues. Proposed legislation in the United States could impose restrictions on offshore outsourcing and on our ability to deploy employees holding U.S. work visas to customer locations, both of which could adversely impact our business. Such legislative measures could broaden restrictions on outsourcing by federal and state government agencies and contracts and impact private industry with tax disincentives, intellectual property transfer restrictions, and restrictions on the use or availability of certain work visas.
Some of our projects require our personnel to obtain visas to travel and work at client sites outside of our personnel’s home countries. Our reliance on visas to staff projects with employees who are not citizens of the country where the work is to be performed makes us vulnerable to legislative and administrative changes in visa and work permit laws and regulations. The process to obtain the required visas and work permits can be lengthy and difficult and variations in application and enforcement due to political forces and economic conditions may cause delays or rejections when trying to obtain visas. Delays in obtaining visas may result in delays in the ability of our personnel to travel to meet with and provide services to our customers or to continue to provide services on a timely basis. In addition, the availability of a sufficient number of visas without significant additional costs could limit our ability to provide services to our customers on a timely and cost-effective basis or manage our sales and delivery centers as efficiently as we otherwise could. Delays in or the unavailability of visas and work permits could have a material adverse effect on our business, results of operations, financial condition and cash flows.
We do not have long-term commitments from our clients, andcustomers, our clientscustomers may terminate contracts before completion, or choose not to renew contracts.contracts, and we are not guaranteed payment for services performed under contract. A loss of business or non-payment from significant clientscustomers could materially affect our results of operations.
Our ability to maintain closecontinuing relationships with our major clientscustomers and successfully obtain payment for our services is essential to the growth and profitability of our business. However, the volume of work performed for any specific clientcustomer is likely to vary from year to year, especially since we generally are not our clients’customers’ exclusive IT services provider and we generally do not have long-term commitments from any clientscustomers to purchase our services. The abilityWe may also fail to adequately or accurately assess the creditworthiness of our clientscustomers. Our customers’ ability to terminate master services agreements and work ordersengagements with or without cause and our customers’ inability or unwillingness to pay for services we performed makes our future revenues uncertain, as our clients are generally not obligated for any long-term commitments to us.and profitability uncertain. Although a substantial majority of our revenues are generated from clientscustomers who also contributed to our revenues during the prior year, our engagements with our clientscustomers are typically for projects that are singular in nature. Therefore, we must seek to obtain new engagements when our current engagements end. Our failure to perform or observe any contractual obligations could also result in termination or non-renewal of a contract, as could a change of control of our company.
There are a number of factors relating to our clientscustomers that are outside of our control, which might lead them to terminate or not renew a contract or project with us, including a client’s:or be unable to pay us, including:
financial difficulties;
corporate restructuring, or mergers and acquisitions activity;
our inability to complete our contractual commitments and bill and collect our contracted revenues;
change in strategic priorities or economic conditions, resulting in elimination of the impetus for the project or a reduced level of technology related spending;
change in outsourcing strategy resulting in moving more work to the client’scustomer’s in-house technology departments or to our competitors; and
replacement of existing software with packaged software supported by licensors.
Termination or non-renewal of a customer contract could cause us to experience a higher than expected number of unassigned employees and thus compress our margins until we are able to reduce or reallocate our headcount. Customers that delay payment, request modifications to their payment arrangements, or fail to meet their payment obligations to us could increase our cash collection time or cause us to incur bad debt expense. The loss of any of our major clients, orcustomers, a significant decrease in the volume of work they outsource to us or the price at which we sell our servicesthey are willing or able to them,pay us, if not replaced by new clientservice engagements and revenue, could materially adversely affect our revenues and results of operations.
Our revenues are highly dependent on a limited number of industries, and any decrease in demand for outsourced services in these industries could reduce our revenues and adversely affect our results of operations.
A substantial portion of our clients iscustomers are concentrated in five specific industry verticals: Financial Services; Software and& Hi-Tech; Media and Entertainment;Business Information & Media; Travel and& Consumer; and Life Sciences and& Healthcare. Our business growth largely depends on continued demand for our services from clientscustomers in these five industry verticals and other industries that we target or may target in the future, as well asand also depends on trends in these industries to outsource IT services.the type of services we provide.
A downturn in any of our targeted industries, a slowdown or reversal of the trend to outsource IT services in any of these industries or the introduction of regulations that restrict or discourage companies from outsourcing could result in a decrease in the demand for our services and materially adversely affectcould have a material adverse effect on our business, financial condition and results of operations. Other developments in the industries in which we operate may also lead to a decline inincrease the demand for lower cost or lower quality IT services and decrease the demand for our services, and weor increase the pressure our customers put on us to reduce pricing. We may not be able to successfully anticipate and prepare for any such changes. Decreased demand for our services, or increased pricing pressure on us from our clients in these key industrieschanges, which could adversely affect our results of operations.
Furthermore, developments in the industries we serve could shift customer demand to new services, solutions or technology. If our customers demand new services, solutions or technologies, we may be less competitive in these new areas or may need to make significant investments to meet that demand. Additionally, as we expand into serving new industry verticals, our solutions and technology may be used by, or generally affect, a broader base of customers and end users, which may expose us to new business and operational risks.
If our pricing structures are based on inaccurate expectations and assumptions regarding the cost and complexity of performing our work, or if we are not able to maintain favorable pricing for our services, then our contracts could be unprofitable.
We negotiate pricing terms with our clients utilizing a range of pricing structures and conditions. We face a number of risks when pricing our contracts.contracts and setting terms with our customers. Our pricing is highly dependent on our internal forecasts, assumptions and predictions about our projects, the marketplace, and global economic conditions (including foreign exchange volatility). Many of our projects entail and the coordination of operations and personnel in multiple locations with different skill sets and competencies. Larger and more complex projects that involve multiple engagements or stages heighten those pricing risks because a customer may choose not to retain us for additional stages or delay forecasted engagements, which disrupts our planned project resource requirements. If our pricing for a project includes dedicated personnel or facilities and the customer were to slow or stop that project, we may not be able to reallocate resources to other customers. Our pricing and cost estimates for the work that we perform may include anticipated long-term cost savings from transformational and other initiatives that we expect to achieve and sustain over the life of the contract. Because of these inherent uncertainties, we may underprice our projects, (particularly with fixed-price contracts), fail to accurately estimate the costs of performing the work or fail to accurately assess the risks associated with potential contracts.contracts, such as defined performance goals, service levels, and completion schedules. The risk of underpricing our services or underestimating the costs of performing the work is heightened in fixed -price contracts and in contracts that require our customer to receive a productivity benefit as a deliverable under the contract. If we fail to accurately estimate the resources, time or quality levels required to complete such engagements, or if the cost to us of employees, facilities, or technology unexpectedly increases, we could be exposed to cost overruns. Any increased or unexpected costs, delays or failures to achieve anticipated cost savings, or unexpected risks we encounter in connection with the performance of this work,the services, including those caused by factors outside our control, could make these contracts less profitable or unprofitable. Moreover,
Our industry is sensitive to the economic environment and the industry tends to decline during general economic downturns. Given our significant revenues from North America and Europe, if we are not able to pass on tothose economies weaken or slow, pricing for our clients increases in compensation cost (whether driven by competition for talent or ordinary-course pay increases) or charge premium prices when justified by market demand or the type of service, our profitabilityservices may suffer.
In addition, a number of our contracts contain pricing terms that condition a portion of the payment of fees by the client on our ability to meet defined performance goals, service levels and completion schedules set forth in the contracts. Our failure to meet such performance goals, service levels or completion schedules or our failure to meet client expectations in such contracts may result in less profitable or unprofitable engagements.
If we are not successful in managing increasingly large and complex projects, we may not achieve our financial goalsbe depressed and our results of operations could be adversely affected.
To successfully perform largercustomers may reduce or postpone their technology related spending significantly, which may in turn lower the demand for our services and more complex projects, we need to establish and maintain effective, close relationships with our clients, continue high levels of client satisfaction and develop a thorough understanding of our clients’ operations. In addition, we may face a number of challenges managing larger and more complex projects, including:
maintaining high-quality control and process execution standards;
maintaining planned resource utilization rates on a consistent basis and using an efficient mix of onsite and offshore staffing;
maintaining productivity levels and implementing necessary process improvements; and
controlling costs.
Our ability to successfully manage large and complex projects depends significantly on the skills of our management personnel and IT professionals, some of whom do not have experience managing large-scale or complex projects. In addition, large and complex projects may involve multiple engagements or stages, and there is a risk that a client may choose not to retain us for additional stages or may cancel or delay additional planned engagements. Such cancellations or delays may make it difficult to plan our project resource requirements. If we fail to successfully obtain engagements for large and complex projects, we may not achieve our revenue growth and other financial goals. Even if we are successful in obtaining such engagements, a failure by us to effectively manage these large and complex projects could damage our reputation, cause us to lose business, compress our margins and adverselynegatively affect our businessrevenues and results of operations.
profitability.
We face risks associated with having a long selling and implementation cycle for our services that require us to make significant resource commitments prior to realizing revenues for those services.
We have a long selling cycle for our IT services, which requires significant investment of human resources and time by both our clients and us.services. Before committingpotential customers commit to use our services, potential clientsthey require us to expend substantial time and resources educating them on the value of our services and our ability to meet their requirements. Therefore, our selling cycle is subject to many risks and delays over which we have little or no control, including our clients’customers’ decision to select another IT service provider or in-house resources to perform the services, and the timing of our clients’customers’ budget cycles, and customer procurement and approval processes. If our sales cycle unexpectedly lengthens for one or more large projects, it wouldcould negatively affect the timing of our revenues and our revenue growth. ForIn certain clients,cases, we may begin work and incur costs prior to executing a contract. A delaycontract, which may cause fluctuations in recognizing revenues between periods or jeopardize our ability to obtain a signed agreement or other persuasive evidence of an arrangement, or to complete certain contract requirements in a particular quarter, could reduce our revenues in that quarter.collect payment from customers.
Implementing our services also involves a significant commitment of resources over an extended period of time from both our clientscustomers and us. Our current and future clientscustomers may not be willing or able to invest the time and resources necessary to implement our services, and we may fail to close sales with potential clients to whom we have devotedcustomers despite devoting significant time and resources. Any significant failure to generate revenues or delays in recognizing revenues after incurring costs related to our sales or services processprocesses could materially adversely affect our business.
If we are unable to collect our receivables from, or bill our unbilled services to, our clients, our results of operations and cash flows could be materially adversely affected.
Our business dependshave a material adverse effect on our ability to successfully obtain payment from our clients of the amounts they owe us for work performed. We usually bill and collect on relatively short cycles. We maintain allowances against receivables. Actual losses on client balances could differ from those that we currently anticipate and, as a result, we might need to adjust our allowances. There is no guarantee that we will accurately assess the creditworthiness of our clients. Weak or volatile macroeconomic and global financial system conditions could also result in financial difficulties for our clients, and, as a result, could cause clients to delay payments to us, request modifications to their payment arrangements that could increase our receivables balance, or default on their payment obligations to us. Timely collection of client balances also depends on our ability to complete our contractual commitments and bill and collect our contracted revenues. If we are unable to meet our contractual requirements, we might experience delays in collection of and/or be unable to collect our client balances, and if this occurs, our results of operations and cash flows could be materially adversely affected. Moreover, in the event of delays in payment from our governmental and quasi-governmental clients, we may have difficulty collecting on receivables owed.business.
We face intense and increasing competition for clientscustomers and opportunities from onshore and offshore IT services companies, and increased competition, our inabilityother consulting companies. If we are unable to compete successfully against competitors, pricing pressures or loss of market share could materially adversely affecthave a material adverse effect on our business.
The market for ITour services is highly competitive, and we expect competition to persist and intensify. We face competition from offshore IT services providers in other outsourcing destinations with low wage costs such as India and China, as well as competition from large, global consulting and outsourcing firms and in-house IT departments of large corporations. ClientsCustomers tend to engage multiple IT services providers instead of using an exclusive IT services provider, which could reduce our revenues to the extent that clients obtain services from otheror place significant downward pressure on pricing among competing IT services providers. ClientsCustomers may prefer IT servicesservice providers that have more locations, more personnel, more experience in a particular country or market, or that are based in countries that are more cost-competitive or have the perception of being more stable than some of the emerging markets in which we operate.
Current or prospective clientscustomers may elect to perform certain services themselves or may be discouraged from transferring services from onshore to offshore IT services providers. This shift away from offshore outsourcing would seriouslyservice providers, which could harm our ability to compete effectively with competitors that provide services from within the countries in which our clientscustomers operate.
Some of our present and potential competitors may have substantially greater financial, marketing or technical resources than EPAM. Client buying patterns can change if clients become more price sensitive and accepting of low-cost suppliers with less emphasis on quality. Therefore,resources; therefore, we may not be ableunable to retain our clients while competing against such competitors.customers or successfully attract new customers. Increased competition, our inability to compete successfully, pricing pressures or loss of market share could have a material adverse effect on our business.
If we are unable to adapt to rapidly changing technologies, methodologies and evolving industry standards, we may lose customers and our business could be materially adversely affected.
Rapidly changing technologies, methodologies and evolving industry standards are inherent in the market for our products and services. Our ability to anticipate developments in our industry, enhance our existing services, develop and introduce new services, provide enhancements and new features for our products,and keep pace with changes and developments are critical to meeting changing customer needs. Developing solutions for our customers is extremely complex and is expected to become increasingly complex and expensive in the future due to the introduction of new platforms, operating systems, technologies and methodologies. Our ability to keep pace with, anticipate or respond to changes and developments is subject to a number of risks, including that:
we may find it difficult or costly to update existing or develop new services, applications, tools and software quickly enough to meet our customers’ needs;
we may find it difficult or costly to make existing software and products work effectively and securely over the internet or with new or changed operating systems;
we may find it difficult or costly to update existing or develop new software, services, and products to keep pace with evolving industry standards, methodologies, and regulatory developments in the industries where our customers operate; and
we may find it difficult to maintain high quality levels with new technologies and methodologies.
We may not be successful in anticipating or responding to these developments in a timely manner, or if we do respond, the services, products, technologies or methodologies we develop or implement may not be successful in the marketplace. Further, services, products, technologies or methodologies that our competitors develop may render our services or products non-competitive or obsolete. Our failure to enhance our existing services and products and to develop and introduce new services and products to promptly address the needs of our customers could have a material adverse effect on our business.
Undetected software design defects, errors or failures may result in loss of business or in liabilities that could materially adversely affect our business.
Our software development solutions involve a high degree of technological complexity, have unique specifications and could contain design defects or software errors that are difficult to detect or correct. Errors or defects may result in the loss of current customers, revenues, market share, or customer data, a failure to attract new customers or achieve market acceptance, and could divert development resources and increase support or service costs. We cannot provide assurance that, despite testing by our customers and us, errors will not be found in the software products we develop or the services we perform. Any such errors could result in claims for damages against us, litigation, and reputational harm that could materially adversely affect our business.
Security breaches and other disruptions to network security could compromise our information and expose us to liability, which would cause our business and reputation to suffer.
In the ordinary course of business, we collect, store, process, transmit, and view sensitive or confidential data, including intellectual property, or proprietary business information or personally identifiable information belonging to us, our customers, respective employees, and other end users. This information is stored in our data centers and networks or in the data centers and networks of third-party providers. Physical security and the secure processing, maintenance and transmission of this information is critical to our operations and business strategy. Some of our customers are seeking additional assurances for the protection of their sensitive information, including personally identifiable information, and attach greater liability in the event that their sensitive information is disclosed.
Despite security measures, information technology and infrastructure may be vulnerable to attacks by hackers or breached due to human error, employee misconduct or malfeasance, system failure, or other disruptions. Any such breach could compromise our networks or the networks of our third-party providers and the information stored there could be accessed, publicly disclosed, misappropriated, lost or stolen. Such a breach, misappropriation, or disruption could also disrupt our operations and the services we provide to customers, damage our reputation, and cause a loss of confidence in our products and services, as well as require us to expend significant resources to protect against further breaches and to rectify problems caused by these events. Any such access, disclosure or other loss of information could result in legal claims or proceedings, liability under applicable laws, and regulatory penalties and could adversely affect our business, revenues and competitive position.
If we cause disruptions to our customers’ businesses, provide inadequate service, or breach contractual obligations, our customers may have claims for substantial damages against us and our reputation may be damaged. Our insurance coverage may be inadequate to protect us against such claims.
If our professionals make errors in the course of delivering services or we fail to meet contractual obligations to a customer, these errors or failures could disrupt the customer’s business or expose confidential or personally identifiable information. Any of these events could result in a reduction in our revenues, damage to our reputation, and could also result in a customer terminating our engagement and making claims for substantial damages against us. Some of our customer agreements do not limit our potential liability for occurrences such as breaches of confidentiality and intellectual property infringement indemnity, and we cannot generally limit liability to third parties with which we do not have a contractual relationship. In some cases, breaches of confidentiality obligations, including obligations to protect personally identifiable information, may entitle the aggrieved party to equitable remedies, including injunctive relief.
Although we maintain professional liability insurance, product liability insurance, commercial general and property insurance, business interruption insurance, workers’ compensation coverage, and umbrella insurance for certain of our operations, our insurance coverage does not insure against all risks in our operations or all claims we may receive. Damage claims from customers or third parties brought against us or claims that we initiate due to the disruption of our business, litigation, or natural disasters, may not be covered by our insurance, may exceed the limits of our insurance coverage, and may result in substantial costs and diversion of resources even if insured. Some types of insurance are not available on reasonable terms or at all in some countries in which we operate, and we cannot insure against damage to our reputation. The assertion of one or more large claims against us, whether or not successful and whether or not insured, could materially adversely affect our reputation, business, financial condition and results of operations.
A significant failure in our systems, telecommunications or IT infrastructure could harm our service model, which could result in a reduction of our revenues and otherwise disrupt our business.
Our service model relies on maintaining active voice and data communications, online resource management, financial and operational record management, customer service and data processing systems between our client sites, our delivery centers and our customer management locations. Our business activities may be materially disrupted in the event of a partial or complete failure of any of these technologies, which could be due to software malfunction, computer virus attacks, conversion errors due to system upgrades, damage from fire, earthquake, power loss, telecommunications failure, unauthorized entry, demands placed on internet infrastructure by growing numbers of users and time spent online, increased bandwidth requirements or other events beyond our control. Our crisis management procedures, business continuity, and disaster recovery plans may not be effective at preventing or mitigating the effects of such disruptions, particularly in the case of a catastrophic event. Loss of all or part of the infrastructure or systems for a period of time could hinder our performance or our ability to complete customer projects on time which, in turn, could lead to a reduction of our revenues or otherwise materially adversely affect our business and business reputation.
Our ability to generate and retain business dependscould depend on our reputation in the marketplace.
Our services are marketed to clientscustomers and prospective clientscustomers based on a number of factors. Since many of our specific client engagements involve unique services and solutions, ourfactors, including reputation. Our corporate reputation is a significant factor in our clients’customers’ evaluation of whether to engage our service, and our clients’services. Our customers’ perception of our ability to add value through our services is critical to the profitability of our engagements. We believe the EPAM brand name and our reputation are important corporate assets that help distinguish our services from those of our competitors and contribute to our efforts to recruit and retain talented employees.
However, ourOur corporate reputation is potentially susceptible to damage by actions or statements made by current or former clientscustomers and employees, competitors, vendors, adversaries in legal proceedings, government regulators, as well as members of the investment community and the media. There is a risk that negative information about our company,us, even if based on false rumor or misunderstanding,untrue, could adversely affect our business. In particular,business, could cause damage to our reputation couldand be difficult and time-consumingchallenging to repair, could make potential or existing clientscustomers reluctant to select us for new engagements, resulting in a loss of business, and could adversely affect our recruitment and retention efforts. Damage to our reputation could also reduce the value and effectiveness of the EPAM brand name and could reduce investor confidence in us.
If we are unable to adapt to rapidly changing technologies, methodologies and evolving industry standards we may lose clients and our business could be materially adversely affected.
Rapidly changing technologies, methodologies and evolving industry standards are inherent in the market for our services. Our future success will depend in part upon our ability to anticipate developments in IT services, enhance our existing services and to develop and introduce new services to keep pace with such changes and developments and to meet changing client needs. The process of developing our client solutions is extremely complex and is expected to become increasingly complex and expensive in the future due to the introduction of new platforms, operating systems, technologies and methodologies. Our ability to keep pace with, anticipate or respond to these changes is subject to a number of risks, including that:
we may find it difficult or costly to update our services, applications, tools and software and to develop new services quickly enough to meet our clients’ needs;
we may find it difficult or costly to make some features of our software work effectively and securely over the Internet or with new or changed operating systems;
we may find it difficult or costly to update our software and services to keep pace with business, evolving industry standards, methodologies, regulatory and other developments in the industries where our clients operate; and
we may find it difficult to maintain a high level of quality in implementing new technologies and methodologies.
We may not be successful in anticipating or responding to these developments in a timely manner, or if we do respond, the services, technologies or methodologies we develop or implement may not be successful in the marketplace. Further, services, technologies or methodologies that are developed by our competitors may render our services non-competitive or obsolete. Our failure to enhance our existing services and to develop and introduce new services to promptly address the needs of our clients could materially adversely affect our business.
Undetected software design defects, errors or failures may result in loss of business or in liabilities that could materially adversely affect our business.
Our software development solutions involve a high degree of technological complexity, have unique specifications and could contain design defects or software errors that are difficult to detect and correct. Errors or defects may result in the loss of current clients and loss of, or delay in, revenues, loss of market share, loss of client data, a failure to attract new clients or achieve market acceptance, diversion of development resources and increased support or service costs. We cannot provide assurance that, despite testing by our clients and us, errors will not be found in new software product development solutions, which could result in litigation, other claims for damages against us, as well as reputational harm and thus could materially adversely affect our business.
Security breaches and other disruptions to network security could compromise our information and expose us to liability, which would cause our business and reputation to suffer.
In the ordinary course of business, we have access to, collect, store, process and transmit sensitive or confidential data, including intellectual property, our proprietary business information and that of our clients, and personally identifiable information of our clients and employees, in our data centers and on our networks. The secure processing, maintenance and transmission of this information is critical to our operations and business strategy. Despite our security measures, our information technology and infrastructure may be vulnerable to attacks by hackers or breached due to human error, malfeasance or other disruptions. Any such breach could compromise our networks and the information stored there could be accessed, publicly disclosed, misappropriated, lost or stolen. Any such access, disclosure or other loss of information could result in legal claims or proceedings, liability under applicable laws and regulatory penalties. Such a breach or disruption could also disrupt our operations and the services we provide to customers, damage our reputation, and cause a loss of confidence in our products and services, as well as require us to expend significant resources to protect against further breaches and to rectify problems caused by such a breach or disruption. Any of these results could adversely affect our business, revenues and competitive position.
We may be liable to our clients for damages caused by the disclosure of confidential information, system failures or errors.
If any person, including any of our personnel, misappropriates sensitive or confidential client information, including personally identifiable information, we could be subject to significant liability from our clients or from our clients’ customers for breaching contractual confidentiality provisions or privacy laws. Some of our client agreements do not limit our potential liability for certain occurrences, including breaches of confidentiality and infringement indemnity. Furthermore, breaches of confidentiality may entitle the aggrieved party to equitable remedies, including injunctive relief. Any such breach or misappropriation resulting in unauthorized disclosure of sensitive or confidential client information, or a violation of intellectual property rights, whether through employee misconduct, breach of our computer systems, systems failure or otherwise, may subject us to liabilities, damage our reputation and cause us to lose clients.
A significant failure in our telecommunications or IT infrastructure or systems could harm our service model, which could result in a reduction of our revenue and otherwise disrupt our business.
Part of our service model is to maintain active voice and data communications, financial control, accounting, customer service and other data processing systems between our clients’ offices, our delivery centers and our client management locations. Moreover, many of our key systems for corporate operations are internally-developed applications. Our business activities may be materially disrupted in the event of a partial or complete failure of any of these internet, IT or communication systems, which could be caused by, among other things, software malfunction, computer virus attacks, conversion errors due to system upgrading, damage from fire, earthquake, power loss, telecommunications failure, unauthorized entry, demands placed on internet infrastructure by growing numbers of users and time spent online or increased bandwidth requirements or other events beyond our control. Internally-developed systems may not possess the same level of control, security or support that traditional third-party systems and applications do. Loss of all or part of the infrastructure or systems for a period of time could hinder our performance or our ability to complete client projects on time which, in turn, could lead to a reduction of our revenue or otherwise materially adversely affect our business and business reputation.
If we cause disruptions to our clients’ businesses or provide inadequate service, our clients may have claims for substantial damages against us, which could cause us to lose clients, have a negative effect on our reputation and adversely affect our results of operations.
If our IT professionals make errors in the course of delivering services to our clients or fail to consistently meet service requirements of a client, these errors or failures could disrupt the client’s business, which could result in a reduction in our revenues or a claim for substantial damages against us. Furthermore, any errors by our employees in the performance of services for a client, or poor execution of such services, could result in a client terminating our engagement and seeking damages from us. Any failure in a client’s system or breach of security relating to the services we provide to the client could damage our reputation or result in a claim for substantial damages against us, regardless of our responsibility for such failure. The assertion of one or more large claims against us, whether or not successful, could materially adversely affect our reputation, business, financial condition and results of operations.
From time to time we may invest substantial cash in new facilities and physical infrastructure, and our profitability could be reduced if our business does not grow proportionately.
As our business grows, we may invest in new facilities and physical infrastructure. We may encounter cost overruns or project delays in connection with new facilities. These expansions will likely increase our fixed costs and if we are unable to grow our business and revenues proportionately, our profitability may be reduced.
If we fail to integrate or manage acquired companies efficiently, or if the acquired companiesacquisitions do not perform to our expectations, our overall profitability and growth plans could be materially adversely affected.
PartStrategic acquisitions are part of our expansion strategy, includes strategic acquisitions. Thesebut these transactions involve significant challenges, including the risk that an acquisition doesrisks. Acquired companies may not advance our business strategy that we do notor achieve a satisfactory return on our investment, that we are unablemay not be able to successfully integrate an acquired company’s employees clientand business culture, customer relationships, andor operations, and that the transactionsacquisitions divert significant management attention and financial resources from our ongoing business. These challenges could disruptFurthermore, contracts between our acquisition targets and their customers may lack terms and conditions that adequately protect us against the risks associated with the services we provide, which may increase our potential exposure to damages.If not effectively managed, the disruption of our ongoing business, and increaseincreases in our expenses, including causing us to incur significant one-time expenses and write-offs, and difficulty and complexity of effectively integrating acquired operations may adversely affect our overall growth and profitability.
We may not be able to prevent unauthorized use of our intellectual property, and our intellectual property rights may not be adequate to protect our business and competitive position.
We rely on a combination of copyright, trademark, patent, unfair competition and trade secret laws, as well as intellectual property assignment and confidentiality agreements and other methods to protect our intellectual property rights. Protection of intellectual property rights and confidentiality in some countries in which we operate may not be as effective as in the United States or other countries with more developed intellectual property protections.
We require our employees and independent contractors to assign to us all intellectual property and work product they create in connection with their employment or engagement. These assignment agreements also obligate our personnel to keep proprietary information confidential. If these agreements are not enforceable in any of the jurisdictions in which we operate, we cannot ensure that we will own the intellectual property they create or that our proprietary information will not be disclosed. Our customers and certain vendors are generally obligated to keep our information confidential, but if these contractual obligations are not entered, or are breached or deemed unenforceable, our trade secrets, know-how or other proprietary information may be subject to unauthorized use, misappropriation or disclosure. Reverse engineering, unauthorized copying or other misappropriation of our and our customers’ proprietary technologies, tools and applications could enable unauthorized parties to benefit from our or our customers’ technologies, tools and applications without payment and may make us liable to our customers for damages and compensation, which could harm our business and competitive position.
We rely on our trademarks, trade names, service marks and brand names to distinguish our services and solutions from the services of our competitors. We have registered or applied to register many of these trademarks. Third parties may oppose our trademark applications, or otherwise challenge our use of our trademarks. In the event that our trademarks are successfully challenged, we could be forced to rebrand our services and solutions, which could result in loss of brand recognition, and could require us to devote additional resources to advertising and marketing new brands. Further, we cannot provide assurance that competitors will not infringe our trademarks, or that we will have adequate resources to enforce our trademarks. If we do enforce our trademarks and our other intellectual property rights through litigation, we may not be successful and the litigation may result in substantial costs and diversion of resources and management attention.
We may face intellectual property infringement claims that could be time-consuming and costly to defend. If we fail to defend ourselves against such claims, we may lose significant intellectual property rights and may be unable to continue providing our existing services.
Our success largely depends on our ability to use and develop our technology, tools, code, methodologies, products, and services without infringing the intellectual property rights of third parties, including patents, copyrights, trade secrets and trademarks. We may be unaware of intellectual property rights relating to our products or services that may give rise to potential infringement claims against us. If those intellectual property rights are potentially relevant to our service offerings, we may need to license those rights in order to continue to use the applicable technology, but the holders of those intellectual property rights may be unwilling to license those rights to us on commercially acceptable terms, if at all. There may also be technologies licensed to and relied on by us that if subject to infringement or misappropriation claims by third parties, may become unavailable to us if such third parties obtain an injunction to prevent us from delivering our services or using technology involving the allegedly infringing intellectual property.
We typically indemnify customers who purchase our products, services and solutions against potential infringement of third-party intellectual property rights, which subjects us to the risk and cost of defending the underlying infringement claims. These claims may require us to initiate or defend protracted and costly litigation on behalf of our customers, regardless of the merits of these claims, and our indemnification obligations are often not subject to liability limits or exclusion of consequential, indirect or punitive damages. Intellectual property litigation could also divert our management’s attention from our business and existing or potential customers could defer or limit their purchase or use of our software product development services or solutions until we resolve such litigation. If any of these claims succeed, we may be forced to pay damages on behalf of our customers, redesign or cease offering our allegedly infringing products, services, or solutions, or obtain licenses for the intellectual property that such services or solutions allegedly infringe. If we cannot obtain all necessary licenses on commercially reasonable terms, our customers may be forced to stop using our services or solutions.
Any of these actions, regardless of the outcome of litigation or merits of the claim, could damage our reputation and materially adversely affect our business, financial condition and results of operations.
We are subject to laws and regulations in the United States and other countries in which we operate, including export restrictions, economic sanctions, the FCPA, and similar anti-corruption laws. Compliance with these laws requires significant resources and non-compliance may result in civil or criminal penalties and other remedial measures.
We are subject to many laws and regulations that restrict our international operations, including laws that prohibit activities involving restricted countries, organizations, entities and persons that have been identified as unlawful actors or that are subject to U.S. sanctions. The U.S. Office of Foreign Assets Control, or OFAC, and other international bodies have imposed sanctions that prohibit us from engaging in trade or financial transactions with certain countries, businesses, organizations and individuals. We are also subject to the FCPA and anti-bribery and anti-corruption laws in other countries, all of which prohibit companies and their intermediaries from bribing government officials for the purpose of obtaining or keeping business or otherwise obtaining favorable treatment. We operate in many parts of the world that have experienced government corruption to some degree, and, in certain circumstances, strict compliance with anti-bribery laws may conflict with local customs and practices, although adherence to local customs and practices is generally not a defense under U.S. and other anti-bribery laws.
Our compliance program contains controls and procedures designed to ensure our compliance with the FCPA, OFAC and other sanctions, and laws and regulations. The continuing implementation and ongoing development and monitoring of our compliance program may be time consuming and expensive, and could result in the discovery of compliance issues or violations by us or our employees, independent contractors, subcontractors or agents of which we were previously unaware.
Any violations of these or other laws, regulations and procedures by our employees, independent contractors, subcontractors and agents, including third parties we associate with or companies we acquire, could expose us to administrative, civil or criminal penalties, fines or business restrictions, which could have a material adverse effect on our results of operations and financial condition and would adversely affect our reputation and the market for shares of our common stock and may require certain of our investors to disclose their investment in us under certain state laws.
Changes in privacy and data protection regulations could expose us to risks of noncompliance and costs associated with compliance.
EPAM is subject to the GDPR and the CCPA, each of which imposes significant restrictions and requirements relating to the processing of personal data. These and other recent international data protection laws are more burdensome than historical privacy standards, especially in the United States. The CCPA and GDPR each established complex legal obligations that organizations must follow with respect to the processing of personal data, including a prohibition on the transfer of personal information to third parties or to other countries, and the imposition of additional notification, security and other control measures.
Enforcement actions taken by the European Union data protection authorities, in the case of GDPR, or by individuals or the California regulatory authorities, in the case of the CCPA, as well as audits or investigations by one or more individuals, organizations, or foreign government agencies could result in penalties and fines for non-compliance or direct claims against us in the event of any loss or damage as a result of a breach of these regulations. The burden of compliance with additional data protection requirements may result in significant additional costs, complexity and risk in our services and customer may seek to shift the potential risks resulting from the implementation of data privacy legislation to us. We are required to establish processes and change certain operations in relation to the processing of personal data as a result of GDPR and CCPA, which may involve substantial expense and distraction from other aspects of our business.
Complying with a wide variety of legal requirements in the jurisdictions where we operate can create risks to our operations and financial condition, including liquidation of the subsidiaries that operate our major delivery centers.
Our global operations require us to comply with a wide variety of foreign laws and regulations, trade or foreign exchange restrictions or sanctions, inflation, unstable political and military situations, labor issues, and legal systems that make it more difficult to enforce intellectual property, contractual, or corporate rights. Certain legal provisions in Russia, Belarus, and complex forUkraine, where our managementlocal subsidiaries operate important delivery centers and employ a significant number of billable professionals, may allow a court to effectively manage ourorder liquidation of a locally organized legal entity on the basis of its formal noncompliance with certain requirements during formation, reorganization or during its operations. If we are not ablefail to successfully integrate an acquired entitycomply with certain requirements, including those relating to minimum net assets, governmental or local authorities can seek the involuntary liquidation of our local subsidiaries in court, and its operationscreditors will have the right to accelerate their claims, demand early performance of the company’s obligations, and to realize the benefits envisioneddemand compensation for such acquisition,any damages. Involuntary liquidation of any of our overall growthsubsidiaries could materially adversely affect our financial condition and profitability plans may be adversely affected.results of operations.
Our effective tax rate could be materially adversely affected by several factors.
We conduct business globally and file income tax returns in multiple jurisdictions. Our effective tax rate could be materially adversely affected by several factors, including changes in the amount of income taxed by or allocated to the various jurisdictions in which we operate that have differing statutory tax rates; changing tax laws, regulations and interpretations of such tax laws in multipleone or more jurisdictions; and the resolution of issues arising from tax audits or examinations and any related interest or penalties.
The determination of our provision for income taxes and other tax liabilities requires estimation, judgment and calculations where the ultimate tax determination may not be certain. Our determination of tax liability is always subject to review or examination by authorities in various jurisdictions.
If a tax authority in any jurisdiction reviews any of our tax returns and proposes an adjustment, including, as a result ofbut not limited to, a determination that the transfer prices and terms we have applied are not appropriate, such an adjustment could have a negative impact on our business.
Our earnings could be adversely affected if we change our intent notresults of operations, business, and profitability. In addition, any significant changes to repatriate earnings from Belarus, Cyprus, Ukraine, the United Kingdom,Tax Cuts and RussiaJobs Act (“U.S. Tax Act”) enacted in 2017, or such earnings become subject to U.S. tax on a current basis.
We do not accrue incremental U.S. taxes on all earnings in Belarus, Cyprus, Ukraine, the United Kingdom, and Russia as these earnings are considered to be indefinitely reinvested outside of the United States. While we have no plans to do so, events may occur in the future that could effectively force us to change our intent not to repatriate our foreign earnings. If we change our intent and repatriate such earnings, we will have to accrue the applicable amount of taxesregulatory guidance associated with such earnings and pay taxes at a substantially higher rate than our effective income tax rate in 2016. These increased taxesthe U.S. Tax Act, could materially adversely affect our financial condition and results of operations.effective tax rate.
Our operating results may be negatively impacted by the loss of certain tax benefits provided to companies in our industry by the governments of Belarus and other countries to companies incountries.
In Belarus, our industry.
Ourlocal subsidiary in Belarus is a member of the Belarus Hi-Tech Park, in whichalong with other member technology companies are 100% exemptof High-Technologies Park have a full exemption from BelarusianBelarus income tax (which as of the date of this annual report was 18%) and from the value added tax for a period of 15 consecutive years effective July 1, 2006until 2049 and are taxed at other reduced rates on a variety of other taxes. OurIn Russia, our local subsidiary in Russia benefitsalong with other qualified IT companies, benefit from paying obligatory social contributions to the government at a substantiallysignificantly reduced rate on social contributions andas well as an exemption onfrom value added tax in certain circumstances, which is a benefit to qualified IT companies in Russia.circumstances. If these tax benefits are changed, terminated, not extended or comparable new tax incentives are not introduced, we expect that our effective income tax rate and/or our operating expenses wouldcould increase significantly, which could materially adversely affect our financial condition and results of operations. See “Item 7. Management’s Discussion and Analysis of Financial Condition and Results of Operations —- Provision for Income Taxes.”
There may be adverse tax and employment law consequences if the independent contractor status of some of our personnel or the exempt status of our employees is successfully challenged.
CertainIn several countries, certain of our personnel are retained as independent contractors in several countries.contractors. The criteria to determine whether an individual is considered an independent contractor or an employee are typically fact sensitive and vary by jurisdiction, as can the interpretation of the applicable laws. If a government authority or court makes any adverse determination with respect to someindependent contractors in general or allone or more of our independent contractors specifically, we could incur significant costs, including for prior periods, in respect of tax withholding, social security taxes or payments, workers’ compensation and unemployment contributions, and recordkeeping, or we may be required to modify our business model, any of which could materially adversely affect our business, financial condition and results of operations. In addition, we classify our U.S. employees as “exempt” or “non-exempt” under the Federal Labor Standards Act (“FLSA”), and the FLSA criteria for these classifications are subject to change from time to time. If it were determined that any of our U.S. employees should be classified as “non-exempt” under the FLSA, we may incur costs and liabilities for back wages, unpaid overtime, fines or penalties and/or be subject to employee litigation.
Our insurance coverage may be inadequate to protect us against losses.
Although we maintain some insurance coverage, including professional liability insurance, property insurance coverage for certain of our facilities and equipment and business interruption insurance coverage for certain of our operations, we do not insure for all risks in our operations. If any claims for injury are brought against us, or if we experience any business disruption, litigation or natural disaster, we might incur substantial costs and diversion of resources.
Most of the agreements we have entered into with our clients require us to purchase and maintain specified insurance coverage during the terms of the agreements, including commercial general insurance or public liability insurance, umbrella insurance, product liability insurance, and workers’ compensation insurance. Some of these types of insurance are not available on reasonable terms or at all in some countries in which we operate. Although to date no client has brought any claims against us for such failure, our clients have the right to terminate these agreements as a result of such failure.
The banking and financial systems in less developed markets where we hold funds remain less developed than those in some more developed markets, and a banking crisis could place liquidity constraints on our business and materially adversely affect our business and financial condition.
Banking and other financial systems in the CIS are less developed and regulated than in some more developed markets, and legislation relating to banks and bank accounts is subject to varying interpretations and inconsistent application. Banks in the CIS generally do not meet the banking standards of more developed markets, and the transparency of the banking sector lags behind international standards. Furthermore, in Russia, Belarus and other CIS countries, bank deposits made by corporate entities generally are not insured. As a result, the banking sector remains subject to periodic instability. Another banking crisis, or the bankruptcy or insolvency of banks through which we receive or with which we hold funds, particularly in Belarus, may result in the loss of our deposits or adversely affect our ability to complete banking transactions in that region, which could materially adversely affect our business and financial condition.
Our business could be negatively affected if we incur legal liability, including with respect to our indemnification obligations, in connection with providing our solutions and services.
If we fail to meet our contractual obligations or otherwise breach obligations to our clients, we could be subject to legal liability. If we cannot or do not perform our obligations, we could face legal liability and our contracts might not always protect us adequately through limitations on the scope and/or amount of our potential liability. As a result, we might face significant legal liability and payment obligations, and our financial condition and results of operations could be materially adversely affected.
We may not be able to prevent unauthorized use of our intellectual property, and our intellectual property rights may not be adequate to protect our business and competitive position.
We rely on a combination of copyright, trademark, unfair competition and trade secret laws, as well as intellectual property assignment and confidentiality agreements and other methods to protect our intellectual property rights. Protection of intellectual property rights and confidentiality in some countries in which we operate may not be as effective as that in the United States or other countries with more mature legal systems.
We require our employees and independent contractors to enter into written agreements with us upon the commencement of their relationship with us, which assign to EPAM all intellectual property and work product made, developed or conceived by them in connection with their employment or engagement with us. These agreements also provide that any confidential or proprietary information disclosed or otherwise made available by us be kept confidential. We also enter into confidentiality and non-disclosure agreements with our clients and certain vendors. These agreements may not provide meaningful protection for trade secrets, know-how or other proprietary information in the event of any unauthorized use, misappropriation or disclosure of such trade secrets, know-how or other proprietary information. Reverse engineering, unauthorized copying or other misappropriation of our and our clients’ proprietary technologies, tools and applications could enable third parties to benefit from our or our clients’ technologies, tools and applications without paying us for doing so, and our clients may hold us liable for that act and seek damages and compensation from us, which could harm our business and competitive position.
We rely on our trademarks, trade names, service marks and brand names to distinguish our services and solutions from the services of our competitors, and have registered or applied to register many of these trademarks. We cannot assure you that our trademark applications will be approved. Third parties may oppose our trademark applications, or otherwise challenge our use of our trademarks. In the event that our trademarks are successfully challenged, we could be forced to rebrand our services and solutions, which could result in loss of brand recognition, and could require us to devote resources to advertising and marketing new brands. Further, we cannot provide assurance that competitors will not infringe our trademarks, or that we will have adequate resources to enforce our trademarks.
We may need to enforce our intellectual property rights through litigation. Litigation relating to our intellectual property may not prove successful and might result in substantial costs and diversion of resources and management attention.
We may face intellectual property infringement claims that could be time-consuming and costly to defend. If we fail to defend ourselves against such claims, we may lose significant intellectual property rights and may be unable to continue providing our existing services.
Our success largely depends on our ability to use and develop our technology, tools, code, methodologies and services without infringing the intellectual property rights of third parties, including patents, copyrights, trade secrets and trademarks. We may be subject to litigation involving claims of patent infringement or violation of other intellectual property rights of third parties.
We typically indemnify clients who purchase our services and solutions against potential infringement of intellectual property rights, which subjects us to the risk of indemnification claims. These claims may require us to initiate or defend protracted and costly litigation on behalf of our clients, regardless of the merits of these claims and are often not subject to liability limits or exclusion of consequential, indirect or punitive damages. If any of these claims succeed, we may be forced to pay damages on behalf of our clients, redesign or cease offering our allegedly infringing services or solutions, or obtain licenses for the intellectual property that such services or solutions allegedly infringe. If we cannot obtain all necessary licenses on commercially reasonable terms, our clients may be forced to stop using our services or solutions.
The holders of patents and other intellectual property rights potentially relevant to our service offerings may make it difficult for us to acquire a license on commercially acceptable terms. In addition, we may be unaware of intellectual property registrations or applications relating to our services that may give rise to potential infringement claims against us. There may also be technologies licensed to and relied on by us that are subject to infringement or other corresponding allegations or claims by third parties, which may damage our ability to rely on such technologies.
Further, our current and former employees and/or subcontractors could challenge our exclusive rights in the software they have developed in the course of their employment. In Russia and certain other countries in which we operate, an employer is deemed to own the copyright in works created by its employees during the course, and within the scope, of their employment, but the employer may be required to satisfy additional legal requirements in order to make further use and dispose of such works. While we believe that we have complied with all such requirements, and have fulfilled all requirements necessary to acquire all rights in software developed by our independent contractors and/or subcontractors, these requirements are often ambiguously defined and enforced. As a result, we cannot assure that we would be successful in defending against any claim by our current or former employees, independent contractors and/or subcontractors challenging our exclusive rights over the use and transfer of works those employees, independent contractors and/or subcontractors created or requesting additional compensation for such works.
Parties making infringement claims may be able to obtain an injunction to prevent us from delivering our services or using technology involving the allegedly infringing intellectual property. Intellectual property litigation is expensive, time-consuming and could divert management’s attention from our business. Protracted litigation could also result in existing or potential clients deferring or limiting their purchase or use of our software product development services or solutions until resolution of such litigation, or could require us to indemnify our clients against infringement claims in certain instances. Any of these actions, regardless of the outcome of litigation or merits of the claim, could damage our reputation and materially adversely affect our business, financial condition and results of operations.
We are subject to laws and regulations in the United States and other countries in which we operate, including export restrictions, economic sanctions and the Foreign Corrupt Practices Act, or FCPA, and similar anti-corruption laws. If we are not in compliance with applicable legal requirements, we may be subject to civil or criminal penalties and other remedial measures.
As a company with international operations, we are subject to many laws and regulations restricting our operations, including activities involving restricted countries, organizations, entities and persons that have been identified as unlawful actors or that are subject to U.S. sanctions imposed by the Office of Foreign Assets Control, or OFAC, or other international sanctions that prohibit us from engaging in trade or financial transactions with certain countries, businesses, organizations and individuals. We are subject to the FCPA, which prohibits U.S. companies and their intermediaries from bribing foreign officials for the purpose of obtaining or keeping business or otherwise obtaining favorable treatment, and other laws concerning our international operations. The FCPA’s foreign counterparts contain similar prohibitions, although varying in both scope and jurisdiction and not limited to transactions with government officials. We operate in many parts of the world that have experienced governmental corruption to some degree, and, in certain circumstances, strict compliance with anti-bribery laws may conflict with local customs and practices, although adherence to local customs and practices is generally not a defense under U.S. and other anti-bribery laws.
We have a compliance program with controls and procedures designed to ensure our compliance with the FCPA, OFAC sanctions, and similar sanctions, laws and regulations. The continuing implementation and ongoing development and monitoring of such program may be time consuming and expensive, and could result in the discovery of issues or violations with respect to the foregoing by us or our employees, independent contractors, subcontractors or agents of which we were previously unaware.
Any violations of these or other laws, regulations and procedures by our employees, independent contractors, subcontractors and agents could expose us to administrative, civil or criminal penalties, fines or business restrictions, which could have a material adverse effect on our results of operations and financial conditionincrease the difficulty in attracting and would adversely affect our reputation and the market for shares of our common stock and may require certain of our investors to disclose their investment in our company under certain state laws.
Anti-outsourcing legislation and restrictions on immigration, if adopted, may affect our ability to compete for and provide services to clients in the United States or other countries, which could hamper our growth and cause our revenues to decline.
The majority of our employees are nationals of CIS and CEE countries. Some of our projects require a portion of the work to be undertaken at our clients’ facilities, which are sometimes located outside the CIS, CEE. The ability of our employees to work in necessary locations around the world depends on their ability to obtain the required visas and work permits, and this process can be lengthy and difficult. Immigration laws are subject to legislative change, as well as to variations in standards of application and enforcement due to political forces and economic conditions.
In addition, the issue of companies outsourcing services to organizations operating in other countries is a topic of political discussion in many countries, including the United States, which is our largest source of revenues. It is possible that pending legislation in the United States regarding offshore outsourcing may impose restrictions on our ability to deploy employees holding U.S. work visas to client locations, which could adversely impact our business. It is generally difficult to predict the political and economic events that could affect immigration laws, or the restrictive impact they could have on obtaining or maintaining business visas for our employees. However, if enacted, such measures may broaden restrictions on outsourcing by federal and state government agencies and on government contracts with firms that outsource services directly or indirectly, impact private industry with measures such as tax disincentives or intellectual property transfer restrictions, and/or restrict the use of certain work visas.
Our reliance on visas for a number of employees makes us vulnerable to such changes and variations as it affects our ability to staff projects with employees who are not citizens of the country where the work is to be performed. We may not be able to obtain a sufficient number of visas for our employees or we may encounter delays or additional costs in obtaining or maintaining such visas, in which case we may not be able to provide services to our clients on a timely and cost-effective basis or manage our sales and delivery centers as efficiently as we otherwise could, any of which could hamper our growth and cause our revenues to decline.
A recent U.S. executive order titled “Protecting the Nation From Foreign Terrorist Entry Into the United States” restricts entry into the United States of non-U.S. nationals from a number of enumerated countries in the Middle East and suspends a visa interview waiver program that was in place at U.S. consulates worldwide. While the travel restrictions do not extend to nationals of CIS and CEE countries, it is possible that there could be delays in visa processing before CIS and CEE nationals can enter into the United States and their wait times for visa interviews may increase significantly. Wait times could also be impacted by a recently announced U.S. federal government hiring freeze. Delays in the process to obtain visas may result in delays in the ability of our personnel to travel to meet with our clients, provide services to our clients or to continue to provide services on a timely basis, which could have a material adverse effect on our business, results of operations, financial condition and cash flows.
Similarly, legislation enacted in certain European jurisdictions and any future legislation in European jurisdictions or any other country in which we have clients restricting the performance of services from an offshore location could also materially adversely affect our business, financial condition and results of operations. For example, legislation enacted in the United Kingdom, based on the 1977 EC Acquired Rights Directive, has been adopted in some form by many European Union countries, and provides that if a company outsources all or part of its business to an IT services provider or changes its current IT services provider, the affected employees of the company or of the previous IT services provider are entitled to become employees of the new IT services provider, generally on the same terms and conditions as their original employment. In addition, dismissals of employees who were employed by the company or the previous IT services provider immediately prior to that transfer are automatically considered unfair dismissals that entitle such employees to compensation. As a result, in order to avoid unfair dismissal claims, we may have to offer, and become liable for, voluntary redundancy payments to the employees of our clients who outsource business to us in the United Kingdom and other European Union countries who have adopted similar laws. This legislation could materially affect our ability to obtain new business from companies in the United Kingdom and European Union and to provide outsourced services to companies in the United Kingdom and European Union in a cost-effective manner.
Our CIS subsidiaries can be forced into liquidation on the basis of formal noncompliance with certain legal requirements.
We operate in CIS countries primarily through locally organized subsidiaries. Certain provisions of Russian law and the laws of other CIS countries may allow a court to order liquidation of a locally organized legal entity on the basis of its formal noncompliance with certain requirements during formation, reorganization or during its operations. If the company fails to comply with certain requirements including those relating to minimum net assets, governmental or local authorities can seek the involuntary liquidation of such company in court, and the company’s creditors will have the right to accelerate their claims or demand early performance of the company’s obligations as well as demand compensation for any damages. If involuntary liquidation of any of our subsidiaries were to occur, such liquidation could materially adversely affect our financial condition and results of operations.retaining personnel.
We may need additional capital, and a failure by us to raise additional capital on terms favorable to us, or at all, could limit our ability to grow our business and develop or enhance our service offerings to respond to market demand or competitive challenges.
We believe that our current cash, cash flow from operations and revolving line of credit are sufficient to meet our anticipated cash needs for at least the next 12twelve months. We may, however, require additional cash resources due to changed business conditions or other future developments, including any investments or acquisitions that we may decide to pursue. If these resources are insufficient to satisfy our cash requirements, we may seek to sell additional equity or debt securities or obtain another or larger credit facility, and we can’tcannot be certain that such additional financing would be available on terms acceptable to us.us or at all. The sale of additional equity securities could result in dilution to our stockholders. The incurrence ofstockholders, and additional indebtedness would result in increased debt service costs and obligations and could require us to agree toimpose operating and financingfinancial covenants that would further restrict our operations.
Our stock price is volatile.
Our common stock has at times experienced substantial price volatility as a result of variations between our actual and anticipated financial results, announcements by our competitors and us, projections or speculation about our business or that of our competitors by the media or investment analysts or uncertainty about current global economic conditions. The stock market, as a whole, also has experienced price and volume fluctuations that have affected the market price of many technology companies in ways that may have been unrelated to these companies’ operating performance. Furthermore, we believe our stock price should reflect future growth and profitability expectations and, if we fail to meet these expectations, our stock price may significantly decline.
Expense related to our liability-classified restricted stock units, which are subject to mark-to-market accounting, and the calculation of the weighted-average diluted shares outstanding in accordance with the treasury method are both affected by our stock price. Any fluctuations in the price of our stock will affect our future operating results.
Our hedging program is subject to counterparty default risk.
We enter into foreign currency forward contracts with a number of counterparties. As a result, we are subject to the risk that the counterparty to one or more of these contracts defaults on its performance under the contract. During an economic downturn, the counterparty’s financial condition may deteriorate rapidly and with little notice and we may be unable to take action to protect our exposure. In the event of a counterparty default, we could incur significant losses, which may harm our business and financial condition. In the event that one or more of our counterparties becomes insolvent or files for bankruptcy, our ability to eventually recover any losses suffered as a result of that counterparty’s default may be limited by the liquidity of the counterparty.
Item 1B. Unresolved Staff Comments
None.
Item 2. Properties
WeOur corporate headquarters are incorporated in Delaware with headquarterslocated in Newtown, PA. The table below sets forth our principal properties: |
| | | | | | | | | |
| Location | | Square Meters Leased | | Square Meters Owned | | Total Square Meters |
| Delivery Centers and Client Management Locations: | | | | | | |
| Belarus | | 63,059 |
| | 21,669 |
| | 84,728 |
|
| Ukraine | | 38,855 |
| | | | 38,855 |
|
| Russia | | 36,576 |
| | | | 36,576 |
|
| Hungary | | 26,297 |
| | | | 26,297 |
|
| Poland | | 16,894 |
| | | | 16,894 |
|
| India | | 14,802 |
| | | | 14,802 |
|
| China | | 10,044 |
| | | | 10,044 |
|
| United States | | 7,331 |
| | | | 7,331 |
|
| Bulgaria | | 3,244 |
| | | | 3,244 |
|
| Czech Republic | | 2,851 |
| | | | 2,851 |
|
| Kazakhstan | | 2,681 |
| | | | 2,681 |
|
| Mexico | | 2,007 |
| | | | 2,007 |
|
| United Kingdom | | 1,090 |
| | | | 1,090 |
|
| Canada | | 978 |
| | | | 978 |
|
| Switzerland | | 662 |
| | | | 662 |
|
| Armenia | | 540 |
| | | | 540 |
|
| Sweden | | 322 |
| | | | 322 |
|
| United Arab Emirates | | 73 |
| | | | 73 |
|
| Germany | | 28 |
| | | | 28 |
|
| Philippines | | 11 |
| | | | 11 |
|
| Total | | 228,345 |
| | 21,669 |
| | 250,014 |
|
| Executive Office: | | | | | | |
| Newtown, PA, United States | | 1,212 |
| | — |
| | 1,212 |
|
OurPennsylvania. We own and lease office buildings used as delivery centers, client management locations and space for administrative and support functions. These facilities are used interchangeably among alllocated in numerous cities worldwide and are strategically positioned in relation to our talent sources and key in-market locations to align with the needs of our segments.operations. We believe that our existing facilitiesproperties are adequate to meet ourthe current requirements of our business, and that suitable additional or substitute space will be available, if necessary. Our facilities are used interchangeably among all of our segments. See Note 15 “Segment Information” in the notes to our consolidated financial statements in this Annual Report on Form 10-K for information regarding the geographical locations and values of our long-lived assets. See
Note 7 “Leases” in the notes to our consolidated financial statements in this Annual Report on Form 10-K for information regarding our leased assets.
Item 3. Legal Proceedings
From time to time, we are involved in litigation and claims arising out of our business and operations in the normal course of business. We are not currently a party to any material legal proceeding. In addition,proceeding, nor are we are not aware of any material legal or governmental proceedings against us,pending or contemplated to be brought against us.
Item 4. Mine Safety Disclosures
None.
PART II
Item 5. Market for Registrant’s Common Equity, Related Stockholder Matters and Issuer Purchases of Equity Securities
Market Information
Our common stock is traded on the New York Stock Exchange (“NYSE”) under the symbol “EPAM.”
The price range per share of common stock presented below represents the highest and lowest intraday sales prices for the Company’s common stock on the NYSE during each quarter of the two most recent years. | | | 2016 | | | | | |
| 2019 | | | | | |
| Quarter Ended | | High | | Low | | High | | Low |
| December 31 | | $ | 69.20 |
| | $ | 54.53 |
| | $ | 217.00 |
| | $ | 168.26 |
|
| September 30 | | $ | 71.79 |
| | $ | 61.47 |
| | $ | 201.00 |
| | $ | 174.71 |
|
| June 30 | | $ | 78.40 |
| | $ | 61.32 |
| | $ | 180.55 |
| | $ | 157.16 |
|
| March 31 | | $ | 78.04 |
| | $ | 54.88 |
| | $ | 173.71 |
| | $ | 111.44 |
|
| | | 2015 | | | | | |
| 2018 | | | | | |
| Quarter Ended | | High | | Low | | High | | Low |
| December 31 | | $ | 84.41 |
| | $ | 67.29 |
| | $ | 139.31 |
| | $ | 104.77 |
|
| September 30 | | $ | 76.69 |
| | $ | 63.37 |
| | $ | 144.19 |
| | $ | 115.95 |
|
| June 30 | | $ | 74.49 |
| | $ | 57.58 |
| | $ | 131.75 |
| | $ | 110.20 |
|
| March 31 | | $ | 63.50 |
| | $ | 45.27 |
| | $ | 125.88 |
| | $ | 102.03 |
|
As of February 10, 2017,12, 2020, we had approximately 2818 stockholders of record of our common stock. The number of record holders does not include holders of shares in “street name” or persons, partnerships, associations, corporations or other entities identified in security position listings maintained by depositories.
Dividend Policy
We have not declared or paid any cash dividends on our common stock and currently do not anticipate paying any cash dividends in the foreseeable future. Instead, we intend to retain all available funds and any future earnings for use in the operation and expansion of our business. Any future determination relating to our dividend policy will be made at the discretion of our Board of Directors and will depend on our future earnings, capital requirements, financial condition, future prospects, applicable Delaware law, which provides that dividends are only payable out of surplus or current net profits, and other factors that our Board of Directors deems relevant. In addition, our revolving credit facility restricts our ability to make or pay dividends (other than certain intercompany dividends) unless no potential or actual event of default has occurred or would be triggered thereby.
Equity Compensation Plan Information
See “Item 12. Security Ownership of Certain Beneficial Owners and Management and Related Stockholder Matters” in Part III of this Annual Report for our equity compensation plan information.
Performance Graph
The following graph compares the cumulative total stockholder return on our common stock with the cumulative total return on the S&P 500 Index and a Peer Group Index (capitalization weighted) for the period beginning February 8, 2012, which is the date of our initial public offering,December 31, 2014 and ending on the last day of our last completed fiscal year.December 31, 2019. The stock performance shown on the graph below is not indicative of future price performance. The following performance graph and related information shall not be deemed “soliciting material” or to be “filed” with the SEC, nor shall information be incorporated by reference into any future filing under the Securities Act of 1933 or Securities Exchange Act of 1934, each as amended, except to the extent that we specifically incorporate it by reference into such filing.
COMPARISON OF CUMULATIVE TOTAL RETURN (1)(2)
Among EPAM, a Peer Group (3) and the S&P 500 Index and a Peer Group Index(3) (Capitalization Weighted)
|
| | | | | | | | | | | | |
| | | Company / Index |
| Base Period | | EPAM Systems, Inc. | | S&P 500 Index | | Peer Group Index |
| 12/31/2016 | | $ | 459.36 |
| | $ | 165.84 |
| | $ | 121.34 |
|
| 9/30/2016 | | $ | 495.07 |
| | $ | 160.62 |
| | $ | 120.39 |
|
| 6/30/2016 | | $ | 459.36 |
| | $ | 155.48 |
| | $ | 142.02 |
|
| 3/31/2016 | | $ | 533.36 |
| | $ | 152.58 |
| | $ | 150.74 |
|
| 12/31/2015 | | $ | 561.57 |
| | $ | 151.41 |
| | $ | 139.88 |
|
| 9/30/2015 | | $ | 532.29 |
| | $ | 142.23 |
| | $ | 149.62 |
|
| 6/30/2015 | | $ | 508.79 |
| | $ | 152.83 |
| | $ | 140.50 |
|
| 3/31/2015 | | $ | 437.79 |
| | $ | 153.18 |
| | $ | 149.56 |
|
| 12/31/2014 | | $ | 341.07 |
| | $ | 152.52 |
| | $ | 127.74 |
|
| 9/30/2014 | | $ | 312.79 |
| | $ | 146.10 |
| | $ | 120.55 |
|
| 6/30/2014 | | $ | 312.50 |
| | $ | 145.21 |
| | $ | 118.41 |
|
| 3/31/2014 | | $ | 235.00 |
| | $ | 138.70 |
| | $ | 124.76 |
|
| 12/31/2013 | | $ | 249.57 |
| | $ | 136.92 |
| | $ | 124.18 |
|
| 9/30/2013 | | $ | 246.43 |
| | $ | 124.56 |
| | $ | 103.03 |
|
| 6/30/2013 | | $ | 194.14 |
| | $ | 118.99 |
| | $ | 80.39 |
|
| 3/31/2013 | | $ | 165.93 |
| | $ | 116.24 |
| | $ | 99.89 |
|
| 12/31/2012 | | $ | 129.29 |
| | $ | 105.65 |
| | $ | 85.86 |
|
| 9/30/2012 | | $ | 135.29 |
| | $ | 106.72 |
| | $ | 89.48 |
|
| 6/30/2012 | | $ | 121.36 |
| | $ | 100.90 |
| | $ | 83.91 |
|
| 3/31/2012 | | $ | 146.57 |
| | $ | 104.33 |
| | $ | 102.94 |
|
| 2/8/2012 | | $ | 100 |
| | $ | 100 |
| | $ | 100 |
|
|
| | | | | | | | | | | | | | | | | | | | | | | | |
| Company/Index | | Base period
12/31/2014 | | 12/31/2015 | | 12/31/2016 | | 12/31/2017 | | 12/31/2018 | | 12/31/2019 |
| EPAM Systems, Inc. | | $ | 100.00 |
| | $ | 164.65 |
| | $ | 134.68 |
| | $ | 224.98 |
| | $ | 242.95 |
| | $ | 444.31 |
|
| Peer Group Index | | $ | 100.00 |
| | $ | 119.57 |
| | $ | 115.32 |
| | $ | 157.15 |
| | $ | 136.41 |
| | $ | 145.19 |
|
| S&P 500 Index | | $ | 100.00 |
| | $ | 101.38 |
| | $ | 113.51 |
| | $ | 138.28 |
| | $ | 132.23 |
| | $ | 173.86 |
|
|
| |
| | |
| (1) | Graph assumes $100 invested on February 8, 2012,December 31, 2014, in our common stock, a Peer Group and the S&P 500 Index, and the Peer Group Index (capitalization weighted).Index. |
| (2) | Cumulative total return assumes reinvestment of dividends. |
| (3) | We have constructed aThe Peer Group Index of other information technology consulting firms consisting of Virtusa Corporation (NASDAQ:VRTU),includes Cognizant Technology Solutions Corp. (NASDAQ:CTSH), ExlService Holdings, Inc. (NASDAQ:EXLS), Globant S.A. (NASDAQ:GLOB), Infosys Ltd ADRLtd. (NYSE:INFY), Luxoft Holding, Inc (NASDAQ:LXFT), Syntel,Perficient, Inc. (NASDAQ:SYNT)PRFT), Virtusa Corporation (NASDAQ:VRTU), and Wipro Ltd. (ADR)Limited (NYSE:WIT). |
Unregistered Sales of Equity Securities
There were no unregistered salesIn connection with the Company’s acquisition of all of the outstanding equity securities byof Axsphère SAS (“Axsphere”), on September 3, 2019, the Company duringissued 18,787 shares of common stock to the year ended December 31, 2016.Axsphere seller under the terms of the purchase agreement. Of these issued shares, 4,757 shares were immediately transferred to the seller and accounted for as service-based stock-based compensation expense; 4,637 shares were deposited in an escrow account to satisfy certain potential indemnification claims and were accounted for as service-based stock-based compensation; and 9,393 shares were deposited in an escrow account and will be released upon achievement of certain performance metrics and are accounted for as performance-based stock-based compensation. All of the shares of common stock issued in connection with these transactions are restricted securities (as defined in Rule 144 of the Securities Act of 1933, as amended (the “Securities Act”)). No underwriter was involved in these transactions and no underwriting commissions were paid. The transactions were exempt from the registration requirements pursuant to Section 4(a)(2) of the Securities Act, since such transactions did not involve any public offering.
Purchases of Equity Securities by the Issuer and Affiliated Purchasers
There were no purchasesUnder our equity-based compensation plans, on the date of equity securitiesvesting of stock-based compensation awards to our personnel, the Company withholds a number of shares of vested stock to satisfy tax withholding obligations arising on that date. The number of shares of stock to be withheld is calculated based on the closing price of the Company’s common stock on the vesting date. The following table provides information about shares withheld by the issuer and affiliated purchasersCompany during the quarterly periodyear ended December 31, 2016.2019:
|
| | | | | | | | | | | | | |
| Period | | Total Number of
Shares Purchased | | Average Price
Paid Per Share | | Total Number of Shares Purchased as Part of Publicly Announced Plans or Programs | |
Maximum Dollar Amount of Shares That May Yet Be Purchased Under the Program |
| January 1, 2019 to January 31, 2019 | | 319 |
| | $ | 141.48 |
| | — |
| | — |
|
| March 1, 2019 to March 31, 2019 | | 81,243 |
| | $ | 165.41 |
| | — |
| | — |
|
| April 1, 2019 to April 30, 2019 | | 1,615 |
| | $ | 174.33 |
| | — |
| | — |
|
| May 1, 2019 to May 31, 2019 | | 71 |
| | $ | 171.57 |
| | — |
| | — |
|
| June 1, 2019 to June 30, 2019 | | 398 |
| | $ | 173.07 |
| | — |
| | — |
|
| July 1, 2019 to July 31, 2019 | | 5,846 |
| | $ | 182.75 |
| | — |
| | — |
|
| August 1, 2019 to August 31, 2019 | | 108 |
| | $ | 193.23 |
| | — |
| | — |
|
| September 1, 2019 to September 30, 2019 | | 7 |
| | $ | 180.36 |
| | — |
| | — |
|
| October 1, 2019 to October 31, 2019 | | 326 |
| | $ | 189.20 |
| | — |
| | — |
|
| November 1, 2019 to November 30, 2019 | | 5,227 |
| | $ | 179.82 |
| | — |
| | — |
|
| December 1, 2019 to December 31, 2019 | | 63 |
| | $ | 211.90 |
| | — |
| | — |
|
| Total | | 95,223 |
| | $ | 167.52 |
| | — |
| | — |
|
Item 6. Selected Financial Data
The following table represents the selected financial data for each of the last five fiscal years. Our historical results are not necessarily indicative of the results to be expected for any future period. The following selected financial data should be read in conjunction with “Item 7. Management’s Discussion and Analysis of Financial Condition and Results of Operations” and our consolidated financial statements and related notes included elsewhere in this annual report.
|
| | | | | | | | | | | | | | | | | | | |
| | Year Ended December 31, |
| | 2016 | | 2015 | | 2014 | | 2013 | | 2012 |
| | (in thousands, except per share data) |
| Consolidated Statement of Income Data: | | | | | | | | | |
| Revenues | $ | 1,160,132 |
| | $ | 914,128 |
| | $ | 730,027 |
| | $ | 555,117 |
| | $ | 433,799 |
|
| Operating expenses: | | | | | | | |
| | |
|
| Cost of revenues (exclusive of depreciation and amortization) | 737,186 |
| | 566,913 |
| | 456,530 |
| | 347,650 |
| | 270,361 |
|
| Selling, general and administrative expenses | 264,658 |
| | 222,759 |
| | 163,666 |
| | 116,497 |
| | 85,868 |
|
| Depreciation and amortization expense | 23,387 |
| | 17,395 |
| | 17,483 |
| | 15,120 |
| | 10,882 |
|
| Goodwill impairment loss | — |
| | — |
| | 2,241 |
| | — |
| | — |
|
| Other operating expenses/(income), net | 1,205 |
| | 1,094 |
| | 3,924 |
| | (643 | ) | | 682 |
|
| Income from operations | 133,696 |
| | 105,967 |
| | 86,183 |
| | 76,493 |
| | 66,006 |
|
| Interest and other income, net | 4,848 |
| | 4,731 |
| | 4,769 |
| | 3,077 |
| | 1,941 |
|
| Change in fair value of contingent consideration | — |
| | — |
| | (1,924 | ) | | — |
| | — |
|
| Foreign exchange loss | (12,078 | ) | | (4,628 | ) | | (2,075 | ) | | (2,800 | ) | | (2,084 | ) |
| Income before provision for income taxes | 126,466 |
| | 106,070 |
| | 86,953 |
| | 76,770 |
| | 65,863 |
|
| Provision for income taxes | 27,200 |
| | 21,614 |
| | 17,312 |
| | 14,776 |
| | 11,379 |
|
| Net income | $ | 99,266 |
| | $ | 84,456 |
| | $ | 69,641 |
| | $ | 61,994 |
| | $ | 54,484 |
|
Net income per share of common stock(1): | | | |
| | |
| | |
| | |
|
| Basic | $ | 1.97 |
| | $ | 1.73 |
| | $ | 1.48 |
| | $ | 1.35 |
| | $ | 1.27 |
|
| Diluted | $ | 1.87 |
| | $ | 1.62 |
| | $ | 1.40 |
| | $ | 1.28 |
| | $ | 1.17 |
|
| Shares used in calculation of net income per share: | | | |
| | |
| | |
| | |
|
| Basic | 50,309 |
| | 48,721 |
| | 47,189 |
| | 45,754 |
| | 40,190 |
|
| Diluted | 53,215 |
| | 51,986 |
| | 49,734 |
| | 48,358 |
| | 43,821 |
|
|
| |
| |
(1) | In connection with the completion of our initial public offering, we effected an 8-for-1 common stock split as of January 19, 2012. All historical common stock and per share information has been changed to reflect the common stock split. |
|
| | | | | | | | | | | | | | | | | | | |
| | Year Ended December 31, |
| | 2019 | | 2018 | | 2017 | | 2016 | | 2015 |
| | (in thousands, except per share data) |
| Consolidated Statements of Income Data: | | | | | | | | | |
| Revenues | $ | 2,293,798 |
| | $ | 1,842,912 |
| | $ | 1,450,448 |
| | $ | 1,160,132 |
| | $ | 914,128 |
|
| Operating expenses: | | | | | | | | | |
| Cost of revenues (exclusive of depreciation and amortization) | 1,488,198 |
| | 1,186,921 |
| | 921,352 |
| | 737,186 |
| | 566,913 |
|
| Selling, general and administrative expenses | 457,433 |
| | 373,587 |
| | 327,588 |
| | 265,863 |
| | 223,853 |
|
| Depreciation and amortization expense | 45,317 |
| | 36,640 |
| | 28,562 |
| | 23,387 |
| | 17,395 |
|
| Income from operations | 302,850 |
| | 245,764 |
| | 172,946 |
| | 133,696 |
| | 105,967 |
|
| Interest and other income, net | 8,725 |
| | 3,522 |
| | 4,601 |
| | 4,848 |
| | 4,731 |
|
| Foreign exchange (loss)/gain | (12,049 | ) | | 487 |
| | (3,242 | ) | | (12,078 | ) | | (4,628 | ) |
| Income before provision for income taxes | 299,526 |
| | 249,773 |
| | 174,305 |
| | 126,466 |
| | 106,070 |
|
| Provision for income taxes | 38,469 |
| | 9,517 |
| | 101,545 |
| | 27,200 |
| | 21,614 |
|
| Net income | $ | 261,057 |
| | $ | 240,256 |
| | $ | 72,760 |
| | $ | 99,266 |
| | $ | 84,456 |
|
| Net income per share of common stock: | | | |
| | |
| | |
| | |
|
| Basic | $ | 4.77 |
| | $ | 4.48 |
| | $ | 1.40 |
| | $ | 1.97 |
| | $ | 1.73 |
|
| Diluted | $ | 4.53 |
| | $ | 4.24 |
| | $ | 1.32 |
| | $ | 1.87 |
| | $ | 1.62 |
|
| Shares used in calculation of net income per share: | | | |
| | |
| | |
| | |
|
| Basic | 54,719 |
| | 53,623 |
| | 52,077 |
| | 50,309 |
| | 48,721 |
|
| Diluted | 57,668 |
| | 56,673 |
| | 54,984 |
| | 53,215 |
| | 51,986 |
|
| | | | | As of December 31, | | As of December 31, |
| | | 2016 | | 2015 | | 2014 | | 2013 | | 2012 | | 2019 | | 2018 | | 2017 | | 2016 | | 2015 |
| | | (in thousands) | | (in thousands) |
| Consolidated Balance Sheet Data: | | | | | | | | | | | |
| Consolidated Balance Sheets Data: | | | | | | | | | | | |
| Cash and cash equivalents | | $ | 362,025 |
| | $ | 199,449 |
| | $ | 220,534 |
| | $ | 169,207 |
| | $ | 118,112 |
| | $ | 936,552 |
| | $ | 770,560 |
| | $ | 582,585 |
| | $ | 362,025 |
| | $ | 199,449 |
|
| Time deposits | | 403 |
| | 30,181 |
| | — |
| | — |
| | — |
| |
| Accounts receivable, net | | 199,982 |
| | 174,617 |
| | 124,483 |
| | 95,431 |
| | 78,906 |
| |
| Unbilled revenues | | 63,325 |
| | 95,808 |
| | 55,851 |
| | 43,108 |
| | 33,414 |
| |
| Trade receivables and contract assets, net | | | $ | 497,716 |
| | $ | 402,337 |
| | $ | 352,139 |
| | $ | 263,307 |
| | $ | 270,425 |
|
| Property and equipment, net | | 73,616 |
| | 60,499 |
| | 55,134 |
| | 53,315 |
| | 53,135 |
| | $ | 165,259 |
| | $ | 102,646 |
| | $ | 86,419 |
| | $ | 73,616 |
| | $ | 60,499 |
|
| Total assets | | 925,811 |
| | 778,536 |
| | 594,026 |
| | 432,877 |
| | 350,814 |
| | $ | 2,244,208 |
| | $ | 1,611,802 |
| | $ | 1,250,256 |
| | $ | 925,811 |
| | $ | 778,536 |
|
| Long-term debt | | 25,048 |
| | 35,000 |
| | — |
| | — |
| | — |
| | $ | 25,074 |
| | $ | 25,031 |
| | $ | 25,033 |
| | $ | 25,048 |
| | $ | 35,000 |
|
| Total liabilities | | 144,399 |
| | 165,313 |
| | 129,976 |
| | 56,776 |
| | 64,534 |
| | $ | 648,063 |
| | $ | 349,206 |
| | $ | 275,309 |
| | $ | 144,399 |
| | $ | 165,313 |
|
| Total stockholders’ equity | | 781,412 |
| | 613,223 |
| | 464,050 |
| | 376,101 |
| | 286,280 |
| | $ | 1,596,145 |
| | $ | 1,262,596 |
| | $ | 974,947 |
| | $ | 781,412 |
| | $ | 613,223 |
|
Item 7. Management’s Discussion and Analysis of Financial Condition and Results of Operations
You should read the following discussion and analysis of our financial condition and results of operations together with our audited consolidated financial statements and the related notes included elsewhere in this annual report. In addition to historical information, this discussion contains forward-looking statements that involve risks, uncertainties and assumptions that could cause actual results to differ materially from management’s expectations. Factors that could cause such differences are discussed in the sections entitled “Special Note Regarding Forward-Looking“Forward-Looking Statements” and “Item“Part I. Item 1A. Risk Factors.” We assume no obligation to update any of these forward-looking statements.
Executive Summary
We are a leading global provider of product developmentdigital platform engineering and software engineering solutionsdevelopment services offering specialized technological consultingsolutions to many of the world’s leading organizations.
Our clientscustomers depend on us to solve their complex technical challenges and rely on our expertise in core engineering, advanced technology, digital engagementdesign and intelligent enterprise development. We are continuously venturing intoexplore opportunities in new industries to expand our core industry client base in software and technology, financial services, mediabusiness information and entertainment,media, travel and consumer, retail and distribution and life sciences and healthcare. Our teams of developers, architects, consultants, strategists, engineers, designers, and product experts have the capabilities and skill sets to deliver business results.
Our global delivery model and centralized support functions, combined with the benefits of scale from the shared use of fixed-cost resources, enhance our productivity levels and enable us to better manage the efficiency of our global operations. This model allowsAs a result, we have created a delivery base whereby our applications, tools, methodologies and infrastructure allow us to seamlessly deliver services and solutions from our delivery centers to global clientscustomers across all geographies, further strengthening our relationships with them.
LeveragingThrough increased specialization in focused verticals and a continued emphasis on strategic partnerships, we are leveraging our roots in software engineering along with our vertical expertise and strong strategic partnerships, we have becometo grow as a recognized brand in software development and end-to-end digital transformation services for our clients.customers.
Overview of 20162019 and Financial Highlights
For the year ended December 31, 2016, we reported results of operations consistent with the continued execution of our strategy. Our operating expenses increased in line with our increase in revenues as we continue to invest in our people, processes and infrastructure to support our goal to deliver high-quality offerings that meet the needs of our customers, differentiate our value proposition from that of our competition, and drive scale and growth.
The following table presents a summary of our results of operations for the years ended December 31, 2016, 20152019, 2018 and 2014:2017:
| | | | | | | | | | | | | | | Year Ended December 31, |
| | Year Ended December 31, | 2019 | | 2018 | | 2017 |
| | 2016 | | 2015 | | 2014 | | | % of revenues | | | | % of revenues | | | | % of revenues |
| | (in millions, except percentages and per share data) | (in millions, except percentages and per share data) |
| Revenues | $ | 1,160.1 |
| | 100.0 | % | | $ | 914.1 |
| | 100.0 | % | | $ | 730.0 |
| | 100.0 | % | $ | 2,293.8 |
| | 100.0 | % | | $ | 1,842.9 |
| | 100.0 | % | | $ | 1,450.4 |
| | 100.0 | % |
| Income from operations | $ | 133.7 |
| | 11.5 | % | | $ | 106.0 |
| | 11.6 | % | | $ | 86.2 |
| | 11.8 | % | $ | 302.9 |
| | 13.2 | % | | $ | 245.8 |
| | 13.3 | % | | $ | 172.9 |
| | 11.9 | % |
| Net income | $ | 99.3 |
| | 8.6 | % | | $ | 84.5 |
| | 9.2 | % | | $ | 69.6 |
| | 9.5 | % | $ | 261.1 |
| | 11.4 | % | | $ | 240.3 |
| | 13.0 | % | | $ | 72.8 |
| | 5.0 | % |
| | | | | | | | | | | | | | | | | | | | | | | |
| Effective tax rate | 21.5 | % | | | | 20.4 | % | | | | 19.9 | % | | | 12.8 | % | | | | 3.8 | % | | | | 58.3 | % | | |
| Diluted earnings per share | $ | 1.87 |
| | | | $ | 1.62 |
| | | | $ | 1.40 |
| | | $ | 4.53 |
| | | | $ | 4.24 |
| | | | $ | 1.32 |
| | |
The key highlights of our consolidated results for 20162019 were as follows:
We recorded revenues of $1.16$2.3 billion, or a 26.9%24.5% increase from $914.1$1.8 billion in the previous year, negatively impacted by $25.0 million reported last year, making fiscal 2016 a milestone year, having crossedor 1.3% due to changes in certain foreign currency exchange rates as compared to the $1 billion revenue mark. Revenue growth excluding acquisitions, which accounted for 5.4% of total growth, was 21.5% despite significant currency headwinds.corresponding period in the previous year.
Income from operations grew 26.2%23.2% to $133.7$302.9 million from $106.0$245.8 million reported in the corresponding period of last year.2018. Expressed as a percentage of revenues, income from operations was 11.5%consistent with last year at 13.2% compared to 11.6% last year. A slight decrease was primarily driven by fluctuations in utilization.13.3%.
Our effective tax rate was 21.5%12.8% compared to 20.4%3.8% last year. The provision for income taxes for 2018 was favorably impacted by the recognition of $34.9 million of one-time tax benefits, partially offset by an increase in excess tax benefits associated with equity award exercises and vesting in 2019 compared to the same period last year.
Net income grew 17.5%increased 8.7% to $99.3$261.1 million compared to $84.5$240.3 million reported in 2015.2018. Expressed as a percentage of revenues, net income decreased 0.6%1.6% compared to last year, which was largely driven by higher foreign exchange losses reportedthe increase in 2016.our effective tax rate.
Diluted earnings per share increased 15.4%6.8% to $1.87$4.53 for the year ended December 31, 20162019 from $1.62 reported$4.24 in 2015.2018.
Cash provided by operations increased $88.4decreased $4.8 million, or 115.7%1.6%, to $164.8$287.5 million during fiscal 2016.
During 2016, we continued2019 as compared to expand our global delivery footprint which brought very important hands-on experience in several new geographies.This allowed us to better understand how to integrate and develop, from one side, and position and benefit, from another, such new global delivery locations within the company and within our clients. We are confident that our strategy of combining our traditional technology and engineering advantage with proven capabilities in digital transformation, design, and emerging consultancy should enable us to navigate considerable market, geo-political and economic uncertainties.last year.
The operating results in any period are not necessarily indicative of the results that may be expected for any future period.
Critical Accounting Policies
We prepare our consolidated financial statements in accordance with U.S. generally accepted accounting principles (“GAAP”), which require us to make judgments, estimates and assumptions that affect: (i) the reported amounts of assets and liabilities, (ii) the disclosure of contingent assets and liabilities at the end of each reporting period and (iii) the reported amounts of revenues and expenses during each reporting period. We evaluate these estimates and assumptions based on historical experience, knowledge and assessment of current business and other conditions, and expectations regarding the future based on available information and reasonable assumptions, which together form a basis for making judgments about matters not readily apparent from other sources. Since the use of estimates is an integral component of the financial reporting process, actual results could differ from those estimates. Some of our accounting policies require higher degrees of judgment than others in their application. When reviewing our audited consolidated financial statements, you should consider (i) our selection of critical accounting policies, (ii) the judgment and other uncertainties affecting the application of such policies and (iii) the sensitivity of reported results to changes in conditions and assumptions. We consider the policies discussed below to be critical to an understanding of our consolidated financial statements as their application places significant demands on the judgment of our management.
An accounting policy is considered critical if it requires an accounting estimate to be made based on assumptions about matters that are highly uncertain at the time the estimate is made, and if different estimates that reasonably could have been used, or changes in the accounting estimates that are reasonably likely to occur periodically, could materially impact the consolidated financial statements. We believe that the following critical accounting policies are the most sensitive and require more significant estimates and assumptions used in the preparation of our consolidated financial statements. You should read the following descriptions of critical accounting policies, judgments and estimates in conjunction with our audited consolidated financial statements and other disclosures included elsewhere in this annual report.
Revenues — As discussed in Note 1 “Business and Summary of Significant Accounting Policies” in the notes to our consolidated financial statements in this Annual Report on Form 10-K, on January 1, 2018, we adopted the new accounting standard ASU 2014-09, “Revenue from Contracts with Customers” (Topic 606) as amended using the modified retrospective method. This resulted in different revenue recognition accounting policies applied to the years presented in our consolidated financial statements.
For the years ended December 31, 2019 and 2018
We recognize revenues when control of goods or services is passed to a customer in an amount that reflects the consideration we expect to be entitled to in exchange for those goods or services. Such control may be transferred over time or at a point in time depending on satisfaction of obligations stipulated by the contract. Consideration expected to be received may consist of both fixed and variable components and is allocated to each separately identifiable performance obligation based on the performance obligation’s relative standalone selling price. Variable consideration usually takes the form of volume-based discounts, service level credits, price concessions or incentives. Determining the estimated amount of such variable consideration involves assumptions and judgment that can have an impact on the amount of revenues reported.
We derive revenues from a variety of service arrangements, which have been evolving to provide more customized and integrated solutions to customers by combining software engineering with customer experience design, business consulting and technology innovation services. Fees for these contracts may be in the form of time-and-materials or fixed-price arrangements. We generate the majority of our revenues under time-and-material contracts, which are billed using hourly, daily or monthly rates to determine the amounts to be charged directly to the customer. We apply a practical expedient and revenues related to time-and-material contracts are recognized based on the right to invoice for services performed.
Fixed-price contracts include maintenance and support arrangements, which may exceed one year in duration. Maintenance and support arrangements generally relate to the provision of ongoing services and revenues for such contracts are recognized ratably over the expected service period. Fixed-price contracts also include application development arrangements, where progress towards satisfaction of the performance obligation is measured using input or output methods and input methods are used only when there is a direct correlation between hours incurred and the end product delivered. Assumptions, risks and uncertainties inherent in the estimates used to measure progress could affect the amount of revenues, receivables and deferred revenues at each reporting period.
Revenues from licenses which have significant stand-alone functionality are recognized at a point in time when control of the license is transferred to the customer. Revenues from licenses which do not have stand-alone functionality are recognized over time. If there is an uncertainty about the receipt of payment for the services, revenue recognition is deferred until the uncertainty is sufficiently resolved. We apply a practical expedient and do not assess the existence of a significant financing component if the period between transfer of the service to a customer and when realizedthe customer pays for that service is one year or realizableless.
We report gross reimbursable “out-of-pocket” expenses incurred as both revenues and earned, which iscost of revenues in the consolidated statements of income and comprehensive income.
For the year ended December 31, 2017
We recognized revenue when the following criteria arewere met: (1) persuasive evidence of an arrangement exists;existed; (2) delivery hashad occurred; (3) the sales price iswas fixed or determinable; and (4) collectability iswas reasonably assured. Determining whether and when some of these criteria havehad been satisfied often involvesinvolved assumptions and judgments that cancould have had a significant impact on the timing and amount of revenue we report. If there is an uncertainty about the project completion or receipt of payment for the services, revenues are deferred until the uncertainty is sufficiently resolved. At the time revenues are recognized, we provide for any contractual deductions and reduce revenues accordingly. We defer amounts billed to our clients for revenues not yet earned. Such amounts are anticipated to be recorded as revenues as services are performed in subsequent periods. Unbilled revenues represent services provided which are billed subsequent to the period end in accordance with the contract terms.reported.
We derivederived our revenues from a variety of service offerings, which represent specific competencies of our ITdelivery professionals. Contracts for these services havehad different terms and conditions based on the scope, deliverables, and complexity of the engagement, which requirerequired management to make judgments and estimates in determining appropriate revenue recognition. Fees for these contracts may behave been in the form of time-and-materials or fixed-price arrangements. If there was uncertainty about the project completion or receipt of payment for the services, revenue was deferred until the uncertainty was sufficiently resolved. At the time revenue was recognized, we provided for any contractual deductions and reduced revenue accordingly. The Company reported gross reimbursable “out-of-pocket” expenses incurred as both revenues and cost of revenues in the consolidated statements of income and comprehensive income.
We deferred amounts billed to our customers for revenues not yet earned. Such amounts were anticipated to be recorded as revenues when services were performed in subsequent periods. Revenues were recorded when services had been provided but billed subsequent to the period end in accordance with the contract terms.
The majority of our revenues (88.2%(90.3% of revenues in 2016, 85.8% in 2015 and 84.7% in 2014) are2017) were generated under time-and-material contracts whereby revenues arewere recognized as services arewere performed with the corresponding cost of providing those services reflected as cost of revenues when incurred.revenues. The majority of such revenues arewere billed on anusing hourly, daily or monthly basis wherebyrates as actual time is charged directly towas incurred on the client. We expect time-and-material arrangements to continue to comprise the majority of our revenues in the future.
project. Revenues from fixed-price contracts (10.4%(8.3% of revenues in 2016, 12.8%2017) included fixed-price maintenance and support arrangements, which may have exceeded one year in 2015duration and 13.6% in 2014) arerevenues from maintenance and support arrangements were generally recognized ratably over the expected service period. Fixed-price contracts also included application development arrangements and revenues from these arrangements were primarily determined using the proportional performance method. In instancescases where final acceptance of the product, system, or solution iswas specified by the client, revenue iscustomer, and the acceptance criteria were not objectively determinable to have been met as the services were provided, revenues were deferred until all acceptance criteria havehad been met. In the absence of a sufficient basis to measure progress towards completion, revenue iswas recognized upon receipt of final acceptance from the client. The complexity and judgment of our estimation process and issues related to the assumptions,customer. Assumptions, risks and uncertainties inherent in the estimates used in the application of the proportional performance method of accounting could affecthave affected the amountsamount of revenue,revenues, receivables and deferred revenuerevenues at each reporting period.
Business Combinations— We account for our business combinations using the acquisition accounting method which requires us to determineestimate the fair value of net assets acquired and the related goodwill and other intangible assets in accordance with the FASB ASC Topic 805, “Business Combinations.” We identify and attribute fair values and estimated lives to the intangible assets acquired and allocate the total cost of an acquisition to the underlying net assets based on their respective estimated fair values. Determining the fair value ofidentifiable assets acquired and liabilities assumed, requires management’s judgmentincluding any contingent consideration, to properly allocate purchase price to the individual assets acquired and involvesliabilities assumed. The allocation of the use ofpurchase price utilizes significant estimates including projectionsin determining the fair values of identifiable assets acquired and liabilities assumed, especially with respect to intangible assets. The significant estimates and assumptions used include the timing and amount of forecasted revenues and cash flows, anticipated growth rates, client attrition rates, the discount rate reflecting the risk inherent in future cash inflowsflows and outflows, discount rates, assetthe determination of useful lives and market multiples.for finite-lived assets. There are different valuation models for each component, the selection of which requires considerable judgment. These determinations will affect the amount of amortization expense recognized in future periods. We base our fair value estimates on assumptions we believe are reasonable, but recognize that the assumptions are inherently uncertain. The acquired assets typically include customer relationships, software, trade names, non-competition agreements, and assembled workforce and as a result, a substantial portion of the purchase price is allocated to goodwill and other intangible assets.
If the initial accounting for the business combination has not been completed by the end of the reporting period in which the business combination occurs, provisional amounts are reported to present information about facts and circumstances that existed as of the acquisition date. Once the measurement period ends, which in no case extends beyond one year from the acquisition date, revisions ofto the accounting for the business combination are recorded in earnings.
GoodwillLeases — We determine if an arrangement is a lease or contains a lease at inception. We perform an assessment and Other Intangible Assets — The acquired assets typically include customer relationships, trade names, non-competition agreements,classify the lease as either an operating lease or a financing lease at the lease commencement date with a right-of-use asset (“RoU Asset”) and workforce. As a result, a substantial portion oflease liability recognized in the purchase price is allocated to goodwill and other intangible assets.consolidated balance sheet under both classifications.
We assess goodwill for impairment as of October 31st of each fiscal year, or more frequently if events or changes in circumstances indicate that the fair value of our reporting unit has been reduced below its carrying value. When conducting our annual goodwill impairment assessment, we use a three-step process. The first step is to perform an optional qualitative evaluation as to whether it is more likely than not that the fair value of our reporting unit is less than its carrying value, using an assessment of relevant events and circumstances. In performing this assessment, weLease liabilities are required to make assumptions and judgments including but not limited to an evaluation of macroeconomic conditions as they relate to our business, industry and market trends, as well as the overall future financial performance of our reporting unit and future opportunities in the markets in which it operates. If we determine that it is not more likely than not that the fair value of our reporting unit is less than its carrying value, we are not required to perform any additional tests in assessing goodwill for impairment. However, if we conclude otherwise or elect not to perform the qualitative assessment, we perform a second step for our reporting unit, consisting of a quantitative assessment of goodwill impairment. This quantitative assessment requires us to estimate the fair value of our reporting unit and compare the estimated fair value to its respective carrying value (including goodwill) as of the date of the impairment test. The third step, employed for our reporting unit if it fails the second step, is used to measure the amount of any potential impairment and compares the implied fair value of our reporting unit with the carrying amount of goodwill.
Historically, a significant portion of the purchase consideration was allocated to customer relationships. In valuing customer relationships, we typically utilize the multi-period excess earnings method, a form of the income approach. The principle behind this method is that the value of the intangible asset is equal toinitially measured at the present value of lease payments not yet paid. The present value is determined by applying the after-tax cash flows attributablereadily determinable rate implicit in the lease or, if not available, the incremental borrowing rate of the lessee. We determine the incremental borrowing rate of the lessee on a lease-by-lease basis by developing an estimated centralized U.S. dollar borrowing rate for a fully collateralized obligation with a term similar to the intangible asset only. We amortize our intangible assets that have finite lives using eitherlease term and adjust the straight-line method or, if reliably determinable,rate to reflect the patternincremental risk associated with the currency in which the economic benefitlease is denominated. The development of this estimate includes the use of recovery rates, U.S. risk-free rates, foreign currency/country base rate yields, and a synthetic corporate credit rating of the asset is expectedCompany developed using regression analysis. Our lease agreements may include options to be consumed utilizing expected discounted future cash flows. Amortization is recorded overextend or terminate the estimated useful lives that are predominantly ranging, on average, from five to ten years.lease. We do not have any intangible assets with indefinite useful lives.
We review our intangible assets subject to amortization to determine if any adverse conditions exist or a change in circumstances has occurred that would indicate impairment or a changeincludes such options in the remaining useful life. If the carrying value of an asset exceeds its undiscounted cash flows,lease term when it is reasonably certain that we will write down the carrying value of the intangible asset to its fair value in the period identified. In assessing fair value, we must make assumptions regarding estimated future cash flows and discount rates. If these estimates or related assumptions change in the future, we may be required to record impairment charges. If the estimate of an intangible asset’s remaining useful life is changed, we will amortize the remaining carrying value of the intangible asset prospectively over the revised remaining useful life.
Accounting for Income Taxes — We estimate our income taxesexercise that option. RoU Assets are recognized based on the various jurisdictions where we conduct business and we use estimates in determining our provision for income taxes. We estimate separately our deferred tax assets, related valuation allowances, current tax liabilities and deferred tax liabilities. The calculation of our tax liabilities involves dealing with uncertainties in the application of complex tax rules and the potential for future adjustment of our uncertain tax positions by the U.S. Internal Revenue Service or other taxing jurisdictions.
The provision for income taxes includes federal, state, local and foreign taxes. Deferred tax assets and liabilities are recognized for the estimated future tax consequences of temporary differences between the consolidated financial statement carrying amounts and their respective tax bases. Deferred tax assets and liabilities are measured using enacted tax rates expected to apply to taxable income in the year in which the temporary differences are expected to be reversed. Changes to enacted tax rates would result in either increases or decreases in the provision for income taxes in the period of changes. We evaluate the realizability of deferred tax assets and recognize a valuation allowance when it is more likely than not that all or a portion of deferred tax assets will not be realized.
The realization of deferred tax assets is primarily dependent on future earnings. Any reduction in estimated forecasted results may require that we record valuation allowances against deferred tax assets. Once a valuation allowance has been established, it will be maintained until there is sufficient positive evidence to conclude that it is more likely than not that the deferred tax assets will be realized. A pattern of sustained profitability will generally be considered as sufficient positive evidence to reverse a valuation allowance. If the allowance is reversed in a future period, the income tax provision will be correspondingly reduced. Accordingly, the increase and decrease of valuation allowances could have a significant negative or positive impact on future earnings.
Stock-Based Compensation — Equity-based compensation cost relating to the issuance of share-based awards to employees is based on the fair valueinitial measurement of the award at the date of grant, whichlease liabilities plus initial direct costs less lease incentives. Lease expense for operating leases is expensedrecognized on a straight-line basis over the requisite service period, net of estimated forfeitures. Equity-based awards that do not require future servicelease term. RoU Assets are expensed immediately. If factors changesubject to periodic impairment tests.
We have elected a practical expedient to account for lease and we employ different assumptions, stock-based compensation expense may differ significantly from what we have recorded in the past.
Significant judgment is required in determining the adjustment to stock-based compensation expense for estimated forfeitures. Stock-based compensation expense in a period could be impacted, favorably or unfavorably, by differences between forfeiture estimates and actual forfeitures. If there are any modifications or cancellations of the underlying unvested securities, we may be required to accelerate, increase or cancel any remaining unvested stock-based compensation expense.
Equity-based awards that do not meet the criteria for equity classification are recorded as liabilities and adjusted to fair value based on the closing price of our stock at the end of each reporting period. Future stock-based compensation expense related to our liability-classified awards may increase or decreasenon-lease components together as a resultsingle lease component. In addition, we elected the short-term lease recognition exemption for all classes of changes in the market price for our stock, adding to the volatility in our operating results. As of December 31, 2016, 4.1% of outstanding equity awards were classified as liabilities on our consolidated balance sheets.lease assets.
Recent Accounting Pronouncements
From time to time, new accounting pronouncements are issued by the FinancialSee Note 1 “Business and Summary of Significant Accounting Standards Board (“FASB”) or other standards-setting bodies that we adopt according to the various timetables the FASB specifies. Unless otherwise discussed below, we believe the impact of recently issued standards will not have a material impact on our consolidated financial position, results of operations and cash flows upon adoption.
Stock-Based Compensation — In March 2016, the FASB issued accounting guidance to simplify several aspects of the accounting for share-based payments. We will adopt the various amendments of the new accounting guidancePolicies” in the consolidated financial statements for the quarterly period ending March 31, 2017 with an effective date of January 1, 2017. We believe the new standard will cause volatility in our effective tax rates and diluted earnings per share duenotes to the tax effects related to share-based payments being recorded to the income statement (rather than equity). The volatility in future periods will depend on our stock price at the awards’ vesting dates, geographical mix and tax rates in applicable jurisdictions, as well as the number of awards that vest in each period. While we are continuing to assess the impact of the new standard, we currently expect to recognize approximately $0.01 and $0.05 benefit to the diluted EPS for the first quarter and fiscal year 2017, respectively; and approximately a 1.2% and 1.7% benefit to the effective tax rate for the same periods. However, the benefit realized from the adoption of this accounting standard could vary significantly given the inherent uncertainty in predicting future share-based transactions.
Revenue Recognition — In May 2014, the FASB issued new revenue recognition guidance to provide a single, comprehensive revenue recognition model for all contracts with customers. Under the new guidance, an entity will recognize revenue to depict the transfer of promised goods or services to customers at an amount that the entity expects to be entitled to in exchange for those goods or services. A five-step model has been introduced for an entity to apply when recognizing revenue. The new guidance also includes enhanced disclosure requirements, and is effective January 1, 2018, with early adoption permitted for January 1, 2017. Entities have the option to apply the new guidance under a retrospective approach to each prior reporting period presented, or a modified retrospective approach with the cumulative effect of initially applying the new guidance recognized at the date of initial application within the consolidated statement of changes in stockholders’ equity. We plan to adopt the new guidance effective January 1, 2018 and have not yet determined which transition method we will apply.
We have performed a review of the requirements of the new revenue standard and are monitoring the activity of the FASB and the transition resource group as it relates to specific interpretive guidance. We are currently reviewing customer contracts and are in the process of applying the five-step model of the new standard to each contract category we have identified and will compare the results to our current accounting practices, as well as assessing the enhanced disclosure requirements of the new guidance. The new standard could change the amount and timing of revenue and costs recognized under certain arrangement types and could increase the administrative burden on our operations to properly account for customer contracts and provide the more expansive required disclosures. We are also assessing pricing provisions contained in certain of our customer contracts. These provisions represent variable consideration or may provide the customer with a material right, potentially resulting in a different allocation of the transaction price than under the current guidance. Due to the complexity of certain of our contracts, the actual revenue recognition treatment required under the new standard for these arrangements may be dependent on contract-specific terms and vary in some instances. We have not yet determined what effect the new guidance will have on our consolidated financial statements and/or related disclosures and expect to further our assessment of the financial impact of the new guidance on our consolidated financial statements during fiscal 2017.
Leases — Effective January 1, 2019, we will be required to adopt the new guidance of Accounting Standards Codification (“ASC”) Topic 842, Leases, which will supersede ASC Topic 840, Leases. The new guidance requires lessees to recognize assets and liabilities for all leases with lease terms of more than 12 months. We have not yet completed the assessment of the impact of the new guidance on our consolidated financial statements or determined which transition method we will apply.
Measurement of Credit Losses on Financial Instruments — Effective January 1, 2020, we will be required to adopt the amended guidance on measurement of credit losses on financial instruments (with early adoption permitted effective January 1, 2019.) The amendments in this update change how companies measure and recognize credit impairmentAnnual Report on Form 10-K for many financial assets. The new expected credit loss model will require companies to immediately recognize an estimate of credit losses expected to occur over the remaining life of the financial assets (including trade receivables) that are in the scope of the update. We have not yet completed the assessment of the impact of the new guidance on our consolidated financial statements or concluded on when we will adopt the standard.information regarding recent accounting pronouncements.
Results of Operations
The following table sets forth a summary of our consolidated results of operations for the periods indicated. This information should be read together with our consolidated financial statements and related notes included elsewhere in this annual report. The operating results in any period are not necessarily indicative of the results that may be expected for any future period.
| | | | | | | | | | | | | | | Year Ended December 31, |
| | Year Ended December 31, | 2019 | | 2018 | | 2017 |
| | 2016 | | 2015 | | 2014 | | | % of revenues | | | | % of revenues | | | | % of revenues |
| | (in thousands, except percentages and per share data) | (in thousands, except percentages and per share data) |
| Revenues | $ | 1,160,132 |
| | 100.0 | % | | $ | 914,128 |
| | 100.0 | % | | $ | 730,027 |
| | 100.0 | % | $ | 2,293,798 |
| | 100.0 | % | | $ | 1,842,912 |
| | 100.0 | % | | $ | 1,450,448 |
| | 100.0 | % |
| Operating expenses: | | | | | | | | | |
| | | | | | | | | | | |
| | |
Cost of revenues (exclusive of depreciation and amortization)(1) | 737,186 |
| | 63.6 |
| | 566,913 |
| | 62.0 |
| | 456,530 |
| | 62.5 |
| 1,488,198 |
| | 64.9 |
| | 1,186,921 |
| | 64.4 |
| | 921,352 |
| | 63.5 |
|
Selling, general and administrative expenses(2) | 264,658 |
| | 22.8 |
| | 222,759 |
| | 24.4 |
| | 163,666 |
| | 22.4 |
| 457,433 |
| | 19.9 |
| | 373,587 |
| | 20.3 |
| | 327,588 |
| | 22.6 |
|
| Depreciation and amortization expense | 23,387 |
| | 2.0 |
| | 17,395 |
| | 1.9 |
| | 17,483 |
| | 2.4 |
| 45,317 |
| | 2.0 |
| | 36,640 |
| | 2.0 |
| | 28,562 |
| | 2.0 |
|
| Goodwill impairment loss | — |
| | — |
| | — |
| | — |
| | 2,241 |
| | 0.3 |
| |
| Other operating expenses, net | 1,205 |
| | 0.1 |
| | 1,094 |
| | 0.1 |
| | 3,924 |
| | 0.6 |
| |
| Income from operations | 133,696 |
| | 11.5 |
| | 105,967 |
| | 11.6 |
| | 86,183 |
| | 11.8 |
| 302,850 |
| | 13.2 |
| | 245,764 |
| | 13.3 |
| | 172,946 |
| | 11.9 |
|
| Interest and other income, net | 4,848 |
| | 0.4 |
| | 4,731 |
| | 0.5 |
| | 4,769 |
| | 0.7 |
| 8,725 |
| | 0.4 |
| | 3,522 |
| | 0.3 |
| | 4,601 |
| | 0.3 |
|
| Change in fair value of contingent consideration | — |
| | — |
| | — |
| | — |
| | (1,924 | ) | | (0.3 | ) | |
| Foreign exchange loss | (12,078 | ) | | (1.0 | ) | | (4,628 | ) | | (0.5 | ) | | (2,075 | ) | | (0.3 | ) | |
| Foreign exchange (loss)/gain | | (12,049 | ) | | (0.5 | ) | | 487 |
| | — |
| | (3,242 | ) | | (0.2 | ) |
| Income before provision for income taxes | 126,466 |
| | 10.9 |
| | 106,070 |
| | 11.6 |
| | 86,953 |
| | 11.9 |
| 299,526 |
| | 13.1 |
| | 249,773 |
| | 13.6 |
| | 174,305 |
| | 12.0 |
|
| Provision for income taxes | 27,200 |
| | 2.3 |
| | 21,614 |
| | 2.4 |
| | 17,312 |
| | 2.4 |
| 38,469 |
| | 1.7 |
| | 9,517 |
| | 0.6 |
| | 101,545 |
| | 7.0 |
|
| Net income | $ | 99,266 |
| | 8.6 | % | | $ | 84,456 |
| | 9.2 | % | | $ | 69,641 |
| | 9.5 | % | $ | 261,057 |
| | 11.4 | % | | $ | 240,256 |
| | 13.0 | % | | $ | 72,760 |
| | 5.0 | % |
| | | | | | | | | | | | | | | | | | | | | | | |
| Effective tax rate | 21.5 | % | | | | 20.4 | % | | | | 19.9 | % | | | 12.8 | % | | | | 3.8 | % | | | | 58.3 | % | | |
| Diluted earnings per share | $ | 1.87 |
| | | | $ | 1.62 |
| | | | $ | 1.40 |
| | | $ | 4.53 |
| | | | $ | 4.24 |
| | | | $ | 1.32 |
| | |
| |
| (1) | Included $16,619, $13,695$37,580, $27,245 and $8,648$20,868 of stock-based compensation expense for the years ended December 31, 2016, 20152019, 2018 and 2014, respectively;2017, respectively. |
| |
| (2) | Included $32,625, $32,138$34,456, $31,943 and $15,972$31,539 of stock-based compensation expense for the years ended December 31, 2016, 20152019, 2018 and 2014,2017, respectively. |
Revenues
Our revenues are derived primarily from providing software development servicesWe continue to expand our clients. Revenues include revenue from services as well as reimbursable expensespresence across multiple geographies and other revenues, which primarily consist of travelverticals, both organically and entertainment costs that are chargeable to clients.
through strategic acquisitions. During the year ended December 31, 2016,2019, our total revenues were $1.16 billion, growing 26.9%grew 24.5% over the corresponding period last year. Totalprevious year to $2.3 billion. This growth resulted from our ability to retain existing customers and increase the level of services we provide to them and our ability to produce revenues in 2016from new customer relationships. Customer concentration continued to decrease with revenues from our top five, top ten and 2015 included $12.5 million and $9.5 million of reimbursable expenses and other revenues, respectively, which increased 31.6% in 2016 as compared to 2015, but remained relatively flattop twenty clients declining as a percentage of total revenues.
During 2015, our revenues grew 25.2% over 2014, from $730.0 million to $914.1 million. The increase was attributable to a combination of factors, including deeper penetration into existing customers and attainment of new customers, both organically and through acquisitions. In 2015, revenue from new customers was $45.7 million, primarily resulting from our acquisitions in 2015, and does not include new clients that are affiliates of existing customers whom we consider an expansion of existing business. In addition, total revenues in 2015 and 2014 included $9.5 million and $8.4 million of reimbursable expenses and other revenues, respectively, which increased by 13.1% in 2015for the year ended December 31, 2019 as compared to 2014, but remained relatively flatthe previous year. Revenue has been positively impacted from the acquisition of test IO and other 2019 acquisitions, which contributed 0.2% and 0.5%, respectively to our revenue growth, and negatively impacted by the fluctuations in foreign currency that decreased our revenue growth by 1.3% during the year ended December 31, 2019 as a percentage of total revenues.compared to the previous year.
We discuss below the breakdown of our revenuerevenues by clientvertical, customer location, service offering, vertical, contractarrangement type, and clientcustomer concentration.
Revenues by ClientVertical
We assign our customers into one of our five main vertical markets or a group of various industries where we are increasing our presence, which we label as “Emerging Verticals”. Emerging Verticals include customers in multiple industries such as energy, utilities, manufacturing, automotive, telecommunications and several others.
The following table presents our revenues by vertical and revenues as a percentage of total revenues by vertical for the periods indicated:
|
| | | | | | | | | | | | | | | | | | | | |
| | Year Ended December 31, |
| | 2019 | | 2018 | | 2017 |
| | (in thousands, except percentages) |
| Financial Services | $ | 500,872 |
| | 21.8 | % | | $ | 423,977 |
| | 23.0 | % | | $ | 338,899 |
| | 23.4 | % |
| Travel & Consumer | 439,358 |
| | 19.2 |
| | 393,643 |
| | 21.4 |
| | 317,415 |
| | 21.9 |
|
| Software & Hi-Tech | 433,398 |
| | 18.9 |
| | 350,815 |
| | 19.0 |
| | 287,633 |
| | 19.8 |
|
| Business Information & Media | 420,923 |
| | 18.4 |
| | 324,033 |
| | 17.6 |
| | 256,267 |
| | 17.7 |
|
| Life Sciences & Healthcare | 248,452 |
| | 10.8 |
| | 171,703 |
| | 9.3 |
| | 120,591 |
| | 8.3 |
|
| Emerging Verticals | 250,795 |
| | 10.9 |
| | 178,741 |
| | 9.7 |
| | 129,643 |
| | 8.9 |
|
| Revenues | $ | 2,293,798 |
| | 100.0 | % | | $ | 1,842,912 |
| | 100.0 | % | | $ | 1,450,448 |
| | 100.0 | % |
Revenues by Customer Location
Our revenues are sourced from four geographic markets: North America, Europe, CIS and APAC. We present and discuss our revenues by clientcustomer location based on the location of the specific clientcustomer site that we serve, irrespective of the location of the headquarters of the clientcustomer or the location of the delivery center where the work is performed. RevenueRevenues by clientcustomer location is different from the revenuerevenues by reportable segment in our consolidated financial statements included elsewhere in this annual report. Segments are not based on the geographic location of the clients,customers, but instead they are based on the location of the Company’s management responsible for a particular client.customer or market.
The following table sets forth revenues by clientcustomer location by amount and as a percentage of our revenues for the periods indicated: |
| | | | | | | | | | | | | | | | | | | | |
| | Year Ended December 31, |
| | 2019 | | 2018 | | 2017 |
| | (in thousands, except percentages) |
| North America | $ | 1,390,015 |
| | 60.6 | % | | $ | 1,099,167 |
| | 59.6 | % | | $ | 840,692 |
| | 58.0 | % |
| Europe | 746,866 |
| | 32.6 |
| | 612,472 |
| | 33.2 |
| | 511,319 |
| | 35.2 |
|
CIS (1) | 100,471 |
| | 4.4 |
| | 81,703 |
| | 4.4 |
| | 68,390 |
| | 4.7 |
|
APAC (2) | 56,446 |
| | 2.4 |
| | 49,570 |
| | 2.8 |
| | 30,047 |
| | 2.1 |
|
| Revenues | $ | 2,293,798 |
| | 100.0 | % | | $ | 1,842,912 |
| | 100.0 | % | | $ | 1,450,448 |
| | 100.0 | % |
|
| | | | | | | | | | | | | | | | | | | | |
| | Year Ended December 31, |
| | 2016 | | 2015 | | 2014 |
| | (in thousands, except percentages) |
| North America | $ | 664,598 |
| | 57.3 | % | | $ | 485,075 |
| | 53.1 | % | | $ | 367,498 |
| | 50.4 | % |
| Europe | 412,075 |
| | 35.5 |
| | 352,489 |
| | 38.6 |
| | 284,853 |
| | 39.0 |
|
| CIS | 46,033 |
| | 4.0 |
| | 43,043 |
| | 4.7 |
| | 55,807 |
| | 7.6 |
|
| APAC | 24,905 |
| | 2.1 |
| | 24,010 |
| | 2.6 |
| | 13,459 |
| | 1.8 |
|
| Reimbursable expenses and other revenues | 12,521 |
| | 1.1 |
| | 9,511 |
| | 1.0 |
| | 8,410 |
| | 1.2 |
|
| Revenues | $ | 1,160,132 |
| | 100.0 | % | | $ | 914,128 |
| | 100.0 | % | | $ | 730,027 |
| | 100.0 | % |
| |
| (1) | CIS includes revenues from customers in Belarus, Kazakhstan, Russia and Ukraine. |
| |
| (2) | APAC, which stands for Asia Pacific, includes revenues from customers in Southeast Asia and Australia. |
2016 compared to 2015
During the year ended December 31, 2016,2019, revenues in our largest geography, North America, closed at $664.6were $1,390.0 million growing $179.5$290.8 million, or 37.0%26.5%, from $485.1$1,099.2 million reported for the year ended December 31, 2015.2018. Revenues from this geography accounted for 57.3%60.6% of total revenues in fiscal 2016,2019, an increase of 4.2% from 53.1% reported59.6% in the corresponding period lastprior year.
Within North America, we experienced strong growth across all verticals despite considerable market, geo-political, and economic uncertainties: each The United States continued to be our largest customer location contributing revenues of the two verticals, Media and Entertainment and Life Sciences and Healthcare, grew above 40%; while Emerging Verticals and Financial Services grew 60.0% and 94.1%, respectively. In addition, our traditionally strong Software & Hi-Tech portfolio grew 27.3%, which allowed us$1,321.7 million in 2019 compared to keep this important segment at our strategic target of 20% of consolidated revenues.
We saw continued traction with customers$1,029.3 million in the pharmaceutical segment of our Life Sciences and Healthcare vertical, and significantly grew our portfolio of customers in Emerging Verticals with over 30% growth in revenues there coming from customers who have been with us less than one year. Combined growth in our Software & Hi-Tech and Media & Entertainment verticals accounted for 48.4% of the overall growth in the North America geography, of which $19.3 million, or 22.3%, was attributable to the expansion of existing relationship with certain long-standing customers within our Media and Entertainment vertical.2018.
Revenues in our Europe geography were $412.1$746.9 million, an increase of $59.6$134.4 million, or 16.9%21.9%, over $352.5$612.5 million reported lastin the previous year. Revenues in this geography accounted for 35.5%32.6% of consolidated revenues in 20162019 as compared to 38.6% last33.2% in the previous year. The slowdowntop three revenue contributing customer location countries in Europe were the United Kingdom, Switzerland and the Netherlands generating revenues of $290.0 million, $152.7 million and $88.5 million in 2019, respectively, compared to $200.9 million, $144.4 million and $70.3 million in 2018, respectively. Fluctuations in foreign currency exchange rates with the U.S. dollar, particularly the euro and the British pound, during 2019 compared to the same period in the prior year negatively impacted revenue growth in 2016 was largely attributable to decelerated growth inthe European geography by 3.2%.
During 2019, revenues from our top customer in this geography, coupled with increased internal and external pressures on customers within our Travel and Consumer vertical, and currency headwinds, primarily due to the depreciation of the British pound relative to the U.S. dollar.
Consistent with results in our North America geography, Europe experienced strong growth in the Media and Entertainment, Life Sciences and Healthcare, and Emerging Verticals, each of which grew over 48% during fiscal 2016. Over 40% of growth in Life Sciences and Healthcare and Emerging Verticals came from customers who have been with us less than one year. Financial Services remained our largest vertical in this geography and accounted for 33.4% of the overall growth in 2016.
Revenues in the CIS geography showed an increase of $3.0increased $18.8 million, or 6.9%23.0%, from lastthe previous year. The increase in CIS revenues came predominantly from customers within the Financial Services and Travel and Consumer verticals. Ongoing economic and geo-political uncertainty in the region, as well as significant volatilityRussia, contributing $18.8 million of the Russian ruble limit revenue growth in this geography.
20152019 compared to 2014the previous year.
DuringRevenues from customers in locations in the APAC region comprised 2.4% of total revenues in 2019, a level consistent with the prior year.
Discussion of revenues from 2018 as compared to 2017 is disclosed in “Part II. Item 7. Results of Operations” of our Annual Report on Form 10-K for the year ended December 31, 2015,2018.
Revenues by Customer Concentration
We have long-standing relationships with many of our customers and we seek to grow revenues from our existing customers by continually expanding the scope and size of our engagements. Revenues derived from these customers may fluctuate as these accounts mature or upon completion of multi-year projects. While we believe there is a significant potential for future growth as we expand our capabilities and offerings within existing customers, we continue to focus on diversification of our customer concentration and building up a portfolio of new accounts that we believe have significant revenue potential. We anticipate the contribution of these new accounts to our total revenues to increase in the mid- to long-term and offset the potential slower growth rate of some of our largest geography, North America closed at $485.1 million growing $117.6 million, or 32.0%,customers as compared with the year ended December 31, 2014. Expressed as a percentage of consolidated revenues, the North America geography accounted for 53.1% in 2015, which represented an increase of 2.7% over 2014. The increase was primarily a result of growth in business from several of our top clients as well as new revenue from the acquisition of NavigationArts, LLC and Alliance Consulting Global Holdings, Inc.those accounts mature.
Revenues from all major verticals in North America grew during the year ended December 31, 2015 as compared with the year ended December 31, 2014. The largest contributor to revenue growth in North America, was its Travel and Consumer vertical, which increased $32.9 million, or 48.6%, as compared with the year ended December 31, 2014. The increase in this vertical was primarily driven by the rapid expansion of our strategic relationship with a large retail chain, a relationship we acquired in 2012.
Our Life Sciences and Healthcare vertical in North America continued its impressive growth since we acquired new clients in the healthcare, insurance and life sciences industries in one of our 2014 acquisitions and created synergies with existing customers in those markets. Combined revenue growth from customers in this vertical accounted for $29.0 million representing the largest percentage growth of all North America's verticals at 75.9% growth over prior year.
Revenues from the Media and Entertainment vertical in North America increased by $25.3 million, or 36.2%, as compared with the year ended December 31, 2014. The growth in this vertical in 2015 was attributable to resumed growth in revenues from certain long-time major customers who had decreased demand for our services in prior years.
North America’s largest vertical, Software and Hi-Tech, experienced growth of $24.5 million or 17.2% during the year.
The Financial Services vertical remained our dominant vertical in the European geography. In 2015 revenues from the Financial Services vertical increased by $28.3 million, or 19.0%, respectively, over the corresponding period of 2014. Continued solid performance of the Financial Services vertical was attributable to an increased demand for our services and ongoing relationships with existing top customers located in Europe. We experienced increased businessexpect customer concentration from our top customer located in Switzerland, who was responsible for the majority of the revenue growth in the Financial Services vertical during 2015 as compared with the year ended December 31, 2014. Furthermore, wecustomers to continue to see growing demand for our services from European-based customers withindecrease over the Travel and Consumer vertical. During the year ended December 31, 2015 revenues from this vertical increased by $24.0 million as compared with the year ended December 31, 2014 and accounted for 35.5% of total growth in this geography during period indicated. Europe’s Software and Hi-Tech vertical experienced a significant increase of 66.5% in 2015 compared to 2014, in part due to business from a new significant customer in Germany engaged in 2015.
Revenues in the CIS geography showed a decrease of $12.8 million or 22.9% on a year-to-date basis compared to 2014. The decrease in revenues was primarily attributable to a decline in the Financial Services vertical, which was significantly impacted by the microeconomic situation in the region. Additionally, significant foreign currency fluctuations in Russia and CIS countries had a material negative impact on the revenues from those locations.
Revenues by Service Offering
Our end-to-end service offerings are grouped into five main categories with software development representing our core competency and a substantial majority of our business.long-term. The following table sets forthpresents revenues contributed by service offeringour customers by amount and as a percentage of our revenues for the periods indicated: |
| | | | | | | | | | | | | | | | | | | | |
| | Year Ended December 31, |
| | 2016 | | 2015 | | 2014 |
| | (in thousands, except percentages) |
| Software development | $ | 841,916 |
| | 72.6 | % | | $ | 644,732 |
| | 70.6 | % | | $ | 504,590 |
| | 69.1 | % |
| Application testing services | 223,010 |
| | 19.2 |
| | 174,259 |
| | 19.1 |
| | 140,363 |
| | 19.2 |
|
| Application maintenance and support | 74,475 |
| | 6.4 |
| | 70,551 |
| | 7.7 |
| | 58,840 |
| | 8.1 |
|
| Infrastructure services | 5,069 |
| | 0.4 |
| | 11,311 |
| | 1.2 |
| | 14,198 |
| | 1.9 |
|
| Licensing | 3,141 |
| | 0.3 |
| | 3,764 |
| | 0.4 |
| | 3,626 |
| | 0.5 |
|
| Reimbursable expenses and other revenues | 12,521 |
| | 1.1 |
| | 9,511 |
| | 1.0 |
| | 8,410 |
| | 1.2 |
|
| Revenues | $ | 1,160,132 |
| | 100.0 | % | | $ | 914,128 |
| | 100.0 | % | | $ | 730,027 |
| | 100.0 | % |
|
| | | | | | | | | | | | | | | | | | | | |
| | Year Ended December 31, |
| | 2019 | | 2018 | | 2017 |
| | (in thousands, except percentages) |
| Top five customers | $ | 456,985 |
| | 19.9 | % | | $ | 410,987 |
| | 22.3 | % | | $ | 348,219 |
| | 24.0 | % |
| Top ten customers | $ | 666,584 |
| | 29.1 | % | | $ | 582,539 |
| | 31.6 | % | | $ | 491,742 |
| | 33.9 | % |
| Top twenty customers | $ | 933,178 |
| | 40.7 | % | | $ | 782,771 |
| | 42.5 | % | | $ | 648,786 |
| | 44.7 | % |
| Customers below top twenty | $ | 1,360,620 |
| | 59.3 | % | | $ | 1,060,141 |
| | 57.5 | % | | $ | 801,662 |
| | 55.3 | % |
The following table shows the number of customers from which we earned revenues for each year presented: |
| | | | | |
| | Year Ended December 31, |
| Revenues Greater Than or Equal To | 2019 | | 2018 | | 2017 |
| $0.1 million | 610 | | 562 | | 460 |
| $0.5 million | 402 | | 375 | | 316 |
| $1 million | 297 | | 256 | | 232 |
| $5 million | 91 | | 81 | | 63 |
| $10 million | 49 | | 36 | | 26 |
| $20 million | 22 | | 14 | | 10 |
Revenues by VerticalService Offering
We analyze ourEffective January 1, 2018, the Company adopted ASU No. 2014-09, Revenue from Contracts with Customers (Topic 606) as amended. The adoption of this standard required various disaggregated levels of revenue by separating our clients into five main industry sectors, or verticals,to be disclosed as detailedpresented in Note 9 “Revenues” in the following table. Also,notes to our consolidated financial statements in this Annual Report on Form 10-K. The standard also required us to consider how management views the business and provide the appropriate disclosures that would be relevant and informative under those views.
Our service arrangements have been evolving to provide more customized and integrated solutions to our customers where we serve clients in other industries such as oilcombine software engineering with customer experience design, business consulting and gas, telecommunicationstechnology innovation services. We are continually expanding our service capabilities, moving beyond traditional services into business consulting, design and several others, which are reported in aggregate under Emerging Verticals.
The following table sets forth revenues by vertical by amount and as a percentagephysical product development. As more of our revenuesprojects involve multiple competencies and different types of specialized professionals working collaboratively, it has been increasingly difficult to classify our projects into the specific service offerings that we historically presented. Given the market demand for integrated customer solutions and our management’s view of the periods indicated: |
| | | | | | | | | | | | | | | | | | | | |
| | Year Ended December 31, |
| | 2016 | | 2015 | | 2014 |
| | (in thousands, except percentages) |
| Financial Services | $ | 291,845 |
| | 25.2 | % | | $ | 248,526 |
| | 27.2 | % | | $ | 215,425 |
| | 29.5 | % |
| Travel and Consumer | 259,420 |
| | 22.4 |
| | 215,303 |
| | 23.6 |
| | 157,756 |
| | 21.6 |
|
| Software & Hi-Tech | 237,437 |
| | 20.5 |
| | 192,989 |
| | 21.1 |
| | 157,944 |
| | 21.6 |
|
| Media & Entertainment | 174,017 |
| | 15.0 |
| | 120,616 |
| | 13.2 |
| | 91,726 |
| | 12.6 |
|
| Life Sciences and Healthcare | 105,072 |
| | 9.1 |
| | 73,327 |
| | 8.0 |
| | 42,428 |
| | 5.8 |
|
| Emerging Verticals | 79,820 |
| | 6.7 |
| | 53,856 |
| | 5.9 |
| | 56,338 |
| | 7.7 |
|
| Reimbursable expenses and other revenues | 12,521 |
| | 1.1 |
| | 9,511 |
| | 1.0 |
| | 8,410 |
| | 1.2 |
|
| Revenues | $ | 1,160,132 |
| | 100.0 | % | | $ | 914,128 |
| | 100.0 | % | | $ | 730,027 |
| | 100.0 | % |
Revenues by Contract Typebusiness, we changed our presentation of service offerings to better reflect our business model.
Our professional services are performed under both time-and-material and fixed-price arrangements. Our engagement models dependvary based on the type of services provided to a client,customer, the mix and locations of delivery professionals involved and the business outcomes our clients are looking to achieve.pricing type, which is either time-and-material or fixed-price. Historically, the vast majority of our professional services revenues have been generated under time-and-material contracts. Under time-and-material contracts we are compensated for actual time incurred by our IT professionals at negotiated hourly, daily or monthly rates. Fixed-price contracts require us to perform services throughout the contractual period and we are paid in installments on pre-agreed intervals. We expect time-and-material arrangements to continue to comprise the majority of our revenues in the foreseeable future.
The following table sets forthshows revenues by contract type byservice offering as an amount and as a percentage of our revenues for the periodsyears indicated:
|
| | | | | | | | | | | | | | | | | | | | |
| | Year Ended December 31, |
| | 2019 | | 2018 | | 2017 |
| | (in thousands, except percentages) |
| Professional services | $ | 2,285,303 |
| | 99.7 | % | | $ | 1,837,148 |
| | 99.7 | % | | $ | 1,429,781 |
| | 98.6 | % |
| Licensing | 5,081 |
| | 0.2 |
| | 4,097 |
| | 0.2 |
| | 3,529 |
| | 0.2 |
|
| Other | 3,414 |
| | 0.1 |
| | 1,667 |
| | 0.1 |
| | 1,147 |
| | 0.1 |
|
| Reimbursable expenses | See (1) |
| | See (1) |
| | See (1) |
| | See (1) |
| | 15,991 |
| | 1.1 |
|
| Revenues | $ | 2,293,798 |
| | 100.0 | % | | $ | 1,842,912 |
| | 100.0 | % | | $ | 1,450,448 |
| | 100.0 | % |
| |
| (1) | Following the adoption of Topic 606 on January 1, 2018, the Company includes reimbursable expenses in total contract consideration and is included in Professional services revenues. See Note 1 “Business and Summary of Significant Accounting Policies.” |
|
| | | | | | | | | | | | | | | | | | | | |
| | Year Ended December 31, |
| | 2016 | | 2015 | | 2014 |
| | (in thousands, except percentages) |
| Time-and-material | $ | 1,023,781 |
| | 88.2 | % | | $ | 784,153 |
| | 85.8 | % | | $ | 618,725 |
| | 84.7 | % |
| Fixed-price | 120,689 |
| | 10.4 |
| | 116,700 |
| | 12.8 |
| | 99,266 |
| | 13.6 |
|
| Licensing | 3,141 |
| | 0.3 |
| | 3,764 |
| | 0.4 |
| | 3,626 |
| | 0.5 |
|
| Reimbursable expenses and other revenues | 12,521 |
| | 1.1 |
| | 9,511 |
| | 1.0 |
| | 8,410 |
| | 1.2 |
|
| Revenues | $ | 1,160,132 |
| | 100.0 | % | | $ | 914,128 |
| | 100.0 | % | | $ | 730,027 |
| | 100.0 | % |
Revenues by Client Concentration
The following table sets forth revenues contributed by our top one, top five and top ten clients by amount and as a percentage of our revenues forSee Note 9 “Revenues” in the periods indicated: |
| | | | | | | | | | | | | | | | | | | | |
| | Year Ended December 31, |
| | 2016 | | 2015 | | 2014 |
| | (in thousands, except percentages) |
| Top client | $ | 136,522 |
| | 11.8 | % | | $ | 129,818 |
| | 14.2 | % | | $ | 97,639 |
| | 13.4 | % |
| Top five clients | $ | 327,092 |
| | 28.2 | % | | $ | 298,063 |
| | 32.6 | % | | $ | 239,396 |
| | 32.8 | % |
| Top ten clients | $ | 442,253 |
| | 38.1 | % | | $ | 400,250 |
| | 43.8 | % | | $ | 320,126 |
| | 43.9 | % |
During the year ended December 31, 2016, our growth rate outside the top twenty accounts was 44.3%, while the top twenty accounts grew 12.5%. While we seek to grow revenues from our existing clients by continually expanding the scope and size of our engagements, we expect client concentration from our top ten clients to continue to decrease over the long-term.
Our focus on delivering qualitynotes to our clients is reflected by an average of 96.2%consolidated financial statements in this Annual Report on Form 10-K for more information regarding our contract types and 81.9% of our revenues in 2016 coming from clients that had used our services for at least one and two years, respectively. We have long-standing relationship with many of our customers, and revenues derived from these customers may fluctuate as these accounts reach their maturity or upon completion of multi-year projects. While we believe there’s a significant potential for future growth as we expand our capabilities and offerings within specific domains /verticals, we continue to focus on diversification of our client concentration and building up a portfolio of accounts that we believe have significantrelated revenue potential. We anticipate the contribution of these accounts to our total revenues to increase in the mid- to long-term and counterbalance the slowdown in the growth of certain of our largest customers as they reach maturity.recognition policies.
Cost of Revenues (Exclusive of Depreciation and Amortization)
The principal components of our cost of revenues (exclusive of depreciation and amortization) are salaries, employeebonuses, fringe benefits, stock-based compensation, expense,project-related travel costs and subcontractor fees for IT professionals and subcontractors thatwho are assigned to clientcustomer projects. Salaries and other compensation expenses of our ITdelivery professionals are reported as cost of revenuerevenues regardless of whether the employees are actually performing clientcustomer services during a given period. Our employees are a critical asset, necessary for our continued success and therefore we expect to continue hiring talented employees and providing them with competitive compensation programs.
We manage the utilization levels of our delivery professionals through strategicallystrategic hiring and training high-performing ITefficient staffing of projects. Some of these professionals are hired and efficiently staffingtrained to work for specific customers or on specific projects and some of our offshore development centers are dedicated to specific customers or projects. Our staff utilization also depends on the general economy and its effect on our clientscustomers and their business decisions regarding the use of our services. Some of our IT professionals are specifically hired and trained to work for specific clients or on specific projects, and some of our offshore development centers are dedicated to specific clients or projects.
2016 compared to 2015
During the yearsyear ended December 31, 2016,2019, cost of revenues (exclusive of depreciation and amortization) was $737.2$1,488.2 million, representing an increase of 30.0%25.4% from $566.9$1,186.9 million reported in the corresponding period last year. The increase was primarily due to an increase in compensation costs as a result of a 34.2%19.2% growth in the average number of production headcount for the year and a higher level of accrued variable compensation in 2019 as compared to the prior year.
Expressed as a percentage of revenues, cost of revenues (exclusive of depreciation and amortization) was 63.6%64.9% and 62.0%64.4% during the years ended December 31, 20162019 and 2015,2018, respectively. Of thisThe year-over-year increase 1.5% was attributable to a decrease inreflects the impact from lower utilization during the year ended December 31, 2016, as compared to the same period last year. While we will continue to strategically invest in our business to support its long-term growth, we anticipate utilization to reach normalized levels in 2017.rates and increased stock compensation expense.
2015 compared to 2014
During the years ended December 31, 2015 and 2014,Discussion of cost of revenues (exclusive of depreciation and amortization) was $566.9 millionfrom 2018 as compared to 2017 is disclosed in “Part II. Item 7. Management’s Discussion and $456.5 million, respectively, representing an increaseAnalysis of 24.2%Financial Condition and Results of Operations — Results of Operations” of our Annual Report on Form 10-K for the year ended December 31, 2015 over the corresponding period of 2014, mainly due to an increase in headcount of revenue-producing personnel.
The increase in cost of revenues (exclusive of depreciation and amortization) in 2015 was primarily driven by an increase $107.1 million in compensation costs for revenue-producing personnel, including an increase in stock-based compensation expense of $5.0 million. The increases in all of these costs were the result of organic increase in headcount as well as personnel additions from acquisitions.
As a percentage of revenues, cost of revenues (exclusive of depreciation and amortization), decreased 0.5% over the corresponding period of 2014, to 62.0% of consolidated revenues.2018.
Selling, General and Administrative Expenses
Selling, general and administrative expenses represent expenses associated with promoting and selling our services and general and administrative functions of our business. These expenses include senior management, administrative personnel and sales and marketing personnel salaries;the costs of salaries, bonuses, fringe benefits, stock-based compensation, expense, related fringe benefits, commissions andseverance, bad debt, travel, costs for those employees; legal and audit expenses,accounting services, insurance, facilities including operating lease expenses, and the cost ofleases, advertising and other promotional activities. In addition, we pay a membership fee of 1% of revenues generated in Belarus to the administrative organization of the Belarus Hi-TechHigh-Technologies Park.
Over the recent years, our selling, general and administrative expenses have been increasing as a result of our expanding operations, acquisitions, and the hiring of a number of senior managers to support our growth. We expect our selling, general and administrative expenses to continue to increase in absolute terms as our business expands but will generally to remain steady or slightly decrease as a percentage of our revenues.revenues in the foreseeable future.
2016 compared
Our selling, general and administrative expenses have increased due to 2015
our continuously expanding operations, strategic business acquisitions, and the hiring of necessary personnel to support our growth. During the year ended December 31, 2016,2019, selling, general and administrative expenses were $264.7$457.4 million, representing an increase of 18.8%22.4% as compared to $222.8$373.6 million reported in the corresponding period last year. The increase in selling, general and administrative expenses in 20162019 was primarily driven by a $14.6$44.8 million increase in personnel-related costs coupled withincluding stock-based compensation expense and talent acquisition and development expenses, and a $16.5$28.0 million increase in general and administrative expenses related to investment in facilities and infrastructure related expenses to support the increased headcount, and $4.0 million higher spending related to talent acquisition and development.our growth.
Expressed as a percentage of revenue,revenues, selling, general and administrative expenses decreased 1.6%0.4% to 22.8%19.9% for the year ended December 31, 2016.2019. The decrease was primarily attributable to higher revenuedriven by the slower growth of 19.7% in personnel-related costs including stock-based compensation expense as compared to therevenue growth in compensation driven by the increased headcount and wage inflation, coupled with relatively limited growth in stock-based compensation.of 24.5%.
2015 compared to 2014
We continued to invest in key areas including sales, infrastructure, industry expertise, and other functions supporting global operations and our growth. During the year ended December 31, 2015,Discussion of selling, general and administrative expenses totaled $222.8 million, representing an increasefrom 2018 as compared to 2017 is disclosed in “Part II. Item 7. Management’s Discussion and Analysis of 36.1% from $163.7 million during 2014. As a percentageFinancial Condition and Results of revenue, selling, general and administrative expenses represent 24.4%Operations — Results of consolidated revenues, an increase of 2.0% over last year. The increase in selling, general and administrative expenses in 2015 was primarily driven by a $48.5 million increase in personnel-related costs, which includes salaries and stock-based compensation expenses. Of these personnel-related costs, stock-based compensation expenses increased $16.2 million during the year ended December 31, 2015. Our selling, general and administrative expenses have increased primarily as a resultOperations” of our expanding operations, acquisitions, and the hiring of a number of senior managers to support our growth.
In addition, we have issued stock to the sellers and/or personnel in connection with certain of our business acquisitions and have been recognizing stock-based compensation expense in the periods after the closing of these acquisitions as part of the selling, general and administrative expenses. Such stock based compensation expenses related to acquisitions comprised 58.2% of total selling, general and administrative stock-based compensation expenseAnnual Report on Form 10-K for the year ended December 31, 2015.2018.
Depreciation and Amortization Expense
2016 compared to 2015
During the year ended December 31, 2016,2019, depreciation and amortization expense was $23.4$45.3 million, representing an increase of $6.0$8.7 million from $17.4$36.6 million reported in the corresponding period last year. The increase in depreciation and amortization expense was predominantly driven by depreciation ofprimarily due to an increase in computer equipment and infrastructure related to increasedsupport headcount growth. Depreciation and amortization expense includes amortization of acquired finite-lived intangible assets related to the acquisitions of businesses completed in 2015.assets. Expressed as a percentage of revenues, depreciation and amortization expense wasremained consistent at 2.0%, a slight increase from 1.9% reported in the same period last year.
Depreciation and amortization expense includes amortization of acquired intangible assets, all of which have finite useful lives.
2015 compared to 2014
Depreciation and amortization expense was $17.4 million in 2015, representing a decrease of $0.1 million from 2014. Expressed as a percentage of revenues, depreciation and amortization expense totaled 1.9% and decreased 0.5% compared with 2014.
Depreciation and amortization expense includes amortization of acquired intangible assets, all of which have finite useful lives.
Other Operating Expenses, Net
There were no material changes in other operating expenses, net during the year ended December 31, 20162019 as compared to the corresponding period last year.2018.
DuringDiscussion of depreciation and amortization expense from 2018 as compared to 2017 is disclosed in “Part II. Item 7. Management’s Discussion and Analysis of Financial Condition and Results of Operations — Results of Operations” of our Annual Report on Form 10-K for the year ended December 31, 2015, other operating expenses decreased $2.8 million from 2014 to $1.1 million.2018.
Interest and Other Income, Net
Interest and other income, net is comprised ofincludes interest earned on cash accounts in Belarus and to a lesser extent,cash equivalents and employee housing loans, gains and losses from certain financial instruments, interest expense related to our revolving credit facility interest earned on employee housing loans, and other income.
changes in the fair value of contingent consideration. There were no material changes in interest and other income, net in 20162019 as compared to 2015.
Interest2018 and other income, net was $4.7 million in 2015, representing a slight decrease of 0.8% from $4.8 million recognized in 2014.2017.
Provision for Income Taxes
Determining the consolidated provision for income tax expense, deferred income tax assets and liabilities and any potential related valuation allowance, if any,allowances involves judgment. We consider factors that may contribute, favorably or unfavorably, to the overall annual effective tax rate in the current year as well as the future. These factors include statutory tax rates and tax law changes in the countries where we operate and excess tax benefits upon vesting or exercise of equity awards as well as consideration of any significant or unusual items.
As a global company, we are required to calculate and provide for income taxes in each of the jurisdictions in which we operate. During 2016, 20152019, 2018 and 2014,2017, we had $135.8$234.2 million, $113.8$205.2 million and $94.2$180.9 million, respectively, in income before provision for income taxes attributed to our foreign jurisdictions. The statutory tax rate in the majority of our foreign jurisdictions is lower than the statutory U.S. tax rate. Additionally, we have secured special tax benefits in Belarus as described below. As a result, our provision for income taxes is relatively low as a percentage of income before taxes because of the benefit received from income earned in low tax jurisdictions. Changes in the geographic mix or level of annual pre-tax income can also affect our overall effective income tax rate.
Our provision for income taxes also includes the impact of provisions established for uncertain income tax positions, as well as the related net interest.interest and penalty expense. Tax exposures can involve complex issues and may require an extended period to resolve. Although we believe we have adequately reserved for our uncertain tax positions, we cannot provide assurance that the final tax outcome of these matters will not be different from our current estimates. We adjust these reserves in light of changing facts and circumstances, such as the closing of a tax audit, statute of limitation lapse or the refinement of an estimate. To the extent that the final tax outcome of these matters differs from the amounts recorded, such differences will impact the provision for income taxes in the period in which such determination is made.
Our subsidiary inIn Belarus, is a member of the Belarus Hi-Tech Park, in which member technology companies are 100% exemptof High-Technologies Park, including our local subsidiary, have a full exemption from Belarus income tax on qualifying income through January 2049. However, beginning February 1, 2018, the earnings of the Company’s Belarus local subsidiary became subject to U.S. income taxation due to the Company’s decision to change the tax status of the subsidiary. Consequently, there was less income tax benefit from the current Belarusian incomeBelarus tax rate of 18%. The “On High-Technologies Park” Decree, which createdexemption during 2018 compared to the Belarus Hi-Tech Park, is in effectprevious year. There was no aggregate dollar benefit derived from this tax holiday for a period of 15 years from July 1, 2006. Thethe year ended December 31, 2019, and the aggregate dollar benefits derived from this tax holiday approximated $13.6 million, $20.8$1.4 million and $16.8$15.5 million for the years ended December 31, 2016, 20152018 and 2014,2017, respectively. There was no impact on diluted net income per share for the year ended December 31, 2019. The benefit the tax holiday had on diluted net income per share approximated $0.26, $0.40$0.02 and $0.34$0.28 for the years ended December 31, 2016, 20152018 and 2014,2017, respectively.
2016 compared to 2015
ProvisionThe provision for income taxes was $27.2$38.5 million in 20162019 and $21.6$9.5 million in 2015. The increase in the effective tax rate from 20.4% in 2015 to 21.5% in 2016 was predominantly caused by the changes in the geographic mix of our earnings, including:
higher earnings attributable to our U.S. operations in 20162018, partially driven by the growthincrease in onsite presence in the U.S. and lower earnings attributable to foreign jurisdictions due to currency headwinds, among other factors;
changes in the geographic mix of our earnings attributable to foreign operations toward jurisdictions with higher statutorypre-tax income tax rates;
full-year impact of inclusion of operating results of AGS, a 2015 acquisition with its primary delivery centers in India, which has a significantly higher tax rate.
As we continue to grow our onsite presence and expand the geographic footprint of our delivery centers, we expect this may result in an increase to our effective tax rate in the near and medium term; but other factors that may contribute, favorably or unfavorably, to the overall effective tax rate in 2017 and beyond must be considered as well.
2015 compared to 2014
Provision for income taxes was $21.6 million in 2015 and $17.3 million in 2014.year over year. The effective tax rate increased from 3.8% in 2018 to 20.4%12.8% in 2015 from 19.9% in 20142019 primarily due to changesone-time benefits in 2018, partially offset by an increase in excess tax benefits associated with equity award exercises and vesting which were $28.4 million in 2019 compared to $17.4 million in 2018. The provision for income taxes in 2018 included the following one-time net tax benefits:
We recorded a $26.0 million benefit to reflect the establishment of net deferred tax assets as a result of our decision to file entity classification elections with the Internal Revenue Service for the majority of our foreign subsidiaries to change the tax status and to classify most of our foreign subsidiaries as disregarded for U.S. income tax purposes.
The provisional charge recorded in 2017 due to the one-time transition tax on accumulated foreign subsidiary earnings not previously subject to U.S. income tax was reduced by $4.9 million, and the provisional charge recorded in 2017 due to the impact of the change in the geographic mixU.S. statutory tax rate from 35.0% to 21.0% on the valuation of the net deferred tax assets was increased by $0.9 million.
Based on proposed tax regulations issued by the U.S. Department of the Treasury during 2018, it was determined that a U.S. foreign tax credit could be claimed for the withholding tax paid to Belarus resulting in a net $4.9 million tax benefit recognized in 2018.
Discussion of the provision for income taxes from 2018 as compared to 2017 is disclosed in “Part II. Item 7. Management’s Discussion and Analysis of Financial Condition and Results of Operations — Results of Operations” of our currentAnnual Report on Form 10-K for the year earnings and discrete tax benefits recorded in 2014 that didn’t recur in 2015, as well as due to elimination of certain income tax holiday benefits in Hungary in 2015.ended December 31, 2018.
Foreign Exchange Gain / Loss
For discussion of the impact of foreign exchange fluctuations see “Item 7A. Quantitative and Qualitative Disclosures About Market Risk -— Foreign Exchange Risk.”
Effects of Inflation
Economies in CIS countries, particularly Belarus, Russia, Kazakhstan and Ukraine, have periodically experienced high rates of inflation. Periods of higher inflation may slow economic growth in those countries and as a result decrease demand for our services and negatively impact the business of our existing clients. Inflation is likely to increase some of our expenses, which may reduce our profitability, as we may not be able to pass these increases on to our clients. Generally, our largest expense that could be impacted by inflation is wages. We do not rely on borrowed funds for operations in those locations; therefore, increases in interest rates typical for inflationary environments do not currently pose a risk to our business.
Ukraine has been experiencing political and economic turmoil severely impacting the Ukrainian economy. The Ukrainian currency has been weakened and the negative outlook in the Ukrainian economy continues. We have not experienced a significant impact from the inflation in Ukraine and do not have significant clients located in Ukraine.
Inflation in Russia increased in late 2014 due to weakening of the Russian ruble and decreasing oil prices. Inflation in Russia remained steady during 2015 with some decline observed during 2016. Our operations in Russia have not been significantly affected by local inflation; however, we have noted some impact from inflation on our clients in Russia.
Belarus experienced hyperinflation in the past and may experience high levels of inflation in the future. We have not seen a significant impact from the inflation in Belarus as our largest expense there, wages, is denominated in U.S. dollars in order to provide stability in our business and for our employees. We do not have significant clients located in Belarus and for the year ended December 31, 2016, we had approximately $1,743 or 0.2% of our revenues denominated in Belarusian rubles. The functional currency for financial reporting purposes in Belarus is US dollars.
Other locations where we have clients or perform services are not experiencing significant inflation and our business is not materially impacted by inflation in those locations.
Results by Business Segment
Our operations consist of fourthree reportable segments: North America, Europe, Russia and Other.Russia. The segments represent components of EPAM for which separate financial information is available that isand used on a regular basis by our chief executive officer, who is also our chief operating decision maker (“CODM”), in determiningto determine how to allocate resources and evaluate performance. This determination is based on the unique business practices and market specifics of each region and that each region engages in business activities from which it earns revenues and incurs expenses. Our reportable segments are based on managerial responsibility for a particular client. Because managerial responsibility for a particular client relationship generally correlates with the client’s geographic location, there is a high degree of similarity between client locations and the geographic boundaries of our reportable segments. In some specific cases, however, managerial responsibility for a particular client is assigned to a management team in another region, usually based on the strength of the relationship between client executives and particular members of our senior management team. In a case like this, the client’s activity would be reported through the management team’s reportable segment. Our CODM evaluates the Company’s performance and allocates resourcesmakes business decisions based on segment revenues and segment operating profit.
profits. Segment operating profit is defined as income from operations before unallocated costs. Generally, operating expenses for each reportable segment have similar characteristics and are subject to similar factors, pressures and challenges. Expenses included in segment operating profit consist principally of direct selling and delivery costs as well as an allocation of certain shared services expenses. We use globally integrated support organizations to realize economies of scale and efficient use of resources. As a result, a majority of our expenses is shared by all segments. These shared expenses include Delivery, Recruitment and Development, Sales and Marketing, and support functions such as IT, Finance, Legal, and Human Resources. Generally, shared expenses are allocated based on measurable drivers of expense, e.g., recorded hours or headcount. However, certainCertain corporate expenses are not allocated to specific segments as management does not believe it is practical to allocate such costs to individual segments because they are not directly attributable to any specific segment. Further, stock based compensation expense is not allocated to individual segments in internal management reports used by CODM. Accordingly, these expenses are separately disclosed as “unallocated”not controllable at the segment level. Such expenses include certain types of professional fees, non-corporate taxes, compensation to non-employee directors and adjusted only against ourcertain other general and administrative expenses, including compensation of specific groups of non-production employees. In addition, the Company does not allocate stock-based compensation expenses, amortization of purchased intangible assets and other acquisition-related expenses. These unallocated amounts are combined with total segment operating profit to arrive at consolidated income from operations.
RevenuesWe manage our business primarily based on the managerial responsibility for the client base and market. As managerial responsibility for a particular customer relationship generally correlates with the customer’s geographic location, there is a high degree of similarity between customer locations and the geographic boundaries of our reportable segments. In some cases, managerial responsibility for a particular customer is assigned to a management team in another region and is usually based on the strength of the relationship between customer executives and particular members of EPAM’s senior management team. In such cases, the customer’s activity would be reported through the management team’s reportable segment.
During the fourth quarter of 2019, the Company changed its management reporting of segment revenues to exclude other income. Prior year amounts presented below have been changed to conform to that presentation.
Segment revenues from external clientscustomers and segment operating profit, before unallocated expenses, for the North America, Europe Russia and Other reportableRussia segments for the fiscal years ended December 31, 2016, 20152019, 2018 and 20142017 were as follows:
| | | | Year Ended December 31, | Year Ended December 31, |
| | 2016 | | 2015 | | 2014 | 2019 | | 2018 | | 2017 |
| | (in thousands) | (in thousands) |
| Total segment revenues: | | | | | | |
| Segment revenues: | | | | | | |
| North America | $ | 642,216 |
| | $ | 471,603 |
| | $ | 374,509 |
| $ | 1,380,944 |
| | $ | 1,076,979 |
| | $ | 796,040 |
|
| Europe | 474,988 |
| | 400,460 |
| | 299,279 |
| 820,717 |
| | 692,785 |
| | 591,450 |
|
| Russia | 43,611 |
| | 37,992 |
| | 50,663 |
| 92,137 |
| | 73,148 |
| | 62,958 |
|
| Other | — |
| | 4,911 |
| | 5,552 |
| |
| Total segment revenues | $ | 1,160,815 |
| | $ | 914,966 |
| | $ | 730,003 |
| $ | 2,293,798 |
| | $ | 1,842,912 |
| | $ | 1,450,448 |
|
| Segment operating profit: | |
| | |
| | | |
| | |
| | |
| North America | $ | 143,021 |
| | $ | 112,312 |
| | $ | 90,616 |
| $ | 293,757 |
| | $ | 221,846 |
| | $ | 169,340 |
|
| Europe | 67,545 |
| | 68,717 |
| | 50,189 |
| 114,863 |
| | 115,876 |
| | 92,080 |
|
| Russia | 7,555 |
| | 5,198 |
| | 7,034 |
| 17,347 |
| | 11,377 |
| | 13,906 |
|
| Other | — |
| | (94 | ) | | (3,220 | ) | |
| Total segment operating profit | $ | 218,121 |
| | $ | 186,133 |
| | $ | 144,619 |
| $ | 425,967 |
| | $ | 349,099 |
| | $ | 275,326 |
|
During the year ended December 31, 2018, the Company began to allocate certain staff recruitment and development expenses into segment operating profit as these expenses became part of the evaluation of segment management’s performance. These costs were not previously allocated to segments and were included in unallocated amounts in the reconciliation of segment operating profit to consolidated income before provision for income taxes. The effect of this reclassification was not material to segment operating profit and had no impact on total income from operations for the year ended December 31, 2018.
North America Segment
20162019 compared to 20152018
During 2019, North America segment revenues were 55.3%increased $304.0 million, or 28.2%, over last year. Revenues from our North America segment represent 60.2% and 51.5%58.4% of total segment revenues representing an increase of $170.6 million, or 36.2%, overduring 2019 and 2018, respectively. During 2019 as compared to 2018, the corresponding period last year. The North America segment’s operating profits increased $30.7$71.9 million, or 27.3%32.4%, to $293.8 million. North America’s operating profit represented 21.3% of North America segment revenues as compared to 20.6% in 2018.
Revenues were negatively impacted by the reassignment of a certain customer to the Europe segment from the North America segment as a result of a change in managerial responsibility. Without this reassignment, North America segment revenue growth would have been 34.6% for the year ended December 31, 2019 as compared to 2018.
The following table presents North America segment revenues by industry vertical for the periods indicated: |
| | | | | | | | | | | | | | |
| | Year Ended December 31, | | Change |
| | 2019 | | 2018 | | Dollars | | Percentage |
| Industry Vertical | (in thousands, except percentages) |
| Software & Hi-Tech | $ | 354,023 |
| | $ | 269,067 |
| | $ | 84,956 |
| | 31.6 | % |
| Business Information & Media | 262,448 |
| | 251,081 |
| | 11,367 |
| | 4.5 | % |
| Life Sciences & Healthcare | 224,925 |
| | 151,418 |
| | 73,507 |
| | 48.5 | % |
| Travel & Consumer | 198,264 |
| | 177,910 |
| | 20,354 |
| | 11.4 | % |
| Financial Services | 184,469 |
| | 112,444 |
| | 72,025 |
| | 64.1 | % |
| Emerging Verticals | 156,815 |
| | 115,059 |
| | 41,756 |
| | 36.3 | % |
| Revenues | $ | 1,380,944 |
| | $ | 1,076,979 |
| | $ | 303,965 |
| | 28.2 | % |
Software & Hi-Tech remained the largest industry vertical in the North America segment during the year ended December 31, 2019, growing 31.6% as compared to the sameprior year, which was a result of the continued focus on working with our technology customers. Revenues from the Financial Services vertical grew in excess of 50% during the year ended December 31, 2019 compared to 2018. Revenues from the Business Information & Media vertical grew 4.5% during the year ended December 31, 2019, as compared to the corresponding period from the prior year and were adversely impacted by the reassignment of 2015,a certain customer to $143.0 million net operating profit. North America remains our most profitable segment with operating profit composing 22.3% of North America segment’s revenues.the Europe segment. Without this reassignment, the Business Information & Media vertical would have grown 31.8% during the year 2019 compared to the previous year.
Strong performance of our 2018 compared to 2017
North America segment was predominantly driven by continued expansion of existing top customer relationships across all our key verticals, as well as strong performance of the U.S. dollar against foreign currencies.
2015 compared to 2014
During the years ended December 31, 2015 and 2014 revenues increased $280.9 million, or 35.3%, over 2017. Revenues from our North America segment were 51.5%represent 58.4% and 51.3%54.9% of total segment revenues representing an increase of $97.1 million, or 25.9%, overduring 2018 and 2017, respectively. During 2018 as compared to 2017, the corresponding period in 2014. The North America segment’s operating profits increased by $21.7$52.5 million, or 23.9%31.0%, to $221.8 million. North America’s operating profit represented 20.6% of North America segment revenues as compared to the same period of 2014, to $112.3 million net operating profit.21.3% in 2017.
The following table presents North America remains our most profitable segment with operating profit composing 23.8% of revenues.revenues by industry vertical for the periods indicated: The increase |
| | | | | | | | | | | | | | |
| | Year Ended December 31, | | Change |
| | 2018 | | 2017 | | Dollars | | Percentage |
| Industry Vertical | (in thousands, except percentages) |
| Software & Hi-Tech | $ | 269,067 |
| | $ | 211,310 |
| | $ | 57,757 |
| | 27.3 | % |
| Business Information & Media | 251,081 |
| | 192,110 |
| | 58,971 |
| | 30.7 | % |
| Travel & Consumer | 177,910 |
| | 148,190 |
| | 29,720 |
| | 20.1 | % |
| Life Sciences & Healthcare | 151,418 |
| | 105,839 |
| | 45,579 |
| | 43.1 | % |
| Financial Services | 112,444 |
| | 65,150 |
| | 47,294 |
| | 72.6 | % |
| Emerging Verticals | 115,059 |
| | 73,441 |
| | 41,618 |
| | 56.7 | % |
| Revenues | $ | 1,076,979 |
| | $ | 796,040 |
| | $ | 280,939 |
| | 35.3 | % |
Software & Hi-Tech remained the largest industry vertical in revenuesthe North America segment during the year ended December 31, 2015,2018, growing 27.3% as compared to the prior year, which was primarilya result of the continued focus on working with our technology customers. Revenues from the Financial Services and Emerging Verticals grew in excess of 50% during the year ended December 31, 2018 compared to 2017 substantially driven by continued expansion of existing top customer relationships, as well as our recent acquisitions. Operating results of the North America reportable segment benefited from our 2014 acquisitionscustomers we began serving in the Life Sciences and Healthcare industry as well as acquisitions of NavigationArts and AGS during 2015.prior 24 months.
Europe Segment
Our Europe segment includes the business in the APAC region, which is managed by the same management team.
20162019 compared to 20152018
During 2019, Europe segment’ssegment revenues were $475.0$820.7 million, representingreflecting an increase of $74.5$127.9 million, or 18.6%18.5%, from last year. During the years ended December 31, 2016 and 2015, revenuesRevenues from our Europe segment were 40.9%represent 35.8% and 43.8%37.6% of total segment revenues during 2019 and 2018, respectively. During 2016,2019, this segment’s operating profits decreased $1.2$1.0 million, or 1.7%,0.9% as compared to the corresponding period last year, to $67.5 million net$114.9 million. Europe’s operating profit.profit represented 14.0% of Europe segment revenues as compared to 16.7% in 2018.
During 2016,Revenues benefited from the segment’s operating results were adversely affected byreassignment of a slowdown in growth of our topcertain customer significantly increasing pressures on operating margins and overall profitability of the segment. In January 2017, we announced a multi-year arrangement with this customer, which extended our nine-year relationship and established a minimum revenue commitment of at least $300 million over the next three years.
The segment’s operating results were adversely affected by exchange rate fluctuations, and particularly, the depreciation of the British pound relative to the U.S. dollar, which isEurope segment from the primary currencyNorth America segment as a result of a change in managerial responsibility. Without this reassignment, Europe segment revenue growth would have been 8.6% for the majority of the delivery centers that service our U.K. accounts. The Financial Services vertical remained our largest vertical in this segment and accounted for 30.8% of the overall growth of this segment in 2016.
2015 compared to 2014
During the yearsyear ended December 31, 2015 and 2014, revenues from our2019 as compared to 2018.
The following table presents Europe segment were 43.8% and 41.0%revenues by industry vertical for the periods indicated: |
| | | | | | | | | | | | | | |
| | Year Ended December 31, | | Change |
| | 2019 | | 2018 | | Dollars | | Percentage |
| Industry Vertical | (in thousands, except percentages) |
| Financial Services | $ | 244,284 |
| | $ | 252,196 |
| | $ | (7,912 | ) | | (3.1 | )% |
| Travel & Consumer | 229,523 |
| | 208,266 |
| | 21,257 |
| | 10.2 | % |
| Business Information & Media | 157,844 |
| | 72,898 |
| | 84,946 |
| | 116.5 | % |
| Software & Hi-Tech | 77,377 |
| | 79,121 |
| | (1,744 | ) | | (2.2 | )% |
| Life Sciences & Healthcare | 23,444 |
| | 20,272 |
| | 3,172 |
| | 15.6 | % |
| Emerging Verticals | 88,245 |
| | 60,032 |
| | 28,213 |
| | 47.0 | % |
| Revenues | $ | 820,717 |
| | $ | 692,785 |
| | $ | 127,932 |
| | 18.5 | % |
The Europe segment benefited from strong growth in the Business Information & Media vertical of total segment revenues, respectively, representing an increase116.5% for the year ended December 31, 2019 as compared to 2018. This is primarily due to the reassignment of $101.2 million, or 33.8%, in 2015 over the 2014 results. During 2015,a certain customer to the Europe segment’s operating profits increasedsegment from the North America segment as a result of a change in managerial responsibility. Without this reassignment, Business Information & Media growth would have been 22.7% for the year ended December 31, 2019 as compared to 2018.
For the year ended December 31, 2019, Financial Services remained the largest industry vertical in the Europe segment, however, revenues in Financial Services decreased compared to 2018 primarily due to slower demand for our services by $18.5 million, or 36.9%,certain banks in Europe. Revenues in Software & Hi-Tech also decreased during the year ended December 31, 2019 as compared to the corresponding period of 2014,2018 primarily due to $68.7 million net profit froma change in the segment’s operations.estimate of variable consideration associated with a single customer.
2018 compared to 2017
Europe continuessegment revenues were $692.8 million, reflecting an increase of $101.3 million, or 17.1%, from 2017. Revenues from our Europe segment represented 37.6% and 40.8% of total segment revenues during 2018 and 2017, respectively. During 2018, this segment’s operating profits increased $23.8 million, or 25.8% as compared to be a growing2017, to $115.9 million. Europe’s operating profit represented 16.7% of the Europe segment revenues as compared to 15.6% in our portfolio as our business model continues to gain considerable traction with European-based clients primarily in2017.
The following table presents Europe segment revenues by industry vertical for the Financial Services and Travel and Consumer verticals. Furthermore, ourperiods indicated: |
| | | | | | | | | | | | | | |
| | Year Ended December 31, | | Change |
| | 2018 | | 2017 | | Dollars | | Percentage |
| Industry Vertical | (in thousands, except percentages) |
| Financial Services | $ | 252,196 |
| | $ | 232,283 |
| | $ | 19,913 |
| | 8.6 | % |
| Travel & Consumer | 208,266 |
| | 160,112 |
| | 48,154 |
| | 30.1 | % |
| Software & Hi-Tech | 79,121 |
| | 70,620 |
| | 8,501 |
| | 12.0 | % |
| Business Information & Media | 72,898 |
| | 64,089 |
| | 8,809 |
| | 13.7 | % |
| Life Sciences & Healthcare | 20,272 |
| | 14,726 |
| | 5,546 |
| | 37.7 | % |
| Emerging Verticals | 60,032 |
| | 49,620 |
| | 10,412 |
| | 21.0 | % |
| Revenues | $ | 692,785 |
| | $ | 591,450 |
| | $ | 101,335 |
| | 17.1 | % |
The Europe segment benefited from strong growth in the continued growthTravel & Consumer vertical of Jointech, a company we acquired in 2014, with locations in South-East Asia. This extended reach into a new geography created additional options30.1% for our existing customers within the year ended December 31, 2018 as compared to 2017. Financial Services remained the largest industry vertical particularly in the areasEurope segment. Revenues in Financial Services grew less than 10% as compared to 2017 primarily due to decreasing revenues from certain customers outside of investment banking and wealth and asset management. We continue to expect that our new and existing customers will use our services in that fast-growing region resulting in possible revenue and operating profit increases to the Europe segment.top 5 customers.
Russia and Other SegmentsSegment
20162019 compared to 20152018
During fiscal 2016, we completed multi-year engagements with certain customers, which significantly decreased the portfolio of accounts in our Other reportable segment. As a result, managerial responsibility for the remaining accounts in the Other reportable segment was transferred to2019, revenues from our Russia segment. This change does notsegment increased $19.0 million relative to 2018 and represent a change in our reportable segments, but is rather a movement in responsibility for a number of customers, accounting for less than 1%4.0% of total segment revenue.
Revenues from our Russia reportable segment increased $0.7 million relative to the revenues of our Russiaduring both 2019 and Other segments in the corresponding period of 2015.2018. Operating profits of our Russia segment increased $6.0 million when compared to 2018. Expressed as a percentage of Russia segment revenues, the segment’s operating profits were 18.8% and 15.6% in 2019 and 2018, respectively.
The following table presents Russia segment revenues by industry vertical for the periods indicated: |
| | | | | | | | | | | | | | |
| | Year Ended December 31, | | Change |
| | 2019 | | 2018 | | Dollars | | Percentage |
| Industry Vertical | (in thousands, except percentages) |
| Financial Services | $ | 72,119 |
| | $ | 59,337 |
| | $ | 12,782 |
| | 21.5 | % |
| Travel & Consumer | 11,571 |
| | 7,467 |
| | 4,104 |
| | 55.0 | % |
| Software & Hi-Tech | 1,998 |
| | 2,627 |
| | (629 | ) | | (23.9 | )% |
| Business Information & Media | 631 |
| | 54 |
| | 577 |
| | 1,068.5 | % |
| Life Sciences & Healthcare | 83 |
| | 13 |
| | 70 |
| | 538.5 | % |
| Emerging Verticals | 5,735 |
| | 3,650 |
| | 2,085 |
| | 57.1 | % |
| Revenues | $ | 92,137 |
| | $ | 73,148 |
| | $ | 18,989 |
| | 26.0 | % |
The depreciation of the Russian ruble against the U.S. dollar during 2019 as compared to 2018 unfavorably impacted revenues in this segment; however, segment operating profit as a percentage of revenues improved primarily due to realized gains on our foreign currency hedges. Currency fluctuations of the Russian ruble typically impact the results in the Russia segment. Ongoing economic and geopolitical uncertainty in the region and the volatility of the Russian ruble can significantly impact reported revenues and profitability in this segment. We continue to monitor geopolitical forces, economic and trade sanctions, and other issues involving this region.
2018 compared to 2017
Revenues from our Russia segment increased $10.2 million relative to 2017 and represent 4.0% and 4.3% of total segment revenues during 2018 and 2017, respectively. Operating profits of our Russia segment decreased $2.5 million when compared to the operating profits of our Russia and Other segments in the corresponding period of 2015.2017. Expressed as a percentage of Russia segment revenues, the Russia and Other segments' revenues,segment’s operating profits were 17.3%15.6% and 11.9%22.1% in 20162018 and 2015,2017, respectively. Ongoing economic and geo-political uncertainty in |
| | | | | | | | | | | | | | |
| | Year Ended December 31, | | Change |
| | 2018 | | 2017 | | Dollars | | Percentage |
| Industry Vertical | (in thousands, except percentages) |
| Financial Services | $ | 59,337 |
| | $ | 41,466 |
| | $ | 17,871 |
| | 43.1 | % |
| Travel & Consumer | 7,467 |
| | 9,113 |
| | (1,646 | ) | | (18.1 | )% |
| Software & Hi-Tech | 2,627 |
| | 5,702 |
| | (3,075 | ) | | (53.9 | )% |
| Business Information & Media | 54 |
| | 68 |
| | (14 | ) | | (20.6 | )% |
| Life Sciences & Healthcare | 13 |
| | 27 |
| | (14 | ) | | (51.9 | )% |
| Emerging Verticals | 3,650 |
| | 6,582 |
| | (2,932 | ) | | (44.5 | )% |
| Revenues | $ | 73,148 |
| | $ | 62,958 |
| | $ | 10,190 |
| | 16.2 | % |
The depreciation of the region, as well as significant volatility of Russian ruble limit growth of this segment.
2015against the U.S. dollar during 2018 as compared to 2014
During2017 significantly impacted the years ended December 31, 2015, revenues from the Russia and the Other reportable segments decreased by $12.7 million and $0.6 million, respectively, over the corresponding period of 2014. Operating profits of the Russiain this segment, decreased $1.8 million and the operating losses of the Other segment decreased $3.1 million when comparedwhich were not similarly offset with the operating profits/(losses)costs due to realized losses on our foreign currency hedges.
Effects of these segmentsInflation
Economies in the corresponding periodsome countries where we operate, particularly Belarus, Russia, Kazakhstan, Ukraine and India have periodically experienced high rates of 2014.
Revenues and operating profits in the Russia and Other segments are subject to volatility resulting from revenue recognition delays related to finalizing budgets for certain arrangements with major customersinflation. Periods of higher inflation may affect various economic sectors in those segments causing instabilitycountries and increase our cost of revenues and associated profits. Additionally, strong foreign currency fluctuations in 2014 further destabilized the economic situation in the regions that are included in these segments and negatively impacted ourdoing business in Russia and CIS countries during 2015. Since 2014, the United States and the European Union have imposed sanctions targeting Russian government and government-controlled interests and certain government officials. While this has not directly impacted our business in Russia, the sanctions aggravated the overall Russian economy and negatively influenced the businessthere. Inflation may increase some of our major clients inexpenses such as wages. While inflation may impact our results of operations and financial condition and it is difficult to accurately measure the region, decreasing demand forimpact of inflation, we believe the effects of inflation on our services.results of operations and financial condition are not significant.
Liquidity and Capital Resources
Capital Resources
AtOur cash generated from operations has been our primary source of liquidity to fund operations and investments to support the growth of our business. As of December 31, 2016,2019, our principal sources of liquidity were cash and cash equivalents totaling $362.0$936.6 million and $74.1$274.7 million of available borrowings under our revolving credit facility.
At December 31, 2016, $310.2 million of our totalWe have cash was held outside the United States. Of this amount, $153.6 million was held in U.S. dollar denominated accountsbanks in Belarus, which include some interest bearing deposits.Russia, Ukraine, Kazakhstan, Armenia and Uzbekistan, where the banking sector remains subject to periodic instability. Banking and other financial systems in these countries generally do not meet the banking standards of more developed markets and bank deposits made by corporate entities are not insured. As of December 31, 2016, a balance2019, the total amount of $29.1 million U.S. dollars was kept in unrestricted accounts in our Cyprus entity’s bank accounts in the United Kingdom. Our subsidiaries in the CIS and APAC regions do not maintain significant balances denominated in currencies other than U.S. dollars.
The cash and cash equivalents held at locations outside of the United States are for future operating expenses and we have no intention of repatriating those funds. However, as a result of various factors such as any global or regional instability or changes in tax laws in place for a specific time period, we may later decide to repatriate some or all of our funds to the United States. If we decide to remit funds to the United States in the form of dividends, $307.3 million would be subject to foreign withholding taxes, of which $241.7 million would also be subject to U.S. corporate income tax. We believe that our available cash and cash equivalents held in these countries was $206.5 million and of this amount, $123.4 million was located in Belarus.
As of December 31, 2019, we had $274.7 million available for borrowing under our revolving credit facility and had outstanding debt of $25.0 million. As of December 31, 2019, we were in compliance with all covenants specified under the United Statescredit facility and cash flow to be generated from domestic operations will be adequate to satisfy our domestic liquidity needsanticipate being in compliance for the foreseeable future. See Note 8 “Long-Term Debt” in the notes to our consolidated financial statements in this Annual Report on Form 10-K for information regarding our long-term debt.
Our ability to expand and grow our business in accordance with current plans and to meet our long-term capital requirements will depend on many factors, including the rate if any, at which our cash flows increase our continued intent not to repatriate earnings from outside of the U.S.or decrease and the availability of public and private debt and equity financing. To the extent we pursue oneWe may require additional cash resources due to changed business conditions or more significant strategicother future developments, including any investments or acquisitions we may incur debt ordecide to pursue. If our resources are insufficient to satisfy our cash requirements, we may seek to sell additional equity to finance those acquisitions.or debt securities or obtain another credit facility.
On September 12, 2014, we executed a revolving credit facility with PNC Bank, National Association; Santander Bank, N.A; and Silicon Valley Bank, with a borrowing capacity of $100.0 million. The Revolving Credit Facility will mature and all amounts outstanding thereunder will be due and payable on September 12, 2019. There is potential to increase the credit facility up to $200.0 million if certain conditions are met. Borrowings under the credit facility may be denominated in United States dollars or, up to a maximum of $50.0 million in British pounds sterling, Canadian dollars, euros or Swiss francs (or other currencies as may be approved by the lenders). At December 31, 2016, we had outstanding debt of $25.0 million and unused letters of credit issued under the Revolving Credit Facility totaling $0.9 million, primarily for securing collateral requirements under certain insurance programs, with the balance of the credit limit of $74.1 million remaining available for borrowing.
We were in compliance with all restrictive covenants and limitations in the Revolving Credit Facility as of December 31, 2016, and anticipate being in compliance with all restrictive covenants for the foreseeable future.
Cash Flows
The following table summarizes our cash flows for the periods indicated:
| | | | Year Ended December 31, | For the Years Ended December 31, |
| | 2016 | | 2015 | | 2014 | 2019 | | 2018 | | 2017 |
| | (in thousands) | (in thousands) |
| Consolidated Statements of Cash Flow Data: | | | | | | | | | | |
| Net cash provided by operating activities | $ | 164,817 |
| | $ | 76,393 |
| | $ | 104,874 |
| $ | 287,453 |
| | $ | 292,218 |
| | $ | 192,820 |
|
| Net cash used in investing activities | (9,322 | ) | | (125,494 | ) | | (52,929 | ) | (145,369 | ) | | (112,123 | ) | | (36,151 | ) |
| Net cash provided by financing activities | 10,467 |
| | 33,764 |
| | 10,347 |
| 20,363 |
| | 23,001 |
| | 49,746 |
|
| Effect of exchange rate changes on cash and cash equivalents | (3,386 | ) | | (5,748 | ) | | (10,965 | ) | |
| Net increase/(decrease) in cash and cash equivalents | $ | 162,576 |
| | $ | (21,085 | ) | | $ | 51,327 |
| |
| Cash and cash equivalents, beginning of period | 199,449 |
| | 220,534 |
| | 169,207 |
| |
| Cash and cash equivalents, end of period | $ | 362,025 |
| | $ | 199,449 |
| | $ | 220,534 |
| |
| Effect of exchange rate changes on cash, cash equivalents and restricted cash | | 3,530 |
| | (14,240 | ) | | 11,776 |
|
| Net increase in cash, cash equivalents and restricted cash | | $ | 165,977 |
| | $ | 188,856 |
| | $ | 218,191 |
|
| Cash, cash equivalents and restricted cash, beginning of period | | 771,711 |
| | 582,855 |
| | 364,664 |
|
| Cash, cash equivalents and restricted cash, end of period | | $ | 937,688 |
| | $ | 771,711 |
| | $ | 582,855 |
|
Operating Activities
2016 Compared to 2015
Net cash provided by operating activities during the year ended December 31, 2016 increased $88.42019 decreased $4.8 million, or 115.7%1.6%, to $164.8$287.5 million, as compared to 2018 primarily driven by the corresponding period in 2015. Thepayout of a higher level of variable compensation related to 2018 performance, partially offset by the increase in operating cash flows was primarily attributablenet income. Additionally, a larger improvement in days sales outstanding during 2018 compared to 2019 resulted in higher customerrelative collections as we made substantial progress in managing our billed and unbilled trade receivables, and decreased the ratio of billed and unbilled trade receivables to revenues over the course of 2016. For 2017, we anticipate the ratio to remain relatively consistent with the second half of 2016.
2015 Compared to 2014
Net cash provided by operations during the year ended December 31, 2015 decreased $28.5 million to $76.4 million,2018 as compared to $104.9 million net cash provided by operations in 2014. During 2015, operating cash flows were impacted by increases in billed and unbilled accounts receivable and greater accrued expenses, which were mostly impacted by increases in bonus compensation. During 2015, we had higher accounts receivable and unbilled revenue balances as compared to the same period in 2014.2019.
Investing Activities
2016 Compared to 2015
Net cash used in investing activities during the year ended December 31, 20162019 was $9.3$145.4 million compared to $125.5$112.1 million used in the same period in 2015.2018. During fiscal 2016, cash spent on capital expenditures increased by $11.4 million, which was more than offset by a $71.4 million decrease2019, the increase in cash spent on acquisitions of businesses in 2016, coupled with a $59.5 million increase as a result of movements in restricted cash and time deposits.
2015 Compared to 2014
Net cash used in investing activities duringwas primarily due to an increase in capital expenditures of $61.7 million compared to the same period last year, ended December 31, 2015 was $125.5 million and consisted primarily ofpartially offset by a $30.0 million interest bearing time deposit set up by our Cyprus entitydecrease in the United Kingdom in March 2015 and $76.9 million net cash used in the business combinations with NavigationArts and AGS. The cash spent on acquisitionsto acquire businesses of businesses in 2015 increased by $39.8 million compared to 2014.$34.9 million.
Financing Activities
2016 Compared to 2015
During the year ended December 31, 2016,2019, net cash provided by financing activities was $10.5$20.4 million, representing a $23.3$2.6 million decrease from $33.8$23.0 million cash provided by financing activities in 2015.2018. The decrease was primarily attributable to a $45.1driven by $7.8 million decreasein higher payments of withholding taxes related to borrowingsnet share settlements of restricted stock units, partially offset by a $3.5 million repayment of debt in 2018 and $2.2 million of higher cash received in 2019 from the exercises of stock options issued under our revolving credit facility coupled with lower proceeds related to our long-term incentive plans. This was partially offset by lower payments of deferred consideration related to acquisitions of businesses, which decreased $28.0 million in 2016plans compared to last year.2018.
2015 Compared to 2014
NetDiscussion of the comparison of the cash provided by financing activities duringflows between 2018 and 2017 is disclosed in “Part II. Item 7. Management’s Discussion and Analysis of Financial Condition and Results of Operations — Liquidity and Capital Resources” of our Annual Report on Form 10-K for the year ended December 31, 2015 was $33.8 million, a decrease of $23.4 million from the same period in 2014 primarily due to payment of deferred consideration in the amount of $30 million as well as a decrease in excess tax benefit on stock-based compensation, partly offset by higher proceeds from stock option exercises.2018.
Contractual Obligations and Future Capital Requirements
Contractual Obligations
Set forth below is information concerning our significant fixed and determinable contractual obligations as of December 31, 2016.2019.
| | | | Total | | Less than 1 Year | | 1-3 Years | | 3-5 Years | | More than 5 Years | Total | | Less than 1 Year | | 1-3 Years | | 3-5 Years | | More than 5 Years |
| | (in thousands) | (in thousands) |
| Operating lease obligations | $ | 100,080 |
| | $ | 30,791 |
| | $ | 40,750 |
| | $ | 17,441 |
| | $ | 11,098 |
| $ | 264,049 |
| | $ | 64,667 |
| | $ | 91,229 |
| | $ | 49,621 |
| | $ | 58,532 |
|
Long-term debt obligation (1) | 26,133 |
| | 424 |
| | 25,709 |
| | — |
| | — |
| |
U.S. Tax Act transition tax (1) | | 42,973 |
| | — |
| | 7,753 |
| | 20,545 |
| | 14,675 |
|
Long-term incentive plan payouts(2) | 13,152 |
| | 3,288 |
| | 6,576 |
| | 3,288 |
| | — |
| 51,403 |
| | 25,965 |
| | 22,961 |
| | 2,477 |
| | — |
|
Long-term debt obligations(3) | | 27,785 |
| | 1,232 |
| | 26,553 |
| | — |
| | — |
|
Commitments for the purchase of long term assets (4) | | 53,821 |
| | 53,821 |
| | — |
| | — |
| | — |
|
| Total contractual obligations | $ | 139,365 |
| | $ | 34,503 |
| | $ | 73,035 |
| | $ | 20,729 |
| | $ | 11,098 |
| $ | 440,031 |
| | $ | 145,685 |
| | $ | 148,496 |
| | $ | 72,643 |
| | $ | 73,207 |
|
|
| |
| | |
| (1) | The U.S. Tax Act transition tax on undistributed foreign earnings is payable in annual installments through 2026. See Note 6 “Income Taxes” to our consolidated financial statements. |
| (2) | We estimate our future obligations for interest on our floating rate 2014 Credit Facilitylong-term incentive plan payouts by assuming the weighted averageclosing price per share of our common stock at December 31, 2019 remains constant into the future. This is an estimate as actual prices will vary over time. |
| (3) | Our future obligations related to the 2017 Credit Facility consist of principal, interest ratesand fees for the unused balance. We assume the floating interest rate in effect on each floating rate debt obligation at December 31, 20162019 will remain constant into the future. This is an estimate, as actual rates will vary over time. In addition, for the Revolving2017 Credit Facility, we assume that the balance outstanding and the unused balance as of December 31, 2016 remains2019 remain the same forthrough the remaining term of the agreement. The actual balance outstandingrespective balances under our Revolving2017 Credit Facility may fluctuate significantly in future periods depending on the availabilitybusiness decisions of cash flow from operations and future investing and financing considerations.management. |
(2)(4) | We estimate our future obligations for long-term incentive plan payouts by assumingDuring the price per share of our common stock in effect atyear ended December 31, 2016 remains constant2019, we entered into agreements to purchase office space in Ukraine intended to support the future. This is an estimate, as actual prices will vary over time.global delivery centers in that country. See Note 14 “Commitments and Contingencies” in the notes to our consolidated financial statements in this Annual Report on Form 10-K. We also committed to purchasing certain software licenses. |
LetterAs of credit
At December 31, 2016,2019, we had an irrevocable standby letter$2.9 million of creditunrecognized tax benefits for which we are unable to make a reliable estimate of the eventual cash flows by period that may be required to settle these matters. In addition, we had recorded $10.5 million of contingent consideration liabilities as of December 31, 2019 related to the acquisitions of businesses that are not included in the amount $0.9 million undertable above due to the revolving credit facility, which is requireduncertainty involved with the potential payments.
See Note 14 “Commitments and Contingencies” in the notes to secure commitmentsour consolidated financial statements in this Annual Report on Form 10-K for certain insurance policies. The letter of credit expires on April 27, 2017 with a possibility of automatic extension for an additional period of one year from the present or any future expiration date. No amounts were outstanding against this letter of credit during the year ended December 31, 2016.2019 for information regarding contractual obligations.
Future Capital Requirements
We believe that our existing cash and cash equivalents combined with our expected cash flow from operations will be sufficient to meet our projected operating and capital expenditure requirements for at least the next twelve months and that we possess the financial flexibility to execute our strategic objectives, including the ability to make acquisitions and strategic investments in the foreseeable future. OurHowever, our ability to generate cash however, is subject to our performance, general economic conditions, industry trends and other factors. To the extent that existing cash and cash equivalents and operating cash flow are insufficient to fund our future activities and requirements, we may need to raise additional funds through public or private equity or debt financing. If we issue equity securities in order to raise additional funds, substantial dilution to existing stockholders may occur. If we raise cash through the issuance of additional indebtedness, we may be subject to additional contractual restrictions on our business. There is no assurance that we would be able to raise additional funds on favorable terms or at all.
Off-Balance Sheet Commitments and Arrangements
We do not have any material obligations under guarantee contracts or other contractual arrangements other than as disclosed in Note 1614 “Commitments and Contingencies” in the notes to our consolidated financial statements in this Annual Report on Form 10-K. We have not entered into any transactions with unconsolidated entities where we have financial guarantees, subordinated retained interests, derivative instruments, or other contingent arrangements that expose us to material continuing risks, contingent liabilities, or any other obligation under a variable interest in an unconsolidated entity that provides financing, liquidity, market risk, or credit risk support to us, or engages in leasing, hedging, or research and development services with us.
Item 7A. Quantitative and Qualitative Disclosures About Market Risk
We are exposed to certain market risks in the ordinary course of our business. These risks primarily result primarily from changes in concentration of credit risks, interest rates and foreign currency exchange rates and interest rates, and concentration of credit risks.rates. In addition, our international operations are subject to risks related to differing economic conditions, changes in political climate, differing tax structures, and other regulations and restrictions.
Concentration of Credit and Other Credit Risks
Financial instruments that potentially subject us to significant concentrations of credit risk consist primarily of cash, and cash equivalents and trade accounts receivable and unbilled revenues.receivables.
We maintain our cash, and cash equivalents and short-term investments with financial institutions. We believe that our credit policies reflect normal industry terms and business risk. We do not anticipate non-performance by the counterparties. We hold a significant balance ofhave cash in banks in countries such as Belarus, Russia, Ukraine, Kazakhstan, Armenia and Uzbekistan, where the CIS countries wherebanking sector remains subject to periodic instability, banking and other financial systems generally do not meet the banking standards of more developed markets, and bank deposits made by corporate entities in the CIS region are not insured. As of December 31, 2016, $194.62019, $206.5 million of total cash was heldkept in banks in CISthese countries, with $153.8of which $123.4 million of thatwas held in Belarus,Belarus. In this region, and $18.6 million in Russia. The CIS banking sector remains subject to periodic instability and the transparency of the banking sector lags behind international standards. Particularlyparticularly in Belarus, a banking crisis, bankruptcy or insolvency of banks that process or hold our funds, may result in the loss of our deposits or adversely affect our ability to complete banking transactions in the CIS region, which could materially adversely affect our business and financial condition. Cash in other CIS locationsthis region is used for short-term operational needs and cash balances in those banks move with the needs of thethose entities.
Trade accounts receivable and unbilled revenuesreceivables are generally dispersed across our clientsmany customers operating in proportion to their revenues. Asdifferent industries; therefore, concentration of credit risk is limited and we do not believe significant credit risks existed at December 31, 2016, unbilled trade receivables2019. Though our results of operations depend on our ability to successfully collect payment from twoour customers individually exceeded 10% and accounted for 22.2% of our total unbilled trade receivables. There were no customers individually exceeding 10% of our billed trade receivables as of December 31, 2016.
During the year ended December 31, 2016, our top five customers accounted for 28.2% of our total revenues, and our top ten customers accounted for 38.1% of our total revenues. During the year ended December 31, 2015, our top five customers accounted for 32.6% of our total revenues, and our top ten customers accounted for 43.8% of our total revenues.
During the years ended December 31, 2016 and 2015, the Company had one customer, UBS AG, which contributed revenues of $136.5 million and $129.8 million, respectively, which accounted for more than 10% of total revenues in the periods indicated.
Historically,work performed, historically, credit losses and write-offs of trade accounts receivable balancesreceivables have not been material to our consolidated financial statements.
Interest Rate Risk
Our exposure to market risk is mainly influenced by the changes in interest rates received on our cash and cash equivalent deposits and paid on any outstanding balance on our revolving credit facility,borrowings, mainly under our 2017 Credit Facility, which is subject to a variety of rates depending on the typecurrency and timing of funds borrowed.
As of December 31, 2016, we have borrowed under our revolving credit facility and have outstanding debt of $25.0 million. The interest rate for this debt is based on LIBOR, which resets regularly at issuance, based on lending terms. We do not believe we are exposed to material direct risks associated with changes in interest rates related to this borrowing.these deposits and borrowings.
We have not been exposed to material risks due to changes in market interest rates and we do not use derivative financial instruments to hedge our risk of interest rate volatility. However, our future interest expense may increase and interest income may fall due to changes in market interest rates.
Foreign Exchange Risk
Our global operations are conducted predominantly in U.S. dollars. Other than U.S. dollars, we generate a significant portion of our revenues principally in various currencies, principally, euros, British pounds, Swiss francs, Canadian dollars Swiss francs and Russian rubles andrubles. Other than U.S. dollars, we incur expenditures principally in Russian rubles, Hungarian forints, Russian rubles, Polish zlotys, British pounds, Swiss francs, British pounds,euros, Indian rupees and ChinaChinese yuan renminbi. As a result, currency fluctuations, specifically the depreciation of the euro, British pound, and Canadian dollar and the appreciation of Russian rubles, Hungarian forints, Polish zlotys, Indian rupees and Chinese yuan renminbi (“CNY”) associated with our delivery centers.
Our international operations expose usrelative to foreign currency exchange rate changes that could impact translations of foreign denominated assets and liabilities into U.S. dollars and future earnings and cash flows from transactions denominated in different currencies. We are exposed to fluctuations in foreign currency exchange rates primarily on accounts receivable and unbilled revenues from sales in these foreign currencies and cash outflows for expenditures in foreign currencies. Our results of operations, primarily revenues and expenses denominated in foreign currencies, can be affected if any of the currencies, which we use materially in our business, appreciate or depreciate against the U.S. dollar. Additionally, to the extent that we need to convert U.S. dollars into foreign currencies for our operations, appreciation of such foreign currencies against the U.S. dollar, would adversely affect the amountcould negatively impact our results of such foreign currencies we receive from the conversion.operations.
During the year ended December 31, 2016,2019, our foreign exchange losses increased $7.5 million to $12.1loss was $12.0 million compared to a $4.6$0.5 million lossgain reported in the corresponding period last year. The increase in the reported loss in fiscal 2016 was primarily driven by unfavorable movements of the British pound. For the year ended December 31, 2016, the British pound fell 16.3% relative to the U.S. dollar with significant depreciation following the June 2016 referendum, in which voters in the United Kingdom approved an exit from the European Union. The depreciation of the British pound adversely affected the value of our monetary assets denominated in British pounds, as well as the U.S. dollar-equivalent of the British pound-denominated revenues. During the year ended December 31, 2016,2019, approximately 36%32.3% of consolidated revenues and 40%40.5% of operating expenses were denominated in currencies other than the U.S. dollar.
During 2018, we implemented a hedging program through which we entered into a series of foreign exchange forward contracts that are designated as cash flow hedges of forecasted Russian ruble, Indian rupee and Polish zloty transactions. We are monitoring the developments relatingentered into these foreign exchange contracts to Brexit as we havehedge a significantportion of our forecasted foreign currency denominated operating presenceexpenses in the U.K.normal course of business and collect revenues and incur expensesaccordingly, they are not speculative in currencies that may be affected.nature. As of December 31, 2019, the net unrealized gain from these hedges was $1,667.
Management supplements results reported in accordance with United States generally accepted accounting principles, referred to as GAAP, with non-GAAP financial measures. Management believes these measures help illustrate underlying trends in our business and uses the measures to establish budgets and operational goals, communicated internally and externally, for managing our business and evaluating its performance. When important to management’s analysis, operating results are compared on the basis of “constant currency”, which is a non-GAAP financial measure. This measure excludes the effect of foreign currency exchange rate fluctuations by translating the current period revenues and expenses into U.S. dollars at the weighted average exchange rates of the prior period of comparison.
During the year ended December 31, 2016,2019, we reported revenue growth of 26.9%24.5%. Had our consolidated revenues been expressed in constant currency terms using the exchange rates in effect during fiscal 2015,2018, we would have reported revenue growth of 29.4%25.8%. The decrease inDuring 2019, revenues expressed in constant currency terms was primarily related tohave been negatively impacted by the depreciation of the euro and the British pound relative to the U.S. dollar. During the year ended December 31, 2016, foreign currency fluctuation did not have a significant impact on2019, we reported net income growth of 8.7% over the previous year. Had our net incomeconsolidated results been expressed in constant currency terms asusing the exchange rates in effect during 2018, we continuewould have reported net income growth of 7.3%. Net income has been positively impacted by the depreciation of the Hungarian forint, Polish zloty and Russian ruble relative to be naturally diversified across locationsthe U.S. dollar, partially offset by the depreciation of the euro and currencies in which we operate.British pound relative to the U.S. dollar.
Item 8. Financial Statements and Supplementary Data
The information required is included in this Annual Report on Form 10-K beginning on page F-1.
Item 9. Changes In and Disagreements with Accountants on Accounting and Financial Disclosure
None.
Item 9A. Controls and Procedures
Conclusion Regarding the Effectiveness of Disclosure Controls and Procedures
Based on management’s evaluation, with the participation of our Chief Executive Officer (CEO) and Chief Financial Officer, (CFO), as of the end of the period covered by this report, our CEO and CFOthese officers have concluded that our disclosure controls and procedures, (asas defined in Rules 13a-15(e) and 15d-15(e) under the Securities Exchange Act of 1934, as amended (the Exchange Act)“Exchange Act”), are effective to provide reasonable assurance that information required to be disclosed by us in reports that we file or submit under the Exchange Act is recorded, processed, summarized and reported within the time periods specified in SEC rules and forms, and is accumulated and communicated to management, including our principal executive officer and principal financial officer, as appropriate, to allow timely decisions regarding required disclosure.
Changes in Internal Control Over Financial Reporting
There were no changes in our internal control over financial reporting during the quarter ended December 31, 20162019 that have materially affected, or are reasonably likely to materially affect, our internal control over financial reporting.reporting, except as described below.
Beginning January 1, 2019, we adopted the new lease standard and implemented significant new lease accounting systems, processes and internal controls over lease accounting to assist us in the application of the new lease standard.
During the year ended December 31, 2019, the Company acquired test IO together with its subsidiary and made certain other business acquisitions, as described more fully in Note 2 in the notes to our consolidated financial statements in this Annual Report on Form 10-K. As permitted by the Securities and Exchange Commission, management has elected to exclude these acquired entities from its assessment of the effectiveness of its internal controls over financial reporting as of December 31, 2019. The Company began to integrate these acquired companies into its internal control over financial reporting structure subsequent to their respective acquisition dates and expects to complete these integrations in 2020.
Management’s Report on Internal Control Over Financial Reporting
Our management is responsible for establishing and maintaining adequate internal control over financial reporting as defined in Rules 13a-15(f) and 15d-15(f) under the Exchange Act to provide reasonable assurance regarding the reliability of financial reporting and the preparation of financial statements for external purposes in accordance with U.S. generally accepted accounting principles.
Under the supervision and with the participation of our management, including our principal executive officer and principal financial officer, we conducted an evaluation of the effectiveness of our internal control over financial reporting based on the criteria established in Internal Control — Integrated Framework (2013) issued by the Committee of Sponsoring Organizations of the Treadway Commission.
Based on this assessment, management concluded that our internal control over financial reporting was effective as of December 31, 20162019 to provide reasonable assurance regarding the reliability of financial reporting and the preparation of financial statements for external purposes in accordance with U.S. generally accepted accounting principles.
Management has excluded test IO together with its subsidiary and other acquired businesses from our assessment of the effectiveness of our internal control over financial reporting as of December 31, 2019 since these entities were acquired in business combinations in 2019. These businesses are included in our 2019 consolidated financial statements and constituted 3.0% of total assets as of December 31, 2019 and 1.0% of revenues for the year then ended.
The effectiveness of our internal control over financial reporting as of December 31, 20162019 has been audited by Deloitte & Touche LLP, an independent registered public accounting firm, as stated in their report, which appears in Part“Part IV. Item 15 Exhibits, Financial Statement Schedule” of this Annual Report on Form 10-K.
Inherent Limitations on Effectiveness of Controls
Our management, including the CEO and CFO, does not expect that our disclosure controls or our internal control over financial reporting will prevent or detect all errors and all fraud. A control system, no matter how well designed and operated, can provide only reasonable, not absolute, assurance that the control system’s objectives will be met. The design of a control system must reflect the fact that there are resource constraints, and the benefits of controls must be considered relative to their costs. Further, because of the inherent limitations in all control systems, no evaluation of controls can provide absolute assurance that misstatements due to error or fraud will not occur or that all control issues and instances of fraud, if any, have been detected. The design of any system of controls is based in part on certain assumptions about the likelihood of future events, and there can be no assurance that any design will succeed in achieving its stated goals under all potential future conditions. Projections of any evaluation of the effectiveness of controls to future periods are subject to risks. Over time, controls may become inadequate because of changes in conditions or deterioration in the degree of compliance with policies or procedures.
Item 9B. Other Information
The information provided in “Part III, Item 11. Executive Compensation” relating to Anthony Conte’s, the Company’s Senior Vice President, Chief Financial Officer and Treasurer, transition agreement with us is incorporated herein by reference.None.
PART III
Item 10. Directors, Executive Officers and Corporate Governance
We incorporate by reference the information required by this Item from the information set forth under the captions “Board of Directors”, “Corporate Governance”, and “Our Executive Officers”, and “Section 16(a) Beneficial Ownership Reporting Compliance” in our definitive proxy statement for our 20172020 annual meeting of stockholders, to be filed within 120 days after the end of the year covered by this Annual Report on Form 10-K, pursuant to Regulation 14A under the Securities Exchange Act of 1934, as amended ( our “2017(our “2020 Proxy Statement”).
Item 11. Executive Compensation
We incorporate by reference the information required by this Item from the information set forth under the captions “Executive Compensation” and “Compensation Committee Interlocks and Insider Participation” in our 20172020 Proxy Statement.
The following information is being provided instead of reporting the information under Item 5.02 of a Current Report on Form 8-K:
On November 2, 2016, Anthony Conte indicated that he intends to resign as the Company’s Senior Vice President, Chief Financial Officer and Treasurer, effective in the third quarter of 2017, or at such earlier date determined by the Board, following the appointment of his successor. As part of facilitating a smooth transition, we have entered into a transition agreement with Mr. Conte, dated as of February 23, 2017 (the “Transition Agreement”), which provides for the following terms. Mr. Conte will continue to serve as CFO until August 10, 2017, or an earlier date the Board selects upon identifying his successor. We will continue to provide Mr. Conte his base salary and continued health benefits, each at its current level, until August 10, 2017, unless he voluntarily terminates his employment. Mr. Conte will receive his 2016 annual bonus on the same terms as other executives, and if Mr. Conte remains employed through August 10, 2017, we will pay him a bonus for the 2017 partial year of $125,000. In the event Mr. Conte voluntarily terminates his employment prior to August 10, 2017, he will receive a pro-rated bonus for 2017. Mr. Conte has not and will not receive equity grants in 2017. Upon his departure on August 10, 2017, Mr. Conte’s outstanding, unvested options and restricted stock units that would have vested prior to March 31, 2018, will vest. If Mr. Conte’s employment terminates due to his death or disability, he will receive all of the benefits described above as if he had remained employed until August 10, 2017. In order to receive the benefits described above, Mr. Conte will execute a standard release of claims. The Transition Agreement provides for standard restrictive covenants, including a non-competition clause for one year.
The foregoing description of the Transition Agreement does not purport to be a complete description of the parties’ rights and obligations under the Transition Agreement and the other documents and transactions contemplated by the Transition Agreement. As such, the foregoing description is qualified in its entirety by reference to the complete text of the Transition Agreement, a copy of which is filed as an exhibit to this Annual Report on Form 10-K as Exhibit 10.30 and is incorporated by reference herein.
Item 12. Security Ownership of Certain Beneficial Owners and Management and Related Stockholder Matters
We incorporate by reference the information required by this Item from the information set forth under the caption “Security Ownership of Certain Beneficial Owners and Management” in our 20172020 Proxy Statement.
Equity Compensation Plan Information
The following table sets forth information about awards outstanding as of December 31, 20162019 and securities remaining available for issuance under our 2015 Long-Term Incentive Plan (the “2015 Plan”), our 2012 Long-Term Incentive Plan (the “2012 Plan”), the Amended and Restated 2006 Stock Option Plan (the “2006 Plan”) and the 2012 Non-Employee Directors Compensation Plan (the “2012 Directors Plan”) as of December 31, 2016.
2019. | | | Plan Category | | Number of securities to be issued upon exercise of outstanding options, warrants and rights | | Weighted average exercise price of outstanding options, warrants and rights | | Number of securities remaining available for future issuance under equity compensation plans (excluding securities reflected in column (a)) | | Number of securities to be issued upon exercise of outstanding options, warrants and rights | | Weighted average exercise price of outstanding options, warrants and rights | | Number of securities remaining available for future issuance under equity compensation plans (excluding securities reflected in column (a)) |
Equity compensation plans approved by security holders: (1) | | | | | | 6,750,537 |
| | (4) | | | | | | | | 5,498,195 |
| | (2) |
| Stock options | | 6,637,239 |
| | (2) | | $ | 37.20 |
| | (3) | | — |
| | (5) | | 3,322,930 |
| | (3) | | $ | 50.85 |
| | (4) | | — |
| | — |
| Restricted stock unit and restricted stock awards | | 489,855 |
| | $ | — |
| | (5) | | — |
| | (5) | | 759,182 |
| | (5) | | $ | — |
| | — | | — |
| | — |
| Equity compensation plans not approved by security holders | | — |
| | | | $ | — |
| | | | — |
| | | | — |
| | $ | — |
| | — |
| |
| Total | | 7,127,094 |
| | | | $ | 37.20 |
| | | | 6,750,537 |
| | | | 4,082,112 |
| | | $ | 50.85 |
| | 5,498,195 |
| |
|
| |
| | |
| (1) | This table includes the following stockholder approved plans: the 2015 Plan, 2012 Plan, the 2006 Plan and the 2012 Directors Plan. |
| (2) | Represents the number of shares available for future issuances under our stockholder approved equity compensation plans and is comprised of 4,969,754 shares available for future issuance under the 2015 Plan and 528,441 shares available for future issuances under the 2012 Directors Plan. |
| (3) | Represents the number of underlying shares of common stock associated with outstanding options under our stockholder approved plans and is comprised of 414,235677,915 shares underlying options granted under our 2015 Plan; 5,539,4602,489,500 shares underlying options granted under our 2012 Plan; and 683,544155,515 shares underlying options granted under our 2006 Plan. |
(3)(4) | Represents the weighted-average exercise price of stock options outstanding under the 2015 Plan, the 2012 Plan and the 2006 Plan. |
(4)(5) | Represents the number of underlying shares available for future issuancesof common stock associated with outstanding restricted stock units and restricted stock awards under our stockholder approved equity compensation plans and is comprised of 6,202,977753,604 shares available for future issuanceunderlying restricted stock units granted under theour 2015 PlanPlan; 0 shares underlying restricted stock units granted under our 2012 Plan; and 547,5605,578 shares available for future issuancesunderlying restricted stock units granted under theour 2012 Directors Plan. |
(5) | Not applicable. |
Item 13. Certain Relationships and Related Transactions, and Director Independence
We incorporate by reference the information required by this Item from the information set forth under the caption “Certain Relationships and Related Transactions and Director Independence” in our 20172020 Proxy Statement.
Item 14. Principal Accountant Fees and Services
We incorporate by reference the information required by this Item from the information set forth under the caption “Independent Registered Public Accounting Firm” in our 20172020 Proxy Statement.
PART IV
Item 15. Exhibits, Financial Statement Schedules
(a)We have filed the following documents as part of this annual report:
1.Audited Consolidated Financial Statements
|
| |
| | Page |
| Index to Consolidated Financial Statements | F-1 |
| Report of Independent Registered Public Accounting Firm | F-2 |
Consolidated Balance Sheets as of December 31, 20162019 and 20152018 | F-4 |
Consolidated Statements of Income and Comprehensive Income for the Years Ended December 31, 2016, 20152019, 2018 and 20142017 | F-5 |
Consolidated Statements of Changes in Stockholders’ Equity for the Years Ended December 31, 2016, 20152019, 2018 and 20142017 | F-6 |
Consolidated Statements of Cash Flows for the Years Ended December 31, 2016, 20152019, 2018 and 20142017 | F-8 |
Notes to Consolidated Financial Statements for the Years Ended December 31, 2016, 20152019, 2018 and 20142017 | F-10 |
2.Financial Statement Schedules
Schedule II Valuation and Qualifying Accounts is filed as part of this Annual Report on Form 10-K and should be read in conjunction with our audited consolidated financial statements and the related notes.
3.Exhibits
A list of exhibits required to be filed as part of this Annual Report on Form 10-K is set forth in the Exhibit Index.below:
|
| | |
Exhibit Number | | Description |
| | |
| 3.1 | | |
| 3.2 | | |
| 4.1 | | |
4.24.4* | | Amended and Restated Registration Rights Agreement dated February 19, 2008 (incorporated herein by reference to Exhibit 4.2 to Form S-1, SEC File No. 333-174827, filed June 10, 2011 (the “Registration Statement”)) |
4.3 | | Registration Rights Agreement dated April 26, 2010 (incorporated herein by reference to Exhibit 4.3 to |
| 10.1† | | |
| 10.2† | | |
| 10.3† | | |
| 10.4† | | |
| 10.5† | | |
| 10.6† | | |
| 10.7† | | |
| 10.8† | | |
|
| | |
| 10.9† | | |
| 10.10† | | |
| 10.11† | | |
10.12†* | | |
10.13†* | | |
10.14†* | | |
10.15†* | | |
| 10.16† | | |
| 10.17† | | |
| 10.18† | | Amended and Restated Non-Employee Director Compensation Policy (incorporated herein by reference to Exhibit 10.4 to the Q1 2015 Form 10-Q) |
|
| | |
10.19† | | Form of Director Offer Letter (incorporated herein by reference to Exhibit 10.18 to Amendment No. 6) |
10.20†10.19† | | |
10.21†10.20† | | Offer Letter by and between Ginger Mosier and EPAM Systems, Inc. dated February 24, 2010 (incorporated herein by reference to Exhibit 10.20 to Amendment No. 6) |
10.22† | | |
10.23†10.21† | | |
10.24†10.22† | | Consultancy Agreement by and between Landmark Business Development Limited, Karl Robb and EPAM Systems, Inc. dated January 20, 2006 (expired except with respect to Section 8) (incorporated herein by reference to Exhibit 10.23 to Amendment No. 6) |
10.25† | | |
10.26†10.23† | | |
10.2710.24† | | |
| 10.25† | | |
| 10.26† | | |
| 10.27† | | |
| 10.28† | | |
| 10.29† | | |
| 10.30† | | |
| 10.31† | | |
| 10.32 | | Credit Agreement dated as of September 12, 2014May 24, 2017 by and among EPAM Systems, Inc. (as borrower), the lenders and guarantors party thereto, and PNC Bank, National Association, as Administrative Agent (incorporated hereby by reference to Exhibit 10.1 to the Company’s Current Report on Form 8-K filed September 9, 2014,on May 26, 2017, SEC File No. 001-35418) |
10.28†*10.33 | |
reference to Exhibit 10.33 to the 2018 10-K)
|
10.29†*10.34* | | Amended Non-Employee Director Compensation Policy |
10.30†* | | Transition |
| 21.1* | | |
|
| | |
| 23.1* | | |
| 31.1* | | |
| 31.2* | | |
| 32.1* | | |
| 32.2* | | |
101.INS**101.INS | | XBRL Instance Document - the instance document does not appear in the Interactive Data File because its XBRL tags are embedded within the Inline XBRL document |
101.SCH**101.SCH | | Inline XBRL Taxonomy Extension Schema Document |
101.CAL**101.CAL | | Inline XBRL Taxonomy Extension Calculation Linkbase Document |
101.DEF**101.DEF | | Inline XBRL Taxonomy Extension Definition Linkbase Document |
101.LAB**101.LAB | | Inline XBRL Taxonomy Extension Label Linkbase Document |
101.PRE**101.PRE | | Inline XBRL Taxonomy Extension Presentation Linkbase Document |
| 104 | | Cover Page Interactive Data File - (formatted as Inline XBRL and contained in Exhibit 101) |
| | | |
| † | | Indicates management contracts or compensatory plans or arrangements |
| * | | Exhibits filed herewith |
** | | As provided in Rule 406T of Regulation S-T, this information is furnished and not filed for purposes of Section 11 and 12 of the Securities Act of 1933, as amended, and Section 18 of the Securities Exchange Act of 1934, as amended. |
Item 16. Form 10-K Summary
None.
SIGNATURES
Pursuant to the requirements of Section 13 or 15(d) of the Securities Exchange Act of 1934, the registrant has duly caused this report to be signed on its behalf by the undersigned thereunto duly authorized.
Date: February 28, 20172020
|
| | |
| | EPAM SYSTEMS, INC. |
| | | |
| | By: | /s/ Arkadiy Dobkin |
| | | Name: Arkadiy Dobkin |
| | | Title: Chairman, Chief Executive Officer and President (principal executive officer) |
Pursuant to the requirements of the Securities Exchange Act of 1934, this report has been signed below by the following persons on behalf of the registrant and in the capacities and on the dates indicated.
|
| | | | |
| Signature | | Title | | Date |
| | | | | |
| /s/ Arkadiy Dobkin | | Chairman, Chief Executive Officer and President (principal executive officer) | | February 28, 2017 2020 |
| Arkadiy Dobkin |
| | | | | |
/s/ Anthony J. ConteJason Peterson | | Senior Vice President, Chief Financial Officer and Treasurer (principal financial officer and officer) | | February 28, 2020 |
| Jason Peterson |
| | | | |
| /s/ Gary Abrahams | | Vice President, Corporate Controller, Chief Accounting Officer (principal accounting officer) | | February 28, 2017 2020 |
Anthony J. ConteGary Abrahams | |
| | | | |
| /s/ Eugene Roman | | Director | | February 28, 2020 |
| Eugene Roman | |
| | | | |
| /s/ Helen Shan | | Director | | February 28, 2020 |
| Helen Shan | |
| | | | | |
| /s/ Jill B. Smart | | Director | | February 28, 2017 2020 |
| Jill B. Smart |
| |
| | | | | |
| /s/ Karl Robb | | Director | | February 28, 2017 2020 |
| Karl Robb |
| |
| | | | |
/s/ Peter Kuerpick | | Director | | February 28, 2017
|
Peter Kuerpick |
| |
| | | | | |
| /s/ Richard Michael Mayoras | | Director | | February 28, 2017 2020 |
| Richard Michael Mayoras |
| |
| | | | | |
| /s/ Robert E. Segert | | Director | | February 28, 2017 2020 |
| Robert E. Segert |
| |
| | | | | |
| /s/ Ronald P. Vargo | | Director | | February 28, 2017 2020 |
| Ronald P. Vargo |
| |
EPAM SYSTEMS, INC.
FORM 10-K
FOR THE YEAR ENDED DECEMBER 31, 20162019
TABLE OF CONTENTS
INDEX TO CONSOLIDATED FINANCIAL STATEMENTS
|
| |
| | Page |
| Audited Consolidated Financial Statements | |
| |
| |
| |
| |
| |
| |
| |
| | |
Financial StatementsStatement Schedule: | |
| |
REPORT OF INDEPENDENT REGISTERED PUBLIC ACCOUNTING FIRM
To the Stockholders and the Board of Directors and Stockholders of EPAM Systems, Inc.
Opinion on the Financial Statements
We have audited the accompanying consolidated balance sheets of EPAM Systems, Inc. and subsidiaries (the "Company"“Company”) as of December 31, 20162019 and 2015, and2018, the related consolidated statements of income and comprehensive income, stockholders'changes in stockholders’ equity, and cash flows, for each of the three years in the period ended December 31, 2016. Our audits also included2019, and the financial statementrelated notes and the schedule listed in the Index at Item 15. These financial statements and financial statement schedule are15 (collectively referred to as the responsibility of the Company's management. Our responsibility is to express an“financial statements”). In our opinion, on the financial statements present fairly, in all material respects, the financial position of the Company as of December 31, 2019 and financial statement schedules based on our audits.2018, and the results of its operations and its cash flows for each of the three years in the period ended December 31, 2019, in conformity with accounting principles generally accepted in the United States of America.
We conducted our auditshave also audited, in accordance with the standards of the Public Company Accounting Oversight Board (United States) (PCAOB), the Company's internal control over financial reporting as of December 31, 2019, based on criteria established in Internal Control - Integrated Framework (2013) issued by the Committee of Sponsoring Organizations of the Treadway Commission and our report dated February 28, 2020, expressed an unqualified opinionon the Company's internal control over financial reporting.
Change in Accounting Principle
As discussed in Note 1 to the financial statements, effective January 1, 2019, the Company adopted FASB Accounting Standards Update (“ASU”) 2016-02, Leases (Topic 842). The adoption of FASB ASU 2016-02 is also communicated as a critical audit matter below.
Basis for Opinion
These financial statements are the responsibility of the Company’s management. Our responsibility is to express an opinion on the Company’s financial statements based on our audits. We are a public accounting firm registered with the PCAOB and are required to be independent with respect to the Company in accordance with the U.S. federal securities laws and the applicable rules and regulations of the Securities and Exchange Commission and the PCAOB.
We conducted our audits in accordance with the standards of the PCAOB. Those standards require that we plan and perform the audit to obtain reasonable assurance about whether the financial statements are free of material misstatement. An audit includesmisstatement, whether due to error or fraud. Our audits included performing procedures to assess the risks of material misstatement of the financial statements, whether due to error or fraud, and performing procedures that respond to those risks. Such procedures included examining, on a test basis, evidence supportingregarding the amounts and disclosures in the financial statements. An auditOur audits also includes assessingincluded evaluating the accounting principles used and significant estimates made by management, as well as evaluating the overall presentation of the financial statement presentation.statements. We believe that our audits provide a reasonable basis for our opinion.
Critical Audit Matters
The critical audit matters communicated below are matters arising from the current-period audit of the financial statements that were communicated or required to be communicated to the audit committee and that (1) relate to accounts or disclosures that are material to the financial statements and (2) involved our especially challenging, subjective, or complex judgments. The communication of critical audit matters does not alter in any way our opinion on the financial statements, taken as a whole, and we are not, by communicating the critical audit matters below, providing separate opinions on the critical audit matters or on the accounts or disclosures to which they relate.
Leases - Incremental Borrowing Rates - Refer to Notes 1 and 7 to the financial statements (also see adoption of FASB ASU 2016-02, Leases (Topic 842), explanatory paragraph above)
Critical Audit Matter Description
Effective January 1, 2019, the Company adopted FASB ASU 2016-02, Leases (Topic 842), which required the Company to recognize all leases, with the exception of leases with a term of twelve months or less, on the balance sheet as right-of-use assets (“RoU Assets”) and lease liabilities. Lease liabilities are initially measured by the Company at the present value of lease payments not yet paid, which is determined by applying the incremental borrowing rate of the lessee. The Company determines the incremental borrowing rate of the lessee on a lease-by-lease basis by developing an estimated centralized U.S. dollar borrowing rate for a fully collateralized obligation with a term similar to the lease term and adjusts the rate to reflect the incremental risk associated with the foreign currencies in which the lease is denominated.
The Company’s estimate of the lessee’s incremental borrowing rate was developed using significant observable and unobservable inputs such as recovery rates, U.S. risk-free rates, foreign currency/country base rate yields, and a synthetic corporate credit rating of the Company developed using regression analysis that involved considerable judgment by management.
We identified the incremental borrowing rates as a critical audit matter because of the complex models and unobservable inputs management employs to estimate the incremental borrowing rates used to measure its lease liabilities and RoU Assets and the quantitative significance of the RoU Assets and lease liabilities recognized by the Company upon adoption of the new guidance. Performing audit procedures to evaluate the appropriateness of these models and inputs required a high degree of auditor judgment and an increased extent of audit effort, including the need to involve our fair value specialists who possess significant quantitative and modeling expertise.
How the Critical Audit Matter Was Addressed in the Audit
Our audit procedures related to the complex models and unobservable inputs used by management to estimate the incremental borrowing rates included the following, among others:
We tested the effectiveness of management’s controls over the selection of the incremental borrowing rates.
With the assistance of our fair value specialists, we evaluated the reasonableness of (1) the methodology used to estimate the incremental borrowing rates, (2) the significant inputs to the incremental borrowing rates, (3) the source information underlying the significant inputs, and (4) the mathematical accuracy of the incremental borrowing rates model. Our procedures included (1) testing the source information underlying the determination of the incremental borrowing rates and the mathematical accuracy of the calculations, and (2) developing a range of independent estimates and comparing our estimates to the incremental borrowing rates selected by management.
Revenues - Refer to Notes 1 and 9 to the financial statements
Critical Audit Matter Description
The Company recognizes revenues when control of goods or services is passed to a customer in an amount that reflects the consideration the Company expects to be entitled to in exchange for those goods or services. Such control may be transferred over time or at a point in time depending on satisfaction of obligations stipulated by the contract. Total revenues were $2,294 million for the year ended December 31, 2019.
In our opinion,2019, the Company recognized revenue related to contracts with over 1,500 customers, with no single customer accounting for more than 10% of revenues. Although some of these revenues are recognized under long-term agreements of more than one year, others are negotiated on an annual basis or shorter. Given the number of customers and the nature of the different customer agreements, auditing revenue was challenging due to the extent of audit effort required to evaluate whether revenue was recorded in accordance with the terms of the contracts with the Company’s customers.
How the Critical Audit Matter Was Addressed in the Audit
Our audit procedures related to whether revenue was recorded in accordance with the terms of the contracts with the Company’s customers included the following, among others:
We tested the effectiveness of controls over revenue, including management’s controls over (1) the determination of whether an arrangement with a customer meets the criteria to be considered a contract under ASC 606 and (2) the inputs used in and the mathematical accuracy of the contract revenue calculations and the terms of the related customer contracts.
We selected a sample of recorded revenue transactions and (1) recalculated the amount using the terms of the customer contract and (2) tested whether the underlying arrangement with the customer met the criteria to be considered a contract under ASC 606 as of the date the revenue was recorded.
We selected a sample of hours charged by the Company’s employees in the Company’s internal time tracking system, obtained support for whether such consolidatedhours represented services provided to a customer, and tested whether the hours had been properly evaluated for inclusion in the Company’s revenue calculations.
/s/ DELOITTE & TOUCHE LLP
Philadelphia, Pennsylvania
February 28, 2020
We have served as the Company’s auditor since 2006.
REPORT OF INDEPENDENT REGISTERED PUBLIC ACCOUNTING FIRM
To the Stockholders and Board of Directors of EPAM Systems, Inc.
Opinion on Internal Control over Financial Reporting
We have audited the internal control over financial statements present fairly, in all material respects, the financial positionreporting of EPAM Systems, Inc. and subsidiaries (the “Company”) as of December 31, 2016 and 2015, and2019, based on criteria established in Internal Control - Integrated Framework (2013) issued by the resultsCommittee of their operations and their cash flows for eachSponsoring Organizations of the three years in the period ended December 31, 2016, in conformity with accounting principles generally accepted in the United States of America. Also, inTreadway Commission (COSO). In our opinion, such financial statement schedule, when considered in relation to the basic consolidated financial statements and financial statement schedule taken as a whole, present fairly,Company maintained, in all material respects, the information set forth therein.effective internal control over financial reporting as of December 31, 2019, based on criteria established in Internal Control - Integrated Framework (2013) issued by COSO.
We have also audited, in accordance with the standards of the Public Company Accounting Oversight Board (United States) (PCAOB), the Company's internal control overconsolidated financial reportingstatements and financial statement schedule as of and for the year ended December 31, 2016, based on the criteria established in Internal Control - Integrated Framework (2013) issued by the Committee of Sponsoring Organizations2019, of the Treadway CommissionCompany and our report dated February 28, 20172020, expressed an unqualified opinion on those financial statements and financial statement schedule and included an explanatory paragraph regarding the Company's internal control over financial reporting.Company’s adoption of FASB Accounting Standards Update No. 2016-02, Leases (Topic 842).
/s/ DELOITTE & TOUCHE LLP
Philadelphia, Pennsylvania
February 28, 2017
REPORT OF INDEPENDENT REGISTERED PUBLIC ACCOUNTING FIRM
To the Board of Directors and Stockholders of EPAM Systems, Inc.
We have auditedAs described in Management’s Report on Internal Control Over Financial Reporting, management excluded from its assessment the internal control over financial reporting at test IO, together with its subsidiary, and other acquired businesses as described more fully in Note 2 to the consolidated financial statements, which were acquired during the year ended December 31, 2019, and whose financial statements constitute 3.0% of EPAM Systems, Inc.total assets and subsidiaries (the "Company")1.0% of revenues of the consolidated financial statement amounts as of and for the year ended December 31, 2016, based on criteria established2019. Accordingly, our audit did not include the internal control over financial reporting at test IO, together with its subsidiary, and the other acquired businesses as described more fully in Internal Control - Integrated Framework (2013) issued byNote 2 to the Committee of Sponsoring Organizations of the Treadway Commission. consolidated financial statements.
Basis for Opinion
The Company'sCompany’s management is responsible for maintaining effective internal control over financial reporting and for its assessment of the effectiveness of internal control over financial reporting, included in the accompanying Management’s Report on Internal Control Over Financial Reporting.Reporting. Our responsibility is to express an opinion on the Company'sCompany’s internal control over financial reporting based on our audit.
We are a public accounting firm registered with the PCAOB and are required to be independent with respect to the Company in accordance with the U.S. federal securities laws and the applicable rules and regulations of the Securities and Exchange Commission and the PCAOB.
We conducted our audit in accordance with the standards of the Public Company Accounting Oversight Board (United States).PCAOB. Those standards require that we plan and perform the audit to obtain reasonable assurance about whether effective internal control over financial reporting was maintained in all material respects. Our audit included obtaining an understanding of internal control over financial reporting, assessing the risk that a material weakness exists, testing and evaluating the design and operating effectiveness of internal control based on the assessed risk, and performing such other procedures as we considered necessary in the circumstances. We believe that our audit provides a reasonable basis for our opinion.
Definition and Limitations of Internal Control over Financial Reporting
A company'scompany’s internal control over financial reporting is a process designed by, or under the supervision of, the company's principal executive and principal financial officers, or persons performing similar functions, and effected by the company's board of directors, management, and other personnel to provide reasonable assurance regarding the reliability of financial reporting and the preparation of financial statements for external purposes in accordance with generally accepted accounting principles. A company'scompany’s internal control over financial reporting includes those policies and procedures that (1) pertain to the maintenance of records that, in reasonable detail, accurately and fairly reflect the transactions and dispositions of the assets of the company; (2) provide reasonable assurance that transactions are recorded as necessary to permit preparation of financial statements in accordance with generally accepted accounting principles, and that receipts and expenditures of the company are being made only in accordance with authorizations of management and directors of the company; and (3) provide reasonable assurance regarding prevention or timely detection of unauthorized acquisition, use, or disposition of the company'scompany’s assets that could have a material effect on the financial statements.
Because of theits inherent limitations, of internal control over financial reporting including the possibility of collusion or improper management override of controls, material misstatements due to error or fraud may not be preventedprevent or detected on a timely basis.detect misstatements. Also, projections of any evaluation of the effectiveness of the internal control over financial reporting to future periods are subject to the risk that the controls may become inadequate because of changes in conditions, or that the degree of compliance with the policies or procedures may deteriorate.
In our opinion, the Company maintained, in all material respects, effective internal control over financial reporting as of December 31, 2016, based on the criteria established in Internal Control - Integrated Framework (2013) issued by the Committee of Sponsoring Organizations of the Treadway Commission.
We have also audited, in accordance with the standards of the Public Company Accounting Oversight Board (United States), the consolidated financial statements and financial statement schedule as of and for the year ended December 31, 2016 of the Company and our report dated February 28, 2017 expressed an unqualified opinion on those financial statements and financial statement schedule.
/s/ DELOITTE & TOUCHE LLP
Philadelphia, Pennsylvania
February 28, 2017
2020
EPAM SYSTEMS, INC. AND SUBSIDIARIES
CONSOLIDATED BALANCE SHEETS
(US Dollars inIn thousands, except share and per share data)
| | | | As of
December 31,
2016 | | As of
December 31,
2015 | As of
December 31,
2019 | | As of
December 31,
2018 |
| Assets | | | | | | |
| Current assets | | | | | | |
| Cash and cash equivalents | $ | 362,025 |
| | $ | 199,449 |
| $ | 936,552 |
| | $ | 770,560 |
|
| Restricted cash | 2,400 |
| | — |
| |
| Time deposits | 403 |
| | 30,181 |
| |
| Accounts receivable, net of allowance of $1,434 and $1,729, respectively | 199,982 |
| | 174,617 |
| |
| Unbilled revenues | 63,325 |
| | 95,808 |
| |
| Prepaid and other assets, net of allowance of $644 and $0, respectively | 15,690 |
| | 14,344 |
| |
| Employee loans, net of allowance of $0 and $0, respectively | 2,726 |
| | 2,689 |
| |
| Deferred tax assets | — |
| | 11,847 |
| |
| Trade receivables and contract assets, net of allowance of $2,920 and $1,557, respectively | | 497,716 |
| | 402,337 |
|
| Prepaid and other current assets | | 39,943 |
| | 26,171 |
|
| Total current assets | 646,551 |
| | 528,935 |
| 1,474,211 |
| | 1,199,068 |
|
| Property and equipment, net | 73,616 |
| | 60,499 |
| 165,259 |
| | 102,646 |
|
| Restricted cash | 239 |
| | 238 |
| |
| Employee loans, net of allowance of $0 and $0, respectively | 3,252 |
| | 3,649 |
| |
| Operating lease right-of-use assets | | 238,991 |
| | — |
|
| Intangible assets, net | 51,260 |
| | 46,860 |
| 56,258 |
| | 57,065 |
|
| Goodwill | 109,289 |
| | 115,930 |
| 195,043 |
| | 166,832 |
|
| Deferred tax assets | 31,005 |
| | 18,312 |
| 75,013 |
| | 69,983 |
|
| Other long-term assets, net of allowance of $132 and $0, respectively | 10,599 |
| | 4,113 |
| |
| Other noncurrent assets | | 39,433 |
| | 16,208 |
|
| Total assets | $ | 925,811 |
| | $ | 778,536 |
| $ | 2,244,208 |
| | $ | 1,611,802 |
|
| | | | |
|
| | |
| Liabilities | |
| | |
| |
| | |
|
| Current liabilities | |
| | |
| |
| | |
|
| Accounts payable | $ | 3,213 |
| | $ | 2,576 |
| $ | 7,831 |
| | $ | 7,444 |
|
| Accrued expenses and other liabilities | 49,895 |
| | 63,796 |
| |
| Due to employees | 32,203 |
| | 26,703 |
| |
| Deferred compensation due to employees | 5,900 |
| | 5,364 |
| |
| Taxes payable | 25,008 |
| | 29,472 |
| |
Accrued compensation and benefits expenses
| | 230,035 |
| | 177,594 |
|
| Accrued expenses and other current liabilities | | 82,476 |
| | 50,253 |
|
| Income taxes payable, current | | 9,064 |
| | 27,538 |
|
Operating lease liabilities, current
| | 57,542 |
| | — |
|
| Total current liabilities | 116,219 |
| | 127,911 |
| 386,948 |
| | 262,829 |
|
| Long-term debt | 25,048 |
| | 35,000 |
| 25,074 |
| | 25,031 |
|
| Other long-term liabilities | 3,132 |
| | 2,402 |
| |
| Income taxes payable, noncurrent | | 45,878 |
| | 43,685 |
|
| Operating lease liabilities, noncurrent | | 180,848 |
| | — |
|
| Other noncurrent liabilities | | 9,315 |
| | 17,661 |
|
| Total liabilities | 144,399 |
| | 165,313 |
| 648,063 |
| | 349,206 |
|
| Commitments and contingencies (Note 16) |
|
| |
|
| |
| Commitments and contingencies (Note 14) | |
|
| |
|
|
| Stockholders’ equity | |
| | |
| |
| | |
|
| Common stock, $0.001 par value; 160,000,000 authorized; 51,117,422 and 50,177,044 shares issued, 51,097,687 and 50,166,537 shares outstanding at December 31, 2016 and December 31, 2015, respectively | 50 |
| | 49 |
| |
| Common stock, $0.001 par value; 160,000,000 authorized; 55,207,446 and 54,099,927 shares issued, 55,187,711 and 54,080,192 shares outstanding at December 31, 2019 and December 31, 2018, respectively | | 55 |
| | 54 |
|
| Additional paid-in capital | 374,907 |
| | 303,363 |
| 607,051 |
| | 544,700 |
|
| Retained earnings | 444,320 |
| | 345,054 |
| 1,020,590 |
| | 759,533 |
|
| Treasury stock | (177 | ) | | (93 | ) | (177 | ) | | (177 | ) |
| Accumulated other comprehensive loss | (37,688 | ) | | (35,150 | ) | (31,374 | ) | | (41,514 | ) |
| Total stockholders’ equity | 781,412 |
| | 613,223 |
| 1,596,145 |
| | 1,262,596 |
|
| Total liabilities and stockholders’ equity | $ | 925,811 |
| | $ | 778,536 |
| $ | 2,244,208 |
| | $ | 1,611,802 |
|
The accompanying notes are an integral part of the consolidated financial statements.
EPAM SYSTEMS, INC. AND SUBSIDIARIES
CONSOLIDATED STATEMENTS OF INCOME AND COMPREHENSIVE INCOME
(US Dollars inInthousands, except share and per share data)
| | | | For the Years Ended December 31, | For the Years Ended December 31, |
| | 2016 | | 2015 | | 2014 | 2019 | | 2018 | | 2017 |
| Revenues | $ | 1,160,132 |
| | $ | 914,128 |
| | $ | 730,027 |
| $ | 2,293,798 |
| | $ | 1,842,912 |
| | $ | 1,450,448 |
|
| Operating expenses: | | | | | |
| | | | | |
|
| Cost of revenues (exclusive of depreciation and amortization) | 737,186 |
| | 566,913 |
| | 456,530 |
| 1,488,198 |
| | 1,186,921 |
| | 921,352 |
|
| Selling, general and administrative expenses | 264,658 |
| | 222,759 |
| | 163,666 |
| 457,433 |
| | 373,587 |
| | 327,588 |
|
| Depreciation and amortization expense | 23,387 |
| | 17,395 |
| | 17,483 |
| 45,317 |
| | 36,640 |
| | 28,562 |
|
| Goodwill impairment loss | — |
| | — |
| | 2,241 |
| |
| Other operating expenses, net | 1,205 |
| | 1,094 |
| | 3,924 |
| |
| Income from operations | 133,696 |
| | 105,967 |
| | 86,183 |
| 302,850 |
| | 245,764 |
| | 172,946 |
|
| Interest and other income, net | 4,848 |
| | 4,731 |
| | 4,769 |
| 8,725 |
| | 3,522 |
| | 4,601 |
|
| Change in fair value of contingent consideration | — |
| | — |
| | (1,924 | ) | |
| Foreign exchange loss | (12,078 | ) | | (4,628 | ) | | (2,075 | ) | |
| Foreign exchange (loss)/gain | | (12,049 | ) | | 487 |
| | (3,242 | ) |
| Income before provision for income taxes | 126,466 |
| | 106,070 |
| | 86,953 |
| 299,526 |
| | 249,773 |
| | 174,305 |
|
| Provision for income taxes | 27,200 |
| | 21,614 |
| | 17,312 |
| 38,469 |
| | 9,517 |
| | 101,545 |
|
| Net income | $ | 99,266 |
| | $ | 84,456 |
| | $ | 69,641 |
| $ | 261,057 |
| | $ | 240,256 |
| | $ | 72,760 |
|
| Foreign currency translation adjustments | (2,538 | ) | | (13,096 | ) | | (20,251 | ) | |
| Foreign currency translation adjustments, net of tax | | 6,295 |
| | (21,338 | ) | | 20,065 |
|
| Unrealized gain/(loss) on cash-flow hedging instruments, net of tax | | 3,845 |
| | (2,553 | ) | | — |
|
| Comprehensive income | $ | 96,728 |
| | $ | 71,360 |
| | $ | 49,390 |
| $ | 271,197 |
| | $ | 216,365 |
| | $ | 92,825 |
|
| | | | | | | | | | | |
| Net income per share: | | | | | |
| | | | | |
|
| Basic | $ | 1.97 |
| | $ | 1.73 |
| | $ | 1.48 |
| $ | 4.77 |
| | $ | 4.48 |
| | $ | 1.40 |
|
| Diluted | $ | 1.87 |
| | $ | 1.62 |
| | $ | 1.40 |
| $ | 4.53 |
| | $ | 4.24 |
| | $ | 1.32 |
|
| Shares used in calculation of net income per share: | | | | | |
| | | | | |
|
| Basic | 50,309 |
| | 48,721 |
| | 47,189 |
| 54,719,414 |
| | 53,622,989 |
| | 52,077,011 |
|
| Diluted | 53,215 |
| | 51,986 |
| | 49,734 |
| 57,667,789 |
| | 56,672,676 |
| | 54,984,173 |
|
The accompanying notes are an integral part of the consolidated financial statements.
EPAM SYSTEMS, INC. AND SUBSIDIARIES
CONSOLIDATED STATEMENTS OF CHANGES IN
STOCKHOLDERS’ EQUITY
(US Dollars inIn thousands, except share data)
|
| | | | | | | | | | | | | | | | | | | | | | | | | | |
| | |
| | Common Stock | | Additional Paid-in Capital | | Retained Earnings | | Treasury Stock | | Accumulated Other Comprehensive (Loss)/ Income | | Total Stockholders’ Equity |
| | Shares | | Amount | | | | | | | | | | |
| Balance, December 31, 2013 | 46,614,916 |
| | $ | 46 |
| | $ | 195,585 |
| | $ | 190,986 |
| | $ | (8,684 | ) | | $ | (1,832 | ) | | $ | 376,101 |
|
| Stock issued in connection with acquisitions (Note 3) | 534,534 |
| | — |
| | (2,076 | ) | | — |
| | 4,864 |
| | — |
| | 2,788 |
|
| Forfeiture of stock issued in connection with acquisitions | (24,474 | ) | | — |
| | 223 |
| | — |
| | (223 | ) | | — |
| | — |
|
| Stock issued under the 2012 Non-Employee Directors Compensation Plan (Note 14) | 7,738 |
| | — |
| | — |
| | — |
| | — |
| | — |
| | — |
|
| Stock-based compensation expense | — |
| | — |
| | 21,397 |
| | — |
| | — |
| | — |
| | 21,397 |
|
| Proceeds from stock option exercises | 1,171,097 |
| | 2 |
| | 10,596 |
| | — |
| | — |
| | — |
| | 10,598 |
|
| Excess tax benefits | — |
| | — |
| | 3,776 |
| | — |
| | — |
| | — |
| | 3,776 |
|
| Prior periods retained earnings adjustment | — |
| | — |
| | — |
| | (29 | ) | | — |
| | 29 |
| | — |
|
| Foreign currency translation adjustment | — |
| | — |
| | — |
| | — |
| | — |
| | (20,251 | ) | | (20,251 | ) |
| Net income | — |
| | — |
| | — |
| | 69,641 |
| | — |
| | — |
| | 69,641 |
|
| Balance, December 31, 2014 | 48,303,811 |
| | $ | 48 |
| | $ | 229,501 |
| | $ | 260,598 |
| | $ | (4,043 | ) | | $ | (22,054 | ) | | $ | 464,050 |
|
| Stock issued in connection with acquisitions (Note 3) | 435,462 |
| | — |
| | 1,118 |
| | — |
| | 3,963 |
| | — |
| | 5,081 |
|
| Forfeiture of stock issued in connection with acquisitions | (1,482 | ) | | — |
| | 13 |
| | — |
| | (13 | ) | | — |
| | — |
|
| Stock issued under the 2012 Non-Employee Directors Compensation Plan (Note 14) | 5,295 |
| | — |
| | — |
| | — |
| | — |
| | — |
| | — |
|
| Restricted stock units vested | 17,625 |
| | — |
| | 574 |
| | — |
| | — |
| | — |
| | 574 |
|
| Stock-based compensation expense | — |
| | — |
| | 43,120 |
| | — |
| | — |
| | — |
| | 43,120 |
|
| Proceeds from stock option exercises | 1,405,826 |
| | 1 |
| | 20,674 |
| | — |
| | — |
| | — |
| | 20,675 |
|
| Excess tax benefits | — |
| | — |
| | 8,363 |
| | — |
| | — |
| | — |
| | 8,363 |
|
| Foreign currency translation adjustment | — |
| | — |
| | — |
| | — |
| | — |
| | (13,096 | ) | | (13,096 | ) |
| Net income | — |
| | — |
| | — |
| | 84,456 |
| | — |
| | — |
| | 84,456 |
|
| Balance, December 31, 2015 | 50,166,537 |
| | $ | 49 |
| | $ | 303,363 |
| | $ | 345,054 |
| | $ | (93 | ) | | $ | (35,150 | ) | | $ | 613,223 |
|
|
| | | | | | | | | | | | | | | | | | | | | | | | | | | | | |
| | |
| | Common Stock | | Additional Paid-in Capital | | Retained Earnings | | Treasury Stock | | Accumulated Other Comprehensive (Loss)/ Income | | Total Stockholders’ Equity |
| | Shares | | Amount | | | | | | Shares | | Amount | | | | |
| Balance, January 1, 2017 | 51,097,687 |
| | $ | 50 |
| | $ | 374,907 |
| | $ | 444,320 |
| | 19,735 |
| | $ | (177 | ) | | $ | (37,688 | ) | | $ | 781,412 |
|
| Restricted stock units vested | 140,043 |
| | — |
| | — |
| | — |
| | — |
| | — |
| | — |
| | — |
|
| Restricted stock units withheld for employee taxes | (43,479 | ) | | — |
| | (3,300 | ) | | — |
| | — |
| | — |
| | — |
| | (3,300 | ) |
| Stock-based compensation expense | — |
| | — |
| | 48,173 |
| | — |
| | — |
| | — |
| | — |
| | 48,173 |
|
| Proceeds from stock option exercises | 1,789,434 |
| | 3 |
| | 54,094 |
| | — |
| | — |
| | — |
| | — |
| | 54,097 |
|
| Foreign currency translation adjustments | — |
| | — |
| | — |
| | — |
| | — |
| | — |
| | 20,065 |
| | 20,065 |
|
| Cumulative effect of the adoption of ASU 2016-09 | — |
| | — |
| | — |
| | 1,740 |
| | — |
| | — |
| | — |
| | 1,740 |
|
| Net income | — |
| | — |
| | — |
| | 72,760 |
| | — |
| | — |
| | — |
| | 72,760 |
|
| Balance, December 31, 2017 | 52,983,685 |
| | $ | 53 |
| | $ | 473,874 |
| | $ | 518,820 |
| | 19,735 |
| | $ | (177 | ) | | $ | (17,623 | ) | | $ | 974,947 |
|
| Restricted stock units vested | 222,675 |
| | — |
| | — |
| | — |
| | — |
| | — |
| | — |
| | — |
|
| Restricted stock units withheld for employee taxes | (71,334 | ) | | — |
| | (8,131 | ) | | — |
| | — |
| | — |
| | — |
| | (8,131 | ) |
| Stock-based compensation expense | — |
| | — |
| | 44,279 |
| | — |
| | — |
| | — |
| | — |
| | 44,279 |
|
| Proceeds from stock option exercises | 945,166 |
| | 1 |
| | 34,678 |
| | — |
| | — |
| | — |
| | — |
| | 34,679 |
|
| Foreign currency translation adjustments, net of tax | — |
| | — |
| | — |
| | — |
| | — |
| | — |
| | (21,338 | ) | | (21,338 | ) |
| Change in unrealized gains and losses on cash flow hedges, net of tax | — |
| | — |
| | — |
| | — |
| | — |
| | — |
| | (2,553 | ) | | (2,553 | ) |
| Cumulative effect of the adoption of ASU 2014-09 | — |
| | — |
| | — |
| | 457 |
| | — |
| | — |
| | — |
| | 457 |
|
| Net income | — |
| | — |
| | — |
| | 240,256 |
| | — |
| | — |
| | — |
| | 240,256 |
|
| Balance, December 31, 2018 | 54,080,192 |
| | $ | 54 |
| | $ | 544,700 |
| | $ | 759,533 |
| | 19,735 |
| | $ | (177 | ) | | $ | (41,514 | ) | | $ | 1,262,596 |
|
EPAM SYSTEMS, INC. AND SUBSIDIARIES
CONSOLIDATED STATEMENTS OF CHANGES IN
STOCKHOLDERS’ EQUITY
(Continued)
(US Dollars inIn thousands, except share data)
|
| | | | | | | | | | | | | | | | | | | | | | | | | | |
| | |
| | Common Stock | | Additional Paid-in Capital | | Retained Earnings | | Treasury Stock | | Accumulated Other Comprehensive (Loss)/ Income | | Total Stockholders’ Equity |
| | Shares | | Amount | | | | | | | | | | |
| Balance, December 31, 2015 | 50,166,537 |
| | $ | 49 |
| | $ | 303,363 |
| | $ | 345,054 |
| | $ | (93 | ) | | $ | (35,150 | ) | | $ | 613,223 |
|
| Forfeiture of stock issued in connection with acquisitions | (9,228 | ) | | — |
| | 84 |
| | — |
| | (84 | ) | | — |
| | — |
|
| Stock issued under the 2012 Non-Employee Directors Compensation Plan (Note 14) | 6,510 |
| | — |
| | — |
| | — |
| | — |
| | — |
| | — |
|
| Restricted stock units vested, net of shares withheld for taxes | 38,064 |
| | — |
| | 2,069 |
| | — |
| | — |
| | — |
| | 2,069 |
|
| Stock-based compensation expense | — |
| | — |
| | 46,100 |
| | — |
| | — |
| | — |
| | 46,100 |
|
| Proceeds from stock option exercises | 895,804 |
| | 1 |
| | 18,027 |
| | — |
| | — |
| | — |
| | 18,028 |
|
| Excess tax benefits | — |
| | — |
| | 5,264 |
| | — |
| | — |
| | — |
| | 5,264 |
|
| Foreign currency translation adjustment | — |
| | — |
| | — |
| | — |
| | — |
| | (2,538 | ) | | (2,538 | ) |
| Net income | — |
| | — |
| | — |
| | 99,266 |
| | — |
| | — |
| | 99,266 |
|
| Balance, December 31, 2016 | 51,097,687 |
| | $ | 50 |
| | $ | 374,907 |
| | $ | 444,320 |
| | $ | (177 | ) | | $ | (37,688 | ) | | $ | 781,412 |
|
|
| | | | | | | | | | | | | | | | | | | | | | | | | | | | | |
| | |
| | Common Stock | | Additional Paid-in Capital | | Retained Earnings | | Treasury Stock | | Accumulated Other Comprehensive (Loss)/ Income | | Total Stockholders’ Equity |
| | Shares | | Amount | | | | | | Shares | | Amount | | | | |
| Balance, December 31, 2018 | 54,080,192 |
| | $ | 54 |
| | $ | 544,700 |
| | $ | 759,533 |
| | 19,735 |
| | $ | (177 | ) | | $ | (41,514 | ) | | $ | 1,262,596 |
|
| Restricted stock issued in connection with acquisitions (Note 2) | 18,787 |
| | — |
| | — |
| | — |
| | — |
| | — |
| | — |
| | — |
|
| Restricted stock units vested | 284,922 |
| | — |
| | — |
| | — |
| | — |
| | — |
| | — |
| | — |
|
| Restricted stock units withheld for employee taxes | (95,223 | ) | | — |
| | (15,951 | ) | | — |
| | — |
| | — |
| | — |
| | (15,951 | ) |
| Stock-based compensation expense | — |
| | — |
| | 41,256 |
| | — |
| | — |
| | — |
| | — |
| | 41,256 |
|
| Proceeds from stock option exercises | 899,033 |
| | 1 |
| | 37,046 |
| | — |
| | — |
| | — |
| | — |
| | 37,047 |
|
| Foreign currency translation adjustments, net of tax | — |
| | — |
| | — |
| | — |
| | — |
| | — |
| | 6,295 |
| | 6,295 |
|
Change in unrealized gains and losses on cash flow hedges, net of tax
| — |
| | — |
| | — |
| | — |
| | — |
| | — |
| | 3,845 |
| | 3,845 |
|
| Net income | — |
| | — |
| | — |
| | 261,057 |
| | — |
| | — |
| | — |
| | 261,057 |
|
| Balance, December 31, 2019 | 55,187,711 |
| | $ | 55 |
| | $ | 607,051 |
| | $ | 1,020,590 |
| | 19,735 |
| | $ | (177 | ) | | $ | (31,374 | ) | | $ | 1,596,145 |
|
The accompanying notes are an integral part of the consolidated financial statements.
EPAM SYSTEMS, INC. AND SUBSIDIARIES
CONSOLIDATED STATEMENTS OF CASH FLOWS |
| | | | | | | | | | | | |
| (US Dollars in thousands) | | For the Years Ended December 31, |
| | | 2016 | | 2015 | | 2014 |
| Cash flows from operating activities: | | | | | | |
| Net income | | $ | 99,266 |
| | $ | 84,456 |
| | $ | 69,641 |
|
| Adjustments to reconcile net income to net cash provided by operating activities: | | |
| | |
| | |
| Depreciation and amortization | | 23,387 |
| | 17,395 |
| | 17,483 |
|
| Bad debt expense | | 1,539 |
| | 1,407 |
| | 817 |
|
| Deferred taxes | | (3,304 | ) | | (15,328 | ) | | (3,270 | ) |
| Stock-based compensation expense | | 49,244 |
| | 45,833 |
| | 24,620 |
|
| Impairment charges and acquisition related adjustments | | — |
| | (1,183 | ) | | 7,907 |
|
| Excess tax benefit on stock-based compensation plans | | (5,264 | ) | | (8,363 | ) | | (3,776 | ) |
| Other | | 6,228 |
| | 3,883 |
| | 735 |
|
| Changes in operating assets and liabilities: | | |
| | |
| | |
| (Increase)/decrease in operating assets: | | |
| | |
| | |
| Accounts receivable | | (30,612 | ) | | (47,694 | ) | | (30,410 | ) |
| Unbilled revenues | | 34,777 |
| | (38,076 | ) | | (11,134 | ) |
| Prepaid expenses and other assets | | (4,791 | ) | | (574 | ) | | 565 |
|
| Increase/(decrease) in operating liabilities: | | |
| | |
| | |
| Accounts payable | | 741 |
| | (2,781 | ) | | (2,603 | ) |
| Accrued expenses and other liabilities | | (13,926 | ) | | 25,694 |
| | 9,978 |
|
| Due to employees | | 5,261 |
| | 2,752 |
| | 7,453 |
|
| Taxes payable | | 2,271 |
| | 8,972 |
| | 16,868 |
|
| Net cash provided by operating activities | | 164,817 |
| | 76,393 |
| | 104,874 |
|
| Cash flows used in investing activities: | | |
| | |
| | |
| Purchases of property and equipment | | (29,317 | ) | | (13,272 | ) | | (11,916 | ) |
| Payment for construction of corporate facilities | | — |
| | (4,692 | ) | | (3,924 | ) |
| Employee housing loans issued | | (2,006 | ) | | (2,054 | ) | | (1,740 | ) |
| Proceeds from repayments of employee housing loans | | 2,177 |
| | 2,249 |
| | 1,793 |
|
| (Increase)/decrease in restricted cash and time deposits, net | | 29,595 |
| | (29,944 | ) | | 1,430 |
|
| Increase in other long-term assets, net | | (4,327 | ) | | (708 | ) | | (1,479 | ) |
| Acquisition of businesses, net of cash acquired (Note 3) | | (5,500 | ) | | (76,908 | ) | | (37,093 | ) |
| Other investing activities, net | | 56 |
| | (165 | ) | | — |
|
| Net cash used in investing activities | | (9,322 | ) | | (125,494 | ) | | (52,929 | ) |
| Cash flows from financing activities: | | |
| | |
| | |
| Proceeds related to stock option exercises | | 17,996 |
| | 20,675 |
| | 10,571 |
|
| Excess tax benefit on stock-based compensation plans | | 5,264 |
| | 8,363 |
| | 3,776 |
|
Payments of withholding taxes related to net share settlements of restricted stock units | | (539 | ) | | — |
| | — |
|
| Proceeds from debt (Note 13) | | 20,000 |
| | 35,000 |
| | — |
|
| Repayment of debt (Note 13) | | (30,129 | ) | | — |
| | — |
|
| Proceeds from government grants | | 135 |
| | — |
| | — |
|
| Acquisition of businesses, deferred consideration (Note 3) | | (2,260 | ) | | (30,274 | ) | | (4,000 | ) |
| Net cash provided by financing activities | | 10,467 |
| | 33,764 |
| | 10,347 |
|
| Effect of exchange rate changes on cash and cash equivalents | | (3,386 | ) | | (5,748 | ) | | (10,965 | ) |
| Net increase/(decrease) in cash and cash equivalents | | 162,576 |
| | (21,085 | ) | | 51,327 |
|
| Cash and cash equivalents, beginning of period | | 199,449 |
| | 220,534 |
| | 169,207 |
|
| Cash and cash equivalents, end of period | | $ | 362,025 |
| | $ | 199,449 |
| | $ | 220,534 |
|
EPAM SYSTEMS, INC. AND SUBSIDIARIES
CONSOLIDATED STATEMENTS OF CASH FLOWS
(In thousands)
|
| | | | | | | | | | | | |
| | | For the Years Ended December 31, |
| | | 2019 | | 2018 | | 2017 |
| Cash flows from operating activities: | | | | | | |
| Net income | | $ | 261,057 |
| | $ | 240,256 |
| | $ | 72,760 |
|
| Adjustments to reconcile net income to net cash provided by operating activities: | | |
| | |
| | |
| Depreciation and amortization expense | | 45,317 |
| | 36,640 |
| | 28,562 |
|
| Operating lease right-of-use assets amortization expense | | 55,859 |
| | — |
| | — |
|
| Bad debt expense | | 1,619 |
| | 848 |
| | 51 |
|
| Deferred taxes | | (7,764 | ) | | (48,000 | ) | | 12,561 |
|
| Stock-based compensation expense | | 72,036 |
| | 59,188 |
| | 52,407 |
|
| Other | | 4,764 |
| | (1,712 | ) | | (4,010 | ) |
| Changes in assets and liabilities: | | |
| | |
| | |
| Trade receivables and contract assets | | (87,174 | ) | | (46,902 | ) | | (81,488 | ) |
| Prepaid and other assets | | (7,155 | ) | | (8,432 | ) | | 1,061 |
|
| Accounts payable | | (1,685 | ) | | (772 | ) | | 1,221 |
|
| Accrued expenses and other liabilities | | 27,125 |
| | 51,953 |
| | 47,803 |
|
| Operating lease liabilities | | (53,419 | ) | | — |
| | — |
|
| Income taxes payable | | (23,127 | ) | | 9,151 |
| | 61,892 |
|
| Net cash provided by operating activities | | 287,453 |
| | 292,218 |
| | 192,820 |
|
| Cash flows from investing activities: | | |
| | |
| | |
| Purchases of property and equipment | | (99,308 | ) | | (37,574 | ) | | (29,806 | ) |
| Decrease in time deposits, net | | — |
| | 418 |
| | — |
|
| Acquisition of businesses, net of cash acquired (Note 2) | | (39,322 | ) | | (74,268 | ) | | (6,810 | ) |
| Other investing activities, net | | (6,739 | ) | | (699 | ) | | 465 |
|
| Net cash used in investing activities | | (145,369 | ) | | (112,123 | ) | | (36,151 | ) |
| Cash flows from financing activities: | | |
| | |
| | |
| Proceeds from stock option exercises | | 37,003 |
| | 34,845 |
| | 53,984 |
|
| Payments of withholding taxes related to net share settlements of restricted stock units | | (15,503 | ) | | (7,747 | ) | | (3,194 | ) |
| Proceeds from debt (Note 8) | | — |
| | — |
| | 25,000 |
|
| Repayment of debt (Note 8) | | (9 | ) | | (3,494 | ) | | (25,103 | ) |
| Acquisition of businesses, contingent consideration | | (1,104 | ) | | — |
| | — |
|
| Other financing activities, net | | (24 | ) | | (603 | ) | | (941 | ) |
| Net cash provided by financing activities | | 20,363 |
| | 23,001 |
| | 49,746 |
|
| Effect of exchange rate changes on cash, cash equivalents and restricted cash | | 3,530 |
| | (14,240 | ) | | 11,776 |
|
| Net increase in cash, cash equivalents and restricted cash | | 165,977 |
| | 188,856 |
| | 218,191 |
|
| Cash, cash equivalents and restricted cash, beginning of period | | 771,711 |
| | 582,855 |
| | 364,664 |
|
| Cash, cash equivalents and restricted cash, end of period | | $ | 937,688 |
| | $ | 771,711 |
| | $ | 582,855 |
|
EPAM SYSTEMS, INC. AND SUBSIDIARIES
CONSOLIDATED STATEMENTS OF CASH FLOWS
(In thousands)
(Continued)
|
| | | | | | | | | | | | |
| (US Dollars in thousands) | | For the Years Ended December 31, |
| | | 2016 | | 2015 | | 2014 |
| Supplemental disclosures of cash flow information: | | | | | | |
| Cash paid during the year for: | | | | | | |
| Income taxes | | $ | 37,488 |
| | $ | 25,071 |
| | $ | 11,756 |
|
| Bank interest | | $ | 566 |
| | $ | 124 |
| | $ | 7 |
|
| Supplemental disclosure of non-cash operating activities | | | | | | |
| Goodwill impairment loss | | $ | — |
| | $ | — |
| | $ | 2,241 |
|
| Contingent consideration fair value adjustment | | $ | — |
| | $ | — |
| | $ | 1,924 |
|
Write off related to the construction of a building in Minsk, Belarus
| | $ | — |
| | $ | — |
| | $ | 3,742 |
|
| Prepaid and other current assets write-off related to vendor advance | | $ | — |
| | $ | 741 |
| | $ | — |
|
| Supplemental disclosure of non-cash investing and financing activities | | | | | | |
| Deferred consideration payable | | $ | — |
| | $ | 603 |
| | $ | 1,022 |
|
| Contingent consideration payable | | $ | — |
| | $ | — |
| | $ | 36,322 |
|
|
| | | | | | | | | | | | |
| | | For the Years Ended December 31, |
| | | 2019 | | 2018 | | 2017 |
| Supplemental disclosures of cash flow information: | | | | | | |
| Cash paid during the year for: | | | | | | |
| Income taxes, net of refunds | | $ | 65,306 |
| | $ | 40,437 |
| | $ | 26,669 |
|
| Interest | | $ | 832 |
| | $ | 777 |
| | $ | 548 |
|
| Supplemental disclosure of non-cash investing and financing activities | | | | | | |
| Acquisition-date fair value of contingent consideration issued for acquisition of businesses | | $ | 3,876 |
| | $ | 8,390 |
| | $ | — |
|
| Capital expenditures incurred but not yet paid | | $ | 16,921 |
| | $ | 2,140 |
| | $ | 1,042 |
|
The following table provides a reconciliation of cash, cash equivalents and restricted cash reported within the consolidated balance sheets:
|
| | | | | | | | | | | | |
| | | As of December 31, 2019 | | As of December 31, 2018 | | As of December 31, 2017 |
| Balance sheet classification | | | | | | |
| Cash and cash equivalents | | $ | 936,552 |
| | $ | 770,560 |
| | $ | 582,585 |
|
| Restricted cash in Prepaid and other current assets | | — |
| | 14 |
| | 91 |
|
| Restricted cash in Other noncurrent assets | | 1,136 |
| | 1,137 |
| | 179 |
|
| Total restricted cash | | 1,136 |
| | 1,151 |
| | 270 |
|
| Total cash, cash equivalents and restricted cash | | $ | 937,688 |
| | $ | 771,711 |
| | $ | 582,855 |
|
The accompanying notes are an integral part of the consolidated financial statements.
EPAM SYSTEMS, INC. AND SUBSIDIARIES
NOTES TO CONSOLIDATED FINANCIAL STATEMENTS
AS OF DECEMBER 31, 2016 AND 2015
AND FOR THE YEARS ENDED DECEMBER 31, 2016, 2015 AND 2014
(US Dollars inInthousands, except share and per share data)
| |
| 1. | NATURE OF BUSINESS AND SUMMARY OF SIGNIFICANT ACCOUNTING POLICIES |
EPAM Systems, Inc. (the “Company” or “EPAM”) is a leading global provider of software product development and digital platform engineering and software development services to clientscustomers located around the world, primarily in North America, Europe, Asia and Australia. The Company hasCompany’s industry expertise in various industries, includingincludes financial services, travel and consumer, software and hi-tech, financial services,business information and media, and entertainment, travel and hospitality, retail and distribution and life sciences and healthcare.healthcare, as well as other emerging industries. The Company is incorporated in Delaware with headquarters in Newtown, PA.Pennsylvania.
Principles of Consolidation — The consolidated financial statements include the financial statements of EPAM Systems, Inc. and its subsidiaries. All intercompany balances and transactions have been eliminated.
Reclassifications — Certain amounts recorded in the prior-period consolidated balance sheets and consolidated statements of cash flows presented have been reclassified to conform to the current-period financial statement presentation. These reclassifications had no effect on previously reported results of operations.
The Company made the following reclassifications to its consolidated balance sheet as of December 31, 2018:
The Company combined previously reported Accounts receivable and Unbilled revenues into Trade receivables and contract assets.
Amounts previously reported within Accrued expenses and other current liabilities, Due to employees, Deferred compensation due to employees and Taxes payable, current were reclassified to Accrued compensation and benefits expenses.
Amounts previously reported within Taxes payable, current were reclassified to Accrued expenses and other current liabilities, Accrued compensation and benefits expenses and Income taxes payable, current.
The following table summarizes the impact of these changes on the consolidated balance sheet as of December 31, 2018:
|
| | | | | | | | | | | |
| | As of December 31, 2018 |
| | As Previously Reported | | Change | | As Reported |
| Current assets | | | | | |
| Accounts receivable, net of allowance of $1,557 | $ | 297,685 |
| | $ | (297,685 | ) | | $ | — |
|
| Unbilled revenues | $ | 104,652 |
| | $ | (104,652 | ) | | $ | — |
|
| Trade receivables and contract assets, net of allowance of $1,557 | $ | — |
| | $ | 402,337 |
| | $ | 402,337 |
|
| Current liabilities | | | | | |
| Accrued expenses and other current liabilities | $ | 127,937 |
| | $ | (77,684 | ) | | $ | 50,253 |
|
Accrued compensation and benefits expenses
| $ | — |
| | $ | 177,594 |
| | $ | 177,594 |
|
| Due to employees | $ | 49,683 |
| | $ | (49,683 | ) | | $ | — |
|
| Deferred compensation due to employees | $ | 9,920 |
| | $ | (9,920 | ) | | $ | — |
|
| Taxes payable, current | $ | 67,845 |
| | $ | (67,845 | ) | | $ | — |
|
| Income taxes payable, current | $ | — |
| | $ | 27,538 |
| | $ | 27,538 |
|
Use of Estimates — The preparation of financial statements in conformity with accounting principles generally accepted in the United States requires management to make estimates and assumptions. These estimates and assumptions affect reported amounts of assets and liabilities and the disclosure of contingent assets and liabilities at the date of the financial statements, as well as revenues and expenses during the reporting period. The Company bases its estimates and judgments on historical experience, knowledge of current conditions and its beliefs of what could occur in the future, given available information. Actual results could differ from those estimates, and such differences may be material to the financial statements.
Reclassification
Cash and Cash Equivalents— DuringCash equivalents are short-term, highly liquid investments that are readily convertible into cash, with maturities of three months or less at the first quarterdate acquired.
Trade Receivables and Contract Assets — The Company classifies its right to consideration in exchange for deliverables as either a trade receivable or a contract asset. A trade receivable is a right to consideration that is unconditional (i.e., only the passage of 2016,time is required before payment is due) regardless of whether the Company revised the classificationamounts have been billed. Trade receivables are stated net of certain health insurance premiumallowance for doubtful accounts. Outstanding trade receivables are reviewed periodically and other employee fringe benefit expenses between the cost of revenues and selling, general and administrative expenses line items on the statements of income and comprehensive income. The effect of this reclassification had no impact on total income from operationsallowances are provided for the year ended December 31, 2016.
Revenue Recognition — The Company recognizes revenue when the following criteria are met: (1) persuasive evidence of an arrangement exists; (2) delivery has occurred; (3) the sales price is fixed or determinable; and (4) collectability is reasonably assured. Determining whether and when some of these criteria have been satisfied often involves assumptions and judgments that can have a significant impact on the timing andestimated amount of revenue reported.
receivables that may not be collected. The Company derives its revenues from a variety of service offerings, which represent specific competencies of its IT professionals. Contractsallowance for these services have different terms and conditionsdoubtful accounts is determined based on historical experience and management’s evaluation of trade receivables. A contract asset is a right to consideration that is conditional upon factors other than the scope, deliverables, and complexitypassage of the engagement, which require managementtime. Contract assets primarily relate to make judgments and estimates in determining appropriate revenue recognition. Fees for these contracts may be in the form of time-and-materials orunbilled amounts on fixed-price arrangements. If there is an uncertainty about the project completion or receipt of payment for the services, revenue is deferred until the uncertainty is sufficiently resolved. At the time revenue is recognized, the Company provides for any contractual deductions and reduces the revenue accordingly.
The Company defers amounts billed to its clients for revenues not yet earned. Such amountscontracts. Contract assets are anticipated to be recorded as revenues when services are performed in subsequent periods. Unbilled revenue is recorded when services have been provided but billed subsequentthe Company does not have an unconditional right to receive consideration. The Company recognizes an impairment loss when the contract carrying amount is greater than the remaining consideration receivable, less directly related costs to be incurred.
Property and Equipment — Property and equipment acquired in the ordinary course of the Company’s operations are stated at cost, net of accumulated depreciation. Depreciation is calculated on a straight-line basis over the estimated useful lives of the assets generally ranging from two to fifty years. Leasehold improvements are amortized on a straight-line basis over the shorter of the term of the lease or the estimated useful life of the improvement. Maintenance and repairs are expensed as incurred.
Business Combinations — The Company accounts for business combinations using the acquisition method which requires it to estimate the fair value of identifiable assets acquired and liabilities assumed, including any contingent consideration, to properly allocate the purchase price to the period endindividual assets acquired and liabilities assumed in accordance with the contract terms.
Financial Accounting Standards Board (“FASB”) Accounting Standards Codification (“ASC”) Topic 805, Business Combinations. The Company reports gross reimbursable “out-of-pocket” expenses incurred as bothallocation of the purchase price utilizes significant estimates in determining the fair values of identifiable assets acquired and liabilities assumed, especially with respect to intangible assets. The significant estimates and assumptions used include the timing and amount of forecasted revenues and cost of revenuescash flows, anticipated growth rates, client attrition rates, the discount rate reflecting the risk inherent in the consolidated statements of income and comprehensive income.
The majority of the Company’s revenues (88.2% of revenues in 2016, 85.8% in 2015 and 84.7% in 2014) are generated under time-and-material contracts where revenues are recognized as services are performed with the corresponding cost of providing those services reflected as cost of revenues. The majority of such revenues are billed on an hourly, daily or monthly basis as actual time is incurred on the client.
Revenues from fixed-price contracts (10.4% of revenues in 2016, 12.8% in 2015 and 13.6% in 2014) are primarily determined using the proportional performance method. In instances where final acceptance of the product, system, or solution is specified by the client,future cash flows and the acceptance criteriadetermination of useful lives for finite-lived assets. There are not objectively determinable to have been met asdifferent valuation models for each component, the services are provided, revenues are deferred until all acceptance criteria have been met. In absenceselection of a sufficient basis to measure progress towards completion, revenue is recognized upon receipt of final acceptance from the client. In order to estimatewhich requires considerable judgment. These determinations will affect the amount of revenueamortization expense recognized in future periods. The Company bases its fair value estimates on assumptions it believes are reasonable, but recognizes that the assumptions are inherently uncertain. The acquired assets typically include customer relationships, software, trade names, non-competition agreements, and assembled workforce and as a result, a substantial portion of the purchase price is allocated to goodwill and other intangible assets.
If the initial accounting for the period underbusiness combination has not been completed by the proportional performance method, the Company determines the percentage of actual labor hours incurred as compared to estimated total labor hours and applies that percentage to the consideration allocated to the deliverable. The complexityend of the estimation process and factors relating to the assumptions, risks and uncertainties inherent with the application of the proportional performance method of accounting affects the amounts of revenues and related expenses reported in the Company’s consolidated financial statements. A number of internal and external factors can affect such estimates, including labor hours and specification and testing requirement changes. The cumulative impact of any revision in estimates is reflected in the financial reporting period in which the change in estimate becomes known. No significant revisions occurred in eachbusiness combination occurs, provisional amounts are reported to present information about facts and circumstances that existed as of the three years ended December 31, 2016, 2015acquisition date. Once the measurement period ends, which in no case extends beyond one year from the acquisition date, revisions to the accounting for the business combination are recorded in earnings.
All acquisition-related costs, other than the costs to issue debt or equity securities, are accounted for as expenses in the period in which they are incurred. Changes in the fair value of contingent consideration arrangements that are not measurement period adjustments are recognized in earnings.
Long-Lived Assets — Long-lived assets, such as property and 2014. The Company’s fixed price contractsequipment and finite-lived intangible assets, are generally recognized over a periodreviewed for impairment whenever events or changes in circumstances indicate that the carrying amount of 12 months or less.
Costan asset may not be recoverable. When the carrying value of Revenues (Exclusive of Depreciation and Amortization) — Consists principally of salaries and bonusesan asset is more than the sum of the revenue producing personnel,undiscounted expected future cash flows, an impairment is recognized. An impairment loss is measured as well as employee benefits, stock-based compensation expense and travel costs for these professionals.
Selling, General and Administrative Expenses — Consist mainly of compensation, benefits and travel expensesthe excess of the officers, management, sales, marketingasset’s carrying amount over its fair value. Intangible assets that have finite useful lives are amortized over their estimated useful lives on a straight-line basis.
Goodwill and administrative personnel. Other Indefinite-Lived Intangible Assets — Goodwill and other intangible assets that have indefinite useful lives are accounted for in accordance with FASB ASC 350, Intangibles — Goodwill and Other. The Company conducts its evaluation of goodwill impairment at the reporting unit level on an annual basis as of October 31st, and more frequently if events or circumstances indicate that the carrying value of a reporting unit exceeds its fair value. A reporting unit is an operating expenses includedsegment or one level below. The Company does not have intangible assets other than goodwill that have indefinite useful lives.
Derivative Financial Instruments — The Company enters into derivative financial instruments to manage exposure to fluctuations in selling, generalcertain foreign currencies. During 2018, for accounting purposes, these foreign currency forward contracts became designated as hedges, as defined under FASB ASC Topic 815, Derivatives and administrative expenses are advertising, promotional activities, legal and audit expenses, recruitment and development efforts, insurance, and operating lease expenses. In addition,Hedging. The Company measures these foreign currency derivative contracts at fair value on a recurring basis utilizing Level 2 inputs. The Company records changes in the fair value of these hedges in accumulated other comprehensive income/(loss) until the forecasted transaction occurs. When the forecasted transaction occurs, the Company has issued stockreclassifies the related gain or loss on the cash flow hedge to cost of revenues (exclusive of depreciation and amortization). In the sellers and/event the underlying forecasted transaction does not occur, or personnelit becomes probable that it will not occur, the Company reclassifies the gain or loss on the underlying hedge into income. If the Company does not elect hedge accounting, or the contract does not qualify for hedge accounting treatment, the changes in connection with business acquisitions and has been recognizing stock-based compensation expensefair value from period to period are recorded in the periods after the closingincome. The cash flow impact of these acquisitionsderivatives identified as parthedging instruments is reflected as cash flows from operating activities. The cash flow impact of the selling, general and administrative expenses. Stock option expenses related to acquisitions comprised a significant portion of total selling, general and administrative stock-based compensation expense in 2016 and 2015.derivatives not identified as hedging instruments is reflected as cash flows from investing activities.
Fair Value of Financial Instruments — The Company makes assumptions about fair values of its financial assets and liabilities in accordance with the Financial Accounting Standards Board (“FASB”) Accounting Standards Codification (“ASC”)FASB ASC Topic 820, “FairFair Value Measurement”, and utilizes the following fair value hierarchy in determining inputs used for valuation:
Level 1 — Quoted prices for identical assets or liabilities in active markets.
Level 2 — Inputs other than quoted prices within Level 1 that are observable either directly or indirectly, including quoted prices in markets that are not active, quoted prices in active markets for similar assets or liabilities, and observable inputs other than quoted prices such as interest rates or yield curves.
Level 3 — Unobservable inputs reflecting management’s view about the assumptions that market participants would use in pricing the asset or liability.
Where the fair values of financial assets and liabilities recorded in the consolidated balance sheets cannot be derived from an active market, they are determined using a variety of valuation techniques. These valuation techniques include a net present value technique, comparison to similar instruments with market observable inputs, option pricing models and other relevant valuation models. To the extent possible, observable market data is used as inputs into these models but when it is not feasible, a degree of judgment is required to establish fair values.
The Company’s contingent liabilities measured at fair value on a recurring basis are comprised of performance-based awards issued to certain former owners of acquired businesses in exchange for future services and cash-settled restricted stock units issued to employees. During a performance measurement period, performance-based awards are valued using significant inputs that are not observable in the market, which are defined as Level 3 inputs according to fair value measurement accounting. The Company estimates the fair value of contingent liabilities based on certain performance milestones of the acquired businesses and estimated probabilities of achievement, then discounts the liabilities to present value using the Company’s cost of debt for the cash component of contingent consideration, and a risk free rate for the stock component of a contractual contingency. The Company believes its estimates and assumptions are reasonable, however, there is significant judgment involved. Changes in the fair value of contingent consideration liabilities primarily result from changes in the timing and amount of specific milestone estimates and changes in probability assumptions with respect to the likelihood of achieving the various earnout criteria.
Cash-settled restricted stock units issued to employees are valued using the price of the Company’s stock, a significant input that is observable in the market, which is defined as Level 1 input according to fair value measurement accounting.
Changes in the fair value of these liabilities could cause a material impact to, and volatility in the Company’s operating results. See Note 1711 “Fair Value Measurements.”
Employee Loans Revenue Recognition — TheEffective January 1, 2018, the Company issues employee housing loans in Belarus, relocation loans to assist employeesadopted the Accounting Standard Update (“ASU”) No. 2014-09, Revenue from Contracts with relocation needs in connection with intra-company transfers and loans for the purchase of automobiles in India. There are no loans issued to principal officers, directors, and their affiliates. The Company intends to hold all employee loans until their maturity. Interest income is reportedCustomers (Topic 606) as amended using the effective interestmodified retrospective method. Where applicable, loan origination fees, netThe standard effectively replaced previously existing revenue recognition guidance (Topic 605) and requires entities to recognize revenue to depict the transfer of direct origination costs, are deferred and recognizedpromised goods or services in interest income overan amount that reflects the life ofconsideration to which the loan.
On a quarterly basis, the Company reviews the aging of its loan portfolio and evaluates the ability of employeesentity expects to repay their debt on schedule. Factors consideredbe entitled in the review include historical payment experience, reasonsexchange for payment delays and shortfalls, if any,those goods or services as well as probabilityrequires additional disclosure about the nature, amount, timing and uncertainty of collecting scheduled principalrevenues and interest payments. Sincecash flows arising from customer contracts, including significant judgments and changes in judgments.
The Company applied a practical expedient to aggregate the initiationeffect of all contract modifications that occurred before the loan program there have not been material past dueadoption date.
The following table summarizes the impacts of changes in accounting policies after adoption of Topic 606 on the Company’s consolidated Statement of Income and Comprehensive Income for the year ended December 31, 2018, which primarily resulted from deferring the timing of revenue recognition for contracts that were previously recognized on a cash basis and recognizing revenues from certain license agreements at a point-in-time rather than over time: |
| | | | | | | | | | | |
| | Year Ended December 31, 2018 |
| | As Reported | | Balances Without Adoption of Topic 606 | | Effect of Change Higher/(Lower) |
| Revenues | $ | 1,842,912 |
| | $ | 1,843,159 |
| | $ | (247 | ) |
| Income from operations | $ | 245,764 |
| | $ | 246,011 |
| | $ | (247 | ) |
Provision for income taxes
| $ | 9,517 |
| | $ | 9,572 |
| | $ | (55 | ) |
| Net income | $ | 240,256 |
| | $ | 240,448 |
| | $ | (192 | ) |
For the years ended December 31, 2019 and 2018
The Company recognizes revenues when control of goods or non-accrual employee loans or write-offs relatedservices is passed to loan losses and, therefore,a customer in an amount that reflects the consideration the Company determinedexpects to be entitled to in exchange for those goods or services. Such control may be transferred over time or at a point in time depending on satisfaction of obligations stipulated by the contract. Consideration expected to be received may consist of both fixed and variable components and is allocated to each separately identifiable performance obligation based on the performance obligation’s relative standalone selling price. Variable consideration usually takes the form of volume-based discounts, service level credits, price concessions or incentives. Determining the estimated amount of such variable consideration involves assumptions and judgment that no allowance for loan losses is required.can have an impact on the amount of revenues reported.
Employee Housing Loans — The Employee Housing Program (the “Housing Program”) provides employees with loans to purchase housing in Belarus. The housing loans are measured using the Level 3 inputs within the fair value hierarchy because they are valued using significant unobservable inputs. These housing loans are measured at fair value upon initial recognition through the market approach under ASC Topic 820, “Fair Value Measurement” and subsequently carried at amortized cost less allowance for loan losses, if any. Any difference between the carrying value and the fair value of a loan upon initial recognition is charged to expense.
Other Employee Loans — The Company issues short-term, non-interest bearing relocation loansderives revenues from a variety of service arrangements, which have been evolving to employees who have relocated within the company. In addition, the Company hasprovide more customized and integrated solutions to customers by combining software engineering with customer experience design, business consulting and technology innovation services. Fees for these contracts may be in the past issued and may issue in the future a small numberform of interest bearing loans to employees for the purchase of automobiles. Such loans are issued to qualified employees with certain conditions attached. Due to the short term duration of these employee loans and high certainty of repayment, their carrying amount is a reasonable estimate of their fair value.
Business Combinations —time-and-materials or fixed-price arrangements. The Company accounts forgenerates the majority of its business combinationsrevenues under time-and-material contracts, which are billed using the acquisition accounting method, which requires ithourly, daily or monthly rates to determine the fair valueamounts to be charged directly to the customer. EPAM applies a practical expedient and revenues related to time-and-material contracts are recognized based on the right to invoice for services performed.
Fixed-price contracts include maintenance and support arrangements which may exceed one year in duration. Maintenance and support arrangements generally relate to the provision of net assets acquiredongoing services and revenues for such contracts are recognized ratably over the expected service period. Fixed-price contracts also include application development arrangements, where progress towards satisfaction of the performance obligation is measured using input or output methods and input methods are used only when there is a direct correlation between hours incurred and the related goodwillend product delivered. Assumptions, risks and other intangible assetsuncertainties inherent in the estimates used to measure progress could affect the amount of revenues, receivables and deferred revenues at each reporting period.
Revenues from licenses which have significant stand-alone functionality are recognized at a point in time when control of the license is transferred to the customer. Revenues from licenses which do not have stand-alone functionality are recognized over time.
If there is an uncertainty about the receipt of payment for the services, revenue recognition is deferred until the uncertainty is sufficiently resolved. The Company applies a practical expedient and does not assess the existence of a significant financing component if the period between transfer of the service to a customer and when the customer pays for that service is one year or less.
The Company reports gross reimbursable “out-of-pocket” expenses incurred as both revenues and cost of revenues in the consolidated statements of income and comprehensive income.
For the year ended December 31, 2017
The Company recognized revenue when the following criteria were met: (1) persuasive evidence of an arrangement existed; (2) delivery had occurred; (3) the sales price was fixed or determinable; and (4) collectability was reasonably assured. Determining whether and when some of these criteria had been satisfied often involved assumptions and judgments that could have had a significant impact on the timing and amount of revenue reported.
The Company derived its revenues from a variety of service offerings, which represent specific competencies of its delivery professionals. Contracts for these services have different terms and conditions based on the scope, deliverables, and complexity of the engagement, which require management to make judgments and estimates in determining the appropriate revenue recognition. Fees for these contracts may have been in the form of time-and-materials or fixed-price arrangements. If there was uncertainty about the project completion or receipt of payment for the services, revenue was deferred until the uncertainty was sufficiently resolved. At the time revenue was recognized, the Company provided for any contractual deductions and reduced revenue accordingly. The Company reported gross reimbursable “out-of-pocket” expenses incurred as both revenues and cost of revenues in the consolidated statements of income and comprehensive income.
The Company deferred amounts billed to its customers for revenues not yet earned. Such amounts were anticipated to be recorded as revenues when services were performed in subsequent periods. Unbilled revenue was recorded when services have been provided but billed subsequent to the period end in accordance with the FASB ASC Topic 805, “Business Combinations.” contract terms.
The Company identifies and attributes fair values and estimated lives tomajority of the intangible assets acquired and allocatesCompany’s revenues (90.3% of revenues in 2017) were generated under time-and-material contracts whereby revenues were recognized as services were performed with the totalcorresponding cost of an acquisitionproviding those services reflected as cost of revenues. The majority of such revenues were billed using hourly, daily or monthly rates as actual time was incurred on the project. Revenues from fixed-price contracts (8.3% of revenues in 2017) included fixed-price maintenance and support arrangements, which may have exceeded one year in duration and revenues from maintenance and support arrangements were generally recognized ratably over the expected service period. Fixed-price contracts also included application development arrangements and revenues from these arrangements were primarily determined using the proportional performance method. In cases where final acceptance of the product, system, or solution was specified by the customer, and the acceptance criteria were not objectively determinable to have been met as the underlying net assets based on their respective estimated fair values. Determiningservices were provided, revenues were deferred until all acceptance criteria had been met. In the fair valueabsence of assets acquireda sufficient basis to measure progress towards completion, revenue was recognized upon receipt of final acceptance from the customer. Assumptions, risks and liabilities assumed requires management’s judgment and involvesuncertainties inherent in the useestimates used in the application of significant estimates, including projectionsthe proportional performance method of future cash inflows and outflows, discount rates, asset lives and market multiples. There are different valuation models for each component, the selection of which requires considerable judgment. These determinations will affectaccounting could have affected the amount of amortization expense recognized in future periods. The Company bases its fair value estimates on assumptions it believes are reasonable, but recognizes that the assumptions are inherently uncertain.revenues, receivables and deferred revenues at each reporting period.
All acquisition-relatedCost of Revenues (Exclusive of Depreciation and Amortization) — Consists principally of salaries, bonuses, fringe benefits, stock-based compensation, project related travel costs other than the costs to issue debt or equity securities, are accountedand fees for as expenses in the period in which they are incurred. Changes in fair value of contingent consideration arrangementssubcontractors that are not measurement period adjustments are recognized in earnings. Paymentsassigned to settle contingent consideration, if any, are reflected in cash flows from financing activities and the changes in fair value are reflected in cash flows from operating activities in the Company’s consolidated statements of cash flows.
The acquired assets typically consist of customer relationships, trade names, non-competition agreements, and workforce and as a result, a substantial portion of the purchase price is allocated to goodwillprojects. Salaries and other intangible assets.
Cash and Cash Equivalents — Cash equivalents are short-term, highly liquid investments that are readily convertible into cash, with maturities of three months or less at the date acquired. As of December 31, 2016 and 2015 the Company had no cash equivalents.
Restricted Cash — Restricted cash represents cash that is restricted by agreements with third parties for special purposes or is subject to other limiting conditions. See Note 7 for items that constitute restricted cash.
Accounts Receivable — Accounts receivable are stated net of an allowance for doubtful accounts. Outstanding accounts receivable are reviewed periodically and allowances are provided at such time management believes it is probable that such balances will not be collected within a reasonable time. The allowance for doubtful accounts is determined by evaluating the relative creditworthiness of each client, historical collections experience and other information, including the aging of the receivables. Accounts receivable are generally written off when they are deemed uncollectible. Bad debts are recorded based on historical experience and management’s evaluation of accounts receivable.
Property and Equipment — Property and equipment acquired in the ordinary coursecompensation expenses of the Company’s operationsdelivery professionals are stated atreported as cost net of accumulated depreciation. Depreciation is calculated onrevenues regardless of whether the straight-line basis overemployees are actually performing client services during a given period.
Selling, General and Administrative Expenses — Consists of expenses associated with promoting and selling the estimated useful livesCompany’s services and general and administrative functions of the assets generally ranging from twobusiness. These expenses include the costs of salaries, bonuses, fringe benefits, stock-based compensation, severance, bad debt, travel, legal and accounting services, insurance, facilities including operating leases, advertising and other promotional activities. In addition, we pay a membership fee of 1% of revenues generated in Belarus to fifty years. Leasehold improvements are amortized on a straight-line basis over the shorteradministrative organization of the term of the lease or the estimated useful life of the improvement. Maintenance and repairs are expensed as incurred.Belarus High-Technologies Park.
Goodwill and Other Intangible Assets Stock-Based Compensation— Goodwill and intangible assets that have indefinite useful lives are treated consistently with FASB ASC 350, “Intangibles — Goodwill and Other.” The Company does not have any intangible assets with indefinite useful lives.
The Company conductsrecognizes the cost of its evaluation of goodwill impairment at the reporting unit level on an annual basis as of October 31st, and more frequently if events or circumstances indicate that the carrying value of a reporting unit exceeds its fair value. A reporting unit is a reportable segment or one level below. The Company initially performs a qualitative assessment of goodwill to test for impairment indicators. After applying the qualitative assessment, if the entity concludes that it is not more likely than not that the fair value of goodwill is less than the carrying amount; the two-step goodwill impairment test is not required.
If the Company determines that it is more likely than not that the carrying amount exceeds the fair value, the Company performs a quantitative impairment test. If an indicator of impairment is identified, the implied fair value of the reporting unit’s goodwill is compared to its carrying amount, and the impairment loss is measured by the excess of the carrying value over the fair value. The fair values are estimated using a combination of the income approach, which incorporates the use of the discounted cash flow method, and the market approach, which incorporates the use of earnings multiplesequity settled stock-based incentive awards based on market data. These valuations are considered Level 3 measurements under FASB ASC Topic 820. The Company utilizes estimates to determine the fair value of the reporting unitsaward at the date of grant, net of estimated forfeitures. The cost is expensed evenly over the service period. The service period is the period over which the employee performs the related services, which is normally the same as the vesting period. Quarterly, the forfeiture assumption is adjusted and such as future cash flows, growth rates, capital requirements, effective tax rates and projected margins, among other factors. Estimates utilized inadjustment may affect the future evaluationstiming of goodwill for impairment could differ from estimates used in the current period calculations.
Intangible assets that have finite useful lives are amortized over their estimated useful lives on a straight-line basis. When facts and circumstances indicate potential impairment of amortizable intangible assets, the Company evaluates the recoverabilityrecognition of the asset’s carrying value, using estimatestotal amount of future cash flowsexpense recognized over the remaining asset life. The estimates ofvesting period. Equity-based awards that do not require future cash flows attributableservice are expensed immediately. Stock-based awards that do not meet the criteria for equity classification are recorded as liabilities and adjusted to intangible assets require significant judgment based on the Company’s historical and anticipated results. Any impairment loss is measured by the excess of carrying value over fair value.
Impairment of Long-Lived Assets — Long-lived assets, such as property and equipment, and finite-lived intangible assets, are reviewed for impairment whenever events or changes in circumstances indicate that the carrying amount of an asset may not be recoverable and exceeds the asset’s fair value. When the carrying value of an asset is more than the sum of the undiscounted cash flows that are expected to result from the asset’s use and eventual disposition, it is considered to be unrecoverable. Therefore, when an asset’s carrying value will not be recovered and it is more than its fair value the Company would deem the asset to be impaired. Property and equipment held for disposal are carried at the lowerend of the current carrying value or fair value less estimated costs to sell. The Company did not incur any impairment of long-lived assets for the years ended December 31, 2016 and 2015. The Company wrote off $1,149 related to the building construction in Minsk, Belarus against allowance for losses in the year ended December 31, 2014.each reporting period.
Income Taxes — The provision for income taxes includes federal, state, local and foreign taxes. Deferred tax assets and liabilities are recognized for the estimated future tax consequences of temporary differences between the financial statement carrying amounts and their respective tax bases. Deferred tax assets and liabilities are measured using enacted tax rates expected to apply to taxable income in the year in which the temporary differences are expected to be reversed. Changes to enacted tax rates would result in either increases or decreases in the provision for income taxes in the period of changes.
The realizability of deferred tax assets is primarily dependent on future earnings. The Company evaluates the realizability of deferred tax assets and recognizes a valuation allowance when it is more likely than not that all, or a portion of, deferred tax assets will not be realized.
The realization of deferred tax assets is primarily dependent on future earnings. Any A reduction in estimated forecasted results may require that we record valuation allowances against deferred tax assets. Once a valuation allowance has been established, it will be maintained until there is sufficient positive evidence to conclude that it is more likely than not that the deferred tax assets will be realized. A pattern of sustained profitability will generally be considered as sufficient positive evidence to reverse a valuation allowance. If the allowance is reversed in a future period, the income tax provision will be correspondingly reduced. Accordingly, the increase and decrease of valuation allowances could have a significant negative or positive impact on future earnings. See Note 11
On December 22, 2017, the United States enacted the Tax Cuts and Jobs Act (“U.S. Tax Act”), which subjects a U.S. shareholder to taxes on Global Intangible Low-Taxed Income (“GILTI”) earned by certain foreign subsidiaries. The FASB Staff Q&A, Topic 740, No. 5, Accounting for Global Intangible Low-Taxed Income, states that an entity can make an accounting policy election to either recognize deferred taxes for temporary basis differences expected to reverse as GILTI in future years or provide for the consolidatedtax expense related to GILTI in the year the tax is incurred. During the year ended December 31, 2018, the Company elected to provide for the tax expense related to GILTI in the year the tax is incurred. This election did not have a material impact on the financial statements for further information.the years ended December 31, 2019 or 2018.
Earnings per Share (“EPS”) — Basic EPS is computed by dividing income available to common shareholders by the weighted-average number of shares of common stock outstanding during the period. Diluted earnings per share is computed by dividing income available to common shareholders by the weighted-average number of shares of common stock outstanding during the period, increased to includeby the number of additional shares of common stock that would have been outstanding if the potentially dilutive securities had been issued. Potentially dilutive securities include outstanding stock options, unvested restricted stock and unvested restricted stock units (“RSUs”). The dilutive effect of potentially dilutive securities is reflected in diluted earnings per share by application of the treasury stock method.
Stock-Based Compensation — The Company recognizes the cost of its stock-based incentive awards based on the fair value of the award at the date of grant net of estimated forfeitures. Stock-based compensation cost is recognized as expense on a straight-line basis over the requisite service period. The service period is the period over which the employee performs the related services, which is normally the same as the vesting period. Over time, the forfeiture assumption is adjusted to the actual forfeiture rate and such change may affect the timing of the total amount of expense recognized over the vesting period. Equity-based awards that do not require future service are expensed immediately. Equity-based awards that do not meet the criteria for equity classification are recorded as liabilities and adjusted to fair value at the end of each reporting period.
Off-Balance Sheet Financial Instruments — The Company uses the FASB ASC Topic 825, “Financial Instruments.” to identify and disclose off-balance sheet financial instruments, which include credit instruments, such as commitments to make employee loans and related guarantees, standby letters of credit and certain guarantees issued under customer contracts. The face amount for these items represents the exposure to loss, before considering available collateral or the borrower’s ability to repay. Loss contingencies arising from off-balance sheet financial instruments are recorded as liabilities when the likelihood of loss is probable and an amount or range of loss can be reasonably estimated. The Company does not believe such matters exist that would have a material effect on the financial statements.
Foreign Currency Translation — Assets and liabilities of consolidated foreign subsidiaries whose functional currency is not the local currency,U.S. dollar are translated tointo U.S. dollars at period endperiod-end exchange rates. Revenuesrates and revenues and expenses are translated tointo U.S. dollars at daily exchange rates. The adjustment resulting from translating the financial statements of such foreign subsidiaries tointo U.S. dollars is reflected as a cumulative translation adjustment and reported as a component of accumulated other comprehensive income. Transactionincome/(loss).
For consolidated foreign subsidiaries whose functional currency is the U.S. dollar, transactions and balances denominated in the local currency are foreign currency transactions. Foreign currency transactions and balances related to non-monetary assets and liabilities are remeasured to the functional currency of the subsidiary at historical exchange rates while monetary assets and liabilities are remeasured to the functional currency of the subsidiary at period-end exchange rates. Foreign currency exchange gains andor losses from remeasurement are included in income in the period in which they occur.
Risks and Uncertainties — As a result of its global operations, the Company may be subject to certain inherent risks.
Concentration of Credit — Financial instruments that potentially subject the Company to concentrationsconcentration of credit risk consist primarily of cash, and cash equivalents and trade accounts receivable and unbilled revenues.receivables. The Company maintains cash, and cash equivalents and short-term deposits with financial institutions. The Company determined that the Company’s credit policies reflect normal industry terms and business risk and there is no expectation of non-performance by the counterparties. As of December 31, 2016, $194.6 million of total
The Company has cash including time depositsin banks in countries such as Belarus, Russia, Ukraine, Kazakhstan, Armenia and restricted cash, was held in CIS countries, with $153.8 million of that total in Belarus.Uzbekistan, where the banking sector remains subject to periodic instability. Banking and other financial systems ingenerally do not meet the CIS region are less developed and regulated than in somebanking standards of more developed markets, and bank deposits made by corporate entities in the CIS region are not insured.
Changes As of December 31, 2019, $206,485 of total cash was kept in banks in these countries, of which $123,370 was held in Belarus. In this region, and particularly in Belarus, a banking crisis, bankruptcy or insolvency of banks that process or hold the Company’s funds, may result in the market behaviorloss of deposits or decisions ofadversely affect the Company’s clientsability to complete banking transactions in the region, which could adversely affect the Company’s resultsbusiness and financial condition. Cash in this region is used for operational needs and cash balances in those banks move with the needs of operations. Duringthose entities.
Trade receivables are generally dispersed across many customers operating in different industries; therefore, concentration of credit risk is limited. Historically, credit losses and write-offs of trade receivable balances have not been material to the years ended December 31, 2016, 2015 and 2014, revenues from our top five customers were $327,092, $298,063 and $239,396, respectively, representing 28.2%, 32.6% and 32.8%, respectively, of total revenues in the corresponding periods. Revenues from our top ten customers were $442,253, $400,250 and $320,126 in 2016, 2015 and 2014, respectively, representing 38.1%, 43.8% and 43.9%, respectively, of total revenues in corresponding periods.consolidated financial statements.
Foreign currency risk — The Company’s global operations are conducted predominantly in U.S. dollars. Other than U.S. dollars, the Company generates a significant portion of revenues in various currencies, principally, euros, British pounds, sterling, Canadian dollars, Swiss francs and Russian rubles and incurs expenditures principally in Russian rubles, Hungarian forints, Russian rubles, Polish zlotys, British pounds, Swiss francs, British pounds sterling,euros, Indian rupees and ChinaChinese yuan renminbi (“CNY”) associated with its delivery centers.renminbi.
The Company’s international operations expose it to foreign currency exchange rate changes that could impact translations of foreign denominated assets and liabilities into U.S. dollars and future earnings and cash flows from transactions denominated in different currencies. The Company is exposed to fluctuations in foreign currency exchange rates primarily related to accounts receivable and unbilled revenuestrade receivables from sales in foreign currencies and cash outflows for expenditures in foreign currencies. The Company’s results of operations, primarily revenues and expenses denominated in foreign currencies, can be affected if any of the currencies, which we useare used materially in ourthe Company’s business, appreciate or depreciate against the U.S. dollar. The Company has a hedging program whereby it entered into a series of foreign exchange forward contracts that are designated as cash flow hedges of forecasted Russian ruble, Polish zloty and Indian rupee transactions.
Interest rate risk — The Company’s exposure to market risk is influenced primarily by changes in interest rates on interest payments received on cash and cash equivalent depositsequivalents and paid on any outstanding balance on the Company’s revolving line of credit,borrowings, mainly under the 2017 Credit Facility, which is subject to a variety of rates depending on the type and timing of funds borrowed (Note 13(See Note 8 “Long-Term Debt”). The Company does not use derivative financial instruments to hedge the risk of interest rate volatility.
| |
2. | RECENT ACCOUNTING PRONOUNCEMENTS |
Adoption of New Accounting Standards
Unless otherwise discussed below, the adoption of new accounting standards did not have ana material impact on the Company’s consolidated financial position, results of operations, and cash flows.
Balance Sheet Classification of Deferred Taxes — Effective April 1, 2016, the Company adopted Accounting Standard Update (“ASU”) No. 2015-17, Income Taxes (Topic 740): Balance Sheet Classification of Deferred Taxes, which resulted in the reclassification of current deferred tax assets and current deferred tax liabilities to non-current deferred tax assets and non-current deferred tax liabilities on its condensed consolidated balance sheets. No prior periods were retrospectively adjusted. See Note 11.
Simplifying the Accounting for Measurement-Period Adjustments — Effective January 1, 2016, the Company adopted the amended guidance of Accounting Standards Codification (“ASC”) Topic 805, Business Combinations, which simplifies the accounting for adjustments made to provisional amounts recognized in a business combination. The amended guidance requires an acquirer to recognize adjustments to provisional amounts identified during the measurement period in the reporting period in which the adjustment amounts are determined. The adoption of this amended guidance did not have a significant impact on the Company’s financial results.
Presentation of Debt Issuance CostsLeases — In April 2015,February 2016, the FASB issued ASU 2015-03, Interest-Imputation2016-02, Leases (“Topic 842”). The standard supersedes previously existing lease guidance (Topic 840) and requires entities to recognize all leases, with the exception of Interest (Subtopic 835-30): Simplifying the Presentationleases with a term of Debt Issuance Costs. ASU 2015-03 requires that debt issuance costs related to a recognized debt liability be presentedtwelve months or less, on the balance sheet as right-of-use assets (“RoU Assets”) and lease liabilities. The guidance also changes disclosure requirements with a focus on providing information that will enable users of financial statements to assess the amount, timing and uncertainty of cash flows arising from leases.
The Company adopted Topic 842, effective January 1, 2019, using the optional transition approach, which allows the Company to apply the provisions of the standard at the effective date without adjusting the comparable periods and carry forward disclosures under previously existing guidance for those periods presented within the Company’s financial statements.
The Company determines if an arrangement is a lease or contains a lease at inception. The Company performs an assessment and classifies the lease as either an operating lease or a financing lease at the lease commencement date with a right-of-use asset and a lease liability recognized in the consolidated balance sheet under both classifications. The Company does not have finance leases that are material to the Company’s consolidated financial statements.
Lease liabilities are initially measured at the present value of lease payments not yet paid. The present value is determined by applying the readily determinable rate implicit in the lease or, if not available, the incremental borrowing rate of the lessee. The Company determines the incremental borrowing rate of the lessee on a lease-by-lease basis by developing an estimated centralized U.S. dollar borrowing rate for a fully collateralized obligation with a term similar to the lease term and adjusts the rate to reflect the incremental risk associated with the foreign currency in which the lease is denominated. The development of this estimate includes the use of recovery rates, U.S. risk-free rates, foreign currency/country base rate yields, and a synthetic corporate credit rating of the Company developed using regression analysis. Lease agreements of the Company may include options to extend or terminate the lease and the Company includes such options in the lease term when it is reasonably certain that the Company will exercise that option. RoU Assets are recognized based on the initial measurement of the lease liabilities plus initial direct deduction fromcosts less lease incentives and, according to the guidance for long-lived assets, RoU Assets are reviewed for impairment whenever events or changes in circumstances indicate that the carrying amount of that debt liability, consistent with debt discounts. Previously, debt issuance costs were recognized as deferred charges and recorded as other assets. In August 2015, the FASB issued ASU 2015-15, Interest-Imputation of Interest (Subtopic 835-30): Presentation and Subsequent Measurement of Debt Issuance Costs Associated with Line-of-Credit Arrangements. ASU 2015-15 allows an entity to defer and present debt issuance costs as an asset and subsequently amortize the deferred debt issuance costs ratablymay not be recoverable. Lease expense for operating leases is recognized on a straight-line basis over the lease term.
The Company elected a practical expedient to account for lease and non-lease components together as a single lease component. The Company also elected the short-term lease recognition exemption for all classes of lease assets with an original term of twelve months or less. As part of the line-of-credit arrangement, regardlesstransition, the Company elected a package of whether therepractical expedients allowing it to carry forward historical accounting for any expired or existing contracts that are any outstanding borrowings on the line-of-credit arrangement. The guidance was effective January 1, 2016. The Company early adopted the standards effective December 31, 2015or contain lease contracts, including classification of such contracts and elected to continue to classify debt issuanceinitial direct costs associated with its revolving linethem.
The adoption of creditTopic 842 on January 1, 2019 resulted in other assets. Although the impactrecognition of applying these standards to its existing revolving facility has been immaterial, the standards couldRoU Assets for operating leases of $177,597 and operating lease liabilities of $173,863. The adoption of Topic 842 did not have a significantmaterial impact on the accountingconsolidated statement of income and comprehensive income, consolidated statement of changes in stockholders’ equity or the consolidated statement of cash flows.
See Note 7 “Leases” in the condensed consolidated financial statements for future borrowings.additional information regarding leases.
Pending Accounting Standards
From time to time, new accounting pronouncements are issued by the FASB or other standards-setting bodies that the Company will adopt according to the various timetables the FASB specifies. Unless otherwise discussed below, the Company believes the impact of recently issued standards that are not yet effective will not have a material impact on its consolidated financial position, results of operations and cash flows upon adoption.
Stock-Based Compensation — Effective January 1, 2017, the Company will be required to adopt the various amendments in ASU 2016-09, Compensation - Stock Compensation (Topic 718): Improvements to Employee Share-Based Payment Accounting. The provisions of the new guidance affecting the Company require excess tax benefits and tax deficiencies to be recorded in the income statement when the awards vest or are settled; remove the requirement to include hypothetical excess tax benefits in the application of the treasury stock method when computing earnings per share; and provided for a new policy election to either: (1) continue applying forfeiture rate estimates in the determination of compensation cost, or (2) account for forfeitures as a reduction of share-based compensation cost as they occur. The new guidance also requires cash flows related to excess tax benefits to be classified as an operating activity in the cash flow statement and now requires shares withheld for tax withholding purposes to be classified as a financing activity.
While the Company is still evaluating the impact of adoption of the new guidance, it believes the new standard will cause volatility in its effective tax rates as well as basic and diluted earnings per share due to the tax effects related to share-based payments being recorded to the income statement (rather than equity.) The volatility in future periods will depend on the Company’s stock price at the awards’ vesting dates, geographical mix and tax rates in applicable jurisdictions, as well as the number of awards that vest in each period. The Company will adopt provisions related to recognition of excess tax benefits and tax deficiencies in income on a prospective basis and is in the process of evaluating transition alternatives for various other provisions of the new guidance. The Company will not change its accounting policy and will continue to estimate forfeitures in the determination of its compensation cost. In addition, cash flows related to excess tax benefits will be included in cash provided by operating activities and will no longer be separately classified as a financing activity. Further, consistent with historical presentation, the Company will continue to classify shares withheld for tax withholding purposes as a financing activity.
Simplifying the Measurement for Goodwill — Effective January 1, 2017, the Company will early adopt the new accounting guidance simplifying the accounting for goodwill impairment. The guidance removes Step 2 of the goodwill impairment test, which requires a hypothetical purchase price allocation. A goodwill impairment will now be the amount by which a reporting unit’s carrying value exceeds its fair value, not to exceed the carrying amount of goodwill. The new guidance will be applied prospectively. The Company does not expect the adoption of this amended guidance to have an impact on its financial results.
Revenue Recognition — In May 2014, the FASB issued ASU 2014-09, Revenue from Contracts with Customers (Topic 606). The core principle of ASU 2014-09 is that an entity should recognize revenue to depict the transfer of promised goods or services in an amount that reflects the consideration to which the entity expects to be entitled in exchange for those goods or services. ASU 2014-09 will replace most existing revenue recognition guidance in GAAP and permits the use of either the retrospective or modified retrospective transition method. The update requires significant additional disclosure about the nature, amount, timing and uncertainty of revenue and cash flows arising from customer contracts, including significant judgments and changes in judgments. ASU 2014-09, as amended by ASU 2015-14, Revenue from Contracts with Customers (Topic 606): Deferral of the Effective Date, is effective for years beginning after December 15, 2017, including interim periods, with early adoption permitted for years beginning after December 15, 2016. Since the issuance of ASU 2014-09, the FASB has issued additional interpretive guidance, including new accounting standards updates, that clarify certain points of the standard and modify certain requirements.
The Company has performed a review of the requirements of the new revenue standard and is monitoring the activity of the FASB and the transition resource group as it relates to specific interpretive guidance. It is reviewing customer contracts and is in the process of applying the five-step model of the new standard to each contract category it has identified and will compare the results to its current accounting practices. The Company plans to adopt ASU 2014-09, as well as other clarifications and technical guidance issued by the FASB related to this new revenue standard, on January 1, 2018.
The Company expects the new standard could change the amount and timing of revenue and costs under certain arrangement types. The Company is also assessing pricing provisions contained in certain of its customer contracts. Pricing provisions contained in some of its customer contracts represent variable consideration or may provide the customer with a material right, potentially resulting in a different allocation of the transaction price than under current guidance. Due to the complexity of certain of the Company’s contracts, the actual revenue recognition treatment required under the new standard for these arrangements may be dependent on contract-specific terms and may vary in some instances. The Company has not yet determined what impact the new guidance will have on its consolidated financial statements and/or related disclosures or concluded on the transition method. The Company expects to further its assessment of the financial impact of the new guidance on its consolidated financial statements in 2017.
Leases — Effective January 1, 2019, the Company will be required to adopt the new guidance of ASC Topic 842, Leases (with early adoption permitted effective January 1, 2018.) This amendment supersedes previous accounting guidance (Topic 840) and requires all leases, with the exception of leases with a term of twelve months or less, to be recorded on the balance sheet as lease assets and lease liabilities. The standard requires lessees and lessors to recognize and measure leases at the beginning of the earliest period presented using a modified retrospective approach. The modified retrospective approach includes a number of optional practical expedients that entities may elect to apply. These practical expedients relate to the identification and classification of leases that commenced before the effective date, initial direct costs for leases that commenced before the effective date, and the ability to use hindsight in evaluating lessee options to extend or terminate a lease or to purchase the underlying asset. An entity that elects to apply the practical expedients will, in effect, continue to account for leases that commence before the effective date in accordance with previous GAAP unless the lease is modified, except that lessees are required to recognize a right-of-use asset and a lease liability for all operating leases at each reporting date based on the present value of the remaining minimum rental payments that were tracked and disclosed under previous GAAP. The transition guidance in Topic 842 also provides specific guidance for the amounts previously recognized in accordance with the business combinations guidance for leases. The Company has not yet completed its assessment of the impact of the new guidance on its consolidated financial statements, when it will adopt the standard, or concluded on whether it will elect to apply practical expedients.
Measurement of Credit Losses on Financial Instruments — Effective January 1, 2020, the Company will be required to adopt the amended guidance of FASB ASC Topic 326, Financial Instruments -— Credit Losses (Topic 326): Measurement of Credit Losses on Financial instrumentsInstruments, (with early adoption permitted effective January 1, 2019.) The amendments in this update change how companies measure and recognize credit impairment for many financial assets. The new expected credit loss model will requirerequires companies to immediately recognize an estimate of credit losses expected to occur over the remaining life of the financial assets (including trade receivables) that are in the scope of the update. The update also made amendments to the current impairment model for held-to-maturity and available-for-sale debt securities and certain guarantees. Entities are required to adopt the standard using a modified-retrospective approach through a cumulative effect adjustment to retained earnings as of the beginning of the period of adoption. The Company hasdoes not yet completed its assessment of theexpect Topic 326 to have a material impact of the new guidance on its consolidated financial statements or concluded on when it will adopt the standard.
Tax Accounting for Intra-Entity Asset Transfers — Effective January 1, 2018, with early adoption permitted, the Company will be required to adopt the accounting guidance ASU 2016-16, Accounting for Income taxes: Inter-Entity Asset Transfers of Assets Other than Inventory, that will require the tax effects of intra-entity asset transfers to be recognized in the period when the transfer occurs. Under current guidance, the tax effects of intra-entity sales of assets are deferred until the transferred asset is sold to a third party or otherwise recovered through use. The new guidance does not apply to intra-entity transfers of inventory and is required to be applied on a modified retrospective basis through a cumulative effect adjustment to retained earnings as of the beginning of the period of adoption. The Company has not yet completed its assessment of the impact of the new guidance on its consolidated financial statements or concluded on when it will adopt the standard.statements.
The Company’s acquisitions allow it to expand into desirable geographic locations, complement its existing vertical markets, increase revenue and create new service offerings. Acquisitions were settled in cash and/or stock where a portion of the settlement price may have been deferred. For some transactions, purchase agreements contain contingent consideration in the form of an earnout obligation.
2015 Acquisitions
NavigationArts Continuum — On July 10, 2015,March 15, 2018, the Company acquired all of the outstanding equity of NavigationArts, Inc.Continuum Innovation LLC together with its subsidiaries (“Continuum”) to enhance the Company’s consulting capabilities as well as its digital and service design practices. Continuum, headquartered in Boston with offices located in Milan, Seoul, and Shanghai, focuses on four practices including strategy, physical and digital design, technology and its subsidiary, NavigationArts, LLC (collectively “NavigationArts”). The U.S.-based NavigationArts provided digital consulting, architecture and content solutions and was regarded as a leading user-experience agency.Made Real Lab. The acquisition of NavigationArtsContinuum added approximately 90125 design consultants to the Company’s headcount. In connection with the NavigationArtsContinuum acquisition, the Company paid $28,747 as$52,515 of cash consideration,and committed to making a cash earnout payment with a maximum amount payable of which $2,670 was placed in escrow for a period$3,135, subject to attainment of 18 months as security for the indemnification obligations of the sellers under the terms of the stock purchase agreement. In the first quarter of 2016, the Company decided to make a 338(h)(10) election to treat the NavigationArts acquisition as an asset purchase for tax purposes. As a result, during the second quarter of 2016 the Company paid an additional $1,797 to the sellers of NavigationArts, as provided forspecified performance targets in the stock purchase agreement. The acquired goodwill that is deductible12 months after the acquisition date. See Note 11“Fair Value Measurements” for tax purposes was $23,794 as of the date of the acquisition.more information regarding this earnout payment.
AGSThink — On November 16, 2015,1, 2018, the Company acquired all of the outstanding equity interests of Alliance Consulting Global Holdings, Inc including its wholly-owned directThink Limited (“Think”), a digital transformation agency headquartered in London, UK. This acquisition is intended to strengthen EPAM’s digital and indirect subsidiaries Alliance Global Services, Inc., Alliance Global Services, LLC, companies organized under the laws of the U.S., and Alliance Global Services IT India, a company organized under the laws of India (collectively, “AGS”). AGS provided software product development services and test automation solutions and had multiple locationsorganizational consulting capabilities in the United StatesUK and India. The acquisition of AGS added 1,151 IT professionals toWestern European markets and enhance the Company’s headcount in the United Statesglobal product and India.design offerings. In connection with the AGSThink acquisition, the Company paid $51,717 as$26,254 at closing and committed to making a cash consideration,earnout payment with a maximum amount payable based on exchange rates at the date of acquisition of $8,156 subject to attainment of specified performance targets in the 12 months after the acquisition date. During the year ended December 31, 2019, the Company paid $185 of net true-up payments which $5,000 was placed in escrowincreased the purchase price. See Note 11“Fair Value Measurements” for a period of 15 months as security formore information regarding the indemnification obligationsearnout payment.
test IO — On April 30, 2019, the Company acquired 100% of the sellers underequity interests of a crowdtesting company, test IO GmbH, and its subsidiary (“test IO”). In connection with the termstest IO acquisition, the Company paid $17,323 of the stock purchase agreement.cash.
The following is a summary oftable summarizes the estimated fair values of the net assets acquired atand liabilities assumed as of the date of acquisition as updated for any changes as of December 31, 2019 for each respective acquisition: |
| | | | | | | | | | | |
| | Continuum | | Think | | test IO |
| Cash and cash equivalents | $ | 2,251 |
| | $ | 2,344 |
| | $ | 663 |
|
| Trade receivables and contract assets | 9,139 |
| | 2,637 |
| | 688 |
|
| Prepaid and other current assets | 936 |
| | 900 |
| | 96 |
|
| Goodwill | 26,617 |
| | 20,477 |
| | 12,150 |
|
| Intangible assets | 14,450 |
| | 6,882 |
| | 6,219 |
|
| Property and equipment and other noncurrent assets | 8,902 |
| | 1,214 |
| | 151 |
|
| Total assets acquired | $ | 62,295 |
| | $ | 34,454 |
| | $ | 19,967 |
|
| Accounts payable, accrued expenses and other current liabilities | $ | 3,746 |
| | $ | 2,025 |
| | $ | 910 |
|
| Long-term debt (Note 8) | 3,220 |
| | — |
| | — |
|
| Other noncurrent liabilities | 490 |
| | — |
| | 1,734 |
|
| Total liabilities assumed | $ | 7,456 |
| | $ | 2,025 |
| | $ | 2,644 |
|
| Net assets acquired | $ | 54,839 |
| | $ | 32,429 |
| | $ | 17,323 |
|
During 2018, the Company adjusted initially recognized intangible assets acquired with Continuum and their useful lives, recognized an additional intangible asset in the form of a favorable lease, removed a noncurrent liability associated with an initially recognized unfavorable lease and revised the initial fair value of contingent consideration. The Company also finalized a working capital adjustment that resulted in cash collection in the amount of $76 reducing the original amount of the net assets acquired. These adjustments resulted in a corresponding decrease to the originally recognized value of acquired goodwill. During the first quarter of 2019, the Company finalized the fair value of the assets acquired and liabilities assumed in the acquisition as originally reported duringof Continuum and no additional adjustments were recorded.
During 2019, the year 2015Company recorded purchase price adjustments which increased the original purchase price for Think by $185, with a corresponding adjustment to net assets acquired. In addition, the Company recorded a $1,497 increase in deferred tax assets and at December 31, 2016:
|
| | | | | | | | | | | | | | | | | | | | | | | | |
| | | NavigationArts | | AGS | | Total |
| | | As Originally Reported | | Final as of September 30, 2016 | | As Originally Reported | | Final as of December 31, 2016 | | As Originally Reported | | Final as of
December 31,
2016 |
| Cash and cash equivalents | | $ | 1,317 |
| | $ | 1,317 |
| | $ | 1,727 |
| | $ | 1,727 |
| | $ | 3,044 |
| | $ | 3,044 |
|
| Accounts receivable and other current assets | | 3,920 |
| | 3,920 |
| | 10,600 |
| | 9,934 |
| | 14,520 |
| | 13,854 |
|
| Property and equipment and other long-term assets | | 230 |
| | 230 |
| | 1,665 |
| | 1,600 |
| | 1,895 |
| | 1,830 |
|
| Deferred tax assets | | — |
| | — |
| | 4,996 |
| | 5,722 |
| | 4,996 |
| | 5,722 |
|
| Acquired intangible assets | | 1,500 |
| | 2,800 |
| | 10,000 |
| | 22,700 |
| | 11,500 |
| | 25,500 |
|
| Goodwill | | 23,822 |
| | 23,794 |
| | 33,815 |
| | 24,454 |
| | 57,637 |
| | 48,248 |
|
| Total assets acquired | | 30,789 |
| | 32,061 |
| | 62,803 |
| | 66,137 |
| | 93,592 |
| | 98,198 |
|
| Accounts payable and accrued expenses | | 871 |
| | 871 |
| | 3,087 |
| | 2,760 |
| | 3,958 |
| | 3,631 |
|
| Bank loans and other long-term liabilities | | — |
| | — |
| | — |
| | 295 |
| | — |
| | 295 |
|
| Deferred revenue | | 50 |
| | 50 |
| | 1,049 |
| | 1,049 |
| | 1,099 |
| | 1,099 |
|
| Due to employees | | 596 |
| | 596 |
| | 3,010 |
| | 2,342 |
| | 3,606 |
| | 2,938 |
|
| Deferred tax liabilities | | 525 |
| | — |
| | 3,800 |
| | 7,974 |
| | 4,325 |
| | 7,974 |
|
| Total liabilities assumed | | 2,042 |
| | 1,517 |
| | 10,946 |
| | 14,420 |
| | 12,988 |
| | 15,937 |
|
| Net assets acquired | | $ | 28,747 |
| | $ | 30,544 |
| | $ | 51,857 |
| | $ | 51,717 |
| | $ | 80,604 |
| | $ | 82,261 |
|
As of December 31, 2016, and during2019, the period since the date of each respective acquisition up through December 31, 2016, or the date purchase accounting was finalized, as applicable, the Company made updates to the initially reported acquired balances and has finalized the valuation of intangible assets acquired in connection with the balancesacquisition of NavigationArtstest IO. For the acquisition of test IO, estimated fair values of the income tax-related assets acquired and AGS. For NavigationArts, finalizationliabilities assumed remain provisional and based on the facts and circumstances that existed as of the acquisition date. The Company expects to complete the purchase price allocation includedas soon as practicable but no later than one year from the acquisition date. During 2019, the Company recorded purchase price adjustments to intangible assets to reflectwhich increased the resultsoriginal purchase price for test IO and adjusted related working capital accounts increasing the original amount of a final valuation report as well as certain adjustments made to goodwill and deferred tax liabilities as a result of the 338(h)(10) election to treat the NavigationArts acquisition as an asset purchase for tax purposes, increasing net assets acquired by $1,797. For AGS$119. In addition for the test IO acquisition, the Company made adjustments to goodwill,reduced the value of acquired intangible assets deferred taxes and working capital, resulting inby $145 with a decrease of $140corresponding increase to the net assets acquired, as well as reclassified certain liabilities out of accrued expenses into a separate category.goodwill.
The adjustments identified above did not significantly impact our previously reported net income of prior periods and, as such, prior period amounts have not been retrospectively adjusted.
The following table presents the estimated fair values and useful lives of intangible assets acquired from Continuum, Think, and test IO as of the date of acquisition and updated for any changes during the year ended December 31, 2015:2019 for each respective acquisition: |
| | | | | | | | | | | | | | | | | |
| | Continuum | | Think | | test IO |
| | Weighted Average Useful Life (in years) | | Amount | | Weighted Average Useful Life (in years) | | Amount | | Weighted Average Useful Life (in years) | | Amount |
| Customer relationships | 6.5 | | $ | 5,800 |
| | 7 | | $ | 6,117 |
| | 7 | | $ | 2,456 |
|
| Favorable lease | 11.2 | | 5,500 |
| | — | | — |
| | — | | — |
|
| Software | — | | — |
| | — | | — |
| | 6 | | 3,461 |
|
| Contract royalties | 8 | | 1,900 |
| | — | | — |
| | — | | — |
|
| Trade names | 5 | | 1,250 |
| | 5 | | 765 |
| | 4 | | 302 |
|
| Total | | | $ | 14,450 |
| | | | $ | 6,882 |
| | | | $ | 6,219 |
|
|
| | | | | | | | | | | |
| | NavigationArts | | AGS |
| | Weighted Average Useful Life (in years) | | Amount | | Weighted Average Useful Life (in years) | | Amount |
| Customer relationships | 10 | | $ | 2,800 |
| | 10 | | $ | 22,700 |
|
| Total | | | $ | 2,800 |
| | | | $ | 22,700 |
|
2014 Acquisitions
The following table discloses details of purchase price consideration of each of the 2014 acquisitions: |
| | | | | | | | | | | | | | | | | | | | | | | | | | | | | | | | | | | | | | | | |
| Name of Acquisition | | Effective Date of Acquisition | | Common Shares | | Fair Value of Common Shares | | Cash, Net of Working Capital and Other Adjustments | | Recorded Earnout Payable | | Total Recorded Purchase Price | | Maximum Potential Earnout Payable |
| | | Issued | | Deferred | | Issued | | Deferred | | Paid | | Deferred | | Cash | | Stock | | |
| | | | | (in shares) | | (in thousands) |
| Netsoft | | March 5, 2014 | | — |
| | — |
| | $ | — |
| | $ | — |
| | $ | 2,403 |
| | $ | 1,022 |
| | $ | 1,825 |
| | $ | — |
| | $ | 5,250 |
| | $ | 1,825 |
|
| Jointech | | April 30, 2014 | | — |
| | 89,552 |
| | — |
| | 2,788 |
| | 10,000 |
| | 4,000 |
| | 15,000 |
| | 5,000 |
| | 36,788 |
| | 20,000 |
|
| GGA* | | June 6, 2014 | | — |
| | — |
| | — |
| | — |
| | 14,892 |
| | — |
| | 11,400 |
| | — |
| | 26,292 |
| | |
| Great Fridays | | October 31, 2014 | | — |
| | — |
| | — |
| | — |
| | 10,777 |
| | — |
| | 1,173 |
| | — |
| | 11,950 |
| | 1,173 |
|
| | | | | — |
| | 89,552 |
| | $ | — |
| | $ | 2,788 |
| | $ | 38,072 |
| | $ | 5,022 |
| | $ | 29,398 |
| | $ | 5,000 |
| | $ | 80,280 |
| | |
* Earn-out for GGA had no maximum limit. The determination period ended as of December 31, 2014.
Common shares issued in connection with acquisitions, if applicable, are valued at closing market prices as of the effective date of the applicable acquisition. The maximum potential earnout payables disclosed in the foregoing table represent the maximum amount of additional consideration that could be paid pursuant to the terms of the purchase agreement for the applicable acquisition. The amounts recorded as earnout payables, which are based upon the estimated future operating results of the acquired businesses within a seven-to-twelve-month period subsequent to the acquisition date, are measured at fair value as of the acquisition date and are included on that basis in the recorded purchase price consideration in the foregoing table. The Company records any subsequent changes in the fair value of the earnout obligations in its consolidated income from operations. Please see Note 17 for discussion of significant inputs and assumptions relating to the earnout obligations. All earnout obligations for these acquisitions have been settled.
Netsoft — On March 5, 2014, the Company completed an acquisition of substantially all of the assets and assumed certain specific liabilities of U.S.-based healthcare technology consulting firm Netsoft Holdings LLC and Armenia-based Ozsoft, LLC (collectively, “Netsoft”). As a result of this transaction, substantially all of the employees of Netsoft, including approximately 40 IT professionals, accepted employment with the Company. In connection with the Netsoft acquisition,adoption of Topic 842, effective January 1, 2019, the Company agreedreclassified the favorable lease intangible asset to issue 2,289 restricted shares of Company common stockOperating lease right-of-use assets.
The goodwill recognized as consideration for future services to key management and employees of Netsoft (the “Netsoft Closing Shares”). The Company agreed to pay deferred consideration consisting partly of 9,154 restricted shares of Company common stock. During the first quarter of 2015, the Company issued 16,349 restricted shares of Company common stock to Netsoft for achieving certain performance targets (collectively with the Netsoft Closing Shares, the “Netsoft Employment Shares”). The Netsoft Employment Shares vest in equal annual installments over a three-year period starting from the date of acquisition. All unvested shares will be forfeited upon termination of services by the Company for cause or by the employee other than for good reason. The Netsoft Employment Shares had an estimated value of $1,017 at the time of grant and were recorded as stock-based compensation expense over an associated service period of three years (Note 14). The acquired goodwill that is deductible for tax purposes was $924 as of the date of the acquisition: this amount excludes additional tax deductible amounts resulting from vesting of the employment shares.
Jointech — On April 30, 2014, the Company acquired all of the outstanding equity of Joint Technology Development Limited, a company organized under the laws of Hong Kong, including its wholly-owned subsidiaries Jointech Software (Shenzhen) Co., Ltd., a company organized under the laws of China, and Jointech Software Pte. Ltd., a company organized under the laws of Singapore (collectively, “Jointech”). Jointech provides strategic technology services to multi-national organizations in investment banking, wealth and asset management. As a result of this transaction, substantially all employees of Jointech, including approximately 216 IT professionals, accepted employment with the Company. In connection with the Jointech acquisition, the Company issued 89,552 shares of the Company common stockacquisitions is attributable primarily to a former owner of Jointech as consideration for future services on or about the six-month anniversary from the date of acquisition (the “Jointech Closing Shares”). Furthermore, during the second quarter of 2015, the Company issued 83,057 restricted shares of Company common stock to Jointech for achieving certain performance targets (collectively with the Jointech Closing Shares, the “Jointech Employment Shares”). The Jointech Employment Shares vest in equal annual installments over a three-year period starting from the date of acquisition.
All unvested Jointech Employment Shares will be forfeited upon termination of services for cause by the Company or other than for good reason (as applicable) by either of the two former owners of the acquired business. The aggregate fair value of the Jointech Employment Shares at the date of grant was $7,788strategic and will be recorded as stock-based compensation expense over an associated service period of three years (Note 14).
GGA — On June 6, 2014, the Company acquired substantially all of the assets and assumed certain specific liabilities of GGA Software Services, LLC, Institute of Theoretical Chemistry, Inc., and GGA’s Russian affiliate (collectively, “GGA”). Established in 1994, GGA develops scientific informatics applications and content databases; creates state-of-the-art algorithms and models; and delivers IT support, maintenance, and QA servicessynergistic opportunities related to the world’s leading healthcareconsulting and life sciences companies. Asdesign businesses, the assembled workforces acquired and other factors. The goodwill acquired as a result of this transaction, substantially all employeesthe Continuum acquisition is expected to be deductible for income tax purposes while the goodwill acquired as a result of GGA, including approximately 329 IT professionalsthe Think and 126 scientists, accepted employment withtest IO acquisitions is not expected to be deductible for income tax purposes.
Revenues generated by test IO, acquired on April 30, 2019, totaled $4,539 for the Company. In connection withyear ended December 31, 2019.
Pro forma results of operations have not been presented because the GGA acquisition,effect of the acquisitions on the Company’s consolidated financial statements was not material individually or in the aggregate.
Other 2019 Acquisitions — During the year ended December 31, 2019, the Company agreedcompleted 4 additional acquisitions with an aggregate cash purchase price of $24,786 and committed to issue 262,277 sharesmaking cash earnout payments with a maximum amount payable of the Company common stock to the former owners of GGA as consideration for future services (the “GGA Closing Shares”). Furthermore, during the second quarter of 2015, the Company issued 233,753 restricted shares of Company common stock to the former owners of GGA for achieving certain performance targets (collectively with the GGA Closing Shares, the “GGA Employment Shares”). The GGA Employment Shares vest in equal annual installments over a three-year period starting from the date of acquisition. With respect to each former owner, all unvested shares will be forfeited upon either termination of services by the Company for cause or by the employee other than for good reason. The aggregate fair value of the GGA Employment Shares at the date of grant was $20,655 and will be recorded as stock-based expense over an associated service period of three years (Note 14). The acquired goodwill that is deductible for tax purposes was $7,306 as of the date of the acquisition; this amount excludes additional tax deductible amounts resulting from vesting of the employment shares.
Great Fridays — On October 31, 2014, the Company acquired all of the outstanding equity of Great Fridays Limited and its subsidiaries with intent to expand the Company’s product and design service portfolio. Great Fridays Limited, headquartered in Manchester, UK, with offices in London, San Francisco and New York, focuses on bridging the gap between business and design. The acquisition of Great Fridays added approximately 50 creative design professionals to the Company’s headcount. In connection with the Great Fridays acquisition, the Company agreed to issue 90,864 shares of the Company common stock to the former owners of Great Fridays as consideration for future services (the “Great Fridays Closing Shares”). Furthermore, during the second quarter of 2015,$3,000 subject to attainment of specified performance targets the Company issuedranging from 12 months to 24 months after the former owners of Great Fridays 10,092 shares of the Company common stock (collectively with Great Fridays Closing Shares, the “GF Employment Shares”). The GF Employment Shares vest in equal annual installments over a three-year period starting from the date of acquisition. With respect to each former owner, all unvested shares will be forfeited upon either termination of services by the Company for cause or by the employee other than for good reason. The aggregate fair value of the GF Employment Shares at the date of grant was $4,823 and will be recorded as stock-based compensation expense over an associated service period of three years (Note 14).
The following is a summary of the estimated fair values of the net assets acquired at the date of each respective acquisition dates. These acquisitions increased EPAM’s educational service and platform offerings and expanded the Company’s geographical reach, as well as added $7,488 in intangible assets, consisting mainly of customer relationships. Revenues generated by these other 2019 acquisitions totaled $9,336 during the year ended December 31, 2014 as originally reported in2019. Pro forma results of operations have not been presented because the quarterly condensedeffect of these acquisitions on the Company’s consolidated financial statements and at December 31, 2015:was not material individually or in the aggregate. |
| | | | | | | | | | | | | | | | | | | | | | | | | | | | | | | | | | | | | | | |
| | Netsoft | | Jointech | | GGA | | Great Fridays | | Total |
| | As Originally Reported | | Final as of March 31, 2015 | | As Originally Reported | | Final as of June 30, 2015 | | As Originally Reported | | Final as of June 30, 2015 | | As Originally Reported | | Final as of December 31, 2015 | | As Originally Reported | | Final as of December 31, 2015 |
| Cash and cash equivalents | $ | — |
| | $ | — |
| | $ | 871 |
| | $ | 871 |
| | $ | — |
| | $ | — |
| | $ | 259 |
| | $ | 259 |
| | $ | 1,130 |
| | $ | 1,130 |
|
| Trade receivables and other current assets | 788 |
| | 788 |
| | 784 |
| | 784 |
| | 5,157 |
| | 5,377 |
| | 1,825 |
| | 1,825 |
| | 8,554 |
| | 8,774 |
|
| Property and equipment and other long-term assets | 52 |
| | 52 |
| | 338 |
| | 338 |
| | 444 |
| | 306 |
| | 262 |
| | 262 |
| | 1,096 |
| | 958 |
|
| Deferred tax assets | 351 |
| | — |
| | — |
| | — |
| | 4,463 |
| | — |
| | — |
| | — |
| | 4,814 |
| | — |
|
| Acquired intangible assets | 1,700 |
| | 1,700 |
| | 25,744 |
| | 15,312 |
| | 10,959 |
| | 16,000 |
| | 5,747 |
| | 200 |
| | 44,150 |
| | 33,212 |
|
| Goodwill | 2,776 |
| | 2,779 |
| | 11,033 |
| | 23,758 |
| | 6,496 |
| | 7,306 |
| | 6,947 |
| | 11,262 |
| | 27,252 |
| | 45,105 |
|
| Total assets acquired | 5,667 |
| | 5,319 |
| | 38,770 |
| | 41,063 |
| | 27,519 |
| | 28,989 |
| | 15,040 |
| | 13,808 |
| | 86,996 |
| | 89,179 |
|
| Accounts payable and accrued expenses | 69 |
| | 69 |
| | 728 |
| | 728 |
| | 2,593 |
| | 2,593 |
| | 872 |
| | 807 |
| | 4,262 |
| | 4,197 |
|
| Deferred revenue | — |
| | — |
| | — |
| | — |
| | — |
| | 104 |
| | 317 |
| | 317 |
| | 317 |
| | 421 |
|
| Due to employees | — |
| | — |
| | 1,254 |
| | 1,254 |
| | — |
| | — |
| | 624 |
| | 624 |
| | 1,878 |
| | 1,878 |
|
| Deferred tax liabilities | — |
| | — |
| | — |
| | 2,293 |
| | — |
| | — |
| | 1,200 |
| | 110 |
| | 1,200 |
| | 2,403 |
|
| Total liabilities assumed | 69 |
| | 69 |
| | 1,982 |
| | 4,275 |
| | 2,593 |
| | 2,697 |
| | 3,013 |
| | 1,858 |
| | 7,657 |
| | 8,899 |
|
| Net assets acquired | $ | 5,598 |
| | $ | 5,250 |
| | $ | 36,788 |
| | $ | 36,788 |
| | $ | 24,926 |
| | $ | 26,292 |
| | $ | 12,027 |
| | $ | 11,950 |
| | $ | 79,339 |
| | $ | 80,280 |
|
As of December 31, 2015 the fair values of the assets acquired and liabilities assumed and the related purchase price allocation for the 2014 acquisitions have been finalized.
As of December 31, 2015, and during the period since the date of each respective acquisition up through December 31, 2015, or the date purchase accounting was finalized, as applicable, the Company made updates to the initially reported acquired balances and has finalized the valuation of the balances of Netsoft, Jointech, GGA and Great Fridays. For Netsoft, the deferred tax assets and goodwill were adjusted decreasing the net assets acquired by $348. For Jointech, intangible assets were adjusted to reflect the final fair value of intangible assets acquired and a deferred tax liability was established, both increasing goodwill with no change to the net assets acquired. For GGA, the final working capital adjustment was completed, deferred tax assets were netted with additional recognized deferred tax liabilities and additional accounts receivable and deferred revenue were recognized. In addition, intangible assets and property and equipment were adjusted to reflect the final fair value of the assets acquired. These adjustments resulted in an overall increase to goodwill and increased the net assets acquired by $1,366. For Great Fridays, the value of the intangible assets and associated deferred tax liabilities were reduced based on the final fair value estimates of acquired intangible assets, which increased goodwill. These adjustments resulted in a decrease in net assets acquired by $77.
The adjustments identified above did not significantly impact our previously reported net income of prior periods and, as such, prior period amounts have not been retrospectively adjusted.
The following table presents the estimated fair values and useful lives of intangible assets acquired duringDuring the year ended December 31, 2014: |
| | | | | | | | | | | | | | | | | | | | | | | |
| | Netsoft | | Jointech | | GGA | | Great Fridays |
| | Weighted Average
Useful Life
(in years) | | Amount | | Weighted Average
Useful Life
(in years) | | Amount | | Weighted Average
Useful Life
(in years) | | Amount | | Weighted Average
Useful Life
(in years) | | Amount |
| Customer relationships | 10 | | $ | 1,700 |
| | 10 | | $ | 15,000 |
| | 10 | | $ | 16,000 |
| | 3 | | $ | 200 |
|
| Trade names | — | | — |
| | 2 | | 312 |
| | — | | — |
| | — | | — |
|
| Total | | | $ | 1,700 |
| | | | $ | 15,312 |
| | | | $ | 16,000 |
| | | | $ | 200 |
|
As of December 31, 2016, the companies acquired during 2015 and 2014 have been significantly integrated into2017, the Company completed acquisitions with aggregated purchase price of $6,980. These acquisitions individually and as such, it isin the aggregate are not possiblematerial to precisely report their individual post-acquisition results of operations.the Company’s consolidated financial statements.
4.3.GOODWILL AND INTANGIBLE ASSETS, — NET
Goodwill by reportable segment was as follows: |
| | | | | | | | | | | | | | | |
| | North America | | Europe | | Russia | | Total |
| Balance as of January 1, 2018 | $ | 77,290 |
| | $ | 42,241 |
| | $ | — |
| | $ | 119,531 |
|
| Continuum acquisition (Note 2) | 26,617 |
| | — |
| | — |
| | 26,617 |
|
| Think acquisition (Note 2) | — |
| | 22,482 |
| | — |
| | 22,482 |
|
| Effect of currency translation | (365 | ) | | (1,433 | ) | | — |
| | (1,798 | ) |
| Balance as of December 31, 2018 | 103,542 |
| | 63,290 |
| | — |
| | 166,832 |
|
| test IO acquisition (Note 2) | 3,301 |
| | 8,849 |
| | — |
| | 12,150 |
|
| Other 2019 acquisitions (Note 2) | 6,503 |
| | 9,546 |
| | 738 |
| | 16,787 |
|
| Think purchase accounting adjustments | — |
| | (2,043 | ) | | — |
| | (2,043 | ) |
| Effect of currency translation | $ | 80 |
| | $ | 1,231 |
| | $ | 6 |
| | 1,317 |
|
| Balance as of December 31, 2019 | $ | 113,426 |
| | $ | 80,873 |
| | $ | 744 |
| | $ | 195,043 |
|
|
| | | | | | | | | | | |
| | North America | | Europe | | Total |
| Balance as of January 1, 2015 | $ | 31,078 |
| | $ | 26,339 |
| | $ | 57,417 |
|
| Acquisition of NavigationArts (Note 3) | 23,822 |
| | — |
| | 23,822 |
|
| Acquisition of AGS (Note 3) | 33,815 |
| | — |
| | 33,815 |
|
| Netsoft purchase accounting adjustment (Note 3) | 30 |
| | — |
| | 30 |
|
| Jointech purchase accounting adjustment (Note 3) | — |
| | 6,181 |
| | 6,181 |
|
| GGA purchase accounting adjustment (Note 3) | (4,807 | ) | | — |
| | (4,807 | ) |
| Great Fridays purchase accounting adjustment (Note 3) | — |
| | 4,315 |
| | 4,315 |
|
| NavigationArts purchase accounting adjustment (Note 3) | (2,058 | ) | | — |
| | (2,058 | ) |
| Effect of net foreign currency exchange rate changes | (416 | ) | | (2,369 | ) | | (2,785 | ) |
| Balance as of December 31, 2015 | 81,464 |
| | 34,466 |
| | 115,930 |
|
| NavigationArts purchase accounting adjustment (Note 3) | 2,030 |
| | — |
| | 2,030 |
|
| AGS purchase accounting adjustment (Note 3) | (9,361 | ) | | — |
| | (9,361 | ) |
| Other acquisitions | 2,404 |
| | 177 |
| | 2,581 |
|
| Other acquisitions purchase accounting adjustment | 395 |
| | 87 |
| | 482 |
|
| Effect of net foreign currency exchange rate changes | (120 | ) | | (2,253 | ) | | (2,373 | ) |
| Balance as of December 31, 2016 | $ | 76,812 |
| | $ | 32,477 |
| | $ | 109,289 |
|
Excluded from the table above are the Russia and Other segments.
The Company performed an annualRussia segment had accumulated goodwill impairment test as of October 31, 2014 in accordance with ASC No. 350, “Intangibles-Goodwill and Other.” In assessing impairment both qualitatively and quantitatively based on the total of the expected future discounted cash flows directly related to the Russia reporting unit, the Company determined that the fair value of the reporting unit was below the carrying value of the reporting unit. The Company completed the second step of the goodwill impairment test, resulting in an impairment chargelosses of $2,241 in the Russia segment. Asas of December 31, 20162019, 2018 and 2015 the book value of the goodwill related to the Russia segment was zero. All existing assets that related to the Russia segment, excluding goodwill, were assessed by management and deemed to not be impaired.
As a result of an operating loss in the Other reporting unit for the three months ended June 30, 2011, the Company performed a goodwill impairment test. In assessing impairment in accordance with ASC No. 350, “Intangibles-Goodwill and Other,” the Company determined that the fair value of the Other reporting unit, based on the total of the expected future discounted cash flows directly related to the reporting unit, was below the carrying value of the reporting unit. The Company completed the second step of the goodwill impairment test, resulting in an impairment charge of $1,697 in the Other reportable segment. As of December 31, 2016, and 2015 the book value of the goodwill related to the Other segment was zero.
2017. There were no0 accumulated impairmentsgoodwill impairment losses in the North America or Europe reportable segments as of December 31, 2016, 20152019, 2018 or 2014.2017.
As part of the AGS and NavigationArts acquisitions in 2015, substantially all of the employees of these companies continued employment. The Company believes the amount of goodwill resulting from the allocation of the purchase price to acquire each of the businesses is attributable to the workforce of the acquired businesses. All of the goodwill was allocated to the Company’s U.S. operations and is presented within the North America segment.
As part of the Jointech acquisition in 2014, substantially all of the employees of Jointech continued employment. The Company believes the amount of goodwill resulting from the allocation of purchase price to acquire Jointech is attributable to the workforce of the acquired business. Based on the determination of the reportable units, Jointech has been placed in the Europe reportable unit based on managerial responsibility and consistent with segment reporting. All of the goodwill was allocated to the Company’s UK operations and is presented within the Europe segment.
As part of the Netsoft, GGA and Great Fridays acquisitions in 2014, substantially all of the employees of these companies accepted employment with the Company. The Company believes the amount of goodwill resulting from the allocation of purchase price to acquire each of the businesses is attributable to the workforce of the acquired businesses. All of the goodwill was allocated to the Company’s U.S. operations and is presented within North America.
Intangible assets other than goodwill for the years endedas of December 31, 20162019 and 20152018 were as follows:
| | | | As of December 31, 2016 | As of December 31, 2019 |
| | Weighted average life at acquisition (in years) | | Gross carrying amount | | Accumulated amortization | | Net carrying amount | Weighted average life at acquisition (in years) | | Gross carrying amount | | Accumulated amortization | | Net carrying amount |
| Customer relationships | 10 | | $ | 65,409 |
| | $ | (15,133 | ) | | $ | 50,276 |
| 9 | | $ | 87,489 |
| | $ | (38,526 | ) | | $ | 48,963 |
|
| Software | | 6 | | 4,472 |
| | (486 | ) | | 3,986 |
|
| Trade names | 5 | | 5,622 |
| | (4,661 | ) | | 961 |
| 5 | | 6,439 |
| | (4,753 | ) | | 1,686 |
|
| Non-competition agreements | 4 | | 756 |
| | (733 | ) | | 23 |
| |
| Contract royalties | | 8 | | 1,900 |
| | (435 | ) | | 1,465 |
|
| Assembled workforce | | 3 | | 158 |
| | — |
| | 158 |
|
| Total |
| | $ | 71,787 |
| | $ | (20,527 | ) | | $ | 51,260 |
|
| | $ | 100,458 |
| | $ | (44,200 | ) | | $ | 56,258 |
|
|
| | | | | | | | | | | | | |
| | As of December 31, 2018 |
| | Weighted average life at acquisition (in years) | | Gross carrying amount | | Accumulated amortization | | Net carrying amount |
| Customer relationships | 9.5 | | $ | 78,042 |
| | $ | (29,580 | ) | | $ | 48,462 |
|
| Favorable lease | 11.2 | | 5,500 |
| | (410 | ) | | 5,090 |
|
| Trade names | 5.3 | | 6,111 |
| | (4,300 | ) | | 1,811 |
|
| Contract royalties | 8 | | 1,900 |
| | (198 | ) | | 1,702 |
|
| Total | | | $ | 91,553 |
| | $ | (34,488 | ) | | $ | 57,065 |
|
|
| | | | | | | | | | | | | |
| | As of December 31, 2015 |
| | Weighted average life at acquisition (in years) | | Gross carrying amount | | Accumulated amortization | | Net carrying amount |
| Customer relationships | 10 | | $ | 52,974 |
| | $ | (8,387 | ) | | $ | 44,587 |
|
| Trade names | 5 | | 5,853 |
| | (3,772 | ) | | 2,081 |
|
| Non-competition agreements | 4 | | 746 |
| | (554 | ) | | 192 |
|
| Total | | | $ | 59,573 |
| | $ | (12,713 | ) | | $ | 46,860 |
|
All of the intangible assets other than goodwill have finite lives and as such are subject to amortization. RecognizedAmortization of the other intangible assets is recognized in depreciation and amortization expense for each of the years ended December 31 is presented in the consolidated statements of income and comprehensive income.
The following table below:
|
| | | | | | | | | | | | |
| | | For the Years Ended December 31, |
| | | 2016 | | 2015 | | 2014 |
| Customer relationships | | $ | 6,858 |
| | $ | 3,961 |
| | $ | 3,843 |
|
| Trade names | | 1,139 |
| | 1,280 |
| | 1,319 |
|
| Non-competition agreements | | 173 |
| | 175 |
| | 187 |
|
| Total | | $ | 8,170 |
| | $ | 5,416 |
| | $ | 5,349 |
|
Estimatedpresents amortization expense related torecognized for the periods indicated: |
| | | | | | | | | | | | |
| | | For the Years Ended December 31, |
| | | 2019 | | 2018 | | 2017 |
| Customer relationships | | $ | 8,743 |
| | $ | 7,637 |
| | $ | 6,643 |
|
| Software | | 486 |
| | — |
| | — |
|
| Trade names | | 447 |
| | 266 |
| | 896 |
|
| Contract royalties | | 238 |
| | 198 |
| | — |
|
| Favorable lease | | — |
| | 410 |
| | — |
|
| Non-competition agreements | | — |
| | — |
| | 23 |
|
| Total | | $ | 9,914 |
| | $ | 8,511 |
| | $ | 7,562 |
|
Based on the carrying value of the Company’s existing intangible assets as of December 31, 2019, the estimated amortization expense for the next fivefuture years ending December 31 wasis as follows: |
| | | | |
Year ending December 31,
| | Amount |
| 2020 | | $ | 11,322 |
|
| 2021 | | 11,322 |
|
| 2022 | | 11,126 |
|
| 2023 | | 9,526 |
|
| 2024 | | 7,023 |
|
| Thereafter | | 5,939 |
|
| Total | | $ | 56,258 |
|
|
| | | | |
| | | Amount |
| 2017 | | $ | 7,482 |
|
| 2018 | | 6,539 |
|
| 2019 | | 6,539 |
|
| 2020 | | 6,539 |
|
| 2021 | | 6,539 |
|
| Thereafter | | 17,622 |
|
| Total | | $ | 51,260 |
|
5.PREPAID AND OTHER ASSETS
Prepaid and other assets consisted of the following: |
| | | | | | | | |
| | | December 31,
2016 | | December 31,
2015 |
| Taxes receivable | | $ | 6,054 |
| | $ | 7,954 |
|
| Prepaid expenses | | 5,462 |
| | 4,693 |
|
| Unamortized software licenses and subscriptions | | 1,550 |
| | 699 |
|
| Security deposits under operating leases | | 1,323 |
| | 575 |
|
| Notes receivable, net of allowance of $580 and $0, respectively | | 710 |
| | — |
|
| Other, net of allowance of $64 and $0, respectively | | 591 |
| | 423 |
|
| Total | | $ | 15,690 |
| | $ | 14,344 |
|
| |
6.4. | EMPLOYEE LOANSPROPERTY AND ALLOWANCE FOR LOAN LOSSESEQUIPMENT, NET |
In 2012, the Board of Directors of the Company approved the Employee Housing Program (the “Housing Program”), which provides employees with loans to purchase housing in Belarus. The housing is sold directly to employees by independent third parties. The Housing Program was designed as a retention mechanism for the Company’s employees in BelarusProperty and is available to full-time qualified employees who have been with the Company for at least three years. The aggregate maximum lending limit of the program is $10,000, with no individual outstanding loans exceeding $50. In addition to the housing loans, the Company issues relocation loans in connection with intra-company transfers, as well as certain other individual loans.
During the year ended December 31, 2016, loans issued by the Company under the Housing Program were denominated in U.S. Dollars with a 5-year term and carried an interest rate of 7.5%.
At December 31, 2016 and December 31, 2015, categories of employee loans included in the loan portfolio were as follows: |
| | | | | | | |
| | December 31,
2016 | | December 31,
2015 |
| Housing loans | $ | 5,448 |
| | $ | 5,654 |
|
| Relocation and other loans | 530 |
| | 684 |
|
| Total employee loans | 5,978 |
| | 6,338 |
|
| Less: | |
| | |
|
| Allowance for loan losses | — |
| | — |
|
| Total loans, net of allowance for loan losses | $ | 5,978 |
| | $ | 6,338 |
|
During the years ended December 31, 2016 and 2015, the Company issued a total of $2,960 and $3,427 of loans to its employees, respectively, and received $3,273 and $3,547 in loan repayments during the same periods, respectively. No loans were written-off during the year ended December 31, 2016. There was one loan written-off during the year ended December 31, 2015.
There were no loans issued to principal officers, directors, or their affiliates during the years ended December 31, 2016, 2015 and 2014.
On a quarterly basis, the Company reviews the aging of its loan portfolio and evaluates the ability of employees to repay their debt on schedule. Factors considered in the review include historical payment experience, reasons for payment delays and shortfalls, if any, as well as probability of collecting scheduled principal and interest payments. As of December 31, 2016 and December 31, 2015, there were no material past due or non-accrual employee loans. The Company determined no allowance for loan losses was required regarding its employee loans as of December 31, 2016 and December 31, 2015 and there were no movements in the provision for loan losses during the years ended December 31, 2016, 2015 and 2014.
| |
7. | RESTRICTED CASH AND TIME DEPOSITS |
Restricted cash and time depositsequipment, net consisted of the following: |
| | | | | | | | | | |
| | | Weighted Average Useful Life (in years) | | As of
December 31,
2019 | | As of
December 31,
2018 |
| Computer hardware | | 3 | | $ | 96,286 |
| | $ | 74,884 |
|
| Buildings | | 47 | | 51,300 |
| | 34,458 |
|
| Purchased computer software | | 3 | | 32,115 |
| | 10,406 |
|
| Leasehold improvements | | 8 | | 30,634 |
| | 25,036 |
|
| Furniture, fixture and other equipment | | 7 | | 28,193 |
| | 21,544 |
|
| Office equipment | | 6 | | 18,901 |
| | 13,203 |
|
| Land improvements | | 18 | | 2,137 |
| | 1,474 |
|
| | | | | 259,566 |
| | 181,005 |
|
| Less accumulated depreciation and amortization | | | | (94,307 | ) | | (78,359 | ) |
| Total | | | | $ | 165,259 |
| | $ | 102,646 |
|
|
| | | | | | | |
| | December 31,
2016 | | December 31,
2015 |
| Restricted cash, short-term | $ | 2,400 |
| | $ | — |
|
| Time deposits | 403 |
| | 30,181 |
|
| Other long-term security deposits | 239 |
| | 238 |
|
| Total | $ | 3,042 |
| | $ | 30,419 |
|
As of December 31, 2015 time deposits consisted of a bank deposit of $30,181, earning interest at the rate of 0.74% placed with the Company’s Cyprus entity’s bank accounts in the United Kingdom. The deposit matured on March 11, 2016.
| |
8. | PROPERTY AND EQUIPMENT — NET |
Property and equipment consisted of the following: |
| | | | | | | | | | |
| | | Weighted Average Useful Life (in years) | | December 31,
2016 | | December 31,
2015 |
| Computer hardware | | 3 | | $ | 49,599 |
| | $ | 36,612 |
|
| Building | | 49 | | 34,012 |
| | 34,002 |
|
| Furniture and fixtures | | 7 | | 13,178 |
| | 8,990 |
|
| Office equipment | | 7 | | 9,416 |
| | 8,307 |
|
| Leasehold improvements | | 4 | | 7,944 |
| | 6,801 |
|
| Purchased computer software | | 5 | | 4,601 |
| | 4,099 |
|
| Land improvements | | 20 | | 1,467 |
| | 1,464 |
|
| | | | | 120,217 |
| | 100,275 |
|
| Less accumulated depreciation and amortization | | | | (46,601 | ) | | (39,776 | ) |
| Total | | | | $ | 73,616 |
| | $ | 60,499 |
|
For the leasehold improvements, the useful life is determined based on the shorter of the lease term or useful life of the underlying asset.
Depreciation and amortization expense related to property and equipment was $15,217, $11,979$35,379, $28,539 and $12,134 for$21,000 during the years ended December 31, 2016, 20152019, 2018 and 2014,2017, respectively.
On November 1, 2019, the Company acquired an office building in Minsk, Belarus for $18,904, excluding refundable VAT. The acquired building is intended to be used in the Company’s normal operations as office space for its employees; however, a portion of the building was leased to third parties under operating lease agreements prior to the Company’s purchase and the Company will continue leasing under those agreements (see Note 7 “Leases”). In addition to this building, the Company has other assets which generate lease income. The gross amount of such assets including the leased portion of the Minsk building was $10,654 and the associated accumulated depreciation was $101 as of December 31, 2019. Depreciation expense associated with these assets held under operating leases was $42 for the year ended December 31, 2019. There were 0 material assets held under operating leases as of December 31, 2018.
| |
9.5. | ACCRUED EXPENSES AND OTHER CURRENT LIABILITIES |
Accrued expenses and other current liabilities consisted of the following: |
| | | | | | | | |
| | | As of
December 31,
2019 | | As of
December 31,
2018 |
| Value added taxes payable | | 24,016 |
| | 19,985 |
|
| Contingent consideration, current (Note 11) | | 10,057 |
| | 1,501 |
|
| Deferred revenue | | 9,132 |
| | 4,558 |
|
| Other current liabilities and accrued expenses | | 39,271 |
| | 24,209 |
|
| Total | | $ | 82,476 |
| | $ | 50,253 |
|
|
| | | | | | | | |
| | | December 31,
2016 | | December 31,
2015 |
| Compensation | | $ | 33,404 |
| | $ | 47,285 |
|
| Deferred revenue | | 3,319 |
| | 3,047 |
|
| Subcontractor costs | | 3,317 |
| | 4,360 |
|
| Professional fees | | 2,348 |
| | 2,251 |
|
| Business trips | | 2,324 |
| | 939 |
|
| Facilities costs | | 1,534 |
| | 1,538 |
|
| Insurance costs | | 1,091 |
| | 810 |
|
| Acquisition related deferred consideration | | — |
| | 603 |
|
| Deferred tax liabilities | | — |
| | 365 |
|
| Other | | 2,558 |
| | 2,598 |
|
| Total | | $ | 49,895 |
| | $ | 63,796 |
|
Current taxes payable consisted of the following: |
| | | | | | | | |
| | | December 31,
2016 | | December 31,
2015 |
| Corporate profit tax | | $ | 4,000 |
| | $ | 15,057 |
|
| Value added taxes | | 10,644 |
| | 8,553 |
|
| Payroll, social security, and other taxes | | 10,364 |
| | 5,862 |
|
| Total | | $ | 25,008 |
| | $ | 29,472 |
|
There were no long-term taxes payable as of December 31, 2016 and 2015.
Income/(Loss) Before Provision for Income Taxes
Income/(loss) before provision for income taxes included income from domestic operations and income from foreign operations based on geographic location asis disclosed in the table below: |
| | | | | | | | | | | | |
| | | For the Years Ended December 31, |
| | | 2019 | | 2018 | | 2017 |
| Income/(loss) before provision for income taxes: | | | | | | |
| United States | | $ | 65,370 |
| | $ | 44,527 |
| | $ | (6,595 | ) |
| Foreign | | 234,156 |
| | 205,246 |
| | 180,900 |
|
| Total | | $ | 299,526 |
| | $ | 249,773 |
| | $ | 174,305 |
|
|
| | | | | | | | | | | | |
| | | For the Years Ended December 31, |
| | | 2016 | | 2015 | | 2014 |
| Income/ (loss) before income tax expense: | | | | | | |
| Domestic | | $ | (9,300 | ) | | $ | (7,687 | ) | | $ | (7,229 | ) |
| Foreign | | 135,766 |
| | 113,757 |
| | 94,182 |
|
| Total | | $ | 126,466 |
| | $ | 106,070 |
| | $ | 86,953 |
|
The provision for income taxes consists of the following: |
| | | | | | | | | | | | |
| | | For the Years Ended December 31, |
| | | 2019 | | 2018 | | 2017 |
| Current | | | | | | |
| Federal | | $ | 16,943 |
| | $ | 10,814 |
| | $ | 65,571 |
|
| State | | 3,610 |
| | 4,123 |
| | (204 | ) |
| Foreign | | 25,680 |
| | 42,580 |
| | 23,617 |
|
| Deferred | | | | | | |
| Federal | | (9,425 | ) | | (37,785 | ) | | 7,235 |
|
| State | | (358 | ) | | (3,548 | ) | | (90 | ) |
| Foreign | | 2,019 |
| | (6,667 | ) | | 5,416 |
|
| Total | | $ | 38,469 |
| | $ | 9,517 |
| | $ | 101,545 |
|
|
| | | | | | | | | | | | |
| | | For the Years Ended December 31, |
| | | 2016 | | 2015 | | 2014 |
| Income tax expense (benefit) consists of: | | | | | | |
| Current | | | | | | |
| Federal | | $ | 13,324 |
| | $ | 19,851 |
| | $ | 7,741 |
|
| State | | (63 | ) | | 2,563 |
| | 338 |
|
| Foreign | | 17,243 |
| | 14,528 |
| | 12,504 |
|
| Deferred | | | | | | |
| Federal | | (3,581 | ) | | (13,361 | ) | | (3,979 | ) |
| State | | 312 |
| | (1,891 | ) | | (43 | ) |
| Foreign | | (35 | ) | | (76 | ) | | 751 |
|
| Total | | $ | 27,200 |
| | $ | 21,614 |
| | $ | 17,312 |
|
The U.S. Tax Act significantly changed U.S. corporate income tax laws including a reduction of the U.S. corporate income tax rate from 35.0% to 21.0% effective January 1, 2018 and the creation of a territorial tax system with a one-time transition tax on accumulated foreign subsidiary earnings not previously subject to U.S. income tax. In addition, the U.S. Tax Act created new taxes on certain foreign-sourced earnings and certain related party payments, which are referred to as GILTI and the base erosion and anti-abuse tax (“BEAT”), respectively.
Due to the timing of the enactment and the complexity involved in applying the provisions of the U.S. Tax Act, the Company made reasonable estimates of the effects and recorded provisional amounts in its financial statements as of December 31, 2017. During the year ended December 31, 2018, the Company completed its analysis of the impact of the U.S. Tax Act and recorded the following adjustments to the recorded provisional amounts:
The one-time transition tax on accumulated foreign subsidiary earnings not previously subject to U.S. income tax requires the Company to pay U.S. income tax at a rate of 15.5% to the extent of foreign cash and certain other net current assets and 8.0% on the remaining earnings. During the year ended December 31, 2017, the Company recorded a provisional income tax expense and corresponding income taxes payable of $64,321 to be paid over the next 8 years associated with the one-time transition tax. During the year ended December 31, 2018, the Company completed its assessment and refined its estimate reducing the provisional charge by $4,935. The total charge for the one-time transition tax now totals $59,386.
In 2017, the Company provisionally reduced its net deferred tax assets by $10,311 reflecting the impact of the change in the U.S. statutory tax rate from 35.0% to 21.0% in the periods in which the net deferred tax assets are expected to be realized as a result of the U.S. Tax Act. In 2018, the Company completed its analysis, and consequently recorded an additional charge of $926 to further reduce its net deferred tax assets for a total charge of $11,237.
In 2017, the Company reassessed its accumulated foreign earnings in light of the U.S. Tax Act and determined $97,000 of its accumulated earnings in Belarus were no longer indefinitely reinvested. As a result, the Company recorded a charge of $4,850 in the provision for income taxes during the year ended December 31, 2017 for the withholding tax payable to Belarus when the earnings are distributed. In 2018, the Company remitted this full amount of accumulated earnings as dividends and also remitted as dividends certain earnings of its foreign subsidiaries in Canada, Cyprus, Ireland and Russia and additional earnings in Belarus. Based on proposed tax regulations issued by the U.S. Department of the Treasury during 2018, it was determined that an offsetting U.S. foreign tax credit could be claimed for the withholding tax paid to Belarus resulting in a net $4,850 income tax benefit recognized during the year ended December 31, 2018.
As of December 31, 2019, the Company has determined that all accumulated undistributed foreign earnings of $861,893 are expected to be indefinitely reinvested. Due to the enactment of the U.S. Tax Act and the one-time transition tax on accumulated foreign subsidiary earnings, these accumulated foreign earnings are no longer expected to be subject to U.S. federal income tax if repatriated but could be subject to state and foreign income and withholding taxes.
Effective Tax Rate Reconciliation
The reconciliation of the provision for income taxes at the federal statutory income tax rate to the Company’s effective income tax rate is as follows: |
| | | | | | | | | | | | |
| | | For the Years Ended December 31, |
| | | 2019 | | 2018 | | 2017 |
| Provision for income taxes at federal statutory rate | | $ | 62,898 |
| | $ | 52,452 |
| | $ | 61,007 |
|
| Increase/(decrease) in taxes resulting from: | | | | | | |
| Impact from U.S. Tax Act | | — |
| | (4,009 | ) | | 74,632 |
|
| Entity classification election deferred tax asset impact | | — |
| | (25,962 | ) | | — |
|
| GILTI and BEAT U.S. taxes | | (926 | ) | | 1,526 |
| | — |
|
| Excess tax benefits relating to stock-based compensation | | (28,385 | ) | | (17,370 | ) | | (9,307 | ) |
| Subsidiary withholding tax liability and related foreign tax credit | | — |
| | (4,850 | ) | | 4,850 |
|
| Foreign tax expense and tax rate differential | | (1,402 | ) | | (88 | ) | | (39,997 | ) |
| Effect of permanent differences | | 3,264 |
| | 2,724 |
| | 3,205 |
|
| State taxes, net of federal benefit | | 2,971 |
| | 3,452 |
| | (116 | ) |
| Change in valuation allowance | | 218 |
| | 151 |
| | 783 |
|
| Stock-based compensation expense | | 571 |
| | 652 |
| | 6,908 |
|
| Other | | (740 | ) | | 839 |
| | (420 | ) |
| Provision for income taxes | | $ | 38,469 |
| | $ | 9,517 |
| | $ | 101,545 |
|
The Company’s worldwide effective tax rate for years ended December 31, 2019, 2018 and 2017 was 12.8%, 3.8% and 58.3%, respectively. The provision for income taxes in the year ended December 31, 2018 was favorably impacted by the recognition of $25,962 of net deferred tax assets resulting from the Company’s decision to change the tax status and to classify most of its foreign subsidiaries as disregarded for U.S. income tax purposes. This change subjects the income of the disregarded foreign subsidiaries to U.S. income taxation, resulting in a reduced foreign tax rate differential benefit in 2019 and 2018 as compared to 2017. In addition, the Company recorded excess tax benefits upon vesting or exercise of stock-based awards of $28,385, $17,370 and $9,307 during the years ended December 31, 2019, 2018 and 2017, respectively.
In Belarus, member technology companies of High-Technologies Park, including the Company’s local subsidiary, have a full exemption from Belarus income tax on qualifying income through January 2049. However, beginning February 1, 2018, the earnings of the Company’s Belarus local subsidiary became subject to U. S. income taxation due to the Company’s decision to change the tax status of the subsidiary. Consequently, there was less income tax benefit from the Belarus tax exemption for the year ended December 31, 2018 compared to the previous year. There was 0 aggregate dollar benefit derived from this tax holiday for the year ended December 31, 2019, and the aggregate dollar benefits derived from this tax holiday approximated $1,352 and $15,503 for the years ended December 31, 2018 and 2017, respectively. There was 0 impact on diluted net income per share for the year ended December 31, 2019. The benefit the tax holiday had on diluted net income per share approximated $0.02 and $0.28 for the years ended December 31, 2018 and 2017, respectively.
Deferred Income Taxes
Deferred income taxes reflect the net effects of temporary differences between the carrying amounts of assets and liabilities for financial reporting purposes and the amounts used for income tax purposes. Significant components of the Company’s deferred tax assets and liabilities are as follows: | | | | | December 31,
2016 | | December 31,
2015 | | As of
December 31,
2019 | | As of
December 31,
2018 |
| Deferred tax assets: | | | | | | | | |
| Property and equipment | | $ | 203 |
| | $ | 681 |
| | $ | 5,329 |
| | $ | 4,531 |
|
| Intangible assets | | 1,525 |
| | 1,428 |
| | 574 |
| | 1,262 |
|
| Accrued expenses | | 9,172 |
| | 10,729 |
| | 41,457 |
| | 32,067 |
|
| Net operating loss carryforward | | 5,368 |
| | 5,233 |
| | 5,168 |
| | 4,983 |
|
| Deferred revenue | | 1,165 |
| | 2,162 |
| | 3,510 |
| | 5,802 |
|
| Stock-based compensation | | 19,701 |
| | 12,484 |
| | 29,596 |
| | 27,558 |
|
| Operating lease liabilities | | | 7,438 |
| | — |
|
| Foreign tax credit | | | 3,491 |
| | — |
|
| Foreign currency exchange | | | 2,499 |
| | 5,772 |
|
| Other assets | | 17 |
| | 14 |
| | 1,533 |
| | 782 |
|
| Deferred tax assets | | 37,151 |
| | 32,731 |
| | $ | 100,595 |
| | $ | 82,757 |
|
| Less: valuation allowance | | | (3,877 | ) | | (3,189 | ) |
| Total deferred tax assets | | | $ | 96,718 |
| | $ | 79,568 |
|
| | | | | | |
| Deferred tax liabilities: | | | | | | | | |
Property and equipment
| | 1,735 |
| | 646 |
| | $ | 4,981 |
| | $ | 1,480 |
|
| Intangible assets | | 4,969 |
| | 1,598 |
| | 11,364 |
| | 5,582 |
|
Operating lease right-of-use assets
| | | 6,900 |
| | — |
|
| Accrued revenue and expenses | | 500 |
| | 511 |
| | 2,176 |
| | 1,540 |
|
| Stock-based compensation | | 1,606 |
| | 1,672 |
| |
| U.S. taxation of foreign subsidiaries | | | — |
| | 3,000 |
|
| Other liabilities | | 314 |
| | 912 |
| | 812 |
| | 933 |
|
| Deferred tax liabilities | | 9,124 |
| | 5,339 |
| |
| Total deferred tax liabilities | | | $ | 26,233 |
| | $ | 12,535 |
|
| Net deferred tax assets | | $ | 28,027 |
| | $ | 27,392 |
| | $ | 70,485 |
| | $ | 67,033 |
|
As of December 31, 2019 and 2018, the Company classified $4,530 and $2,950, respectively, of deferred tax liabilities as Other noncurrent liabilities in the consolidated balance sheets.
Included in the stock-based compensation expense deferred tax asset at December 31, 20162019 and 20152018 is $11,471$6,788 and $7,219,$7,561, respectively, that is related to acquisitions and is amortized for tax purposes over a 10 to 15-year period.
We have income taxAs of December 31, 2019, the Company’s domestic and foreign net operating loss (“NOL”) carryforwards for income tax purposes were approximately $3,712 and $25,487, respectively. If not utilized, the domestic NOL carryforwards will begin to expire in 2021. The foreign NOL carryforwards include $9,311 from jurisdictions with no expiration date, with the remainder expiring as follows: $274 in 2020, $5,805 in 2021, $6,273 in 2022, $1,371 in 2023, $2,204 in 2024, and $249 beyond 2024. The Company maintains a valuation allowance primarily related to several jurisdictions of $20,899. We have recorded a deferred tax asset of $5,368 reflecting the full benefit of $20,899 innet operating loss carryforwards as we fully expect to utilize all NOLs before each country’s expiration period.
Adoption of ASU 2015-17 resulted in the classification of current deferred tax assets and liabilities to non-current deferred tax assets and liabilities. As suchcertain foreign jurisdictions that the Company has no current deferred tax assets and liabilitiesbelieves are not likely to be realized, which totaled $21,948 as of December 31, 2016. 2019.
Unrecognized Tax Benefits
As of December 31, 2016, the Company had non-current deferred2019 and 2018, unrecognized tax assetsbenefits of $2,904 and liabilities of $31,005 and $2,979, respectively. At December 31, 2015, the Company had current and non-current deferred tax assets of $11,847 and $18,312,$1,432, respectively, and current and non-current deferred tax liabilities of $365 and $2,402, respectively. Current and non-current deferred tax liabilities were shown under other current and long-term liabilities onare included in Income taxes payable, noncurrent within the consolidated balance sheets.
No provision has been made for U.S. There were no significant new tax positions that resulted in unrecognized tax benefits or non-U.S. income taxes on the undistributed earningsreversals of subsidiaries or for unrecognized deferredprior year tax liabilities for temporary differences related to basis differences in investments in subsidiaries, as such earnings are expected to be permanently reinvested, the investments are essentially permanent in duration, or the Company has concluded that no additional tax liability will arise as a result of the distribution of such earnings. As of December 31, 2016, certain subsidiaries had approximately $571.4 million of undistributed earnings that we intend to permanently reinvest. A liability could arise if our intention to permanently reinvest such earnings were to change and amounts are distributed by such subsidiaries or if such subsidiaries are ultimately disposed. It is not practicable to estimate the additional income taxes related to permanently reinvested earnings or the basis differences related to investments in subsidiaries.
The reconciliation of the federal statutory income tax rate to our effective income tax rate is as follows: |
| | | | | | | | | | | | |
| | | For the Years Ended December 31, |
| | | 2016 | | 2015 | | 2014 |
| Statutory federal tax | | $ | 44,263 |
| | $ | 37,125 |
| | $ | 29,564 |
|
| Increase/ (decrease) in taxes resulting from: | | | | | | |
| State taxes, net of federal benefit | | 1,192 |
| | 341 |
| | 311 |
|
| Provision adjustment for current year uncertain tax position | | — |
| | — |
| | (1,220 | ) |
| Effect of permanent differences | | 5,042 |
| | 7,314 |
| | 8,589 |
|
Stock-based compensation expense | | 9,535 |
| | 7,591 |
| | 3,782 |
|
Foreign tax expense and tax rate differential
| | (33,477 | ) | | (31,094 | ) | | (24,772 | ) |
| Change in foreign tax rate | | — |
| | 9 |
| | 754 |
|
| Change in valuation allowance | | — |
| | — |
| | 149 |
|
| Other | | 645 |
| | 328 |
| | 155 |
|
| Provision for income taxes | | $ | 27,200 |
| | $ | 21,614 |
| | $ | 17,312 |
|
On September 22, 2005, the president of Belarus signed the decree “On the High-Technologies Park” (the “Decree”). The Decree is aimed at boosting the country’s high-technology sector. The Decree stipulates that member technology companies have a 100% exemption from Belarusian income tax of 18% effective July 1, 2006, for a period of 15 years. The aggregate dollar benefits derived from this tax holiday approximated $13.6 million, $20.8 million and $16.8 million forpositions during the years ended December 31, 2016, 20152019, 2018 and 2014, respectively. The benefit the tax holiday had on diluted net income per share approximated $0.26, $0.40 and $0.34 for the years ended December 31, 2016, 2015 and 2014, respectively.
Uncertain Tax Positions
The liability for unrecognized tax benefits is included in taxes payable within the consolidated balance sheets at December 31, 2016 and 2015. At December 31, 2016 and 2015, the total amount of gross unrecognized tax benefits (excluding the federal benefit received from state tax positions) was $66 and $62, respectively. These amounts represent the amount of unrecognized tax benefits that, if recognized, would favorably affect the effective tax rate in future periods.
The Company’s policy is to recognize interest and penalties related to uncertain tax positions as a component of its provision for income taxes. There was no accrued interest and penalties resulting from such unrecognized tax benefits at December 31, 2016 and December 31, 2015. The total amount of accrued interest and penalties resulting from such unrecognized tax benefits was $12 at December 31, 2014.
The beginning to ending reconciliation of the gross unrecognized tax benefits is as follows: |
| | | | | | | | | | | | |
| | | For the Years Ended December 31, |
| | | 2016 | | 2015 | | 2014 |
| Balance at January 1 | | $ | 62 |
| | $ | 200 |
| | $ | 1,271 |
|
| Increases in tax positions in current year | | 4 |
| | — |
| | — |
|
| Increases in tax positions in prior year | | — |
| | — |
| | — |
|
| Decreases due to settlement | | — |
| | (138 | ) | | (1,071 | ) |
| Balance at December 31 | | $ | 66 |
| | $ | 62 |
| | $ | 200 |
|
2017. There were no tax positions for which it was reasonably possible that unrecognized tax benefits will significantly increase or decrease within twelve months of the reporting date.
The Company files income tax returns in the United States and in various state, local and foreign jurisdictions. The Company’s significant tax jurisdictions are the United States, Canada, Russia, Denmark, Germany, Ukraine, the United Kingdom, Hungary, Switzerland, Netherlands, Poland and India. The tax years subsequent to 20122015 remain open to examination by the United States Internal Revenue Service and generally, the tax years subsequent to 20122015 remain open to examination by various state and local taxing authorities and various foreign taxing authorities.
7.LEASES
The Company offers employees a 401(k) retirement plan, which is a tax-qualified self-funded retirement plan covering substantially allleases office space, corporate apartments, office equipment, and vehicles. Many of the Company’s U.S. employees. Underleases contain variable payments including changes in base rent and charges for common area maintenance or other miscellaneous expenses. Due to this plan, employees may electvariability, the cash flows associated with these variable payments are not included in the minimum lease payments used in determining the RoU Assets and associated lease liabilities and are recognized in the period in which the obligation for such payments is incurred. The Company’s leases have remaining lease terms ranging from 0.1 to defer their current compensation up11.4 years. Certain lease agreements, mainly for office space, include options to extend or terminate the statutory limit defined bylease before the Internal Revenue Service.expiration date. The Company provides discretionary matching contributionsconsiders such options when determining the lease term when it is reasonably certain that the Company will exercise that option. The Company leases and subleases a portion of its office space to the plan of up to a maximum of 2.0% of the employee’s eligible compensation as defined by the plan. Employer contributions are subject to a two year vesting schedule. Employer contributions charged to expensethird parties. Lease income and sublease income were immaterial for the years ended December 31, 2016, 20152019, 2018 and 2014,2017.
During the year ended December 31, 2019, the components of lease expense were $1,934, $740as follows: |
| | | | | | |
| | | Income Statement Classification | | Year Ended December 31, 2019 |
| Operating lease cost | | Selling, general and administrative expenses | | $ | 62,740 |
|
| Variable lease cost | | Selling, general and administrative expenses | | 8,730 |
|
| Short-term lease cost | | Selling, general and administrative expenses | | 3,870 |
|
| Total lease cost | | | | $ | 75,340 |
|
Rent expense under operating lease agreements for the years ended December 31, 2018 and $549,2017 was $46,924 and $37,916, respectively.
Supplemental cash flow information related to leases was as follows: |
| | | |
| | Year Ended December 31, 2019 |
| Cash paid for amounts included in the measurement of lease liabilities: | |
| Operating cash flows used for operating leases | $ | 59,952 |
|
| Right-of-use assets obtained in exchange for lease obligations: | |
| Operating leases | $ | 107,822 |
|
| Non-cash net increase due to lease modifications: | |
| Operating lease right-of-use assets | $ | 10,124 |
|
| Operating lease liabilities | $ | 10,192 |
|
Weighted average remaining lease term and discount rate as of December 31, 2019, were as follows: |
| | | |
| | As of December 31, 2019 |
| Weighted average remaining lease term, in years: | | |
| Operating leases | | 6.1 |
|
| Weighted average discount rate: | | |
| Operating leases | | 3.6 | % |
As of December 31, 2019, operating lease liabilities will mature as follows: |
| | | | |
| Year ending December 31, | | Lease Payments |
| 2020 | | $ | 64,667 |
|
| 2021 | | 54,343 |
|
| 2022 | | 36,886 |
|
| 2023 | | 27,018 |
|
| 2024 | | 22,603 |
|
| Thereafter | | 58,532 |
|
| Total lease payments | | 264,049 |
|
| Less: imputed interest | | (25,660 | ) |
| Total | | $ | 238,389 |
|
There were no lease agreements that contained material restrictive covenants or material residual value guarantees as of December 31, 2019. There were no material lease agreements signed with related parties as of December 31, 2019.
As of December 31, 2019, the Company had committed to payments of $37,559 related to operating lease agreements that had not yet commenced. These operating leases will commence during various dates during 2020 with lease terms ranging from 1.2 to 10.9 years. The Company doesdid not maintainhave any defined benefit pension plans or any nonqualified deferred compensation plans.material finance lease agreements that had not yet commenced.
Revolving Line of Credit — On September 12, 2014, the Company entered into a revolving loan agreement (the “2014 Credit Facility”) with PNC Bank, National Association; Santander Bank, N.A; and Silicon Valley Bank (collectively the “2014 Lenders”). Under the 2014 Credit Facility, the Company’s borrowing capacity was set at $100,000, with potential to increase it to $200,000 if certain conditions were met.
Borrowings under the 2014 Credit Facility were denominated in U.S. dollars or, up to a maximum of $50,000 in British pounds, Canadian dollars, euros and Swiss francs and other currencies as may be approved by the administrative agent and the 2014 Lenders. Borrowings under the 2014 Credit Facility bore interest at either a base rate or Euro-rate plus a margin based on the Company’s leverage ratio. The base rate was equal to the highest of (a) the Federal Funds Open Rate, plus 0.5%, (b) the Prime Rate, and (c) the Daily LIBOR Rate, plus 1.0%.
On May 24, 2017, the Company terminated the 2014 Credit Facility and entered into a new unsecured credit facility (the “2017 Credit Facility”), as may be amended from time to time, with PNC Bank, National Association; PNC Capital Markets LLC; Citibank N.A.; Wells Fargo Bank, National Association; Fifth Third Bank and Santander Bank, N.A. (collectively the “Lenders”) to replace its former revolving loan agreement.. The 20142017 Credit Facility provides for a borrowing capacity of $100,000,$300,000, with potential to increase the credit facility up to $200,000$400,000 if certain conditions are met. The 20142017 Credit Facility matures on September 12, 2019.May 24, 2022.
Borrowings under the 20142017 Credit Facility may be denominated in U.S. dollars or up to a maximum of $50,000$100,000 in British pounds, sterling, Canadian dollars, euros orand Swiss francs (orand other currencies as may be approved by the lenders).administrative agent and the Lenders. Borrowings under the 20142017 Credit Facility bear interest at either a base rate or Euro-rate plus a margin based on the Company’s leverage ratio. BaseThe base rate is equal to the highest of (a) the Federal Funds OpenOvernight Bank Funding Rate, plus 0.5%, (b) the Prime Rate, or (c) the Daily LIBOR Rate, plus 1.0%. As of December 31, 2019, the Company’s outstanding borrowings are subject to a LIBOR-based interest rate, which resets regularly at issuance, based on lending terms.
The 2014 Credit Facility is collateralized with: (a) all tangible and intangible assets of the Company, and its U.S.-based subsidiaries including all accounts, general intangibles, intellectual property rights and equipment; and (b) all of the outstanding shares of capital stock and other equity interests in U.S.-based subsidiaries of the Company, and 65% of the outstanding shares of capital stock and other equity interests in certain of the Company’s foreign subsidiaries. The 20142017 Credit Facility includes customary business and financial covenants and restrictsthat may restrict the Company’s ability to make or pay dividends (other than certain intercompany dividends) unless noif a potential or an actual event of default has occurred or would be triggered. As of December 31, 2016,2019, the Company was in compliance with all covenants contained in the 20142017 Credit Facility.
As of December 31, 2016 and 2015,
The following table presents the outstanding debt of the Company under the 2014 Credit Facility was $25,000 and $35,000 respectively, and is subject to a LIBOR-based interest rate, which resets regularly at issuance, based on lending terms. In addition, as of December 31, 2016, the Company has a $942 unused irrevocable standby letter of credit associated with its insurance program that was issued under the 2014 Credit Facility during the year 2016.
As of December 31, 2016 and 2015, the borrowing capacity of the Company under the
20142017 Credit
FacilityFacility: |
| | | | | | | |
| | As of
December 31,
2019 | | As of
December 31,
2018 |
| Outstanding debt | $ | 25,000 |
| | $ | 25,000 |
|
| Interest rate | 2.8 | % | | 3.5 | % |
| Irrevocable standby letters of credit | $ | 303 |
| | $ | 382 |
|
| Available borrowing capacity | $ | 274,697 |
| | $ | 274,618 |
|
| Current maximum borrowing capacity | $ | 300,000 |
| | $ | 300,000 |
|
As part of the acquisition of Continuum in 2018, the Company assumed $3,448 of long-term debt associated with a leased facility and payable to Continuum’s landlord. The debt was $74,058payable in monthly installments through March 31, 2029 and $65,000, respectively.bore interest at a rate of 8% per annum. In March 2018, the Company paid $3,448 to settle this assumed long-term debt.
| |
14.9. | STOCK-BASED COMPENSATIONREVENUES |
Disaggregation of Revenues
The following costs related totables show the disaggregation of the Company’s stock compensation plans were included in the consolidated statements of income and comprehensive income: |
| | | | | | | | | | | | |
| | | For the Years Ended December 31, |
| | | 2016 | | 2015 | | 2014 |
| Cost of revenues | | $ | 16,619 |
| | $ | 13,695 |
| | $ | 8,648 |
|
Selling, general and administrative expenses — Acquisition related | | 12,884 |
| | 18,690 |
| | 8,829 |
|
Selling, general and administrative expenses — All other | | 19,741 |
| | 13,448 |
| | 7,143 |
|
| Total | | $ | 49,244 |
| | $ | 45,833 |
| | $ | 24,620 |
|
Equity Plans
2012 Non-Employee Directors Compensation Plan — On January 11, 2012, the Company approved the 2012 Non-Employee Directors Compensation Plan (“2012 Directors Plan”) to be used to issue equity grants to its non-employee directors. The Company authorized 600,000 shares of common stock to be reserved for issuance under the plan. As of December 31, 2016, 547,560 shares of common stock remained available for issuance under the 2012 Directors Plan. The 2012 Directors Plan will expire after 10 years and is administeredrevenues by the Company’s Board of Directors.
2015 Long-Term Incentive Plan— On June 11, 2015, the Company’s stockholders approved the 2015 Long-Term Incentive Plan (“2015 Plan”) to be used to issue equity awards to company personnel. As of December 31, 2016, 6,202,977 shares of common stock remained available for issuance under the 2015 Plan. Allmajor customer location, including a reconciliation of the awards issued pursuant to the 2015 Plan expire 10 years from the date of grant.
2012 Long-Term Incentive Plan — On January 11, 2012, the Company approved the 2012 Long-Term Incentive Plan (“2012 Plan”) to be used to issue equity grants to company personnel. In June 2015, the 2012 Plan was discontinued; however, outstanding awards remain subject to the terms of the 2012 Plan and any shares that are subject to an award that was previously granted under the 2012 Plan and that expire or terminate for any reason prior to exercise will become available for issuance under the 2015 Plan. All of the awards issued pursuant to the 2012 Plan expire 10 years from the date of grant.
2006 Stock Option Plan — Effective May 31, 2006, the Board of Directors of the Company adopted the 2006 Stock Option Plan (the “2006 Plan”) to grant stock options to directors, employees, and certain independent contractors. In January 2012, the 2006 Plan was discontinued; however, outstanding awards remain subject to the terms of the 2006 Plan and any shares that are subject to an option award that was previously granted under the 2006 Plan and that expire or terminate for any reason prior to exercise will become available for issuance under the 2015 Plan. All of the awards issued pursuant to the 2006 Plan expire 10 years from the date of grant.
Stock Options
Stock option activity under the Company’s plans is set forth below: |
| | | | | | | | | | |
| | Number of Options | | Weighted Average Exercise Price | | Aggregate Intrinsic Value |
| Options outstanding at January 1, 2014 | 5,823,536 |
| | $ | 13.99 |
| | $ | 122,003 |
|
| Options granted | 2,400,500 |
| | 32.51 |
| | 36,584 |
|
| Options exercised | (1,171,097 | ) | | 9.05 |
| | (45,321 | ) |
| Options forfeited/cancelled | (214,193 | ) | | 25.33 |
| | (4,802 | ) |
| Options outstanding at December 31, 2014 | 6,838,746 |
| | $ | 20.98 |
| | $ | 183,073 |
|
| Options granted | 2,219,725 |
| | 62.18 |
| | 36,492 |
|
| Options exercised | (1,405,826 | ) | | 14.70 |
| | (89,860 | ) |
| Options forfeited/cancelled | (201,731 | ) | | 34.48 |
| | (8,904 | ) |
| Options outstanding at December 31, 2015 | 7,450,914 |
| | $ | 34.07 |
| | $ | 331,938 |
|
| Options granted | 313,088 |
| | 70.27 |
| | (1,866 | ) |
| Options exercised | (895,804 | ) | | 20.13 |
| | (39,577 | ) |
| Options forfeited/cancelled | (227,759 | ) | | 47.89 |
| | (3,740 | ) |
| Options expired | (3,200 | ) | | 1.52 |
| | (201 | ) |
| Options outstanding at December 31, 2016 | 6,637,239 |
| | $ | 37.20 |
| | $ | 179,936 |
|
| | | | | | |
| Options vested and exercisable at December 31, 2016 | 3,350,682 |
| | $ | 25.96 |
| | $ | 128,499 |
|
| Options expected to vest | 3,127,635 |
| | $ | 48.28 |
| | $ | 50,136 |
|
The fair value of each option award is estimated on the date of grant using the Black-Scholes option valuation model. The Company recognizes the fair value of each option as compensation expense ratably using the straight-line method over the service period (generally the vesting period). The Black-Scholes model incorporates the following assumptions:
a. Expected volatility — the Company estimated the volatility of its common stock at the date of grant using historical volatility of peer public companies. During 2014, the Company began including the historical volatility for the Company in conjunction with peer public companies to formulate estimated volatility regarding stock options. The expected volatility was 31.9%, 34.1% and 45.9% in the years ended December 31, 2016, 2015 and 2014, respectively.
b. Expected term — the Company estimates the expected term of options granted using the simplified method of determining expected term as outlined in SEC Staff Accounting Bulletin 107 as the Company does not have sufficient history in order to develop a more precise estimate. The expected term was 6.24 years in 2016, 6.25 years in 2015, and 6.20 years in 2014.
c. Risk-free interest rate — the Company estimates the risk-free interest rate using the U.S. Treasury yield curve for periods equal to the expected term of the options in effect at the time of grant. The risk-free rate was approximately 1.5%, 1.8% and 2.0% in 2016, 2015 and 2014, respectively.
d. Dividends — the Company uses an expected dividend yield of zero since it has never declared or paid any dividends on its common stock. The Company intends to retain any earnings to fund future growth and the operation of its business and, therefore, does not anticipate paying any cash dividends in the foreseeable future.
Additionally, the Company records share-based compensation expense only for those awards that are expected to vest. The Company applies an estimated forfeiture rate at the time of grant and adjusts those estimated forfeitures to reflect actual forfeitures at least annually.
Aggregate grant-date fair value of stock options issued during the year ended December 31, 2016 was $6,874. The options are typically scheduled to vest over four years from the time of grant, subject to the terms of the applicable plan and stock option agreement. In general, in the event of the participant’s termination of service for any reason, unvested options are forfeited as of the date of such termination without any payment to the participant.
As of December 31, 2016, total remaining unrecognized compensation cost related to unvested stock options, net of estimated forfeitures, was approximately $44,162. The expense is expected to be recognized over a weighted-average period of 1.6 years. As of December 31, 2016, the weighted average remaining contractual term was 6.0 years for fully vested and exercisable options and 7.8 years for options expected to vest.
As of December 31, 2016, a total of 2,550 shares underlying options exercised through December 31, 2016, were in transferdisaggregated revenues with the Company’s transfer agent.
Restricted Stock and Restricted Stock Units
The Company grants awards of restricted stock to non-employee directors under the Company’s 2012 Directors Plan and restricted stock units (“RSUs”reportable segments (Note 15 “Segment Information”) to Company personnel under the Company’s 2015 Plan (and prior to its approval, under the 2012 Plan). In addition, the Company has issued in the past, and may issue in the future, its equity securities to compensate employees of acquired businesses for future services. Equity-based awards granted in connection with acquisitions of businesses are generally issued in the form of service-based awards (dependent on continuing employment only) and performance-based awards, which are granted and vest only if certain specified performance conditions are met. The awards issued in connection with acquisitions of businesses are subject to the terms and conditions contained in the applicable award agreement and acquisition documents with typical vesting period of 3 years, with 33.3% of the awards granted vesting in equal installments on the first, second and third anniversaries of the grant.
Service-Based Awards
The table below summarizes activity related to the Company’s equity-classified and liability-classified service-based awards for the years ended December 31, 2016, 20152019 and 2014:2018: |
| | | | | | | | | | | | | | | | | | | | |
| | Equity-Classified Equity-Settled Restricted Stock | | Equity-Classified Equity-Settled Restricted Stock Units | | Liability-Classified Cash-Settled Restricted Stock Units |
| | Number of Shares | | Weighted Average Grant Date Fair Value Per Share | | Number of Shares | | Weighted Average Grant Date Fair Value Per Share | | Number of Shares | | Weighted Average Grant Date Fair Value Per Share |
| Unvested service-based awards outstanding at January 1, 2014 | 344,928 |
| | $ | 18.74 |
| | — |
| | $ | — |
| | — |
| | $ | — |
|
| Awards granted | 452,720 |
| | 41.63 |
| | 70,500 |
| | 32.55 |
| | — |
| | — |
|
| Awards vested | (217,668 | ) | | 17.84 |
| | — |
| | — |
| | — |
| | — |
|
| Awards forfeited/cancelled | (17,038 | ) | | 21.14 |
| | — |
| | — |
| | — |
| | — |
|
| Unvested service-based awards outstanding at December 31, 2014 | 562,942 |
| | $ | 37.42 |
| | 70,500 |
| | $ | 32.55 |
| | — |
| | $ | — |
|
| Awards granted | 5,295 |
| | 70.79 |
| | 108,319 |
| | 67.21 |
| | — |
| | — |
|
| Awards vested | (261,504 | ) | | 33.74 |
| | (17,625 | ) | | 32.55 |
| | — |
| | — |
|
| Awards forfeited/cancelled | 106 |
| | 36.57 |
| | (11,922 | ) | | 34.49 |
| | — |
| | — |
|
| Unvested service-based awards outstanding at December 31, 2015 | 306,839 |
| | $ | 41.14 |
| | 149,272 |
| | $ | 57.55 |
| | — |
| | $ | — |
|
| Awards granted | 6,510 |
| | 73.00 |
| | 408,629 |
| | 70.39 |
| | 207,586 |
| | 70.53 |
|
| Awards vested | (156,535 | ) | | 42.64 |
| | (41,015 | ) | | 55.60 |
| | — |
| | — |
|
| Awards forfeited/cancelled | (2,689 | ) | | 45.32 |
| | (31,698 | ) | | 70.44 |
| | (3,085 | ) | | 70.52 |
|
| Unvested service-based awards outstanding at December 31, 2016 | 154,125 |
| | $ | 40.89 |
| | 485,188 |
| | $ | 67.69 |
| | 204,501 |
| | $ | 70.53 |
|
|
| | | | | | | | | | | | | | | |
| | Year Ended December 31, 2019 |
| | Reportable Segments
| | |
| | North America | | Europe | | Russia | | Consolidated Revenues |
| Customer Locations | | | | | | | |
| North America | $ | 1,344,040 |
| | $ | 45,859 |
| | $ | 116 |
| | $ | 1,390,015 |
|
| Europe | 27,042 |
| | 719,548 |
| | 276 |
| | 746,866 |
|
| CIS | 8,583 |
| | 143 |
| | 91,745 |
| | 100,471 |
|
| APAC | 1,279 |
| | 55,167 |
| | — |
| | 56,446 |
|
| Revenues | $ | 1,380,944 |
| | $ | 820,717 |
| | $ | 92,137 |
| | $ | 2,293,798 |
|
|
| | | | | | | | | | | | | | | |
| | Year Ended December 31, 2018 |
| | Reportable Segments
| | |
| | North America | | Europe | | Russia | | Consolidated Revenues |
| Customer Locations | | | | | | | |
| North America | $ | 1,046,232 |
| | $ | 52,860 |
| | $ | 75 |
| | $ | 1,099,167 |
|
| Europe | 16,679 |
| | 595,741 |
| | 52 |
| | 612,472 |
|
| CIS | 8,437 |
| | 336 |
| | 72,930 |
| | 81,703 |
|
| APAC | 5,631 |
| | 43,848 |
| | 91 |
| | 49,570 |
|
| Revenues | $ | 1,076,979 |
| | $ | 692,785 |
| | $ | 73,148 |
| | $ | 1,842,912 |
|
The following tables show the disaggregation of the Company’s revenues by industry vertical, including a reconciliation of the disaggregated revenues with the Company’s reportable segments (Note 15 “Segment Information”) for the year ended December 31, 2016,2019 and 2018: |
| | | | | | | | | | | | | | | |
| | Year Ended December 31, 2019 |
| | Reportable Segments | | |
| | North America | | Europe | | Russia | | Consolidated Revenues |
| Industry Verticals | | | | | | | |
| Financial Services | $ | 184,469 |
| | $ | 244,284 |
| | $ | 72,119 |
| | $ | 500,872 |
|
| Travel & Consumer | 198,264 |
| | 229,523 |
| | 11,571 |
| | 439,358 |
|
| Software & Hi-Tech | 354,023 |
| | 77,377 |
| | 1,998 |
| | 433,398 |
|
| Business Information & Media | 262,448 |
| | 157,844 |
| | 631 |
| | 420,923 |
|
| Life Sciences & Healthcare | 224,925 |
| | 23,444 |
| | 83 |
| | 248,452 |
|
| Emerging Verticals | 156,815 |
| | 88,245 |
| | 5,735 |
| | 250,795 |
|
| Revenues | $ | 1,380,944 |
| | $ | 820,717 |
| | $ | 92,137 |
| | $ | 2,293,798 |
|
|
| | | | | | | | | | | | | | | |
| | Year Ended December 31, 2018 |
| | Reportable Segments | | |
| | North America | | Europe | | Russia | | Consolidated Revenues |
| Industry Verticals | | | | | | | |
| Financial Services | $ | 112,444 |
| | $ | 252,196 |
| | $ | 59,337 |
| | $ | 423,977 |
|
| Travel and Consumer | 177,910 |
| | 208,266 |
| | 7,467 |
| | 393,643 |
|
| Software & Hi-Tech | 269,067 |
| | 79,121 |
| | 2,627 |
| | 350,815 |
|
| Business Information & Media | 251,081 |
| | 72,898 |
| | 54 |
| | 324,033 |
|
| Life Sciences & Healthcare | 151,418 |
| | 20,272 |
| | 13 |
| | 171,703 |
|
| Emerging Verticals | 115,059 |
| | 60,032 |
| | 3,650 |
| | 178,741 |
|
| Revenues | $ | 1,076,979 |
| | $ | 692,785 |
| | $ | 73,148 |
| | $ | 1,842,912 |
|
The following tables show the aggregate unrecognized compensation expensedisaggregation of the Company’s revenues by contract type, including a reconciliation of the disaggregated revenues with the Company’s reportable segments (Note 15 “Segment Information”) for outstanding service-based equity-classified restricted stock was $3,444. This expense isthe year ended December 31, 2019 and 2018: |
| | | | | | | | | | | | | | | |
| | Year Ended December 31, 2019 |
| | Reportable Segments | | |
| | North America | | Europe | | Russia | | Consolidated Revenues |
| Contract Types | | | | | | | |
| Time-and-material | $ | 1,247,979 |
| | $ | 688,605 |
| | $ | 54,069 |
| | $ | 1,990,653 |
|
| Fixed-price | 127,926 |
| | 128,977 |
| | 37,747 |
| | 294,650 |
|
| Licensing | 3,626 |
| | 1,230 |
| | 225 |
| | 5,081 |
|
| Other revenues | 1,413 |
| | 1,905 |
| | 96 |
| | 3,414 |
|
| Revenues | $ | 1,380,944 |
| | $ | 820,717 |
| | $ | 92,137 |
| | $ | 2,293,798 |
|
|
| | | | | | | | | | | | | | | |
| | Year Ended December 31, 2018 |
| | Reportable Segments | | |
| | North America | | Europe | | Russia | | Consolidated Revenues |
| Contract Types | | | | | | | |
| Time-and-material | $ | 983,436 |
| | $ | 628,707 |
| | $ | 40,754 |
| | $ | 1,652,897 |
|
| Fixed-price | 89,831 |
| | 62,078 |
| | 32,342 |
| | 184,251 |
|
| Licensing | 2,748 |
| | 1,332 |
| | 17 |
| | 4,097 |
|
| Other revenues | 964 |
| | 668 |
| | 35 |
| | 1,667 |
|
| Revenues | $ | 1,076,979 |
| | $ | 692,785 |
| | $ | 73,148 |
| | $ | 1,842,912 |
|
Timing of Revenue Recognition
The following tables show the timing of revenue recognition:
|
| | | | | | | | | | | | | | | |
| | Year Ended December 31, 2019 |
| | Reportable Segments | | |
| | North America | | Europe | | Russia | | Consolidated Revenues |
| Timing of Revenue Recognition | | | | | | | |
| Transferred over time | $ | 1,379,256 |
| | $ | 819,913 |
| | $ | 92,076 |
| | $ | 2,291,245 |
|
| Transferred at a point of time | 1,688 |
| | 804 |
| | 61 |
| | 2,553 |
|
| Revenues | $ | 1,380,944 |
| | $ | 820,717 |
| | $ | 92,137 |
| | $ | 2,293,798 |
|
|
| | | | | | | | | | | | | | | |
| | Year Ended December 31, 2018 |
| | Reportable Segments | | |
| | North America | | Europe | | Russia | | Consolidated Revenues |
| Timing of Revenue Recognition | | | | | | | |
| Transferred over time | $ | 1,076,084 |
| | $ | 692,023 |
| | $ | 73,135 |
| | $ | 1,841,242 |
|
| Transferred at a point of time | 895 |
| | 762 |
| | 13 |
| | 1,670 |
|
| Revenues | $ | 1,076,979 |
| | $ | 692,785 |
| | $ | 73,148 |
| | $ | 1,842,912 |
|
During the years ended December 31, 2019 and 2018 the Company recognized $7,806 and $5,736, respectively, of revenues from performance obligations satisfied in previous periods.
The following table includes the estimated revenues expected to be recognized overin the next 1.0 years using the weighted average method.
Asfuture related to performance obligations that are partially or fully unsatisfied as of December 31,
2016,2019. The Company applies a practical expedient and does not disclose the
aggregate unrecognized compensation expensevalue of unsatisfied performance obligations for
all outstanding service-based equity-classified RSUs was $22,584. This costcontracts that (i) have an original expected duration of one year or less and (ii) contracts for which it recognizes revenues at the amount to which it has the right to invoice for services provided: |
| | | | | | | | | | | | | | | | | | | |
| | Less than 1 year | | 1 Year | | 2 Years | | 3 Years | | Total |
| Contract Type | | | | | | | | | |
| Fixed-price | $ | 17,892 |
| | $ | 992 |
| | $ | 64 |
| | $ | — |
| | $ | 18,948 |
|
The Company applies a practical expedient and does not disclose the amount of the transaction price allocated to the remaining performance obligations nor provide an explanation of when the Company expects to recognize that amount as revenue for certain variable consideration.
Contract Balances
The following table provides information on the classification of contract assets and liabilities in the consolidated balance sheets: |
| | | | | | | |
| | As of
December 31,
2019 | | As of December 31, 2018 |
| Contract assets included in Trade receivables and contract assets | $ | 14,320 |
| | $ | 13,522 |
|
| Contract liabilities included in Accrued expenses and other current liabilities | $ | 9,132 |
| | $ | 4,558 |
|
| Contract liabilities included in Other noncurrent liabilities | $ | 5 |
| | $ | 224 |
|
Contract assets have increased from December 31, 2018 primarily due to new contracts entered into in 2019 where the Company’s right to bill is expectedcontingent upon achievement of contractual milestones.
Contract liabilities comprise amounts collected from the Company’s customers for revenues not yet earned. Such amounts are anticipated to be recognized over the next 2.0 years using the weighted average method.
As ofrecorded as revenues when services are performed in subsequent periods. Contract liabilities have increased from December 31, 2016, the aggregate unrecognized compensation expense for all outstanding service-based liability-classified cash-settled RSUs was $8,842, which is expected2018 due to be recognized over the next 2.1 years using the weighted average method.
Performance -Based Awards
In 2014, the Company granted performance-based awardsan increase in connection with the acquisitions completed during that year. The total number of the awards varies based on attainment of certain performance targets pursuantadvance billings largely attributable to the terms of the relevant transaction documents.businesses acquired during 2019. During the year ended December 31, 2016, two-thirds2019, the Company recognized $3,850 of revenues that were included in Accrued expenses and other current liabilities at December 31, 2018. During the performance-based awards issued in 2014 acquisitions vested, net of any forfeitures.
Summarized activity related to the Company’s performance-based awards for the yearsyear ended December 31, 2016, was as follows: |
| | | | | | | | | | | | | | | | | | | | |
| | Equity-Classified
Equity-Settled
Restricted Stock | | Liability-Classified
Equity-Settled
Restricted Stock | | Equity-Classified
Equity-Settled
Restricted Stock Units |
| | Number of Shares | | Weighted Average Grant Date Fair Value Per Share | | Number of Shares | | Weighted Average Grant Date Fair Value Per Share | | Number of Shares | | Weighted Average Grant Date Fair Value Per Share |
| Unvested performance-based awards outstanding at January 1, 2014 | — |
| | $ | — |
| | — |
| | $ | — |
| | — |
| | $ | — |
|
| Awards granted | 26,441 |
| | 38.91 |
| | 360,617 |
| | 38.13 |
| | — |
| | — |
|
| Awards vested | — |
| | — |
| | — |
| | — |
| | — |
| | — |
|
| Awards forfeited/cancelled | (2,550 | ) | | 36.57 |
| | — |
| | — |
| | — |
| | — |
|
| Changes in the number of awards expected to be delivered | 9,154 |
| �� | 36.57 |
| | (22,152 | ) | | 18.32 |
| | — |
| | — |
|
| Unvested performance-based awards outstanding at December 31, 2014 | 33,045 |
| | $ | 38.44 |
| | 338,465 |
| | $ | 39.43 |
| | — |
| | $ | — |
|
| Awards granted | — |
| | — |
| | — |
| | — |
| | 14,000 |
| | 70.22 |
|
| Awards vested | (12,145 | ) | | 39.92 |
| | (105,604 | ) | | 40.44 |
| | — |
| | — |
|
| Awards forfeited/cancelled | (1,360 | ) | | 36.57 |
| | — |
| | — |
| | — |
| | — |
|
| Changes in the number of awards expected to be delivered | 2,550 |
| | 36.57 |
| | (21,655 | ) | | 32.27 |
| | — |
| | — |
|
| Unvested performance-based awards outstanding at December 31, 2015 | 22,090 |
| | $ | 37.52 |
| | 211,206 |
| | $ | 39.65 |
| | 14,000 |
| | $ | 70.22 |
|
| Awards granted | — |
| | — |
| | — |
| | — |
| | — |
| | — |
|
| Awards vested | (9,978 | ) | | 40.15 |
| | (105,604 | ) | | 40.44 |
| | (4,666 | ) | | 70.22 |
|
| Awards forfeited/cancelled | (6,539 | ) | | 36.97 |
| | — |
| | — |
| | (4,667 | ) | | 70.22 |
|
| Unvested performance-based awards outstanding at December 31, 2016 | 5,573 |
| | $ | 33.47 |
| | 105,602 |
| | $ | 38.86 |
| | 4,667 |
| | $ | 70.22 |
|
As2018, the Company recognized $3,810 of December 31, 2016, the aggregate unrecognized compensation expense for all outstanding performance-based equity-classified restricted stock was $144. That cost is expected to be recognized over the next 1.0 year using the weighted average method.
As of December 31, 2016, the aggregate unrecognized compensation expense for all outstanding performance-based liability-classified restricted stock was $3,002. That cost is expected to be recognized over the next 1.0 year using the weighted average method.
As of December 31, 2016, the aggregate unrecognized compensation expense for all outstanding performance-based equity-classified RSUs was $471. This expense is expected to be recognized over the next 1.3 years using the weighted average method.revenues that were included in Accrued expenses and other current liabilities at January 1, 2018.
| |
15.10. | EARNINGS PER SHAREDERIVATIVE FINANCIAL INSTRUMENTS |
Basic EPS is computed by dividingThe Company conducts a large portion of its operations in international markets that subject it to foreign currency fluctuations. To manage the net income applicable to common stockholdersrisk of fluctuations in foreign currency exchange rates, during the year ended December 31, 2018, the Company implemented a hedging program whereby it enters into a series of foreign exchange forward contracts with durations of twelve months or less that are designated as cash flow hedges of forecasted Russian ruble, Polish zloty and Indian rupee transactions.
The Company measures derivative instruments and hedging activities at fair value and recognizes them as either assets or liabilities in its consolidated balance sheets. Accounting for the periodgains and losses resulting from changes in fair value depends on the use of the derivative and whether it is designated and qualifies for hedge accounting. To receive hedge accounting treatment, all hedging relationships are formally documented at the inception of the hedge, and the hedges must be highly effective in offsetting changes to future cash flows on hedged transactions. As of December 31, 2019, all of the Company’s foreign exchange forward contracts were designated as hedges.
Derivatives may give rise to credit risks from the possible non-performance by counterparties. The Company has limited its credit risk by entering into derivative transactions only with highly-rated financial institutions and by conducting an ongoing evaluation of the creditworthiness of the financial institutions with which the Company does business. There is no financial collateral (including cash collateral) required to be posted by the weighted average number of shares of common stock outstanding duringCompany related to the same period. Diluted earnings per share is computed by dividing the net income available to common shareholders by the weighted-average number of shares of common stock outstanding during the period increased to include the number of additional shares of common stock that would have been outstanding if the potentially dilutive securities had been issued. Potentially dilutive securities include outstanding stock options, unvested restricted stock and unvested RSUs. The dilutive effect of potentially dilutive securities is reflected in diluted earnings per share by application of the treasury stock method.foreign exchange forward contracts.
The following table sets forthfair value of derivative instruments on the computationCompany’s consolidated balance sheets as of basicDecember 31, 2019 and diluted earnings per share of common stockDecember 31, 2018 were as follows: |
| | | | | | | | | | | | |
| | | For the Years Ended December 31, |
| | | 2016 | | 2015 | | 2014 |
| Numerator for common earnings per share: | | | | | | |
| Net income | | $ | 99,266 |
| | $ | 84,456 |
| | $ | 69,641 |
|
| Numerator for basic and diluted earnings per share | | $ | 99,266 |
| | $ | 84,456 |
| | $ | 69,641 |
|
| | | | | | | |
Denominator for basic and diluted earnings per share:
| | |
| | |
| | |
| Weighted average common shares outstanding | | 50,309 |
| | 48,721 |
| | 47,189 |
|
| Effect of dilutive securities: | | | | | | |
| Stock options, RSUs and performance-based awards | | 2,906 |
| | 3,265 |
| | 2,545 |
|
| Denominator for diluted earnings per share | | 53,215 |
| | 51,986 |
| | 49,734 |
|
| | | | | | | |
| Net income per share: | | |
| | |
| | |
| Basic | | $ | 1.97 |
| | $ | 1.73 |
| | $ | 1.48 |
|
| Diluted | | $ | 1.87 |
| | $ | 1.62 |
| | $ | 1.40 |
|
|
| | | | | | | | | | | | | | | | | | |
| | | | | As of December 31, 2019 | | As of December 31, 2018 |
| | | Balance Sheet Classification | | Asset Derivatives | | Liability Derivatives | | Asset Derivatives | | Liability Derivatives |
Foreign exchange forward contracts - Designated as hedging instruments | | Prepaid and other current assets | | $ | 1,910 |
| | | | $ | 181 |
| | |
| | | Accrued expenses and other current liabilities | | | | $ | 243 |
| | | | $ | 3,475 |
|
ForThe changes in the fair value of foreign currency derivative instruments in the Company’s consolidated statements of income and comprehensive income for the years ended December 31, 2016, 20152019, 2018 and 2014 a total of 2,325, 1,637 and 2,260 shares underlying equity-based awards, respectively,2017 were outstanding but were not included in the computation of diluted earnings per share because the effect was anti-dilutive.as follows:
|
| | | | | | | | | | | |
| | Year Ended December 31, |
| | 2019 | | 2018 | | 2017 |
| Foreign exchange forward contracts - Designated as hedging instruments: | | | | | |
| Net gain/(loss) in fair value recognized in Accumulated other comprehensive loss | $ | 4,961 |
| | $ | (3,294 | ) | | $ | — |
|
| Net gain/(loss) reclassified from Accumulated other comprehensive loss into Cost of revenues (exclusive of depreciation and amortization) | $ | 2,028 |
| | $ | (4,161 | ) | | $ | — |
|
| Foreign exchange forward contracts - Not designated as hedging instruments: | | | | | |
| Net gain recognized in Foreign exchange (loss)/gain | $ | — |
| | $ | 44 |
| | $ | 425 |
|
| |
16. | COMMITMENTS AND CONTINGENCIES |
The Company leases office space under operating leases, which expire at various dates. Certain leases contain renewal provisions and generally require the Company to pay utilities, insurance, taxes, and other operating expenses. Rent expense under operating lease agreements for the years ended December 31, 2016, 2015 and 2014 was $28,220, $20,065, and $18,200 respectively. Future minimum rental payments under operating leases that have initial or remaining lease terms in excess of one year as of December 31, 2016 were as follows: |
| | | | |
| Year Ending December 31, | | Operating Leases |
| 2017 | | $ | 30,791 |
|
| 2018 | | 24,706 |
|
| 2019 | | 16,044 |
|
| 2020 | | 10,271 |
|
| 2021 | | 7,170 |
|
| Thereafter | | 11,098 |
|
| Total minimum lease payments | | $ | 100,080 |
|
Indemnification Obligations—In the normal course of business, the Company is a party to a variety of agreements under which it may be obligated to indemnify the other party for certain matters. These obligations typically arise in contracts where the Company customarily agrees to hold the other party harmless against losses arising from a breach of representations or covenants for certain matters such as title to assets and intellectual property rights associated with certain arrangements. The duration of these indemnifications varies, and in certain cases, is indefinite.
The Company is unable to reasonably estimate the maximum potential amount of future payments under these or similar agreements due to the unique facts and circumstances of each agreement and the fact that certain indemnifications provide for no limitation to the maximum potential future payments under the indemnification. Management is not aware of any such matters that historically had or would have a material effect on the financial statements of the Company.
Litigation — From time to time, the Company is involved in litigation, claims or other contingencies. Management is not aware of any such matters that would have a material effect on the consolidated financial statements of the Company.
| |
17.11. | FAIR VALUE MEASUREMENTS |
The Company carries contingentcertain assets and liabilities and certain equity-based awards at fair value on a recurring basis on its consolidated balance sheets. Changes in the fair values of these financial liabilities are typically recorded within selling, general and administrative expenses on the Company’s consolidated statements of income and comprehensive income.
The following tables showtable shows the fair values of the Company’s financial assets and liabilities measured at fair value on a recurring basis as of December 31, 2016 and 2015:2019: |
| | | | | | | | | | | | | | | | |
| | | As of December 31, 2016 |
| | | Balance | | Level 1 | | Level 2 | | Level 3 |
| Performance-based equity awards | | $ | 3,789 |
| | $ | 3,789 |
| | $ | — |
| | $ | — |
|
| Cash-settled restricted stock units | | 2,111 |
| | 2,111 |
| | — |
| | — |
|
| Total liabilities measured at fair value on a recurring basis | | $ | 5,900 |
| | $ | 5,900 |
| | $ | — |
| | $ | — |
|
|
| | | | | | | | | | | | | | | | |
| | | As of December 31, 2019 |
| | | Balance | | Level 1 | | Level 2 | | Level 3 |
| Foreign exchange derivative assets | | $ | 1,910 |
| | $ | — |
| | $ | 1,910 |
| | $ | — |
|
| Total assets measured at fair value on a recurring basis | | $ | 1,910 |
| | $ | — |
| | $ | 1,910 |
| | $ | — |
|
| | | | | | | | | |
| Foreign exchange derivative liabilities | | $ | 243 |
| | $ | — |
| | $ | 243 |
| | $ | — |
|
| Contingent consideration | | 10,495 |
| | — |
| | — |
| | 10,495 |
|
| Total liabilities measured at fair value on a recurring basis | | $ | 10,738 |
| | $ | — |
| | $ | 243 |
| | $ | 10,495 |
|
|
| | | | | | | | | | | | | | | | |
| | | As of December 31, 2015 |
| | | Balance | | Level 1 | | Level 2 | | Level 3 |
| Performance-based equity awards | | $ | 5,364 |
| | $ | — |
| | $ | — |
| | $ | 5,364 |
|
Total liabilities measured at fair value on a recurring basis
| | $ | 5,364 |
| | $ | — |
| | $ | — |
| | $ | 5,364 |
|
Performance-based equity awards carriedThe following table shows the fair values of the Company’s financial assets and liabilities measured at fair value on a recurring basis represent contractual liabilities related to certain business combination transactions completed in 2014. During the determination period, the Company classified the performance-based equity awards within Level 3. as of December 31, 2018.
|
| | | | | | | | | | | | | | | | |
| | | As of December 31, 2018 |
| | | Balance | | Level 1 | | Level 2 | | Level 3 |
| Foreign exchange derivative assets | | $ | 181 |
| | $ | — |
| | $ | 181 |
| | $ | — |
|
| Total assets measured at fair value on a recurring basis | | $ | 181 |
| | $ | — |
| | $ | 181 |
| | $ | — |
|
| | | | | | | | | |
| Foreign exchange derivative liabilities | | $ | 3,475 |
| | $ | — |
| | $ | 3,475 |
| | $ | — |
|
| Contingent consideration | | 7,468 |
| | — |
| | — |
| | 7,468 |
|
| Total liabilities measured at fair value on a recurring basis | | $ | 10,943 |
| | $ | — |
| | $ | 3,475 |
| | $ | 7,468 |
|
The Company estimated the fair value of these liabilitiesforeign exchange derivatives are valued using pricing models and discounted cash flow methodologies based on transaction-specific inputs by discountingobservable foreign exchange data at the expected cash flows to a present value, after taking into account estimated probabilities of reaching specified performance targets, as appropriate. During the year ended December 31, 2016, the fair value of the performance-based awards was measured using pricesmeasurement date. See Note 10 “Derivative Financial Instruments” for which observable marketadditional information became available. As a result, the Company reclassified these liabilities from Level 3 to Level 1.regarding derivative financial instruments.
The fair value of the cash-settled restricted stock unitscontingent consideration is measuredbased on the expected future payments to be made to the sellers of the acquired businesses in accordance with the provisions outlined in the respective purchase agreements. Although there is significant judgment involved, the Company believes its estimates and assumptions are reasonable. In determining fair value, the Company considered a variety of factors, including future performance of the acquired business using pricesfinancial projections developed by the Company and market risk assumptions that were derived for which observablerevenue growth and earnings before interest and taxes. The Company estimated future payments using the earnout formula and performance targets specified in the purchase agreements and adjusted those estimates to reflect the probability of their achievement. Those estimated future payments were then discounted to present value using a rate based on the weighted-average cost of capital of guideline companies. Changes in financial projections, market risk assumptions, discount rates or probability assumptions related to achieving the various earnout criteria would result in a change in the fair value of the recorded contingent liabilities. Such changes, if any, are recorded within Interest and other income, net in the Company’s consolidated statement of income and comprehensive income.
In connection with the Continuum acquisition, the Company committed to making a cash earnout payment subject to attainment of specified performance targets in the 12 months after the acquisition date. As of the acquisition date, the Company recorded a $2,400 contingent consideration liability related to this earnout payment and, subsequently, reduced this liability by $900 during the third quarter of 2018 and $396 during the second quarter of 2019 due to the change in its fair value. The Company extinguished the earnout obligation during the second quarter of 2019 by paying $1,104 in cash. In connection with the Think acquisition, the Company committed to making a cash earnout payment subject to attainment of specified performance targets in the 12 months after the acquisition date. As of the acquisition date, the Company recorded a $5,990 liability related to this earnout payment as contingent consideration and, subsequently, increased this liability by $2,172 during 2019 due to the change in its fair value. In connection with the Company’s other 2019 acquisitions, the Company committed to making cash earnout payments subject to attainment of specified performance targets ranging from 12 months to 24 months after the respective acquisition dates. See Note 2 “Acquisitions” in the consolidated financial statements for additional information is available.regarding business acquisitions.
A reconciliation of the beginning and ending balances of acquisition-related contractual contingent liabilities using significant unobservable inputs (Level 3) for the years ended December 31, 20162018 and 2015, wasDecember 31, 2019 are as follows: |
| | | | |
| | | Amount |
| Contractual contingent liabilities as of January 1, 2018 | | $ | — |
|
| Acquisition date fair value of contingent consideration — Continuum acquisition (Note 2) | | 2,400 |
|
| Acquisition date fair value of contingent consideration — Think acquisition (Note 2) | | 5,990 |
|
| Changes in fair value of contingent consideration included in Interest and other income, net | | (900 | ) |
| Effect of net foreign currency exchange rate changes | | (22 | ) |
| Contractual contingent liabilities as of December 31, 2018 | | $ | 7,468 |
|
| Payment of contingent consideration | | (1,104 | ) |
| Acquisition date fair value of contractual contingent consideration — Other 2019 acquisitions (Note 2) | | 2,100 |
|
| Changes in fair value of contingent consideration included in Interest and other income, net | | 1,776 |
|
| Effect of net foreign currency exchange rate changes | | 255 |
|
| Contingent consideration liabilities as of December 31, 2019 | | $ | 10,495 |
|
|
| | | | |
| | Amount |
Contractual contingent liabilities at January 1, 2014 | | $ | — |
|
Acquisition date fair value of contractual contingent liabilities — Netsoft | | 1,825 |
|
Acquisition date fair value of contractual contingent liabilities — Jointech | | 20,000 |
|
Acquisition date fair value of contractual contingent liabilities — GGA | | 11,400 |
|
Acquisition date fair value of contractual contingent liabilities — Great Fridays | | 1,173 |
|
Liability-classified stock-based awards | | 3,088 |
|
Changes in fair value of contractual contingent liabilities included in earnings | | 2,059 |
|
Changes in fair value of contractual contingent liabilities recorded against goodwill | | 1,366 |
|
Effect of net foreign currency exchange rate changes | | (288 | ) |
Contractual contingent liabilities at December 31, 2014 | | 40,623 |
|
Liability-classified stock-based awards | | 5,148 |
|
Changes in fair value of contractual contingent liabilities included in earnings | | 4,355 |
|
Effect of net foreign currency exchange rate changes | | 246 |
|
Settlements of contractual contingent liabilities | | (45,008 | ) |
Contractual contingent liabilities at December 31, 2015 | | 5,364 |
|
Acquisition date fair value of contractual contingent liabilities — other acquisitions | | 800 |
|
Liability-classified stock-based awards | | 5,148 |
|
Changes in fair value of contractual contingent liabilities included in earnings | | 1,232 |
|
Changes in fair value of contractual contingent liabilities recorded against goodwill | | 200 |
|
Settlements of contractual contingent liabilities | | (8,955 | ) |
Reclassification of contractual contingent liabilities out of Level 3 | | (3,789 | ) |
Contractual contingent liabilities at December 31, 2016 | | $ | — |
|
The Company had 0 activity related to contractual contingent liabilities during the year ended December 31, 2017.Estimates of fair value of financial instruments not carried at fair value on a recurring basis on the Company’s consolidated balance sheets are generally subjective in nature, and are determined as of a specific point in time based on the characteristics of the financial instruments and relevant market information. The Company uses the following methods to estimate the fair values of its financial instruments:
for financial instruments that have quoted market prices, those quoted prices are used to estimate fair value;
for financial instruments for which no quoted market prices are available, fair value is estimated using information obtained from independent third parties, or by discounting the expected cash flows using an estimated current market interest rate for the financial instrument.instrument;
for financial instruments for which no quoted market prices are available and that have no defined maturity, have a remaining maturity of 360 days or less, or reprice frequently to a market rate, the Company assumes that the fair value of these instruments approximates their reported value, after taking into consideration any applicable credit risk;risk.
The generally short duration of certain of the Company’s assets and liabilities results in a significant number of assets and liabilities for which fair value equals or closely approximates the amount recorded on the Company’s consolidated balance sheets. TheseThe Company’s financial assets and liabilities that are reportednot carried at fair value on a recurring basis on the Company’s consolidated balance sheets:sheets are as follows:
cash and cash equivalents;
time deposits and restricted cash;
employee loans and notes receivable;loans;
borrowings under the 2014 Credit Facility (Note 13)
In addition, due to the relatively short duration of certain of our loans, the Company considers fair value for these loans to approximate their carrying amounts. The fair value of other types of loans, such as employee loans issued under the Housing Program, is estimated using information on the rates of return that market participants in Belarus would require when investing in unsecured U.S. dollar-denominated government bonds with similar maturities (a “risk-free rate”), after taking into consideration any applicable credit and liquidity risk. | |
| • | long-term debt (Note 8 “Long-Term Debt”) |
The following tables present the reported amounts and estimated fair values of the financial assets and liabilities not carried atfor which disclosure of fair value on a recurring basis,is required, as they would be categorized within the fair-valuefair value hierarchy, as of the dates indicated:
|
| | | | | | | | | | | | | | | | | | | | |
| | | | | | | Fair Value Hierarchy |
| | | Balance | | Estimated Fair Value | | Level 1 | | Level 2 | | Level 3 |
| December 31, 2016 | | | | | | | | | | |
| Financial Assets: | | | | | | | | | | |
| Cash and cash equivalents | | $ | 362,025 |
| | $ | 362,025 |
| | $ | 362,025 |
| | $ | — |
| | $ | — |
|
| Time deposits and restricted cash | | $ | 3,042 |
| | $ | 3,042 |
| | $ | — |
| | $ | 3,042 |
| | $ | — |
|
| Employee loans | | $ | 5,978 |
| | $ | 5,978 |
| | $ | — |
| | $ | — |
| | $ | 5,978 |
|
| Financial Liabilities: | | | | | | | | | | |
| Borrowing under 2014 Credit Facility | | $ | 25,019 |
| | $ | 25,019 |
| | $ | — |
| | $ | 25,019 |
| | $ | — |
|
|
| | | | | | | | | | | | | | | | | | | | |
| | | | | | | Fair Value Hierarchy |
| | | Balance | | Estimated Fair Value | | Level 1 | | Level 2 | | Level 3 |
| December 31, 2019 | | | | | | | | | | |
| Financial Assets: | | | | | | | | | | |
| Cash equivalents: | | | | | | | | | | |
| Money market funds | | $ | 407,817 |
| | $ | 407,817 |
| | $ | 407,817 |
| | $ | — |
| | $ | — |
|
| Time deposits | | 10,002 |
| | 10,002 |
| | — |
| | 10,002 |
| | — |
|
| Total cash equivalents | | $ | 417,819 |
| | $ | 417,819 |
| | $ | 407,817 |
| | $ | 10,002 |
| | $ | — |
|
| Restricted cash | | $ | 1,136 |
| | $ | 1,136 |
| | $ | 1,136 |
| | $ | — |
| | $ | — |
|
| Employee loans | | $ | 2,434 |
| | $ | 2,434 |
| | $ | — |
| | $ | — |
| | $ | 2,434 |
|
| Financial Liabilities: | | | | | | | | | | |
| Borrowings under 2017 Credit Facility | | $ | 25,017 |
| | $ | 25,017 |
| | $ | — |
| | $ | 25,017 |
| | $ | — |
|
|
| | | | | | | | | | | | | | | | | | | | |
| | | | | | | Fair Value Hierarchy |
| | | Balance | | Estimated Fair Value | | Level 1 | | Level 2 | | Level 3 |
| December 31, 2015 | | | | | | | | | | |
| Financial Assets: | | | | | | | | | | |
| Cash and cash equivalents | | $ | 199,449 |
| | $ | 199,449 |
| | $ | 199,449 |
| | $ | — |
| | $ | — |
|
| Time deposits and restricted cash | | $ | 30,419 |
| | $ | 30,419 |
| | $ | — |
| | $ | 30,419 |
| | $ | — |
|
| Employee loans | | $ | 6,338 |
| | $ | 6,338 |
| | $ | — |
| | $ | — |
| | $ | 6,338 |
|
| Financial Liabilities: | | | | | | | | | | |
| Borrowing under 2014 Credit Facility | | $ | 35,000 |
| | $ | 35,000 |
| | $ | — |
| | $ | 35,000 |
| | $ | — |
|
|
| | | | | | | | | | | | | | | | | | | | |
| | | | | | | Fair Value Hierarchy |
| | | Balance | | Estimated Fair Value | | Level 1 | | Level 2 | | Level 3 |
| December 31, 2018 | | | | | | | | | | |
| Financial Assets: | | | | | | | | | | |
| Cash equivalents | | | | | | | | | | |
| Money market funds | | $ | 282,664 |
| | $ | 282,664 |
| | $ | 282,664 |
| | $ | — |
| | $ | — |
|
| Total cash equivalents | | $ | 282,664 |
| | $ | 282,664 |
| | $ | 282,664 |
| | $ | — |
| | $ | — |
|
| Restricted cash | | $ | 1,151 |
| | $ | 1,151 |
| | $ | 1,151 |
| | $ | — |
| | $ | — |
|
| Employee loans | | $ | 3,525 |
| | $ | 3,525 |
| | $ | — |
| | $ | — |
| | $ | 3,525 |
|
| Financial Liabilities: | | | | | | | | | | |
| Borrowings under 2017 Credit Facility | | $ | 25,020 |
| | $ | 25,020 |
| | $ | — |
| | $ | 25,020 |
| | $ | — |
|
12.STOCK-BASED COMPENSATION
The following costs related to the Company’s stock compensation plans were included in the consolidated statements of income and comprehensive income: |
| | | | | | | | | | | | |
| | | For the Years Ended December 31, |
| | | 2019 | | 2018 | | 2017 |
| Cost of revenues (exclusive of depreciation and amortization) | | $ | 37,580 |
| | $ | 27,245 |
| | $ | 20,868 |
|
Selling, general and administrative expenses | | 34,456 |
| | 31,943 |
| | 31,539 |
|
| Total | | $ | 72,036 |
| | $ | 59,188 |
| | $ | 52,407 |
|
Equity Plans
2015 Long-Term Incentive Plan— On June 11, 2015, the Company’s stockholders approved the 2015 Long-Term Incentive Plan (“2015 Plan”) to be used to issue equity awards to company personnel. As of December 31, 2019, 4,969,754 shares of common stock remained available for issuance under the 2015 Plan. All of the awards issued pursuant to the 2015 Plan expire 10 years from the date of grant.
2012 Non-Employee Directors Compensation Plan — On January 11, 2012, the Company approved the 2012 Non-Employee Directors Compensation Plan (“2012 Directors Plan”) to be used to issue equity grants to its non-employee directors. The Company authorized 600,000 shares of common stock to be reserved for issuance under the plan. As of December 31, 2019, 528,441 shares of common stock remained available for issuance under the 2012 Directors Plan. The 2012 Directors Plan will expire after 10 years and is administered by the Company’s Board of Directors.
2012 Long-Term Incentive Plan — On January 11, 2012, the Company approved the 2012 Long-Term Incentive Plan (“2012 Plan”) to be used to issue equity grants to Company personnel. In June 2015, the 2012 Plan was discontinued; however, outstanding awards remain subject to the terms of the 2012 Plan and any shares that are subject to an award that was previously granted under the 2012 Plan and that expire or terminate for any reason prior to exercise will become available for issuance under the 2015 Plan. All of the awards issued pursuant to the 2012 Plan expire 10 years from the date of grant.
2006 Stock Option Plan — Effective May 31, 2006, the Board of Directors of the Company adopted the 2006 Stock Option Plan (the “2006 Plan”) to grant stock options to directors, employees, and certain independent contractors. In January 2012, the 2006 Plan was discontinued; however, outstanding awards remain subject to the terms of the 2006 Plan and any shares that are subject to an option award that was previously granted under the 2006 Plan and that expire or terminate for any reason prior to exercise will become available for issuance under the 2015 Plan. All of the awards issued pursuant to the 2006 Plan expire 10 years from the date of grant.
Stock Options
Stock option activity under the Company’s plans is set forth below: |
| | | | | | | | | | | | |
| | Number of Options | | Weighted Average Exercise Price | | Aggregate Intrinsic Value | | Weighted Average
Remaining Contractual Term (in years) |
| Options outstanding as of January 1, 2017 | 6,637,239 |
| | $ | 37.20 |
| | $ | 179,936 |
| | |
| Options granted | 261,373 |
| | $ | 73.40 |
| | | | |
| Options exercised | (1,789,434 | ) | | $ | 30.23 |
| | | | |
| Options forfeited/cancelled | (200,210 | ) | | $ | 57.09 |
| | | | |
| Options expired | (7,220 | ) | | $ | 4.63 |
| | | | |
| Options outstanding as of December 31, 2017 | 4,901,748 |
| | $ | 40.91 |
| | $ | 326,064 |
| | |
| Options granted | 160,181 |
| | $ | 112.81 |
| | | | |
| Options exercised | (945,166 | ) | | $ | 36.69 |
| | | | |
| Options forfeited/cancelled | (32,569 | ) | | $ | 63.28 |
| | | | |
| Options expired | (1,250 | ) | | $ | 25.72 |
| | | | |
| Options outstanding as of December 31, 2018 | 4,082,944 |
| | $ | 44.54 |
| | $ | 291,846 |
| | |
| Options granted | 131,849 |
| | $ | 169.13 |
| | | | |
| Options modified | 17,871 |
| | $ | 163.55 |
| | | | |
| Options exercised | (899,033 | ) | | $ | 41.21 |
| | | | |
| Options forfeited/cancelled | (10,701 | ) | | $ | 97.83 |
| | | | |
| Options outstanding as of December 31, 2019 | 3,322,930 |
| | $ | 50.85 |
| | $ | 536,015 |
| | 4.8 |
| | | | | | | | |
| Options vested and exercisable as of December 31, 2019 | 2,908,237 |
| | $ | 41.53 |
| | $ | 496,226 |
| | 4.3 |
| Options expected to vest as of December 31, 2019 | 392,241 |
| | $ | 115.26 |
| | $ | 38,010 |
| | 8.1 |
The fair value of each option award is estimated on the date of grant using the Black-Scholes option valuation model. The model incorporated the following weighted-average assumptions: |
| | | | | | | | |
| | For the Years Ended December 31, |
| | 2019 | | 2018 | | 2017 |
| Expected volatility | 33.5 | % | | 33.8 | % | | 30.5 | % |
| Expected term (in years) | 6.25 |
| | 6.25 |
| | 6.25 |
|
| Risk-free interest rate | 2.3 | % | | 2.7 | % | | 2.1 | % |
| Expected dividends | — | % | | — | % | | — | % |
Effective January 1, 2018, the Company changed its methodology for estimating volatility used in the Black-Scholes option valuation model. Prior to January 1, 2018, the Company estimated the volatility of its common stock by using the historical volatility of peer public companies including the Company’s historical volatility. In the first quarter of 2018, the Company began exclusively using its own historical volatility as it believes this is a more accurate estimate of future volatility of the price of the Company’s common stock. The Company did not change the methodology for estimating any other Black-Scholes option valuation model assumptions.
The risk-free rate is based on the U.S. Treasury yield curve for periods equal to the expected term of the options in effect at the time of grant. The Company has not declared or paid any dividends on its common stock. The Company intends to retain any earnings to fund operations and future growth of its business and, therefore, does not anticipate paying any cash dividends in the foreseeable future.
The weighted-average grant-date fair value of stock options granted during the years ended December 31, 2019, 2018 and 2017 was $63.12, $43.42 and $25.29, respectively. The total intrinsic value of options exercised during the years ended December 31, 2019, 2018 and 2017 was $121,063, $83,250 and $91,148, respectively.
The Company recognizes the fair value of each option as compensation expense on a straight-line basis over the requisite service period, which is generally the vesting period. The options are typically scheduled to vest over four years from the time of grant, subject to the terms of the applicable plan and stock option agreement. In general, in the event of a participant’s termination of service for any reason, unvested options are forfeited as of the date of such termination without any payment to the participant. The Company records share-based compensation expense only for those awards that are expected to vest and as such, the Company applies an estimated forfeiture rate at the time of grant and adjusts the forfeiture rate to reflect actual forfeitures quarterly.
As of December 31, 2019, $12,262 of total remaining unrecognized compensation cost related to unvested stock options, net of estimated forfeitures, is expected to be recognized over a weighted-average period of 2.6 years.
Restricted Stock and Restricted Stock Units
The Company grants restricted stock units (“RSUs”) to Company personnel and non-employee directors under the Company’s 2015 Plan (and prior to its approval, under the 2012 Plan) and 2012 Directors Plan, respectively. Prior to 2017, awards to non-employee directors were in the form of restricted stock. In addition, the Company has issued in the past, and may issue in the future, its equity securities to compensate employees of acquired businesses for future services. Equity-based awards granted in connection with acquisitions of businesses are generally issued in the form of service-based awards (dependent on continuing employment only) and performance-based awards, which are granted and vest only if certain specified performance and service conditions are met. The awards issued in connection with acquisitions of businesses are subject to the terms and conditions contained in the applicable award agreements and acquisition documents.
Service-Based Awards
The table below summarizes activity related to the Company’s equity-classified and liability-classified service-based awards for the years ended December 31, 2019, 2018 and 2017: |
| | | | | | | | | | | | | | | | | | | | |
| | Equity-Classified Equity-Settled Restricted Stock | | Equity-Classified Equity-Settled Restricted Stock Units | | Liability-Classified Cash-Settled Restricted Stock Units |
| | Number of Shares | | Weighted Average Grant Date Fair Value Per Share | | Number of Shares | | Weighted Average Grant Date Fair Value Per Share | | Number of Shares | | Weighted Average Grant Date Fair Value Per Share |
| Unvested service-based awards outstanding as of January 1, 2017 | 154,125 |
| | $ | 40.89 |
| | 485,188 |
| | $ | 67.69 |
| | 204,501 |
| | $ | 70.53 |
|
| Awards granted | — |
| | $ | — |
| | 424,623 |
| | $ | 73.89 |
| | 170,295 |
| | $ | 74.21 |
|
| Awards modified | — |
| | $ | — |
| | (2,570 | ) | | $ | 26.85 |
| | 2,570 |
| | $ | 73.27 |
|
| Awards vested | (152,285 | ) | | $ | 43.39 |
| | (140,043 | ) | | $ | 66.54 |
| | (52,004 | ) | | $ | 70.56 |
|
| Awards forfeited/cancelled | — |
| | $ | — |
| | (79,186 | ) | | $ | 70.30 |
| | (10,533 | ) | | $ | 71.72 |
|
| Unvested service-based awards outstanding as of December 31, 2017 | 1,840 |
| | $ | 54.37 |
| | 688,012 |
| | $ | 71.60 |
| | 314,829 |
| | $ | 72.50 |
|
| Awards granted | — |
| | $ | — |
| | 380,864 |
| | $ | 115.84 |
| | 85,380 |
| | $ | 112.65 |
|
| Awards modified | — |
| | $ | — |
| | (3,110 | ) | | $ | 80.27 |
| | 3,110 |
| | $ | 120.18 |
|
| Awards vested | (1,047 | ) | | $ | 47.76 |
| | (217,800 | ) | | $ | 70.10 |
| | (91,684 | ) | | $ | 72.69 |
|
| Awards forfeited/cancelled | — |
| | $ | — |
| | (50,063 | ) | | $ | 86.97 |
| | (8,668 | ) | | $ | 81.40 |
|
| Unvested service-based awards outstanding as of December 31, 2018 | 793 |
| | $ | 63.10 |
| | 797,903 |
| | $ | 92.13 |
| | 302,967 |
| | $ | 83.99 |
|
| Awards granted | 9,394 |
| | $ | 167.18 |
| | 284,269 |
| | $ | 170.29 |
| | 55,923 |
| | $ | 170.13 |
|
| Awards modified | — |
| | $ | — |
| | 6,897 |
| | $ | 170.74 |
| | 668 |
| | $ | 168.36 |
|
| Awards vested | (396 | ) | | $ | 63.10 |
| | (286,654 | ) | | $ | 87.79 |
| | (110,643 | ) | | $ | 80.51 |
|
| Awards forfeited/cancelled | — |
| | $ | — |
| | (43,630 | ) | | $ | 114.45 |
| | (6,627 | ) | | $ | 94.77 |
|
| Unvested service-based awards outstanding as of December 31, 2019 | 9,791 |
| | $ | 162.96 |
| | 758,785 |
| | $ | 122.48 |
| | 242,288 |
| | $ | 105.40 |
|
The fair value of vested service-based awards (measured at the vesting date) for the years ended December 31, 2019, 2018 and 2017 was as follows:
|
| | | | | | | | | | | |
| | For the Years Ended December 31, |
| | 2019 | | 2018 | | 2017 |
| Equity-classified equity-settled | | | | | |
| Restricted stock | $ | 73 |
| | $ | 142 |
| | $ | 12,607 |
|
| Restricted stock units | 48,111 |
| | 24,987 |
| �� | 10,620 |
|
| Liability-classified cash-settled | | | | | |
| Restricted stock units | 18,449 |
| | 10,349 |
| | 3,811 |
|
| Total fair value of vested service-based awards | $ | 66,633 |
| | $ | 35,478 |
| | $ | 27,038 |
|
As of December 31, 2019, $1,413 of total remaining unrecognized stock-based compensation costs related to service-based equity-classified restricted stock is expected to be recognized over the weighted-average remaining requisite service period of 2.7 years. During the year ended December 31, 2019, the Company issued 9,394 shares of service-based restricted stock in connection with an acquisition of a business. See Note 2 “Acquisitions” for additional information regarding business acquisitions.
As of December 31, 2019, $63,588 of total remaining unrecognized stock-based compensation costs related to service-based equity-classified RSUs, net of estimated forfeitures, is expected to be recognized over the weighted-average remaining requisite service period of 2.5 years. During the years ended December 31, 2019 and 2018, in connection with business acquisitions, the Company issued 21,933 and 88,578 equity-classified RSUs. See Note 2 “Acquisitions” for additional information regarding business acquisitions.
As of December 31, 2019, $27,538 of total remaining unrecognized stock-based compensation costs related to service-based liability-classified RSUs, net of estimated forfeitures, is expected to be recognized over the weighted-average remaining requisite service period of 2.1 years. During the year ended December 31, 2019, the Company issued 7,280 shares of service-based liability-classified cash-settled RSUs in connection with a business acquisition. See Note 2 “Acquisitions” for additional information regarding business acquisitions.
The liability associated with the Company’s service-based liability-classified RSUs as of December 31, 2019 and 2018 was $21,902 and $9,920, respectively, and is classified as Accrued compensation and benefits expenses in the consolidated balance sheets.
Performance -Based Awards
The table below summarizes activity related to the Company’s performance-based awards for the years ended December 31, 2019, 2018 and 2017: |
| | | | | | | | | | | | | | | | | | | | |
| | Equity-Classified
Equity-Settled
Restricted Stock | | Liability-Classified
Equity-Settled
Restricted Stock | | Equity-Classified
Equity-Settled
Restricted Stock Units |
| | Number of Shares | | Weighted Average Grant Date Fair Value Per Share | | Number of Shares | | Weighted Average Grant Date Fair Value Per Share | | Number of Shares | | Weighted Average Grant Date Fair Value Per Share |
| Unvested performance-based awards outstanding as of January 1, 2017 | 5,573 |
| | $ | 33.47 |
| | 105,602 |
| | $ | 38.86 |
| | 4,667 |
| | $ | 70.22 |
|
| Awards granted | — |
| | $ | — |
| | — |
| | $ | — |
| | — |
| | $ | — |
|
| Awards vested | (5,573 | ) | | $ | 33.47 |
| | (105,602 | ) | | $ | 38.86 |
| | — |
| | $ | — |
|
| Awards forfeited/cancelled | — |
| | $ | — |
| | — |
| | $ | — |
| | (4,667 | ) | | $ | 70.22 |
|
| Unvested performance-based awards outstanding as of December 31, 2017 | — |
| | $ | — |
| | — |
| | $ | — |
| | — |
| | $ | — |
|
| Awards granted | — |
| | $ | — |
| | — |
| | $ | — |
| | 45,375 |
| | $ | 121.75 |
|
| Awards vested | — |
| | $ | — |
| | — |
| | $ | — |
| | (8,769 | ) | | $ | 121.75 |
|
| Awards forfeited/cancelled | — |
| | $ | — |
| | — |
| | $ | — |
| | (7,014 | ) | | $ | 121.75 |
|
| Unvested performance-based awards outstanding as of December 31, 2018 | — |
| | $ | — |
| | — |
| | $ | — |
| | 29,592 |
| | $ | 121.75 |
|
| Awards granted | 9,393 |
| | $ | 165.87 |
| | — |
| | $ | — |
| | — |
| | $ | — |
|
| Awards modified | — |
| | $ | — |
| | — |
| | $ | — |
| | (29,592 | ) | | $ | 121.75 |
|
| Unvested performance-based awards outstanding as of December 31, 2019 | 9,393 |
| | $ | 165.87 |
| | — |
| | $ | — |
| | — |
| | $ | — |
|
During the year ended December 31, 2019, the Company issued 9,393 shares of performance-based equity-classified restricted stock, in connection with an acquisition of a business. Vesting of these awards are subject to attainment of specified performance targets in the 12 months after the acquisition date. See Note 2 “Acquisitions” for additional information regarding business acquisitions. As of December 31, 2019, $1,002 of total remaining unrecognized stock-based compensation cost related to performance-based equity-classified restricted stock is expected to be recognized over the weighted-average remaining requisite service period of 3.7 years.
Performance-based equity-classified RSUs were granted during the year ended December 31, 2018 in connection with the acquisition of Continuum and have a variable vesting period, subject to satisfaction of the applicable performance conditions with each vesting portion having its own service inception date. Compensation is recognized over the vesting period and adjusted each period for the probability of achievement of the performance criteria for each vesting portion separately. During the fourth quarter of 2018, the Company accelerated the recognition of $835 of expense due to vesting of performance-based equity-classified RSUs in accordance with the terms of the award agreement. During the year ended December 31, 2019, the Company and holders of the unvested performance-based equity-classified RSUs mutually agreed to cancel these awards and the Company issued service-based stock option and equity-classified RSU awards with four-year vesting terms to those same recipients. As of December 31, 2019, there is 0 remaining unrecognized stock-based compensation cost related to performance-based equity-classified RSUs.
As part of an acquisition completed during the year ended December 31, 2019, the Company recognized $348 stock-based compensation expense related to stock awards that had not yet been formally issued as of December 31, 2019. These awards were considered to be granted for accounting purposes as all key terms were communicated to the employees. On January 3, 2020, the Company formally issued 5,793 service-based RSUs and 24,836 performance-based equity-classified RSUs to these employees.
The fair value of vested performance-based awards (measured at the vesting date) for the years ended December 31, 2019, 2018 and 2017 was as follows: |
| | | | | | | | | | | |
| | For the Years Ended December 31, |
| | 2019 | | 2018 | | 2017 |
| Equity-classified equity-settled | | | | | |
| Restricted stock | $ | — |
| | $ | — |
| | $ | 452 |
|
| Restricted stock units | — |
| | 1,046 |
| | — |
|
| Liability-classified equity-settled | | | | | |
| Restricted stock | — |
| | — |
| | 8,633 |
|
| Total fair value of vested performance-based awards | $ | — |
| | $ | 1,046 |
| | $ | 9,085 |
|
Basic earnings per share is computed by dividing net income available to common shareholders by the weighted-average number of shares of common stock outstanding during the period. For purposes of computing basic earnings per share, any nonvested shares of restricted stock that have been issued by the Company and are contingently returnable to the Company are excluded from the weighted-average number of shares of common stock outstanding during the period. Diluted earnings per share is computed by dividing net income available to common shareholders by the weighted-average number of shares of common stock outstanding during the period increased to include the number of additional shares of common stock that would have been outstanding if the potentially dilutive securities had been issued. Potentially dilutive securities include outstanding stock options, unvested restricted stock and unvested equity-settled RSUs. The dilutive effect of potentially dilutive securities is reflected in diluted earnings per share by application of the treasury stock method.
The following table sets forth the computation of basic and diluted earnings per share of common stock as follows: |
| | | | | | | | | | | | |
| | | For the Years Ended December 31, |
| | | 2019 | | 2018 | | 2017 |
| Numerator for basic and diluted earnings per share: | | | | | | |
| Net income | | $ | 261,057 |
| | $ | 240,256 |
| | $ | 72,760 |
|
| Numerator for basic and diluted earnings per share | | $ | 261,057 |
| | $ | 240,256 |
| | $ | 72,760 |
|
| | | | | | | |
| Denominator: | | |
| | |
| | |
| Weighted average common shares for basic earnings per share | | 54,719,414 |
| | 53,622,989 |
| | 52,077,011 |
|
| Net effect of dilutive stock options, restricted stock units and restricted stock awards | | 2,948,375 |
| | 3,049,687 |
| | 2,907,162 |
|
| Weighted average common shares for diluted earnings per share | | 57,667,789 |
| | 56,672,676 |
| | 54,984,173 |
|
| | | | | | | |
| Net Income per share: | | |
| | |
| | |
| Basic | | $ | 4.77 |
| | $ | 4.48 |
| | $ | 1.40 |
|
| Diluted | | $ | 4.53 |
| | $ | 4.24 |
| | $ | 1.32 |
|
The number of shares underlying equity-based awards that were excluded from the calculation of diluted earnings per share as their effect would be anti-dilutive was 120,021, 138,639 and 883,350 for the years ended December 31, 2019, 2018 and 2017, respectively.
| |
| 14. | COMMITMENTS AND CONTINGENCIES |
Indemnification Obligations—In the normal course of business, the Company is a party to a variety of agreements under which it may be obligated to indemnify the other party for certain matters. These obligations typically arise in contracts with customers where the Company customarily agrees to hold the other party harmless against losses arising from a breach of representations or covenants for certain matters, infringement of third party intellectual property rights, data privacy violations, and certain tortious conduct in the course of providing services. The duration of these indemnifications varies, and in certain cases, is indefinite.
The Company is unable to reasonably estimate the maximum potential amount of future payments under these or similar agreements due to the unique facts and circumstances of each agreement and the fact that certain indemnifications provide for no limitation to the maximum potential future payments under the indemnification. Management is not aware of any such matters that would have a material effect on the consolidated financial statements of the Company.
Litigation — From time to time, the Company is involved in litigation, claims or other contingencies arising in the ordinary course of business. The Company accrues a liability when a loss is considered probable and the amount can be reasonably estimated. When a material loss contingency is reasonably possible but not probable, the Company does not record a liability, but instead discloses the nature and the amount of the claim, and an estimate of the loss or range of loss, if such an estimate can be made. Legal fees are expensed as incurred. In the opinion of management, the outcome of any existing claims and legal or regulatory proceedings, if decided adversely, is not expected to have a material effect on the Company’s business, financial condition, results of operations or cash flows.
Building Acquisition Commitment —During the year ended December 31, 2019, the Company entered into agreements to purchase office space in Ukraine intended to support the global delivery centers in that country. The agreement is subject to completion of construction and other ordinary closing conditions and requires the Company to pay approximately $48,900 in cash including VAT to the sellers, $12,000 of which has been paid as of December 31, 2019 and is classified as Other noncurrent assets in the consolidated balance sheets.
The Company determines its business segments and reports segment information in accordance with the management approach, which designates internal reporting used by management to make operating decisions and assess performance as the source ofhow the Company’s reportable segments.
The Company manages its business primarily based on the geographic managerial responsibility for its client base. As managerial responsibility for a particular client relationship generally correlates with the client’s geographic location, there is a high degree of similarity between client locations and the geographic boundaries of the Company’s reportable segments. In some cases, managerial responsibility for a particular client is assigned to a management team in another region and is usually based on the strength of the relationship between client executives and particular members of EPAM’s senior management team. In such a case, the client’s activity would be reported through the management team’s reportable segment.
The Company’s reportable segments are North America, Europe, Russia and Other. The revenues in the Other segment represented less than 1% of total segment revenues in 2014 and 2015 due to the ending of certain customer relationships and contractual changes with other clients. As no substantial clients remained in the segment, during the first quarter of 2016, the Company shifted managerial responsibility for the remaining clients to the Russia segment. This change does not represent a change in the Company's existing segments but rather a movement in responsibility for several clients that represent less than 1% of total segment revenue.
The Company’s Chief Operating Decision Makerchief operating decision maker (“CODM”) evaluatesorganizes the segments to evaluate performance, allocate resources and allocates resourcesmake business decisions. Segment results are based on the segment’s revenues and operating profit. Segmentprofit, where segment operating profit is defined as income from operations before unallocated costs. Generally, operating expenses for each reportable segment have similar characteristics and are subject to similar factors, pressures and challenges. Expenses included in segment operating profit consist principally of direct selling and delivery costs as well as an allocation of certain shared services expenses. Certain corporate expenses thatare not allocated to specific segments as these expenses are not controllable at the segment levellevel. Such expenses include certain types of professional fees, non-corporate taxes, compensation to non-employee directors and certain other general and administrative expenses, including compensation of specific groups of non-production employees. In addition, the Company does not allocate stock-based compensation expenses, amortization of purchased intangible assets, other acquisition-related expenses and other unallocated costs. These unallocated amounts are not allocatedcombined with total segment operating profit to specific segments. Such “unallocated” expenses are deducted against the Company’s totalarrive at consolidated income from operations as reported below in the reconciliation of segment operating profit to consolidated income before provision for income taxes. Additionally, management has determined that it is not practical to allocate identifiable assets by segment since such assets are used interchangeably among the segments.
The Company manages its business primarily based on the managerial responsibility for its client base and are not allocatedmarket. As managerial responsibility for a particular customer relationship generally correlates with the customer’s geographic location, there is a high degree of similarity between customer locations and the geographic boundaries of the Company’s reportable segments. In some cases, managerial responsibility for a particular customer is assigned to individual segmentsa management team in internalanother region and is usually based on the strength of the relationship between customer executives and particular members of EPAM’s senior management reports used byteam. In such cases, the CODM.customer’s activity would be reported through the management team’s reportable segment.
During the fourth quarter of 2019, the Company changed its management reporting of segment revenue to exclude other income. Prior year amounts presented below have been changed to conform to the new presentation.
Revenues from external customers and segment operating profit, before unallocated expenses, for the North America, Europe, Russia and Otherby reportable segments were as follows: |
| | | | | | | | | | | | |
| | | For the years ended December 31, |
| | | 2019 | | 2018 | | 2017 |
| Segment revenues: | | | | | | |
| North America | | $ | 1,380,944 |
| | $ | 1,076,979 |
| | $ | 796,040 |
|
| Europe | | 820,717 |
| | 692,785 |
| | 591,450 |
|
| Russia | | 92,137 |
| | 73,148 |
| | 62,958 |
|
| Total revenues | | $ | 2,293,798 |
| | $ | 1,842,912 |
| | $ | 1,450,448 |
|
| Segment operating profit: | | | | | | |
| North America | | $ | 293,757 |
| | $ | 221,846 |
| | $ | 169,340 |
|
| Europe | | 114,863 |
| | 115,876 |
| | 92,080 |
|
| Russia | | 17,347 |
| | 11,377 |
| | 13,906 |
|
| Total segment operating profit | | $ | 425,967 |
| | $ | 349,099 |
| | $ | 275,326 |
|
|
| | | | | | | | | | | | |
| | | For the years ended December 31, |
| | | 2016 | | 2015 | | 2014 |
| Total segment revenues: | | | | | | |
| North America | | $ | 642,216 |
| | $ | 471,603 |
| | $ | 374,509 |
|
| Europe | | 474,988 |
| | 400,460 |
| | 299,279 |
|
| Russia | | 43,611 |
| | 37,992 |
| | 50,663 |
|
| Other | | — |
| | 4,911 |
| | 5,552 |
|
| Total segment revenues | | $ | 1,160,815 |
| | $ | 914,966 |
| | $ | 730,003 |
|
| Segment operating profit: | | | | | | |
| North America | | $ | 143,021 |
| | $ | 112,312 |
| | $ | 90,616 |
|
| Europe | | 67,545 |
| | 68,717 |
| | 50,189 |
|
| Russia | | 7,555 |
| | 5,198 |
| | 7,034 |
|
| Other | | — |
| | (94 | ) | | (3,220 | ) |
| Total segment operating profit | | $ | 218,121 |
| | $ | 186,133 |
| | $ | 144,619 |
|
Intersegment transactions were excluded from the above on the basis that they are neither included intoin the measure of a segment’s profit and loss results, nor considered by the CODM nor provided toduring the CODM on a regular basis.review of segment results.
During the years ended December 31, 2016, 2015 and 2014, revenues from one customer, UBS AG, were $138,124, $130,605 and $97,872, respectively and accounted for more than 10% of total revenues. Revenue from this customer is reported in the Company’s Europe segment and includes reimbursable expenses.
Trade accounts receivable and unbilled revenues are generally dispersed across our clients in proportion to their revenues. As of December 31, 2016, unbilled trade receivables from two customers, individually exceeded 10% and accounted for 22.2% of our total unbilled trade receivables. There were no0 customers individually exceeding 10% of our billed trade receivables as oftotal segment revenues for the years ended December 31, 2016. As of December 31, 2015, billed2019, 2018 and unbilled trade receivables from one customer, UBS AG, individually exceeded 10% and accounted for 12.4% and 19.8% of our total billed and unbilled trade receivables, respectively.2017.
Reconciliation of segment revenues and operating profit to consolidated income before provision for income taxes is presented below: |
| | | | | | | | | | | | |
| | | For the Years Ended December 31, |
| | | 2019 | | 2018 | | 2017 |
| Total segment operating profit: | | $ | 425,967 |
| | $ | 349,099 |
| | $ | 275,326 |
|
| Unallocated costs: | | | | | | |
| Stock-based compensation expense | | (72,036 | ) | | (59,188 | ) | | (52,407 | ) |
| Amortization of purchased intangibles | | (9,914 | ) | | (8,101 | ) | | (7,562 | ) |
| Other acquisition-related expenses | | (3,774 | ) | | (916 | ) | | (1,500 | ) |
Other unallocated costs
| | (37,393 | ) | | (35,130 | ) | | (40,911 | ) |
| Income from operations | | 302,850 |
| | 245,764 |
| | 172,946 |
|
| Interest and other income, net | | 8,725 |
| | 3,522 |
| | 4,601 |
|
| Foreign exchange (loss)/gain | | (12,049 | ) | | 487 |
| | (3,242 | ) |
| Income before provision for income taxes | | $ | 299,526 |
| | $ | 249,773 |
| | $ | 174,305 |
|
|
| | | | | | | | | | | | |
| | | For the Years Ended December 31, |
| | | 2016 | | 2015 | | 2014 |
| Total segment revenues | | $ | 1,160,815 |
| | $ | 914,966 |
| | $ | 730,003 |
|
| Unallocated (revenue)/loss | | (683 | ) | | (838 | ) | | 24 |
|
| Revenues | | $ | 1,160,132 |
| | $ | 914,128 |
| | $ | 730,027 |
|
| | | | | | | |
| Total segment operating profit: | | $ | 218,121 |
| | $ | 186,133 |
| | $ | 144,619 |
|
| Unallocated amounts: | | | | | | |
| Other (revenues)/loss | | (683 | ) | | (838 | ) | | 24 |
|
| Stock-based compensation expense | | (49,244 | ) | | (45,833 | ) | | (24,620 | ) |
| Non-corporate taxes | | (5,909 | ) | | (4,274 | ) | | (6,882 | ) |
| Professional fees | | (8,265 | ) | | (7,104 | ) | | (5,312 | ) |
| Depreciation and amortization | | (8,290 | ) | | (5,581 | ) | | (7,988 | ) |
| Bank charges | | (1,515 | ) | | (1,352 | ) | | (1,049 | ) |
| One-time charges | | (706 | ) | | (747 | ) | | (5,983 | ) |
| Other corporate expenses | | (9,813 | ) | | (14,437 | ) | | (6,626 | ) |
| Income from operations | | 133,696 |
| | 105,967 |
| | 86,183 |
|
| Interest and other income, net | | 4,848 |
| | 4,731 |
| | 4,769 |
|
| Change in fair value of contingent consideration | | — |
| | — |
| | (1,924 | ) |
| Foreign exchange loss | | (12,078 | ) | | (4,628 | ) | | (2,075 | ) |
| Income before provision for income taxes | | $ | 126,466 |
| | $ | 106,070 |
| | $ | 86,953 |
|
Geographic Area Information
Long-lived assets include property and equipment, net of accumulated depreciation and amortization, and management has determined that it is not practical to allocate these assets by segment since such assets are used interchangeably among the segments. Geographical information aboutPhysical locations and values of the Company’s long-lived assets based on physical location of the assets was as follows:are presented below: | | | | December 31,
2016 | | December 31,
2015 | As of
December 31,
2019 | | As of
December 31,
2018 | | As of December 31, 2017 |
| Belarus | $ | 46,011 |
| | $ | 44,879 |
| $ | 75,984 |
| | $ | 50,085 |
| | $ | 49,866 |
|
| Ukraine | | 24,652 |
| | 8,433 |
| | 6,995 |
|
| Russia | 7,203 |
| | 2,084 |
| 17,980 |
| | 9,902 |
| | 9,617 |
|
| Ukraine | 5,610 |
| | 4,487 |
| |
| United States | | 15,637 |
| | 13,101 |
| | 3,371 |
|
| India | | 7,443 |
| | 7,019 |
| | 2,698 |
|
| Hungary | 3,485 |
| | 2,485 |
| 5,201 |
| | 3,168 |
| | 3,901 |
|
| United States | 2,618 |
| | 1,969 |
| |
| Poland | 2,213 |
| | 1,088 |
| 5,029 |
| | 2,637 |
| | 2,893 |
|
| China | 1,887 |
| | 514 |
| 3,036 |
| | 2,651 |
| | 2,608 |
|
| India | 1,650 |
| | 1,099 |
| |
| Other | 2,939 |
| | 1,894 |
| 10,297 |
| | 5,650 |
| | 4,470 |
|
| Total | $ | 73,616 |
| | $ | 60,499 |
| $ | 165,259 |
| | $ | 102,646 |
| | $ | 86,419 |
|
Information aboutThe table below presents the Company’s revenues by clientcustomer location is as follows: |
| | | | | | | | | | | | |
| | | For the Years Ended December 31, |
| | | 2016 | | 2015 | | 2014 |
| United States | | $ | 605,856 |
| | $ | 427,433 |
| | $ | 318,304 |
|
| United Kingdom | | 174,719 |
| | 164,301 |
| | 141,366 |
|
| Switzerland | | 122,399 |
| | 111,353 |
| | 87,111 |
|
| Canada | | 58,742 |
| | 57,643 |
| | 49,193 |
|
| Germany | | 43,216 |
| | 36,089 |
| | 25,740 |
|
| Russia | | 40,866 |
| | 36,506 |
| | 48,945 |
|
| Sweden | | 22,945 |
| | 10,589 |
| | 7,892 |
|
| Hong Kong | | 20,333 |
| | 23,117 |
| | 13,445 |
|
| Netherlands | | 16,762 |
| | 9,989 |
| | 8,838 |
|
| Belgium | | 8,505 |
| | 7,916 |
| | 4,198 |
|
| Ireland | | 5,152 |
| | 5,437 |
| | 3,667 |
|
| China | | 4,445 |
| | 817 |
| | — |
|
| Italy | | 3,970 |
| | 2,318 |
| | 1,746 |
|
| Spain | | 3,406 |
| | 1,028 |
| | 106 |
|
| Other locations | | 16,295 |
| | 10,081 |
| | 11,066 |
|
| Reimbursable expenses and other revenues | | 12,521 |
| | 9,511 |
| | 8,410 |
|
| Revenues | | $ | 1,160,132 |
| | $ | 914,128 |
| | $ | 730,027 |
|
Service Offering Information
Information aboutfor the Company’s revenues by service offering is as follows:years ended December 31, 2019, 2018 and 2017: |
| | | | | | | | | | | | |
| | | For the Years Ended December 31, |
| | | 2019 | | 2018 | | 2017 |
| United States | | $ | 1,321,662 |
| | $ | 1,029,327 |
| | $ | 783,563 |
|
| United Kingdom | | 290,039 |
| | 200,918 |
| | 188,995 |
|
| Switzerland | | 152,710 |
| | 144,398 |
| | 123,281 |
|
| Russia | | 89,941 |
| | 71,181 |
| | 61,222 |
|
| Netherlands | | 88,488 |
| | 70,274 |
| | 51,556 |
|
| Germany | | 82,441 |
| | 80,787 |
| | 60,158 |
|
| Canada | | 68,304 |
| | 69,836 |
| | 57,129 |
|
| Other locations | | 200,213 |
| | 176,191 |
| | 124,544 |
|
| Revenues | | $ | 2,293,798 |
| | $ | 1,842,912 |
| | $ | 1,450,448 |
|
|
| | | | | | | | | | | | |
| | | For the Years Ended December 31, |
| | | 2016 | | 2015 | | 2014 |
| Software development | | $ | 841,916 |
| | $ | 644,732 |
| | $ | 504,590 |
|
| Application testing services | | 223,010 |
| | 174,259 |
| | 140,363 |
|
| Application maintenance and support | | 74,475 |
| | 70,551 |
| | 58,840 |
|
| Infrastructure services | | 5,069 |
| | 11,311 |
| | 14,198 |
|
| Licensing | | 3,141 |
| | 3,764 |
| | 3,626 |
|
| Reimbursable expenses and other revenues | | 12,521 |
| | 9,511 |
| | 8,410 |
|
| Revenues | | $ | 1,160,132 |
| | $ | 914,128 |
| | $ | 730,027 |
|
| |
19.16. | QUARTERLY FINANCIAL DATA (UNAUDITED) |
Summarized quarterly results for the two years ended December 31, 20162019 and 20152018 were as follows: | | | | | Three Months Ended | | | | Three Months Ended | | |
| 2016 | | March 31 | | June 30 | | September 30 | | December 31 | | Full Year | |
| 2019 | | | March 31 | | June 30 | | September 30 | | December 31 | | Full Year |
| Revenues | | $ | 264,482 |
| | $ | 283,832 |
| | $ | 298,293 |
| | $ | 313,525 |
| | $ | 1,160,132 |
| | $ | 521,333 |
| | $ | 551,587 |
| | $ | 588,103 |
| | $ | 632,775 |
| | $ | 2,293,798 |
|
| Operating expenses: | | |
| | | | | | | | |
| | |
| | | | | | | | |
|
| Cost of revenues (exclusive of depreciation and amortization) | | 167,381 |
| | 180,782 |
| | 190,797 |
| | 198,226 |
| | 737,186 |
| | 344,689 |
| | 355,915 |
| | 377,525 |
| | 410,069 |
| | 1,488,198 |
|
| Selling, general and administrative expenses | | 61,494 |
| | 64,241 |
| | 67,491 |
| | 71,432 |
| | 264,658 |
| | 101,786 |
| | 111,762 |
| | 118,886 |
| | 124,999 |
| | 457,433 |
|
| Depreciation and amortization expense | | 5,102 |
| | 6,123 |
| | 5,925 |
| | 6,237 |
| | 23,387 |
| | 10,200 |
| | 11,028 |
| | 11,127 |
| | 12,962 |
| | 45,317 |
|
| Other operating expenses, net | | 174 |
| | 606 |
| | 178 |
| | 247 |
| | 1,205 |
| |
| Income from operations | | 30,331 |
| | 32,080 |
| | 33,902 |
| | 37,383 |
| | 133,696 |
| | 64,658 |
| | 72,882 |
| | 80,565 |
| | 84,745 |
| | 302,850 |
|
| Interest and other income, net | | 1,211 |
| | 1,138 |
| | 1,067 |
| | 1,432 |
| | 4,848 |
| | 3,076 |
| | 1,190 |
| | 2,509 |
| | 1,950 |
| | 8,725 |
|
| Foreign exchange loss | | (1,290 | ) | | (2,295 | ) | | (1,728 | ) | | (6,765 | ) | | (12,078 | ) | | (3,484 | ) | | (3,562 | ) | | (3,105 | ) | | (1,898 | ) | | (12,049 | ) |
| Income before provision for income taxes | | 30,252 |
| | 30,923 |
| | 33,241 |
| | 32,050 |
| | 126,466 |
| | 64,250 |
| | 70,510 |
| | 79,969 |
| | 84,797 |
| | 299,526 |
|
| Provision for income taxes | | 6,353 |
| | 6,493 |
| | 7,067 |
| | 7,287 |
| | 27,200 |
| | 3,496 |
| | 11,733 |
| | 12,967 |
| | 10,273 |
| | 38,469 |
|
| Net income | | $ | 23,899 |
| | $ | 24,430 |
| | $ | 26,174 |
| | $ | 24,763 |
| | $ | 99,266 |
| | $ | 60,754 |
| | $ | 58,777 |
| | $ | 67,002 |
| | $ | 74,524 |
| | $ | 261,057 |
|
| Comprehensive income | | $ | 28,598 |
| | $ | 22,044 |
| | $ | 26,532 |
| | $ | 19,554 |
| | $ | 96,728 |
| | $ | 66,797 |
| | $ | 62,934 |
| | $ | 54,725 |
| | $ | 86,741 |
| | $ | 271,197 |
|
Basic net income per share(1) | | $ | 0.48 |
| | $ | 0.49 |
| | $ | 0.51 |
| | $ | 0.49 |
| | $ | 1.97 |
| | $ | 1.12 |
| | $ | 1.07 |
| | $ | 1.22 |
| | $ | 1.35 |
| | $ | 4.77 |
|
Diluted net income per share(1) | | $ | 0.45 |
| | $ | 0.46 |
| | $ | 0.49 |
| | $ | 0.46 |
| | $ | 1.87 |
| | $ | 1.06 |
| | $ | 1.02 |
| | $ | 1.16 |
| | $ | 1.29 |
| | $ | 4.53 |
|
| |
| (1) | Earnings per share amounts for each quarter may not necessarily total to the yearly earnings per share due to the weighting of shares outstanding on a quarterly and year to date basis. |
|
| | | | | | | | | | | | | | | | | | | | |
| | | Three Months Ended | | |
| 2018 | | March 31 | | June 30 | | September 30 | | December 31 | | Full Year |
| Revenues | | $ | 424,148 |
| | $ | 445,647 |
| | $ | 468,186 |
| | $ | 504,931 |
| | $ | 1,842,912 |
|
| Operating expenses: | | |
| | | | | | | | |
|
| Cost of revenues (exclusive of depreciation and amortization) | | 277,634 |
| | 289,175 |
| | 301,081 |
| | 319,031 |
| | 1,186,921 |
|
| Selling, general and administrative expenses | | 89,641 |
| | 93,273 |
| | 93,226 |
| | 97,447 |
| | 373,587 |
|
| Depreciation and amortization expense | | 8,176 |
| | 8,962 |
| | 9,319 |
| | 10,183 |
| | 36,640 |
|
| Income from operations | | 48,697 |
| | 54,237 |
| | 64,560 |
| | 78,270 |
| | 245,764 |
|
| Interest and other income/(expense), net | | (551 | ) | | 1,052 |
| | 1,941 |
| | 1,080 |
| | 3,522 |
|
| Foreign exchange gain/(loss) | | (247 | ) | | 1,830 |
| | (514 | ) | | (582 | ) | | 487 |
|
| Income before provision for/(benefit from) income taxes | | 47,899 |
| | 57,119 |
| | 65,987 |
| | 78,768 |
| | 249,773 |
|
| Provision for/(benefit from) income taxes | | (16,519 | ) | | 6,864 |
| | 369 |
| | 18,803 |
| | 9,517 |
|
| Net income | | $ | 64,418 |
| | $ | 50,255 |
| | $ | 65,618 |
| | $ | 59,965 |
| | $ | 240,256 |
|
| Comprehensive income | | $ | 67,796 |
| | $ | 32,345 |
| | $ | 63,426 |
| | $ | 52,798 |
| | $ | 216,365 |
|
Basic net income per share(1) | | $ | 1.21 |
| | $ | 0.94 |
| | $ | 1.22 |
| | $ | 1.11 |
| | $ | 4.48 |
|
Diluted net income per share(1) | | $ | 1.15 |
| | $ | 0.89 |
| | $ | 1.15 |
| | $ | 1.05 |
| | $ | 4.24 |
|
|
| | | | | | | | | | | | | | | | | | | | |
| | | Three Months Ended | | |
| 2015 | | March 31 | | June 30 | | September 30 | | December 31 | | Full Year |
| Revenues | | $ | 200,045 |
| | $ | 217,781 |
| | $ | 236,049 |
| | $ | 260,253 |
| | $ | 914,128 |
|
| Operating expenses: | | |
| | | | | | | | |
|
| Cost of revenues (exclusive of depreciation and amortization) | | 125,887 |
| | 134,256 |
| | 148,479 |
| | 158,291 |
| | 566,913 |
|
| Selling, general and administrative expenses | | 46,938 |
| | 55,976 |
| | 55,431 |
| | 64,414 |
| | 222,759 |
|
| Depreciation and amortization expense | | 4,200 |
| | 3,903 |
| | 4,393 |
| | 4,899 |
| | 17,395 |
|
| Other operating expenses/(income), net | | 200 |
| | 40 |
| | (30 | ) | | 884 |
| | 1,094 |
|
| Income from operations | | 22,820 |
| | 23,606 |
| | 27,776 |
| | 31,765 |
| | 105,967 |
|
| Interest and other income, net | | 1,158 |
| | 1,299 |
| | 865 |
| | 1,409 |
| | 4,731 |
|
| Foreign exchange (loss)/income | | (5,754 | ) | | (465 | ) | | 32 |
| | 1,559 |
| | (4,628 | ) |
| Income before provision for income taxes | | 18,224 |
| | 24,440 |
| | 28,673 |
| | 34,733 |
| | 106,070 |
|
| Provision for income taxes | | 3,510 |
| | 5,209 |
| | 5,800 |
| | 7,095 |
| | 21,614 |
|
| Net income | | $ | 14,714 |
| | $ | 19,231 |
| | $ | 22,873 |
| | $ | 27,638 |
| | $ | 84,456 |
|
| Comprehensive income | | $ | 11,984 |
| | $ | 22,905 |
| | $ | 14,532 |
| | $ | 21,939 |
| | $ | 71,360 |
|
Basic net income per share(1) | | $ | 0.31 |
| | $ | 0.40 |
| | $ | 0.47 |
| | $ | 0.56 |
| | $ | 1.73 |
|
Diluted net income per share(1) | | $ | 0.29 |
| | $ | 0.37 |
| | $ | 0.44 |
| | $ | 0.52 |
| | $ | 1.62 |
|
| |
| (1) | Earnings per share amounts for each quarter may not necessarily total to the yearly earnings per share due to the weighting of shares outstanding on a quarterly and year to date basis. |
On February 3, 2020, the Company acquired 100% of Deltix and its affiliates, a provider of software and services for quantitative research to the financial sector. The Company paid approximately $10,620 in cash at closing and could pay up to $18,975 in earn-out consideration based on achievement of certain revenue and earnings targets. In addition, the Company granted to Deltix employees 17,981 service-based RSUs and performance and service-based equity-settled awards that could pay up to $13,915 based on achievement of certain revenue and earnings targets.
SCHEDULE II
VALUATION AND QUALIFYING ACCOUNTS
(US Dollars inthousands)FOR THE YEARS ENDED DECEMBER 31, 2019, 2018 AND 2017
The table below summarizes movements in qualifying accounts, which include accounts receivable and notes receivable (from customers) for the years ended December 31, 2016, 2015 and 2014:(Inthousands)
|
| | | | | | | | | | | | | | |
| | | Balance at Beginning of Year | | Additions | | Deductions/ Write offs | | Balance at End of Year |
| Year Ended December 31, 2019 | | | | | | | | |
| Allowance for doubtful accounts for trade receivables and contract assets | | $ | 1,557 |
| | 2,072 |
| | (419 | ) | | $ | 3,210 |
|
| Valuation allowance on deferred tax assets | | $ | 3,189 |
| | 688 |
| | — |
| | $ | 3,877 |
|
| Year Ended December 31, 2018 | | | | | | | | |
Allowance for doubtful accounts for trade receivables and contract assets
| | $ | 1,186 |
| | 2,722 |
| | (2,351 | ) | | $ | 1,557 |
|
| Valuation allowance on deferred tax assets | | $ | 924 |
| | 2,265 |
| | — |
| | $ | 3,189 |
|
| Year Ended December 31, 2017 | | | | | | | | |
Allowance for doubtful accounts for trade receivables and contract assets
| | $ | 2,014 |
| | 998 |
| | (1,826 | ) | | $ | 1,186 |
|
| Valuation allowance on deferred tax assets | | $ | — |
| | 924 |
| | — |
| | $ | 924 |
|
|
| | | | | | | | | | | | | | | | |
| | | Balance at Beginning of Year | | Charged to Expenses | | Deductions/ Write offs | | Balance at End of Year |
| Fiscal Year 2014 | | $ | 1,800 |
| | $ | 1,325 |
| | $ | (944 | ) | | $ | 2,181 |
|
| Fiscal Year 2015 | | 2,181 |
| | 1,704 |
| | (2,156 | ) | | 1,729 |
|
| Fiscal Year 2016 | | 1,729 |
| | 3,500 |
| | (3,215 | ) | | 2,014 |
|