4
| Date Declared | Distribution Declared Per Unit | Total Distribution Amount | Month Distribution Paid | |||||||
| November 15, 2016 | $ | 600 | $ | 8,763,600 | December 2016 | |||||
| February 14, 2017 | 200 | 2,921,200 | February 2017 | |||||||
| May 16, 2017 | 275 | 4,016,650 | May 2017 | |||||||
| August 14, 2017 | 100 | 1,460,600 | August 2017 | |||||||
| Totals | $ | 1,175 | $ | 17,162,050 | ||||||
| Date Declared | Distribution Declared Per Unit | Total Distribution Amount | Month Distribution To Be Paid | |||||||
| November 21, 2017 | $ | 400 | $ | 5,842,400 | December 2017 | |||||
Principal Products
The principal products we are producing at the plantin our Ethanol Division are fuel-grade ethanol and distillers grains. In addition, we are extracting corn oil and capturing a portion of the raw carbon dioxide we produce for sale. The table below shows the approximate percentage of our total ethanol division revenue which is attributed to each of our products for each of our last three fiscal years.
| Product | Fiscal Year 2020 | Fiscal Year 2019 | Fiscal Year 2018 | |||||||||||||||||
| Ethanol | 75 | % | 77 | % | 77 | % | ||||||||||||||
| Distillers Grains | 20 | % | 19 | % | 19 | % | ||||||||||||||
| Corn Oil | 5 | % | 4 | % | 4 | % | ||||||||||||||
| Carbon Dioxide | < 1% | < 1 % | < 1% | |||||||||||||||||
| Product | Fiscal Year 2017 | Fiscal Year 2016 | Fiscal Year 2015 | ||||||
| Ethanol | 83 | % | 78 | % | 75 | % | |||
| Distillers Grains | 14 | % | 18 | % | 21 | % | |||
| Corn Oil | 3 | % | 4 | % | 3 | % | |||
| Carbon Dioxide | < 1% | < 1% | < 1% | ||||||
Our primary product is ethanol. Ethanol is ethyl alcohol, a fuel component made primarily from corn and various other grains. The ethanol we produce is manufactured from corn. Although the ethanol industry continues to explore production technologies employing various feedstocks, such as biomass, corn-based production technologies remain the most practical and provide the lowest operating risks. Corn produces large quantities of carbohydrates, which convert into glucose more easily than most other kinds of biomass. The Renewable Fuels Association estimates current domestic ethanol production capacity of approximately 16 billion gallons with approximately 2.5% of that capacity idled as of September 25, 2017.
An ethanol plant is essentially a fermentation plant. Ground corn and water are mixed with enzymes and yeast to produce a substance called “beer,”“beer,” which contains about 10% alcohol and 90% water. The “beer”“beer” is boiled to separate the water, resulting in ethyl alcohol, which is then dehydrated to increase the alcohol content. This product is then mixed with a certified denaturant to make the product unfit for human consumption and commercially saleable.
Ethanol can be used as: (i) an octane enhancer in fuels; (ii) an oxygenated fuel additive for the purpose of reducing ozone and carbon monoxide emissions; and (iii) a non-petroleum-based gasoline substitute. Approximately 95% of all ethanol is used in its primary form for blending with unleaded gasoline and other fuel products. Used as a fuel oxygenate, ethanol provides a means to control carbon monoxide emissions in large metropolitan areas. The principal purchasers of ethanol are generally the wholesale gasoline marketer or blender. The principal markets for our ethanol are petroleum terminals in the northeastern United States.
As a result of an emergency domestic need resulting from the COVID-19 pandemic, some ethanol plants provided ethanol to be used for the production of hand sanitizer and related products. Some ethanol plants have subsequently announced plans to install equipment to allow USP-grade ethanol production which can also be used for disinfectants, pharmaceuticals, fragrances, cosmetics and other industrial applications. We engaged in some limited ethanol sales for sanitizer use during the third quarter of our 2020 fiscal year. However, we have discontinued this practice.
Distillers Grains
The principal co-product of the ethanol production process is distillers grains, a high protein, high-energy animal feed supplement primarily marketed to the dairy, beef, poultry and swine industries. Dry mill ethanol processing creates three forms of distillers grains: Distillers Wet Grains with Solubles ("DWS"), Distillers Modified Wet Grains with Solubles ("DMWS") and Distillers Dried Grains with Solubles ("DDGS"). DWS is processed corn mash that contains approximately 70% moisture. DWS has a shelf life of approximately three days and can be sold only to farms within the immediate vicinity of an ethanol plant. DMWS is DWS that has been dried to approximately 50% moisture. DMWS have a slightly longer shelf life of approximately ten days and are often sold to nearby markets. DDGS is DWS that has been dried to 10% to 12% moisture.
5
DDGS has an almost indefinite shelf life and may be sold and shipped to any market regardless of its vicinity to an ethanol plant.
Corn Oil
Since November 2008, we have been separating some of the corn oil contained in our distillers grains for sale. We have worked hard to improve corn oil production levels and continue to fine tune the operation of our equipment to further increase production rates. The corn oil that we produce is not food grade corn oil and therefore cannot be used for human consumption. However, corn oil can be used as the feedstock to produce biodiesel, as a feed ingredient and has other industrial uses.
Carbon Dioxide
Since March 2010, we have been selling some of the carbon dioxide gas produced at the plant.
Ethanol, Distillers Grains, Carbon Dioxide and Corn Oil Markets
As described below in "Distribution Methods," we market and distribute our ethanol and distillers grains through third parties. Our ethanol and distillers grains marketers make all decisions, in consultation with management, with regard to where our products are marketed. Our ethanol and distillers grains are predominately sold in the domestic market. Specifically, we ship a substantial portion of the ethanol we produce to the New York harbor. In addition, we engaged in some limited ethanol sales for sanitizer use during the third quarter of our 2020 fiscal year. We expect our ethanol and distillers grains marketers to explore all markets for our products, including export markets, and believe that there is some potential for increased international sales of our products. However, due to high transportation costs, and the fact that we are not located near a major international shipping port, we expect a majority of our products to continue to be marketed and sold domestically.
Brazil, Canada and India were top destinations for ethanol exports for the year to date through July 2020. However, overall exports of ethanol for this period decreased approximately 9% compared to the same period last year due to escalating trade barriers and the impacts of COVID-19. Tariffs implemented by Brazil and China on ethanol imported from the United States.States reduced export demand from these markets. Trade barriers with key markets may continue to take a toll on ethanol export demand negatively effecting domestic ethanol prices. Export demand has also decreased due to the disruption in global fuel demand resulting from restrictions in response to the COVID-19 pandemic. Restricted travel, new lockdown measures and slow economic growth continue to have a negative effect on global fuel consumption and it is unknown when such demand will recover as reopening efforts continue to evolve.
Historically, the United States ethanol industry has exported a significant amount of distillers grains to ChinaChina. The imposition of anti-dumping and Mexico with Vietnam receiving notable amounts. However, the distillers grains market has faced many challengesanti-subsidy duties by China over the past year. On January 10, 2017, China announced a final ruling related to its anti-dumping and countervailing duty investigation imposing anti-dumping duties from a range of 42.2% to 53.7% and anti-subsidy duties from 11.2% to 12.0%. The imposition of these duties has resulted in a significant decline in demand from this top importerthree years effectively closed the Chinese market requiring United States producers to seek out alternative markets.alternatives. Mexico, Indonesia, Thailand and Vietnam suspended United Stateshave recently been top destinations for distillers grains exports. However, overall exports in December 2016 due to its decision to ban certain fumigants used in the shipping of distillers grains. However, on September 6, 2017, the Vietnam government resumed imports of distillers grains fromdecreased during 2020 due to shortages in exportable supply due to a decrease in production by the ethanol industry in the United States which is anticipatedrelated to increase imports of distillers grains to that market.the COVID-19 pandemic.
As described below in "Distribution Methods," we sell carbon dioxide to Air Products and Chemicals, Inc. ("Air Products") (formerly known as EPCO Carbon Dioxide Products, Inc.) and we market and distribute all of the corn oil we produce directly to end users and third party brokers in the domestic market.
Distribution Methods
Our ethanol plant is located near Union City, Indiana in Randolph County. We selected the site because of its locationproximity to existing ethanol consumption and accessibility to road and rail transportation. Our site is in close proximity to rail and major highways that connect to major population centers such as Indianapolis, Cincinnati, Columbus, Cleveland, Toledo, Detroit, New York and Chicago.
Ethanol Distribution
We entered into an Ethanol Purchase and Sale Agreement with Murex, LLC ("Murex") for the purpose of marketing and distributing all of the ethanol we produce at the plant. The initial term of the agreement was five years commencing on the
6
date of first delivery of ethanol with automatic renewal for one year terms thereafter unless otherwise terminated by either party. The agreement may be terminated due to the insolvency or intentional misconduct of either party or upon the default of one of the parties as set forth in the agreement.
Under the terms of the agreement, Murex markets all of our ethanol unless we choose to sell a portion at a retail fueling station owned by us or one of our affiliates. Murex pays to us the purchase price invoiced to the third-party purchaser less all resale costs, taxes paid by Murex and Murex's commission. Murex has agreed to purchase on its own account and at market price any ethanol which it is unable to sell to a third party purchaser. Murex has promised to use its best efforts to obtain the best purchase price available for our ethanol. In addition, Murex has agreed to promptly notify us of any and all price arbitrage opportunities. Under the agreement, Murex is responsible for all transportation arrangements for the distribution of our ethanol. On November 22, 2011, we amended ourThis agreement to provideprovides for an annual cap on the commission paid to Murex. WeEffective November 18, 2018, we further amended our agreement to provide for the payment of the commission to Murex to be calculated on each net gallon of ethanol taken under the agreement. The amendment provides that Murex will handle all RIN activity, submit regulatory reports, and lease us a minimum number of tank cars for rail transportation and manage the tank car fleet in exchange for a monthly payment. The amendment also agreed to extendextends the initial term of the agreement until November 30, 2022, to an eleven year period, which now expires in 2019.be renewed thereafter automatically for one-year periods unless either party gives notice of non-renewal at least 90 days prior to the end of the current term.
Distillers Grains Distribution
We have entered into an agreement with CHS, Inc. to market all distillers grains we produce at the plant. CHS, Inc. is a diversified energy, grains and foods company owned by farmers, ranchers and cooperatives. CHS, Inc. provides products and services ranging from grain marketing to food processing to meet the needs of its customers around the world. We receive a percentage of the selling price actually received by CHS, Inc. in marketing our distillers grains to its customers. The initial term of our agreement with CHS, Inc. was for one year commencing as of November 1, 2008. Thereafter, the agreement will remainremains in effect unless otherwise terminated by either party with 120 days notice. Under the agreement, CHS, Inc. is responsible for all transportation arrangements for the distribution of our distillers grains.
Corn Oil Distribution
We market and distribute all of the corn oil we produce directly to end users and third party brokers. Our corn oil is mainly used as an animal feed ingredient and as a feedstock in biodiesel production.
Carbon Dioxide Distribution
Federal Ethanol Supports and Governmental Regulation
Federal Ethanol Supports
The ethanol industry is dependent on several economic incentives to produce ethanol. One significant federal ethanol support is the Federal Renewable Fuels Standard (the “RFS”“RFS”). The RFS requires that in each year, a certain amount of renewable fuels must be used in the United States. The RFS is a national program that does not require that any renewable fuels be used in any particular area or state, allowing refiners to use renewable fuel blends in those areas where it is most cost-effective. The RFS statutory volume requirement increases incrementally each year until the United States is required to use 36 billion gallons of renewable fuels by 2022. Starting in 2009, the RFS required that a portion of the RFS must be met by certain “advanced”“advanced” renewable fuels. These advanced renewable fuels include ethanol that is not made from corn, such as cellulosic ethanol and biomass based biodiesel. The use of these advanced renewable fuels increases each year as a percentage of the total renewable fuels required to be used in the United States.
7
The United States Environmental Protection Agency ("EPA") has the authority to waive the RFS statutory volume requirement, in whole or in part, provided one of the following two conditions have been met: (1) there is inadequate domestic renewable fuel supply; or (2) implementation of the requirement would severely harm the economy or environment of a state, region or the United States. Annually, the EPA is required by statute to pass a rule that establishes the number of gallons of different types of renewable fuels that must be used in the United States which is called the renewable volume obligation. The statutory volumes and the EPA's volumes for 2014, 2015, 2016 and 20172018 through 2020 (in billion gallons) are as follows:
| Total Renewable Fuel Volume Requirement | Portion of Volume Requirement That Can Be Met By Corn-based Ethanol | ||||||||||
| 2018 | Statutory | 26.00 | 15.00 | ||||||||
| EPA Rule 11/30/2017 | 19.29 | 15.00 | |||||||||
| 2019 | Statutory | 28.00 | 15.00 | ||||||||
| EPA Rule 11/30/2018 | 19.92 | 15.00 | |||||||||
| 2020 | Statutory | 30.00 | 15.00 | ||||||||
| EPA Rule 12/19/2019 | 20.09 | 15.00 | |||||||||
| Total Renewable Fuel Volume Requirement | Portion of Volume Requirement That Can Be Met By Corn-based Ethanol | ||
| 2014 | Statutory | 18.15 | 14.40 |
| EPA Rule 11/30/2015 | 16.28 | 13.61 | |
| 2015 | Statutory | 20.50 | 15.00 |
| EPA Rule 11/30/2015 | 16.93 | 14.05 | |
| 2016 | Statutory | 22.25 | 15.00 |
| EPA Rule 11/30/2015 | 18.11 | 14.50 | |
| 2017 | Statutory | 24.00 | 15.00 |
| EPA Rule 11/30/2016 | 19.28 | 15.00 | |
Small refineries can petition the EPA annually for an exemption from their ethanol use requirements for the prior compliance year. The EPA proposesgranted significantly more small refinery waivers in 2018 and 2019 than in past years and did not reallocate the waived gallons to set the total volume obligation at 19.24 billion gallons ofother refiners. These actions resulted in decreased ethanol demand which 15.0 billion gallon could be met by corn-based ethanol. A public hearing on the proposed rule was held in June and the public comment expired on August 31, 2017. The final rule is expectedled to be issued in November 2017. If the volume requirements of the RFS were to be reduced it could have an adverse effect on market ethanol prices and demandnegative operating margins in the ethanol industry. In January 2020, the Tenth Circuit Court of Appeals ruled that small refinery exemptions may only be granted to refineries that had secured them continuously each year since 2010. Consistent with this ruling, in September 2020, the EPA denied certain small refinery exemption petitions filed by oil refineries in 2020 seeking retroactive relief from their ethanol use requirements for ethanol.prior years. There are currently still some petitions for waivers pending before the EPA for 2019 and 2020 compliance years.
In February 2010, the EPA issued new regulations governing the RFS. These new regulations have been called RFS2. The most controversial part of RFS2 involves what is commonly referred to as the lifecycle analysis of green house gas emissions. Specifically, the EPA adopted rules to determine which renewable fuels provided sufficient reductions in green house gases, compared to conventional gasoline, to qualify under the RFS program. RFS2 establishes a tiered approach, where regular renewable fuels are required to accomplish a 20% green house gas reduction compared to gasoline, advanced biofuels and biomass-based biodiesel must accomplish a 50% reduction in green house gases, and cellulosic biofuels must accomplish a 60% reduction in green house gases. Any fuels that fail to meet this standard cannot be used by fuel blenders to satisfy their obligations under the RFS program. The scientific method of calculating these green house gas reductions has been a contentious issue. Many in the ethanol industry were concerned that corn based ethanol would not meet the 20% green house gas reduction requirement based on certain parts of the environmental impact model that many in the ethanol industry believed was scientifically suspect. However, RFS2 as adopted by the EPA provides that corn-based ethanol from modern ethanol production processes does meetmeets the definition of a renewable fuel under the RFS program. Our ethanol plant was grandfathered into the RFS up to 115,000,000 gallons annually due to the fact that it was constructed prior to the effective date of the lifecycle green house gas requirement and isrequirement. Therefore, we are not required to prove compliance with the lifecycle green house gas reductions.reductions for a significant amount of our production. Certain provisions of RFS2 as adopted may disproportionately benefit ethanol produced from sugarcane. This could make sugarcane based ethanol, which is primarily produced in Brazil, more competitive in the United States ethanol market. If this were to occur, it could reduce demand for the ethanol that we produce.
Most ethanol that is used in the United States is sold in a blend called E10. E10 is a blend of 10% ethanol and 90% gasoline. E10 is approved for use in all standard vehicles. In 2016,2019, gasoline demand in the United States was approximately 143 billion gallons. Assuming that all gasoline in the United States is blended at a rate of 10% ethanol and 90% gasoline, the maximum demand for ethanol isin 2019 was 14.3 billion gallons per year. This is commonly referred to as the “blending“blending wall,”” which represents a theoretical limit where more ethanol cannot be blended into the national gasoline pool. This is a theoretical limit because it is believed that it would not be possible to blend ethanol into every gallon of gasoline that is being used in the United States and it discounts the possibility of additional ethanol used in higher percentage blends. Gasoline demand is estimated to decrease for 2020 due to COVID-19.
In June 2012, the EPA gave final approval for the sale of E15, gasoline which is blended at a rate of 15% ethanol and 85% gasoline, for use in vehicles manufactured in the model year 2001 and later. Although there have been significant steps towards introduction of E15 in the marketplace, there are still obstacles to meaningful market penetration by E15. Many states still have regulatory issues that hamper or prevent the sale of E15. In addition, sales of E15 may be limited because E15 is not approved for use in all vehicles, the EPA requires a label that may discourage consumers from using E15, and retailers may
8
choose not to sell E15 due to concerns regarding liability. In addition,Previously, different gasoline blendstocks may bewere required at certain times of
the year in order to use E15 due to federal regulations related to fuel evaporative emissions which may preventprevented E15 from being used during certain times of the year in various states. In May of 2019, the EPA issued a final rule allowing the year-round sale of E15.
A blender pump is a gasoline pump that can dispense a variety of different ethanol/gasoline blends. Blender pumps typically can dispense E10, E20, E30, E40, E50 and E85. These blender pumps accomplish these different ethanol/gasoline blends by internally mixing ethanol and gasoline which are held in separate tanks at the retail gas stations. Many in the ethanol industry believe that increased use of blender pumps will increase demand for ethanol by allowing gasoline retailers to provide various mid-level ethanol blends in a cost effective manner and allowing consumers with flex-fuel vehicles to purchase more ethanol through these mid-level blends. However, the expense of blender pumps has delayed their availability in the retail gasoline market.
In May 2020, the United States Department of Agriculture ("USDA") announced the Higher Blends Infrastructure Incentive Program which consists of up to $100 million in funding for grants to be used to increase the availability of higher blends of ethanol and biodiesel fuels. Funds may be awarded to retailers such as fueling stations and convenience stores to assist in the cost of installation or upgrading of fuel pumps and other infrastructure. In October 2020, the USDA announced the first round of awards to recipients of $22 million worth of grants.
Effect of Governmental Regulation
The government's regulation of the environment changes constantly. We are subject to extensive air, water and other environmental regulations and we have been required to obtain a number of environmental permits to construct and operate the plant. It is possible that more stringent federal or state environmental rules or regulations could be adopted, which could increase our operating costs and expenses. It also is possible that federal or state environmental rules or regulations could be adopted that could have an adverse effect on the use of ethanol. For example, changes in the environmental regulations regarding the required oxygen content of automobile emissions could have an adverse effect on the ethanol industry. Plant operations are governed by the Occupational Safety and Health Administration (“OSHA”(“OSHA”). OSHA regulations may change such that the costs of operating the plant may increase. Any of these regulatory factors may result in higher costs or other adverse conditions affecting our operations, cash flows and financial performance.
In late 2009, California passed a Low Carbon Fuels Standard ("LCFS"). The California LCFS requires that renewable fuels used in California must accomplish certain reductions in greenhouse gases which is measured using a lifecycle analysis, similar to the RFS. On December 29, 2011, a federal district court in California ruled that the California LCFS was unconstitutional which halted implementation of the California LCFS. However, the California Air Resources Board ("CARB") appealed this court ruling and on September 18, 2013, the federal appellate court reversed the federal district court finding the LCFS constitutional and remanding the case back to federal district court to determine whether the LCFS imposes a burden on interstate commerce that is excessive in light of the local benefits. On June 30, 2014, the United States Supreme Court declined to hear the appeal of the federal appellate court ruling and CARB recently re-adopted the LCFS with some slight modifications. The LCFS could have a negative impact on demand for corn-based ethanol and result in decreased ethanol prices affecting our ability to operate profitably.
We have obtained all of the necessary permits to operate the plant. In the fiscal year ended September 30, 2017,2020, we incurred costs and expenses of approximately $260,000$69,000 complying with environmental laws. Although we have been successful in obtaining all of the permits currently required, any retroactive change in environmental regulations, either at the federal or state level, could require us to obtain additional or new permits or spend considerable resources in complying with such regulations.
Competition
Ethanol
We are in direct competition with numerous ethanol producers, many of whom have greater resources than we do. Following the significant growth during 2005 and 2006, the ethanol industry has grown at a much slower pace. As of September 25, 2017, theThe Renewable Fuels Association estimates that there are 214approximately 209 ethanol production facilities in the United States with capacity to produce approximately 1617.6 billion gallons of ethanol. However, many ethanol and five additional plants under expansion or construction with capacity to produce an additional 273 million gallons. However, the Renewable Fuels Association estimates that approximately 2.5% of thesignificantly reduced ethanol production capacityor even ceased operations altogether in the spring of 2020 in response to the disruption in demand from the COVID-19 pandemic. Some of these plants have gradually increased production as fuel demand partially recovered but some have not returned to historic levels or restarted operations. It is unknown how much production in the United States is idled.currently idled or when demand will fully return.
9
Since ethanol is a commodity product, competition in the industry is predominantly based on price. We have also experienced increased competition from oil companies who have purchased ethanol production facilities. These oil companies are required to blend a certain amount of ethanol each year. Therefore, the oil companies may be able to operate their ethanol production facilities at times when it is unprofitable for us to operate. Larger ethanol producers may be able to realize economies of scale that we are unable to realize. This could put us at a competitive disadvantage to other ethanol producers. The ethanol industry is continuing to consolidate where a few larger ethanol producers are increasing their production capacities and are controlling a larger portion of the United States ethanol production. Further, some ethanol producers own multiple ethanol plants which may allow them to compete more effectively by providing them flexibility to run certain production facilities while they have other facilities shut down. This added flexibility may allow these ethanol producers to compete more effectively, especially during periods when operation margins are unfavorable in the ethanol industry.
The largest ethanol producers include Archer Daniels Midland, Flint Hill Resources LP, Green Plains Renewable Energy, POET Biorefining and Valero Renewable Fuels, each of which are capable of producing significantly more ethanol than we produce.
The following table identifies the majority of the largest ethanol producers in the United States along with their production capacities.
U.S. FUEL ETHANOL PRODUCTION CAPACITY
BY TOP PRODUCERS
Producers of Approximately 750
million gallons per year (mmgy) or more
| Company | Current Capacity (mmgy) | ||||
| POET Biorefining | 1,805 | ||||
| Valero Renewable Fuels | 1,730 | ||||
| Archer Daniels Midland | |||||
| Green Plains Renewable Energy | |||||
| Flint Hill Resources LP | |||||
The ethanol industry in the United States experienced increased competition from ethanol produced outside of the United States during 2012 which was likely the result of the expiration of the tariff on imported ethanol which expired on December 31, 2011. Although ethanol imports have since decreased, if competition from ethanol imports were to increase again that could negatively impact demand for ethanol produced in the United States which could result in lower operating margins.
We also anticipate increased competition from renewable fuels that do not use corn as the feedstock. Many of the current ethanol production incentives are designed to encourage the production of renewable fuels using raw materials other than corn. One type of ethanol production feedstock is cellulose. Cellulose is the main component of plant cell walls and is the most common organic compound on earth. Cellulose is found in wood chips, corn stalks, rice, straw, amongst other common plants. Cellulosic ethanol is ethanol produced from cellulose. Several companies and researchers have commenced pilot projects to study the feasibility of commercially producing cellulosic ethanol and are producing cellulosic ethanol on a small scale and a few companies in the United States have begun producing on a commercial scale. Additional commercial scale cellulosic ethanol plants could be completed in the near future. If this technology can be profitably employed on a commercial scale, it could potentially lead to ethanol that is less expensive to produce than corn based ethanol. Cellulosic ethanol may also capture more government subsidies and assistance than corn based ethanol. This could decrease demand for our product or result in competitive disadvantages for our ethanol production process.
Our ethanol plant also competes with producers of other gasoline additives having similar octane and oxygenate values as ethanol. Alternative fuels, gasoline oxygenates and alternative ethanol production methods are also continually under development. The major oil companies have significantly greater resources than we have to market other additives, to develop alternative products, and to influence legislation and public perception of ethanol. These companies also have sufficient resources to begin production of ethanol should they choose to do so.
A number of automotive, industrial and power generation manufacturers are developing alternative clean power systems using fuel cells, plug-in hybrids, electric cars or clean burning gaseous fuels. Electric car technology has recently grown in popularity, especially in urban areas. While currentlyin the past there arewere a limited number of vehicle recharging stations, making electric cars not feasible for all consumers, there has been an increased focus on developing these recharging stations
10
which may makehave made electric car technology more widely available in the future.available. This additional competition from alternate sources could reduce the demand for ethanol, which would negatively impact our profitability.
Distillers Grains Competition
Ethanol plants in the Midwest produce the majority of distillers grains and primarily compete with other ethanol producers in the production and sales of distillers grains. Ethanol plants produced approximately 4240 million metric tons of distillers grains in 2016.2019.
The primary consumers of distillers grains are dairy and beef cattle. In recent years, an increasing amount of distillers grains have been used in the swine and poultry markets. Numerous feeding trials show advantages in milk production, growth, rumen health, and palatability over other dairy cattle feeds. With the advancement of research into the feeding rations of poultry and swine, we expect these markets to expand and create additional demand for distillers grains; however, no assurance can be given that these markets will in fact expand, or if they do, that we will benefit from it. The market for distillers grains is generally confined to locations where freight costs allow it to be competitively priced against other feed ingredients. Distillers grains compete with three other feed formulations: corn gluten feed, dry brewers grain and mill feeds. The primary value of these products as animal feed is their protein content. Dry brewers grain and distillers grains have about the same protein content, and corn gluten feed and mill feeds have slightly lower protein contents.
Sources and Availability of Raw Materials
The major raw material required for our ethanol plant to produce ethanol, distillers grain and corn oil is corn. To produce 135 million gallons of ethanol per year, our ethanol plant needs approximately 47 million bushels of corn per year, or approximately 129,000 bushels per day, as the feedstock for its dry milling process. Traditionally, corn grown in the area of the plant site has been fed locally to livestock or exported for feeding or processing and/or overseas export sales.
The price at which we purchase corn will depend on prevailing market prices. We are significantly dependent on the availability and price of corn. The price and availability of corn are subject to significant fluctuations depending upon a number of factors affecting grain commodity prices in general, including crop conditions, weather, governmental programs and foreign purchases. Because the market price of ethanol is not directly related to grain prices, ethanol producers are generally not able to compensate for increases in the cost of grain feedstock through adjustments in prices charged for their ethanol. We therefore anticipate that our plant's profitability will be negatively impacted during periods of high grain prices.
In an attempt to minimize the effects of the volatility of corn costs on operating profits, we take hedging positions in corn futures markets. Hedging means protecting the price at which we buy corn and the price at which we will sell our products in the future. It is a way to attempt to reduce the risk caused by price fluctuation. The effectiveness of hedging activities is dependent upon, among other things, the cost of corn and our ability to sell sufficient amounts of ethanol and distillers grains to utilize all of the corn subject to the futures contracts. Hedging activities can result in costs to us because price movements in grain contracts are highly volatile and are influenced by many factors beyond our control. These costs may be significant.
High corn prices have a negative effect on our operating margins unless the price of ethanol and distillers grains out paces rising corn prices. Corn prices were lower during the fiscal year ended September 30, 2017,2020, compared to the same period in 20162019 due primarily to increased supply resulting from a plentiful 2016 harvest in our corn supply region.concerns due primarily to concerns related to the COVID-19 pandemic. On October 12, 2017,9, 2020, the United States Department of Agriculture ("USDA")USDA released a report estimating the 20172020 corn crop in the United States at approximately 14.314.7 billion bushels, down 6%up 8% from last year's production, with yields averaging 171.8178.4 bushels per acre. The USDA forecasted area harvested for grain at 83.182.5 million acres, down 4%up 1% from 2016. If realized, this would be the second highest national yield and production on record.2019. The Indiana corn crop is estimated to be approximately 903992 million bushels, down 5%up approximately 22% from 2016.2019. Yields in Indiana are expected to be approximately 173189 bushels per acre, similar to 2016.up approximately 12% from 2019. Management will continue to monitor the availability of corn in our area.
We engaged Capstone Energy Services, LLC ("Capstone") to provide us with on-going energy management services. Capstone manages the procurement and delivery of energy to our location. They assist with strategy development, cost analysis, risk management, supply management and reporting services in exchange for a monthly fee. The agreement commenced on June 1, 2015, and continues for one year unless earlier terminated due to an event of default. Following the expiration of the initial one-year term, the agreement will be on a month-to-month basis and may be terminated by either party upon sixty days prior written notice.
11
Natural Gas
Natural gas is also an important input commodity to our manufacturing process. Our natural gas usage for our fiscal year ended September 30, 20172020 was approximately 3.08% more1.7% less MMBTUs than for last fiscal year, constituting approximately 4.82%4.2% of our total costs of goods sold. We are using natural gas to produce process steam and to dry our distillers grain products to a moisture content at which they can be stored for long periods of time, and can be transported greater distances, so that we can market the product to broader livestock markets, including poultry and swine markets in the continental United States.
On March 20, 2007, we entered into a Long-Term Transportation Service Contract for Redelivery of Natural Gas with Ohio Valley Gas Corporation ("Ohio Valley"). Under the contract, Ohio Valley receives, transports and redelivers natural gas to us for all of our natural gas requirements up to a maximum of 100,000 therms per purchase gas day and our estimated annual natural gas requirements of 34,000,000 therms. For all gas received for and redelivered to us by Ohio Valley, we pay a throughput rate in the amount of $0.0138 per therm for the first five years of the contract term, and $0.0138 increased by the compounded inflation rate as established and determined by the U.S. Consumer Price Index - All Urban Consumers for Transportation for the following five years. In addition, we pay a service charge for all gas received for and redelivered to us by Ohio Valley in the amount of $750 per delivery meter per billing cycle per month for the first five years of the contract term and $750 increased by the compounded inflation rate over the initial rate as established and determined by the U.S. Consumer Price Index - All Urban Consumers for Transportation for the following five years. The initial term of the contract iswas ten years. Provided neither party terminates the contract, the contract will automatically renew for a series of not more than three consecutive one year periods.
Electricity
We require a significant amount of electrical power to operate the plant. On May 2, 2007, we entered into an agreement with Indiana Michigan Power Company to furnish our electric energy. The initial term of the contract was 30 months from the time service is commenced and continues thereafter unless terminated by either party with 12 months written notice. We pay Indiana Michigan Power Company monthly pursuant to their standard rates.
Water
We require a significant supply of water. Engineering specifications show our plant's water requirements to be approximately 774 gallons per minute, 1.1 million gallons per day, depending on the quality of water. We have assessed our water needs and available supply and have determined that we have an adequate supply. Union City Water Works is supplying the water necessary to operate our plant.
Much of the water used in our ethanol plant is recycled back into the process. There are, however, certain areas of production where fresh water is needed. Those areas include boiler makeup water and cooling tower water. Boiler makeup water is treated on-site to minimize all elements that will harm the boiler and recycled water cannot be used for this process. Cooling tower water is deemed non-contact water because it does not come in contact with the mash, and, therefore, can be regenerated back into the cooling tower process. The makeup water requirements for the cooling tower are primarily a result of evaporation. Much of the water can be recycled back into the process, which minimizes the discharge water. This will have the long-term effect of lowering wastewater treatment costs. Many new plants today are zero or near zero effluent discharge facilities. Our plant design incorporates the ICM/Phoenix Bio-Methanator wastewater treatment process resulting in a zero discharge of plant process water.
Patents, Trademarks, Licenses, Franchises and Concessions
We do not currently hold any patents, trademarks, franchises or concessions. We were granted a license by ICM, Inc. to use certain ethanol production technology necessary to operate our ethanol plant. The cost of the license granted by ICM, Inc. was included in the amount we paid to Fagen, Inc. to design and build our ethanol plant. In addition, we were granted a license by ICM, Inc. to use certain corn oil technologies necessary to extract corn oil during our plant operations.
Seasonality of Ethanol Sales
We experience some seasonality of demand for ethanol. Since ethanol is predominantly blended with conventional gasoline for use in automobiles, ethanol demand tends to shift in relation to gasoline demand. As a result, we experience some seasonality of demand for ethanol in the summer months related to increased driving. In addition, we experience some increased ethanol demand during holiday seasons related to increased gasoline demand.
12
Dependence on One or a Few Major Customers
As discussed above, we have entered into a marketing agreement with Murex for the purpose of marketing and distributing our ethanol and have engaged CHS, Inc. for the purpose of marketing and distributing our distillers grains. We rely on Murex for the sale and distribution of our ethanol and CHS, Inc. for the sale and distribution of our distillers grains. Therefore, although there are other marketers in the industry, we are highly dependent on Murex and CHS, Inc. for the successful marketing of our products. Any loss of Murex or CHS, Inc. as our marketing agent for our ethanol and distillers grains respectively could have a significant negative impact on our revenues.
Principal Products
We have and expect to continue to buy primarily soybeans and corn from producers relying principally on forward purchase contracts to ensure an adequate supply of grain. However, we occasionally also purchase grain the day of delivery. Grain prices are typically comprised of futures prices on the Chicago Mercantile Exchange ("CME") and local basis adjustments.
Grain Markets and Distribution Methods
Grain shipments are made by rail and truck. Our sales are made to grain processors and export markets in the southeastern United States. Our grain sales are generally made by contract for delivery in a future period. Income is expected to be earned on grain bought and sold, the appreciation or depreciation in the basis value of the grain held and the appreciation or depreciation between the futures contract months.
Competition
We primarily compete in the purchase of grain on a local or regional basis although there are some larger national and international companies that maintain regional grain purchase and storage facilities. We compete in the sale of grain with other public and private grain brokers, elevator operators and farmer owned cooperatives. Competition is based primarily on price, service and reliability.
Seasonality of Grain Purchases and Sales
Our grain operations are domiciledsomewhat seasonal in nature in that the grain we procure is harvested in October and November. The largest portion of the grain is delivered by producers in the United States. Allfall although we buy and sell a significant portion of our grain throughout the year.
Risk Management
We manage the futures price risk of changing commodity prices by entering into exchange-traded futures contracts on the CME. The CME is a regulated commodity futures exchange that maintains futures markets for the grain we trade. Futures prices are determined by worldwide supply and demand.
We entered into a Risk Management Agreement with John Stewart & Associates ("JS&A") under which JS&A provides risk management and related services pertaining to grain hedging, grain pricing information, aid in purchase of grain, and assistance in risk management as it pertains to ethanol, co-products and soybeans. In exchange for JS&A's risk management services, we pay JS&A a fee of $1,500 per month. We are currently on a month to month basis for this contract with JS&A. The agreement may be terminated by either party at any time upon written notice.
We also entered into an agreement with Advance Trading to assist us with hedging corn, ethanol, natural gas and soybeans. We pay them a fee of $3,000 per month for these services. The term of the products soldagreement is month-to-month and may be terminated by either party at any time upon proper notice.
13
We also entered into an agreement with Commodity & Ingredient Hedging, LLC to our customersevaluate and provide marketing advice and margin management related to cash sales and purchases, forward contracts and exchange-traded futures and options. We pay an annual fee of $12,000 in exchange for fiscal years 2017, 2016 and 2015 were producedthese services. The agreement automatically renews for additional one year terms unless either party gives written notice of non-renewal as provided in the United States and all of our long-lived assets are domiciled in the United States.agreement.
Employees
We have engaged third-party professional marketers who decide where57 full-time employees as of November 18, 2020.
Working Capital
We primarily use our ethanolworking capital for purchases of raw materials necessary to operate the Ethanol Division and distillers grains are marketedfor purchases of grain commodities for the Trading Division. Our primary sources of working capital is cash we generate from our operations along with our Declining Loan and our Revolving Credit Loan with our primary lender First National Bank of Omaha. The Declining Loan provides $5,000,000 in total for us to use on capital projects allowing us to preserve our working capital at a sufficient level. At September 30, 2020, we have no control over the marketing decisions made by our third-party professional marketers. These third-party marketers may decideapproximately $15,000,000 available to sell our products in countries other than the United States. Over the past fiscal year, exports of ethanol and distillers grains produced in the United States have increased. However, although there is some potential to sell our productsdraw on the international markets, we anticipate that our productsRevolving Credit Loan to provide additional working capital. We will still primarily be marketeddiscuss the Declining Loan and soldRevolving Loan in the United States.more detail in "Item 7- Management Discussion and Analysis of Financial Condition and Results of Operations".
ITEM 1A. RISK FACTORS
You should carefully read and consider the risks and uncertainties below and the other information contained in this report. The risks and uncertainties described below are not the only ones we may face. The following risks, together with additional risks and uncertainties not currently known to us or that we currently deem immaterial could impair our financial condition and results of operation.
Risks Relating to Our Business
Our existing debt financing agreements contain, and our future debt financing agreements may contain, restrictive covenants that limit distributions and impose restrictions on the operation of our business. The use of debt financing makes it more difficult for us to operate because we must make principal and interest payments on the indebtedness and abide by covenants contained in our debt financing agreements. Although we have significantly reduced our level of debt, the restrictive covenants contained in our financing agreements may have important implications on our operations, including, among other things: (a) limiting our ability to obtain additional debt or equity financing; (b) subjecting all or substantially all of our assets to liens; and (c) limiting our ability to make business and operational decisions regarding our business, including, among other things making capital improvements and selling or purchasing assets or engaging in transactions we deem to be appropriate and in our best interest.
Failures of our information technology infrastructure could have a material adverse effect on operations. We utilize various software applications and other information technology that are critically important to our business operations. We rely on information technology networks and systems, including the Internet, to process, transmit and store electronic and financial information, to manage a variety of business processes and activities, including production, manufacturing, financial, logistics, sales, marketing and administrative functions. We depend on our information technology infrastructure to communicate internally and externally with employees, customers, suppliers and others. We also use information technology networks and systems to comply with regulatory, legal and tax requirements. These information technology systems, some of which are managed by third parties, may be susceptible to damage, disruptions or shutdowns due to failures during the process of upgrading or replacing software, databases or components thereof, power outages, hardware failures, computer viruses, attacks by computer hackers or other cybersecurity risks, telecommunication failures, user errors, natural disasters, terrorist attacks or other catastrophic events. If any of our significant information technology systems suffer severe damage, disruption or shutdown, and our disaster recovery and business continuity plans do not effectively resolve the issues in a timely manner, our product sales, financial condition and results of operations may be materially and adversely affected.
A cyber attack or other information security breach could have a material adverse effect on our operations and result in financial losses. We are regularly the target of attempted cyber and other security threats and must continuously monitor and develop our information technology networks and infrastructure to prevent, detect, address and mitigate the risk of unauthorized access, misuse, computer viruses and other events that could have a security impact. If we are unable to prevent cyber attacks and other information security breaches, we may encounter significant disruptions in our operations which could adversely impact our business, financial condition and results of operations or result in the unauthorized disclosure of
14
confidential information. Such breaches may also harm our reputation, result in financial losses or subject us to litigation or other costs or penalties.
We may violate the terms of our credit agreements and financial covenants which could result in our lender demanding immediate repayment of our loans. We were in compliance with all financial covenants at September 30, 2020. Current management projections indicate that we will be in compliance with our loan covenants through September 30, 2021. However, unforeseen circumstances may develop which could result in violations of our loan covenants. If we violate the terms of our credit agreement, our primary lender could deem us in default of our loans and require us to immediately repay any outstanding balance of our loans.
Our inability to maintain or secure credit facilities we may require in the future may negatively impact our liquidity. While we do not currently require more financing than we have, in the future we may need additional financing. If we require financing in the future and we are unable to secure such financing, or we are unable to secure the financing we require on reasonable terms, it may have a negative impact on our liquidity. This could negatively impact the value of our units.
We depend on our management and key employees, and the loss of these relationships could negatively impact our ability to operate profitably. We are highly dependent on our management team to operate our ethanol plant. We may not be able to replace these individuals should they decide to cease their employment with us, or if they become unavailable for any other reason. While we seek to compensate our management and key employees in a manner that will encourage them to continue their employment with us, they may choose to seek other employment. Any loss of these officers and key employees may prevent us from operating the ethanol plant profitably and could decrease the value of our units.
We are subject to global and regional economic downturns and related risks and the effects of COVID-19 or another pandemic may materially and adversely affect demand and the market price for our products. The level of demand for our products is affected by global and regional demographic and macroeconomic conditions. A significant downturn in global economic growth, or recessionary conditions in major geographic regions for prolonged periods, may lead to reduced demand for our products, which could have a negative effect on the market price of our products. In December 2019, a novel coronavirus surfaced in Wuhan, China (“COVID-19”). The spread of COVID-19 worldwide has resulted in businesses suspending or substantially curtailing global operations and travel, quarantines, and an overall substantial slowdown of economic activity. Transportation fuels in particular, including ethanol, have experienced significant price declines and reduced demand. The effects of COVID-19 have and may continue to materially and adversely affect the market price for our products, our business, results of operations and liquidity.
COVID-19 or another pandemic may negatively impact our ability to operate our business which could decrease or eliminate the value of our units. COVID-19 has resulted in significant uncertainty in many areas of our business. We do not know how long these conditions will last. This uncertainty is expected to negatively impact our operations. We may experience labor shortages if our employees are unable or unwilling to come to work. If our suppliers cannot deliver the supplies we need to operate our business or if we are unable to ship our products due to trucking or rail shipping disruptions, we may be forced to suspend operations or reduce production. If we are unable to operate the ethanol plant at capacity, it may result in unfavorable operating results. Any shut down of operations or reduction in production, especially for an extended period of time, could reduce or eliminate the value of our units.
Risks Related to our Trading Division
Our Trading Division business is affected by the supply and demand of commodities, and is sensitive to factors outside of our control. Adverse price movements could negatively affect our profitability and results of operations. Our Trading Division buys, sells and holds inventories of agricultural commodities, some of which are readily traded on commodity futures exchanges. Unfavorable weather conditions, both local and worldwide, as well as other factors beyond our control, can affect the supply and demand of these commodities and expose us to liquidity pressures to finance hedges in the grain business in rapidly rising markets. Increased costs of inventory and prices of raw material would decrease our profit margins and adversely affect our results of operations. While we attempt to manage the risk associated with commodity price changes for our grain inventory positions with derivative instruments, including purchase and sale contracts, we are unable to offset 100% of the price risk of each transaction due to timing, availability of futures and options contracts and third-party credit risk. Furthermore, there is a risk that the derivatives we employ will not be effective in offsetting all of the risks that we are trying to manage. This can happen when the derivative and the underlying value of grain inventories and purchase and sale contracts are not perfectly matched. Our grain derivatives, for example, do not perfectly correlate with the basis component of our grain inventory and contracts. (Basis is defined as the difference between the local cash price of a commodity and the corresponding exchange-traded futures price.) Differences can reflect time periods, locations or product forms. Although the basis component is smaller and generally less volatile than the futures component of our grain market price, basis moves on a large grain position
15
can significantly impact the profitability of the Trading Division. Our futures, options and over-the-counter contracts are subject to margin calls. If there are large movements in the commodities market, we could be required to post significant levels of margin, which would impact our liquidity. There is no assurance that the efforts we have taken to mitigate the impact of the volatility of the prices of commodities upon which we rely will be successful and any sudden change in the price of these commodities could have an adverse effect on our business and results of operations.
We face intense competition in our Trading Division. We face significant competition in our Trading Division and we have numerous competitors, some of which are larger and have greater financial resources than we have. Competition could cause us to lose market share and talented employees, exit certain lines of business, increase marketing or other expenditures or reduce pricing, each of which could have an adverse effect on our business and profitability.
Our Trading Division uses derivative contracts to reduce volatility in the commodity markets. Non-performance by the counter-parties to those contracts could adversely affect our future results of operations and financial position. A significant amount of our commodity purchases and sales are done through forward contracting. In addition, we use exchange traded and to a lesser degree over-the-counter contracts to reduce volatility in changing commodity prices. A significant adverse change in commodity prices could cause a counter-party to one or more of our derivative contracts to not perform on their obligation.
If a substantial portion of our inventory becomes damaged or obsolete, its value would decrease and our profit margins would suffer. We may carry significant amounts of inventory in our Trading Division. The value of our inventories could decrease due to deterioration in the quality of our grain inventory due to damage, moisture, insects, disease or foreign material. If the quality of our grain were to deteriorate below an acceptable level, the value of our inventory could decrease significantly.
Risks Related to our Ethanol Division
Declines in the price of ethanol or distillers grain would significantly reduce our revenues. The sales prices of ethanol and distillers grains can be volatile as a result of a number of factors such as overall supply and demand, the price of gasoline and corn, levels of government support, and the availability and price of competing products. We are dependent on a favorable spread between the price we receive for our ethanol and distillers grains and the price we pay for corn and natural gas. Any lowering of ethanol and distillers grains prices, especially if it is associated with increases in corn and natural gas prices, may affect our ability to operate profitably. We anticipate the price of ethanol and distillers grains to continue to be volatile in our 20182020 fiscal year as a result of the net effect of changes in the price of gasoline and corn and increased ethanol supply offset by increased export demand. In addition, growing conditions in a particular season’sseason’s harvest may cause the corn crop to be of poor quality resulting in corn shortages and a decrease in distillers grains prices. Declines in the prices we receive for our ethanol and distillers grains will lead to decreased revenues and may result in our inability to operate the ethanol plant profitably for an extended period of time which could decrease the value of our units.
Increases in the price of corn or natural gas would reduce our profitability. Our primary source of revenue is from the sale of ethanol, distillers grains and corn oil. Our results of operations and financial condition are significantly affected by the cost and supply of corn and natural gas. Changes in the price and supply of corn and natural gas are subject to and determined by market forces over which we have no control including weather and general economic factors.
Ethanol production requires substantial amounts of corn. Generally, higher corn prices will produce lower profit margins and, therefore, negatively affect our financial performance. If a period of high corn prices were to be sustained for some time, such pricing may reduce our ability to operate profitably because of the higher cost of operating our plant. We may not be able to offset any increase in the price of corn by increasing the price of our products. If we cannot offset increases in the price of corn, our financial performance may be negatively affected.
The prices for and availability of natural gas are subject to volatile market conditions. These market conditions often are affected by factors beyond our control such as higher prices as a result of colder than average weather conditions or natural disasters, overall economic conditions and foreign and domestic governmental regulations and relations. Significant disruptions in the supply of natural gas could impair our ability to manufacture ethanol and more significantly, distillers grains for our customers. Furthermore, increases in natural gas prices or changes in our natural gas costs relative to natural gas costs paid by competitors may adversely affect our results of operations and financial condition. We seek to minimize the risks from fluctuations in the prices of corn and natural gas through the use of hedging instruments. However, these hedging transactions also involve risks to our business. See ““Risks Relating to Our Business - We engage in hedging transactions which involve risks that could harm our business.”” If we were to experience relatively higher corn and natural gas costs compared to the selling prices of our products for an extended period of time, the value of our units may be reduced.
16
We engage in hedging transactions which involve risks that could harm our business. We are exposed to market risk from changes in commodity prices. Exposure to commodity price risk results from our dependence on corn and natural gas in the ethanol production process. We seek to minimize the risks from fluctuations in the prices of corn, natural gas and ethanol through the use of hedging instruments. The effectiveness of our hedging strategies is dependent on the price of corn, natural gas and ethanol and our ability to sell sufficient products to use all of the corn and natural gas for which we have futures contracts. Our hedging activities may not successfully reduce the risk caused by price fluctuation which may leave us vulnerable to high corn and natural gas prices. Alternatively, we may choose not to engage in hedging transactions in the future and our operations and financial conditions may be adversely affected during periods in which corn and/or natural gas prices increase. Utilizing cash for margin calls has an impact on the cash we have available for our operations which could result in liquidity problems during times when corn prices rise or fall significantly.
Price movements in corn, natural gas and ethanol contracts are highly volatile and are influenced by many factors that are beyond our control. There are several variables that could affect the extent to which our derivative instruments are impacted by price fluctuations in the cost of corn or natural gas. However, it is likely that commodity cash prices will have the greatest impact on the derivatives instruments with delivery dates nearest the current cash price. We may incur such costs and they may be significant which could impact our ability to profitably operate the plant and may reduce the value of our units.
Our businessEthanol Division is not diversified. Our While we do procure, transport and sell grain commodities through our Trading Division, our success depends largely on our ability to profitably operate our ethanol plant. We do not have any other signficiantsignificant sources of revenue if we are unable to operate our ethanol plant and manufacture ethanol, distillers grains, corn oil and carbon dioxide or if economic or political factors adversely affect the market for ethanol, distillers grains, corn oil or carbon dioxide. Our business would also be significantly harmed if the ethanol plant could not operate at full capacity for any extended period of time.
The ethanol industry is an industry that is changing rapidly which can result in unexpected developments that could negatively impact our operations and the value of our units. The ethanol industry has grown significantly in the last decade. This rapid growth has resulted in significant shifts in supply and demand of ethanol over a very short period of time. As a result, past performance by the ethanol plant or the ethanol industry generally might not be indicative of future performance. We may experience a rapid shift in the economic conditions in the ethanol industry which may make it difficult to operate the ethanol plant profitably. If changes occur in the ethanol industry that make it difficult for us to operate the ethanol plant profitably, it could result in a reduction in the value of our units.
Changes and advances in ethanol production technology could require us to incurcosts to update our plant or could otherwise hinder our ability tocompete in the ethanol industry or operate profitably. Advances and changes in the technology of ethanol production are expected to occur. Such advances and changes may make the ethanol production technology installed in our plant less desirable or obsolete. These advances could also allow our competitors to produce ethanol at a lower cost than we are able. If we are unable to adopt or incorporate technological advances, our ethanol production methods and processes could be less efficient than our competitors, which could cause our plant to become uncompetitivenoncompetitive or completely obsolete. If our competitors develop, obtain or license technology that is superior to ours or that makes our technology obsolete, we may be required to incur significant costs to enhance or acquire new technology so that our ethanol production remains competitive. Alternatively, we may be required to seek third-party licenses, which could also result in significant expenditures. These third-party licenses may not be available or, once obtained, they may not continue to be available on commercially reasonable terms. These costs could negatively impact our financial performance by increasing our operating costs and reducing our net income.
Decreasing gasoline prices could negatively impact our ability to operate profitably. Discretionary blending is an important secondary market which is often determined by the price of ethanol versus the price of gasoline. In periods when discretionary blending is financially unattractive, the demand for ethanol may be reduced. Lower gasoline prices reduce the spread between the price of gasoline and the price of ethanol which can discourage discretionary blending, dampen the export market and result in a downwards market adjustment in the price of ethanol. If oil and gasoline prices were to remain low for a significant period of time, it could hurt our ability to profitably operate the ethanol plant which could decrease the value of our units.
Demand for ethanol may not continue to grow unless ethanol can be blended into gasoline in higher percentage blends for conventional automobiles. Currently, ethanol is blended with conventional gasoline for use in standard (non-flex fuel) vehicles to create a blend which is 10% ethanol and 90% conventional gasoline. In order to expand demand for ethanol, higher percentage blends of ethanol must be utilized in conventional automobiles. Such higher percentage blends of ethanol have become a contentious issue with automobile manufacturers and environmental groups having fought against higher percentage ethanol blends. E15 is a blend which is 15% ethanol and 85% conventional gasoline. Although there have been significant
17
developments towards the availability of E15 in the marketplace and the EPA recently issued a final rule allowing the year-round sale of E15, there are still obstacles tothat could inhibit meaningful market penetration by E15. As a result, the approval of E15 may not significantly increase demand for ethanol.
Technology advances in the commercialization of cellulosic ethanol may decrease demand for corn based ethanol which may negatively affect our profitability. Ethanol production research has worked to develop an efficient method of producing ethanol from cellulose-based biomass, such as agricultural waste, forest residue, municipal solid waste, and energy crops. Cellulose-based biomass is generally cheaper than corn, and producing ethanol from cellulose-based biomass would create opportunities to produce ethanol in areas which are unable to grow corn. The Energy Independence and Security Act of 2007 and the 2008 Farm Bill offer a very strong incentive to develop commercial scale cellulosic ethanol. The statutory volume requirement in the RFS requires that 16 billion gallons per year of advanced bio-fuels be consumed in the United States by 2022. Some companies have reportedly produced cellulosic ethanol on a commercial scale and other companies have begun construction on commercial scale cellulosic ethanol plants. If an efficient method of producing ethanol from cellulose-based biomass is developed, we may not be able to compete effectively. If we are unable to produce ethanol as cost-effectively as cellulose-based producers, our ability to generate revenue and our financial condition will be negatively impacted.
Decreasing ethanol prices could reduce our ability to operate profitably. Decreases in the price of ethanol reduce our revenue. Our profitability depends on a favorable spread between our corn and natural gas costs and the price we receive for our ethanol. If ethanol prices fall during times when corn and/or natural gas prices are high, we may not be able to operate our ethanol plant profitably.
If a substantial portion of our corn inventory becomes damaged or obsolete, its value would decrease and our profit margins would suffer. We may carry significant amounts of corn inventory in our Ethanol Division. The value of our inventories could decrease due to deterioration in the quality of our inventory due to damage, moisture, insects, disease or foreign material. If the quality of our corn inventory were to deteriorate below an acceptable level, the value of our inventory could decrease significantly.
We operate in an intensely competitive industry and compete with larger, better financed entities which could impact our ability to operate profitably. There is significant competition among ethanol producers. There are numerous producer-owned and privately-owned ethanol plants planned and operating throughout the Midwest and elsewhere in the United States. In addition, we have seen increased competition from oil companies who have purchased ethanol production facilities. We also face competition from outside of the United States. The largest ethanol producers include Archer Daniels Midland, Flint Hill Resources LP, Green Plains Renewable Energy, POET Biorefining and Valero Renewable Fuels, alleach of which are eachis capable of producing significantly more ethanol than we produce. Further, many believe that there will be further consolidation occurring in the ethanol industry in the future which will likely lead to a few companies which control a significant portion of the ethanol production market. We may not be able to compete with these larger entities. These larger ethanol producers may be able to affect the ethanol market in ways that are not beneficial to us which could affect our financial performance.
Competition from the advancement of alternative fuels may lessen the demand forethanol. Alternative fuels, gasoline oxygenates and ethanol production methods are continually under development. Like ethanol, these emerging technologies offer an option to address worldwide energy costs, the long-term availability of petroleum reserves and environmental concerns. If these alternative technologies continue to expand and gain broad acceptance and become readily available to consumers for motor vehicle use, we may not be able to compete effectively. This additional competition could reduce the demand for ethanol, resulting in lower ethanol prices that might adversely affect our results of operations and financial condition.
Increased use of fuel cells, plug-in hybrids and electric cars may lessen the demand for ethanol. A number of automotive, Automotive, industrial and power generation manufacturers are developinghave developed alternative clean power systems using fuel cells, plug-in hybrids, electric cars or clean burning gaseous fuels. Electric car technology has recently grown in popularity, especially in urban areas, which has led to an increase in recharging stations which may makehas made electric car technology more widely available in the future.available. This additional competition from alternate sources could reduce the demand for ethanol, resulting in lower ethanol prices which could negatively impact our results of operations and financial condition.
Consumer resistance to the use of ethanol based on the belief that ethanol isexpensive, uses too much corn, adds to air pollution, harms engines and/or takes more energy toproduce than it contributes may affect the demand for ethanol. Certain individuals believe that use of ethanol will have a negative impact on gasoline prices at the pump and that ethanol uses too much of the available corn supply. Many also believe that ethanol adds to air pollution and harms car and truck engines. Still other consumers believe that the process of producing ethanol actually uses more fossil energy, such as oil and natural gas, than the amount of energy that is produced. These consumer beliefs could potentially be wide-spread and may be increasing as a result of recent efforts to increase the allowable percentage of ethanol that may be blended for use in conventional
18
automobiles. If consumers choose not to buy ethanol based on these beliefs, it would affect the demand for the ethanol we produce which could negatively affect our profitability and financial condition.
Risks Related to Regulation and Governmental Action
Government incentives for ethanol production may be eliminated in the future, which could hinder our ability to operate at aprofit. The ethanol industry is assisted by various federal ethanol production and tax incentives, including the RFS set forth in the Energy Policy Act of 2005. The RFS helps support a market for ethanol that might disappear without this incentive.
The United States Environmental Protection Agency ("EPA") has the authority to waive the RFS statutory volume requirement, in whole or in part, provided certain conditions have been met. Annually,In addition, the EPA is supposedexpanded its use of waivers to pass a rule that establishessmall refineries allowing those refineries to avoid their ethanol use requirements under the number of gallons of different types of renewable fuels that must be usedRFS resulting in the United States which is called the renewable volume obligations. In the past, the EPA has set the renewable volume obligations below the statutory volume requirements. On May 18, 2017, the EPA released a proposed rule to set the 2018 total volume obligation at 19.24 billion gallons of which 15.0 billion gallon could be met by corn-based ethanol. The final rule is expected to be issued in November 2017.decreased ethanol demand. If the EPA were to significantly reduce the volume requirements under the RFS or if the RFS were to be otherwise reduced or eliminated by the exercise of the EPA waiver authority or by Congress, the market price and demand for ethanol could decrease which will negatively impact our financial performance.
Government policies and regulations, particularly those affecting the agricultural sector and related industries, could adversely affect our operations and profitability. Agricultural commodity production and trade flows are significantly affected by government policies and regulations. Governmental policies affecting the agricultural industry, such as taxes, tariffs, duties, subsidies, import and export restrictions on agricultural commodities and commodity products can influence industry profitability, the planting of certain crops versus other uses of agricultural resources, the location and size of crop production, whether unprocessed or processed commodity products are traded and the volume and types of imports and exports. In addition, international trade disputes can adversely affect agricultural commodity trade flows by limiting or disrupting trade between countries or regions. Future governmental policies, regulations or actions affecting our industry may adversely affect the supply of, demand for and prices of our products, restrict our ability to do business and cause our financial results to suffer.
A reduction in distillers grains exports to China could have a negative effect on the price of distillers grains in the U.S. and negatively affect our profitability. China iswas the world's largest buyer of distillers grains produced in the United States. On January 12, 2016, the Chinese government began an antidumping and countervailing duty investigation related to distillers grains imported from the United States which contributed to a decline in distillers grains shipped to China. China began imposing anti-dumping and anti-subsidy duties during 2016 as a result of a preliminary ruling on its investigation. On January 10, 2017, China announced a final ruling related to its anti-dumping and countervailing duty investigation imposing anti-dumping duties from a range of 42.2% to 53.7% and anti-subsidy duties from 11.2% to 12.0%. The imposition of these duties havehas resulted in a significant decline in demand from this top importer and negatively impacted prices for distillers grains produced in the United States. This reduction in demand could negatively impact our ability to profitably operate the ethanol plant.
A reduction in ethanol exports to China due to the imposition of a tariff on U.S. ethanol could have a negative impact on ethanol prices. China imposed a tariff on ethanol which is produced in the United States and exported to China which has negatively impacted exports of ethanol to China. The decrease could negatively impact the market price of ethanol in the United States and our ability to profitably operate the ethanol plant.
A reduction in ethanol exports to Brazil due to the imposition by the Brazilian government of a tariff on U.S. ethanol could have a negative impact on ethanol prices. Brazil haswas historically been a top destination for ethanol produced in the United States. However, earlier this year, Brazil imposed a tariff on ethanol which is produced in the United States and exported to Brazil. ThisThe tariff has resulted in a decline in demand for ethanol from Brazil and could negatively impact the market price of ethanol in the United States and our ability to profitably operate the ethanol plant.
Changes in environmental regulations or violations of these regulations could beexpensive and reduce our profitability. We are subject to extensive air, water and other environmental laws and regulations. In addition, some of these laws require our plant to operate under a number of environmental permits. These laws, regulations and permits can often require expensive pollution control equipment or operational changes to limit actual or potential impacts to the environment. A violation of these laws and regulations or permit conditions can result in substantial fines, damages, criminal sanctions, permit revocations and/or plant shutdowns. In the future, we may be subject to legal actions brought by environmental advocacy groups and other parties for actual or alleged violations of environmental laws or our permits. Additionally, any changes in environmental laws and regulations, both at the federal and state level, could require us to spend considerable resources in order
19
to comply with future environmental regulations. The expense of compliance could be significant enough to reduce our profitability and negatively affect our financial condition.
The California Low Carbon Fuel Standard may decrease demand for corn based ethanol which could negatively impact our profitability. California passed a Low Carbon Fuels Standard ("LCFS") which requires that renewable fuels used in California must accomplish certain reductions in greenhouse gases which reductions are measured using a lifecycle analysis. Management believes that these regulations could preclude corn based ethanol produced in the Midwest from being used in California. California represents a significant ethanol demand market. If the ethanol industry is unable to supply corn based ethanol to California, it could significantly reduce demand for the ethanol we produce. This could result in a reduction of our revenues and could negatively impact our ability to profitably operate the ethanol plant.
ITEM 2. PROPERTIES
Our plant site is made up of two adjacent parcels which together total approximately 295 acres in east central Indiana near Union City, Indiana. The address of our plant is 1554 N. County Road 600 E., Union City, Indiana 47390. On October 31, 2016, we purchased approximately 64 acres of land adjacent to our property for a total purchase price of approximately $646,000.
In November 2008, the plant was substantially completed and plant operations commenced. The plant consists of the following buildings:
•A grains area, fermentation area, distillation - evaporation area;
•A dryer/energy center area;
•A tank farm;
•An auxiliary area; and
•An administration building.
Our plant is in excellent condition and is capable of functioning at over 100% of its 100 million gallons per year nameplate production capacity.
In September 2017, we completed a construction project to add grain receiving and train loading facilities and additional rail spurs, track and grain storage to allow us to procure, transport and sell grain commodities.
All of our tangible and intangible property, real and personal, serves as the collateral for the debt financing with First National Bank of Omaha, which is described below under "Item 7 - Management's Discussion and Analysis of Financial Condition and Results of Operations."
ITEM 3. LEGAL PROCEEDINGS
Patent Infringement
On June 27, 2008, we entered into a Tricanter Purchase and Installation Agreement with ICM, Inc. for the construction and installation of a Tricanter Oil Separation System. On February 12, 2010, GS CleanTech Corporation ("GS CleanTech") filed a lawsuit in the United States District Court for the Southern District of Indiana, claiming that the Company's operation of the oil recovery system manufactured and installed by ICM, Inc. infringes a patent claimed by GS CleanTech. GS CleanTech sought royalties and damages associated with the alleged infringement, as well as attorney's fees from the Company. On February 16, 2010, ICM, Inc. agreed to indemnify and defend the Company from and against all claims, demands, liabilities, actions, litigations, losses, damages, costs and expenses, including reasonable attorney's fees arising out of any claim of infringement of patents, copyrights or other intellectual property rights by reason of our purchase and use of the oil recovery system.
GS CleanTech subsequently filed actions against at least fourteen other ethanol producing companies for infringement of its patent rights, adding several additional patents. GS CleanTech successfully petitioned for the cases to be joined in a multi-district litigation ("MDL") which was assigned to the United States District Court for the Southern District of Indiana (Case No. 1:10-ml-02181). We subsequently answered and counterclaimed that the patent claims at issue are invalid and that the Company is not infringing.
Motions for summary judgment were filed by the defendants, including the Company, and GS CleanTech. Meanwhile, GS CleantechCleanTech filed suit against another group of defendants which were joined with the MDL. On October 23,
20
2014, the United States District Court granted summary judgment finding that all of the patents claimed by GS CleanTech were invalid and that the Company had not infringed. In addition, on September 15, 2016, the United States District Court granted summary judgment finding that the patents were invalid due to inequitable conduct before the US Patent and Trademark Office by the inventors and their attorneys. GS Cleantech has asked the United States District Court to reconsider its decision regarding inequitable conduct. In addition, GS CleantechCleanTech and its attorneys filed a Notice of Appeal appealing the rulings on summary judgment.
On February 16, 2010, ICM, Inc. agreed to indemnifyMarch 2, 2020, the Company fromrulings were affirmed on appeal and against all claims, demands, liabilities, actions, litigations, losses, damages, costs and expenses, including reasonable attorney's fees arising out of any claim of infringement of patents, copyrights or other intellectual property rights by reason of our purchase and usea petition for a rehearing of the oil recovery system and agreesappeal was subsequently denied. The time to defend the Company. Severalseek further appeal of the other defendants also use equipment and processes provided by ICM, Inc. ICM, Inc.rulings has and we expect it will continue, to vigorously defend itself andsince expired. A motion for an award of attorney fees against the Company in this lawsuit and in any appeal filed by GS CleanTech. If GS CleanTech were to be successful in any appeal filed and allowed to continue to pursue its claims, we estimate that damages, if awarded, would be based on a reasonable royalty to, or lost profits of, GS CleanTech. Because of its rulings, it seems unlikelyplaintiffs is currently pending.
ITEM 4. MINE SAFETY DISCLOSURES
None.
PART II
ITEM 5. MARKET FOR REGISTRANT'S COMMON EQUITY, RELATED MEMBER MATTERS AND ISSUER PURCHASES OF EQUITY SECURITIES
Market for ourOur Units
As of November 22, 2017,18, 2020, we had approximately 14,606 membership units outstanding and approximately 1,1111,232 unit holders of record. There is no public trading market for our units. However, we have established through FNC Ag Stock, LLC a Unit Trading Bulletin Board, a private online matching service, in order to facilitate trading among our members. The Unit Trading Bulletin Board has been designed to comply with federal tax laws and IRS regulations establishing an “alternative“alternative trading service,”” as well as state and federal securities laws. Our Unit Trading Bulletin Board consists of an electronic bulletin board that provides a list of interested buyers with a list of interested sellers, along with their non-firm price quotes. The Unit Trading Bulletin Board does not automatically affect matches between potential sellers and buyers and it is the sole responsibility of sellers and buyers to contact each other to make a determination as to whether an agreement to transfer units may be reached. We do not become involved in any purchase or sale negotiations arising from our Unit Trading Bulletin Board and have no role in effecting the transactions beyond approval, as required under our operating agreement, and the issuance of new certificates. We do not give advice regarding the merits or shortcomings of any particular transaction. We do not receive, transfer or hold funds or securities as an incident of operating the Unit Trading Bulletin Board. We do not receive any compensation for creating or maintaining the Unit Trading Bulletin Board. In advertising our alternative trading service, we do not characterize Cardinal as being a broker or dealer or an exchange. We do not use the Unit Trading Bulletin Board to offer to buy or sell securities other than in compliance with the securities laws, including any applicable registration requirements.
There are detailed timelines that must be followed under the Unit Trading Bulletin Board Rules and Procedures with respect to offers and sales of membership units. All transactions must comply with the Unit Trading Bulletin Board Rules, our operating agreement, and are subject to approval by our board of directors.
As a limited liability company, we are required to restrict the transfers of our membership units in order to preserve our partnership tax status. Our membership units may not be traded on any established securities market or readily traded on a secondary market (or the substantial equivalent thereof). All transfers are subject to a determination that the transfer will not cause the Company to be deemed a publicly traded partnership.
The following table contains historical information by fiscal quarter for the past two fiscal years regarding the actual unit transactions that were completed by our unit-holders during the periods specified. We believe this most accurately represents the current trading value of the Company's units. The information was compiled by reviewing the completed unit transfers that occurred on our qualified matching service bulletin board during the quarters indicated.
21
| Selling Quarter | Low Price | High Price | Average Price | # of Units Traded | |||||||||||
2016 1st | $ | 10,750 | $ | 12,500 | $ | 11,772 | 31 | ||||||||
2016 2nd | $ | 11,000 | $ | 12,500 | $ | 11,833 | 12 | ||||||||
2016 3rd | $ | 12,500 | $ | 13,000 | $ | 12,659 | 6 | ||||||||
2016 4th | $ | 13,260 | $ | 14,521 | $ | 13,807 | 25 | ||||||||
2017 1st | $ | 13,500 | $ | 15,150 | $ | 13,807 | 38 | ||||||||
2017 2nd | $ | 14,000 | $ | 15,000 | $ | 14,363 | 41 | ||||||||
2017 3rd | $ | 14,000 | $ | 15,100 | $ | 14,815 | 42 | ||||||||
2017 4th | $ | 15,500 | $ | 15,600 | $ | 15,591 | 22 | ||||||||
| Selling Quarter | Low Price | High Price | Average Price | # of Units Traded | ||||||||||||||||||||||
2019 1st | $ | 9,500 | $ | 9,700 | $ | 9,600 | 2 | |||||||||||||||||||
2019 2nd | $ | — | $ | — | $ | — | — | |||||||||||||||||||
2019 3rd | $ | — | $ | — | $ | — | — | |||||||||||||||||||
2019 4th | $ | 6,803 | $ | 7,212 | $ | 7,039 | 47 | |||||||||||||||||||
2020 1st | $ | 6,800 | $ | 7,220 | $ | 6,992 | 39 | |||||||||||||||||||
2020 2nd | $ | 6,000 | $ | 7,015 | $ | 6,632 | 26 | |||||||||||||||||||
2020 3rd | $ | 5,000 | $ | 5,200 | $ | 5,080 | 18 | |||||||||||||||||||
2020 4th | $ | 5,000 | $ | 5,500 | $ | 5,139 | 86 | |||||||||||||||||||
The following table contains the bid and asked prices that were posted on the Company's alternative trading service bulletin board and includes some transactions that were not completed. The Company believes the table above more accurately describes the trading value of its units as the bid and asked prices below include some offers that never resulted in completed transactions. The information was compiled by reviewing postings that were made on the Company's alternative trading service bulletin board.
| Listing Quarter | Low Price | High Price | Average Price | # of Units Listed | ||||||||||||||||||||||
2019 1st | $ | 9,500 | $ | 13,000 | $ | 12,300 | 25 | |||||||||||||||||||
2019 2nd | $ | 8,000 | $ | 9,800 | $ | 8,841 | 43 | |||||||||||||||||||
2019 3rd | $ | — | $ | — | $ | — | — | |||||||||||||||||||
2019 4th | $ | 7,000 | $ | 10,000 | $ | 8,223 | 20 | |||||||||||||||||||
2020 1st | $ | 7,000 | $ | 8,000 | $ | 7,875 | 8 | |||||||||||||||||||
2020 2nd | $ | 6,000 | $ | 8,000 | $ | 6,663 | 116 | |||||||||||||||||||
2020 3rd | $ | 6,500 | $ | 6,500 | $ | 6,500 | 16 | |||||||||||||||||||
2020 4th | $ | 5,000 | $ | 5,500 | $ | 5,292 | 52 | |||||||||||||||||||
| Listing Quarter | Low Price | High Price | Average Price | # of Units Listed | |||||||||||
2016 1st | $ | 10,750 | $ | 12,500 | $ | 11,838 | 51 | ||||||||
2016 2nd | $ | 11,000 | $ | 12,500 | $ | 11,833 | 12 | ||||||||
2016 3rd | $ | 12,500 | $ | 13,000 | $ | 12,659 | 6 | ||||||||
2016 4th | $ | 13,260 | $ | 14,521 | $ | 13,807 | 25 | ||||||||
2017 1st | $ | 13,500 | $ | 15,150 | $ | 14,236 | 43 | ||||||||
2017 2nd | $ | 14,000 | $ | 15,500 | $ | 14,459 | 52 | ||||||||
2017 3rd | $ | 14,000 | $ | 15,500 | $ | 15,166 | 86 | ||||||||
2017 4th | $ | 15,400 | $ | 17,000 | $ | 16,000 | 47 | ||||||||
Distributions
| Date Declared | Distribution Declared Per Unit | Total Distribution Amount | Month Distribution Paid | |||||||
| November 15, 2016 | $ | 600 | $ | 8,763,600 | December 2016 | |||||
| February 14, 2017 | 200 | 2,921,200 | February 2017 | |||||||
| May 16, 2017 | 275 | 4,016,650 | May 2017 | |||||||
| August 14, 2017 | 100 | 1,460,600 | August 2017 | |||||||
| Totals | $ | 1,175 | $ | 17,162,050 | ||||||
| Date Declared | Distribution Declared Per Unit | Total Distribution Amount | Month Distribution Paid | |||||||
| November 17, 2015 | $ | 500 | $ | 7,303,000 | November 2015 | |||||
| February 9, 2016 | 300 | 4,381,800 | February 2016 | |||||||
| May 17, 2016 | 230 | 3,359,380 | June 2016 | |||||||
| August 16, 2016 | 600 | 8,763,601 | August 2016 | |||||||
| Totals | $ | 1,630 | $ | 23,807,781 | ||||||
Our board of directors has complete discretion over the timing and amount of distributions to our members. Our expectations with respect to our ability to make future distributions are discussed in greater detail in "Item 7 - Management Discussion and Analysis of Financial Condition and Results of Operations."
Performance Graph
The following graph shows a comparison of cumulative total member return since September 30, 2012,2015, calculated on a dividend reinvested basis, for the Company, the NASDAQ Composite Index (the “NASDAQ”“Composite”) and an index of other companies that have the same SIC code as the CompanyNASDAQ Clean Edge Green Energy Index (the “Industry Index”"CELS"). The graph assumes $100 was invested in each of our units, the NASDAQ,Composite and the Industry IndexCELS on September 30, 2012.2015. Data points on the graph are annual. Note that historic unit price performance is not necessarily indicative of future unit price performance.
22
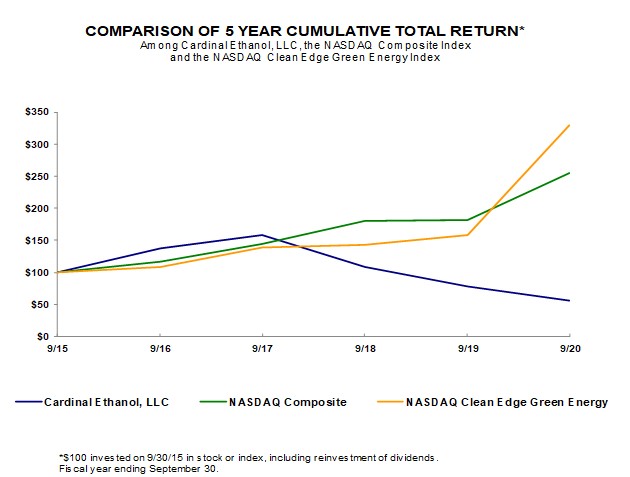

Pursuant to the rules and regulations of the Securities and Exchange Commission, the performance graph and the information set forth therein shall not be deemed to be filed for purposes of Section 18 of the Securities Exchange Act of 1934, and shall not be deemed to be incorporated by reference in any filing under the Securities Act of 1933, as amended, or the Exchange Act, except as shall be expressly set forth by specific reference in such a filing.
ITEM 6. SELECTED FINANCIAL DATA
The following table presents selected financial and operating data as of the dates and for the periods indicated. The selected balance sheet financial data as of the yearyears ended September 30, 2015, 20142018, 2017 and 20132016 and the selected income statement data and other financial data for the years ended September 30, 20142017 and 20132016 have been derived from our audited financial statements that are not included in this Form 10-K. The selected balance sheet financial data for the years ended September 30, 20172020 and 20162019 and the selected income statement data and other financial data for the years ended September 30, 2017, 20162020, 2019 and 20152018 have been derived from the audited Financial Statements included elsewhere in this Form 10-K. You should read the following table in conjunction with "Item 7- Management Discussion and Analysis of Financial Condition and Results of Operations" and the financial statements and the accompanying notes included elsewhere in this Form 10-K. Among other things, those financial statements include more detailed information regarding the basis of presentation for the following financial data.
23
| Statement of Operations Data: | 2017 | 2016 | 2015 | 2014 | 2013 | Statement of Operations Data: | 2020 | 2019 | 2018 | 2017 | 2016 | |||||||||||||||||||||||||||||||||||||||||
| Revenues | $ | 228,496,827 | $ | 222,895,449 | $ | 240,695,293 | $ | 337,355,515 | $ | 357,611,814 | Revenues | $ | 244,718,562 | $ | 260,669,352 | $ | 266,858,452 | $ | 228,496,827 | $ | 222,895,449 | |||||||||||||||||||||||||||||||
| Cost Goods Sold | 209,241,617 | 204,014,877 | 197,305,291 | 244,414,762 | 324,122,396 | Cost Goods Sold | 239,426,482 | 260,633,708 | 251,670,473 | 209,241,617 | 204,014,877 | |||||||||||||||||||||||||||||||||||||||||
| Gross Profit | 19,255,210 | 18,880,572 | 43,390,002 | 92,940,753 | 33,489,418 | Gross Profit | 5,292,080 | 35,644 | 15,187,979 | 19,255,210 | 18,880,572 | |||||||||||||||||||||||||||||||||||||||||
| Operating Expenses | 5,520,971 | 5,233,634 | 4,714,891 | 4,945,382 | 4,697,637 | Operating Expenses | 6,773,264 | 6,938,893 | 6,778,756 | 5,520,971 | 5,233,634 | |||||||||||||||||||||||||||||||||||||||||
| Operating Income | 13,734,239 | 13,646,938 | 38,675,111 | 87,995,371 | 28,791,781 | |||||||||||||||||||||||||||||||||||||||||||||||
| Operating Income (Loss) | Operating Income (Loss) | (1,481,184) | (6,903,249) | 8,409,223 | 13,734,239 | 13,646,938 | ||||||||||||||||||||||||||||||||||||||||||||||
| Other Income (Expense), Net | (309,615 | ) | (125,143 | ) | 46,706 | (733,697 | ) | (2,436,357 | ) | Other Income (Expense), Net | 340,751 | 304,336 | (778,158) | (309,615) | (125,143) | |||||||||||||||||||||||||||||||||||||
| Net Income | $ | 13,424,624 | $ | 13,521,795 | $ | 38,721,817 | $ | 87,261,674 | $ | 26,355,424 | ||||||||||||||||||||||||||||||||||||||||||
| Net Income (Loss) | Net Income (Loss) | $ | (1,140,433) | $ | (6,598,913) | $ | 7,631,065 | $ | 13,424,624 | $ | 13,521,795 | |||||||||||||||||||||||||||||||||||||||||
| Weighted Average Units Outstanding | 14,606 | 14,606 | 14,606 | 14,606 | 14,606 | Weighted Average Units Outstanding | 14,606 | 14,606 | 14,606 | 14,606 | 14,606 | |||||||||||||||||||||||||||||||||||||||||
| Net Income Per Unit | $ | 919 | $ | 926 | $ | 2,651 | $ | 5,974 | $ | 1,804 | ||||||||||||||||||||||||||||||||||||||||||
| Net Income (Loss) Per Unit | Net Income (Loss) Per Unit | $ | (78) | $ | (452) | $ | 522 | $ | 919 | $ | 926 | |||||||||||||||||||||||||||||||||||||||||
| Cash Distributions Per Unit | $ | 1,175 | $ | 1,630 | $ | 3,500 | $ | 4,547 | $ | 382 | Cash Distributions Per Unit | $ | 150 | $ | 100 | $ | 950 | $ | 1,175 | $ | 1,630 | |||||||||||||||||||||||||||||||
| Balance Sheet Data: | 2017 | 2016 | 2015 | 2014 | 2013 | Balance Sheet Data: | 2020 | 2019 | 2018 | 2017 | 2016 | |||||||||||||||||||||||||||||||||||||||||
| Current Assets | $ | 50,139,370 | $ | 48,529,843 | $ | 48,646,801 | $ | 60,034,736 | $ | 57,914,023 | Current Assets | $ | 45,522,739 | $ | 50,122,788 | $ | 46,351,013 | $ | 50,139,370 | $ | 48,529,843 | |||||||||||||||||||||||||||||||
| Net Property and Equipment | 107,936,389 | 104,461,078 | 107,998,425 | 105,632,776 | 110,311,216 | Net Property and Equipment | 78,003,177 | 86,169,079 | 96,948,671 | 107,936,389 | 104,461,078 | |||||||||||||||||||||||||||||||||||||||||
| Other Assets | 1,096,237 | 938,251 | 823,494 | 718,553 | 554,837 | Other Assets | 6,211,362 | 1,259,770 | 1,295,192 | 1,096,237 | 938,251 | |||||||||||||||||||||||||||||||||||||||||
| Total Assets | 159,171,996 | 153,929,172 | 157,468,720 | 166,386,065 | 168,780,076 | Total Assets | 129,737,278 | 137,551,637 | 144,594,876 | 159,171,996 | 153,929,172 | |||||||||||||||||||||||||||||||||||||||||
| Current Liabilities | 18,007,407 | 11,676,852 | 11,997,241 | 13,380,637 | 13,149,364 | Current Liabilities | 16,442,809 | 18,821,283 | 16,941,813 | 18,007,407 | 11,676,852 | |||||||||||||||||||||||||||||||||||||||||
| Long-Term Debt | 14,581,758 | 11,932,063 | 4,865,236 | — | 24,154,710 | |||||||||||||||||||||||||||||||||||||||||||||||
| Long-Term Liabilities | Long-Term Liabilities | 4,347,119 | 6,451,671 | 7,314,867 | 14,581,758 | 11,932,063 | ||||||||||||||||||||||||||||||||||||||||||||||
| Members' Equity | 126,582,831 | 130,320,257 | 140,606,243 | 153,005,428 | 131,476,002 | Members' Equity | 108,947,350 | 112,278,683 | 120,338,196 | 126,582,831 | 130,320,257 | |||||||||||||||||||||||||||||||||||||||||
* See Item 7. Management's Discussion and Analysis of Financial Condition and Results of Operations for further discussion of our financial results.
24
ITEM 7. MANAGEMENT'S DISCUSSION AND ANALYSIS OF FINANCIAL CONDITION AND RESULTS OF OPERATIONS
Overview
We produce ethanol, distillers grains and corn oil at our plant located near Union City, Indiana. In addition, we procure, transport and sell grain commodities.
Results of Operations for the Fiscal Years Ended September 30, 20172020 and 20162019
The following table shows the results of our operations and the percentage of revenues, cost of goods sold, operating expenses and other items to total revenues in our statement of operations for the fiscal years ended September 30, 20172020 and 2016:2019:
| 2020 | 2019 | ||||||||||||||||||||||
| Statement of Operations Data | Amount | % | Amount | % | |||||||||||||||||||
| Revenues | $ | 244,718,562 | 100.0 | $ | 260,669,352 | 100.0 | |||||||||||||||||
| Cost of Goods Sold | 239,426,482 | 97.8 | 260,633,708 | 100.0 | |||||||||||||||||||
| Gross Profit | 5,292,080 | 2.2 | 35,644 | — | |||||||||||||||||||
| Operating Expenses | 6,773,264 | 2.8 | 6,938,893 | 2.7 | |||||||||||||||||||
| Operating Loss | (1,481,184) | (0.6) | (6,903,249) | (2.7) | |||||||||||||||||||
| Other Income, net | 340,751 | 0.1 | 304,336 | 0.1 | |||||||||||||||||||
| Net Loss | $ | (1,140,433) | (0.5) | $ | (6,598,913) | (2.6) | |||||||||||||||||
Revenues
We have two reportable segments-the Ethanol Division and the Trading Division. Our revenues from operations from our Ethanol Division come from three primary sources: sales of fuel ethanol, distillers grains and corn oil. Revenues from operations of our Trading Division are derived from procuring, transporting and selling grain commodities. Revenues in each division also include net gains or losses from derivatives related to products sold.
The following table shows the sources of our total revenue from the two segments and the approximate percentage of revenues to total revenues in our consolidated statements of operations for the fiscal years ended September 30, 2020 and 2019:
| 2020 | 2019 | ||||||||||||||||
| Revenue: | Amount | % of Total Revenues | Amount | % of Total Revenues | |||||||||||||
| Ethanol production | $ | 211,573,718 | 86.5 | % | $ | 222,107,998 | 85.2 | % | |||||||||
| Grain trading | 33,144,844 | 13.5 | 38,561,354 | 14.8 | |||||||||||||
| Total Revenue | $ | 244,718,562 | 100.0 | % | $ | 260,669,352 | 100.0 | % | |||||||||
Ethanol Division
The following table shows the sources of our ethanol division revenue for the fiscal years ended September 30, 2020 and 2019:
| 2020 | 2019 | ||||||||||||||||
| Revenue Source | Amount | % of Revenues | Amount | % of Revenues | |||||||||||||
| Ethanol Sales | $ | 157,704,059 | 74.5 | % | $ | 170,418,067 | 76.7 | % | |||||||||
| Distillers Grains Sales | 41,687,109 | 19.7 | 42,940,147 | 19.4 | |||||||||||||
| Corn Oil Sales | 9,640,523 | 4.6 | 8,192,603 | 3.7 | |||||||||||||
| Carbon Dioxide Sales | 493,500 | 0.2 | 504,237 | 0.2 | |||||||||||||
| Other Revenue | 2,048,527 | 1.0 | 52,944 | — | |||||||||||||
| Total Revenues | $ | 211,573,718 | 100.0 | % | $ | 222,107,998 | 100.0 | % | |||||||||
25
| 2017 | 2016 | ||||||||||||
| Statement of Operations Data | Amount | % | Amount | % | |||||||||
| Revenues | $ | 228,496,827 | 100.0 | $ | 222,895,449 | 100.0 | |||||||
| Cost of Goods Sold | 209,241,617 | 91.6 | 204,014,877 | 91.5 | |||||||||
| Gross Profit | 19,255,210 | 8.4 | 18,880,572 | 8.5 | |||||||||
| Operating Expenses | 5,520,971 | 2.4 | 5,233,634 | 2.3 | |||||||||
| Operating Income | 13,734,239 | 6.0 | 13,646,938 | 6.2 | |||||||||
| Other Expense, net | (309,615 | ) | (0.1 | ) | (125,143 | ) | (0.1 | ) | |||||
| Net Income | $ | 13,424,624 | 5.9 | $ | 13,521,795 | 6.1 | |||||||
Our average price per gallon of ethanol sold for the fiscal year ended September 30, 2020, was approximately 4.9% lower than our average price per gallon of ethanol sold for the same period in 2019. Ethanol market prices have been lower as a result of an extended period of industry-wide production in excess of demand due to a variety of factors including the granting by the EPA of small refinery waivers and trade barriers resulting from disputes with foreign governments. This was exacerbated by a collapse in both domestic and foreign demand as a result of restrictions put in place in response to the COVID-19 pandemic which caused ethanol stocks in the United States to become significantly high and prices to decrease dramatically. As a result of poor economic conditions, many ethanol plants curtailed or stopped ethanol production. The decrease in industry-wide production coupled with a gradual increase in domestic demand due to the lifting of COVID-19 restrictions in many areas and the summer driving season in the United States had a positive effect on ethanol prices towards the end of the period.
Management anticipates that ethanol prices will be negatively effected as ethanol plants return to higher production levels due to improving operating conditions. Ethanol prices may also decrease if certain areas of the United States reinstate restrictions in response to the COVID-19 pandemic resulting in a decrease in fuel demand. Continued declines in ethanol exports due to decreased global fuel consumption in response to the COVID-19 pandemic or trade disputes with foreign governments would also likely contribute to lower ethanol prices and potentially negative operating margins. Finally, the granting of additional EPA waivers to small refiners could have a negative effect on ethanol prices.
We experienced a decrease in ethanol gallons sold of approximately 2.7% for the fiscal year ended September 30, 2020, as compared to the same period in 2019 resulting primarily from decreased ethanol production rates. In March of 2020, we reduced our ethanol production rate by approximately 20% due to unfavorable operating conditions in the ethanol industry and the COVID-19 pandemic. However, beginning in May of 2020, we began operating at an ethanol production rate of approximately 135 million gallons annually which is approximately 35% above the nameplate capacity for the plant. Management continues to monitor economic conditions carefully. If market conditions worsen affecting our ability to profitably operate the plant, we may be forced to reduce our ethanol production rate or even temporarily shut down ethanol production altogether.
Distillers Grains
Our revenues from distillers grains decreased in the fiscal year ended September 30, 2020, as compared to the same period in 2019. This decrease in revenues is primarily the result of a decrease in tons of distillers grains sold for the period ended September 30, 2020, as compared to the same period in 2019. We experienced a decrease of approximately 7.3% in distillers grains tons sold in the fiscal year ended September 30, 2020, as compared to the same period in 2019 due to lower production.
The average market price per ton of distillers grains sold for the fiscal year ended September 30, 2020, increased by approximately 4.7% compared to the average price per ton of distillers grains sold for the same period in 2019. This increase in the market price of distillers grains is primarily due to a reduction in distillers grains supply due to some ethanol plants curtailing or shutting down ethanol production in response to poor economic conditions and lower corn stocks nearing the end of fiscal year ended September 30, 2020.
Management anticipates that distillers grains prices will be negatively affected by an increase in distillers grains supply as operating conditions improve and ethanol plants increase production levels. In addition, trade barriers with foreign countries have had a negative effect on export demand in the past. If trade disputes with foreign countries such as China are not favorably resolved, this could have a negative effect on distillers grains prices unless additional demand can be sustained from domestic or other foreign markets. Domestic demand for distillers grains could also decrease if end-users switch to lower priced alternatives.
Corn Oil
Our revenues from corn oil sales increased by approximately 17.7% in the fiscal year ended September 30, 2020, as compared to the same period in 2019 which was mainly the result of increased volume of sales. We experienced an increase of
26
21.6% in pounds of corn oil sold during the fiscal year ended September 30, 2020, as compared to the same period in 2019 due to higher corn oil yield on average resulting in higher corn oil production for the period.
The average price per pound of corn oil sold for the fiscal year ended September 30, 2020, decreased by approximately 3.8% as compared to the same period in 2019. Lower prices in the early part of our 2020 fiscal year due to a surplus of corn oil in the market were only partially offset by higher prices because of a decrease in corn oil supply later in the period due to some ethanol plants reducing or shutting down production in response to poor economic conditions. The higher prices toward the end of the fiscal year also resulted from higher prices for soybean oil. Soybean oil is the primary competitor with distillers corn oil.
Management anticipates that corn oil prices will continue to follow soybean oil prices. Corn oil prices are also likely to be negatively affected by an increase in corn oil supply as operating conditions improve and ethanol plants increase production levels. However, the extension of the biodiesel tax credit by Congress could have a positive impact on demand and corn oil prices.
We are currently operating at an ethanol production rate of approximately 135 million gallons annually which is approximately 35% above the nameplate capacity for the plant. However, if we are forced to again reduce ethanol production that would result in a corresponding decrease in corn oil production.
Trading Division
The following table shows the sources of our revenues from our Trading Division for the fiscal year ended September 30, 2020 and 2019:
| 2020 | 2019 | ||||||||||||||||
| Revenue Source | Amount | % of Revenues | Amount | % of Revenues | |||||||||||||
| Soybean Sales | $ | 33,057,394 | 99.7 | % | $ | 38,519,254 | 99.9 | % | |||||||||
| Other Revenue | 87,450 | 0.3 | 42,100 | 0.1 | |||||||||||||
| Total Revenues | $ | 33,144,844 | 100.0 | % | $ | 38,561,354 | 100.0 | % | |||||||||
Soybeans
During the fiscal year ended September 30, 2020, revenues from our Trading Division were derived primarily from transporting and selling soybeans. Our revenues from soybeans sales decreased for the fiscal year ended September 30, 2020, as a result of a decrease in bushels of soybeans sold of approximately 18.3% during the fiscal year ended September 30, 2020, as compared to the same period in 2019. The decrease in bushels of soybeans sold is primarily due to smaller ending stocks, commonly referred to as carryout in the grain industry, in the local region for the fiscal year ended September 30, 2020.
We also experienced an increase of approximately 5.3% in the average price per bushel of soybeans sold for the fiscal year ended September 30, 2020, as compared to the same period in 2019 primarily due to smaller carryout for the 2019 harvest driving the remaining stock price higher. The presence of exports to China towards during the fiscal year ended September 30, 2020 was also a contributing factor to higher prices. The average price per bushel of soybeans sold was $9.17 based on sales of approximately 3,616,000 bushels for the fiscal year ended September 30, 2020.
Cost of Goods Sold
Ethanol Division
Our cost of goods sold for this division as a percentage of its total revenues was approximately 98.3% for the fiscal year ended September 30, 2020, as compared to approximately 100.4% for the same period in 2019. This decrease in cost of goods sold as a percentage of revenues was the result of decreased corn prices relative to the price of ethanol for the fiscal year ended September 30, 2020, as compared to the same period in 2019. Our two largest costs of production are corn and natural gas. Cost of goods sold also includes net gains or losses from derivatives related to commodities purchased.
27
Corn
Our largest cost associated with the production of ethanol, distillers grains and corn oil is corn cost. During the fiscal year ended September 30, 2020, the bushels of corn we used to produce our ethanol, distillers grains and corn oil decreased by approximately 2.2% as compared to the same period in 2019. Less bushels were used in production due to lower overall ethanol production levels for the fiscal year ended September 30, 2020, compared to the same period in 2019. During the fiscal year ended September 30, 2020, our average price paid per bushel of corn decreased approximately 3.0% as compared to the same period in 2019 due primarily to concerns related to the COVID-19 pandemic.
Weather, world supply and demand, current and anticipated stocks, agricultural policy and other factors can contribute to volatility in corn prices. If corn prices rise, it will have a negative effect on our operating margins unless the price of ethanol and distillers grains out paces rising corn prices. Volatility in the price of corn could significantly impact our cost of goods sold.
Natural Gas
Our natural gas cost was lower during our fiscal year ended September 30, 2020, as compared to the fiscal year ended September 30, 2019. This decrease in the cost of natural gas for the fiscal year ended September 30, 2020, as compared to the same period in 2019 was primarily the result of a decrease of approximately 11.0% in the average price per MMBTU of natural gas primarily due to plentiful supply and low demand. In addition, natural gas prices were lower towards the end of the period as a result of a reduction in the price of crude oil. We also used approximately 1.7% less natural gas for the fiscal year ended September 30, 2020, as compared to the same period in 2019 which was primarily due to lower ethanol production.
Management expects that natural gas prices will be dependent upon the severity of the coming winter weather. If the nation were to experience a catastrophic weather event causing problems related to the supply of natural gas, this could result in higher natural gas prices.
Rail Car Rehabilitation Costs
We lease 180 hopper rail cars under a multi-year agreement which ends in November 2021. Under the agreement, we are required to pay to rehabilitate each car for "damage" that is considered to be other than normal wear and tear upon turn in of each car at the termination of the lease. We have evaluated the condition of the cars and believe that it is probable that we may be assessed for damages incurred. Management has estimated total costs to rehabilitate the cars at September 30, 2020, to be approximately $1,453,000. During the year ended September 30, 2020, we have recorded an expense in cost of goods of $298,000. We accrue the estimated cost per railcar damages over the term of the lease.
Trading Division
The following table shows the costs incurred to procure various agricultural commodities for our Trading Division for the fiscal year ended September 30, 2020 and 2019:
| 2020 | 2019 | ||||||||||||||||
| Amount | % of Revenues | Amount | % of Revenues | ||||||||||||||
| Soybeans | $ | 31,415,693 | 94.8 | % | $ | 37,595,012 | 97.5 | % | |||||||||
| Total Cost of Goods Sold | $ | 31,415,693 | 94.8 | % | $ | 37,595,012 | 97.5 | % | |||||||||
Soybeans
During the fiscal year ended September 30, 2020, our cost was primarily the procurement of soybeans for sale. During the fiscal year ended September 30, 2020, our average price paid per bushel of soybeans was approximately 4.05% more as compared to the same period in 2019 due to concerns over a smaller crop and smaller ending stocks from the 2019 harvest. We also purchased 2.9% less bushels of soybeans during the fiscal year ended September 30, 2020, as compared to the same period in 2019. This is due primarily to a smaller 2019 crop to purchase coupled with a higher export demand.
28
Derivatives
We enter into hedging instruments to minimize price fluctuations in the prices of our finished products and inputs. As the current market price of our hedge positions changes, the realized or unrealized gains and losses are immediately recognized in our revenues and our cost of goods sold. These commodity-based derivatives are not designated as effective hedges for accounting purposes. Please refer to"Item 7A - Quantitative and Qualitative Disclosures About Market Risk-Commodity Price Risk"for information on our derivatives.
Operating Expense
Our operating expenses as a percentage of revenues were approximately 2.8% for the fiscal year ended September 30, 2020, as compared to operating expenses of approximately 2.7% of revenues for the same period in 2019. Operating expenses include salaries and benefits of administrative employees, insurance, taxes, professional fees, depreciation of trading division fixed assets, property taxes and other general administrative costs. Our efforts to optimize efficiencies and maximize production may result in a decrease in our operating expenses on a per gallon basis. These expenses generally do not vary with the level of production at the plant; we expect our operating expenses to remain consistent with 2020 into and throughout our 2021 fiscal year.
Operating Loss
Our loss from operations for the fiscal year ended September 30, 2020, was approximately 0.6% of our revenues compared to operating loss of approximately 2.7% of revenues for the same period in 2019. The decrease in operating loss for the fiscal year ended September 30, 2020, was primarily the result of decreased corn prices relative to the cost of ethanol.
Other Income
We had other income of approximately 0.1% of revenues for the fiscal year ended September 30, 2020 and 2019, respectively. Other income for the fiscal year ended September 30, 2020, consisted primarily of insurance proceeds from the DDGS silo explosion being received in January 2020, partially offset by interest expense.
Results of Operations for the Fiscal Years Ended September 30, 2019 and 2018
The following table shows the results of our operations and the percentage of revenues, cost of goods sold, operating expenses and other items to total revenues in our statement of operations for the fiscal years ended September 30, 2019 and 2018:
| 2019 | 2018 | ||||||||||||||||||||||
| Statement of Operations Data | Amount | % | Amount | % | |||||||||||||||||||
| Revenues | $ | 260,669,352 | 100.0 | $ | 266,858,452 | 100.0 | |||||||||||||||||
| Cost of Goods Sold | 260,633,708 | 100.0 | 251,670,473 | 94.3 | |||||||||||||||||||
| Gross Profit | 35,644 | — | 15,187,979 | 5.7 | |||||||||||||||||||
| Operating Expenses | 6,938,893 | 2.7 | 6,778,756 | 2.5 | |||||||||||||||||||
| Operating Income (Loss) | (6,903,249) | (2.7) | 8,409,223 | 3.2 | |||||||||||||||||||
| Other Expense, net | 304,336 | 0.1 | (778,158) | (0.3) | |||||||||||||||||||
| Net Income (Loss) | $ | (6,598,913) | (2.6) | $ | 7,631,065 | 2.9 | |||||||||||||||||
Revenues
We have two reportable segments-the Ethanol Division and the Trading Division. Our revenues from operations from our Ethanol Division come from three primary sources: sales of fuel ethanol, distillers grains and corn oil. Revenues from operations of our Trading Division are derived from procuring, transporting and selling grain commodities. Revenues in each division also include net gains or losses from derivatives related to products sold.
29
The following table shows the sources of our total revenue from the two segments and the approximate percentage of revenues to total revenues in our unaudited condensed consolidated statements of operations for the fiscal years ended September 30, 2019 and 2018:
| 2019 | 2018 | ||||||||||||||||
| Revenue: | Amount | % of Total Revenues | Amount | % of Total Revenues | |||||||||||||
| Ethanol production | $ | 222,107,998 | 85.2 | % | $ | 222,847,401 | 83.5 | % | |||||||||
| Grain trading | 38,561,354 | 14.8 | 44,011,051 | 16.5 | |||||||||||||
| Total Revenue | $ | 260,669,352 | 100.0 | % | $ | 266,858,452 | 100.0 | % | |||||||||
Ethanol Division
Our revenues from operations come from three primary sources: sales of fuel ethanol, distillers grains and corn oil. The following table shows the sources of our ethanol division revenue for the fiscal years ended September 30, 20172019 and 2016:2018:
| 2019 | 2018 | ||||||||||||||||
| Revenue Source | Amount | % of Revenues | Amount | % of Revenues | |||||||||||||
| Ethanol Sales | $ | 170,418,067 | 76.7 | % | $ | 171,669,232 | 77.0 | % | |||||||||
| Distillers Grains Sales | 42,940,147 | 19.4 | 42,422,819 | 19.1 | |||||||||||||
| Corn Oil Sales | 8,192,603 | 3.7 | 8,020,761 | 3.6 | |||||||||||||
| CO2 Sales | 504,237 | 0.2 | 477,355 | 0.2 | |||||||||||||
| Other Revenue | 52,944 | — | 257,234 | 0.1 | |||||||||||||
| Total Revenues | $ | 222,107,998 | 100.0 | % | $ | 222,847,401 | 100.0 | % | |||||||||
| 2017 | 2016 | ||||||||||
| Revenue Source | Amount | % of Revenues | Amount | % of Revenues | |||||||
| Ethanol Sales | $ | 188,860,886 | 82.7 | % | $ | 173,252,481 | 77.7 | % | |||
| Distillers Grains Sales | 30,886,518 | 13.5 | 40,709,845 | 18.3 | |||||||
| Corn Oil Sales | 8,010,124 | 3.5 | 8,226,924 | 3.7 | |||||||
| CO2 Sales | 481,893 | 0.2 | 514,937 | 0.2 | |||||||
| Other Revenue | 257,406 | 0.1 | 191,262 | 0.1 | |||||||
| Total Revenues | $ | 228,496,827 | 100 | % | $ | 222,895,449 | 100 | % | |||
Our revenues from ethanol increaseddecreased for our fiscal year ended September 30, 20172019, as compared to our fiscal year ended September 30, 2016.2018. This increasedecrease in revenues iswas primarily the result of an increase in thea lower average price per gallon of ethanol sold for the fiscal year ended September 30, 20172019 as compared to the same period in 2016.2018.
Our average price per gallon of ethanol sold for the fiscal year ended September 30, 20172019, was approximately 4.17% higher0.8% lower than our average price per gallon of ethanol sold for the same period in 2016.2018. Ethanol prices were higherlower during the fiscal year ended September 30, 20172019, due to increased export demandindustry-wide production which offset increased industry-wide production.was in excess of demand. In addition, lower corn, crude oiltrade disputes with countries such as China, Mexico and gasoline prices during the 2016 fiscal year had a negative affectEuropean Union and the imposition of tariffs on ethanol prices for that period.
Distillers Grains
Our revenues from distillers grains decreasedincreased in the fiscal year ended September 30, 20172019, as compared to the same period in 2016.2018. This decreaseincrease in revenues is primarily the result of a decreasean increase in the average market price per tontons of distillers grains sold for the period ended September 30, 20172019, as compared to the same period in 2016.2018. We experienced an increase of approximately 3.6% in distillers grains tons sold in the fiscal year ended September 30, 2019 as compared to the same period in 2018 due to higher demand and the ability to capitalize on some logistical market constraints. However, this increase was offset by lower ethanol production during our first quarter of 2019 which resulted in lower distillers grains production during the period.
The average market price per ton of distillers grains sold for the fiscal year ended September 30, 2017 was2019, decreased by approximately 25.00% lower than2.3% compared to the average price per ton of distillers grains sold for the same period in 2016.2018. This declinedecrease in the market price of distillers grains iswas due to increasedweak export demand from foreign markets due to international trade disputes combined with high industry-wide production along with lower export demand during the fiscal year ended September 30, 2017 as compared to the same period in 2016 which has resulted in a decline in the price of distillers grains as a percentage of corn values. In addition, poor corn quality from the 2016 corn crop had a negative effect on the pricedistiller's grains prices.
30
China has been a significant consumer of exported distillers grains particularly since December of 2014 following the resolution of a dispute related to China's objection to the presence of an unapproved genetically modified organism in some U.S. shipments.grains. However, an anti-dumping investigation beginning in January of 2016 into distillers grains produced in the United States led to the imposition by China of preliminary anti-dumping and anti-subsidy duties on imports of ethanol produced in the United States in the fall of 2016 and a final ruling imposing even higher duties in January 2017. The investigation and imposition of these duties have resulted in a decline in demand from China and distillers grains prices could remain low unless additional demand can be created from domestic or other foreign marketsChina. In addition, trade disputes with countries such as Vietnam,China, Mexico and the European Union had a nation that recently resumed imports of distillers grainsnegative effect on export demand.
Corn Oil
Our revenues from the United States after a nine-month ban. Domestic demand for distillers grains could also decrease due to expansion of production capacity in the ethanol industry or if lower corn prices result in end-users switching to lower priced alternatives. In addition, growing conditions in a particular season’s harvest may cause corn crop to be of poor quality resulting in lower distillers grains prices.
We experienced a decrease of 3.6% in pounds of corn oil sold during the fiscal year ended September 30, 2019, as compared to the same period in 2018 due to decreased oil extraction rates per bushel of corn which we attribute primarilydue to the the quality of corn purchased.
Trading Division
The following table shows the sources of our revenues from our Trading Division for the fiscal year ended September 30, 20172019 and 2018:
| 2019 | 2018 | ||||||||||||||||
| Revenue Source | Amount | % of Revenues | Amount | % of Revenues | |||||||||||||
| Soybean Sales | $ | 38,519,254 | 99.9 | % | $ | 43,975,501 | 99.9 | % | |||||||||
| Other Revenue | 42,100 | 0.1 | 35,550 | 0.1 | |||||||||||||
| Total Revenues | $ | 38,561,354 | 100.0 | % | $ | 44,011,051 | 100.0 | % | |||||||||
Soybeans
During the fiscal year ended September 30, 2019, revenues from our Trading Division were derived primarily from transporting and selling soybeans. Our revenues from soybeans sales decreased during the fiscal year ended September 30, 2019, as compared to the same period in 2016 due primarily to higher demand from2018. This decrease in revenues is the biodiesel industry during our first fiscal quarterresult of 2017 and from the feed industry during our second fiscal quartera decrease in bushels of 2017 which positively impacted the market pricesoybeans sold of corn oil. However, corn oil demand was lowerapproximately 3.42% during the last half of our fiscal year.
We also experienced a decrease in the average price per bushel of soybeans sold for the fiscal year ended September 30, 2019, that was approximately 9.27% less than our average price per bushel of soybeans sold for the same period in 2018 primarily due to completioncontinued pressure from increased tariffs from China along with a plentiful harvest in the fall of various projects which are expected to increase our ethanol production capacity to2018. The average price per bushel of soybeans sold was $8.71 based on sales of approximately 135 million gallons which would also increase our corn oil production.4,426,000 bushels for the fiscal year ended September 30, 2019.
Cost of Goods Sold
Ethanol Division
Our Ethanol Division cost of goods sold as a percentage of its revenues was approximately 91.60%100.4% for the fiscal year ended September 30, 20172019, as compared to approximately 91.53%94.1% for the same period in 2016.2018. This increase in cost of goods sold as a percentage of revenues was the result of increaseddecreased ethanol prices relative to the price of corn for the fiscal year ended September 30, 20172019, as compared to the same period in 2016.2018. Our two largest costs of production are corn and natural gas. Cost of goods sold also includes net gains or losses from derivatives related to commodities purchased.
31
Corn
Our largest cost associated with the production of ethanol, distillers grains and corn oil is corn cost. During the fiscal year ended September 30, 2017, we used approximately 3.42% more2019, the bushels of corn we used to produce our ethanol, distillers graingrains and corn oil increased by approximately 1.1% as compared to the same period in 2016.2018. More bushels were used in production because we produced more gallons of ethanol during the fiscal year ended September 30, 20172019, as compared to the same period in 2016.2018. During the fiscal year ended September 30, 2017,2019, our average price paid per bushel of corn increased approximately 2.33%8.8% as compared to the same period in 20162018 due primarily to market concerns that the size of the crop would be negatively affected by substandard spring planting conditions resulting from wet weather and flooding in the late spring and early summer months about wet conditions in our area of the corn belt. Better growing conditions in July and August relieved those concerns but the higher prices earlier caused the average annual price to be higher.upper Midwest.
Natural Gas
Our natural gas cost was higherlower during our fiscal year ended September 30, 20172019, as compared to the fiscal year ended September 30, 2016.2018. This increasedecrease in the cost of natural gas for the fiscal year ended September 30, 20172019 as compared to the same period in 20162018 was primarily the result of an increasea decrease of approximately 16.60%5.7% in the average price per MMBTU of natural gas due to lower production and increased demand which have used upan increase in natural gas stocks built up in 2015.stocks. We also used approximately 3.08% more0.5% less natural gas for the fiscal year ended September 30, 20172019, as compared to the same period in 20162018 because of highermore efficient ethanol production.
We lease 180 hopper rail cars under a multi-year agreement which ends in November 2021. Under the agreement, we are expectedrequired to increasepay to rehabilitate each car for "damage" that is considered to be other than normal wear and tear upon turn in of each car at the future due to producers shutting down wells resulting in lower natural gas production andtermination of the lease. Prior to the conversion of power plants acrossyear ending September 30, 2019, we believed ongoing repairs results in an insignificant future rehabilitation expense. During the U.S.year ending September 30, 2019, based on new information from coalthe lessor, we re-evaluated our assumptions and believe that it is probable that we may be assessed for damages incurred. Management estimated total costs to natural gas. Natural gas prices will alsorehabilitate the cars at September 30, 2019, to be dependent uponapproximately $1,155,000. During the severity of the coming winter weather. If the nation were to experience a catastrophic weather event causing problems related to the supply of natural gas, this could resultyear ended September 30, 2019, we recorded an expense in higher natural gas prices.
Trading Division
The following table shows the costs incurred to procure various agricultural commodities for our Trading Division for the fiscal year ended September 30, 2019 and 2018:
| 2019 | 2018 | ||||||||||||||||
| Amount | % of Revenues | Amount | % of Revenues | ||||||||||||||
| Soybean | $ | 37,595,012 | 97.5 | % | $ | 42,062,458 | 95.6 | % | |||||||||
| Total Revenue | $ | 37,595,012 | 97.5 | % | $ | 42,062,458 | 95.6 | % | |||||||||
Soybeans
During the fiscal year ended September 30, 2019, our cost was primarily the procurement of soybeans for sale. During the fiscal year ended September 30, 2019, our average price paid per bushel of soybeans was approximately 9.80% less as effective hedges for accounting purposes. Please refercompared to"Item 7A - Quantitative and Qualitative Disclosures About Market Risk-Commodity Price Risk"for information on our derivatives. the same period in 2018 due to continued pressure from increased tariffs from China along with a plentiful harvest in the fall of 2018.
Operating Expense
Our operating expenses as a percentage of revenues were approximately 2.41% and 2.34%2.7% for the fiscal yearsyear ended September 30, 2017 and 2016, respectively.2019, as compared to operating expenses of approximately 2.5% of revenues for the same period in 2018. Operating expenses include salaries and benefits of administrative employees, insurance, taxes, professional fees, depreciation of trading division fixed assets, property taxes and other general administrative costs. The increase was due primarily to the increased depreciation of Trading Division and property taxes for the fiscal year ended September 30, 2019. Our efforts to optimize efficiencies and maximize production may result in a decrease in our operating expenses on a per gallon basis. However, because these expenses generally do not vary with the level of production at the plant, we expect our operating expenses to remain steadyconsistent with 2019 into and throughout our 20182020 fiscal year.
32
Operating Income
Our incomeloss from operations for the fiscal year ended September 30, 20172019, was approximately 6.00%2.7% of our revenues compared to operating income of approximately 6.20%3.2% of revenues for the same period in 2016.2018. The decrease in operating income for the fiscal year ended September 30, 20172019, was primarily the result of decreased ethanol prices relative to the cost of corn.
Other ExpenseIncome (Expense)
We had other expenseincome of approximately 0.14%0.1% of revenues for the fiscal year ended September 30, 20172019, as compared to other incomeexpense of approximately 0.06%0.3% of revenues for the same period in 2016.2018. This increase in other expense for the fiscal year ended September 30, 2017, was primarily due to drawing additional funds on our debt facilities which increased our interest expense for our fiscal year ended September 30, 2017.
| 2016 | 2015 | |||||||||||
| Statement of Operations Data | Amount | % | Amount | % | ||||||||
| Revenues | $ | 222,895,449 | 100.0 | $ | 240,695,293 | 100.0 | ||||||
| Cost of Goods Sold | 204,014,877 | 91.5 | 197,305,291 | 82.0 | ||||||||
| Gross Profit | 18,880,572 | 8.5 | 43,390,002 | 18.0 | ||||||||
| Operating Expenses | 5,233,634 | 2.3 | 4,714,891 | 2.0 | ||||||||
| Operating Income | 13,646,938 | 6.2 | 38,675,111 | 16.0 | ||||||||
| Other Expense, net | (125,143 | ) | (0.1 | ) | 46,706 | — | ||||||
| Net Income | $ | 13,521,795 | 6.1 | $ | 38,721,817 | 16.0 | ||||||
| 2016 | 2015 | ||||||||||
| Revenue Source | Amount | % of Revenues | Amount | % of Revenues | |||||||
| Ethanol Sales | $ | 173,252,481 | 77.7 | % | $ | 181,640,992 | 75.5 | % | |||
| Distillers Grains Sales | 40,709,845 | 18.3 | 50,269,686 | 20.9 | |||||||
| Corn Oil Sales | 8,226,924 | 3.7 | 8,120,749 | 3.3 | |||||||
| CO2 Sales | 514,937 | 0.2 | 488,065 | 0.2 | |||||||
| Other Revenue | 191,262 | 0.1 | 175,801 | 0.1 | |||||||
| Total Revenues | $ | 222,895,449 | 100 | % | $ | 240,695,293 | 100 | % | |||
Changes in Financial Condition for the Fiscal Year Ended September 30, 20172020
The following table highlights the changes in our financial condition for the fiscal years ended September 30, 20172020 and 2016:2019:
| September 30, 2020 | September 30, 2019 | ||||||||||
| Current Assets | $ | 45,522,739 | $ | 50,122,788 | |||||||
| Current Liabilities | 16,442,809 | 18,821,283 | |||||||||
| Long-term Liabilities | 4,347,119 | 6,451,671 | |||||||||
| Members' Equity | 108,947,350 | 112,278,683 | |||||||||
| September 30, 2017 | September 30, 2016 | ||||||
| Current Assets | $ | 50,139,370 | $ | 48,529,843 | |||
| Current Liabilities | 18,007,407 | 11,676,852 | |||||
| Long-term Liabilities | 14,581,758 | 11,932,063 | |||||
| Members' Equity | 126,582,831 | 130,320,257 | |||||
We experienced an increasea decrease in our current assets at September 30, 20172020 as compared to September 30, 2016.2019. This increasedecrease was primarily driven by a decrease in our cash, restricted cash and accounts receivable at September 30, 2020 compared to September 30, 2019. The reduction in cash was due to paying off the balance of the Grain Loadout Facility Loan during the fiscal year ended September 30, 2020. The reduction in restricted cash was because of the varying cash requirements with derivative trading counter-parties. Accounts receivable also decreased due the timing of rail shipments of ethanol and soybeans. These decreases were partially offset by an increase in our grain inventories at September 30, 20172020, as compared to September 30, 2016 because the harvest began earlier and because we began operations of our new Trading Division and were holding soybeans for sale. Our trade accounts receivable increased due to ethanol revenues and the timing of shipments before fiscal year end.2019.
We also experienced an increasea decrease in our commodity derivative instruments and miscellaneous receivables at September 30, 2017 compared to September 30, 2016 due to the volume of corn and soybean purchases that were hedged at September 30, 2017.
We experienced an increasea decrease in our long-term liabilities as of September 30, 20172020, as compared to September 30, 2016. The2019 as a result of paying off the Grain Loadout Facility loan during the fiscal year ended September 30, 2020. This decrease was partially offset by an increase isin long-term liabilities due to borrowing fundsrecording a liability related to pay for constructionlong-term portion of the grain receivingOperating Lease Liability because of the implementation of ASC 842 as well as the addition of the long-term portion of the PPP Loan as of September 30, 2020.
Liquidity and loading facilityCapital Resources
We, and the ethanol industry as a whole, experienced adverse conditions throughout 2019 and 2020, as a result of industry-wide record low ethanol prices due to reduced demand and high industry inventory levels. These factors, which are compounded by the recent impact of COVID-19, resulted in negative operating margins, lower cash flow from operations and net operating losses. In response to the low margin environment, we reduced our ethanol production rate by approximately 20%. However, as margins improved in May of 2020, we began operating at an ethanol production rate of approximately 135 million gallons annually which is approximately 35% above the nameplate capacity for our Trading Division.
the plant. We continue to monitor
33
COVID-19 developments and the effect on demand for our products in order to determine whether future adjustments to production are warranted.
Based on financial forecasts performed by our management, we anticipate that we will have sufficient cash from our current credit facilities and cash from our operations to continue to operate the ethanol plant for the next 12 months. We do not anticipate seeking additional equity financing during our 20182021 fiscal year. However, should we experiencethe current unfavorable operating conditions in the ethanol industry that prevent us from profitably operating the ethanol plant,worsen or continue for a prolonged period, we could have difficulty maintaining our liquidity and may need to rely on our revolving lines of credit for operations.
Comparison of Cash Flows for Fiscal Years Ended September 30, 20172020 and 20162019
The following table shows cash flows for the fiscal year ended September 30, 20172020 and 2016:2019:
| 2020 | 2019 | |||||||||||||
| Net cash provided by operating activities | $ | 5,736,271 | $ | 7,951,807 | ||||||||||
| Net cash used for investing activities | (2,796,452) | (1,677,363) | ||||||||||||
| Net cash used for financing activities | (8,059,957) | (3,478,316) | ||||||||||||
| Net increase (decrease) in cash & restricted cash | (5,120,138) | 2,796,128 | ||||||||||||
| Cash & restricted cash, beginning of period | $ | 22,034,120 | 19,237,992 | |||||||||||
| Cash & restricted cash, end of period | $ | 16,913,982 | $ | 22,034,120 | ||||||||||
| 2017 | 2016 | |||||||
| Net cash provided by operating activities | $ | 21,535,242 | $ | 23,207,492 | ||||
| Net cash used for investing activities | (12,950,173 | ) | (6,931,007 | ) | ||||
| Net cash used for financing activities | (13,650,819 | ) | (13,852,664 | ) | ||||
| Net increase (decrease) in cash & restricted cash | (5,065,750 | ) | 2,423,821 | |||||
| Cash & restricted cash, beginning of period | 24,462,911 | 22,039,090 | ||||||
| Cash & restricted cash, end of period | $ | 19,397,161 | $ | 24,462,911 | ||||
Cash Flow from Operations
We experienced a decrease in our cash flow from operations for the fiscal year ended September 30, 20172020, as compared to the same period in 2016.2019. This decrease was primarily the result of decreased ethanol and distillers grain prices relativedue to the costamount of corn and the impact these prices hadinventory on inventory and other working capital components forhand at the fiscal year ended September 30, 20172020, as compared withto the same period in 2016.2019 coupled with changes in various working capital items, particularly a decrease in accounts receivable and an increase in accounts payable as of September 30, 2020.
Cash Flow used for Investing Activities
We used more cash in investing activities for the fiscal year ended September 30, 20172020, as compared to the same period in 2016.2019. This decreaseincrease was primarily the result of an increasecapital expenditures for the fiscal year ended September 30, 2020, coupled with the receipt of funds in payments for constructionfiscal year ended September 30, 2019, from the acquisition account from Randolph County Redevelopment Commission of approximately $2,300,000 as compared to $0 in progress due to construction of the grain receiving and loading facility for our Trading Division.fiscal year ended September 30, 2020.
Cash Flow used for Financing Activities
We used lessmore cash for financing activities for the fiscal year ended September 30, 20172020, as compared to the same period in 2016.2019. This decreaseincrease was the result of paying lessoff the Grain Loadout Facility Loan that was partially offset by receipt of the PPP Loan in fiscal year ended September 30, 2020. More cash was also used in distributions to our members during the fiscal year ended September 30, 20172020, as compared towith the same period in 2016. This was partially offset by net additional borrowing of approximately $3.5 million from our debt facilities.2019.
Our liquidity, results of operations and financial performance will be impacted by many variables, including the market price for commodities such as, but not limited to, corn, ethanol, soybeans and other energy commodities, as well as the market price for any co-products generated by the facility and the cost of labor and other operating costs. Assuming future relative price levels for corn, ethanol, and distillers grains and soybeans remain consistent with the relative price levels as of September 30, 2017,2020, we expect operations to generate adequate cash flows to maintain operations.
34
Comparison of Cash Flows for Fiscal Years Ended September 30, 20162019 and 20152018
The following table shows cash flows for the fiscal year ended September 30, 20162019 and 2015:2018:
| 2019 | 2018 | |||||||||||||
| Net cash provided by operating activities | $ | 7,951,807 | $ | 25,369,114 | ||||||||||
| Net cash used for investing activities | (1,677,363) | (2,064,437) | ||||||||||||
| Net cash used for financing activities | (3,478,316) | (23,463,846) | ||||||||||||
| Net increase (decrease) in cash & restricted cash | 2,796,128 | (159,169) | ||||||||||||
| Cash & restricted cash, beginning of period | 19,237,992 | 19,397,161 | ||||||||||||
| Cash & restricted cash, end of period | $ | 22,034,120 | $ | 19,237,992 | ||||||||||
| 2016 | 2015 | |||||||
| Net cash provided by operating activities | $ | 23,207,492 | $ | 50,201,987 | ||||
| Net cash used for investing activities | (6,931,007 | ) | (10,524,207 | ) | ||||
| Net cash used for financing activities | (13,852,664 | ) | (46,255,766 | ) | ||||
| Net increase (decrease) in cash and restricted cash | 2,423,821 | (6,577,986 | ) | |||||
| Cash & restricted cash, beginning of period | 22,039,090 | 28,617,076 | ||||||
| Cash and restricted cash, end of period | $ | 24,462,911 | $ | 22,039,090 | ||||
Cash Flow from Operations
We experienced a decrease in our cash flow from operations for the fiscal year ended September 30, 20162019, as compared to the same period in 2015.2018. This decrease was primarily the result of decreased ethanol and distillers grain prices relativedue to the cost of corn fornet operating losses experienced during the fiscal year ended September 30, 20162019, as compared withto net operating income during the same period in 2015.2018 coupled with changes in various working capital items, particularly an increase in accounts receivable as of September 30, 2019.
Cash Flow used for Investing Activities
We used less cash in investing activities for the fiscal year ended September 30, 20162019, as compared to the same period in 2015.2018. This decrease was primarily the result of athe receipt of funds from the acquisition account from Randolph County Redevelopment Commission of approximately $2,300,000. This decrease in paymentswas partially offset by increased amounts paid for construction in progress and other capital expenditures due to finalizing our expansion projects.which were approximately $2,000,000 higher in 2019.
Cash Flow used for Financing Activities
We used less cash for financing activities for the fiscal year ended September 30, 20162019, as compared to the same period in 2015.2018. This decrease was the result of paying less net repayment activity on long-term debt along with a decrease in distributions to our members during the fiscal year ended September 30, 20162019, as compared towith the same period in 2015. However, we did borrow funds from our Declining Loan to fund our expansion projects during the 2015 period.2018.
Short and Long Term Debt Sources
We have a loan agreement consisting of fourtwo loans, the Term Loan, the Declining Revolving Loan ("Declining Loan"), and the Revolving Credit Loan. We formerly had an additional loan called a Grain Loadout Facility Loan and a Construction Loan.which was paid in full on August 24, 2020. In exchange for these loans, we granted liens on all property (real and personal, tangible and intangible) which include, among other things, a mortgage on the property, a security interest on commodity trading accounts, and assignment of material contracts. On March 23, 2017, we executed a Tenth Amendment of First Amended and Restated Construction Loan Agreement to be effective as of February 28, 2017, which amends the First Amended and Restated Construction Loan Agreement dated June 10, 2013 (the "Amendment"). The primary purpose of the Amendment was to provide an additional $10,000,000 in financing to fund construction of the grain receiving and loading facility for our Trading Division. (the "Construction Loan"). The Amendment also extends the termination date of the Revolving Credit Loan from February 28, 2017 to February 28, 2018 and amends the mortgage to add an additional 64 acres of land purchased in October 2016. Please refer to "Item 8 - Financial Statements, Note 89 - Bank Financing" for additional details regarding the Amendment.details.
Declining Loan
The maximum availability of the Declining Loan is $5,000,000 with such amount to be available for working capital purposes. The interest rate on the Declining Loan is based on the 3-month LIBOR plus two hundred ninety basis points. The interest rate at September 30, 20172020 was 4.20%3.13%. There waswere no borrowings outstanding on the Declining Loan at September 30, 20172020 or September 30, 2016.2019.
Revolving Credit Loan
The Revolving Credit Loan has a limit of $15,000,000 supported by a borrowing base made up of our corn, ethanol, dried distillers grain, and corn oil and soybean inventories reduced by accounts payable associated with those inventories having a priority over FNBO.priority. It is also supported by the eligible accounts receivable and commodity trading account excess margin funds. The interest rate on the Revolving Credit Loan is the 1-month LIBOR plus two hundred ninety basis points. The interest rate at September 30, 20172020 was 4.14%3.06%. There were no borrowings outstanding on the Revolving Credit Loan at September 30, 20172020 or September 30, 2016.2019.
35
Grain Loadout Facility Loan
The ConstructionGrain Loadout Facility Loan has(formerly construction loan) was a term loan with a limit of $10,000,000. The Grain Loadout Facility Loan required monthly installment payments of principal of approximately $119,000 plus interest rateaccrued in arrears from the date of the last payment. Such payments commenced on the Construction Loan is based on the 3-month LIBOR plus two hundred ninety basis points and at September 30, 2017 was 4.22%.February 1, 2018, with a final maturity date of February 28, 2023. There were borrowings in the amount of approximately $6,476,000$6,726,000 outstanding on the ConstructionGrain Loadout Facility Loan at September 30, 20172019. On August 24, 2020, we elected to pay the remaining balance due on the Grain Loadout Facility Loan and as such there were no borrowings outstanding on the ConstructionGrain Loadout Facility Loan at September 30, 2016.2020. During the fiscal year ended September 30, 2017,2020, we have capitalized approximately $263,000$45,000 of interest related to the various improvement and construction projects. This compares with approximately $175,000$67,000 capitalized in the same period ended September 30, 2016.2019. Due to our payment in full, the Grain Loadout Facility Loan terminated and there is currently no credit availability on this loan.
Covenants
During the term of the loans, we will be subject to certain financial covenants. Our minimum working capital is $15,000,000, which is calculated as our current assets plus the amount available for drawing under our long term revolving note, less current liabilities. Our minimum fixed charge coverage ratio is no less than 1.15:1.0 measured on a rolling four quarter average basis. However, for any reporting period, if our working capital is equal to or more than $25,000,000,$23,000,000, we will be subject to maintaining a debt service charge coverage ratio of no less than 1.25:1.0 in lieu of the fixed charge coverage ratio.
Our loan agreement also requires us to obtain prior approval from our lender before making, or committing to make, capital expenditures exceeding an aggregate amount of $5,000,000 in any single fiscal year except for the 2017 fiscal year when we were allowed $7,000,000 of expenditures without prior approval excluding the grain loading and receiving project from the calculation.$5,000,000.
We are meeting our liquidity needs and complying with our financial covenants and the other terms of our loan agreements at September 30, 2017.2020. Based on current management projections, we anticipate that future operations will be sufficient to generate enough cash flow to maintain operations, service any new debt and comply with our financial covenants and other terms of our loan agreements through September 30, , 2018.2020. Should market conditions deteriorate in the future, circumstances may develop which could result in us violating the financial covenants or other terms of our loan agreements. Should we violate the terms or covenants of our loan or fail to obtain a waiver of any such term or covenant, our primary lender could deem us in default of our loans and require us to immediately repay a significant portion or possibly the entire outstanding balance of our loans if we have a balance outstanding. In that event, our lender could also elect to proceed with a foreclosure action on our plant.
Paycheck Protection Program Loan
In March 2020, Congress passed the Paycheck Protection Program, authorizing loans to small business for use in paying employees that continue to work throughout the COVID-19 pandemic and for rent, utilities and interest on mortgages. Loans obtained through the Paycheck Protection Program are eligible to be forgiven as long as the proceeds are used for qualifying purposes and other conditions are met. On April 20, 2020, we received a loan in the approximate amount of $856,000 through the Paycheck Protection Program. Management expects that the entire loan will be used for payroll, utilities and interest on our one mortgage loan; therefore management anticipates that the loan will be substantially forgiven. To the extent it is not forgiven, we would be required to repay that portion at an interest rate of interest of 1% over eighteen months beginning six months after the loan is executed. As of September 30, 2020, we had not requested nor recognized any forgiveness of the Paycheck Protection Program Loan.
Capital Improvements
The board of directors approved various capital projects in order to make certain improvements to our ethanol plant to allow us to increase our annual ethanol production rate. These improvements include updates to our corn oil loadout racks, an additional ethanol loadout skid and other small miscellaneous projects. We are also investing in an ethanol recovery system which is expected to cost approximately $2,400,000 and be funded with funds from operations and our existing debt facilities. We anticipate completion of this project in the first half of fiscal 2021.
In addition, we added an additional flat storage building to replace our distillers grains silo that was damaged in a DDGS silo explosion in November 2018. The flat storage cost totaled approximately $1,700,000 which was funded with insurance proceeds along with funds from operations and our existing debt facilities. The flat storage was put into service in June 2020.
36
Development Agreement
In September 2007, the Companywe entered into a development agreement with Randolph County Redevelopment Commission (“(“the Commission”Commission”) to promote economic development in the area. Under the terms of this agreement, beginning in January 2008 through December 2028, the money the Company payswe pay toward property tax expense is allocated to an expense and an acquisition account. The funds in the acquisition account can be used by the Commission to purchase equipment, at the Company'sour direction, for the plant. The Company doesWe do not have title to or control over the funds in the acquisition account, no amounts have been recorded in the balance sheet relating to this account. During the fiscal year ended September 30, 2020, no amounts were refunded to the Company and used to offset costs of capital expenditures. During the fiscal year ended September 30, 2019, approximately $2.3 million was refunded to the Company and used to offset capital expenditures.
Tax Abatement
In October 2006, the real estate on which our plant was constructed was determined to be an economic revitalization area, which qualified us for tax abatement. The abatement period is for a ten year term, with an effective date beginning calendar year end 2009 for the property taxes payable in calendar year 2010. The program allows for 100% abatement of property taxes beginning in year 1, and then decreases on a ratable scale so that in year 11 the full amount of property taxes are due and payable. We must apply annually and meet specified criteria to qualify for the abatement program.
Contractual Cash Obligations
In addition to our long-term debt obligations, we have certain other contractual cash obligations and commitments. The following tables provide information regarding our contractual obligations and approximate commitments as of September 30, 2017:2020:
| Payment Due By Period | |||||||||||||||||||||||||||||
| Contractual Cash Obligations | Total | Less than One Year | One to Three Years | Three to Five Years | After Five Years | ||||||||||||||||||||||||
| Long-Term Debt Obligations | $ | 871,886 | $ | 287,821 | $ | 584,065 | $ | — | $ | — | |||||||||||||||||||
| Operating Lease Obligations | 5,200,182 | 2,819,680 | 2,380,502 | — | — | ||||||||||||||||||||||||
| Purchase Obligations | 36,597,282 | 35,022,435 | 1,574,847 | — | — | ||||||||||||||||||||||||
| Total Contractual Cash Obligations | $ | 42,669,350 | $ | 38,129,936 | $ | 4,539,414 | $ | — | $ | — | |||||||||||||||||||
| Payment Due By Period | ||||||||||||||||||||
| Contractual Cash Obligations | Total | Less than One Year | One to Three Years | Three to Five Years | After Five Years | |||||||||||||||
| Long-Term Debt Obligations | $ | 20,275,490 | $ | 4,462,740 | $ | 12,678,604 | $ | 3,134,146 | $ | — | ||||||||||
| Operating Lease Obligations | $ | 4,120,270 | 1,171,870 | 2,795,400 | 153,000 | — | ||||||||||||||
| Purchase Obligations | $ | 12,268,353 | 11,624,291 | 644,062 | — | — | — | |||||||||||||
| Total Contractual Cash Obligations | $ | 36,664,113 | $ | 17,258,901 | $ | 16,118,066 | $ | 3,287,146 | $ | — | ||||||||||
The long-term debt obligations in the table above include both estimated principal and interest payments applicable to the obligations incurred as a result of the borrowings against the Term Loan for our expansion projects (discussed above).Paycheck Protection Program Loan. The operating lease obligations in the table above include our hopper and tank railcars and forklift lease obligations as of September 30, 2017.2020. Purchase obligations consist of forward contracted corn and soybean deliveries and forward contracted natural gas purchases.
Critical Accounting Estimates
Management uses various estimates and assumptions in preparing our financial statements in accordance with generally accepted accounting principles. These estimates and assumptions affect the reported amounts of assets and liabilities, the disclosure of contingent assets and liabilities, and the reported revenues and expenses. Accounting estimates that are the most important to the presentation of our results of operations and financial condition, and which require the greatest use of judgment by management, are designated as our critical accounting estimates. We have the following critical accounting estimates:
We enter into derivative instruments to hedge the variability of expected future cash flows related to commodity markets. We do not typically enter into derivative instruments other than for economic hedging purposes. All derivative instruments are recognized on the September 30, 20172020 balance sheet at their fair market value. Changes in the fair value of a derivative instrument that is designated as and meets all of the required criteria for a cash flow hedge are recorded in accumulated other comprehensive income and reclassified into earnings as the underlying hedged items affect earnings.
As of September 30, 2017,2020, we have open short (selling) positions for 2,110,0009,451,418 bushels of corn and long (buying) positions for 405,0004,205,000 bushels of corn on the Chicago Board of Trade, open short (selling) positions of 4,410,00018,690,000 gallons of ethanol and long (buying) positions of 4,200,0005,670,000 gallons of ethanol on the Chicago Board of Trade. We also have open short (selling) positions for 2,091,854 bushels of soybeans and long (buying) positions of 250,000 bushels of soybeans on the
37
Chicago Board of Trade. These derivatives have not been designated as an effective hedge for accounting purposes. Corn, ethanol and ethanolsoybean positions are forecasted to settle through March 2018July 2023, December 2020 and December
We carry our long-lived assets at the original acquisition cost as required by current generally accepted accounting principles. Due to business conditions and the business environment in which our industry operates, the fair market value of those assets could, theoretically, fall below the amount which we carry them in our financial statements. In such cases, those assets would be known as impaired. Thus, we periodically perform an assessment of the fair value of these assets. Given the significant assumptions required and the possibility that actual conditions will differ, we consider the assessment of the useful lives of property and equipment to be a critical accounting estimate. Our assessment shows us that the fair value of our long-lived assets as a group is substantially in excess of its carrying value.
Inventories consist of raw materials, work in process, finished goods, grain inventory and parts. Corn is the primary raw material. Finished goods consist of ethanol, dried distiller grains and corn oil. We, valueother than for our inventoryTrading Division, state inventories at the lower of weighted average cost or net realizable value. For our Trading Division, we state our grain inventories at market price less estimated disposition costs. Net realizable value is the estimated selling prices in the normal course of business, less reasonably predictable costs. Our estimates are based upon assumptions believed to be reasonable, but which are inherently uncertain and unpredictable. These valuations require the use of management's assumptions which do not reflect unanticipated events and circumstances that may occur. In our analysis, we consider future corn costs and ethanol prices, break-even points for our plant and our risk management strategies in place through our derivative instruments and forward contracts. Given the significant assumptions required and the possibility that actual conditions will differ, we consider the valuation of the lower of cost or net realizable value on inventory to be a critical accounting estimate.
We enter into forward contracts for corngrain purchases and natural gas to supply the plant.two divisions. These contracts represent firm purchase commitments which must be evaluated for potential losses. We have determined that there are no losses that are required to be recognized on these firm purchase commitments related to corn contracts in place at September 30, 2017.2020. Our estimates include various assumptions including the future prices of ethanol, distillers grains, corn, natural gas and corn.soybeans.
We lease 180 hopper rail cars under a multi-year agreement which ends in November 2021. Under the agreement, we are required to pay to rehabilitate each car for "damage" that is considered to be other than normal wear and tear upon return of each car at the termination of the lease. We have estimated total costs to rehabilitate the cars at September 30, 2020, to be approximately $1,452,600. This is based on our estimate of incurred damages as of the end of the fiscal year, on expected total car damages at the lease termination, and upon damage claims charged to industry peers with similar leasing arrangements. During the year ended September 30, 2020, we have recorded an expense in cost of goods sold of $298,000. We accrue the estimated cost of damage to the rail cars over the term of the lease, but because the actual cost is not finalized until the lease termination, it is reasonably possible that there will be a change in the estimate in the future.
Off-Balance Sheet Arrangements
We do not have any off-balance sheet arrangements.
ITEM 7A. QUANTITATIVE AND QUALITATIVE DISCLOSURES ABOUT MARKET RISK
We are exposed to the impact of market fluctuations associated with interest rates and commodity prices as discussed below. We have no exposure to foreign currency risk as all of our business is conducted in U.S. Dollars. We use derivative financial instruments as part of an overall strategy to manage market risk. We use cash, futures and option contracts to hedge changes to the commodity prices of corn and natural gas. We do not enter into these derivative financial instruments for trading or speculative purposes, nor do we designate these contracts as hedges for accounting purposes. We used derivative financial instruments to alter our exposure to interest rate risk.
Interest Rate Risk
38
Commodity Price Risk
We expect to be exposed to market risk from changes in commodity prices. Exposure to commodity price risk results from our dependence on corn in the ethanol production process and the sale of ethanol.
We seek to minimize the risks from fluctuations in the prices of raw material inputs, such as corn and natural gas, and finished products, such as ethanol and distillers grains, through the use of hedging instruments. In practice, as markets move, we
actively manage our risk and adjust hedging strategies as appropriate. Although we believe our hedge positions accomplish an economic hedge against our future purchases and sales, management has chosen not to use hedge accounting, which would match the gain or loss on our hedge positions to the specific commodity purchase being hedged. We are using fair value accounting for our hedge positions, which means as the current market price of our hedge positions changes, the realized or unrealized gains and losses are immediately recognized in our cost of goods sold or as an offset to revenues. The immediate recognition of hedging gains and losses can cause net income to be volatile from quarter to quarter due to the timing of the change in value of the derivative instruments relative to the cost and use of the commodity being hedged.
We enter into forward contracts for our commodity purchases and sales on a regular basis. It is our intent that, as we enter in to these contracts, we will use various hedging instruments to maintain a near even market position. For example, if we have 1 million bushels of corn under fixed price contracts we would generally expect to enter into a short hedge position to offset our price risk relative to those bushels we have under fixed price contracts. Because our ethanol marketing company is selling substantially all of the gallons it markets on a spot basis we also include the corn bushel equivalent of the ethanol we have produced that is inventory but not yet priced as bushels that need to be hedged.
At September 30, 2017,2020, we had a net longshort position of 210,00013,020,000 gallons of ethanol under derivative contracts used to hedge our future ethanol sales for various delivery periods through March 2018,December 2020, a net short (selling) position of 1,710,0005,246,418 bushels of corn under derivative contracts used to hedge our forward corn contracts, corn inventory and ethanol sales for various delivery periods through May 2019.July 2023. At September 30, 2017,2020, we had a net short (selling) position of 750,0001,841,854 bushels of soybeans under derivative contracts used to hedge its forward soybean purchase contracts that it had entered into for its new Trading Division. These derivatives have not been designated as an effective hedge for accounting purposes. There may be offsetting positions that are not shown on a net basis that could lower the notional amount of positions outstanding as disclosed above. At September 30, 2017,2020, we also had entered into certain forward purchase contracts for soybeans at fixed prices for which we elected to account for as derivatives. The following table provides details regarding the gains and (losses) from our derivative instruments in the statements of operations, none of which are designated as hedging instruments for the fiscal years ended September 30, 2017,2020, September 30, 20162019 and September 30, 2015:2018:
| Fiscal Year Ended | Fiscal Year Ended | Fiscal Year Ended | |||||||||
| September 30, 2020 | September 30, 2019 | September 30, 2018 | |||||||||
| Corn Derivative Contracts | $ | 2,196,868 | $ | (2,035,159) | $ | 1,994,778 | |||||
| Ethanol Derivative Contracts | (5,484,019) | 467,160 | (700,074) | ||||||||
| Natural Gas Derivative Contracts | — | 23,354 | 165,590 | ||||||||
| Soybean Derivative Contracts | (279,131) | 628,652 | 3,495,818 | ||||||||
| Soybean Forward Purchase and Sales Contracts Derivatives | 970,344 | 1,509,539 | (1,344,332) | ||||||||
| Totals | $ | (2,595,938) | $ | 593,546 | $ | 3,611,780 | |||||
| Fiscal Year Ended | Fiscal Year Ended | Fiscal Year Ended | |||||||
| September 30, 2017 | September 30, 2016 | September 30, 2015 | |||||||
| Corn Derivative Contracts | $ | 2,003,473 | $ | 6,134,582 | $ | 1,306,174 | |||
| Ethanol Derivative Contracts | 1,640,292 | (218,066 | ) | (677,043 | ) | ||||
| Natural Gas Derivative Contracts | 205,523 | (90,442 | ) | (68,635 | ) | ||||
| Soybean Derivative Contracts | 223,409 | — | — | ||||||
| Soybean Forward Purchase Contracts Derivatives | (327,005 | ) | — | ||||||
| Totals | $ | 3,745,692 | $ | 5,826,074 | $ | 560,496 | |||
At September 30, 2017,2020, we had forward corn purchase contracts at various fixed prices for various delivery periods through May 2019July 2023 for approximately 4.33%5.4% of our expected production needs for the next 2034 months. At September 30, 2017,2020, we also had forward dried distiller grains sales contracts at various fixed prices for various delivery periods through March 2018December 2020 for approximately 17.43%37.4% of expected production for the next 63 months and forward corn oil contracts at various prices for various delivery periods through December 20172021 for approximately 65.82%63.89% of expected production for the next 315 months. Also, at September 30, 2017,2020, we had forward natural gas contracts for approximately 29.28%82.6% of expected purchases for the next 25P13M months at various prices for various delivery periods through October 2019.2021. We had no forward ethanol sales contracts at fixed prices as of September 30, 2017.2020.
We began operating our Trading Division in late September 2017. In preparation for beginning those operations, we entered into forward purchases contracts for soybeans. At September 30, 2017,2020, the Company had soybean forward purchase and sales contracts at various fixed prices for various delivery periods through July 2018November 2021 for approximately 7.39%25.2% of its anticipated trading volume of that commodity for the next 1014 months.
39
As contracts are delivered, any gains or losses realized will be recognized in our gross margin. Due to the volatility and risk involved in the commodities market, we cannot be certain that these gains or losses will be realized.
As corn prices move in reaction to market trends and information, our income statement will be affected depending on the impact such market movements have on the value of our derivative instruments. Depending on market movements, crop
prospects and weather, these price protection positions may cause immediate adverse effects, but are expected to produce long-term positive growth for us.
A sensitivity analysis has been prepared to estimate our exposure to ethanol, distillers grains, corn oil, corn, natural gas and soybeans price risk. Market risk related to these factors is estimated as the potential change in income resulting from a hypothetical 10% adverse change in the average cost of our corn and natural gas and average ethanol, distillers grains, corn oil and soybeans prices as of September 30, 20172020 net of the forward and future contracts used to hedge our market risk. The volumes are based on our expected use, purchase and sale of these commodities for a one year period from September 30, 2017.2020. The results of this analysis, which may differ from actual results, are approximately as follows:
| Estimated Volume Requirements for the next 12 months (net of forward and futures contracts) | Unit of Measure | Hypothetical Adverse Change in Price as of September 30, 2020 | Approximate Adverse Change to Income | ||||||||||||||
| Natural Gas | 280,000 | MMBTU | 10 | % | $ | 50,960 | |||||||||||
| Ethanol | 135,000,000 | Gallons | 10 | % | $ | 18,495,000 | |||||||||||
| Corn | 25,387,665 | Bushels | 10 | % | $ | 9,571,150 | |||||||||||
| DDGs | 293,470 | Tons | 10 | % | $ | 4,695,520 | |||||||||||
| Corn Oil | 6,303,074 | Pounds | 10 | % | $ | 182,789 | |||||||||||
| Soybeans-Purchase | 3,528,221 | Bushels | 10 | % | $ | 3,514,108 | |||||||||||
| Soybeans-Sale | 4,370,000 | Bushels | 10 | % | $ | 4,439,920 | |||||||||||
| Estimated Volume Requirements for the next 12 months (net of forward and futures contracts) | Unit of Measure | Hypothetical Adverse Change in Price as of September 30, 2017 | Approximate Adverse Change to Income | ||||||
| Natural Gas | 1,262,500 | MMBTU | 10 | % | $ | 367,009 | |||
| Ethanol | 130,000,000 | Gallons | 10 | % | $ | 19,760,000 | |||
| Corn | 40,710,063 | Bushels | 10 | % | $ | 14,146,747 | |||
| DDGs | 295,837 | Tons | 10 | % | $ | 3,195,040 | |||
| Corn Oil | 23,165,660 | Pounds | 10 | % | $ | 671,804 | |||
| Soybeans | 8,445,899 | Bushels | 10 | % | $ | 7,766,004 | |||
For comparison purposes, the results of our sensitivity analysis as of September 30, 20162019, were approximately as follows:
| Estimated Volume Requirements for the next 12 months (net of forward and futures contracts) | Unit of Measure | Hypothetical Adverse Change in Price as of September 30, 2019 | Approximate Adverse Change to Income | ||||||||||||||
| Natural Gas | — | MMBTU | 10 | % | $ | — | |||||||||||
| Ethanol | 135,000,000 | Gallons | 10 | % | $ | 21,195,000 | |||||||||||
| Corn | 38,923,999 | Bushels | 10 | % | $ | 16,270,232 | |||||||||||
| DDGs | 298,385 | Tons | 10 | % | $ | 4,028,198 | |||||||||||
| Corn Oil | 28,492,820 | Pounds | 10 | % | $ | 712,321 | |||||||||||
| Soybeans - purchase | 4,382,866 | Bushels | 10 | % | $ | 3,817,476 | |||||||||||
| Soybeans - Sale | 4,999,701 | Bushels | 10 | % | $ | 4,414,736 | |||||||||||
| Estimated Volume Requirements for the next 12 months (net of forward and futures contracts) | Unit of Measure | Hypothetical Adverse Change in Price as of September 30, 2016 | Approximate Adverse Change to Income | ||||||
| Natural Gas | 1,969,000 | MMBTU | 10 | % | $ | 561,000 | |||
| Ethanol | 115,360,000 | Gallons | 10 | % | $ | 17,765,000 | |||
| Corn | 39,944,000 | Bushels | 10 | % | $ | 13,262,000 | |||
| DDGs | 288,000 | Tons | 10 | % | $ | 3,403,000 | |||
| Corn Oil | 26,766,000 | Pounds | 10 | % | $ | 763,000 | |||
Liability Risk
We participate in a captive reinsurance company (the “Captive”“Captive”). The Captive reinsures losses related to worker's compensation, commercial property and general liability. Premiums are accrued by a charge to income for the period to which the premium relates and is remitted by our insurer to the captive reinsurer. The Captive reinsures catastrophic losses in excess of a predetermined amount. Our premiums are structured such that we have made a prepaid collateral deposit estimated for losses related to the above coverage. The Captive insurer has estimated and collected an amount in excess of the estimated losses but less than the catastrophic loss limit insured by the Captive. We cannot be assessed in excess of the amount in the collateral fund.
40
ITEM 8. FINANCIAL STATEMENTS AND SUPPLEMENTARY DATA


REPORT OF INDEPENDENT REGISTERED PUBLIC ACCOUNTING FIRM
To the Board of Directors and
Members of Cardinal Ethanol, LLC
Opinion on the Financial Statements
We have audited the accompanying balance sheets of Cardinal Ethanol, LLC (the Company) as of September 30, 20172020 and 2016,2019, and the related statements of operations, cash flows and changes in members'members’ equity, and cash flows for each of the fiscal years in the three-year period ended September 30, 2017. Cardinal Ethanol, LLC's management is responsible2020, and the related notes (collectively referred to as the financial statements). In our opinion, the financial statements present fairly, in all material respects, the financial position of the Company as of September 30, 2020 and 2019, and the results of its operations and its cash flows for theseeach of the years in the three-year period ended September 30, 2020, in conformity with accounting principles generally accepted in the United States of America.
Basis for Opinion
These financial statements.statements are the responsibility of the Company’s management. Our responsibility is to express an opinion on thesethe Company’s financial statements based on our audits. We are a public accounting firm registered with the Public Company Accounting Oversight Board (United States) (PCAOB) and are required to be independent with respect to the Company in accordance with the U.S. federal securities laws and the applicable rules and regulations of the Securities and Exchange Commission and the PCAOB.
We conducted our audits in accordance with the standards of the Public Company Accounting Oversight Board (United States).PCAOB. Those standards require that we plan and perform the audit to obtain reasonable assurance about whether the financial statements are free of material misstatement.misstatement, whether due to error or fraud. The Company is not required to have, nor were we engaged to perform, an audit of its internal control over financial reporting. Our audit included considerationAs part of our audits, we are required to obtain an understanding of internal control over financial reporting, as a basis for designing audit procedures that are appropriate in the circumstances, but not for the purpose of expressing an opinion on the effectiveness of the company'sCompany’s internal control over financial reporting. Accordingly, we express no such opinion. An audit also includes
Our audits included performing procedures to assess the risks of material misstatement of the financial statements, whether due to error or fraud, and performing procedures that respond to those risks. Such procedures included examining, on a test basis, evidence supportingregarding the amounts and disclosures in the financial statements, assessingstatements. Our audits also included evaluating the accounting principles used and significant estimates made by management, as well as evaluating the overall presentation of the financial statement presentation.statements. We believe that our audits provide a reasonable basis for our opinion.
/s/ Boulay PLLP
Minneapolis, Minnesota
November 22, 201718, 2020
41
CARDINAL ETHANOL, LLC
Balance Sheets
| ASSETS | September 30, 2020 | September 30, 2019 | |||||||||
| Current Assets | |||||||||||
| Cash | $ | 12,950,558 | $ | 15,670,696 | |||||||
| Restricted cash | 3,963,424 | 6,363,424 | |||||||||
| Trade accounts receivable | 9,174,937 | 12,824,985 | |||||||||
| Miscellaneous receivables | 813,060 | 1,380,649 | |||||||||
| Inventories | 17,318,700 | 13,439,808 | |||||||||
| Prepaid and other current assets | 186,761 | 130,464 | |||||||||
| Futures & options derivatives | 0 | 221,947 | |||||||||
| Forward purchase/sales derivatives | 1,115,299 | 90,815 | |||||||||
| Total current assets | 45,522,739 | 50,122,788 | |||||||||
| Property, Plant, and Equipment | |||||||||||
| Land and land improvements | 22,522,222 | 22,507,849 | |||||||||
| Plant and equipment | 157,826,345 | 156,159,960 | |||||||||
| Building | 8,715,364 | 7,018,061 | |||||||||
| Office equipment | 915,758 | 915,758 | |||||||||
| Vehicles | 31,928 | 31,928 | |||||||||
| Construction in process | 738,689 | 1,031,021 | |||||||||
| 190,750,306 | 187,664,577 | ||||||||||
| Less accumulated depreciation | (112,747,129) | (101,495,498) | |||||||||
| Property, Plant, and Equipment, Net | 78,003,177 | 86,169,079 | |||||||||
| Other Assets | |||||||||||
| Operating lease right of use asset, net | 4,951,592 | 0 | |||||||||
| Investment | 1,259,770 | 1,259,770 | |||||||||
| Total other assets | 6,211,362 | 1,259,770 | |||||||||
| Total Assets | $ | 129,737,278 | $ | 137,551,637 | |||||||
| ASSETS | September 30, 2017 | September 30, 2016 | |||||
| Current Assets | |||||||
| Cash | $ | 18,995,755 | $ | 23,002,139 | |||
| Restricted cash | 401,406 | 1,460,772 | |||||
| Trade accounts receivable | 15,006,093 | 11,574,847 | |||||
| Miscellaneous receivables | 384,508 | 135,517 | |||||
| Inventories | 14,604,975 | 12,093,469 | |||||
| Prepaid and other current assets | 253,791 | 248,999 | |||||
| Commodity derivative instruments | 492,842 | 14,100 | |||||
| Total current assets | 50,139,370 | 48,529,843 | |||||
| Property, Plant, and Equipment | |||||||
| Land and land improvements | 22,454,661 | 21,124,597 | |||||
| Plant and equipment | 156,035,099 | 144,157,818 | |||||
| Building | 7,018,061 | 7,018,061 | |||||
| Office equipment | 814,842 | 648,256 | |||||
| Vehicles | 31,928 | 31,928 | |||||
| Construction in process | 1,522,246 | 544,687 | |||||
| 187,876,837 | 173,525,347 | ||||||
| Less accumulated depreciation | (79,940,448 | ) | (69,064,269 | ) | |||
| Property, Plant, and Equipment, Net | 107,936,389 | 104,461,078 | |||||
| Other Assets | |||||||
| Investment | 1,096,237 | 938,251 | |||||
| Total other assets | 1,096,237 | 938,251 | |||||
| Total Assets | $ | 159,171,996 | $ | 153,929,172 | |||
Notes to Financial Statements are an integral part of this Statement.
42
CARDINAL ETHANOL, LLC
Balance Sheets
| LIABILITIES AND MEMBERS' EQUITY | September 30, 2020 | September 30, 2019 | |||||||||
| Current Liabilities | |||||||||||
| Contract liability | $ | 15,000 | $ | 0 | |||||||
| Accounts payable | 4,154,598 | 2,712,760 | |||||||||
| Accounts payable - grain | 5,673,785 | 10,624,278 | |||||||||
| Accrued expenses | 1,407,746 | 1,249,467 | |||||||||
| Due to broker | 0 | 1,589,324 | |||||||||
| Futures & options derivatives | 2,051,928 | 1,045,113 | |||||||||
| Forward purchase/sales derivatives | 225,909 | 171,770 | |||||||||
| Operating lease liability current | 2,638,003 | 0 | |||||||||
| Current maturities of long-term debt | 275,840 | 1,428,571 | |||||||||
| Total current liabilities | 16,442,809 | 18,821,283 | |||||||||
| Long-Term Liabilities | |||||||||||
| Long-term debt, net of current maturities | 580,825 | 5,297,151 | |||||||||
| Operating lease long-term liabilities | 2,313,694 | 0 | |||||||||
| Liability for railcar rehabilitation costs | 1,452,600 | 1,154,520 | |||||||||
| Total long-term liabilities | 4,347,119 | 6,451,671 | |||||||||
| Commitments and Contingencies | 0 | 0 | |||||||||
| Members’ Equity | |||||||||||
Member contributions net of cost of raising capital, 14,606 units authorized, issued and outstanding | 70,912,213 | 70,912,213 | |||||||||
| Retained earnings | 38,035,137 | 41,366,470 | |||||||||
| Total members' equity | 108,947,350 | 112,278,683 | |||||||||
| Total Liabilities and Members’ Equity | $ | 129,737,278 | $ | 137,551,637 | |||||||
| LIABILITIES AND MEMBERS' EQUITY | September 30, 2017 | September 30, 2016 | |||||
| Current Liabilities | |||||||
| Accounts payable | $ | 3,983,923 | $ | 2,472,212 | |||
| Accounts payable-corn | 8,378,095 | 4,761,547 | |||||
| Accrued expenses | 1,381,734 | 1,213,753 | |||||
| Commodity derivative instruments | 513,829 | 341,050 | |||||
| Current maturities of long-term debt | 3,749,826 | 2,888,290 | |||||
| Total current liabilities | 18,007,407 | 11,676,852 | |||||
| Long-Term Debt | 14,581,758 | 11,932,063 | |||||
| Commitments and Contingencies | |||||||
| Members’ Equity | |||||||
| Member contributions net of cost of raising capital, 14,606 units authorized, issued and outstanding | 70,912,213 | 70,912,213 | |||||
| Retained earnings | 55,670,618 | 59,408,044 | |||||
| Total members' equity | 126,582,831 | 130,320,257 | |||||
| Total Liabilities and Members’ Equity | $ | 159,171,996 | $ | 153,929,172 | |||
Notes to Financial Statements are an integral part of this Statement.
43
CARDINAL ETHANOL, LLC
Statements of Operations
| Fiscal Year Ended | Fiscal Year Ended | Fiscal Year Ended | ||||||||||||||||||
| September 30, 2020 | September 30, 2019 | September 30, 2018 | ||||||||||||||||||
| Revenues | $ | 244,718,562 | $ | 260,669,352 | $ | 266,858,452 | ||||||||||||||
| Cost of Goods Sold | 239,426,482 | 260,633,708 | 251,670,473 | |||||||||||||||||
| Gross Profit | 5,292,080 | 35,644 | 15,187,979 | |||||||||||||||||
| Operating Expenses | 6,773,264 | 6,938,893 | 6,778,756 | |||||||||||||||||
| Operating Income (Loss) | (1,481,184) | (6,903,249) | 8,409,223 | |||||||||||||||||
| Other Income (Expense) | ||||||||||||||||||||
| Interest expense | (180,348) | (358,950) | (858,725) | |||||||||||||||||
| Miscellaneous income | 521,099 | 663,286 | 80,567 | |||||||||||||||||
| Total | 340,751 | 304,336 | (778,158) | |||||||||||||||||
| Net Income (Loss) | $ | (1,140,433) | $ | (6,598,913) | $ | 7,631,065 | ||||||||||||||
| Weight Average Units Outstanding - basic and diluted | 14,606 | 14,606 | 14,606 | |||||||||||||||||
| Net Income (Loss) Per Unit - basic and diluted | $ | (78) | $ | (452) | $ | 522 | ||||||||||||||
| Distributions Per Unit | $ | 150 | $ | 100 | $ | 950 | ||||||||||||||
| Fiscal Year Ended | Fiscal Year Ended | Fiscal Year Ended | ||||||||||
| September 30, 2017 | September 30, 2016 | September 30, 2015 | ||||||||||
| Revenues | $ | 228,496,827 | $ | 222,895,449 | $ | 240,695,293 | ||||||
| Cost of Goods Sold | 209,241,617 | 204,014,877 | 197,305,291 | |||||||||
| Gross Profit | 19,255,210 | 18,880,572 | 43,390,002 | |||||||||
| Operating Expenses | 5,520,971 | 5,233,634 | 4,714,891 | |||||||||
| Operating Income | 13,734,239 | 13,646,938 | 38,675,111 | |||||||||
| Other Income (Expense) | ||||||||||||
| Interest income | — | 250 | — | |||||||||
| Interest expense | (362,188 | ) | (185,870 | ) | (2,162 | ) | ||||||
| Miscellaneous income | 52,573 | 60,477 | 48,868 | |||||||||
| Total | (309,615 | ) | (125,143 | ) | 46,706 | |||||||
| Net Income | $ | 13,424,624 | $ | 13,521,795 | $ | 38,721,817 | ||||||
| Weight Average Units Outstanding - basic and diluted | 14,606 | 14,606 | 14,606 | |||||||||
| Net Income Per Unit - basic and diluted | $ | 919 | $ | 926 | $ | 2,651 | ||||||
| Distributions Per Unit | $ | 1,175 | $ | 1,630 | $ | 3,500 | ||||||
Notes to Financial Statements are an integral part of this Statement.
44
CARDINAL ETHANOL, LLC
Statements of Cash Flows
| Fiscal Year Ended | Fiscal Year Ended | Fiscal Year Ended | |||||||||||||||
| September 30, 2020 | September 30, 2019 | September 30, 2018 | |||||||||||||||
| Cash Flows from Operating Activities | |||||||||||||||||
| Net income (loss) | $ | (1,140,433) | $ | (6,598,913) | $ | 7,631,065 | |||||||||||
| Adjustments to reconcile net income (loss) to net cash provided by operations: | |||||||||||||||||
| Depreciation | 11,251,736 | 11,242,289 | 11,624,076 | ||||||||||||||
| Change in fair value of commodity derivative instruments | 258,417 | (679,052) | 1,562,186 | ||||||||||||||
| Loss (gain) on disposal of fixed asset | 0 | 1,218 | (9,560) | ||||||||||||||
| Loss of abandonment of equipment - ethanol division | 0 | 1,197,917 | 0 | ||||||||||||||
| Non-cash dividend income | 0 | 0 | (198,955) | ||||||||||||||
| Investment redemption | 0 | 35,422 | 0 | ||||||||||||||
| Change in operating assets and liabilities: | |||||||||||||||||
| Trade accounts receivables | 3,650,048 | (3,285,978) | 5,467,086 | ||||||||||||||
| Miscellaneous receivable | 567,589 | (860,928) | (135,213) | ||||||||||||||
| Inventories | (3,878,892) | 3,112,792 | (1,947,625) | ||||||||||||||
| Prepaid and other current assets | (56,297) | 40,489 | 82,838 | ||||||||||||||
| Contract liability | 15,000 | 0 | 0 | ||||||||||||||
| Accounts payable | 1,152,561 | 16,713 | 165,294 | ||||||||||||||
| Accounts payable-grain | (4,950,493) | 1,026,456 | 1,219,727 | ||||||||||||||
| Accrued expenses | 158,279 | (40,462) | (91,805) | ||||||||||||||
| Liability for railcar rehabilitation costs | 298,080 | 1,154,520 | 0 | ||||||||||||||
| Due to broker | (1,589,324) | 1,589,324 | 0 | ||||||||||||||
| Net cash provided by operating activities | 5,736,271 | 7,951,807 | 25,369,114 | ||||||||||||||
| Cash Flows from Investing Activities | |||||||||||||||||
| Capital expenditures | (14,372) | 0 | (118,953) | ||||||||||||||
| Payments for construction in process | (2,782,080) | (3,981,163) | (1,955,484) | ||||||||||||||
| Proceeds from sale of equipment | 0 | 3,800 | 10,000 | ||||||||||||||
| Development agreement funds received for capital expenditures | 0 | 2,300,000 | 0 | ||||||||||||||
| Net cash used for investing activities | (2,796,452) | (1,677,363) | (2,064,437) | ||||||||||||||
| Cash Flows from Financing Activities | |||||||||||||||||
| Distributions paid | (2,190,900) | (1,460,600) | (13,875,700) | ||||||||||||||
| Proceeds from line of credit | 0 | 5,541,948 | 10,349,708 | ||||||||||||||
| Repayment on line of credit | 0 | (5,541,948) | (10,349,708) | ||||||||||||||
| Proceeds from long-term debt | 856,665 | 0 | 3,524,048 | ||||||||||||||
| Payments on long-term debt | (6,725,722) | (2,017,716) | (13,112,194) | ||||||||||||||
| Net cash used for financing activities | (8,059,957) | (3,478,316) | (23,463,846) | ||||||||||||||
45
| Fiscal Year Ended | Fiscal Year Ended | Fiscal Year Ended | |||||||||
| September 30, 2017 | September 30, 2016 | September 30, 2015 | |||||||||
| Cash Flows from Operating Activities | |||||||||||
| Net income | $ | 13,424,624 | $ | 13,521,795 | $ | 38,721,817 | |||||
| Adjustments to reconcile net income to net cash provided by operations: | |||||||||||
| Depreciation | 10,876,179 | 9,698,309 | 9,006,994 | ||||||||
| Change in fair value of commodity derivative instruments | (3,745,692 | ) | (5,826,074 | ) | (560,496 | ) | |||||
| Gain on disposal of fixed asset | (6,600 | ) | — | (11,827 | ) | ||||||
| Non-cash dividend income | (157,986 | ) | (114,757 | ) | (104,941 | ) | |||||
| Change in operating assets and liabilities: | |||||||||||
| Trade accounts receivables | (3,431,246 | ) | 387,510 | 9,803,944 | |||||||
| Miscellaneous receivable | (248,991 | ) | 249,188 | (378,737 | ) | ||||||
| Inventories | (2,511,506 | ) | 1,660,983 | (6,329,053 | ) | ||||||
| Prepaid and other current assets | (4,792 | ) | 257,198 | 23,264 | |||||||
| Commodity derivative instruments | 3,439,729 | 6,084,545 | 1,032,359 | ||||||||
| Accounts payable | 1,511,712 | (1,144,090 | ) | 472,468 | |||||||
| Accounts payable-corn | 3,616,548 | (1,995,627 | ) | 698,647 | |||||||
| Accrued expenses | (1,226,737 | ) | 428,512 | (2,172,452 | ) | ||||||
| Net cash provided by operating activities | 21,535,242 | 23,207,492 | 50,201,987 | ||||||||
| Cash Flows from Investing Activities | |||||||||||
| Capital expenditures | (571,366 | ) | (6,452,884 | ) | (27,686 | ) | |||||
| Payments for construction in process | (12,385,407 | ) | (478,123 | ) | (10,531,521 | ) | |||||
| Proceeds from sale of equipment | 6,600 | — | 35,000 | ||||||||
| Net cash used for investing activities | (12,950,173 | ) | (6,931,007 | ) | (10,524,207 | ) | |||||
| Cash Flows from Financing Activities | |||||||||||
| Distributions paid | (17,162,050 | ) | (23,807,781 | ) | (51,121,002 | ) | |||||
| Proceeds from long-term debt | 6,475,952 | 10,134,764 | 4,865,236 | ||||||||
| Payments on long-term debt | (2,964,721 | ) | (179,647 | ) | — | ||||||
| Net cash used for financing activities | (13,650,819 | ) | (13,852,664 | ) | (46,255,766 | ) | |||||
| Net Increase (Decrease) in Cash and Restricted Cash | (5,065,750 | ) | 2,423,821 | (6,577,986 | ) | ||||||
| Cash and Restricted Cash – Beginning of Period | 24,462,911 | 22,039,090 | 28,617,076 | ||||||||
| Cash and Restricted Cash – End of Period | $ | 19,397,161 | $ | 24,462,911 | $ | 22,039,090 | |||||
Statements of Cash Flows
| Fiscal Year Ended | Fiscal Year Ended | Fiscal Year Ended | |||||||||||||||
| September 30, 2020 | September 30, 2019 | September 30, 2018 | |||||||||||||||
| Net Increase (Decrease) in Cash and Restricted Cash | (5,120,138) | 2,796,128 | (159,169) | ||||||||||||||
| Cash and Restricted Cash – Beginning of Period | 22,034,120 | 19,237,992 | 19,397,161 | ||||||||||||||
| Cash and Restricted Cash – End of Period | $ | 16,913,982 | $ | 22,034,120 | $ | 19,237,992 | |||||||||||
| Reconciliation of Cash and Restricted Cash | |||||||||||||||||
| Cash - Balance Sheet | $ | 12,950,558 | $ | 15,670,696 | $ | 17,989,013 | |||||||||||
| Restricted Cash - Balance Sheet | 3,963,424 | 6,363,424 | 1,248,979 | ||||||||||||||
| Cash and Restricted Cash | $ | 16,913,982 | $ | 22,034,120 | $ | 19,237,992 | |||||||||||
| Supplemental Cash Flow Information | |||||||||||||||||
| Interest paid | $ | 259,451 | $ | 436,196 | $ | 883,972 | |||||||||||
| Supplemental Disclosure of Noncash Investing and Financing Activities | |||||||||||||||||
| Construction costs included in accrued expenses and accounts payable | $ | 301,724 | $ | 12,447 | $ | 23,643 | |||||||||||
| Construction period interest capitalized in property, plant and equipment | $ | 44,927 | $ | 67,231 | $ | 14,912 | |||||||||||
Notes to Financial Statements are an integral part of this Statement.
46
CARDINAL ETHANOL, LLC
Statements of Cash FlowsChanges in Members' Equity
| Member | Retained | ||||||||||||||||
| Contributions | Earnings | ||||||||||||||||
| Balance - September 30, 2017 | $ | 70,912,213 | $ | 55,670,618 | |||||||||||||
| Net income for year ended September 30, 2018 | 0 | 7,631,065 | |||||||||||||||
| Members Distributions | 0 | (13,875,700) | |||||||||||||||
| Balance - September 30, 2018 | 70,912,213 | 49,425,983 | |||||||||||||||
| Net loss for year ended September 30, 2019 | 0 | (6,598,913) | |||||||||||||||
| Members Distributions | 0 | (1,460,600) | |||||||||||||||
| Balance - September 30, 2019 | 70,912,213 | 41,366,470 | |||||||||||||||
| Net loss for year ended September 30, 2020 | 0 | (1,140,433) | |||||||||||||||
| Member Distributions | 0 | (2,190,900) | |||||||||||||||
| Balance - September 30, 2020 | $ | 70,912,213 | $ | 38,035,137 | |||||||||||||
| Fiscal Year Ended | Fiscal Year Ended | Fiscal Year Ended | |||||||||
| September 30, 2017 | September 30, 2016 | September 30, 2015 | |||||||||
| Reconciliation of Cash and Restricted Cash | |||||||||||
| Cash - Balance Sheet | $ | 18,995,755 | $ | 23,002,139 | $ | 20,827,614 | |||||
| Restricted Cash - Balance Sheet | 401,406 | 1,460,772 | 1,211,476 | ||||||||
| Cash and Restricted Cash | $ | 19,397,161 | $ | 24,462,911 | $ | 22,039,090 | |||||
| Supplemental Cash Flow Information | |||||||||||
| Interest paid | $ | 613,856 | $ | 320,323 | $ | — | |||||
| Supplemental Disclosure of Noncash Investing and Financing Activities | |||||||||||
| Construction costs included in accrued expenses and accounts payable | $ | 1,461,282 | $ | 66,564 | $ | 836,609 | |||||
| Construction period interest capitalized in property, plant and equipment | $ | 263,261 | $ | 174,594 | $ | — | |||||
Notes to Financial Statements are an integral part of this Statement.
47
CARDINAL ETHANOL, LLC
| Member | Retained | ||||||||
| Contributions | Earnings | ||||||||
| Balance - September 30, 2014 | $ | 70,912,213 | $ | 82,093,215 | |||||
| Net income for year ended September 30, 2015 | — | 38,721,817 | |||||||
| Members Distributions | — | (51,121,002 | ) | ||||||
| Balance - September 30, 2015 | 70,912,213 | 69,694,030 | |||||||
| Net income for year ended September 30, 2016 | — | 13,521,795 | |||||||
| Members Distributions | — | (23,807,781 | ) | ||||||
| Balance - September 30, 2016 | 70,912,213 | 59,408,044 | |||||||
| Net income for year ended September 30, 2017 | — | 13,424,624 | |||||||
| Members Distributions | — | (17,162,050 | ) | ||||||
| Balance - September 30, 2017 | $ | 70,912,213 | $ | 55,670,618 | |||||
Notes to Audited Financial Statements
September 30, 20172020 and 2016
2019
1. SUMMARY OF SIGNIFICANT ACCOUNTING POLICIES
Nature of Business
Cardinal Ethanol, LLC, (the “Company”“Company”) is an Indiana limited liability company currently producing fuel-grade ethanol, distillers grains, corn oil and carbon dioxide near Union City, Indiana and sells these products throughout the continental United States. During the fiscal years ended September 30, 2017, 20162020, 2019 and 2015,2018, the Company produced approximately 125,443,000, 119,815,000129,100,000, 130,700,000 and 117,000,000130,500,000 gallons of ethanol, respectively.
Fiscal Reporting Period
The Company has adopted a fiscal year ending September 30 for reporting financial operations and a year ending December 31 for tax return purposes.
Reportable Segments
Accounting Standards Codification (“ASC”) 280, “Segment Reporting,” establishes the standards for reporting information about segments in financial statements. Operating segments are defined as components of an enterprise for which separate financial information is available that are evaluated regularly by the chief operating decision maker in deciding how to allocate resources and in assessing performance. Based on the related business nature and expected financial results criteria set forth in ASC 280, the Company has 2 reportable operating segments for financial reporting purposes.
•Ethanol Production Division. Based on the nature of the products and production process and the expected financial results, the Company’s operations at its ethanol plant, including the production and sale of ethanol and its co-products, are aggregated into one financial reporting segment.
•Trading Division. The Company has a grain loading facility within the Company's single site to buy, hold and sell inventories of agricultural grains, primarily soybeans. The Company performs no additional processing of these grains, unlike the corn inventory the Company holds and uses in ethanol production. The activities of buying, selling and holding of grains other than for ethanol and co-product production comprise this financial reporting segment.
Accounting Estimates
Management uses estimates and assumptions in preparing these financial statements in accordance with generally accepted accounting principles. Those estimates and assumptions affect the reported amounts of assets and liabilities, the disclosure of contingent assets and liabilities, and the reported revenues and expenses. The Company uses estimates and assumptions in accounting for the following significant matters, among others; the useful lives of fixed assets, the valuation of basisinventory purchase and delay price contracts on corn purchases,sale commitments derivatives, inventory,inventories, patronage dividends,equities, long-lived assets, liability for railcar rehabilitation costs and inventory purchase commitments. Actual results may differ from previously estimated amounts, and such differences may be material to the financial statements. The Company periodically reviews estimates and assumptions, and the effects of revisions are reflected in the period in which the revision is made.
Cash
The Company maintains its accounts primarily at two financial institutions. At times throughout the year the Company's cash balances may exceed amounts insured by the Federal Deposit Insurance Corporation.
Restricted Cash
As a part of its commodities hedging activities, the companyCompany is required to maintain cash balances with ourits commodities trading companies for initial and maintenance margins on a per futures contract basis. Changes in the market value of contracts may increase these requirements. As the futures contracts expire, the margin requirements also expire. Accordingly, we recordthe Company
48
CARDINAL ETHANOL, LLC
Notes to Audited Financial Statements
September 30, 2020 and 2019
records the cash maintained with the traders in the margin accounts as restricted cash. Since this cash is immediately available to us upon request when there is a margin excess, we considerthe Company considers this restricted cash to be a current asset.
Trade Accounts Receivable
Credit terms are extended to customers in the normal course of business. The Company performs ongoing credit evaluations of its customers' financial condition and, generally, requires no collateral. Accounts receivable are recorded at their estimated net realizable value. Accounts are considered past due if payment is not made on a timely basis in accordance with the Company's credit terms. Amounts considered uncollectible are written off. The Company's estimate of the allowance for doubtful accounts is based on historical experience, its evaluation of the current status of receivables, and unusual circumstances, if any. At September 30, 20172020 and 2016,2019, the Company determined that an allowance for doubtful accounts was not necessary.
Inventories
Trading Division (see Reportable Segments) inventories consist of grain. Soybeans were the only grains held and traded at September 30, 2020 and 2019. These inventories are stated at market value less estimated selling costs, which may include reductions for quality.
Property, Plant and Equipment
Property, plant, and equipment are stated at cost. Depreciation is provided over estimated useful lives by use of the straight line depreciation method. Maintenance and repairs are expensed as incurred; major improvements and betterments are capitalized. Construction in process expenditures will be depreciated using the straight-line method over their estimated useful lives once the assets are placed into service.
| Minimum years | Maximum years | |||||||
| Land improvements | 15 | 20 | ||||||
| Office building | 10 | 40 | ||||||
| Office equipment | 5 | 5 | ||||||
| Process and grain handling equipment | 10 | 20 | ||||||
| Plant buildings | 15 | 40 | ||||||
Long-Lived Assets
The Company reviews its long-lived assets, such as property, plant and equipment and financing costs, subject to depreciation and amortization, for impairment whenever events or changes in circumstances indicate that the carrying amount of an asset may not be recoverable. If circumstances require a long-lived asset be tested for possible impairment, the Company first compares undiscounted cash flows expected to be generated by an asset to the carrying value of the asset. If the carrying value of the long-lived asset is not recoverable on an undiscounted cash flow basis, impairment is recognized to the extent that the carrying value exceeds its fair value. Fair value is determined through various valuation techniques including discounted cash flow models, quoted market values and third-party independent appraisals, as considered necessary. Management evaluated and determined 0 impairment write-downs were considered necessary for the fiscal years ending September 30, 2020 and September 30, 2019.
49
CARDINAL ETHANOL, LLC
Notes to Audited Financial Statements
September 30, 2020 and 2019
Investments
Investments consist of the capital stock and patron equities of the Company's distillers grains marketer. The investments are stated at the lower of cost or fair value and adjusted for non cash patronage equities received. Patronage dividends are recognized when received and included within revenue in the statements of operations.
Revenue Recognition
Revenue is recognized upon transfer of control of promised products or services to customers in an amount that reflects the consideration we expect to receive in exchange for those products or services. The Company's contracts primarily consist of agreements with marketing companies and other customers as described below. The Company's performance obligations consist of the delivery of ethanol, distillers' grains, corn oil, soybeans and carbon dioxide to its customers. The consideration the Company receives for these products is fixed based on current observable market prices at the Chicago Mercantile Exchange, generally, and adjusted for local market differentials. The Company's contracts have specific delivery modes, rail or truck, and dates. Revenue is recognized when the Company delivers the products to the mode of transportation specified in the contract, at the transaction price established in the contract, net of commissions, fees, and freight. The Company generally sells each of the products via different marketing channels as described below.
•Ethanol. The Company sells its ethanol via a marketing agreement with Murex, LLC. Murex buys one hundred percent of the Company's ethanol production based on agreements with end users at prices agreed upon mutually among the end user, Murex and related products pursuantthe Company. Murex then provides a schedule of deliveries required and an order for each rail car or tankers needed to fulfill their commitment with the end user. These are individual performance obligations of the Company. The marketing agreements. Revenuesagreement calls for control and title to pass when the delivery vehicle is filled. Revenue is recognized then at the price in the agreement with the end user, net of commissions, freight, and insurance.
•Distillers grains. The Company engages another third-party marketing company, CHS, Inc. to sell one hundred percent of the distillers grains it produces at the plant. The process for selling the distillers grains is like that of ethanol, except that CHS takes title and control once a rail car is released to the railroad or a truck is released from the Company's scales.
•Distillers corn oil (corn oil). The Company sells its production of ethanolcorn oil directly to commercial customers. The customer is provided with a delivery schedule and the related productspick up orders representing performance obligations are recordedfulfilled when the customer has taken title and assumedcustomer's driver picks up the risks and rewards of ownership, prices are fixed or determinable and collectabilityscheduled load. The price is reasonably assured. The Company believes that there are no ethanol sales, during any given month, which should be considered contingent and recorded as deferred revenue. The Company's products are sold Free on Board (FOB) shipping point.
•Carbon dioxide. The Company sells a portion of the carbon dioxide it produces to a customer that maintains a plant on-site for a set price per ton. Delivery is defined as transference of the yearsgas from our stream to their plant.
•Soybeans and other grains. The Company sells soybeans exclusively to commercial mills, processors or grain traders. Contracts are negotiated directly with the parties at prices based on negotiated prices.
•Other. The Company engaged in ethanol sales to be processed for sanitizer during the fiscal year ended September 30, 2017, 20162020 as a result of a direct domestic need from COVID-19. The Company has since discontinued ethanol for sanitizer sales.
Cost of Goods Sold
Cost of goods sold include corn, trading division grains, natural gas and 2015, respectively. Freight was approximately $10,027,000, $8,637,000 and $9,362,000 for the years ended September 30, 2017, 2016 and 2015, respectively. Revenue is recorded net of these commissions and freight as they do not provide an identifiable benefit that is sufficiently separable from the saleother components which includes processing ingredients, electricity, railcar maintenance, depreciation of ethanol production fixed assets and related products.
wages, salaries and benefits of production personnel.
50
CARDINAL ETHANOL, LLC
Notes to Audited Financial Statements
September 30, 20172020 and 2016
2019
Operating Expense
Operating expenses include wages, salaries and benefits of administrative employees at the plant, insurance, professional fees, depreciation of trading division fixed assets, property taxes and similar costs.
Derivative Instruments
From time to time the Company enters into derivative transactions to hedge its exposures to commodity price fluctuations. The Company is required to record these derivatives in the balance sheet at fair value.
In order for a derivative to qualify as a hedge, specific criteria must be met and appropriate documentation maintained. Gains and losses from derivatives that do not qualify as hedges, or are undesignated, must be recognized immediately in earnings. If the derivative does qualify as a hedge, depending on the nature of the hedge, changes in the fair value of the derivative will be either offset against the change in fair value of the hedged assets, liabilities, or firm commitments through earnings or recognized in other comprehensive income until the hedged item is recognized in earnings. Changes in the fair value of undesignated derivatives are recorded in the statement of operations, depending on the item being hedged.
Additionally, the Company is required to evaluate its contracts to determine whether the contracts are derivatives. Certain contracts that literally meet the definition of a derivative may be exempted as “normal“normal purchases or normal sales”sales”. Normal purchases and normal sales are contracts that provide for the purchase or sale of something other than a financial instrument or derivative instrument that will be delivered in quantities expected to be used or sold over a reasonable period in the normal course of business. Contracts that meet the requirements of normal purchases or sales are documented as normal and exempted from accounting and reporting requirements, and therefore, are not marked to market in our financial statements. The Company has elected for its Ethanol Division to apply the normal purchase and normal sale exemption to all forward commodity contracts except for its Trading Division.contracts. For the Trading Division, the Company has elected not to apply the normal purchase normal sale exemption to its forward purchase and sales contracts and therefore treats them asmarks these derivative instruments.instruments to market.
Fair Value of Financial Instruments
The Company follows guidance for accounting for fair value measurements of financial assets and financial liabilities and for fair value measurements of nonfinancial items that are recognized or disclosed at fair value in the financial statements on a recurring and nonrecurring basis. The guidance establishes a fair value hierarchy that prioritizes the inputs to valuation techniques used to measure fair value. The hierarchy gives the highest priority to unadjusted quoted prices in active markets for identical assets or liabilities (Level 1 measurements) and the lowest priority to measurements involving significant unobservable inputs (Level 3 measurements). The three levels of the fair value hierarchy are as follows:
•Level 1 inputs are quoted prices (unadjusted) in active markets for identical assets or liabilities that the Company has the ability to access at the measurement date.
•Level 2 inputs are inputs other than quoted prices included within Level 1 that are observable for the asset or liability, either directly or indirectly, for substantially the full term of the asset or liability.
•Level 3 inputs are unobservable inputs for the asset or liability.liability used to measure fair values to the extent that observable inputs are not available, thereby allowing for situations in which there is little, if any, market activity for the asset or liability at measurement date.
The level in the fair value hierarchy within which a fair measurement in its entirety falls is based on the lowest level input that is significant to the fair value measurement in its entirety.
The carrying value of cash, restricted cash, trade accounts receivable, miscellaneous accounts receivable, accounts payable, accounts payable-grain, contract liability and accrued liabilitiesexpenses approximates fair value at September 30, 20172020 and 20162019 due to the short maturity nature of these instruments. The fair value of derivative instruments, Trading Division inventory, and debt is disclosed in Note 7.8.
51
CARDINAL ETHANOL, LLC
Notes to Audited Financial Statements
September 30, 2020 and 2019
Except for those assets and liabilities, which are required by authoritative accounting guidance to be recorded at fair value on our balance sheets, the Company has elected not to record any other assets or liabilities at fair value. No events occurred during the fiscal years ended September 30, 2017,2020, 2019, or 20162018 that required adjustment to the recognized balances of assets or liabilities, which are recorded at fair value on a nonrecurring basis.
Environmental Liabilities
The Company's operations are subject to environmental laws and regulations adopted by various governmental entities in the jurisdiction in which it operates. These laws require the Company to investigate and remediate the effects of the release or disposal of materials at its location. Accordingly, the Company has adopted policies, practices and procedures in the areas of pollution control, occupational health, and the production, handling, storage and use of hazardous materials to prevent material environmental
or other damage, and to limit the financial liability, which could result from such events. Environmental liabilities are recorded when the liability is probable and the costs can be reasonably estimated. NoNaN liabilities were recorded at September 30, 20172020 or 2016.2019.
Net Income (Loss) per Unit
Basic net income (loss) per unit is computed by dividing net income (loss) by the weighted average number of members' units outstanding during the period. Diluted net income (loss) per unit is computed by dividing net income (loss) by the weighted average number of members' units and members' unit equivalents outstanding during the period. There were no member unit equivalents outstanding during the periods presented; accordingly, the Company's basic and diluted net income (loss) per unit are the same.
Income Taxes
Cardinal Ethanol LLC is treated as a partnership for federal and state income tax purposes and generally does not incur income taxes. Instead, income or losses are included in the income tax returns of the members and partners. Accordingly, no provision or liability for federal or state income taxes has been included in these financial statements. The Company had no significant uncertain tax positions as of September 30, 20172020 or 2016.2019. Differences between the financial statement basis of assets and tax basis of assets is related to capitalization and amortization of organization and start-up costs for tax purposes, whereas these costs are expensed for financial statement purposes. In addition, the Company uses the modified accelerated cost recovery system method (MACRS) for tax depreciation instead of the straight-line method that is used for book depreciation, which also causes temporary differences. For years before 2013,2016, the Company is no longer subject to U.S. Federal income tax examinations.
Recently Issued or Adopted Accounting Pronouncements
Recent Accounting Pronouncements – In NovemberFebruary 2016, the Financial Accounting Standards Board (FASB)(“FASB”) issued new guidance on accounting for leases under Accounting Standards Update (ASU) No. 2016-18, Restricted Cash,Codification 842 (“ASC 842”). Under the new guidance, lessees are required to recognize the following for all leases (with the exception of short-term leases) at the commencement date: (1) a lease liability, which is a lessee’s obligation to make lease payments arising from a lease, measured on a discounted cash flow basis; and (2) a “right of use” asset, which is an asset that represents the lessee’s right to use the specified asset for the lease term. Lease expense under the new guidance is substantially the same as prior to the adoption. See Note 10 for further information.
2.REVENUE
Adoption of ASC Topic 606
On October 1, 2018, the Company adopted the amended Statement of Cash Flows (Topic 230)guidance in ASC Topic 606, Revenue from Contracts with Customers, and all related amendments (“new revenue standard”) and applied it to all contracts using the modified retrospective transition method. There were no adjustments to the October 1, 2018 balance sheet for the adoption of the Accounting Standards Codification. The new guidance will require amounts generally described as restricted cashrevenue standard. As such,
52
CARDINAL ETHANOL, LLC
Notes to Audited Financial Statements
September 30, 2020 and restricted cash equivalents2019
comparative information has not been restated and continues to be included with cash and cash equivalents when reconcilingreported under the beginning-of-period and end-of-period total amounts shownaccounting standards in effect for those periods. In addition, there was no impact of adoption on the statementstatements of cash flows. The amendments will be effective for the Company for fiscal years beginning after December 15, 2017. Early adoption is permitted. The Company has elected to adopt the amendments for the current statements presentedoperations or balance sheets as of and for the fiscal years ended September 30, 20172020 and we have applied the standard retrospectively.2019.
Revenue by Source
All revenues from contracts with customers under ASC Topic 606 are recognized at a modified retrospective approach.point in time. The Company is currently evaluatingfollowing tables disaggregate revenue by major source:
Fiscal Year Ended September 30, 2020
| Ethanol Production | Grain Trading | Total | |||||||||||||||
| Revenues from contracts with customers under ASC Topic 606 | |||||||||||||||||
| Ethanol | $ | 157,704,059 | $ | 0 | $ | 157,704,059 | |||||||||||
| Distillers' Grains | 41,687,109 | 0 | 41,687,109 | ||||||||||||||
| Corn Oil | 9,640,523 | 0 | 9,640,523 | ||||||||||||||
| Carbon Dioxide | 493,500 | 0 | 493,500 | ||||||||||||||
| Other Revenue | 2,048,527 | 87,450 | 2,135,977 | ||||||||||||||
| Total revenues from contracts with customers | 211,573,718 | 87,450 | 211,661,168 | ||||||||||||||
Revenues from contracts accounted for as derivatives under ASC Topic 815 (1) | |||||||||||||||||
| Soybeans and other grains | 0 | 33,057,394 | 33,057,394 | ||||||||||||||
| Total revenues from contracts accounted for as derivatives | 0 | 33,057,394 | 33,057,394 | ||||||||||||||
| Total Revenues | $ | 211,573,718 | $ | 33,144,844 | $ | 244,718,562 | |||||||||||
53
CARDINAL ETHANOL, LLC
Notes to Audited Financial Statements
September 30, 2020 and 2019
Fiscal Year Ended September 30, 2019
| Ethanol Production | Grain Trading | Total | |||||||||||||||
| Revenues from contracts with customers under ASC Topic 606 | |||||||||||||||||
| Ethanol | $ | 170,418,067 | $ | 0 | $ | 170,418,067 | |||||||||||
| Distillers' Grains | 42,940,147 | 0 | 42,940,147 | ||||||||||||||
| Corn Oil | 8,192,603 | 0 | 8,192,603 | ||||||||||||||
| Carbon Dioxide | 504,237 | 0 | 504,237 | ||||||||||||||
| Other Revenue | 52,944 | 42,100 | 95,044 | ||||||||||||||
| Total revenues from contracts with customers | 222,107,998 | 42,100 | 222,150,098 | ||||||||||||||
Revenues from contracts accounted for as derivatives under ASC Topic 815 (1) | |||||||||||||||||
| Soybeans and other grains | 0 | 38,519,254 | 38,519,254 | ||||||||||||||
| Total revenues from contracts accounted for as derivatives | 0 | 38,519,254 | 38,519,254 | ||||||||||||||
| Total Revenues | $ | 222,107,998 | $ | 38,561,354 | $ | 260,669,352 | |||||||||||
(1) Revenues from contracts accounted for as derivatives represent physically settled derivative sales that are outside the impact that the adoptionscope of this guidance will have on the Company’s financial statements and anticipates the new guidance will significantly impact its financial statements given the Company has leased a significant number of rail cars for transporting Dried Distillers' Grains with Solubles (DDGS) to its ultimate customers.
Payment Terms
The core principleCompany has contractual payment terms with each respective marketer that sells ethanol and distillers grains. These terms are generally 10 - 20 days after the week of the new guidance is that an entity should recognize revenue to reflect the transfer of control.
The Company has standard payment terms of net 10 days for its sale of corn oil.
The Company has standard payments terms due upon delivery for its sale of soybeans.
The contractual terms with the carbon dioxide customer calls for an annual settlement.
Shipping and Handling Costs
Shipping and handling costs related to contracts with customers for sale of goods are accounted for as a fulfillment activity and are included in cost of goods sold. Accordingly, amounts billed to customers for such costs are included as a component of revenue.
Contract Liabilities
The Company records unearned revenue when consideration is received, or such consideration is unconditionally due, from a customer prior to transferring goods or services to customers in an amount equal to the considerationcustomer under the entity receives or expects to receive. The guidance will be effective for the Company beginning in October 2018. We have evaluated the impactterms of the standard on the financial statements and believe there will be no material effect aside for additional disclosure.its contracts with customers.
Two major customers accounted for approximately 95%91% and 94%92% of the outstanding accounts receivable balance at September 30, 20172020 and September 30, 2016,2019, respectively. These same two customers also accounted for approximately 96%81% of revenue for the year ended September 30, 2020 and 82% and 80% of revenue for each of the years ended September 30, 2017, 20162019, and 2015.2018, respectively.
54
CARDINAL ETHANOL, LLC
Notes to Audited Financial Statements
September 30, 2020 and 2019
4. INCOME TAXES
The differences between financial statement basis and tax basis of assets and liabilities at September 30, 20172020 and 20162019 are as follows:
| 2020 | 2019 | ||||||||||
| Financial statement basis of assets | $ | 129,737,278 | $ | 137,551,637 | |||||||
| Organization and start-up costs | 1,976,610 | 1,976,610 | |||||||||
| Book to tax depreciation and amortization | (61,868,066) | (69,437,507) | |||||||||
| Book to tax derivative instruments | 0 | (234,875) | |||||||||
| Book to tax operating lease right of use asset | (4,951,593) | 0 | |||||||||
| Capitalized inventory | 140,000 | 140,000 | |||||||||
| Income tax basis of assets | $ | 65,034,229 | $ | 69,995,865 | |||||||
| Financial statement basis of liabilities | $ | 20,789,928 | $ | 25,272,954 | |||||||
| Book to tax derivative instruments | (2,051,929) | (1,058,041) | |||||||||
| Book to tax operating lease liability | (4,951,697) | 0 | |||||||||
| Accrued employee benefits | (349,719) | (425,997) | |||||||||
| Accrued Rail Car Rehabilitation Costs | (1,452,600) | (1,154,520) | |||||||||
| Income tax basis of liabilities | $ | 11,983,983 | $ | 22,634,396 | |||||||