UNITED STATES
SECURITIES AND EXCHANGE COMMISSION
WASHINGTON, D. C. 20549
FORM 10-K
| ANNUAL REPORT PURSUANT TO SECTION 13 OR 15(d) OF THE SECURITIES EXCHANGE ACT OF 1934 | |
For the Fiscal Year Ended: January 31, 20162019
OR
| ¨ | TRANSITION REPORT PURSUANT TO SECTION 13 OR 15(d) OF THE SECURITIES EXCHANGE ACT OF 1934 |
Commission File Number: 001-35498

Splunk Inc.
(Exact name of registrant as specified in its charter)
| Delaware | 86-1106510 | |
| (State or other jurisdiction of | (I.R.S. Employer | |
| incorporation or organization) | Identification No.) | |
San Francisco, California 94107
(Address of principal executive offices)
(Zip Code)
(415) 848-8400
(Registrant’s telephone number, including area code)
Securities Registered pursuant to Section 12(b) of the Act:
| Title of each class | Name of each exchange on which registered | |
| Common Stock, $0.001 par value per share | The NASDAQ Global Select Market | |
Securities registered pursuant to Section 12(g) of the Act: None
Indicate by check mark if the Registrant is a well-known seasoned issuer, as defined in Rule 405 of the Securities
Act: Yes xý No ¨
Indicate by check mark if the Registrant is not required to file reports pursuant to Section 13 or Section 15(d) of the
Act: Yes ¨No xý
Indicate by check mark whether the Registrant (1) has filed all reports required to be filed by Section 13 or 15(d) of the Securities Exchange Act of 1934 during the preceding 12 months (or for such shorter period that the Registrant was required to file such reports), and (2) has been subject to such filing requirements for the past 90 days. Yes xý No ¨
Indicate by check mark whether the registrant has submitted electronically and posted on its corporate Web site, if any, every Interactive Data File required to be submitted and posted pursuant to Rule 405 of Regulation S-T during the preceding 12 months (or for such shorter period that the registrant was required to submit and post such files). Yes xý No ¨
Indicate by check mark if disclosure of delinquent filers pursuant to Item 405 of Regulation S-K is not contained herein, and will not be contained, to the best of Registrant’s knowledge, in definitive proxy or information statements incorporated by reference in Part III of this Form 10-K, or any amendment to this Form 10-K. ¨
Indicate by check mark whether the registrant is a large accelerated filer, an accelerated filer, a non-accelerated filer, or a smaller reporting company, or an emerging growth company. See the definitions of “large accelerated filer,” “accelerated filer”filer,” “smaller reporting company” and “smaller reporting“emerging growth company” in Rule 12b-2 of the Exchange Act.
| Large accelerated filer | Accelerated filer | ¨ | |
| Non-accelerated filer | Smaller reporting company | ¨ | |
| Emerging growth company | ¨ | ||
If an emerging growth company, indicate by check mark if the registrant has elected not to use the extended transition period for complying with any new or revised financial accounting standards provided pursuant to Section 13(a) of the Exchange Act. ¨
Indicate by check mark whether the registrant is a shell company (as defined in Rule 12b-2 of the Exchange Act). Yes ¨No xý
The number of shares outstanding of the Registrant’s Common Stock as of March 23, 201618, 2019 was 132,376,844150,074,503 shares.
Documents Incorporated by Reference
Portions of the registrant’s definitive Proxy Statement for the 20162019 Annual Stockholders’ Meeting are incorporated by reference into Part III of this Annual Report on Form 10-K.
Splunk Inc.
Table of Contents
| Page No. | |||
| Item 1. | |||
| Item 1A. | |||
| Item 1B. | |||
| Item 2. | |||
| Item 3. | |||
| Item 4. | |||
| Item 5. | |||
| Item 6. | |||
| Item 7. | |||
| Item 7A. | |||
| Item 8. | |||
| Item 9. | |||
| Item 9A. | |||
| Item 9B. | |||
| Item 10. | |||
| Item 11. | |||
| Item 12. | |||
| Item 13. | |||
| Item 14. | |||
| Item 15. | |||
| Item 16. | |||
PART I
This Annual Report on Form 10-K, including but not limited to the sections entitled “Business,” “Risk Factors,” and “Management’s Discussion and Analysis of Financial Condition and Results of Operations,” contains forward-looking statements that involve risks and uncertainties, as well as assumptions that, if they never materialize or prove incorrect, could cause our results to differ materially from those expressed or implied by such forward-looking statements. Statements that are not purely historical are forward-looking statements within the meaning of Section 27A of the Securities Act of 1933, as amended, and Section 21E of the Securities Exchange Act of 1934, as amended (the “Exchange Act”). Forward-looking statements are often identified by the use of words such as, but not limited to, “anticipate,” “believe,” “can,” “continue,” “could,” “estimate,” “expect,” “intend,” “may,” “plan,” “project,” “seek,” “should,” “target,” “will,” “would” and similar expressions or variations intended to identify forward-looking statements. These forward-looking statements include, but are not limited to, statements concerning the following:
our future financial and operating results; including trends in and expectations regarding revenues, deferred revenue, billings, gross margins, operating income and the proportion of transactions that will be recognized ratably;
market opportunity;
expected benefits to customers and potential customers of our offerings, as well as our user-driven ecosystem;
investment strategy, business strategy and growth strategy, including our business model transition and the use of acquisitions to expand our business;
sales and marketing strategy, including our international sales and channel partner strategy;
management’s plans, beliefs and objectives for future operations;
our ability to provide compelling, uninterrupted and uninterruptedsecure cloud services to our customers;
expectations about competition;
economic and industry trends or trend analysis;
expectations about the benefits of acquisitions;
expectations about seasonality;
revenue mix;
expected impact of changes in accounting rules or standards;
use of non-GAAP financial measures;
operating expenses, including changes in research and development, sales and marketing, facilities and general and administrative expenses;
sufficiency of cash to meet cash needs for at least the next 12 months;
exposure to interest rate changes;
inflation;
anticipated income tax rates;rates, tax estimates and tax standards; and
capital expenditures, cash flows and liquidity.
These statements represent the beliefs and assumptions of our management based on information currently available to us. Such forward-looking statements are subject to risks, uncertainties and other important factors that could cause actual results and the timing of certain events to differ materially from future results expressed or implied by such forward-looking statements. Factors that could cause or contribute to such differences include, but are not limited to, those identified below, and those discussed in the section titled “Risk Factors” included under Part I, Item 1A. Furthermore, such forward-looking statements speak only as of the date of this report. Except as required by law, we undertake no obligation to update any forward-looking statements to reflect events or circumstances that occur after the date of this report.
| Item 1. Business |
Overview
Splunk provides innovative software solutions that enable organizations to gain real-time operational intelligence by harnessing the value of their data. Our offerings enable users to collect, index, search, explore,investigate, monitor, analyze and analyzeact on machine data regardless of format or source. Our offerings address large and diverse data sets commonly referred to as big data and are specifically tailored for machine data. Machine data is produced by nearly every software application and electronic device inacross an organization and contains a definitive, time-stampedreal-time record of various activities, such as transactions, customer and user activities,behavior, and security threats. Beyond an organization’sorganization's traditional information technology (“IT”) and security infrastructure, every processor-based system,data from the Industrial Internet, including HVAC controllers, manyindustrial control systems, sensors, supervisory control and data acquisition (“SCADA”) systems, networks, manufacturing systems, smart electrical meters GPS devices and radio-frequency identification tags, and manythe Internet of Things (“IoT”), which includes consumer-oriented systems, such as electronic wearables, mobile devices, automobiles and medical devices that contain embedded processor chips, are also continuously generating machine data. Our offerings help organizations gain the value from all of these different sources and forms ofcontained in machine data.data by delivering real-time information to enable operational decision making.
Our mission is to make machine data accessible, usable and valuable to everyone in an organization. Our customers leverage our offerings for various use cases, including infrastructure and operations management, applications management, security and compliance, businesssoftware development and webIT operations, applications management and business analytics, and to provide insights into data generated by the Internet of Things (“IoT”)IoT and industrial data, among many others. Our offerings are intended to help users in various roles, including IT, security, manufacturing and business professionals, quickly analyze their machine data and achieve real-time visibility into and intelligence about their organization’s operations. We believe this operational intelligence enables organizations to improve service levels, reduce operational costs, mitigate security risks, demonstrate and maintain compliance, and drive better business decisions. The result is an improved level of operational visibility enabling more informed business decisions that can provide greater efficiency, security and competitive advantage for our customers.
Our flagship product is Splunk Enterprise, a machine data platform, comprised of collection, indexing, search, reporting, analysis, alerting, monitoring and data management capabilities. Splunk Enterprise can collect and index hundreds of terabytespetabytes of machine data daily, irrespective of format or source. Our machine data platform uses our patented data processing architecture that performs dynamic schema creation on the fly,at read time, rather than write time, enabling users to run queries on data without having to define or understand the structure of the data prior to collection and indexing. This is in contrast to traditional IT systems that require users to establish the format of their data prior to collection in order to answer a pre-set list of questions. Splunk Enterprise also enables customers to interactively explore, analyze and visualize data stored in data sources such as Hadoop and Amazon S3. Our technology delivers speed, scalability and scalabilityadvanced analytics including machine learning when processing massive amounts of machine data.data for anomaly detection, event grouping, prediction and other methods. Our software leverages improvements in the cost and performance of commodity computing and can be deployed in a wide variety of computing environments, from a single laptop to large globally distributed data centers as well as public, private and hybrid cloud environments.
Splunk Cloud service delivers the core functionalitiesbenefits of Splunk Enterprise deployed and managed reliably and scalably as a scalable, reliable cloud service. Splunk Cloud is available globally and eliminates the need to purchase, deploy and manage infrastructure. Splunk Cloud can be used solely asto collect, analyze and store data in a public cloud serviceenvironment or via a hybrid approach that spans cloud and on-premises environments, in which aenvironments. A single Splunk interface can search data stored in both on-premises Splunk Enterprise instances as well as Splunk Cloud instances.instances, providing a single point of visibility and analysis across the customer’s entire enterprise.
Splunk Light product provides log search and analysis that is designed, and priced and packaged for small IT environments, where a single-server log analytics solution is sufficient, and accordingly the daily indexing volume is limited as compared to Splunk Enterprise. Splunk Light collects, indexes, monitors, reports and alerts on a customer’s log data in real time, and can be purchased through our online store or via our channel partners.
Our premium solutions are purpose-built solutions thatto address key customer needs. Splunk premium solutions are sold separately and include:
Splunk Enterprise Security (“ES”) - Addresses emerging security threats and security information and event management (“SIEM”) use cases through monitoring, alertsalerting, reporting, investigation and analytics.forensic analysis.
Splunk IT Service Intelligence (“ITSI”) - Monitors the health and key performance indicators of critical IT and business services with machine learning.
Splunk User Behavior Analytics (“UBA”) - Detects cyber-attacks and insider threats using data science, machine learning and advanced correlation.
Splunk IT Service IntelligencePhantom - MonitorsAutomates and orchestrates incident response workflows to take immediate action the health and key performance indicators of critical IT services.moment an incident is detected.
We also complement the capabilities of Splunk Enterprise, Splunk Cloud and our premium solutions with additional content (“apps” and “add-ons”). These apps and add-ons, which are generally available for download from within our offerings, via our Splunkbase website or in our Splunk Cloud environment, provide functionality in the form of pre-built data inputs, workflows, searches, reports, alerts and dashboards that make it easier and faster for our customers to address specific use cases. Splunk, along with a number of third-party developers and customers, havehas developed hundreds of apps and add-ons for common data sources and valuable use cases in our core and adjacent markets. Many of these apps and add-ons are available as free downloads. Examples of apps that we and our partners have developed include:
Splunk AppMachine Learning Toolkit (“MLTK”) - Includes custom visualizations and guided workflows, as well as application programming interfaces (“APIs”) for AWS - Usedopen source and proprietary algorithms. It also contains a data prep module to ensure cloud securityhelp customers prepare and compliance by using AWS CloudTrail and Configclean their data streams to monitor user activity and resources in real time.before they create machine learning models.
Splunk App for StreamAmazon Web Services (“AWS”) - UsedCollects and analyzes data from AWS data sources to capture, analyzedeliver security, operational and correlate network wire data to monitor operationscost management insights via pre-built dashboards, reports and end-to-end transactions without manual instrumentation.alerts.
Splunk DB Connect - Enables customers to get business and enterprise context such as customer, product and HR data from traditional relational databases using real-time integration.integration
Cisco Firepower App for Splunk - Enables Delivers critical high value contextual security and network event information when combined with the Cisco eStreamer eNcore Add-on. Incorporates advanced visualizations and investigative capabilities for Cisco Firepower and Firepower Management Console. Built, supported, and maintained by Cisco Systems, Inc.
Splunk users to gain visibility to Palo Alto Networks firewalls in order to perform incident analysis on correlated applicationApps and user activities across all network and security infrastructures from a real-time and historical perspective.
As part of our strategy to offer an open platform, we provide application programming interfaces (“APIs”) andAPIs, software development kits (“SDKs”) in major programming languages.languages, and extensions for popular integrated development environments (“IDEs”) like Eclipse and Microsoft Visual Studio. These enable developers to build software that leverages Splunk Enterprise or Splunk Cloud as well as integrate with other parts of an organizations’ IT infrastructure.
Our online user community websites, Splunkbase and Splunk Answers, provide our customers with an environment to share apps, collaborate on the use of our software and provide community-based support.support and education. Additionally, our Splunk Dev portal allows developers the ability to download SDKs, access API documentation and see sample code for building applications using our developer environment and tools. We believe this user-driven ecosystem results in greater use of our offerings and provides cost-effective marketing, increased brand awareness and affinity, as well as viral adoption of our offerings.
Our offerings are designed to deliver rapid return-on-investment for our customers. They generally do not require customization, long deployment cycles or extensive professional services commonly associated with traditional enterprise software applications. Prospective users can get started with our free online sandboxes that enable our customers to immediately try and experience Splunk offerings. Users that prefer to deploy the software on-premises can take advantage of our free 60-day trial of Splunk Enterprise, which converts into a limited free perpetual license of up to 500 megabytes of data per day. PayingA 15-day free trial is available to users that prefer the core functionalities of Splunk Enterprise delivered as a cloud service. These users can sign up for the Splunk Cloud service and avoid the need to provision, deploy and manage internal infrastructure. Alternatively, they can simply download and install the software, typically in a matter of hours, to connect to their relevant machine data sources. Customers can also provision a compute instance on AWS via a pre-built Amazon Machine Image, which delivers a pre-configured virtual machine instance with our Splunk Enterprise software. We offer free development-test licenses for certain commercial customers, allowing users to explore new data and use cases in a non-production environment without incurring additional fees. We also offer support, training and professional services to our customers to assist in the deployment of our software.
Splunk pricing offers scalable solutions tailored to ensure that our customers including 85 of the Fortune 100 companies.can realize value for their investment. Our Splunk Enterprise customers pay license fees generally based on their estimated peak daily indexing capacity needs. Our pricing model builds in volume discounts as daily ingestion rates increase. From time to time, our customers enter into transactions that are designed to enable broad adoption of our software across their entire organization, referred to as enterprise adoption agreements (“EAAs”). EAAs provide these customers with a flexible licensing model that providescan provide the freedom to use our software beyond their original daily indexing capacity estimates and more predictable costs that can be budgeted over a multi-year period. Our Splunk Cloud customers pay an annual subscription fee based on the combination of the volume of data indexed per day and the amount of data they wish to store. For fiscal 2016, 2015 and 2014, our revenues were $668.4 million, $450.9 million and $302.6 million, respectively, representing year-over-year growth of 48% for fiscal 2016 and 49% for fiscal 2015. Our net losses for fiscal 2016, 2015 and 2014 were $278.8 million, $217.1 million and $79.0 million, respectively.stored.
Our Growth Strategy
Our goal is to make Splunk the standard platform for delivering operational intelligence and real-time business insights from machine data. The key elements of our strategy are to:
Extend our technological capabilities. We intend to continue to invest heavily in product development to deliver additional features address additional customer needs and enableperformance enhancements, deployment models and solutions that can address new end markets.markets and support Splunk software usage across multiple use cases. In particular, we intend to invest in our suite of cloud services to both deliver new capabilities as well as provide a cloud-first experience to our customers. We will continue to expand into adjacent productproducts, services and technology areastechnologies that enable organizations to further realize the value of their machine data.data across cloud and on-premises environments. Our investments may involve organic hiring and associated development, acquisitions and licensing of third partythird-party technology.
Continue to expand our direct and indirect sales organization, including our channel relationships, to increase our sales capacity and enable greater market presence. We will continue to increase investments in our sales and marketing organizations to enable the acquisition of new customers as well as expansion within our current customer base. Our investments will be spread across geographies, customer tiers and industries. We will continue to invest in and foster the growth of our channel relationships, both inside and outside the United States, to enable greater leverage in our go-to-market investments. We will also expand go-to-market channels that enable new ways to consume our offerings.
Further penetrate our existing customer base and drive enterprise-wide adoption. We will continue to drive customer satisfaction and renewals by offering community, standard, enterprise and global support to ensure our customers’ success with our offerings. We will continue to cultivate incremental sales from our existing customers through increased use of our offerings within organizations as well as consultative services that broaden the customer’s awareness of our product and service capabilities. In particular, we will continue to seek to upsell increased licenseindexing capacity to our existing customers for additional deployments and new use cases. We believe our existing customer base serves as a strong source of incremental revenues given the horizontal applicability of our offerings and the growing machine data volumes our customers experience. Our sales teams are responsible for securing new customers, obtaining renewals of existing contracts and increasing adoption of our software by existing customers.
Enhance our value proposition through a focus on solutions which address core and expanded use cases. We will continue to organize our go-to-market and product strategy around our customer use cases. We have invested in market groups in the Security, IT, and Cloud areas, and may add additional domain expertise in business analyticsBusiness Analytics and IoT among others.areas. This approach includes offering capabilities, either in the form of platform features or premium solutions, which target both our core use cases as well as new use cases, as driven by our corporate strategy and customer demand. We believe premium solutions in particular will enable us to increase our market penetration, expand our addressable market opportunity and make our products a more targeted solution for specific challenges that our customers face across their organizations.
Grow our user communities and partner ecosystem to increase awareness of our brand, target new use cases, drive operational leverage and deliver more targeted, higher value solutions. We believe our user community has the potential to provide significant operating leverage by delivering apps that extend the Splunk platform into new use cases. We will continue to invest in business development initiatives in order to add additional OEM and strategic relationships to enable new sales channels for our productsofferings as well as extend our product integrations with third-party products. In addition, once these relationships have been established, we expect that OEM vendors and managed service providers will continue to invest in and create customized application functionality based on our platform.
Continue to deliver a rich developer environment to enable rapid development of enterprise applications that leverage machine data and the Splunk platform. We intend to continue our investments in SDKs and APIs that help software
developers leverage the Splunk platform and Hunk software.platform. Our SDKs enable developers to build solutions that deeply integrate the analytics functionality of these products as well as access data stored in data indexes.our offerings across the enterprise. Through our investments in SDKs and APIs, we intend to promote and extend the capabilities of our offerings to customers who wish to build sophisticated applications and interfaces that leverage our software and services.
Pricing
We price our offerings primarily on the amount of data indexed, namely the maximum aggregate volume of uncompressed data indexed on a daily basis, expressed in gigabytes, terabytes or petabytes per day. Once a data ingestion license is purchased, there is no limit or additional costs based on other product usage elements nor the customer’s preferred deployment size or model. Our Splunk Cloud and Splunk Light Cloud customers generally pay an annual subscription fee based on the combination of the volume of data indexed per day and the amount of data they wish to store.stored.
For organizations that choose to standardize on Splunk software as their enterprise-wide platform for machine data, we offer EAAs, which provide our customers with a flexible licensing model and can provide the freedom to use our software beyond their purchased license capacity.original daily indexing capacity estimates. EAAs are designed to benefit organizations of any size, from small and midsize businesses to Fortune 100 companies and provide customers with more predictable costs that can be budgeted over a multi-year period as well as enable expansion to new use cases without penalty or cost.
Some of our productsofferings address markets where other pricing models may be prevalent. Hunk, which delivers analytics inFor example, the Hadoop market, is priced by the number of TaskTracker Nodes (Compute Nodes in YARN) in the respective Hadoop cluster over which Hunk operates. The pricing of Splunk User Behavior Analytics, which helps detect cyber-attacks and insider threats using data science, machine learning and advanced correlation, is based on the number of monitored user and system accounts.
Splunk Technology
Key Technologies
We believe our investments in our products and key technologies provide significant competitive differentiation. Our key technologies are architected to support large volumes of machine data at a massive scale with minimal overhead. Our platform is highly flexible and is able to collect and index large amounts of heterogeneous data formats, from physical, virtual and/or cloud environments.
Schema-on-the-fly. Our products collect and index data irrespective of source and format. Rather than requiring that data be input in a pre-defined structure, our schema-on-the-fly technology creates structure as data is being searched, allowing users to ask new and different questions at any time without having to re-architect a schema as would be required in a relational database. Our technology builds a schema at read time, rather than write time, and does not require pre-defined knowledge about the data it is processing. Using our technology, different users can run a variety of queries, regardless of changes in format of the data being input into the system.
Machine data fabric.platform. Our products enable users to process machine data no matter the infrastructure topology, from a single machine to a globally distributed, virtualized IT infrastructure. This machine data fabricplatform allows customers to address the complexities of handling massive amounts of real-time, dynamic, heterogeneous machine data. Our APIs enable users to forward data from our software to other parts of their IT network, creating a machine data fabricplatform across the organization irrespective of whether the data is used by our products for analysis and reporting or as a conduit to other systems.
Search processing language. Our proprietary search processing language is specifically designed for working with large volumes of machine data. Our search language supports arithmetic operations to refine searches and conduct calculations with the results of a query in real time. Statistical and reporting commands native to our search language, including machine learning algorithm support, let users perform more robust calculations and analytics. Our software can also learn about the structure of the machine data through the searches users conduct, allowing users to utilize the machine data structure and knowledge garnered by previous Splunk searches. Our software includes acceleration technology that delivers high performance for analytical operations across terabytes or petabytes of data, such as identifying rare terms and performing aggregation operations.
Machine Learning. The Splunk platform allows our customers to apply machine learning analytics to better predict and help prevent IT, security and IoT incidents, and can also be used to forecast key business indicators. Machine learning embedded in our software offers customers advanced analytics as an integrated, turnkey part of IT and security use cases.
Splunk Enterprise and Splunk Cloud
Features and Functionality
Our Splunk Enterprise platform contains the following features and functionalities whileand Splunk Cloud providesdelivers the same core functionalitiesbenefits of Splunk Enterprise offered as a cloud service.
Universally collect, index, store and archive any machine data, from any source. Splunk Enterprise processes machine data in real time from any source, format or location. This includes streaming data generated by websites, applications, servers, networks, sensors and mobile devices.
Search and investigate. Splunk Enterprise allows users to search real-time and historical machine data simultaneously.
User-friendly interface. Splunk Enterprise uses a customizable interface that enables users to understand and adopt the product. The user interface also provides productivity features, such as type-ahead and contextual help to accelerate adoption and usage.
Knowledge store. Users can store knowledge about events, fields, transactions, patterns, statistics and key-value pairs so others who utilize the Splunk instance can leverage this information.
Monitor and alert. Users can save searches so they can be run automatically to raise real-time alerts that trigger actions such as sending emails, running scripts, or posting to an RSS feed.
Report and analyze. Users can create ad hoc reports on real-time and historical data to analyze business and IT data trends.
Custom dashboards and views. Splunk Enterprise enables users to create custom dashboards that integrate multiple charts and views of real-time and historical data for different users and roles.
Data models and pivot. Splunk Enterprise enables users to build data models that describe relationships in the underlying machine data, making it more meaningful and usable. Non-technical users can generate charts, visuals and dashboards using the pivot interface, without the need to master the Splunk Search Processing Language.
Developer platform. Splunk Enterprise includes a rich developer environment. The Splunk Web Framework enables developers to use the tools and languages they know, such as JavaScript, to build Splunk apps with custom dashboards, a flexible UI and custom data visualizations. SDKs for Java, JavaScript, C#,C# and Python PHP and Ruby enable rapid integration between Splunk Enterprise to other applications and systems to maximize the value of our customers’ data.
Role-based access controls. Splunk Enterprise incorporates role-based access controls and authentication, integrated with existing enterprise-wide security policies, to help secure the data stored within our indexes as well as control users’ activities in our software.
Technology Architecture
The technology architecture of our Splunk platform the technology architecture contains a number of important components:
Collection. Our Splunk platform collects machine data from many disparate sources across a distributed environment deployed on-premises, or in public and private clouds. This includes servers, network devices, message buses, API endpoints, desktop and laptop computers, mobile devices and various other systems that organizations have deployed to support their operations. Our products act as a recording mechanism, collecting, storing and making available all of the machine data that they index and store. Splunk offers a Universal Forwarder and other data ingestion tools that can be deployed on various data sources to facilitate the reliable collection of machine data. Splunk Enterprise features native support for metrics, which are sets of numbers describing a particular process or activity, measured over time. Our Splunk platform uses a custom index type that is optimized for metric storage and retrieval for system metrics such as CPU, memory, disk or information from IoT devices.
Indexing. Our proprietary universal indexing technology enables real-time indexing of any machine data collected regardless of its source or format and without the use of any specific parsers or data connectors. Our Splunk platform indexes the data and stores the data in a scalable storage format, which can reside on commodity servers and storage devices. In the case of Splunk Cloud, data is stored securely in our cloud service, which we host on Amazon Web Services.
Search. Our Splunk platform enables users to search massive amounts of machine data that have been indexed and stored. At its most basic level, the search engine at the core of our Splunk platform allows users to type and search for keywords or data fields that are of interest. This foundational capability forms the basis for deriving business insights from our dashboards and customized views. Users can leverage our search language and functionality to filter through indexed data and refine search results to obtain more precise information. The Splunk platform also provides event pattern detection to allow users to detect meaningful patterns in their machine data, regardless of data source or type.
Core functions. Our Splunk platform’s core functionality includes alerts, access control, statistics, correlation and predictive capabilities. With our software’s granular, role-based access control, an administrator can manage various aspects of a given user’s search including the data to which the user has access, as well as what portions of the data may be visible in results. Search results and reports can be defined according to a particular user’s business function and level of access. Different users can see completely different views on the same data, depending on what is important to them.
Archive to Hadoop and Amazon S3. Splunk Enterprise customers can archive historical data to Hadoop or Amazon S3 for low-cost storage. Using our Hunk product, customersstorage as a standard feature. Customers can gain new insights with distributed search queries that correlate real-time data from Splunk Enterprise with historical data storesstored in Hadoop or Amazon S3.
SDKs and APIs. Our SDKs allow third-party software developers to build enterprise applications on top of our software using popular programming languages such as Java, JavaScript, C#, Python, PHPC# and Ruby.Python. Our APIs allow users to access the machine data stored within the Splunk platform instance as well as access our machine data engine functionality from third-party software.
App Development Environment. We provide the ability for users and third partythird-party developers to create apps with custom dashboards, flexible UI components and custom data visualizations using freely available components and templates, as well as common development languages and frameworks, such as JavaScript and Python.
Splunk Product Deployments
Splunk Enterprise Splunk Light and Hunk can be deployed on-premises and in public or private clouds. Splunk Cloud offersdelivers the core functionalitiesbenefits of Splunk Enterprise as a cloud service. Taking Splunk Enterprise and Splunk Cloud together, customers utilizing a hybrid deployment model can have a single centralized view and location-independent use across cloud and on-premises environments.
For Splunk Enterprise deployments, our software can be deployed in a variety of environments ranging from a single server to globally distributed enterprise IT environments handling hundreds of terabytespetabytes of data per day. Our customers can deploy Splunk Enterprise on-premises, in the cloud, in virtualized server and storage environments or in hybrid IT environments. Our customers can use Splunk forwarders, indexers, and search heads to create a machine data fabricplatform that allows for the efficient, secure and real-time collection and indexing of machine data regardless of network, data center or IT infrastructure topology.
This distributed machine data processing architecture provides near-linear scalability, resulting in the ability to index and search across massive data volumes. Our Splunk platform can operate in a single data center or across multiple data centers both inside and outside an organization, and all from a single user interface. This architecture also allows for flexible deployment of hardware, as commodity hardware can be added as needed.
Services
While users can easily download, install and deploy Splunk software on their own, certain enterprise customers that have large, highly complex IT environments or deployment requirements may choose to leverage our customer support and professional services organization. Many users leverage the community-based support of Splunk Apps and Add-ons and Splunk Answers before engaging with our customer support or services organizations. Some of our certified partners also provide limited, first level support and professional services before a customer reaches out to our internal Splunk customer support and professional services teams.
Maintenance and Customer Support
Our customers typically purchase one year of software maintenance and support as part of their initial purchase of our products,perpetual licenses, with an option to renew their maintenance agreements. Term license purchases include software maintenance and support for the term of the license. These maintenance agreements provide customers the right to receive unspecified software updates, maintenance releases and patches, and access to our technical support services during the term of the agreement.
We maintain a customer support organization that offers multiple service levels for our customers based on their needs. TheseStandard or Premium support customers receive guaranteed response times,24x7x365 access to subject matter experts for critical issues, direct telephonictelephone support, and access to online support portals. Our highest levels ofand software upgrades. Additionally, Premium support provide 24x7x365 supportprovides our best response and targeted fix Service Level Objectives (SLO’s) for critical issues,all case priorities and a designated resource to manage the account holistically, providing proactive support and quarterly reviews of the customer’s deployments. Our customer support organization has global capabilities, delivering support in multiple languages with deep expertise in our software, complex IT environments and associated third partythird-party infrastructure.
Training Services
We offer training services to our customers and channel partners through our education and training organization. We have also implemented a comprehensive training certification program to ensure an understanding of our offerings.
Professional Services
We provide consulting and implementation services to customers through our professional services team. They are typically utilized by large enterprises looking to deploy our software across their large, disparate and complex IT infrastructure. We generally provide these services at the time of initial installation to help the customer with configuration and implementation. Given our software’s ease-of-use, our professional services engagements are typically short in duration and last from a few days to up to several weeks.
Partner and Developer Ecosystem
We have established relationships with several leading technology companies to build Splunk apps that allow users to capture data and gain insights into those parties’ respective products. Many technology providers offer apps for free via the Splunkbase website. These apps typically consist of collections of reports, dashboards and data extractions which put our software in context for users of those specific technologies and allow them to easily and quickly understand the performance of their IT systems or correlate this data with other data sources.
We offer a developer license that allows third-party developers to build software using our existing developer framework and we have published information about our APIs to enable developers to build new user interfaces on top of our platform. We are creating additional SDKs based on various programming languages to make our software more extensible and allow developers to build applications and services that extend its functionality.
We have OEM relationships with a select group of third parties who integrate our software into their product offerings to provide additional reporting, monitoring and analytic capabilities within their own products. With respect to our OEM relationships, we provide a limited use license to expose certain data and analytics functionalities in their products, for which they generally pay us a royalty based on units shipped.
We engage with managed service providers, who offer services based on our software, such as for security PCI compliance and log management. These services are typically offered on a subscription basis, for which we are paid license fees typically based on daily indexing volume.
Splunk CommunityCommunities
Our online communities provide us with a rapidly growing network of active users who promote the usage of our software and provide technical support to each other.
Our online communities include Splunkbase, our apps repository,repository; Splunk Answers, our community collaboration site,site; and Splunk Dev, where developers can download SDKs, access API documentation and see sample code for building applications using our developer environment and tools. We also maintain active communities on leading social internet platforms, including Facebook, Twitter, LinkedIn and LinkedIn.Slack.
Splunk Answers. Users ask questions in an online community forum and share best practices about how to build searches, create data visualizations and configure and deploy our software. While our product, support, engineering and professional services teams participate in the Splunk Answers forum, during fiscal 2016, approximately three-quartersthe majority of questions appearing on Splunk Answers wereare answered by non-Splunk personnel, largely the result of a growing, active user community.
Splunk Dev. In addition to documentation about the Splunk APIs and SDKs, our developer portal contains documentation about best practices for building machine data output into third-party software.
We also promote and support offline meetings for our community, including regional user group meetings and an annual user conference.
Sales and Marketing
Our sales and marketing organizations work together closely to drive market awareness, build a strong sales pipeline, and cultivate customer relationships to drive revenue growth.
Sales
We sell our offerings directly through direct field sales directand inside sales and indirectindirectly through channel sales.partners. We gather prospects through a broad range of marketing programs and events, and through users who either download our trial software from our website or sign up for our online sandboxes or cloud services. Our inside sales team handlesdevelopment teams handle lead qualifications as well as smaller transactions, while largerqualifications. Large or more complex transactions are handled by our globally distributed direct field sales teams. Our sales engineers help define customer use cases and pre-sales qualification and evaluation.
We maintain a distributoran extensive partner ecosystem, of which many types of partners contribute to sourcing, co-selling and reseller network, or channel, which often co-sells with our field sales organization.fulfilling Splunk sales. These partner types include distributors, resellers and managed service providers. Our channel assists us by sourcing new prospects through leveraging their deep customer relationships, providing technicalprofessional services and support to existing customers, upselling for additional use cases and daily indexing capacities and maintenance renewals. In fiscal 2016, we launched theOur Splunk Partner+ Program is based on providing a value-basedsimple and predictable business model which allowsfor our partners to capture margins based upon the value they are delivering to specific opportunities.and Splunk. Our channel expands our geographic sales reach worldwide, particularly in key international markets such as the United Kingdom, Germany, Japanacross all our sales theaters. The Splunk Partner+ Program includes over 1,700 active partners that span our global system integrators, distributors, value-added resellers, technology alliance partners, OEMs, professional services and China. As of January 31, 2016, we had over 600 channel relationships worldwide.managed services providers. Of that number, nearly 1,000 partners contribute to sales. Historically, the majority of EMEAEurope, Middle East and APACAfrica (“EMEA”), Asia Pacific (“APAC”) and U.S. Public Sector sales have been fulfilled through channel partners and we expect this trend to continue.
In addition to acquiring new customers, our sales teams are responsible for securing renewals of existing contracts as well as increased adoption of our offerings by existing customers. To accomplish this, our field and inside sales teams work closely with our customers to drive expanded licenses through higher capacity or upgrades and additional use cases within existing customers. Our field sales teams are organized geographically across the Americas, EMEA and APAC. We intend to invest in our sales organization and channel to drive greater market penetration in the Americas, EMEA and APAC.these regions. We also have a dedicated sales team focused on government customers, which includes United States federal, state and local government entities. Our Splunk Light product is designed to broaden our market reach by providing log search and analysis for small IT environments. We are initially relying on select channel partners, as well as an online store, to reach the Splunk Light target markets. For fiscal 2016, 2015 and 2014, our revenues from our international operations represented 25%, 24% and 23% of
Marketing
We focus our marketing efforts on generating demand to drive pipeline for our sales force and partners, increasing Splunk’s brand and awareness, driving viral adoption, and communicating product advantages and business benefits, and generating leads for our sales force and channel.benefits. We market
our offerings as a targeted solution for specific use cases and as an enterprise solution for machine data. We engage with existing and potential customers to provide community-based education and awareness and to promote expanded use of our software within these customers. We host a number of events, including the SplunkLive! eventsevent series, across our sales regions to engage with both existing customers and new prospects as well as deliver product training. We host an annual worldwide user conference (“.conf”) and multiple partner conferences as another wayother ways to support the Splunk community to foster collaboration and help our customers drive further business results from our software.
Research and Development
We invest substantial resources in research and development to enhance our products,offerings, develop new end market specific solutions and apps, conduct software and quality assurance testing and improve our core technology. Our technical staff monitors and tests our software on a regular basis, and we maintain a regular release process to refine, update, and enhance our existing offerings.
Intellectual Property
We rely on patent, trademark, copyright and trade secret laws, confidentiality procedures and contractual provisions to protect our technology and intellectual property rights. The nature and extent of legal protection of our intellectual property rights depends on, among other things, its type and the jurisdiction in which it arises. We believe that our intellectual property rights are valuable and important to our business.
We retain ownership of software we develop. All software is licensed to users and primarily provided in object code or as a cloud service pursuant to either shrink-wrap, embedded or on-line licenses, or signed license agreements. These agreements generally contain restrictions on duplication, disclosure and transfer. We are currently unable to measure the full extent of unauthorized use of our software. We believe, however, that such unauthorized use is and can be expected to be a persistent problem that negatively impacts our revenue and financial results.
Customers
Our customer base has grown from approximately 450 customers at the end of fiscal 2008 to over 11,00017,500 customers in more than 110130 countries, including 8590 of the Fortune 100 companies, as of January 31, 2016.2019. We exclude users of our trial software and users of VictorOps from our customer count. We provide offerings to customers of varying sizes, including enterprises, educational institutions and government agencies. No individual customer represented greatermore than 10% of our total revenues in fiscal 2016, 2015 or 2014. One channel partner represented 14% and a second channel partner represented 13%for any of our total revenues in fiscal 2016.the periods presented. Our current customer base spans numerous industry verticals, including cloud and online services; education; financial services; government; healthcare/pharmaceuticals; industrials/manufacturing; media/entertainment; retail/ecommerce; technology and telecommunications.
Backlog and Seasonality
Our backlog represents non-cancelable orders that have not been recognized as revenue and have not yet been invoiced. We had backlog of approximately $379.8 million as of January 31, 2019. We had backlog of approximately $132.7 million as of January 31, 2018, which reflects the adoption of ASU No. 2014-09, Revenue from Contracts with Customers (Topic 606).
For additional information regarding our backlog and the seasonality in the sale of our offerings, see Item 7, “Management’s Discussion and Analysis of Financial Condition and Results of Operations —- Seasonality, Cyclicality and Quarterly Trends” of this Annual Report on Form 10-K.
Competition
We compete against a variety of large cloud service providers and software vendors, andas well as smaller specialized companies, open source projects and custom development efforts, which provide solutions in the specific markets we address. Our principal competitors include:
IT departments of potential customers which have undertaken custom software development efforts to analyze and manage their machine data;
companies targeting the big data market by commercializing open source software, such as the various Hadoop distributions and NoSQL data stores, including Elastic;
security, systems management and other IT vendors, including BMC Software, CA Technologies, Hewlett Packard Enterprise,Micro Focus, IBM, Intel, Microsoft, Dell Software and VMware;
business intelligence vendors, analytics and visualization vendors, including IBM and Oracle; and
The principal competitive factors in our markets are product features, performance and support, product scalability and flexibility, ease of deployment and use, total cost of ownership and time to value. We believe that we generally compete favorably on the basis of these factors. For example, Splunk Enterprise, Splunk Cloud, Splunk Light, Hunk, and our premium solutions all contain rich feature sets that reduce costly deployment cycles typically associated with enterprise software. Additionally, we offer a broad range of support options, and our customers consistently provide us with high ratings for our support.
Some of our actual and potential competitors have advantages over us, such as longer operating histories, significantly greater financial, technical, marketing or other resources, stronger brand and business user recognition, larger intellectual property portfolios, broader global distribution and presence, and competitive pricing. In addition, our industry is evolving rapidly and is becoming increasingly competitive. Larger and more established companies may focus on operational intelligence and could directly compete with us. Companies may develop open source basedsource-based alternatives that, customers may conclude, offer equivalent or superior functionality to our Splunk offerings. Smaller companies could also launch new offerings that we do not offer and that could gain market acceptance quickly.
Employees
As of January 31, 2016,2019, we had over 2,1004,400 employees. None of our United States employees is represented by a labor union with respect to his or her employment with us. Employees in certain European countries have the benefits of collective bargaining arrangements at the national level. We have not experienced any work stoppages.
Corporate Information
Our principal executive offices are located at 250270 Brannan Street, San Francisco, California 94107, and our telephone number is (415) 848-8400. We were incorporated in California in October 2003 and were reincorporated in Delaware in May 2006.
Our website is located at www.splunk.com and our investor relations website is located at http://investors.splunk.com. The information posted on our website is not incorporated into this Annual Report on Form 10-K. Our Annual Report on Form 10-K, Quarterly Reports on Form 10-Q, Current Reports on Form 8-K and amendments to reports filed or furnished pursuant to Sections 13(a) and 15(d) of the Securities Exchange Act of 1934, as amended, are available free of charge on our investor relations website as soon as reasonably practicable after we electronically file such material with, or furnish it to, the SEC. You may also access all of our public filings through the SEC’s website at www.sec.gov. Further, a copy of this Annual Report on Form 10-K is located at the SEC’s Public Reference Room at 100 F Street, NE, Washington, D.C. 20549. Information on the operation of the Public Reference Room can be obtained by calling the SEC at 1-800-SEC-0330.
We webcast our earnings calls and certain events we participate in or host with members of the investment community on our investor relations website. Additionally, we provide notifications of news or announcements regarding our financial performance, including SEC filings, investor events, press and earnings releases, as part of our investor relations website. The contents of these websites are not intended to be incorporated by reference into this report or in any other report or document we file.
| Item 1A. Risk Factors |
Our operations and financial results are subject to various risks and uncertainties including those described below. The risks and uncertainties described below are not the only ones we face. Additional risks and uncertainties that we are
unaware of, or that we currently believe are not material, also may become important factors that affect us. If any of the following risks or others not specified below materialize, our business, financial condition and results of operations could be materially adversely affected. In that case, the trading price of our common stock could decline.
Our future operating results may fluctuate significantly, we are transitioning our business model, and our recent operating results may not be a good indication of our future performance.
Our revenues, operating margins, cash flows and other operating results could vary significantly from period to period as a result of various factors, many of which are outside of our control. For example, we have historically generated a majority of our revenues from perpetual license agreements, whereby we generally recognize the license fee portion of the arrangement upfront, assuming all revenue recognition criteria are satisfied. Our customers also have the choice of entering into agreements for term licenses and/orand agreements for our cloud servicesservices. We are currently transitioning our business model to shift from sales of perpetual licenses in favor of sales of term licenses and subscription agreements for useour cloud services. This transition may give rise to a number of risks, and if we do not successfully execute this transition, our software, whereby the fee is recognizedbusiness and future operating results could be adversely affected.
Under accounting standards update No. 2014-09 (Topic 606), Revenue from Contracts with Customers, which we adopted as of February 1, 2018, we generally recognize term license revenues, in addition to perpetual license revenues, upfront and continue to recognize revenues associated with our cloud services ratably over the term of the agreement, and, in combination with our introduction of enterprise adoption agreements, or transactions that are designed to enable broad adoption of our software within an enterprise, we have seen the proportion of our customer orders where revenues will be recognized ratably increase steadily as a percentage of total orders.agreement. At the beginning of each quarter,period, we do not knowcannot predict the ratio between perpetual licensesof orders with revenues that will be recognized upfront and ratablythose with revenues that will be recognized agreementsratably that we will enter into during the quarter. In the fourth quarter of fiscal 2016, the percentage of licenseOur operating margins, cash flows and cloud orders that will be recognized ratably was 53%. As a result, ourother operating results and our business model could also be significantly impacted by unexpected shifts over time in the ratio betweenpercentage of term licenses and agreements for our cloud services we receive for our offerings and the duration of these types of agreements for our offerings. Term licenses and cloud services agreements have shorter contract duration than perpetual licenses, and ratably recognized agreements.the shift away from perpetual license sales could cause fluctuations in our operating results. In addition, the size of our licenses and orders varies greatly, and agreatly. A single, large perpetual or term license in a given period could distort our operating results, and a decline in larger orders in any given period could adversely affect our revenues and operating results. The timing and size of large transactionsorders are often hard to predict in any particular period. Further, a portion of revenue recognized in any given quarter is a result of ratably recognized agreements entered into during previous quarters, including agreements for our cloud services and maintenance and support agreements. Consequently, a decline in business from such ratably recognized agreements or maintenance and support agreements in any quarter may not be reflected in our revenue results for that quarter. Any such decline, however, will negatively affect our revenues in future quarters. Accordingly, the effect of downturns in sales and market acceptance of our offerings may not be fully reflected in our results of operations until future periods. Comparing our revenues and operating results on a period-to-period basis may not be meaningful, and youour past results should not rely on our past resultsbe relied upon as an indication of our future performance.
We may not be able to accurately predict our future revenues or results of operations. In particular, approximately half or more than half of the revenues we currently recognize each quarter has beenis attributable to sales made in that same quarter with the balance of the revenues being attributable to sales made in prior quarters in which the related revenues were not recognized upfront. As a result, our ability to forecast revenues on a quarterly or longer-term basis is extremely limited. We base our current and future expense levels on our operating plans and sales forecasts, and our operating costs are expected to be relatively fixed in the short-term. As a result, we may not be able to reduce our costs sufficiently to compensate for an unexpected shortfall in revenues, and even a small shortfall in revenues could disproportionately and adversely affect our financial results for that quarter.
In addition to other risk factors described elsewhere in this “Risk Factors” section, factors that may cause our financial results to fluctuate from quarter to quarter include:
the timing of our sales during the quarter, particularly because a large portion of our sales occur toward the end of the quarter, or the loss or delay of a few large contracts;transactions;
the mix of revenues attributable to larger transactions as opposed to smaller transactions and the impact that a few large transactions or a change in mix may have on our overall financial results as well as the overall average selling price (“ASP”) of our offerings;
the mix of revenues attributable to perpetual licenses and term licenses, subscriptions,agreements for our cloud services, enterprise adoption agreements, maintenance and professional services and training, which may impact our revenue, deferred revenue, billings, remaining performance obligations, gross margins and operating income;
the renewal and usage rates of our customers;
changes in the competitive dynamics of our market;
changes in customers’ budgets and in the timing of their purchasing decisions;
changes in our pricing policies or those of our competitors;
customers delaying purchasing decisions in anticipation of new offerings or software enhancements by us or our competitors;
customer acceptance of and willingness to pay for new versions of our offerings or new solutions for specific product and end markets;
our ability to successfully introduce and monetize new offerings and licensing and service models for our new offerings;
network outages or actual or perceived security breaches;
the availability and performance of our cloud services, including Splunk Cloud;
our ability to control costs, including our operating expenses;
the amount and timing of our stock-based compensation expenses;
changes in accounting standards, particularly those related to revenue recognition and sales commissions;
use of estimates, judgments and assumptions under current accounting standards;
the timing of satisfying revenue recognition criteria;
our ability to qualify and successfully compete for government contracts;
the collectability of receivables from customers and resellers, which may be hindered or delayed;
the removal of metered license enforcement via our software, which could lead to customers delaying renewal or purchasing decisions;
changes in laws and regulations that impact our business; and
general economic and political conditions and uncertainty, both domestically and internationally, as well as economic and political conditions and uncertainty specifically affecting industries in which our customers participate.
Many of these factors are outside our control, and the variability and unpredictability of such factors could result in our failing to meet or exceed our financial expectations for a given period. We believe that quarter-to-quarter comparisons of our revenues, operating results and cash flows may not necessarily be indicative of our future performance.
If we fail to effectively manage our growth, our business and operating results could be adversely affected.
Although our business has experienced significant growth, we cannot provide any assurance that our business will continue to grow at the same rate or at all. We have experienced and may continue to experience rapid growth in our headcount and operations, which has placed and will continue to place significant demands on our management and our operational and financial infrastructure. As of January 31, 2016,2019, approximately 40%36% of our employeesworkforce had been withemployed by us for less than one year. As we continue to grow, we must effectively integrate, develop and motivate a large number of new employees, while maintaining the effectiveness of our business execution and the beneficial aspects of our corporate culture. In particular, we intend to continue to make directed and substantial investments to expand our research and development, sales and marketing, and general and administrative organizations, as well as our international operations.
To effectively manage growth, we must continue to improve our operational, financial and management controls, and our reporting systems and procedures by, among other things:
improving our key business applications, processes and IT infrastructure to support our business needs;
enhancing information and communication systems to ensure that our employees and offices around the world are well-coordinated and can effectively communicate with each other and our growing base of customers and channel partners;
enhancing our internal controls to ensure timely and accurate reporting of all of our operations and financial results; and
appropriately documenting our IT systems and our business processes.
These systems enhancements and improvements will require significant capital expenditures and allocation of valuable management and employee resources. If we fail to implement these improvements effectively, our ability to manage our expected growth, ensure uninterrupted operation of key business systems and comply with the rules and regulations that are applicable to public reporting companies will be impaired. Additionally, if we do not effectively manage the growth of our business and operations, the quality of our offerings could suffer, which could negatively affect our brand, financial results and overall business.
We face intense competition in our markets, and we may be unable to compete effectively for sales opportunities.against our current and future competitors.
Although our offerings target the new and emerging market for software and cloud services that provide operational intelligence, we compete against a variety of large cloud service providers and software vendors, andas well as smaller specialized companies, open source projects and custom development efforts, which provide solutions in the specific markets we address. Our principal competitors include:
large cloud service providers, as well as small, specialized vendors, that provide complementary and competitive solutions in enterprise data analytics, security offerings, log aggregation and management, data warehousing and big data technologies that may compete with our offerings;
IT departments of potential customers which have undertaken custom software development efforts to analyze and manage their machine data;
companies targeting the big data market by commercializing open source software, such as the various Hadoop distributions and NoSQL data stores, including Elastic;
security, systems management and other IT vendors, including BMC Software, CA Technologies, Hewlett Packard Enterprise,Micro Focus, IBM, Intel, Microsoft Dell Software and VMware; and
business intelligence vendors, analytics and visualization vendors, including IBM and Oracle; and
The principal competitive factors in our markets include features, performance and support, scalability and flexibility, ease of deployment and use, total cost of ownership and time to value. Some of our actualcurrent and potential competitors have advantages over us, such as longer operating histories, significantly greater financial, technical, marketing or other resources, stronger brand and business user recognition, larger intellectual property portfolios, and broader global distribution and presence.presence and more developed ecosystems of partners and skilled users. Further, competitors may be able to offer products or functionality similar to ours at a more attractive price than we can, such as by integrating or bundling their software products with their other product offerings. In addition, our industry is evolving rapidly and is becoming increasingly competitive. Larger and more established companies may focus on operational intelligence and could directly compete with us. For example, companies may commercialize open source software, such as Hadoop or Elasticsearch, in a manner that competes with our offerings or causes potential customers to believe that such product and our offerings perform the same function. If companies move a greater proportion of their data and computational needs to the cloud, new competitors may emerge that offer services comparable to ours or that are better suited for cloud-based data, and the demand for our offerings may decrease. Smaller companies could also launch new products and services that we do not offer and that could gain market acceptance quickly.
In recent years, there have been significant acquisitions and consolidation by and among our actual and potential competitors. We anticipate this trend of consolidation will continue, which will present heightened competitive challenges to our business. In particular, consolidation in our industry increases the likelihood of our competitors offering bundled or integrated products, and we believe that it may increase the competitive pressures we face with respect to our offerings. If we are unable to differentiate our offerings from the integrated or bundled products of our competitors, such as by offering enhanced functionality, performance or value, we may see decreased demand for those offerings, which would adversely affect our business operations, financial results and growth prospects. Further, it is possible that continued industry consolidation may impact customers’ perceptions of the viability of smaller or even medium-sized software firms and consequently their willingness to use software solutions from such firms. Similarly, if customers seek to concentrate their software license purchases in the product portfolios of a few large providers, we may be at a competitive disadvantage regardless of the performance and features of our offerings. We believe that in order to remain competitive at the large enterprise level, we will need to develop and expand relationships with resellers and large system integrators that provide a broad range of products and
services. If we are unable to compete effectively, our business operations and financial results could be materially and adversely affected.
Because we deriveour business substantially all of our revenues and cash flows fromdepends on sales of licenses, maintenance and services related to one software product, failure of this productoffering to satisfy customer demands or to achieve increased market acceptance would adversely affect our business, results of operations, financial condition and growth prospects.
Although we have recently introduced several newsoftware and services offerings, our business substantially depends on, and we derive and expect our business to continue to derive substantially all of our license revenues and cash flows fromdepend on, sales of licenses, maintenance and services related to Splunk Enterprise. As such, the market acceptance of Splunk Enterprise is critical to our continued success. Demand for licenses to Splunk Enterprise is affected by a number of factors beyond our control, including continued market acceptance of Splunk Enterprise by referenceable accounts for existing and new use cases, the timing of development and release of new products by our competitors, technological change, and growth or contraction in our market. In addition, users of software that provides operational intelligence may seek a cloud-based service, and although we offer a cloud service with the features and functionality of Splunk Enterprise, it currently represents a de minimis percentage of our overall revenues. We expect the proliferation of machine data to lead to an increase in the data analysis demands of our customers, and our offerings may not be able to scale and perform to meet those demands or may not be chosen by users for those needs. If we are unable to continue to meet customer demands or to achieve more widespread market acceptance of Splunk Enterprise, our business operations, financial results and growth prospects will be materially and adversely affected.
If customers do not expand their use of our offerings beyond the current predominant use cases, our ability to grow our business and operating results may be adversely affected.
Most of our customers currently use our offerings to support application management, IT operations, security and compliance functions. Our ability to grow our business depends in part on our ability to persuadehelp enable current and future customers to increase their use of our offerings for their existing use cases and expand their use of our offerings to additional use cases, such as facilities management, supply chain management, business analytics, IoT and customer analytics. If we fail to achieve market acceptance of our offerings for these applications, if we fail to predict demand for product functionality or respond to such demand in a timely fashion, if our customers are not satisfied with our offerings, or if a competitor establishes a more widely adopted solution for these applications, our ability to grow our business and financial results will be adversely affected.
We employ multiple, unique and evolving pricing models, which subject us to various pricing and licensing challenges that could make it difficult for us to derive value from our customers and may adversely affect our operating results.
We employ multiple, unique and evolving pricing models for our offerings. For example, we generally charge our customers for their use of Splunk Enterprise and Splunk Light based on their estimated peak daily indexing capacity. In addition, Splunk Cloud is generally priced based on peak daily indexing capacity and data storage, and Hunk licenses are priced based on the number of Hadoop data nodes while Splunk User Behavior Analytics is priced by the number of monitored user orand system accounts. We offer both perpetual and term licensing options for on-premises offerings, as well as a subscription model for cloud services, which each have different payment schedules, and depending on the mix of such licenses and cloud subscriptions, our revenues or deferred revenues could be adversely affected. Our pricing models may ultimately result in a higher total cost to our customers generally as data volumes increase over time, or may cause our customers to limit or decrease usage in order to stay within the limits of their existing licenses or lower their costs, making it more difficult for us to compete in our markets.markets or negatively impacting our financial results. As the amount of machine data within our customers’ organizations grows, we face downward pressure from our customers regarding our pricing, which could adversely affect our revenues and operating margins. In addition, our unique pricing models may allow competitors with different pricing models to attract customers unfamiliar or uncomfortable with our pricing models, which
Furthermore, while our offerings can measure and limit customer usage, we removed metered license enforcement via our software under certain circumstances, and in other circumstances, such limitations may be improperly circumvented or otherwise bypassed by certain users. Similarly, we provide our customers with an encrypted license key for enabling their use of our offerings. There is no guarantee that users of our offerings will abide by the terms of these license limitations or encrypted license keys, and if they do not, we may not be able to capture the full value for the use of our offerings. For example, our enterprise license is generally meant for our customers’ internal use only. If our internal use customers improperly make our offerings available to their customers or other third parties, for example, through a cloud or managed service offering not authorized by us, it may displace our end user sales. Additionally, if an internal use customer that has received a volume discount from us improperly makes available our offerings to its end customers, we may experience price erosion and be unable to capture the appropriate value from those end customers.
Our license agreements generally provide that we can audit our customers’ use of our offerings or require them to certify their actual usage to ensure compliance with the terms of our license agreement at our request. However, a customer may resist or refuse to allow us to audit their usage, in which case we may have to pursue legal recourse to enforce our rights under the license agreement, which would require us to spend money, distract management and potentially adversely affect our relationship with our customers and users.
The market for our offerings may not grow.
We believe our future success will depend in large part on the growth, if any, in the market for offerings that provide operational intelligence, particularly from machine data. We market our offerings as targeted solutions for specific use cases and as an enterprise solution for machine data. In order to grow our business, we intend to expand the functionality of our offerings to increase their acceptance and use by the broader market as well as develop new offerings. It is difficult to predict customer adoption and renewal rates, customer demand for our offerings, the size and growth rate of this market, the entry of competitive products or the success of existing competitive products. Any expansion in our market depends on a number of factors, including the cost, performance and perceived value associated with our offerings. If our offerings do not achieve widespread adoption or there is a reduction in demand for products in our market caused by a lack of customer acceptance or expansion, technological challenges, security concerns, decreases in accessible machine data, competing technologies and products, pricing pressure, decreases in corporate or information technology spending, weakening economic conditions, or otherwise, it could result in reduced customer orders, early terminations, reduced renewal rates or decreased revenues, any of which would adversely affect our business operations and financial results. We believe that these are inherent risks and difficulties in this new and unproven market.
We are a growing company in an evolving industry, which makes it difficult to evaluate our future prospects and may increase the risk that we will not be successful.
As a growing company in an evolving industry, we have encountered and will continue to encounter risks and uncertainties, including our ability to plan for and model future growth. If our assumptions regarding these uncertainties, which we use to plan our business, are incorrect or change in reaction to changes in our markets, or if we do not effectively expandaddress these risks successfully, our operating and trainfinancial results could differ materially from our sales force, we may be unable to add new customers or increase sales to our existing customersexpectations and our business will be adversely affected.
improve the performance and capabilities of our offerings and technology and architecture through research and development;
continue to develop, enhance, expand adoption of and globally deliver our cloud services, including Splunk Cloud, and comply with applicable laws in recruiting, trainingeach jurisdiction in which we offer such services;
successfully develop, introduce and retaining sufficient numbersexpand adoption of sales personnelnew offerings;
continue to supportacquire new customers and increase the number of new customers we acquire;
increase revenues from existing customers through increased or broader use of our growth. New hires require significant trainingofferings within their organizations;
successfully and may take significant time before they achieve full productivity. Our recent hirescontinuously expand our business domestically and planned hiresinternationally;
maintain and expand our customer base and the ways in which our customers use our offerings;
successfully compete with other companies, open source projects and custom development efforts that are currently in, or may not become productive as quickly as we expect, and we may be unable to hire or retain sufficient numbers of qualified individuals in the future enter, the markets where we dofor our offerings;
successfully provide our customers a compelling business or plancase to do business. In addition, as we continue to grow rapidly,purchase our offerings in a large percentage oftime frame that matches our sales force is new to the company and our offerings. Our growth creates additional challengescustomers’ sales and risks with respectpurchase cycles and at a compelling price point;
respond timely and effectively to attracting, integrating and retaining qualified employees, particularly sales personnel. If we are unable to hire and train sufficient numbers of effective sales personnel, or the sales personnel are not successful in obtaining new customers or increasing sales to our existing customer base, our business will be adversely affected.
appropriately price our offerings;
manage the short-term difficulty in adjustingcosts of providing our operating expenses. Our operating results depend in part on sales to large customerscloud services;
generate leads and conversions ofconvert users of the trial versions of our offerings intoto paying customers. The lengthcustomers;
prevent users from circumventing the terms of their licenses and cloud subscriptions;
continue to invest in our platform to deliver additional enhancements and content for our offerings and to foster an ecosystem of developers and users to expand the use cases of our sales cycle, from initial evaluationofferings;
maintain and enhance our website and cloud services infrastructure to delivery ofminimize interruptions when accessing our offerings;
process, store and payment foruse our employees, customers’ and other third parties’ data in compliance with applicable governmental regulations and other legal obligations related to data privacy, data protection, data transfer, data residency, encryption and security;
hire, integrate and retain world-class professional and technical talent; and
successfully integrate acquired businesses and technologies.
If we fail to address the software license, varies substantially from customer to customer. In addition, the introduction ofrisks and difficulties we face, including those described elsewhere in this “Risk Factors” section, our Splunk Cloud service has generated interest frombusiness will be adversely affected and our customers who are also considering purchasingbusiness operations and deploying Splunk Enterprise on-premises. In some cases, our customers may wish to consider a combination of these offerings, potentially further slowing our sales cycle. Our sales cycle can extend to more than a year for certain customers, particularly large customers. It is difficult to predict exactly when, or even if, we will make a sale with a potential customer or if a user of a trial version of one of our offerings will upgrade to the paid version of that offering. As a result, large individual sales have, in some cases, occurred in quarters subsequent to those we anticipated, or have not occurred at all. The loss or delay of one or more large transactions in a quarter could impact our operating results for that quarter and any future quarters for which revenues from that transaction is delayed. As a result of these factors, it is difficult for us to forecast our revenues accurately in any quarter. Because a substantial portion of our expenses are relatively fixed in the short-term, our operatingfinancial results will suffer if revenues fall below our expectations in a particular quarter, which could cause the price of our common stock to decline.suffer.
Our business and growth depend substantially on customers entering into, renewing, upgrading and expanding their term licenses, agreements for cloud services and maintenance and support agreements with us. Any decline in our customer renewals, upgrades or expansions could adversely affect our future operating results.
While much of ourwe offer software is sold under perpetual license agreements, all of our maintenance and support agreements are sold on a term basis. In addition, we also enter into renewable term license agreements for our offerings.on-premises offerings and agreements for our cloud services. In order for us to improve our operating results, it is important that customers enter into renewable agreements, and our existing customers renew, upgrade and expand their term licenses, if applicable,agreements for cloud services and maintenance and support agreements when the initial contract term expires. Our customers have no obligation to renew, upgrade or expand their term licenses, agreements for cloud services or maintenance and support agreements with us after the initial terms have expired. Our customers’ renewal, upgrade and expansion rates may decline or fluctuate as a result of a number of factors, including their satisfaction or dissatisfaction with our offerings, our pricing, the effects of economic conditions, competitive offerings or alterations or reductions in our customers’ spending levels. If our customers do not renew, upgrade or expand their agreements with us or renew on terms less favorable to us, our revenues may decline.
We have a history of losses, and we may not be profitable in the future.
We have incurred net losses in each year since our inception. As a result, we had an accumulated deficit of $1.23 billion at January 31, 2019. Because the market for our offerings continues to evolve and has not yet reached widespread adoption, it is difficult for us to predict our future operating results. We expect our operating expenses to increase over the next several years as we hire additional personnel, expand and improve the effectiveness of our distribution channels, improve the performance and scalability of our technology architecture, and continue to develop features and functionality for our offerings. In addition, as a public company, we have incurred and will continue to incur significant legal, accounting and other operating expenses. If our revenues do not increase to offset these increases in our operating expenses, we may not be profitable in future periods. Our historical revenue growth has been inconsistent and should not be considered indicative of our future performance. Further, in future periods, our revenue growth could slow, or our revenues could decline for a number of reasons, including slowing demand for our offerings, increasing competition, a decrease in the growth of our overall market, or our failure, for any reason, to continue to capitalize on growth opportunities. Any failure by us to achieve, sustain or increase profitability on a consistent basis could cause the value of our common stock to decline.
If we or our third-party service providers experience a security breach or unauthorized parties otherwise obtain access to our customers’ data, our data, or our cloud services, our offerings may be perceived as not being secure, our reputation may be harmed, demand for our offerings may be reduced, and we may incur significant liabilities.
Our international salesofferings involve the storage and operations subject ustransmission of data, and security breaches could result in the loss of this information, litigation, indemnity obligations, fines, penalties and other liability. We may become the target of cyber-attacks by third parties seeking unauthorized access to additional risksour data or users’ data or to disrupt our ability to provide service. While we have taken steps to protect the confidential information that can adversely affectwe have access to, including confidential information we may obtain through our customer support services or customer usage of our cloud services, our security measures or those of our third-party service providers could be breached or we could suffer data loss. Computer malware, viruses, social engineering (predominantly spear phishing attacks), and general hacking have become more prevalent in our industry, particularly against cloud services. In the first quarter of fiscal 2019, we took corrective action against an attacker who utilized compromised credentials to create and delete compute infrastructure in the Splunk Cloud environment. In addition, we do not directly control content that customers store in our offerings. If customers use our offerings for the transmission or storage of personally identifiable information and our security measures are or are believed to have been breached as a result of third-party action, employee error, malfeasance or otherwise, our reputation could be damaged, our business operationsmay suffer, and financial results.we could incur significant liability.
Because there are unablemany different security breach techniques and such techniques continue to engage with non-U.S. customers effectively with our limited sales force capacity or our indirect sales model,evolve, we may be unable to grow salesanticipate attempted security breaches and implement adequate preventative measures. Third parties may also conduct attacks designed to existingtemporarily deny customers access to our cloud services. Any security breach or other security incident, or the same degree we have experiencedperception that one has occurred, could result in a loss of customer confidence in the United States.
We use third-party technology and systems for a variety of risksreasons, including, without limitation, encryption and challenges, including:
to us on economically reasonable terms, or region;
Interruptions or performance problems associated with our technology and infrastructure, and our reliance on Software-as-a-Service or SaaS,(“SaaS”) technologies from third parties, may adversely affect our business operations and financial results.
Our continued growth depends in part on the ability of our existing and potential customers to use and access our cloud services or our website in order to download our on-premises software or encrypted access keys for our software within an acceptable amount of time. We have experienced, and may in the future experience, website and cloud service disruptions, storage failures, outages and other performance problems due to a variety of factors, including infrastructure changes, human or software errors, capacity constraints due to an overwhelming number of users accessing our website and services simultaneously, andunauthorized access, denial of service, security or fraud or securityransomware attacks. In some instances, we may not be able to identify the cause or causes of these website andor service performance problems within an acceptable period of time. It may become increasingly difficult to maintain and improve our website and service performance, especially during peak usage times and as our offerings become more complex and our user traffic increases. If our website or cloud services are unavailable or if our users are unable to download our software or encrypted access keys within a reasonable amount of time or at all, our business would be negatively affected. We expect to continue to make significant investments to maintain and improve website and service performance and to enable rapid releases of new features and apps for our offerings. To the extent that we do not effectively address capacity constraints, upgrade our systems as needed and continually develop our technology and network architecture to accommodate actual and anticipated changes in technology, our business and operating results may be adversely affected.
In addition, we rely heavily on hosted SaaS technologies from third parties in order to operate critical functions of our business, including enterprise resource planning services and customer relationship management services. Further, our cloud services, such as Splunk Cloud, are hosted exclusively by third parties. We currently offer a 100% uptime service level agreement (“SLA”) for Splunk Cloud. If any of these services fail or become unavailable due to extended outages, interruptions or because they are no longer available on commercially reasonable terms or prices, or if we are unable to deliver 100% uptime under our SLAs, our revenues could be reduced, our reputation could be damaged, we could be exposed to legal liability, expenses could increase, our ability to manage our finances could be interrupted and our processes for managing sales of our offerings and supporting our customers could be impaired until equivalent services, if available, are identified, obtained and implemented, all of which could adversely affect our business.
Our systems and third-party systems upon which we rely are also vulnerable to damage or interruption from catastrophic occurrences such as earthquakes, floods, fires, power loss, telecommunication failures, terrorist attacks, criminal acts, sabotage, other intentional acts of vandalism and misconduct, geopolitical events and similar events. Our United States corporate offices and certain of the facilities we lease to house our computer and telecommunications equipment are located in the San Francisco Bay Area, a region known for seismic activity. Despite any precautions we may take, the occurrence of a natural disaster or other unanticipated problems at our and our third parties’ hosting facilities could result in interruptions, performance problems or failure of our infrastructure.
Splunk Cloud, as well as cloud services for other products, require costly and continual infrastructure investments, and market adoption of these cloud services could adversely affect our business.
A cloud-based model of software deployment is one in which a software provider typically licenses an application to customers for use as a service on demand through web browser technologies. Delivering software under a cloud-based model results in higher costs and expenses when compared to sales of on-premises licenses for similar functionality. In recent years, companies have begun to expect that key software, such as customer relationship management and enterprise resource planning systems, be provided through a cloud-based model. Many of our offerings are now made available in the cloud as well as on-premises. Customers can sign up for Splunk Cloud and other services and avoid the need to provision, deploy and manage internal infrastructure. In order to provide Splunk Cloud and other services via a cloud-based deployment, we have made and will continue to make capital investments and incur substantial costs to implement and maintain this alternative business model, which could negatively affect our financial results. In addition, as we look to deliver more cloud services, we are making significant technology investments to deliver new capabilities and advance our software to deliver cloud-native customer experiences. If we are not successful with returns from these investments, our financial results, business model and competitive
position could suffer. We expect that over time the percentage of our revenue attributable to our cloud services will increase. If our cloud services, in particular Splunk Cloud, do not garner widespread market adoption, or there is a reduction in demand for cloud-based services caused by a lack of customer acceptance, technological challenges, weakening economic or political conditions, security or privacy concerns, inability to properly manage such services, competing technologies and products, decreases in corporate spending or otherwise, our financial results, business model and competitive position could suffer. If we are unable to decrease the cost of providing our cloud services, our gross margins may decrease and negatively impact our overall financial results. Transitioning to a cloud-based model also impacts the way we recognize revenues, which may affect our operating results and could have an adverse effect on our business operations and financial results.
Even with these investments and costs, the cloud-based business model for Splunk Cloud and other services may not be successful, as some customers may desire only on-premises licenses to our offerings. Our cloud services may raise concerns among customers, including concerns regarding changes to pricing models, service availability, scalability, ability to use customer-developed apps, information security of a cloud-based service and hosted data and access to data while offline or once a subscription has expired. Market acceptance of our cloud services can be affected by a variety of factors, including but not limited to: security, reliability, performance, terms of service, support terms, customer preference, community engagement, customer concerns with entrusting a third-party to store and manage their data, public concerns regarding data privacy or data protection, and the enactment of restrictive laws or regulations in the affected jurisdictions. If we or other providers of cloud-based services experience security incidents or breaches, loss of customer data, disruptions in delivery of services, network outages, disruptions in availability of the internet, unauthorized access or other problems, the market for cloud-based services as a whole, including Splunk Cloud, may be negatively affected. Moreover, sales of Splunk Cloud and other services could displace sales of our on-premises software licenses. Alternatively, subscriptions to Splunk Cloud and other services that exceed our expectations may unexpectedly increase our costs, lower our margins, lower our profits or increase our losses and otherwise negatively affect our projected financial results.
If we do not effectively expand, train, manage changes to, and retain our sales force, we may be unable to add new customers or increase sales to our existing customers, and our revenue growth and business could be adversely affected.
We continue to be substantially dependent on our sales force to effectively execute our sales strategies to obtain new customers and to drive additional use cases and adoption among our existing customers. We believe that there is significant competition for sales personnel with the skills and technical knowledge that we require. Our ability to achieve significant revenue growth will depend, in large part, on our success in recruiting, training and retaining sufficient numbers of sales personnel to support our growth. New hires require significant training and may take a significant amount of time before they achieve full productivity. Our recent hires and planned hires may not become productive as quickly as we expect, and we may be unable to hire or retain sufficient numbers of qualified individuals in the markets where we do business or plan to do business. In addition, as we continue to grow rapidly, a large percentage of our sales force is new to the company and our offerings. As our sales strategies evolve, additional training for new hires and our existing team may be required for our sales force to successfully execute on those strategies. We periodically adjust our sales organization as part of our efforts to optimize our sales operations to grow revenue. If we have not structured our sales organization or compensation for our sales organization properly, if we fail to make changes in a timely fashion or do not effectively manage changes, our revenue growth could be adversely affected. Our growth creates additional challenges and risks with respect to attracting, integrating and retaining qualified employees, particularly sales personnel. If we are unable to hire and train sufficient numbers of effective sales personnel, or the sales personnel are not successful in obtaining new customers or increasing sales to our existing customer base, our business will be adversely affected.
Our sales cycle is long and unpredictable, particularly with respect to large customers, and our sales efforts require considerable time and expense.
Our operating results may fluctuate, in part, because of the resource intensive nature of our sales efforts, the length and variability of the sales cycle of our offerings and the short-term difficulty in adjusting our operating expenses. Our operating results depend in part on sales to large customers. The length of our sales cycle, from initial evaluation to delivery of and payment for the software license, varies substantially from customer to customer. In addition, the introduction of Splunk Cloud has generated interest from our customers who are also considering purchasing and deploying Splunk Enterprise on-premises. In some cases, our customers may wish to consider a combination of these offerings, potentially further slowing our sales cycle. Our sales cycle can extend to more than a year for certain customers, particularly large customers. It is difficult to predict exactly when, or even if, we will make a sale with a potential customer or if a user of a trial version of one of our offerings will upgrade to the paid version of that offering. As a result, large individual sales have, in some cases, occurred in quarters subsequent to those we anticipated, or have not occurred at all. The loss or delay of one or more large transactions in a quarter
could impact our operating results for that quarter and any future quarters for which revenues from that transaction is delayed. As a result of these factors, it is difficult for us to forecast our revenues accurately in any quarter. Because a substantial portion of our expenses are relatively fixed in the short-term, our operating results will suffer if revenues fall below our expectations in a particular quarter, which could cause the price of our common stock to decline.
Our international sales and operations subject us to additional risks and challenges that can adversely affect our business operations and financial results.
During the fiscal year ended January 31, 2019, we derived approximately 29% of our total revenues from customers outside the United States, and we are continuing to expand our international operations as part of our growth strategy. We currently have sales personnel and sales and support operations in the United States and certain countries around the world. To the extent that we experience difficulties in recruiting, training, managing, or retaining non-U.S. staff, and specifically sales management and sales personnel staff, we may experience difficulties in sales productivity in, or market penetration of, non-U.S. markets. Additionally, our sales organization outside the United States is substantially smaller than our sales organization in the United States, and we rely heavily on our indirect sales channel for non-U.S. sales. Our ability to convince customers to expand their use of our offerings or renew their maintenance and support agreements with us is directly correlated to our direct engagement with the customer. To the extent we are unable to engage with non-U.S. customers effectively with our limited sales force, professional services and support capacity or our indirect sales model, we may be unable to grow sales to existing customers to the same degree we have experienced in the United States.
Our international operations subject us to a variety of risks and challenges, including:
increased management, travel, infrastructure and legal compliance costs associated with having multiple international operations;
reliance on channel partners, which may have different incentives or may sell competing products, as well as different approaches with respect to compliance with laws and regulations, business practices and other day-to-day activities;
longer payment cycles and difficulties in collecting accounts receivable or satisfying revenue recognition criteria, especially in emerging markets;
increased financial accounting and reporting burdens and complexities;
general economic conditions in each country or region;
economic and political uncertainty around the world;
compliance with multiple and changing foreign laws and regulations, including those governing employment, tax, privacy and data protection, data transfer and the risks and costs of non-compliance with such laws and regulations;
compliance with laws and regulations for foreign operations, including the United States Foreign Corrupt Practices Act, the United Kingdom Bribery Act, import and export control laws, tariffs, trade barriers, economic sanctions and other regulatory or contractual limitations on our ability to sell our offerings in certain foreign markets, and the risks and costs of non-compliance, including as a result of any changes in trade relations, sanctioned parties or other restrictions;
heightened risks of unfair or corrupt business practices in certain geographies and of improper or fraudulent sales arrangements that may impact financial results and result in restatements of financial statements and irregularities in financial statements;
fluctuations in currency exchange rates and the related effect on our financial results;
difficulties in repatriating or transferring funds from or converting currencies in certain countries;
the need for localized software and licensing programs;
reduced protection for intellectual property rights in some countries and practical difficulties of enforcing intellectual property and contract rights abroad; and
compliance with the laws of numerous foreign taxing jurisdictions and overlapping of different tax regimes.
Further, following a referendum in June 2016 in which voters in the United Kingdom approved an exit from the EU, the United Kingdom government has initiated a process to leave the EU (often referred to as “Brexit”). Brexit has led to economic and legal uncertainty in the region and could adversely affect the tax, operational, legal and regulatory regimes to which our business is subject. Brexit may subject us to new regulatory costs and challenges, in addition to other adverse effects that we are unable effectively to anticipate.
Any of these risks could adversely affect our international operations, reduce our international revenues or increase our operating costs, adversely affecting our business operations, financial results and growth prospects.
In addition, compliance with laws and regulations applicable to our international operations increases our cost of doing business in foreign jurisdictions. We may be unable to keep current with changes in foreign government requirements and laws as they change from time to time. Failure to comply with these regulations could have adverse effects on our business. In many foreign countries, it is common for others to engage in business practices that are prohibited by our internal policies and procedures or United States regulations applicable to us. In addition, although we have implemented policies and procedures designed to ensure compliance with these laws and policies, there can be no assurance that all of our employees, contractors, channel partners and agents will comply with these laws and policies. Violations of laws or key control policies by our employees, contractors, channel partners or agents could result in delays in revenue recognition, financial reporting misstatements, fines, penalties, or the prohibition of the importation or exportation of our offerings and could have a material adverse effect on our business operations and financial results.
If we are unable to maintain successful relationships with our channel partners, and to help our channel partners enhance their ability to independently sell and deploy our offerings, our business operations, financial results and growth prospects could be adversely affected.
In addition to our direct sales force, we use indirect channel partners, such as distributors and resellers, to license, provide professional services and support our offerings. We derive a portion of our revenues from sales of our offerings through our channel partners, particularly in the Europe, Middle East and Africa, or EMEA, and Asia Pacific, or APAC, regions and for sales to government agencies. We expect that sales through channel partners in all regions will continue to grow as a portion of our revenues for the foreseeable future. As changes in our channel strategy are implemented, including potentially emphasizing partner-sourced transactions, results from sales through our channel partners may be adversely affected.
Our agreements with our channel partners are generally non-exclusive, meaning our channel partners may offer customers the products of several different companies, including products that compete with ours. If our channel partners do not effectively market and sell our offerings, choose to use greater efforts to market and sell their own products or those of our competitors, or fail to meet the needs of our customers, our ability to grow our business and sell our offerings may be adversely affected. Our channel partners may cease marketing our offerings with limited or no notice and with little or no penalty. The loss of a substantial number of our channel partners, our possible inability to replace them, or the failure to recruit additional channel partners could materially and adversely affect our results of operations. In addition, sales by channel partners are more likely than direct sales to involve collectability concerns, in particular sales by our channel partners in developing markets, and accordingly, variations in the mix between revenues attributable to sales by channel partners and revenues attributable to direct sales may result in fluctuations in our operating results.
Our ability to achieve revenue growth in the future will depend in part on our success in maintaining successful relationships with our channel partners, and to help our channel partners enhance their ability to independently sell and deploy our offerings. In order to achieve these objectives, we may be required to adjust our incentives, pricing or discount programs for our channel partners, which could adversely affect our operating results. If we are unable to maintain our relationships with these channel partners, or otherwise develop and expand our indirect distribution channel, our business, results of operations, financial condition or cash flows could be adversely affected.
Incorrect or improper implementation or use of our software could result in customer dissatisfaction, customer data loss or corruption and negatively affect our business, operations, financial results and growth prospects.
Our software is deployed in a wide variety of technology environments. Increasingly, our software has been deployed in large scale, complex technology environments, and we believe our future success will depend on our ability to increase sales of our software licenses for use in such deployments. We often must assist our customers in achieving successful
implementations for large, complex deployments. If we or our customers are unable to implement our software successfully, are unable to do so in a timely manner or if an improper implementation or change in system configuration results in errors or loss of data, customer perceptions of our company may be impaired, our reputation and brand may suffer, and customers may choose not to increase their use of our offerings. In addition, our software imposes server load and index storage requirements for implementation. If our customers do not have the server load capacity or the storage capacity required, they may not be able to effectively implement and use our software and, therefore, may not choose to increase their use of our offerings.
Our customers and third-party partners may need training in the proper use of and the variety of benefits that can be derived from our software to maximize its potential. If our software is not implemented or used correctly or as intended, inadequate performance, errors, data loss or corruption may result. Because our customers rely on our software and maintenance and support services to manage a wide range of operations, the incorrect or improper implementation or use of our software, our failure to train customers on how to efficiently and effectively use our software, or our failure to provide maintenance services to our customers, may result in negative publicity or legal claims against us. Also, as we continue to expand our customer base, any failure by us to properly provide these services will likely result in lost opportunities for follow-on sales of our offerings.
We are subject to governmental export and import controls that could impair our ability to compete in international markets or subject us to liability if we violate the controls.
Our offerings are subject to United States export controls, and we incorporate encryption technology into certain of our offerings. These encryption offerings and the underlying technology may be exported outside of the United States only with the required export authorizations, including by license.
Furthermore, our activities are subject to the U.S. economic sanctions laws and regulations that prohibit the shipment of certain products and services without the required export authorizations or export to countries, governments, and persons targeted by U.S. sanctions. While we take precautions to prevent our offerings from being exported in violation of these laws, including obtaining authorizations for our encryption offerings, implementing IP address blocking and screenings against U.S. Government and international lists of restricted and prohibited persons, we cannot guarantee that the precautions we take will prevent violations of export control and sanctions laws. For example, downloads of our free software may have in the past been made in potential violation of the export control and economic sanctions laws.
We also note that if our channel partners fail to obtain appropriate import, export or re-export licenses or permits, we may also be adversely affected, through reputational harm as well as other negative consequences including government
investigations and penalties. We presently incorporate export control compliance requirements in our channel partner agreements. Complying with export control and sanctions regulations for a particular sale may be time-consuming and may result in the delay or loss of sales opportunities.
Violations of U.S. sanctions or export control laws can result in fines or penalties, including civil penalties of up to $250,000$300,000 or twice the value of the transaction, whichever is greater, per violation. In the event of criminal knowing and willful violations of these laws, fines of up to $1 million per violation and possible incarceration for responsible employees and managers could be imposed. We cannot predict when
During the pendency of our acquisition of VictorOps, we discovered a small number of instances where the software as a service platform was accessed (or attempted to be accessed) from IP addresses potentially located in embargoed countries. VictorOps filed an initial voluntary disclosure with the U.S. Treasury Department’s Office of Foreign Assets Control (“OFAC”) in June 2018 to alert the agency to these potential violations. After completion of the acquisition, we conducted an internal investigation into these potential violations and filed a Final Voluntary Disclosure with OFAC with respect to these matters in November 2018. In March 2019, OFAC notified us that it had completed its review of this matter and BIS will complete their reviewsclosed its review with the issuance of a Cautionary Letter. No monetary penalties or what enforcement action, if any, they will take.other sanctions were imposed by the agency in connection with its investigation.
Also, various countries, in addition to the United States, regulate the import and export of certain encryption and other technology, including import and export permitting and licensing requirements, and have enacted laws that could limit our ability to distribute our offerings or could limit our customers’ ability to implement our offerings in those countries. Changes in our offerings or future changes in export and import regulations may create delays in the introduction of our offerings in international markets, prevent our customers with international operations from deploying our offerings globally or, in some cases, prevent the export or import of our offerings to certain countries, governments, or persons altogether. Any change in export or import regulations, economic sanctions or related legislation, or change in the countries, governments, persons or
technologies targeted by such regulations, could result in decreased use of our offerings by, or in our decreased ability to export or sell our offerings to, existing or potential customers with international operations. Any decreased use of our offerings or limitation on our ability to export or sell our offerings would likely adversely affect our business operations and financial results.
If our new offerings and product enhancements do not achieve sufficient market acceptance, our financial results and competitive position will suffer.
We spend substantial amounts of time and money to research and develop new offerings and enhanced versions of our existing offerings to incorporate additional features, improve functionality or other enhancements in order to meet our customers’ rapidly evolving demands. In addition, we continue to invest in solutions that can be deployed on top of our platform to target specific use cases and to cultivate our community of application developers and users. When we develop a new or enhanced version of an existing offering, we typically incur expenses and expend resources upfront to market, promote and sell the new offering. Therefore, when we develop and introduce new or enhanced offerings, they must achieve high levels of market acceptance in order to justify the amount of our investment in developing and bringing them to market. For example, if our cloud services such as Splunk Cloud do not garner widespread market adoption and implementation, our financial results and competitive position could suffer.
Further, we may make changes to our offerings that our customers do not like, find useful or agree with. We may also discontinue certain features, begin to charge for certain features that are currently free or increase fees for any of our features or usage of our offerings.
Our new offerings or product enhancements and changes to our existing offerings could fail to attain sufficient market acceptance for many reasons, including:
our failure to predict market demand accurately in terms of product functionality and to supply offerings that meet this demand in a timely fashion;
defects, errors or failures;
negative publicity about their performance or effectiveness;
delays in releasing to the market our new offerings or enhancements to our existing offerings to the market;
introduction or anticipated introduction of competing products by our competitors;
poor business conditions for our end-customers, causing them to delay IT purchases; and
reluctance of customers to purchase products incorporating open source software.
If our new offerings or enhancements and changes do not achieve adequate acceptance in the market, our competitive position will be impaired, and our revenues will be diminished. The adverse effect on our financial results may be particularly acute because of the significant research, development, marketing, sales and other expenses we will have incurred in connection with the new offerings or enhancements.
Our business depends, in part, on sales to the public sector, and significant changes in the contracting or fiscal policies of the public sector could have a material adverse effect on our business.
We derive a portion of our revenues from contracts with federal, state, local and foreign governments, and we believe that the success and growth of our business will continue to depend on our successful procurement of government contracts. Factors that could impede our ability to maintain or increase the amount of revenues derived from government contracts, include:
changes in fiscal or contracting policies;
decreases in available government funding;
changes in government programs or applicable requirements;
changes in government sanctions programs and related policies;
the adoption of new laws or regulations or changes to existing laws or regulations;
noncompliance with contract provisions or government procurement or other applicable regulations;
ability to obtain or maintain any required facility clearances or security clearances for our employees;
an extended government shutdown or other potential delays or changes in the government appropriations or other funding authorization processes; and
delays in the payment of our invoices by government payment offices.
The occurrence of any of the foregoing could cause governments and governmental agencies to delay or refrain from purchasing licenses of our offerings in the future or otherwise have an adverse effect on our business operations and financial results.
Failure to comply with laws or regulations applicable to our business could cause us to lose customers in the public sector, subject us to fines and penalties, or negatively impact our ability to contract with the public sector.
We must comply with laws and regulations relating to the formation, administration and performance of contracts with the public sector, including United States federal, state and local governmental bodies and foreign governmental bodies, which affect how our channel partners and how we do business with governmental agencies. These laws and regulations provide public sector customers rights, many of which are not typically found in commercial contracts. These may include rights with respect to price protection, the accuracy of information provided to the government, compliance with supply chain requirements and supplier diversity policies, and other terms that are particular to public sector customers. These laws and regulations may impose added costs on our business, and failure to comply with these or other applicable regulations and requirements, including non-compliance in the past, could lead to claims for damages from our channel partners,or other relief, penalties, termination of contracts, loss of exclusive rights in our intellectual property, and temporary suspension or permanent debarment from government contracting. Any such damages, penalties, disruptions or limitations in our ability to do business with the public sector could have a material adverse effect on our business operations and financial results.
Real or perceived errors, failures or bugs in our offerings could adversely affect our financial results and growth prospects.
Because our offerings are complex, undetected errors, failures or bugs may occur, especially when new offerings, versions or updates are released. Our on-premises software is often installed and used in large-scale computing environments with different operating systems, system management software, and equipment and networking configurations, which may cause errors or failures of our software or other aspects of the computing environment into which it is deployed. In addition, deployment of our software into complicated, large-scale computing environments may expose undetected errors, failures or bugs in our software. Despite testing by us, errors, failures or bugs may not be found in our offerings until they are released to our customers. In the past, we have discovered errors, failures and bugs in some of our offerings after their introduction. Real or perceived errors, failures or bugs in our offerings could result in negative publicity, loss of or delay in market acceptance of our offerings, loss of competitive position or claims by customers for losses sustained by them. In such an event, we may be required, or may choose, for customer relations or other reasons, to expend additional resources in order to help correct the problem.
In addition, if an actual or perceived failure of our on-premises software occurs in a customer’s deployment or in our cloud services, regardless of whether the failure is attributable to our software, the market perception of the effectiveness of our offerings could be adversely affected. Alleviating any of these problems could require significant expenditures of our capital and other resources and could cause interruptions, delays or cessation of our licensing, which could cause us to lose existing or potential customers and could adversely affect our financial results and growth prospects.
Failure to protect our intellectual property rights could adversely affect our business.business and our brand.
Our success and ability to compete depends, in part, on our ability to protect our trade secrets, trademarks, copyrights, patents, proprietary methods and technologies and other intellectual property that we develop under patent and other intellectual property laws
of the United States and other jurisdictions outside of the United States so that we can prevent others from using our inventions and proprietary information.information and property. We generally rely on copyright, trade secret and trademark laws, trade secret protection and confidentiality or license agreements with our employees, consultants, vendors, customers, partners and others and generally limit access to and distribution of our proprietary information in order to protect our intellectual property rights. If we fail to protect our intellectual property rights adequately, our competitors might gain access to our technology or use of our brand, and our business might be adversely affected. However, defending our intellectual property rights might entail significant expenses. Any of our patent rights, copyrights, trademarks or other intellectual property rights may be challenged by others or invalidated through administrative process or litigation. Our issued patents and any patents issued in the future may not provide us with any competitive advantages, and our patent applications may never be granted. Additionally, the process of obtaining patent protection is expensive and time-consuming, and we may not be able to file and prosecute all necessary or desirable patent applications, or we may not be able to do so at a reasonable cost or in a timely manner. Even if issued, there can be no assurance that these patents will adequately protect our intellectual property, as the legal standards relating to the infringement, validity, enforceability and scope of protection of patent and other intellectual property rights are complex and often uncertain.
Any patents that are issued may subsequently be invalidated or otherwise limited, allowing other companies to develop offerings that compete with ours, which could adversely affect our competitive business position, business prospects and financial condition. In addition, issuance of a patent does not guarantee that we have a right to practice the patented invention. Patent applications in the United States are typically not published until 18 months after filing or, in some cases, not at all, and publications of discoveries in industry-related literature lag behind actual discoveries. We cannot be certain that we were the first to use the inventions claimed in our issued patents or pending patent applications or otherwise used in our offerings, that we were the first to file patent applications, or that third parties do not have blocking patents that could be used to prevent us from marketing or practicing our offerings or technology. Effective patent, trademark, copyright and trade secret protection may not be available to us in every country in which our offerings are available. The laws of some foreign countries may not be as protective of intellectual property rights as those in the United States (in particular, some foreign jurisdictions do not permit patent protection for software), and mechanisms for enforcement of intellectual property rights may be inadequate. Additional uncertainty may result from recent and future changes to intellectual property legislation in the United States (including the “America Invents Act”) and other countries and from interpretations of the intellectual property laws of the United States and other countries by applicable courts and agencies. Accordingly, despite our efforts, we may be unable to prevent third parties from infringing upon or misappropriating our intellectual property.
We rely in part on trade secrets, proprietary know-how and other confidential information to maintain our competitive position. We generally enter into confidentiality agreements with our employees, consultants, vendors and customers, and generally limit access to and distribution of our proprietary information. Although we endeavor to enter into non-disclosure agreements with our employees, licensees and others who may have access to this information, we cannot assure you that these agreements or other steps we have taken will prevent unauthorized use, disclosure or reverse engineering of our technology. In addition, the laws of some foreign countries do not protect our proprietary rights to as great an extent as the laws of the United States, and many foreign countries do not enforce these laws as diligently as government agencies and private parties in the United States. Moreover, third parties may independently develop technologies or products that compete with ours, and we may be unable to prevent this competition.
We might be required to spend significant resources to monitor and protect our intellectual property rights. We may initiate claims or litigation against third parties for infringement of our proprietary rights or to establish the validity of our proprietary rights. Litigation also puts our patents at risk of being invalidated or interpreted narrowly. Additionally, we may provoke third parties to assert counterclaims against us. We may not prevail in any lawsuits that we initiate, and the damages or other remedies awarded, if any, may not be adequate to compensate us for the harm suffered. Any litigation, whether or not it is resolved in our favor, could result in significant expense to us and divert the efforts of our technical and management personnel, which may adversely affect our business operations or financial results.
We have been, and may in the future be, subject to intellectual property rights claims by third parties, which are extremely costly to defend, could require us to pay significant damages and could limit our ability to use certain technologies.
Companies in the software and technology industries, including some of our current and potential competitors, own large numbers of patents, copyrights, trademarks and trade secrets and frequently enter into litigation based on allegations of infringement or other violations of intellectual property rights. In addition, many of these companies have the capability to dedicate substantially greater resources to enforce their intellectual property rights and to defend claims that may be brought against them. The litigation may involve patent holding companies or other adverse patent owners that have no relevant product revenues and against which our patents may therefore provide little or no deterrence. From time-to-time, third parties, including certain of these leading companies, have asserted and may assert patent, copyright, trademark or other intellectual property
rights against us, our channel partners, our technology partners or our customers. We have received, and may in the future receive, notices that claim we have misappropriated, misused, or infringed other parties’ intellectual property rights, and, to the extent we gain greater market visibility, we face a higher risk of being the subject of intellectual property infringement claims, which is not uncommon with respect to the enterprise software market.
There may be third-party intellectual property rights, including issued or pending patents, that cover significant aspects of our technologies or business methods. We may be exposed to increased risk of being the subject of intellectual property infringement claims as a result of acquisitions, as, among other things, we have a lower level of visibility into the development process with respect to such technology or the care taken to safeguard against infringement risks. Any intellectual property claims, with or without merit, could be very time-consuming, could be expensive to settle or litigate and could divert our management’s attention and other resources. These claims could also subject us to significant liability for damages, potentially including treble damages if we are found to have willfully infringed patents or copyrights. These claims could also result in our having to stop using technology found to be in violation of a third party’sthird-party’s rights. We might be required to seek a license for the intellectual property, which may not be available on reasonable terms or at all. Even if a license were available, we could be required to pay significant royalties, which would increase our operating expenses. As a result, we may be required to develop alternative non-infringing technology, which could require significant effort and expense. If we cannot license or develop technology for any infringing aspect of our business, we would be forced to limit or stop sales of our offerings and may be unable to compete effectively. Any of these results would adversely affect our business operations and financial results.
We offer trial version licenses, including online sandboxes, of certain of our offerings to users free of charge as part of our overall strategy of developing the market for offerings that provides operational intelligence and promoting additional penetration of our offerings in the markets in which we compete. Some users never convert from the trial version to the paid version. In fiscal 2017, we introduced free development-test licenses for certain commercial customers as part of our strategy to help enable such customers to expand their use of our offerings to additional use cases. In fiscal 2018, we began offering our cloud services through a cloud vendor marketplace. To the extent that these users of our trial version do not become paying customers, our current customers do not expand their use of our offerings beyond the current predominant use cases, or we are unsuccessful in building effective go-to-market strategies for our offerings, we will not realize the intended benefits of thisthese marketing strategystrategies and our ability to grow our revenues will be adversely affected.
If we are not able to maintain and enhance our brand, our business and operating results may be adversely affected.
We believe that maintaining and enhancing the “Splunk” brand identity is critical to our relationships with our customers and channel partners and to our ability to attract new customers and channel partners. The successful promotion of our brand will depend largely upon our marketing efforts, our ability to continue to offer high-quality productsofferings and our ability to successfully differentiate our productsofferings from those of our competitors. Our brand promotion activities may not be successful or yield increased revenues. In addition, independent industry analysts often provide reviews of our products,offerings, as well as those of our competitors, and perception of our productsofferings in the marketplace may be significantly influenced by these reviews. If these reviews are negative, or less positive as compared to those of our competitors’ products and services, our brand may be adversely affected.
Moreover, it may be difficult to maintain and enhance our brand in connection with sales through channel or strategic partners. The promotion of our brand requires us to make substantial expenditures, and we anticipate that the expenditures will increase as our market becomes more competitive, as we expand into new markets and as more sales are generated through our channel partners. To the extent that these activities yield increased revenues, these revenues may not offset the increased expenses we incur. If we do not successfully maintain and enhance our brand, our business may not grow, we may have reduced pricing power relative to competitors with stronger brands, and we could lose customers and channel partners, all of which would adversely affect our business operations and financial results.
Our future performance depends in part on proper use of our community website, Splunkbase, expansion of our developer ecosystem, and support from third-party software developers.
Our offerings enable third-party software developers to build apps on top of our platform. We operate a community website, Splunkbase, for sharing these third-party apps, including add-ons and extensions. While we expect Splunkbase to support our sales and marketing efforts, it also presents certain risks to our business, including:
third-party developers may not continue developing or supporting the software apps that they share on Splunkbase;
we cannot guarantee that if and as we change the architecture of our products and services, third-party developers will evolve their existing software apps to be compatible or that they will participate in the creation of new apps utilizing the new architecture;
we cannot provide any assurance that these apps meet the same quality and security standards that we apply to our own development efforts, and, to the extent they contain bugs, defects or defects,security vulnerabilities, they may create disruptions in our customers’ use of our offerings or negatively affect our brand;
we do not currently provide support for software apps developed by third-party software developers, and users may be left without support and potentially ceasedisappointed by their experience of using our offerings if the third-party software developers do not provide support for these apps;
these third-party software developers may not possess the appropriate intellectual property rights to develop and share their apps or otherwise may not have assessed legal and compliance risks related to distributing their apps; and
some of these developers may use the insight they gain using our offerings and from documentation publicly available on our website to develop competing products.
Many of these risks are not within our control to prevent, and our brand may be damaged if these apps, add-ons and extensions do not perform to our customers’ satisfaction and that dissatisfaction is attributed to us.
Our use of “open source” software could negatively affect our ability to sell our offerings and subject us to possible litigation.litigation, and our participation in open source projects may impose unanticipated burdens or restrictions.
We use open source software in our offerings and expect to continue to use open source software in the future. We may face claims from others claimingalleging breach of license requirements or infringement of intellectual property rights in what we believe to be licensed open source software, or seeking to enforce the terms of an open source license, including by demanding release of our proprietary source code that was developed using, incorporating or linked with such open source software.software or by requiring that we apply open source licenses to our proprietary applications. These claims could also result in litigation, require us to purchase a costly license or require us to devote additional research and development resources to change our offerings, any of which would have a negative effect on our business and operating results. In addition, if the license terms for the open source code change, we may be forced to re-engineer our offerings or incur additional costs to find alternative tools. In addition to risks related to license requirements, usage of open source software can lead to greater risks than use of third-party commercial software, as open source licensors generally do not provide warranties, support, indemnity or assurance of title or controls on origin of the software. Further,Likewise, some open source projects have known security and other vulnerabilities and architectural instabilities and are provided on an “as-is” basis. Additionally, because any software source code we contribute to open source projects is publicly available, our ability to protect our intellectual property rights with respect to such software source code may be limited or lost entirely, and we may be unable to prevent our competitors or others from using such contributed software source code. Many of these risks associated with usage of open source software, such as the lack of warranties, support or assurances of title, cannot be eliminated, and could, if not properly addressed, negatively affect the performance of our offerings and our business. While we have established processes to help alleviate these risks, we cannot assure that these measures will significantly reduce or completely shield us from these risks.
We are subject to a number of legal requirements, contractual obligations and industry standards regarding security, data protection, and privacy and any failure to comply with these requirements, obligations or standards could have an adverse effect on our reputation, business, financial condition and operating results.
California consumers, and afford such consumers new abilities to opt-out of certain sales of personal information, when it goes into effect on January 1, 2020. The CCPA provides for civil penalties for violations, as well as a private right of action for data breaches that may increase data breach litigation. The CCPA was amended in September 2018, and it is possible that it will be amended again before it goes into effect. We cannot yet predict the impact of the CCPA on our business or operations, but it may require us to modify our data processing practices and policies and to incur substantial costs and expenses in an effort to comply.
Internationally, virtually every jurisdiction in which we operate has established its own data security and privacy or data protection legal framework with which we or our customers must comply. Laws and regulations in these jurisdictions apply broadly to the collection, use, storage, disclosure and security of data that identifies or may be used to identify or locate an individual, such as names, email addresses and, in some jurisdictions, Internet Protocol (“IP”) addresses. These laws and regulations often are more restrictive than those in the United States and are rapidly evolving. For example, a new EU data protection regime, the General Data Protection Regulation (“GDPR”) became effective on May 25, 2018, and, in addition to imposing stringent obligations relating to data protection and information security, authorizes fines up to 4% of global annual revenue or €20 million, whichever is greater, for some types of violations. We have self-certified to the EU-U.S. and the Swiss-U.S. Privacy Shield Frameworks developed by the U.S. Department of Commerce and the European Commission to provide U.S. companies with a valid data transfer mechanism under EU and Swiss law to permit them to transfer personal data from the European Union or Switzerland to the United States. The EU-U.S. and Swiss-U.S. Privacy Shield Frameworks are subject to annual review. The EU-U.S. Privacy Shield Framework and model contractual clauses approved by the European Commission, which we also use in our business to address certain cross-border data transfers, each have faced challenges in European courts, and may be challenged, suspended or invalidated. Further, following a referendum in June 2016 in which voters in the United Kingdom approved an exit from the EU, the United Kingdom government has initiated a process to leave the EU (“Brexit”). The United Kingdom enacted a Data Protection Act in May 2018 that substantially implements the GDPR, but Brexit has created uncertainty with regard to the regulation of data protection in the United Kingdom. In particular, it is unclear how data transfers to and from the United Kingdom will be regulated post-Brexit. Our EMEA headquarters is in London, causing this uncertainty to be particularly significant to our operations. Some countries also are considering or have passed legislation requiring local storage and processing of thesedata, or similar requirements, which could increase the cost and complexity of delivering our services. Complying with the GDPR or other laws, regulations, or other obligations relating to privacy, data protection, data localization or information security may cause us to incur substantial operational costs or require us to modify our data handling practices. Non-compliance could result in proceedings against us by governmental entities or others, could result in substantial fines or other liability, and may otherwise adversely impact our business, financial condition and operating results.
Some statutory requirements, both in the United States and abroad, such as the Health Insurance Portability and Accountability Act of 1996 (“HIPAA”) and numerous state statutes, include obligations of companies to notify individuals of security breaches involving particular personal information, which could result from breaches experienced by us or our service providers. Even though we may have contractual protections with our service providers, notifications related to aany actual or perceived security breach could impact our reputation, harm our customer confidence, hurt our sales and expansion into new markets or cause us to lose existing customers.
In addition to government regulation, privacy advocates and industry groups may propose new and different self-regulatory standards that eitherfrom time to time. These and other industry standards may legally or contractually apply to us.us, or we may elect to comply with such standards or to facilitate our customers’ compliance with such standards. Because privacy, data protection and data security are critical competitive factors in our industry, we may make statements on our website, in marketing materials, or in other settings about our data security measures and our compliance with, or our ability to facilitate our customers’ compliance with, these standards. We also expect that there will continue to be new proposed laws and regulations concerning privacy, data protection and information security, and we cannot yet determine the impact such future laws, regulations and standards may have on our business. New laws, amendments to or re-interpretations of existing laws and regulations, industry standards, contractual obligations and other obligations may require us to incur additional costs and restrict our business operations. Because the interpretation and application of laws, standards, contractual obligations and other obligations relating to privacy and data protection are still uncertain, it is possible that these laws, standards, contractual obligations and other obligations may be interpreted and applied in a manner that is inconsistent with our existing data management practices, our privacy, data protection, or data security policies or procedures, or the features of our offerings. If so, in addition to the possibility of fines, lawsuits and other claims, we could be required to fundamentally change our business activities and practices or modify our offerings, which could have an adverse effect on our business. We may be unable to make such changes and modifications in a commercially reasonable manner or at all, and our ability to develop new offerings and features could be limited. Any inability to adequately address privacy concerns, even if unfounded, or comply with applicable privacy or data protection laws, regulations and policies, could result in additional cost and liability to us, damage our reputation, inhibit sales and adversely affect our business.
Furthermore, the costs of compliance with, and other burdens imposed by, the laws, regulations, and policies that are applicable to the businesses of our
customers may limit the use and adoption of, and reduce the overall demand for, our offerings. For example, as a service providerAny inability to our customers, we may collect and use personally identifiable information, including protected health information, which may subject us to a number ofadequately address privacy, data protection or information security-related concerns, even if unfounded, or to successfully negotiate privacy, data protection or information security-related contractual terms with customers, or to comply with applicable laws, regulations and policies relating to privacy, data protection, and information security, privacycould result in additional cost and other government-liability to us, damage our reputation, inhibit sales, slow our sales cycles, and industry-specific requirements, including those that require companies to notify individuals of data security incidents involving certain types of personal data, such as the Health Insurance Portability and Accountability Act of 1996 (“HIPAA”).adversely affect our business. Privacy and personal information security concerns, whether valid or not valid, may inhibit market adoption of our offerings particularly in certain industries and foreign countries.
If we are unable to attract and retain leadership and key personnel, our business could be adversely affected.
We depend on the continued contributions of our leadership, senior management and other key personnel, the loss of whom could adversely affect our business. On November 19, 2015, Godfrey Sullivan retired29, 2018, we announced that David Conte, our current Chief Financial Officer, intends to retire from his position as our President and Chief Executive Officer, and Doug Merritt, who previously served as our Senior Vice President, Field Operations, was appointed as our President and Chief Executive Officer.the company. Our future success depends in part on successfully transitioning Mr. Merritt into his new role, as well as our ability to appoint and successfully transition a qualified new field leadership.chief financial officer. With any change in leadership, there is a risk to organizational effectiveness and employee retention as well as the potential for disruption to our business. All of our executive officers and key employees are at-will employees, which means they may terminate their employment relationship with us at any time. We do not maintain a key-person life insurance policy on any of our officers or other employees.
Our future success also depends on our ability to identify, attract and retain highly skilled technical, managerial, finance and other personnel, particularly in our sales and marketing, research and development, general and administrative, and professional service departments. We face intense competition for qualified individuals from numerous software and other technology companies.
In addition, competition for qualified personnel, particularly software engineers, is particularly intense in the San Francisco Bay Area, where our headquarters are located. We may incur significant costs to attract and retain them, and we may lose new employees to our competitors or other technology companies before we realize the benefit of our investment in recruiting and training them. As we move into new geographies, we will need to attract and recruit skilled personnel in those areas. If we are unable to attract and retain suitably qualified individuals who are capable of meeting our growing technical, operational and managerial requirements, on a timely basis or at all, our business will be adversely affected.
Volatility or lack of performance in our stock price may also affect our ability to attract and retain our key employees. Many of our senior management personnel and other key employees have become, or will soon become, vested in a substantial amount of stock, restricted stock units or stock options. Employees may be more likely to leave us if the shares they own or the shares underlying their vested restricted stock units or options have significantly appreciated in value relative to the original purchase prices of the shares or the exercise prices of the options, or, conversely, if the exercise prices of the options that they
hold are significantly above the market price of our common stock. If we are unable to retain our employees, or if we need to increase our compensation expenses to retain our employees, our business, results of operations, financial condition and cash flows would be adversely affected.
We have in the past made and may in the future make acquisitions that could prove difficult to integrate and/or adversely affect our business operations and financial results.
From time to time, we may choose to expand by making acquisitions that could be material to our business, results of operations, financial condition and cash flows. Our ability as an organization to successfully acquire and integrate technologies or businesses is unproven. Acquisitions involve many risks, including the following:
an acquisition may negatively affect our financial results because it may require us to incur charges or assume substantial debt or other liabilities, may cause adverse tax consequences or unfavorable accounting treatment, may expose us to claims and disputes by third parties, including intellectual property claims and disputes, or may not generate sufficient financial return to offset additional costs and expenses related to the acquisition;
potential goodwill impairment charges related to acquisitions;
costs and potential difficulties associated with the requirement to test and assimilate the internal control processes of the acquired business;
we may encounter difficulties or unforeseen expenditures in integrating the business, technologies, products, personnel or operations of any company that we acquire, particularly if key personnel of the acquired company decide not to work for us or if we are unable to retain key personnel;
we may not realize the expected benefits of the acquisition;
an acquisition may disrupt our ongoing business, divert resources, increase our expenses and distract our management;
an acquisition may result in a delay or reduction of customer purchases for both us and the company acquired due to customer uncertainty about continuity and effectiveness of service from either company;
the potential impact on relationships with existing customers, vendors and distributors as business partners as a result of acquiring another company or business that competes with or otherwise is incompatible with those existing relationships;
the potential that our due diligence of the acquired company or business does not identify significant problems or liabilities, or that we underestimate the costs and effects of identified liabilities;
exposure to litigation or other claims in connection with, or inheritance of claims or litigation risk as a result of, an acquisition, including but not limited to claims from former employees, customers or other third parties, which may differ from or be more significant than the risks our business faces;
we may encounter difficulties in, or may be unable to, successfully sell any acquired products;
an acquisition may involve the entry into geographic or business markets in which we have little or no prior experience or where competitors have stronger market positions;
an acquisition may require us to comply with additional laws and regulations or result in liabilities resulting from the acquired company’s pre-acquisition failure to comply with applicable laws;
our use of cash to pay for an acquisition would limit other potential uses for our cash;
if we incur debt to fund such acquisition, such debt may subject us to material restrictions on our ability to conduct our business as well as financial maintenance covenants; and
to the extent that we issue a significant amount of equity securities in connection with future acquisitions, existing stockholders may be diluted and earnings per share may decrease.
The occurrence of any of these risks could have a material adverse effect on our business operations and financial results.
If poor advice or misinformation is spread through our community website, Splunk Answers, users of our offerings may experience unsatisfactory results from using our offerings, which could adversely affect our reputation and our ability to grow our business.
We host Splunk Answers for sharing knowledge about how to perform certain functions with our offerings. Our users are increasingly turning to Splunk Answers for support in connection with their use of our offerings. We do not review or test the information that non-Splunk employees post on Splunk Answers to ensure its accuracy or efficacy in resolving technical issues. Therefore, we cannot ensure that all the information listed on Splunk Answers is accurate or that it will not adversely affect the performance of our offerings. Furthermore, users who post such information on Splunk Answers may not have adequate rights to the information to share it publicly, and we could be the subject of intellectual property claims based on our hosting of such information. If poor advice or misinformation is spread among users of Splunk Answers, our customers or other users of our offerings may experience unsatisfactory results from using our offerings, which could adversely affect our reputation and our ability to grow our business.
Prolonged economic uncertainties or downturns could materially adversely affect our business.
We have a significant number of customers in the business services, energy, financial services, healthcare and pharmaceuticals, technology, manufacturing, media and entertainment, online services, retail, telecommunications and travel and transportation industries. A substantial downturn in any of these industries may cause firms to react to worsening conditions by reducing their capital expenditures in general or by specifically reducing their spending on information technology. Customers in these industries may delay or cancel information technology projects or seek to lower their costs by renegotiating vendor contracts. To the extent purchases of our offerings are perceived by customers and potential customers to be discretionary, our revenues may be disproportionately affected by delays or reductions in general information technology spending. Also, customers may choose to develop in-house software as an alternative to using our offerings. Moreover, competitors may respond to market conditions by lowering prices and attempting to lure away our customers. In addition, the increased pace of consolidation in certain industries may result in reduced overall spending on our offerings.
We cannot predict the timing, strength or duration of any economic slowdown, instability or recovery, generally or within any particular industry or geography. If the economic conditions of the general economy or industries in which we operate worsen from present levels, our business operations and financial results could be adversely affected.
We may require additional capital to support business growth, and this capital might not be available on acceptable terms, if at all.
We intend to continue to make investments to support our business growth and may require additional funds to respond to business challenges, including the need to develop new features or enhance our offerings, improve our operating infrastructure or acquire complementary businesses and technologies. Accordingly, we have engaged in, and may need to engage in the future, in equity or debt financings to secure additional funds. If we raise additional funds through future issuances of equity or convertible debt securities, our existing stockholders could suffer significant dilution, and any new equity securities we issue could have rights, preferences and privileges superior to those of holders of our common stock. If we elect to settle our conversion obligation under the Notes (as defined below) in shares of our common stock or a combination of cash and shares of our common stock, the issuance of such common stock may dilute the ownership interests of our stockholders and sales in the public market could adversely affect prevailing market prices. Any debt financing that we may secure in the future could involve restrictive covenants relating to our capital raising activities and other financial and operational matters, which may make it more difficult for us to obtain additional capital and to pursue business opportunities, including potential acquisitions.acquisitions, or otherwise reduce operational flexibility. We may not be able to obtain additional financing on terms favorable to us, if at all. If we are unable to obtain adequate financing or financing on terms satisfactory to us when we require it, our ability to continue to support our business growth and to respond to business challenges could be significantly impaired, and our business may be adversely affected.
If currency exchange rates fluctuate substantially in the future, our financial results, which are reported in U.S. dollars, could be adversely affected.
As we continue to expand our international operations, we become more exposed to the effects of fluctuations in currency exchange rates. Although most of our sales contracts are denominated in U.S. dollars, and therefore substantially all of our revenues are not subject to foreign currency risk, a strengthening of the U.S. dollar could increase the real cost of our offerings to our customers outside of the United States, adversely affecting our business operations and financial results. We incur expenses for employee
compensation and other operating expenses at our non-U.S. locations in the local currency. Fluctuations in the exchange rates between the U.S. dollar and other currencies could result in the dollar equivalent of such expenses being higher. This could have a negative impact on our reported operating results. Although we engage in limited hedging strategies, any such strategies, such as forward contracts, options and foreign exchange swaps, related to transaction exposures that we may implement to mitigate this risk may not eliminate our exposure to foreign exchange fluctuations.
Our ability to use our net operating losses to offset future taxable income may be subject to certain limitations.
In general, under Section 382 of the United States Internal Revenue Code of 1986, as amended, or the Code, a corporation that undergoes an “ownership change”ownership change is subject to limitations on its ability to utilize its pre-change net operating losses, or NOLs, to offset future taxable income. If our existing NOLs are subject to limitations arising from previous ownership changes, our ability to utilize NOLs could be limited by Section 382 of the Code. Future changes in our stock ownership, some of which are outside of our control, could result in an ownership change under Section 382 of the Code. Furthermore, our ability to utilize NOLs of companies that we may acquire in the future may be subject to limitations. There is also a risk that due to regulatory changes, such as suspensions on the use of NOLs,either under prior regulations or other unforeseen reasons, our existingprior year NOLs could expire or otherwise be unavailable to offset future income tax liabilities. For these reasons, we may not be able to utilize a portion of thethese NOLs reflected on our balance sheet, even if we attain profitability.
Taxing authorities may successfully assert that we should have collected or in the future should collect sales and use, value added or similar taxes, and we could be subject to liability with respect to past or future sales, which could adversely affect our financial results.
We do not collect sales and use, value added and similar taxes in all jurisdictions in which we have sales, based on our belief that such taxes are not applicable. Sales and use, value added and similar tax laws and rates vary greatly by jurisdiction. Certain jurisdictions in which we do not collect such taxes may assert that such taxes are applicable, which could result in tax assessments, penalties and interest, and we may be required to collect such taxes in the future. Such tax assessments, penalties and interest or future requirements may adversely affect our financial results.
Our international operations subject us to potentially adverse tax consequences.
We generally conduct our international operations through wholly owned subsidiaries, branches and representative offices and report our taxable income in various jurisdictions worldwide based upon our business operations in those jurisdictions. We are in the process of organizing our corporate structure to more closely align with the international nature of our business activities. Our intercompany relationships are subject to complex transfer pricing regulations administered by taxing authorities in various jurisdictions. Many countries and organizations such as the Organization for Economic Cooperation and Development are actively considering changes to existing tax laws or proposed or enacted new tax laws that could increase our tax liabilities in countries where we do business. The relevant taxing authorities may disagree with our determinations as to the income and expenses attributable to specific jurisdictions. If such a disagreement were to occur, and our position were not sustained, we could be required to pay additional taxes, interest and penalties, which could result in one-time tax charges, higher effective tax rates, reduced cash flows and lower overall profitability of our operations. We believe that our financial statements reflect adequate reserves to cover such a contingency, but there can be no assurances in that regard.
We could be subject to additional tax liabilities.
We are subject to federal, state and local taxes in the United States and numerous foreign jurisdictions. Significant judgment is required in evaluating our tax positions and our worldwide provision for taxes. During the ordinary course of business, there are many activities and transactions for which the ultimate tax determination is uncertain. We previously discovered that we have not complied with various tax rules and regulations in certain foreign jurisdictions. We are working to resolve these matters. In addition, our tax obligations and effective tax rates could be adversely affected by changes in the
relevant tax, accounting and other laws, regulations, principles and interpretations, including those relating to income tax nexus, by our earnings being lower than anticipated in jurisdictions where we have lower statutory rates and higher than anticipated in jurisdictions where we have higher statutory rates, by changes in foreign currency exchange rates, or by changes in the valuation of our deferred tax assets and liabilities. We may be audited in various jurisdictions, and such jurisdictions may assess additional taxes against us. Although we believe our tax estimates are reasonable, the final determination of any tax audits or litigation could be materially different from our historical tax provisions and accruals, which could have a material adverse effect on our operating results or cash flows in the period or periods for which a determination is made.
Our financial results may be adversely affected by changes in accounting principles applicable to us.
Generally accepted accounting principles in the United States (“U.S. GAAP”) are subject to interpretation by the Financial Accounting Standards Board (“FASB”), the SEC, and other various bodies formed to promulgate and interpret appropriate accounting principles. For example, in May 2014, the FASB issued accounting standards update No. 2014-09 (Topic 606), Revenue from Contracts with Customers, which supersedes nearly all existing revenue recognition guidance under U.S. GAAP. We willadopted this new revenue standard as of February 1, 2018. Under Topic 606, more estimates, judgments and assumptions are required within the revenue recognition process than were previously required. Our reported financial position and financial results may be requiredadversely affected if our estimates or judgments prove to implementbe wrong, assumptions change or actual circumstances differ from those in our assumptions. We presently anticipate that this guidancestandard could create volatility in our reported revenue and operating results, which could negatively impact our stock price. The most significant impacts of the first quarterstandard related to the timing of our fiscal year 2019. We have not yet determinedrevenue recognition for arrangements involving term licenses, deferred revenue and sales commissions. Additionally, some deferred revenue, primarily from arrangements involving term licenses, was never recognized as revenue and instead is now part of the cumulative effect adjustment within accumulated deficit. See Part I, Item 1. Financial Information - Note 1 for information regarding the effect of the standard onnew accounting pronouncements in our ongoingconsolidated financial reporting. Implementation of this new standardstatements. These or other changes in accounting principles could have a significant effect onadversely affect our financial results, and anyresults. Any difficulties in implementing these pronouncements could cause us to fail to meet our financial reporting obligations, which could result in regulatory discipline and harm investors’ confidence in us.
Servicing our debt requires a significant amount of cash, and we may not have sufficient cash flow from our business to pay our substantial debt.
Our ability to make scheduled payments of the principal of, to pay interest on or to refinance our indebtedness, including the $2.13 billion aggregate principal amount of convertible senior notes that we issued in September 2018, which includes $1.27 billion aggregate principal amount of 0.50% Convertible Senior Notes due 2023 and $862.5 million aggregate principal amount of 1.125% Convertible Senior Notes due 2025 (collectively, the “Notes”), depends on our future performance, which is subject to economic, financial, competitive and other factors beyond our control. Our business may not continue to generate cash flow from operations in the future sufficient to service our debt and make necessary capital expenditures. If we are unable to generate such cash flow, we may be required to adopt one or more alternatives, such as selling assets, restructuring debt or obtaining additional equity capital on terms that may be onerous or highly dilutive. Our ability to refinance our indebtedness will depend on the capital markets and our financial condition at such time. We may not be able to engage in any of these activities or engage in these activities on desirable terms, which could result in a default on our debt obligations.
Conversion of the Notes may dilute the ownership interest of our stockholders or may otherwise depress the price of our common stock.
The conversion of some or all of the Notes may dilute the ownership interests of our stockholders. Upon conversion of the Notes, we have the option to pay or deliver, as the case may be, cash, shares of our common stock, or a combination of cash and shares of our common stock. If we elect to settle our conversion obligation in shares of our common stock or a combination of cash and shares of our common stock, any sales in the public market of our common stock issuable upon such conversion could adversely affect prevailing market prices of our common stock. In addition, the existence of the Notes may encourage short selling by market participants because the conversion of the Notes could be used to satisfy short positions, or anticipated conversion of the Notes into shares of our common stock could depress the price of our common stock.
The conditional conversion feature of the Notes, if triggered, may adversely affect our financial condition and operating results.
In the event the conditional conversion feature of a series of Notes is triggered, holders of such Notes will be entitled to convert their Notes at any time during specified periods at their option. If one or more holders elect to convert their Notes, unless we elect to satisfy our conversion obligation by delivering solely shares of our common stock (other than paying cash in
lieu of delivering any fractional share), we would be required to settle a portion or all of our conversion obligation through the payment of cash, which could adversely affect our liquidity. In addition, even if holders do not elect to convert their Notes, we could be required under applicable accounting rules to reclassify all or a portion of the outstanding principal of the relevant series of Notes as a current rather than long-term liability, which would result in a material reduction of our net working capital.
The accounting method for convertible debt securities that may be settled in cash, such as the Notes, could have a material effect on our reported financial results.
In May 2008, the Financial Accounting Standards Board, or FASB, issued FASB Staff Position No. APB 14-1, Accounting for Convertible Debt Instruments That May Be Settled in Cash Upon Conversion (Including Partial Cash Settlement), which has subsequently been codified as Accounting Standards Codification 470-20, Debt with Conversion and Other Options, or ASC 470-20.
Under ASC 470-20, an entity must separately account for the liability and equity components of the convertible debt instruments (such as the Notes) that may be settled entirely or partially in cash upon conversion in a manner that reflects the issuer’s economic interest cost. The effect of ASC 470-20 on the accounting for the Notes is that the equity component is required to be included in the additional paid-in capital section of stockholders’ equity in our consolidated balance sheet at issuance, and the value of the equity component would be treated as original issue discount for purposes of accounting for the debt component of the Notes. As a result, we will be required to record a greater amount of non-cash interest expense in current periods presented as a result of the amortization of the discounted carrying value of the Notes to their respective face amounts over their respective terms. We will report larger net losses or lower net income in our financial results because ASC 470-20 will require interest to include both the current period’s amortization of the debt discount and the instrument’s non-convertible coupon interest rate, which could adversely affect our reported or future financial results, the trading price of our common stock and the trading price of the Notes.
In addition, under certain circumstances, convertible debt instruments (such as the Notes) that may be settled entirely or partly in cash are currently accounted for utilizing the treasury stock method, the effect of which is that the shares issuable upon conversion of a series of Notes are not included in the calculation of diluted earnings per share except to the extent that the conversion value of such series of Notes exceeds their principal amount. Under the treasury stock method, for diluted earnings per share purposes, the transaction is accounted for as if the number of shares of common stock that would be necessary to settle such excess, if we elected to settle such excess in shares, are issued. We cannot be sure that the accounting standards in the future will continue to permit the use of the treasury stock method. If we are unable or otherwise elect not to use the treasury stock method in accounting for the shares issuable upon conversion of the Notes, then the “if converted” method of accounting would be applied and accordingly, the full number of shares that could be issued would be included in the calculation of diluted earnings per share, which would adversely affect our diluted earnings per share.
The Capped Calls may affect the value of our common stock.
In connection with the pricing of the Notes, we entered into privately negotiated capped call transactions with certain counterparties (the “Capped Calls”). The Capped Calls relating to the 2023 Notes cover, subject to customary adjustments, the number of shares of our common stock that will initially underlie the 2023 Notes, and the Capped Calls relating to the 2025 Notes cover, subject to customary adjustments, the number of shares of our common stock that will initially underlie the 2025 Notes. The Capped Calls are expected generally to offset the potential dilution to our common stock as a result of any conversion of the relevant series of Notes. If the initial purchasers exercise their option to purchase additional Notes, we expect to enter into additional Capped Calls with the option counterparties with respect to the relevant series of Notes as to which the option was exercised.
In connection with establishing their initial hedges of the Capped Calls, the option counterparties or their respective affiliates may purchase shares of our common stock and/or enter into various derivative transactions with respect to our common stock concurrently with or shortly after the pricing of the Notes, including with certain investors in the Notes. This activity could increase (or reduce the size of any decrease in) the market price of our common stock at that time.
In addition, the option counterparties or their respective affiliates may modify their hedge positions by entering into or unwinding various derivatives with respect to our common stock and/or purchasing or selling our common stock or other securities of ours in secondary market transactions following the pricing of the Notes and prior to the maturity of the Notes (and are likely to do so on each exercise date for the Capped Calls, which are expected to occur during each 30 trading day period beginning on the 31st scheduled trading day prior to the maturity date of each series of Notes, or following any termination of
any portion of the Capped Calls in connection with any repurchase, redemption or early conversion of the Notes). This activity could also cause or prevent an increase or a decrease in the market price of our common stock.
In addition, if any such Capped Calls fail to become effective, the option counterparties or their respective affiliates may unwind their hedge positions with respect to our common stock, which could adversely affect the price of our common stock.
We do not make any representation or prediction as to the direction or magnitude of any potential effect that the transactions described above may have on the price of the shares of our common stock. In addition, we do not make any representation that the counterparties will engage in these transactions or that these transactions, once commenced, will not be discontinued without notice.
We are subject to counterparty risk with respect to the Capped Calls.
The option counterparties to the Capped Calls we have entered into are financial institutions, and we will be subject to the risk that one or more of the option counterparties may default or otherwise fail to perform, or may exercise certain rights to terminate, their obligations under the Capped Calls. Our exposure to the credit risk of the option counterparties will not be secured by any collateral.
If an option counterparty to one or more Capped Calls becomes subject to insolvency proceedings, we will become an unsecured creditor in those proceedings with a claim equal to our exposure at the time under such transaction. Our exposure will depend on many factors but, generally, our exposure will increase if the market price or the volatility of our common stock increases. In addition, upon a default or other failure to perform, or a termination of obligations, by an option counterparty, we may suffer more dilution than we currently anticipate with respect to our common stock. We can provide no assurances as to the financial stability or viability of the option counterparties.
Our stock price has been volatile, may continue to be volatile and may decline regardless of our financial performance.
The trading prices of the securities of technology companies have been highly volatile. The market price of our common stock has fluctuated significantly and may continue to fluctuate significantly in response to numerous factors, many of which are beyond our control, including:
actual or anticipated fluctuations in our financial results;
the financial projections we provide to the public, any changes in these projections or our failure to meet or exceed these projections;
failure of securities analysts to initiate or maintain coverage of our company, changes in financial estimates by any securities analysts who follow our company, or our failure to meet these estimates or the expectations of investors;
ratings changes by any securities analysts who follow our company;
announcements by us or our competitors of significant technical innovations, acquisitions, strategic partnerships, joint ventures or capital commitments;
changes in operating performance and stock market valuations of other technology companies generally, or those in our industry in particular;
price and volume fluctuations in certain categories of companies or the overall stock market, including as a result of trends in the global economy;
any major change in our board of directors or management;
lawsuits threatened or filed against us;
cybersecurity attacks or incidents; and
other events or factors, including those resulting from war, incidents of terrorism or responses to these events.
In addition, the stock markets, and in particular the market on which our common stock is listed, have experienced extreme price and volume fluctuations that have affected and continue to affect the market prices of equity securities of many technology companies. Stock prices of many technology companies have fluctuated in a manner unrelated or disproportionate to the financial performance of those companies. In the past, stockholders have instituted securities class action litigation following periods of market volatility. If we were to become involved in securities litigation, it could subject us to substantial costs, divert resources and the attention of management from our business and adversely affect our business, results of operations, financial condition and cash flows.
If securities or industry analysts do not publish research ornegative reports about our business, or publish negative reports aboutcease coverage of our business,company, our share price and trading volume could decline.
The trading market for our common stock depends in part on the research and reports that securities or industry analysts publish about us or our business, our market and our competitors. We do not have any control over these analysts. If one or more of the analysts who cover us downgrade our shares or change their opinion of our shares, our share price would likely decline. If one or more of these analysts cease coverage of our company or fail to regularly publish reports on us, we could lose visibility in the financial markets, which could cause our share price or trading volume to decline.
The requirements of being a public company and a growing and increasingly complex organization may strain our resources, divert management’s attention and affect our ability to attract and retain executive management and qualified board members.
As a public company, we are subject to the reporting requirements of the Securities Exchange Act of 1934, or the Exchange Act, the Sarbanes-Oxley Act, the Dodd-Frank Act, the listing requirements of The NASDAQ Stock Market and other applicable securities rules and regulations. Compliance with these rules and regulations has increased our legal and financial compliance costs, made some activities more difficult, time-consuming or costly and increased and will continue to increase demand on our systems and resources. The Exchange Act requires, among other things, that we file annual, quarterly and current reports with respect to our business and operating results. The Sarbanes-Oxley Act requires, among other things, that we maintain effective disclosure controls and procedures and internal control over financial reporting. In order to maintain and, if required, improve our disclosure controls and procedures and internal control over financial reporting to meet this standard, significant resources and management oversight may be required. As a result, management’s attention may be diverted from other business concerns, which could adversely affect our business and operating results. Although we have already hired additional employees to comply with these requirements, we may need to hire more employees in the future or engage outside consultants, which will increase our costs and expenses.
In addition, changing laws, regulations, standards and practices relating to corporate governance and public disclosure are creating uncertainty for public companies, increasing legal and financial compliance costs and making some activities more time consuming. These laws, regulations, standards and practices are subject to varying interpretations, in many cases due to their lack of specificity, and, as a result, their application in practice may evolve over time as regulatory and governing bodies provide new guidance or as market practices develop. This could result in continuing uncertainty regarding compliance matters and higher costs necessitated by ongoing revisions to disclosure and governance practices. We will continue to invest resources to comply with evolving laws, regulations and standards and keeping abreast of current practices, and this investment may result in increased general and administrative expenses and a diversion of management’s time and attention from revenue-generating activities to compliance and corporate governance activities. If our efforts to comply with new laws, regulations and standards differ from the activities intended by regulatory or governing bodies due to ambiguities related to their application and practice, regulatory authorities may initiate legal proceedings against us and our business may be adversely affected.
increased debt, special dividends, stock repurchases, management changes or sales of assets or the entire company. If stockholders attempt to effect such changes or acquire control over us, responding to such actions would be costly, time-consuming and disruptive, which could adversely affect our results of operations, financial results and the value of our common stock. These factors could also make it more difficult for us to attract and retain qualified employees, executive officers and members of our board of directors.
We are obligated to develop and maintain proper and effective internal control over financial reporting. These internal controls may not be determined to be effective, which may adversely affect investor confidence in our company and, as a result, the value of our common stock.
We are required, pursuant to Section 404 of the Sarbanes-Oxley Act, to furnish a report by management on, among other things, the effectiveness of our internal control over financial reporting. This assessment includes disclosure of any material weaknesses identified by our management in our internal control over financial reporting. We are also required to have our independent registered public accounting firm issue an opinion on the effectiveness of our internal control over financial reporting on an annual basis. During the evaluation and testing process, if we identify one or more material weaknesses in our internal control over financial reporting, we will be unable to assert that our internal controls are effective.
If we are unable to assert that our internal control over financial reporting is effective, or if our independent registered public accounting firm is unable to express an opinion on the effectiveness of our internal control over financial reporting, we could lose investor confidence in the accuracy and completeness of our financial reports, which would cause the price of our common stock to decline, and we may be subject to investigation or sanctions by the SEC.
We do not intend to pay dividends for the foreseeable future.
We have never declared or paid any cash dividends on our common stock and do not intend to pay any cash dividends in the foreseeable future. We anticipate that we will retain all of our future earnings for use in the development of our business and for general corporate purposes. Any determination to pay dividends in the future will be at the discretion of our board of directors. Accordingly, price appreciation of our common stock, which may never occur, may be the only way our stockholders realize any future gains on their investments.
Anti-takeover provisions in our charter documents and under Delaware law could make an acquisition of our company more difficult, limit attempts by our stockholders to replace or remove our current management and limit the market price of our common stock.
Provisions in our certificate of incorporation and bylaws may have the effect of delaying or preventing a change of control or changes in our management. Our certificate of incorporation and bylaws include provisions that:
authorize our board of directors to issue, without further action by the stockholders, shares of undesignated preferred stock with terms, rights and preferences determined by our board of directors;
require that any action to be taken by our stockholders be effected at a duly called annual or special meeting and not by written consent;
specify that special meetings of our stockholders can be called only by our board of directors, the Chairman of our board of directors, or our Chief Executive Officer;
establish an advance notice procedure for stockholder proposals to be brought before an annual meeting, including proposed nominations of persons for election to our board of directors;
establish that our board of directors is divided into three classes, Class I, Class II and Class III, with each class serving three-year staggered terms;
prohibit cumulative voting in the election of directors;
provide that our directors may be removed only for cause;
provide that vacancies on our board of directors may be filled only by a majority of directors then in office, even though less than a quorum; and
require the approval of our board of directors or the holders of a supermajority of our outstanding shares of capital stock to amend our bylaws and certain provisions of our certificate of incorporation.
These provisions may frustrate or prevent any attempts by our stockholders to replace or remove our current management by making it more difficult for stockholders to replace members of our board of directors, which is responsible for appointing the members of our management. In addition, because we are incorporated in Delaware, we are governed by the provisions of Section 203 of the Delaware General Corporation Law, which generally prohibits a Delaware corporation from engaging in any of a broad range of business combinations with any “interested” stockholder for a period of three years following the date on which the stockholder became an “interested” stockholder.
| Item 1B. Unresolved Staff Comments |
None.
41
| Item 2. Properties |
Our corporate headquarters at 270 Brannan Street occupy approximately 95,000182,000 square feet in San Francisco, California under an operatinga lease that expires in February 2019. To expand our corporate headquarters,2024. Additionally, we entered intohave an office lease for approximately 182,000235,000 square feet located at 270 Brannan Street,3098 Olsen Drive, San Francisco,Jose, California that expires in February 2024. We expect to occupy the premises at 270 Brannan Street in the first quarter of fiscal 2017.August 2027 for our business operations, sales, support and product development. We lease smaller regional offices for our business operations, sales, support and some product development in various locations throughout the United States. Our foreign
subsidiaries lease office space for their operations including local sales, support and some product development. While we believe our facilities are sufficient and suitable for the operations of our business today, we are in the process of adding new facilities and expanding our existing facilities as we add employees and expand into additional markets.
During the fiscal year ended January 31, 2016,2019, we entered into an office lease for approximately 235,000300,000 square feet located at 500 Santana Row,3060 Olsen Drive, San Jose, California. We expect to occupy the premises at 500 Santana Row3060 Olsen Drive starting in the fourth quarter of fiscal 2017.2020.
| Item 3. Legal Proceedings |
The information set forth under Legal Proceedings in Note 3 contained in the “Notes to Consolidated Financial Statements” is incorporated herein by reference.
| Item 4. Mine Safety Disclosures |
Not applicable.
PART II
| Item 5. Market for Registrant’s Common Equity, Related Stockholder Matters and Issuer Purchases of Equity Securities |
Common Stock Price and Dividends
Our common stock, $0.001 par value, began trading on the NASDAQ Global Select Market on April 19, 2012, where its prices are quoted under the symbol “SPLK.” As of January 31, 20162019, there were 1921 holders of record of our common stock. Because many of our shares of common stock are held by brokers and other institutions on behalf of stockholders, we are unable to estimate the total number of beneficial holders represented by these record holders, but it is well in excess of the number of record holders.
| High | Low | |||||||
| Year Ended January 31, 2015: | ||||||||
| First Quarter | $ | 106.15 | $ | 50.84 | ||||
| Second Quarter | $ | 57.60 | $ | 39.35 | ||||
| Third Quarter | $ | 68.20 | $ | 40.71 | ||||
| Fourth Quarter | $ | 72.25 | $ | 51.60 | ||||
| High | Low | |||||||
| Year Ended January 31, 2016: | ||||||||
| First Quarter | $ | 74.88 | $ | 51.41 | ||||
| Second Quarter | $ | 76.85 | $ | 64.70 | ||||
| Third Quarter | $ | 71.75 | $ | 51.71 | ||||
| Fourth Quarter | $ | 66.90 | $ | 43.80 | ||||
Stock Performance Graph
This chart compares the cumulative total return on our common stock with that of the NASDAQ Composite index and the NASDAQ Computer index. The chart assumes $100 was invested on April 19, 2012,index for each of the date our stock began trading, in our common stock, the NASDAQ Composite index and the NASDAQ Computer index.last five fiscal years ended January 31, 2019, assuming an initial investment of $100. The peer group indices utilize the same methods of presentation and assumptions for the total return calculation as does Splunk and the NASDAQ Composite index. All companies in the peer group index are weighted in accordance with their market capitalizations.
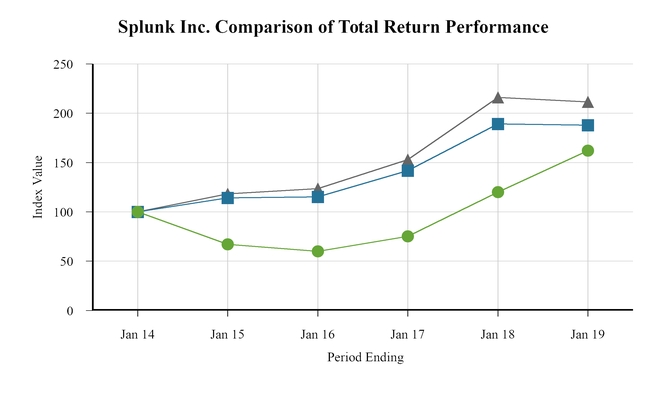
| l | Splunk Inc. | n | NASDAQ Composite | ▲ | NASDAQ Computer |
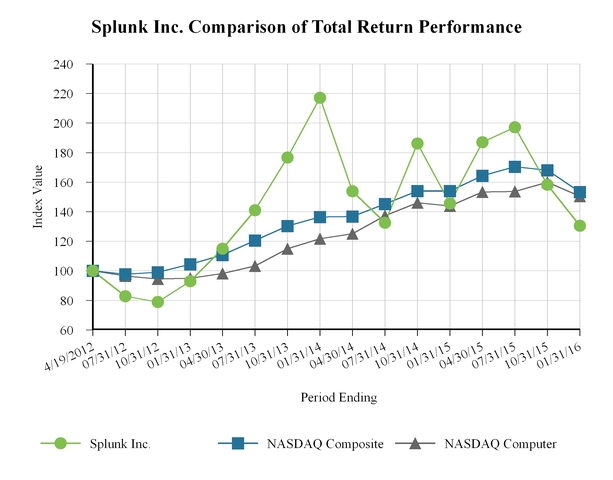
| Company/Index | 1/31/14 | 1/31/15 | 1/31/16 | 1/31/17 | 1/31/18 | 1/31/19 | ||||||||||||||||||
| Splunk Inc. | $ | 100.00 | $ | 67.05 | $ | 60.09 | $ | 75.11 | $ | 119.91 | $ | 162.07 | ||||||||||||
| NASDAQ Composite | $ | 100.00 | $ | 114.30 | $ | 115.10 | $ | 141.84 | $ | 189.26 | $ | 187.97 | ||||||||||||
| NASDAQ Computer | $ | 100.00 | $ | 118.31 | $ | 123.63 | $ | 152.88 | $ | 216.12 | $ | 211.53 | ||||||||||||
| Company/Index | Base Period 4/19/12 | 7/31/12 | 10/31/12 | 1/31/13 | 4/30/13 | 7/31/13 | 10/31/13 | 1/31/14 | 4/30/14 | 7/31/14 | 10/31/14 | 1/31/15 | 4/30/15 | 7/31/15 | 10/31/15 | 1/31/16 | ||||||||||||||||||||||||||||||||
| Splunk Inc. | $ | 100.00 | $ | 82.86 | $ | 79.00 | $ | 92.90 | $ | 114.99 | $ | 140.95 | $ | 176.75 | $ | 217.11 | $ | 153.80 | $ | 132.53 | $ | 186.25 | $ | 145.57 | $ | 187.01 | $ | 197.13 | $ | 158.29 | $ | 130.47 | ||||||||||||||||
| NASDAQ Composite | 100.00 | 97.74 | 98.99 | 104.47 | 110.68 | 120.58 | 130.33 | 136.45 | 136.81 | 145.29 | 153.97 | 154.12 | 164.30 | 170.51 | 168.03 | 153.41 | ||||||||||||||||||||||||||||||||
| NASDAQ Computer | 100.00 | 96.58 | 94.56 | 95.02 | 98.17 | 103.38 | 114.95 | 121.69 | 125.19 | 137.25 | 146.04 | 143.97 | 153.40 | 153.66 | 159.99 | 150.45 | ||||||||||||||||||||||||||||||||
| Item 6. Selected Financial Data |
The following selected consolidated financial data should be read in conjunction with our audited consolidated financial statements and related notes thereto and with Management’s Discussion and Analysis of Financial Condition and Results of Operations, which are included elsewhere in this Form 10-K. The consolidated statementstatements of operations data for fiscal 2016, 2015,2019, 2018 and 20142017, and the selected consolidated balance sheetsheets data as of January 31, 20162019 and 20152018 are derived from, and are qualified by reference to, the audited consolidated financial statements, andadjusted for the adoption of accounting standards update No. 2014-09 (Topic 606), which are included in this Form 10-K. The consolidated statement of operations data for fiscal 2013 and 2012 and the consolidated balance sheet data as of January 31, 2014, 2013,2017 has been adjusted for the adoption of Topic 606. The consolidated statements of operations data for fiscal 2016 and 20122015 and the consolidated balance sheets data as of January 31, 2016 and 2015 are derived from audited consolidated financial statements, which are not included in this Form 10-K.
Consolidated Statements of Operations Data
| Fiscal Year Ended January 31, | Fiscal Year Ended January 31, | ||||||||||||||||||||||||||||||||||||||
| 2016 | 2015 | 2014 | 2013 | 2012 | 2019 | 2018 | 2017 | 2016 | 2015 | ||||||||||||||||||||||||||||||
| (in thousands, except per share amounts) | |||||||||||||||||||||||||||||||||||||||
| Consolidated Statement of Operations Data: | |||||||||||||||||||||||||||||||||||||||
| (In thousands, except per share amounts) | 2019 | * As Adjusted | * As Adjusted | 2016 | 2015 | ||||||||||||||||||||||||||||||||||
| Revenues | |||||||||||||||||||||||||||||||||||||||
| License | $ | 405,399 | $ | 283,191 | $ | 199,024 | $ | 135,922 | $ | 88,308 | $ | 1,030,277 | $ | 741,302 | $ | 543,510 | $ | 405,399 | $ | 283,191 | |||||||||||||||||||
| Maintenance and services | 263,036 | 167,684 | 103,599 | 63,022 | 32,652 | 772,733 | 567,830 | 400,054 | 263,036 | 167,684 | |||||||||||||||||||||||||||||
| Total revenues | 668,435 | 450,875 | 302,623 | 198,944 | 120,960 | 1,803,010 | 1,309,132 | 943,564 | 668,435 | 450,875 | |||||||||||||||||||||||||||||
| Cost of revenues (1) | |||||||||||||||||||||||||||||||||||||||
| License | 9,080 | 1,859 | 330 | 727 | 890 | 22,527 | 13,398 | 11,965 | 9,080 | 1,859 | |||||||||||||||||||||||||||||
| Maintenance and services | 105,042 | 66,519 | 35,495 | 20,697 | 10,715 | 322,149 | 243,011 | 179,088 | 105,042 | 66,519 | |||||||||||||||||||||||||||||
| Total cost of revenues | 114,122 | 68,378 | 35,825 | 21,424 | 11,605 | 344,676 | 256,409 | 191,053 | 114,122 | 68,378 | |||||||||||||||||||||||||||||
| Gross profit | 554,313 | 382,497 | 266,798 | 177,520 | 109,355 | 1,458,334 | 1,052,723 | 752,511 | 554,313 | 382,497 | |||||||||||||||||||||||||||||
| Operating expenses (1) | |||||||||||||||||||||||||||||||||||||||
| Research and development | 215,309 | 150,790 | 75,895 | 41,853 | 23,561 | 441,969 | 301,114 | 295,850 | 215,309 | 150,790 | |||||||||||||||||||||||||||||
| Sales and marketing | 505,348 | 344,471 | 215,335 | 125,098 | 74,782 | 1,029,950 | 777,876 | 639,404 | 505,348 | 344,471 | |||||||||||||||||||||||||||||
| General and administrative | 121,579 | 103,046 | 53,875 | 32,602 | 19,698 | 237,588 | 159,143 | 153,359 | 121,579 | 103,046 | |||||||||||||||||||||||||||||
| Total operating expenses | 842,236 | 598,307 | 345,105 | 199,553 | 118,041 | 1,709,507 | 1,238,133 | 1,088,613 | 842,236 | 598,307 | |||||||||||||||||||||||||||||
| Operating loss | (287,923 | ) | (215,810 | ) | (78,307 | ) | (22,033 | ) | (8,686 | ) | (251,173 | ) | (185,410 | ) | (336,102 | ) | (287,923 | ) | (215,810 | ) | |||||||||||||||||||
| Interest and other income (expense), net | |||||||||||||||||||||||||||||||||||||||
| Interest income, net | 1,798 | 754 | 225 | 152 | (94 | ) | |||||||||||||||||||||||||||||||||
| Interest income | 31,458 | 8,943 | 5,720 | 3,166 | 1,586 | ||||||||||||||||||||||||||||||||||
| Interest expense | (41,963 | ) | (8,794 | ) | (8,549 | ) | (1,368 | ) | (832 | ) | |||||||||||||||||||||||||||||
| Other income (expense), net | (519 | ) | 216 | (920 | ) | — | — | (1,513 | ) | (3,600 | ) | (3,022 | ) | (519 | ) | 216 | |||||||||||||||||||||||
| Change in fair value of preferred stock warrants | — | — | — | (14,087 | ) | (2,034 | ) | ||||||||||||||||||||||||||||||||
| Total interest and other income (expense), net | 1,279 | 970 | (695 | ) | (13,935 | ) | (2,128 | ) | (12,018 | ) | (3,451 | ) | (5,851 | ) | 1,279 | 970 | |||||||||||||||||||||||
| Loss before income taxes | (286,644 | ) | (214,840 | ) | (79,002 | ) | (35,968 | ) | (10,814 | ) | (263,191 | ) | (188,861 | ) | (341,953 | ) | (286,644 | ) | (214,840 | ) | |||||||||||||||||||
| Provision for income taxes (benefit) | (7,872 | ) | 2,276 | 6 | 713 | 178 | 12,386 | 1,357 | 5,507 | (7,872 | ) | 2,276 | |||||||||||||||||||||||||||
| Net loss | $ | (278,772 | ) | $ | (217,116 | ) | $ | (79,008 | ) | $ | (36,681 | ) | $ | (10,992 | ) | $ | (275,577 | ) | $ | (190,218 | ) | $ | (347,460 | ) | $ | (278,772 | ) | $ | (217,116 | ) | |||||||||
| Net loss per share: | |||||||||||||||||||||||||||||||||||||||
| Basic and diluted | $ | (2.20 | ) | $ | (1.81 | ) | $ | (0.75 | ) | $ | (0.46 | ) | $ | (0.53 | ) | $ | (1.89 | ) | $ | (1.36 | ) | $ | (2.59 | ) | $ | (2.20 | ) | $ | (1.81 | ) | |||||||||
| Weighted-average shares outstanding: | |||||||||||||||||||||||||||||||||||||||
| Basic and diluted | 126,746 | 119,775 | 105,067 | 80,246 | 20,646 | 145,707 | 139,866 | 133,910 | 126,746 | 119,775 | |||||||||||||||||||||||||||||
| * | Prior-period information has been adjusted to reflect the adoption of ASU No. 2014-09, Revenue from Contracts with Customers (Topic 606), which we adopted on February 1, 2018. Refer to Note 1 for further details. |
(1) | Amounts include stock-based compensation expense as follows: |
| Fiscal Year Ended January 31, | Fiscal Year Ended January 31, | ||||||||||||||||||||||||||||||||||||||
| 2016 | 2015 | 2014 | 2013 | 2012 | |||||||||||||||||||||||||||||||||||
| (in thousands) | |||||||||||||||||||||||||||||||||||||||
| (In thousands) | 2019 | 2018 | 2017 | 2016 | 2015 | ||||||||||||||||||||||||||||||||||
| Cost of revenues | $ | 26,057 | $ | 17,189 | $ | 5,283 | $ | 1,217 | $ | 134 | $ | 37,501 | $ | 33,605 | $ | 30,971 | $ | 26,057 | $ | 17,189 | |||||||||||||||||||
| Research and development | 89,197 | 60,777 | 20,829 | 6,170 | 841 | 137,171 | 106,690 | 129,388 | 89,197 | 60,777 | |||||||||||||||||||||||||||||
| Sales and marketing | 130,054 | 90,064 | 30,012 | 8,093 | 1,488 | 190,422 | 159,240 | 161,164 | 130,054 | 90,064 | |||||||||||||||||||||||||||||
| General and administrative | 46,949 | 46,149 | 13,244 | 4,000 | 1,297 | 76,836 | 58,928 | 56,518 | 46,949 | 46,149 | |||||||||||||||||||||||||||||
Consolidated Balance Sheets Data
| As of January 31, | |||||||||||||||||||
| 2016 | 2015 | 2014 | 2013 | 2012 | |||||||||||||||
| (in thousands) | |||||||||||||||||||
| Consolidated Balance Sheet Data: | |||||||||||||||||||
| Cash, cash equivalents and short-term investments | $ | 1,009,039 | $ | 850,164 | $ | 897,453 | $ | 305,939 | $ | 31,599 | |||||||||
| Working capital | 719,503 | 653,185 | 784,966 | 259,789 | 1,142 | ||||||||||||||
| Total assets | 1,536,839 | 1,247,791 | 1,040,331 | 390,445 | 82,223 | ||||||||||||||
| Deferred revenue, current and long-term | 449,503 | 304,085 | 192,321 | 114,712 | 52,665 | ||||||||||||||
| Debt obligations, current and long-term | — | — | — | — | 2,289 | ||||||||||||||
| Preferred stock warrants | — | — | — | — | 2,133 | ||||||||||||||
| Convertible preferred stock | — | — | — | — | 40,913 | ||||||||||||||
| Total stockholders’ equity (deficit) | 859,414 | 813,321 | 784,908 | 237,544 | (41,646 | ) | |||||||||||||
| January 31, | ||||||||||||||||||||
| 2019 | 2018 | 2017 | 2016 | 2015 | ||||||||||||||||
| (In thousands) | * As Adjusted | * As Adjusted | ||||||||||||||||||
| Cash, cash equivalents and short-term investments | $ | 2,757,385 | $ | 1,165,150 | $ | 1,083,442 | $ | 1,009,039 | $ | 850,164 | ||||||||||
| Working capital | 2,333,325 | 953,086 | 874,405 | 719,503 | 653,185 | |||||||||||||||
| Total assets | 4,500,243 | 2,139,445 | 1,785,993 | 1,536,839 | 1,247,791 | |||||||||||||||
| Deferred revenue, current and long-term | 877,947 | 668,705 | 436,426 | 449,503 | 304,085 | |||||||||||||||
| Total stockholders’ equity | 1,520,457 | 1,131,321 | 1,060,292 | 859,414 | 813,321 | |||||||||||||||
| * | Prior-period information has been adjusted to reflect the adoption of ASU No. 2014-09, Revenue from Contracts with Customers (Topic 606), which we adopted on February 1, 2018. Refer to Note 1 for further details. |
| Item 7. Management’s Discussion and Analysis of Financial Condition and Results of Operations |
The following discussion and analysis of our financial condition and results of operations should be read in conjunction with our consolidated financial statements and related notes appearing elsewhere in this Annual Report on Form 10-K.This discussion contains forward-looking statements based upon current expectations that involve risks and uncertainties. Our actual results may differ materially from those anticipated in these forward-looking statements as a result of various factors, including those set forth under “Risk Factors” included in Part I, Item 1A or in other parts of this report.
Overview
Splunk provides innovative software solutions that enable organizations to gain real-time operational intelligence by harnessing the value of their data. Our offerings enable users to collect, index, search, explore,investigate, monitor, analyze and analyzeact on machine data regardless of format or source. Our offerings address large and diverse data sets commonly referred to as big data and are specifically tailored for machine data. Machine data is produced by nearly every software application and electronic device across an organization and contains a definitive, time-stampedreal-time record of various activities, such as transactions, customer and user activities,behavior, and security threats. Beyond an organization’s traditional information technology (“IT”) and security infrastructure, every processor-based system,data from the Industrial Internet, including HVAC controllers, manyindustrial control systems, sensors, supervisory control and data acquisition (“SCADA”) systems, networks, manufacturing systems, smart electrical meters GPS devices and radio-frequency identification tags, and manythe Internet of Things (“IoT”), which includes consumer-oriented systems, such as electronic wearables, mobile devices, automobiles and medical devices that contain embedded processor chips, are also continuously generating machine data. Our offerings help organizations gain the value from all of these different sources and forms ofcontained in machine data.data by delivering real-time information to enable operational decision making.
We believe the market for products that provide operational intelligence presents a substantial opportunity as data grows in volume and diversity, creating new risks, opportunities and challenges for organizations. Since our inception, we have invested a substantial amount of resources developing our offerings to address this market, specifically with respect to machine data.
Our offerings are designed to deliver rapid return-on-investment for our customers. They generally do not require customization, long deployment cycles or extensive professional services commonly associated with traditional enterprise
software applications. ForProspective users can get started with our free online sandboxes that enable our customers to immediately try and experience Splunk offerings. Users that prefer to deploy the software on-premises can take advantage of our free 60-day trial of Splunk Enterprise, which converts into a limited free perpetual license of up to 500 megabytes of data per day. A 15-day free trial is available to users that prefer the core functionalities of Splunk Enterprise delivered as a cloud service. These users can sign up for Splunk Cloud and avoid the need to provision, deploy and manage internal infrastructure. Alternatively, they can simply download and install the software, typically in a matter of hours, to connect to their relevant machine data sources. Alternatively, they can sign up for our Splunk Cloud service and avoid the
For Splunk Enterprise, we base our license fees on the estimated daily data indexing capacity our customers require. Prospective customers can download a free 60-day trial of Splunk Enterprise, which converts into a limited free perpetual license of up to 500 megabytes of data per day. A majoritysubstantial portion of our license revenues consist of revenues from perpetual and term licenses, whereby we generally recognize the license fee portion of these arrangements upfront. As a result, the timing of when we enter into large perpetual and term licenses may lead to fluctuations in our revenues and operating results because our expenses are largely fixed in the short-term. Additionally, we license our software under term licenses, which are generally recognized ratably over the contract term. From time to time, we also enter into transactions that are designed to enable broad adoption of our software within an enterprise, referred to as enterprise adoption agreements. These agreements often include provisions that require revenue deferral and recognition over time.
We intend to continue investing for long-term growth. We have invested and expectintend to continue to invest heavily in our product development efforts to deliver additional compelling features address customer needs and enableperformance enhancements, deployment models and solutions that can address new end markets. For example, we released new versions of existing productsofferings such as Splunk Enterprise, Splunk ES and Splunk ITSI and introduced new productsofferings for the security and IT marketsmarket during fiscal 2016. In addition, we2019. We expect to continue to aggressively expand our sales and marketing organizations to market and sell our software both in the United States and internationally.
We have utilized and expect to continue to utilize acquisitions to contribute to our long-term growth objectives. In June 2015,During fiscal 2019, we acquired Metafor Software,completed a privately-held British Columbia corporation,number of acquisitions, including Phantom, which developed technology that provides anomaly detectiondevelops solutions for security orchestration, automation and behavioral analyticsresponse, and VictorOps, which develops incident management solutions for the IT operations. In July 2015, we acquired Caspida, a privately-held Delaware corporation, which developed technology that provides behavioral analytics to help detect, respond to and mitigate advanced security and insider security threats.DevOps markets.
Our goal is to make our software the platform for delivering operational intelligence and real-time business insights from machine data. The key elements of our growth strategy are to:
Extend our technological capabilities.
Continue to expand our direct and indirect sales organization, including our channel relationships, to increase our sales capacity and enable greater market presence.
Further penetrate our existing customer base and drive enterprise-wide adoption.
Enhance our value proposition through a focus on solutions which address core and expanded use cases.
Grow our user communities and partner ecosystem to increase awareness of our brand, target new use cases, drive operational leverage and deliver more targeted, higher value solutions.
Continue to deliver a rich developer environment to enable rapid development of enterprise applications that leverage machine data and the Splunk platform.
We believe the factors that will influence our ability to achieve our goals include, among other things, our ability to deliver new productsofferings as well as additional product functionality; acquire new customers across geographies and industries; cultivate incremental sales from our existing customers by driving increased use of our software within organizations; provide additional solutions that leverage our core machine data platform to help organizations understand and realize the value of their machine data in specific end markets and use cases; add additional OEMoriginal equipment manufacturer (“OEM”) and strategic relationships to enable new sales channels for our software as well as extend our integration with third partythird-party products; help software developers leverage the
functionality of our machine data platform through SDKssoftware development kits (“SDKs”) and APIs;application programming interfaces (“APIs”); and successfully integrate acquired businesses and technologies.
Prior period information presented in the fiscal years ended January 31, 2016, 2015“Management’s Discussion and 2014, our total revenues were $668.4 million, $450.9 million $302.6 million, respectively. ForAnalysis of Financial Condition and Results of Operations” section and comparative references to prior periods have been adjusted to reflect the fiscal year ended January 31, 2016, approximately 25%impact of the full retrospective adoption of ASU No. 2014-09, Revenue from Contracts with Customers (Topic 606). Refer to Note 1 of our total revenues were derived from customers located outside the United States. accompanying Notes to Consolidated Financial Statements included in Part II, Item 8, “Financial Statements and Supplementary Data” of this Annual Report on Form 10-K for further information.
Financial Summary
(Dollars in millions)
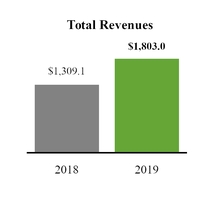
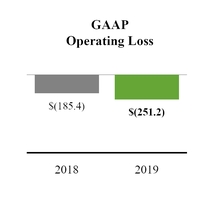
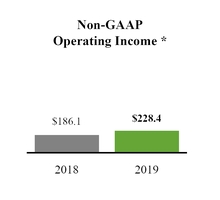
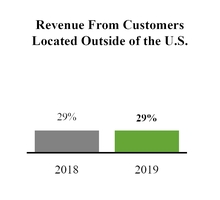
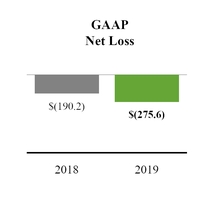
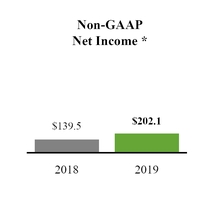
_________________________
| * | Refer to Non-GAAP Financial Results below for further information regarding our GAAP to non-GAAP Financial Measures and related reconciliations. |
Our customers and end-users represent the public sector and a wide variety of industries, including financial services, manufacturing, retail and technology, among others. As of January 31, 2016,2019, we had over 11,00017,500 customers, including 8590 of the Fortune 100 companies.
Non-GAAP Financial Results
To supplement our consolidated financial statements, which are prepared and presented in accordance with GAAP, we provide investors with certain non-GAAP financial measures, including non-GAAP cost of revenues, non-GAAP gross margin, non-GAAP research and development expense, non-GAAP sales and marketing expense, non-GAAP general and administrative expense, non-GAAP operating income (loss), non-GAAP operating margin, non-GAAP income tax provision (benefit), non-GAAP net income (loss) and non-GAAP net income (loss) per share (collectively the “non-GAAP financial measures”). These non-GAAP financial measures exclude all or a combination of the following (as reflected in the following reconciliation tables): expenses related to stock-based compensation expense,and related employer payroll tax, expense related to employee stock plans, amortization of acquired intangible assets, impairment of a long-lived asset, acquisition-related costs, ground lease expenseadjustments related to a build-to-suitfinancing lease obligation, andadjustments related to facility exits, acquisition-related adjustments, including the partial release of the valuation allowance due to acquisitions.acquisitions and non-cash interest expense related to our convertible senior notes. The adjustments for the financing lease obligation are to reflect the expense we would have recorded if our build-to-suit lease arrangement had been deemed an operating lease instead of a financing lease and is calculated as the net of actual ground lease expense, depreciation and interest expense over estimated straight-line rent expense. We issued convertible senior notes in the third quarter of fiscal 2019, and therefore exclude non-cash interest expense related to our convertible senior notes beginning with the third quarter of fiscal 2019. The non-GAAP financial measures are also adjusted for our estimated tax rate on non-GAAP income (loss). To determine the annual non-GAAP tax rate, we evaluate a financial projection based on our non-GAAP results. The annual non-GAAP tax rate takes into account other factors including our current operating structure, our existing tax positions in various jurisdictions and key legislation in major jurisdictions where we operate. The non-GAAP tax rate applied to the fiscal year ended January 31, 2019 was 20%. We provide updates to this rate on an annual basis, or more frequently if material changes occur. In addition, our non-GAAP financial measures include free cash flow, which represents cash from operations less purchases of property and equipment. The presentation of the non-GAAP financial measures is not intended to be considered in isolation or as a substitute for, or superior to, the financial information prepared and presented in accordance with GAAP. We use these non-GAAP financial measures for financial and operational decision-making purposes and as a means to evaluate period-to-period comparisons. We believe that these non-GAAP financial measures provide useful information about our operating results, enhance the overall understanding of past financial performance and future prospects and allow for greater transparency with respect to key metrics used by our management in itsour financial and operational decision making. In addition, these non-GAAP financial measures facilitate comparisons to competitors’ operating results.
We exclude stock-based compensation expense from our non-GAAP financial measures because it is non-cash in nature and excluding this expense provides meaningful supplemental information regarding our operational performance. In particular, because of varying available valuation methodologies, subjective assumptionsperformance and the variety of award types that companies can use under the Financial Accounting Standards Board (“FASB”), Accounting Standards Codification (“ASC”) Topic 718, we believe that providing non-GAAP financial measures that exclude this expense allows investors the ability to make more meaningful comparisons between our operating results and those of other companies. We exclude employer payroll tax expense related to employee stock plans in order for investors to see the full effect that excluding that stock-based compensation expense had on our operating results. These expenses are tied to the exercise or vesting of underlying equity awards and the price of our common stock at the time of vesting or exercise, which may vary from period to period independent of the operating performance of our business. We also exclude the non-cash charge for previously capitalized research and development expense for our Splunk Storm product (reflected as an impairment of a long-lived asset) as a result of our strategic decision to start making Splunk Storm available at no cost to customers, a decision that we expect to be infrequent in nature. We also exclude amortization of acquired intangible assets, acquisition-related costs, ground lease expenseadjustments related to a build-to-suitfinancing lease obligation, andadjustments related to facility exits, acquisition-related adjustments, including the partial release of the valuation allowance due to our acquisitions, and non-cash interest expense related to our convertible senior notes from our non-GAAP financial measures because these are considered by management to be outside of our core operating results.
Accordingly, we believe that excluding these expenses provides investors and management with greater visibility to the underlying performance of our business operations, facilitates comparison of our results with other periods and may also facilitate comparison with the results of other companies in our industry. We consider free cash flow to be a liquidity measure that provides useful information to management and investors about the amount of cash generated by the business that can be used for strategic opportunities, including investing in our business, making strategic acquisitions and strengthening our balance sheet.
There are limitations in using non-GAAP financial measures because the non-GAAP financial measures are not prepared in accordance with GAAP, may be different from non-GAAP financial measures used by our competitors and exclude expenses that may have a material impact upon our reported financial results. Further, stock-based compensation expense has been and will continue to be for the foreseeable future a significant recurring expense in our business and an important part of the compensation provided to our employees. The non-GAAP financial measures are meant to supplement and be viewed in conjunction with GAAP financial measures.
The following table reconciles our net cash provided by operating activities to free cash flow for the fiscal years ended January 31, 2016, 2015 and 2014 (in thousands):flow:
| Fiscal Year Ended January 31, | Fiscal Year Ended January 31, | ||||||||||||||||||
| 2016 | 2015 | 2014 | |||||||||||||||||
| (In thousands) | 2019 | 2018 | |||||||||||||||||
| Net cash provided by operating activities | $ | 155,622 | $ | 103,980 | $ | 73,848 | $ | 296,454 | $ | 262,904 | |||||||||
| Less purchases of property and equipment | (51,332 | ) | (13,950 | ) | (9,308 | ) | (23,160 | ) | (20,503 | ) | |||||||||
| Free cash flow (non-GAAP) | $ | 104,290 | $ | 90,030 | $ | 64,540 | $ | 273,294 | $ | 242,401 | |||||||||
| Net cash used in investing activities | $ | (153,490 | ) | $ | (645,160 | ) | $ | (39,046 | ) | $ | (779,278 | ) | $ | (38,505 | ) | ||||
| Net cash provided by financing activities | $ | 35,485 | $ | 31,610 | $ | 556,699 | |||||||||||||
| Net cash provided by (used in) financing activities | $ | 1,813,425 | $ | (101,419 | ) | ||||||||||||||
The following table reconciles our GAAP gross margin to non-GAAP gross marginFinancial Measures for the fiscal yearsyear ended January 31, 2016, 2015 and 2014:2019:
| Fiscal Year Ended January 31, | ||||||||
| 2016 | 2015 | 2014 | ||||||
| GAAP gross margin | 82.9 | % | 84.8 | % | 88.2 | % | ||
| Stock-based compensation expense | 3.9 | 3.9 | 1.7 | |||||
| Employer payroll tax on employee stock plans | 0.1 | 0.1 | 0.1 | |||||
| Amortization of acquired intangible assets | 1.3 | 0.7 | 0.2 | |||||
| Impairment of long-lived asset | — | — | 0.7 | |||||
| Non-GAAP gross margin | 88.2 | % | 89.5 | % | 90.9 | % | ||
| (Dollars in thousands, except per share amounts) | GAAP | Stock-based compensation and related employer payroll tax | Amortization of acquired intangible assets | Adjustments related to financing lease obligation | Acquisition-related adjustments | Non-cash interest expense related to convertible senior notes | Income tax effects related to non-GAAP adjustments (4) | Non-GAAP | ||||||||||||||||||||||||
| Cost of revenues | $ | 344,676 | $ | (39,429 | ) | $ | (21,444 | ) | $ | 1,218 | $ | — | $ | — | $ | — | $ | 285,021 | ||||||||||||||
| Gross margin | 80.9 | % | 2.2 | % | 1.2 | % | (0.1 | )% | — | % | — | % | — | % | 84.2 | % | ||||||||||||||||
| Research and development | 441,969 | (141,315 | ) | (1,041 | ) | 2,029 | — | — | — | 301,642 | ||||||||||||||||||||||
| Sales and marketing | 1,029,950 | (197,384 | ) | (2,740 | ) | 4,573 | — | — | — | 834,399 | ||||||||||||||||||||||
| General and administrative | 237,588 | (79,045 | ) | — | 1,002 | (6,034 | ) | — | — | 153,511 | ||||||||||||||||||||||
| Operating income (loss) | (251,173 | ) | 457,173 | 25,225 | (8,822 | ) | 6,034 | — | — | 228,437 | ||||||||||||||||||||||
| Operating margin | (13.9 | )% | 25.4 | % | 1.4 | % | (0.5 | )% | 0.3 | % | — | % | — | % | 12.7 | % | ||||||||||||||||
| Income tax provision | 12,386 | — | — | — | 3,313 | (3) | — | 34,826 | 50,525 | |||||||||||||||||||||||
| Net income (loss) | $ | (275,577 | ) | $ | 457,173 | $ | 25,225 | $ | (636 | ) | (2) | $ | 2,721 | $ | 28,019 | $ | (34,826 | ) | $ | 202,099 | ||||||||||||
Net income (loss) per share (1) | $ | (1.89 | ) | $ | 1.33 | |||||||||||||||||||||||||||
_________________________
(1) | GAAP net loss per share calculated based on 145,707 weighted-average shares of common stock. Non-GAAP net income per share calculated based on 152,126 diluted weighted-average shares of common stock, which includes 6,419 potentially dilutive shares related to employee stock awards. GAAP to non-GAAP net income (loss) per share is not reconciled due to the difference in the number of shares used to calculate basic and diluted weighted-average shares of common stock. |
(2) | Includes $8.2 million of interest expense related to the financing lease obligation. |
(3) | Represents the partial release of the valuation allowance. |
(4) | Represents the tax effect of the non-GAAP adjustments based on the estimated annual effective tax rate of 20%. |
The following table reconciles our GAAP operating loss to non-GAAP operating income (loss)Financial Measures for the fiscal yearsyear ended January 31, 2016, 2015 and 2014 (in thousands):2018:
| Fiscal Year Ended January 31, | |||||||||||
| 2016 | 2015 | 2014 | |||||||||
| GAAP operating loss | $ | (287,923 | ) | $ | (215,810 | ) | $ | (78,307 | ) | ||
| Stock-based compensation expense | 292,257 | 214,179 | 69,368 | ||||||||
| Employer payroll tax on employee stock plans | 8,968 | 8,868 | 3,971 | ||||||||
| Amortization of acquired intangible assets | 9,190 | 4,377 | 906 | ||||||||
| Impairment of long-lived asset | — | — | 2,128 | ||||||||
| Acquisition-related costs | 1,993 | — | 722 | ||||||||
| Ground lease expense related to build-to-suit lease obligation | 888 | 666 | — | ||||||||
| Non-GAAP operating income (loss) | $ | 25,373 | $ | 12,280 | $ | (1,212 | ) | ||||
| (Dollars in thousands, except per share amounts) | GAAP | Stock-based compensation and related employer payroll tax | Amortization of acquired intangible assets | Adjustments related to financing lease obligation | Adjustments related to facility exits | Acquisition-related adjustments | Income tax effects related to non-GAAP adjustments (4) | Non-GAAP | ||||||||||||||||||||||||
| Cost of revenues | $ | 256,409 | $ | (34,814 | ) | $ | (12,387 | ) | $ | 1,259 | $ | — | $ | — | $ | — | $ | 210,467 | ||||||||||||||
| Gross margin | 80.4 | % | 2.7 | % | 0.9 | % | (0.1 | )% | — | % | — | % | — | % | 83.9 | % | ||||||||||||||||
| Research and development | 301,114 | (109,743 | ) | (492 | ) | 1,990 | — | — | — | 192,869 | ||||||||||||||||||||||
| Sales and marketing | 777,876 | (164,363 | ) | (1,909 | ) | 4,684 | — | — | — | 616,288 | ||||||||||||||||||||||
| General and administrative | 159,143 | (61,192 | ) | — | 927 | 5,191 | (643 | ) | — | 103,426 | ||||||||||||||||||||||
| Operating income (loss) | (185,410 | ) | 370,112 | 14,788 | (8,860 | ) | (5,191 | ) | 643 | — | 186,082 | |||||||||||||||||||||
| Operating margin | (14.2 | )% | 28.4 | % | 1.1 | % | (0.7 | )% | (0.4 | )% | — | % | — | % | 14.2 | % | ||||||||||||||||
| Income tax provision | 1,357 | — | — | — | — | 2,540 | (3) | 47,681 | 51,578 | |||||||||||||||||||||||
| Net income (loss) | $ | (190,218 | ) | $ | 370,112 | $ | 14,788 | $ | (463 | ) | (2) | $ | (5,191 | ) | $ | (1,897 | ) | $ | (47,681 | ) | $ | 139,450 | ||||||||||
Net income (loss) per share (1) | $ | (1.36 | ) | $ | 0.96 | |||||||||||||||||||||||||||
_________________________
(1) | GAAP net loss per share calculated based on 139,866 weighted-average shares of common stock. Non-GAAP net income per share calculated based on 144,862 diluted weighted-average shares of common stock, which includes 4,996 potentially dilutive shares related to employee stock awards. GAAP to non-GAAP net income (loss) per share is not reconciled due to the difference in the number of shares used to calculate basic and diluted weighted-average shares of common stock. |
(2) | Includes $8.4 million of interest expense related to the financing lease obligation. |
(3) | Represents the partial release of the valuation allowance. |
(4) | Represents the tax effect of the non-GAAP adjustments based on the estimated annual effective tax rate of 27%. |
| Fiscal Year Ended January 31, | ||||||||
| 2016 | 2015 | 2014 | ||||||
| GAAP operating margin | (43.1 | )% | (47.9 | )% | (25.9 | )% | ||
| Stock-based compensation expense | 43.8 | 47.5 | 22.9 | |||||
| Employer payroll tax on employee stock plans | 1.3 | 2.0 | 1.3 | |||||
| Amortization of acquired intangible assets | 1.4 | 1.0 | 0.3 | |||||
| Impairment of long-lived asset | — | — | 0.7 | |||||
| Acquisition-related costs | 0.3 | — | 0.3 | |||||
| Ground lease expense related to build-to-suit lease obligation | 0.1 | 0.1 | — | |||||
| Non-GAAP operating margin | 3.8 | % | 2.7 | % | (0.4 | )% | ||
| Fiscal Year Ended January 31, | |||||||||||
| 2016 | 2015 | 2014 | |||||||||
| GAAP net loss | $ | (278,772 | ) | $ | (217,116 | ) | $ | (79,008 | ) | ||
| Stock-based compensation expense | 292,257 | 214,179 | 69,368 | ||||||||
| Employer payroll tax on employee stock plans | 8,968 | 8,868 | 3,971 | ||||||||
| Amortization of acquired intangible assets | 9,190 | 4,377 | 906 | ||||||||
| Impairment of long-lived assets | — | — | 2,128 | ||||||||
| Acquisition-related costs | 1,993 | — | 722 | ||||||||
| Ground lease expense related to build-to-suit lease obligation | 888 | 666 | — | ||||||||
| Partial release of the valuation allowance due to acquisitions | (10,924 | ) | — | (1,174 | ) | ||||||
| Non-GAAP net income (loss) | $ | 23,600 | $ | 10,974 | $ | (3,087 | ) | ||||
| Fiscal Year Ended January 31, | |||||||||||
| 2016 | 2015 | 2014 | |||||||||
| Weighted-average shares used in computing GAAP basic net loss per share | 126,746 | 119,775 | 105,067 | ||||||||
| Effect of dilutive securities: Employee stock awards | 5,007 | 7,364 | — | ||||||||
| Weighted-average shares used in computing Non-GAAP basic and diluted net income (loss) per share | 131,753 | 127,139 | 105,067 | ||||||||
| GAAP basic and diluted net loss per share | $ | (2.20 | ) | $ | (1.81 | ) | $ | (0.75 | ) | ||
| Non-GAAP basic and diluted net income (loss) per share | $ | 0.18 | $ | 0.09 | $ | (0.03 | ) | ||||
Components of Operating Results
Revenues
License revenues.revenues. License revenues reflect the revenues recognized from sales of licenses to new customers and additional licenses to existing customers.customers, including sales from the renewal of term licenses. We are focused on acquiring new customers and increasing revenues from our existing customers as they realize the value of our software by indexing higher volumes of machine data and expanding the use of our software through additional use cases and broader deployment within their organizations. A majority of ourOur license revenues consistsconsist of revenues from perpetual licenses and term licenses, under which we generally recognize the license fee portion of the arrangement upfront, assuming all revenue recognition criteria are satisfied. Customers can also purchase term license agreements, under which we recognize the license fee ratably, on a straight-line basis, over the term of the license. Due to the differing revenue recognition policies applicable to perpetual and term licenses, shifts in the mix between perpetual and term licenses from quarter to quarter could produce substantial variation in revenues recognized even if our sales remain consistent. In addition, seasonal trends that contribute to increased sales activity in the fourth fiscal quarter often result in lower sequential revenues in the first fiscal quarter, and we expect this trend to continue. We also expect our license revenue mix to continue to shift in favor of term licenses as we continue our transition to a predominately renewable model. Comparing our revenues on a period-to-period basis may not be meaningful, and youour past results should not rely on our past resultsbe relied upon as an indication of our future performance. Our historical methods of revenue recognition have been materially affected by the adoption of Topic 606. Refer to Note 1 of our accompanying Notes to Consolidated Financial Statements included elsewhere in this Annual Report on Form 10-K for further information.
Maintenance and services revenues. Maintenance and services revenues consist of revenues from maintenance agreements, cloud services and to a lesser extent, professional services and training, as well as revenues from our cloud services.training.
Maintenance revenues. Typically, when purchasing a perpetual license, a customer also purchases one year of maintenance service for which we charge a percentage of the license fee. When a term license is purchased, maintenance service is typically bundled with the license for the term of the license period. Customers with maintenance agreements are entitled to receive support and unspecified upgrades and enhancements when and if they become available during the maintenance period. We recognize the revenues associated with maintenance agreements ratably, on a straight-line basis, over the associated maintenance period. In arrangements involving a term license, we recognize both the license and maintenance revenues
Cloud services revenues. Cloud services allow customers to use hosted software over the contract period. We have a professional services organization focused on helping someperiod without taking possession of our largest customers deploy our software in highly complex operational environments and train their personnel. We recognize the revenues associated with these professional services on a time and materials basis as we deliver the services or provide the training. We expect maintenance and services revenues to become a larger percentage of our total revenues as our installed customer base grows.software. We generally recognize the revenues associated with our cloud services ratably, on a straight-line basis, over the associated subscription term. We expect revenues from cloud services to continue to increase as a percentage of total revenue as we continue our transition to a predominately renewable model.
Professional services and training revenues. We have a professional services organization focused on helping our customers deploy our software in highly complex operational environments and train their personnel. Training and professional services have stated billing rates per service hour or are provided on a subscription basis, accordingly, revenues are recognized as services are delivered or ratably over the subscription period. Professional services and training revenues as a percentage of total revenues were 7%8% for the fiscal years ended January 31, 20162019 and 2015.2018. We have experienced continued growth in our professional services revenues primarily due to the deployment of our software with some customers that have large, highly complex IT environments.
Cost of Revenues
Cost of license revenues. Cost of license revenues includes all direct costs to deliver our product,products, including salaries, benefits, stock-based compensation and related expenses such as employer taxes, allocated overhead for facilities and IT and amortization of acquired intangible assets. We recognize these expenses as they are incurred.
Cost of maintenance and services revenues. Cost of maintenance and services revenues includes salaries, benefits, stock-based compensation and related expenses such as employer taxes for our maintenance and services organization,organizations, third-party consulting services, allocated overhead for depreciation of equipment, facilities and IT, amortization of acquired intangible assets and third-party hosting fees related to our cloud services. We recognize expenses related to our maintenance and services organizationorganizations as they are incurred.
Operating Expenses
Our operating expenses are classified into three categories: research and development, sales and marketing and general and administrative. For each category, the largest component is personnel costs, which include salaries, employee benefit costs,
bonuses, commissions as applicable, stock-based compensation and related expenses such as employer taxes. Operating expenses also include allocated overhead costs for depreciation of equipment, facilities and IT. Allocated costs for facilities consistinclude costs for compensation of our facilities personnel, leasehold improvements and rent. Our allocated costs for IT include costs for compensation of our IT personnel and costs associated with our IT infrastructure. Operating expenses are generally recognized as incurred.
Research and development. Research and development expenses primarily consist of personnel and facility-related costs attributable to our research and development personnel. We have devoted our product development efforts primarily to enhancing the functionality and expanding the capabilities of our software and services. We expect that our research and development expenses will continue to increase, in absolute dollars, as we increase our research and development headcount to further strengthen and enhance our software and services and invest in the development of our solutions and apps.
Sales and marketing. Sales and marketing expenses primarily consist of personnel and facility-related costs for our sales, marketing and business development personnel, commissions earned by our sales personnel, and the cost of marketing and business development programs. We expect that sales and marketing expenses will continue to increase, in absolute dollars, as we continue to hire additional personnel and invest in marketing programs.
General and administrative. General and administrative expenses primarily consist of personnel and facility-related costs for our executive, finance, legal, human resources and administrative personnel; our legal, accounting and other professional services fees; and other corporate expenses. We anticipate continuing to incur additional expenses due to growing our operations, including higher legal, corporate insurance and accounting expenses.
Interest and other income (expense)Other Income (Expense), netNet
Interest and other income (expense), net consists primarily of interest expense related to our convertible senior notes, foreign exchange gains and losses, interest income on our investments and cash and cash equivalents balances and changes in the fair value of forward exchange contracts.
Income Tax Provision for income taxes(Benefit)
The income tax provision for income taxes(benefit) consists of federal, state and foreign income taxes. We recognize deferred tax assets and liabilities for the expected tax consequences of temporary differences between the tax basis of assets and liabilities and their reported amounts using enacted tax rates in effect for the year in which we expect the differences to reverse. We record a valuation allowance to reduce the deferred tax assets to the amount that we are more-likely-than-not to realize. Because of our history of U.S. net operating losses, we have established, in prior years, a full valuation allowance against potential future benefits for U.S. deferred tax assets including loss carry-forwards and research and development and other tax credits. We regularly assess the likelihood that our deferred income tax assets will be realized based on the realization guidance available. To the extent that we believe any amounts are not more-likely-than-not to be realized, we record a valuation allowance to reduce the deferred income tax assets. We regularly assess the need for the valuation allowance on our deferred tax assets, and to the extent that we determine that an adjustment is needed, such adjustment will be recorded in the period that the determination is made.
Critical Accounting Policies and Estimates
We prepare our consolidated financial statements in accordance with generally accepted accounting principles in the United States.States (“U.S. GAAP”). The preparation of consolidated financial statements also requires us to make estimates and assumptions that affect the reported amounts of assets, liabilities, revenues, costs and expenses and related disclosures. We base our estimates on historical experience and on various other assumptions that we believe to be reasonable under the circumstances. Actual results could differ significantly from the estimates made by our management. To the extent that there are differences between our estimates and actual results, our future financial statement presentation, financial condition, results of operations and cash flows will be affected.
We believe that the assumptions and estimates associated with revenue recognition, share-based compensation, income taxesdeferred sales commissions and business combinations have the greatest potential impact on our consolidated financial statements. Therefore, we consider these to be our critical accounting policies and estimates. Accordingly, we believe these are the most critical to fully understand and evaluate our financial condition and results of operations.
Revenue Recognition
Our contracts with customers often contain multiple performance obligations. For these contracts, we account for individual performance obligations separately if they are distinct. The transaction price is allocated to the separate performance obligations on a relative standalone selling price (“SSP”) basis. We determine the SSP based on an observable standalone selling price when it is available, as well as other factors, including the price charged to customers, our discounting practices, and our overall pricing objectives, while maximizing observable inputs. In situations where pricing is highly variable or uncertain, we estimate the SSP using a residual approach.
Deferred Sales Commissions
Sales commissions paid to our sales force and the related payroll taxes are considered incremental and recoverable costs of obtaining a contract with a customer. We generally amortize these costs over the remaining contractual term of our customer contracts, consistent with the pattern of revenue recognition of each performance obligation, for contracts in which the commissions paid on the initial and renewal contracts are commensurate. For certain contracts in which the commissions paid on the initial and renewal contracts are not commensurate, we amortize the commissions paid on the initial contract over an expected period of benefit, which we have determined to be approximately five years. We have determined the period of benefit by taking into consideration our customer contracts, the duration of our relationships with our customers and our technology. In capitalizing and amortizing deferred commissions, we have elected to apply a portfolio approach.
Business Combinations
We use our best estimates and assumptions to allocate the fair value of purchase consideration to the tangible and intangible assets acquired and liabilities assumed based on their estimated fair values. The excess of the fair value of purchase consideration over the fair values of these identifiable assets and liabilities is recorded as goodwill. Our estimates are inherently uncertain and subject to refinement. During the measurement period, which may be up to one year from the acquisition date, we may record adjustments to the fair value of these tangible and intangible assets acquired and liabilities assumed, with the corresponding offset to goodwill. In addition, uncertain tax positions and tax-related valuation allowances are initially established in connection with a business combination as of the acquisition date. We continue to collect information and reevaluate these estimates and assumptions quarterly and record any adjustments to our preliminary estimates to goodwill provided that we are within the measurement period. Upon the conclusion of the final determination of the fair value of assets acquired or liabilities assumed during the measurement period, any subsequent adjustments are recorded to our consolidated statements of operations.
For further information on all of our significant accounting policies, seerefer to Note 1 of our accompanying Notes to Consolidated Financial Statements included elsewhere in Part II, Item 8, “Financial Statements and Supplementary Data” of this Annual Report on Form 10-K.
Results of Operations
The following tables settable sets forth our results of operations for the periods presented and as a percentage of our total revenues for those periods. The period-to-period comparison of financial results is not necessarily indicative of financial results to be achieved in future periods.
| Fiscal Year Ended January 31, | Fiscal Year Ended January 31, | |||||||||||||||||||||||||||||||||||||||||
| 2016 | 2015 | 2014 | 2019 | 2018 | 2017 | |||||||||||||||||||||||||||||||||||||
| (in thousands and as % of revenues ) | ||||||||||||||||||||||||||||||||||||||||||
| Consolidated Statement of Operations Data: | ||||||||||||||||||||||||||||||||||||||||||
| (In thousands and as % of revenues) | 2019 | *As Adjusted | *As Adjusted | |||||||||||||||||||||||||||||||||||||||
| Revenues | ||||||||||||||||||||||||||||||||||||||||||
| License | $ | 405,399 | 60.6 | % | $ | 283,191 | 62.8 | % | $ | 199,024 | 65.8 | % | $ | 1,030,277 | 57.1 | % | $ | 741,302 | 56.6 | % | $ | 543,510 | 57.6 | % | ||||||||||||||||||
| Maintenance and services | 263,036 | 39.4 | 167,684 | 37.2 | 103,599 | 34.2 | 772,733 | 42.9 | 567,830 | 43.4 | 400,054 | 42.4 | ||||||||||||||||||||||||||||||
| Total revenues | 668,435 | 100.0 | 450,875 | 100.0 | 302,623 | 100.0 | 1,803,010 | 100.0 | 1,309,132 | 100.0 | 943,564 | 100.0 | ||||||||||||||||||||||||||||||
| Cost of revenues | ||||||||||||||||||||||||||||||||||||||||||
| License (1) | 9,080 | 2.2 | 1,859 | 0.7 | 330 | 0.2 | 22,527 | 2.2 | 13,398 | 1.8 | 11,965 | 2.2 | ||||||||||||||||||||||||||||||
| Maintenance and services (1) | 105,042 | 39.9 | 66,519 | 39.7 | 35,495 | 34.3 | 322,149 | 41.7 | 243,011 | 42.8 | 179,088 | 44.8 | ||||||||||||||||||||||||||||||
| Total cost of revenues | 114,122 | 17.1 | 68,378 | 15.2 | 35,825 | 11.8 | 344,676 | 19.1 | 256,409 | 19.6 | 191,053 | 20.2 | ||||||||||||||||||||||||||||||
| Gross profit | 554,313 | 82.9 | 382,497 | 84.8 | 266,798 | 88.2 | 1,458,334 | 80.9 | 1,052,723 | 80.4 | 752,511 | 79.8 | ||||||||||||||||||||||||||||||
| Operating expenses | ||||||||||||||||||||||||||||||||||||||||||
| Research and development | 215,309 | 32.2 | 150,790 | 33.4 | 75,895 | 25.1 | 441,969 | 24.5 | 301,114 | 23.0 | 295,850 | 31.4 | ||||||||||||||||||||||||||||||
| Sales and marketing | 505,348 | 75.6 | 344,471 | 76.4 | 215,335 | 71.2 | 1,029,950 | 57.1 | 777,876 | 59.4 | 639,404 | 67.7 | ||||||||||||||||||||||||||||||
| General and administrative | 121,579 | 18.2 | 103,046 | 22.9 | 53,875 | 17.8 | 237,588 | 13.2 | 159,143 | 12.2 | 153,359 | 16.3 | ||||||||||||||||||||||||||||||
| Total operating expenses | 842,236 | 126.0 | 598,307 | 132.7 | 345,105 | 114.1 | 1,709,507 | 94.8 | 1,238,133 | 94.6 | 1,088,613 | 115.4 | ||||||||||||||||||||||||||||||
| Operating loss | (287,923 | ) | (43.1 | ) | (215,810 | ) | (47.9 | ) | (78,307 | ) | (25.9 | ) | (251,173 | ) | (13.9 | ) | (185,410 | ) | (14.2 | ) | (336,102 | ) | (35.6 | ) | ||||||||||||||||||
| Other income (expense), net | ||||||||||||||||||||||||||||||||||||||||||
| Interest income, net | 1,798 | 0.3 | 754 | 0.3 | 225 | 0.1 | ||||||||||||||||||||||||||||||||||||
| Interest income | 31,458 | 1.7 | 8,943 | 0.7 | 5,720 | 0.6 | ||||||||||||||||||||||||||||||||||||
| Interest expense | (41,963 | ) | (2.3 | ) | (8,794 | ) | (0.7 | ) | (8,549 | ) | (0.9 | ) | ||||||||||||||||||||||||||||||
| Other income (expense), net | (519 | ) | (0.1 | ) | 216 | — | (920 | ) | (0.3 | ) | (1,513 | ) | (0.1 | ) | (3,600 | ) | (0.2 | ) | (3,022 | ) | (0.3 | ) | ||||||||||||||||||||
| Total other income (expense), net | 1,279 | 0.2 | 970 | 0.3 | (695 | ) | (0.2 | ) | (12,018 | ) | (0.7 | ) | (3,451 | ) | (0.2 | ) | (5,851 | ) | (0.6 | ) | ||||||||||||||||||||||
| Loss before income taxes | (286,644 | ) | (42.9 | ) | (214,840 | ) | (47.6 | ) | (79,002 | ) | (26.1 | ) | (263,191 | ) | (14.6 | ) | (188,861 | ) | (14.4 | ) | (341,953 | ) | (36.2 | ) | ||||||||||||||||||
| Provision for income taxes (benefit) | (7,872 | ) | (1.2 | ) | 2,276 | 0.6 | 6 | — | ||||||||||||||||||||||||||||||||||
| Provision for income taxes | 12,386 | 0.7 | 1,357 | 0.1 | 5,507 | 0.6 | ||||||||||||||||||||||||||||||||||||
| Net loss | $ | (278,772 | ) | (41.7 | )% | $ | (217,116 | ) | (48.2 | )% | $ | (79,008 | ) | (26.1 | )% | $ | (275,577 | ) | (15.3 | )% | $ | (190,218 | ) | (14.5 | )% | $ | (347,460 | ) | (36.8 | )% | ||||||||||||
| * | Prior-period information has been adjusted to reflect the adoption of ASU No. 2014-09, Revenue from Contracts with Customers (Topic 606), which we adopted on February 1, 2018. Refer to Note 1 for further details. |
_________________________
(1) | Calculated as a percentage of the associated revenues. |
Fiscal 2016, 20152019, 2018 and 20142017
Revenues
(Dollars in millions)
| Fiscal Year Ended January 31, | ||||||||||||||||||
| 2016 to 2015 % Change | 2015 to 2014 % Change | |||||||||||||||||
| 2016 | 2015 | 2014 | ||||||||||||||||
| (in thousands) | ||||||||||||||||||
| Revenues | ||||||||||||||||||
| License | $ | 405,399 | $ | 283,191 | $ | 199,024 | 43.2 | % | 42.3 | % | ||||||||
| Maintenance and services | 263,036 | 167,684 | 103,599 | 56.9 | % | 61.9 | % | |||||||||||
| Total revenues | $ | 668,435 | $ | 450,875 | $ | 302,623 | 48.3 | % | 49.0 | % | ||||||||
| Percentage of revenues | ||||||||||||||||||
| License | 60.6 | % | 62.8 | % | 65.8 | % | ||||||||||||
| Maintenance and services | 39.4 | 37.2 | 34.2 | |||||||||||||||
| Total | 100.0 | % | 100.0 | % | 100.0 | % | ||||||||||||
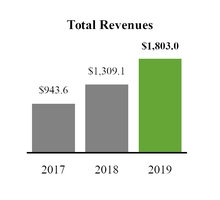

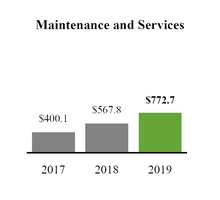
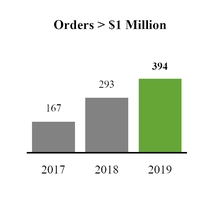
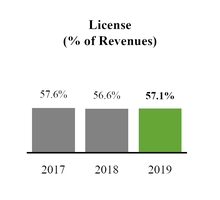
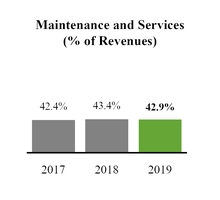
The increase in license revenues of $122.2 million was primarily driven by increases in our total number of customers, sales to existing customers and an increase in the number of largerlarge orders. For example, we had 1,447 and 1,112 orders greater than $100,000 for the fiscal years ended January 31, 2016 and 2015, respectively. Our total number of Splunk customers increased from approximately 9,000 at January 31, 2015 to approximately 11,000 at January 31, 2016. The increase in maintenanceMaintenance and services revenues of $95.4 million was due to increases inare primarily driven by sales of our maintenance agreements, sales of our cloud services, as well as sales of our professional services resulting from the growth of our installed customer base as well as sales of our professional services.base.
| Fiscal 2019 - 2018 |
Total revenues of $84.2increased $493.9 million, wasor 37.7%, primarily driven by increases in our total number of customers, sales to existing customers and an increase in the number of larger orders. For example, we had 1,112 and 791 orders greater than $100,000 for the fiscal years ended January 31, 2015 and 2014, respectively. Our total number of Splunk customers increased from approximately 7,000 at January 31, 2014 to approximately 9,000 at January 31, 2015. The increase in maintenance and services revenues of $64.1 million was due to increases in sales of maintenance agreements resulting from the growth of our installed customer base as well as sales of our professional services.following:
| + | increase of $289.0 million, or 39.0%, in license revenues |
| + | increase of $204.9 million, or 36.1%, in maintenance and services revenues |
| + | increase in the total number of orders greater than $1.0 million from 293 to 394 |
| + | increase in the total number of customers from 15,000 to over 17,500 |
| Fiscal 2018 - 2017 |
Total revenues increased $365.6 million, or 38.7%, primarily due to the following:
| + | increase of $197.8 million, or 36.4%, in license revenues |
| + | increase of $167.8 million, or 41.9%, in maintenance and services revenues |
| + | increase in the total number of orders greater than $1.0 million from 167 to 293 |
| + | increase in the total number of customers from 13,000 to over 15,000 |
Cost of Revenues and Gross Margin
(Dollars in millions)
| Fiscal Year Ended January 31, | ||||||||||||||||||
| 2016 to 2015 % Change | 2015 to 2014 % Change | |||||||||||||||||
| 2016 | 2015 | 2014 | ||||||||||||||||
| (in thousands) | ||||||||||||||||||
| Cost of revenues (1) | ||||||||||||||||||
| License | $ | 9,080 | $ | 1,859 | $ | 330 | 388.4 | % | 463.3 | % | ||||||||
| Maintenance and services | 105,042 | 66,519 | 35,495 | 57.9 | % | 87.4 | % | |||||||||||
| Total cost of revenues | $ | 114,122 | $ | 68,378 | $ | 35,825 | 66.9 | % | 90.9 | % | ||||||||
| Gross margin | ||||||||||||||||||
| License | 97.8 | % | 99.3 | % | 99.8 | % | ||||||||||||
| Maintenance and services | 60.1 | % | 60.3 | % | 65.7 | % | ||||||||||||
| Total gross margin | 82.9 | % | 84.8 | % | 88.2 | % | ||||||||||||
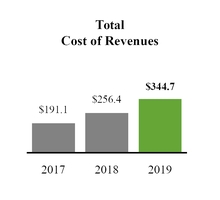
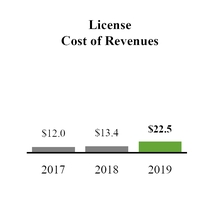
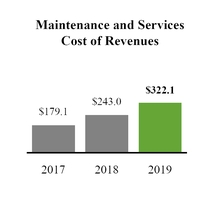
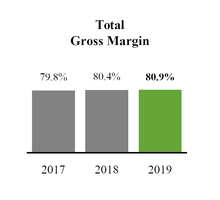
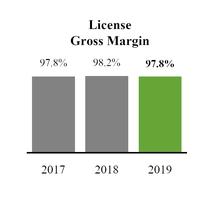
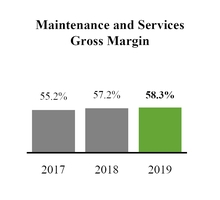
| Cost of revenues | $ | 26,057 | $ | 17,189 | $ | 5,283 | ||||||||||
| Fiscal 2019 - 2018 |
+ increase of $21.5$37.0 million in salaries and benefits, expense, which includes a $8.9$3.9 million increase in stock-based compensation expense due to increased headcount an
+ increase of $9.9$20.8 million related toin third-party hosting fees to support our cloud services and an
+ increase of $4.7$18.6 million related to third-party consulting services. The $7.2 million increase in cost ofservices
| Fiscal 2018 - 2017 |
Total cost of revenues increased $65.4 million or 34.2%. License cost of revenues increased $1.4 million, or 12.0%, due to an increase in amortization expense related to acquired intangible assets. Total gross margin decreased slightly primarily due to amortization expense related to acquired intangible assets.
| Fiscal Year Ended January 31, | ||||||||||||||||||
| 2016 to 2015 % Change | 2015 to 2014 % Change | |||||||||||||||||
| 2016 | 2015 | 2014 | ||||||||||||||||
| (in thousands) | ||||||||||||||||||
| Operating expenses (1) | ||||||||||||||||||
| Research and development | $ | 215,309 | $ | 150,790 | $ | 75,895 | 42.8 | % | 98.7 | % | ||||||||
| Sales and marketing | 505,348 | 344,471 | 215,335 | 46.7 | % | 60.0 | % | |||||||||||
| General and administrative | 121,579 | 103,046 | 53,875 | 18.0 | % | 91.3 | % | |||||||||||
| Total operating expenses | $ | 842,236 | $ | 598,307 | $ | 345,105 | 40.8 | % | 73.4 | % | ||||||||
| Percentage of revenues | ||||||||||||||||||
| Research and development | 32.2 | % | 33.4 | % | 25.1 | % | ||||||||||||
| Sales and marketing | 75.6 | 76.4 | 71.2 | |||||||||||||||
| General and administrative | 18.2 | 22.9 | 17.8 | |||||||||||||||
| Total | 126.0 | % | 132.7 | % | 114.1 | % | ||||||||||||
| Research and development | $ | 89,197 | $ | 60,777 | $ | 20,829 | ||||||||||
| Sales and marketing | 130,054 | 90,064 | 30,012 | |||||||||||||
| General and administrative | 46,949 | 46,149 | 13,244 | |||||||||||||
| Total stock-based compensation expense | $ | 266,200 | $ | 196,990 | $ | 64,085 | ||||||||||
+ increase of $17.4 million in third-party hosting fees to support our cloud services
+ increase of $13.9 million related to third-party consulting services
Maintenance and services gross margin increased primarily due to the growth and improved margins of our cloud business during fiscal 2018. Total gross margin remained relatively flat.
Operating Expenses
(Dollars in millions)
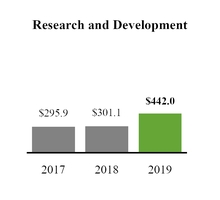

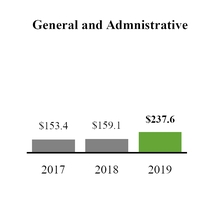
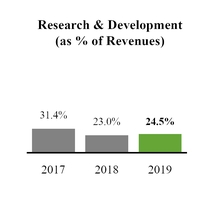
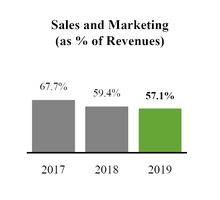
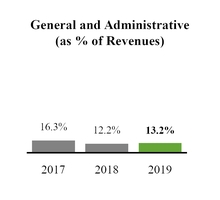
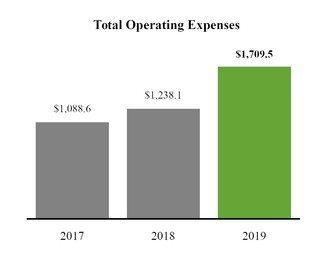
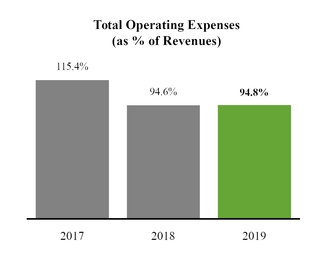
Research and Development Expense
| Fiscal 2019 - 2018 |
Research and development expense increased $140.9 million, or 46.8%, primarily due to the following:
| + | increase of $105.7 million in salaries and benefits, which includes a $30.5 million increase in stock-based compensation expense as we increased headcount as part of our focus on further developing and enhancing our products and services |
| + | increase of $13.8 million in hosting fees to support our product development efforts |
| + | increase of $7.2 million related to facilities and overhead |
| + | increase of $4.9 million related to third-party consulting services |
| Fiscal 2018 - 2017 |
Research and development expense increased $5.3 million, or 1.8%, primarily due to the following:
| + | increase of $4.3 million in hosting fees to support our product development efforts |
| - | net decrease of $1.2 million in salaries and benefits, which reflects a decrease of $22.7 million in stock-based compensation, partially offset by an increase of $21.5 million in salaries. The decrease in stock-based compensation was primarily due to the absence of accelerated vesting of certain restricted shares of common stock, which occurred during fiscal 2017. |
Sales and Marketing Expense
| Fiscal 2019 - 2018 |
Sales and marketing expense increased $252.1 million, or 32.4%, primarily due to the following:
+ increase of $207.5 million in salaries and benefits, which includes a $31.2 million increase in stock-based compensation expense as we increased headcount as part of our focus on further developing and enhancing our products and services. We also had an increase of $7.4 million related to overhead costs including rent and utilities costs, as well as IT costs related to our operations.
| + | increase of $12.0 million in travel-related expenses due to increased travel from our growing field sales organization |
| + | increase of $9.9 million related to facilities and overhead |
| + | increase of $8.3 million in marketing expenses |
| + | increase of $7.3 million related to third-party consulting services |
| Fiscal 2018 - 2017 |
Sales and marketing expense increased $138.5 million, 21.7%, primarily due to the following:
| + | increase of $92.4 million in salaries and benefits, which includes a $1.9 million decrease in stock-based compensation expense |
+ increase of $18.6 million in expenses due to increased facilities and overhead, as well as an increase of $10.6$14.7 million in marketing program fees, marketing events and advertising. Additionally, we had anexpenses
+increase of $6.4$11.1 million related to facilities and overhead
+ increase of $9.9 million related to third-party consulting services
+ increase of $4.3 million in travel-related expenses due to increased travel from our growing field sales organization and an increase of $5.3 million due to our sales kickoff and other sales related events.
General and administrative expenseAdministrative Expense
| Fiscal 2019 - 2018 |
General and administrative expense increased $18.5$78.4 million, or 49.3%, primarily due to a $11.9the following:
+ increase of $44.0 million net increase in salaries and benefits, which includes a $0.8 million net increase in stock-based compensation expense. The net increase in stock-based compensation expense reflects a gross increase of $13.9 million, offset by a decrease of $13.1 million as a result of the acceleration of stock-based compensation expense during the prior year’s second fiscal quarter related to the return of two restricted stock unit grants from our then-serving Chief Executive Officer. Additionally, we experienced a $2.9 million increase in legal expenses.
+ increase of stock-based compensation expense of $13.1$12.6 million related to the return of two restricted stock unit grants from our then-serving Chief Executive Officer, covering a total of 242,500 unvested shares of our common stock. We also incurred anthird-party consulting services
+ increase of $3.4$7.0 million related to facilities and overhead
+ increase of $5.9 million in general office expenses
+ increase of $5.5 million in accounting and legal activitiesexpenses
| Fiscal 2018 - 2017 |
General and administrative expense increased $5.8 million, or 3.8%, primarily due to support the overall growthfollowing:
+ increase of the business.$11.9 million in salaries and benefits, which includes a $2.4 million increase in stock-based compensation expense
+ increase of $2.8 million in accounting and legal fees
+ increase of $2.8 million related to third-party consulting services
| - | net decrease of $16.6 million in rent and depreciation expense related to adjustments made to our facility exit liability during fiscal 2017 and fiscal 2018 |
Interest and Other Income (Expense), net
| Fiscal Year Ended January 31, | ||||||||||||
| (In thousands) | 2019 | 2018 | 2017 | |||||||||
| Interest and other income (expense), net | ||||||||||||
| Interest income | $ | 31,458 | $ | 8,943 | $ | 5,720 | ||||||
| Interest expense | (41,963 | ) | (8,794 | ) | (8,549 | ) | ||||||
| Other income (expense), net | (1,513 | ) | (3,600 | ) | (3,022 | ) | ||||||
| Total interest and other income (expense), net | $ | (12,018 | ) | $ | (3,451 | ) | $ | (5,851 | ) | |||
| Fiscal Year Ended January 31, | ||||||||||||||||||
| 2016 to 2015 % Change | 2015 to 2014 % Change | |||||||||||||||||
| 2016 | 2015 | 2014 | ||||||||||||||||
| (in thousands) | ||||||||||||||||||
| Interest and other income (expense), net | ||||||||||||||||||
| Interest income, net | $ | 1,798 | $ | 754 | $ | 225 | 138.5 | % | 235.1 | % | ||||||||
| Other income (expense), net | (519 | ) | 216 | (920 | ) | (340.3 | )% | (123.5 | )% | |||||||||
| Total interest and other income (expense), net | $ | 1,279 | $ | 970 | $ | (695 | ) | 31.9 | % | (239.6 | )% | |||||||
| Fiscal 2019 - 2018 |
| Fiscal 2018 - 2017 |
Interest and other income (expense), net reflects a net decrease in expense of $2.4 million, or 41.0%, primarily due to an increase in interest income from our investments.
| Fiscal Year Ended January 31, | ||||||||||||
| (In thousands) | 2019 | 2018 | 2017 | |||||||||
| Provision for income taxes | $ | 12,386 | $ | 1,357 | $ | 5,507 | ||||||
| Fiscal 2019 - 2018 |
Provision for income (expense), net reflects a net increase in incometaxes increased $11.0 million, primarily due to an increase in interest income from our investments and higher foreign currency exchange gains compared to the same period last year.
| Fiscal Year Ended January 31, | ||||||||||||||||
| 2016 to 2015 % Change | 2015 to 2014 % Change | |||||||||||||||
| 2016 | 2015 | 2014 | ||||||||||||||
| (in thousands) | ||||||||||||||||
| Provision for income taxes (benefit) | $ | (7,872 | ) | $ | 2,276 | $ | 6 | * | * | |||||||
| Fiscal 2018 - 2017 |
Provision for income to support the realizability of the pre-existing deferred tax assets and as a result, we released a portion of the deferred tax asset valuation allowance.
Quarterly Results of Operations
The following table setstables set forth our unaudited quarterly statements of operations data for the last eight fiscal quarters. The information for each of these quarters has been prepared on the same basis as the audited annual financial statements included elsewhere in this annual report and, in the opinion of management, includes all adjustments, which includes only normal recurring adjustments, necessary for the fair statement of the results of operations for these periods. This data should be read in conjunction with our audited consolidated financial statements and related notes included elsewhere in this annual report. These quarterly operating results are not necessarily indicative of our operating results for any future period.
Consolidated Statements of Operations Data
| Three Months Ended | Three Months Ended | ||||||||||||||||||||||||||||||||||||||||||||||||||||||||||||||
| Jan 31, 2016 | Oct 31, 2015 | July 31, 2015 | Apr 30, 2015 | Jan 31, 2015 | Oct 31, 2014 | July 31, 2014 | Apr 30, 2014 | Jan 31, 2019 | Oct 31, 2018 | July 31, 2018 | Apr 30, 2018 | Jan 31, 2018 | Oct 31, 2017 | July 31, 2017 | Apr 30, 2017 | ||||||||||||||||||||||||||||||||||||||||||||||||
| (in thousands, except per share amounts) | |||||||||||||||||||||||||||||||||||||||||||||||||||||||||||||||
| Consolidated Statement of Operations Data: | |||||||||||||||||||||||||||||||||||||||||||||||||||||||||||||||
| (In thousands, except per share amounts) | Jan 31, 2019 | Oct 31, 2018 | July 31, 2018 | Apr 30, 2018 | *As Adjusted | *As Adjusted | *As Adjusted | *As Adjusted | |||||||||||||||||||||||||||||||||||||||||||||||||||||||
| Revenues | |||||||||||||||||||||||||||||||||||||||||||||||||||||||||||||||
| License | $ | 141,403 | $ | 104,164 | $ | 87,960 | $ | 71,872 | $ | 98,082 | $ | 71,754 | $ | 62,081 | $ | 51,274 | $ | 411,031 | $ | 279,603 | $ | 200,668 | $ | 138,975 | $ | 297,699 | $ | 193,810 | $ | 147,231 | $ | 102,562 | |||||||||||||||||||||||||||||||
| Maintenance and services | 78,621 | 70,256 | 60,366 | 53,793 | 49,310 | 44,275 | 39,466 | 34,633 | 211,054 | 201,380 | 187,635 | 172,664 | 161,952 | 148,679 | 132,993 | 124,206 | |||||||||||||||||||||||||||||||||||||||||||||||
| Total revenues | 220,024 | 174,420 | 148,326 | 125,665 | 147,392 | 116,029 | 101,547 | 85,907 | 622,085 | 480,983 | 388,303 | 311,639 | 459,651 | 342,489 | 280,224 | 226,768 | |||||||||||||||||||||||||||||||||||||||||||||||
| Cost of revenues | |||||||||||||||||||||||||||||||||||||||||||||||||||||||||||||||
Cost of revenues (1) | |||||||||||||||||||||||||||||||||||||||||||||||||||||||||||||||
| License | 2,970 | 3,136 | 1,813 | 1,161 | 1,174 | 535 | 72 | 78 | 5,810 | 5,922 | 5,671 | 5,124 | 4,298 | 3,013 | 3,159 | 2,928 | |||||||||||||||||||||||||||||||||||||||||||||||
| Maintenance and services | 32,436 | 27,455 | 23,227 | 21,924 | 20,366 | 17,045 | 14,999 | 14,109 | 87,923 | 83,303 | 78,077 | 72,846 | 69,905 | 61,154 | 56,717 | 55,235 | |||||||||||||||||||||||||||||||||||||||||||||||
Total cost of revenues (1) | 35,406 | 30,591 | 25,040 | 23,085 | 21,540 | 17,580 | 15,071 | 14,187 | |||||||||||||||||||||||||||||||||||||||||||||||||||||||
| Total cost of revenues | 93,733 | 89,225 | 83,748 | 77,970 | 74,203 | 64,167 | 59,876 | 58,163 | |||||||||||||||||||||||||||||||||||||||||||||||||||||||
| Gross profit | 184,618 | 143,829 | 123,286 | 102,580 | 125,852 | 98,449 | 86,476 | 71,720 | 528,352 | 391,758 | 304,555 | 233,669 | 385,448 | 278,322 | 220,348 | 168,605 | |||||||||||||||||||||||||||||||||||||||||||||||
| Operating expenses | |||||||||||||||||||||||||||||||||||||||||||||||||||||||||||||||
Research and development (1) | 66,117 | 56,186 | 48,308 | 44,698 | 47,335 | 39,534 | 34,179 | 29,742 | |||||||||||||||||||||||||||||||||||||||||||||||||||||||
Sales and marketing (1) | 161,442 | 130,131 | 111,786 | 101,989 | 107,695 | 85,720 | 79,978 | 71,078 | |||||||||||||||||||||||||||||||||||||||||||||||||||||||
General and administrative (1) | 36,090 | 29,857 | 28,760 | 26,872 | 27,921 | 21,446 | 32,676 | 21,003 | |||||||||||||||||||||||||||||||||||||||||||||||||||||||
Operating expenses (1) | |||||||||||||||||||||||||||||||||||||||||||||||||||||||||||||||
| Research and development | 131,151 | 117,722 | 106,739 | 86,357 | 83,962 | 74,080 | 71,774 | 71,298 | |||||||||||||||||||||||||||||||||||||||||||||||||||||||
| Sales and marketing | 303,861 | 264,223 | 243,830 | 218,036 | 219,512 | 198,266 | 186,637 | 173,461 | |||||||||||||||||||||||||||||||||||||||||||||||||||||||
| General and administrative | 69,183 | 59,819 | 57,844 | 50,742 | 47,651 | 35,857 | 39,139 | 36,496 | |||||||||||||||||||||||||||||||||||||||||||||||||||||||
| Total operating expenses | 263,649 | 216,174 | 188,854 | 173,559 | 182,951 | 146,700 | 146,833 | 121,823 | 504,195 | 441,764 | 408,413 | 355,135 | 351,125 | 308,203 | 297,550 | 281,255 | |||||||||||||||||||||||||||||||||||||||||||||||
| Operating loss | (79,031 | ) | (72,345 | ) | (65,568 | ) | (70,979 | ) | (57,099 | ) | (48,251 | ) | (60,357 | ) | (50,103 | ) | |||||||||||||||||||||||||||||||||||||||||||||||
| Operating income (loss) | 24,157 | (50,006 | ) | (103,858 | ) | (121,466 | ) | 34,323 | (29,881 | ) | (77,202 | ) | (112,650 | ) | |||||||||||||||||||||||||||||||||||||||||||||||||
| Interest and other income (expense), net | |||||||||||||||||||||||||||||||||||||||||||||||||||||||||||||||
| Interest income, net | 636 | 377 | 425 | 360 | 262 | 199 | 163 | 130 | |||||||||||||||||||||||||||||||||||||||||||||||||||||||
| Interest income | 16,136 | 8,571 | 3,564 | 3,187 | 2,670 | 2,403 | 2,068 | 1,802 | |||||||||||||||||||||||||||||||||||||||||||||||||||||||
| Interest expense | (25,562 | ) | (12,270 | ) | (2,058 | ) | (2,073 | ) | (2,099 | ) | (2,133 | ) | (2,232 | ) | (2,330 | ) | |||||||||||||||||||||||||||||||||||||||||||||||
| Other income (expense), net | (42 | ) | (271 | ) | (295 | ) | 89 | 542 | (52 | ) | (54 | ) | (220 | ) | (856 | ) | (186 | ) | (336 | ) | (135 | ) | (1,829 | ) | (289 | ) | (874 | ) | (608 | ) | |||||||||||||||||||||||||||||||||
| Total interest and other income (expense), net | 594 | 106 | 130 | 449 | 804 | 147 | 109 | (90 | ) | (10,282 | ) | (3,885 | ) | 1,170 | 979 | (1,258 | ) | (19 | ) | (1,038 | ) | (1,136 | ) | ||||||||||||||||||||||||||||||||||||||||
| Loss before income taxes | (78,437 | ) | (72,239 | ) | (65,438 | ) | (70,530 | ) | (56,295 | ) | (48,104 | ) | (60,248 | ) | (50,193 | ) | |||||||||||||||||||||||||||||||||||||||||||||||
| Income (loss) before income taxes | 13,875 | (53,891 | ) | (102,688 | ) | (120,487 | ) | 33,065 | (29,900 | ) | (78,240 | ) | (113,786 | ) | |||||||||||||||||||||||||||||||||||||||||||||||||
| Income tax provision (benefit) | 886 | 735 | (10,149 | ) | 656 | 733 | 447 | 534 | 562 | 11,749 | 1,814 | 811 | (1,988 | ) | (102 | ) | (232 | ) | 353 | 1,338 | |||||||||||||||||||||||||||||||||||||||||||
| Net loss | $ | (79,323 | ) | $ | (72,974 | ) | $ | (55,289 | ) | $ | (71,186 | ) | $ | (57,028 | ) | $ | (48,551 | ) | $ | (60,782 | ) | $ | (50,755 | ) | |||||||||||||||||||||||||||||||||||||||
| Net income (loss) | $ | 2,126 | $ | (55,705 | ) | $ | (103,499 | ) | $ | (118,499 | ) | $ | 33,167 | $ | (29,668 | ) | $ | (78,593 | ) | $ | (115,124 | ) | |||||||||||||||||||||||||||||||||||||||||
| Net loss per share, basic and diluted: | $ | (0.61 | ) | $ | (0.57 | ) | $ | (0.44 | ) | $ | (0.57 | ) | $ | (0.47 | ) | $ | (0.40 | ) | $ | (0.51 | ) | $ | (0.43 | ) | |||||||||||||||||||||||||||||||||||||||
| Net income (loss) per share | |||||||||||||||||||||||||||||||||||||||||||||||||||||||||||||||
| Basic | $ | 0.01 | $ | (0.38 | ) | $ | (0.71 | ) | $ | (0.83 | ) | $ | 0.23 | $ | (0.21 | ) | $ | (0.57 | ) | $ | (0.84 | ) | |||||||||||||||||||||||||||||||||||||||||
| Diluted | $ | 0.01 | $ | (0.38 | ) | $ | (0.71 | ) | $ | (0.83 | ) | $ | 0.23 | $ | (0.21 | ) | $ | (0.57 | ) | $ | (0.84 | ) | |||||||||||||||||||||||||||||||||||||||||
| * | Prior-period information has been adjusted to reflect the adoption of ASU No. 2014-09, Revenue from Contracts with Customers (Topic 606), which we adopted on February 1, 2018. Refer to Note 1 for further details. |
_________________________
(1) | Includes stock-based compensation expense as follows: |
| Three Months Ended | Three Months Ended | ||||||||||||||||||||||||||||||||||||||||||||||||||||||||||||||
| Jan 31, 2016 | Oct 31, 2015 | July 31, 2015 | Apr 30, 2015 | Jan 31, 2015 | Oct 31, 2014 | July 31, 2014 | Apr 30, 2014 | ||||||||||||||||||||||||||||||||||||||||||||||||||||||||
| (in thousands) | |||||||||||||||||||||||||||||||||||||||||||||||||||||||||||||||
| (In thousands) | Jan 31, 2019 | Oct 31, 2018 | July 31, 2018 | Apr 30, 2018 | Jan 31, 2018 | Oct 31, 2017 | July 31, 2017 | Apr 30, 2017 | |||||||||||||||||||||||||||||||||||||||||||||||||||||||
| Cost of revenues | $ | 7,479 | $ | 6,384 | $ | 5,662 | $ | 6,532 | $ | 5,536 | $ | 4,039 | $ | 3,808 | $ | 3,806 | $ | 10,883 | $ | 8,867 | $ | 8,497 | $ | 8,804 | $ | 9,082 | $ | 7,921 | $ | 8,410 | $ | 8,192 | |||||||||||||||||||||||||||||||
| Research and development | 27,287 | 22,534 | 19,301 | 20,075 | 19,260 | 15,352 | 13,578 | 12,587 | 42,072 | 35,088 | 33,597 | 26,416 | 28,864 | 25,038 | 25,991 | 26,797 | |||||||||||||||||||||||||||||||||||||||||||||||
| Sales and marketing | 38,987 | 33,247 | 28,210 | 29,610 | 28,606 | 21,075 | 21,263 | 19,120 | 56,550 | 45,280 | 45,546 | 43,047 | 39,217 | 36,728 | 42,652 | 40,643 | |||||||||||||||||||||||||||||||||||||||||||||||
| General and administrative | 14,622 | 11,999 | 10,436 | 9,892 | 9,792 | 7,770 | 20,861 | 7,726 | 25,080 | 18,449 | 16,953 | 16,354 | 14,767 | 14,424 | 15,314 | 14,423 | |||||||||||||||||||||||||||||||||||||||||||||||
| Three Months Ended | |||||||||||||||||||||||
| Jan 31, 2016 | Oct 31, 2015 | July 31, 2015 | Apr 30, 2015 | Jan 31, 2015 | Oct 31, 2014 | July 31, 2014 | Apr 30, 2014 | ||||||||||||||||
| (as % of revenues) | |||||||||||||||||||||||
| Consolidated Statement of Operations Data: | |||||||||||||||||||||||
| Revenues | |||||||||||||||||||||||
| License | 64.3 | % | 59.7 | % | 59.3 | % | 57.2 | % | 66.5 | % | 61.8 | % | 61.1 | % | 59.7 | % | |||||||
| Maintenance and services | 35.7 | 40.3 | 40.7 | 42.8 | 33.5 | 38.2 | 38.9 | 40.3 | |||||||||||||||
| Total revenues | 100.0 | 100.0 | 100.0 | 100.0 | 100.0 | 100.0 | 100.0 | 100.0 | |||||||||||||||
| Cost of revenues | |||||||||||||||||||||||
| License (1) | 2.1 | 3.0 | 2.1 | 1.6 | 1.2 | 0.7 | 0.1 | 0.2 | |||||||||||||||
| Maintenance and services (1) | 41.3 | 39.1 | 38.5 | 40.8 | 41.3 | 38.5 | 38.0 | 40.7 | |||||||||||||||
| Total cost of revenues | 16.1 | 17.5 | 16.9 | 18.4 | 14.6 | 15.2 | 14.8 | 16.5 | |||||||||||||||
| Gross profit | 83.9 | 82.5 | 83.1 | 81.6 | 85.4 | 84.8 | 85.2 | 83.5 | |||||||||||||||
| Operating expenses | |||||||||||||||||||||||
| Research and development | 30.0 | 32.2 | 32.6 | 35.6 | 32.1 | 34.1 | 33.7 | 34.6 | |||||||||||||||
| Sales and marketing | 73.4 | 74.6 | 75.4 | 81.2 | 73.1 | 73.8 | 78.7 | 82.8 | |||||||||||||||
| General and administrative | 16.4 | 17.2 | 19.3 | 21.3 | 18.9 | 18.5 | 32.2 | 24.4 | |||||||||||||||
| Total operating expenses | 119.8 | 124.0 | 127.3 | 138.1 | 124.1 | 126.4 | 144.6 | 141.8 | |||||||||||||||
| Operating loss | (35.9 | ) | (41.5 | ) | (44.2 | ) | (56.5 | ) | (38.7 | ) | (41.6 | ) | (59.4 | ) | (58.3 | ) | |||||||
| Interest and other income (expense), net | |||||||||||||||||||||||
| Interest income, net | 0.3 | 0.2 | 0.3 | 0.3 | 0.2 | 0.2 | 0.2 | 0.2 | |||||||||||||||
| Other income (expense), net | — | (0.1 | ) | (0.2 | ) | 0.1 | 0.3 | — | (0.1 | ) | (0.3 | ) | |||||||||||
| Total interest and other income (expense), net | 0.3 | 0.1 | 0.1 | 0.4 | 0.5 | 0.2 | 0.1 | (0.1 | ) | ||||||||||||||
| Loss before income taxes | (35.6 | ) | (41.4 | ) | (44.1 | ) | (56.1 | ) | (38.2 | ) | (41.4 | ) | (59.3 | ) | (58.4 | ) | |||||||
| Income tax provision (benefit) | 0.5 | 0.4 | (6.8 | ) | 0.5 | 0.5 | 0.4 | 0.5 | 0.7 | ||||||||||||||
| Net loss | (36.1 | )% | (41.8 | )% | (37.3 | )% | (56.6 | )% | (38.7 | )% | (41.8 | )% | (59.8 | )% | (59.1 | )% | |||||||
| Three Months Ended | ||||||||||||||||||||||||
| (As % of revenues) | Jan 31, 2019 | Oct 31, 2018 | July 31, 2018 | Apr 30, 2018 | Jan 31, 2018 | Oct 31, 2017 | July 31, 2017 | Apr 30, 2017 | ||||||||||||||||
| *As Adjusted | *As Adjusted | *As Adjusted | * As Adjusted | |||||||||||||||||||||
| Revenues | ||||||||||||||||||||||||
| License | 66.1 | % | 58.1 | % | 51.7 | % | 44.6 | % | 64.8 | % | 56.6 | % | 52.5 | % | 45.2 | % | ||||||||
| Maintenance and services | 33.9 | 41.9 | 48.3 | 55.4 | 35.2 | 43.4 | 47.5 | 54.8 | ||||||||||||||||
| Total revenues | 100.0 | 100.0 | 100.0 | 100.0 | 100.0 | 100.0 | 100.0 | 100.0 | ||||||||||||||||
| Cost of revenues | ||||||||||||||||||||||||
License (1) | 1.4 | 2.1 | 2.8 | 3.7 | 1.4 | 1.6 | 2.1 | 2.9 | ||||||||||||||||
Maintenance and services (1) | 41.7 | 41.4 | 41.6 | 42.2 | 43.2 | 41.1 | 42.6 | 44.5 | ||||||||||||||||
| Total cost of revenues | 15.1 | 18.6 | 21.6 | 25.0 | 16.1 | 18.7 | 21.4 | 25.6 | ||||||||||||||||
| Gross profit | 84.9 | 81.4 | 78.4 | 75.0 | 83.9 | 81.3 | 78.6 | 74.4 | ||||||||||||||||
| Operating expenses | ||||||||||||||||||||||||
| Research and development | 21.1 | 24.5 | 27.5 | 27.7 | 18.3 | 21.6 | 25.6 | 31.4 | ||||||||||||||||
| Sales and marketing | 48.8 | 54.9 | 62.7 | 70.0 | 47.7 | 57.9 | 66.6 | 76.6 | ||||||||||||||||
| General and administrative | 11.1 | 12.4 | 14.9 | 16.3 | 10.4 | 10.5 | 14.0 | 16.1 | ||||||||||||||||
| Total operating expenses | 81.0 | 91.8 | 105.1 | 114.0 | 76.4 | 90.0 | 106.2 | 124.1 | ||||||||||||||||
| Operating income (loss) | 3.9 | (10.4 | ) | (26.7 | ) | (39.0 | ) | 7.5 | (8.7 | ) | (27.6 | ) | (49.7 | ) | ||||||||||
| Interest and other income (expense), net | ||||||||||||||||||||||||
| Interest income | 2.6 | 1.8 | 0.9 | 1.0 | 0.6 | 0.6 | 0.7 | 0.8 | ||||||||||||||||
| Interest expense | (4.1 | ) | (2.6 | ) | (0.5 | ) | (0.6 | ) | (0.5 | ) | (0.6 | ) | (0.8 | ) | (1.0 | ) | ||||||||
| Other income (expense), net | (0.2 | ) | — | (0.1 | ) | — | (0.4 | ) | (0.1 | ) | (0.3 | ) | (0.3 | ) | ||||||||||
| Total interest and other income (expense), net | (1.7 | ) | (0.8 | ) | 0.3 | 0.4 | (0.3 | ) | (0.1 | ) | (0.4 | ) | (0.5 | ) | ||||||||||
| Income (loss) before income taxes | 2.2 | (11.2 | ) | (26.4 | ) | (38.6 | ) | 7.2 | (8.8 | ) | (27.9 | ) | (50.2 | ) | ||||||||||
| Income tax provision (benefit) | 1.9 | 0.4 | 0.2 | (0.6 | ) | — | (0.1 | ) | 0.1 | 0.6 | ||||||||||||||
| Net income (loss) | 0.3 | % | (11.6 | )% | (26.6 | )% | (38.0 | )% | 7.2 | % | (8.7 | )% | (28.0 | )% | (50.8 | )% | ||||||||
| * | Prior-period information has been adjusted to reflect the adoption of ASU No. 2014-09, Revenue from Contracts with Customers (Topic 606), which we adopted on February 1, 2018. Refer to Note 1 for further details. |
_________________________
(1) | This percentage is calculated as a percentage of the associated revenues. |
Seasonality, Cyclicality and Quarterly Trends
Our quarterly results reflect seasonality in the sale of our offerings. Historically, a pattern of increased license sales in the fourth fiscal quarter as a result of industry buying patterns has positively impacted sales activity in that period, which can result in lower sequential revenue in the first fiscal quarter. We expect this seasonality to continue in fiscal 20172020 and beyond. Our gross margins and operating losses have been affected by these historical trends because the majority of our expenses are relatively fixed in the short term. The timing of revenues in relation to our expenses, much of which does not vary directly with revenues, has an impact on the cost of revenues, research and development expense, sales and marketing expense and general
and administrative expense as a percentage of revenues in each fiscal quarter during the year. The majority of our expenses are personnel-related and include salaries, stock-based compensation, benefits and incentive-based compensation plan expenses. As a result, we have not experienced significant seasonal fluctuations in the timing of expenses from period to period. Although these seasonal factors are common in the technology industry, historical patterns should not be considered a reliable indicator of our future sales activity or performance.
Liquidity and Capital Resources
| As of January 31, | Fiscal Year Ended January 31, | ||||||||||||||||||||||
| 2016 | 2015 | 2014 | |||||||||||||||||||||
| (in thousands) | |||||||||||||||||||||||
| (In thousands) | 2019 | 2018 | 2017 | ||||||||||||||||||||
| Cash and cash equivalents | $ | 424,541 | $ | 387,315 | $ | 897,453 | $ | 1,876,165 | $ | 545,947 | $ | 421,346 | |||||||||||
| Investments, current portion | 584,498 | 462,849 | — | 881,220 | 619,203 | 662,096 | |||||||||||||||||
| Investments, non-current | 1,500 | 165,082 | — | 110,588 | 5,375 | 5,000 | |||||||||||||||||
(Dollars in millions)
| Fiscal Year Ended January 31, | |||||||||||
| 2016 | 2015 | 2014 | |||||||||
| (in thousands) | |||||||||||
| Cash provided by operating activities | $ | 155,622 | $ | 103,980 | $ | 73,848 | |||||
| Cash used in investing activities | (153,490 | ) | (645,160 | ) | (39,046 | ) | |||||
| Cash provided by financing activities | 35,485 | 31,610 | 556,699 | ||||||||
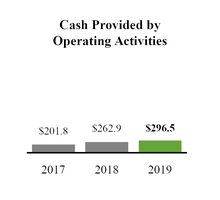
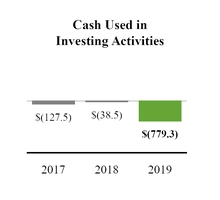
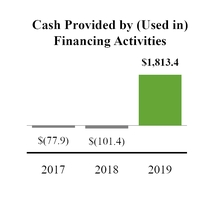
In September 2018, we issued $2.13 billion aggregate principal amount of convertible senior notes, which includes $1.27 billion aggregate principal amount of 0.50% Convertible Senior Notes due 2023 and $862.5 million aggregate principal amount of 1.125% Convertible Senior Notes due 2025 (collectively, the “Notes”). In connection with the issuance of the Notes, we entered into privately negotiated capped call transactions with certain counterparties (the “Capped Calls”). The premiums paid for the purchase of the Capped Calls were $274.3 million. Refer to Note 7 of our accompanying Notes to Consolidated Financial Statements included elsewhere in this Annual Report on 10-K.
Our future capital requirements will depend on many factors including our growth rate, the timing and extent of spending to support development efforts, the expansion of sales and marketing activities, the introduction of new and enhanced software and services offerings, the continuing market acceptance of our offerings and our planned investments, particularly in our product development efforts or acquisitions of complementary businesses, applications or technologies.
In the event that additional financing is required from outside sources, we may not be able to raise it on terms acceptable to us, if at all. If we are unable to raise additional capital when desired, our business, operating results and financial condition could be adversely affected.
Operating Activities
Operating activities were $155.6 million, which reflectsconsist of our net loss of $278.8 million, adjusted for certain non-cash items and changes in operating assets and liabilities during the year.
| Fiscal 2019 - 2018 |
Net cash provided by non-cash charges of $301.1 million, consisting primarily of $292.3operating activities was $296.5 million for stock-based compensation, $19.5the year ended January 31, 2019 compared to $262.9 million for depreciation and amortization and $1.3 million for amortization of investment premiums, partially offset by $11.1 million for deferred income taxes and $0.9 million for excess tax benefits from employee stock plans. Sources of cash inflows were from changes in our working capital, including a $145.4 millionthe prior year. The increase in deferred revenuenet cash provided by operating activities was primarily due to increased sales of our products and services and the related support agreements, a $30.0 millionfollowing:
+ increase in accounts receivable collections
+ reduction in payments for accrued payroll and compensation mainly as a result of higher commission expense due to increased customer orders, a $5.5 million increase
+ reduction in payments for accrued expenses and other liabilities primarily as a result of
The increase spend related to sales and marketing, a $4.7 million decrease in cash provided by operating activities was partially offset by anincrease in payments for prepaid expenseexpenses and other current and non-current assets and a $1.0assets.
| Fiscal 2018 - 2017 |
Net cash provided by operating activities was $262.9 million for the year ended January 31, 2018 compared to $201.8 million from the prior year. The increase in accounts payable. Thesenet cash inflows wereprovided by operating activities was primarily due to the following:
+ increase in deferred revenue
+ reduction in payments for accrued compensation
The increase in cash provided by operating activities was partially offset by a $53.3 million increasereduction in accounts receivable due tocollections and an increase in larger customer orders during fiscal 2016.
Investing Activities
| Fiscal 2019 - 2018 |
Net cash used in investing activities of $153.5was $779.3 million for the year ended January 31, 2019 compared to $38.5 million from the prior year. The increase in cash used in investing activities was primarily attributabledue to $480.6the following:
| - | increase of $397.4 million in purchases of investments, net of maturities |
| - | increase of $335.6 million in cash purchase price paid, net of cash acquired, from our acquisitions of Phantom and VictorOps |
| Fiscal 2018 - 2017 |
Net cash used in investing activities was $38.5 million for the year ended January 31, 2018 compared to $127.5 million from the prior year. The decrease in cash used in investing activities was primarily due to the following:
+ reduction of $120.3 million in purchases of investments, net of maturities
+ reduction of $24.8 million in U.S. treasury securities, $142.7purchases of property and equipment
The decrease in cash used in investing activities was partially offset by an increase of $59.4 million ofin cash purchase price paid, net of cash acquired, for our acquisitions, $51.3 million of capital expenditures for the purchase of technology and hardware, as well as purchases related to our facilities and infrastructure and $1.5 million related to other investment activities. These cash outflows were partially offset by a $522.6 million cash inflow due to the maturities of our investments.
Financing Activities
| Fiscal 2019 - 2018 |
Net cash provided by financing activities was $1.81 billion for the year ended January 31, 2019 compared to net cash used in financing activities of $35.5$101.4 million consisted primarily of $19.3 million of proceeds from our employee stock purchase plan, $15.3 million of proceeds from the exercise of stock options and $0.9 million from excess tax benefits from employee stock plans.
+ increase of $31.6 million consisted primarily of $16.8 million of proceeds from the exercise of stock options, $14.5 million of proceeds from our employee stock purchase plan and $0.8 million from excess tax benefits from employee stock plans, partially offset by a $0.5 million payment$2.11 billion related to our build-to-suit lease obligation.the issuance of the Notes, net of initial purchaser discounts and issuance costs
The increase in cash provided by financing activities of $556.7was partially offset by $274.3 million consisted primarily of $539.3 million of proceeds from our follow-on offering, net of paid underwriter discount and issuance costs and $35.1 million of proceeds received fromin cash used to purchase capped calls in connection with the issuance of stock relatedour convertible senior notes.
| Fiscal 2018 - 2017 |
Net cash used in financing activities was $101.4 million for the year ended January 31, 2018 compared to our equity incentive plans. These increases were partially offset by $18.2$77.9 million of taxes paid relatedfrom the prior year. The increase in cash used in financing activities was primarily due to the net settlement of RSUs.following:
| - | increase of $24.1 million in taxes paid related to net share settlement of equity awards |
Loan and Security Agreement
On May 9, 2013 we entered into a Loan Agreement with Silicon Valley Bank, which was most recently amended in May 2015. As amended, the agreement provides forprovided us a revolving line of credit facility, which expires May 9, 2017.facility. Under the agreement, we are able tocould borrow up to $25 million. Interest on any drawdown under the revolving line of credit accrues$25.0 million with interest accrued either at the prime rate (3.50% in January 2016) or the LIBOR rate plus 2.75%. As of January 31, 2016,We never borrowed under the credit facility, and during fiscal 2019, we had no balance outstanding under this agreement. The agreement includes restrictive covenants, in each case subject to certain exceptions, that limitterminated our ability to: sell or otherwise dispose of our business or property; change our business, liquidate or dissolve or undergo a change in control; enter into mergers, consolidations and acquisitions; incur indebtedness; create liens; pay dividends or make
Contractual Payment Obligations
Operating Lease Commitments and Contractual Obligations
We lease our office spaces under non-cancelable leases with rent expense recognized on a straight-line basis over the lease term.leases. Rent expense, net of sublease income, for our operating leases was $12.8$26.2 million, $10.5$16.8 million and $6.4$28.1 million during fiscal 2016, 20152019, 2018 and 2014, respectively,2017, respectively. Rent expense includes a decrease of $5.2 million of expense for fiscal 2018, and an increase of $8.6 million of expense for fiscal 2017, in connection with facility exit charge adjustments. Refer to “Facility Exit Costs” below for details.
On August 24, 2015,15, 2018, we entered into an office lease at 3060 Olsen Drive for approximately 235,000300,000 square feet located at 500 Santana Row,in San Jose, California. This lease is expected to commence in the fourth quarter of fiscal 20172020 for a term of 10 years and nine130 months, subject to the completion of certain pre-occupancy improvements by our landlord. Our total obligation for the base rent iswill be approximately $120.5$162.6 million.
On June 18, 2018, we renewed our office lease at 250 Brannan Street for approximately 100,000 square feet located in San Francisco, California. This lease is expected to commence in the first quarter of fiscal 2020 for a term of 147 months. Our total obligation for the base rent will be approximately $137.6 million.
Purchase obligations are contractual obligations for purchase of goods or services and are defined as agreements that are enforceable and legally binding and that specify all significant terms, including: fixed or minimum quantities to be purchased; fixed, minimum, or variable price provisions; and the approximate timing of the transaction.
The following summarizes our convertible senior notes, operating lease commitments and significant purchase obligations as of January 31, 2019:
| Payments Due by Period | ||||||||||||||||||||
| (In thousands) | Total | Less Than 1 year | 1-3 years | 3-5 years | More Than 5 years | |||||||||||||||
0.5% Convertible Senior Notes due 2023 (1) | $ | 1,296,520 | $ | 6,220 | $ | 12,650 | $ | 1,277,650 | $ | — | ||||||||||
1.125% Convertible Senior Notes due 2025 (1) | 930,260 | 9,542 | 19,406 | 19,406 | 881,906 | |||||||||||||||
Operating lease commitments (2) | 465,807 | 30,976 | 96,321 | 84,654 | 253,856 | |||||||||||||||
Purchase obligations (3) | 92,333 | 19,171 | 56,893 | 13,099 | 3,170 | |||||||||||||||
| Total | $ | 2,784,920 | $ | 65,909 | $ | 185,270 | $ | 1,394,809 | $ | 1,138,932 | ||||||||||
_________________________
(1) | Total future payments related to our Convertible Senior Notes due 2023 includes $1.27 billion principal amount and future interest payments of $31.5 million. Total future payments related to our Convertible Senior Notes due 2023 includes $862.5 million principal amount and future interest payments of $67.8 million. For more information on our convertible senior notes, refer to Note 7 of our accompanying Notes to the Consolidated Financial Statements included elsewhere in this Annual Report on Form 10-K. |
(2) | We have entered into sublease agreements for portions of our office space and the future rental income of $2.3 million from these agreements has been included as an offset to our future minimum rental payments. |
(3) | Purchase obligations relate primarily to IT and product infrastructure costs, enterprise subscription agreements, and sales and marketing costs. |
Facility Exit Costs
In fiscal 2017, we relocated certain corporate offices in the San Francisco Bay Area and as a result, some of our leased office spaces are no longer in use. Accordingly, we calculated and recorded a liability at the "cease-use" date. We recorded a facility exit charge of approximately $8.6 million to “General and administrative” expenses associated with the recognition of the liability.
Cease-use liability balances are presented below:
| (In thousands) | Carrying amount | |||
| Balance as of January 31, 2018 | $ | 320 | ||
| Cash payments, net of deferred rent | (204 | ) | ||
| Balance as of January 31, 2019 | $ | 116 | ||
Financing Lease Obligation
On April 29, 2014, we entered into an office lease (the “Lease”) for approximately 182,000 square feet located at 270 Brannan Street, San Francisco, California (the “Premises”). The Premises will beis allocated tobetween the “Initial Premises” and “Additional Premises,” which are each approximately 95,00091,000 square feet of rentable space (the “Initial Premises”) and approximately 87,000 square feet of rentable space (the “Additional Premises”). We expect to occupy the Premises in the first quarter of fiscal 2017.space. The term of the Additional Premises beginsbegan one year after the term of the Initial Premises, which began in August 2015, and each have a term of 84 months. Our total obligation for the base rent is approximately $92.0 million. On May 13, 2014, we entered into an irrevocable, standby letter of credit with Silicon Valley Bank for $6.0 million to serve as a security deposit for the Lease.
As a result of our involvement during the construction period, whereby we havehad certain indemnification obligations related to the construction, we arewere considered, for accounting purposes only, the owner of the construction project under build-to-suit lease accounting. We have recorded estimated project construction costs incurred by the landlord as an asset and a corresponding long-term liability in “Property and equipment, net” and “Other liabilities, non-current”non-current,” respectively, onin our consolidated balance sheets. We will increasemoved into the asset and corresponding long term liability as additional building costs are incurred by the landlord during the construction period. The landlord completed the construction of the Initial Premises in February 2016 and we2016. We have determined that the lease does not meet the criteria for “sale-leaseback” treatment. We are currently evaluatingtreatment, due to our continuing involvement in the impactconstruction project resulting from our standby letter of this lease on our consolidated financial statements.credit. Accordingly, the Lease will continue to be accounted for as a financing obligation.
| Payments Due by Period* | ||||||||||||||||||||
| Total | Less Than 1 year | 1-3 years | 3-5 years | More Than 5 years | ||||||||||||||||
| (in thousands) | ||||||||||||||||||||
| Office lease obligations | $ | 265,505 | $ | 18,541 | $ | 66,724 | $ | 58,905 | $ | 121,335 | ||||||||||
Fiscal Period (In thousands) | Future Payments | |||
| Fiscal 2020 | $ | 12,928 | ||
| Fiscal 2021 | 13,316 | |||
| Fiscal 2022 | 13,715 | |||
| Fiscal 2023 | 14,127 | |||
| Fiscal 2024 | 7,667 | |||
| Thereafter | 475 | |||
| Total future minimum lease payments | $ | 62,228 | ||
We entered into sublease agreements for portionshave made a $5.0 million capital commitment to a venture capital fund that requires us to contribute capital upon notice. As of January 31, 2019, we have contributed $1.1 million towards our office space and the future rental income of $2.0 million from these agreements has been included as an offset to our future minimum rental payments.capital commitment.
Off-Balance Sheet Arrangements
During fiscal 2016, 20152019, 2018 and 2014,2017, we did not have any relationships with unconsolidated organizations or financial partnerships, such as structured finance or special purpose entities that have been established for the purpose of facilitating off-balance sheet arrangements or other contractually narrow or limited purposes.
Indemnification Arrangements
During the ordinary course of business, we may indemnify, hold harmless and agree to reimburse for losses suffered or incurred, our customers, vendors and their affiliates for certain intellectual property infringement and other claims by third parties with respect to our offerings, in connection with our commercial end-user license arrangements or related to general business dealings with those parties.
As permitted under Delaware law, we have entered into indemnification agreements with our officers and directors, indemnifying them for certain events or occurrences while they serve as officers or directors of the company.
To date, there have not been any costs incurred in connection with such indemnification obligations; therefore, there is no accrual of such amounts at January 31, 2016.2019. We are unable to estimate the maximum potential impact of these indemnifications on our future results of operations.
| Item 7A. Quantitative and Qualitative Disclosures about Market Risk |
Interest Rate Risk
We had cash and cash equivalents of $424.5 million$1.88 billion as of January 31, 2016.2019. We hold our cash and cash equivalents for working capital purposes. Our cash and cash equivalents are held in cash deposits and money market funds. The primary objective of our investment activities is to preserve principal while maximizing yields without significantly increasing risk. This objective is accomplished by making diversified investments, consisting only of investment grade securities. During the fiscal years ended January 31, 20162019 and 2015,2018, the effect of a hypothetical 10% increase or decrease in overall interest rates would not have had a material impact on our interest income.
Foreign Currency Exchange Risk
Our results of operations and cash flows are subject to fluctuations due to changes in foreign currency exchange rates. All of our revenues are generated in U.S. dollars. Our expenses are generally denominated in the currencies in which our operations are located, which is primarily in the United States and to a lesser extent in Europe and Asia. Our results of operations and cash flows are, therefore, subject to fluctuations due to changes in foreign currency exchange rates and may be adversely affected in the future due to changes in foreign exchange rates. We seek to minimize the impact of certain foreign currency fluctuations by hedging certain balance sheet exposures with foreign currency forward contracts. Any gain or loss from settling these contracts is offset by the loss or gain derived from the underlying balance sheet exposures. We do not enter into any hedging contracts for trading or speculative purposes. The effect of a hypothetical 10% change in foreign currency exchange rates applicable to our business would not have a material impact on our historical consolidated financial statements. To date, we have not engaged in any hedging strategies. As our international operations grow, we will continue to reassess our approach to manage our risk relating to fluctuations in currency rates.
Inflation
We do not believe that inflation had a material effect on our business, financial condition or results of operations in the last three fiscal years. If our costs were to become subject to significant inflationary pressures, we may not be able to fully offset such higher costs through price increases. Our inability or failure to do so could harm our business, financial condition and results of operations.
Recent Accounting Pronouncements
For recent accounting pronouncements, see Note 1 of our accompanying Notes to Consolidated Financial Statements included elsewhere in Part II, Item 8, “Financial Statements and Supplementary Data” of this Annual Report on Form 10-K.
| Item 8. Financial Statements and Supplementary Data |
Splunk Inc.
Index to Consolidated Financial Statements
| Page No. | ||
The supplementary financial information required by this Item 8, is included in Part II, Item 7 under the caption “Quarterly Results of Operations,” which is incorporated herein by reference.
Report of Independent Registered Public Accounting Firm
To the the Board of Directors and Stockholders of Splunk Inc.
Opinions on the Financial Statements and Internal Control over Financial Reporting
In our opinion, the consolidated financial statements referred to above present fairly, in all material respects, the financial position of the Company as of January 31, 2019 and 2018, and the results of its operations and its cash flows for each of the three years in the period ended January 31, 2019 in conformity with accounting principles generally accepted in the United States of America. Also in our opinion, the Company maintained, in all material respects, effective internal control over financial reporting as of January 31, 2016,2019, based on criteria established in Internal Control - Integrated Framework(2013)issued by the Committee of Sponsoring Organizations ofCOSO.
Change in Accounting Principle
As discussed in Note 1 to the Treadway Commission (COSO). consolidated financial statements, the Company changed the manner in which it accounts for revenues from contracts with customers in 2019.
Basis for Opinions
The Company'sCompany’s management is responsible for these consolidated financial statements, for maintaining effective internal control over financial reporting, and for its assessment of the effectiveness of internal control over financial reporting, included in Management'sManagement’s Annual Report on Internal Control over Financial Reporting appearing under Item 9A. Our responsibility is to express opinions on thesethe Company’s consolidated financial statements and on the Company'sCompany’s internal control over financial reporting based on our integrated audits. We are a public accounting firm registered with the Public Company Accounting Oversight Board (United States) (PCAOB) and are required to be independent with respect to the Company in accordance with the U.S. federal securities laws and the applicable rules and regulations of the Securities and Exchange Commission and the PCAOB.
We conducted our audits in accordance with the standards of the Public Company Accounting Oversight Board (United States).PCAOB. Those standards require that we plan and perform the audits to obtain reasonable assurance about whether the consolidatedfinancial statements are free of material misstatement, whether due to error or fraud, and whether effective internal control over financial reporting was maintained in all material respects.
Our audits of the consolidated financial statements included performing procedures to assess the risks of material misstatement of the consolidated financial statements, whether due to error or fraud, and performing procedures that respond to those risks. Such procedures included examining, on a test basis, evidence supportingregarding the amounts and disclosures in the consolidated financial statements, assessingstatements. Our audits also included evaluating the accounting principles used and significant estimates made by management, andas well as evaluating the overall presentation of the consolidated financial statement presentation.statements. Our audit of internal control over financial reporting included obtaining an understanding of internal control over financial reporting, assessing the risk that a material weakness exists, and testing and evaluating the design and operating effectiveness of internal control based on the assessed risk. Our audits also included performing such other procedures as we considered necessary in the circumstances. We believe that our audits provide a reasonable basis for our opinions.
A company’s internal control over financial reporting is a process designed to provide reasonable assurance regarding the reliability of financial reporting and the preparation of financial statements for external purposes in accordance with generally accepted accounting principles. A company’s internal control over financial reporting includes those policies and procedures that (i) pertain to the maintenance of records that, in reasonable detail, accurately and fairly reflect the transactions and dispositions of the assets of the company; (ii) provide reasonable assurance that transactions are recorded as necessary to permit preparation of financial statements in accordance with generally accepted accounting principles, and that receipts and expenditures of the company are being made only in accordance with authorizations of management and directors of the company; and (iii) provide reasonable assurance regarding prevention or timely detection of unauthorized acquisition, use, or disposition of the company’s assets that could have a material effect on the financial statements.
Because of its inherent limitations, internal control over financial reporting may not prevent or detect misstatements. Also, projections of any evaluation of effectiveness to future periods are subject to the risk that controls may become inadequate because of changes in conditions, or that the degree of compliance with the policies or procedures may deteriorate.
/s/ PricewaterhouseCoopers LLP
San Jose, California
March 30, 201627, 2019
We have served as the Company’s auditor since 2010.
Splunk Inc.
CONSOLIDATED BALANCE SHEETS
| January 31, 2019 | January 31, 2018 | |||||||
| (In thousands, except share and per share amounts) | *As Adjusted | |||||||
| Assets | ||||||||
| Current assets | ||||||||
| Cash and cash equivalents | $ | 1,876,165 | $ | 545,947 | ||||
| Investments, current | 881,220 | 619,203 | ||||||
| Accounts receivable, net | 469,658 | 396,413 | ||||||
| Prepaid expenses and other current assets | 73,197 | 70,021 | ||||||
| Deferred commissions, current | 78,223 | 52,451 | ||||||
| Total current assets | 3,378,463 | 1,684,035 | ||||||
| Investments, non-current | 110,588 | 5,375 | ||||||
| Property and equipment, net | 158,276 | 160,880 | ||||||
| Intangible assets, net | 91,622 | 48,142 | ||||||
| Goodwill | 503,388 | 161,382 | ||||||
| Deferred commissions, non-current | 64,766 | 37,920 | ||||||
| Other assets | 193,140 | 41,711 | ||||||
| Total assets | $ | 4,500,243 | $ | 2,139,445 | ||||
| Liabilities and Stockholders’ Equity | ||||||||
| Current liabilities | ||||||||
| Accounts payable | $ | 20,418 | $ | 11,040 | ||||
| Accrued compensation | 226,061 | 145,365 | ||||||
| Accrued expenses and other liabilities | 125,641 | 84,631 | ||||||
| Deferred revenue, current | 673,018 | 489,913 | ||||||
| Total current liabilities | 1,045,138 | 730,949 | ||||||
| Convertible senior notes, net | 1,634,474 | — | ||||||
| Deferred revenue, non-current | 204,929 | 178,792 | ||||||
| Other liabilities, non-current | 95,245 | 98,383 | ||||||
| Total non-current liabilities | 1,934,648 | 277,175 | ||||||
| Total liabilities | 2,979,786 | 1,008,124 | ||||||
| Commitments and contingencies (Note 3) | ||||||||
| Stockholders’ equity | ||||||||
| Preferred stock: $0.001 par value; 20,000,000 shares authorized; no shares issued or outstanding at January 31, 2019 and January 31, 2018 | — | — | ||||||
| Common stock: $0.001 par value; 1,000,000,000 shares authorized; 149,167,298 shares issued and outstanding at January 31, 2019, and 142,835,123 shares issued and outstanding at January 31, 2018 | 149 | 143 | ||||||
| Accumulated other comprehensive income (loss) | (2,506 | ) | 156 | |||||
| Additional paid-in capital | 2,754,858 | 2,086,893 | ||||||
| Accumulated deficit | (1,232,044 | ) | (955,871 | ) | ||||
| Total stockholders’ equity | 1,520,457 | 1,131,321 | ||||||
| Total liabilities and stockholders’ equity | $ | 4,500,243 | $ | 2,139,445 | ||||
| * | Prior-period information has been adjusted to reflect the adoption of ASU No. 2014-09, Revenue from Contracts with Customers (Topic 606), which we adopted on February 1, 2018. Refer to Note 1 for further details. |
| January 31, 2016 | January 31, 2015 | ||||||
| ASSETS | |||||||
| Current assets | |||||||
| Cash and cash equivalents | $ | 424,541 | $ | 387,315 | |||
| Investments, current portion | 584,498 | 462,849 | |||||
| Accounts receivable, net | 181,665 | 128,413 | |||||
| Prepaid expenses and other current assets | 26,565 | 21,256 | |||||
| Total current assets | 1,217,269 | 999,833 | |||||
| Investments, non-current | 1,500 | 165,082 | |||||
| Property and equipment, net | 134,995 | 50,374 | |||||
| Intangible assets, net | 49,482 | 10,416 | |||||
| Goodwill | 123,318 | 19,070 | |||||
| Other assets | 10,275 | 3,016 | |||||
| Total assets | $ | 1,536,839 | $ | 1,247,791 | |||
| LIABILITIES AND STOCKHOLDERS’ EQUITY | |||||||
| Current liabilities | |||||||
| Accounts payable | $ | 4,868 | $ | 3,726 | |||
| Accrued payroll and compensation | 95,898 | 65,220 | |||||
| Accrued expenses and other liabilities | 49,879 | 27,819 | |||||
| Deferred revenue, current portion | 347,121 | 249,883 | |||||
| Total current liabilities | 497,766 | 346,648 | |||||
| Deferred revenue, non-current | 102,382 | 54,202 | |||||
| Other liabilities, non-current | 77,277 | 33,620 | |||||
| Total non-current liabilities | 179,659 | 87,822 | |||||
| Total liabilities | 677,425 | 434,470 | |||||
| Commitments and contingencies (Note 3) | |||||||
| Stockholders’ equity | |||||||
| Preferred stock: $0.001 par value; 20,000,000 shares authorized; no shares issued or outstanding at January 31, 2016 and January 31, 2015 | — | — | |||||
| Common stock: $0.001 par value; 1,000,000,000 shares authorized; 131,543,467 shares issued and outstanding at January 31, 2016, and 123,538,492 shares issued and outstanding at January 31, 2015 | 132 | 123 | |||||
| Accumulated other comprehensive loss | (3,770 | ) | (837 | ) | |||
| Additional paid-in capital | 1,528,647 | 1,200,858 | |||||
| Accumulated deficit | (665,595 | ) | (386,823 | ) | |||
| Total stockholders’ equity | 859,414 | 813,321 | |||||
| Total liabilities and stockholders’ equity | $ | 1,536,839 | $ | 1,247,791 | |||
The accompanying notes are an integral part of these consolidated financial statements.
Splunk Inc.
CONSOLIDATED STATEMENTS OF OPERATIONS
| Fiscal Year Ended January 31, | Fiscal Year Ended January 31, | ||||||||||||||||||||||
| 2016 | 2015 | 2014 | 2019 | 2018 | 2017 | ||||||||||||||||||
| (In thousands, except per share amounts) | *As Adjusted | *As Adjusted | |||||||||||||||||||||
| Revenues | |||||||||||||||||||||||
| License | $ | 405,399 | $ | 283,191 | $ | 199,024 | $ | 1,030,277 | $ | 741,302 | $ | 543,510 | |||||||||||
| Maintenance and services | 263,036 | 167,684 | 103,599 | 772,733 | 567,830 | 400,054 | |||||||||||||||||
| Total revenues | 668,435 | 450,875 | 302,623 | 1,803,010 | 1,309,132 | 943,564 | |||||||||||||||||
| Cost of revenues (1) | |||||||||||||||||||||||
| License | 9,080 | 1,859 | 330 | 22,527 | 13,398 | 11,965 | |||||||||||||||||
| Maintenance and services | 105,042 | 66,519 | 35,495 | 322,149 | 243,011 | 179,088 | |||||||||||||||||
| Total cost of revenues | 114,122 | 68,378 | 35,825 | 344,676 | 256,409 | 191,053 | |||||||||||||||||
| Gross profit | 554,313 | 382,497 | 266,798 | 1,458,334 | 1,052,723 | 752,511 | |||||||||||||||||
| Operating expenses (1) | |||||||||||||||||||||||
| Research and development | 215,309 | 150,790 | 75,895 | 441,969 | 301,114 | 295,850 | |||||||||||||||||
| Sales and marketing | 505,348 | 344,471 | 215,335 | 1,029,950 | 777,876 | 639,404 | |||||||||||||||||
| General and administrative | 121,579 | 103,046 | 53,875 | 237,588 | 159,143 | 153,359 | |||||||||||||||||
| Total operating expenses | 842,236 | 598,307 | 345,105 | 1,709,507 | 1,238,133 | 1,088,613 | |||||||||||||||||
| Operating loss | (287,923 | ) | (215,810 | ) | (78,307 | ) | (251,173 | ) | (185,410 | ) | (336,102 | ) | |||||||||||
| Interest and other income (expense), net | |||||||||||||||||||||||
| Interest income, net | 1,798 | 754 | 225 | ||||||||||||||||||||
| Interest income | 31,458 | 8,943 | 5,720 | ||||||||||||||||||||
| Interest expense | (41,963 | ) | (8,794 | ) | (8,549 | ) | |||||||||||||||||
| Other income (expense), net | (519 | ) | 216 | (920 | ) | (1,513 | ) | (3,600 | ) | (3,022 | ) | ||||||||||||
| Total interest and other income (expense), net | 1,279 | 970 | (695 | ) | (12,018 | ) | (3,451 | ) | (5,851 | ) | |||||||||||||
| Loss before income taxes | (286,644 | ) | (214,840 | ) | (79,002 | ) | (263,191 | ) | (188,861 | ) | (341,953 | ) | |||||||||||
| Provision for income taxes (benefit) | (7,872 | ) | 2,276 | 6 | |||||||||||||||||||
| Provision for income taxes | 12,386 | 1,357 | 5,507 | ||||||||||||||||||||
| Net loss | $ | (278,772 | ) | $ | (217,116 | ) | $ | (79,008 | ) | $ | (275,577 | ) | $ | (190,218 | ) | $ | (347,460 | ) | |||||
| Basic and diluted net loss per share | $ | (2.20 | ) | $ | (1.81 | ) | $ | (0.75 | ) | $ | (1.89 | ) | $ | (1.36 | ) | $ | (2.59 | ) | |||||
| Weighted-average shares used in computing basic and diluted net loss per share | 126,746 | 119,775 | 105,067 | 145,707 | 139,866 | 133,910 | |||||||||||||||||
| * | Prior-period information has been adjusted to reflect the adoption of ASU No. 2014-09, Revenue from Contracts with Customers (Topic 606), which we adopted on February 1, 2018. Refer to Note 1 for further details. |
(1) | Amounts include stock-based compensation expense, as follows: |
| Cost of revenues | $ | 26,057 | $ | 17,189 | $ | 5,283 | $ | 37,501 | $ | 33,605 | $ | 30,971 | |||||||||||
| Research and development | 89,197 | 60,777 | 20,829 | 137,171 | 106,690 | 129,388 | |||||||||||||||||
| Sales and marketing | 130,054 | 90,064 | 30,012 | 190,422 | 159,240 | 161,164 | |||||||||||||||||
| General and administrative | 46,949 | 46,149 | 13,244 | 76,836 | 58,928 | 56,518 | |||||||||||||||||
The accompanying notes are an integral part of these consolidated financial statements.
| Fiscal Year Ended January 31, | Fiscal Year Ended January 31, | ||||||||||||||||||||||
| 2016 | 2015 | 2014 | 2019 | 2018 | 2017 | ||||||||||||||||||
| (In thousands) | *As Adjusted | *As Adjusted | |||||||||||||||||||||
| Net loss | $ | (278,772 | ) | $ | (217,116 | ) | $ | (79,008 | ) | $ | (275,577 | ) | $ | (190,218 | ) | $ | (347,460 | ) | |||||
| Other comprehensive income (loss): | |||||||||||||||||||||||
| Net unrealized gain (loss) on investments | (66 | ) | 2 | — | |||||||||||||||||||
| Net unrealized gain (loss) on investments (net of tax) | 1,279 | (911 | ) | (174 | ) | ||||||||||||||||||
| Foreign currency translation adjustments | (2,867 | ) | (897 | ) | 193 | (3,941 | ) | 4,080 | 931 | ||||||||||||||
| Total other comprehensive income (loss) | (2,933 | ) | (895 | ) | 193 | (2,662 | ) | 3,169 | 757 | ||||||||||||||
| Comprehensive loss | $ | (281,705 | ) | $ | (218,011 | ) | $ | (78,815 | ) | $ | (278,239 | ) | $ | (187,049 | ) | $ | (346,703 | ) | |||||
| * | Prior-period information has been adjusted to reflect the adoption of ASU No. 2014-09, Revenue from Contracts with Customers (Topic 606), which we adopted on February 1, 2018. Refer to Note 1 for further details. |
The accompanying notes are an integral part of these consolidated financial statements.
| Common Stock | Common Stock | ||||||||||||||||||||||||||||||||||||||||||||
| (in thousands, except share amounts) | Shares | Amount | Additional Paid-in Capital | Accumulated Other Comprehensive Income (Loss) | Accumulated Deficit | Total Stockholders’ Equity | |||||||||||||||||||||||||||||||||||||||
| Balances at January 31, 2013 | 100,920,350 | $ | 101 | $ | 328,277 | $ | (135 | ) | $ | (90,699 | ) | $ | 237,544 | ||||||||||||||||||||||||||||||||
| (In thousands, except share amounts) | Shares | Amount | Additional Paid-in Capital | Accumulated Other Comprehensive Income (Loss) | Accumulated Deficit | Total Stockholders’ Equity | |||||||||||||||||||||||||||||||||||||||
| Balances at January 31, 2016 | 131,543,467 | $ | 132 | $ | 1,528,647 | $ | (3,770 | ) | $ | (665,595 | ) | $ | 859,414 | ||||||||||||||||||||||||||||||||
| Cumulative-effect adjustment from adoption of ASU 2014-09 | — | — | — | — | 247,402 | 247,402 | |||||||||||||||||||||||||||||||||||||||
| Stock-based compensation | — | — | 69,368 | — | — | 69,368 | — | — | 378,041 | — | — | 378,041 | |||||||||||||||||||||||||||||||||
| Issuance of common stock upon exercise of options | 7,254,049 | 7 | 23,724 | — | — | 23,731 | 1,642,599 | 2 | 7,746 | — | — | 7,748 | |||||||||||||||||||||||||||||||||
| Vesting of early exercised options | — | — | 112 | — | — | 112 | |||||||||||||||||||||||||||||||||||||||
| Vesting of restricted stock units | 475,111 | — | — | — | — | 3,571,873 | 3 | — | — | — | 3 | ||||||||||||||||||||||||||||||||||
| Taxes withholding related to net share settlement of equity awards | — | — | (18,156 | ) | — | — | (18,156 | ) | |||||||||||||||||||||||||||||||||||||
| Common stock issued upon ESPP purchase | 550,006 | 1 | 11,433 | — | — | 11,434 | |||||||||||||||||||||||||||||||||||||||
| Excess tax benefits from employee stock plans | — | — | 351 | — | — | 351 | |||||||||||||||||||||||||||||||||||||||
| Net change in cumulative translation adjustment | — | — | — | 193 | — | 193 | |||||||||||||||||||||||||||||||||||||||
| Issuance of common stock in connection with follow-on offering, net of offering costs | 6,900,000 | 7 | 539,332 | — | — | 539,339 | |||||||||||||||||||||||||||||||||||||||
| Net loss | — | — | — | — | (79,008 | ) | (79,008 | ) | |||||||||||||||||||||||||||||||||||||
| Balances at January 31, 2014 | 116,099,516 | 116 | 954,441 | 58 | (169,707 | ) | 784,908 | ||||||||||||||||||||||||||||||||||||||
| Stock-based compensation | — | — | 214,179 | — | — | 214,179 | |||||||||||||||||||||||||||||||||||||||
| Issuance of common stock upon exercise of options | 4,213,746 | 4 | 16,788 | — | — | 16,792 | |||||||||||||||||||||||||||||||||||||||
| Vesting of early exercised options | — | — | 112 | — | — | 112 | |||||||||||||||||||||||||||||||||||||||
| Vesting of restricted stock units | 2,862,027 | 3 | (3 | ) | — | — | — | ||||||||||||||||||||||||||||||||||||||
| Taxes paid related to net share settlement of equity awards | — | — | (113,707 | ) | — | — | (113,707 | ) | |||||||||||||||||||||||||||||||||||||
| Issuance of common stock upon ESPP purchase | 363,203 | — | 14,494 | — | — | 14,494 | 597,545 | — | 27,412 | — | — | 27,412 | |||||||||||||||||||||||||||||||||
| Excess tax benefits from employee stock plans | — | — | 847 | — | — | 847 | |||||||||||||||||||||||||||||||||||||||
| Unrealized gain from investments | — | — | — | 2 | — | 2 | |||||||||||||||||||||||||||||||||||||||
| Net change in cumulative translation adjustments | — | — | — | (897 | ) | — | (897 | ) | |||||||||||||||||||||||||||||||||||||
| Net loss | — | — | — | — | (217,116 | ) | (217,116 | ) | |||||||||||||||||||||||||||||||||||||
| Balances at January 31, 2015 | 123,538,492 | 123 | 1,200,858 | (837 | ) | (386,823 | ) | 813,321 | |||||||||||||||||||||||||||||||||||||
| Stock-based compensation | — | — | 292,257 | — | — | 292,257 | |||||||||||||||||||||||||||||||||||||||
| Issuance of common stock upon exercise of options | 2,755,556 | 3 | 15,266 | — | — | 15,269 | |||||||||||||||||||||||||||||||||||||||
| Vesting of early exercised options | — | — | 55 | — | — | 55 | |||||||||||||||||||||||||||||||||||||||
| Vesting of restricted stock units | 4,136,073 | 5 | (5 | ) | — | — | — | ||||||||||||||||||||||||||||||||||||||
| Issuance of common stock upon ESPP purchase | 441,564 | — | 19,342 | — | — | 19,342 | |||||||||||||||||||||||||||||||||||||||
| Issuance of restricted stock awards | 671,782 | 1 | — | — | — | 1 | |||||||||||||||||||||||||||||||||||||||
| Forfeited restricted stock awards | (186,003 | ) | — | — | — | — | — | ||||||||||||||||||||||||||||||||||||||
| Excess tax benefits from employee stock plans | — | — | 874 | — | — | 874 | — | — | 682 | — | — | 682 | |||||||||||||||||||||||||||||||||
| Unrealized loss from investments | — | — | — | (66 | ) | — | (66 | ) | — | — | — | (174 | ) | — | (174 | ) | |||||||||||||||||||||||||||||
| Net change in cumulative translation adjustments | — | — | — | (2,867 | ) | — | (2,867 | ) | — | — | — | 931 | — | 931 | |||||||||||||||||||||||||||||||
| Net loss | — | — | — | — | (278,772 | ) | (278,772 | ) | — | — | — | — | (347,460 | ) | (347,460 | ) | |||||||||||||||||||||||||||||
| Balances at January 31, 2016 | 131,543,467 | $ | 132 | $ | 1,528,647 | $ | (3,770 | ) | $ | (665,595 | ) | $ | 859,414 | ||||||||||||||||||||||||||||||||
| Balances at January 31, 2017* | 137,169,481 | 137 | 1,828,821 | (3,013 | ) | (765,653 | ) | 1,060,292 | |||||||||||||||||||||||||||||||||||||
| Stock-based compensation | — | — | 358,463 | — | — | 358,463 | |||||||||||||||||||||||||||||||||||||||
| Issuance of common stock upon exercise of options | 1,428,602 | 1 | 4,170 | — | — | 4,171 | |||||||||||||||||||||||||||||||||||||||
| Vesting of restricted stock units | 3,515,384 | 4 | — | — | — | 4 | |||||||||||||||||||||||||||||||||||||||
| Taxes paid related to net share settlement of equity awards | — | — | (138,604 | ) | — | — | (138,604 | ) | |||||||||||||||||||||||||||||||||||||
| Issuance of common stock upon ESPP purchase | 721,656 | 1 | 34,043 | — | — | 34,044 | |||||||||||||||||||||||||||||||||||||||
| Unrealized loss from investments | — | — | — | (911 | ) | — | (911 | ) | |||||||||||||||||||||||||||||||||||||
| Net change in cumulative translation adjustments | — | — | — | 4,080 | — | 4,080 | |||||||||||||||||||||||||||||||||||||||
| Net loss | — | — | — | — | (190,218 | ) | (190,218 | ) | |||||||||||||||||||||||||||||||||||||
| Balances at January 31, 2018* | 142,835,123 | 143 | 2,086,893 | 156 | (955,871 | ) | 1,131,321 | ||||||||||||||||||||||||||||||||||||||
| Cumulative-effect adjustment from adoption of ASU 2016-16 | — | — | (7 | ) | — | (596 | ) | (603 | ) | ||||||||||||||||||||||||||||||||||||
| Stock-based compensation | — | — | 441,930 | — | — | 441,930 | |||||||||||||||||||||||||||||||||||||||
| Issuance of common stock upon exercise of options | 267,226 | — | 1,951 | — | — | 1,951 | |||||||||||||||||||||||||||||||||||||||
| Vesting of restricted stock units | 4,583,333 | 4 | — | — | — | 4 | |||||||||||||||||||||||||||||||||||||||
| Issuance of restricted stock awards | 824,605 | 1 | — | — | — | 1 | |||||||||||||||||||||||||||||||||||||||
| Fair value of replacement equity awards attributable to pre-acquisition service | — | — | 15,776 | — | — | 15,776 | |||||||||||||||||||||||||||||||||||||||
| Taxes paid related to net share settlement of equity awards | — | — | (62,590 | ) | — | — | (62,590 | ) | |||||||||||||||||||||||||||||||||||||
| Issuance of common stock upon ESPP purchase | 657,011 | 1 | 46,339 | — | — | 46,340 | |||||||||||||||||||||||||||||||||||||||
| Equity component of convertible senior notes, net | — | — | 498,841 | — | — | 498,841 | |||||||||||||||||||||||||||||||||||||||
| Purchase of capped calls | — | — | (274,275 | ) | — | — | (274,275 | ) | |||||||||||||||||||||||||||||||||||||
| Unrealized gain from investments | — | — | — | 1,279 | — | 1,279 | |||||||||||||||||||||||||||||||||||||||
| Net change in cumulative translation adjustments | — | — | — | (3,941 | ) | — | (3,941 | ) | |||||||||||||||||||||||||||||||||||||
| Net loss | — | — | — | — | (275,577 | ) | (275,577 | ) | |||||||||||||||||||||||||||||||||||||
| Balances at January 31, 2019 | 149,167,298 | $ | 149 | $ | 2,754,858 | $ | (2,506 | ) | $ | (1,232,044 | ) | $ | 1,520,457 | ||||||||||||||||||||||||||||||||
| * | Prior-period information has been adjusted to reflect the adoption of ASU No. 2014-09, Revenue from Contracts with Customers (Topic 606), which we adopted on February 1, 2018. Refer to Note 1 for further details. |
The accompanying notes are an integral part of these consolidated financial statements.
| Fiscal Year Ended January 31, | Fiscal Year Ended January 31, | ||||||||||||||||||||||
| 2016 | 2015 | 2014 | 2019 | 2018 | 2017 | ||||||||||||||||||
| (In thousands) | *As Adjusted | *As Adjusted | |||||||||||||||||||||
| Cash flows from operating activities | |||||||||||||||||||||||
| Net loss | $ | (278,772 | ) | $ | (217,116 | ) | $ | (79,008 | ) | $ | (275,577 | ) | $ | (190,218 | ) | $ | (347,460 | ) | |||||
| Adjustments to reconcile net loss to net cash provided by operating activities: | |||||||||||||||||||||||
| Depreciation and amortization | 19,491 | 12,494 | 6,692 | 52,430 | 40,941 | 32,113 | |||||||||||||||||
| Amortization of investment premiums | 1,332 | 775 | — | ||||||||||||||||||||
| Stock-based compensation expense | 292,257 | 214,179 | 69,368 | ||||||||||||||||||||
| Amortization of deferred commissions | 77,867 | 46,653 | 34,079 | ||||||||||||||||||||
| Amortization of investment premiums (accretion of discounts) | (4,743 | ) | 259 | 840 | |||||||||||||||||||
| Amortization of debt discount and issuance costs | 28,019 | — | — | ||||||||||||||||||||
| Stock-based compensation | 441,930 | 358,463 | 378,041 | ||||||||||||||||||||
| Deferred income taxes | (11,140 | ) | (327 | ) | (1,374 | ) | (4,064 | ) | (4,822 | ) | (326 | ) | |||||||||||
| Excess tax benefits from employee stock plans | (874 | ) | (847 | ) | (351 | ) | — | — | (682 | ) | |||||||||||||
| Impairment of long-lived asset | — | — | 2,128 | ||||||||||||||||||||
| Non-cash facility exit adjustment | — | (5,191 | ) | 8,625 | |||||||||||||||||||
| Accelerated depreciation of property and equipment | — | — | 2,739 | ||||||||||||||||||||
| Changes in operating assets and liabilities, net of acquisitions: | |||||||||||||||||||||||
| Accounts receivable, net | (53,252 | ) | (45,065 | ) | (19,400 | ) | (65,469 | ) | (150,953 | ) | (48,650 | ) | |||||||||||
| Prepaid expenses, other current and non-current assets | 4,675 | (11,284 | ) | (6 | ) | ||||||||||||||||||
| Prepaid expenses and other assets | (148,501 | ) | (45,611 | ) | (25,726 | ) | |||||||||||||||||
| Deferred commissions | (130,485 | ) | (76,756 | ) | (49,492 | ) | |||||||||||||||||
| Accounts payable | 965 | 1,766 | 171 | 9,240 | 3,409 | 2,720 | |||||||||||||||||
| Accrued compensation | 30,026 | 21,344 | 15,753 | 81,213 | 44,484 | 4,194 | |||||||||||||||||
| Accrued expenses and other liabilities | 5,496 | 16,297 | 2,454 | 30,751 | 9,967 | 36,552 | |||||||||||||||||
| Deferred revenue | 145,418 | 111,764 | 77,421 | 203,843 | 232,279 | 174,267 | |||||||||||||||||
| Net cash provided by operating activities | 155,622 | 103,980 | 73,848 | 296,454 | 262,904 | 201,834 | |||||||||||||||||
| Cash flows from investing activities | |||||||||||||||||||||||
| Purchases of investments | (480,610 | ) | (820,710 | ) | — | (1,109,852 | ) | (645,762 | ) | (683,787 | ) | ||||||||||||
| Maturities of investments | 522,645 | 192,000 | — | 754,138 | 687,485 | 605,175 | |||||||||||||||||
| Acquisitions, net of cash acquired | (142,693 | ) | (2,500 | ) | (29,738 | ) | (394,910 | ) | (59,350 | ) | — | ||||||||||||
| Purchases of property and equipment | (51,332 | ) | (13,950 | ) | (9,308 | ) | (23,160 | ) | (20,503 | ) | (45,349 | ) | |||||||||||
| Other investment activities | (1,500 | ) | — | — | (5,494 | ) | (375 | ) | (3,500 | ) | |||||||||||||
| Net cash used in investing activities | (153,490 | ) | (645,160 | ) | (39,046 | ) | (779,278 | ) | (38,505 | ) | (127,461 | ) | |||||||||||
| Cash flows from financing activities | |||||||||||||||||||||||
| Proceeds from exercise of stock options | 15,269 | 16,792 | 23,731 | ||||||||||||||||||||
| Proceeds from the exercise of stock options | 1,953 | 4,175 | 7,751 | ||||||||||||||||||||
| Proceeds from employee stock purchase plan | 46,342 | 34,044 | 27,412 | ||||||||||||||||||||
| Proceeds from the issuance of convertible senior notes, net of issuance costs | 2,105,296 | — | — | ||||||||||||||||||||
| Purchase of capped calls | (274,275 | ) | — | — | |||||||||||||||||||
| Taxes paid related to net share settlement of equity awards | (63,369 | ) | (137,830 | ) | (113,707 | ) | |||||||||||||||||
| Repayment of financing lease obligation | (2,522 | ) | (1,808 | ) | — | ||||||||||||||||||
| Excess tax benefits from employee stock plans | 874 | 847 | 351 | — | — | 682 | |||||||||||||||||
| Proceeds from employee stock purchase plan | 19,342 | 14,494 | 11,434 | ||||||||||||||||||||
| Proceeds from follow-on offering, net of offering costs | — | — | 539,339 | ||||||||||||||||||||
| Taxes paid related to net share settlement of equity awards | — | — | (18,156 | ) | |||||||||||||||||||
| Payment related to build-to-suit lease obligation | — | (523 | ) | — | |||||||||||||||||||
| Net cash provided by financing activities | 35,485 | 31,610 | 556,699 | ||||||||||||||||||||
| Net cash provided by (used in) financing activities | 1,813,425 | (101,419 | ) | (77,862 | ) | ||||||||||||||||||
| Effect of exchange rate changes on cash and cash equivalents | (391 | ) | (568 | ) | 13 | (383 | ) | 1,621 | 294 | ||||||||||||||
| Net increase (decrease) in cash and cash equivalents | 37,226 | (510,138 | ) | 591,514 | 1,330,218 | 124,601 | (3,195 | ) | |||||||||||||||
| Cash and cash equivalents | |||||||||||||||||||||||
| Beginning of period | 387,315 | 897,453 | 305,939 | ||||||||||||||||||||
| End of period | $ | 424,541 | $ | 387,315 | $ | 897,453 | |||||||||||||||||
| Cash and cash equivalents at beginning of period | 545,947 | 421,346 | 424,541 | ||||||||||||||||||||
| Cash and cash equivalents at end of period | $ | 1,876,165 | $ | 545,947 | $ | 421,346 | |||||||||||||||||
| Supplemental disclosures | |||||||||||||||||||||||
| Cash paid for income taxes | $ | 1,408 | $ | 1,080 | $ | 490 | $ | 6,639 | $ | 6,480 | $ | 3,021 | |||||||||||
| Cash paid for interest expense related to financing lease obligation | 8,183 | 8,150 | 4,132 | ||||||||||||||||||||
| Non-cash investing and financing activities | |||||||||||||||||||||||
| Accrued purchases of property and equipment | (775 | ) | 1,057 | 1,265 | |||||||||||||||||||
| Vesting of early exercised options | 56 | 112 | 112 | ||||||||||||||||||||
| Deferred offering costs not yet paid | — | — | 344 | ||||||||||||||||||||
| Capitalized construction costs related to build-to-suit lease | 42,825 | 29,360 | — | ||||||||||||||||||||
| Increase (decrease) in accrued purchases of property and equipment | 666 | 132 | (1,121 | ) | |||||||||||||||||||
| Increase in capitalized construction costs related to build-to-suit lease | — | — | 10,065 | ||||||||||||||||||||
| * | Prior-period information has been adjusted to reflect the adoption of ASU No. 2014-09, Revenue from Contracts with Customers (Topic 606), which we adopted on February 1, 2018. Refer to Note 1 for further details. |
The accompanying notes are an integral part of these consolidated financial statements.
(1) Description of the Business and Significant Accounting Policies
Business
Splunk Inc. (“we,” “us,” “our”) provides innovative software solutions that enable organizations to gain real-time operational intelligence by harnessing the value of their data. Our offerings enable users to collect, index, search, explore,investigate, monitor, analyze and analyzeact on machine data regardless of format or source. Our offerings address large and diverse data sets commonly referred to as big data and are specifically tailored for machine data. Machine data is produced by nearly every software application and electronic device across an organization and contains a definitive, time-stampedreal-time record of various activities, such as transactions, customer and user activitiesbehavior, and security threats. Our offerings help users derive new insights from machine data that can be used to, among other things, improve service levels, reduce operational costs, mitigate security risks, demonstrate and maintain compliance, and drive better business decisions. We were incorporated in California in October 2003 and reincorporated in Delaware in May 2006.
Fiscal Year
Our fiscal year ends on January 31. References to fiscal 2016,2019, for example, refer to the fiscal year ended January 31, 2016.2019.
Reclassifications
Certain reclassifications have been made to prior year balances in order to conform to the underwriters. The public offering pricecurrent period presentation. “Interest income” and “Interest expense” have been reclassified from “Interest income (expense), net” on the condensed consolidated statements of operations. These reclassifications had no impact on the shares sold in the offering was $81.00 per share. The total gross proceeds from the offering to us were $558.9 million. After deducting underwriting discounts and commissions of $19.6 million, we received approximately $539.3 million.previously reported net loss or accumulated deficit.
Use of Estimates
The preparation of financial statements in conformity with accounting principles generally accepted in the United States of AmericaU.S. GAAP requires management to make estimates, judgments and assumptions that affect the reported amounts of assets and liabilities and disclosure of contingent assets and liabilities at the date of the financial statements and reported amounts of revenues and expenses during the reporting periods covered by the financial statements and accompanying notes. In particular, we make estimates with respect to the fair value ofstand-alone selling price for each distinct performance obligation included in customer contracts with multiple elements in revenue recognition,performance obligations, uncollectible accounts receivable, the assessment of the useful life and recoverability of long-lived assets (property and equipment, goodwill and identified intangibles), the period of benefit for deferred commissions, stock-based compensation expense, the fair value of assets acquired and liabilities assumed for business combinations, income taxes, leases and contingencies. Actual results could differ from those estimates.
Segments
We operate our business as one operating segment: the development and marketing of software solutions that enable our customers to gain real-time operational intelligence by harnessing the value of their data. Our chief operating decision maker is our Chief Executive Officer, who reviews financial information presented on a consolidated basis for purposes of making operating decisions, assessing financial performance and allocating resources.
75
Principles of Consolidation
The accompanying consolidated financial statements include the accounts of Splunk Inc. and its direct and indirect wholly-owned subsidiaries. All intercompany balances and transactions have been eliminated upon consolidation.
Foreign Currency
The functional currency of our foreign subsidiaries is their respective local currency. Translation adjustments arising from the use of differing exchange rates from period to period are included in Accumulated"Accumulated other comprehensive lossincome (loss)" within the consolidated statementstatements of stockholders’ equity. Foreign currency transaction gains and losses are included in Other"Other income (expense), netnet" and were not material for the three years ended January 31, 2016.2019. All assets and liabilities denominated in a
foreign currency are translated into U.S. dollars at the exchange rate on the balance sheet date. Expenses are translated at the average exchange rate during the period. Equity transactions are translated using historical exchange rates.
Foreign Currency Contracts
Business Combinations
We use our best estimates and assumptions to allocate the fair value of purchase consideration to the tangible and intangible assets acquired and liabilities assumed based on their estimated fair values. The excess of the fair value of purchase consideration over the fair values of these identifiable assets and liabilities is recorded as goodwill. Our estimates are inherently uncertain and subject to refinement. During the measurement period, which may be up to one year from the acquisition date, we may record adjustments to the fair value of these tangible and intangible assets acquired and liabilities assumed, with the corresponding offset to goodwill. In addition, uncertain tax positions and tax-related valuation allowances are initially established in connection with a business combination as of the acquisition date. We continue to collect information and reevaluate these estimates and assumptions quarterly and record any adjustments to our preliminary estimates to goodwill provided that we are within the measurement period. Upon the conclusion of the final determination of the fair value of assets acquired or liabilities assumed during the measurement period, any subsequent adjustments are recorded to our consolidated statements of operations.
Equity Investments
Equity investments without readily determinable fair values are accounted for at cost, less impairment and adjusted for subsequent observable price changes obtained from transactions for identical or similar investments issued by the same issuer. Changes in the basis of the equity investment will be recognized in “Other income (expense), net.”
Investments in entities where we have the ability to exercise significant influence, but not control, over the investee are accounted for using the equity method of accounting. Our results of operations will include, as a component of “Other income (expense), net,” our share of the net income or loss of the equity investments accounted for under the equity method of accounting.
Revenue Recognition
We generate revenues primarily in the form of software license fees and related maintenance fees, cloud services and other services fees. License fees includeLicenses for on-premises software are either perpetual or term licenses and provide the customer with a right to use the software. Typically, when purchasing a perpetual license, fees,a customer also purchases one year of maintenance for which we charge a percentage of the license fee. When a term license feesis purchased, maintenance is bundled with the license for the term of the license period. Cloud services are provided on a subscription basis and royalties. Maintenancegive our customers access to our cloud solutions, which include related customer support. Other services include training and services primarily consist of fees for maintenance services (including support and unspecified upgrades and enhancements when and if they are available), training, professional services that are not essential to functionality and subscription software services.
Our contracts with customers often contain multiple performance obligations. For these contracts, we account for individual performance obligations separately if they are distinct. The transaction price is allocated to the separate performance obligations on a relative standalone selling price (“SSP”) basis. We determine the SSP based on an observable standalone selling price when it is available, as well as other factors, including the price charged to customers, our discounting practices, and our overall pricing objectives, while maximizing observable inputs. In situations where pricing is highly variable or uncertain, we estimate the SSP using a residual approach.
A receivable is recorded in the period we deliver products or provide services, or when we have an unconditional right to payment. Some of our multi-year on-premises license contracts are invoiced annually and we generally recognize the total amount of the license revenues upfront and record a corresponding receivable, if we have an unconditional right to receive payment. Current and non-current accounts receivable, net of allowance for doubtful accounts, was $625.1 million and $396.4 million as of January 31, 2019 and 2018, respectively.
Payment terms and conditions vary by contract type, although our terms generally include a requirement of payment within 30 to 60 days. In instances where the timing of revenue recognition differs from the indirect sales channel upon sell-through by the partnertiming of payment, we have determined our contracts do not include a significant financing component. The primary purpose of our invoicing terms is to provide customers with simplified and predictable ways of purchasing our products and services, not to receive financing from our customers or distributor. Sell-throughto provide customers with financing.
Deferred revenue is determinedrecorded when we receive an order form frominvoice a resellercontract or deliver a license prior to recognizing revenue. It is comprised of balances related to maintenance, cloud services, training and professional services invoiced at the beginning of each service period, as well as for licenses that we delivered prior to the license term commencing.
Deferred Sales Commissions
Sales commissions paid to our sales force and the related payroll taxes are considered incremental and recoverable costs of obtaining a specific end-user sale.contract with a customer. These costs are capitalized and recorded in “Deferred commissions, current and non-current” in our consolidated balance sheets. We do not offer right of return, product rotation or price protection to anygenerally amortize these costs over the remaining contractual term of our channel partners. customer contracts, consistent with the pattern of revenue recognition of each performance obligation, for contracts in which the commissions paid on the initial and renewal contracts are commensurate. For certain contracts in which the commissions paid on the initial and renewal contracts are not commensurate, we amortize the commissions paid on the initial contract over an expected period of benefit, which we have determined to be approximately five years. We also have licensing arrangementsdetermined the period of benefit by taking into consideration our customer contracts, the duration of our relationships with OEMour customers for which royalty fees are generally recognized as revenue upon receiptand our technology. In capitalizing and amortizing deferred commissions, we have elected to apply a portfolio approach. We include amortization of reports of units shipped, respectively. Provided all other revenue criteria are met, the upfront, minimum, non-refundable license fees from OEM customers are recognized upon delivery,deferred commissions in “Sales and on-going royalty fees are recognized upon reports of units shipped.
Cash and Cash Equivalents
We consider all highly liquid instruments with original or remaining maturities of 90 days or less at the date of purchase to be cash equivalents. Cash and cash equivalents are recorded at cost, which approximates fair value. We do not hold or issue financial instruments for trading purposes. As of January 31, 2016, 2015 and 2014, $374.6 million, $374.7 million and $864.0 million, respectively, of cash and cash equivalents were invested in money market funds.
Investments
We determine the appropriate classification of our investments at the time of purchase and reevaluate such determination at each balance sheet date. Securities are classified as available-for-sale and are carried at fair value, with the change in unrealized gains and losses, net of tax, reported as a separate component on the consolidated statements of comprehensive income (loss). Fair value is determined based on quoted market rates when observable or utilizing data points
77
that are observable, such as quoted prices, interest rates and yield curves. Declines in fair value judged to be other-than-temporary on securities available for sale are included as a component of investment income. In order to determine whether a decline in value is other-than-temporary, we evaluate, among other factors, the duration and extent to which the fair value has been less than the carrying value and our intent and ability to retain the investment for a period of time sufficient to allow for any anticipated recovery in fair value. The cost of securities sold is based on the specific-identification method. Interest on securities classified as available-for-sale is included as a componentin “Interest income” in our consolidated statements of Interest income, net.operations.
Concentration of Risk
Financial instruments that potentially subject us to significant concentrations of credit risk consist principally of cash and cash equivalents, investments and accounts receivable. We maintain the majority of our cash balance at two financial institutions that management believes are high-credit, quality financial institutions and invest our cash equivalents in highly rated money market funds.
Our accounts receivable is subject to collection risks.risk. Our gross accounts receivable is reduced for this risk by an allowance for doubtful accounts. This allowance is for estimated losses resulting from the inability of our customers to make required payments. It is an estimate and is regularly evaluated for adequacy by taking into consideration a combination of factors. We look at factors such as past collection experience, credit quality of the customer, age of the receivable balance, and current economic conditions. These factors are reviewed to determine whether an allowance for bad debts should be recorded to reduce the receivable balance to the amount believed to be collectible.
The following table presents the changes in the allowance for doubtful accounts (in thousands):accounts:
| Fiscal Year Ended January 31, | Fiscal Year Ended January 31, | ||||||||||||||||||||||
| (in thousands) | 2016 | 2015 | 2014 | ||||||||||||||||||||
| (In thousands) | 2019 | 2018 | 2017 | ||||||||||||||||||||
| Balance at beginning of period | $ | 473 | $ | 758 | $ | 821 | $ | 467 | $ | 475 | $ | 531 | |||||||||||
| Add: bad debt expense | 98 | — | 140 | — | — | — | |||||||||||||||||
| Less: write-offs, net of recoveries | (40 | ) | (285 | ) | (203 | ) | (22 | ) | (8 | ) | (56 | ) | |||||||||||
| Balance at end of period | $ | 531 | $ | 473 | $ | 758 | $ | 445 | $ | 467 | $ | 475 | |||||||||||
Goodwill, Intangible Assets, Long-Lived Assets and Impairment Assessments
Goodwill and indefinite-lived intangible assets are carried at cost and are evaluated annually for impairment, or more frequently if circumstances exist that indicate that impairment may exist. When conducting our annual goodwill impairment assessment, we perform a quantitative evaluation of whether goodwill is impaired using the two-step impairment test. The first step isby comparing the fair value of our reporting unit to its carrying value. We consider the enterprise to be the reporting unit for this analysis. If step one indicates that impairment potentially exists, the second step is performed to measure thecarrying amount of impairment, if any. We record the amount by which the carrying value of the goodwillour reporting unit exceeds its implied fair value, if any,we recognize an impairment loss in an amount equal to that excess, limited to the total amount of goodwill allocated to that reporting unit.
In-process research and development is initially capitalized at fair value as impairment.an intangible asset with an indefinite life and assessed for impairment thereafter. When in-process research and development projects are completed, the corresponding amount is reclassified as an amortizable intangible asset and is amortized over the asset’s estimated useful life.
Finite-lived intangible assets are amortized over their useful lives. Each period we evaluate the estimated remaining useful life of our finite-lived intangible assets and whether events or changes in circumstances warrant a revision to the remaining period of amortization. The carrying amountsIn addition, we evaluate the recoverability of theseour long-lived assets are periodically reviewedincluding intangible and tangible assets for impairment whenever events or changes in circumstances indicate that the carrying value of these assets may not be recoverable. Recoverability of these assets is measured by comparison of the carrying amount of each asset to the future undiscounted cash flows the asset is expected to generate. If the undiscounted cash flows used in the test for recoverability are less than the carrying amount of these assets, then the carrying amount of such assets is reduced to fair value.
78
NOTES TO CONSOLIDATED FINANCIAL STATEMENTS
Property and Equipment
Property and equipment are stated at cost net of accumulated depreciation.depreciation and amortization. Depreciation is calculated using the straight-line method over the estimated useful lives of the assets ranging from generally three to five years. Leasehold improvements are amortized over the shorter of the estimated useful life or the remaining lease term. When assets are retired or disposed of, the cost and accumulated depreciation are removed from the accounts, and any resulting gains or losses are included in the consolidated statements of operations. Maintenance and repairs that do not improve or extend the lives of the respective assets are charged to expense in the period incurred.
The following table presents the estimated useful lives of our property and equipment:
| Property and Equipment | Useful Life | |
| Computer equipment and software | 3 years | |
| Furniture and fixtures | 5 years | |
| Leasehold improvements | Shorter of the useful life of the asset or the lease term | |
Capitalized Software Development Costs
Capitalization of software development costs for software to be sold, leased, or otherwise marketed begins upon the establishment of technological feasibility, which is generally the completion of a working prototype that has been certified as having no critical bugs and is a release candidate. Amortization begins once the software is ready for its intended use, generally based on the pattern in which the economic benefits will be consumed. We did not capitalize any internal software development costs for fiscal 20162019 and 20152018 because the cost incurred and the time between technological feasibility and product release was insignificant. We had no amortization expense from capitalized purchased technology during fiscal 2016, 20152019, 2018 or 2014.2017.
Costs related to software acquired, developed or modified solely to meet our internal requirements, with no substantive plans to market such software at the time of development, are capitalized. Costs incurred during the preliminary planning and evaluation stage of the project and during post implementation operational stage are expensed as incurred. Costs incurred during the application development stage of the project are capitalized. We define the design, configuration, and coding process as the application development stage. We did not capitalize any costsCosts related to computer software developed for internal use in fiscal 20162019 or 2015. During the third quarter of fiscal 2014, we recognized a $2.1 million impairment charge for the remaining balance of the previously capitalized Storm software development costs as a result of our decision to make Splunk Storm available to customers at no cost.2018 were not material.
We primarily lease our facilities under operating leases. For leases that contain rent escalation or rent concession provisions, we record the total rent expense during the lease term on a straight-line basis over the term of the lease. We record the difference between the rent paid and the straight-line rent expense as a current and non-current deferred rent liability in Accrued“Accrued expenses and other liabilitiesliabilities” and Other“Other liabilities, non-current,” respectively, on the consolidated balance sheets. Rent expense for our operating leases was $12.8$26.2 million, $10.5$16.8 million and $6.4$28.1 million during fiscal 2016, 20152019, 2018 and 2014,2017, respectively.
Facility Exit Costs
Certain of our operating facility leases include office space that is not occupied or used by us. We calculate and record a liability at the “cease-use” date related to those operating leases based on the difference between the present value of estimated future sublease rental income and the present value of our remaining lease obligations, adjusted for the effects of any prepaid or deferred items. The short-term portion of the liability is recorded in “Accrued expenses and other liabilities” and the long-term portion of the liability is recorded in “Other liabilities, non-current,” on the consolidated balance sheets. Associated with the recognition of the liability, we also record a corresponding charge to “General and administrative” expenses in the consolidated statements of operations.
Advertising Expense
We expense advertising costs as incurred. We incurred $13.3$17.3 million, $8.4$10.1 million and $6.3$10.0 million in advertising expenses for fiscal 2016, 20152019, 2018 and 2014,2017, respectively. Advertising costs are recorded in sales“Sales and marketingmarketing” expenses in the consolidated statements of operations.
79
Stock-Based Compensation
We recognize compensation expense for all share-based payment awards, including stock options, restricted stock units (“RSUs”), performance units (“PSUs”) and restricted stock awards (“RSAs”), based on the estimated fair value of the award on the grant date in the consolidated statements of operations over the related vesting periods. The expense recorded is based on awards ultimately expected to vest and therefore is reduced by estimated forfeitures. Forfeitures are estimated at the time of grant and revised, if necessary, in subsequent periods if actual forfeitures differ from those estimates. We calculate the fair value of options using the Black-Scholes method and expense using the straight-line attribution approach.
We account for equity awards issued to non-employees, such as consultants, in accordance with the guidance relating to equity instruments that are issued to other than employees for acquiring, or in conjunction with selling, goods or services, using the Black-Scholes method to determine the fair value of such instruments. Awards granted to non-employees are remeasured over the vesting period, and the resulting value is recorded as an expense over the period the services are received.
The fair value of each option grant and stock purchase right granted under the Employee Stock Purchase Plan (“ESPP”) wasis estimated on the date of grant using the Black-Scholes option pricing model. We recognize stock-based compensation expense related to our ESPP on a straight-line basis over the offering period, which is twelve months. Stock-based compensation expense is recognized net of estimated forfeiture activity.
The determination of the grant date fair value of options using an option-pricing model is affected by assumptions regarding a number of other complex and subjective variables, which include our expected stock price volatility over the expected term of the options, stock option exercise and cancellation behaviors, risk-free interest rates and expected dividends.
The number of PSUs earned and eligible to vest will beare determined based on achievement of certain company financial performance measuresconditions and/or market conditions and the recipient’srecipients’ continued service with us. TheFor awards subject to service and performance conditions, the number of shares of our stock issued pursuant to be received at vestingthe award can range from 0% to 200% of the target amount. For awards subject to service and performance conditions that also include market conditions, the number of shares of our stock issued pursuant to the award can range from 0% to 300% of the target amount. Compensation expense for PSUs with performance conditions is measured using the fair value at the date of grant and recorded over the vesting period under the graded-vesting attribution method, and may be adjusted over the vesting period based on interim estimates of performance against the pre-set objectives.
Income Taxes
Income taxes are accounted for under the asset and liability method in accordance with authoritative guidance for income taxes. Deferred tax assets and liabilities are recognized for the future tax consequences attributable to differences between the financial statement carrying amounts of existing assets and liabilities and their respective tax basis and operating loss and tax credit carry forwards. Deferred tax assets and liabilities are measured using enacted tax rates expected to apply to taxable income in the years in which those temporary differences are expected to be recovered or settled. The effect on deferred tax assets and liabilities of a change in tax rates is recognized in income in the period that includes the enactment date.
The guidance on accounting for uncertainty in income taxes requires us to identify, evaluate and measure all uncertain tax positions taken or to be taken on tax returns and to record liabilities for the amount of these positions that may not be sustained, or may only partially be sustained, upon examination by the relevant taxing authorities. Although we believe that our estimates and judgments were reasonable, actual results may differ from these estimates. Some or all of these judgments are subject to review by the taxing authorities.
| Standard | Description | Effective Date | Effect on the Consolidated Financial Statements (or Other Significant Matters) | |||
| ASU No. 2018-07 (Topic 718), Compensation - Stock Compensation: Improvements to Nonemployee Share-Based Payment Accounting | Under the new standard, entities will no longer be required to value non-employee share-based payment awards differently from employee awards. Upon transition, entities are required to measure non-employee awards at their grant-date fair value as of the adoption date. | We early adopted this new standard as of August 1, 2018. | The adoption of this new standard did not have a material impact on our consolidated financial statements. | |||
| ASU No. 2017-09 (Topic 718), Scope of Modification Accounting | The new standard clarifies when changes to the terms or conditions of a share-based payment award must be accounted for as modifications. | We adopted this new standard as of February 1, 2018. | The adoption of this new standard did not have an impact on our consolidated financial statements. | |||
| ASU No. 2017-01 (Topic 805), Business Combinations - Clarifying the Definition of a Business | The new standard narrows the application of when an integrated set of assets and activities is considered a business and provides a framework to assist entities in evaluating whether both an input and a substantive process are present to be considered a business. | We adopted this new standard as of February 1, 2018. | We anticipate that the adoption of the new guidance will result in more transactions being accounted for as asset acquisitions rather than business combinations and that the new standard will impact our consideration of strategic investments. The adoption of this new standard did not have an impact on our consolidated financial statements. | |||
| ASU No. 2016-16 (Topic 740), Income Taxes: Intra-Entity Transfers of Assets Other Than Inventory | The standard includes a revision of the accounting for the income tax consequences of intra-entity transfers of assets other than inventory to reduce the complexity in accounting standards. | We adopted this new standard as of February 1, 2018. | An immaterial cumulative effect adjustment was recorded in accumulated deficit as of February 1, 2018. | |||
| ASU No. 2016-01 (Subtopic 825-10), Financial Instruments - Overall | The amendments in this update, and recent clarifications issued by the FASB through ASU No. 2018-03 and ASU No. 2018-04, address certain aspects of recognition, measurement, presentation and disclosure of financial instruments, and require equity securities to be measured at fair value with changes in fair value recognized through net income. | We adopted this new standard as of February 1, 2018 on a prospective basis. | As part of the adoption, we elected to apply the measurement alternative for our non-marketable equity investments that do not have readily determinable fair values, measuring them at cost, less any impairment, plus or minus adjustments resulting from observable price changes in orderly transactions for the identical or a similar investment of the same issuer. The adoption of these standards did not result in an adjustment for our non-marketable equity investments. | |||
81
| ASU No. 2014-09 (Topic 606), Revenue from Contracts with Customers | The new standard supersedes the revenue recognition requirements in Accounting Standards Codification 605, Revenue Recognition and establishes a new revenue standard. This new standard is based on the principle that revenue is recognized to depict the transfer of control of goods or services to customers in an amount that reflects the consideration to which the entity expects to be entitled to in exchange for those goods or services. The standard also requires additional disclosures about the nature, amount, timing and uncertainty of revenues and cash flows arising from customer contracts, including significant judgments and changes in judgments, and assets recognized from costs incurred to obtain or fulfill a contract. The FASB has also issued several amendments to the new standard which were designed to clarify and simplify the adoption process. | We adopted Topic 606 as of February 1, 2018 using the full retrospective method, which required us to adjust our historical financial information for fiscal years 2017 and 2018 to be consistent with the new standard. | In preparation for adoption of the new standard, we updated our accounting policies, systems, internal controls and processes. The most significant impacts of the standard relate to the timing of revenue recognition for arrangements involving term licenses, deferred revenue and sales commissions. Under the new revenue standard, we are required to recognize term license revenues upon the transfer of the license and the associated maintenance revenues over the contract period. Additionally, some deferred revenue, primarily from arrangements involving term licenses, was never recognized as revenue and instead is now a part of the cumulative effect adjustment within accumulated deficit. Finally, we are required to capitalize and amortize incremental costs of obtaining a contract, such as certain sales commission costs, over the remaining contractual term or over an expected period of benefit, which we have determined to be approximately five years. We applied the following practical expedients permitted under Topic 606. For all reporting periods presented before the date of initial adoption, we have elected not to disclose the amount of the transaction price allocated to the remaining performance obligations or provide an explanation of when we expect to recognize that amount as revenue. Additionally, we have also elected not to separately evaluate each contract modification that occurred before the initial adoption date. We have elected not to assess whether a contract has a significant financing component if we expect at contract inception that the period between payment and the transfer of products or services will be one year or less. | |||
82
The following tables present the impact of the new standard (Topic 606) to the reported results on our selected consolidated financial statements.balance sheet data and selected consolidated statements of operations data:
| Fiscal Year Ended January 31, 2018 | ||||||||||||
| (In thousands, except per share amounts) | As Reported | Impact of Adoption | As Adjusted | |||||||||
| Revenues | ||||||||||||
| License | $ | 693,704 | $ | 47,598 | $ | 741,302 | ||||||
| Maintenance and services | 577,084 | (9,254 | ) | 567,830 | ||||||||
| Total revenues | 1,270,788 | 38,344 | 1,309,132 | |||||||||
| Gross profit | 1,014,379 | 38,344 | 1,052,723 | |||||||||
| Operating expenses | ||||||||||||
| Sales and marketing | 808,417 | (30,541 | ) | 777,876 | ||||||||
| Operating loss | (254,295 | ) | 68,885 | (185,410 | ) | |||||||
| Net loss | $ | (259,103 | ) | $ | 68,885 | $ | (190,218 | ) | ||||
| Basic and diluted net loss per share | $ | (1.85 | ) | $ | 0.49 | $ | (1.36 | ) | ||||
| Fiscal Year Ended January 31, 2017 | ||||||||||||
| (In thousands, except per share amounts) | As Reported | Impact of Adoption | As Adjusted | |||||||||
| Revenues | ||||||||||||
| License | $ | 546,925 | $ | (3,415 | ) | $ | 543,510 | |||||
| Maintenance and services | 403,030 | (2,976 | ) | 400,054 | ||||||||
| Total revenues | 949,955 | (6,391 | ) | 943,564 | ||||||||
| Gross profit | 758,902 | (6,391 | ) | 752,511 | ||||||||
| Operating expenses | ||||||||||||
| Sales and marketing | 653,524 | (14,120 | ) | 639,404 | ||||||||
| Operating loss | (343,831 | ) | 7,729 | (336,102 | ) | |||||||
| Net loss | $ | (355,189 | ) | $ | 7,729 | $ | (347,460 | ) | ||||
| Basic and diluted net loss per share | $ | (2.65 | ) | $ | 0.06 | $ | (2.59 | ) | ||||
Selected Consolidated Balance Sheet Data
| January 31, 2018 | ||||||||||||
| (In thousands) | As previously reported | Impact of Adoption | As Adjusted | |||||||||
| Assets | ||||||||||||
| Accounts receivable, net | $ | 391,799 | $ | 4,614 | $ | 396,413 | ||||||
| Deferred commissions, current | — | 52,451 | 52,451 | |||||||||
| Deferred commissions, non-current | — | 37,920 | 37,920 | |||||||||
| Liabilities and Stockholders’ Equity | ||||||||||||
| Accrued expenses and other liabilities | 77,160 | 7,471 | 84,631 | |||||||||
| Deferred revenue, current | 635,253 | (145,340 | ) | 489,913 | ||||||||
| Deferred revenue, non-current | 269,954 | (91,162 | ) | 178,792 | ||||||||
| Accumulated deficit | (1,279,887 | ) | 324,016 | (955,871 | ) | |||||||
The adoption of Topic 606 had no impact to cash provided by or used in Accounting Standards Codification 605, Revenue Recognition. This ASU is based on the principle that revenue is recognized to depict the transfer of goodsoperating, financing, or services to customersinvesting activities in an amount that reflects the consideration to which the entity expects to be entitled in exchange for those goods or services. The ASU also requires additional disclosure about the nature, amount, timing and uncertainty of revenues and cash flows arising from customer contracts, including significant judgments and changes in judgments and assets recognized from costs incurred to obtain or fulfill a contract. In August 2015, the FASB issued ASU No. 2015-14, which provides a one-year deferral in the effective date of ASU No. 2014-09. Early adoption will be permitted, but not earlier than the original effective date for annual and interim periods. In accordance with the deferral, the effective date applicable to us will be the first quarter of fiscal 2019. We have not yet selected a transition method and we are currently evaluating the effect that the updated standard will have on our consolidated financial statements and related disclosures.of cash flows.
83
Recently Issued Accounting Pronouncements
| Standard | Description | Effective Date | Effect on the Consolidated Financial Statements (or Other Significant Matters) | |||
| ASU No. 2018-15 (Subtopic 350-40), Intangibles - Goodwill and Other - Internal-Use Software: Customer’s Accounting for Implementation Costs Incurred in a Cloud Computing Arrangement That Is a Service Contract | The standard aligns the requirements for capitalizing implementation costs in a cloud computing arrangement service contract with the requirements for capitalizing implementation costs incurred for an internal-use software license. | First quarter of fiscal 2021, although early adoption is permitted. | We are currently evaluating whether the adoption of this standard will have a material impact on our consolidated financial statements. | |||
| ASU No. 2018-13 (Topic 820), Fair Value Measurement: Disclosure Framework - Changes to the Disclosure Requirements for Fair Value Measurement | The new standard no longer requires disclosure of the amount and reasons for transfers between Level 1 and Level 2 of the fair value hierarchy, but public companies will be required to disclose the range and weighted-average used to develop significant unobservable inputs for Level 3 fair value measurements. | First quarter of fiscal 2020, and although early adoption is permitted, we did not early adopt. | We do not expect a material impact on our consolidated financial statements upon adoption. | |||
| ASU No. 2016-13 (Topic 326), Financial Instruments - Credit Losses | The amendments in this update require a financial asset (or a group of financial assets) measured at an amortized cost basis to be presented at the net amount expected to be collected. The new approach to estimating credit losses (referred to as the current expected credit losses model) applies to most financial assets measured at amortized cost and certain other instruments, including trade and other receivables, loans and held-to-maturity debt securities. In November 2018, the FASB issued ASU No. 2018-19, Codification Improvements to Topic 326, Financial Instruments - Credit Losses, which clarifies codification and corrects unintended application of the guidance. | First quarter of fiscal 2021, although early adoption is permitted. | We are currently evaluating whether the adoption of this standard will have a material impact on our consolidated financial statements. | |||
| ASU No. 2016-02 (Topic 842), Leases | The new standard supersedes the lease recognition requirements in ASC Topic 840, Leases. The standard requires an entity to recognize right-of-use assets and lease liabilities arising from a lease for operating leases, initially measured at the present value of the lease payments on the consolidated balance sheets. The impact of such leases on the consolidated statements of operations and cash flows will continue to be treated in a similar manner under current GAAP. The standard also requires additional qualitative and quantitative disclosures. In July 2018, the FASB issued ASU No. 2018-10, Codification Improvements to Topic 842, Leases, which clarifies the codification or corrects unintended application of the guidance. | First quarter of fiscal 2020, and may be applied retrospectively to each prior period presented or, as amended by ASU No. 2018-11, with the cumulative-effect recognized as of the date of initial application. | We adopted Topic 842 as of February 1, 2019 using the cumulative effect transition method. As is allowed by the new standard, we have elected to account for lease and non-lease components as a single lease component. We have also elected to exclude leases that, at the lease commencement date, have a lease term of 12 months or less from the balance sheet. In preparation for adoption of the new standard we have updated our accounting policies, systems, processes and internal controls, and have allocated internal and external resources to assist in our implementation efforts. We have substantially completed the review of our existing population of lease contracts and we expect that the adoption of Topic 842 will result in the recognition of right of use assets and a net increase in liabilities of approximately $190 million to $210 million at February 1, 2019. We also expect an impact to our opening accumulated deficit of approximately $7.9 million related to the derecognition of build-to-suit lease assets and liabilities. | |||
(2) Investments and Fair Value Measurements
84
The carrying amounts of certain of our financial instruments including cash equivalents, accounts receivable, accounts payable and accrued liabilities approximate fair value due to their short-term maturities.
Assets and liabilities recorded at fair value in the financial statements are categorized based upon the level of judgment associated with the inputs used to measure their fair value. Hierarchical levels that are directly related to the amount of subjectivity associated with the inputs to the valuation of these assets or liabilities are as follows:
Level 1—Observable inputs, such as quoted prices in active markets for identical assets or liabilities.
Level 2—Observable inputs other than Level 1 prices such as quoted prices for similar assets or liabilities, quoted prices in markets that are not active, or other inputs that are observable or can be corroborated by observable market data for substantially the full term of the assets or liabilities.
Level 3—Unobservable inputs that are supported by little or no market activity and that are significant to the fair value of the assets or liabilities.
Assets and liabilities measured at fair value are classified in their entirety based on the lowest level of input that is significant to the fair value measurement. Our assessment of the significance of a particular input to the fair value measurement in its entirety requires management to make judgments and consider factors specific to the asset or liability.
The following table sets forth the fair value of our financial assets and liabilities that were measured on a recurring basis as of January 31, 2016 and 2015 (in thousands):
basis:
| January 31, 2016 | January 31, 2015 | January 31, | ||||||||||||||||||||||||||||||||||||||||||||||||||||||||||||||
| Level 1 | Level 2 | Level 3 | Total | Level 1 | Level 2 | Level 3 | Total | 2019 | 2018 | |||||||||||||||||||||||||||||||||||||||||||||||||||||||
| (In thousands) | Level 1 | Level 2 | Level 3 | Total | Level 1 | Level 2 | Level 3 | Total | ||||||||||||||||||||||||||||||||||||||||||||||||||||||||
| Assets: | �� | |||||||||||||||||||||||||||||||||||||||||||||||||||||||||||||||
| Money market funds | $ | 374,571 | $ | — | $ | — | $ | 374,571 | $ | 374,682 | $ | — | $ | — | $ | 374,682 | $ | 46,311 | $ | — | $ | — | $ | 46,311 | $ | 341,687 | $ | — | $ | — | $ | 341,687 | ||||||||||||||||||||||||||||||||
| U.S. treasury securities | — | 607,892 | — | 607,892 | — | 627,931 | — | 627,931 | — | 980,940 | — | 980,940 | — | 619,203 | — | 619,203 | ||||||||||||||||||||||||||||||||||||||||||||||||
| Other | — | — | 1,500 | 1,500 | — | — | — | — | — | — | 4,744 | 4,744 | — | — | — | — | ||||||||||||||||||||||||||||||||||||||||||||||||
| Reported as: | ||||||||||||||||||||||||||||||||||||||||||||||||||||||||||||||||
| Assets: | ||||||||||||||||||||||||||||||||||||||||||||||||||||||||||||||||
| Cash and cash equivalents | $ | 397,965 | $ | 374,682 | $ | 46,311 | $ | 341,687 | ||||||||||||||||||||||||||||||||||||||||||||||||||||||||
| Investments, current portion | 584,498 | 462,849 | 881,220 | 619,203 | ||||||||||||||||||||||||||||||||||||||||||||||||||||||||||||
| Investments, non-current | 1,500 | 165,082 | 104,463 | — | ||||||||||||||||||||||||||||||||||||||||||||||||||||||||||||
| Total | $ | 983,963 | $ | 1,002,613 | $ | 1,031,994 | $ | 960,890 | ||||||||||||||||||||||||||||||||||||||||||||||||||||||||
Our investments in money market funds are measured at fair value on a recurring basis. These money market funds are actively traded and reported daily through a variety of sources. The fair value of the money market fund investments is classified as Level 1.
We invested in U.S. treasury securities during the fiscal yearyears ended January 31, 20162019 and 2015,2018, which we have classified as available-for-sale securities. The following table presents our available-for-sale investments as of January 31, 2016 (in thousands):
2019:
| January 31, 2016 | ||||||||||||||||
| Amortized Cost | Unrealized Gains | Unrealized Losses | Fair Value | |||||||||||||
| Cash and cash equivalents: | ||||||||||||||||
| U.S. treasury securities | $ | 23,399 | $ | — | $ | (5 | ) | $ | 23,394 | |||||||
| Investments, current portion: | ||||||||||||||||
| U.S. treasury securities | 584,554 | 158 | (214 | ) | 584,498 | |||||||||||
| Total available-for-sale investments | $ | 607,953 | $ | 158 | $ | (219 | ) | $ | 607,892 | |||||||
| (In thousands) | Amortized Cost | Unrealized Gains | Unrealized Losses | Fair Value | ||||||||||||
| Investments, current: | ||||||||||||||||
| U.S. treasury securities | $ | 881,206 | $ | 131 | $ | (117 | ) | $ | 881,220 | |||||||
| Investments, non-current: | ||||||||||||||||
| U.S. treasury securities | 99,597 | 134 | (11 | ) | 99,720 | |||||||||||
| Total available-for-sale investments in U.S. treasury securities | $ | 980,803 | $ | 265 | $ | (128 | ) | $ | 980,940 | |||||||
The following table presents our available-for-sale investments as of January 31, 2015 (in thousands): 2018:
85
| January 31, 2015 | ||||||||||||||||
| Amortized Cost | Unrealized Gains | Unrealized Losses | Fair Value | |||||||||||||
| Cash and cash equivalents: | ||||||||||||||||
| U.S. treasury securities | $ | 462,831 | $ | 52 | $ | (34 | ) | $ | 462,849 | |||||||
| Investments, current portion: | ||||||||||||||||
| U.S. treasury securities | 165,098 | 45 | (61 | ) | 165,082 | |||||||||||
| Total available-for-sale investments | $ | 627,929 | $ | 97 | $ | (95 | ) | $ | 627,931 | |||||||
| (In thousands) | Amortized Cost | Unrealized Gains | Unrealized Losses | Fair Value | ||||||||||||
| Investments, current: | ||||||||||||||||
| U.S. treasury securities | $ | 620,345 | $ | — | $ | (1,142 | ) | $ | 619,203 | |||||||
| Total available-for-sale investments in U.S. treasury securities | $ | 620,345 | $ | — | $ | (1,142 | ) | $ | 619,203 | |||||||
The following table represents the fair values and unrealized losses of our available-for-sale investments classified by length of time that the securities have been in a continuous unrealized loss position:
| Less than 12 Months | 12 Months or Greater | Total | ||||||||||||||||||||||
| (In thousands) | Fair Value | Unrealized Losses | Fair Value | Unrealized Losses | Fair Value | Unrealized Losses | ||||||||||||||||||
| January 31, 2019: | ||||||||||||||||||||||||
| U.S. treasury securities | $ | 582,761 | $ | (128 | ) | $ | — | $ | — | $ | 582,761 | $ | (128 | ) | ||||||||||
| January 31, 2018: | ||||||||||||||||||||||||
| U.S. treasury securities | $ | 619,203 | $ | (1,142 | ) | $ | — | $ | — | $ | 619,203 | $ | (1,142 | ) | ||||||||||
As of January 31, 2016, the following marketable securities were in an unrealized loss position (in thousands):
| Less than 12 Months | 12 Months or Greater | Total | ||||||||||||||||||||||
| Fair Value | Unrealized Losses | Fair Value | Unrealized Losses | Fair Value | Unrealized Losses | |||||||||||||||||||
| U.S. treasury securities | $ | 212,532 | $ | (138 | ) | $ | 164,298 | $ | (81 | ) | $ | 376,830 | $ | (219 | ) | |||||||||
| Less than 12 Months | 12 Months or Greater | Total | ||||||||||||||||||||||
| Fair Value | Unrealized Losses | Fair Value | Unrealized Losses | Fair Value | Unrealized Losses | |||||||||||||||||||
| U.S. treasury securities | $ | 354,592 | $ | (95 | ) | $ | — | $ | — | $ | 354,592 | $ | (95 | ) | ||||||||||
The contractual maturities of our investments are as follows (in thousands):follows:
| January 31, 2016 | ||||||||
| (In thousands) | January 31, 2019 | |||||||
| Due within one year | $ | 607,892 | $ | 881,220 | ||||
| Due within one to two years | 99,720 | |||||||
| Total | $ | 607,892 | $ | 980,940 | ||||
Investments with maturities of less than 12 months from the balance sheet date are classified as current assets, which are available for use to fund current operations. Investments with maturities greater than 12 months from the balance sheet date are classified as long-term assets.
Refer to Note 7 “Convertible Senior Notes” for details regarding the fair value of our convertible senior notes.
Equity Investments
Our equity investments are reported in “Investments, non-current” in our consolidated balance sheets. The following table provides a summary of our equity investments:
| January 31, | ||||||||
| (In thousands) | 2019 | 2018 | ||||||
| Equity investments without readily determinable fair values | $ | 5,000 | $ | 5,000 | ||||
| Equity investments under the equity method of accounting | 1,125 | 375 | ||||||
| Total | $ | 6,125 | $ | 5,375 | ||||
(3) Commitments and Contingencies
Operating Lease Commitments
We lease our office spaces under non-cancelable leases. Rent expense, net of sublease income, for our operating leases was $26.2 million, $16.8 million and $28.1 million during fiscal 2019, 2018 and 2017, respectively. Rent expense includes a decrease of $5.2 million of expense for fiscal 2018, and an increase of $8.6 million of expense for fiscal 2017, in connection with facility exit charge adjustments. Refer to “Facility Exit Costs” below for details.
86
On August 24, 2015,15, 2018, we entered into an office lease at 3060 Olsen Drive for approximately 235,000300,000 square feet located at 500 Santana Row,in San Jose, California. This lease is expected to commence in the fourth quarter of fiscal 20172020 for a term of 10 years and nine130 months, subject to the completion of certain pre-occupancy improvements by our landlord. Our total obligation for the base rent will be approximately $162.6 million.
On June 18, 2018, we renewed our office lease at 250 Brannan Street for approximately 100,000 square feet located in San Francisco, California. This lease is expected to commence in the first quarter of fiscal 2020 for a term of 147 months. Our total obligation for the base rent will be approximately $120.5$137.6 million.
The following summarizes our operating lease commitments as of January 31, 2019:
| Payments Due by Period | ||||||||||||||||||||
| (In thousands) | Total | Less Than 1 year | 1-3 years | 3-5 years | More Than 5 years | |||||||||||||||
Operating lease commitments (1) | $ | 465,807 | $ | 30,976 | $ | 96,321 | $ | 84,654 | $ | 253,856 | ||||||||||
_________________________
(1) | We have entered into sublease agreements for portions of our office space and the future rental income of $2.3 million from these agreements has been included as an offset to our future minimum rental payments. |
Facility Exit Costs
In fiscal 2017, we relocated certain corporate offices in the San Francisco Bay Area and as a result, some of our leased office spaces are no longer in use. Accordingly, we calculated and recorded a liability at the "cease-use" date. We recorded a facility exit charge of approximately $8.6 million to “General and administrative” expenses associated with the recognition of the liability.
Cease-use liability balances are presented below:
| (In thousands) | Carrying amount | |||
| Balance as of January 31, 2017 | $ | 8,625 | ||
Facility exit charge - adjustment (revision of estimated sublease income) (1) | (5,191 | ) | ||
| Cash payments, net of deferred rent | (3,114 | ) | ||
| Balance as of January 31, 2018 | $ | 320 | ||
| Cash payments, net of deferred rent | (204 | ) | ||
| Balance as of January 31, 2019 | $ | 116 | ||
_________________________
(1) | During fiscal 2018 we entered into sublease agreements for our office spaces that are no longer in use by us. As a result, we made an adjustment to our estimated future sublease rental income related to our cease-use liability. |
Financing Lease Obligation
On April 29, 2014, we entered into an office lease (the “Lease”) for approximately 182,000 square feet located at 270 Brannan Street, San Francisco, California (the “Premises”). The Premises will beis allocated tobetween the “Initial Premises” and “Additional Premises,” which are each approximately 95,00091,000 square feet of rentable space (the “Initial Premises”) and approximately 87,000 square feet of rentable space (the “Additional Premises”). We expect to occupy the Premises in the first quarter of fiscal 2017.space. The term of the Additional Premises begins one year after the term of the Initial Premises, which began in August 2015, and each have a term of 84 months. Our total obligation for the base rent is approximately $92.0 million. On May 13, 2014, we entered into an irrevocable, standby letter of credit with Silicon Valley Bank for $6.0 million to serve as a security deposit for the Lease.
As a result of our involvement during the construction period, whereby we havehad certain indemnification obligations related to the construction, we arewere considered, for accounting purposes only, the owner of the construction project under build-to-suit lease accounting. We have recorded estimated project construction costs incurred by the landlord as an asset and a corresponding long termlong-term liability in “Property and equipment, net” and “Other liabilities, non-current”non-current,” respectively, onin our consolidated balance sheets. We will increasemoved into the asset and corresponding long term liability as additional building costs are incurred by the landlord during the construction period. The landlord completed the construction of the Initial Premises in February 2016 and we2016. We have determined that the leaseLease does not meet the criteria for “sale-leaseback” treatment. We are currently evaluatingtreatment, due to our continuing involvement in the impactconstruction project resulting from our standby letter of this lease on our consolidated financial statements.credit. Accordingly, the Lease will continue to be accounted for as a financing obligation.
87
| Payments Due by Period* | ||||||||||||||||||||
| Total | Less Than 1 year | 1-3 years | 3-5 years | More Than 5 years | ||||||||||||||||
| (in thousands) | ||||||||||||||||||||
| Office lease obligations | $ | 265,505 | $ | 18,541 | $ | 66,724 | $ | 58,905 | $ | 121,335 | ||||||||||
Fiscal Period (In thousands) | Future Payments | |||
| Fiscal 2020 | $ | 12,928 | ||
| Fiscal 2021 | 13,316 | |||
| Fiscal 2022 | 13,715 | |||
| Fiscal 2023 | 14,127 | |||
| Fiscal 2024 | 7,667 | |||
| Thereafter | 475 | |||
| Total future minimum lease payments | $ | 62,228 | ||
Legal Proceedings
We are subject to certain routine legal and regulatory proceedings, as well as demands and claims that arise in the normal course of our business. We make a provision for a liability relating to legal matters when it is both probable that a liability has been incurred and the amount of the loss can be reasonably estimated. These provisions are reviewed at least quarterly and adjusted to reflect the impact of negotiations, estimated settlements, legal rulings, advice of legal counsel and other information and events pertaining to a particular matter. In our opinion, resolution of any pending claims (either
individually or in the aggregate) is not expected to have a material adverse impact on our consolidated results of operations, cash flows or financial position, nor is it possible to provide an estimated amount of any such loss. However, depending on the nature and timing of any such dispute, an unfavorable resolution of a matter could materially affect our future financial position, results of operations or cash flows, or both,all, in a particular quarter.period.
Indemnification Arrangements
During the ordinary course of business, we may indemnify, hold harmless and agree to reimburse for losses suffered or incurred, our customers, vendors, and each of their affiliates for certain intellectual property infringement and other claims by third parties with respect to our offerings, in connection with our commercial license arrangements or related to general business dealings with those parties.
As permitted under Delaware law, we have entered into indemnification agreements with our officers, directors and certain employees, indemnifying them for certain events or occurrences while they serve as our officers or directors or those of our direct and indirect subsidiaries.
To date, there have not been any costs incurred in connection with such indemnification obligations; therefore, there is no accrual of such amounts at January 31, 2016.2019. We are unable to estimate the maximum potential impact of these indemnifications on our future results of operations.
(4) Property and Equipment
Property and equipment are stated at cost, net of accumulated depreciation and amortization. These assets are depreciated and amortized using the straight-line method over their estimated useful lives. Property and equipment consisted of the following (in thousands):
following:
| As of January 31, | January 31, | |||||||||||||||
| 2016 | 2015 | |||||||||||||||
| (In thousands) | 2019 | 2018 | ||||||||||||||
| Computer equipment and software | $ | 43,883 | $ | 28,342 | $ | 79,887 | $ | 69,457 | ||||||||
| Furniture and fixtures | 13,398 | 7,707 | 18,872 | 18,090 | ||||||||||||
| Leasehold improvements (1) | 41,028 | 10,146 | ||||||||||||||
| Construction in progress (2) | 72,186 | 29,360 | ||||||||||||||
| 170,495 | 75,555 | |||||||||||||||
Leasehold and building improvements (1) | 79,064 | 67,348 | ||||||||||||||
Building (2) | 82,250 | 82,250 | ||||||||||||||
| Property and equipment, gross | 260,073 | 237,145 | ||||||||||||||
| Less: accumulated depreciation and amortization | (35,500 | ) | (25,181 | ) | (101,797 | ) | (76,265 | ) | ||||||||
| Property and equipment, net | $ | 134,995 | $ | 50,374 | $ | 158,276 | $ | 160,880 | ||||||||
_________________________
(1) | Includes costs related to assets not yet placed into service of $11.3 million and $2.8 million, as of January 31, 2019 and 2018, respectively. |
(2) | This relates to the capitalization of construction costs in connection with our financing lease obligation, where we are considered the owner of the asset, for accounting purposes only. There is a corresponding long-term liability for this obligation on our consolidated balance sheets under “Other liabilities, non-current.” Refer to Note 3 “Commitments and Contingencies” for details. |
Depreciation and insider security threats.amortization expense on Property and Equipment, net was $27.0 million, $26.1 million and $22.8 million for the fiscal years ended January 31, 2019, 2018 and 2017, respectively. Included in depreciation and amortization expense for the fiscal year ended January 31, 2017 is $2.7 million of expense related to the acceleration of depreciation on certain property and equipment due to the “cease-use” of certain operating facility leases.
Geographic information
The following table presents our property and equipment, net depreciation and amortization, by geographic region:
| January 31, | ||||||||
| (In thousands) | 2019 | 2018 | ||||||
| United States | $ | 147,659 | $ | 153,335 | ||||
| International | 10,617 | 7,545 | ||||||
| Total property and equipment, net | $ | 158,276 | $ | 160,880 | ||||
Other than the United States, no country represented 10% or more of our total property and equipment as of January 31, 2019 or 2018.
(5) Acquisitions, Goodwill and Intangible Assets
VictorOps
On June 22, 2018, we acquired 100% of the voting equity interest of VictorOps, Inc. (“VictorOps”), a privately-held Delaware corporation that develops incident management solutions for the IT and DevOps markets. This acquisition has been accounted for as a business combination. The purchase price of $128.4$112.3 million, paid in cash of $108.8 million and $3.5 million in fair value of replacement equity awards attributable to pre-acquisition service, was preliminarily allocated as follows: $45.8$21.1 million to identifiableidentified intangible assets, $11.4 million to net deferred tax liability and $1.2$1.7 million to net assets acquired, with the excess $92.8$89.5 million of the purchase price over the fair value of net tangible and intangible assets acquired recorded as goodwill, allocated to our one operating segment. Goodwill is primarily attributable to the value expected from the synergies of the combination, including combined selling opportunities with our offerings as well as our ability to sell into the security market.products. This goodwill is not deductible for income tax purposes. The results of operations of Caspida,VictorOps, which are not material, have been included in our consolidated financial statements from the date of purchase. We are still finalizing the allocation of the purchase price, which may be subject to change as additional information becomes available to us. Additionally, we recognized $1.7$2.7 million of acquisition-related costs as general and administrative expense onin our consolidated statements of operations.
Per the terms of the merger agreement with Caspida,VictorOps, certain unvested shares of stock and unvested stock options held by CaspidaVictorOps employees were canceled and exchanged for unvested restricted stock units and replacement stock options to purchase shares of our common stock under our 2012 Equity Incentive Plan. Additionally, certain shares of stock issued under share-based compensation awards held by key employees of CaspidaVictorOps were canceled and exchanged for unregistered restricted shares of our common stock subject to vesting. The portion of the fair value of $61.6the replacement equity awards associated with pre-acquisition service of VictorOps employees represented a component of the total purchase consideration, as discussed above. The remaining fair value of $7.6 million of these issued awards, which are subject to the recipient’srecipients’ continued service with us and thuswas excluded from the purchase price, will be recognized ratably as stock-based compensation expense over the required service period. We are still finalizing the allocation of the purchase price, which is subject to change as additional information becomes available to us.
The following table sets forth the components of identifiable intangible assets acquired and their estimated useful lives as of the date of acquisition (in thousands, except useful life):acquisition:
89
| Fair Value | Useful Life (months) | |||||
| Developed technology | $ | 44,300 | 72 | |||
| In-process research and development | 1,300 | Indefinite* | ||||
| Customer relationships | 190 | 36 | ||||
| Total intangible assets acquired | $ | 45,790 | ||||
| (In thousands, except useful life) | Fair Value | Useful Life (months) | ||||
| Developed technology | $ | 11,700 | 84 | |||
| Customer relationships | 9,400 | 60 | ||||
| Total intangible assets acquired | $ | 21,100 | ||||
Fiscal Year Ended January 31, | ||||||||
| 2016 | 2015 | |||||||
| Revenues | $ | 668,435 | $ | 450,875 | ||||
| Net loss | $ | (301,527 | ) | $ | (229,755 | ) | ||
| Basic and diluted net loss per share | $ | (2.38 | ) | $ | (1.92 | ) | ||
On June 23, 2015,April 6, 2018, we acquired 100% of the voting equity interest of Metafor Software Inc.Phantom Cyber Corporation (“Metafor”Phantom”), a privately-held British ColumbiaDelaware corporation whichthat develops technology that provides anomaly detectionsolutions for security orchestration, automation and behavioral analytics for IT operations.response. This acquisition has been accounted for as a business combination. The purchase price of $16.4$303.8 million, paid in
Per the terms of the merger agreement with Phantom, certain shares of stock issued under share-based compensation awards held by key employees of Phantom were canceled and exchanged for replacement equity awards consisting of unregistered restricted shares of our common stock subject to vesting. The portion of the fair value of the replacement equity awards associated with pre-acquisition service of Phantom's key employees represented a component of the total purchase consideration, as discussed above. The remaining fair value of $62.2 million of these issued awards, which are subject to the recipients’ continued service with us and thus excluded from the purchase price, will be recognized ratably as stock-based compensation expense over the required service period. We are still finalizing the allocation of the purchase price, which may beis subject to change as additional information becomes available to us.
The following table sets forth the components of identifiable intangible assets acquired and their estimated useful lives as of the date of acquisition (in thousands, except useful life):acquisition:
| Fair Value | Useful Life (months) | ||||||||||
| (In thousands, except useful life) | Fair Value | Useful Life (months) | |||||||||
| Developed technology | $ | 2,300 | 48 | $ | 34,400 | 84 | |||||
| Other acquired intangible assets | 370 | 36 | |||||||||
| Customer relationships | 9,700 | 60 | |||||||||
| Total intangible assets acquired | $ | 2,670 | $ | 44,100 | |||||||
The following unaudited pro forma information presents the combined results of operations as if the acquisitions of VictorOps and Phantom had been completed on February 1, 2017, the beginning of the comparable prior annual reporting period. The unaudited pro forma results include adjustments primarily related to the following: (i) amortization associated with preliminary estimates for the acquired intangible assets; (ii) recognition of post-acquisition stock-based compensation; (iii) acquisition-related costs incurred prior to the acquisitions and (iv) the associated tax impact of the acquisitions and these unaudited pro forma adjustments.
The unaudited pro forma results do not reflect any cost saving synergies from operating efficiencies or the effect of the incremental costs incurred from integrating these companies. Accordingly, these unaudited pro forma results are presented for informational purposes only and are not necessarily indicative of what the actual results of operations of the combined company would have been if the acquisitions had occurred at the beginning of the period presented, nor are they indicative of future results of operations:
90
| Fiscal Year Ended January 31, | ||||||||
| (In thousands, except per share amounts) | 2019 | 2018 | ||||||
| Revenue | $ | 1,811,629 | $ | 1,327,999 | ||||
| Net loss | $ | (284,673 | ) | $ | (244,636 | ) | ||
| Basic and diluted net loss per share | $ | (1.95 | ) | $ | (1.75 | ) | ||
Rocana
On DecemberOctober 6, 2013,2017, we acquired Cloudmeter,certain assets of Rocana, Inc. (“Rocana”), a privately-held Delaware corporation which developed technology that enables users to capture machine data directly from network traffic.develops analytics solutions for the IT market. This acquisition has been accounted for as a business combination. The purchase price of $21.0$30.2 million, paid in cash, was allocated as follows: $8.5$10.1 million to identifiable intangible assets, $0.6 million to net deferred tax liability recorded and $0.2 million to net liabilities assumed, andwith the excess $13.3$20.1 million of the purchase price over the fair value of net assets acquired was recorded as goodwill. This goodwill allocatedis primarily attributable to the value expected from the synergies of the combination, including advancing the analytics and machine learning capabilities of our one operating segment.products, and is deductible for income tax purposes. The results of operations of the acquired entity, which are not material, have been included in our consolidated financial statements from the date of purchase. Pro forma and historical results of operations of the acquired entity have not been presented as we do not consider the results to have a material effect on any of the periods presented in our consolidated statements of operations.
The following table sets forth the components of identifiable intangible assets acquired and their estimated useful lives as of the date of acquisition (in thousands, except useful life):
acquisition:
| Fair value | Useful Life (months) | |||||
| Developed technology | $ | 7,330 | 48 | |||
| In-process research and development | 500 | Indefinite* | ||||
| Customer relationships | 160 | 36 | ||||
| Other acquired intangible assets | 480 | 24-36 | ||||
| Total intangible assets subject to amortization | $ | 8,470 | ||||
| (In thousands, except useful life) | Fair Value | Useful Life (months) | ||||
| Developed technology | $ | 8,320 | 36 | |||
| Other acquired intangible assets | 1,790 | 24 | ||||
| Total intangible assets acquired | $ | 10,110 | ||||
On September 25, 2013,29, 2017, we acquired BugSense,100% of the voting equity interest of SignalSense Inc. (“SignalSense”), a privately-held Delawareprivately held Washington corporation which developedthat develops cloud-based data collection and offered as a service an analytics solution forbreach detection solutions that leverage machine data generated by mobile devices.learning. This acquisition has been accounted for as a business combination. The purchase price of $9.0$12.2 million, paid in cash, was allocated as follows: $4.7$11.3 million to identifiable intangible assets $0.7acquired, $0.2 million in net assets and $2.0 million to net deferred tax liability recorded and $0.7 million to net liabilities, assumed, andwith the excess $5.7$2.7 million of the purchase price over the fair value of net assets acquired was recorded as goodwill. This goodwill allocatedis primarily attributable to the value expected from the synergies of the combination, including developing more advanced cloud and machine learning capabilities for our one operating segment.products, and is not deductible for income tax purposes. The results of operations of the acquired entity, which are not material, have been included in our consolidated financial statements from the date of purchase. Pro forma and historical results of operations of the acquired entity have not been presented as we do not consider the results to have a material effect on any of the periods presented in our consolidated statements of operations.
The following table sets forth the components of identifiable intangible assets acquired and their estimated useful lives as of the date of acquisition (in thousands, except useful life):acquisition:
| (In thousands, except useful life) | Fair Value | Useful Life (months) | ||||
| Developed technology | $ | 11,310 | 36 | |||
| Total intangible assets acquired | $ | 11,310 | ||||
Drastin
On May 15, 2017, we acquired 100% of the voting equity interest of Drastin, Inc. (“Drastin”) privately-held Delaware corporation that develops technology for search-driven analytics on enterprise data. This acquisition has been accounted for as a business combination. The purchase price of $17.3 million, paid in cash, was allocated as follows: $3.8 million to identifiable intangible assets and $0.5 million to net deferred tax liability, with the excess $14.0 million of the purchase price over the fair value of net assets acquired recorded as goodwill. This goodwill is primarily attributable to the value expected from the
synergies of the combination, including developing a more intuitive search experience for our products, and is not deductible for income tax purposes. The results of operations of the acquired entity, which are not material, have been included in our consolidated financial statements from the date of purchase. Pro forma and historical results of operations of the acquired entity have not been presented as we do not consider the results to have a material effect on any of the periods presented in our consolidated statements of operations.
The following table sets forth the components of identifiable intangible assets acquired and their estimated useful lives as of the date of acquisition:
| Fair value | Useful Life (months) | |||||||||||
| (In thousands, except useful life) | Fair Value | Useful Life (months) | ||||||||||
| Developed technology | $ | 2,940 | 36 | $ | 3,500 | 48 | ||||||
| Customer relationships | 1,460 | 36 | ||||||||||
| Other acquired intangible assets | 330 | 24 | 300 | 24 | ||||||||
| Total intangible assets subject to amortization | $ | 4,730 | ||||||||||
| Total intangible assets acquired | $ | 3,800 | ||||||||||
Goodwill
There were no impairments to goodwill during the fiscal year ended January 31, 2019 or during prior periods.
Goodwill balances are presented below (in thousands):below:
| Carrying amount | ||||
| Balance as of January 31, 2015 | $ | 19,070 | ||
| Goodwill acquired | 105,916 | |||
| Foreign currency translation adjustments | (1,668 | ) | ||
| Balance as of January 31, 2016 | $ | 123,318 | ||
| Fiscal Year Ended January 31, | ||||||||
| (In thousands) | 2019 | 2018 | ||||||
| Beginning balance | $ | 161,382 | $ | 124,642 | ||||
| Goodwill acquired | 342,006 | 36,740 | ||||||
| Ending balance | $ | 503,388 | $ | 161,382 | ||||
Intangible Assets
Intangible assets subject to amortization realized from acquisitions as of January 31, 20162019 are as follows (in thousands, except useful life):follows:
| Gross Fair Value | Accumulated Amortization | Net Book Value | Weighted-Average Remaining Useful Life (months) | |||||||||||||||||||||||||
| (In thousands, except useful life) | Gross Carrying Amount | Accumulated Amortization | Net Carrying Amount | Weighted-Average Remaining Useful Life (months) | ||||||||||||||||||||||||
| Developed technology | $ | 59,370 | $ | (12,088 | ) | $ | 47,282 | 59 | $ | 132,100 | $ | (57,596 | ) | $ | 74,504 | 52 | ||||||||||||
| Customer relationships | 1,810 | (1,288 | ) | 522 | 14 | 20,910 | (4,523 | ) | 16,387 | 52 | ||||||||||||||||||
| Other acquired intangible assets | 1,180 | (802 | ) | 378 | 26 | 3,270 | (2,539 | ) | 731 | 9 | ||||||||||||||||||
| Total intangible assets subject to amortization | $ | 62,360 | $ | (14,178 | ) | $ | 48,182 | $ | 156,280 | $ | (64,658 | ) | $ | 91,622 | ||||||||||||||
| (In thousands, except useful life) | Gross Carrying Amount | Accumulated Amortization | Net Carrying Amount | Weighted-Average Remaining Useful Life (months) | ||||||||||
| Developed technology | $ | 82,500 | $ | (36,156 | ) | $ | 46,344 | 37 | ||||||
| Customer relationships | 1,810 | (1,784 | ) | 26 | 5 | |||||||||
| Other acquired intangible assets | 3,270 | (1,498 | ) | 1,772 | 20 | |||||||||
| Total intangible assets subject to amortization | $ | 87,580 | $ | (39,438 | ) | $ | 48,142 | |||||||
Amortization expense from acquired intangible assets was $25.2 million, of in-process research$13.5 million and development upon$11.9 million for the acquisition of Caspida, which has an indefinite useful life. We will assess the carrying valuefiscal year ended January 31, 2019, 2018 and useful life of the asset once the associated research and development efforts are completed.2017, respectively.
The expected future amortization expense for acquired intangible assets as of January 31, 20162019 is as follows (in thousands):follows:
92
| Fiscal Period: | ||||||||
| Fiscal 2017 | $ | 11,891 | ||||||
| Fiscal 2018 | 10,240 | |||||||
| Fiscal 2019 | 7,987 | |||||||
Fiscal Period (In thousands) | Expected Amortization Expense | |||||||
| Fiscal 2020 | 7,605 | $ | 27,942 | |||||
| Fiscal 2021 | 7,383 | 23,780 | ||||||
| Fiscal 2022 | 13,701 | |||||||
| Fiscal 2023 | 10,406 | |||||||
| Fiscal 2024 | 7,692 | |||||||
| Thereafter | 3,076 | 8,101 | ||||||
| Total amortization expense | $ | 48,182 | $ | 91,622 | ||||
(6) Debt Financing Facilities
On May 9, 2013 we entered into a Loan Agreement with Silicon Valley Bank, which was most recently amended in May 2015. As amended, the agreement provides forprovided us with a revolving line of credit facility, which expires May 9, 2017.facility. Under the agreement, we are able tocould borrow up to $25 million. Interest on any drawdown under the revolving line of credit accrues$25.0 million with interest accrued either at the prime rate (3.50% in January 2016) or the LIBOR rate plus 2.75%. AsWe never borrowed under the credit facility and during fiscal 2019 we terminated our Loan Agreement with Silicon Valley Bank.
(7) Convertible Senior Notes
In September 2018, we issued $1.27 billion aggregate principal amount of January 31, 2016, we had no balance outstanding under this agreement.0.50% Convertible Senior Notes due 2023 (the “2023 Notes”), including the exercise in full by the initial purchasers of the 2023 Notes of their option to purchase an additional $165.0 million principal amount of 2023 Notes, and $862.5 million aggregate principal amount of 1.125% Convertible Senior Notes due 2025 (the “2025 Notes” and, together with the 2023 Notes, the “Notes”), including the exercise in full by the initial purchasers of the 2025 Notes of their option to purchase an additional $112.5 million principal amount of 2025 Notes. The agreement includes restrictive covenants,Notes are general senior, unsecured obligations of Splunk. The total proceeds from the issuance of the Notes was $2.11 billion, net of initial purchaser discounts and issuance costs.
The 2023 Notes will mature on September 15, 2023, and the 2025 Notes will mature on September 15, 2025, in each case unless earlier redeemed, repurchased or converted. The 2023 Notes will bear interest from September 21, 2018 at a rate of 0.50% per year and the 2025 Notes will bear interest from September 21, 2018 at a rate of 1.125% per year, in each case payable semiannually in arrears on March 15 and September 15 of each year, beginning on March 15, 2019.
The initial conversion rate for each series of notes is 6.7433 shares of our common stock per $1,000 principal amount of Notes, which is equivalent to an initial conversion price of approximately $148.30 per share of our common stock, subject to certain exceptions, that limit our ability to: sell or otherwise disposeadjustment upon the occurrence of specified events. The initial conversion price of each series of Notes represents a premium of approximately 27.5% to the $116.31 per share closing price of our common stock on September 18, 2018, which was the date the pricing of the Notes was determined. The Notes will be convertible at the option of the holders at any time prior to the close of business on the business day immediately preceding June 15, 2023, in the case of the 2023 Notes, or property; changeJune 15, 2025, in the case of the 2025 Notes, only under the following circumstances:
during any fiscal quarter commencing after the fiscal quarter ending on January 31, 2019 (and only during such fiscal quarter), if the last reported sale price of our common stock for at least 20 trading days (whether or not consecutive) during a period of 30 consecutive trading days ending on, and including, the last trading day of the immediately preceding fiscal quarter is greater than or equal to 130% of the conversion price for the relevant series of Notes on each applicable trading day;
during the five business liquidateday period after any 10 consecutive trading day period (the “measurement period”) in which the trading price (as defined in the indenture governing the relevant series of notes) per $1,000 principal amount of the relevant series of Notes for each trading day of the measurement period was less than 98% of the product of the last reported sale price of our common stock and the conversion rate for the relevant series of Notes on each such trading day;
if we call the relevant series of Notes for redemption, at any time prior to the close of business on the scheduled trading day immediately preceding the redemption date; or dissolve or undergo a
upon the occurrence of specified corporate events as set forth in the relevant indenture.
On or after June 15, 2023, in the case of the 2023 Notes, and on or after June 15, 2025, in the case of the 2025 Notes, until the close of business on the second scheduled trading day immediately preceding the relevant maturity date, holders of the relevant series of Notes may convert all or any portion of their Notes of such series, in multiples of $1,000 principal amount, at the option of the holder regardless of the foregoing circumstances.
Upon conversion, we may satisfy our conversion obligation by paying and/or delivering, as the case may be, cash, shares of our common stock or a combination of cash and shares of our common stock, at our election, in the manner and subject to the terms and conditions provided in the relevant indenture. It is our current intent to settle the conversions of principal amount of the Notes in cash and the remaining conversion value, if any, in shares of common stock. If we undergo a fundamental change (as defined in control; entereach indenture), holders may require us to repurchase for cash all or any portion of their Notes of the relevant series at a fundamental change repurchase price equal to 100% of the principal amount of the relevant series of Notes to be repurchased, plus accrued and unpaid interest to, but excluding, the fundamental change repurchase date. In addition, following certain corporate events that occur prior to the relevant maturity date of a series of Notes or if we deliver a notice of redemption in respect of a series of Notes, we will, in certain circumstances, increase the conversion rate of the relevant series of Notes for a holder who elects to convert its Notes of the applicable series in connection with such corporate event or notice of redemption, as the case may be. During the fiscal year ended January 31, 2019, the conditions allowing holders of the Notes to convert were not met. The Notes were therefore not convertible during the fiscal year ended January 31, 2019 and were classified as long-term debt in our consolidated balance sheets.
We may not redeem the 2023 Notes prior to September 20, 2021, and we may not redeem the 2025 Notes prior to September 20, 2022. We may redeem for cash all or any portion of the 2023 Notes, at our option, on or after September 20, 2021, and we may redeem for cash all or any portion of the 2025 Notes, at our option, on or after September 20, 2022, in each case if the last reported sale price of our common stock has been at least 130% of the conversion price for the relevant series of Notes then in effect for at least 20 trading days (whether or not consecutive) during any 30 consecutive trading day period (including the last trading day of such period) ending on, and including, the trading day immediately preceding the date on which we provide notice of redemption at a redemption price equal to 100% of the principal amount of the relevant series of Notes to be redeemed, plus accrued and unpaid interest to, but excluding, the relevant redemption date.
In accounting for the issuance of the Notes, we separated the Notes into mergers, consolidationsliability and acquisitions; incur indebtedness; create liens; pay dividends or make distributions; make investments; enter into material transactions with affiliates; pay any subordinatedequity components. The carrying amounts of the liability components of the Notes were calculated by measuring the fair value of similar debt or amend certaininstruments that do not have an associated convertible feature. The carrying amounts of the equity components, representing the conversion option, were determined by deducting the fair value of the liability components from the par value of the respective Notes. This difference represents the debt discount that is amortized to interest expense over the respective terms thereof; or becomeof the Notes using the effective interest rate method. The carrying amounts of the equity components representing the conversion options were $266.9 million and $237.2 million for the 2023 Notes and 2025 Notes, respectively, and are recorded in additional paid-in capital and are not remeasured as long as they continue to meet the conditions for equity classification.
In accounting for the issuance costs related to the Notes, we allocated the total amount incurred to the liability and equity components of the Notes based on the proportion of the proceeds allocated to the debt and equity components. Issuance costs attributable to the liability component of the 2023 Notes and 2025 Notes were $10.4 million and $6.5 million, respectively. The issuance costs allocated to the liability component are amortized to interest expense over the contractual terms of the 2023 Notes and 2025 Notes at an investment company. Weeffective interest rate of 5.65% and 6.22%, respectively. Issuance costs attributable to the equity component of the 2023 Notes and 2025 Notes were $2.8 million and $2.5 million, respectively, and are netted against the equity components representing the conversion option in compliance with all covenantsadditional paid-in capital.
The net carrying amount of the liability and equity components for each of the Notes as of January 31, 2016.2019 was as follows:
| (In thousands) | 2023 Notes | 2025 Notes | ||||||
| Liability component: | ||||||||
| Principal amount | $ | 1,265,000 | $ | 862,500 | ||||
| Unamortized discount | (249,860 | ) | (227,164 | ) | ||||
| Unamortized issuance costs | (9,751 | ) | (6,251 | ) | ||||
| Net carrying amount | $ | 1,005,389 | $ | 629,085 | ||||
| Equity component, net of purchase discounts and issuance costs | $ | 264,129 | $ | 234,712 | ||||
94
The following table sets forth the interest expense related to the Notes:
| (In thousands) | Fiscal Year Ended January 31, 2019 | |||
| 2023 Notes: | ||||
| Coupon interest expense | $ | 2,266 | ||
| Amortization of debt discount (conversion option) | 17,055 | |||
| Amortization of debt issuance costs and purchase discounts | 666 | |||
| Total interest expense related to the 2023 Notes | $ | 19,987 | ||
| 2025 Notes: | ||||
| Coupon interest expense | $ | 3,477 | ||
| Amortization of debt discount (conversion option) | 10,023 | |||
| Amortization of debt issuance costs and purchase discounts | 276 | |||
| Total interest expense related to the 2025 Notes | $ | 13,776 | ||
As of January 31, 2019, the total estimated fair values of the 2023 Notes and the 2025 Notes were approximately $1.36 billion and $930.8 million, respectively. The fair value was determined based on the closing trading price per $100 of the Notes as of the last day of trading for the period. The fair value of the Notes is primarily affected by the trading price of our common stock and market interest rates. The fair value of the Notes is considered a Level 2 measurement as they are not actively traded.
Capped Calls
In connection with the issuance of the Notes, including the initial purchasers’ exercise of the option to purchase additional Notes, we entered into privately negotiated capped call transactions with certain counterparties (the “Capped Calls”). The Capped Calls are expected to reduce potential dilution to our common stock upon conversion of the Notes and/or offset any cash payments that we are required to make in excess of the principal amount of converted Notes, as the case may be, with such reduction and/or offset subject to a cap. The Capped Calls have an initial strike price of $148.30 per share, subject to certain adjustments, which corresponds to the conversion option strike price in the Notes. The Capped Calls have a cap price equal to $232.62 per share, subject to certain adjustments. The Capped Calls are subject to adjustment upon the occurrence of specified extraordinary events affecting us, including merger events, tender offers and announcement events. In addition, the Capped Calls are subject to certain specified additional disruption events that may give rise to a termination of the Capped Calls, including nationalization, insolvency or delisting, changes in law, failures to deliver, insolvency filings and hedging disruptions. For accounting purposes, the Capped Calls are separate transactions, and not part of the terms of the Notes. As these transactions meet certain accounting criteria, the Capped Calls are recorded in stockholders’ equity and are not accounted for as derivatives. The premium paid for the purchase of the Capped Calls in the amount of $274.3 million has been recorded as a reduction to additional paid-in capital and will not be remeasured.
Common Stock
Our certificate of incorporation, as amended and restated, authorizes us to issue 1,000,000,000 shares of common stock, $0.001 par value per share. At January 31, 20162019 and January 31, 2015, 131,543,4672018, 149,167,298 shares and 123,538,492142,835,123 shares of common stock were issued and outstanding, respectively.
Equity Incentive Plans
In November 2003, our board adopted the 2003 Equity Incentive Plan (the “2003 Plan”). The 2003 Plan authorizes the granting of common stock options and restricted stock awards to employees, directors and consultants.
In January 2012, our board approved the 2012 Equity Incentive Plan (the “2012 Plan”), which became effective upon the effectiveness of our IPO registration statement on Form S-1, on April 18, 2012. The 2012 Plan provides for the grant of incentive stock options, within the meaning of Section 422 of the
95
Internal Revenue Code, to our employees and any parent and subsidiary corporations’ employees, and for the grant of nonstatutory stock options, restricted stock, restricted stock units, (“RSUs”), stock appreciation rights, performance units and performance shares to our employees, directors and consultants and any parent or subsidiary corporations’ employees and consultants. Upon the effectiveness of our IPO registration statement on Form S-1,the 2012 plan, all shares that were reserved but not issued under the 2003 Plan became available for issuance under the 2012 Plan and no further shares will be granted pursuant to the 2003 Plan. Canceled or forfeited equity awards under the 2003 Plan will also become available for issuance under the 2012 Plan. The term of an incentive stock option may not exceed 10 years, except that with respect to any participant who owns more than 10% of the voting power of all classes or our outstanding stock, the term must not exceed 5 years. Options and RSUs generally vest over 4 years.
The 2012 plan provides for annual automatic increases on February 1 to the shares reserved for issuance. The automatic increase of the number of shares available for issuance under the 2012 Plan is equal to the least of 10 million shares, 5% of the outstanding shares of common stock as of the last day of our immediately preceding fiscal year or such other amount as our board may determine.
The following table summarizes the stock option, RSU and PSU award activity during the fiscal years ended January 31, 20152018 and 2016:2019:
| Options Outstanding | RSUs and PSUs Outstanding | ||||||||||||||||||
| Available for Grant | Shares | Weighted- Average Exercise Price Per Share | Weighted- Average Remaining Contractual Term | Aggregate Intrinsic Value (1) | Shares | ||||||||||||||
| (in thousands) | |||||||||||||||||||
| Balances as of January 31, 2014 | 5,918,773 | 11,094,438 | $ | 4.84 | 6.42 | $ | 800,933 | 9,993,688 | |||||||||||
| Additional shares authorized | 5,804,975 | ||||||||||||||||||
| Options granted | (40,000 | ) | 40,000 | 88.64 | |||||||||||||||
| Options exercised | — | (4,213,746 | ) | 3.99 | |||||||||||||||
| Options forfeited and expired | 383,837 | (383,837 | ) | 7.17 | |||||||||||||||
| RSUs granted | (6,470,969 | ) | 6,470,969 | ||||||||||||||||
| RSUs vested | — | (2,862,027 | ) | ||||||||||||||||
| RSUs forfeited and canceled | 1,122,262 | (1,122,262 | ) | ||||||||||||||||
| Balances as of January 31, 2015 | 6,718,878 | 6,536,855 | $ | 5.76 | 5.59 | $ | 301,532 | 12,480,368 | |||||||||||
| Additional shares authorized | 6,176,924 | ||||||||||||||||||
| Options granted from acquisitions | (86,753 | ) | 86,753 | 1.30 | |||||||||||||||
| Options exercised | — | (2,755,556 | ) | 5.54 | |||||||||||||||
| Options forfeited and expired | 152,053 | (152,053 | ) | 32.80 | |||||||||||||||
| RSUs and PSUs granted | (7,905,929 | ) | 7,905,929 | ||||||||||||||||
| RSUs vested | — | (4,136,073 | ) | ||||||||||||||||
| RSUs forfeited and canceled | 1,497,971 | (1,497,971 | ) | ||||||||||||||||
| Balances as of January 31, 2016 | 6,553,144 | 3,715,999 | $ | 4.72 | 4.24 | $ | 154,696 | 14,752,253 | |||||||||||
| Vested and expected to vest | 3,714,985 | $ | 4.72 | 4.24 | $ | 154,657 | 14,329,178 | ||||||||||||
| Exercisable as of January 31, 2016 | 3,493,106 | $ | 4.18 | 4.07 | $ | 147,212 | |||||||||||||
| Options Outstanding | RSUs and PSUs Outstanding | ||||||||||||||||||
| Available for Grant | Shares | Weighted- Average Exercise Price Per Share | Weighted- Average Remaining Contractual Term | Aggregate Intrinsic Value (1) | Shares | ||||||||||||||
| (in thousands) | |||||||||||||||||||
| Balances as of January 31, 2017 | 10,401,789 | 2,057,894 | $ | 4.67 | 3.28 | $ | 109,571 | 13,924,414 | |||||||||||
| Additional shares authorized | 6,858,474 | ||||||||||||||||||
| Options exercised | (1,428,602 | ) | 2.92 | ||||||||||||||||
| Options forfeited and expired | 6,172 | (6,172 | ) | 50.38 | |||||||||||||||
| RSUs and PSUs granted | (6,638,656 | ) | 6,638,656 | ||||||||||||||||
| RSUs and PSUs vested | (5,555,299 | ) | |||||||||||||||||
| Shares withheld related to net share settlement of RSUs and PSUs | 2,039,915 | ||||||||||||||||||
| RSUs and PSUs forfeited and canceled | 1,991,298 | (1,991,298 | ) | ||||||||||||||||
| Balances as of January 31, 2018 | 14,658,992 | 623,120 | $ | 8.22 | 3.68 | $ | 52,435 | 13,016,473 | |||||||||||
| Additional shares authorized | 7,141,756 | ||||||||||||||||||
| Options granted | (54,343 | ) | 54,343 | 22.71 | |||||||||||||||
| Options exercised | (267,226 | ) | 7.31 | ||||||||||||||||
| Options forfeited and expired | 1,198 | (1,198 | ) | 26.63 | |||||||||||||||
| RSUs and PSUs granted | (6,416,331 | ) | 6,416,331 | ||||||||||||||||
| RSUs and PSUs vested | (5,160,642 | ) | |||||||||||||||||
| Shares withheld related to net share settlement of RSUs and PSUs | 577,309 | ||||||||||||||||||
| RSUs and PSUs forfeited and canceled | 1,173,555 | (1,173,555 | ) | ||||||||||||||||
| Balances as of January 31, 2019 | 17,082,136 | 409,039 | $ | 10.69 | 3.36 | $ | 46,693 | 13,098,607 | |||||||||||
| Vested and expected to vest | 408,983 | $ | 10.68 | 3.36 | $ | 46,689 | 12,868,593 | ||||||||||||
| Exercisable as of January 31, 2019 | 378,150 | $ | 9.64 | 2.95 | $ | 43,562 | |||||||||||||
_________________________
(1) | The intrinsic value is calculated as the difference between the exercise price of the underlying stock option award and the closing market price of our common stock as of January 31, 2019. |
During fiscal 2014,2018 and a portion of fiscal 2019, upon each settlement date of our outstanding RSUs to current employees, RSUs were withheld to cover the required withholding tax, which was based on the value of the RSU on the
96
settlement date as determined by the closing price of our common stock on the trading day of the applicable settlement date. The remaining shares were delivered to the recipient as shares of our common stock. The amount remitted to the tax authorities for the employees’ tax obligation was reflected as a financing activity within our consolidated statements of cash flows. These shares withheld by us as a result of the net settlement of RSUs were not considered issued and outstanding, thereby reducing our shares outstanding used to calculate earnings per share. These shares were returned to the reserves and were available for future issuance under our 2012 Equity Incentive Plan. During fiscal 2015 and 2016,2019, we also required that employees sell a portion of the shares that they receive upon the vesting of RSUs in order to cover any required withholding taxes, rather than our previous approach of net share settlement.taxes.
During fiscal 2016,2019 and 2018, we granted 235,000518,147 PSUs and 417,861 PSUs, respectively, to certain executives under our 2012 Equity Incentive Plan.Plan, which includes both PSUs awarded but not yet earned, as well as PSUs earned and eligible to vest. The number of PSUs earned and eligible to vest will be determined after a one-year performance period, based on achievement of certain company financial performance measures and the recipient’s continued service with us. The number of shares of our stock to be received at vestingbased on financial performance measures can range from 0% to 200% of the target amount. Compensation expense for PSUs with financial performance measures is measured using the fair value at the date of grant and recorded over the four-year vesting period under the graded-vesting attribution method, and may be adjusted over the vesting period based on interim estimates of performance against the pre-set objectives. PSUs granted in fiscal 2019 contain an additional market performance measure that can increase the number of shares earned by up to an additional 50% of the shares received based on the financial performance measure.
The following table summarizes our RSA activity during the fiscal ended January 31, 2019:
| Shares | |||
| Outstanding as of January 31, 2018 | 63,353 | ||
| RSAs granted | 824,605 | ||
| RSAs vested | (63,353 | ) | |
| Outstanding as of January 31, 2019 | 824,605 | ||
The aggregate intrinsic value of options exercised during the fiscal yearyears ended January 31, 20162019, 2018 and 2017 was $162.3 million.$27.0 million, $93.5 million, and $83.5 million, respectively. The weighted-average grant date fair value of options granted was $67.81$83.96 per share for the fiscal year ended January 31, 2016.2019. The weighted-average grant date fair value of RSUs granted was $60.67$108.57 per share for the fiscal year ended January 31, 2016.2019. The aggregate intrinsic value of RSUs vested during the fiscal year ended January 31, 20162019 was $253.7$537.7 million. The weighted-average grant date fair value of PSUs granted was $61.83$86.55 per share for the fiscal year ended January 31, 2016.2019. The weighted-average grant date fair value of RSAs granted was $69.00$79.07 per share for the fiscal year ended January 31, 2016.
Employee Stock Purchase Plan
Our 2012 Employee Stock Purchase Plan (the “ESPP”) allows eligible employees to purchase shares of our common stock at a discount through payroll deductions of up to 15% of their eligible compensation, at not less than 85% of the fair market value, as defined in the ESPP, subject to any plan limitations. The ESPP provides for consecutive 12-month offering periods, starting on the first trading day on or after June 15 and December 15 of each year. The ESPP provides for an automatic increase of the number of shares available for issuance under the ESPP equal to the least of 4 million shares, 2% of the outstanding shares of our common stock on the last day of the immediately preceding fiscal year, or such other amount as may be determined by our board of directors.
Stock-Based Compensation Expense
Stock-based compensation expense related to our stock-based awards, employee stock purchases and restricted stock units was allocated as follows (in thousands):
| Fiscal Year Ended January 31, | ||||||||||||
| 2016 | 2015 | 2014 | ||||||||||
| Cost of revenues | $ | 26,057 | $ | 17,189 | $ | 5,283 | ||||||
| Research and development | 89,197 | 60,777 | 20,829 | |||||||||
| Sales and marketing | 130,054 | 90,064 | 30,012 | |||||||||
| General and administrative | 46,949 | 46,149 | 13,244 | |||||||||
| Total stock-based compensation expense | $ | 292,257 | $ | 214,179 | $ | 69,368 | ||||||
| Fiscal Year Ended January 31, | |||||||||
| 2016 | 2015 | 2014 | |||||||
| Expected volatility | 62.8 | % | 49.4 | % | 53.3 | % | |||
| Risk-free rate | 1.58 | % | 1.96 | % | 1.75 | % | |||
| Dividend yield | — | — | — | ||||||
| Expected term (in years) | 5.29 | 6.04 | 5.97 | ||||||
| Fiscal Year Ended January 31, | ||||||||||||
| (In thousands) | 2019 | 2018 | 2017 | |||||||||
| Cost of revenues | $ | 37,501 | $ | 33,605 | $ | 30,971 | ||||||
| Research and development | 137,171 | 106,690 | 129,388 | |||||||||
| Sales and marketing | 190,422 | 159,240 | 161,164 | |||||||||
| General and administrative | 76,836 | 58,928 | 56,518 | |||||||||
| Total stock-based compensation expense | $ | 441,930 | $ | 358,463 | $ | 378,041 | ||||||
PSUs granted in fiscal 2019 contain an additional market performance measure that can increase the timenumber of grant and revised, if necessary, in subsequent periods if actual forfeitures differed from those estimates. Forfeitures were estimated based on historical experience.
shares earned. The following table summarizes the assumptions were used in the Monte Carlo simulation model to estimatedetermine the fair value of nonemployee options:
| Fiscal Year Ended January 31, | ||||||||
| 2016* | 2015 | 2014 | ||||||
| Expected volatility | — | 50.5 - 51.4% | 49.8 - 58.0% | |||||
| Risk-free rate | — | 1.85 - 2.43% | 1.37 - 2.52% | |||||
| Dividend yield | — | — | — | |||||
| Expected term (in years) | — | 6.70 - 7.96 | 7.45 - 9.12 | |||||
| Fiscal Year Ended January 31, | |||
| 2019 | |||
Expected volatility (1) | 39.5 | % | |
| Risk-free rate | 2.5 | % | |
| Dividend yield | — | ||
| Expected term (in years) | 4.0 | ||
_________________________
(1) | Equal weighting of Splunk historical and implied volatility. |
The following table summarizes the assumptions used in the Black-Scholes option-pricing model to determine the fair value of our common shares under the ESPP:
| Fiscal Year Ended January 31, | |||||||||
| 2019 | 2018 | 2017 | |||||||
| Expected volatility | 33.1 - 53.8% | 28.4 - 34.5% | 37.4 - 57.6% | ||||||
| Risk-free rate | 2.1 - 2.7% | 1.1 - 1.7% | 0.3 - 0.9% | ||||||
| Dividend yield | — | — | — | ||||||
| Expected term (in years) | 0.5 - 1.0 | 0.5 - 1.0 | 0.5 - 1.0 | ||||||
(10) Revenues, Deferred Revenue and Remaining Performance Obligations
Disaggregation of Revenues
The following assumptions were used to estimate the fair value of the ESPP:table presents disaggregated revenues by major product or service type:
| Fiscal Year Ended January 31, | |||||||||
| 2016 | 2015 | 2014 | |||||||
| Expected volatility | 37.3 - 57.1% | 38.4 - 59.0% | 33.9 - 44.4% | ||||||
| Risk-free rate | 0.11 - 0.69% | 0.07 - 0.22% | 0.08 - 0.13% | ||||||
| Dividend yield | — | — | — | ||||||
| Expected term (in years) | 0.50 - 1.00 | 0.50 - 1.00 | 0.50 - 1.00 | ||||||
| Fiscal Year Ended January 31, | ||||||||||||
| (In thousands) | 2019 | 2018* | 2017* | |||||||||
| Revenues | ||||||||||||
| License | $ | 1,030,277 | $ | 741,302 | $ | 543,510 | ||||||
| Maintenance, professional services and training | 601,533 | 475,330 | 352,220 | |||||||||
| Cloud services | 171,200 | 92,500 | 47,834 | |||||||||
| Total revenues | $ | 1,803,010 | $ | 1,309,132 | $ | 943,564 | ||||||
| * | Prior-period information has been adjusted to reflect the adoption of ASU No. 2014-09, Revenue from Contracts with Customers (Topic 606), which we adopted on February 1, 2018. Refer to Note 1 for further details. |
Revenues by geography are based on the shipping address of the customer. The following tables presenttable presents our revenues by geographic region for the periods presented (in thousands):region:
98
| Fiscal Year Ended January 31, | Fiscal Year Ended January 31, | ||||||||||||||||||||||
| 2016 | 2015 | 2014 | |||||||||||||||||||||
| (In thousands) | 2019 | 2018* | 2017* | ||||||||||||||||||||
| United States | $ | 501,802 | $ | 342,728 | $ | 234,458 | $ | 1,274,361 | $ | 931,281 | $ | 691,130 | |||||||||||
| International | 166,633 | 108,147 | 68,165 | 528,649 | 377,851 | 252,434 | |||||||||||||||||
| Total revenues | $ | 668,435 | $ | 450,875 | $ | 302,623 | $ | 1,803,010 | $ | 1,309,132 | $ | 943,564 | |||||||||||
| * | Prior-period information has been adjusted to reflect the adoption of ASU No. 2014-09, Revenue from Contracts with Customers (Topic 606), which we adopted on February 1, 2018. Refer to Note 1 for further details. |
Other than the United States, no other individual country exceeded 10% of total revenues during any of the periods presented. One channel partner represented 14%32% and a second channel partner represented 13%18% of total revenues during fiscal 2016.2019. One channel partner represented 12%31% and a second channel partner represented 17% of total revenues during fiscal 2015.2018. One channel partner represented 31% and a second channel partner represented 17% of total revenues during fiscal 2017. The revenues from these channel partners are comprised of a number of customer transactions, none of which were individually greater than 10%than10% of total revenues during fiscal 20162019, 2018 or 2015. No individual channel partners or customers represented greater than 10%2017.
Deferred Revenue
Revenues recognized from amounts included in deferred revenue as of total revenues during fiscal 2014. At January 31, 2016, one channel partner represented 26% and one customer represented 16% of total accounts receivable. At2018 were $452.4 million during the fiscal year ended January 31, 2015 no channel partner or customer represented greater than 10% of total accounts receivable.2019.
Revenue allocated to remaining performance obligations represents contracted revenue that has not yet been recognized, which includes deferred revenue and non-cancelable amounts that will be invoiced and excludes performance obligations that are subject to cancellation terms. Our remaining performance obligations were $1.26 billion as of January 31, 2019, of which we expect to recognize approximately 88% as revenue over the next 24 months and the remainder thereafter.
(11) Income Taxes
Income (loss) before income tax expense consists of the following:
| Fiscal Year Ended January 31, | ||||||||||||
| 2019 | 2018 | 2017 | ||||||||||
| (In thousands) | *As Adjusted | *As Adjusted | ||||||||||
| United States | $ | (289,896 | ) | $ | (207,607 | ) | $ | (354,776 | ) | |||
| International | 26,705 | 18,746 | 12,823 | |||||||||
| Total | $ | (263,191 | ) | $ | (188,861 | ) | $ | (341,953 | ) | |||
| * | Prior-period information has been adjusted to reflect the adoption of ASU No. 2014-09, Revenue from Contracts with Customers (Topic 606), which we adopted on February 1, 2018. Refer to Note 1 for further details. |
Income tax expense (benefit) consists of the following:
99
| As of January 31, | |||||||
| 2016 | 2015 | ||||||
| United States | $ | 129,268 | $ | 47,236 | |||
| International | 5,727 | 3,138 | |||||
| Total property and equipment, net | $ | 134,995 | $ | 50,374 | |||
| Fiscal Year Ended January 31, | ||||||||||||
| 2019 | 2018 | 2017 | ||||||||||
| (In thousands) | *As Adjusted | *As Adjusted | ||||||||||
| Current tax provision: | ||||||||||||
| Federal | $ | 7,532 | $ | — | $ | — | ||||||
| State | 422 | 301 | 274 | |||||||||
| Foreign | 8,496 | 5,878 | 5,559 | |||||||||
| Total current tax provision | 16,450 | 6,179 | 5,833 | |||||||||
| Deferred tax provision: | ||||||||||||
| Federal | (3,313 | ) | (2,825 | ) | 165 | |||||||
| State | — | (362 | ) | 15 | ||||||||
| Foreign | (751 | ) | (1,635 | ) | (506 | ) | ||||||
| Total deferred tax provision | (4,064 | ) | (4,822 | ) | (326 | ) | ||||||
| Total tax provision (benefit) | $ | 12,386 | $ | 1,357 | $ | 5,507 | ||||||
| * | Prior-period information has been adjusted to reflect the adoption of ASU No. 2014-09, Revenue from Contracts with Customers (Topic 606), which we adopted on February 1, 2018. Refer to Note 1 for further details. |
On December 22, 2017, the Tax Cuts and Jobs Act of 2017 (the “Act”) was enacted into law, making significant changes to how the U.S. imposes income tax on multinational corporations. We were required to recognize the effect of the Act in the period of enactment. Subsequent to the enactment of the Act, the SEC staff issued Staff Accounting Bulletin No. 118 (“SAB 118”), which allows us to record provisional amounts during a measurement period not to extend more than one year beyond the United States, no other individual country exceeded 10%enactment date, with further clarifications made recently with the issuance of total propertyASU 2018-05. In accordance with SAB 118, we made reasonable estimates of the effects and equipmentrecorded provisional amounts in our financial statements as of January 31, 2016 or 2015.
| Fiscal Year Ended January 31, | |||||||||||
| 2016 | 2015 | 2014 | |||||||||
| United States | $ | (294,624 | ) | $ | (221,041 | ) | $ | (80,900 | ) | ||
| International | 7,980 | 6,201 | 1,898 | ||||||||
| Total | $ | (286,644 | ) | $ | (214,840 | ) | $ | (79,002 | ) | ||
| Fiscal Year Ended January 31, | |||||||||||
| 2016 | 2015 | 2014 | |||||||||
| Current tax provision: | |||||||||||
| Federal | $ | — | $ | — | $ | — | |||||
| State | 223 | 138 | 178 | ||||||||
| Foreign | 3,045 | 2,465 | 1,202 | ||||||||
| Total current tax provision | 3,268 | 2,603 | 1,380 | ||||||||
| Deferred tax provision: | |||||||||||
| Federal | (10,437 | ) | (170 | ) | (1,043 | ) | |||||
| State | (487 | ) | (14 | ) | (131 | ) | |||||
| Foreign | (216 | ) | (143 | ) | (200 | ) | |||||
| Total deferred tax provision | (11,140 | ) | (327 | ) | (1,374 | ) | |||||
| Total tax provision (benefit) | $ | (7,872 | ) | $ | 2,276 | $ | 6 | ||||
The Global Intangible Low-Taxed Income (“GILTI”) provisions impose a tax provision consisted principallyon foreign income in excess of statea deemed return on tangible assets of foreign corporations. The FASB Staff Q&A, Topic 740, No. 5, Accounting for Global Intangible Low-Taxed Income, states that an entity can make an accounting policy election to either recognize deferred taxes for temporary basis differences expected to reverse as GILTI in future years or provide for the tax expense related to GILTI in the United States and foreign taxes from legal entities established in foreign jurisdictions and withholding taxes paid, offset by a partial release of valuation allowance on our United States deferredyear the tax asset,is incurred as a resultperiod expense. We have elected to account for any potential GILTI tax in the period in which it is incurred.
In October 2016, the FASB issued ASU 2016-16, “Income Taxes (Topic 740): Intra-Entity Transfers of Assets Other Than Inventory,” which includes a revision of the acquisitionaccounting for the income tax consequences of Caspida duringintra-entity transfers of assets other than inventory to reduce the 2016 fiscal year. Forcomplexity in accounting standards. We adopted this new standard as of February 1, 2018 with an immaterial amount of cumulative effect adjustment recorded to our accumulated deficit as of February 1, 2018. As this standard was adopted on a prospective basis as of February 1, 2018, the fiscal yearadoption of this standard did not impact our previously reported financial statements for periods ended on or prior to January 31, 2015, our tax provision consisted principally of state and foreign income tax expense. For the fiscal year ended January 31, 2014, our tax provision consisted principally of state and foreign income tax expense, offset by a partial release of valuation allowance on our United States deferred tax asset, as a result of the acquisitions made during the 2014 fiscal year.2018.
The reconciliation of federal statutory income tax rate to our effective income tax rate is as follows (in thousands):follows:
| Fiscal Year Ended January 31, | Fiscal Year Ended January 31, | ||||||||||||||||||||||
| 2016 | 2015 | 2014 | 2019 | 2018 | 2017 | ||||||||||||||||||
| Expected provision at United States federal statutory rate | $ | (97,459 | ) | $ | (73,635 | ) | $ | (26,861 | ) | ||||||||||||||
| (In thousands) | 2019 | *As Adjusted | *As Adjusted | ||||||||||||||||||||
| Expected provision (benefit) at U.S. federal statutory rate | $ | (39,661 | ) | $ | (116,264 | ) | |||||||||||||||||
| State income taxes - net of federal benefit | (8,730 | ) | (3,914 | ) | (2,124 | ) | (8,904 | ) | (6,454 | ) | (10,472 | ) | |||||||||||
| Stock options | 10,734 | 9,570 | 3,300 | ||||||||||||||||||||
| Stock-based compensation | (26,554 | ) | (18,893 | ) | 21,772 | ||||||||||||||||||
| Research and development tax credits | (11,965 | ) | (6,647 | ) | (6,309 | ) | (32,819 | ) | (18,463 | ) | (13,496 | ) | |||||||||||
| Tax reserve for uncertain tax positions | 26 | (10 | ) | 8 | |||||||||||||||||||
| Change in valuation allowance | 108,300 | 75,910 | 32,069 | 122,614 | (104,672 | ) | 121,353 | ||||||||||||||||
| Non-deductible expenses | 2,632 | 1,006 | 866 | 4,767 | 2,145 | 2,694 | |||||||||||||||||
| Release of valuation allowance due to acquisitions | (10,924 | ) | — | (1,173 | ) | (3,313 | ) | (3,187 | ) | — | |||||||||||||
| Other | (486 | ) | (4 | ) | 230 | ||||||||||||||||||
| Impact of the Act | — | 190,920 | — | ||||||||||||||||||||
| Base erosion anti-abuse tax | 7,532 | — | — | ||||||||||||||||||||
| Non-U.S. tax rate differential | 4,333 | (378 | ) | (80 | ) | ||||||||||||||||||
| Total tax provision (benefit) | $ | (7,872 | ) | $ | 2,276 | $ | 6 | $ | 12,386 | $ | 1,357 | $ | 5,507 | ||||||||||
| * | Prior-period information has been adjusted to reflect the adoption of ASU No. 2014-09, Revenue from Contracts with Customers (Topic 606), which we adopted on February 1, 2018. Refer to Note 1 for further details. |
Deferred tax assets and liabilities consist of the following (in thousands):following:
| Fiscal Year Ended January 31, | Fiscal Year Ended January 31, | ||||||||||||||
| 2016 | 2015 | 2019 | 2018 | ||||||||||||
| (In thousands) | *As Adjusted | ||||||||||||||
| Deferred tax assets: | |||||||||||||||
| Net operating loss carryforwards | $ | 151,917 | $ | 68,527 | $ | 472,153 | $ | 401,339 | |||||||
| Accrued liabilities | 7,995 | 7,362 | 13,622 | 16,546 | |||||||||||
| Tax credit carryforwards | 35,826 | 22,396 | 108,769 | 71,373 | |||||||||||
| Stock-based compensation | 34,912 | 24,772 | 34,319 | 22,411 | |||||||||||
| Deferred revenue | 22,200 | 14,996 | 21,549 | — | |||||||||||
| Valuation allowance | (236,174 | ) | (135,655 | ) | (481,279 | ) | (468,997 | ) | |||||||
| Total deferred tax assets | 16,676 | 2,398 | 169,133 | 42,672 | |||||||||||
| Deferred tax liabilities: | |||||||||||||||
| Depreciation and amortization | (16,184 | ) | (1,776 | ) | (15,965 | ) | (4,539 | ) | |||||||
| Deferred revenue | — | (12,819 | ) | ||||||||||||
| Deferred commissions | (35,125 | ) | (22,210 | ) | |||||||||||
| Convertible senior notes | (116,023 | ) | — | ||||||||||||
| Total deferred tax liabilities | (16,184 | ) | (1,776 | ) | (167,113 | ) | (39,568 | ) | |||||||
| Net deferred taxes | 492 | 622 | 2,020 | 3,104 | |||||||||||
| Recorded as: | |||||||||||||||
| Current deferred tax assets | — | 15,017 | |||||||||||||
| Current valuation allowance | — | (14,682 | ) | ||||||||||||
| Non-current deferred tax assets | 236,666 | 121,260 | 483,299 | 472,101 | |||||||||||
| Non-current valuation allowance | (236,174 | ) | (120,973 | ) | (481,279 | ) | (468,997 | ) | |||||||
| Net deferred tax assets | $ | 492 | $ | 622 | $ | 2,020 | $ | 3,104 | |||||||
| * | Prior-period information has been adjusted to reflect the adoption of ASU No. 2014-09, Revenue from Contracts with Customers (Topic 606), which we adopted on February 1, 2018. Refer to Note 1 for further details. |
Net operating loss and tax credit carry forwardscarryforwards as of January 31, 20162019 are as follows (in thousands):follows:
101
| Amount | Expiration years | ||||||||||
| Net operating loss, federal | $ | 1,167,842 | 2025 - 2036 | ||||||||
| (Dollars in thousands) | Amount | Expiration years | |||||||||
| Net operating loss, federal (generated in taxable years ended after December 31, 2017) | $ | 449,578 | No expiration | ||||||||
| Net operating loss, federal (generated in taxable years ended before December 31, 2017) | 1,440,097 | 2025 - 2038 | |||||||||
| Net operating loss, state | 797,389 | 2016 - 2036 | 1,262,961 | 2019 - 2038 | |||||||
| Tax credit, federal | 29,843 | 2026 - 2036 | 83,416 | 2026 - 2038 | |||||||
| Tax credit, state | 28,105 | N/A | 68,922 | No expiration | |||||||
ASC Topic 740, Income Taxes, requires that the tax benefit of net operating losses, temporary differences and credit carryforwards be recorded as an asset to the extent that we assess that realization is more likely than not. Realization of the future tax benefits is dependent on our ability to generate sufficient taxable income within the carryforward period. Due to our history of U.S. operating losses, we believe the recognition of the deferred tax assets arising from the above mentionedabove-mentioned future tax benefits is currently not more likely than not to be realized and, accordingly, have provided a full valuation allowance against net U.S. deferred tax assets. The valuation allowance totaled $236.2 million, $135.7$481.3 million and $57.5$469.0 million for fiscal 2016, 2015,2019 and 2014,2018, respectively.
If certain factors change, we may determine that there is sufficient positive evidence to support a reversal of, or decrease in, the valuation allowance. If we were to reverse all or some part of our valuation allowance, our consolidated financial statements in the period of reversal would likely reflect an increase in assets on our balance sheet and a corresponding tax benefit to our consolidated statements of operations in the amount of the reversal.
Because of certain prior period ownership changes, the utilization of a portion of our United StatesU.S. federal and state NOL and tax credit carryforwards may be limited.
As of January 31, 2016,2019, our liability for uncertainunrecognized tax positions was $12.5benefits were $32.9 million, of which $0.3$0.4 million would, if recognized, impact our effective tax rate. The remainder will not, if recognized, affect the effective income tax rate due to the valuation allowance that currently offsets deferred tax assets.
Unrecognized tax benefit balances are presented below:
| Fiscal Year Ended January 31, | Fiscal Year Ended January 31, | ||||||||||||||||||||||
| (in thousands) | 2016 | 2015 | 2014 | ||||||||||||||||||||
| (In thousands) | 2019 | 2018 | 2017 | ||||||||||||||||||||
| Balance at beginning of year | $ | 8,462 | $ | 4,862 | $ | 2,105 | $ | 31,802 | $ | 16,755 | $ | 12,493 | |||||||||||
| Increase related to prior year tax positions | — | 889 | — | — | 6,355 | — | |||||||||||||||||
| Decrease related to prior year tax positions | — | (24 | ) | — | (6,035 | ) | — | — | |||||||||||||||
| Increase related to current year tax positions | 4,031 | 2,735 | 2,757 | 7,138 | 8,692 | 4,262 | |||||||||||||||||
| Balance at end of year | $ | 12,493 | $ | 8,462 | $ | 4,862 | $ | 32,905 | $ | 31,802 | $ | 16,755 | |||||||||||
We are required to identify, evaluate and measure all uncertain tax positions taken or to be taken on tax returns and to record liabilities for the amount of these positions that may not be sustained, or may only partially be sustained, upon examination by the relevant taxing authorities. Although we believe that our estimates and judgments were reasonable, actual results may differ from these estimates. Some or all of these judgments are subject to review by the taxing authorities.
We are subject to income taxes in United States federal and various state and local jurisdictions. Generally, we are no longer subject to United States federal, state and local tax examinations for tax years ended before January 31, 2012.2015. However, to the extent allowed by law, the tax authorities may have the right to examine prior periods where net operating losses or tax credits were generated and carried forward, and make adjustments up to the amount of the net operating loss or credit carryforward.
The potential unrecognized tax benefits during the next 12 months is not expected to be material.
We accrue interest and penalties related to unrecognized tax benefits as a component of income tax expense. As of both January 31, 20162019 and 2015, there was2018, we had accrued $0.1 million in interest and penalties of $106,000 and $94,000, respectively.penalties.
102
(12) Net Loss Per Share
Basic net loss per share is computed by dividing the net loss by the weighted-average number of shares of common stock outstanding during the period, less the weighted-average unvested common stock subject to repurchase or forfeiture.
Diluted net loss per share is computed by giving effect to all potential shares of common stock, including convertible senior notes, preferred stock, stock options, RSUs, PSUs and RSAs, to the extent dilutive.
The following table sets forth the computation of historical basic and diluted net loss per share (in thousands, except per share data):share:
| Fiscal Year Ended January 31, | Fiscal Year Ended January 31, | ||||||||||||||||||||||
| 2016 | 2015 | 2014 | |||||||||||||||||||||
| (In thousands, except per share amounts) | 2019 | 2018* | 2017* | ||||||||||||||||||||
| Numerator: | |||||||||||||||||||||||
| Net loss | $ | (278,772 | ) | $ | (217,116 | ) | $ | (79,008 | ) | $ | (275,577 | ) | $ | (190,218 | ) | $ | (347,460 | ) | |||||
| Denominator: | |||||||||||||||||||||||
| Weighted-average common shares outstanding | 127,415 | 119,813 | 105,143 | 145,737 | 139,921 | 134,357 | |||||||||||||||||
| Less: Weighted-average unvested common shares subject to repurchase or forfeiture | (669 | ) | (38 | ) | (76 | ) | (30 | ) | (55 | ) | (447 | ) | |||||||||||
| Weighted-average shares used to compute net loss per share, basic and diluted | 126,746 | 119,775 | 105,067 | 145,707 | 139,866 | 133,910 | |||||||||||||||||
| Net loss per share, basic and diluted | $ | (2.20 | ) | $ | (1.81 | ) | $ | (0.75 | ) | $ | (1.89 | ) | $ | (1.36 | ) | $ | (2.59 | ) | |||||
| * | Prior-period information has been adjusted to reflect the adoption of ASU No. 2014-09, Revenue from Contracts with Customers (Topic 606), which we adopted on February 1, 2018. Refer to Note 1 for further details. |
Since we were in a net loss position for all periods presented, basic net loss per share is the same as diluted net loss per share for all periods as the inclusion of all potentially dilutive securities outstanding would have been anti-dilutive. Potentially dilutive securities that were not included in the diluted per share calculations because they would be anti-dilutive were as follows:
| As of January 31, | Fiscal Year Ended January 31, | ||||||||||||||||
| 2016 | 2015 | 2014 | |||||||||||||||
| (In thousands) | 2019 | 2018 | 2017 | ||||||||||||||
| Shares subject to outstanding common stock options | 3,715,999 | 6,536,855 | 11,094,438 | 409 | 623 | 2,058 | |||||||||||
| Shares subject to outstanding RSUs, PSUs and RSAs | 15,374,151 | 12,480,368 | 9,993,688 | 13,923 | 13,080 | 14,002 | |||||||||||
| Employee stock purchase plan | 548,221 | 281,716 | 56,369 | 554 | 543 | 669 | |||||||||||
| Total | 19,638,371 | 19,298,939 | 21,144,495 | 14,886 | 14,246 | 16,729 | |||||||||||
| Item 9. Changes in and Disagreements with Accountants on Accounting and Financial Disclosure |
None.
| Item 9A. Controls and Procedures |
Evaluation of Disclosure Controls and Procedures
Our management, with the participation of our Chief Executive Officer and our Chief Financial Officer, evaluated the effectiveness of our disclosure controls and procedures as of January 31, 2016.2019. The term “disclosure controls and procedures,” as defined in Rules 13a-15(e) and 15d-15(e) under the Exchange Act, means controls and other procedures of a company that are designed to ensure that information required to be disclosed by a company in the reports that it files or submits under the
Exchange Act is recorded, processed, summarized and reported, within the time periods specified in the SEC’s rules and forms. Disclosure controls and procedures include, without limitation, controls and procedures designed to ensure that information required to be disclosed by a company in the reports that it files or submits under the Exchange Act is accumulated and communicated to the company’s management, including its principal executive and principal financial officers, as appropriate to allow timely decisions regarding required disclosure. Based on the evaluation of our disclosure controls and procedures as of January 31, 2016,2019, our Chief Executive Officer and Chief Financial Officer concluded that, as of such date, our disclosure controls and procedures were effective at the reasonable assurance level.
Management’s Annual Report on Internal Control Over Financial Reporting
Our management is responsible for establishing and maintaining adequate internal control over financial reporting, as defined in Rule 13a-15(f) of the Exchange Act. Our management conducted an evaluation of the effectiveness of our internal control over financial reporting based on the criteria set forth in Internal Control—Integrated Framework issued by the Committee of Sponsoring Organizations of the Treadway Commission (2013 framework). Based on this evaluation, management concluded that our internal control over financial reporting was effective as of January 31, 2016.2019.
The effectiveness of our internal control over financial reporting as of January 31, 20162019 has been audited by PricewaterhouseCoopers LLP, an independent registered public accounting firm, as stated in their report which is included in Item 8 of this Annual Report on Form 10-K.
Changes in Internal Control over Financial Reporting
There was no change in our internal control over financial reporting identified in connection with the evaluation required by Rule 13a-15(d) and 15d-15(d) of the Exchange Act that occurred during the quarter ended January 31, 20162019 that has materially affected, or is reasonably likely to materially affect, our internal control over financial reporting.
Inherent Limitations on Effectiveness of Controls
Our management, including our Chief Executive Officer and Chief Financial Officer, believes that our disclosure controls and procedures and internal control over financial reporting are designed to provide reasonable assurance of achieving their objectives and are effective at the reasonable assurance level. However, our management does not expect that our disclosure controls and procedures or our internal control over financial reporting will prevent all errors and all fraud. A control system, no matter how well conceived and operated, can provide only reasonable, not absolute, assurance that the objectives of the control system are met. Further, the design of a control system must reflect the fact that there are resource constraints, and the benefits of controls must be considered relative to their costs. Because of the inherent limitations in all control systems, no evaluation of controls can provide absolute assurance that all control issues and instances of fraud, if any, have been detected. These inherent limitations include the realities that judgments in decision-making can be faulty, and that breakdowns can occur because of a simple error or mistake. Additionally, controls can be circumvented by the individual acts of some persons, by collusion of two or more people or by management override of the controls. The design of any system of controls also is based in part upon certain assumptions about the likelihood of future events, and there can be no assurance that any design will succeed in achieving its stated goals under all potential future conditions; over time, controls may become inadequate because of changes in conditions, or the degree of compliance with policies or procedures may deteriorate. Because of the inherent limitations in a cost-effective control system, misstatements due to error or fraud may occur and not be detected.
| Item 9b. Other Information |
None.
PART III
| Item 10. Directors, Executive Officers and Corporate Governance |
Executive Officers and Directors
Information responsive to this item is incorporated herein by reference to our definitive proxy statement with respect to our 20162019 Annual Meeting of Stockholders to be filed with the SEC within 120 days after the end of the fiscal year covered by this annual report on Form 10-K (the “Proxy Statement”).
As part of our system of corporate governance, our board of directors has adopted a code of business conduct and ethics. The code applies to all of our employees, officers (including our principal executive officer, principal financial officer, principal accounting officer or controller, or persons performing similar functions), agents and representatives, including our independent directors and consultants, who are not employees of the Company, with regard to their Splunk-related activities. Our code of business conduct and ethics is available on our website at http://investors.splunk.com/governance.cfmcorporate-governance. We will post on this section of our website any amendment to our code of business conduct and ethics, as well as any waivers of our code of business conduct and ethics, that are required to be disclosed by the rules of the SEC or the NASDAQ Stock Market.
| Item 11. Executive Compensation |
The information required by this Item is incorporated herein by reference to the sectionsections entitled “Executive Compensation” and “Corporate Governance at Splunk -– Non-Employee Director Compensation” in our Proxy Statement.
| Item 12. Security Ownership of Certain Beneficial Owners and Management and Related Stockholder Matters |
The information required by this Item is incorporated herein by reference to the sectionsections entitled “Stock Ownership Information -– Security Ownership of Certain Beneficial Owners and Management,” and “Executive Compensation -Compensation–Compensation Tables -– Equity Compensation Plan Information” in our Proxy Statement.
| Item 13. Certain Relationships and Related Transactions, and Director Independence |
The information required by this Item is incorporated herein by reference to the sectionsections entitled “Corporate Governance at Splunk -– Related Party and Other Transactions” and “Corporate Governance at Splunk -– Director Independence” in our Proxy Statement.
| Item 14. Principal Accountant Fees and Services |
The information required by this Item is incorporated herein by reference to the sections entitled “Audit Committee Matters - Proposal 2: Ratification– Fees Paid to the Independent Registered Public Accounting Firm” and “Audit Committee Matters – Audit Committee Policy on Pre-Approval of AppointmentAudit and Permissible Non-Audit Services of Independent Registered Public Accounting Firm” in our Proxy Statement.
PART IV
| Item 15. Exhibits and Financial Statement Schedules |
Documents filed as part of this report are as follows:
| 1. | Consolidated Financial Statements: Our Consolidated Financial Statements are listed in the “Index to Consolidated Financial Statements” Under Part II, Item 8 of this report. |
| 2. | Financial Statement Schedules: Financial statement schedules have been omitted because they are not applicable or the required information is shown in the Consolidated Financial Statements or Notes thereto. |
| 3. | Exhibits: The documents listed in the Exhibit Index of this report are incorporated by reference or are filed with this report, in each case as indicated therein (numbered in accordance with Item 601 of Regulation S-K). |
| Item 16. Form 10-K Summary |
Not applicable.
EXHIBIT
INDEX
Exhibit Number | Description | |
Amended and Restated Certificate of Incorporation of the Registrant | ||
Amended and Restated Bylaws of the Registrant | ||
Specimen common stock certificate of the Registrant | ||
2003 Equity Incentive Plan, as amended, and Forms of Stock Option Agreement under 2003 Equity Incentive Plan | ||
2012 Equity Incentive Plan | ||
Office Lease, dated as of April 29, 2014, between 270 Brannan | ||
Office Lease, dated as of August 24, 2015, between FRIT San Jose Town and Country Village, LLC and the Registrant | ||
| 101.INS | XBRL Instance Document | |
| 101.SCH | XBRL Taxonomy Schema Linkbase Document | |
| 101.CAL | XBRL Taxonomy Calculation Linkbase Document | |
| 101.DEF | XBRL Taxonomy Definition Linkbase Document | |
| 101.LAB | XBRL Taxonomy Labels Linkbase Document | |
| 101.RE | XBRL Taxonomy Presentation Linkbase Document | |
| # | Indicates management contract or compensatory plan. | |
| SIGNATURES |
Pursuant to the requirements of Section 13 or 15(d) of the Securities Exchange Act of 1934, the registrant has duly caused this report to be signed on its behalf by the undersigned, thereunto duly authorized, on March 30, 2016.27, 2019.
| SPLUNK INC. | ||
| By: | /s/ Douglas S. Merritt | |
Douglas S. Merritt President and Chief Executive Officer | ||
POWER OF ATTORNEY
KNOW ALL THESE PERSONS BY THESE PRESENTS, that each person whose signature appears below constitutes and appoints Douglas S. Merritt and David F. Conte, and each of them, his or her attorneys-in-fact, each with full power of substitution, for him or her in any and all capacities, to sign any and all amendments to this Annual Report on Form 10-K, and to file the same, with exhibits thereto and other documents in connection therewith, with the Securities and Exchange Commission, hereby ratifying and confirming all that each said attorneys-in-fact or his or her substitute or substitutes, may do or cause to be done by virtue hereof.
Pursuant to the requirements of the Securities Exchange Act of 1934, this Annual Report on Form 10-K has been signed below by the following persons on behalf of the registrant and in the capacities and on the dates indicated.
| Signature | Title | Date |
| /s/ Douglas S. Merritt | President and Chief Executive Officer (Principal Executive Officer) | March |
| Douglas S. Merritt | ||
| /s/ David F. Conte | Senior Vice President and Chief Financial Officer (Principal Financial and Accounting Officer) | March |
| David F. Conte | ||
| /s/ | Chairman and Director | March |
| /s/ Sara J. Baack | Director | March 27, 2019 |
| Sara J. Baack | ||
| /s/ Mark T. Carges | Director | March |
| Mark T. Carges | ||
| /s/ John G. Connors | Director | March |
| John G. Connors | ||
| /s/ Patricia B. Morrison | Director | March |
| Patricia B. Morrison | ||
| /s/ Thomas M. Neustaetter | Director | March |
| Thomas M. Neustaetter | ||
| /s/ Stephen G. Newberry | Director | March |
| Stephen G. Newberry | ||
| /s/ | Director | March |
| /s/ Godfrey R. Sullivan | Director | March 27, 2019 |
| Godfrey R. Sullivan | ||
| /s/ Sri Viswanath | Director | March 27, 2019 |
| Sri Viswanath | ||