The registrant’s Common Stock is traded Over-the-Counter under the symbol FMBM. The aggregate market value of the 2,949,4182,932,029 shares of Common Stock of the registrant issued and outstanding held by non-affiliates on June 30, 20152017 was approximately $66,066,952$85,615,255 based on the closing sales price of $22.40$29.20 per share on that date. For purposes of this calculation, the term “affiliate” refers to all directors and executive officers of the registrant.
As of the close of business on March 21, 2016,9, 2018, there were 3,298,9833,256,579 shares of the registrant's Common Stock outstanding.
DOCUMENTS INCORPORATED BY REFERENCE:
Part III: Proxy Statement for the Annual Meeting of Shareholders to be held on May 14, 201612, 2018 (the “Proxy Statement”).
Table of Contents
| Page | ||||
PART I | ||||
| Item 1 | Business | 2 | ||
| Item 1A | Risk Factors | |||
| Item 1B | Unresolved Staff Comments | |||
| Item 2 | Properties | |||
| Item 3 | Legal Proceedings | |||
| Item 4 | Mine Safety Disclosures | |||
PART II | ||||
| Item 5 | Market for Registrant’s Common Equity, Related Stockholder Matters and Issuer Purchases of Equity Securities | |||
| Item 6 | Selected Financial Data | |||
| Item 7 | Management’s Discussion and Analysis of Financial Condition | |||
| and Results of Operations | ||||
| Item 7A. | Quantitative and Qualitative Disclosures about Market Risk | 42 | ||
| Item 8 | Financial Statements and Supplementary Data | |||
| Item 9 | Changes in and Disagreements with Accountants on Accounting and Financial Disclosure | |||
| Item 9A | Controls and Procedures | |||
| Item 9B | Other Information | |||
PART III | ||||
| Item 10 | Directors, Executive Officers and Corporate Governance | |||
| Item 11 | Executive Compensation | |||
| Item 12 | Security Ownership of Certain Beneficial Owners and Management and Related Stockholder Matters | |||
| Item 13 | Certain Relationships and Related Transactions, and Director Independence | |||
| Item 14 | Principal Accounting Fees and Services | |||
PART IV | ||||
| Item 15 | Exhibits and Financial Statement Schedules | |||
| Item 16 | Form 10-K Summary | 101 | ||
| Signatures | ||||
PART I
Item 1. Business
General
F & M Bank Corp. (the “Company” or “we”), incorporated in Virginia in 1983, is a one bank financial holding company pursuant to section 3(a)(1) of the Bank Holding Company Act of 1956, and owns 100% of the outstanding stock of its affiliate, Farmers & Merchants Bank (Bank)(“Bank”) and a majority interest in VS Title, LLC (“VST”). TEB Life Insurance Company (TEB)(“TEB”) and Farmers & Merchants Financial Services, Inc. (FMFS)(“FMFS”) are wholly owned subsidiaries of Farmers & Merchantsthe Bank. Farmers & MerchantsThe Bank also holds a majority ownership in VBS Mortgage, LLC (VBS)(“VBS”).
As a commercial bank, the Bank offers a wide range of banking services including commercial and individual demand and time deposit accounts, repurchase agreements for commercial customers, commercial and individual loans, internet and mobile banking, drive-in banking services, ATMs at all branch locations and several off-site locations, as well as a courier service for its commercial banking customers. TEB was organized to re-insure credit life and accident and health insurance currently being sold by the Bank in connection with its lending activities. FMFS was organized to write title insurance but now provides brokerage services, commercial and personal lines of insurance to customers of the Bank. VBS originates conventional and government sponsored mortgages through their offices in Harrisonburg, Woodstock and Fishersville. VS Title provides title insurance and real estate settlement services through their offices in Harrisonburg, Fishersville and Charlottesville, VA.
The Bank makes various types of commercial and consumer loans and has a large portfolio of residential mortgages and a concentration in developmentindirect auto lending. The local economy is relatively diverse with strong employment in the agricultural, manufacturing, service and governmental sectors.
The Company’s and the Bank’s principal executive office is at 205 South Main Street, Timberville, VA 22853, and its phone number is (540) 896-8941.
Filings with the SEC
The Company files annual, quarterly and other reports under the Securities Exchange Act of 1934 with the Securities and Exchange Commission (“SEC”). These reports are posted and are available at no cost on the Company’s website, www.FMBankVA.com, as soon as reasonably practicable after the Company files such documents with the SEC. The Company’s filings are also available through the SEC’s website at www.sec.gov.
Employees
On December 31, 2015,2017, the Bank had 168178 full-time and part-time employees; including executive officers, loan and other banking officers, branch personnel, operations personnel and other support personnel. None of the Company’s employees is represented by a union or covered under a collective bargaining agreement. Management of the Company considers their employee relations to be excellent. No one employee devotes full-time services to F & M Bank Corp.
Competition
The Bank's offices face strong competition from numerous other financial institutions. These other institutions include large national and regional banks, other community banks, nationally chartered savings banks, credit unions, consumer finance companies, mortgage companies, loan production offices, mutual funds and life insurance companies. Competition for loans and deposits is affected by a variety of factors including interest rates, types of products offered, the number and location of branch offices, marketing strategies and the reputation of the Bank within the communities served.
PART I, continued
Item 1. Business, continued
Regulation and Supervision
General.The operations of F & M Bank Corp.the Company and the Bank are subject to federal and state statutes, which apply to bankfinancial holding companies and state member banks of the Federal Reserve System. The common stock of F & M Bank Corp.the Company is registered pursuant to and subject to the periodic reporting requirements of the Securities Exchange Act of 1934 (the “Exchange Act”). These include, but are not limited to, the filing of annual, quarterly, and other current reports with the Securities and Exchange Commission (the “SEC”). As an Exchange Act reporting company, the Company is directly affected by the Sarbanes-Oxley Act of 2002 (“Sarbanes-Oxley”), which is aimed at improving corporate governance and reporting procedures.. The Company believes it is in compliance with SEC and other rules and regulations implemented pursuant to Sarbanes-Oxley and intends to comply with any applicable rules and regulations implemented in the future.
As a bankfinancial holding company, F & M Bank Corp.the Company is required to file with the Federal Reserve Board an annual report and such additional information as it may require pursuant to the Act. The Federal Reserve Board may also conduct examinations of F & M Bank Corp. and any or all of its subsidiaries. Under Section 106 of the 1970 Amendments to the Act and the regulations of the Federal Reserve Board, a bank holding company and its subsidiaries are prohibited from engaging in certain tie-in arrangements in connection with an extension of credit, provisionprovision of credit, sale or lease of property or furnishing of services.
The Federal Reserve Board regulations limit activities of bankfinancial holding companies to managing or controlling banks or non-banking activities closely related to banking. These activities include the making or servicing of loans, performing certain data processing services, and certain leasing and insurance agency activities. Since 1994, the Company has entered into agreements with the Virginia Community Development Corporation to purchase equity positions in several Low IncomeLow-Income Housing Funds; these funds provide housing for low-income individuals throughout Virginia. Approval of the Federal Reserve Board is necessary to engage in any of the activities described above or to acquire interests engaging in these activities.
The Bank as a state member bank is supervised and regularly examined by the Virginia Bureau of Financial Institutions and the Federal Reserve Board. SuchBoard; such supervision and examination by the Virginia Bureau of Financial Institutions and the Federal Reserve Board is intended primarily for the protection of depositors and not the stockholders of F & M Bank Corp.the Company.
Payment of Dividends.The Company is a legal entity, separate and distinct from its subsidiaries. A significant portion of the revenues of the Company result from dividends paid to it by the Bank. There are various legal limitations applicable to the payment of dividends by the Bank to the Company. Under the current regulatory guidelines, prior approval from the Federal Reserve Board is required if cash dividends declared in any given year exceed net income for that year, plus retained net profits of the two preceding years. A bank also may not declare a dividend out of or in excess of its net undivided profits without regulatory approval. The payment of dividends by the Bank or the Company may also be limited by other factors, such as requirements to maintain capital above regulatory guidelines.
Bank regulatory agencies have the authority to prohibit the Bank or the Company from engaging in an unsafe or unsound practice in conducting their businesses. The payment of dividends, depending on the financial condition of the Bank, or the Company, could be deemed to constitute such an unsafe or unsound practice. Based on the Bank’s current financial condition, the Company does not expect that any of these laws will have any impact on its ability to obtain dividends from the Bank.
PART I, continued
Item 1. Business, continued
Regulation and Supervision, continued
The Company also is subject to regulatory restrictions on dividends to its shareholders. Regulators have indicated that bank holding companies should generally pay dividends only if the organization’s net income available to common shareholders over the past year has been sufficient to fully fund the dividends and the prospective rate of earnings retention appears consistent with the organization’s capital needs, asset quality, and overall financial condition. Further, a bank holding company should inform and consult with the Federal Reserve Board prior to declaring a dividend that exceeds earnings for the period (e.g., quarter) for which the dividend is being paid or that could result in a material adverse change to the organization’s capital structure.
Capital Requirements.In 2013, the Federal Reserve, the FDICFederal Deposit Insurance Company (FDIC) and the OCCOffice of the Comptroller of the Currency (OCC) approved a new rule that substantially amends the regulatory risk-based capital rules applicable to us. The final rule implements the "Basel III" regulatory capital reforms and changes required by the Dodd-Frank Act (see definition below). The final rule includes new minimum risk-based capital and leverage ratios which was effective for us on January 1, 2015, and refines the definition of what constitutes "capital" for purposes of calculating these ratios. The new minimum capital requirements are: (i) a new common equity Tier 1 ("CET1") capital ratio of 4.5%; (ii) a Tier 1 to risk-based assets capital ratio of 6%, which is increased from 4%; (iii) a total capital ratio of 8%, which is unchanged from the previous rules; and (iv) a Tier 1 leverage ratio of 4%. The final rule also establishes a "capital conservation buffer" of 2.5% above the new regulatory minimum capital ratios, and when fully effective in 2019, will result in the following minimum ratios: (a) a common equity Tier 1 capital ratio of 7.0%; (b) a Tier 1 to risk-based assets capital ratio of 8.5%; and (c) a total capital ratio of 10.5%. The new capital conservation buffer requirement would beis being phased in beginning in January 2016 at 0.625% of risk-weighted assets and would increase each year until fully implemented in Januaryfrom 0.00% for 2015 to 2.50% by 2019. An institution will be subject to limitations on paying dividends, engaging in share repurchases, and paying discretionary bonuses if its capital level falls below the buffer amount. These limitations will establish a maximum percentage of eligible retained income that can be utilized for such activities.
The CETI and Tier 1 leverage ratio of the CompanyBank as of December 31, 2015,2017, were 12.46%14.43% and 12.18%12.07%, respectively, which are significantly above the minimum requirements. The guidelines also provide that banking organizations experiencing internal growth or making acquisitions will be expected to maintain strong capital positions substantially above the minimum supervisory levels, without significant reliance on intangible assets.
In September 2017, the federal bank regulatory agencies proposed to revise and simplify the capital treatment for certain deferred tax assets, mortgage servicing assets, investments in non-consolidated financial entities and minority interests for banking organizations, such as the Bank, that are not subject to the advanced approaches requirements. In November 2017, the regulatory agencies revised the capital rules enacted in 2013 to extend the current transitional treatment of these items for non-advanced approaches banking organizations until the September 2017 proposal is finalized. The September 2017 proposal would also change the capital treatment of certain commercial real estate loans under the standardized approach, which the Bank uses to calculate its capital ratios.
In December 2017, the Basel Committee published standards that it described as the finalization of the Basel III post-crisis regulatory reforms (the standards are commonly referred to as “Basel IV”). Among other things, these standards revise the Basel Committee’s standardized approach for credit risk (including by recalibrating risk weights and introducing new capital requirements for certain “unconditionally cancellable commitments,” such as unused credit card lines of credit) and provide a new standardized approach for operational risk capital. Under the proposed framework, these standards will generally be effective on January 1, 2022, with an aggregate output floor phasing-in through January 1, 2027. Under the current capital rules, operational risk capital requirements and a capital floor apply only to advanced approaches institutions, and not to the Company. The impact of Basel IV on the Company and the Bank will depend on the manner in which it is implemented by the federal bank regulatory agencies.
PART I, continued
Item 1. Business, continued
Regulation and Supervision, continued
Source of Strength. Federal Reserve policy has historically required bank holding companies to act as a source of financial and managerial strength to their subsidiary banks. The Dodd-Frank Act codified this policy as a statutory requirement. Under this requirement, the Company is expected to commit resources to support the Bank, including at times when the Company may not be in a financial position to provide such resources. Any capital loans by a bank holding company to any of its subsidiary banks are subordinate in right of payment to depositors and to certain other indebtedness of such subsidiary banks. In the event of a bank holding company's bankruptcy, any commitment by the bank holding company to a federal bank regulatory agency to maintain the capital of a subsidiary bank will be assumed by the bankruptcy trustee and entitled to priority of payment.
Safety and Soundness. There are a number of obligations and restrictions imposed on bank holding companies and their subsidiary banks by law and regulatory policy that are designed to minimize potential loss to the depositors of such depository institutions and the FDIC insurance fund in the event of a depository institution default. For example, under the Federal Deposit Insurance Corporation Improvement Act of 1991, to avoid receivership of an insured depository institution subsidiary, a bank holding company is required to guarantee the compliance of any subsidiary bank that may become "undercapitalized" with the terms of any capital restoration plan filed by such subsidiary with its appropriate federal bank regulatory agency up to the lesser of (i) an amount equal to 5% of the institution's total assets at the time the institution became undercapitalized or (ii) the amount that is necessary (or would have been necessary) to bring the institution into compliance with all applicable capital standards as of the time the institution fails to comply with such capital restoration plan. Under the Federal Deposit Insurance Act, the federal bank regulatory agencies have adopted guidelines prescribing safety and soundness standards. These guidelines establish general standards relating to internal controls and information systems, internal audit systems, loan documentation, credit underwriting, interest rate exposure, asset growth and compensation, fees and benefits. In general, the guidelines require, among other things, appropriate systems and practices to identify and manage the risk and exposures specified in the guidelines.
The Gramm-Leach-Bliley Act.Effective on March 11, 2001, the Gramm-Leach-Bliley Act (the “GLB Act”) allows a bank holding company or other company to certify status as a financial holding company, which will allow such company to engage in activities that are financial in nature, that are incidental to such activities, or are complementary to such activities. The GLB Act enumerates certain activities that are deemed financial in nature, such as underwriting insurance or acting as an insurance principal, agent or broker; dealing in or making markets in securities; and engaging in merchant banking under certain restrictions. It also authorizes the Federal Reserve to determine by regulation what other activities are financial in nature, or incidental or complementary thereto.
USA Patriot Act of 2001.In October 2001, the USA Patriot Act of 2001 was enacted in response to the terrorist attacks in New York, Pennsylvania and Northern Virginia which occurred on September 11, 2001. The Patriot Act is intended to strengthen U.S. law enforcements’ and the intelligence communities’ abilities to work cohesively to combat terrorism on a variety of fronts. The continuing and potential impact of the Patriot Act and related regulations and policies on financial institutions of all kinds is significant and wide ranging. The Patriot Act contains sweeping anti-money laundering and financial transparency laws, and imposes various regulations, including standards for verifying client identification at account opening, and rules to promote cooperation among financial institutions, regulators and law enforcement entities in identifying parties that may be involved in terrorism or money laundering.
Community Reinvestment Act. The requirements of the Community Reinvestment Act are also applicable to the Bank. The act imposes on financial institutions an affirmative and ongoing obligation to meet the credit needs of their local communities, including low and moderate income neighborhoods, consistent with the safe and sound operation of those institutions. A financial institution’s efforts in meeting community needs currently are evaluated as part of the examination process pursuant to twelve assessment factors. These factors are also considered in evaluating mergers, acquisitions and applications to open a branch or facility.
PART I, continued
Item 1. Business, continued
Regulation and Supervision, continued
Dodd-Frank Wall Street Reform and Consumer Protection Act. The Dodd-Frank Act was signed into law on July 21, 2010. Its wide rangingwide-ranging provisions affect all federal financial regulatory agencies and nearly every aspect of the American financial services industry. Among the provisions of the Dodd-Frank Act that directly impact the Company is the creation of an independent Consumer Financial Protection Bureau (CFPB), which has the ability to implement, examine and enforce complaints with federal consumer protection laws, which govern all financial institutions. For smaller financial institutions, such as the Company and the Bank, their primary regulators will continue to conduct its examination activities.
The Dodd-Frank Act contains provisions designed to reform mortgage lending, which includes the requirement of additional disclosures for consumer mortgages. In addition, the Federal Reserve has issued new rules that have the effect of limiting the fees charged to merchants for debit card transactions. The result of these rules will be to limit the amount of interchange fee income available explicitly to larger banks and indirectly to us. The Dodd-Frank Act also contains provisions that affect corporate governance and executive compensation.
Although the Dodd-Frank Act provisions themselves are extensive, the ultimate impact on the Company of this massive legislation is unknown. The Act provides that several federal agencies, including the Federal Reserve and the Securities and Exchange Commission, shall issue regulations implementing major portions of the legislation, and this process is ongoing.
Mortgage Lending.In 2013, the CFPB adopted a rule, effective in January 2014, to implement certain sections of the Dodd-Frank Act requiring creditors to make a reasonable, good faith determination of a consumer’s ability to repay any closed-end consumer credit transaction secured by a 1-4 family dwelling. The rule also establishes certain protections from liability under this requirement to ensure a borrower’s ability to repay for loans that meet the definition of “qualified mortgage.” Loans that satisfy this “qualified mortgage” safe harbor will be presumed to have complied with the new ability-to-repay standard.
Forward-Looking Statements
Certain information contained in this report may include “forward-looking statements” within the meaning of Section 27A of the Securities Act of 1933, as amended, and Section 21E of the Exchange Act. These forward-looking statements are generally identified by phrases such as “we expect,” “we believe” or words of similar import. Such forward-looking statements involve known and unknown risks including, but not limited to:
●
Changes in the quality or composition of our loan or investment portfolios, including adverse developments in borrower industries, declines in real estate values in our markets, or in the repayment ability of individual borrowers or issuers;
●
The strength of the economy in our target market area, as well as general economic, market, or business conditions;
●
An insufficient allowance for loan losses as a result of inaccurate assumptions;
●
Our ability to maintain our “well-capitalized” regulatory status;
●
Changes in the interest rates affecting our deposits and our loans;
●
Changes in our competitive position, competitive actions by other financial institutions and the competitive nature of the financial services industry and our ability to compete effectively against other financial institutions in our banking markets;
●
Our ability to manage growth;
●
Our potential growth, including our entrance or expansion into new markets, the opportunities that may be presented to and pursued by us and the need for sufficient capital to support that growth;
●
Our exposure to operational risk;
●
Our ability to raise capital as needed by our business;
●
Changes in laws, regulations and the policies of federal or state regulators and agencies;
●
Other circumstances, many of which are beyond our control; and
●
Other factors identified in “Risk Factors” below and in other reports the Company files with the SEC from time to time.
PART I, continued
Item 1. Business, continued
Although we believe that our expectations with respect to the forward-looking statements are based upon reliable assumptions within the bounds of our knowledge of our business and operations, there can be no assurance that our actual results, performance or achievements will not differ materially from any future results, performance or achievements expressed or implied by such forward-looking statements.
Operating Revenue
The following table displays components that contributed 15% or more of the Company’s total operating revenue for the years ended December 31, 2017, 2016, and 2015:
Period | Class of Service | Percentage of Total Revenues |
| December 31, 2017 | Interest and fees on loans held for investment | 77.35% |
| December 31, 2016 | Interest and fees on loans held for investment | 79.02% |
| December 31, 2015 | Interest and fees on loans held for investment | 81.75% |
Executive Officers of the Company
Dean W. Withers, 60, has served as CEO of the Company and Bank since March 1, 2018. Prior to that he served as President/CEO of the Bank since May 2004; Executive Vice President of the Bank from Jan. 2003 to May 2004; Vice President of the Bank from 1993 to 2003. As stated in the form 8-K/A filed in December 2017, Mr. Withers will continue as CEO of the Company and Bank for a transition period, no official retirement date has been set.
Mark C. Hanna, 49, has served as President of the Bank since December 2017. Prior to joining the Company, he served as Executive Vice President and Tidewater Regional President of EVB and its successor, Sonabank from November 2014 through October 2017. Previously, he served as President and Chief Executive Officer of Virginia Company Bank from November 2006 through November 2014.
Neil W. Hayslett, 56, has served as Executive Vice President and Chief Operating Officer of the Bank and the Company since March 1, 2018, prior to that he served as Executive Vice President/Chief Administrative Officer of the Bank and the Company from June 2013 until March 2018 and Executive Vice President/Chief Financial Officer from November 2007 until June 2013. Prior to that time, he served as Senior Vice President/Chief Financial Officer of the Bank and the Company from January 2003 until November 2007 and served as Vice President/Chief Financial Officer from October 1996 to January 2003.
Carrie A. Comer, 48, has served as Executive Vice President and Chief Financial Officer of the Bank and the Company since March 1, 2018, prior to that she served as Senior Vice President/Chief Financial Officer of the Company and Bank since June 2013. Ms. Comer served as Vice President/Controller of the Bank from March 2009 to June 2013. From December 2005 to March 2009, Ms. Comer served as Assistant Vice President/Controller of F&M Bank.
Larry A. Caplinger, 65, has served as Executive Vice President and Chief Projects Officer of the Bank and the Company since January 1, 2018. Prior to that he served as Executive Vice President/Chief Lending Officer of the Bank and the Company since November 2007. Prior to that time, he served as Senior Vice President of the Bank from May 1990 until November 2007 and Senior Vice President of the Company from April 2002 until November 2007. Larry has held a number of positions with the Bank over his 45-year career with the Company.
Stephanie E. Shillingburg, 56, has served as Executive Vice President/Chief Banking Officer of the Bank and the Company since July 2016, Executive Vice President/Chief Retail Officer from June 2013 until July 2016, Senior Vice President/Branch Administrator from February 2005 until June 2013. She also served as Vice President/Branch Administrator from March 2003 until February 2005 and as Branch Manager of the Edinburg Branch from February 2001 until March 2003.
PART I, continued
Item 1. Business, continued
Executive Officers of the Company continued
Edward Strunk, 61, has served as Executive Vice President and Chief Credit Officer of the Bank and the Company since March 1, 2018. Prior to that he serviced as Senior Vice President/Senior Lending Officer since July 2006, Senior Vice President/Commercial Loan Administrator from May 2011 until July 2016, Vice President/Commercial Loan Administrator from February 2011 until May 2011 and Vice Present/Business Development Officer III from May 2007 until February 2011.
Josh Hale, 41, has served as Executive Vice President and Chief Lending Officer of the Bank and the Company since March 1, 2018. Prior to that he served as Senior Vice President/Business Development Leader since June 2013, Vice President/Commercial Relationship Manager III from December 2010 until June 2013, Vice President/Business Development Officer II from March 2009 until December 2010 and Assistant Vice President/Business Development Officer II from December 2004 until March 2009.
Item 1A. Risk Factors
General economic conditions in our market area could adversely affect us.
We are affected by the general economic conditions in the local markets in which we operate. Since theConditions such as economic recession, began in 2008, our market has experienced a significant downturn in which we have seen falling home prices, rising foreclosures and other factors beyond our control could lead to, among other things, an increased level of commercial and consumer delinquencies. Although economic conditions have improved, many businesses and individuals are still experiencing difficulty as a result of the economic downturn and protracted recovery. If economic conditions in our market deteriorate, from current conditions, we could experience further adverse consequences, including a decline in demand for our products and services and an increase in problem assets, forecloses and loan losses. Future economic conditions in our market will depend on factors outside of our control such as political and market conditions, broad trends in industry and finance, legislative and regulatory changes, changes in government, military and fiscal policies and inflation, any of which could negatively affect our performance and financial condition.
Our allowance for loan losses may prove to be insufficient to absorb losses in the loan portfolio.
Like all financial institutions, we maintain an allowance for loan losses to provide for loans that our borrowers may not repay in their entirety. We believe that we maintain an allowance for loan losses at a level adequate to absorb probable losses inherent in the loan portfolio. Through a periodic review and consideration of the loan portfolio, management determines the amount of the allowance for loan losses by considering general market conditions, credit quality of the loan portfolio, the collateral supporting the loans and performance of customers relative to their financial obligations with us. At December 31, 2015,2017, our non-performing loans were $6.5$7.1 million, compared to $6.9$4.9 million at December 31, 2014. Our2016. Approximately $1.5 million of the increase is related to one relationship that is reviewed for impairment and a specific reserve of $249,000 has been recorded. The Company did not record a provision for loan losses was $.3 million for the year ended December 31, 2015,2017, and our loan loss allowance was $8.8$6.04 million, or 1.61%.98% of total loans held for investment at December 31, 2015.2017. The Company anticipates that a provision for loan losses will be required in 2018 based on expected growth coupled with normalized five year historical charge-offs in the lookback period.
The amount of future losses is susceptible to changes in economic, operating and other conditions, including changes in interest rates, which may be beyond our control, and these losses may exceed current estimates. Although we believe the allowance for loan losses is a reasonable estimate of known and inherent losses in the loan portfolio, it cannot fully predict such losses or that the loss allowance will be adequate in the future. While the risk of nonpayment is inherent in banking, we could experience greater nonpayment levels than we anticipate. In addition, we have loan participation arrangements with several other banks within the region and may not be able to exercise control of negotiations with borrowers in the event these loans do not perform. Additional problems with asset quality could cause our interest income and net interest margin to decrease and our provisions for loan losses to increase, further, which could adversely affect our results of operations and financial condition.
Federal and state regulators periodically review our allowance for loan losses and may require us to increase our provision for loan losses or recognize further loan charge-offs, based on judgments different than those of management. Any increase in the amount of the provision or loans charged-off as required by these regulatory agencies could have a negative effect on our operating results.
PART I, continued
Item 1A. Risk Factors, continued
Our loan concentrations could, as a result of adverse market conditions, increase credit losses which could adversely impact earnings.
We offer a variety of secured loans, including commercial lines of credit, commercial term loans, real estate, construction, home equity, consumer and other loans. Many of our loans are secured by real estate (both residential and commercial) in our market area, which could result in adverse consequences to us in the event of a prolonged economic downturn in our market. As of December 31, 2015,2017, approximately 83%80% of our loans had real estate as a primary or secondary component of collateral. A significant decline in real estate values in our market would mean that the collateral for many of our loans would provide less security. As a result, we would be more likely to suffer losses on defaulted loans because our ability to fully recover on defaulted loans by selling the real estate collateral would be diminished. In addition, our consumer loans (such as automobile loans) are collateralized, if at all, with assets that may not provide an adequate source of repayment of the loan due to depreciation, damage or loss.
In addition, we have a large portfolio of residential mortgages and a concentration in development lending, both of which could be adversely affected by a decline in the real estate markets. Construction and development lending entails significant additional risks, because these loans, which often involve larger loan balances concentrated with single borrowers or groups of related borrowers, are dependent on the successful completion of real estate projects. Loan funds for construction and development loans often are advanced upon the security of the land or home under construction, which value is estimated prior to the completion of construction. The deterioration of one or a few of these loans could cause a significant increase in the percentage of non-performing loans. An increase in non-performing loans could result in a loss of earnings from these loans, an increase in the provision for loan losses and an increase in charge-offs, all of which could have a material adverse effect on our financial condition.
In 2012, the Bank began a loan production office which specializes in providing consumer installment loans to finance automobile purchases through a network of automobile dealers. As of December 31, 2017, we had approximately $75 million in loans outstanding in this portfolio. We serve customers over a broad range of creditworthiness, and the required terms and rates are reflective of those risk profiles. While these loans have higher yields than many of our other loans, such loans involve significant risks in addition to normal credit risk. Potential risk elements associated with indirect lending include the limited personal contact with the borrower as a result of indirect lending through our network of dealers, the absence of assured continued employment of the borrower, the varying general creditworthiness of the borrower, changes in the local economy and difficulty in monitoring collateral. While indirect automobile loans are secured, such loans are secured by depreciating assets and characterized by loan to value ratios that could result in us not recovering the full value of an outstanding loan upon default by the borrower. Delinquencies, charge-offs and repossessions of vehicles in this portfolio are always concerns. If general economic conditions worsen, we may experience higher levels of delinquencies, repossessions and charge-offs.
Our small-to-medium sized business target market may have fewer financial resources to weather continued downturn in the economy.
We target our commercial development and marketing strategy primarily to serve the banking and financial services needs of small and medium sized businesses. These businesses generally have less capital or borrowing capacity than larger entities. If general economic conditions negatively impact this major economic sector in the markets in which we operate, our results of operations and financial condition may be adversely affected.
PART I, continued
Item 1A. Risk Factors, continued
Our inability to maintain adequate sources of funding and liquidity may negatively impact our current financial condition or our ability to grow.
Our access to funding and liquidity sources in amounts adequate to finance our activities on terms which are acceptable to us could be impaired by factors that affect us specifically or the financial services industry or economy in general. In managing our balance sheet, a primary source of funding asset growth and liquidity historically has been deposits, including both local customer deposits and brokered deposits. If the level of deposits were to materially decrease, we would have to raise additional funds by increasing the interest that we pay on certificates of deposit or other depository accounts, seek other debt or equity financing, or draw upon our available lines of credit. Our access to these funding and liquidity sources could be detrimentally impacted by a number of factors, including operating losses, rising levels of non-performing assets, a decrease in the level of our business activity as a result of a downturn in the markets in which our loans or deposits are concentrated or regulatory restrictions. In addition, our ability to continue to attract deposits and other funding or liquidity sources is subject to variability based upon additional factors including volume and volatility in the securities markets and the relative interest rates that we are prepared to pay for these liabilities. We do not maintain significant additional sources of liquidity through potential sales in our investment portfolio or liquid assets at the holding company level. Our potential inability to maintain adequate sources of funding or liquidity may, among other things, inhibit our ability to fund asset growth or negatively impact our financial condition, including our ability to pay dividends or satisfy our obligations.
If we do not maintain our capital requirements and our status as a “well-capitalized” bank, there could an adverse effect on our liquidity and our ability to fund our loan portfolio.
We are subject to regulatory capital adequacy guidelines. If we fail to meet the capital adequacy guidelines for a “well-capitalized” bank, it could increase the regulatory scrutiny for the Bank and the Company. In addition, if we failed to be “well capitalized” for regulatory capital purposes, we would not be able to renew or accept brokered deposits without prior regulatory approval and we would not be able to offer interest rates on our deposit accounts that are significantly higher than the average rates in our market area. As a result, it would be more difficult for us to attract new deposits as our existing brokered deposits mature and do not roll over and to retain or increase existing, non-brokered deposits. If we are prohibited from renewing or accepting brokered deposits and are unable to attract new deposits, our liquidity and our ability to fund our loan portfolio may be adversely affected. In addition, we would be required to pay higher insurance premiums to the FDIC, which would reduce our earnings.
We are subject to more stringent capital requirements as a result of the Basel III regulatory capital reforms and the Dodd-Frank Act which could adversely affect our results of operations and future growth.
In 2013, the Federal Reserve, the FDIC and the OCC approved a new rule that substantially amends the regulatory risk-based capital rules applicable to us. The final rule implements the “Basel III” regulatory capital reforms and changes required by the Dodd-Frank Act. The final rule includes new minimum risk-based capital and leverage ratios which waswere effective for us on January 1, 2015 and refines the definition of what constitutes “capital” for purposes of calculating these ratios. The new minimum capital requirements are: (i) a new common equity Tier 1 (“CET1”) capital ratio of 4.5%; (ii) a Tier 1 to risk-based assets capital ratio of 6%, which is increased from 4%; (iii) a total capital ratio of 8%, which is unchanged from the previous rules; and (iv) a Tier 1 leverage ratio of 4%. The final rule also establishes a “capital conservation buffer” of 2.5% above the new regulatory minimum capital ratios, and when fully effective in 2019, will result in the following minimum ratios: (a) a common equity Tier 1 capital ratio of 7.0%; (b) a Tier 1 to risk-based assets capital ratio of 8.5%; and (c) a total capital ratio of 10.5%.The new capital conservation buffer requirement would beis being phased in beginning in January 2016 at 0.625% of risk-weighted assets and would increase each year until fully implemented in Januaryfrom 0.00% for 2015 to 2.50% by 2019.An institution will be subject to limitations on paying dividends, engaging in share repurchases, and paying discretionary bonuses if its capital level falls below the buffer amount. These limitations will establish a maximum percentage of eligible retained income that can be utilized for such activities. In addition, the final rule provides for a number of new deductions from and adjustments to capital and prescribes a revised approach for risk weightings that could result in higher risk weights for a variety of asset categories.
The application of these more stringent capital requirements for us could, among other things, result in lower returns on equity, require the raising of additional capital, adversely affect our future growth opportunities, and result in regulatory actions such as a prohibition on the payment of dividends or on the repurchase shares if we are unable to comply with such requirements.
PART I, continued
Item 1A. Risk Factors, continued
Consumer financial protection laws and regulations could adversely impact our earnings due to, among other things, increased compliance costs or costs due to noncompliance.
The Dodd-Frank Act established the Consumer Financial Protection Bureau has(“CFPD”) with broad authority to administer a new federal regulatory framework of consumer financial regulation, including consumer mortgage banking. For example, the CFPB issued a rule, effective as of January 14, 2014, designed to clarify for lenders how they can avoid monetary damages under the Dodd-Frank Act, which would hold lenders accountable for ensuring a borrower’s ability to repay a mortgage. Loans that satisfy this “qualified mortgage” safe-harbor will be presumed to have complied with the new ability-to-repay standard. Under the Consumer Financial Protection Bureau’s rule, a “qualified mortgage” loan must not contain certain specified features, including but not limited to:
●
●
| interest-only payments; ● negative-amortization; and ● terms longer than 30 years. |
Also, to qualify as a “qualified mortgage,” a borrower’s total monthly debt-to-income ratio may not exceed 43%. Lenders must also verify and document the income and financial resources relied upon to qualify the borrower for the loan and underwrite the loan based on a fully amortizing payment schedule and maximum interest rate during the first five years, taking into account all applicable taxes, insurance and assessments. The Consumer Financial Protection Bureau’sCFPB’s rule on qualified mortgages and other consumer financial protection laws could limit our ability or desire to make certain types of loans or loans to certain borrowers or could make it more expensive and/or time consuming to make these loans, which could adversely impact our growth or profitability.
Our future success is dependent on our ability to effectively compete in the face of substantial competition from other financial institutions in our primary markets.
We encounter significant competition for deposits, loans and other financial services from banks and other financial institutions, including savings and loan associations, savings banks, finance companies, and credit unions in our market area. A number of these banks and other financial institutions are significantly larger than us and have substantially greater access to capital and other resources, larger lending limits, more extensive branch systems, and may offer a wider array of banking services. To a limited extent, we compete with other providers of financial services, such as money market mutual funds, brokerage firms, consumer finance companies, insurance companies and governmental organizations any of which may offer more favorable financing rates and terms than us. Many of these non-bank competitors are not subject to the same extensive regulations that govern us. As a result, these non-bank competitors may have advantages in providing certain services. This competition may reduce or limit our margins and our market share and may adversely affect our results of operations and financial condition.
PART I, continued
Item 1A. Risk Factors, continued
Our exposure to operational risk may adversely affect us.
Similar to other financial institutions, we are exposed to many types of operational risk, including reputational risk, legal and compliance risk, the risk of fraud or theft by employees or outsiders, unauthorized transactions by employees or operational errors, including clerical or record-keeping errors or those resulting from faulty or disabled computer or telecommunications systems.
Reputational risk, or the risk to our earnings and capital from negative public opinion, could result from our actual alleged conduct in any number of activities, including lending practices, corporate governance, regulatory compliance or the occurrence of any of the events or instances mentioned below, or from actions taken by government regulators or community organizations in response to that conduct. Negative public opinion could also result from adverse news or publicity that impairs the reputation of the financial services industry generally.
Further, if any of our financial, accounting, or other data processing systems fail or have other significant shortcomings, we could be adversely affected. We depend on internal systems and outsourced technology to support these data storage and processing operations. Our inability to use or access these information systems at critical points in time could unfavorably impact the timeliness and efficiency of our business operations. We could be adversely affected if one of our employees causes a significant operational break-down or failure, either as a result of human error or where an individual purposefully sabotages or fraudulently manipulates our operations or systems. We are also at risk of the impact of natural disasters, terrorism and international hostilities on our systems or for the effects of outages or other failures involving power or communications systems operated by others.
Misconduct by employees could include fraudulent, improper or unauthorized activities on behalf of clients or improper use of confidential information. We may not be able to prevent employee errors or misconduct, and the precautions we take to detect this type of activity might not be effective in all cases. Employee errors or misconduct could subject us to civil claims for negligence or regulatory enforcement actions, including fines and restrictions on our business.
In addition, there have been instances where financial institutions have been victims of fraudulent activity in which criminals pose as customers to initiate wire and automated clearinghouse transactions out of customer accounts. Although we have policies and procedures in place to verify the authenticity of our customers, we cannot assure that such policies and procedures will prevent all fraudulent transfers. Such activity can result in financial liability and harm to our reputation.
If any of the foregoing risks materialize, it could have a material adverse effect on our business, financial condition and results of operations.
Changes in market interest rates could affect our cash flows and our ability to successfully manage our interest rate risk.
Our profitability and financial condition depend to a great extent on our ability to manage the net interest margin, which is the difference between the interest income earned on loans and investments and the interest expense paid for deposits and borrowings. The amounts of interest income and interest expense are principally driven by two factors; the market levels of interest rates, and the volumes of earning assets or interest bearing liabilities. The management of the net interest margin is accomplished by our Asset Liability Management Committee. Short term interest rates are highly sensitive to factors beyond our control and are effectively set and managed by the Federal Reserve, while longer term rates are generally determined by the market based on investors’ inflationary expectations. Thus, changes in monetary and or fiscal policy will affect both short term and long term interest rates which in turn will influence the origination of loans, the prepayment speed of loans, the purchase of investments, the generation of deposits and the rates received on loans and investment securities and paid on deposits or other sources of funding. The impact of these changes may be magnified if we do not effectively manage the relative sensitivity of our earning assets and interest bearing liabilities to changes in market interest rates. We generally attempt to maintain a neutral position in terms of the volume of earning assets and interest bearing liabilities that mature or can re-price within a one year period in order that we may maintain the maximum net interest margin; however, interest rate fluctuations, loan prepayments, loan production and deposit flows are constantly changing and greatly influence this ability to maintain a neutral position.
PART I, continued
Item 1A. Risk Factors, continued
Generally, our earnings will be more sensitive to fluctuations in interest rates the greater the difference between the volume of earning assets and interest bearing liabilities that mature or are subject to re-pricing in any period. The extent and duration of this sensitivity will depend on the cumulative difference over time, the velocity and direction of interest rate changes, and whether we are more asset sensitive or liability sensitive. Additionally, the Asset Liability Management Committee may desire to move our position to more asset sensitive or more liability sensitive depending upon their expectation of the direction and velocity of future changes in interest rates in an effort to maximize the net interest margin. Should we not be successful in maintaining the desired position, or should interest rates not move as anticipated, our net interest margin may be negatively impacted.
Our inability to successfully manage growth or implement our growth strategy may adversely affect our results of operations and financial condition.
We may not be able to successfully implement our growth strategy if we are unable to identify attractive markets, locations or opportunities to expand in the future. Our ability to manage growth successfully also depends on whether we can maintain capital levels adequate to support our growth, maintain cost controls, asset quality and successfully integrate any businesses acquired into the organization.
As we continue to implement our growth strategy, we may incur increased personnel, occupancy and other operating expenses. We must absorb those higher expenses while we begin to generate new deposits, and there is a further time lag involved in redeploying new deposits into attractively priced loans and other higher yielding earning assets. Thus, our plans to branch could depress earnings in the short run, even if we efficiently execute a branching strategy leading to long-term financial benefits.
Our operations rely on certain external vendors.
We are reliant upon certain external vendors to provide products and services necessary to maintain our day-to-day operations. Accordingly, our operations are exposed to risk that these vendors will not perform in accordance with the contracted arrangements under service agreements. Although we maintain a system of comprehensive policies and a control framework designed to monitor vendor risks, the failure of an external vendor to perform in accordance with the contracted arrangements under service agreements could be disruptive to our operations, which could have a material adverse impact on our business and, in turn, our financial condition and results of operations.
Our operations may be adversely affected by cyber security risks.
In the ordinary course of business, we collect and store sensitive data, including proprietary business information and personally identifiable information of its customers and employees in systems and on networks. The secure processing, maintenance and use of this information is critical to operations and our business strategy. We have invested in accepted technologies and review processes and practices that are designed to protect our networks, computers and data from damage or unauthorized access. Despite these security measures, our computer systems and infrastructure may be vulnerable to attacks by hackers or breached due to employee error, malfeasance or other disruptions. A breach of any kind could compromise systems and the information stored there could be accessed, damaged or disclosed. A breach in security could result in legal claims, regulatory penalties, disruption in operations, and damage to our reputation, which could adversely affect our business.
Legislative or regulatory changes or actions, or significant litigation, could adversely impact us or the businesses in which we are engaged.
We are subject to extensive state and federal regulation, supervision and legislation that govern almost all aspects of our operations. Laws and regulations may change from time to time and are primarily intended for the protection of consumers, depositors and the deposit insurance funds. The impact of any changes to laws and regulations or other actions by regulatory agencies may negatively impact us or our ability to increase the value of our business. Additionally, actions by regulatory agencies or significant litigation against us could cause us to devote significant time and resources to defending ourselves and may lead to penalties that materially affect us. Future changes in the laws or regulations or their interpretations or enforcement could be materially adverse us and our shareholders.
PART I, continued
Item 1A. Risk Factors, continued
Changes in accounting standards could impact reported earnings.
The accounting standard setters, including the FASB,Financial Accounting Standards Board (FASB), SEC and other regulatory bodies, periodically change the financial accounting and reporting standards that govern the preparation of our consolidated financial statements. These changes can be harddifficult to predict and can materially impact how we record and report our financial condition and results of operations. In some cases, we could be required to apply a new or revised standard retroactively, resulting in the restatement of prior period financial statements.
Consumers may decide not to use banks to complete their financial transactions.
Technology and other changes are allowing parties to complete financial transactions through alternative methods that historically have involved banks. The activity and prominence of so-called marketplace lenders and other technological financial service companies have grown significantly over recent years and is expected to continue growing. In addition, consumers can now maintain funds that would have historically been held as bank deposits in brokerage accounts, mutual funds or general-purpose reloadable prepaid cards. Consumers can also complete transactions, such as paying bills and/or transferring funds directly without the assistance of banks. If we are unable to address the competitive pressures that we face, we could lose market share, which could result in reduced net revenue and profitability and lower returns, as well as the loss of customer deposits. The loss of these revenue streams and the lower cost of deposits as a source of funds could have a material adverse effect on our financial condition and results of operations.
Failure to keep pace with technological change could adversely affect our business.
The financial services industry is continually undergoing rapid technological change with frequent introductions of new technology-driven products and services. The effective use of technology increases efficiency and enables financial institutions to better serve customers and to reduce costs. Our future success depends, in part, upon our ability to address the needs of our customers by using technology to provide products and services that will satisfy customer demands, as well as to create additional efficiencies in our operations. Many of our competitors have substantially greater resources to invest in technological improvements. We may not be able to effectively implement new technology-driven products and services or be successful in marketing these products and services to our customers. Failure to successfully keep pace with technological change affecting the financial services industry could have a material adverse impact on our business and, in turn, our financial condition and results of operations.
The full impact of changes to federal tax laws is uncertain and may negatively impact our financial performance.
We are subject to changes in tax law that could increase our effective tax rates. These law changes may be retroactive to previous periods and, as a result, could negatively affect our current and future financial performance.
The Tax Cuts and Jobs Act, the full impact of which is subject to further evaluation and analysis, is likely to have both positive and negative effects on our financial performance. For example, the new legislation will result in a reduction in our federal corporate tax rate from 35% to 21% beginning in 2018, which is expected to have a favorable impact on our earnings and capital generation abilities. However, the new legislation also enacted limitations on certain deductions, such as the deduction of FDIC deposit insurance premiums, which will partially offset the anticipated increase in net earnings from the lower tax rate. In addition, as a result of the lower corporate tax rate, we were required under Generally Accepted Accounting Principles (GAAP) to record a tax expense due to remeasurement in the fourth quarter of 2017 with respect to our deferred tax assets amounting to $811,000. Further, the full impact of the Tax Act may differ from the foregoing and from our expectations, possibly materially, due to changes in interpretations or in assumptions that we have made or that we make in 2018, guidance or regulations that may be promulgated, and other actions that we may take as a result of the Tax Act.
Similarly, the Bank’s customers are likely to experience varying effects from both the individual and business tax provisions of the Tax Act. For example, changes to tax deductibility of business interest expense could impact business customer borrowing. Such effects, whether positive or negative, may have a corresponding impact on our business and the economy as a whole.
Item 1B. Unresolved Staff Comments
The Company does not have any unresolved staff comments to report for the year ended December 31, 2015.
2017.
Item 2. Properties
The locations of F & M Bank Corp., Inc. and its subsidiaries are shown below.
| Corporate Offices | Timberville Branch | Elkton Branch |
| 205 South Main Street | 165 New Market Road | 127 West Rockingham Street |
| Timberville, VA 22853 | Timberville, VA 22853 | Elkton, VA 22827 |
| Broadway Branch | |
| 126 Timberway | |
| Broadway, VA 22815 | Harrisonburg, VA 22801 |
| Bridgewater Branch | Edinburg Branch |
| 100 Plaza Drive | 120 South Main Street |
| Bridgewater, VA 22812 | Edinburg, VA 22824 |
| Woodstock Branch | Crossroads Branch |
| 161 South Main Street | 80 Cross Keys Road |
| Woodstock, VA 22664 | Harrisonburg, VA 22801 |
| Luray Branch | Dealer Finance Division |
| 700 East Main Street | 4759 Spotswood Trail |
| Luray, VA 22835 | Penn Laird, VA 22846 |
| North Augusta Branch | |
| 2813 North Augusta Street | |
| Staunton, VA 22401 | |
| Craigsville Branch | Grottoes Branch |
| 125 W. Craig Street | 200 Augusta Avenue |
| Craigsville, VA 24430 | Grottoes, VA 24441 |
With the exception of the Edinburg Branch, Port Road Branch, Luray Branch, Dealer Finance Division, the Fishersville Loan Production Office and the North Augusta Branch, the remaining facilities are owned by Farmers & Merchants Bank. ATMs are available at all branch locations.
Through an agreement with FCTI, Inc., the Bank also operates cash only ATMs at five Food Lion grocery stores, one in Mt. Jackson, VA and four in Harrisonburg, VA. The Bank also has an agreement with CardTronics ATM to operate twlevetwelve cash only ATMs in various Rite Aid Pharmacies, CVS Pharmacies and Target Stores in Rockingham and Augusta Counties of VA.
| VBS’ offices are located at: | |||
| Harrisonburg Office | |||
| 2040 Deyerle Avenue | 1842 Jefferson Hwy | 161 South Main Street | |
| Suite 107 | Fishersville, VA 22939 | Woodstock, VA 22664 | |
| Harrisonburg, VA 22801 | |||
| VS Title’s offices are located at: | |||
| Harrisonburg Office | Fishersville Office | Charlottesville Office | |
| 410 Neff Avenue | 1707 Jefferson Highway | 154 Hansen Rd., Suite 202-C | |
| Harrisonburg, VA 22801 | Fishersville, VA 22939 | Charlottesville, VA 22911 |
Item 3. Legal Proceedings
In the normal course of business, the Company may become involved in litigation arising from banking, financial, or other activities of the Company. Management after consultation with legal counsel, does not anticipate that the ultimate liability, if any, arising out of these matters will have a material effect on the Company’s financial condition, operating results or liquidity.
Item 4. Mine Safety Disclosures
None.
PART II
Item 5. Market for Registrant’s Common Equity, Related Stockholder Matters and Issuer Purchases of Equity Securities
Stock Listing
The Company’s Common Stock is quoted under the symbol “FMBM” on the OTCQX Market. The bid and ask price is quoted at www.OTCMARKETS.com/Stock/FMBM/quote. With its inclusion on the OTCQX Markets, there are now several active market makers for FMBM stock.
Transfer Agent and Registrar
Broadridge Financial Solutions
2 Journal Plaza Square, 7th Floor
Jersey City, NJ 07306
Stock Performance
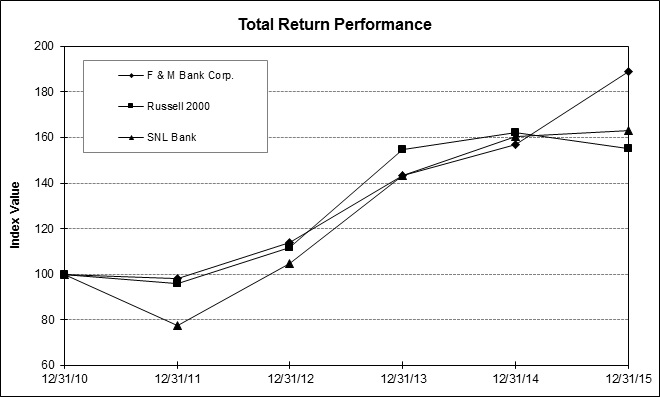
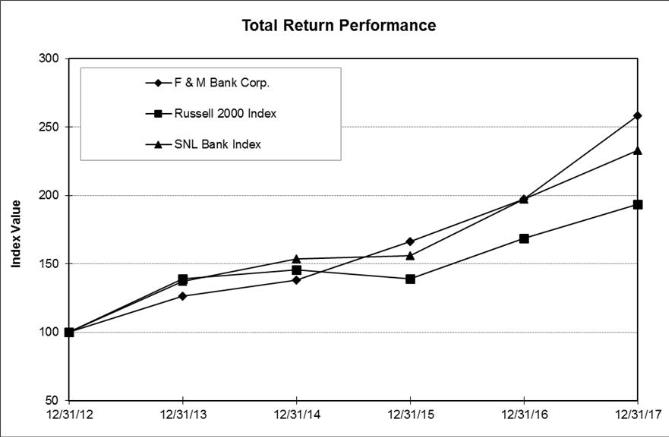
The following graph compares the cumulative total return to the shareholders of the Company for the last five fiscal years with the total return of the Russell 2000 Index and the SNL Bank Index, as reported by SNL Financial, LC, assuming an investment of $100 in the Company’s common stock on December 31, 2010,2012, and the reinvestment of dividends.
| Period Ending | ||||||||||||||||||||||||||||||
Period Ending | ||||||||||||||||||||||||||||||
| Index | 12/31/10 | 12/31/11 | 12/31/12 | 12/31/13 | 12/31/14 | 12/31/15 | 12/31/12 | 12/31/13 | 12/31/14 | 12/31/15 | 12/31/16 | 12/31/17 | ||||||||||||||||||
| F & M Bank Corp. | 100.00 | 98.06 | 113.68 | 143.51 | 156.93 | 189.07 | 100.00 | 126.23 | 138.04 | 166.31 | 197.11 | 258.36 | ||||||||||||||||||
| Russell 2000 | 100.00 | 95.82 | 111.49 | 154.78 | 162.35 | 155.18 | ||||||||||||||||||||||||
| SNL Bank | 100.00 | 77.44 | 104.51 | 143.49 | 160.40 | 163.14 | ||||||||||||||||||||||||
| Russell 2000 Index | 100.00 | 138.82 | 145.62 | 139.19 | 168.85 | 193.58 | ||||||||||||||||||||||||
| SNL Bank Index | 100.00 | 137.30 | 153.48 | 156.10 | 197.23 | 232.91 | ||||||||||||||||||||||||
16
PART II, continued
Item 5. Market for Registrant’s Common Equity, Related Stockholder Matters and Issuer Purchases of Equity Securities, continued
Recent Stock Prices and Dividends
Dividends to common shareholders totaled $2,405,000$2,972,000 and $2,104,000$2,628,000 in 20152017 and 2014,2016, respectively. Preferred stock dividends were $510,000$415,000 and $128,000$487,000 in 20152017 and 2014,2016, respectively. Regular quarterly dividends have been declared for at least 2325 years. The payment of dividends depends on the earnings of the Company and its subsidiaries, the financial condition of the Company and other factors including capital adequacy, regulatory requirements, general economic conditions and shareholder returns. The ratio of dividends per common share to net income per common share was 30.42%35.67% in 2015,2017, compared to 37.36%28.88% in 2014.2016.
Refer to Payment of Dividendsin Item 1. Business, Regulation and Supervision section above for a summary of applicable restrictions on the Company’s ability to pay dividends.
Stock Repurchases
As previously reported, on September 18, 2008, the Company’s Board of Directors approved an increase in the number of shares of common stock that the Company can repurchase under the share repurchase program from 150,000 to 200,000 shares. On October 20, 2016, the Company’s Board of Directors approved a plan to repurchase up to an additional 150,000 shares of common stock. Shares repurchased through the end of 20152017 totaled 177,409221,976 shares; of this amount, 13,27721,984 were repurchased in 2015.2017 at an average price of $32.39 per share.
The number of common shareholders of record was approximately 1,8592,104 as of March 21, 2016.9, 2018. This amount includes all shareholders, whether titled individually or held by a brokerage firm or custodian in street name.
Quarterly Stock Information
These quotes include the terms of trades transacted through a broker. The terms of exchanges occurring between individual parties may not be known to the Company.
| 2015 | 2014 | 2017 | 2016 | |||||||||||||||||||||||||||
Stock Price Range | Per Share | Stock Price Range | Per Share | Stock Price Range | Per Share | Stock Price Range | Per Share | |||||||||||||||||||||||
| Quarter | Low | High | Dividends Declared | Low | High | Dividends Declared | Low | High | Dividends Declared | Low | High | Dividends Declared | ||||||||||||||||||
1st | 19.30 | 20.95 | $ | .18 | 17.21 | 18.00 | $ | .17 | $26.50 | $28.45 | $.22 | $21.75 | $23.55 | $.19 | ||||||||||||||||
2nd | 20.00 | 24.50 | .18 | 17.27 | 19.90 | .17 | 27.50 | 29.35 | .23 | 23.02 | 25.00 | .19 | ||||||||||||||||||
3rd | 20.98 | 22.45 | .18 | 17.70 | 19.08 | .17 | 29.20 | 32.00 | .24 | 23.50 | 26.25 | .20 | ||||||||||||||||||
4th | 21.10 | 24.47 | .19 | 17.83 | 19.73 | .17 | 30.02 | 34.50 | .25 | 24.82 | 27.00 | .22 | ||||||||||||||||||
| Total | $ | .73 | $ | .68 | $.94 | $.80 | ||||||||||||||||||||||||
PART II, continued
Item 6. Selected Financial Data
Five Year Summary of Selected Financial Data
| (Dollars in thousands, except per share data) | 2015 | 2014 | 2013 | 2012 | 2011 | |||||||||||||||
| Income Statement Data: | ||||||||||||||||||||
| Interest and Dividend Income | $ | 29,353 | $ | 26,772 | $ | 25,966 | $ | 27,225 | $ | 27,680 | ||||||||||
| Interest Expense | 2,876 | 3,648 | 4,773 | 6,294 | 7,719 | |||||||||||||||
| Net Interest Income | 26,477 | 23,124 | 21,193 | 20,931 | 19,961 | |||||||||||||||
| Provision for Loan Losses | 300 | 2,250 | 3,775 | 4,200 | 4,000 | |||||||||||||||
| Net Interest Income after Provision for Loan Losses | 26,177 | 20,874 | 17,418 | 16,731 | 15,961 | |||||||||||||||
| Noninterest Income | 3,732 | 3,485 | 3,925 | 3,627 | 3,118 | |||||||||||||||
| Low Income Housing Partnership Losses | (620 | ) | (608 | ) | (856 | ) | (621 | ) | (467 | ) | ||||||||||
| Securities Gains (Losses) | - | - | - | - | 1,024 | |||||||||||||||
| Noninterest Expenses | 17,986 | 15,656 | 14,720 | 13,362 | 12,892 | |||||||||||||||
| Income before Income Taxes | 11,303 | 8,095 | 5,767 | 6,375 | 6,744 | |||||||||||||||
| Income Tax Expense | 2,886 | 2,293 | 1,051 | 1,474 | 2,056 | |||||||||||||||
| Net Income | $ | 8,417 | $ | 5,802 | $ | 4,716 | $ | 4,901 | $ | 4,688 | ||||||||||
| Per Share Data: | ||||||||||||||||||||
| Net Income – basic | $ | 2.40 | $ | 1.82 | $ | 1.88 | $ | 1.96 | $ | 1.91 | ||||||||||
| Net Income - diluted | $ | 2.25 | $ | 1.80 | $ | - | $ | - | $ | - | ||||||||||
| Dividends Declared | .73 | .68 | .68 | .64 | .60 | |||||||||||||||
| Book Value per Common Share | 22.38 | 20.77 | 21.56 | 19.76 | 18.53 | |||||||||||||||
| Balance Sheet Data: | ||||||||||||||||||||
| Assets | $ | 665,357 | $ | 605,308 | $ | 552,788 | $ | 596,904 | $ | 566,734 | ||||||||||
| Loans Held for Investment | 544,053 | 518,202 | 478,453 | 465,819 | 451,570 | |||||||||||||||
| Loans Held for Sale | 57,806 | 13,382 | 3,804 | 77,207 | 60,543 | |||||||||||||||
| Securities | 25,329 | 22,305 | 38,486 | 18,807 | 22,108 | |||||||||||||||
| Deposits | 494,670 | 491,505 | 464,149 | 453,796 | 435,947 | |||||||||||||||
| Short-Term Debt | 24,954 | 14,358 | 3,423 | 34,597 | 18,539 | |||||||||||||||
| Long-Term Debt | 48,161 | 9,875 | 21,691 | 47,905 | 57,298 | |||||||||||||||
| Stockholders’ Equity | 82,950 | 77,798 | 54,141 | 49,384 | 46,180 | |||||||||||||||
| Average Common Shares Outstanding – basic | 3,291 | 3,119 | 2,504 | 2,496 | 2,450 | |||||||||||||||
| Average Common Shares Outstanding – diluted | 3,735 | 3,230 | - | - | - | |||||||||||||||
| Financial Ratios: | ||||||||||||||||||||
Return on Average Assets1 | 1.31 | % | 1.00 | % | .82 | % | .86 | % | .84 | % | ||||||||||
Return on Average Equity1 | 10.46 | % | 8.65 | % | 9.11 | % | 10.26 | % | 10.41 | % | ||||||||||
| Net Interest Margin | 4.43 | % | 4.30 | % | 4.02 | % | 3.95 | % | 3.87 | % | ||||||||||
Efficiency Ratio 2 | 58.96 | % | 58.51 | % | 58.15 | % | 54.03 | % | 55.43 | % | ||||||||||
Dividend Payout Ratio - Common | 30.42 | % | 37.36 | % | 36.17 | % | 32.65 | % | 31.41 | % | ||||||||||
| Capital and Credit Quality Ratios: | ||||||||||||||||||||
Average Equity to Average Assets1 | 12.49 | % | 11.59 | % | 9.00 | % | 8.35 | % | 8.14 | % | ||||||||||
Allowance for Loan Losses to Loans3 | 1.61 | % | 1.68 | % | 1.71 | % | 1.75 | % | 1.54 | % | ||||||||||
Nonperforming Loans to Total Assets4 | .98 | % | 1.15 | % | 2.28 | % | 2.24 | % | 2.61 | % | ||||||||||
Nonperforming Assets to Total Assets5 | 1.34 | % | 1.73 | % | 2.75 | % | 2.73 | % | 3.15 | % | ||||||||||
Net Charge-offs to Total Loans3 | .04 | % | .33 | % | .78 | % | .64 | % | .63 | % | ||||||||||
| (Dollars and shares in thousands, except per share data) | 2017 | 20166 | 20156 | 2014 | 2013 |
| Income Statement Data: | |||||
| Interest and Dividend Income | $34,095 | $32,150 | $29,404 | $26,772 | $25,966 |
| Interest Expense | 3,897 | 3,599 | 2,876 | 3,648 | 4,773 |
| Net Interest Income | 30,198 | 28,551 | 26,528 | 23,124 | 21,193 |
| Provision for Loan Losses | - | - | 300 | 2,250 | 3,775 |
| Net Interest Income After Provision for Loan Losses | 30,198 | 28,551 | 26,228 | 20,874 | 17,418 |
Noninterest Income6 | 8,517 | 6,313 | 5,412 | 3,530 | 4,032 |
| Low income housing partnership losses | (625) | (731) | (619) | (608) | (856) |
Noninterest Expenses6 | 24,719 | 21,272 | 19,554 | 15,656 | 14,720 |
| Income before income taxes | 13,371 | 12,861 | 11,467 | 8,140 | 5,874 |
| Income Tax Expense | 4,330 | 3,099 | 2,886 | 2,293 | 1,051 |
| Net income attributable to noncontrolling interest | (31) | (194) | (164) | (45) | (107) |
| Net Income attributable to F & M Bank Corp. | $9,010 | $9,568 | $8,417 | $5,802 | $4,716 |
| Per Common Share Data: | |||||
| Net Income – basic | $2.63 | $2.77 | $2.40 | $1.82 | $1.88 |
| Net Income - diluted | $2.48 | $2.57 | $2.25 | $1.80 | $1.88 |
| Dividends Declared | .94 | .80 | .73 | .68 | .68 |
| Book Value per Common Share | 25.73 | 24.18 | 22.38 | 20.77 | 21.56 |
| Balance Sheet Data: | |||||
| Assets | $753,270 | $744,889 | $665,357 | $605,308 | $552,788 |
| Loans Held for Investment | 616,974 | 591,636 | 544,053 | 518,202 | 478,453 |
| Loans Held for Sale | 39,775 | 62,735 | 57,806 | 13,382 | 3,804 |
| Securities | 41,243 | 39,475 | 25,329 | 22,305 | 38,486 |
| Deposits | 569,177 | 537,085 | 494,670 | 491,505 | 464,149 |
| Short-Term Debt | 25,296 | 40,000 | 24,954 | 14,358 | 3,423 |
| Long-Term Debt | 49,733 | 64,237 | 48,161 | 9,875 | 21,691 |
| Stockholders’ Equity | 91,275 | 86,682 | 82,950 | 77,798 | 54,141 |
| Average Common Shares Outstanding – basic | 3,270 | 3,282 | 3,291 | 3,119 | 2,504 |
| Average Common Shares Outstanding – diluted | 3,632 | 3,717 | 3,735 | 3,230 | 2,504 |
| Financial Ratios: | |||||
Return on Average Assets1 | 1.21% | 1.34% | 1.31% | 1.00% | .82% |
Return on Average Equity1 | 10.01% | 11.18% | 10.46% | 8.65% | 9.11% |
| Net Interest Margin | 4.53% | 4.34% | 4.43% | 4.30% | 4.02% |
Efficiency Ratio 2 | 63.54% | 60.78% | 60.97% | 58.51% | 58.15% |
| Dividend Payout Ratio - Common | 35.74% | 28.88% | 30.42% | 37.36% | 36.17% |
| Capital and Credit Quality Ratios: | |||||
Average Equity to Average Assets1 | 12.10% | 11.97% | 12.49% | 11.59% | 9.00% |
Allowance for Loan Losses to Loans3 | .98% | 1.27% | 1.61% | 1.68% | 1.71% |
Nonperforming Loans to Total Assets4 | .94% | .65% | .98% | 1.15% | 2.28% |
Nonperforming Assets to Total Assets5 | 1.21% | .94% | 1.34% | 1.73% | 2.75% |
Net Charge-offs to Total Loans3 | .24% | .21% | .04% | .33% | .78% |
1
Ratios are primarily based on daily average balances.
2
The Efficiency Ratio equals noninterest expenses divided by the sum of tax equivalent net interest income and noninterest income. Noninterest income excludes gains (losses) on securities transactions and LIH Partnership losses. Ratio for 2017, 2016 and 2015 reflects reclassification of VBS and VST (2017 only) to report gross income/expense rather than net.
3
Calculated based on Loans Held for Investment, excludes Loans Held for Sale.
4
Calculated based on 90 day past due and non-accrual to Total Assets.
5
Calculated based on 90 day past due, non-accrual and OREO to Total Assets
6
Data reflects reclassification of VBS (2017, 2016, 2015) and VST (2017) to report gross income/expense rather than net
PART II, continued
Item 7. Management’s Discussion and Analysis of Financial Condition and Results of Operations
The following discussion provides information about the major components of the results of operations and financial condition, liquidity and capital resources of F & M Bank Corp. and its subsidiaries. This discussion and analysis should be read in conjunction with the Consolidated Financial Statements and the Notes to the Consolidated Financial Statements presented in Item 8, Financial Statements and Supplementary Information, of this Form 10-K.
Lending Activities
Credit Policies
The principal risk associated with each of the categories of loans in our portfolio is the creditworthiness of our borrowers. Within each category, such risk is increased or decreased, depending on prevailing economic conditions. In an effort to manage the risk, our loan policy gives loan amount approval limits to individual loan officers based on their position and level of experience and to our loan committees based on the size of the lending relationship. The risk associated with real estate and construction loans, commercial loans and consumer loans varies, based on market employment levels, consumer confidence, fluctuations in the value of real estate and other conditions that affect the ability of borrowers to repay indebtedness. The risk associated with real estate construction loans varies, based on the supply and demand for the type of real estate under construction.
We have written policies and procedures to help manage credit risk. We have a loan review policy that includes regular portfolio reviews to establish loss exposure and to ascertain compliance with our loan policy.
We use a management loan committee and a directors’ loan committee to approve loans. The management loan committee is comprised of members of senior management, and the directors’ loan committee is composedcomprised of any six directors. Both committees approve new, renewed and or modified loans that exceed officer loan authorities. The directors’ loan committee also reviews any changes to our lending policies, which are then approved by our board of directors.
Construction and Development Lending
We make construction loans, primarily residential, and land acquisition and development loans. The construction loans are secured by residential houses under construction and the underlying land for which the loan was obtained. The average life of a construction loan is approximately 12 months, and it is typically re-priced as the prime rate of interest changes. The majority of the interest rates charged on these loans float with the market. Construction lending entails significant additional risks, compared with residential mortgage lending. Construction loans often involve larger loan balances concentrated with single borrowers or groups of related borrowers. Another risk involved in construction lending is attributable to the fact that loan funds are advanced upon the security of the land or home under construction, which value is estimated prior to the completion of construction. Thus, it is more difficult to evaluate accurately the total loan funds required to complete a project and related loan-to-value ratios. To mitigate the risks associated with construction lending, we generally limit loan amounts to 75% to 90% of appraised value, in addition to analyzing the creditworthiness of our borrowers. We also obtain a first lien on the property as security for our construction loans and typically require personal guarantees from the borrower’s principal owners.
PART II, continued
Item 7. Management’s Discussion and Analysis of Financial Condition and Results of Operations, Continued
Commercial Real Estate Lending
Commercial real estate loans are secured by various types of commercial real estate in our market area, including multi-family residential buildings, commercial buildings and offices, shopping centers and churches. Commercial real estate lending entails significant additional risks, compared with residential mortgage lending. Commercial real estate loans typically involve larger loan balances concentrated with single borrowers or groups of related borrowers. Additionally, the payment experience on loans secured by income producing properties is typically dependent on the successful operation of a business or a real estate project and thus may be subject, to a greater extent, to adverse conditions in the real estate market or in the economy in general. Our commercial real estate loan underwriting criteria require an examination of debt service coverage ratios and the borrower’s creditworthiness, prior credit history and reputation. We also evaluate the location of the security property and typically require personal guarantees or endorsements of the borrower’s principal owners.
Business Lending
Business loans generally have a higher degree of risk than residential mortgage loans but have higher yields. To manage these risks, we generally obtain appropriate collateral and personal guarantees from the borrower’s principal owners and monitor the financial condition of our business borrowers. Residential mortgage loans generally are made on the basis of the borrower’s ability to make repayment from his employment and other income and are secured by real estate whose value tends to be readily ascertainable. In contrast, business loans typically are made on the basis of the borrower’s ability to make repayment from cash flow from its business and are secured by business assets, such as real estate, accounts receivable, equipment and inventory. As a result, the availability of funds for the repayment of business loans is substantially dependent on the success of the business itself. Furthermore, the collateral for business loans may depreciate over time and generally cannot be appraised with as much precision as residential real estate.
Consumer Lending
We offer various consumer loans, including personal loans and lines of credit, automobile loans, deposit account loans, installment and demand loans, and home equity lines of credit and loans. Such loans are generally made to clients with whom we have a pre-existing relationship. We currently originate all of our consumer loans in our geographic market area.
The underwriting standards employed by us for consumer loans include a determination of the applicant’s payment history on other debts and an assessment of their ability to meet existing obligations and payments on the proposed loan. The stability of the applicant’s monthly income may be determined by verification of gross monthly income from primary employment and additionally from any verifiable secondary income. Although creditworthiness of the applicant is of primary consideration, the underwriting process also includes an analysis of the value of the security in relation to the proposed loan amount. For home equity lines of credit and loans our primary consumer loan category, we require title insurance, hazard insurance and, if required, flood insurance.
Residential Mortgage Lending
The Bank makes residential mortgage loans for the purchase or refinance of existing loans with loan to value limits ranging between 80 and 90% depending on the age of the property, borrower’s income and credit worthiness. Loans that are retained in our portfolio generally carry adjustable rates that can change every three to five years, based on amortization periods of twenty to thirty years.
PART II, continued
Item 7. Management’s Discussion and Analysis of Financial Condition and Results of Operations, Continued
Loans Held for Sale
The Bank makes fixed rate mortgage loans with terms of typically fifteen or thirty years through its subsidiary VBS Mortgage. These loans are typically onfunded by VBS utilizing a line of credit at the Bank’s books for two to three weeks prior to beingBank until sold to investors in the secondary market. Similarly, the Bank also has a relationship with Gateway Savings Bank in Oakland, CA and Northpointe Bank in Grand Rapids, MI whereby it purchases fixed rate conforming 1-4 family mortgage loans for short periods of time pending those loans being sold to investors in the secondary market. These loans have an average duration of ten days to two weeks, but occasionally remain on the Bank’s books for up to 60 days. The Bank has maintained a relationship with Gateway Bank since 2003 and began its relationship with Northpointe Bank in 2014.2014 and had a similar program with a prior bank since 2003. This relationship allows the Bank to achieve a higher rate of return than is available on other short term investment opportunities.
Dealer Finance Division
Critical Accounting Policies
General
The Company’s financial statements are prepared in accordance with accounting principles generally accepted in the United States of America (“GAAP”). The financial information contained within the statements is, to a significant extent, financial information that is based on measures of the financial effects of transactions and events that have already occurred. The Company’s financial position and results of operations are affected by management’s application of accounting policies, including estimates, assumptions and judgments made to arrive at the carrying value of assets and liabilities and amounts reported for revenues, expenses and related disclosures. Different assumptions in the application of these policies could result in material changes in the Company’s consolidated financial position and/or results of operations.
In addition, GAAP itself may change from one previously acceptable method to another method. Although the economics of these transactions would be the same, the timing of events that would impact these transactions could change. Following is a summary of the Company’s significant accounting policies that are highly dependent on estimates, assumptions and judgments.
Allowance for Loan Losses
The allowance for loan losses is an estimate of the losses that may be sustained in the loan portfolio. The allowance is based on two basic principles of accounting: (i) ASC 450 (formerly SFAS No. 5) “Contingencies”,which requires that losses be accrued when they are probable of occurring and estimable and (ii) ASC 310 (formerly SFAS No.114), “Receivables”,which requires that losses be accrued based on the differences between the value of collateral, present value of future cash flows or values that are observable in the secondary market and the loan balance. The Company’s allowance for loan losses is the accumulation of various components that are calculated based on independent methodologies. All components of the allowance represent an estimation performed pursuant to either ASC 450 or ASC 310. Management’s estimate of each ASC 450 component is based on certain observable data that management believes are most reflective of the underlying credit losses being estimated. This evaluation includes credit quality trends; collateral values; loan volumes; geographic, borrower and industry concentrations; seasoning of the loan portfolio; the findings of internal credit quality assessments and results from external bank regulatory examinations. These factors, as well as historical losses and current economic and business conditions, are used in developing estimated loss factors used in the calculations.
PART II, continued
Item 7. Management’s Discussion and Analysis of Financial Condition and Results of Operations, continued
Allowance for Loan Losses, continued
Allowances for loans are determined by applying estimated loss factors to the portfolio based on management’s evaluation and “risk grading” of the loan portfolio. Specific allowances are typically provided on all impaired loans in excess of a defined loan size threshold that are classified in the Substandard or Doubtful risk grades. The specific reserves are determined on a loan-by-loan basis based on management’s evaluation of the Company’s exposure for each credit, given the current payment status of the loan and the value of any underlying collateral.
While management uses the best information available to establish the allowance for loan and lease losses, future adjustments to the allowance may be necessary if economic conditions differ substantially from the assumptions used in making the valuations or, if required by regulators, based upon information available to them at the time of their examinations. Such adjustments to original estimates, as necessary, are made in the period in which these factors and other relevant considerations indicate that loss levels may vary from previous estimates.
Goodwill and Intangibles
In June 2001, the Financial Accounting Standards Board issued ASC 805, (formerly SFAS No. 141), Business Combinations and ASC 350, (formerly SFAS No. 142), Intangibles. ASC 805 requires that the purchase method of accounting be used for all business combinations initiated after June 30, 2001. Additionally, it further clarifies the criteria for the initial recognition and measurement of intangible assets separate from goodwill. ASC 350 was effective for fiscal years beginning after December 15, 2001 and prescribes the accounting for goodwill and intangible assets subsequent to initial recognition. The provisions of ASC 350 discontinue theand amortization of goodwill and intangible assets with indefinite lives. Instead, these assets are subject to an annual impairment review and more frequently if certain impairment indicators are in evidence. ASC 350 also requires that reporting units be identified for the purpose of assessing potential future impairments of goodwill.
The Company adopted ASC 350 on January 1, 2002. Goodwill totaled $2,639,000 at January 1, 2002. As of December 31, 2008, the Company recognized $30,000$31,000 in additional goodwill related to the purchase of 70% ownership in VBS Mortgage. In 2017 the Company recognized $211,000 in goodwill and $285,000 in intangibles related to the purchase of 76% ownership in VST. The goodwill is not amortized but is tested for impairment at least annually. Based on this testing, there were no impairment charges for 2015, 20142017, 2016 or 2013.2015. Application ofThe Intangibles related to the non-amortization provisions of the Statement resultedVST purchase are amortized over periods up to 15 years with $53,000 recorded in additional net income of $120,000 for each of the years ended December 31, 2015, 2014 and 2013.2017.
Income Tax
The determination of income taxes represents results in income and expense being recognized in different periods for financial reporting purposes versus for the purpose of computing income taxes currently payable. Deferred taxes are provided on such temporary differences and are measured using the enacted tax rates expected to apply to taxable income in the years in which those temporary differences are expected to be realized or settled. Further, the Company seeks strategies that minimize the tax effect of implementing its business strategies. Management makes judgementsjudgments regarding the ultimate consequence of long-term tax planning strategies, including the likelihood of future recognition of deferred tax benefits. As a result, it is considered a significant estimate.
PART II, continued
Item 7. Management’s Discussion and Analysis of Financial Condition and Results of Operations, continued
Fair Value
The estimate of fair value involves the use of (1) quoted prices for identical instruments traded in active markets, (2) quoted prices for similar instruments in active markets, quoted prices for identical or similar instruments in markets that are not active, and model-based valuation techniques using significant assumptions that are observable in the market or (3) model-based techniques that use significant assumptions not observable in the market. When observable market prices and parameters are not fully available, management’s judgment is necessary to estimatearrive at fair value possibly including estimates that incorporate estimates of current market participant expectations of future cash flows, risk premiums, among other things. Additionally, significant judgment may be required to determine whether certain assets measured at fair value are classified within the fair value hierarchy as Level 2 or Level 3. The estimation process and the potential materiality of the amounts involved result in this item being identified as critical.
Pension Plan Accounting
The accounting guidance for the measurement and recognition of obligations and expense related to pension plans generally applies the concept that the cost of benefits provided during retirement should be recognized over the employees’ active working life. Inherent in this concept is the requirement to use various actuarial assumptions to predict and measure costs and obligations many years prior to the settlement date. Major actuarial assumptions that require significant management judgment and have a material impact on the measurement of benefits expense and accumulated obligation include discount rates, expected return on assets, mortality rates, health care cost trend rates, and projected salary increases, among others. Changes in assumptions or judgments related to any of these variables could result in significant volatility in the Company’s financial condition and results of operations. As a result, accounting for the Company’s pension expense and obligation is considered a significant estimate. The estimation process and the potential materiality of the amounts involved result in this item being identified as critical.
Other Real Estate Owned (OREO)
OREO is held for sale and represents real estate acquired through or in lieu of foreclosure. OREO is initially recorded at fair value less costs to sell when acquired, establishing a new cost basis. Physical possession of residential real estate property collateralizing a consumer mortgage loan occurs when legal title is obtained upon completion of foreclosure or when the borrower conveys all interest in the property to satisfy the loan through completion of a deed in lieu of foreclosure or through a similar legal agreement. The Company’s policy is to carry OREO on its balance sheet at the lower of cost or fair value less estimated costs to sell. If fair value declines subsequent to foreclosure, a valuation allowance is recorded through expense. Operating costs after acquisition are expensed.
PART II, continued
Item 7. Management’s Discussion and Analysis of Financial Condition and Results of Operations, continued
Overview
The Company’s net income for 20152017 totaled $8,417,000$9,010,000 or $2.40$2.63 per common share, an increasea decrease of 45.07%5.83% from $5,802,000$9,568,000 or $1.82$2.77 a share in 2014.2016. Return on average equity increaseddecreased in 20152017 to 10.46%10.01% versus 8.65%11.18% in 2014,2016, and the return on average assets increaseddecreased from 1.00%1.34% in 2016 to 1.31%.1.21% in 2017. These results reflect an $811,000 tax adjustment due to the write down of deferred tax assets as a result of the change in federal corporate income tax rate from 34% to 21% with the passing of the Tax Cuts & Jobs Act.
See page 1619 for a five-year summary of selected financial data.
Changes in Net Income per Common Share (Basic)
| 2015 | 2014 | |||||||
| to 2014 | to 2013 | |||||||
| Prior Year Net Income Per Common Share | $ | 1.82 | $ | 1.88 | ||||
| Change from differences in: | ||||||||
| Net interest income | 1.02 | .77 | ||||||
| Provision for credit losses | .59 | .61 | ||||||
| Noninterest income, excluding securities gains | .08 | (.18 | ) | |||||
| Noninterest expenses | (.71 | ) | (.37 | ) | ||||
| Income taxes | (.18 | ) | (.40 | ) | ||||
| Effect of common stock raise | - | (.49 | ) | |||||
| Effect of preferred stock dividend | (.12 | ) | - | |||||
| Effect of increase in average shares outstanding | (.10 | ) | - | |||||
| Total Change | .58 | (.06 | ) | |||||
| Net Income Per Common Share | $ | 2.40 | $ | 1.82 | ||||
2017 | 2016 | |
to 2016 | to 2015 | |
| Prior Year Net Income Per Common Share (Basic) | $2.77 | $2.40 |
| Change from differences in: | ||
Net interest income 1 | .52 | .62 |
| Provision for loan losses | - | .09 |
| Noninterest income, excluding securities gains | 1.36 | (.08) |
| Security gains (losses), net | (.01) | - |
Noninterest expenses1 | (1.66) | (.40) |
| Income taxes | (.38) | .12 |
| Effect of preferred stock dividend | .02 | .01 |
| Change in average shares outstanding | .01 | .01 |
| Total Change | (.14) | .37 |
| Net Income Per Common Share (Basic) | $2.63 | $2.77 |
1Noninterest income and noninterest expense reflect the reclassification of VBS to record gross income/expense rather than net.
Net Interest Income
The largest source of operating revenue for the Company is net interest income, which is calculated as the difference between the interest earned on earning assets and the interest expense paid on interest bearing liabilities. Net interest income increased 5.78% from 2016 to 2017 following an increase of 7.60% from 2015 to 2016. The net interest margin is the net interest income expressed as a percentage of interest earning assets. Changes in the volume and mix of interest earning assets and interest bearing liabilities, along with their yields and rates, have a significant impact on the level of net interest income. NetTax equivalent net interest income for 20152017 was $26,477,000$30,342,000 representing an increase of $3,353,000$1,714,000 or 14.50%5.99% over the prior year. A 9.11%7.60% increase in 20142016 versus 20132015 resulted in total tax equivalent net interest income of $23,124,000.$28,683,000.
In this discussion and in the tabular analysis of net interest income performance, entitled “Consolidated Average Balances, Yields and Rates,” (found on page 23)26), the interest earned on tax exempt loans and investment securities has been adjusted to reflect the amount that would have been earned had these investments been subject to normal income taxation. This is referred to as tax equivalent net interest income. For a reconciliation of tax equivalent net interest income to GAAP measures, see the table on page 25.40.
Tax equivalent income on earning assets increased $2,610,000.$2,012,000 in 2017 compared to 2016. Loans held for investment, expressed as a percentage of total earning assets, decreasedincreased in 20152017 to 88.60%90.29% as compared to 91.84%86.02% in 2014.2016. During 2015,2017, yields on earning assets decreased 6increased 23 basis points (BP), primarily due to a 72BP decreaserate increases during 2017 specifically in the yield oncommercial loans, held for sale. This decrease is due to the growth in the short term participation program with Northpointe Bank.investments and federal funds sold. The average cost of interest bearing liabilities decreased 23BPincreased 6BP in 2015,2017, following a decreasean increase of 24BP9BP in 2014.2016. The decrease isincrease in 2017 in due to the redemptionincreased cost of subordinateddeposits and debt agreements at the end of 2014 and the continued low rate environment.as rates increased.
The analysis on the next page reveals an increase in the net interest margin to 4.43%4.53% in 20152017 from 4.34% in 2016, primarily due to changes in balance sheet leverage as higher rate borrowings decreased,and increased interest rates during the increase in noninterest bearing deposit accounts and the growth in the Dealer Finance division produced higher yields.year.
PART II, Continued
Item 7. Management’s Discussion and Analysis of Financial Condition and Results of Operations, Continued
Consolidated Average Balances, Yields and Rates1
| 2015 | 2014 | 2013 | ||||||||||||||||||||||||||||||||||
| Balance | Interest | Rate | Balance | Interest | Rate | Balance | Interest | Rate | ||||||||||||||||||||||||||||
| ASSETS | ||||||||||||||||||||||||||||||||||||
Loans2 | ||||||||||||||||||||||||||||||||||||
| Commercial | $ | 170,272 | $ | 8,103 | 4.76 | % | $ | 164,666 | $ | 7,810 | 4.74 | % | $ | 169,431 | $ | 7,896 | 4.66 | % | ||||||||||||||||||
| Real estate | 295,892 | 14,976 | 5.06 | % | 281,052 | 14,542 | 5.17 | % | 268,902 | 14,796 | 5.50 | % | ||||||||||||||||||||||||
| Installment | 65,870 | 4,981 | 7.56 | % | 50,695 | 3,960 | 7.81 | % | 33,625 | 2,467 | 7.34 | % | ||||||||||||||||||||||||
Loans held for investment4 | 532,034 | 28,060 | 5.27 | % | 496,413 | 26,312 | 5.30 | % | 471,958 | 25,159 | 5.33 | % | ||||||||||||||||||||||||
| Loans held for sale | 40,450 | 1,099 | 2.72 | % | 9,072 | 312 | 3.44 | % | 21,298 | 648 | 3.04 | % | ||||||||||||||||||||||||
Investment securities3 | ||||||||||||||||||||||||||||||||||||
| Fully taxable | 17,372 | 303 | 1.74 | % | 13,392 | 205 | 1.53 | % | 11,718 | 194 | 1.66 | % | ||||||||||||||||||||||||
| Partially taxable | 125 | - | .- | 116 | - | .- | 107 | - | .- | |||||||||||||||||||||||||||
| Tax exempt | - | - | - | - | - | - | - | - | - | |||||||||||||||||||||||||||
| Total investment securities | 17,497 | 303 | 1.74 | % | 13,508 | 205 | 1.53 | % | 11,825 | 194 | 1.66 | % | ||||||||||||||||||||||||
| Interest bearing deposits in banks | 1,223 | - | - | 896 | - | - | 1,084 | 4 | .37 | % | ||||||||||||||||||||||||||
| Federal funds sold | 9,310 | 21 | .23 | % | 20,602 | 44 | .21 | % | 23,094 | 50 | .22 | % | ||||||||||||||||||||||||
| Total Earning Assets | 600,514 | 29,483 | 4.91 | % | 540,491 | 26,873 | 4.97 | % | 529,259 | 26,055 | 4.92 | % | ||||||||||||||||||||||||
| Allowance for loan losses | (8,933 | ) | (8,476 | ) | (8,384 | ) | ||||||||||||||||||||||||||||||
| Nonearning assets | 52,378 | 47,036 | 48,565 | |||||||||||||||||||||||||||||||||
| Total Assets | $ | 643,959 | $ | 579,051 | $ | 569,440 | ||||||||||||||||||||||||||||||
| LIABILITIES AND STOCKHOLDERS’ EQUITY | ||||||||||||||||||||||||||||||||||||
| Deposits | ||||||||||||||||||||||||||||||||||||
| Demand –interest bearing | $ | 112,334 | $ | 539 | .48 | % | $ | 117,396 | $ | 664 | .57 | % | $ | 120,482 | $ | 792 | .66 | % | ||||||||||||||||||
| Savings | 76,491 | 212 | .28 | % | 60,460 | 122 | .20 | % | 52,714 | 119 | .23 | % | ||||||||||||||||||||||||
| Time deposits | 171,829 | 1,402 | .82 | % | 195,933 | 1,704 | .87 | % | 198,786 | 2,331 | 1.17 | % | ||||||||||||||||||||||||
| Total interest bearing deposits | 360,654 | 2,153 | .60 | % | 373,789 | 2,490 | .67 | % | 371,982 | 3,242 | .87 | % | ||||||||||||||||||||||||
| Short-term debt | 32,017 | 69 | .22 | % | 3,872 | 9 | .23 | % | 6,171 | 24 | .39 | % | ||||||||||||||||||||||||
| Long-term debt | 31,856 | 654 | 2.05 | % | 21,501 | 1,149 | 5.34 | % | 36,280 | 1,507 | 4.15 | % | ||||||||||||||||||||||||
| Total interest bearing liabilities | 424,527 | 2,876 | .68 | % | 399,162 | 3,648 | .91 | % | 414,433 | 4,773 | 1.15 | % | ||||||||||||||||||||||||
| Noninterest bearing deposits | 125,665 | 107,647 | 90,170 | |||||||||||||||||||||||||||||||||
| Other liabilities | 13,318 | 5,134 | 13,074 | |||||||||||||||||||||||||||||||||
| Total liabilities | 563,510 | 511,943 | 517,677 | |||||||||||||||||||||||||||||||||
| Stockholders’ equity | 80,449 | 67,108 | 51,763 | |||||||||||||||||||||||||||||||||
| Total liabilities and stockholders’ equity | $ | 643,959 | $ | 579,051 | $ | 569,440 | ||||||||||||||||||||||||||||||
| Net interest earnings | $ | 26,607 | $ | 23,225 | $ | 21,282 | ||||||||||||||||||||||||||||||
| Net yield on interest earning assets (NIM) | 4.43 | % | 4.30 | % | 4.02 | % | ||||||||||||||||||||||||||||||
2017 | 2016 | 2015 | |||||||
Balance | Interest | Rate | Balance | Interest | Rate | Balance | Interest | Rate | |
| ASSETS | |||||||||
Loans2 | |||||||||
| Commercial | $182,646 | $9,475 | 5.19% | $176,389 | $8,362 | 4.74% | $170,272 | $8,103 | 4.76% |
| Real estate | 330,828 | 16,678 | 5.04% | 312,435 | 15,781 | 5.05% | 295,892 | 14,976 | 5.07% |
| Installment | 90,787 | 6,470 | 7.13% | 78,524 | 5,805 | 7.39% | 65,870 | 4,981 | 7.56% |
Loans held for investment4 | 604,261 | 32,623 | 5.40% | 567,348 | 29,948 | 5.28% | 532,034 | 28,087 | 5.28% |
| Loans held for sale | 37,008 | 1,112 | 3.00% | 68,438 | 1,924 | 2.81% | 40,450 | 1,099 | 2.72% |
Investment securities3 | |||||||||
| Fully taxable | 10,886 | 338 | 3.10% | 15,714 | 372 | 2.37% | 17,372 | 327 | 1.88% |
| Partially taxable | 125 | - | - | 125 | - | - | 125 | - | - |
| Total investment securities | 11,011 | 338 | 3.07% | 15,839 | 372 | 2.37% | 17,497 | 327 | 1.88% |
| Interest bearing deposits in banks | 1,512 | 10 | .66% | 727 | 3 | .41% | 1,223 | - | - |
| Federal funds sold | 15,475 | 156 | 1.01% | 7,195 | 35 | .49% | 9,310 | 21 | .23% |
| Total Earning Assets | 669,267 | 34,239 | 5.12% | 659,547 | 32,282 | 4.89% | 600,514 | 29,534 | 4.92% |
| Allowance for loan losses | (6,793) | (8,162) | (8,933) | ||||||
| Nonearning assets | 81,552 | 63,205 | 52,378 | ||||||
| Total Assets | $744,026 | $714,590 | $643,959 | ||||||
| LIABILITIES AND STOCKHOLDERS’ EQUITY | |||||||||
| Deposits | |||||||||
| Demand –interest bearing | $121,095 | $538 | .44% | $113,525 | $499 | .44% | $112,334 | $539 | .48% |
| Savings | 114,489 | 516 | .45% | 100,298 | 441 | .44% | 76,491 | 212 | .28% |
| Time deposits | 159,415 | 1,634 | 1.02% | 160,221 | 1,440 | .90% | 171,829 | 1,402 | .82% |
| Total interest bearing deposits | 394,999 | 2,688 | .68% | 374,044 | 2,380 | .64% | 360,654 | 2,153 | .60% |
| Short-term debt | 20,398 | 63 | .31% | 37,716 | 55 | .15% | 32,017 | 69 | .22% |
| Long-term debt | 53,004 | 1,146 | 2.16% | 56,253 | 1,164 | 2.07% | 31,856 | 654 | 2.05% |
| Total interest bearing liabilities | 468,401 | 3,897 | .83% | 468,013 | 3,599 | .77% | 424,527 | 2,876 | .68% |
| Noninterest bearing deposits | 153,640 | 141,180 | 125,665 | ||||||
| Other liabilities | 31,936 | 19,824 | 13,318 | ||||||
| Total liabilities | 653,977 | 629,017 | 563,510 | ||||||
| Stockholders’ equity | 90,049 | 85,572 | 80,449 | ||||||
| Total liabilities and stockholders’ equity | $744,026 | $714,590 | $643,959 | ||||||
| Net interest earnings | $30,342 | $28,683 | $26,658 | ||||||
| Net yield on interest earning assets (NIM) | 4.53% | �� 4.34% | 4.44% | ||||||
1
Income and yields are presented on a tax-equivalent basis using the applicable federal income tax rate of 34%.
2
Interest income on loans includes loan fees.
3
Average balance information is reflective of historical cost and has not been adjusted for changes in market value.
4
Includes nonaccrual loans.
PART II, Continued
Item 7. Management’s Discussion and Analysis of Financial Condition and Results of Operations, Continued
The following table illustrates the effect of changes in volumes and rates.
| 2015 Compared to 2014 | 2014 Compared to 2013 | 2017 Compared to 2016 | 2016 Compared to 2015 | |||||||||||||||||||||||||||
| Increase (Decrease) | Increase (Decrease) | Increase (Decrease) | ||||||||||||||||||||||||||||
| Due to Change | Increase | Due to Change | Increase | Due to Change | Increase | Due to Change | Increase | |||||||||||||||||||||||
| in Average: | Or | in Average: | or | in Average: | Or | in Average: | or | |||||||||||||||||||||||
| Volume | Rate | (Decrease) | Volume | Rate | (Decrease) | Volume | Rate | (Decrease) | Volume | Rate | (Decrease) | |||||||||||||||||||
| Interest income | ||||||||||||||||||||||||||||||
| Loans held for investment | $ | 1,888 | $ | (140 | ) | $ | 1,748 | $ | 1,303 | $ | (150 | ) | $ | 1,153 | $1,949 | $726 | $2,675 | $1,865 | $(4) | $1,861 | ||||||||||
| Loans held for sale | 1,079 | (292 | ) | 787 | (372 | ) | 36 | (336 | ) | (884) | 72 | (812) | 761 | 64 | 825 | |||||||||||||||
| Investment securities | ||||||||||||||||||||||||||||||
| Taxable | 61 | 37 | 98 | 28 | (17 | ) | 11 | |||||||||||||||||||||||
| Fully taxable | (114) | 80 | (34) | (31) | 76 | 45 | ||||||||||||||||||||||||
| Partially taxable | - | - | - | - | - | - | - | |||||||||||||||||||||||
| Tax exempt | - | - | - | - | - | - | ||||||||||||||||||||||||
| Interest bearing deposits in banks | - | - | - | (1 | ) | (3 | ) | (4 | ) | 3 | 4 | 7 | - | 3 | ||||||||||||||||
| Federal funds sold | (24 | ) | 1 | (23 | ) | (5 | ) | (1 | ) | (6 | ) | 40 | 81 | 121 | (5) | 19 | 14 | |||||||||||||
| Total Interest Income | 3,004 | (394 | ) | 2,610 | 953 | (135 | ) | 818 | 994 | 963 | 1,957 | 2,590 | 158 | 2,748 | ||||||||||||||||
| Interest expense | ||||||||||||||||||||||||||||||
| Deposits | ||||||||||||||||||||||||||||||
| Demand | (29 | ) | (96 | ) | (125 | ) | (20 | ) | (108 | ) | (128 | ) | ||||||||||||||||||
| Demand - interest bearing | 33 | 6 | 39 | 6 | (46) | (40) | ||||||||||||||||||||||||
| Savings | 32 | 58 | 90 | 18 | (15 | ) | 3 | 62 | 13 | 75 | 67 | 162 | 229 | |||||||||||||||||
| Time deposits | (210 | ) | (92 | ) | (302 | ) | (33 | ) | (594 | ) | (627 | ) | (7) | 201 | 194 | (95) | 133 | 38 | ||||||||||||
| Short-term debt | 65 | (5 | ) | 60 | (9 | ) | (6 | ) | (15 | ) | (25) | 33 | 8 | 13 | (27) | (14) | ||||||||||||||
| Long-term debt | 553 | (1,048 | ) | (495 | ) | (613 | ) | 255 | (358 | ) | (67) | 49 | (18) | 500 | 10 | 510 | ||||||||||||||
| Total Interest Expense | 411 | (1,183 | ) | (772 | ) | (657 | ) | (468 | ) | (1,125 | ) | (4) | 302 | 298 | 491 | 232 | 723 | |||||||||||||
| Net Interest Income | $ | 2,593 | $ | 789 | $ | 3,382 | $ | 1 ,610 | $ | 333 | $ | 1,943 | $998 | $661 | $1,659 | $2,099 | $(74) | $2,025 | ||||||||||||
Note: Volume changes have been determined by multiplying the prior years’ average rate by the change in average balances outstanding. The rate change is determined by multiplying the difference betweencurrent year average balance outstanding by the total change andin rate from the volume change.prior year to the current year.
Interest Income
Tax equivalent interest income increased $2,610,000$2,012,000 or 9.71%6.24% in 2015,2017, after increasing 3.14%9.31% or $818,000$2,744,000 in 2014.2016. Overall, the yield on earning assets decreased .06%increased .23%, from 4.97%4.89% to 4.91%5.12%. Average loans held for investment grew during 2015,2017, with average loans outstanding increasing $35,621,000$36,913,000 to $532,034,000. Real$604,261,000. Average real estate loans increased 5.28%5.89%, commercial loans increased 3.40%3.55% and consumer installment loans increased 29.93%.15.62% on average. The increase in average consumer loans is a result of the growth in our Dealer Finance divisionDivision which opened at the end of 2012. The increase in tax equivalent interest income is primarily due to the growth in the Dealer Finance division as well asloan portfolio, with commercial loans contributing the volume in the short term loan participation program with Northpointe Bank. .most interest income growth.
PART II, Continued
Item 7. Management’s Discussion and Analysis of Financial Condition and Results of Operations, Continued
The following table provides detail on the components of tax equivalent net interest income:
GAAP Financial Measurements: (Dollars in thousands). | 2015 | 2014 | 2013 | 2017 | 2016 | 2015 | |||||||||
| Interest Income – Loans | $ | 29,029 | $ | 26,522 | $ | 25,718 | $33,591 | $31,740 | $29,056 | ||||||
| Interest Income - Securities and Other Interest-Earnings Assets | 324 | 249 | 248 | 504 | 410 | 348 | |||||||||
| Interest Expense – Deposits | 2,153 | 2,490 | 3,242 | 2,688 | 2,380 | 2,153 | |||||||||
| Interest Expense - Other Borrowings | 723 | 1,158 | 1,531 | 1,209 | 1,219 | 723 | |||||||||
| Total Net Interest Income | 26,477 | 23,123 | 21,193 | 30,198 | 28,551 | 26,528 | |||||||||
| Non-GAAP Financial Measurements: | |||||||||||||||
| Add: Tax Benefit on Tax-Exempt Interest Income – Loans | 130 | 102 | 89 | 144 | 132 | 130 | |||||||||
| Add: Tax Benefit on Tax-Exempt Interest Income - Securities and Other Interest-Earnings Assets | - | - | - | - | |||||||||||
| Total Tax Benefit on Tax-Exempt Interest Income | 130 | 102 | 89 | 144 | 132 | 130 | |||||||||
| Tax-Equivalent Net Interest Income | $ | 26,607 | $ | 23,225 | $ | 21,282 | $30,342 | $28,683 | $26,658 | ||||||
Interest Expense
Interest expense decreased $772,000increased $298,000 or 21.16%8.28% during 2015,2017, which followed a 23.57% decrease25.14% increase or $1,125,000$723,000 in 2014.2016. The average cost of funds of .68% decreased .23%.83% increased .06% compared to 2014.2016, which followed an increase of .09% in 2016 compared to 2015. Average interest bearing liabilities increased $25,365,000$388,000 in 20152017 following decreasean increase of $15,271,000$43,486,000 in 2014.2016. The increase inaverage interest bearing liabilities was the result of an increasehave remained flat in FHLB borrowings to support loan growth. Due to declining rates2017 and the migration into noninterest bearing accounts the expense associated with time deposits decreased $302,000 (17.72%)increased 10.24% in 2015.2016. Changes in the cost of funds attributable to rate and volume variances can be found in the table at the top of page 24.27.
Noninterest Income
Noninterest income continues to be an increasingly important factor in maintaining and growing profitability. Management is conscious of the need to constantly review fee income and develop additional sources of complementary revenue. During 2017, VBS Mortgage’s income was reclassified to report gross income and gross expenses in the appropriate income statement categories rather than netting in noninterest income, 2016 and 2015 income statements were reclassified to be comparative.
The Company reported an investment loss related to increased volumeboth the Bank and VBS exiting the Bankers Title investment in our low interest rate environment and slight economic improvement. Areas of decrease were service charges on deposit accounts ($71,000), which has experience a steady decline over the past few years with regulatory changes.
2017. The total loss was $42,000. There were no security transactions in 2015, 20142016 or 20132015 which resulted in a gain or loss.
PART II, Continued
Item 7. Management’s Discussion and Analysis of Financial Condition and Results of Operations, Continued
Noninterest Expense
Noninterest expenses increased from $15,656,000$21,272,000 in 20142016 to $17,986,000$24,719,000 in 2015,2017, a 14.88%16.20% increase. Salary and benefits increased 14.14%16.05% to $10,055,000$14,854,000 in 2015,2017 following a 1.60%an increase of 11.72% in 2014.2016. This increase was the result of normal salary increases, additions to staff for new branches, the addition of VS Title (in 2017) and administrative positions as well as increasing benefit costs (including health care cost, pension expense and profit sharing expenses). This year the pension expense increased by $185,000 over 2014. Other real estate ownedOccupancy and Equipment expenses increased $159,000$268,000 or 3.90%16.72% due to costs associated with maintaining the properties and losses from sales or write-downsgrowth in our branch network following an increase of property.5.74% in 2016. Other operating expenses increased $910,000$1,125,000 in 2015,2017, following a $562,000$288,000 increase in 2014. Increases2016. The primary increases were in the areas of information technology ($211,000), credit and debit card related services ($114,000), contributions ($266,000), and VBS and VST other operating expense growth ($101,000). The 2016 primary increases were in advertising and employee appreciation ($114,000)70,000), technologyother loan related costs ($127,000), legal and professional expense ($148,000), Franchise tax expense ($203,000)108,000) and checking account program expenses ($103,000)257,000). Noninterest expenses continue to be substantially lower than peer group averages. Total noninterest expense as a percentage of average assets totaled 2.79%3.32%, 2.70%2.98%, and 2.58%3.04%, in 2017, 2016 and 2015, 2014respectively. With the growth in branches, addition of VST and 2013, respectively.increased staff at VBS mortgage noninterest expenses have shown increase relative to peer data. Peer group averages (as reported in the most recent Uniform Bank Performance Report) have ranged between 2.86%2.80%, 2.89%2.84% and 2.93%2.86% over the same time period.
Provision for Loan Losses
Management evaluates the loan portfolio in light of national and local economic trends, changes in the nature and volume of the portfolio and industry standards. Specific factors considered by management in determining the adequacy of the level of the allowance for loan losses include internally generated loan review reports, past due reports and historical loan loss experience. This review also considers concentrations of loans in terms of geography, business type and level of risk. Management evaluates nonperforming loans relative to their collateral value, when deemed collateral dependent, and makes the appropriate adjustments to the allowance for loan losses when needed. Based on the factors outlined above, the current year provision for loan losses decreased from $2,250,000remained at $0 as in 2014 to $300,000 in 2015.2016. The decrease in the provision for loan losses and the current levels of the allowance for loan losses reflect specific reserves related to nonperforming loans, changes in risk rating on loans,increased net charge-off activity, loan growth, delinquency trends and other credit risk factors that the Company considers in assessing the adequacy of the allowance for loan losses. The Company has experienced an increase in past due loans and nonperforming loans at year end; the nonperforming loans increase can be attributed to one borrower ($1.1 million) that has a specific reserve in the allowance for loan losses; the past due loan increase is primarily attributed to one borrower ($5.9 million) that is being closely monitored. Management is in the process of restructuring the relationship and has determined that there is no impairment at this time. Management will continue to monitor nonperforming and past due loans and will make necessary adjustments to specific reserves and record provision for loan losses if conditions change regarding collateral values or cash flow expectations. Management anticipates the Bank will need to record provision expense in 2018 due to expected growth and a normalized historical charge-off rate.
Actual net loan charge-offs were $244,000$1,499,000 in 20152017 and $1,709,000$1,238,000 in 2014. Loan losses2016. Net charge-offs as a percentage of loans held for investment totaled .04%.24% and .33%.21% in 20152017 and 2014,2016, respectively. The Dealer Finance Division’s charge-off percentage is the largest category at .11% of loans held for investment and land development was .09%. As stated in the most recently available Uniform Bank Holding Company Performance Report (BHCPR)(UPBR), peer group loss averages were .12%.10% in 20152017 and .18%.11% in 2014.2016. The Bank anticipates losses will remain above peer due to the Dealer Finance Division, however these losses have been in line with expectations and are more than offset by the increased yield derived from this portfolio.
Balance Sheet
Total assets increased 9.92%1.13% during the year to $665,357,000,$753,270,000, an increase of $60,049,000$8,381,000 from $605,308,000$744,889,000 in 2014.2016. Loans held for investment grew $25,338,000, Bank premises and equipment increased $5,554,000, whereas loans held for sale decreased $22,960,000 and other asset categories experienced modest fluctuations. Average earning assets increased 11.10%1.47% or $60,023,000$9,720,000 to $600,514,000$669,267,000 at December 31, 2015.2017. The increase in earning assets is due largely to the growth in the short termloans held for investment offset by the decrease in short-term loan participation program with Northpointe BankBank. Deposits grew $32,092,000 and other liabilities decreased $28,304,000 in the Dealer Finance division in installment loans.2017. Average interest bearing deposits decreased $13,135,000increased $20,955,000 for 20152017 or 3.51%5.60%, with all decreasesincreases in both time deposits and interest bearinginterest-bearing demand accounts thereand savings accounts. There was $16,031,000 in growtha slight decrease in the savingstime deposit category. The Company continues to utilize its assets well, with 93.25%89.95% of average assets consisting of earning assets.
PART II, Continued
Item 7. Management’s Discussion and Analysis of Financial Condition and Results of Operations, Continued
Investment Securities
Total securities increased $1,768,000 or 4.48% in 2017 to $41,243,000 at December 31, 2017 from $39,475,000 at December 31, 2016. Average balances in investment securities increased 29.53%decreased 30.48% in 20152017 to $17,497,000.$11,011,000. At year end, 2.91%1.65% of average earning assets of the Company were held as investment securities, to provide security for public deposits and to secure repurchase agreements.all of which are unpledged. Management strives to match the types and maturities of securities owned to balance projected liquidity needs, interest rate sensitivity and to maximize earnings through a portfolio bearing low credit risk. Portfolio yields averaged 1.74%3.07% for 2015,2017, up from 1.53%2.37% in 2014.2016.
There were no Other Than Temporary Impairments (OTTI) write-downs in 2017, 2016 or 2015. In 2017, the Company recognized a $42,000 loss on exit of the Banker’s Title investment; there were no security gains or losses and no Other Than Temporary Impairment (OTTI) write-downs in 2015, 20142016 or 2013. 2015.
The composition of securities at December 31 was:
| (Dollars in thousands) | 2015 | 2014 | 2013 | 2017 | 2016 | 2015 | |||||||||
Available for Sale1 | |||||||||||||||
| U.S. Treasury, Agency and Government Sponsored Enterprises (GSE) | $ | 12,095 | $ | 12,058 | $ | 29,065 | |||||||||
Mortgage-backed2 | 817 | 1,022 | 1,201 | ||||||||||||
| Marketable equity securities | 135 | 135 | - | ||||||||||||
| U.S. Treasury and Agency | $27,978 | $24,014 | $12,095 | ||||||||||||
Mortgage-backed obligations of federal agencies2 | 502 | 634 | 817 | ||||||||||||
| Equity securities | 135 | ||||||||||||||
| Total | 13,047 | 13,215 | 30,266 | 28,615 | 24,783 | 13,047 | |||||||||
| Held to Maturity | |||||||||||||||
| U.S. Treasury and Agency | 125 | 125 | 106 | 125 | |||||||||||
| Total | 125 | 125 | 106 | 125 | |||||||||||
| Other Equity Investments | 12,157 | 8,965 | 8,114 | 12,503 | 14,567 | 12,157 | |||||||||
| Total Securities | $ | 25,329 | $ | 22,305 | $ | c38,486 | $41,243 | $39,475 | $25,329 | ||||||
1
At estimated fair value. See Note 4 to the Consolidated Financial Statements for amortized cost.
2
Issued by a U.S. Government Agency or secured by U.S. Government Agency collateral.
Maturities and weighted average yields of debt securities at December 31, 20152017 are presented in the table below. Amounts are shown by contractual maturity; expected maturities will differ as issuers may have the right to call or prepay obligations. Maturities of Other Investmentsother investments are not readily determinable due to the nature of the investment; see Note 4 to the Consolidated Financial Statements for a description of these investments.
| Less | One to | Five to | Over | Less | One to | Five to | Over | |||||||||||||||||||||||||||||||||||||||||||
| Than one Year | Five Years | Ten Years | Ten Years | Than one Year | Five Years | Ten Years | ||||||||||||||||||||||||||||||||||||||||||||
| (Dollars in thousands) | Amount | Yield | Amount | Yield | Amount | Yield | Amount | Yield | Total | Yield | Amount | Yield | Amount | Yield | Amount | Yield | Amount | Yield | Total | Yield | ||||||||||||||||||||||||||||||
| Debt Securities Available for Sale | ||||||||||||||||||||||||||||||||||||||||||||||||||
| U.S. Treasury, Agency & GSE | $ | 4,075 | .99 | % | $ | 8,020 | .78 | % | $ | - | $ | - | $ | 12,095 | .85 | % | ||||||||||||||||||||||||||||||||||
| Mortgage-backed | 817 | 2.35 | % | 817 | 2.35 | % | ||||||||||||||||||||||||||||||||||||||||||||
| Marketable equities | - | - | - | 135 | 135 | |||||||||||||||||||||||||||||||||||||||||||||
| U.S. Treasury & Agency | $19,998 | 1.05% | $7,980 | 2.06% | $- | $- | $27,978 | 1.34% | ||||||||||||||||||||||||||||||||||||||||||
| Mortgage-backed obligations of federal agencies | 502 | 2.41% | - | 502 | 2.41% | |||||||||||||||||||||||||||||||||||||||||||||
| Equity securities | - | - | - | 135 | 135 | |||||||||||||||||||||||||||||||||||||||||||||
Total | $ | 4,075 | .99 | % | $ | 8,020 | .78 | % | $ | - | $ | 952 | 2.29 | % | $ | 13,047 | .94 | % | $19,978 | 1.05% | $7,980 | 2.06% | $502 | 2.41% | $135 | $28,615 | 1.36% | |||||||||||||||||||||||
| Debt Securities Held to Maturity | ||||||||||||||||||||||||||||||||||||||||||||||||||
| U.S. Treasury & Agency | $ | 125 | .28 | % | $ | 125 | .28 | % | $125 | .75% | $125 | .75% | ||||||||||||||||||||||||||||||||||||||
Total | $ | 125 | .28 | % | $ | 125 | .28 | % | $125 | .75% | $125 | .75% | ||||||||||||||||||||||||||||||||||||||
PART II, Continued
Item 7. Management’s Discussion and Analysis of Financial Condition and Results of Operations, Continued
Analysis of Loan Portfolio
The Company’s market area has a relatively stable economy which tends to be less cyclical than the national economy. Major industries in the market area include agricultural production and processing, higher education, retail sales, services and light manufacturing.
The Company’s portfolio of loans held for investment totaled $544,053,000$616,974,000 at December 31, 20152017 compared with $518,202,000$591,636,000 at the beginning of the year. The Company’s policy has been to make conservative loans that are held for future interest income.income, utilizing prudent underwriting and a strong loan review program. Collateral required by the Company is determined on an individual basis depending on the purpose of the loan and the financial condition of the borrower. Commercial loans, including agricultural and multifamily loans, increased 1.24%3.89% during 20152017 to $176,922,000.$209,721,000. Real estate mortgages increased $8,407,000 (3.76%)$12,260,000 or 5.14%. Growth has included a variety of loan and collateral types including owner occupied residential real estate and residential rental properties.
Construction loans increased $2,579,000decreased $4,552,000 or 3.84%5.98%. The increase in construction lending is a result of improvement in the economy in the Bank’s primary market area. The Bank also has loan participation arrangements with several other banks within the region to aid in diversification of the loan portfolio geographically, by collateral type and by borrower.
Consumer installment loans increased $12,624,000$9,411,000 or 25.44%13.06%. This category includes personal loans, auto loans and other loans to individuals. This category began increasing during the fourth quarter of 2012 due to the opening of the Dealer Finance Division in Penn Laird, Virginia; at year end this Division had a loan portfolio of $54,086,000.$75,169,000. Credit card balances increased $40,000$117,000 to $2,745,000$2,939,000 but are a minor component of the loan portfolio. The following table presents the changes in the loan portfolio over the previous five years.
| December 31 | December 31 | ||||||||||||||||||||||||
| (Dollars in thousands) | 2015 | 2014 | 2013 | 2012 | 2011 | 2017 | 2016 | 2015 | 2014 | 2013 | |||||||||||||||
| Real estate – mortgage | $ | 232,321 | $ | 223,824 | $ | 212,630 | $ | 204,812 | $ | 193,280 | $250,891 | $238,631 | $232,321 | $223,824 | $212,630 | ||||||||||
| Real estate – construction | 69,759 | 67,180 | 68,512 | 71,251 | 72,224 | 71,620 | 76,172 | 69,759 | 67,180 | 68,512 | |||||||||||||||
| Consumer installment | 62,239 | 49,615 | 30,643 | 15,753 | 13,015 | 81,458 | 72,048 | 62,239 | 49,615 | 30,643 | |||||||||||||||
| Commercial | 153,691 | 147,599 | 135,835 | 147,089 | 141,014 | 182,360 | 178,392 | 153,691 | 147,599 | 135,835 | |||||||||||||||
| Agricultural | 15,672 | 15,374 | 16,265 | 14,099 | 15,985 | 17,064 | 15,876 | 15,672 | 15,374 | 16,265 | |||||||||||||||
| Multi-family residential | 7,559 | 11,775 | 11,797 | 9,357 | 13,157 | 10,298 | 7,605 | 7,559 | 11,775 | 11,797 | |||||||||||||||
| Credit cards | 2,745 | 2,705 | 2,680 | 2,788 | 2,812 | 2,939 | 2,822 | 2,745 | 2,705 | 2,680 | |||||||||||||||
| Other | 67 | 130 | 91 | 670 | 83 | 344 | 90 | 67 | 130 | 91 | |||||||||||||||
| Total Loans | $ | 544,053 | $ | 518,202 | $ | 478,453 | $ | 465,819 | $ | 451,570 | $616,974 | $591,636 | $544,053 | $518,202 | $478,453 | ||||||||||
The following table shows the Company’s loan maturity and interest rate sensitivity as of December 31, 2015:
| Less Than | 1-5 | Over | ||||||||||||||
| (Dollars in thousands) | 1 Year | Years | 5 Years | Total | ||||||||||||
| Commercial and | ||||||||||||||||
| agricultural loans | $ | 42,132 | $ | 113,729 | $ | 13,503 | $ | 169,364 | ||||||||
| Multi-family residential | 2,078 | 4,883 | 597 | 7,558 | ||||||||||||
| Real Estate – mortgage | 84,888 | 147,124 | 309 | 232,321 | ||||||||||||
| Real Estate – construction | 53,860 | 15,479 | 420 | 69,759 | ||||||||||||
| Consumer – installment/other | 7,519 | 45,811 | 11,721 | 65,051 | ||||||||||||
| Total | $ | 190,477 | $ | 327,026 | $ | 26,550 | $ | 544,053 | ||||||||
| Loans with predetermined rates | $ | 28,667 | $ | 60,484 | $ | 15,062 | $ | 104,213 | ||||||||
| Loans with variable or | ||||||||||||||||
| adjustable rates | 161,810 | 266,542 | 11,488 | 439,840 | ||||||||||||
| Total | $ | 190,477 | $ | 327,026 | $ | 26,550 | $ | 544,053 | ||||||||
Less Than | 1-5 | Over | ||
| (Dollars in thousands) | 1 Year | Years | 5 Years | Total |
| Commercial and | ||||
| agricultural loans | $66,586 | $106,048 | $26,790 | $199,424 |
| Multi-family residential | 4,628 | 5,173 | 497 | 10,298 |
| Real Estate – mortgage | 104,699 | 141,572 | 4,620 | 250,891 |
| Real Estate – construction | 50,857 | 18,637 | 2,126 | 71,620 |
| Consumer – installment/credit cards/other | 9,027 | 61,600 | 14,114 | 84,741 |
| Total | $235,797 | $333,030 | $48,147 | $616,974 |
| Loans with predetermined rates | $28,101 | $79,748 | $30,378 | $138,227 |
| Loans with variable or | ||||
| adjustable rates | 207,696 | 253,282 | 17,769 | 478,747 |
| Total | $235,797 | $333,030 | $48,147 | $616,974 |
PART II, Continued
Item 7. Management’s Discussion and Analysis of Financial Condition and Results of Operations, Continued
Analysis of Loan Portfolio, continued
Residential real estate loans are generally made for a period not to exceed 25 years and are secured by a first deed of trust which normally does not exceed 90% of the appraised value. If the loan to value ratio exceeds 90%, the Company requires additional collateral, guarantees or mortgage insurance. On approximately 94% of the real estate loans, interest is adjustable after each one, three or five yearfive-year period. The remainder of the portfolio is comprised of fixed rate loans that are generally made for a fifteen-year or a twenty-year period with an interest rate adjustment after ten years.
Since 1992, fixed rate real estate loans have been funded with fixed rate borrowings from the Federal Home Loan Bank, which allows the Company to control its interest rate risk. In addition, the Company makes home equity loans secured by second deeds of trust with total indebtedness not to exceed 90% of the appraised value. Home equity loans are made for three, five or ten year periods at a fixed rate or as a revolving line of credit.
Construction loans may be made to individuals, who have arranged with a contractor for the construction of a residence, or to contractors that are involved in building pre-sold, spec-homes or subdivisions. The majority of commercial loans are made to small retail, manufacturing and service businesses. Consumer loans are made for a variety of reasons; however, approximately 81%74% of the loans are secured by automobiles and trucks.
The Bank has not identified any loan categories that would be considered loan concentrations of greater than 25% of capital in the real estate development category.capital. While the Bank has not developed a formal policy limiting the concentration level to any particular loan type or industry segment, it has established target limits on both a nominal and percentage of capital basis. Concentrations are monitored and reported to the board of directors quarterly. Concentration levels have been used by management to determine how aggressively theywe may price or pursue new loan requests. At December 31, 2015,2017, there are no industry categories of loans that exceed 10% of total loans.
Nonaccrual and Past Due Loans
Nonperforming loans include nonaccrual loans and loans 90 days or more past due. Nonaccrual loans are loans on which interest accruals have been suspended or discontinued permanently. The Company would have earned approximately $267,000$102,000 in additional interest income had the loans on nonaccrual status been current and performing. Nonperforming loans totaled $6,526,000$7,102,000 at December 31, 20152017 compared to $6,975,000$4,870,000 at December 31, 2014.2016. At December 31, 2015 $570,0002017, $198,000 of loans 90 days or more past due were not on nonaccrual status. Approximately 91%88% of these nonperforming loans are secured by real estate. Although management expects that there may be additional loan losses, the bankBank believes that it is generally well secured and continues to actively work with its customers to effect payment. As of December 31, 2015,2017, the Company holds $2,128,000$1,984,000 of real estate which was acquired through foreclosure, of which $125,000 was under contract pending sale in the first quarter of 2016.foreclosure.
Nonperforming loans have decreasedincreased approximately $449,000$2,232,000 since December 31, 2014.2016. Of the increase, $1.5 million relates to two borrowers; one of which has sold equipment and the loan will be modified for collection of the remaining balance, with no loss anticipated as of December 31, 2017. The other relationship is in the process of subdividing property to sell in order to bring the loan current; this loan has been reviewed for impairment and has a specific reserve of $249,000 in our allowance for loan losses at December 31, 2017.
PART II, Continued
Item 7. Management’s Discussion and Analysis of Financial Condition and Results of Operations, Continued
Nonaccrual and Past Due Loans, continued
The following is a summary of information pertaining to risk elements and impairednonperforming loans:
| (Dollars in thousands) | 2015 | 2014 | 2013 | 2012 | 2011 | 2017 | 2016 | 2015 | 2014 | 2013 | |||||||||||||||
| Nonaccrual Loans: | |||||||||||||||||||||||||
| Real Estate - 2011 includes $1,040 of restructured loans | $ | 5,698 | $ | 5,481 | $ | 9,963 | $ | 9,611 | $ | 7,671 | |||||||||||||||
| Commercial - 2011 includes $309 of restructured loans | 109 | 1,179 | 1,890 | 2,914 | 5,888 | ||||||||||||||||||||
| Real Estate | $5,628 | $4,204 | $5,698 | $5,481 | $9,963 | ||||||||||||||||||||
| Commercial | 599 | 70 | 109 | 1,179 | 1,890 | ||||||||||||||||||||
| Home Equity | 40 | 153 | 402 | 740 | 266 | 451 | 311 | 40 | 153 | 402 | |||||||||||||||
| Other | 108 | 161 | - | 121 | 39 | 226 | 178 | 108 | 161 | - | |||||||||||||||
| Loans past due 90 days or more: | |||||||||||||||||||||||||
| Real Estate | 272 | 0 | 246 | - | 646 | 143 | 81 | 272 | 0 | 246 | |||||||||||||||
| Commercial | 25 | 0 | 4 | - | - | - | 25 | 0 | 4 | ||||||||||||||||
| Home Equity | 107 | 0 | 61 | - | 260 | - | 107 | 0 | 61 | ||||||||||||||||
| Other | 167 | 1 | 16 | - | 6 | 55 | 26 | 67 | 1 | 16 | |||||||||||||||
| Total Nonperforming loans | $ | 6,526 | $ | 6,975 | $ | 12,582 | $ | 13,386 | $ | 14,776 | $7,102 | $4,870 | $6,526 | $6,975 | $12,582 | ||||||||||
| Restructured Loans current and performing: | |||||||||||||||||||||||||
| Real Estate | 8,713 | 3,913 | 7,484 | 6,572 | 4,335 | 7,710 | 8,641 | 8,713 | 3,913 | 7,484 | |||||||||||||||
| Commercial | 1,463 | 518 | 3,989 | 3,753 | 1,292 | - | 1,121 | 1,463 | 518 | 3,989 | |||||||||||||||
| Home Equity | 1,414 | 290 | 727 | 450 | 451 | - | 1,414 | 290 | 727 | ||||||||||||||||
| Other | 91 | 22 | - | - | - | 78 | 76 | 91 | 22 | - | |||||||||||||||
| Nonperforming loans as a percentage of loans held for investment | 1.20 | % | 1.35 | % | 2.63 | % | 2.87 | % | 3.27 | % | 1.15% | .82% | 1.20% | 1.35% | 2.63% | ||||||||||
Net Charge Offs to Total Loans Held for Investment | 0.04 | % | 0.33 | % | 0.78 | % | 0.64 | % | 0.63 | % | .24% | .21% | .04% | .33% | .78% | ||||||||||
| Allowance for loan and lease losses to nonperforming loans | 134.55 | % | 125.09 | % | 65.04 | % | 60.91 | % | 46.95 | % | 85.10% | 154.89% | 134.55% | 125.09% | 65.04% | ||||||||||
Potential Problem Loans
Loans classified for regulatory purposes as loss, doubtful, substandard, or special mention do not represent or result from trends or uncertainties which management reasonably expects will materially impact future operating results, liquidity or capital resources. Nor do they represent material credits about which management is aware of any information which causes it to have serious doubts as to the ability of such borrowers to comply with the loan repayment terms. As of December 31, 2015,2017, management is not aware of any potential problem loans which are not already classified for regulatory purposes or on the watch list as part of the Bank’s internal grading system.
PART II, Continued
Item 7. Management’s Discussion and Analysis of Financial Condition and Results of Operations, Continued
Loan Losses and the Allowance for Loan Losses
In evaluating the portfolio, loans are segregated into loans with identified potential losses, pools of loans by type, with separate weighting for past dues and adverse rated loans, and a general allowance based on a variety of criteria. Loans with identified potential losses include examiner and bank classified loans. Classified relationships in excess of $500,000 and loans identified as Troubled Debt Restructuringtroubled debt restructurings are reviewed individually for impairment under ASC 310. A variety of factors are taken into accountconsidered when reviewing these credits, including borrower cash flow, payment history, fair value of collateral, company management, industry and economic factors. Loan relationships that are determined to have no impairment are placed back into the appropriate loan pool and reviewed under ASC 450.
Loans that are not impaired are categorized by call report code into unimpaired and classified loans. For unimpaired loans an estimate is calculated based on actual loss experience over the last five years. Due to the amountyears, for loans of loan losses in the past two years,that type. During 2015, the Company felt the two year losttwo-year loss history utilized in 2014 and prior would not be indicative of the amount of losses that could occur in our current economic cycle, therefore for 2015 the loss history was expanded to five years to capture a more representative loss history. Dealer finance loans utilize the highest year within the five yeara two-year loss history. The Company will monitormonitors the net losses for this division and adjustadjusts based on how the portfolio performs since the department was established in 2012. For classified loans, loans are grouped by call code and past due or adverse risk rating. Loss rates are assigned based on actual loss experience over the last five years multiplied by a risk factor. The Dealer finance loans are given a higher risk factor for past due and adverse risk ratings based on back testing of the risk factors.
A general allowance for inherent losses has been established to reflect other unidentified losses within the portfolio. The general allowance is calculated using six (past dues are now segregated as their own pool) environmentalnine qualitative factors (loan growth, unemployment, interest rates, changesidentified in underwriting practices, local real estate industry conditions, and experience of lending staff).the 2006 Interagency Policy Statement on the allowance for loan losses. The general allowance assists in managing recent changes in portfolio risk that may not be captured in individually impaired loans, past dues or in the homogeneous pools based on five year loss histories. The Board approves the loan loss provision for each quarter based on this evaluation. An effort is made to keep the actual allowance at or above the midpoint of the range established by the evaluation process.
The allowance for loan losses of $8,781,000$6,044,000 at December 31, 20152017 is equal to 1.61%.98% of total loans held for investment. This compares to an allowance of $8,725,000 (1.68%)$7,543,000 or 1.27% at December 31, 20142016 and 1.71%1.61% at December 31, 2013.2015. Management and the Board of Directors made a concentrated effort at increasing the allowance during the recent recession to reflect the increased risks within the portfolio. The overall level of the allowance is above peer group averages and management feelsfeel that the current reserve level is appropriate. Management has reached this conclusionadequate based on the analysis of historical losses, delinquency rates, collateral values of delinquent loans and a thorough review of the loan portfolio. The allowance for loan losses to nonperforming loans has decreased from 154.89% to 85.10% in 2017; increases in the nonperforming loans have been analyzed and, where necessary, a specific reserve has been recorded. In addition, past due and adversely risk rated loans have higher allocation factors within the allowance for loan losses calculation. The Company has experienced a continued decline in historical charge-off rates with 2017 replacing 2012 in the five-year lookback and the local economy showing continued improvements in unemployment. Management will continue to monitor relationships that have recently become past due but are not considered impaired at this time.
Loan losses, net of recoveries, totaled $244,000$1,499,000 in 20152017 which is equivalent to .04%.24% of total loans outstanding. Over the preceding three years, the Company has had an average loss rate of .38%.16%, compared to a .20%.11% loss rate for its peer group.
PART II, Continued
Item 7. Management’s Discussion and Analysis of Financial Condition and Results of Operations, Continued
Loan Losses and the Allowance for Loan Losses, continued
A summary of the activity in the allowance for loan losses follows:
| (Dollars in thousands) | 2015 | 2014 | 2013 | 2012 | 2011 | 2017 | 2016 | 2015 | 2014 | 2013 | |||||||||||||||
| Balance at beginning of period | $ | 8,725 | $ | 8,184 | $ | 8,154 | $ | 6,937 | $ | 5,786 | $7,543 | $8,781 | $8,725 | $8,184 | $8,154 | ||||||||||
| Provision charged to expenses | 300 | 2,250 | 3,775 | 4,200 | 4,000 | - | 300 | 2,250 | 3,775 | ||||||||||||||||
| Loan losses: | |||||||||||||||||||||||||
| Construction/land development | 156 | 1,611 | 2,127 | 1,480 | 1,263 | 620 | 356 | 156 | 1,611 | 2,127 | |||||||||||||||
| Farmland | - | - | - | - | - | - | |||||||||||||||||||
| Real Estate | 25 | 208 | 173 | 482 | 474 | - | 23 | 25 | 208 | 173 | |||||||||||||||
| Multi-family | - | - | - | - | - | - | |||||||||||||||||||
| Commercial Real Estate | - | - | 201 | 424 | 381 | - | 19 | - | 201 | ||||||||||||||||
| Home Equity – closed end | 26 | - | 159 | 69 | 222 | 7 | 8 | 26 | - | 159 | |||||||||||||||
| Home Equity – open end | 51 | 80 | 68 | - | 83 | 26 | 370 | 51 | 80 | 68 | |||||||||||||||
| Commercial & Industrial – Non Real Estate | - | 385 | 986 | 776 | 423 | 179 | 293 | - | 385 | 986 | |||||||||||||||
| Consumer | 32 | 33 | 173 | 45 | 90 | 136 | 37 | 32 | 33 | 173 | |||||||||||||||
| Dealer Finance | 251 | 107 | 17 | - | - | 1,806 | 1,081 | 251 | 107 | 17 | |||||||||||||||
| Credit Cards | 60 | 46 | 121 | 71 | 106 | 98 | 74 | 60 | 46 | 121 | |||||||||||||||
| Total loan losses | 601 | 2,470 | 4,025 | 3,347 | 3,042 | 2,872 | 2,261 | 601 | 2,470 | 4,025 | |||||||||||||||
| Recoveries: | |||||||||||||||||||||||||
| Construction/land development | 85 | 223 | 40 | 192 | - | - | 7 | 85 | 223 | 40 | |||||||||||||||
| Farmland | - | - | - | 3 | - | - | |||||||||||||||||||
| Real Estate | 37 | - | - | - | 8 | 2 | 4 | 37 | - | ||||||||||||||||
| Multi-family | - | - | - | - | 48 | - | |||||||||||||||||||
| Commercial Real Estate | 65 | 108 | 42 | 48 | 16 | 13 | 135 | 65 | 108 | 42 | |||||||||||||||
| Home Equity – closed end | 6 | - | - | - | 3 | 25 | - | 6 | - | ||||||||||||||||
| Home Equity – open end | - | - | 29 | - | 27 | 53 | 120 | - | 29 | ||||||||||||||||
| Commercial & Industrial – Non Real Estate | 62 | 356 | 127 | 62 | 24 | 72 | 267 | 62 | 356 | 127 | |||||||||||||||
| Consumer | 32 | 33 | 14 | 27 | 42 | 28 | 19 | 32 | 33 | 14 | |||||||||||||||
| Dealer Finance | 24 | 6 | - | - | - | 1,143 | 417 | 24 | 6 | - | |||||||||||||||
| Credit Cards | 46 | 35 | 28 | 32 | 25 | 37 | 54 | 46 | 35 | 28 | |||||||||||||||
| Total recoveries | 357 | 761 | 280 | 364 | 193 | 1,373 | 1,023 | 357 | 761 | 280 | |||||||||||||||
| Net loan losses | (244 | ) | (1,709 | ) | (3,745 | ) | (2,983 | ) | (2,849 | ) | (1,499) | (1,238) | (244) | (1,709) | (3,745) | ||||||||||
| Balance at end of period | $ | 8,781 | $ | 8,725 | $ | 8,184 | $ | 8,154 | $ | 6,937 | $6,044 | $7,543 | $8,781 | $8,725 | $8,184 | ||||||||||
| Allowance for loan losses as a | |||||||||||||||||||||||||
| percentage of loans | 1.61 | % | 1.68 | % | 1.71 | % | 1.75 | % | 1.54 | % | .98% | 1.27% | 1.61% | 1.68% | 1.71% | ||||||||||
| Net loan losses to loans held for investment | .04 | % | .33 | % | .78 | % | .64 | % | .63 | % | .24% | .21% | .04% | .33% | .78% | ||||||||||
PART II, Continued
Item 7. Management’s Discussion and Analysis of Financial Condition and Results of Operations, Continued
Loan Losses and the Allowance for Loan Losses, continued
| ALLOCATION OF THE ALLOWANCE FOR LOAN LOSSES | ||||||||||||||||||||||||||||||||||||||||
| 2015 | 2014 | 2013 | 2012* | 2011* | ||||||||||||||||||||||||||||||||||||
Allowance for loan losses: (in thousands) | Balance | Percentage of Loans in Each Category | Balance | Percentage of Loans in Each Category | Balance | Percentage of Loans in Each Category | Balance | Percentage of Loans in Each Category | Balance | Percentage of Loans in Each Category | ||||||||||||||||||||||||||||||
| Construction/Land Development | $ | 4,442 | 50.59 | % | $ | 4,738 | 54.30 | % | $ | 4,007 | 45.93 | % | $ | 2,771 | 33.86 | % | $ | - | - | |||||||||||||||||||||
| Real Estate | 806 | 9.18 | % | 623 | 7.14 | % | 400 | 4.58 | % | 924 | 11.29 | % | - | - | ||||||||||||||||||||||||||
| Commercial, Financial and Agricultural | 1,666 | 18.97 | % | 1,337 | 15.33 | % | 2,239 | 25.66 | % | 3,187 | 38.94 | % | 2,984 | 36.60 | % | |||||||||||||||||||||||||
| Consumer | 1,059 | 12.06 | % | 1,685 | 19.31 | % | 905 | 10.37 | % | 253 | 3.09 | % | 298 | 3.65 | % | |||||||||||||||||||||||||
| Home Equity | 808 | 9.20 | % | 342 | 3.92 | % | 633 | 7.26 | % | 1,019 | 12.45 | % | 920 | 11.28 | % | |||||||||||||||||||||||||
| Total | $ | 8,781 | 100.00 | % | $ | 8,725 | 100.00 | % | $ | 8,184 | 93.80 | % | $ | 8,154 | 99.63 | % | $ | 6,937 | 85.07 | % | ||||||||||||||||||||
* Allocation detail for Construction/Land Development verses Real Estate is not readily available. | ||||||||||||||||||||||||||||||||||||||||
ALLOCATION OF THE ALLOWANCE FOR LOAN LOSSES | ||||||||||
2017 | 2016 | 2015 | 2014 | 2013 | ||||||
| Allowance for loan losses: (dollars in thousands) | Balance | Percentage of Loans in Each Category | Balance | Percentage of Loans in Each Category | Balance | Percentage of Loans in Each Category | Balance | Percentage of Loans in Each Category | Balance | Percentage of Loans in Each Category |
| Construction/Land Development | $2,547 | 42.14% | $3,381 | 44.82% | $4,442 | 50.59% | $4,738 | 54.30% | $4,007 | 48.96% |
| Real Estate | 719 | 11.90% | 843 | 11.18% | 806 | 9.18% | 623 | 7.14% | 400 | 4.89% |
| Commercial, Financial and Agricultural | 863 | 14.28% | 1,348 | 17.88% | 1,666 | 18.97% | 1,337 | 15.33% | 2,239 | 27.36% |
| Consumer | 1,640 | 27.13% | 1,426 | 18.90% | 1,059 | 12.06% | 1,685 | 19.31% | 905 | 11.06% |
| Home Equity | 275 | 4.55% | 545 | 7.22% | 808 | 9.20% | 342 | 3.92% | 633 | 7.73% |
| Total | $6,044 | 100.00% | $7,543 | 100.00% | $8,781 | 100.00% | $8,725 | 100.00% | $8,184 | 100.00% |
Deposits and Borrowings
The average deposit balances and average rates paid for 2015, 20142017, 2016 and 20132015 were as follows:
Average Deposits and Rates Paid (Dollars in thousands)
December 31, | ||||||||||||||||||||||||||||||
| December 31, | 2017 | 2016 | 2015 | |||||||||||||||||||||||||||
| 2015 | 2014 | 2013 | Average Balance | Rate | Average Balance | Rate | Average Balance | Rate | ||||||||||||||||||||||
| Amount | Rate | Amount | Rate | Amount | Rate | |||||||||||||||||||||||||
| Noninterest-bearing | $ | 125,665 | $ | 107,647 | $ | 90,170 | $153,640 | $141,180 | $125,665 | |||||||||||||||||||||
| Interest-bearing: | ||||||||||||||||||||||||||||||
| Interest Checking | $ | 112,334 | .48 | % | $ | 117,396 | .57 | % | $ | 120,482 | .66 | % | $121,095 | .44% | $113,525 | .44% | $112,334 | .48% | ||||||||||||
| Savings Accounts | 76,491 | .28 | % | 60,460 | .20 | % | 52,714 | .23 | % | 114,489 | .45% | 100,298 | .44% | 76,491 | .28% | |||||||||||||||
| Time Deposits: | ||||||||||||||||||||||||||||||
| CDARS | 11,247 | .18 | % | 19,771 | .21 | % | 8,581 | .53 | % | 1,247 | .56% | 1,253 | .88% | 11,247 | .18% | |||||||||||||||
| $100,000 or more | 66,719 | .55 | % | 74,743 | .61 | % | 69,130 | .87 | % | |||||||||||||||||||||
| Less than $100,000 | 93,863 | 1.08 | % | 101,419 | 1.19 | % | 121,075 | 1.39 | % | |||||||||||||||||||||
| Total Interest-bearing | 360,654 | .60 | % | 373,789 | .67 | % | 371,982 | .87 | % | |||||||||||||||||||||
| All other | 158,168 | 1.03% | 158,968 | .90% | 160,582 | .86% | ||||||||||||||||||||||||
| Total interest-bearing | 394,999 | .68% | 374,044 | .64% | 360,654 | .60% | ||||||||||||||||||||||||
| Total deposits | $ | 486,319 | .44 | % | $ | 481,436 | .52 | % | $ | 462,152 | .70 | % | $548,639 | .49% | $515,224 | .46% | $486,319 | .44% | ||||||||||||
PART II, Continued
Item 7. Management’s Discussion and Analysis of decrease in certificatesFinancial Condition and Results of deposit of $100,000Operations, Continued
Deposits and more of $8,024,000 or 10.74% from $74,743,000 at December 31, 2014 to $66,719,000 at December 31, 2015, a decrease in certificates of deposit of less than $100,000 of $7,556,000 or 7.45% from $101,419,000 at December 31, 2014 to $93,863,000 at December 31, 2015 and decrease in CDARs deposits of $8,524,000 or 43.11% from $19,771,000 at December 31, 2014 to $11,247,000 at December 31, 2015 The Bank joined the CDARS network in 2008, which allows it to offer over $50 million in FDIC insurance on a certificate of deposit.Borrowings, continued
The maturity distribution of certificates of deposit of $100,000 or more is as follows:
| (Actual Dollars in thousands) | 2015 | 2014 | ||||||
| Less than 3 months | $ | 5,238 | $ | 32,378 | ||||
| 3 to 6 months | 12,478 | 6,915 | ||||||
| 6 to 12 months | 8,008 | 7,439 | ||||||
| 1 year to 5 years | 27,901 | 33,080 | ||||||
| Total | $ | 53,625 | $ | 79,812 | ||||
| (Actual Dollars in thousands) | 2017 | 2016 |
| Less than 3 months | $4,392 | $2,379 |
| 3 to 6 months | 7,212 | 4,332 |
| 6 to 12 months | 11,410 | 7,624 |
| 1 year to 5 years | 37,606 | 36,534 |
| Total | $60,620 | $50,869 |
Non-deposit borrowings include repurchase agreements, federal funds purchased and Federal Home Loan Bank (FHLB) borrowings, (both short term and long term). Non-deposit borrowings are an important source of funding for the Bank. These sources assist in managing short and long termlong-term funding needs, often at rates that are more favorable than raising additional funds within the deposit portfolio.
Borrowings from the Federal Home Loan BankFHLB are used to support the Bank’s lending program and allow the Bank to manage interest rate risk by laddering maturities and matching funding terms to the terms of various loan types in 4thethe loan portfolio. The Company borrowed $40,000,000 during 2015, with maturities ranging from 5 to 10 years, to replace maturities and lock in lower rates. The Company borrowed $10,000,000 in 2014 and there were no newdid not borrow long term borrowingsFHLB loans during 2017. This compares to $20,000,000 borrowed in 2013.2016 and $40,000,000 in 2015. Repayment of amortizing and fixed maturity loans through FHLB totaled $1,714,000 for the year.$14,429,000 during 2017, including prepayment of $10,000,000 resulting in a prepayment gain of $504,000. These long-term loans carry an average rate of 1.86% at December 31, 2015.2017.
Contractual Obligations and Scheduled Payments (dollars in thousands)
| December 31, 2015 | December 31, 2017 | ||||||||||||||||||||||||
| Less than | One Year Through | Three Years Through | More than | Less than | One Year Through | Three Years Through | More than | ||||||||||||||||||
| One Year | Three Years | Five Years | Five Years | Total | One Year | Three Years | Five Years | Total | |||||||||||||||||
| Securities sold under agreements to repurchase | $ | 3,995 | $ | - | $ | - | $ | - | $ | 3,995 | |||||||||||||||
| Federal funds purchased | $5,296 | $- | $5,296 | ||||||||||||||||||||||
| FHLB Short term advances | 20,000 | - | - | - | 20,000 | 20,000 | - | 20,000 | |||||||||||||||||
| Federal Funds Purchased | 959 | - | - | - | 959 | ||||||||||||||||||||
| FHLB long term advances | 3,929 | 12,857 | 20,357 | 11,018 | 48,161 | 9,429 | 21,357 | 8,643 | 10,125 | 49,554 | |||||||||||||||
| Subordinated Debt | - | - | - | - | - | ||||||||||||||||||||
| Total | $ | 28,883 | $ | 12,857 | $ | 20,357 | $ | 11,018 | $ | 73,115 | $34,725 | $21,357 | $8,643 | $10,125 | $74,850 | ||||||||||
See Note 11 (Short Term Debt) and Note 12 (Long Term Debt) to the Consolidated Financial Statements for a discussion of the rates, terms, and conversion features on these advances.advances
PART II, Continued
Item 7. Management’s Discussion and Analysis of Financial Condition and Results of Operations, Continued
Deposits and Borrowings, continued
Stockholders’ Equity
Total stockholders' equity increased $5,152,000$4,593,000 or 6.62%5.30% in 2015.2017. Net income totaled $8,417,009,$9,010,000, noncontrolling interest net income totaled $164,575, other sales$31,000, issuance of common stock totaled $146,418, changes in other comprehensive income decreased $353,484,$197,000 and capital was reduced by dividends ($2.915 million),of $3,387,000, decreases in other comprehensive income of $295,000, repurchases of common stock of $289,119$712,000, repurchase of preferred stock $101,000 and minority interest distributions of $18,260.$150,000. As of December 31, 2015,2017, book value per common share was $22.38$25.73 compared to $20.77$24.18 as of December 31, 2014.2016. Dividends are paid to stockholders on a quarterly basis in uniform amounts unless unexpected fluctuations in net income indicate a change to this policy is needed.
The Company adopted ASU 2018-02 which allows financial statement preparers an option to reclassify stranded tax effects within accumulated other comprehensive income to retained earnings in each period in which the effect of the change in the U.S. federal corporate income tax rate in the Tax Cuts and Jobs Act (or portion thereof) is recorded. Therefore retained earnings has been adjusted by $682,000 for reflect these changes.
Banking regulators have established a uniform system to address the adequacy of capital for financial institutions. The rules require minimum capital levels based on risk-adjusted assets. Simply stated, the riskier an entity's investments, the more capital it is required to maintain. The Bank as well as the Company, is required to maintain these minimum capital levels. In March 2015, the CompanyBank implemented the Basel III capital requirements, which introduced the Common Equity Tier I ratio in addition to the two previous capital guidelines of Tier I capital (referred to as core capital) and Tier II capital (referred to as supplementary capital). At December 31, 2015,2017, the CompanyBank had Common Equity Tier I capital of 12.46%14.43%, Tier I capital of 14.13%14.43% of risk weighted assets and combined Tier I and II capital of 15.38%15.41% of risk weighted assets. Regulatory minimums at this date were 4.5%, 6% and 10%8%, respectively. The Bank has maintained capital levels far above the minimum requirements throughout the year. In the unlikely event that such capital levels are not met, regulatory agencies are empowered to require the CompanyBank to raise additional capital and/or reallocate present capital.
In addition, the regulatory agencies have issued guidelines requiring the maintenance of a capital leverage ratio. The leverage ratio is computed by dividing Tier I capital by average total assets. The regulators have established a minimum of 5%4% for this ratio but can increase the minimum requirement based upon an institution's overall financial condition. At December 31, 2015,2017, the CompanyBank reported a leverage ratio of 12.18%12.07%. The Bank's leverage ratio was also substantially above the minimum. The Bank also reported a capital conservation buffer of 7.41% at December 31, 2017. The capital conservation buffer is designed to strengthen an institution’s financial resilience during economic cycles. Financial institutions are required to maintain a minimum buffer as required by the Basel III final rules in order to avoid restrictions on capital distributions and other payments. Beginning January 1, 2016, a capital conservation buffer of 0.625% became effective. The capital conservations buffer for 2017 is 1.25% and will gradually be increased through January 1, 2019 to 2.5%.
PART II, Continued
Item 7. Management’s Discussion and Analysis of Financial Condition and Results of Operations, Continued
Market Risk Management
Most of the Company’s net income is dependent on the Bank’s net interest income. Rapid changes in short-term interest rates may lead to volatility in net interest income resulting in additional interest rate risk to the extent that imbalances exist between the maturities or repricing of interest bearing liabilities and interest earning assets. Fortunately theThe Company’s net interest margin increased .13%.19% in 20152017 following an increasea decrease of .28%.09% in 2014.2016. This increase can be attributedis due to increases in interest rates in 2017, loan growth and the growth in the Dealer finance division and continued reduction in cost of funds, in additionnoninterest bearing deposits to the matching of maturities of interest bearing liabilities to interest earning assets.support loan growth. In December 2015,2017, the Federal Open Market Committee elected to raise the short termshort-term rates target .25% to .251.25 to .50%1.50% due to expanding economic activity.
Net interest income is also affected by changes in the mix of funding that supports earning assets. For example, higher levels of non-interest bearing demand deposits and leveraging earning assets by funding with stockholder’s equity would result in greater levels of net interest income than if most of the earning assets were funded with higher cost interest-bearing liabilities, such as certificates of deposit.
Liquid assets, which include cash and cash equivalents, federal funds sold, interest bearing deposits and short term investments averaged $17,022,000$40,189,000 for 2015.2017. The Bank historically has had a stable core deposit base and, therefore, does not have to rely on volatile funding sources. Because of the stable core deposit base, changes in interest rates should not have a significant effect on liquidity. The Bank's membership in the Federal Home Loan Bank has historically provided liquidity as the Bank borrows money that is repaid over a five to ten yearten-year period and uses the money to make fixed rate loans. The matching of the long-term receivables and liabilities helps the Bank reduce its sensitivity to interest rate changes. The Company reviews its interest rate gap periodically and makes adjustments as needed. There are no off balanceoff-balance sheet items that will impair future liquidity.
The following table depicts the Company’s interest rate sensitivity, as measured by the repricing of its interest sensitive assets and liabilities as of December 31, 2015.2017. As the notes to the table indicate, the data was based in part on assumptions as to when certain assets or liabilities would mature or reprice. The analysis indicates an asset sensitive one-year cumulative GAP position of 15.59%21.36% of total earning assets, compared to 13.98%23.71% in 2014.2016. Approximately 41.20%44.40% of rate sensitive assets and 36.48%32.83% of rate sensitive liabilities are subject to repricing within one year. Short term assets (less than one year) increased $10,446,000decreased $11,305,000 during the year, while total earning assets increased $54,741,000.decreased $1,106,000. The increasedecrease is attributed to a decrease in loans held for sale of $22,960,000 and a decrease in federal funds sold of $7,926,000 which were offset by growth in Loans Heldloans held for Investmentinvestment of $25,811,000 as well as Loans Held for Sale$25,221,000 and investments of $44,424,000.$3,832,000. Growth in the loanloans held for investment portfolio was concentrated in real estate secured loans, commercial and the Dealer Finance division. Short term liabilities increased $10,596,000,$5,059,000, while total interest bearing liabilities increased $29,459,000.decreased $12,732,000. The increasedecrease in short term liabilities is due to an increasethe decreased demand in short term debt of $20,000,000 to fund Loans Heldthe loans held for Sale. Due to the relatively flat yield curve, managementsale program. Management has keptraised deposit rates low. These actions and the increaseminimally in total earning assets have resulted in a slightly lower one year cumulative gap than prior year.2017.
PART II, Continued
Item 7. Management’s Discussion and Analysis of Financial Condition and Results of Operations, Continued
Market Risk Management, continued
The following GAP analysis shows the time frames as of December 31, 2015,2017, in which the Company’s assets and liabilities are subject to repricing:
| 1-90 | 91-365 | 1-5 | Over 5 | Not | ||||||||||||||||||||
| (Dollars in thousands) | Days | Days | Years | Years | Classified | Total | ||||||||||||||||||
| Rate Sensitive Assets: | ||||||||||||||||||||||||
| Loans held for investment | $ | 122,425 | $ | 65,307 | $ | 327,026 | $ | 26,550 | $ | - | $ | 541,308 | ||||||||||||
| Loans held for sale | 57,806 | - | - | - | - | 57,806 | ||||||||||||||||||
| Federal funds sold | - | - | - | - | - | - | ||||||||||||||||||
| Investment securities | 125 | 4,075 | 8,020 | 817 | 135 | 13,172 | ||||||||||||||||||
| Credit Cards | 2,745 | - | - | - | - | 2,745 | ||||||||||||||||||
| Interest bearing bank deposits | 1,596 | - | - | - | - | 1,596 | ||||||||||||||||||
| Total | 184,697 | 69,382 | 335,046 | 27,367 | 135 | 616,627 | ||||||||||||||||||
| Rate Sensitive Liabilities: | ||||||||||||||||||||||||
| Interest bearing demand deposits | - | 29,783 | 62,379 | 16,298 | - | 108,460 | ||||||||||||||||||
| Savings deposits | - | 18,076 | 54,230 | 18,077 | - | 90,383 | ||||||||||||||||||
| Certificates of deposit $100,000 and over | 5,239 | 20,486 | 27,900 | - | - | 53,625 | ||||||||||||||||||
| Other certificates of deposit | 14,683 | 40,827 | 51,905 | - | - | 107,415 | ||||||||||||||||||
| Total Deposits | 19,922 | 109,172 | 196,414 | 34,375 | - | 359,883 | ||||||||||||||||||
| Short-term debt | 24,954 | - | - | - | - | 24,954 | ||||||||||||||||||
| Long-term debt | 982 | 2,947 | 33,214 | 11,018 | - | 48,161 | ||||||||||||||||||
| Total | 45,858 | 112,119 | 229,628 | 45,393 | - | 432,998 | ||||||||||||||||||
| Discrete Gap | 138,839 | (42,737 | ) | 105,418 | (18,026 | ) | 135 | 183,629 | ||||||||||||||||
| Cumulative Gap | 138,839 | 96,102 | 201,520 | 183,494 | 183,629 | |||||||||||||||||||
| As a % of Earning Assets | 22.52 | % | 15.59 | % | 32.68 | % | 29.76 | % | 29.78 | % | ||||||||||||||
1-90 | 91-365 | 1-5 | Over 5 | Not | ||
| (Dollars in thousands) | Days | Days | Years | Years | Classified | Total |
| Rate Sensitive Assets: | ||||||
| Loans held for investment | $136,692 | $96,166 | $333,030 | $48,147 | $- | $614,035 |
| Loans held for sale | 39,775 | - | - | - | - | 39,775 |
| Federal funds sold | - | - | - | - | - | - |
| Investment securities | 20,123 | 7,980 | - | 502 | 135 | 28,740 |
| Credit cards | 2,939 | - | - | - | - | 2,939 |
| Interest bearing bank deposits | 1,285 | - | - | - | - | 1,285 |
| Total | 200,814 | 104,146 | 333,030 | 48,649 | 135 | 686,774 |
| Rate Sensitive Liabilities: | ||||||
| Interest bearing demand deposits | - | 32,473 | 69,810 | 18,668 | - | 120,951 |
| Savings deposits | - | 24,144 | 72,434 | 24,145 | - | 120,723 |
| Certificates of deposit $100,000 and over | 4,192 | 17,223 | 39,205 | - | - | 60,620 |
| Other certificates of deposit | 13,313 | 32,095 | 59,242 | - | - | 104,650 |
| Total Deposits | 17,505 | 105,935 | 240,691 | 42,813 | - | 406,944 |
| Short-term debt | 25,296 | - | - | - | - | 25,296 |
| Long-term debt | 1,192 | 8,322 | 30,094 | 10,125 | - | 49,733 |
| Total | 43,993 | 114,257 | 270,785 | 52,938 | - | 481,973 |
| Discrete Gap | 156,821 | (10,111) | 62,245 | (4,289) | 135 | 204,801 |
| Cumulative Gap | 156,821 | 146,710 | 208,955 | 204,666 | 204,801 | |
| As a % of Earning Assets | 22.83% | 21.36% | 30.43% | 29.80% | 29.82% |
●
In preparing the above table, no assumptions are made with respect to loan prepayments or deposit run off. Loan principal payments are included in the earliest period in which the loan matures or can be repriced. Principal payments on installment loans scheduled prior to maturity are included in the period of maturity or repricing. Proceeds from the redemption of investments and deposits are included in the period of maturity. Estimated maturities on deposits which have no stated maturity dates were derived from guidance contained in FDICIA 305.
PART II, Continued
Item 7. Management’s Discussion and Analysis of Financial Condition and Results of Operations, Continued
Quarterly Results (unaudited)
The table below lists the Company’s quarterly performance for the years ended December 31, 20152017 and 2014:2016:
| 2015 | 2017 | ||||||||||||||||||||||||
| (Dollars in thousands) | Fourth | Third | Second | First | Total | Fourth | Third | Second | First | Total | |||||||||||||||
| Interest and Dividend Income | $ | 7,518 | $ | 7,451 | $ | 7,373 | $ | 7,011 | $ | 29,353 | $9,141 | $8,688 | $8,256 | $8,010 | $34,095 | ||||||||||
| Interest Expense | 771 | 722 | 698 | 685 | 2,876 | 1,036 | 1,030 | 925 | 906 | 3,897 | |||||||||||||||
| Net Interest Income | 6,747 | 6,729 | 6,675 | 6,326 | 26,477 | 8,105 | 7,658 | 7,331 | 7,104 | 30,198 | |||||||||||||||
| Provision for Loan Losses | - | - | - | 300 | 300 | - | - | - | |||||||||||||||||
Net Interest Income after Provision, For Loan Losses | 6,747 | 6,729 | 6,675 | 6,026 | 26,177 | ||||||||||||||||||||
| Net Interest Income after Provision | |||||||||||||||||||||||||
| for Loan Losses | 8,105 | 7,658 | 7,331 | 7,104 | 30,198 | ||||||||||||||||||||
| Non-Interest Income | 813 | 797 | 783 | 719 | 112 | 1,820 | 2,145 | 1,882 | 2,045 | 7,892 | |||||||||||||||
| Non-Interest Expense | 4,614 | 4,494 | 4,496 | 4,382 | 17,986 | 6,489 | 6,259 | 6,017 | 5,954 | 24,719 | |||||||||||||||
| Income before taxes | 2,946 | 3,032 | 2,962 | 2,363 | 11,303 | ||||||||||||||||||||
| Income before income taxes | 3,436 | 3,544 | 3,196 | 3,195 | 13,371 | ||||||||||||||||||||
| Income Tax Expense | 766 | 842 | 786 | 492 | 2,886 | 1,698 | 946 | 809 | 877 | 4,330 | |||||||||||||||
| Noncontrolling interest (income)/expense | 49 | (48) | (59) | (4) | (31) | ||||||||||||||||||||
| Net Income | $ | 2,180 | $ | 2,190 | $ | 2,176 | $ | 1,871 | $ | 8,417 | $1,787 | $2,602 | $2,328 | $2,090 | $9,010 | ||||||||||
| Net Income Per Average Common Share | $ | .62 | $ | .63 | $ | .62 | $ | .53 | $ | 2.40 | |||||||||||||||
| Net Income Per Average | |||||||||||||||||||||||||
| Common Share Basic | $.52 | $.75 | $.68 | $.68 | $2.63 | ||||||||||||||||||||
Note that fourth quarter 2017 includes the one time deferred tax asset write down due to the Tax Cuts and Jobs Act.
2016 | |||||
| (Dollars in thousands) | Fourth | Third | Second | First | Total |
| Interest and Dividend Income | $8,387 | $8,198 | $7,931 | $7,634 | $32,150 |
| Interest Expense | 954 | 969 | 862 | 814 | 3,599 |
| Net Interest Income | 7,433 | 7,229 | 7,069 | 6,820 | 28,551 |
| Provision for Loan Losses | - | - | - | - | - |
| Net Interest Income after Provision | |||||
| for Loan Losses | 7,433 | 7,229 | 7,069 | 6,820 | 28,551 |
| Non-Interest Income | 2,843 | 1,054 | 986 | 699 | 5,582 |
| Non-Interest Expense | 6,806 | 4,962 | 4,772 | 4,732 | 21,272 |
| Income before income taxes | 3,470 | 3,321 | 3,283 | 2,787 | 12,861 |
| Income Tax Expense | 912 | 655 | 839 | 693 | 3,099 |
| Noncontrolling interest | (40) | (64) | (86) | (4) | (194) |
| Net Income | $2,518 | $2,602 | $2,358 | $2,090 | $9,568 |
| Net Income Per Average | |||||
| Common Share Basic | $.74 | $.75 | $.68 | $.60 | $2.77 |
Item 7A Quantitative and Qualitative Disclosures about Market Risk
Interest Rate Sensitivity
The Company considers interest rate risk to be a significant risk and has systems in place to measure the exposure of net interest income and fair values to movement in interest rates. Among the tools available to management is interest rate sensitivity analysis, which provides information related to repricing opportunities. Interest rate shock simulations indicate potential economic loss due to future interest rate changes. Shock analysis is a test that measures the effect of a hypothetical, immediate and parallel shift in interest rates. The following table shows the results of a rate shock and the effect on net income, net interest income and net interest margin. The information is an excerpt from our Interest Rate Risk model run as of November 30, 2017 and 2016:
Rate Shift (bp) | Net Income | Net Interest Income | Net Interest Margin | |||
2017 | 2016 | 2017 | 2016 | 2017 | 2016 | |
300 | 16,084 | 14,583 | 38,622 | 35,480 | 5.71% | 5.21% |
200 | 14,832 | 13,118 | 36,904 | 33,492 | 5.46% | 4.96% |
100 | 13,414 | 11,507 | 34,959 | 31,306 | 5.18% | 4.61% |
(-)100 | 12,291 | 10,458 | 33,418 | 29,883 | 4.96% | 4.41% |
(-)200 | 11,999 | 10,319 | 33,017 | 29,694 | 4.90% | 4.38% |
| 2014 | ||||||||||||||||||||
| (Dollars in thousands) | Fourth | Third | Second | First | Total | |||||||||||||||
| Interest and Dividend Income | $ | 6,934 | $ | 6,873 | $ | 6,674 | $ | 6,291 | $ | 26,772 | ||||||||||
Interest Expense | 871 | 908 | 919 | 950 | 3,648 | |||||||||||||||
| Net Interest Income | 6,063 | 5,965 | 5,755 | 5,341 | 23,124 | |||||||||||||||
Provision for Loan Losses | - | 750 | 750 | 750 | 2,250 | |||||||||||||||
Net Interest Income after Provision, For Loan Losses | 6,063 | 5,215 | 5,005 | 4,591 | 20,874 | |||||||||||||||
Non-Interest Income | 780 | 789 | 738 | 570 | 2,877 | |||||||||||||||
Non-Interest Expense | 4,194 | 3,923 | 3,801 | 3,738 | 15,656 | |||||||||||||||
Income before taxes | 2,649 | 2,081 | 1,942 | 1,423 | 8,095 | |||||||||||||||
Income Tax Expense | 1,057 | 520 | 446 | 270 | 2,293 | |||||||||||||||
Net Income | $ | 1,592 | $ | 1,561 | $ | 1,496 | $ | 1,153 | $ | 5,802 | ||||||||||
Net Income Per Average Common Share | $ | .43 | $ | .48 | $ | .45 | $ | .46 | $ | 1.82 | ||||||||||
See accompanying Notes to the Consolidated Financial Statements.
42
Item 8. Financial Statements and Supplementary Data
F & M Bank Corp. and Subsidiaries
Consolidated Balance Sheets (dollars in thousands, except per share data)
As of December 31, 20152017 and 20142016
| 2015 | 2014 | |||||||
| Assets | ||||||||
| Cash and due from banks (notes 3 and 15) | $ | 6,923,065 | $ | 6,241,016 | ||||
| Money market funds | 1,596,382 | 910,527 | ||||||
| Federal funds sold | - | 16,051,000 | ||||||
| Cash and cash equivalents | 8,519,447 | 23,202,543 | ||||||
| Securities: | ||||||||
| Held to maturity - fair value of $125,043 and $125,150 in 2015 and 2014, respectively (note 4) | 125,043 | 125,150 | ||||||
| Available for sale (note 4) | 13,046,945 | 13,215,112 | ||||||
| Other investments (note 4) | 12,157,115 | 8,964,640 | ||||||
| Loans held for sale | 57,805,529 | 13,381,941 | ||||||
| Loans held for investment (notes 5) | 544,053,477 | 518,201,574 | ||||||
| Less: allowance for loan losses (note 6) | (8,781,453 | ) | (8,724,731 | ) | ||||
| Net loans held for investment | 535,272,024 | 509,476,843 | ||||||
| Other real estate owned (note 9) | 2,127,685 | 3,507,153 | ||||||
| Bank premises and equipment, net (note 8) | 7,542,078 | 6,458,254 | ||||||
| Interest receivable | 1,708,617 | 1,674,846 | ||||||
| Goodwill (note 23) | 2,669,517 | 2,669,517 | ||||||
| Bank owned life insurance (note 24) | 13,046,111 | 12,581,210 | ||||||
| Other assets | 11,336,735 | 10,050,893 | ||||||
| Total Assets | $ | 665,356,846 | $ | 605,308,102 | ||||
| Liabilities | ||||||||
| Deposits: (note 10) | ||||||||
| Noninterest bearing | $ | 134,786,875 | $ | 112,197,722 | ||||
| Interest bearing: | ||||||||
| Demand | 81,491,760 | 93,693,468 | ||||||
| Money market accounts | 26,967,837 | 25,900,061 | ||||||
| Savings | 90,383,486 | 64,249,199 | ||||||
| Time deposits over $100,000 | 53,624,554 | 79,812,757 | ||||||
| All other time deposits | 107,415,244 | 115,651,329 | ||||||
| Total deposits | 494,669,756 | 491,504,536 | ||||||
| Short-term debt (note 11) | 24,954,051 | 14,358,492 | ||||||
| Accrued liabilities | 14,621,913 | 11,771,671 | ||||||
| Federal Home Loan Bank debt (note 12) | 48,160,714 | 9,875,000 | ||||||
| Total Liabilities | 582,406,434 | 527,509,699 | ||||||
| Commitments and contingencies (notes 4 and 16) | ||||||||
| Stockholders’ Equity (Note 22) | ||||||||
| Preferred Stock $5 par value, 400,000 shares authorized, issued and outstanding for 2015 | 9,425,123 | 9,425,123 | ||||||
| Common stock $5 par value, 6,000,000 shares authorized, 3,285,404 and 3,291,766 | ||||||||
| shares issued and outstanding at December 31, 2015 and 2014, respectively | 16,427,020 | 16,458,830 | ||||||
| Additional paid in capital – common stock | 11,149,104 | 11,259,995 | ||||||
| Retained earnings (note 19) | 48,056,300 | 42,554,421 | ||||||
| Noncontrolling interest | 572,680 | 426,365 | ||||||
| Accumulated other comprehensive loss | (2,679,815 | ) | (2,326,331 | ) | ||||
| Total Stockholders' Equity | 82,950,412 | 77,798,403 | ||||||
| Total Liabilities and Stockholders' Equity | $ | 665,356,846 | $ | 605,308,102 | ||||
2017 | 2016 | |
| Assets | ||
| Cash and due from banks | $10,622 | $7,755 |
| Money market funds | 1,285 | 674 |
| Federal funds sold | - | 7,926 |
| Cash and cash equivalents | 11,907 | 16,355 |
| Securities: | ||
| Held to maturity - fair value of $125 in 2017 and 2016 | 125 | 125 |
| Available for sale | 28,615 | 24,783 |
| Other investments | 12,503 | 14,567 |
| Loans held for sale | 39,775 | 62,735 |
| Loans held for investment | 616,974 | 591,636 |
| Less: allowance for loan losses | (6,044) | (7,543) |
| Net loans held for investment | 610,930 | 584,093 |
| Other real estate owned | 1,984 | 2,076 |
| Bank premises and equipment, net | 15,894 | 10,340 |
| Interest receivable | 2,007 | 1,785 |
| Goodwill | 2,881 | 2,670 |
| Bank owned life insurance | 13,950 | 13,513 |
| Other assets | 12,699 | 11,847 |
| Total Assets | $753,270 | $744,889 |
| Liabilities | ||
| Deposits: | ||
| Noninterest bearing | $162,233 | $146,617 |
| Interest bearing | 406,944 | 390,468 |
| Total deposits | 569,177 | 537,085 |
| Short-term debt | 25,296 | 40,000 |
| Accrued liabilities | 17,789 | 16,885 |
| Long-term debt | 49,733 | 64,237 |
| Total Liabilities | 661,995 | 658,207 |
| Commitments and contingencies | ||
| Stockholders’ Equity | ||
| Preferred Stock $25 par value, 400,000 shares authorized, 324,150 and 327,350 shares | ||
| issued and outstanding at December 31, 2017 and 2016, respectively | 7,529 | 7,609 |
| Common stock $5 par value, 6,000,000 shares authorized, 3,255,036 and 3,270,315 | ||
| shares issued and outstanding at December 31, 2017 and 2016, respectively | 16,275 | 16,352 |
| Additional paid in capital – common stock | 10,225 | 10,684 |
| Retained earnings | 60,814 | 54,509 |
| Noncontrolling interest in consolidated subsidiaries | 574 | 693 |
| Accumulated other comprehensive loss | (4,142) | (3,165) |
| Total Stockholders' Equity | 91,275 | 86,682 |
| Total Liabilities and Stockholders' Equity | $753,270 | $744,889 |
See accompanying Notes to the Consolidated Financial Statements.
43
F & M Bank Corp. and Subsidiaries
Consolidated Statements of Income (dollars in thousands, except per share data)
For the years ended 2015, 20142017, 2016 and 20132015
| 2015 | 2014 | 2013 | 2017 | 2016 | 2015 | ||||||||||
| Interest and Dividend Income | |||||||||||||||
| Interest and fees on loans held for investment | $ | 27,930,151 | $ | 26,210,609 | $ | 25,070,039 | $32,479 | $29,816 | $27,957 | ||||||
| Interest from loans held for sale | 1,099,419 | 312,364 | 647,622 | 1,112 | 1,924 | 1,099 | |||||||||
| Interest from deposits and federal funds sold | 20,990 | 44,435 | 54,679 | ||||||||||||
| Interest from debt securities | 302,117 | 204,649 | 193,244 | ||||||||||||
| Total interest and dividend Income | 29,352,677 | 26,772,057 | 25,965,584 | ||||||||||||
| Interest from money market funds and federal funds sold | 166 | 38 | 21 | ||||||||||||
| Interest from debt securities – taxable | 338 | 372 | 327 | ||||||||||||
| Total interest and dividend income | 34,095 | 32,150 | 29,404 | ||||||||||||
| Interest Expense | |||||||||||||||
| Interest from demand deposits | 539,469 | 663,618 | 791,245 | ||||||||||||
| Interest from savings deposits | 212,186 | 121,808 | 119,020 | ||||||||||||
| Interest from time deposits over $100,000 | 485,285 | 589,673 | 781,950 | ||||||||||||
| Interest from all other time deposits | 916,219 | 1,114,470 | 1,549,273 | ||||||||||||
| Total interest on deposits | 2,153,159 | 2,489,569 | 3,241,488 | 2,688 | 2,380 | 2,153 | |||||||||
| Interest from short-term debt | 69,179 | 9,437 | 23,956 | 63 | 55 | 69 | |||||||||
| Interest from long-term debt | 653,271 | 1,148,716 | 1,507,299 | 1,146 | 1,164 | 654 | |||||||||
| Total interest expense | 2,875,609 | 3,647,722 | 4,772,743 | 3,897 | 3,599 | 2,876 | |||||||||
| Net Interest Income | 26,477,068 | 23,124,335 | 21,192,841 | 30,198 | 28,551 | 26,528 | |||||||||
Provision for Loan and Lease losses (note 6) | 300,000 | 2,250,000 | 3,775,000 | ||||||||||||
| Provision for Loan Losses | - | 300 | |||||||||||||
| Net Interest Income After Provision for Loan Losses | 26,177,068 | 20,874,335 | 17,417,841 | 30,198 | 28,551 | 26,228 | |||||||||
| Noninterest Income | |||||||||||||||
| Service charges on deposit accounts | 963,459 | 1,033,959 | 1,117,910 | 1,360 | 1,174 | 963 | |||||||||
| Insurance and other commissions | 1,058,281 | 635,543 | 868,464 | ||||||||||||
| Insurance, other commissions and mortgage banking, net | 4,137 | 3,006 | 2,575 | ||||||||||||
| Other operating income | 1,401,162 | 1,393,897 | 1,537,397 | 2,109 | 1,657 | 1,401 | |||||||||
| Income from bank owned life insurance | 473,098 | 466,936 | 508,658 | 449 | 476 | 473 | |||||||||
| Gain on prepayment of long term debt | 504 | - | |||||||||||||
| Loss on sale of other investments | (42) | - | |||||||||||||
| Low income housing partnership losses | (619,534 | ) | (608,360 | ) | (855,527 | ) | (625) | (731) | (619) | ||||||
| Total noninterest income | 3,276,466 | 2,921,975 | 3,176,902 | 7,892 | 5,582 | 4,793 | |||||||||
| Noninterest Expenses | |||||||||||||||
| Salaries | 7,816,214 | 6,898,400 | 6,524,515 | 11,482 | 9,986 | 9,018 | |||||||||
| Employee benefits (note 14) | 2,239,258 | 1,911,250 | 2,146,871 | ||||||||||||
| Employee benefits | 3,372 | 2,814 | 2,439 | ||||||||||||
| Occupancy expense | 678,799 | 621,855 | 606,935 | 1,035 | 868 | 801 | |||||||||
| Equipment expense | 651,113 | 589,919 | 547,948 | 836 | 735 | 715 | |||||||||
| FDIC insurance assessment | 587,000 | 690,000 | 704,103 | 190 | 388 | 587 | |||||||||
| Other real estate owned expenses | 566,147 | 407,219 | 214,832 | ||||||||||||
| Other real estate owned, net | 76 | 86 | 566 | ||||||||||||
| Other operating expenses | 5,447,347 | 4,537,269 | 3,974,791 | 7,728 | 6,395 | 5,428 | |||||||||
| Total noninterest expenses | 17,985,878 | 15,655,912 | 14,719,995 | 24,719 | 21,272 | 19,554 | |||||||||
| Income before income taxes | 11,467,656 | 8,140,398 | 5,874,748 | 13,371 | 12,861 | 11,467 | |||||||||
Income Tax Expense (note 13) | 2,886,072 | 2,293,136 | 1,051,770 | ||||||||||||
| Income Tax Expense | 4,330 | 3,099 | 2,886 | ||||||||||||
| Consolidated Net Income – F & M Bank Corp. | 8,581,584 | 5,847,262 | 4,822,978 | ||||||||||||
| Net Income | 9,041 | 9,762 | 8,581 | ||||||||||||
| Net Income attributed to Noncontrolling interest | (164,575 | ) | (45,653 | ) | (107,185 | ) | |||||||||
| Net Income-F & M Bank Corp. | $ | 8,417,009 | $ | 5,801,609 | $ | 4,715,793 | |||||||||
| Net Income attributable to noncontrolling interests | (31) | (194) | (164) | ||||||||||||
| Net Income attributable to F & M Bank Corp. | $9,010 | $9,568 | $8,417 | ||||||||||||
| Dividends paid/accumulated on preferred stock | 510,000 | 127,500 | - | 415 | 487 | 510 | |||||||||
| Net income available to common stockholders | $ | 7,907,009 | $ | 5,674,109 | $ | 4,715,793 | $8,595 | $9,081 | $7,907 | ||||||
| Per Common Share Data | |||||||||||||||
| Net income - basic | 2.40 | 1.82 | 1.88 | $2.63 | $2.77 | $2.40 | |||||||||
| Net income - diluted | 2.25 | 1.80 | 1.88 | $2.48 | $2.57 | $2.25 | |||||||||
| Cash dividends on common stock | .73 | .68 | .68 | $.94 | $.80 | $.73 | |||||||||
| Weighted average common shares outstanding – basic | 3,290,812 | 3,119,333 | 2,504,015 | 3,269,713 | 3,282,335 | 3,290,812 | |||||||||
| Weighted average common shares outstanding – diluted | 3,735,212 | 3,229,942 | 2,504,015 | 3,631,984 | 3,716,591 | 3,735,212 | |||||||||
See accompanying Notes to the Consolidated Financial Statements.
44
F & M BANK CORP.
Consolidated Statements of Comprehensive Income (dollars in thousands)
For the years ended 2015, 20142017, 2016 and 20132015
| Years Ended December 31, | ||||||||||||
| 2015 | 2014 | 2013 | ||||||||||
| Net Income: | ||||||||||||
| Net income – F & M Bank Corp | $ | 8,417,009 | $ | 5,801,609 | $ | 4,715,793 | ||||||
| Net income attributable to noncontrolling interest | 164,575 | 45,653 | 107,185 | |||||||||
| Total net income | 8,581,584 | 5,847,262 | 4,822,978 | |||||||||
| Other comprehensive income (loss): | ||||||||||||
| Pension plan adjustment | (537,005 | ) | (2,145,868 | ) | 2,314,274 | |||||||
| Tax effect | 182,582 | 729,595 | (786,853 | ) | ||||||||
| Pension plan adjustment, net of tax | (354,423 | ) | (1,416,273 | ) | 1,527,421 | |||||||
| Unrealized holding gains (losses) | ||||||||||||
| on available-for-sale securities | 1,423 | 22,386 | (75,127 | ) | ||||||||
| Tax effect | (484 | ) | (7,611 | ) | 25,543 | |||||||
| Unrealized holding gain (losses), net of tax | 939 | 14,775 | (49,584 | ) | ||||||||
| Other comprehensive income | (353,484 | ) | (1,401,498 | ) | 1,477,837 | |||||||
| Total comprehensive income | $ | 8,228,100 | $ | 4,445,764 | $ | 6,300,815 | ||||||
Years Ended December 31, | |||
2017 | 2016 | 2015 | |
| Net Income | $9,041 | $9,762 | $8,581 |
| Other comprehensive income (loss): | |||
| Pension plan adjustment | (414) | (738) | (537) |
| Tax effect | 141 | 251 | 183 |
| Pension plan adjustment, net of tax | (273) | (487) | (354) |
| Unrealized holding gains | |||
| on available-for-sale securities | (34) | 3 | 2 |
| Tax effect | 12 | (1) | (1) |
| Unrealized holding gains, net of tax | (22) | 2 | 1 |
| Total other comprehensive income (loss) | (295) | (485) | (353) |
| Total comprehensive income | $8,746 | $9,277 | $8,228 |
| Comprehensive income attributable to noncontrolling interests | $(31) | $(194) | $(164) |
| Comprehensive income attributable to F&M Bank Corp. | $8,715 | $9,083 | $8,064 |
See accompanying Notes to the Consolidated Financial Statements.
F & M Bank Corp. and Subsidiaries
Consolidated Statements of Changes in Stockholders’ Equity (dollars in thousands, except share and per share data)
For the years ended December 31, 2015, 20142017, 2016 and 20132015
| Accumulated | ||||||||||||||||||||||||||||
| Other | ||||||||||||||||||||||||||||
| Comprehensive | ||||||||||||||||||||||||||||
| Preferred | Common | Additional Paid in | Retained | Noncontrolling | Income | |||||||||||||||||||||||
| Stock | Stock | Capital | Earnings | Interest | (Loss) | Total | ||||||||||||||||||||||
| Balance December 31, 2012 | $ | - | $ | 12,497,720 | $ | 2,951,967 | $ | 35,974,812 | $ | 362,131 | $ | (2,402,670 | ) | $ | 49,383,960 | |||||||||||||
| Net income consolidated | 4,715,793 | 107,185 | 4,822,978 | |||||||||||||||||||||||||
| Other comprehensive income (loss) | 1,477,837 | 1,477,837 | ||||||||||||||||||||||||||
| Minority Interest Contributed Capital (Distributions) | (51,088 | ) | (51,088 | ) | ||||||||||||||||||||||||
| Dividends on common stock | (1,705,881 | ) | (1,705,881 | ) | ||||||||||||||||||||||||
| Common stock issued (12,141 shares) | 60,955 | 152,474 | - | - | - | 213,429 | ||||||||||||||||||||||
| Balance December 31, 2013 | $ | - | $ | 12,558,675 | $ | 3,104,441 | $ | 38,984,724 | $ | 418,228 | $ | (924,833 | ) | $ | 54,141,235 | |||||||||||||
| Net income consolidated | 5,801,609 | 45,653 | 5,847,262 | |||||||||||||||||||||||||
| Other comprehensive income (loss) | (1,401,498 | ) | (1,401,498 | ) | ||||||||||||||||||||||||
| Minority Interest Contributed Capital (Distributions) | (37,516 | ) | (37,516 | ) | ||||||||||||||||||||||||
| Dividends on preferred stock | (127,500 | ) | (127,500 | ) | ||||||||||||||||||||||||
| Dividends on common stock | (2,104,412 | ) | (2,104,412 | ) | ||||||||||||||||||||||||
| Preferred stock issued (400,000 shares) | 9,425,123 | 9,425,123 | ||||||||||||||||||||||||||
| Common Stock issued (780,031 shares) | - | 3,900,155 | 8,155,554 | - | - | - | 12,055,709 | |||||||||||||||||||||
| Balance December 31, 2014 | $ | 9,425,123 | $ | 16,458,830 | $ | 11,259,995 | $ | 42,554,421 | $ | 426,365 | $ | (2,326,331 | ) | $ | 77,798,403 | |||||||||||||
| Net income consolidated | 8,417,009 | 164,575 | 8,581,584 | |||||||||||||||||||||||||
| Other comprehensive income (loss) | (353,484 | ) | (353,484 | ) | ||||||||||||||||||||||||
| Minority Interest Distribution | (18,260 | ) | (18,260 | ) | ||||||||||||||||||||||||
| Dividends on preferred stock | (510,000 | ) | (510,000 | ) | ||||||||||||||||||||||||
| Dividends on common stock | (2,405,130 | ) | (2,405,130 | ) | ||||||||||||||||||||||||
| Common stock repurchased (13,277 shares) | (66,390 | ) | (222,729 | ) | (289,119 | ) | ||||||||||||||||||||||
| Common Stock issued (6,916 shares) | 34,580 | 111,838 | - | - | - | 146,418 | ||||||||||||||||||||||
| Balance December 31, 2015 | $ | 9,425,123 | $ | 16,427,020 | $ | 11,149,104 | $ | 48,056,300 | $ | 572,680 | $ | (2,679,815 | ) | $ | 82,950,412 | |||||||||||||
Accumulated | |||||||
Other | |||||||
Comprehensive | |||||||
Preferred | Common | Additional Paid in | Retained | Noncontrolling | Income | ||
Stock | Stock | Capital | Earnings | Interest | (Loss) | Total | |
| Balance December 31, 2014 | $9,425 | $16,459 | $11,260 | $42,554 | $426 | $(2,327) | $77,797 |
| Net income | 8,417 | 164 | 8,581 | ||||
| Other comprehensive loss | (353) | (353) | |||||
| Distributions to noncontrolling interest | (17) | (17) | |||||
| Dividends on preferred stock ($1.275 per share) | (510) | (510) | |||||
| Dividends on common stock ($.73 per share) | (2,405) | (2,405) | |||||
| Common stock repurchased (13,277 shares) | (67) | (223) | (290) | ||||
| Common stock issued (6,916 shares) | 35 | 112 | - | - | - | 147 | |
| Balance December 31, 2015 | $9,425 | $16,427 | $11,149 | $48,056 | $573 | $(2,680) | $82,950 |
| Net income | 9,568 | 194 | 9,762 | ||||
| Other comprehensive loss | (485) | (485) | |||||
| Distributions to noncontrolling interest | (74) | (74) | |||||
| Dividends on preferred stock ($1.488 per share) | (487) | (487) | |||||
| Dividends on common stock ($.80 per share) | (2,628) | (2,628) | |||||
| Common stock repurchased (22,583 shares) | (112) | (466) | (578) | ||||
| Common stock issued (7,494 shares) | 37 | 146 | 183 | ||||
| Preferred stock repurchased (72,650 shares) | (1,816) | (145) | (1,961) | ||||
| Balance, December 31, 2016 | $7,609 | $16,352 | $10,684 | $54,509 | $693 | $(3,165) | $86,682 |
| Net income | 9,010 | 31 | 9,041 | ||||
| Other comprehensive loss | (295) | (295) | |||||
| Distributions to noncontrolling interest | (150) | (150) | |||||
| Dividends on preferred stock ($1.28 per share) | (415) | (415) | |||||
| Dividends on common stock ($.94 per share) | (2,972) | (2,972) | |||||
| Common stock repurchased (21,984 shares) | (110) | (602) | (712) | ||||
| Common stock issued (6,705 shares) | 33 | 164 | 197 | ||||
| Preferred stock repurchased (3,200 shares) | (80) | (21) | (101) | ||||
| Stranded tax effect of Tax Cuts and Jobs Act | 682 | (682) | - | ||||
| Balance, December 31, 2017 | $7,529 | $16,275 | $10,225 | $60,814 | $574 | $(4,142) | $91,275 |
See accompanying Notes to the Consolidated Financial Statements.
F & M Bank Corp. and Subsidiaries
Consolidated Statements of Cash Flows (dollars in thousands)
For the years ended December 31, 2015, 20142017, 2016 and 2013
| 2015 | 2014 | 2013 | ||||||||||
| Cash Flows from Operating Activities | ||||||||||||
| Net income | $ | 8,417,009 | $ | 5,801,609 | $ | 4,715,793 | ||||||
| Adjustments to reconcile net income to net cash | ||||||||||||
| provided by (used in) operating activities: | ||||||||||||
| Depreciation | 709,237 | 612,116 | 581,625 | |||||||||
| Amortization of securities | 147,407 | 76,057 | 45,416 | |||||||||
| Sale of loans held for sale originated | 75,364,878 | 56,210,640 | 79,778,381 | |||||||||
| Loans held for sale originated | (77,151,936 | ) | (56,044,669 | ) | (71,169,362 | ) | ||||||
| Provision for loan losses | 300,000 | 2,250,000 | 3,775,000 | |||||||||
| Benefit (expense) for deferred taxes | 340,941 | (515,538 | ) | (568,858 | ) | |||||||
| (Increase) decrease in interest receivable | (33,771 | ) | (176,734 | ) | 204,735 | |||||||
| Increase in other assets | (457,010 | ) | (1,473,634 | ) | (967,516 | ) | ||||||
| Increase in accrued expenses | 1,480,074 | 1,159,913 | 1,731,973 | |||||||||
| Amortization of limited partnership investments | 627,326 | 608,360 | 581,737 | |||||||||
| Loss on sale and valuation adjustments of other real estate owned | 488,583 | 318,714 | 97,155 | |||||||||
| Income from life insurance investment | (473,098 | ) | (466,936 | ) | (508,658 | ) | ||||||
| Net Cash Provided by Operating Activities | 9,759,640 | 8,359,898 | 18,297,421 | |||||||||
| Cash Flows from Investing Activities | ||||||||||||
| Decrease in interest bearing bank deposits | - | - | 248,000 | |||||||||
| Proceeds from maturities of securities available for sale | 8,242,751 | 27,495,319 | 10,712,508 | |||||||||
| Proceeds from maturities of securities held to maturity | - | 106,000 | ||||||||||
| Purchases of securities available for sale | (12,040,262 | ) | (11,957,235 | ) | (31,093,384 | ) | ||||||
| Purchases of securities held to maturity | - | (125,250 | ) | |||||||||
| Net increase in loans held for investment | (25,892,052 | ) | (43,642,033 | ) | (17,149,156 | ) | ||||||
| Net (increase) decrease in loans held for sale participations | (42,636,530 | ) | (9,743,487 | ) | 64,793,073 | |||||||
| Net purchase of property and equipment | (1,793,061 | ) | (545,313 | ) | (661,621 | ) | ||||||
| Proceeds from sale of other real estate owned | 687,756 | 986,373 | 928,897 | |||||||||
| Net Cash Provided by (Used in) Investing Activities | (73,431,398 | ) | (37,425,626 | ) | 27,778,317 | |||||||
| Cash Flows from Financing Activities | ||||||||||||
| Net change in demand and savings deposits | 37,589,508 | 27,894,981 | 15,867,944 | |||||||||
| Net change in time deposits | (34,424,288 | ) | (539,689 | ) | (5,514,239 | ) | ||||||
| Net change in short-term debt | 10,595,559 | 10,935,414 | (31,174,274 | ) | ||||||||
| Dividends paid in cash | (2,915,130 | ) | (2,231,912 | ) | (1,705,881 | ) | ||||||
| Proceeds from long-term debt | 40,000,000 | 10,000,000 | - | |||||||||
| Proceeds from issuance of preferred stock | - | 6,831,123 | - | |||||||||
| Proceeds from issuance of common stock | 146,418 | 12,055,709 | 213,429 | |||||||||
| Repurchase of common stock | (289,119 | ) | ||||||||||
| Repayments of long-term debt | (1,714,286 | ) | (19,222,000 | ) | (26,214,286 | ) | ||||||
| Net Cash Provided by (Used in) Financing Activities | 48,988,662 | 45,723,626 | (48,527,307 | ) | ||||||||
| Net Increase (Decrease) in Cash and Cash Equivalents | (14,683,096 | ) | 16,657,898 | (2,451,569 | ) | |||||||
| Cash and Cash Equivalents, Beginning of Year | 23,202,543 | 6,544,645 | 8,996,214 | |||||||||
| Cash and Cash Equivalents, End of Year | $ | 8,519,447 | $ | 23,202,543 | $ | 6,544,645 | ||||||
| Supplemental Disclosure: | ||||||||||||
| Cash paid for: | ||||||||||||
| Interest expense | $ | 2,854,119 | $ | 3,703,190 | $ | 6,500,592 | ||||||
| Income taxes | 1,500,000 | 1,607,000 | 800,000 | |||||||||
| Transfers from loans to other real estate owned | 125,000 | 2,914,958 | 1,337,890 | |||||||||
| Loans originated for the sale of other real estate owned | (328,129 | ) | (780,097 | ) | (569,245 | ) | ||||||
| Conversion of subordinated debt to preferred stock | - | 2,594,000 | ||||||||||
2017 | 2016 | 2015 | |
| Cash Flows from Operating Activities | |||
| Net income | $9,010 | $9,568 | $8,417 |
| Adjustments to reconcile net income to net cash | |||
| provided by operating activities: | |||
| Depreciation | 930 | 827 | 727 |
| Amortization of intangibles | 53 | - | - |
| Amortization of securities | - | 109 | 147 |
| Proceeds from sale of loans held for sale originated | 67,517 | 73,112 | 77,662 |
| Gain on sale of loans held for sale originated | (2,331) | (2,778) | (2,297) |
| Loans held for sale originated | (68,647) | (66,779) | (77,152) |
| Provision for loan losses | - | - | 300 |
| (Expense) benefit for deferred taxes | (222) | 9 | 341 |
| (Increase) in interest receivable | (222) | (76) | (34) |
| Increase in other assets | (1,693) | (444) | (457) |
| Increase in accrued liabilities | 1,498 | 1,690 | 1,480 |
| Amortization of limited partnership investments | 625 | 731 | 627 |
| Loss on sale of investments | 42 | - | - |
| Loss on sale and valuation adjustments of other real estate owned | 44 | 19 | 489 |
| Income from life insurance investment | (449) | (476) | (473) |
| Net Cash Provided by Operating Activities | 6,155 | 15,512 | 9,777 |
| Cash Flows from Investing Activities | |||
| Proceeds from maturities of securities available for sale | 86,741 | 32,218 | 8,243 |
| Proceeds from sales of other investments | 55 | - | - |
| Purchases of securities available for sale and other investments | (89,428) | (47,137) | (12,040) |
| Capital improvements to other real estate owned | (2) | (24) | - |
| Net increase in loans held for investment | (27, 068) | (49,386) | (25,892) |
| Net decrease (increase) in loans held for sale participations | 26 421 | (8,483) | (42,637) |
| Net purchase of property and equipment | (6,484) | (3,553) | (1,811) |
| Proceeds from sale of other real estate owned | 281 | 623 | 688 |
| Net Cash Used in Investing Activities | (9,484) | (75,742) | (73,449) |
| Cash Flows from Financing Activities | |||
| Net change in deposits | 32,092 | 42,415 | 3,165 |
| Net change in short-term debt | (14,704) | 15,046 | 10,596 |
| Dividends paid in cash | (3,387) | (3,115) | (2,915) |
| Proceeds from long-term debt | - | 20,000 | 40,000 |
| Proceeds from issuance of common stock | 197 | 183 | 147 |
| Repurchase of preferred stock | (712) | (1,961) | - |
| Repurchase of common stock | (101) | (578) | (290) |
| Repayments of long-term debt | (14,504) | (3,924) | (1,714) |
| Net Cash (Used in) Provided by Financing Activities | (1,119) | 68,066 | 48,989 |
| Net (Decrease) Increase in Cash and Cash Equivalents | (4,448) | 7,836) | (14,683) |
| Cash and Cash Equivalents, Beginning of Year | 16,355 | 8,519 | 23,202 |
| Cash and Cash Equivalents, End of Year | $11,907 | $16,355 | $8,519 |
| Supplemental Cash Flow information: | |||
| Cash paid for: | |||
| Interest | $3,866 | $3,573 | $2,854 |
| Income taxes | 4,460 | 2,300 | 1,500 |
| Supplemental non-cash disclosures: | |||
| Transfers from loans to other real estate owned | 231 | 566 | 125 |
| Loans originated for the sale of other real estate owned | - | - | (328) |
| Unrealized gain (loss) on securities available for sale | (26) | 2 | 1 |
| Minimum pension liability adjustment | (952) | (487) | (354) |
See accompanying Notes to the Consolidated Financial Statements.
47
F & M Bank Corp. and Subsidiaries
Notes to the Consolidated Financial Statements (dollars in thousands)
December 31, 20152017 and 20142016
NOTE 1
NATURE OF OPERATIONS:
F & M Bank Corp. (the “Company”), through its subsidiary Farmers & Merchants Bank (the “Bank”), operates under a charter issued by the Commonwealth of Virginia and provides commercial banking services. As a state charteredstate-chartered bank, the Bank is subject to regulation by the Virginia Bureau of Financial Institutions and the Federal Reserve Bank. The Bank provides services to customers located mainly in Rockingham, Shenandoah, Page and Augusta Counties in Virginia, and the adjacent county of Hardy, West Virginia. Services are provided at eleventhirteen branch offices and a Dealer Finance Division and a loan production office. The Company offers insurance, mortgage lending, title insurance and financial services through its subsidiaries, TEB Life Insurance, Inc., Farmers & Merchants Financial Services, Inc, and VBS Mortgage, LLC (VBS) and VS Title, LLC.
NOTE 2
SUMMARY OF SIGNIFICANT ACCOUNTING POLICIES:
The accounting and reporting policies of the Company and its subsidiaries conform to generally accepted accounting principles and to accepted practice within the banking industry.
The following is a summary of the more significant policies:
Principles of Consolidation
The consolidated financial statements include the accounts of Farmers and Merchants Bank, TEB Life Insurance Company, Farmers & Merchants Financial Services, Inc. and, VBS Mortgage, LLC, (net of minoritynoncontrolling interest). and VS Title, LLC. Significant inter-company accounts and transactions have been eliminated.
Use of Estimates in the Preparation of Financial Statements
Cash and Cash Equivalents
Cash and cash equivalents include cash on hand, deposits at other financial institutionsmoney market funds whose initial maturity is ninety days or less and Federal funds sold.
The Company follows the accounting guidance related to recognition and presentation of other-than-temporary impairment. The guidance specifies that if (a) an entity does not have the intent to sell a debt security prior to recovery and (b) it is more likely than not that the entity will not have to sell the debt security prior to recovery, the security would not be considered other-than-temporarily impaired, unless there is a credit loss. When criteria (a) and (b) are met, the entity will recognize the credit component of other-than-temporary impairment of a debt security in earnings and the remaining portion in other comprehensive income.
F & M Bank Corp. and Subsidiaries
Notes to the Consolidated Financial Statements (dollars in thousands)
December 31, 2017 and 2016
NOTE 2
SUMMARY OF SIGNIFICANT ACCOUNTING POLICIES (CONTINUED):
For held-to-maturity debt securities, the amount of other-than-temporary impairment recorded in other comprehensive income for Historic Rehabilitationthe noncredit portion of a previous other-than-temporary impairment is amortized prospectively over the remaining life of the security on the basis of the timing of future estimated cash flows of the security.
For equity securities, when the Company has decided to sell an impaired available-for-sale security and Low Income Housing Partnershipsthe Company does not expect the fair value of the security to fully recover before the expected time of sale, the security is deemed other-than-temporarily impaired in the period in which the decision to sell is made. The Company recognizes an impairment loss when the impairment is deemed other than temporary even if a decision to sell has not been made.
Other Investments
The Company periodically invests in low income housing partnerships whose primary benefit is the distribution of federal income tax credits to partners. The Company recognizes these benefits and the cost of the investments over the life of the partnership (usually 15 years). In addition, state and federal historic rehabilitation credits are generated from some of the partnerships. Amortization of these investments is prorated based on the amount of benefits received in each year to the total estimated benefits over the life of the projects. The effective yield method is used to record the income statement effects of these investments.
Other Investment Securities
Income Taxes
Deferred income tax expense results from changes in deferred tax assets and liabilities between periods. Deferred tax assets are includedrecognized if it is more likely than not, based on the technical merits, that the tax position will be realized or sustained upon examination. The term more likely than not means a likelihood of more than 50 percent; the terms examined and upon examination also include resolution of the related appeals or litigation processes, if any. A tax position that meets the more-likely-than-not recognition threshold is initially and subsequently measured as the largest amount of tax benefit that has a greater than 50 percent likelihood of being realized upon settlement with a taxing authority that has full knowledge of all relevant information. The determination of whether or not a tax position has met the more-likely-than-not recognition threshold considers the facts, circumstances, and information available at the reporting date and is subject to management’s judgment. Deferred tax assets are reduced by a valuation allowance if, based on the weight of evidence available, it is more likely than not that some portion or all of a deferred tax asset will not be realized.
The results for the year ended December 31, 2017 include the effect of the Tax Cuts and Jobs Act (the Tax Act), which was signed into law on December 22, 2017. Among other things, the Tax Act permanently lowers the federal corporate income tax rate to 21% from the maximum rate prior to the passage of the Tax Act of 35%, effective January 1, 2018. As a result of the reduction of the federal corporate tax rate, U.S. GAAP requires companies to re-measure their deferred tax assets and deferred tax liabilities, including those accounted for in accumulated other comprehensive income (loss), as of the date of the Tax Act’s enactment and record the corresponding effects in income tax expense in the amounts providedfourth quarter of 2017. The Company recognized a $811 reduction in the value of its net deferred tax asset and recorded a corresponding incremental income tax expense in the Company’s consolidated statement of income for income taxes.
anticipated.
F & M Bank Corp. and Subsidiaries
Notes to the Consolidated Financial Statements (dollars in thousands)
December 31, 20152017 and 20142016
NOTE 2
SUMMARY OF SIGNIFICANT ACCOUNTING POLICIES (CONTINUED):
Income Taxes, continued
The Company recognizes interest and penalties on income taxes as a component of income tax expense.
Loans Held for Investment
The Company, through its banking subsidiary, provides mortgage, commercial, and consumer loans to customers. A substantial portion of the loan portfolio is represented by mortgage loans, particularly commercial and residential mortgages. The ability of the Company’s debtors to honor their contracts is largely dependent upon the real estate and general economic conditions in the Company’s market area.
Loans that management has the intent and ability to hold for the foreseeable future or until maturity or pay-off, generally are reported at their outstanding unpaid principal balance adjusted for the allowance for loan losses, and any unearned income. Interest income is accrued on the unpaid principal balance. The accrual of interest on loans is generally discontinued at the time the loan is 90 days delinquent unless the credit is well-secured and in process of collection. Loans are typically charged off when the loan is 120 days past due, unless secured and in process of collection. Loans are placed on nonaccrual status or charged-off at an earlier date if collection of principal or interest is considered doubtful.
The Company’s loans are grouped into eleven segments: construction/land development, farmland, real estate, multi-family, commercial real estate, home equity – closed end, home equity – open end, commercial & industrial – non-real estate, consumer, credit cards and dealer finance. Each segment is subject to certain risks that influence the establishment of pricing, loan structures, approval requirements, reserves, and ongoing credit management. The Company does not segregate the portfolio further.
Construction and land development loans are subject to general risks from changing commercial building and housing market trends and economic conditions that may impact demand for completed properties and the costs of completion. Completed properties that do not sell or become leased within originally expected timeframes may impact the borrower’s ability to service the debt. These risks are measured by market-area unemployment rates, bankruptcy rates, housing and commercial building market trends, and interest rates. Risks specific to the borrower are also evaluated, including previous repayment history, debt service ability, and current and projected loan-to value ratios for the collateral.
Farmland loans are loans secured by agricultural property. These loans are subject to risks associated with the value of the underlying farmland and the cash flows of the borrower’s farming operations.
Multifamily loans are loans secured by multi-unit residential property. These loans are subject to risks associated with the value of the underlying property as well as the successful operation and management of the property.
Real estate loans are for consumer residential real estate where the credit quality is subject to risks associated with the borrower’s repayment ability and collateral value, measured generally by analyzing local unemployment and bankruptcy trends, and local housing market trends and interest rates. Risks specific to a borrower are determined by previous repayment history, loan-to-value ratios, and debt-to-income ratios.
The commercial real estate segment includes loans secured by commercial real estate occupied by the owner/borrower, and commercial real estate leased to non-owners. Loans in the commercial real estate segment are impacted by economic risks from changing commercial real estate markets, rental markets for commercial buildings, business bankruptcy rates, local unemployment rates and interest rate trends that would impact the businesses housed by the commercial real estate.
The Company’s home-equity loan portfolios (closed end and open end) carry risks associated with the creditworthiness of the borrower and changes in loan-to-value ratios. The Company manages these risks through policies and procedures such as limiting loan-to-value at origination, experienced underwriting, and requiring standards for appraisers.
Notes to the Consolidated Financial Statements (dollars in thousands)
December 31, 2017 and 2016
NOTE 2
SUMMARY OF SIGNIFICANT ACCOUNTING POLICIES (CONTINUED):
Loans Held for LoanInvestment, continued
Commercial and Lease Losses, continuedindustrial non-real estate loans are secured by collateral other than real estate or are unsecured. Credit risk for commercial non-real estate loans is subject to economic conditions, generally monitored by local business bankruptcy trends, interest rates, and borrower repayment ability and collateral value (if secured).
Consumer non-real estate includes non-dealer financed automobile loans and other consumer loans. Certain consumer loans are unsecured, while collateral is obtained for automobile loans and other consumer loans. Credit risk stems primarily from the borrower’s ability to repay. If the loan is secured, the Company analyzes loan-to-value ratios. All consumer non-real estate loans are analyzed for debt-to-income ratios and previous credit history, as well as for general risks for the portfolio, including local unemployment rates, personal bankruptcy rates and interest rates.
Credit card loan portfolios carry risks associated with the creditworthiness of the borrower and changes in the economic environment. The Company manages these risks through policies and procedures such as experienced underwriting, maximum debt to income ratios, and minimum borrower credit scores.
Dealer finance lending generally carries certain risks associated with the values of the collateral and borrower’s ability to repay the loan. The Company focuses its dealer finance lending on used vehicles where substantial depreciation has already occurred thereby minimizing the risk of significant loss of collateral values in the future.
Interest accrued but not collected for loans that are placed on nonaccrual status or charged-off is reversed against interest income. The interest on these loans is accounted for on the cash basis or cost recovery method, until qualifying for return to accrual status. Loans are returned to accrual status when all the principal and interest amounts contractually due are brought current and future payments are reasonably assured.
A loan is considered past due when a payment of principal or interest or both is due but not paid. Management closely monitors past due loans in timeframes of 30-59 days, 60-89 days, and 90 or more days past due.
These policies apply to all loan portfolio segments.
A loan is considered impaired when, based on current information and events, it is probable that the Company will be unable to collect the scheduled payments of principal or interest when due according to the contractual terms of the loan agreement. Factors considered by management in determining impairment include payment status, collateral value, and the probability of collecting scheduled principal and interest payments when due. Loans that experience insignificant payment delays and payment shortfalls generally are not classified as impaired. Management determines the significance of payment delays and payment shortfalls on a case-by-case basis, taking into consideration all of the circumstances surrounding the loan and the borrower, including the length of the delay, the reasons for the delay, the borrower’sborrower's prior payment record, and the amount of the shortfall in relation to the principal and interest owed. Impairment is measured on a loan by loanloan-by-loan basis for commercial and construction loans by either the present value of expected future cash flows discounted at the loan’sloan's effective interest rate, the loan’sloan's obtainable market price, or the fair value of the collateral if the loan is collateral dependent. Troubled debt restructurings are considered impaired loans.
Loans Held for Sale
These loans consist of fixed rate loans made through the Company’s subsidiary, VBS Mortgage, and loans purchased from Northpointe Bank, Grand Rapids, MI.
F & M Bank Corp. and Subsidiaries
Notes to the Consolidated Financial Statements (dollars in thousands)
December 31, 2017 and 2016
NOTE 2
SUMMARY OF SIGNIFICANT ACCOUNTING POLICIES (CONTINUED):
Loans Held for Sale, continued
VBS Mortgage originates conforming mortgage loans for sale in the secondary market. These loans consist primarily of fixed-rate, single-family residential mortgage loans which meet the underwriting characteristics of the investors. VBS enters into mortgage loan commitments whereby the interest rate on the loan is determined prior to funding (rate lock commitments).
The period of time between issuance of a loan commitment and sale of the loan generally ranges from two to three weeks. VBS protects itself from changes in interest rates through the use of best efforts forward delivery contracts, by committing to sell a loan at the time the borrower commits to an interest rate with the intent that the buyer has assumed the interest rate risk on the loan. As a result, the Company is not generally exposed to significant losses nor will it realize significant gains related to its rate lock commitments due to changes in interest rates. The correlation between the rate lock commitments and the best efforts contracts is very high due to their similarity. The market value of rate lock commitments and best efforts contracts is not readily ascertainable with precision because rate lock commitments and best efforts contracts are not actively traded in stand-alone markets. VBS determines the fair value of rate lock commitments and best efforts contracts by measuring the change in the estimated value of the underlying assets while taking into consideration the probability that the loan will be funded. The fair value of rate lock commitments and best efforts contracts was considered immaterial at December 31, 2017 and 2016. The average time on the line is two or three weeks. These loans are pre-sold with servicing released and no interest is retained after the loans are sold. Because of the short holding period, these loans are carried at the lower of cost or market and no market adjustments were deemed necessary in 2017, 2016, or 2015. Gains on sales of loans and commission expense are recognized at the loan closing date and are included in mortgage banking income, net on the Company’s consolidated income statement.
The Bank participates in a Mortgage Purchase Program with Northpointe Bank (Northpointe), a Michigan banking corporation. Pursuant to the terms of a participation agreement, the Bank purchases participation interests in loans made by Northpointe related to fully underwritten and pre-sold mortgage loans originated by various prescreened mortgage loan originators located throughout the United States. A takeout commitment is in place at the time the loans are purchased. The Bank has participated in similar arrangements since 2003 as a higher yielding alternative to federal funds sold or investment securities. These loans are short-term, residential real estate loans that have an average life in our portfolio of approximately two weeks. The Bank holds these loans during the period of time between loan closing and when the loan is paid off by the ultimate secondary market purchaser. As of December 31, 2017, and 2016, there were $36,130 and $62,550 million of these loans included in loans held for sale on the Company’s consolidated balance sheet.
Troubled Debt Restructuring
In situations where, for economic or legal reasons related to a borrower's financial condition, management may grant a concession to the borrower that it would not otherwise consider, the related loan is classified as a troubled debt restructuring ("TDR"). Management strives to identify borrowers in financial difficulty early and work with them to modify their loan to more affordable terms before their loan reaches nonaccrual status. These modified terms may include rate reductions, principal forgiveness, payment forbearance and other actions intended to minimize the economic loss and to avoid foreclosure or repossession of the collateral. In cases where borrowers are granted new terms that provide for a reduction of either interest or principal, management measures any impairment on the restructuring as noted above for impaired loans. The Company has $7.8 million in loans classified as TDRs that are current and performing as of December 31, 2017, and $9.8 million as of December 31, 2016.
F & M Bank Corp. and Subsidiaries
Notes to the Consolidated Financial Statements (dollars in thousands)
December 31, 2017 and 2016
NOTE 2
SUMMARY OF SIGNIFICANT ACCOUNTING POLICIES (CONTINUED):
Allowance for Loan and Losses
The allowance for loan losses represents management’s estimate of probable losses inherent in the Company’s loan portfolio. A provision for estimated losses is charged to earnings to establish and maintain the allowance for loan losses at a level reflective of the estimated credit risk. When management determines that a loan balance or portion of a loan balance is not collectible, the loss is charged against the allowance. Subsequent recoveries, if any, are credited to the allowance.
Management’s determination of the adequacy of the allowance is based on an evaluation of the composition of the loan portfolio, the value and adequacy of collateral, current economic conditions, historical loan loss experience, and other risk factors. Management evaluates the allowance each quarter through a methodology that estimates losses on individual impaired loans and evaluates the effect of numerous factors on the credit risk of each segment of loans.
The Company’s allowance for loan losses has two basic components: the general allowance and the specific allowance. Each of these components is determined based upon estimates and judgments. The general allowance uses historical loss experience as an indicator of future losses, along with various qualitative factors, including levels and trends in delinquencies, nonaccrual loans, charge-offs and recoveries, trends in volume and terms of loans, effects of changes in underwriting standards, experience of lending staff, economic conditions, and portfolio concentrations.
Except for credit card and dealer finance loans, all loans are assigned an internal risk rating based on certain credit quality indicators. Credit card, consumer and dealer finance loans are monitored based on payment activity. Loss rates are amplified for loans with adverse risk ratings that are not considered impaired. In the general allowance, the historical loss rate is combined with the qualitative factors, resulting in an adjusted loss factor for each segment of loans. The period-end balances for each loan segment are multiplied by the adjusted loss factor. Historical loss rates are combined with qualitative factors resulting in an adjusted loss factor for each segment. Specific allowances are established for individually-evaluated impaired loans based on the excess of the loan balance relative to the fair value of the collateral, if the loan is deemed collateral dependent.
Management believes that the allowance for loan losses is adequate. While management uses available information to recognize losses on loans, future additions to the allowance may be necessary based on changes in economic conditions, particularly those affecting real estate values. In addition, regulatory agencies, as an integral part of their examination process, periodically review the Company’s allowance for loan losses. Such agencies may require the Company to recognize additions to the allowance based on their judgments about information available to them at the time of their examination.
Other Real Estate Owned (OREO)
Notes to the Consolidated Financial Statements (dollars in thousands)
December 31, 2017 and 2016
NOTE 2
Bank Premises and Equipment
| Premises and Improvements | 10 - 40 years | |
| Furniture and | 5 - 20 years |
Maintenance, repairs, and minor improvements are charged to operations as incurred. Gains and losses on dispositions are reflectedreflected in other income or expense.
Goodwill and Intangible Assets
The Company accounts for goodwill and intangible assets under ASC 805, “Business Combination”Combinations” and ASC 350, “Intangibles”, respectively.
Goodwill totaled $2,669,517is subject to at least an annual assessment for impairment by applying a fair value-based test. Additionally, acquired intangible assets are separately recognized if the benefit of the assets can be sold, transferred, licensed, rented, or exchanged, and amortized over their useful lives. The Company recorded goodwill and intangible assets in 2017 related to the purchase of VS Title which was valued by an independent third party. The Company records as goodwill the excess of purchase price over the fair value of the identifiable net assets acquired. Impairment testing is performed annually, as well as when an event triggering impairment may have occurred. The Company performs its annual analysis as of December 31 2015each fiscal year. Accounting guidance permits preliminary assessment of qualitative factors to determine whether a more substantial impairment testing is required. The Company chose to bypass the preliminary assessment and 2014. The goodwill is no longer amortized, but instead testedutilized a two-step process for impairment at least annually. Based ontesting of goodwill. The first step tests for impairment, while the testing, theresecond step, if necessary, measures the impairment. No indicators of impairment were no impairment charges for 2015, 2014 or 2013.
identified during the years ended December 31, 2017, 2016, and 2015.
Pension Plans
The Bank has a qualified noncontributory defined benefit pension plan which covers all full timefull-time employees hired prior to April 1, 2012. The benefits are primarily based on years of service and earnings. The Company complies with ASC 325-960 “Defined Benefit Pension Plans” which requires recognition of the over-funded or under-funded status of pension and other postretirement benefit plans on the balance sheet. Under ASC 325-960, gains and losses, prior service costs and credits, and any remaining transition amounts that have not yet been recognized through net periodic benefit cost will be recognized in accumulated other comprehensive income, net of tax effects, until they are amortized as a component of net periodic cost.
Advertising Costs
The Company follows the policy of charging the cost of advertising to expense as incurred. Total advertising costs included in other operating expenses for 2017, 2016, and 2015 2014,were $507, $496, and 2013 were $401,138, $317,780,$452, respectively.
Bank Owned Life Insurance
The Company has purchased life insurance policies on certain employees. Bank owned life insurance is recorded at the amount that can be realized under the insurance contract at the balance sheet date, which is the cash surrender value adjusted for other charges or other amounts due that are probable at settlement.
F & M Bank Corp. and $278,555, respectively.Subsidiaries
Notes to the Consolidated Financial Statements (dollars in thousands)
December 31, 2017 and 2016
NOTE 2 SUMMARY OF SIGNIFICANT ACCOUNTING POLICIES (CONTINUED):
Transfers of Financial Assets
Transfers of financial assets are accounted for as sales, when control over the assets has been surrendered. Control over transferred assets is deemed to be surrendered when (1) the assets have been isolated from the Company – put presumptively beyond reach of the transferor and its creditors, even in bankruptcy or other receivership, (2) the transferee obtains the right (free of conditions that constrain it from taking advantage of that right) to pledge or exchange the transferred assets, and (3) the Company does not maintain effective control over the transferred assets through an agreement to repurchase them before their maturity or the ability to unilaterally cause the holder to return specific assets.
Comprehensive Income
In February 2018, the FASB issued ASU 2018-02, “Reclassification of Certain Tax Effects from Accumulated Other Comprehensive Income (“AOCI”). The Company early adopted this new standard in the current year. ASU 2018-02 requires reclassification from AOCI to retained earnings for stranded tax effects resulting from the impact of the equity sectionnewly enacted federal corporate tax rate on items included in AOCI. The amount of the balance sheet. Such items, along with operating net income, are components of comprehensive income.reclassification in 2017 was $682.
Derivative Financial Instruments and Change in Accounting Principle
Under ASC 815, the gain or loss on a derivative designated and qualifying as a fair value hedging instrument, as well as the offsetting gain or loss on the hedging item attributable to the risk being hedged, is recognized currently in earnings in the same accounting period. The effective portion of the gain or loss on a derivative designated and qualifying as a cash flow hedging instrument is initially reported as a component of other comprehensive income and subsequently reclassified into earnings in the same period or periods during which the hedged transaction affects earnings. The ineffective portion of the gain or loss on the derivative instrument, if any, is recognized currently in earnings.
Interest rate derivative financial instruments receive hedge accounting treatment only if they are designated as a hedge and are expected to be, and are, effective in substantially reducing interest rate risk arising from the assets and liabilities identified as exposing the Company to risk. Those derivative financial instruments that do not meet the hedging criteria discussed below would be classified as trading activities and would be recorded at fair value with changes in fair value recorded in income. Derivative hedge contracts must meet specific effectiveness tests (i.e., over time the change in their fair values due to the designated hedge risk must be within 80 to 125 percent of the opposite change in the fair value of the hedged assets or liabilities).tests. Changes in fair value of the derivative financial instruments must be effective at offsetting changes in the fair value of the hedging items due to the designated hedge risk during the term of the hedge. Further, if the underlying financial instrument differs from the hedged asset or liability, there must be a clear economic relationship between the prices of the two financial instruments. If periodic assessment indicates derivatives no longer provide an effective hedge, the derivatives contracts would be closed out and settled or classified as a trading activity.
Loss Contingencies
Loss contingencies, including claims and legal actions arising in the ordinary course of business, are recorded as liabilities when the likelihood of loss is probable, and an amount or range of loss can be reasonably estimated. Management does not believe there now are such matters that will have a material effect on the consolidated financial statements.
Fair Value Measurements
The Company follows the provisions of ASC Topic 820 “Fair Value Measurements and Disclosures,” for financial assets and financial liabilities. ASC 820 defines fair value, establishes a framework for measuring fair value in generally accepted accounting principles, and expands disclosures about fair value measurements.
F & M Bank Corp. and Subsidiaries
Notes to the Consolidated Financial Statements (dollars in thousands)
December 31, 20152017 and 20142016
NOTE 2
SUMMARY OF SIGNIFICANT ACCOUNTING POLICIES (CONTINUED):
Reclassifications
Certain reclassifications have been made in prior years’ financial statements to conform to classifications used in the current year. The reclassification adjustments related to our consolidation of VBS and the classification of individual line items in a manner consistent with the rest of the Company on the income statement. These reclassifications had no impact on net income or earnings per share.
Earnings per Share
Accounting guidance specifies the computation, presentation and disclosure requirements for earnings per share (“EPS”) for entities with publicly held common stock or potential common stock such as options, warrants, convertible securities or contingent stock agreements if those securities trade in a public market. Basic EPS is computed by dividing net income available to common stockholders by the weighted average number of common shares outstanding. Diluted EPS is similar to the computation of basic EPS except that the denominator is increased to include the number of additional common shares that would have been outstanding if the dilutive common shares had been issued. The dilutive effect of conversion of preferred stock is reflected in the diluted earnings per common share calculation.
Net income available to common stockholders represents consolidated net income adjusted for preferred dividends declared.
The following table provides a reconciliation of net income to net income available to common stockholders for the periods presented:
| For the year ended | For the year ended | ||||||||||
| December 31, 2015 | December 31, 2014 | ||||||||||
| Dollars in thousands | December 31, 2017 | December 31, 2016 | December 31, 2015 | ||||||||
| Earnings Available to Common Stockholders: | |||||||||||
| Net Income | $ | 8,581,584 | $ | 5,847,262 | $9,041 | $9,762 | $8,581 | ||||
| Minority interest | $ | 164,575 | $ | 45,653 | |||||||
| Preferred Stock Dividends | 510,000 | 127,500 | |||||||||
| Minority interest attributable to noncontrolling interest | 31 | 194 | 164 | ||||||||
| Dividends paid/accumulated on preferred stock | 415 | 487 | 510 | ||||||||
| Net Income Available to Common Stockholders | $ | 7,907,009 | $ | 5,674,109 | $8,595 | $9,081 | $7,907 | ||||
The following table shows the effect of dilutive preferred stock conversion on the Company's earnings per share for the periods indicated:
| Year ended | Year ended | ||||||||||||||||||||||||||||||||
| 12/31/2015 | 12/31/2014 | December 31, 2017 | December 31, 2016 | December 31, 2015 | |||||||||||||||||||||||||||||
| Income | Shares | Per Share Amounts | Income | Shares | Per Share Amounts | ||||||||||||||||||||||||||||
| Dollars in thousands | Net Income Available to Common Stockholders | Weighted Average Shares | Per Share Amounts | Net Income Available to Common Stockholders | Weighted Average Shares | Per Share Amounts | Net Income Available to Common Stockholders | Weighted Average Shares | Per Share Amounts | ||||||||||||||||||||||||
| Basic EPS | $ | 7,907,009 | 3,735,212 | $ | 2.40 | $ | 5,674,109 | 3,229,942 | $ | 1.82 | $8,595 | 3,269,713 | $2.63 | $9,081 | 3,282,335 | $2.77 | $7,907 | 3,290,812 | $2.40 | ||||||||||||||
| Effect of Dilutive Securities: | |||||||||||||||||||||||||||||||||
| Convertible Preferred Stock | 510,000 | 444,400 | (0.15 | ) | 127,500 | 110,631 | (0.02 | ) | 415 | 362,271 | (0.15) | 487 | 434,256 | (0.20) | 510 | 444,400 | (0.15) | ||||||||||||||||
| Diluted EPS | $ | 8,417,009 | 3,290,812 | $ | 2.25 | $ | 5,801,609 | 3,119,311 | $ | 1.80 | $9,010 | 3,631,984 | $2.48 | $9,568 | 3,716,591 | $2.57 | $8,417 | 3,735,212 | $2.25 | ||||||||||||||
F & M Bank Corp. and Subsidiaries
Notes to the Consolidated Financial Statements (dollars in thousands)
December 31, 20152017 and 20142016
NOTE 2
SUMMARY OF SIGNIFICANT ACCOUNTING POLICIES (CONTINUED):
Recent Accounting Pronouncements
In May 2014, the Financial Accounting Standards Board (“FASB”)FASB issued ASU No. 2014-09, “Revenue from Contracts with Customers: Topic 606.” This ASU revised guidance to changefor the recognition, measurement, and disclosure of revenue from contracts with customers. The core principleoriginal guidance has been amended through subsequent accounting standard updates that resulted in technical corrections, improvements, and a one-year deferral of the new guidance is that an entity should recognize revenueeffective date to reflect the transfer of goods and services to customers in an amount equal to the consideration the entity receives or expects to receive.January 1, 2018. The guidance, as amended, is applicable to all entities and, once effective, will be effective forreplace significant portions of existing industry and transaction-specific revenue recognition rules with a more principles-based recognition model. Most revenue associated with financial instruments, including interest income, loan origination fees, and credit card fees, is outside the Company for reporting periods beginning after December 15, 2017. Management is currently analyzing the impactscope of the adoptionguidance. Gains and losses on investment securities, derivatives, and sales of this guidance on the Company’s consolidated financial statements. The Company does not expect these amendments to have a material effect on its financial statements.
In January 2016, the FASB amendedissued ASU 2016-01, “Financial Instruments – Overall (Subtopic 825-10): Recognition and Measurement of Financial Assets and Financial Liabilities.” The amendments in ASU 2016-01, among other things: 1) Requires equity investments (except those accounted for under the Financial Instruments topicequity method of accounting, or those that result in consolidation of the Accounting Standards Codificationinvestee) to address certain aspects of recognition, measurement, presentation, and disclosurebe measured at fair value with changes in fair value recognized in net income. 2) Requires public business entities to use the exit price notion when measuring the fair value of financial instruments.instruments for disclosure purposes. 3) Requires separate presentation of financial assets and financial liabilities by measurement category and form of financial asset (i.e., securities or loans and receivables). 4) Eliminates the requirement for public business entities to disclose the method(s) and significant assumptions used to estimate the fair value that is required to be disclosed for financial instruments measured at amortized cost. The amendments will bein this ASU are effective for public companies for fiscal years beginning after December 15, 2017, including interim periods within those fiscal years. The Company will applyis currently assessing the guidance by means of a cumulative-effect adjustment to the balance sheet as of the beginning of the fiscal year of adoption. The amendments related to equity securities without readily determinable fair values will be applied prospectively to equity investmentsimpact that exist as of the date of adoption of the amendments. The Company does not expect these amendments toASU 2016-01 will have a material effect on its consolidated financial statements.statements by contracting with a third party vendor.
In February 2016, the FASB issued new guidance to change accounting for leases and that will generally require most leases to be recognized onASU No. 2016-02, “Leases (Topic 842).” Among other things, in the balance sheet. The new lease standard only contains targeted changes to accounting by lessors, however,amendments in ASU 2016-02, lessees will be required to recognize mostthe following for all leases in their balance sheets as(with the exception of short-term leases) at the commencement date: (1) A lease liabilities forliability, which is a lessee‘s obligation to make lease payments arising from a lease, measured on a discounted basis; and (2) A right-of-use assets representingasset, which is an asset that represents the lessee’s rightsright to use, or control the underlying assetsuse of, a specified asset for the lease terms for lease arrangements longer than 12 months.term. Under this approach, a lessee will account for most existing capital/finance leases as Type A leases and most existing operating leases as Type B leases. Type A and Type B leases have unique accounting and disclosure requirements. Existing sale-leaseback guidance, including guidance for real estate, will be replaced with a new model applicable to both lessees and lessors. Thethe new guidance, will belessor accounting is largely unchanged. Certain targeted improvements were made to align, where necessary, lessor accounting with the lessee accounting model and Topic 606, Revenue from Contracts with Customers. The amendments in this ASU are effective for fiscal years (andbeginning after December 15, 2018, including interim periods within those fiscal years)years. Early application is permitted upon issuance. Lessees (for capital and operating leases) and lessors (for sales-type, direct financing, and operating leases) must apply a modified retrospective transition approach for leases existing at, or entered into after, the beginning of the earliest comparative period presented in the financial statements. The modified retrospective approach would not require any transition accounting for leases that expired before the earliest comparative period presented. Lessees and lessors may not apply a full retrospective transition approach. The Company is currently assessing the impact that ASU 2016-02 will have on its consolidated financial statements by gathering data on current lease agreements and analyzing the capital impact of expected right of use assets that will be recorded. No changes are expected regarding total lease expense.
During March 2016, the FASB issued ASU No. 2016-05, “Derivatives and Hedging (Topic 815): Effect of Derivative Contract Novations on Existing Hedge Accounting Relationships.” The amendments in this ASU clarify that a change in the counterparty to a derivative instrument that has been designated as the hedging instrument does not, in and of itself, require de-designation of that hedging relationship provided that all other hedge accounting criteria remain intact. The amendments in this ASU are effective for financial statements issued for fiscal years beginning after December 15, 2018.2016, and interim periods within those fiscal years. Early adoption is permitted, for all companies and organizations. Management is currently analyzing the impact ofincluding adoption in an interim period. The Company does not expect the adoption of this guidance on the Company’s consolidated financial statements, including assessing changes that might be necessary to information technology systems, processes and internal controls to capture new data and address changes in financial reporting.
F & M Bank Corp. and Subsidiaries
Notes to the Company’s financial position,Consolidated Financial Statements (dollars in thousands)
December 31, 2017 and 2016
NOTE 2
SUMMARY OF SIGNIFICANT ACCOUNTING POLICIES (CONTINUED):
Recent Accounting Pronouncements, continued
In March 2016, the FASB issued ASU No. 2016-07, “Investments – Equity Method and Joint Ventures (Topic 323): Simplifying the Transition to the Equity Method of Accounting.” The amendments in this ASU eliminate the requirement that when an investment qualifies for use of the equity method as a result of an increase in the level of ownership interest or degree of influence, an investor must adjust the investment, results of operations, or cash flows.
During June 2016, the FASB issued ASU No. 2016-13, “Financial Instruments – Credit Losses (Topic 326): Measurement of Credit Losses on Financial Instruments.” The amendments in this ASU, among other things, require the measurement of all expected credit losses for financial assets held at the reporting date based on historical experience, current conditions, and reasonable and supportable forecasts. Financial institutions and other organizations will now use forward-looking information to better inform their credit loss estimates. Many of the loss estimation techniques applied today will still be permitted, although the inputs to those techniques will change to reflect the full amount of expected credit losses. In addition, the ASU amends the accounting for credit losses on available-for-sale debt securities and purchased financial assets with credit deterioration. The amendments in this ASU are effective for SEC filers for fiscal years, and interim periods within those fiscal years, beginning after December 15, 2019. For public companies that are not SEC filers, the amendments in this ASU are effective for fiscal years, and interim periods within those fiscal years, beginning after December 15, 2020. The Company is currently assessing the impact that ASU 2016-13 will have on its consolidated financial statements and has formed a Current Expected Credit Losses steering committee that is researching methods and models.
During August 2016, the FASB issued ASU No. 2016-15, “Statement of Cash Flows (Topic 230): Classification of Certain Cash Receipts and Cash Payments”, to address diversity in how certain cash receipts and cash payments are presented and classified in the statement of cash flows. The amendments are effective for public business entities for fiscal years beginning after December 15, 2017, and interim periods within those fiscal years. The amendments should be applied using a retrospective transition method to each period presented. If retrospective application is impractical for some of the issues addressed by the update, the amendments for those issues would be applied prospectively as of the earliest date practicable. Early adoption is permitted, including adoption in an interim period. The Company does not expect the adoption of ASU 2016-15 to have a material impact on its consolidated financial statements.
F & M Bank Corp. and Subsidiaries
Notes to the Consolidated Financial Statements (dollars in thousands)
December 31, 20152017 and 20142016
NOTE 2
SUMMARY OF SIGNIFICANT ACCOUNTING POLICIES (CONTINUED):
Recent Accounting Pronouncements, continued
During January 2017, the FASB issued ASU No. 2017-01, “Business Combinations (Topic 805): Clarifying the Definition of a Business”. The amendments in this ASU clarify the definition of a business with the objective of adding guidance to assist entities with evaluating whether transactions should be accounted for as acquisitions (or disposals) of assets or businesses. Under the current implementation guidance in Topic 805, there are three elements of a business—inputs, processes, and outputs. While an integrated set of assets and activities (collectively referred to as a “set”) that is a business usually has outputs, outputs are not required to be present. In addition, all the inputs and processes that a seller uses in operating a set are not required if market participants can acquire the set and continue to produce outputs. The amendments in this ASU provide a screen to determine when a set is not a business. If the screen is not met, the amendments (1) require that to be considered a business, a set must include, at a minimum, an input and a substantive process that together significantly contribute to the ability to create output and (2) remove the evaluation of whether a market participant could replace missing elements. The ASU provides a framework to assist entities in evaluating whether both an input and a substantive process are present. The amendments in this ASU are effective for annual periods beginning after December 15, 2017, including interim periods within those annual periods. The amendments in this ASU should be applied prospectively on or after the effective date. No disclosures are required at transition. The Company does not expect the adoption of ASU 2017-01 to have a material impact on its consolidated financial statements.
During January 2017, the FASB issued ASU No. 2017-04, “Intangibles – Goodwill and Other (Topic 350): Simplifying the Test for Goodwill Impairment”. The amendments in this ASU simplify how an entity is required to test goodwill for impairment by eliminating Step 2 from the goodwill impairment test. Step 2 measures a goodwill impairment loss by comparing the implied fair value of a reporting unit’s goodwill with the carrying amount of that goodwill. Instead, under the amendments in this ASU, an entity should perform its annual, or interim, goodwill impairment test by comparing the fair value of a reporting unit with its carrying amount. An entity still has the option to perform the qualitative assessment for a reporting unit to determine if the quantitative impairment test is necessary. Public business entities that are U.S. Securities and Exchange Commission (SEC) filers should adopt the amendments in this ASU for annual or interim goodwill impairment tests in fiscal years beginning after December 15, 2019. Public business entities that are not SEC filers should adopt the amendments in this ASU for annual or interim goodwill impairment tests in fiscal years beginning after December 15, 2020. Early adoption is permitted for interim or annual goodwill impairment tests performed on testing dates after January 1, 2017. The Company does not expect the adoption of ASU 2017-04 to have a material impact on its consolidated financial statements.
During March 2017, the FASB issued ASU 2017-07, “Compensation — Retirement Benefits (Topic 715): Improving the Presentation of Net Periodic Pension Cost and Net Periodic Postretirement Benefit Cost.” The amendments in this ASU require an employer that offers defined benefit pension plans, other postretirement benefit plans, or other types of benefits accounted for under Topic 715 to report the service cost component of net periodic benefit cost in the same line item(s) as other compensation costs arising from services rendered during the period. The other components of net periodic benefit cost are required to be presented in the income statement separately from the service cost component. If the other components of net periodic benefit cost are not presented on a separate line or lines, the line item(s) used in the income statement must be disclosed. In addition, only the service cost component will be eligible for capitalization as part of an asset, when applicable. The amendments are effective for annual periods beginning after December 15, 2017, including interim periods within those annual periods. Early adoption is permitted. The Company does not expect the adoption of ASU 2017-07 to have a material impact on its consolidated financial statements.
F & M Bank Corp. and Subsidiaries
Notes to the Consolidated Financial Statements (dollars in thousands)
December 31, 2017 and 2016
NOTE 2
SUMMARY OF SIGNIFICANT ACCOUNTING POLICIES (CONTINUED):
Recent Accounting Pronouncements, continued
During March 2017, the FASB issued ASU 2017‐08, “Receivables—Nonrefundable Fees and Other Costs (Subtopic 310‐20), Premium Amortization on Purchased Callable Debt Securities.” The amendments in this ASU shorten the amortization period for certain callable debt securities purchased at a premium. Upon adoption of the standard, premiums on these qualifying callable debt securities will be amortized to the earliest call date. Discounts on purchased debt securities will continue to be accreted to maturity. The amendments are effective for fiscal years beginning after December 15, 2018, and interim periods within those fiscal years. Early adoption is permitted, including adoption in an interim period. Upon transition, entities should apply the guidance on a modified retrospective basis, with a cumulative-effect adjustment to retained earnings as of the beginning of the period of adoption and provide the disclosures required for a change in accounting principle. Given the composition of our securities portfolio, the Company does not expect that adoption of ASU 2017‐08 will have a material impact on its consolidated financial statements.
During May 2017, the FASB issued ASU 2017‐09, “Compensation – Stock Compensation (Topic 718): Scope of Modification Accounting.” The amendments provide guidance on determining which changes to the terms and conditions of share-based payment awards require an entity to apply modification accounting under Topic 718. The amendments are effective for annual periods, including interim periods within those annual periods, beginning after December 15, 2017. Early adoption is permitted, including adoption in any interim period, for reporting periods for which financial statements have not yet been issued. Given the Company historically has not issued stock based compensation, the Company does not expect the adoption of ASU 2017‐09 will have a material impact on its consolidated financial statements.
During August 2017, the FASB issued ASU 2017-12, “Derivatives and Hedging (Topic 815): Targeted Improvements to Accounting for Hedging Activities.” The amendments in this ASU modify the designation and measurement guidance for hedge accounting as well as provide for increased transparency regarding the presentation of economic results on both the financial statements and related footnotes. Certain aspects of hedge effectiveness assessments will also be simplified upon implementation of this update. The amendments are effective for annual periods, including interim periods within those annual periods, beginning after December 15, 2018. Early adoption is permitted, including adoption in any interim period. The Company does not expect the adoption of ASU 2017-12 to have a material impact on its consolidated financial statements.
During February 2018, the FASB issued ASU 2018-02, “Income Statement – Reporting Comprehensive Income (Topic 220): Reclassification of Certain Tax Effects from Accumulated Other Comprehensive Income.” The amendments provide financial statement preparers with an option to reclassify stranded tax effects within accumulated other comprehensive income to retained earnings in each period in which the effect of the change in the U.S. federal corporate income tax rate in the Tax Cuts and Jobs Act (or portion thereof) is recorded. The amendments are effective for all organizations for fiscal years beginning after December 15, 2018, and interim periods within those fiscal years. Early adoption is permitted. Organizations should apply the proposed amendments either in the period of adoption or retrospectively to each period (or periods) in which the effect of the change in the U.S. federal corporate income tax rate in the Tax Cuts and Jobs Act is recognized. The Company has elected to reclassify the stranded income tax effects from the Tax Cuts and Jobs Act in the consolidated financial statements for the period ending December 31, 2017. The amount of this reclassification in 2017 was $811.
F & M Bank Corp. and Subsidiaries
Notes to the Consolidated Financial Statements (dollars in thousands)
December 31, 2017 and 2016
NOTE 3
CASH AND DUE FROM BANKS:
The Bank is required to maintain average reserve balances based on a percentage of deposits. The average balance of cash, whichDue to the deposit reclassification procedures implemented by the Bank, there is no Federal Reserve Bank requires to be on reserve was $25,000requirement for the years ended December 31, 20152017 and 2014.
NOTE 4
SECURITIES:
The amortized cost and fair value, with unrealized gains and losses, of securities held to maturity arewere as follows:
Amortized Cost | Gross Unrealized Gains | Gross Unrealized Losses | Fair Value | |
| December 31, 2017 | ||||
U. S. Treasuries | $125 | $- | $- | $125 |
| December 31, 2016 | ||||
U. S. Treasuries | $125 | $- | $- | $125 |
Amortized Cost | Gross Unrealized Gains | Gross Unrealized Losses | Fair Value | |||||||||||||
| December 31, 2015 | ||||||||||||||||
| U. S. Treasuries | $ | 125,043 | $ | - | $ | - | $ | 125,043 | ||||||||
| December 31, 2014 | ||||||||||||||||
| U. S. Treasuries | $ | 125,150 | $ | - | $ | - | $ | 125,150 | ||||||||
The amortized cost and fair value of securities available for sale are as follows:
Amortized Cost | Gross Unrealized Gains | Gross Unrealized Losses | Fair Value | |
| December 31, 2017 | ||||
| U. S. Treasuries | $19,998 | $- | $- | $19,998 |
| U. S. Government sponsored enterprises | 7,999 | - | 19 | 7,980 |
| Mortgage-backed obligations of federal agencies | 508 | - | 6 | 502 |
| Equity securities | 135 | - | - | 135 |
| Total Securities Available for Sale | $28,640 | $- | $25 | $28,615 |
| December 31, 2016 | ||||
| U. S. Treasuries | $24,005 | $9 | $- | $24,014 |
| Mortgage-backed obligations of federal agencies | 634 | - | - | 634 |
| Equity securities | 135 | - | - | 135 |
| Total Securities Available for Sale | $24,774 | $9 | $- | $24,783 |
| Amortized Cost | Gross Unrealized Gains | Gross Unrealized Losses | Fair Value | |||||||||||||
| December 31, 2015 | ||||||||||||||||
| U. S. Treasuries | $ | 4,015,440 | $ | 5,840 | $ | - | $ | 4,021,280 | ||||||||
| Government sponsored enterprises | 8,080,540 | 3,780 | 10,600 | 8,073,720 | ||||||||||||
| Mortgage-backed obligations of federal agencies | 810,802 | 6,143 | - | 816,945 | ||||||||||||
| Marketable equities | 135,000 | - | - | 135,000 | ||||||||||||
| Total Securities Available for Sale | $ | 13,041,782 | $ | 15,763 | $ | 10,600 | $ | 13,046,945 | ||||||||
| December 31, 2014 | ||||||||||||||||
| U. S. Treasuries | $ | 4,025,740 | $ | - | $ | 6,100 | $ | 4,019,640 | ||||||||
| Government sponsored enterprises | 8,039,540 | 8,940 | 9,880 | 8,038,600 | ||||||||||||
| Mortgage-backed obligations of federal agencies | 1,011,092 | 10,780 | - | 1,021,872 | ||||||||||||
| Marketable equities | 135,000 | - | - | 135,000 | ||||||||||||
| Total Securities Available for Sale | $ | 13,211,372 | $ | 19,720 | $ | 15,980 | $ | 13,215,112 | ||||||||
Notes to the Consolidated Financial Statements (dollars in thousands)
December 31, 2017 and 2016
NOTE 4
SECURITIES (CONTINUED):
The amortized cost and fair value of securities at December 31, 2015,2017, by contractual maturity are shown below. Expected maturities will differ from contractual maturities because borrowers may have the right to call or prepay obligations with or without call or prepayment penalties.
| Securities Held to Maturity | Securities Available for Sale | Securities Held to Maturity | Securities Available for Sale | |||||||||||||||||
| Amortized Cost | Fair Value | Amortized Cost | Fair Value | Amortized Cost | Fair Value | Amortized Cost | Fair Value | |||||||||||||
| Due in one year or less | $ | 125,043 | $ | 125,043 | $ | 4,015,440 | $ | 4,021,280 | $125 | $19,998 | ||||||||||
| Due after one year through five years | - | - | 8,080,540 | 8,073,720 | - | 7,999 | 7,980 | |||||||||||||
| Due after five years | - | - | 945,802 | 951,945 | ||||||||||||||||
| Due after five years through ten years | - | 508 | 502 | |||||||||||||||||
| Due after ten years | - | 135 | ||||||||||||||||||
| Total | $ | 125,043 | $ | 125,043 | $ | 13,041,782 | $ | 13,046,945 | $125 | $28,640 | $28,615 | |||||||||
There were no sales of debt or equity securities during 2015, 20142017, 2016 or 2013.2015.
Other investments consist of investments in nineteentwenty low-income housing and historic equity partnerships (carrying basis of $7,213,000)$7,406), stock in the Federal Home Loan Bank (carrying basis of $3,441,000)$3,627), and various other investments (carrying basis of $1,503,000)$1,470). The interests in the low-income housing and historic equity partnerships have limited transferability and the interests in the other stocks are restricted as to sales. The market values of these securities are estimated to approximate their carrying valuevalues as of December 31, 2015.2017. At December 31, 2015,2017, the Company was committed to invest an additional $4,358,041$4,231 in eightsix low-income housing limited partnerships. These funds will be paid as requested by the general partner to complete the projects. This additional investment has been reflected in the above carrying basis and in accrued liabilities on the balance sheet.
The primary purpose of the investment portfolio is to generate income and meet liquidity needs of the Company through readily saleable financial instruments. The portfolio includes fixed rate bonds, whose prices move inversely with rates and variable rate bonds. At the end of any accounting period, the investment portfolio has unrealized gains and losses. The Company monitors the portfolio, which is subject to liquidity needs, market rate changes and credit risk changes to see if adjustments are needed.for other than temporary impairment. The primary concern in a loss situation is the credit quality of the business behind the instrument. Bonds deteriorate in value due to credit quality of the individual issuer and changes in market conditions. These losses relate to market conditions and the timing of purchases.
A summary of theseunrealized losses (in thousands) isand the length of time in a continuous loss position, by security type of December 31, 2017 were as follows:
| Less than 12 Months | More than 12 Months | Total | ||||||||||||||||||||||
| Fair Value | Unrealized Losses | Fair Value | Unrealized Losses | Fair Value | Unrealized Losses | |||||||||||||||||||
| 2015 | ||||||||||||||||||||||||
| U. S. Treasuries | $ | - | $ | - | $ | - | $ | - | $ | - | $ | - | ||||||||||||
| Government sponsored enterprises | 6,056 | (11 | ) | - | - | 6,056 | (11 | ) | ||||||||||||||||
| Mortgage-backed obligations | - | - | - | - | - | - | ||||||||||||||||||
| Total | $ | 6,056 | $ | (11 | ) | $ | - | $ | - | $ | 6,056 | $ | (11 | ) | ||||||||||
| 2014 | ||||||||||||||||||||||||
| U. S. Treasuries | $ | 4,020 | $ | (6 | ) | $ | - | $ | - | $ | 4,020 | $ | (6 | ) | ||||||||||
| Government sponsored enterprises | 2,004 | (2 | ) | 1,991 | (8 | ) | 3,995 | (10 | ) | |||||||||||||||
| Mortgage-backed obligations | - | - | - | - | - | - | ||||||||||||||||||
| Total | $ | 6,024 | $ | (8 | ) | $ | 1,991 | $ | (8 | ) | $ | 8,015 | $ | (16 | ) | |||||||||
Less than 12 Months | More than 12 Months | Total | ||||
Fair Value | Unrealized Losses | Fair Value | Unrealized Losses | Fair Value | Unrealized Losses | |
| December 31, 2017 | ||||||
| U. S. Government sponsored enterprises | $3,981 | $(19) | $- | $- | $3,981 | $(19) |
| Mortgage-backed obligations of federal agencies | 502 | (6) | - | - | 502 | (6) |
| Total | $4,483 | $(25) | $- | $- | $4,483 | $(25) |
As of December 31, 2016, there were no securities in an unrealized loss position.
F & M Bank Corp. and Subsidiaries
Notes to the Consolidated Financial Statements (dollars in thousands)
December 31, 20152017 and 20142016
NOTE 4 INVESTMENT
SECURITIES (CONTINUED):
Management evaluates securities for other-than-temporary impairment on at least a quarterly basis, and more frequently when economic or market conditions warrant such evaluation. Consideration is given to (1) the length of time and the extent to which the fair value has been less than the cost, (2) the financial condition and near-term prospects of the issuer, and (3) the intent and ability of the Company to retain its investment in the issuer for a period of time sufficient to allow for any anticipated recovery of fair value. The Company does not intend to sell these securities and it is more likely than not that the Company will not be required to sell these securities before recovery of their amortized cost. As of December 31, 2017, the Company had two agencies and a mortgage backed security that were temporarily impaired due to rising interest rates not the credit quality of the security. There were no securities that had been in an unrealized loss position for more than twelve months. The Company did not recognize any other-than-temporary impairment losses in 2015, 20142017, 2016 or 2013.2015.
NOTE 5
LOANS:
Loans held for investment as of December 31:31, 2017, and 2016 were as follows:
| 2015 | 2014 | 2017 | 2016 | |||||||
| Construction/Land Development | $ | 69,759,401 | $ | 67,180,467 | $71,620 | $76,172 | ||||
| Farmland | 13,377,740 | 12,507,446 | 13,606 | 12,901 | ||||||
| Real Estate | 166,586,877 | 162,248,606 | 184,546 | 172,758 | ||||||
| Multi-Family | 7,558,460 | 11,775,205 | 10,298 | 7,605 | ||||||
| Commercial Real Estate | 128,031,686 | 122,305,417 | 148,906 | 150,061 | ||||||
| Home Equity – closed end | 9,135,433 | 9,393,805 | 11,606 | 11,453 | ||||||
| Home Equity – open end | 56,599,337 | 52,181,679 | 54,739 | 54,420 | ||||||
| Commercial & Industrial – Non-Real Estate | 27,954,171 | 28,160,584 | 36,912 | 31,306 | ||||||
| Consumer | 8,219,391 | 9,109,994 | 6,633 | 6,643 | ||||||
| Dealer Finance | 54,085,791 | 40,633,086 | 75,169 | 65,495 | ||||||
| Credit Cards | 2,745,190 | 2,745,190 | 2,939 | 2,822 | ||||||
| Total | $ | 544,053,477 | $ | 518,201,574 | $616,974 | $591,636 | ||||
The Company has pledged loans held for investment as collateral for borrowings with the Federal Home Loan Bank of Atlanta totaling $182,312,000$218,323 and $183,483,000$199,401 as of December 31, 20152017, and 2014,2016, respectively. The Company maintains a blanket lien on its entire residential real estate portfolio and also began pledgescertain commercial and home equity loans.
| Unpaid | Average | Interest | ||||||||||||||||||
| December 31, 2015 | Recorded | Principal | Related | Recorded | Income | |||||||||||||||
| Investment | Balance | Allowance | Investment | Recognized | ||||||||||||||||
| Impaired loans without a valuation allowance: | ||||||||||||||||||||
| Construction/Land Development | $ | 1,361 | $ | 1,499 | $ | - | $ | 3,622 | $ | 73 | ||||||||||
| Farmland | - | - | - | - | - | |||||||||||||||
| Real Estate | 1,097 | 1,097 | - | 734 | 58 | |||||||||||||||
| Multi-Family | - | - | - | - | - | |||||||||||||||
| Commercial Real Estate | 307 | 307 | - | 874 | 17 | |||||||||||||||
| Home Equity – closed end | - | - | - | - | - | |||||||||||||||
| Home Equity – open end | 1,159 | 1,159 | - | 1,513 | 82 | |||||||||||||||
| Commercial & Industrial – Non-Real Estate | 181 | 181 | - | 186 | 10 | |||||||||||||||
| Consumer | 18 | 18 | - | 7 | - | |||||||||||||||
| Credit Cards | - | - | - | - | - | |||||||||||||||
| Dealer Finance | 4 | 4 | - | 1 | 4 | |||||||||||||||
| 4,127 | 4,265 | - | 6,937 | 244 | ||||||||||||||||
| Impaired loans with a valuation allowance | ||||||||||||||||||||
| Construction/Land Development | 11,534 | 11,534 | 2,373 | 12,884 | 299 | |||||||||||||||
| Farmland | - | - | - | - | - | |||||||||||||||
| Real Estate | 324 | 324 | 238 | 699 | 46 | |||||||||||||||
| Multi-Family | - | - | - | - | - | |||||||||||||||
| Commercial Real Estate | 890 | 890 | 18 | 900 | 15 | |||||||||||||||
| Home Equity – closed end | - | - | - | - | - | |||||||||||||||
| Home Equity – open end | 1,414 | 1,414 | 269 | 613 | 75 | |||||||||||||||
| Commercial & Industrial – Non-Real Estate | - | - | - | - | - | |||||||||||||||
| Consumer | - | - | - | - | - | |||||||||||||||
| Credit cards | - | - | - | - | - | |||||||||||||||
| Dealer Finance | 68 | 68 | 17 | 38 | 5 | |||||||||||||||
| 14,230 | 14,230 | 2,915 | 15,134 | 440 | ||||||||||||||||
| Total impaired loans | $ | 18,357 | $ | 18,495 | $ | 2,915 | $ | 22,071 | $ | 684 | ||||||||||
| Unpaid | Average | Interest | ||||||||||||||||||
| December 31, 2014 | Recorded | Principal | Related | Recorded | Income | |||||||||||||||
| Investment | Balance | Allowance | Investment | Recognized | ||||||||||||||||
| Impaired loans without a valuation allowance: | ||||||||||||||||||||
| Construction/Land Development | $ | 4,982 | $ | 5,402 | $ | - | $ | 5,412 | $ | 251 | ||||||||||
| Farmland | - | - | - | 1,163 | - | |||||||||||||||
| Real Estate | 141 | 141 | - | 85 | 5 | |||||||||||||||
| Multi-Family | - | - | - | - | - | |||||||||||||||
| Commercial Real Estate | 1,159 | 1,459 | - | 1,450 | 66 | |||||||||||||||
| Home Equity – closed end | - | - | - | 123 | - | |||||||||||||||
| Home Equity – open end | 1,649 | 1,649 | - | 330 | 57 | |||||||||||||||
| Commercial & Industrial – Non-Real Estate | 191 | 191 | - | 237 | 11 | |||||||||||||||
| Consumer | - | - | - | - | - | |||||||||||||||
| Credit cards | - | - | - | - | - | |||||||||||||||
| Dealer Finance | - | - | - | - | - | |||||||||||||||
| 8,122 | 8,842 | - | 8,800 | 390 | ||||||||||||||||
| Impaired loans with a valuation allowance | ||||||||||||||||||||
| Construction/Land Development | 12,976 | 14,749 | 1,469 | 12,056 | 326 | |||||||||||||||
| Farmland | - | - | - | - | - | |||||||||||||||
| Real Estate | 926 | 926 | 101 | 988 | 105 | |||||||||||||||
| Multi-Family | - | - | - | - | - | |||||||||||||||
| Commercial Real Estate | 938 | 938 | 47 | 1,030 | 4 | |||||||||||||||
| Home Equity – closed end | - | - | - | 72 | - | |||||||||||||||
| Home Equity – open end | - | - | - | 40 | - | |||||||||||||||
| Commercial & Industrial – Non-Real Estate | - | - | - | - | - | |||||||||||||||
| Consumer | - | - | - | - | - | |||||||||||||||
| Credit cards | - | - | - | - | - | |||||||||||||||
| Dealer Finance | - | - | - | - | - | |||||||||||||||
| 14,840 | 16,613 | 1,617 | 14,186 | 435 | ||||||||||||||||
| Total impaired loans | $ | 22,962 | $ | 25,455 | $ | 1,617 | $ | 22,986 | $ | 825 | ||||||||||
Loans held for sale consists of loans originated by VBS Mortgage for sale in the secondary market, and the Bank’s commitment to purchase residential mortgage loan participationsParticipations from Gateway Bank and Northpointe Bank. The volume of loans purchased from Northpointe fluctuates due to a number of factors including changes in secondary market rates, which affects demand for mortgage loans; the number of participating banks involved in the program; the number of mortgage loan originators selling loans to the lead bank and the funding capabilities of the lead bank. Loans held for sale as of December 31, 20152017, and 20142016 were $57,805,529$39,775 and $13,381,941,$62,735, respectively.
F & M Bank Corp. and Subsidiaries
Notes to the Consolidated Financial Statements (dollars in thousands)
December 31, 2017 and 2016
NOTE 5
LOANS (CONTINUED):
The following is a summary of information pertaining to impaired loans (in thousands), as of December 31, 2017 and 2016:
December 31, 2017 | December 31, 2016 | |||||
Unpaid | Unpaid | |||||
Recorded | Principal | Related | Recorded | Principal | Related | |
Investment | Balance | Allowance | Investment | Balance | Allowance | |
| Impaired loans without a valuation allowance: | ||||||
| Construction/Land Development | $4,352 | $5,269 | $- | $3,296 | $3,652 | $- |
| Farmland | 1,984 | 1,984 | - | - | - | - |
| Real Estate | 1,273 | 1,273 | - | 768 | 768 | - |
| Multi-Family | - | - | - | - | - | - |
| Commercial Real Estate | 6,229 | 6,229 | - | 1,958 | 1,958 | - |
| Home Equity – closed end | - | - | - | - | - | - |
| Home Equity – open end | - | 347 | - | - | 347 | - |
| Commercial & Industrial – Non-Real Estate | - | - | - | 170 | 170 | - |
| Consumer | 8 | 8 | - | 13 | 13 | - |
| Credit cards | - | - | - | - | - | - |
| Dealer Finance | 31 | 31 | - | - | - | - |
13,877 | 15,141 | - | 6,205 | 6,908 | - | |
| Impaired loans with a valuation allowance | ||||||
| Construction/Land Development | 4,998 | 4,998 | 1,661 | 6,592 | 6,592 | 1,853 |
| Farmland | - | - | - | - | - | - |
| Real Estate | 1,188 | 1,188 | 209 | 1,206 | 1,206 | 221 |
| Multi-Family | - | - | - | - | - | - |
| Commercial Real Estate | - | - | - | 952 | 952 | 60 |
| Home Equity – closed end | - | - | - | - | - | - |
| Home Equity – open end | - | - | - | - | - | - |
| Commercial & Industrial – Non-Real Estate | - | - | - | - | - | - |
| Consumer | - | - | - | - | - | - |
| Credit cards | - | - | - | - | - | - |
| Dealer Finance | 47 | 47 | 12 | 87 | 87 | 20 |
6,233 | 6,233 | 1,882 | 8,837 | 8,837 | 2,154 | |
| Total impaired loans | $20,110 | $21,374 | $1,882 | $15,042 | $15,745 | $2,154 |
The Recorded Investment is defined as the principal balance less principal payments and charge-offs.
F & M Bank Corp. and Subsidiaries
Notes to the Consolidated Financial Statements (dollars in thousands)
December 31, 2017 and 2016
NOTE 5
LOANS (CONTINUED):
The following is a summary of the average investment and interest income recognized for impaired loans (dollars in thousands):
December 31, 2017 | December 31, 2016 | |||
Average | Interest | Average | Interest | |
Recorded | Income | Recorded | Income | |
Investment | Recognized | Investment | Recognized | |
| Impaired loans without a valuation allowance: | ||||
| Construction/Land Development | $4,969 | $382 | $2,547 | $10 |
| Farmland | 1,921 | 62 | - | - |
| Real Estate | 878 | 57 | 778 | 10 |
| Multi-Family | - | - | - | - |
| Commercial Real Estate | 1,682 | 44 | 1,087 | 114 |
| Home Equity – closed end | - | - | - | - |
| Home Equity – open end | 347 | - | 964 | 2 |
| Commercial & Industrial – Non-Real Estate | 124 | - | 174 | 2 |
| Consumer | 10 | - | 11 | - |
| Credit cards | - | - | - | - |
| Dealer Finance | 24 | 3 | 14 | 1 |
9,955 | 548 | 5,575 | 139 | |
| Impaired loans with a valuation allowance | ||||
| Construction/Land Development | 5,911 | 258 | 8,525 | 291 |
| Farmland | - | - | - | - |
| Real Estate | 1,194 | 49 | 1,215 | 10 |
| Multi-Family | - | - | - | - |
| Commercial Real Estate | - | - | 959 | 57 |
| Home Equity – closed end | - | - | - | - |
| Home Equity – open end | - | - | 969 | - |
| Commercial & Industrial – Non-Real Estate | - | - | 14 | - |
| Consumer | - | - | - | - |
| Credit cards | - | - | - | - |
| Dealer Finance | 56 | 3 | 77 | 1 |
7,161 | 310 | 11,759 | 359 | |
| Total impaired loans | $17,116 | $858 | $17,334 | $498 |
F & M Bank Corp. and Subsidiaries
Notes to the Consolidated Financial Statements (dollars in thousands)
December 31, 2017 and 2016
NOTE 5
LOANS (CONTINUED):
The following table presents the aging of the recorded investment of past due loans (in thousands) as of December 31, 2017 and 2016:
30-59 Days Past due | 60-89 Days Past Due | Greater than 90 Days | Total Past Due | Current | Total Loan Receivable | Non-Accrual Loans | Recorded Investment >90 days & accruing | |
| December 31, 2017 | ||||||||
| Construction/Land Development | $167 | $5,459 | $3,908 | $9,534 | $62,086 | $71,620 | $3,908 | $- |
| Farmland | - | - | - | - | 13,606 | 13,606 | - | - |
| Real Estate | 2,858 | 1,954 | 560 | 5,372 | 179,174 | 184,546 | 1,720 | 143 |
| Multi-Family | 179 | - | - | 179 | 10,119 | 10,298 | - | - |
| Commercial Real Estate | 544 | - | - | 544 | 148,362 | 148,906 | - | - |
| Home Equity – closed end | - | 25 | - | 25 | 11,581 | 11,606 | 3 | - |
| Home Equity – open end | 454 | 165 | 268 | 887 | 53,852 | 54,739 | 448 | - |
| Commercial & Industrial – Non- Real Estate | 108 | 36 | 595 | 739 | 36,173 | 36,912 | 599 | - |
| Consumer | 43 | 5 | - | 48 | 6,585 | 6,633 | - | - |
| Dealer Finance | 1,300 | 252 | 189 | 1,741 | 73,428 | 75,169 | 226 | 54 |
| Credit Cards | 30 | 8 | 1 | 39 | 2,900 | 2,939 | - | 1 |
| Total | $5,683 | $7,904 | $5,521 | $19,108 | $597,866 | $616,974 | $6,904 | $198 |
30-59 Days Past due | 60-89 Days Past Due | Greater than 90 Days) | Total Past Due | Current | Total Loan Receivable | Non-Accrual Loans | Recorded Investment >90 days & accruing | |
| December 31, 2016 | ||||||||
| Construction/Land Development | $73 | $101 | $2,175 | $2,349 | $73,823 | $76,172 | $2,805 | $- |
| Farmland | - | - | - | - | 12,901 | 12,901 | - | - |
| Real Estate | 2,135 | 746 | 774 | 3,655 | 169,103 | 172,758 | 1,399 | 81 |
| Multi-Family | - | - | - | - | 7,605 | 7,605 | - | - |
| Commercial Real Estate | 139 | - | - | 139 | 149,922 | 150,061 | - | - |
| Home Equity – closed end | 101 | - | 32 | 133 | 11,320 | 11,453 | 32 | - |
| Home Equity – open end | 484 | - | 69 | 553 | 53,867 | 54,420 | 279 | - |
| Commercial & Industrial – Non- Real Estate | 313 | 5 | - | 318 | 30,988 | 31,306 | 70 | - |
| Consumer | 35 | 4 | 6 | 45 | 6,598 | 6,643 | - | - |
| Dealer Finance | 797 | 187 | 183 | 1,167 | 64,328 | 65,495 | 178 | 26 |
| Credit Cards | 18 | 4 | - | 22 | 2,800 | 2,822 | - | - |
| Total | $4,095 | $1,047 | $3,239 | $8,381 | $583,255 | $591,636 | $4,763 | $107 |
F & M Bank Corp. and Subsidiaries
Notes to the Consolidated Financial Statements (dollars in thousands)
December 31, 2017 and 2016
NOTE 6
ALLOWANCE FOR LOAN LOSSES:
A summary of changes in the allowance for loan losses (in thousands) for the years ended December 31, 2017 and 2016 is as follows:
| December 31, 2017 | Beginning Balance | Charge-offs | Recoveries | Provision for Loan Losses | Ending Balance | Individually Evaluated for Impairment | Collectively Evaluated for Impairment |
| Allowance for loan losses: | |||||||
| Construction/Land Development | $3,381 | $620 | $- | $(214) | $2,547 | $1,661 | $886 |
| Farmland | 34 | - | - | (9) | 25 | - | 25 |
| Real Estate | 843 | - | 2 | (126) | 719 | 209 | 510 |
| Multi-Family | 23 | - | - | (6) | 19 | - | 19 |
| Commercial Real Estate | 705 | - | 13 | (236) | 482 | - | 482 |
| Home Equity – closed end | 75 | 7 | 25 | (27) | 66 | - | 66 |
| Home Equity – open end | 470 | 26 | 53 | (288) | 209 | - | 209 |
| Commercial & Industrial – Non-Real Estate | 586 | 179 | 72 | (142) | 337 | - | 337 |
| Consumer | 78 | 136 | 28 | 178 | 148 | - | 148 |
| Dealer Finance | 1,289 | 1,806 | 1,143 | 814 | 1,440 | 12 | 1,428 |
| Credit Cards | 59 | 98 | 37 | 54 | 52 | - | 52 |
| Total | $7,543 | $2,872 | $1,373 | $- | $6,044 | $1,882 | $4,162 |
| December 31, 2016 | Beginning Balance | Charge-offs | Recoveries | Provision for Loan Losses | Ending Balance | Individually Evaluated for Impairment | Collectively Evaluated for Impairment |
| Allowance for loan losses: | |||||||
| Construction/Land Development | $4,442 | $356 | $7 | $(712) | $3,381 | $1,853 | $1,528 |
| Farmland | 95 | - | - | (61) | 34 | - | 34 |
| Real Estate | 806 | 23 | 4 | 56 | 843 | 221 | 622 |
| Multi-Family | 71 | - | - | (48) | 23 | - | 23 |
| Commercial Real Estate | 445 | 19 | 135 | 144 | 705 | - | 705 |
| Home Equity – closed end | 174 | 8 | - | (91) | 75 | - | 75 |
| Home Equity – open end | 634 | 370 | 120 | 86 | 470 | 60 | 410 |
| Commercial & Industrial – Non-Real Estate | 1,055 | 293 | 267 | (443) | 586 | - | 586 |
| Consumer | 108 | 37 | 19 | (12) | 78 | - | 78 |
| Dealer Finance | 836 | 1,081 | 417 | 1,117 | 1,289 | 20 | 1,269 |
| Credit Cards | 115 | 74 | 54 | (36) | 59 | - | 59 |
| Total | $8,781 | $2,261 | $1,023 | $- | $7,543 | $2,154 | $5,389 |
F & M Bank Corp. and Subsidiaries
Notes to the Consolidated Financial Statements (dollars in thousands)
December 31, 2017 and 2016
NOTE 6
ALLOWANCE FOR LOAN LOSSES (CONTINUED):
The following table presents the recorded investment in loans (in thousands) based on impairment method as of December 31, 2017 and 2016:
| December 31, 2017 | Loan Receivable | Individually Evaluated for Impairment | Collectively Evaluated for Impairment |
| Construction/Land Development | $71,620 | $9,350 | $62,270 |
| Farmland | 13,606 | 1,984 | 11,622 |
| Real Estate | 184,546 | 2,461 | 182,085 |
| Multi-Family | 10,298 | - | 10,298 |
| Commercial Real Estate | 148,906 | 6,229 | 142,677 |
| Home Equity – closed end | 11,606 | - | 11,606 |
| Home Equity –open end | 54,739 | - | 54,739 |
| Commercial & Industrial – Non-Real Estate | 36,912 | - | 36,912 |
| Consumer | 6,633 | 8 | 6,625 |
| Dealer Finance | 75,169 | 78 | 75,091 |
| Credit Cards | 2,939 | - | 2,939 |
$616,974 | $20,110 | $596,864 | |
| Total |
| December 31, 2016 | Loan Receivable | Individually Evaluated for Impairment | Collectively Evaluated for Impairment |
| Construction/Land Development | $76,172 | $9,888 | $66,284 |
| Farmland | 12,901 | - | 12,901 |
| Real Estate | 172,758 | 1,974 | 170,784 |
| Multi-Family | 7,605 | - | 7,605 |
| Commercial Real Estate | 150,061 | 2,910 | 147,151 |
| Home Equity – closed end | 11,453 | - | 11,453 |
| Home Equity –open end | 54,420 | - | 54,420 |
| Commercial & Industrial – Non-Real Estate | 31,306 | 170 | 31,136 |
| Consumer | 6,643 | 13 | 6,630 |
| Dealer Finance | 65,495 | 87 | 65,408 |
| Credit Cards | 2,822 | - | 2,822 |
$591,636 | $15,042 | $576,594 |
F & M Bank Corp. and Subsidiaries
Notes to the Consolidated Financial Statements (dollars in thousands)
December 31, 2017 and 2016
NOTE 6
ALLOWANCE FOR LOAN LOSSES (CONTINUED):
The following table shows the Company’s loan portfolio broken down by internal loan grade (in thousands) as of December 31, 2017 and 2016:
December 31, 2017 | Grade 1 Minimal Risk | Grade 2 Modest Risk | Grade 3 Average Risk | Grade 4 Acceptable Risk | Grade 5 Marginally Acceptable | Grade 6 Watch | Grade 7 Substandard | Grade 8 Doubtful | Total |
| Construction/Land Development | $- | $690 | $12,974 | $30,197 | $9,165 | $3,520 | $15,074 | $- | $71,620 |
| Farmland | 63 | - | 3,153 | 4,120 | 3,793 | 494 | 1,983 | - | 13,606 |
| Real Estate | - | 1,512 | 53,764 | 101,606 | 19,734 | 4,660 | 3,270 | - | 184,546 |
| Multi-Family | - | 228 | 4,780 | 5,111 | 179 | - | - | - | 10,298 |
| Commercial Real Estate | - | 3,525 | 45,384 | 89,195 | 9,012 | 634 | 1,156 | - | 148,906 |
| Home Equity – closed end | - | - | 3,535 | 5,410 | 1,279 | 1,379 | 3 | - | 11,606 |
| Home Equity – open end | 235 | 1,598 | 17,383 | 30,888 | 3,945 | 176 | 514 | - | 54,739 |
| Commercial & Industrial (Non-Real Estate) | 262 | 1,595 | 13,297 | 19,442 | 1,480 | 207 | 629 | - | 36,912 |
| Consumer (excluding dealer) | 34 | 490 | 2,226 | 88 | 1,065 | 2,254 | 476 | - | 6,633 |
| Total | $594 | $9,638 | $156,496 | $286,057 | $49,652 | $13,324 | $23,105 | $- | $538,866 |
Credit Cards | Dealer Finance | |
| Performing | $2,938 | $75,116 |
| Non performing | 1 | 53 |
| Total | $2,939 | $75,169 |
F & M Bank Corp. and Subsidiaries
Notes to the Consolidated Financial Statements (dollars in thousands)
December 31, 2017 and 2016
NOTE 6
ALLOWANCE FOR LOAN LOSSES (CONTINUED):
December 31, 2016 | Grade 1 Minimal Risk | Grade 2 Modest Risk | Grade 3 Average Risk | Grade 4 Acceptable Risk | Grade 5 Marginally Acceptable | Grade 6 Watch | Grade 7 Substandard | Grade 8 Doubtful | Total |
| Construction/Land Development | $- | $1,478 | $10,870 | $43,863 | $8,399 | $2,473 | $9,089 | $- | $76,172 |
| Farmland | 65 | - | 3,073 | 3,456 | 4,446 | 1,861 | - | - | 12,901 |
| Real Estate | - | 1,149 | 62,168 | 74,242 | 28,266 | 4,680 | 2,253 | - | 172,758 |
| Multi-Family | - | 311 | 3,009 | 4,099 | 186 | - | - | - | 7,605 |
| Commercial Real Estate | - | 2,793 | 32,986 | 91,157 | 19,181 | 1,840 | 2,104 | - | 150,061 |
| Home Equity – closed end | - | 150 | 3,966 | 4,139 | 1,746 | 1,414 | 38 | - | 11,453 |
| Home Equity – open end | 124 | 1,724 | 16,415 | 30,974 | 4,547 | 125 | 511 | - | 54,420 |
| Commercial & Industrial (Non-Real Estate) | 1,375 | 1,267 | 6,827 | 19,530 | 2,198 | 39 | 70 | - | 31,306 |
| Consumer (excluding dealer) | 67 | 174 | 1,837 | 607 | 1,242 | 2,252 | 466 | - | 6,643 |
| Total | $1,631 | $9,046 | $141,151 | $272,065 | $70,211 | $14,684 | $14,531 | $- | $523,319 |
Credit Cards | Dealer Finance | |
| Performing | $2,822 | $65,291 |
| Non performing | - | 204 |
| Total | $2,822 | $65,495 |
Description of internal loan grades:
Grade 1 – Minimal Risk: Excellent credit, superior asset quality, excellent debt capacity and coverage, and recognized management capabilities.
Grade 2 – Modest Risk: Borrower consistently generates sufficient cash flow to fund debt service, excellent credit, above average asset quality and liquidity.
Grade 3 – Average Risk: Borrower generates sufficient cash flow to fund debt service. Employment (or business) is stable with good future trends. Credit is very good.
Grade 4 – Acceptable Risk: Borrower’s cash flow is adequate to cover debt service; however, unusual expenses or capital expenses must by covered through additional long term debt. Employment (or business) stability is reasonable, but future trends may exhibit slight weakness. Credit history is good. No unpaid judgments or collection items appearing on credit report.
Grade 5 – Marginally acceptable: Credit to borrowers who may exhibit declining earnings, may have leverage that is materially above industry averages, liquidity may be marginally acceptable. Employment or business stability may be weak or deteriorating. May be currently performing as agreed, but would be adversely affected by developing factors such as layoffs, illness, reduced hours or declining business prospects. Credit history shows weaknesses, past dues, paid or disputed collections and judgments, but does not include borrowers that are currently past due on obligations or with unpaid, undisputed judgments.
F & M Bank Corp. and Subsidiaries
Notes to the Consolidated Financial Statements (dollars in thousands)
December 31, 2017 and 2016
NOTE 6
ALLOWANCE FOR LOAN LOSSES (CONTINUED):
Grade 6 – Watch: Loans are currently protected but are weak due to negative balance sheet or income statement trends. There may be a lack of effective control over collateral or the existence of documentation deficiencies. These loans have potential weaknesses that deserve management’s close attention. Other reasons supporting this classification include adverse economic or market conditions, pending litigation or any other material weakness. Existing loans that become 60 or more days past due are placed in this category pending a return to current status.
Grade 7 – Substandard: Loans having well-defined weaknesses where a payment default and or loss is possible, but not yet probable. Cash flow is inadequate to service the debt under the current payment, or terms, with prospects that the condition is permanent. Loans classified as substandard are inadequately protected by the current net worth and paying capacity of the borrower and there is the likelihood that collateral will have to be liquidated and/or guarantor(s) called upon to repay the debt. Generally, the loan is considered collectible as to both principal and interest, primarily because of collateral coverage, however, if the deficiencies are not corrected quickly; there is a probability of loss.
Grade 8 – Doubtful: Loans having all the characteristics of a substandard credit, but available information indicates it is unlikely the loan will be repaid in its entirety. Cash flow is insufficient to service the debt. It may be difficult to project the exact amount of loss, but the probability of some loss is great. Loans are to be placed on non-accrual status when any portion is classified doubtful.
Credit card and dealer finance loans are classified as performing or nonperforming. A loan is nonperforming when payments of principal and interest are past due 90 days or more.
NOTE 7
TROUBLED DEBT RESTRUCTURING:
In the determination of the allowance for loan losses, management considers troubled debt restructurings and subsequent defaults in these restructurings by adjusting the loan grades of such loans, which are considered in the qualitative factors within the allowance for loan loss methodology. Defaults resulting in charge-offs affect the historical loss experience ratios which are a component of the allowance calculation. Additionally, specific reserves may be established on restructured loans which are evaluated individually for impairment.
During the twelve months ended December 31, 2017, the Bank modified 3 loans that were considered to be troubled debt restructurings. These modifications include rate adjustments, revisions to amortization schedules, suspension of principal payments for a temporary period, re-advancing funds to be applied as payments to bring the loan(s) current, or any combination thereof.
December 31, 2017 | |||
Pre-Modification | Post-Modification | ||
| (dollars in thousands) | Outstanding | Outstanding | |
| Troubled Debt Restructurings | Number of Contracts | Recorded Investment | Recorded Investment |
| Consumer | 3 | $32 | $32 |
| Total | 3 | $32 | $32 |
As of December 31, 2017, there were 3 loans restructured in the previous twelve months, in default. A restructured loan is considered in default when it becomes 90 days past due.
December 31, 2017 | |||
Pre-Modification | Post-Modification | ||
| (dollars in thousands) | Outstanding | Outstanding | |
| Troubled Debt Restructurings | Number of Contracts | Recorded Investment | Recorded Investment |
| Real Estate | 1 | $67 | $67 |
| Construction/Land Development | 2 | 1,502 | 1,502 |
| Total | 3 | $1,569 | $1,569 |
F & M Bank Corp. and Subsidiaries
Notes to the Consolidated Financial Statements (dollars in thousands)
December 31, 2017 and 2016
NOTE 7
TROUBLED DEBT RESTRUCTURING (CONTINUED):
During the twelve months ended December 31, 2016, the Bank modified 6 loans that were considered to be troubled debt restructurings. These modifications included rate adjustments, revisions to amortization schedules, suspension of principal payments for a temporary period, re-advancing funds to be applied as payments to bring the loan(s) current, or any combination thereof.
December 31, 2016 | |||
Pre-Modification | Post-Modification | ||
| (in thousands) | Outstanding | Outstanding | |
| Troubled Debt Restructurings | Number of Contracts | Recorded Investment | Recorded Investment |
| Real Estate | 2 | $141 | $141 |
| Consumer | 4 | 39 | 39 |
| Total | 6 | $180 | $180 |
As of December 31, 2016, there were no loans restructured in the previous twelve months, in default. A restructured loan is considered in default when it becomes 90 days past due.
NOTE 8
BANK PREMISES AND EQUIPMENT:
Bank premises and equipment as of December 31 are summarized as follows:
2017 | 2016 | |
| Land | $3,883 | $3,091 |
| Buildings and improvements | 12,384 | 7,877 |
| Furniture and equipment | 9,454 | 8,257 |
25,721 | 19,225 | |
| Less - accumulated depreciation | (9,827) | (8,885) |
| Net | $15,894 | $10,340 |
Provisions for depreciation of $930 in 2017, $827 in 2016, and $727 in 2015 were charged to operations.
F & M Bank Corp. and Subsidiaries
Notes to the Consolidated Financial Statements (dollars in thousands)
December 31, 2017 and 2016
NOTE 9
OTHER REAL ESTATE OWNED:
The table below reflects other real estate owned (OREO) activity for 2017 and 2016:
Other Real Estate Owned | ||
2017 | 2016 | |
| Balance as of January 1 | $2,076 | $2,128 |
| Loans transferred to OREO | 231 | 566 |
| Capital improvements | 2 | 24 |
| Sale of OREO | (281) | (623) |
| Write down of OREO or losses on sale | (44) | (19) |
| Balance as of December 31 | $1,984 | $2,076 |
At December 31, 2017, the balance of real estate owned includes $207 of foreclosed residential real estate properties recorded as a result of obtaining physical possession of the property. At December 31, 2017, the recorded investment of consumer mortgage loans secured by residential real estate properties for which formal foreclosure procedures are in process is $103.
NOTE 10 DEPOSITS:
Time deposits that meet or exceed the FDIC insurance limit of $250 at year end 2017 and 2016 were $13,637 and $7,841. At December 31, 2017, the scheduled maturities of time deposits are as follows:
| 2018 | $66,749 |
| 2019 | 51,434 |
| 2020 | 30,151 |
| 2021 | 9,296 |
| 2022 and after | 7,640 |
| Total | $165,270 |
NOTE 11
SHORT-TERM DEBT:
Short-term debt, all maturing within 12 months, as of December 31, 2017 and 2016 is summarized as follows:
Outstanding | Average | |||
Maximum Outstanding | At | Balance | ||
at any Month End | Year End | Outstanding | Yield | |
| 2017 | ||||
| Federal funds purchased | $8,964 | $5,296 | $97 | .17% |
| FHLB short term | 50,000 | 20,000 | 20,301 | .30% |
| Totals | $25,296 | $20,398 | .31% | |
| 2016 | ||||
| Federal funds purchased | $11,421 | $- | $637 | .98% |
| FHLB short term | 50,000 | 40,000 | 34,740 | .12% |
| Securities sold under agreements to repurchase | 4,272 | - | 2,133 | .25% |
| Totals | $40,000 | $37,510 | .15% |
F & M Bank Corp. and Subsidiaries
Notes to the Consolidated Financial Statements (dollars in thousands)
December 31, 2017 and 2016
NOTE 11
SHORT-TERM DEBT (CONTINUED)
The Company utilizes short-term debt such as Federal funds purchased and Federal Home Loan Bank of Atlanta (FHLB) short term borrowings to support the loans held for sale participation program and provide liquidity. Federal funds purchased are unsecured overnight borrowings from other financial institutions. FHLB short term debt, which is secured by the loan portfolio, can be a daily rate variable loan that acts as a line of credit or a fixed rate advance, depending on the need of the Company.
Securities sold under repurchase agreements are secured transactions with customers and generally mature the day following the date sold. This product was discontinued in 2017.
As of December 31, 2017, the Company had unsecured lines of credit with correspondent banks totaling $41,000, which may be used in the management of short-term liquidity, in which $5,296 was outstanding.
NOTE 12
LONG-TERM DEBT:
The Company utilizes the FHLB advance program to fund loan growth and provide liquidity. The interest rates on long-term debt are fixed at the time of the advance and range from 1.16% to 2.56%; the weighted average interest rate was 1.86% and 1.80% at December 31, 2017 and December 31, 2016, respectively. The balance of these obligations at December 31, 2017 and 2016 were $49,554 and $63,982 respectively. The Company recognized a gain of $504 on prepayment of two FHLB advances totaling $10,000 during the first quarter of 2017 and there were no additional borrowings in 2017. FHLB advances include a $5,000 line of credit at FHLB that is pledged to the Commonwealth of Virginia to secure public funds.
The maturities of long-term Federal Home Loan Bank long term debt as of December 31, 2017, were as follows:
| 2018 | $9,428 |
| 2019 | 6,929 |
| 2020 | 14,429 |
| 2021 | 5,929 |
| 2022 | 2,714 |
| Thereafter | 10,125 |
| Total | $49,554 |
In addition, the Company has a note payable to purchase a lot adjacent to one of the Bank branches for $170 at December 31, 2017 that is payable in two remaining annual payments on January 1, 2018 and 2019. There was $255 outstanding on this note at December 31, 2016.
VS Title, LLC has a note payable for vehicle purchases with a balance of $9 at December 31, 2017.
NOTE 13
INCOME TAX EXPENSE:
The components of income tax expense were as follows:
2017 | 2016 | 2015 | |
| Current expense | $3,671 | $3,046 | $3,227 |
| Deferred expense (benefit) | (152) | 53 | (341) |
| Adjustments to deferred tax asset due to change in federal tax rate | 811 | - | - |
| Total deferred (benefit) expense | 659 | 53 | (341) |
| Total Income Tax Expense | $4,330 | $3,099 | $2,886 |
F & M Bank Corp. and Subsidiaries
Notes to the Consolidated Financial Statements (dollars in thousands)
December 31, 2017 and 2016
NOTE 13
INCOME TAX EXPENSE (CONTINUED):
The components of deferred taxes as of December 31, were as follows:
2017 | 2016 | |
| Deferred Tax Assets: | ||
| Allowance for loan losses | $1,265 | $2,354 |
| Split Dollar Life Insurance | 3 | 4 |
| Nonqualified deferred compensation | 546 | 856 |
| Low income housing partnerships losses | 203 | 94 |
| Core deposit amortization | 108 | 165 |
| Other real estate owned | 173 | 280 |
| Unfunded pension benefit obligation | 1,096 | 1,633 |
| Total Assets | $3,394 | $5,386 |
2017 | 2016 | |
| Deferred Tax Liabilities: | ||
| Unearned low income housing credits | $180 | $307 |
| Depreciation | 340 | 437 |
| Prepaid pension | 1,010 | 1,840 |
| Goodwill tax amortization | 559 | 901 |
| Net unrealized gain (loss) on securities available for sale | (5) | 3 |
| Total Liabilities | 2 084 | 3,488 |
| Net Deferred Tax Asset (included in Other Assets on Balance Sheet) | $1,310 | $1,898 |
The following table summarizes the differences between the actual income tax expense and the amounts computed using the federal statutory tax rates:
2017 | 2016 | 2015 | |
| Tax expense at federal statutory rates | $4,511 | $4,307 | $3,843 |
| Increases (decreases) in taxes resulting from: | |||
| State income taxes, net of federal benefit | - | 6 | 8 |
| Partially tax-exempt income | (59) | (41) | (46) |
| Tax-exempt income | (212) | (217) | (223) |
| LIH and historic credits | (633) | (896) | (701) |
| Deferred Tax Asset rate change | 811 | ||
| Other | (88) | (60) | 5 |
| Total Income Tax Expense | $4,330 | $3,099 | $2,886 |
The Company has analyzed the tax positions taken or expected to be taken in its tax returns and concluded it has no liability related to uncertain tax positions in accordance with accounting guidance related to income taxes.
The Company and its subsidiaries file federal income tax returns and state income tax returns. With few exceptions, the Company is no longer subject to federal or state income tax examinations by tax authorities for years before 2014.
F & M Bank Corp. and Subsidiaries
Notes to the Consolidated Financial Statements (dollars in thousands)
December 31, 2017 and 2016
NOTE 14
EMPLOYEE BENEFITS:
Defined Benefit Pension Plan
The Company has a qualified noncontributory defined benefit pension plan which covers substantially all of its employees hired before April 1, 2012. The benefits are primarily based on years of service and earnings. The Company uses December 31st as the measurement date for the defined benefit pension plan.
The following table provides a reconciliation of the changes in the benefit obligations and fair value of plan assets for 2017, 2016 and 2015:
2017 | 2016 | 2015 | |
| Change in Benefit Obligation | |||
| Benefit obligation, beginning | $12,475 | $10,944 | $10,777 |
| Service cost | 696 | 632 | 648 |
| Interest cost | 487 | 453 | 411 |
| Actuarial (gain) loss | 1,620 | 872 | (137) |
| Benefits paid | (175) | (426) | (754) |
| Benefit obligation, ending | $15,103 | $12,475 | $10,945 |
| Change in Plan Assets | |||
| Fair value of plan assets, beginning | $12,032 | $11,678 | $11,684 |
| Actual return on plan assets | 1,788 | 780 | (1) |
| Employer contribution | - | - | 750 |
| Benefits paid | (175) | (426) | (755) |
| Fair value of plan assets, ending | $13,645 | $12,032 | $11,678 |
| Funded status at the end of the year | $(1,458) | $(443) | $733 |
The fair value of plan assets is measured based on the fair value hierarchy as discussed in Note 20, “Fair Value Measurements” to the Consolidated Financial Statements. The valuations are based on third party data received as of the balance sheet date. All plan assets are considered Level 1 assets, as quoted prices exist in active markets for identical assets.
F & M Bank Corp. and Subsidiaries
Notes to the Consolidated Financial Statements (dollars in thousands)
December 31, 2017 and 2016
NOTE 14
EMPLOYEE BENEFITS (CONTINUED):
Defined Benefit Pension Plan, continued
2017 | 2016 | 2015 | |
| Amount recognized in the Consolidated Balance Sheet | |||
| Prepaid benefit cost | $3,760 | $4,361 | $4,799 |
| Unfunded pension benefit obligation under ASC 325-960 | (5,218) | (4,804) | (4,065) |
| Deferred taxes | 1,096 | 1,633 | 1,382 |
| Amount recognized in accumulated other | |||
| comprehensive income (loss) | |||
| Net loss | $(5,260) | $(4,861) | $(4,137) |
| Prior service cost | 42 | 57 | 72 |
| Amount recognized | (5,218) | (4,804) | (4,065) |
| Deferred taxes | 1,096 | 1,633 | 1,382 |
| Amount recognized in accumulated comprehensive income | $(4,122) | $(3,171) | $(2,683) |
| Prepaid benefit detail | |||
| Benefit obligation | $(15,103) | $(12,475) | $(10,945) |
| Fair value of assets | 13,645 | 12,032 | 11,678 |
| Unrecognized net actuarial loss | 5,260 | 4,861 | 4,138 |
| Unrecognized prior service cost | (42) | (57) | (72) |
| Prepaid (accrued) benefits | $3,760 | $4,361 | $4,799 |
| Components of net periodic benefit cost | |||
| Service cost | $696 | $632 | $648 |
| Interest cost | 487 | 452 | 411 |
| Expected return on plan assets | (851) | (854) | (839) |
| Amortization of prior service cost | (15) | (15) | (15) |
| Recognized net actuarial loss | 284 | 223 | 181 |
| Net periodic benefit cost | $601 | $438 | $386 |
| Other changes in plan assets and benefit obligations | |||
| recognized in other comprehensive income (loss) | |||
| Net loss | $399 | $724 | $522 |
| Amortization of prior service cost | 15 | 15 | 15 |
| Total recognized in other comprehensive income | $414 | $739 | $537 |
| Total recognized in net periodic benefit cost and other | |||
| comprehensive income (loss) | $1,015 | $1,177 | $923 |
| Additional disclosure information | |||
| Accumulated benefit obligation | $10,760 | $8,789 | $7,601 |
| Vested benefit obligation | $10,750 | $8,780 | $7,539 |
| Discount rate used for net pension cost | 4.00% | 4.25% | 4.00% |
| Discount rate used for disclosure | 3.50% | 4.00% | 4.25% |
| Expected return on plan assets | 7.25% | 7.50% | 7.50% |
| Rate of compensation increase | 3.00% | 3.00% | 3.00% |
| Average remaining service (years) | 12 | 13 | 13 |
F & M Bank Corp. and Subsidiaries
The Company has a qualified noncontributory defined benefit pension plan which covers substantially all of its employees hired before April 1, 2012. The benefits are primarily based on years of service and earnings. The Company uses December 31st as the measurement date for the defined benefit pension plan.
The following table provides a reconciliation of the changes in the benefit obligations and fair value of plan assets for 2017, 2016 and 2015:
2017 | 2016 | 2015 | |
| Change in Benefit Obligation | |||
| Benefit obligation, beginning | $12,475 | $10,944 | $10,777 |
| Service cost | 696 | 632 | 648 |
| Interest cost | 487 | 453 | 411 |
| Actuarial (gain) loss | 1,620 | 872 | (137) |
| Benefits paid | (175) | (426) | (754) |
| Benefit obligation, ending | $15,103 | $12,475 | $10,945 |
| Change in Plan Assets | |||
| Fair value of plan assets, beginning | $12,032 | $11,678 | $11,684 |
| Actual return on plan assets | 1,788 | 780 | (1) |
| Employer contribution | - | - | 750 |
| Benefits paid | (175) | (426) | (755) |
| Fair value of plan assets, ending | $13,645 | $12,032 | $11,678 |
| Funded status at the end of the year | $(1,458) | $(443) | $733 |
The fair value of plan assets is measured based on the fair value hierarchy as discussed in Note 20, “Fair Value Measurements” to the Consolidated Financial Statements
December 31, 2015 (in thousands) | Beginning Balance | Charge-offs | Recoveries | Provision | Ending Balance | Individually Evaluated for Impairment | Collectively Evaluated for Impairment | |||||||||||||||||||||
| Allowance for loan losses: | ||||||||||||||||||||||||||||
| Construction/Land Development | $ | 4,738 | $ | 156 | $ | 85 | $ | (225 | ) | $ | 4,442 | $ | 2,373 | $ | 2,069 | |||||||||||||
| Farmland | - | - | - | 95 | 95 | - | 95 | |||||||||||||||||||||
| Real Estate | 623 | 25 | 37 | 171 | 806 | 238 | 568 | |||||||||||||||||||||
| Multi-Family | - | - | - | 71 | 71 | - | 71 | |||||||||||||||||||||
| Commercial Real Estate | 126 | - | 65 | 254 | 445 | 18 | 427 | |||||||||||||||||||||
| Home Equity – closed end | 188 | 26 | 6 | 6 | 174 | - | 174 | |||||||||||||||||||||
| Home Equity – open end | 154 | 51 | - | 531 | 634 | 269 | 365 | |||||||||||||||||||||
| Commercial & Industrial – Non-Real Estate | 1,211 | - | 62 | (218 | ) | 1,055 | - | 1,055 | ||||||||||||||||||||
| Consumer | 214 | 32 | 32 | (106 | ) | 108 | - | 108 | ||||||||||||||||||||
| Dealer Finance | 1,336 | 251 | 24 | (273 | ) | 836 | 17 | �� | 819 | |||||||||||||||||||
| Credit Cards | 135 | 60 | 46 | (6 | ) | 115 | - | 115 | ||||||||||||||||||||
| Total | $ | 8,725 | $ | 601 | $ | 357 | $ | 300 | $ | 8,781 | $ | 2,915 | $ | 5,866 | ||||||||||||||
December 31, 2014 (in thousands) | Beginning Balance | Charge-offs | Recoveries | Provision | Ending Balance | Individually Evaluated for Impairment | Collectively Evaluated for Impairment | |||||||||||||||||||||
| Allowance for loan losses: | ||||||||||||||||||||||||||||
| Construction/Land Development | $ | 4,007 | $ | 1,611 | $ | 223 | $ | 2,119 | $ | 4,738 | $ | 1,469 | $ | 3,269 | ||||||||||||||
| Farmland | (2 | ) | - | - | 2 | - | - | - | ||||||||||||||||||||
| Real Estate | 400 | 208 | - | 431 | 623 | 101 | 522 | |||||||||||||||||||||
| Multi-Family | - | - | - | - | - | - | - | |||||||||||||||||||||
| Commercial Real Estate | 777 | - | 108 | (759 | ) | 126 | 47 | 79 | ||||||||||||||||||||
| Home Equity – closed end | 157 | - | - | 31 | 188 | - | 188 | |||||||||||||||||||||
| Home Equity – open end | 476 | 80 | - | (242 | ) | 154 | - | 154 | ||||||||||||||||||||
| Commercial & Industrial – Non-Real Estate | 1,464 | 385 | 356 | (224 | ) | 1,211 | - | 1,211 | ||||||||||||||||||||
| Consumer | 156 | 33 | 33 | 58 | 214 | - | 214 | |||||||||||||||||||||
| Dealer Finance | 628 | 107 | 6 | 809 | 1,336 | - | 1,336 | |||||||||||||||||||||
| Credit Cards | 121 | 46 | 35 | 25 | 135 | - | 135 | |||||||||||||||||||||
| Total | $ | 8,184 | $ | 2,470 | $ | 761 | $ | 2,250 | $ | 8,725 | $ | 1,617 | $ | 7,108 | ||||||||||||||
| December 31, 2015 | Loan Receivable | Individually Evaluated for Impairment | Collectively Evaluated for Impairment | |||||||||
| Construction/Land Development | $ | 69,759 | $ | 12,895 | $ | 56,864 | ||||||
| Farmland | 13,378 | - | 13,378 | |||||||||
| Real Estate | 166,587 | 1,421 | 165,167 | |||||||||
| Multi-Family | 7,559 | - | 7,559 | |||||||||
| Commercial Real Estate | 128,032 | 1,197 | 126,835 | |||||||||
| Home Equity – closed end | 9,135 | - | 9,135 | |||||||||
| Home Equity –open end | 56,599 | 2,573 | 54,026 | |||||||||
| Commercial & Industrial – Non-Real Estate | 27,954 | 181 | 27,773 | |||||||||
| Consumer | 8,219 | 18 | 8,201 | |||||||||
| Dealer Finance | 54,086 | 72 | 54,013 | |||||||||
| Credit Cards | 2,745 | - | 2,745 | |||||||||
| $ | 544,053 | $ | 18,357 | $ | 525,696 | |||||||
| Total | ||||||||||||
| December 31, 2014 | Loan Receivable | Individually Evaluated for Impairment | Collectively Evaluated for Impairment | |||||||||
| Construction/Land Development | $ | 67,181 | $ | 17,958 | $ | 49,223 | ||||||
| Farmland | 12,507 | - | 12,507 | |||||||||
| Real Estate | 162,249 | 1,067 | 161,182 | |||||||||
| Multi-Family | 11,775 | - | 11,775 | |||||||||
| Commercial Real Estate | 122,305 | 2,097 | 120,208 | |||||||||
| Home Equity – closed end | 9,394 | - | 9,394 | |||||||||
| Home Equity –open end | 52,182 | 1,649 | 50,533 | |||||||||
| Commercial & Industrial – Non-Real Estate | 28,161 | 191 | 27,970 | |||||||||
| Consumer | 9,110 | - | 9,110 | |||||||||
| Dealer Finance | 40,633 | 40,633 | ||||||||||
| Credit Cards | 2,705 | - | 2,705 | |||||||||
| $ | 518,202 | $ | 22,962 | $ | 495,240 | |||||||
| Total | ||||||||||||
| 30-59 Days Past due | 60-89 Days Past Due | Greater than 90 Days (excluding non-accrual) | Non-Accrual Loans | Total Past Due | Current | Total Loan Receivable | ||||||||||||||||||||||
| December 31, 2015 | ||||||||||||||||||||||||||||
| Construction/Land Development | $ | 104 | $ | - | $ | - | $ | 4,688 | $ | 4,792 | $ | 64,967 | $ | 69,759 | ||||||||||||||
| Farmland | - | - | - | - | - | 13,378 | 13,378 | |||||||||||||||||||||
| Real Estate | 2,684 | 1,332 | 272 | 1,010 | 5,298 | 161,289 | 166,587 | |||||||||||||||||||||
| Multi-Family | - | - | - | - | - | 7,559 | 7,559 | |||||||||||||||||||||
| Commercial Real Estate | 340 | 241 | - | - | 581 | 127,451 | 128,032 | |||||||||||||||||||||
| Home Equity – closed end | 41 | 7 | - | - | 48 | 9,087 | 9,135 | |||||||||||||||||||||
| Home Equity – open end | 918 | 46 | 107 | 40 | 1,111 | 55,488 | 56,599 | |||||||||||||||||||||
| Commercial & Industrial – Non- Real Estate | 114 | 3 | 25 | 109 | 251 | 27,703 | 27,954 | |||||||||||||||||||||
| Consumer | 120 | 10 | - | - | 130 | 8,089 | 8,219 | |||||||||||||||||||||
| Dealer Finance | 905 | 183 | 152 | 108 | 1,348 | 52,738 | 54,086 | |||||||||||||||||||||
| Credit Cards | 10 | 13 | 15 | - | 38 | 2,707 | 2,745 | |||||||||||||||||||||
| Total | $ | 5,236 | $ | 1,835 | $ | 571 | $ | 5,955 | $ | 13,597 | $ | 530,456 | $ | 544,053 | ||||||||||||||
| 30-59 Days Past due | 60-89 Days Past Due | Greater than 90 Days (excluding non-accrual) | Non-Accrual Loans | Total Past Due | Current | Total Loan Receivable | ||||||||||||||||||||||
| December 31, 2014 | ||||||||||||||||||||||||||||
| Construction/Land Development | $ | 205 | $ | 166 | $ | - | $ | 4,508 | $ | 4,879 | $ | 62,302 | $ | 67,181 | ||||||||||||||
| Farmland | - | - | - | - | - | 12,507 | 12,507 | |||||||||||||||||||||
| Real Estate | 5,085 | 635 | - | 973 | 6,693 | 155,556 | 162,249 | |||||||||||||||||||||
| Multi-Family | - | - | - | - | - | 11,775 | 11,775 | |||||||||||||||||||||
| Commercial Real Estate | 747 | - | - | 1,165 | 1,912 | 120,393 | 122,305 | |||||||||||||||||||||
| Home Equity – closed end | 162 | 15 | - | 10 | 187 | 9,207 | 9,394 | |||||||||||||||||||||
| Home Equity – open end | 730 | 25 | - | 143 | 898 | 51,284 | 52,182 | |||||||||||||||||||||
| Commercial & Industrial – Non- Real Estate | - | - | - | 14 | 14 | 28,147 | 28,161 | |||||||||||||||||||||
| Consumer | 290 | 9 | - | - | 299 | 8,811 | 9,110 | |||||||||||||||||||||
| Dealer Finance | 696 | 189 | - | 161 | 1,046 | 39,587 | 40,633 | |||||||||||||||||||||
| Credit Cards | 36 | - | 1 | - | 37 | 2,668 | 2,705 | |||||||||||||||||||||
| Total | $ | 7,951 | $ | 1,039 | $ | 1 | $ | 6,974 | $ | 15,965 | $ | 502,237 | $ | 518,202 | ||||||||||||||
| CREDIT QUALITY INDICATORS (in thousands) | ||||||||||||||||||||||||||||||||||||
| AS OF DECEMBER 31, 2015 | ||||||||||||||||||||||||||||||||||||
| Corporate Credit Exposure | ||||||||||||||||||||||||||||||||||||
Credit Risk Profile by Creditworthiness Category | ||||||||||||||||||||||||||||||||||||
| Grade 1 Minimal Risk | Grade 2 Modest Risk | Grade 3 Average Risk | Grade 4 Acceptable Risk | Grade 5 Marginally Acceptable | Grade 6 Watch | Grade 7 Substandard | Grade 8 Doubtful | Total | ||||||||||||||||||||||||||||
| Construction/Land Development | $ | - | $ | 485 | $ | 8,410 | $ | 31,783 | $ | 14,260 | $ | 3,216 | $ | 11,605 | $ | - | $ | 69,759 | ||||||||||||||||||
| Farmland | 66 | - | 2,615 | 3,768 | 4,952 | 1,977 | - | - | 13,378 | |||||||||||||||||||||||||||
| Real Estate | - | 955 | 54,400 | 76,545 | 23,695 | 8,334 | 2,658 | - | 166,587 | |||||||||||||||||||||||||||
| Multi-Family | - | 391 | 3,925 | 3,046 | 197 | - | - | - | 7,559 | |||||||||||||||||||||||||||
| Commercial Real Estate | - | 2,087 | 25,889 | 74,337 | 20,271 | 4,149 | 1,299 | - | 128,032 | |||||||||||||||||||||||||||
| Home Equity – closed end | - | - | 3,549 | 3,792 | 1,661 | 114 | 19 | - | 9,135 | |||||||||||||||||||||||||||
| Home Equity – open end | - | 1,657 | 15,043 | 31,455 | 4,827 | 398 | 3,219 | - | 56,599 | |||||||||||||||||||||||||||
| Commercial & Industrial (Non-Real Estate) | 896 | 646 | 6,423 | 17,053 | 2,281 | 517 | 138 | - | 27,954 | |||||||||||||||||||||||||||
| Total | $ | 962 | $ | 6,221 | $ | 120,254 | $ | 241,779 | $ | 72,144 | $ | 18,705 | $ | 18,938 | $ | - | $ | 479,003 | ||||||||||||||||||
| Consumer Credit Exposure | ||||||||
| Credit Risk Profile Based on Payment Activity | ||||||||
| Credit Cards | Consumer | |||||||
| Performing | $ | 2,730 | $ | 62,046 | ||||
| Non performing | 15 | 259 | ||||||
| Total | $ | 2,745 | $ | 62,305 | ||||
| CREDIT QUALITY INDICATORS (in thousands) | ||||||||||||||||||||||||||||||||||||
| AS OF DECEMBER 31, 2014 | ||||||||||||||||||||||||||||||||||||
| Corporate Credit Exposure | ||||||||||||||||||||||||||||||||||||
Credit Risk Profile by Creditworthiness Category | ||||||||||||||||||||||||||||||||||||
| Grade 1 Minimal Risk | Grade 2 Modest Risk | Grade 3 Average Risk | Grade 4 Acceptable Risk | Grade 5 Marginally Acceptable | Grade 6 Watch | Grade 7 Substandard | Grade 8 Doubtful | Total | ||||||||||||||||||||||||||||
| Construction/Land Development | $ | - | $ | 165 | $ | 8,460 | $ | 24,227 | $ | 9,605 | $ | 3,815 | $ | 20,909 | $ | - | $ | 67,181 | ||||||||||||||||||
| Farmland | 68 | - | 1,640 | 3,451 | 5,228 | - | 2,120 | - | 12,507 | |||||||||||||||||||||||||||
| Real Estate | - | 629 | 60,290 | 66,464 | 23,934 | 7,083 | 3,849 | - | 162,249 | |||||||||||||||||||||||||||
| Multi-Family | - | 468 | 4,145 | 2,183 | 4,979 | - | - | - | 11,775 | |||||||||||||||||||||||||||
| Commercial Real Estate | - | 1,687 | 22,800 | 65,653 | 19,058 | 10,571 | 2,536 | - | 122,305 | |||||||||||||||||||||||||||
| Home Equity – closed end | - | - | 4,327 | 3,090 | 1,812 | 154 | 11 | - | 9,394 | |||||||||||||||||||||||||||
| Home Equity – open end | - | 1,555 | 13,433 | 28,425 | 4,309 | 1,936 | 2,524 | - | 52,182 | |||||||||||||||||||||||||||
| Commercial & Industrial (Non-Real Estate) | 643 | 74 | 4,692 | 18,039 | 3,948 | 735 | 30 | - | 28,161 | |||||||||||||||||||||||||||
| Total | $ | 711 | $ | 4,578 | $ | 119,787 | $ | 211,532 | $ | 72,873 | $ | 24,294 | $ | 31,979 | $ | - | $ | 465.754 | ||||||||||||||||||
| Consumer Credit Exposure | ||||||||
| Credit Risk Profile Based on Payment Activity | ||||||||
| Credit Cards | Consumer | |||||||
| Performing | $ | 2,704 | $ | 49,582 | ||||
| Non performing | 1 | 161 | ||||||
| Total | $ | 2,705 | $ | 49,743 | ||||
F & M Bank Corp. and Subsidiaries
Notes to the Consolidated Financial Statements (dollars in thousands)
December 31, 20152017 and 2014
| December 31, 2015 | ||||||||||||
| Pre-Modification | Post-Modification | |||||||||||
| (in thousands) | Outstanding | Outstanding | ||||||||||
| Troubled Debt Restructurings | Number of Contracts | Recorded Investment | Recorded Investment | |||||||||
| Commercial | 1 | $ | 974 | $ | 974 | |||||||
| Real Estate | 5 | 1,408 | 1,408 | |||||||||
| Home Equity | 4 | 1,414 | 1,414 | |||||||||
| Consumer | 6 | 73 | 73 | |||||||||
| Total | 16 | $ | 3,869 | $ | 3,869 | |||||||
NOTE 14
EMPLOYEE BENEFITS (CONTINUED):
Defined Benefit Pension Plan, continued
2017 | 2016 | 2015 | |
| Amount recognized in the Consolidated Balance Sheet | |||
| Prepaid benefit cost | $3,760 | $4,361 | $4,799 |
| Unfunded pension benefit obligation under ASC 325-960 | (5,218) | (4,804) | (4,065) |
| Deferred taxes | 1,096 | 1,633 | 1,382 |
| Amount recognized in accumulated other | |||
| comprehensive income (loss) | |||
| Net loss | $(5,260) | $(4,861) | $(4,137) |
| Prior service cost | 42 | 57 | 72 |
| Amount recognized | (5,218) | (4,804) | (4,065) |
| Deferred taxes | 1,096 | 1,633 | 1,382 |
| Amount recognized in accumulated comprehensive income | $(4,122) | $(3,171) | $(2,683) |
| Prepaid benefit detail | |||
| Benefit obligation | $(15,103) | $(12,475) | $(10,945) |
| Fair value of assets | 13,645 | 12,032 | 11,678 |
| Unrecognized net actuarial loss | 5,260 | 4,861 | 4,138 |
| Unrecognized prior service cost | (42) | (57) | (72) |
| Prepaid (accrued) benefits | $3,760 | $4,361 | $4,799 |
| Components of net periodic benefit cost | |||
| Service cost | $696 | $632 | $648 |
| Interest cost | 487 | 452 | 411 |
| Expected return on plan assets | (851) | (854) | (839) |
| Amortization of prior service cost | (15) | (15) | (15) |
| Recognized net actuarial loss | 284 | 223 | 181 |
| Net periodic benefit cost | $601 | $438 | $386 |
| Other changes in plan assets and benefit obligations | |||
| recognized in other comprehensive income (loss) | |||
| Net loss | $399 | $724 | $522 |
| Amortization of prior service cost | 15 | 15 | 15 |
| Total recognized in other comprehensive income | $414 | $739 | $537 |
| Total recognized in net periodic benefit cost and other | |||
| comprehensive income (loss) | $1,015 | $1,177 | $923 |
| Additional disclosure information | |||
| Accumulated benefit obligation | $10,760 | $8,789 | $7,601 |
| Vested benefit obligation | $10,750 | $8,780 | $7,539 |
| Discount rate used for net pension cost | 4.00% | 4.25% | 4.00% |
| Discount rate used for disclosure | 3.50% | 4.00% | 4.25% |
| Expected return on plan assets | 7.25% | 7.50% | 7.50% |
| Rate of compensation increase | 3.00% | 3.00% | 3.00% |
| Average remaining service (years) | 12 | 13 | 13 |
F & M Bank Corp. and Subsidiaries
| December 31, 2014 | ||||||||||||
| Pre-Modification | Post-Modification | |||||||||||
| (in thousands) | Outstanding | Outstanding | ||||||||||
| Number of Contracts | Recorded Investment | Recorded Investment | ||||||||||
| Troubled Debt Restructurings | ||||||||||||
| Real Estate | 2 | $ | 179 | $ | 179 | |||||||
| Consumer | 1 | 22 | 22 | |||||||||
| 3 | $ | 201 | $ | 201 | ||||||||
| 2015 | 2014 | |||||||
| Land | $ | 1,868,709 | $ | 1,418,003 | ||||
| Buildings and improvements | 7,209,427 | 6,793,644 | ||||||
| Furniture and equipment | 7,397,173 | 6,479,815 | ||||||
| 16,475,309 | 14,691,462 | |||||||
| Less - accumulated depreciation | (8,933,231 | ) | (8,233,208 | ) | ||||
| Net | $ | 7,542,078 | $ | 6,458,254 | ||||
| Other Real Estate Owned | ||||||||
| 2015 | 2014 | |||||||
| Balance as of January 1 | $ | 3,507,153 | $ | 2,628,418 | ||||
| Property acquired at foreclosure | 125,000 | 2,914,958 | ||||||
| Capital improvements on foreclosed property | 98,929 | 48,961 | ||||||
| Sale of other real estate owned financed by Bank | (328,129 | ) | (780,097 | ) | ||||
| Sales of foreclosed properties | (737,663 | ) | (1,029,452 | ) | ||||
| Write down of OREO | (537,605 | ) | (275,635 | ) | ||||
| Balance as of December 31 | $ | 2,127,685 | $ | 3,507,153 | ||||
| December 31, | ||||||||
| 2015 | 2014 | |||||||
| Noninterest bearing demand deposits | $ | 134,786,875 | $ | 112,197,722 | ||||
| Savings and interest bearing demand deposits: | ||||||||
| Interest checking accounts | 108,459,597 | 119,593,529 | ||||||
| Savings accounts | 90,383,486 | 64,249,199 | ||||||
| Time Deposits: | ||||||||
| Balances of less than $100,000 | 107,415,244 | 115,651,329 | ||||||
| Balances of $100,000 and more | 53,624,554 | 79,812,757 | ||||||
| Total Deposits | $ | 494,669,756 | $ | 491,504,536 | ||||
| 2016 | $ | 68,800,143 | ||
| 2017 | 38,529,664 | |||
| 2018 | 27,310,066 | |||
| 2019 | 12,595,076 | |||
| 2020 and after | 13,804,849 | |||
| Total | $ | 161,039,798 |
| Maximum | Weighted | |||||||||||||||||||
| Outstanding | Outstanding | Average | Average | Year End | ||||||||||||||||
| at any | at | Balance | Interest | Interest | ||||||||||||||||
| Month End | Year End | Outstanding | Rate | Rate | ||||||||||||||||
| 2015 | ||||||||||||||||||||
| Federal funds purchased | $ | 8,843,000 | $ | 959,217 | $ | 833,907 | .02 | % | .78 | % | ||||||||||
| FHLB short term | 45,000 ,000 | 20,000,000 | 26,739,726 | .16 | % | .19 | % | |||||||||||||
| Securities sold under agreements to repurchase | 4,697,341 | 3,994,834 | 4,443,753 | .04 | % | .25 | % | |||||||||||||
| Totals | $ | 24,954,051 | $ | 32,017,386 | .21 | % | .22 | % | ||||||||||||
| 2014 | ||||||||||||||||||||
| Federal funds purchased | $ | 491,000 | $ | - | $ | 7,704 | .001 | % | .61 | % | ||||||||||
| FHLB short term | 10,000 ,000 | 10,000,000 | 27,397 | .001 | % | .17 | % | |||||||||||||
| Securities sold under agreements to repurchase | 5,066,238 | 4,358,492 | 3,837,612 | .23 | % | .24 | % | |||||||||||||
| Totals | $ | 14,358,492 | $ | 3,872,713 | .23 | % | .23 | % | ||||||||||||
| 2016 | $ | 3,929,000 | ||
| 2017 | 3,929,000 | |||
| 2018 | 8,929,000 | |||
| 2019 | 6,429,000 | |||
| 2020 | 13,929,000 | |||
| Thereafter | 11,016,000 | |||
| Total | $ | 48,161,000 |
| 2015 | 2014 | 2013 | ||||||||||
| Current expense | ||||||||||||
| Federal | $ | 3,227,013 | $ | 1,777,598 | $ | 482,912 | ||||||
| Deferred (benefit) expense | ||||||||||||
| Federal | (340,941 | ) | 505,684 | 636,452 | ||||||||
| State | - | 9,854 | (67,594 | ) | ||||||||
| Total Deferred (benefit) expense | (340,941 | ) | 515,538 | 568,858 | ||||||||
| Total Income Tax Expense | $ | 2,886,072 | $ | 2,293,136 | $ | 1,051,770 | ||||||
| Deferred Tax Assets: | 2015 | 2014 | ||||||
| Allowance for loan losses | $ | 2,564,214 | $ | 2,201,291 | ||||
| Split Dollar Life Insurance | 4,440 | 4,440 | ||||||
| Nonqualified deferred compensation | 702,440 | 594,132 | ||||||
| Low income housing partnerships losses | 210,107 | 308,539 | ||||||
| Core deposit amortization | 176,605 | 72,188 | ||||||
| Other real estate owned | 269,610 | 3,746 | ||||||
| Pension plan | 1,382,268 | 1,199,686 | ||||||
| Total Assets | $ | 5,309,684 | $ | 4,384,022 | ||||
| Deferred Tax Liabilities: | 2015 | 2014 | ||||||
| Unearned low income housing credits | $ | 418,416 | $ | 523,769 | ||||
| Depreciation | 359,406 | 320,743 | ||||||
| Pension | 1,988,736 | 1,864,964 | ||||||
| Goodwill tax amortization | 901,340 | 853,880 | ||||||
| Securities available for sale | 1,757 | 1,272 | ||||||
| Total Liabilities | 3,669,655 | 3,564,628 | ||||||
| Net Deferred Tax Asset (included in Other Assets on Balance Sheet) | $ | 1,640,029 | $ | 819,394 | ||||
| 2015 | 2014 | 2013 | ||||||||||
| Tax expense at federal statutory rates | $ | 3,843,048 | $ | 2,959,056 | $ | 2,251,851 | ||||||
| Increases (decreases) in taxes resulting from: | ||||||||||||
| State income taxes, net of federal benefit | 8,087 | 8,659 | 9,229 | |||||||||
| Partially tax-exempt income | (46,348 | ) | (54,529 | ) | (44,676 | ) | ||||||
| Tax-exempt income | (222,672 | ) | (190,192 | ) | (197,482 | ) | ||||||
| Prior year LIH credits | (132,028 | ) | (21,787 | ) | (61,768 | ) | ||||||
| LIH and historic credits | (568,854 | ) | (484,955 | ) | (611,795 | ) | ||||||
| Deferred Tax Asset Valuation Allowance - reversal | - | 396,440 | - | |||||||||
| Other | 4,840 | (112,714 | ) | (2,710 | ) | |||||||
| Total Income Tax Expense | $ | 2,886,072 | $ | 2,293,136 | $ | 1,051,770 | ||||||
Defined Benefit Pension Plan
The BankCompany has a qualified noncontributory defined benefit pension plan which covers substantially all of its employees hired before April 1, 2012. The benefits are primarily based on years of service and earnings. The Company uses December 31st as the measurement date for the defined benefit pension plan.
The following table provides a reconciliation of the changes in the benefit obligations and fair value of plan assets for 2015, 20142017, 2016 and 2013:2015:
| 2015 | 2014 | 2013 | 2017 | 2016 | 2015 | ||||||||||
| Change in Benefit Obligation | |||||||||||||||
| Benefit obligation, beginning | $ | 10,777,415 | $ | 7,933,568 | $ | 8,931,940 | $12,475 | $10,944 | $10,777 | ||||||
| Service cost | 648,334 | 501,032 | 599,933 | 696 | 632 | 648 | |||||||||
| Interest cost | 410,944 | 377,706 | 350,314 | 487 | 453 | 411 | |||||||||
| Actuarial gain (loss) | (137,048 | ) | 2,030,583 | (1,300,094 | ) | ||||||||||
| Actuarial (gain) loss | 1,620 | 872 | (137) | ||||||||||||
| Benefits paid | (754,987 | ) | (65,474 | ) | (648,525 | ) | (175) | (426) | (754) | ||||||
| Benefit obligation, ending | $ | 10,944,658 | $ | 10,777,415 | $ | 7,933,568 | $15,103 | $12,475 | $10,945 | ||||||
| Change in Plan Assets | |||||||||||||||
| Fair value of plan assets, beginning | $ | 11,683,845 | $ | 9,687,226 | $ | 8,123,437 | $12,032 | $11,678 | $11,684 | ||||||
| Actual return on plan assets | (640 | ) | 562,093 | 1,462,314 | 1,788 | 780 | (1) | ||||||||
| Employer contribution | 750,000 | 1,500,000 | 750,000 | - | 750 | ||||||||||
| Benefits paid | (754,987 | ) | (65,474 | ) | (648,525 | ) | (175) | (426) | (755) | ||||||
| Fair value of plan assets, ending | 11,678,218 | 11,683,845 | 9,687,226 | $13,645 | $12,032 | $11,678 | |||||||||
| Funded status at the end of the year | $ | 733,560 | $ | 906,430 | $ | 1,753,658 | $(1,458) | $(443) | $733 | ||||||
The fair value of plan assets is measured based on the fair value hierarchy as discussed in Note 21,20, “Fair Value Measurements” to the Consolidated Financial Statements. The valuations are based on third party data received as of the balance sheet date. All plan assets are considered Level 1 assets, as quoted prices exist in active markets for identical assets.
F & M Bank Corp. and Subsidiaries
Notes to the Consolidated Financial Statements (dollars in thousands)
December 31, 20152017 and 20142016
NOTE 14
EMPLOYEE BENEFITS (CONTINUED):
Defined Benefit Pension Plan, continued
| 2015 | 2014 | 2013 | 2017 | 2016 | 2015 | ||||||||||
| Amount recognized in the Balance Sheet | |||||||||||||||
| Accrued prepaid benefit cost | $ | 4,799,051 | $ | 4,434,917 | $ | 3,136,277 | |||||||||
| Amount recognized in the Consolidated Balance Sheet | |||||||||||||||
| Prepaid benefit cost | $3,760 | $4,361 | $4,799 | ||||||||||||
| Unfunded pension benefit obligation under ASC 325-960 | (4,065,491 | ) | (3,528,487 | ) | (1,382,619 | ) | (5,218) | (4,804) | (4,065) | ||||||
| Deferred taxes | 1,096 | 1,633 | 1,382 | ||||||||||||
| Amount recognized in accumulated other | |||||||||||||||
| comprehensive income | |||||||||||||||
| Net Gain/(Loss) | $ | (4,137,855 | ) | $ | (3,616,087 | ) | $ | (1,485,455 | ) | ||||||
| comprehensive income (loss) | |||||||||||||||
| Net loss | $(5,260) | $(4,861) | $(4,137) | ||||||||||||
| Prior service cost | 72,364 | 87,600 | 102,836 | 42 | 57 | 72 | |||||||||
| Amount recognized | (4,065,491 | ) | (3,528,487 | ) | (1,382,619 | ) | (5,218) | (4,804) | (4,065) | ||||||
| Deferred Taxes | 1,382,267 | 1,199,686 | 470,090 | ||||||||||||
| Amount recognized in accumulated | |||||||||||||||
| comprehensive income | $ | (2,683,224 | ) | $ | (2,328,801 | ) | $ | (912,529 | ) | ||||||
| Deferred taxes | 1,096 | 1,633 | 1,382 | ||||||||||||
| Amount recognized in accumulated comprehensive income | $(4,122) | $(3,171) | $(2,683) | ||||||||||||
| (Accrued) Prepaid benefit detail | |||||||||||||||
| Prepaid benefit detail | |||||||||||||||
| Benefit obligation | $ | (10,944,658 | ) | $ | (10,777,415 | ) | $ | (7,933,568 | ) | $(15,103) | $(12,475) | $(10,945) | |||
| Fair value of assets | 11,678,218 | 11,683,845 | 9,687,226 | 13,645 | 12,032 | 11,678 | |||||||||
| Unrecognized net actuarial loss | 4,137,855 | 3,616,087 | 1,485,455 | 5,260 | 4,861 | 4,138 | |||||||||
| Unrecognized prior service cost | (72,364 | ) | (87,600 | ) | (102,836 | ) | (42) | (57) | (72) | ||||||
| Prepaid (accrued) benefits | $ | 4,799,051 | $ | 4,434,917 | $ | 3,136,277 | $3,760 | $4,361 | $4,799 | ||||||
| Components of net periodic benefit cost | |||||||||||||||
| Service cost | $ | 648,334 | $ | 501,032 | $ | 599,933 | $696 | $632 | $648 | ||||||
| Interest cost | 410,944 | 377,706 | 350,314 | 487 | 452 | 411 | |||||||||
| Expected return on plan assets | (838,818 | ) | (698,252 | ) | (636,081 | ) | (851) | (854) | (839) | ||||||
| Amortization of prior service cost | (15,236 | ) | (15,236 | ) | (15,236 | ) | (15) | ||||||||
| Recognized net actuarial (gain) loss | 180,642 | 36,110 | 203,183 | ||||||||||||
| Recognized net actuarial loss | 284 | 223 | 181 | ||||||||||||
| Net periodic benefit cost | $ | 385,866 | $ | 201,360 | $ | 502,113 | $601 | $438 | $386 | ||||||
| Other changes in plan assets and benefit obligations | |||||||||||||||
| recognized in other comprehensive income (loss) | |||||||||||||||
| Net loss | $399 | $724 | $522 | ||||||||||||
| Amortization of prior service cost | 15 | ||||||||||||||
| Total recognized in other comprehensive income | $414 | $739 | $537 | ||||||||||||
| Total recognized in net periodic benefit cost and other | |||||||||||||||
| comprehensive income (loss) | $1,015 | $1,177 | $923 | ||||||||||||
| Additional disclosure information | |||||||||||||||
| Accumulated benefit obligation | $ | 7,601,249 | $ | 7,543,340 | $ | 5,474,048 | $10,760 | $8,789 | $7,601 | ||||||
| Vested benefit obligation | $ | 7,539,365 | $ | 7,408,014 | $ | 5,388,808 | $10,750 | $8,780 | $7,539 | ||||||
| Discount rate used for net pension cost | 4.00 | % | 5.00 | % | 4.00 | % | 4.00% | 4.25% | 4.00% | ||||||
| Discount rate used for disclosure | 4.25 | % | 4.00 | % | 5.00 | % | 3.50% | 4.00% | 4.25% | ||||||
| Expected return on plan assets | 7.50 | % | 7.50 | % | 8.00 | % | 7.25% | 7.50% | |||||||
| Rate of compensation increase | 3.00 | % | 3.00 | % | 3.00 | % | 3.00% | ||||||||
| Average remaining service (years) | 13 | 14 | 14 | 12 | 13 | ||||||||||
F & M Bank Corp. and Subsidiaries
Notes to the Consolidated Financial Statements
December 31, 20152017 and 20142016
NOTE 14
EMPLOYEE BENEFITS (CONTINUED):
Funding Policy
Due to the current funding status of the plan, the Company did not make a contribution in 2017 or 2016. The Company’s contributions for 2015 was $750,000. The net periodic pension cost of the plan for 2018 will be approximately $629.
Long-Term Rate of Return
The Company, as plan sponsor, selects the expected long-term rate of return on assets assumption in consultation with theirinvestment advisors and the plan actuary, and with concurrence from their auditor.actuary. This rate is intended to reflect the average rate of earnings expected to be earned on the funds invested or to be invested to provide plan benefits. Historical performance is reviewed, especially with respect to real rates of return (net of inflation) for the major asset classes held or anticipated to be held by the trust. Undue weight is not given to recent experience, which may not continue over the measurement period, with higher significance placed on current forecasts of future long-term economic conditions.
Because assets are held in a qualified trust, anticipated returns are not reduced for taxes. Further, –and solely for this purpose, the plan is assumed to continue in force and not terminate during the period during which the assets are invested. However, consideration is given to the potential impact of current and future investment policy, cash flow into and out of the trust, and expenses (both investment and non-investment) typically paid from plan assets (to the extent such expenses are not explicitly estimated within periodic cost).
Asset Allocation
The trust fund is sufficiently diversified to maintain a reasonable level of risk without imprudently sacrificing return, with a targeted asset allocation of 40%39% fixed income and 60%61% equity. The Investment Manager selects investment fund managers with demonstrated experience and expertise, and funds with demonstrated historical performance, for the implementation of the Plan’s investment strategy. The Investment Manager will consider both actively and passively managed investment strategies and will allocate funds across the asset classes to develop an efficient investment structure. The pension plan’s allocations as of December 31, 20152017, and 20142016 were 60%61% equity and 40%39% fixed and 61% equity and 39% fixed, respectively.
Estimated Future Benefit Payments, which reflect expected future service, as appropriate, as of December 31, 2017, are as follows:
| 2016 | $ | 582,606 | |||
| 2017 | 48,333 | ||||
| 2018 | 1,249,321 | $1,862 | |||
| 2019 | 662,704 | 698 | |||
| 2020 | 543,814 | 264 | |||
| 2021-2025 | 4,568,645 | ||||
| 2021 | 179 | ||||
| 2022 | 2,867 | ||||
| 2023-2027 | 7,151 | ||||
| $ | 7,655,423 | $13,021 | |||
Employee Stock Ownership Plan (ESOP)
The Company sponsors an ESOP which provides stock ownership to substantially all employees of the Bank.Company. The Plan provides total vesting upon the attainment of five years of service. Contributions to the plan are made at the discretion of the Board of Directors and are allocated based on the compensation of each employee relative to total compensation paid by the Bank.Company. All shares issued and held by the Plan are considered outstanding in the computation of earnings per share. Dividends on Company stock are allocated and paid to participants at least annually. Shares of Company stock, when distributed, have restrictions on transferability. TheFor the plan year ending September 30, 2017 the Company contributed $420,000$430 in 2015, $360,0002017, $407 in 2014,2016, and $360,000$270 in 20132015 to the Plan and charged this expense to operations. The shares held by the ESOP totaled 188,596194,018 and 188,396190,271 at December 31, 20152017 and 2014,2016, respectively.
F & M Bank Corp. and Subsidiaries
Notes to the Consolidated Financial Statements (dollars in thousands)
December 31, 20152016 and 20142015
NOTE 14
EMPLOYEE BENEFITS (CONTINUED):
401(K) Plan
The Company sponsors a 401(k) savings plan under which eligible employees may choose to save up to 20 percent of their salary on a pretax basis, subject to certain IRS limits. Under the Federal Safe Harbor rules employees are automatically enrolled at 3% (in the third year this increases by 1% per year up to 6%) of their salary unless elected otherwise. The Company matches aone hundred percent of the first 1% contributed by the employee and fifty percent from 2% to 6% of employee contributions. Vesting in the contributions made by the Company is 100% after two years of service. Contributions under the plan amounted to $211,987, $190,057$263, $242 and $183,468$212 in 2015, 20142017, 2016 and 2013,2015, respectively.
Deferred Compensation Plan
The Company has a nonqualified deferred compensation plan for several of its key employees and directors. The Company may make annual contributions to the plan, and the employee or director has the option to defer a portion of their salary or bonus based on qualifying annual elections. Contributions to the plan totaled $110,000$125 in 2015, $100,0002017, $125 in 20142016 and $90,000$110 in 2013.2015. A liability is accrued for the obligation under the plan and totaled $3,377 and $2,767 at December 31, 2017 and 2016, respectively.
Investments in Life Insurance Contracts
The Bank currently offers a variety of benefit plans to all full-time employees. While the costs of these plans are generally tax deductible to the Bank, the cost has been escalating greatly in recent years. To help offset escalating benefit costs and to attract and retain qualified employees, the Bank purchased Bank Owned Life Insurance (BOLI) contracts that will provide benefits to employees during their lifetime. Dividends received on these policies are tax-deferred and the death benefits under the policies are tax exempt. Rates of return on a tax-equivalent basis are very favorable when compared to other long-term investments which the Bank might make. The accrued liability related to the BOLI contracts was $443 and $412 for December 31, 2017 and 2016, respectively.
NOTE 15
CONCENTRATIONS OF CREDIT:
The Company had cash deposits in other commercial banks in excess of FDIC insurance limits totaling $2,156,006$1,798 and $1,731,223$680 at December 31, 20152017 and 2014,2016, respectively.
The Company grants commercial, residential real estate and consumer loans to customers located primarily in the northwestern portion of the State of Virginia. LoanThere were no loan concentration areas greater than 25% of capital include land development.capital. Collateral required by the Company is determined on an individual basis depending on the purpose of the loan and the financial condition of the borrower. Approximately 83%As of December 31, 2017, approximately 80% of the loan portfolio iswas secured by real estate.
NOTE 16
COMMITMENTS:
The Company makes commitments to extend credit in the normal course of business and issues standby letters of credit to meet the financing needs of its customers. The amount of the commitments represents the Company's exposure to credit loss that is not included in the consolidated balance sheet. As of the balance sheet dates,December 31, 2017 and 2016, the Company had the following commitments outstanding:
| 2015 | 2014 | 2017 | 2016 | |||||||
| Commitments to loan money | $ | 135,138,834 | $ | 120,922,771 | ||||||
| Commitments to extend credit | $170,798 | $148,060 | ||||||||
| Standby letters of credit | 1,344,191 | 2,077,870 | 1,533 | 1,089 | ||||||
The Company uses the same credit policies in making commitments to lend moneyextend credit and issue standby letters of credit as it does for the loans reflected in the consolidated balance sheet.
F & M Bank Corp. and Subsidiaries
Notes to the Consolidated Financial Statements (dollars in thousands)
December 31, 2017 and 2016
NOTE 16
COMMITMENTS (CONTINUED):
Commitments to extend credit are agreements to lend to a customer as long as there is no violation of any condition established in the contract. Commitments generally have fixed expiration dates or other termination clauses and may require payment of a fee. Since many of the commitments are expected to expire without being drawn upon, the total commitment amounts do not necessarily represent future cash requirements. The Company evaluates each customer's creditworthiness on a case-by-case basis. Collateral required, if any, upon extension of credit is based on management's credit evaluation of the borrower’s ability to pay. Collateral held varies but may include accounts receivable, inventory, property, plant and equipment.
The Bank leases four of its branch offices and both of its loan production officesoffice under long term lease arrangements which had initial terms of either three, five or ten years. VBS leased its building until December of 2017 and therefore recorded lease expense in 2017, 2016 and 2015. VST leases three of its offices, the lease expense is included in the following disclosure as well as future lease payments. The North Augusta Branch and the Dealer Finance division office are leases with related parties. The Company considers these lease agreements to be arm's length transactions.
Lease expense was $164,294, $120,728$355, $291 and $121,025$281 for 2015, 20142017, 2016 and 2013,2015, respectively. As of December 31, 2015,2017, the required lease payments for the next five years arewere as follows:
| 2016 | $ | 160,882 | |||
| 2017 | 116,899 | ||||
| 2018 | 73,226 | $177 | |||
| 2019 | 74,349 | 150 | |||
| 2020 | 75,500 | 128 | |||
| 2021 | 110 | ||||
| 2022 | 105 | ||||
NOTE 17
ON BALANCE SHEET DERIVATIVE INSTRUMENTS AND HEDGING ACTIVITIES:
Derivative Financial Instruments
The Company has stand alone derivative financial instruments in the form of forward option contracts. These transactions involve both credit and market risk. The notional amounts are amounts on which calculations, payments, and the value of the derivative are based. Notional amounts do not represent direct credit exposures. Direct credit exposure is limited to the net difference between the calculated amounts to be received and paid, if any. Such difference, which represents the fair value of the derivative instruments, is reflected on the Company’s balance sheet as derivative assets and derivative liabilities.
The Company is exposed to credit-related losses in the event of nonperformance by the counterparties to these agreements. The Company controls the credit risk of its financial contracts through credit approvals, limits and monitoring procedures, and does not expect any counterparties to fail their obligations. The Company deals only with primary dealers.
Derivative instruments are generally either negotiated OTCOver-the-Counter (OTC) contracts or standardized contracts executed on a recognized exchange. Negotiated OTC derivative contracts are generally entered into between two counterparties that negotiate specific agreement terms, including the underlying instrument, amount, exercise prices and maturity.
The Company issues to customerscustomer’s certificates of deposit with an interest rate that is derived from the rate of return on the stock of the companies that comprise The Dow Jones Industrial Average. In order to manage the interest rate risk associated with this deposit product, the Company has purchased a series of forward option contracts. These contracts provide the Company with a rate of return commensurate with the return of The Dow Jones Industrial Average from the time of the contract until maturity of the related certificatecertificates of deposit. These contracts are accounted for as fair value hedges. Because the certificates of deposit can be redeemed by the customer at any time and the related forward options contracts cannot be cancelled by the Company, the hedge is not considered effective. The ineffective portion of the gain or loss on the derivative instrument, if any, is recognized currently in earnings. There was no ineffective portion included in the consolidated income statement for the years ended December 31, 2017, 2016 and 2015.
F & M Bank Corp. and Subsidiaries
Notes to the Consolidated Financial Statements (dollars in thousands)
December 31, 2017 and 2016
NOTE 17
ON BALANCE SHEET DERIVATIVE INSTRUMENTS AND HEDGING ACTIVITIES (CONTINUED):
At December 31, the information pertaining to the forward option contracts, included in other assets and other liabilities on the balance sheet, is as follows:
| 2015 | 2014 | 2017 | 2016 | |||||||
| Notional amount | $ | 189,629 | $ | 87,782 | $184 | $190 | ||||
| Fair market value of contracts | 15,162 | 32,795 | ||||||||
| Fair value of contracts, included in other assets | 59 | 26 | ||||||||
Mortgage Banking Derivatives
Commitments to fund certain mortgage loans originated by VBS (rate lock commitments) to be sold into the secondary market and best efforts commitments for the future delivery of mortgage loans to third party investors are considered derivatives. It is the practice of VBS to enter into best efforts commitments for the future delivery of residential mortgage loans when interest rate lock commitments are entered into in order to economically hedge the effect of changes in interest rates resulting from its commitments to fund the loans. These mortgage banking derivatives are not designated hedge relationships. The fair value of the mortgage banking derivatives were estimated based on changes in interest rates from the date of the commitments and were considered immaterial at December 31, 2017 and 2016, and were not recorded on the Company’s balance sheet.
NOTE 18
TRANSACTIONS WITH RELATED PARTIES:
During the year, executive officers and directors (and companies controlled by them) were customers of and had transactions with the Company in the normal course of business. TheseManagement believes these transactions were made on substantially the same terms as those prevailing for other customers and did not involve any abnormal risk.
Loan transactions with related parties are shown in the following schedule:
2017 | 2016 | |
| Total loans, beginning of year | $7,486 | $7,180 |
| New loans | 6,803 | 4,701 |
| Relationship change | 10,403 | 611 |
| Repayments | (4,315) | (5,006) |
| Total loans, end of year | $20,377 | $7,486 |
| 2015 | 2014 | |||||||
| Total loans, beginning of year | $ | 7,449,140 | $ | 7,786,058 | ||||
| New loans | 5,226,432 | 5,249,565 | ||||||
| Relationship change | (44,948 | ) | - | |||||
| Repayments | (5,450,520 | ) | (5,586,483 | ) | ||||
| Total loans, end of year | $ | 7,180,104 | $ | 7,449,140 | ||||
Deposit of executive officers and directors and their affiliates were $4,529,503$7,757 and $3,430,336$4,524 on December 31, 20152017 and 20142016 respectively. TheseManagement believes these deposits were made under the same terms available to other customers of the bankbank.
NOTE 19
DIVIDEND LIMITATIONS ON SUBSIDIARY BANK:
The principal source of funds of F & M Bank Corp. is dividends paid by the Farmers and& Merchants Bank. The Federal Reserve Act restricts the amount of dividends the Bank may pay. Approval by the Board of Governors of the Federal Reserve System is required if the dividends declared by a state member bank, in any year, exceed the sum of (1) net income of the current year and (2) income net of dividends for the preceding two years. As of January 1, 2015,2018, approximately $10,494,000$13,705 was available for dividend distribution without permission of the Board of Governors. Dividends paid by the Bank to the Company totaled $2,500,000$5,000 in 2015, $1,300,0002017, $5,000 in 20142016 and $1,550,000$2,500 in 2013.
| 2015 | 2014 | |||||||||||||||
| Estimated | Carrying | Estimated | Carrying | |||||||||||||
| Fair Value | Value | Fair Value | Value | |||||||||||||
| Financial Assets (in thousands) | ||||||||||||||||
| Loans | $ | 555,762 | $ | 544,053 | $ | 551,338 | $ | 518,202 | ||||||||
| Financial Liabilities | ||||||||||||||||
| Time deposits | 162,524 | 161,040 | 196,826 | 195,464 | ||||||||||||
| Long-term debt | 48,565 | 48,161 | 9,862 | 9,875 | ||||||||||||
F & M Bank Corp. and Subsidiaries
Notes to the Consolidated Financial Statements (dollars in thousands)
December 31, 20152017 and 20142016
NOTE 21 20
FAIR VALUE MEASUREMENTSMEASUREMENTS:
Those techniques are significantly affected by the assumptions used, including the discount rate and estimates of future cash flows. Accordingly, the fair value establishesestimates may not be realized in an immediate settlement of the instrument. Accounting guidance for fair value excludes certain financial instruments and all nonfinancial instruments from its disclosure requirements. Accordingly, the aggregate fair value amounts presented may not necessarily represent the underlying fair value of the Company.
The Company records fair value adjustments to certain assets and liabilities and determines fair value disclosures utilizing a three-level valuation hierarchy for disclosuredefinition of fair value measurementof assets and enhances disclosure requirements forliabilities that states that fair value measurements. The valuation hierarchy is based uponan exit price, representing the transparency of inputsamount that would be received to the valuation ofsell an asset or paid to transfer a liability asin an orderly transaction between market participants. Additional considerations are involved to determine the fair value of financial assets in markets that are not active.
The Company uses a hierarchy of valuation techniques based on whether the measurement date.inputs to those valuation techniques are observable or unobservable. Observable inputs reflect market data obtained from independent sources, while unobservable inputs reflect the Company’s market assumptions. The three levels of the fair value hierarchy based on these two types of inputs are defined as follows:
| Level 1 | Valuation is based on quoted prices | ||
| Level 2 – | Valuation is based on observable inputs including quoted prices in active |
| Level 3 – | Valuation is based on model-based techniques that use one or more significant inputs or assumptions that are |
The following sections provide a description ofdescribes the valuation methodologiestechniques used for instruments measuredby the Company to measure certain financial assets and liabilities recorded at fair value as well ason a recurring basis in the general classification of such instruments pursuant to the valuation hierarchy:financial statements:
Where quoted prices are available in an active market, securities are classified within Level 1 of the valuation hierarchy. Level 1 securities would include highly liquid government bonds, mortgage products and exchange traded equities.equities, such as U. S. Treasuries. If quoted market prices are not available, then fair values are estimated by using pricing models, quoted prices of securities with similar characteristics, or discounted cash flow. Level 2 securities would include U.S. agency securities, mortgage-backed agency securities, obligations of states and political subdivisions and certain corporate, asset backed and other securities. In certain cases where there is limited activity or less transparency around inputs to the valuation, securities are classified within Level 3 of the valuation hierarchy. The carrying value of restricted Federal Reserve Bank and Federal Home Loan Bank stock approximates fair value based upon the redemption provisions of each entity and is therefore excluded from the following table.
Derivatives
The Company’s derivatives are recorded at fair value based on third party vendor supplied information using discounted cash flow analysis from observable-market based inputs, which are considered Level 2 inputs.
F & M Bank Corp. and Subsidiaries
Notes to the Consolidated Financial Statements (dollars in thousands)
December 31, 2017 and 2016
NOTE 20
FAIR VALUE MEASUREMENTS (CONTINUED):
The following tables present the balances of financial assets measured at fair value on a recurring basis as of December 31, 2017, and 2016 (dollars in thousands):
| December 31, 2017 | Total | Level 1 | Level 2 | Level 3 |
| U. S. Treasuries | $19,998 | $19,998 | $- | $- |
| U.S. Government sponsored enterprises | 7,980 | - | 7,980 | - |
| Mortgage-backed obligations of federal agencies | 502 | - | 502 | - |
| Equity securities | 135 | - | 135 | - |
| Total securities available for sale | $28,615 | $19,998 | $8,617 | - |
| December 31, 2016 | Total | Level 1 | Level 2 | Level 3 |
| U. S. Treasuries | $24,014 | $24,014 | $- | $- |
| Mortgage-backed obligations of federal agencies | 634 | - | 634 | - |
| Equity securities | 135 | - | 135 | - |
| Total securities available for sale | $24,783 | $24,014 | $769 | - |
Certain financial assets are measured at fair value on a nonrecurring basis in accordance with GAAP. Adjustments to the fair value of these assets usually result from the application of lower-of-cost-or-market accounting or write-downs of individual assets.
The following describes the valuation techniques used by the Company to measure certain financial assets recorded at fair value on a nonrecurring basis in the financial statements:
Loans Held for Sale: Sale
Loans held for sale are short-term loans purchased at par for resale to investors at the par value of the loan. Theseloan and loans originated by VBS for sale in the secondary market. Loan participations are generally repurchased within 15 days. Loans originated for sale by VBS are recorded at lower of cost or market. No market adjustments were required at December 31, 2017 or 2016; therefore, loans held for sale were carried at cost. Because of the short-term nature and fixed repurchasedrepurchase price, the book value of these loans approximates fair value.value at December 31, 2017, and 2016.
Impaired Loans: ASC 310 appliesLoans
Loans are designated as impaired when, in the judgment of management based on current information and events, it is probable that all amounts due will not be collected according to loans measured for impairment using the practical expedients permitted by SFAS No. 114, “Accounting by Creditors for Impairment of a Loan,” including impaired loans measured at an observable market price (if available), or at the fair valuecontractual terms of the loan’s collateral (if the loan is collateral dependent). Fair value of the loan’s collateral, when the loan is dependent on collateral, is determined by appraisals or independent valuation which is then adjusted for the cost related to liquidation of the collateral.
The fair value of an impaired loan and measurement of associated loss is based on one of three methods: the observable market price of the loan, the present value of projected cash flows, or non-recurring basis as of December 31, 2015 and 2014 significant unobservable inputs used in the fair value measurements wereof the collateral. The observable market price of a loan is categorized as follows:
a Level 1 input. The present value of projected cash flows method results in a Level 3 categorization because the calculation relies on the Company’s judgment to determine projected cash flows, which are then discounted at the current rate of the loan, or the rate prior to modification if the loan is a troubled debt restructure.
| Fair Value at December 31, 2015 | Valuation Technique | Significant Unobservable Inputs | Range | ||||||||
| Impaired Loans | $ | 11,315 | Discounted appraised value | Discount for selling costs and age of appraisals | 15%-55 | % | |||||
| Other Real Estate Owned | $ | 2,128 | Discounted appraised value | Discount for selling costs and age of appraisals | 15%-55 | % | |||||
| Fair Value at December 31, 2014 | Valuation Technique | Significant Unobservable Inputs | Range | ||||||||
| Impaired Loans | $ | 13,223 | Discounted appraised value | Discount for selling costs and age of appraisals | 15%-55 | % | |||||
| Other Real Estate Owned | $ | 3,507 | Discounted appraised value | Discount for selling costs and age of appraisals | 15%-55 | % | |||||
F & M Bank Corp. and Subsidiaries
Notes to the Consolidated Financial Statements (dollars in thousands)
December 31, 20152017 and 20142016
NOTE 2120 FAIR VALUE MEASUREMENTS (CONTINUED):
The value of real estate collateral is determined by an independent appraisal utilizing an income or market valuation approach. The Company discounts appraised value by estimated selling costs to arrive at net fair value. Appraisals conducted by an independent, licensed appraiser outside of the Company using observable market data is categorized as Level 3. The value of business equipment is based upon an outside appraisal (Level 3) if deemed significant, or the net book value on the applicable business’ financial statements (Level 3) if not considered significant. Likewise, values for inventory and accounts receivables collateral are based on financial statement balances or aging reports (Level 3).
As of December 31, 2017, and 2016, the fair value measurements for impaired loans with specific allocations were primarily based upon the fair value of the collateral.
The following table summarizes the Company’s financial assets that were measured at fair value on a nonrecurring basis during the period (dollars in thousands):
| December 31, 2017 | Total | Level 1 | Level 2 | Level 3 |
| Construction/Land Development | $3,337 | - | - | $3,337 |
| Real Estate | 979 | - | - | 979 |
| Dealer Finance | 35 | - | - | 35 |
| Impaired loans | $4,351 | - | - | $4,351 |
| December 31, 2016 | Total | Level 1 | Level 2 | Level 3 |
| Construction/Land Development | $4,739 | - | - | $4,739 |
| Real Estate | 985 | - | - | 985 |
| Commercial Real Estate | 892 | - | - | 892 |
| Dealer Finance | 67 | - | - | 67 |
| Impaired loans | $6,683 | - | - | $6,683 |
The following table presents information about Level 3 Fair Value on a Recurring Basis (in thousands)
Measurements for December 31, 2017 and 2016:| December 31, 2015 | Total | Level 1 | Level 2 | Level 3 | ||||||||||||
| U. S. Treasuries | $ | 4,021 | $ | - | $ | 4,021 | $ | - | ||||||||
| Government sponsored enterprises | 8,074 | - | 8,074 | - | ||||||||||||
| Mortgage-backed obligations of federal agencies | 817 | - | 817 | - | ||||||||||||
| Marketable equities | 135 | - | 135 | - | ||||||||||||
| Investment securities available for sale | 13,047 | - | 13,047 | - | ||||||||||||
| Total assets at fair value | $ | 13,047 | $ | - | $ | 13,047 | $ | - | ||||||||
| Total liabilities at fair value | $ | - | $ | - | $ | - | $ | - | ||||||||
| Derivative financial instruments at fair value | $ | 15 | $ | - | $ | 15 | $ | - | ||||||||
Fair Value at December 31, 2017 | Valuation Technique | Significant Unobservable Inputs | Range | |
| Impaired Loans | $4,351 | Discounted appraised value | Discount for selling costs and marketability | 3%-19% (Average 5.5%) |
| December 31, 2014 | Total | Level 1 | Level 2 | Level 3 | ||||||||||||
| U. S. Treasuries | $ | 4,020 | $ | - | $ | 4,020 | $ | - | ||||||||
| Government sponsored enterprises | 8,038 | - | 8,038 | - | ||||||||||||
| Mortgage-backed obligations of federal agencies | 1,022 | - | 1,022 | - | ||||||||||||
| Marketable equities | 135 | - | 135 | - | ||||||||||||
| Investment securities available for sale | 13,215 | - | 13,215 | - | ||||||||||||
| Total assets at fair value | $ | 13,215 | $ | - | $ | 13,215 | $ | - | ||||||||
| Total liabilities at fair value | $ | - | $ | - | $ | - | $ | - | ||||||||
| Derivative financial instruments at fair value | $ | 33 | $ | - | $ | 33 | $ | - | ||||||||
Fair Value at December 31, 2016 | Valuation Technique | Significant Unobservable Inputs | Range | |
| Impaired Loans | $6,683 | Discounted appraised value | Discount for selling costs and marketability | 2%-50% (Average 4.7%) |
Notes to the Consolidated Financial Statements (dollars in thousands)
December 31, 2017 and 2016
NOTE 20 FAIR VALUE MEASUREMENTS (CONTINUED):
Other Real Estate Owned
Certain assets such as other real estate owned (OREO) are measured at fair value less cost to sell. Valuation of other real estate owned is determined using current appraisals from independent parties, a level three input. If current appraisals cannot be obtained prior to reporting dates, or if declines in value are identified after a recent appraisal is received, appraisal values are discounted, resulting in Level 3 estimates. If the Company markets the property with a realtor, estimated selling costs reduce the fair value, resulting in a valuation based on Level 3 inputs.
The Company markets other real estate owned both independently and with local realtors. Properties marketed by realtors are discounted by selling costs. Properties that the Company markets independently are not discounted by selling costs.
The following table summarizes the Company’s other real estate owned that were measured at fair value on a nonrecurring basis during the period.
| December 31, 2017 | Total | Level 1 | Level 2 | Level 3 |
| Other real estate owned | $1,984 | - | - | $1,984 |
| December 31, 2016 | Total | Level 1 | Level 2 | Level 3 |
| Other real estate owned | $2,076 | - | - | $2,076 |
The following table presents information about Level 3 Fair Value on a Non-Recurring Basis (in thousands)Measurements for December 31, 2017 and 2016:
| December 31, 2015 | Total | Level 1 | Level 2 | Level 3 | ||||||||||||
| Other Real Estate Owned | $ | 2,128 | - | - | $ | 2,128 | ||||||||||
| - | - | |||||||||||||||
| Construction/Land Development | 9,161 | - | - | 9,161 | ||||||||||||
| Farmland | - | - | - | - | ||||||||||||
| Real Estate | 85 | - | - | 85 | ||||||||||||
| Multi-Family | - | - | - | - | ||||||||||||
| Commercial Real Estate | 872 | - | - | 872 | ||||||||||||
| Home Equity – closed end | - | - | - | - | ||||||||||||
| Home Equity – open end | 1,145 | - | - | 1,145 | ||||||||||||
| Commercial & Industrial – Non-Real Estate | - | - | - | - | ||||||||||||
| Consumer | - | - | - | - | ||||||||||||
| Credit cards | - | - | - | - | ||||||||||||
| Dealer Finance | 52 | - | - | 52 | ||||||||||||
| Impaired loans | 11,315 | - | - | 11,315 | ||||||||||||
| Total assets at fair value | $ | 13,443 | - | $ | - | $ | 13,443 | |||||||||
| Total liabilities at fair value | $ | - | $ | - | $ | - | $ | - | ||||||||
Fair Value at December 31, 2017 | Valuation Technique | Significant Unobservable Inputs | Range | |
| Other real estate owned | $1,984 | Discounted appraised value | Discount for selling costs | 5%-15% (Average 8%) |
Fair Value at December 31, 2016 | Valuation Technique | Significant Unobservable Inputs | Range | |
| Other real estate owned | $2,076 | Discounted appraised value | Discount for selling costs | 5%-15% (Average 8%) |
The following methods and assumptions were used by the Company in estimating fair value disclosures for financial instruments:
Cash and Due from Bank, and Interest-Bearing Deposits
The carrying amounts approximate fair value.
Securities
The fair values of securities, excluding restricted stock, are determined by quoted market prices or dealer quotes. The fair value of certain state and municipal securities is not readily available through market sources other than dealer quotations, so fair value estimates are based on quoted market prices of similar instruments adjusted for differences between the quoted instruments and the instruments being valued. The carrying value of restricted securities and other investments approximates fair value and are therefore excluded from the following table.
Loans Held for Sale
Fair values of loans held for sale are based on commitments on hand from investors or prevailing market prices.
F & M Bank Corp. and Subsidiaries
Notes to the Consolidated Financial Statements (dollars in thousands)
December 31, 2017 and 2016
NOTE 20 FAIR VALUE MEASUREMENTS (CONTINUED):
Loans
Fair values are estimated for portfolios of loans with similar financial characteristics. Loans are segregated by type such as commercial, real estate – commercial, real estate – construction, real estate – mortgage, credit card and other consumer loans. Each loan category is further segmented into fixed and adjustable rate interest terms and by performing and nonperforming categories.
The fair value of performing loans is calculated by discounting scheduled cash flows through the estimated maturity using estimated market discount rates that reflect the credit and interest rate risk inherent in the loan, as well as estimates for prepayments. The estimate of maturity is based on the Company’s historical experience with repayments for loan classification, modified, as required, by an estimate of the effect of economic conditions on lending.
Fair value for significant nonperforming loans is based on estimated cash flows which are discounted using a rate commensurate with the risk associated with the estimated cash flows. Assumptions regarding credit risk, cash flows and discount rates are determined within management’s judgment, using available market information and specific borrower information.
Bank-Owned Life Insurance
Bank-owned life insurance represents insurance policies on officers of the Company. The cash values of the policies are estimates using information provided by insurance carriers. These policies are carried at their cash surrender value, which approximates fair value.
Deposits
The fair value of demand and savings deposits is the amount payable on demand. The fair value of fixed maturity term deposits and certificates of deposit is estimated using the rates currently offered for deposits with similar remaining maturities.
Short-Term Debt
The carrying amounts of short-term debt maturing within 90 days approximate their fair values. Fair values of any other short-term debt are estimated using discounted cash flow analyses based on the current incremental borrowing rates for similar types of debt.
Long-Term Debt
The fair value of the Company’s long-term debt is estimated using discounted cash flow analyses based on the Company’s incremental borrowing rates for similar types of debt arrangements.
Accrued Interest
The carrying amounts of accrued interest approximate fair value.
F & M Bank Corp. and Subsidiaries
Notes to the Consolidated Financial Statements (dollars in thousands)
December 31, 2017 and 2016
NOTE 20 FAIR VALUE MEASUREMENTS (CONTINUED):
Fair Value Measurements at December 31, 2017 Using | |||||
| (dollars in thousands) | Carrying Amount | Quoted Prices in Active Markets for Identical Assets (Level 1) | Significant Other Observable Inputs (Level 2) | Significant Unobservable Inputs (Level 3) | Fair Value at December 31, 2016 |
| Assets: | |||||
| Cash and cash equivalents | $11,907 | $11,907 | $- | $- | $11,907 |
| Securities | 28,740 | 19,998 | 8,742 | - | 28,740 |
| Loans held for sale | 39,775 | - | 39,775 | - | 39,775 |
| Loans held for investment, net | 610,930 | - | - | 646,703 | 646,703 |
| Interest receivable | 2,007 | - | 2,007 | - | 2,007 |
| Bank owned life insurance | 13,950 | - | 13,950 | - | 13,950 |
| Total | $707,309 | $31,905 | $64,474 | $646,703 | $743,082 |
| Liabilities: | |||||
| Deposits | $569,177 | $- | $403,907 | $167,210 | $571,117 |
| Short-term debt | 25,296 | - | 25,296 | - | 25,296 |
| Long-term debt | 49,733 | - | - | 49,869 | 49, 869 |
| Interest payable | 260 | - | 260 | - | 260 |
| Total | $644,466 | $- | $429,463 | $217,079 | $646,542 |
The estimated fair values, and related carrying amounts (in thousands), of the Company’s financial instruments are as follows:
Fair Value Measurements at December 31, 2016 Using | |||||
| (dollars in thousands) | Carrying Amount | Quoted Prices in Active Markets for Identical Assets (Level 1) | Significant Other Observable Inputs (Level 2) | Significant Unobservable Inputs (Level 3) | Fair Value at December 31, 2016 |
| Assets: | |||||
| Cash and cash equivalents | $16,355 | $16,355 | $- | $- | $16,355 |
| Securities | 24,908 | 24,014 | 894 | - | 24,908 |
| Loans held for sale | 62,735 | - | 62,735 | - | 62,735 |
| Loans held for investment, net | 584,093 | - | - | 598,991 | 598,991 |
| Interest receivable | 1,785 | - | 1,785 | - | 1,785 |
| Bank owned life insurance | 13,513 | - | 13,513 | - | 13,513 |
| Total | $703,389 | $40,369 | $78,927 | $598,991 | $718,287 |
| Liabilities: | |||||
| Deposits | $537,085 | $- | $379,857 | $158,073 | $537,930 |
| Short-term debt | 40,000 | - | 40,000 | - | 40,000 |
| Long-term debt | 64,237 | - | - | 63,945 | 63,945 |
| Interest payable | 228 | - | 228 | - | 228 |
| Total | $641,550 | $- | $420,085 | $222,018 | $642,103 |
F & M Bank Corp. and Subsidiaries
Notes to the Consolidated Financial Statements (dollars in thousands)
December 31, 20152017 and 2014
| December 31, 2014 | Total | Level 1 | Level 2 | Level 3 | ||||||||||||
| Other Real Estate Owned | $ | 3,507 | - | - | $ | 3,507 | ||||||||||
| - | - | |||||||||||||||
| Construction/Land Development | 11,507 | - | - | 11,507 | ||||||||||||
| Farmland | - | - | - | - | ||||||||||||
| Real Estate | 825 | - | - | 825 | ||||||||||||
| Multi-Family | - | - | - | - | ||||||||||||
| Commercial Real Estate | 891 | - | - | 891 | ||||||||||||
| Home Equity – closed end | - | - | - | - | ||||||||||||
| Home Equity – open end | - | - | - | - | ||||||||||||
| Commercial & Industrial – Non-Real Estate | - | - | - | - | ||||||||||||
| Consumer | - | - | - | - | ||||||||||||
| Credit cards | - | - | - | - | ||||||||||||
| Dealer Finance | - | - | - | - | ||||||||||||
| Impaired loans | 13,223 | - | - | 13,223 | ||||||||||||
| Total assets at fair value | $ | 16,730 | - | $ | - | $ | 16,730 | |||||||||
| Total liabilities at fair value | $ | - | $ | - | $ | - | $ | - | ||||||||
NOTE 22 21
REGULATORY MATTERS
The Company meets the eligibility criteria of a small bank holding company in accordance with the Federal Reserve’s Small Bank Holding Company Policy Statement issued in February 2015 and its subsidiary bank areis no longer obligated to report consolidated regulatory capital. The Bank is subject to various regulatory capital requirements administered by the federal banking agencies. Failure to meet minimum capital requirements can initiate certain mandatory and possibly additional discretionary actions by regulators that, if undertaken, could have a direct material effect on the Company’sBank’s financial statements. Under capital adequacy guidelines and the regulatory framework for prompt corrective action, the CompanyBank must meet specific capital guidelines that involve quantitative measures of the Company’sBank’s assets, liabilities, and certain off balance-sheet items as calculated under regulatory accounting practices. The Company’sBank’s capital amounts and classification are also subject to qualitative judgments by the regulators about components, risk weightings, and other factors.
The final rules implementing the Basel Committee on Banking Supervision’s capital guidelines for U.S. Banks (Basel III rules) became effective January 1, 2015, with full compliance of all the requirements being phased in over a multi-year schedule and becoming fully phased in by January 1, 2019. Under the Basel III rules, the Company must hold a capital conservation buffer above the adequately capitalized risk-based capital ratios. The capital conservation buffer is being phased in from 0.0% for 2015 to 2.50% by 2019. The capital conservation buffer for 2017 was 1.25% and for 2016 was 0.625%. The net unrealized gain on securities available for sale and the unfunded pension liability are not included in computing regulatory capital.
Quantitative measures established by regulation, to ensure capital adequacy, require the CompanyBank to maintain minimum amounts and ratios. These ratios are defined in the regulations and the amounts are set forth in the table below. Management believes, as of December 31, 2015,2017 and 2016, that the Company and its subsidiary bank meetBank meets all capital adequacy requirements to which they are subject.
As of the most recent notification from the Federal Reserve Bank Report of Examination, (which was as of February 23, 2015), the subsidiary bank was categorized as well capitalized under the regulatory framework for prompt corrective action. To be categorized as well capitalized, the CompanyBank must maintain minimum total risk based, Tier I1 risk-based, and Tier I1 leverage ratios as set forth in the table. There are no conditions or events since that notification that management believes have changed the institution’s category.
The actual capital ratios for the Bank are presented in the following table (dollars in thousands):
Actual | Minimum Capital Requirement | Minimum to be Well Capitalized Under Prompt Corrective Action Provisions | ||||
| December 31, 2017 | Amount | Ratio | Amount | Ratio | Amount | Ratio |
| Total risk-based ratio | $95,563 | 15.41% | $49,614 | 8.00% | $62,018 | 10.00% |
| Tier 1 risk-based ratio | 89,519 | 14.43% | 37,211 | 6.00% | 49,614 | 8.00% |
| Common equity tier 1 | 89,519 | 14.43% | 27,908 | 4.50% | 40,312 | 6.50% |
| Total assets leverage ratio | 89,519 | 12.07% | 29,656 | 4.00% | 37,070 | 5.00% |
Actual | Minimum Capital Requirement | Minimum to be Well Capitalized Under Prompt Corrective Action Provisions | ||||
| December 31, 2016 | Amount | Ratio | Amount | Ratio | Amount | Ratio |
| Total risk-based ratio | $93,519 | 15.08% | $49,615 | 8.00% | $62,019 | 10.00% |
| Tier 1 risk-based ratio | 85,976 | 13.86% | 37,212 | 6.00% | 49,615 | 8.00% |
| Common equity tier 1 | 85,976 | 13.86% | 27,909 | 4.50% | 40,312 | 6.50% |
| Total assets leverage ratio | 85,976 | 11.83% | 29,065 | 4.00% | 36,331 | 5.00% |
F & M Bank Corp. and Subsidiaries
Notes to the Consolidated Financial Statements (dollars in thousands)
December 31, 20152017 and 20142016
NOTE 22 REGULATORY MATTERS (CONTINUED):
BUSINESS SEGMENTS:
December 31, 2017 | |||||||
F&M Bank | VBS Mortgage | TEB Life/FMFS | VS Title | Parent Only | Eliminations | F&M Bank Corp. Consolidated | |
| Revenues: | |||||||
| Interest Income | $33,904 | $125 | $148 | $- | $- | $(82) | $34,095 |
| Service charges on deposits | 1,360 | - | - | - | - | - | 1,360 |
| Investment services and insurance income | 1 | - | 772 | - | - | (18) | 755 |
| Mortgage banking income, net | - | 2,220 | - | - | - | - | 2,220 |
| Title insurance income | - | 279 | - | 883 | - | - | 1,162 |
| Gain on prepayment of long-term debt | 504 | - | - | - | - | - | 504 |
| Loss on sale of investments | - | (40) | (2) | - | - | - | (42) |
| Other operating income | 2,128 | - | - | - | 162 | (357) | 1,933 |
| Total income | 37,897 | 2,584 | 918 | 883 | 162 | (457) | 41,987 |
| Expenses: | |||||||
| Interest Expense | 3,904 | 75 | - | - | - | (82) | 3,897 |
| Provision for loan losses | - | - | - | - | - | - | - |
| Salaries and benefits | 12,092 | 1,733 | 474 | 555 | - | - | 14,854 |
| Other operating expenses | 8,942 | 672 | 51 | 172 | 46 | (18) | 9,865 |
| Total expense | 24,938 | 2,480 | 525 | 727 | 46 | (100) | 28,616 |
| Income before income taxes | 12,959 | 104 | 393 | 156 | 116 | (357) | 13,371 |
| Income tax expense (benefit) | 4,316 | - | 109 | - | (95) | - | 4,330 |
| Net income | $8,643 | $104 | $284 | $156 | $211 | $(357) | $9,041 |
| Net income attributable to noncontrolling interest | - | 31 | - | - | - | - | 31 |
| Net Income attributable to F & M Bank Corp. | $8,643 | $73 | $284 | $156 | $211 | $(357) | $9,010 |
| Total Assets | $754,375 | $7,018 | $6,749 | $811 | $90,964 | $(106,647) | $753,270 |
| Goodwill | $2,670 | $47 | $- | $- | $164 | $- | $2,881 |
| Analysis of Capital | Regulatory Requirements | ||||||||||||||||||
| At December 31, | Adequately | Well | |||||||||||||||||
| 2015 | 2014 | 2013 | Capitalized | Capitalized | |||||||||||||||
| Tier1 capital: | |||||||||||||||||||
| Preferred stock | $ | 9,425 | $ | 9,425 | $ | - | |||||||||||||
| Common stock | 16,427 | 16,459 | 12,559 | ||||||||||||||||
| Retained earnings | 59,205 | 53,815 | 42,089 | ||||||||||||||||
| Intangible assets | (2,670 | ) | (2,670 | ) | (2,670 | ) | |||||||||||||
| Accumulated other comprehensive income | (2,680 | ) | - | - | |||||||||||||||
| Total Tier 1 Capital | $ | 79,707 | $ | 77,029 | $ | 51,978 | |||||||||||||
| Tier 2 capital: | |||||||||||||||||||
| Qualifying subordinated debt | $ | - | $ | - | $ | 8,487 | |||||||||||||
| Allowance for loan losses | 7,073 | 6,018 | 5,389 | ||||||||||||||||
| Unrealized gains on AFS equity securities | - | - | - | ||||||||||||||||
| Total risked based capital | $ | 86,780 | $ | 83,047 | $ | 65,854 | |||||||||||||
| Common Equity Tier 1 Capital (Tier 1 less preferred stock) | $ | 70,282 | $ | - | $ | - | |||||||||||||
| Risk-weighted assets | $ | 564,106 | $ | 478,725 | $ | 428,349 | |||||||||||||
| Capital ratios: | |||||||||||||||||||
| Total risk-based ratio | 15.38 | % | 17.35 | % | 15.37 | % | 8.00 | % | 10.00 | % | |||||||||
| Tier 1 risk-based ratio | 14.13 | % | 16.09 | % | 12.13 | % | 4.00 | % | 6.00 | % | |||||||||
| Common equity tier 1 | 12.46 | % | 4.5 | % | 6.5 | % | |||||||||||||
| Total assets leverage ratio | 12.18 | % | 12.88 | % | 9.37 | % | 3.00 | % | 5.00 | % | |||||||||
| Analysis of Capital | Regulatory Requirements | |||||||||||||||||||
| At December 31, | Adequately | Well | ||||||||||||||||||
| 2015 | 2014 | 2013 | Capitalized | Capitalized | ||||||||||||||||
| Common Equity Tier 1 capital: | ||||||||||||||||||||
| Common stock | $ | 500 | $ | 500 | $ | 500 | ||||||||||||||
| Capital surplus | 37,971 | 37,971 | 18,971 | |||||||||||||||||
| Retained earnings | 45,855 | 40,114 | 35,361 | |||||||||||||||||
| Intangible assets | (2,670 | ) | (2,670 | ) | (2,670 | ) | ||||||||||||||
| Accumulated other comprehensive income | (2,680 | ) | - | - | ||||||||||||||||
| Total Common Equity Tier 1 Capital | $ | 78,976 | $ | 75,915 | $ | 52,162 | ||||||||||||||
| Tier 2 capital: | ||||||||||||||||||||
| Qualifying subordinated debt | $ | - | $ | - | $ | 8,487 | ||||||||||||||
| Allowance for loan losses | 7,077 | 6,006 | 5,384 | |||||||||||||||||
| Unrealized gains on AFS securities | - | - | - | |||||||||||||||||
| Total risked based capital | $ | 86,053 | $ | 81,921 | $ | 66,033 | ||||||||||||||
| Risk-weighted assets | $ | 564,469 | $ | 478,512 | $ | 427,957 | ||||||||||||||
| Capital ratios: | ||||||||||||||||||||
| Total risk-based ratio | 15.24 | % | 17.12 | % | 15.43 | % | 8.00 | % | 10.00 | % | ||||||||||
| Tier 1 risk-based ratio | 13.99 | % | 15.86 | % | 12.19 | % | 4.00 | % | 6.00 | % | ||||||||||
| Common equity tier 1 | 13.99 | % | 4.5 | % | 6.5 | % | ||||||||||||||
| Total assets leverage ratio | 12.06 | % | 12.70 | % | 9.41 | % | 3.00 | % | 5.00 | % | ||||||||||
F & M Bank Corp. and Subsidiaries
Notes to the Consolidated Financial Statements (dollars in thousands)
December 31, 20152017 and 2014
| 2015 | 2014 | |||||||
| Assets | ||||||||
| Cash and cash equivalents | $ | 1,907,581 | $ | 1,214,140 | ||||
| Investment in subsidiaries | 81,646,312 | 76,684,121 | ||||||
| Securities available for sale | 135,000 | 135,000 | ||||||
| Income tax receivable (including due from subsidiary) | - | 453,585 | ||||||
| Total Assets | $ | 83,688,893 | $ | 78,486,846 | ||||
| Liabilities | ||||||||
| Other liabilities | $ | - | $ | 137,977 | ||||
| Income tax payable (including due form subsidiary) | 847,001 | - | ||||||
| Deferred income taxes | 301,870 | 383,125 | ||||||
| Demand obligations for low income housing investment | 162,290 | 167,341 | ||||||
| Total Liabilities | $ | 1,311,161 | $ | 688,443 | ||||
| Stockholders’ Equity | ||||||||
| Preferred stock par value $5 per share, 400,000 shares authorized, issued and outstanding | $ | 9,425,123 | $ | 9,425,123 | ||||
| Common stock par value $5 per share, 6,000,000 shares authorized, 3,285,404 and 3,291,766 shares issued and outstanding for 2015 and 2014, respectively | 16,427,020 | 16,458,830 | ||||||
| Retained earnings | 59,205,404 | 53,814,416 | ||||||
| Noncontrolling interest | - | 426,365 | ||||||
| Accumulated other comprehensive income (loss) | (2,679,815 | ) | (2,326,331 | ) | ||||
| Total Stockholders' Equity | 82,377,732 | 77,798,403 | ||||||
| Total Liabilities and Stockholders' Equity | $ | 83,688,893 | $ | 78,486,846 | ||||
NOTE 22
BUSINESS SEGMENTS CONTINUED:
December 31, 2016 | |||||||
F&M Bank | VBS Mortgage | TEB Life/FMFS | VS Title | Parent Only | Eliminations | F&M Bank Corp. Consolidated | |
| Revenues: | |||||||
| Interest Income | $31,949 | $55 | $152 | $- | $- | $(6) | $32,150 |
| Service charges on deposits | 1,174 | - | - | - | - | - | 1,174 |
| Investment services and insurance income | 1 | - | 470 | - | - | (30) | 441 |
| Mortgage banking income, net | - | 2,565 | - | - | - | - | 2,565 |
| Title insurance income | - | - | - | - | - | - | - |
| Gain on prepayment of long-term debt | - | - | - | - | - | - | - |
| Loss on investments | - | - | - | - | - | - | - |
| Other operating income | 2,353 | - | - | - | - | (951) | 1,402 |
| Total income | 35,477 | 2,620 | 622 | - | - | (987) | 37,732 |
| Expenses: | |||||||
| Interest Expense | 3,605 | - | - | - | - | (6) | 3,599 |
| Provision for loan losses | - | - | - | - | - | - | - |
| Salaries and benefits | 11,123 | 1,387 | 290 | - | - | - | 12,800 |
| Other operating expenses | 8,139 | 586 | 66 | - | 1 | (320) | 8,472 |
| Total expense | 22,867 | 1,973 | 356 | - | 1 | (326) | 24,871 |
| Income before income taxes | 12,610 | 647 | 266 | - | (1) | (661) | 12,861 |
| Income tax expense (benefit) | 3,290 | - | 58 | - | (249) | - | 3,099 |
| Net income | $9,320 | $647 | $208 | $- | $248 | $(661) | $9,762 |
| Net income attributable to noncontrolling interest | - | 194 | - | - | - | - | 194 |
| Net Income attributable to F & M Bank Corp. | $9,320 | $453 | $208 | $- | $248 | $(661) | $9,568 |
| Total Assets | $748,273 | $7,487 | $6,476 | $- | $87,449 | $(104,796) | $744,889 |
| Goodwill | $2,670 | $- | $- | $- | $- | $- | $2,670 |
F & M Bank Corp. and Subsidiaries
Notes to the Consolidated Financial Statements (dollars in thousands)
December 31, 20152017 and 20142016
NOTE 22
BUSINESS SEGMENTS CONTINUED:
December 31, 2015 | |||||||
F&M Bank | VBS Mortgage | TEB Life/FMFS | VS Title | Parent Only | Eliminations | F&M Bank Corp. Consolidated | |
| Revenues: | |||||||
| Interest Income | $29,206 | $51 | $152 | $- | $- | $(5) | $29,404 |
| Service charges on deposits | 963 | - | - | - | - | - | 963 |
| Investment services and insurance income | 2 | - | 522 | - | - | (14) | 510 |
| Mortgage banking income, net | - | 2,066 | - | - | - | - | 2,066 |
| Title insurance income | - | - | - | - | - | - | - |
| Gain on prepayment of long-term debt | - | - | - | - | - | - | - |
| Loss on investments | - | - | - | - | - | - | - |
| Other operating income | 2,142 | - | - | - | 5 | (893) | 1,254 |
| Total income | 32,313 | 2,117 | 674 | - | 5 | (912) | 34,197 |
| Expenses: | |||||||
| Interest Expense | 2,881 | - | - | - | - | (5) | 2,876 |
| Provision for loan losses | 300 | - | - | - | - | - | 300 |
| Salaries and benefits | 10,056 | 1,103 | 298 | - | - | - | 11,457 |
| Other operating expenses | 7,887 | 466 | 35 | - | 21 | (312) | 8,097 |
| Total expense | 21,124 | 1,569 | 333 | - | 21 | (317) | 22,730 |
| Income before income taxes | 11,189 | 548 | 341 | - | (16) | (595) | 11,467 |
| Income tax expense (benefit) | 2,948 | - | 129 | - | (191) | - | 2,886 |
| Net income | $8,241 | $548 | $212 | $- | $175 | $(595) | $8,581 |
| Net income attributable to noncontrolling interest | - | 164 | - | - | - | - | 164 |
| Net Income attributable to F & M Bank Corp. | $8,241 | $384 | $212 | $- | $175 | $(595) | $8,417 |
| Total Assets | $669,968 | $2,180 | $6,269 | $- | $84,897 | $(97,957) | $665,357 |
| Goodwill | $2,670 | $- | $- | $- | $- | $- | $2,670 |
| 2015 | 2014 | 2013 | ||||||||||
| Income | ||||||||||||
| Dividends from affiliate | $ | 2,500,000 | $ | 1,300,000 | $ | 1,550,000 | ||||||
| Interest Income | - | - | 5 | |||||||||
| Net limited partnership income (loss) | 4,792 | - | (65,165 | ) | ||||||||
| Total Income | 2,504,792 | 1,300,000 | 1,484,840 | |||||||||
| Expenses | ||||||||||||
| Other expense | 21,316 | 7,100 | - | |||||||||
| Administrative expenses | - | - | 60,209 | |||||||||
| Total Expenses | 21,316 | 7,100 | 60,209 | |||||||||
| Net income before income tax expense (benefit) | ||||||||||||
| and undistributed subsidiary net income | 2,483,476 | 1,292,900 | 1,424,631 | |||||||||
| Income Tax Expense (Benefit) | (191,494 | ) | 243,492 | (239,908 | ) | |||||||
| Income before undistributed subsidiary | ||||||||||||
| net income | 2,674,970 | 1,049,408 | 1,664,539 | |||||||||
| Undistributed subsidiary net income | 5,742,039 | 4,752,201 | 3,051,254 | |||||||||
| Net Income F&M Bank Corp. | $ | 8,417,009 | $ | 5,801,609 | $ | 4,715,793 | ||||||
F & M Bank Corp. and Subsidiaries
Notes to the Consolidated Financial Statements (dollars in thousands)
December 31, 20152017 and 20142016
NOTE 23PARENT COMPANY ONLY FINANCIAL STATEMENTS:
Balance Sheets
December 31, 2017 and 2016
2017 | 2016 | |
| Assets | ||
| Cash and cash equivalents | $917 | $1,155 |
| Investment in subsidiaries | 88,967 | 85,481 |
| Securities available for sale | 135 | 135 |
| Income tax receivable (including due from subsidiary) | 565 | - |
| Goodwill and intangibles | 380 | - |
| Total Assets | $90,964 | $86,771 |
| Liabilities | ||
| Income tax payable (including due from subsidiary) | $- | $313 |
| Deferred income taxes | 177 | 307 |
| Accrued expenses | 86 | - |
| Demand obligations for low income housing investment | - | 162 |
| Total Liabilities | $263 | $782 |
| Stockholders’ Equity | ||
| Preferred stock par value $5 per share, 400,000 shares authorized, 324,150 and 327,350 issued and outstanding at December 31, 2017 and 2016, respectively. | $7,529 | $7,609 |
| Common stock par value $5 per share, 6,000,000 shares authorized, 3,255,036 and 3,270,315 shares issued and outstanding for 2016 and 2015, respectively | 16,275 | 16,352 |
| Additional paid in capital | 10,225 | 10,684 |
| Retained earnings | 60,814 | 54,509 |
| Accumulated other comprehensive income (loss) | (4,142) | (3,165) |
| Total Stockholders' Equity | 90,701 | 85,989 |
| Total Liabilities and Stockholders' Equity | $90,964 | $86,771 |
Statements of Income
For the years ended December 31, 2017, 2016 and 2015
2017 | 2016 | 2015 | |
| Income | |||
| Dividends from affiliate | $5,000 | $5,000 | $2,500 |
| Net limited partnership income (loss) | 162 | - | 5 |
| Total Income | 5,162 | 5,000 | 2,505 |
| Expenses | |||
| Total Expenses | 47 | 1 | 21 |
| Net income before income tax expense (benefit) | |||
| and undistributed subsidiary net income | 5,115 | 4,999 | 2,484 |
| Income Tax Expense (Benefit) | (95) | (249) | (191) |
| Income before undistributed subsidiary | |||
| net income | 5,210 | 5,248 | 2,675 |
| Undistributed subsidiary net income | 3,800 | 4,320 | 5,742 |
| Net Income F&M Bank Corp. | $9,010 | $9,568 | $8,417 |
F & M Bank Corp. and Subsidiaries
Notes to the Consolidated Financial Statements (dollars in thousands)
December 31, 2017 and 2016
NOTE 25 23
PARENT CORPORATIONCOMPANY ONLY FINANCIAL STATEMENTS (CONTINUED):
Statements of Cash Flows
For the years ended December 31, 2015, 20142017, 2016 and 20132015
| 2015 | 2014 | 2013 | 2017 | 2016 | 2015 | ||||||||||
| Cash Flows from Operating Activities | |||||||||||||||
| Net income | $ | 8,417,009 | $ | 5,801,609 | $ | 4,715,793 | $9,010 | $9,568 | $8,417 | ||||||
| Adjustments to reconcile net income to net | |||||||||||||||
| cash provided by operating activities: | |||||||||||||||
| Undistributed subsidiary income | (5,742,039 | ) | (4,752,201 | ) | (3,051,254 | ) | (3,800) | (4,320) | (5,742) | ||||||
| Deferred tax (benefit) expense | (81,256 | ) | 279,928 | 8,577 | (112) | 5 | (81) | ||||||||
| Decrease (increase) in other assets | 1,300,586 | (444,885 | ) | (174,367 | ) | (1,256) | - | 1,300 | |||||||
| Increase (decrease) in other liabilities | (143,028 | ) | 137,817 | (1,109,728 | ) | (77) | (535) | (143) | |||||||
| Net change in deferred tax credits | - | - | (27,918 | ) | |||||||||||
| Amortization of limited partnership investments | - | - | 65,165 | ||||||||||||
| Net Cash Provided by Operating Activities | 3,751,272 | 1,022,268 | 426,268 | 3,765 | 4,718 | 3,751 | |||||||||
| Cash Flows from Investing Activities | |||||||||||||||
| Change in loans receivable | - | - | 1,000,000 | ||||||||||||
| Purchase of securities available for sale | - | (135,000 | ) | - | |||||||||||
| Net Cash Provided by (Used in) Investing Activities | - | (135,000 | ) | 1,000,000 | |||||||||||
| Net Cash Used in Investing Activities | - | ||||||||||||||
| Cash Flows from Financing Activities | |||||||||||||||
| Capital contributed to subsidiary | - | (19,000,000 | ) | - | |||||||||||
| Proceeds from issuance of preferred stock | - | 9,425,123 | - | ||||||||||||
| Repurchase of preferred stock | (101) | (1,961) | |||||||||||||
| Repurchase of common stock | (289,119 | ) | - | - | (712) | (577) | (289) | ||||||||
| Proceeds from issuance of common stock | 146,418 | 12,055,709 | 213,429 | 197 | 183 | 146 | |||||||||
| Dividends paid in cash | (2,915,130 | ) | (2,231,912 | ) | (1,705,881 | ) | (3,387) | (3,115) | (2,915) | ||||||
| Net Provided by (Cash Used) in Financing Activities | (3,057,831 | ) | 248,920 | (1,492,452 | ) | ||||||||||
| Net Cash Used in Financing Activities | (4,003) | (5,470) | (3,058) | ||||||||||||
| Net Increase (decreases) in Cash and Cash Equivalents | 693,441 | 1,136,188 | (66,184 | ) | |||||||||||
| Net (Decrease) increase in Cash and Cash Equivalents | (238) | (752) | 693 | ||||||||||||
| Cash and Cash Equivalents, Beginning of Year | 1,214,140 | 77,952 | 144,136 | 1,155 | 1,907 | 1,214 | |||||||||
| Cash and Cash Equivalents, End of Year | $ | 1,907,581 | $ | 1,214,140 | $ | 77,952 | $917 | $1,155 | $1,907 | ||||||
NOTE 24
On November 3, 2008, the Bank acquired a 70% ownership interest in VBS Mortgage, LLC (formerly Valley Broker Services, DBA VBS Mortgage). VBS originates both conventional and government sponsored mortgages for sale in the secondary market. AsAccordingly, the Company consolidated the assets, liabilities, revenues and expenses of December 31, 2015VBS Mortgage, LLC and 2014, VBS’ summarized balance sheetreflected the issued and income statement wereoutstanding interest not held by the Company in its consolidated financial statements as follows:noncontrolling interest.
Notes to the Consolidated Financial Statements (dollars in thousands)
December 31, 20152017 and 2014
| 2015 | 2014 | |||||||
| Assets | ||||||||
| Cash and cash equivalents | $ | 1,071,293 | $ | 610,973 | ||||
| Loans Receivable | 763,534 | 818,054 | ||||||
| Property and equipment, net | 79,038 | 45,600 | ||||||
| Other Assets | 266,073 | 162,304 | ||||||
| Total Assets | $ | 2,179,938 | $ | 1,636,931 | ||||
| Liabilities | ||||||||
| Other liabilities | 271,004 | 215,713 | ||||||
| Total Liabilities | $ | 271,004 | $ | 215,713 | ||||
| Equity | ||||||||
| Capital | 219,634 | 219,634 | ||||||
| Retained earnings | 1,689,300 | 1,201,584 | ||||||
| Total Equity | $ | 1,908,934 | $ | 1,421,218 | ||||
| Total Liabilities and Equity | $ | 2,179,938 | $ | 1,636,931 | ||||
NOTE 25
INVESTMENT IN VS TITLE, LLC
| 2015 | 2014 | 2013 | ||||||||||
| Income | ||||||||||||
| Mortgage origination income | $ | 2,645,235 | $ | 1,907,804 | $ | 2,528,108 | ||||||
| Other Income | 51,175 | 53,528 | 42,092 | |||||||||
| Total Income | 2,696,410 | 1,961,332 | 2,570,200 | |||||||||
| Expenses | ||||||||||||
| Salaries and employee benefits | 1,413,107 | 1,105,902 | 1,461,797 | |||||||||
| Occupancy and equipment expense | 212,858 | 177,014 | 164,717 | |||||||||
| Management and professional fees | 290,102 | 321,053 | 301,558 | |||||||||
| Other | 231,757 | 205,188 | 284,845 | |||||||||
| Total Expenses | 2,147,824 | 1,809,157 | 2,212,917 | |||||||||
| Net income(loss) | $ | 548,586 | $ | 152,175 | $ | 357,283 | ||||||

The balances in accumulated other comprehensive loss are shown in the following table:
| dollars in thousands | Unrealized Securities Gains (Losses) | Adjustments Related to Pension Plan | Accumulated Other Comprehensive Loss |
| Balance at December, 31, 2014 | 3 | (2,330) | (2,327) |
| Change in unrealized securities gains (losses), net of tax | 1 | - | 1 |
| Change in unfunded pension liability, net of tax | - | (354) | (354) |
| Balance at December, 31, 2015 | 4 | (2,684) | (2,680) |
| Change in unrealized securities gains (losses), net of tax | 2 | - | 2 |
| Change in unfunded pension liability, net of tax | - | (487) | (487) |
| Balance at December, 31, 2016 | $6 | $(3,171) | $(3,165) |
| Change in unrealized securities gains (losses), net of tax | (26) | - | (26) |
| Change in unfunded pension liability, net of tax | - | (951) | (951) |
| Balance at December, 31, 2017 | $(20) | $(4,122) | $(4,142) |
There were no reclassifications adjustments reported on the consolidated statements of Independent Registered Public Accounting Firmincome during 2015, 2016 or 2017.

REPORT OF INDEPENDENT REGISTERED PUBLIC ACCOUNTING FIRM
To the Board of Directors and Stockholders
F&M Bank Corp. and Subsidiaries
Timberville, Virginia
Opinion on the Financial Statements
We have audited the accompanying consolidated balance sheets of F&M Bank Corp. and subsidiaries (“the Company”)(the Company) as of December 31, 20152017 and 2014,2016, the related consolidated statements of income, comprehensive income, stockholders’ equity and cash flows for the years then ended, and the related notes to the consolidated financial statements (collectively, the financial statements). In our opinion, the financial statements present fairly, in all material respects, the financial position of the Company as of December 31, 2017 and 2016, and the results of its operations and its cash flows for the years then ended, in conformity with accounting principles generally accepted in the United States of America.
We have also audited, in accordance with the standards of the Public Company Accounting Oversight Board (United States) (PCAOB), the Company’s internal control over financial reporting as of December 31, 2017, based on criteria established in Internal Control — Integrated Framework issued by the Committee of Sponsoring Organizations of the Treadway Commission in 2013, and our report dated March 16, 2018 expressed an unqualified opinion on the effectiveness of the Company’s internal control over financial reporting.
Basis for Opinion
These financial statements are the responsibility of the Company��s management. Our responsibility is to express an opinion on the Company’s financial statements based on our audits. We are a public accounting firm registered with the PCAOB and are required to be independent with respect to the Company in accordance with U.S. federal securities laws and the applicable rules and regulations of the Securities and Exchange Commission and the PCAOB.
We conducted our audits in accordance with the standards of the PCAOB. Those standards require that we plan and perform the audits to obtain reasonable assurance about whether the financial statements are free of material misstatement, whether due to error or fraud. Our audits included performing procedures to assess the risks of material misstatement of the financial statements, whether due to error or fraud, and performing procedures that respond to those risks. Such procedures included examining, on a test basis, evidence regarding the amounts and disclosures in the financial statements. Our audits also included evaluating the accounting principles used and significant estimates made by management, as well as evaluating the overall presentation of the financial statements. We believe that our audits provide a reasonable basis for our opinion.
/s/ Yount, Hyde & Barbour, P.C.
We have served as the Company’s auditor since 2016.
Winchester, Virginia
March 16, 2018
REPORT OF INDEPENDENT REGISTERED PUBLIC ACCOUNTING FIRM
To the Board of Directors and Stockholders
F&M Bank Corp.
Timberville, Virginia
Opinion on the Internal Control over Financial Reporting
We have audited F&M Bank Corp. and subsidiaries' (the Company) internal control over financial reporting as of December 31, 2017, based on criteria established inInternal Control — Integrated Frameworkissued by the Committee of Sponsoring Organizations of the Treadway Commission in 2013. In our opinion, the Company maintained, in all material respects, effective internal control over financial reporting as of December 31, 2017, based on criteria established inInternal Control — Integrated Frameworkissued by the Committee of Sponsoring Organizations of the Treadway Commission in 2013.
We have also audited, in accordance with the standards of the Public Company Accounting Oversight Board (United States) (PCAOB), the consolidated balance sheets as of December 31, 2017 and 2016, and the related consolidated statements of income, comprehensive income, changes in stockholders'shareholders’ equity and cash flows for eachthe years then ended of the three yearsCompany and our report dated March 16, 2018 expressed an unqualified opinion.
Basis for Opinion
The Company’s management is responsible for maintaining effective internal control over financial reporting and for its assessment of the effectiveness of internal control over financial reporting in the periodaccompanyingReport of Management’s Assessment of Internal Control over Financial Reporting. Our responsibility is to express an opinion on the Company’s internal control over financial reporting based on our audit. We are a public accounting firm registered with the PCAOB and are required to be independent with respect to the Company in accordance with U.S. federal securities laws and the applicable rules and regulations of the Securities and Exchange Commission and the PCAOB.
We conducted our audit in accordance with the standards of the PCAOB. Those standards require that we plan and perform the audit to obtain reasonable assurance about whether effective internal control over financial reporting was maintained in all material respects. Our audit included obtaining an understanding of internal control over financial reporting, assessing the risk that a material weakness exists, and testing and evaluating the design and operating effectiveness of internal control based on the assessed risk. Our audit also included performing such other procedures as we considered necessary in the circumstances. We believe that our audit provides a reasonable basis for our opinion.
Definition and Limitations of Internal Control over Financial Reporting
A company's internal control over financial reporting is a process designed to provide reasonable assurance regarding the reliability of financial reporting and the preparation of financial statements for external purposes in accordance with generally accepted accounting principles. A company's internal control over financialreporting includes those policies and procedures that (1) pertain to the maintenance of records that, in reasonable detail, accurately and fairly reflect the transactions and dispositions of the assets of the company; (2) provide reasonable assurance thattransactions are recorded as necessary to permit preparation of financial statements in accordance with generally accepted accounting principles, and that receipts and expenditures of the company are being made only in accordance with authorizations of management and directors of the company; and (3) provide reasonable assurance regarding prevention or timely detection of unauthorized acquisition, use or disposition of the company's assets that could have a material effect on the financial statements.
Because of its inherent limitations, internal control over financial reporting may not prevent or detect misstatements. Also, projections of any evaluation of effectiveness to future periods are subject to the risk that controls may become inadequate because of changes in conditions, or that the degree of compliance with the policies or procedures may deteriorate.
/s/ Yount, Hyde & Barbour, P.C., Winchester, Virginia
March 16, 2018

Report of Independent Registered Public Accounting Firm
To the Board of Directors and Stockholders
F & M Bank Corp. and Subsidiaries
Timberville, Virginia
We have audited the accompanying consolidated statements of income, comprehensive income, changes in stockholders’ equity, and cash flows of F&M Bank Corp. and Subsidiaries (the “Company”) for the year ended December 31, 2015. These consolidated financial statements are the responsibility of the Company'sCompany’s management. Our responsibility is to express an opinion on these consolidated financial statements based on our audits.audit.
We conducted our auditsaudit in accordance with the standards of the Public Company Accounting Oversight Board (United States). Those standards require that we plan and perform the audit to obtain reasonable assurance about whether the financial statements are free of material misstatement. The Company is not required to have, nor were we engaged to perform, an audit of its internal control over financial reporting. Our auditsaudit included consideration of internal control over financial reporting as a basis for designing audit procedures that are appropriate in the circumstances, but not for the purpose of expressing an opinion on the effectiveness of the Company’s internal control over financial reporting. Accordingly, we express no such opinion. An audit also includes examining, on a test basis, evidence supporting the amounts and disclosures in the financial statements, assessing the accounting principles used and significant estimates made by management, as well as evaluating the overall financial statement presentation. We believe that our audits provideaudit provides a reasonable basis for our opinion.
In our opinion, the consolidated financial statements referred to above present fairly, in all material respects, the financial positionresults of F&M Bank Corp. and subsidiaries as of December 31, 2015 and 2014, and theSubsidiaries’ results of their operations and their cash flows for each of the three years in the periodyear ended December 31, 2015, in conformity with U.S. generally accepted accounting principles.principles in the United States of America.
/s/ Elliott Davis, Decosimo, LLCPLLC
March 29, 2016
Item 9. Changes in and Disagreements with Accountants on Accounting and Financial Disclosure
None.
Item 9A. Controls and Procedures
Disclosure Controls and Procedures.The Company, under the supervision and with the participation of management, including the Company’s Chief Executive Officer and Chief Financial Officer, has evaluated the effectiveness of the design and operation of its disclosure controls and procedures as of the end of the period covered by this Annual Report on Form 10-K. Based on that evaluation, the Chief Executive Officer and Chief Financial Officer have concluded that the Company’s disclosure controls and procedures were effective as of December 31, 20152017 to ensure that information required to be disclosed by the Company in reports that it files or submits under the Securities Exchange Act of 1934 is recorded, processed, summarized and reported within the time periods specified in Securities and Exchange Commission rules and forms and is accumulated and communicated to the Company’s management, including its Chief Executive Officer and Chief Financial Officer, as appropriate to allow timely decisions regarding required disclosures.
Changes in Internal Control over Financial Reporting. There were no changes in the Company’s internal control over financial reporting during the Company’s quarter ended December 31, 2017 that have materially affected, or are reasonably likely to materially affect, the Company’s internal control over financial reporting. Because of the inherent limitations in all control systems, the Company believes that no system of controls, no matter how well designed and operated, can provide absolute assurance that all control issues have been detected.
Management’s Report on Internal Control over Financial Reporting.Management is responsible for the preparation and fair presentation of the financial statements included in the annual report. The financial statements have been prepared in conformity with accounting principles generally accepted in the United States of America and reflect management’s judgements and estimates concerning effects of events and transactions that are accounted for or disclosed.
Management is also responsible for establishing and maintaining adequate internal control over financial reporting (as such term is defined in Rule 13a-15(f) and Rule 15d – 15(f) under the Exchange Act). Ourreporting. The Company's internal control over financial reporting includes those policies and procedures that (i) pertain to the maintenance of recordsCompany's ability to record, process, summarize and report reliable financial data. Management recognizes that in reasonable detail, accurately and fairly reflect the transactions and dispositions of our assets; (ii) provide reasonable assurance that transactionsthere are recorded as necessary to permit preparation of financial statements in accordance with generally accepted accounting principles, and that our receipts and expenditures are being made only in accordance with authorizations of our management and directors; and (iii) provide reasonable assurance regarding prevention or timely detection of unauthorized acquisition, use, or disposition of our assets that could have a material effect on the financial statements.
In order to ensure that the Company's internal control over financial reporting is effective, management regularly assesses such controls and did so most recently for its financial reporting as of a specific date, and continued effectivenessDecember 31, 2017. This assessment was based on criteria for effective internal control over financial reporting described in future periods is subject toInternal Control Integrated Framework issued by the risks that controls may become inadequate becauseCommittee of changes in conditions or that the degree of compliance with the policies and procedures may decline.
Item 9A. Controls and Procedures, continued
The Board of Directors, acting through its Audit Committee, is responsible for the oversight of the Company's accounting policies, financial reporting and internal control. The Audit Committee of the Board of Directors is comprised entirely of outside directors who are independent of management. The Audit Committee is responsible for the appointment and compensation of the independent registered public accounting firm and approves decisions regarding the appointment or removal of the Company Auditor. It meets periodically with management, the independent registered public accounting firm and the internal auditors to ensure that they are carrying out their responsibilities. The Audit Committee is also responsible for performing an oversight role by reviewing and monitoring the financial, accounting and auditing procedures of the Company in addition to reviewing the Company's financial reports. The independent registered public accounting firm and the internal auditors have full and unlimited access to the Audit Committee, with or without management, to discuss the adequacy of internal control over financial reporting, and any other matter which they believe should be brought to the attention of the Audit Committee. The Company's independent registered public accounting firm has also issued an attestation report on the effectiveness of internal control over financial reporting.
Item 9B. Other Information
None.
PART III
Item 10. Directors, Executive Officers and Corporate Governance
Information regarding directors, executive officers and the audit committee financial expert is incorporated by reference from the Company’s definitive proxy statement for the Company’s 20162018 Annual Meeting of Shareholders to be held May 14, 201612, 2018 (“Proxy Statement”), under the captions “Election of Directors,” “Board of Directors and Committees,” and “Executive Officers.”
Information on Section 16(a) beneficial ownership reporting compliance for the directors and executive officers of the Company is incorporated by reference from the Proxy Statement under the caption “Section 16(a) Beneficial Ownership Reporting Compliance.”
The Company has adopted a broad based code of ethics for all employees and directors. The Company has also adopted a code of ethics tailored to senior officers who have financial responsibilities. A copy of the codes may be obtained without charge by request from the corporate secretary.
Item 11. Executive Compensation
This information is incorporated by reference from the Proxy Statement under the caption “Executive Compensation.”
Item 12. Security Ownership of Certain Beneficial Owners and Management and Related Stockholder Matters
This information is incorporated by reference from the Proxy Statement under the caption “Ownership of Company Common Stock” and “Executive Compensation” and from Item 5 of this 10-K.
Item 13. Certain Relationships and Related Transactions, and Directors Independence
This information is incorporated by reference from the Proxy Statement under the caption “Interest of Directors and Officers in Certain Transactions.”
Item 14. Principal Accounting Fees and Services
This information is incorporated by reference from the Proxy Statement under the caption “Principal Accounting Fees.”
PART IV
Item 15. Exhibits and Financial Statement Schedules
The following financial statements are filed as a part of this report:
(a)(1) Financial Statements
The following consolidated financial statements and reports of independent auditors of the Company are in Part II, Item 8 on pages 38 thru 79:
| Consolidated Balance Sheets - December 31, | |
| Consolidated Statements of Income - Years ended December 31, | |
| Consolidated Statements of Comprehensive Income - Years ended December 31, | |
| Consolidated Statements of Changes in Stockholders’ Equity – Years ended December 31, | |
Consolidated Statements of Cash Flows - Years ended December 31, 2015 | |
| Notes to the Consolidated Financial Statements | |
(a)(2) Financial Statement Schedules
All schedules are omitted since they are not required, are not applicable, or the required information is shown in the consolidated financial statements or notes thereto.
(a)(3) Exhibits
The following exhibits are filed as a part of this form 10-K:
Exhibit No.
Subsidiaries of the Registrant
Consent of Yount, Hyde & Barbour, P.C.
Consent of Elliott Davis, PLLC
Certification of Chief Executive Officer pursuant to Section 302 of the Sarbanes-Oxley Act of 2002
Certification of Chief Financial Officer pursuant to Section 302 of the Sarbanes-Oxley Act of 2002
Certification of Chief Executive Officer and Chief Financial Officer pursuant to Section 906 of the Sarbanes-Oxley Act of 2002.
101
The following materials from F&M Bank Corp.’s Annual Report on Form 10-K for the year ended December 31, 2017, formatted in Extensible Business Reporting Language (XBRL), include: (i) Consolidated Balance Sheets, (ii) Consolidated Statements of Income, (iii) Consolidated Statements of Comprehensive Income, (iv) Consolidated Statements of Changes in Stockholders’ Equity, (v) Consolidated Statements of Cash Flows and (vi) related notes (furnished herewith).
PART IV
Item 16 Form 10-K Summary
Not Required
Shareholders may obtain, free of charge, a copy of the exhibits to this Report on Form 10-K by writing Larry A. Caplinger, Corporate Secretary, at F & M Bank Corp., P.O. Box 1111, Timberville, VA 22853 or our website at www.fmbankva.com.
SIGNATURES
Pursuant to the requirements of Section 13 or 15(d) of the Securities Exchange Act of 1934, the registrant has duly caused this report to be signed on its behalf by the undersigned, thereunto duly authorized.
F & M Bank Corp.
(Registrant)
| By: | /s/ Dean W. Withers | March 16, 2018 | |||
| Dean W. Withers | Date | ||||
| Director | |||||
| By: | /s/ Carrie A. Comer | March | |||
| Carrie A. Comer | Date | ||||
Pursuant to the requirements of the Securities Exchange Act of 1934, this report has been signed below by the following persons on behalf of the registrant and in the capacities and as of the date indicated.
| Signature | Title | Date | ||
| /s/ Larry A. Caplinger | Director | March | ||
| Larry A. Caplinger | ||||
| /s/ John N. Crist | Director | March | ||
| John N. Crist | ||||
| /s/ Ellen R. Fitzwater | Director, Chair | March | ||
| Ellen R. Fitzwater | ||||
| /s/ Daniel J. Harshman | Director | March | ||
| Daniel J. Harshman | ||||
| /s/ Richard S. Myers | Director | March | ||
| Richard S. Myers | ||||
| /s/ Michael W. Pugh | Director | March | ||
| Michael W. Pugh | ||||
| /s/ Christopher S. Runion | Director | March | ||
| Christopher S. Runion | ||||
| /s/ Ronald E. Wampler | Director | March | ||
| Ronald E. Wampler | ||||
| /s/ E. Ray Burkholder | Director | March | ||
| E. Ray Burkholder | ||||
| /s/ Peter H. Wray | Director | March 16, 2018 | ||
| Peter H. Wray |
102