UNITED STATES
SECURITIES AND EXCHANGE COMMISSION
Washington, D.C. 20549
FORM 10-K
| | | | | |
| ☒ | Annual Report Pursuant to Section 13 or 15(d) of the Securities Exchange Act of 1934 |
For the fiscal year ended December 31, 202129, 2023
OR | | | | | |
| ☐ | Transition Report Pursuant to Section 13 or 15(d) of the Securities Exchange Act of 1934 for the transition period from to |
Commission File Number: 001-33146
KBR, Inc.
(Exact name of registrant as specified in its charter)
| | | | | | | | | | | | | | |
| Delaware | | 20-4536774 |
| (State of incorporation) | | (I.R.S. Employer Identification No.) |
| 601 Jefferson Street, Suite 3400 | Houston | Texas | | 77002 |
| (Address of principal executive offices) | | (Zip Code) |
(713) 753-2000
(Registrant's telephone number including area code)
Securities registered pursuant to Section 12(b) of the Act:
| | | | | | | | |
| Title of each class | Trading Symbol | Name of each exchange on which registered |
| Common Stock par value $0.001 per share | KBR | New York Stock Exchange |
Securities registered pursuant to Section 12(g) of the Act: None
Indicate by check mark if the registrant is a well-known seasoned issuer, as defined in Rule 405 of the Securities Act. Yes ☒ No ☐
Indicate by check mark if the registrant is not required to file reports pursuant to Section 13 or Section 15(d) of the Act. Yes ☐ No ☒
Indicate by check mark whether the registrant (1) has filed all reports required to be filed by Section 13 or 15(d) of the Securities Exchange Act of 1934 during the preceding 12 months (or for such shorter period that the registrant was required to file such reports), and (2) has been subject to such filing requirements for the past 90 days. Yes ☒ No ☐
Indicate by check mark whether the registrant has submitted electronically every Interactive Data File required to be submitted pursuant to Rule 405 of Regulation S-T (§232.405 of this chapter) during the preceding 12 months (or for such shorter period that the registrant was required to submit such files). Yes ☒ No ☐
Indicate by check mark whether the registrant is a large accelerated filer, an accelerated filer, a non-accelerated filer, a smaller reporting company, or an emerging growth company. See the definitions of “large accelerated filer,” “accelerated filer,” “smaller reporting company,” and “emerging growth company” in Rule 12b-2 of the Exchange Act.
| | | | | | | | | | | | | | | | | |
| Large accelerated filer | | ☒ | Accelerated filer | | ☐ |
| Non-accelerated filer | | ☐ | Smaller reporting company | | ☐ |
| | | Emerging growth company | | ☐ |
If an emerging growth company, indicate by check mark if the registrant has elected not to use the extended transition period for complying with any new or revised financial accounting standards provided pursuant to section 13(a) of the Exchange Act ☐
Indicate by check mark whether the registrant has filed a report on and attestation to its management’s assessment of the effectiveness of its internal control over financial reporting under Section 404(b) of the Sarbanes-Oxley Act (15 U.S.C. 7262(b)) by the registered public accounting firm that prepared or issued its audit report ☒
If securities are registered pursuant to Section 12(b) of the Act, indicate by check mark whether the financial statements of the registrant included in the filing reflect the correction of an error to previously issued financial statements. ☐
Indicate by check mark whether any of those error corrections are restatements that required a recovery analysis of incentive-based compensation received by any of the registrant’s executive officers during the relevant recovery period pursuant to §240.10D-1(b) ☐
Indicate by check mark whether the registrant is a shell company (as defined in Rule 12b-2 of the Act). Yes ☐ No ☒
The aggregate market value of the voting stock held by non-affiliates on June 30, 20212023 was approximately $4.8$8.7 billion, determined using the closing price of shares of the registrant's common stock on the New York Stock Exchange on that date of $38.15.$65.06.
As of February 10, 2022,January 26, 2024, there were 139,500,619135,071,541 shares of KBR, Inc. Common Stock, par value $0.001 per share, outstanding.
DOCUMENTS INCORPORATED BY REFERENCE
Portions of the registrant’s Proxy Statement for its 20222024 Annual Meeting of Stockholders are incorporated by reference into Part III of this report.
TABLE OF CONTENTS
Glossary of Terms
The following frequently used abbreviations or acronyms are used in this Annual Report on Form 10-K as defined below:
| | | | | | | | |
| Acronym | | Definition |
| Affinity | | Affinity Flying Training Services Ltd. |
| Aspire Defence | | Aspire Defence Limited |
| AOCL | | Accumulated other comprehensive loss |
ASBCA | | Armed Services Board of Contract Appeals |
| ASC | | Accounting Standards Codification |
| ASU | | Accounting Standards Update |
| | |
BBSYBRIS | | Bank Bill Swap Bid RateBrown & Root Industrial Services Joint Venture |
BrexitC5ISR | | European Union |
C4ISR | | Command, Control, Communications, Computers, Cyber, Intelligence, Surveillance and Reconnaissance |
| Carillion | | Carillion plc
| CAS | | Cost Accounting Standards for U.S. government contracts |
| | |
COFC | | U.S. Court of Federal Claims |
| DCAA | | Defense Contract Audit Agency |
| DCMA | | Defense Contract Management Agency |
| DoD | | Department of Defense |
| DOJ | | U.S. Department of Justice |
| | |
| EAC | | Estimate at completion |
| EBIC | | Egypt Basic Industries Corporation
| EBITDA | | Earnings before interest, taxes, depreciation and amortization |
| EPC | | Engineering, procurement and construction
| | |
| | |
| ERGs | | Employee Resource Groups |
| ES | | Energy Solutions
| ESPP | | Employee Stock Purchase Plan |
| EVP | | Employee Value Proposition |
| Exchange Act | | Securities Exchange Act of 1934, as amended |
| E.U. | | European Union |
| FAR | | Federal Acquisition Regulation |
| FASB | | Financial Accounting Standards Board |
| FCA | | False Claims Act |
| FCPA | | United States Foreign Corrupt Practices Act |
| | |
| FKTC | | First Kuwaiti Trading Company |
| | |
| | |
| | |
| | |
| G&A | | General and administrative |
| GAAP | | Generally Accepted Accounting Principles |
| | |
| GS | | Government Solutions |
| HETs | | Heavy equipment transporters |
| HR | | Human Resources |
| | |
ICC | | International Chamber of Commerce |
| I&D | | Inclusion & Diversity |
| IRS | | Internal Revenue Service |
| JKC | | JKC Australia LNG, an Australian joint venture executing the Ichthys LNG Project |
| LIBOR | | London interbank offered rate |
| LNG | | Liquefied natural gas |
| MD&A | | Management's Discussion and Analysis of Financial Condition and Results of Operations |
| | | | | | | | |
| Acronym | | Definition
MFRs | | Memorandums for Record |
| | |
| MoD | | Ministry of Defence |
| NCI | | Noncontrolling interests |
| NYSE | | The New York Stock Exchange |
| | |
| | |
| OAW | | Operation Allies Welcome |
| PCAOB | | Public Company Accounting Oversight Board |
| PFIs | | Private financed initiatives and projects |
| PIC | | Paid-in capital in excess of par |
| | | | | | | | |
| Acronym | | Definition |
| PPE | | Property, Plant and Equipment |
| | |
| | |
| | |
| RPA | | Master Accounts Receivable Purchase Agreement |
| SEC | | U.S. Securities and Exchange Commission |
| Securities Act | | Securities Act of 1933, as amended |
| | |
| | |
SGTSOFR | | Stinger Ghaffarian Technologies |
SMA | | Scientific Management Associates (Operations) Pty LtdSecured Overnight Financing Rate |
| SONIA | | Sterling Overnight Index Average |
| STS | | Sustainable Technology Solutions |
| Tax Act | | Tax Cuts and Jobs Act |
| | |
| U.K. | | United Kingdom |
| U.S. | | United States |
| U.S. GAAP | | Accounting principles generally accepted in the United States |
| UKMFTS | | U.K. Military Flying Training System |
| VIEs | | Variable interest entities |
| | |
Forward-Looking and Cautionary Statements
This Annual Report on Form 10-K contains certain statements that are, or may be deemed to be, "forward-looking statements" within the meaning of Section 27A of the Securities Act and Section 21E of the Exchange Act. The Private Securities Litigation Reform Act of 1995 provides safe harbor provisions for forward-looking information. Some of the statements contained in this Annual Report on Form 10-K are forward-looking statements. All statements other than statements of historical fact are, or may be deemed to be, forward-looking statements. The words "believe," "may," "estimate," "continue," "anticipate," "intend," "plan," "expect" and similar expressions are intended to identify forward-looking statements. Forward-looking statements include information concerning our possible or assumed future financial performance and results of operations.
We have based these statements on our assumptions and analyses in light of our experience and perception of historical trends, current conditions, expected future developments and other factors we believe are appropriate in the circumstances. Forward-looking statements by their nature involve substantial risks and uncertainties that could significantly affect expected results, and actual future results could differ materially from those described in such statements. While it is not possible to identify all factors, factors that could cause actual future results to differ materially include the risks and uncertainties disclosed under “Item 1A. Risk Factors” contained in Part I and other relevant sections of this Annual Report on Form 10-K.
Many of these factors are beyond our ability to control or predict. Any of thesethe following factors, as well as the risks and uncertainties disclosed under “Item 1A. Risk Factors” contained in Part I of this Annual Report on Form 10-K, and the risk factors and other cautionary statements contained in our other filings with the SEC, or a combination of these factors, could materially and adversely affect our future financial condition or results of operations and the ultimate accuracy of the forward-looking statements. These forward-looking statements are not guarantees of our future performance, and our actual results and future developments may differ materially and adversely from those projected in the forward-looking statements. We caution against putting undue reliance on forward-looking statements or projecting any future results based on such statements or on present or prior earnings levels. In addition, each forward-looking statement speaks only as of the date of the particular statement, and we undertake no obligation to publicly update or revise any forward-looking statement.
Summary Risk Factors
The following is a summary of some of the risks and uncertainties that could materially adversely affect our business, financial condition and results of operations. This summary should be read together with the more detailed description of each risk factor disclosed under "Item 1A. Risk Factors" contained in Part I of this Annual Report on Form 10-K.
Risks Related to Operations of Our Business
•The widespread outbreak of a pandemicAny loss, cancellation or epidemic,delay in one or more projects by our significant customers in the outbreak of an infectious disease, such as COVID-19, has materially impacted how we and our customers operate our business and may materially adverselyfuture could negatively affect our future results of operations and financial performance.
•Our results of operations and cash flows depend on the award of new contracts and the timing of the performance of theseexisting contracts.
•A loss, cancellationOngoing international conflicts, and other geopolitical conditions, may adversely affect our business and results of operations.
•Global pandemics, epidemics, outbreaks of infectious diseases or delay in projects bypublic health crises have disrupted our significant customers in thebusiness and could have a material adverse effect on our future could negatively affect ourresults of operations and financial performance.
•If we are unable to enforce our intellectual property rights, our competitive position could be adversely impacted.
•We may not properly leverage or appropriately invest in technology advancements, which could result in the potential loss of market share and profits.
•If we are unable to attract and retain senior management and key technical professionals with elite skills and appropriate government qualifications, our ability to pursue and compete for projects to grow our business may be adversely affected.
•The nature of our business exposes us to potential liability claims and contract disputes.disputes that may exceed or be excluded from existing insurance coverage.
•Dependence on third-party subcontractors and equipment manufacturers could adversely affect our financial performance on contracts.
•OurWe use of the cost-to-cost method of revenue recognition could resultestimates in a reduction or reversal of previously recordedrecognizing revenues, and profits.if we make changes to estimates used in recognizing revenues, our profitability may be adversely affected.
•We conduct a portion of our operations through joint ventures and partnerships, which exposes us to risks and uncertainties, many of which are outside of our control.
•The nature of our contracts subjects us to risks associated with cost overruns, operating cost inflation and potential claims for liquidated damages.
•The transition period resulting from the Referendum of the United Kingdom's Membership of the European Union could adversely affect our business, financial condition and results of operations.
•We work in locations and on projects where there are high security risks, which could result in harm to our employees, contractors and clients.
•Our backlog of unfilled orders is subject to unexpected adjustments and cancellations.
•We make equity investments in privately financed projects in which we could sustain significant losses.
•We have made and may continue to make business combinations, which may present certain risks and uncertainties.
•International and political events may adversely affect our operations.
•We rely on internalInternal or external cybersecurity or privacy breaches, or systems and external information technology ("IT") systems to conduct our business, and disruption,interruption or failure or security breaches of these systems could adversely affectimpact our businessability to operate or expose us to significant financial losses and results of operations.reputational harm.
•An impairment of all or part of our goodwill or our intangible assets could have a material adverse impact on our net earnings and net worth.
•Our actual results could differ from the estimates and assumptions used to prepare our financial statements.
•We ship a significant amount of cargo using seagoing vessels, exposing us to certain maritime risks.
Risks Related to Our Industry
•The U.S. government awards its contracts through a rigorous competitive process and our efforts to obtain future contracts may be unsuccessful.
•Our profitability and cash flow may vary based on the mix of our contracts and programs, our performance, and our ability to control costs.
•The U.S. government may adopt new contract rules and regulations or revise its procurement practices in a manner adverse to us at any time.
•Heightened competition could impact our ability to obtain contracts which could reduce our market share and profits.
•If we are unable to hire or retain employees with adequate security clearances, we may be unable to perform our U.S. government work.
•Our U.S. government contract work is regularly reviewed and audited and these reviews can lead to withholding or delay of payments to us and other remedies against us.
•Several of our contracts with the U.S. government are classified, which may limit investor insight into portions of our business.
•Demand for our services provided under government contracts are directly affected by spending by our customers.
•Fluctuations in commodity prices may affect our customers’ investment decisions and result in existing project cancellations or delays.
Risks Related to Financial Conditions and Markets
•Current or future economic conditions, including recession or inflation, in the credit markets may negatively affect the ability to operate our business.or our customers’ businesses, finance working capital, implement our acquisition strategy and access our cash and short-term investments.
•We may be unable to obtain new contract awards if we are unable to provide our customers with letters of credit, surety bonds or other credit enhancements.
•Our Senior Credit Facility imposes restrictions that limit our operating flexibility and may result in additional expenses.
•Our indebtedness and the associated covenants could materially adversely affect our ability to obtain additional financing.
•We may be required to contribute additional cash to meet our significant underfundedany unfunded benefit obligations associated with defined benefit plans we manage.
•We are subject to foreign currency exchange risks.
Risks Related to Our Common Stock
•If we need to sell or issue additional shares of common stock to refinance existing debt or to finance future acquisitions, our existing shareholder ownership could be diluted.
•Provisions in our charter documents, Delaware law and our Senior Credit Facility may inhibit a takeover or impact operational control that could adversely affect the value of our common stock.
•We may change our dividend policy in the future.
Risks Related to Regulations and Compliance
•We could be adversely impacted if we fail to comply with international export and domestic laws.
•We are subject to anti-bribery laws in the U.S. and other jurisdictions, violations of which could result in suspension or debarment of our ability to contract with governments.
•Certain of our work sites are inherently dangerous and we are subject to various environmental and worker health and safety laws and regulations.
•Our effective tax rate and tax positions may vary.
Risks Related to Climate Change
•There is a rapidly evolving awareness and focus from stakeholders with respect to global climate change and the related emphasis on environmental, social and governance practices, which could affect our business.
•Climate change and related environmental issues could have a material adverse impact on our business, financial condition and results of operations.
•We may be unable to achieve our sustainability commitments and targets which could result in the loss of investors and customers and damage to our reputation.
PART I
Item 1. Business
Company Overview
KBR, Inc., a Delaware corporation ("KBR" or, the "Company"), delivers science, technology, engineering and engineeringlogistics support solutions to governments and companies around the world. Drawing from its rich 100-year history and culture of innovation and mission focus, KBR creates sustainable value by combining deep domain expertise with its full-life cycle capabilities to help clients meet their most pressing challenges. Our capabilities and offerings include the following:
•Scientific research such as quantum science and computing; health and human performance; materials science; life science research; and earth sciences;
•Defense systems engineering such as rapid prototyping; test and evaluation; aerospace acquisition support; systems and platform integration; and sustainment engineering;
•Operational support such as space domain awareness; C4ISR;C5ISR; human spaceflight and satellite operations; integrated supply chain and logistics; and military aviation support;
•Information operations such as cyber analytics and cybersecurity; data analytics; mission planning systems; virtual/augmented reality and technical training; and artificial intelligence and machine learning;
•Professional advisory services across the defense, renewable energy and critical infrastructure sectors; and
•TechnologySustainable decarbonization solutions that accelerate and enable energy transition and climate change solutions such as proprietary, sustainability-focused process licensing; advisory services focused on energy transition; high-end engineering, design and management program offerings; and digitally-enabled asset optimization solutions.
Our Business
Our people leverage dynamic teams that combine deep mission understanding, market-leading technical expertise and an unwavering operational focus to deliver solutions to solve our clients’ most complex issues. In 2021,2023, KBR’s operating model continued to shift toward agile, technology-driven, solutions-oriented delivery and was streamlined to increase strategic focus to move upmarket into differentiated areas that we believe will provide attractive returns and consistent growth with favorable cash conversion. The Company has also transitioned away from higher risk, volatile and increasingly commoditized markets.
Our key areas of strategic focus are as follows:
•Government. KBR delivers a wide range of professional services acrossfull life-cycle support solutions to defense, intelligence, space, aviation and other programs and missions for military and other government agencies primarily in the U.S., the U.K. and Australia under long-term programs with key technical, scientific or mission-specific differentiation. KBR's services cover the full spectrum spanning research and development, advanced prototyping, acquisition support, systems engineering, C4ISR,systems assurance and technology, C5ISR, cyber analytics, space domain awareness, test and evaluation, systems integration and program management, global supply chain management, digital transformation and operations readiness and support. These services are provided primarily to government agencies in the U.S., the U.K. and Australia under long-term programs with key technical, scientific or mission-specific differentiation. Key customers include U.S. Department of Defense (“DoD”)DoD agencies such as the U.S. Army, U.S. Navy and U.S. Air Force, Missile Defense Agency, National Geospatial-Intelligence Agency, National Reconnaissance Office and other intelligence agencies; U.S. civilian agencies such as NASA, U.S. Geological Survey and National Oceanic and Atmospheric Administration; the U.K. Ministry of Defence (“MoD”),MoD, London Metropolitan Police, other U.K. Crown Services; the Royal Australian Air Force, Navy and Army; and other national governments. Areas of long-term strategic focus include defense modernization, space superiority and health and human performance.
•Sustainable Technology. Consistent with our corporate focus towards sustainability, KBR continues to develop and prioritize investment in commercial process technologies that are innovative, proprietary and sustainability-focused. We market high-end advisory solutionsand consulting services focused on broad-based energy transition and net-zero carbon emission solutions; high-end engineering, design and program management centered around decarbonization, energy transition, license process technologies, provide basic engineeringefficiency, environmental impact and design services, sell proprietary equipmentasset optimization; and catalystsdigitally-enabled operating and provide asset optimization and remote facility-operations monitoring.monitoring solutions. Key customers include national governments,commercial and industrial companies and oil and gas companies. Areas of long-term
strategic focus include sustainable technology solutions, energy transition, energy security and technology-led asset optimization.
Competitive Advantages
We operate in global markets with customers who demand innovation, technical and domain expertise and digitally-enabled, technology-led sustainable solutions. We seek to differentiate ourselves in areas in which we believe we have a competitive advantage, including:
•People
◦Distinctive, mission-focused and inclusive team ethos and culture, which we refer to as “One KBR”.
◦Deep domain expertise resident across nationally recognized subject matter experts.
◦Highly-cleared employee base.Employee base that includes individuals with high-level security clearance.
•Sustainability Leadership
◦Our Zero Harm philosophy includes ten key areas of sustainability focus across our company and correspond with the United Nations’ (U.N.) Sustainable Development Goals (SDGs).
◦As signatories to the U.N. Global Compact, we align our business with the U.N. SDGs that serve as a benchmark for accomplishing our sustainability goals.
◦We have a dedicated Global Sustainability Committee made up of leaders from across key corporate and business functions, and the Chair of that Committee reports quarterly to the Board.
◦Achieved carbon neutrality from 2019 and established a 2030 operational net-zero carbon ambition.
◦Based on our Science Based Targets Initiative commitments, we have set preliminary reduction targets in line with a 1.5 degree Celsius ambition. These targets include a 25% reduction in business travel, renewable energy agreements and certifications and increasing our green fleets.
◦We have a dedicated Net Zero Roadmap project team working with each section of the business to measure and monitor GHG emissions for developing discrete and tailored reduction programs, alongside the corporate level reduction plans and targets.
◦As an industry leader, we have and will continue to invest in the development of disruptive, innovative clean energy solutions that promote a cleaner, greener future and a sustainable world.
◦World leader in ammonia technology, a leading hydrogen energy enabler, with a fully developed, proprietary, end-to-end green ammonia solution K-GreeNTM.K-GreeNTM.
◦Exclusive licensor of Cat-HTRTM, an innovative, disruptive mixed plastics recycling technology that processes all types of plastic including many that are currently considered unrecyclable, and Hydro-PRTTM,Hydro-PRTTM, a cutting-edge, scalable technology that utilizes supercritical steam to convert a wide range of single-use and other plastics into virgin-grade feedstocks used to produce new plastics, delivering a truly circular economy.
◦Safe and responsible operations are essential, and our Zero Harm culture prioritizes the safety and security of our people as well as the active management of our environmental impact.
•Technical Excellence and Digital Solutions
◦Innovative, sustainable, proprietary process technology, expertise and solutions.
◦Innovative digital solutions and advanced capabilities to improve operations, reliability and environmental impact, including machine learning and artificial intelligence.
◦Virtual and augmented reality visualizations to provide greater perspectives, insights and training in a controlled environment.
•Customer Relationships
◦Customer missions and objectives are placed at the center of our planning and delivery model.
◦Decades of enduring relationships with government and commercial client base.
•Financial Strength
◦Diverse portfolio of multi-year, mission critical programs creating stability and resilience.
◦Low capital intensity business model generating favorable operating cash flows.
◦Strong liquidity with ample capacity for growth.
Our Business Segments
We provide a wide range of professional services and the management of our business is heavily focused on major projects or programs within each of our reportable segments. At any given time, government programs and joint ventures represent a substantial part of our operations. Our business is organized into two core business segments and one non-core business segment as follows:
Core business segments
•Government Solutions ("GS")
•Sustainable Technology Solutions ("STS")
Non-core business segment
•Other
Our business segments are described below.
Government Solutions. Our Government Solutions business segment provides full life-cycle support solutions to defense, intelligence, space, aviation and other programs and missions for military and other government agencies primarily in the U.S., U.K. and Australia. KBR's services cover the full spectrum spanning research and development, advanced prototyping, acquisition support, systems engineering, C4ISR,C5ISR, cyber analytics, space domain awareness, test and evaluation, systems integration and program management, global supply chain management, and operations readiness and support. With the acquisition of Frazer-Nash Consultancy Limited ("Frazer-Nash") on October 20, 2021 (described in Note 4 to the consolidated financial statements), our GS business segment also provides a broad range ofsupport and professional advisory services to deliver high-end systems engineering, systems assurance and technology to customers across the defense, renewable energy and critical infrastructure sectors primarily in the U.K. and Australia.sectors.
Sustainable Technology Solutions. Our Sustainable Technology Solutions business segment is anchored by our portfolio of over 7080 innovative, proprietary, sustainability-focused process technologies that we license spanningaccelerate and enable energy transition across the industrial base in four primary areas:verticals: ammonia/syngas/fertilizers,syngas, chemical/petrochemicals, clean refining and circular process/circular economy solutions. STS also includes ourprovides highly synergistic services including advisory and consulting practice focused on broad-based energy transition and net-zero carbon emission consulting, oursolutions, high-end engineering, design and professional services offerings,program management centered around decarbonization, energy efficiency, environmental impact and asset optimization, as well as our technology-led industrial solutions built on our KBR INSITE® platform. KBR INSITE® is a proprietary, digital, cloud-based operationsdigitally-enabled operating and maintenance platform that identifies opportunities for our clients to achieve sustainable improvements in production, reliability, environment impact, energy efficiency and ultimately profitability. Frommonitoring solutions. Through early planning throughand scope definition, advanced technologies and facility life-cycle support,optimization, our STS business segment works closely with customers to provide what we believe is the optimal approach to maximize their return on investment.
Other. Our non-core Other segment includes corporate expenses and selling, general and administrative expenses not allocated to the core business segments above.
Significant Customers
We provide services to a diverse customer base, including domestic and foreign governments and commercial and industrial companies.
We generate significant revenues within our GS business segment from key U.S. government customers including U.S. DoD and NASA, and from the U.K government. No other customers represented 10% or more of consolidated revenues in any of the periods presented. The following table summarizes our revenues from contracts with U.S. and U.K. government agencies.agencies for which we are the prime contractor, as well as for those contracts in which we are a subcontractor and the ultimate customer is a U.S. or U.K. government agency, respectively.
| | | | | | | | | | | | | | | | | | | | | | | | | | | | | | | | | | | |
| Revenues and percent of consolidated revenues attributable to major customers by year: |
| | Years ended December 31, |
| Dollars in millions, except percentage amounts | 2021 | | 2020 | | 2019 |
| U.S. government (all agencies) | $ | 5,122 | | | 70 | % | | $ | 3,079 | | | 53 | % | | $ | 3,014 | | | 53 | % |
| U.K. government (all agencies) | $ | 508 | | | 7 | % | | $ | 573 | | | 10 | % | | $ | 659 | | | 12 | % |
| | | | | | | | | | | | | | | | | | | | | | | | | | | | | | | | | | | |
| Revenues and percentage of consolidated revenues from major customers: |
| | Years ended, |
| December 29, | | December 31, | | December 31, |
| Dollars in millions | 2023 | | 2022 | | 2021 |
| U.S. government | $ | 4,000 | | | 58 | % | | $ | 4,034 | | | 61 | % | | $ | 5,122 | | | 70 | % |
| U.K. government | $ | 634 | | | 9 | % | | $ | 584 | | | 9 | % | | $ | 508 | | | 7 | % |
Information relating to our customer concentration is described in “Item 1A. Risk Factors” contained in Part I of this Annual Report on Form 10-K. Also, see further explanations in "Item 7. Management’s Discussion and Analysis of Financial Condition and Results of Operations" contained in Part II of this Annual Report on Form 10-K and Note 31 to our consolidated financial statements in Part II, Item 8 of this Annual Report on Form 10-K.
Recent Developments
Frazer-Nash Acquisition
On October 20, 2021, we acquired Frazer-Nash, a leading provider of high-end systems engineering, assurance and technology advisory services used to solve complex challenges. Frazer-Nash provides a broad range of professional advisory services across the defense, renewable energy and critical infrastructure sectors primarily in the U.K. and Australia. With expertise in areas such as systems engineering, data science, cyber and clean energy, Frazer-Nash compliments KBR's global priorities with minimal overlap because of its geographic footprint. Additional information relating to the Frazer-Nash acquisition is described in Part II of this Annual Report on Form 10-K in Note 4 to our consolidated financial statements.
HomeSafe Alliance LLC Contract Award
In November 2021, we announced that HomeSafe Alliance LLC (“HomeSafe”), a KBR led joint venture, was awarded the global household goods contract by U.S. Transportation Command. The contract ceiling value is $20 billion with a potential 9-year term, inclusive of all options periods. HomeSafe is expected to be the exclusive household goods move management service provider for the U.S. Armed Forces, Department of Defense civilians and their families. Under this contract, HomeSafe plans to modernize and infuse technology to improve the domestic and international relocation experience for all military personnel and their families. The contract award is currently under protest.
Significant Joint Ventures and Alliances
We enter into joint ventures and alliances with other reputable industry participants to capitalize on the strengths of each party, and provide greater flexibility in delivering our services based on expertise, cost and geographical efficiency, increase the number of opportunities that can be pursued, and reduce exposure and diversify risk. Our significant joint ventures and alliances are described below. All joint venture ownership percentages presented are stated as of December 31, 2021.29, 2023.
Aspire Defence Limited, a joint venture owned by KBR and two financial investors, provides a range of facilities life cycle management services at the British Army’s garrisons at Aldershot and across the Salisbury Plain in the U.K. KBR owns 45% of Aspire Defence Limited that is reported within our GS business segment using the equity method of accounting.
In 2016, we established the Affinity joint venture with Elbit Systems Ltd. to procure, operate and maintain aircraft and aircraft-related assets over an 18-year contract period, in support of the UKMFTS project. KBR owns a 50% interest in Affinity. In addition, KBR owns a 50% interest in the two joint ventures, Affinity Capital Works and Affinity Flying Services, which provide procurement, operations and management support services under subcontracts with Affinity. The investments are accounted for within our GS business segment using the equity method of accounting.
Brown & Root Industrial Services is a joint venture with Bernhard Capital Partners and offers maintenance services, turnarounds and small capital projects, primarily in North America, in which we own 50% equity interest. The investment is accounted for within our STS business segment using the equity method of accounting.
JKC Australia LNG is a joint venture contracted to perform the engineering, procurement, supply, construction and commissioning of onshore LNG facilities for a client in Darwin, Australia. The project is being executed through two entities (collectively, "JKC"), which are VIEs, in which we own a 30% equity interest. The investment is accounted for within our STS business segment using the equity method of accounting.
KZJV is a joint venture with Zachary Group that performs certain design, engineering, procurement and construction-related services for a LNG facility in Plaquemines Parish, Louisiana. KBR owns a 45% interest in KZJV, which is a VIE. The investment is accounted for within our STS business segment using the equity method of accounting.
HomeSafe, a KBR led joint venture with Tier One Relocation, was established to be the exclusive provider of household goods move management services for the U.S. Armed Forces, U.S. DoD civilians and their families. KBR owns a 72% interest in HomeSafe. The joint venture is a VIE that is consolidated for financial reporting purposes and is accounted for within our GS business segment.
Additional information relating to our joint ventures is described in Part II of this Annual Report on Form 10-K in Note 9 to our consolidated financial statements.
Backlog of Unfulfilled Orders
Backlog is our estimate of the U.S. dollar amount of future revenues we expect to realize as a result of performing work on awarded contracts. For projects within our unconsolidated joint ventures, we have included our percentage ownership of the joint venture’s estimated revenues in backlog to provide an indication of future work to be performed. The future revenues we expect to realize as a result of backlog was $15.0were $17.3 billion and $15.1$15.6 billion as of December 29, 2023 and December 31, 2021 and 2020,2022, respectively, with approximately 17%24% and 16%25%, respectively, related to work being executed by joint ventures accounted for using the equity method of accounting. We estimate as of December 31, 2021,29, 2023, 30% of our backlog will be recognized as revenues or equity in earnings of unconsolidated affiliates within fiscal year 2022.2024. For additional information regarding backlog, see our discussion within “Item 7. Management’s Discussion and Analysis of Financial Condition and Results of Operations” contained in Part II of this Annual Report on Form 10-K.
Government Contracts and Regulations
Our business is heavily regulated. We contract with numerous U.S. government agencies and entities, principally the U.S. DoD and NASA. When working with these and other U.S. government agencies and entities, we must comply with various laws and regulations relating to the formation, administration and performance of contracts. U.S. government contracts are generally subject to the FAR, which sets forth policies, procedures and requirements for the acquisition of goods and services by the U.S. government, other agency-specific regulations that implement or supplement the FAR, such as the DoD FAR Supplement ("DFARS"), and other applicable laws and regulations. These regulations impose a broad range of requirements, many of which are unique to government contracting, including various procurement, import and export, security, contract pricing and cost, contract termination and adjustment and audit requirements. Among other things, these laws and regulations:
•require certification and disclosure of all cost and pricing data in connection with certain contract negotiations;
•define allowable and unallowable costs and otherwise govern our right to reimbursement under various cost-type U.S. government contracts;
•require compliance with CAS;
•require reviews by the DCAA, DCMA and other regulatory agencies for compliance with a contractor’s business systems;
•restrict the use and dissemination of and require the protection of unclassified contract-related information and information classified for national security purposes and the export of certain products and technical data; and
•prohibit competing for work if an actual or potential organizational conflict of interest, as defined by these laws and regulations, related to such work exists and/or cannot be appropriately mitigated, neutralized or avoided.
Our GS business segment primarily performs work under cost-reimbursable contracts in the U.S. with the DoD and other U.S. governmental agencies. If the U.S. government concludes costs charged to a contract are not reimbursable under the terms of the contract or applicable procurement regulations, these costs are disallowed or, if already reimbursed, we may be required to refund the reimbursed amounts to the customer. Such conditions may also include interest and other financial penalties. If performance issues arise under any of our government contracts, the customer retains the right to pursue remedies, which could include termination under any affected contract. Generally, our customers have the contractual right to terminate or reduce the amount of work under our contracts at any time. For more information, see “Item 1A. Risk Factors” contained in Part I of this Annual Report on Form 10-K.
Our GS business segment also participates in PFI contracts, such as the Aspire Defence and UKMFTS projects. PFIs are long-term contracts that outsource the responsibility for the construction, procurement, financing, operation and maintenance of government-owned assets to the private sector. These contracts may contain both fixed-price and cost-reimbursable elements. The PFI projects in which KBR participates are all located in the U.K. with contractual terms ranging from 15 to 35 years and involve the provision of services to various types of assets ranging from acquisition and maintenance of major military equipment and housing to transportation infrastructure. Under most of these PFI contracts, the primary deliverables of the contracting entity are the initial construction or procurement of assets for the customer and the subsequent provision of lifecycle management services for the life of such assets. The amount of renumeration from the customer to the contracting entity is negotiated on each contract and varies depending on the specific terms for each PFI.
Contract Types
The Company performs work under contracts that broadly consist of fixed-price, cost-reimbursable, time-and-materials or a combination of the three.
Fixed-price contracts include both lump-sum and unit-rate contracts. Under lump-sumfixed-price contracts, we perform a defined scope of work for a specified fee to cover all costs and any profit element. Lump-sumFixed-price contracts entail significant risk to us because they require us to predetermine the work to be performed, the project execution schedule and all the costs associated with the scope of work. Unit-rateAdditionally, unit-rate contracts are essentially fixed-price contracts with the only variable being units of work to be performed. Further, our fixed-price contracts may include cost escalation and other features that allow for increases in price should certain events occur or conditions change. Fixed-price contracts are typically subject to change orders if the scope of work changes or unforeseen conditions arise resulting in adjustments to the fixed price. Although fixed-price contracts involve greater risk than cost-reimbursable contracts, they also are potentially more profitable because the owner/customer pays a premium to transfer project risks to us.
Time-and-materials contracts typically provide for negotiated fixed hourly rates for specified categories of direct labor. The rates cover the cost of direct labor, indirect expense and fee. These contracts can also allow for reimbursement of cost of
material plus a fee, if applicable. In U.S. government contracting, this type of contract is generally used when there is
uncertainty of the extent or duration of the work to be performed by the contractor at the time of contract award or it is not possible to anticipate costs with any reasonable degree of confidence. With respect to time-and-materials contracts, we assume the price risk because our costs of performance may exceed negotiated hourly rates. In commercial and non-U.S. government contracting, this contract is generally used for defined and non-defined scope contracts where there is a higher degree of uncertainty and risks as to the scope of work. These types of contracts may also provide for a guaranteed maximum price where the total cost plus the fee cannot exceed an agreed upon guaranteed maximum price or not-to-exceed provisions.
Under cost-reimbursable contracts, the price is generally variable based upon our actual allowable costs incurred for materials, equipment, reimbursable labor hours, overhead and G&A expenses. Profit on cost-reimbursable contracts may be in the form of a fixed fee or a mark-up applied to costs incurred, or a combination of the two. The fee may also be an incentive fee based on performance indicators, milestones or targets and can be based on customer discretion or in the form of an award fee determined based on customer evaluation of the Company's performance against contractual criteria. Cost-reimbursable contracts may also provide for a guaranteed maximum price where the total fee plus the total cost cannot exceed an agreed upon guaranteed maximum price. Cost-reimbursable contracts are generally less risky because the owner/customer retains many of the project risks, however it generally requires us to use our best efforts to accomplish the scope of the work within a specified time and budget. Cost-reimbursable contracts with the U.S. government are generally subject to the FAR and are competitively priced based on estimated or actual costs of providing the contractual goods or services. The FAR provides guidance on types of costs that are allowable in establishing prices for goods and services provided to the U.S. government and its agencies. Pricing for non-U.S. government agencies and commercial customers is based on specific negotiations with each customer.
Raw Materials and Suppliers
Equipment and materials essential to our business are obtained from a variety of global sources. The principal equipment and materials we use in our business are subject to availability and price fluctuations due to customer demand, producer capacity and market conditions. We monitor the availability and price of equipment and materials on a regular basis. Our procurement function seeks to leverage our size and buying power to ensure that we have access to key equipment and materials at low prices and ideal delivery schedules. While the ongoing COVID-19 pandemic haspolitical and economic conditions and regional conflict and war have resulted in significant supply chain disruptions and inflation globally and within the United States that are still ongoing, we have not experienced, and do not anticipate experiencing, any significant procurement difficulties, as we purchase our required materials and equipment from a variety of sources. However, a number of factors that we may not be able to predict or control could result in increased costs for these materials including the continued impact of the ongoing COVID-19 pandemic, as well as global trade relationships, regional conflict and wars and other general market and political conditions. These potential increased costs could reduce profitability on our contracts, particularly those that are fixed price. See “Item 1A. Risk Factors” contained in Part I of this Annual Report on Form 10-K for more information.
Intellectual Property
The use of intellectual property generally benefits our STS business segment. We have developed, acquired or otherwise have the right to license leading technologies, including technologies held under license from third parties, used for the production of a variety of petrochemicals and chemicals and in the areas of olefins, refining, fertilizers, coal gasification, semi-submersibles and specialty chemicals. We also license a variety of technologies for the transformation of raw materials into commodity chemicals such as phenol which is used in the production of consumer end products. In addition, we are a licensor of ammonia process technologies used in the conversion of natural gas to ammonia with a fully developed, proprietary, end-to-end green ammonia solution K-GreeNTM. We are the exclusive licensor of Hydro-PRTTM, a cutting-edge, scalable technology that utilizes supercritical steam to convert a wide range of single-use and other plastics into commercial raw materials used to produce new plastics. In 2023, we launched our Sustainable Aviation Fuel technology to extend our decarbonization efforts into the aviation sector. We also offer technologies for crystallization and evaporation, concentration and purification of strong inorganic acids. We believe our technology portfolio and experience in the commercial application of these technologies and our related know-how differentiates us, enables our sustainability strategy and enhances our margins.
Our rights to make use of technologies licensed to us are governed by written agreements of varying durations, including some with fixed terms that are subject to renewal based on mutual agreement. Generally, each agreement may be further extended and we have historically been able to renew existing agreements before they expire. We expect these and other similar agreements to be extended so long as it is mutually advantageous to both parties at the time of renewal. For technologies we own, we protect our rights, know-how and trade secrets through patents and confidentiality agreements.
Seasonality
Our operations are not generally affected by seasonality. However, various factors can affect the distribution of our sales between accounting periods, including the timing of government awards, the availability of government funding, product deliveries and customer acceptance. Additionally, weather and natural phenomena can temporarily affect the performance of our services.
Environmental Regulation
Our business involves planning, design, program management, construction and construction management and operations and maintenance at various project sites throughout the world, including oil field and related energy infrastructure construction services,which may be in and around sensitive environmental areas, such as rivers, lakes and wetlands. Our operations may require us to manage, handle, remove, treat, transport and dispose of toxic or hazardous substances, which are subject to stringent and complex laws relating to the protection of the environment and prevention of pollution.environmental protection.
Significant fines, penalties and other sanctions may be imposed for non-compliance with environmental and worker health and safety laws and regulations, and some laws provide for joint and several strict liabilities for remediation of releases of hazardous substances, rendering a person liable for environmental damage, without regard to negligence or fault on the part of such person. These laws and regulations may expose us to liability arising out of the conduct of operations or conditions caused by others, or for our acts that were in compliance with all applicable laws at the time these acts were performed. For example, there are a number of governmental laws that strictly regulate the handling, removal, treatment, transportation and disposal of toxic and hazardous substances, such as the Comprehensive Environmental Response Compensation and Liability Act of 1980, and comparable national and state laws that impose strict, joint and several liabilities for the entire cost of cleanup, without regard to whether a company knew of or caused the release of hazardous substances. In addition, some environmental regulations can impose liability for the entire clean-up costs on owners, operators, transporters and other persons arranging for the treatment or disposal of such hazardous substances costs related to contaminated facilities or project sites. Other environmental laws applicable to our and customers' operations affecting us include, but are not limited to, the Resource Conservation and Recovery Act, the National Environmental Policy Act, the Clean Air Act, the Clean Water Act, the Occupational Safety and Health Act and the Toxic Substances Control Act as well as other comparable foreign and state laws. Liabilities related to environmental contamination or human exposure to hazardous substances or a failure to comply with any applicable environmental and worker health and safety laws and regulations could result in substantial costs to us, including cleanup costs, fines, civil or criminal sanctions, third-party claims for property damage, personal injury or cessation of remediation activities.
Additional information relating to environmental regulations is described in "Item 1A. Risk Factors” contained in Part I of this Annual Report on Form 10-K and in Note 1413 to our consolidated financial statements.
Human Capital Management
AcrossEvery day, the people of KBR 2021 has been known as ‘the yearhelp solve some of the world’s most challenging scientific, technological and engineering problems. From our promising new interns to world-renowned experts, this diverse Team of Teams delivers for our customers, so in turn, we put them first. At the end of 2023, we employed approximately 34,000 people performing diverse, complex and mission critical roles in over 30 countries. In addition, our unconsolidated joint ventures employ approximately 9,000 employees.
Our Employee Value Proposition ("EVP") is the unique set of experiences and offerings that help differentiate KBR from other competitors for our employees’ time and talents and describes in practical terms how we put our people first.
Purpose & Values
At the center of our people’. We enteredEVP is Purpose, because at KBR, we do work that matters, helping to solve the year with ambitious plans to build on our empowering culture, enhance our employee experience and ensure that we deserve our reputation as an employer of choice. Through the combined effortsgreat challenges of our employees and leadership team, this bold initiative has already resulted in tangible benefits for our people and the business, helping us realize ourtime while striving to create a better, safer, more sustainable world. Our vision is to bring together the best and brightest employees to deliver technology and solutions that help our customers accomplish their most critical missions and objectives.objectives, and this important work enables us to attract and retain some of the world’s best talent, who thrive in this purposeful environment.
CultureOur Values unite us across our diverse global cultures, guiding our behavior and Valuesdecision making throughout KBR. We have embedded our values in our business processes, established them as a foundation for our learning and development activities and regularly celebrate employees who epitomize our values-led behavior. Our employees have told us that their experience is aligned to our values even in the ‘new normal’ of a hybrid and flexible working environment.
We refreshedWhile our One KBR Values unite us, as a global business operating in late 2020, as follows:distinct markets and environments, we recognize and respect that our cultures are different. Acknowledging this diversity, our sustainability culture weaves a golden thread through KBR. Our employees take enormous pride in being part of an organization with a philosophical, practical and proven commitment to Zero Harm.
Health and Safety
•We Value Our People
•We Deliver
•We Are People of Integrity
•We Empower
•We Are a Team of Teams
We brought these to life early in 2021 by a cascade of conversations between managers and their teams in every business and market. Our aim was to lift our values off the page and into our employees’ local experience, identifying any areas for improvement and building on our existing strengths. This concerted effort was underpinned by a review of our people processes to ensure these reflect our culture and values, resulting in updates to selection and exit interviews, job descriptions and training collateral. We then tested how embedded the values are through our global ‘People Perspectives’ employee survey, achieving high scores in each value area. This positive feedback about our organizational culture is particularly encouraging as many employees continued to work remotely through the pandemic. However, we are not complacent. Leaders across KBR continue to consciously reinforce our values through their everyday behavior and to proactively engage and communicate with their teams as hybrid working arrangements become the new normal.
Employee Health & Safety
We are subject to numerous worker health and safety laws and regulations. InOur commitment to the U.S., these laws and regulations include the Federal Occupational Safety and Health Act and comparable state legislation, the Mine Safety and Health Administration lawshealth and safety requirements of the Departments of State, Defense, Energy and Transportation of the U.S. government. We are also subject to similar requirements in other countries in whicheach employee as well as anyone we have extensive operations, including the U.K. where we are subject to the various regulations enacted by the Health and Safety Act of 1974. These laws and regulations are frequently changing, and it is impossible to predict with certainty the effect of such laws and regulations on us in the future.
Our global Zero Harm culture encompasses ten sustainability pillars. The central pillar is Health Safety & Security and is supported by the key Zero Harm principle of “Courage to Care,” which we define as the willingness to intervene when one observes something that does not meet acceptable standards. We believe our Zero Harm culture has resulted in a work environment that promotes employee engagement and ownership. Although we have experienced significant improvement in our safety performance indicators, we cannot guarantee that our efforts will always be successful and from time to time we may experience incidents or unsafe work conditions or practices may arise. Our project sites often put our employees and others in proximity with mechanized equipment, moving vehicles, chemical and manufacturing processes and highly regulated materials. Additionally, our employees and others at certain project sites may be exposed to severe weather events or high security risks. We actively seek to maintain a safe, healthy and environmentally sound workplace for all of our employees and those who work with us. Consequently, we may incur substantial costs to maintainis the safety and securityfoundation of our personnel in these locations.
COVID-19
As the dynamic impacts of the pandemic continued to affect all businesses and markets throughout 2021, the employees of KBR have been reassured by our robust safety protocols, which are founded on our Zero Harm culture. Our people are resilient, and while personal and operational challenges have persisted, they continuedWe know that our employees’ willingness to provide excellent serviceimplement each commitment into their daily work tasks is vital to our customers.
During 2021, we introduced a requirement for all people attending KBR sitesoperations and has contributed to be fully vaccinated, or by exception to undertake daily testing, to safeguard the health of visitors and colleagues. Safety protocols remained in place, such as social
distancing and wearing masks, and this safe environment has enabled large numbers of employees previously working from home to return to the workplace in accordance with local pandemic guidance. In the US, we prepared early for the Executive Order for Federal Contractors, and by the end of 2021, 95% of affected employees were either vaccinated or had approved accommodations in place and underway.
Mental Health & Fitness
During 2021, our focus on employee wellbeing to enable peakstrong safety performance continued, and our Mental Health & Wellbeing Committee and Employee Resource Group ("ERG"), OK NoW ("Network of Well-Being"), took significant strides implementing our wellbeing strategy. A structured communication program, global roll-out of training to over 700 managers and expansion of our Wellbeing Ambassadors program to over 9,000 employees have helped create an environment where employees can thrive and perform at their best. We also provide all employees and their families with free 24/7 access to a first-rate employee support program and a mental fitness app to help track and support their mental health and resilience. These efforts have resulted in a supportive environment as evidenced in our global survey results, where we achieved a high Wellbeing Index score.
Organization Agility
KBR continues to grow organically and through acquisition, while remaining agile and restructuring where required to support our long-term strategy. At the end of 2021, we employed approximately 28,000 people performing diverse, complex and mission critical roles in 34 countries. In addition, our unconsolidated joint ventures employ approximately 10,000 employees.
With a fundamental focus onamong our customers, our working practices adapt to their projectspartners and priorities while empowering our employees to balance personal and work commitments through increasing adoption of flexible working practices. This agile working approach has also supported our Inclusion & Diversity journey, allowing us to recruit from global and diverse talent pools. Responses to our global survey demonstrated that this modern approach resonates with our employees, with a majority saying they are able to balance their work and personal lives and have the flexibility to take time off while still meeting the needs of our fast-paced, customer-focused organization.
peers.
Talent Acquisition
In 2021, we hired almost 6,000 employees, and while some markets found candidates in shorter supply, we maintained a strong applicant flow by clearly articulating our EVP, running social media campaigns highlighting KBR’s unique culture and values and showcasing the important work our employees perform across the world.
Teams of experts from across KBR reviewed our onboarding and hiring processes to ensure best practices are adopted in all business areas and we expanded our use of digital talent platforms to monitor candidate supply and demand in real time. During the year, we instituted unconscious bias training for all new recruiters and managers and undertook a concerted effort of outreach to diverse candidates, including recruitment at historically black colleges and universities and veteran hiring events. We have also begun to track the progress of diverse candidates through our HR information systems, which showed that 30% of our new hires were women and 49% were Black, Indigenous or people of color.
Inclusion & Diversity
The leadership team atsix core processes that comprise our Transactional Health, Safety, Security, Environmental ("HSSE") Management that lead to Transformational Leadership are non-negotiable KBR fundamentally believessafety standards that Inclusion & Diversity ("I&D") is good for business. It helps us innovate, helps our teams performare required to be observed and creates an environment where everyone can belong. Diversity is embedded in KBR, with employees from over 120 countries. In 2021, we increased our data capture to encompass race/ethnicity in all markets, with 94% of all employee records now updated. As of December 31, 2021, our employees had the following gender and race/ethnicity demographics:
Additionally,We believe that KBR has provided the tools and processes our Boardpeople need to achieve the mindset of Directors24/7 Zero Harm. One process known as the Courage to Care Conversation is 30% womeninstrumental in developing a continual awareness of unsafe acts through observation, intervention and 30% Black, Indigenous orconversation. A web-application to log conversations was created in-house and is available to all KBR employees. The goal of the Courage to Care Conversation is to continuously evaluate the work environment and to focus on people and their actions.
Thanks to our people's commitment to our Zero Harm culture, we recorded another consecutive year of color. Our particular attention on gender increasingly shows in our demographicsindustry-leading HSSE performance, with the percentagea total recordable incident rate of women in KBR increasing from 23.4% to 24.8% in 2020 and 2021, respectively.0.067.
Our I&D Council helps shape our strategic priorities. In 2021, it provided recommendations relatedJourney to working practices, target setting, supporting racial and ethnic diversity and sustainability in the supply chain. Furthermore, itZero Harm has committed to identifying best practicesallowed us to create an inclusive organizationa company culture where safe execution is non-negotiable and people take responsibility and accountability. When it comes to safety, we strive for employees with disabilities, increase the number of women in operational and business leadership roles and improve retention of diverse talent.one number: Zero.
In 2021, we required each area of the business to developEthics and implement a tailored I&D action plan, which was directly linked to payout under our short-term incentive program. Our 2022 plans will build on this baseline while incorporating the 2021 recommendations from the I&D Council as appropriate.Compliance
KBR's ethics and our Code of Business Conduct (the “Code”) are rooted in our values and provide the standards and support to help us successfully navigate issues, make the right decisions, and conduct our business with the integrity that reflects our heritage and ethical reputation. Additionally, our Code is essential to how we as a Team of Teams interact with the world around us and to our success.
We continuebelieve that an ethical culture, where employees are treated fairly, respectfully and without favoritism, is key to striveemployee satisfaction and retention. We promote a speak-up culture where employees are comfortable with making reports of possible unethical behavior and workplace issues. The Business Integrity Team has implemented a Question Manager as part of our Ethics Hotline for increased visibility of I&D data, enablingemployees to receive advice, confidentially or anonymously, on ethical or other inquiries. Employees speaking up and reporting issues enable us to better analyzeaddress and remediate these issues early and effectively while instilling confidence that employee concerns are heard and addressed. The recent People Perspective Survey indicates that a majority of our performance across all people processes,employees feel safe to report misconduct and reflects our dedication to an ethical culture.
Retaliation undermines a speak-up culture and is not tolerated. Our Code sets forth our anti-retaliation commitment, which is reinforced in our communications and our annual Ethics training. To further convey to the workforce that reports of unethical behavior are investigated and remediated, the Ethics training incorporates examples of past misconduct incidents.
Career
As well as providing meaningful work from Day 1, our employees and job applicants are attracted to KBR because of the candidate pipelineopportunity to pay equity,develop personally and reach their full potential. Providing the opportunity to ‘Grow’ at KBR is a key component in 2022 we are extending our data captureEVP. We have a good reputation among our employees for providing growth opportunities and have continued to focus on enhancing these growth prospects in a number of veteran status and sexual orientation. With enhancements to our benefits, such asways throughout 2023 with the introduction of supplementary childcare/elder-care benefitsinternal career fairs and expansion of floating holidays,global career opportunities. In addition, we invest in training our employees across a range of topics that align with and persistentenhance our values, including programs that focus on leadership, I&D, among our Team of Teams, we are confident that KBR will continue to see improvements within our genderethics and race/ethnicity demographics. In 2021, KBR's President and Chief Executive Officer signed the CEO Action Pledge, making a public commitment to diversity, equality and inclusion, and KBR has been recognized externally for our progress to date with our ranking in the top 100 of Forbes’ list of The World’s Top Female-Friendly Companies.technical development.
Employee Resource GroupsTechnical Professionals
For many years,our Technical Talent, our One KBR has encouraged employeesTech Fellows program provides funding and opportunities for these world-leading scientists and technical professionals to participate in employee-led Employee Resource Groups, where networking, advocacy and education help instill an environment where everyone can contribute. In addition to OK NoW, our ERG focused on mental health and wellbeing, we have expanded our ERGs in the I&D arena with the addition of the Armed Forces Community, the globalization of our Pride & Allies ERG and plans to launch MERGE, an ERG focused on minority groups. Together with ASPIRE, our ERG focused on the promotion of gender diversity, these other I&D focused ERGs came together in the ‘All In’ community, which was launched in 2021, and held a series of high-impact events onconduct advanced research into topics ranging from neurodiversitycarbon capture to understanding disabilities in the workplace.machine learning. Our ERGsFellows also provide valuable input into strategy development, business development and talent development within KBR. KBR Communities of Interest ("COIs") are rounded out with IMPACT, the communitycollaborative, virtual forums for early career professionals, which also expanded globally in 2021subject matter experts and those who support them. Our COIs continue to host a series of fireside chats with the CEO and virtual networking events to connect colleagues across KBR. Our Team of Teams value is embedded in these ERGs, giving employees a strong voice across KBR, and providing inspiring insight for leaders and colleaguesevolve, ensuring that subject matter experts across the globe.
Talent Developmentglobe can connect and collaborate on Data Science & Succession
In addition toAnalytics, Digital Engineering, Cloud, Cyber and other technical specialties that inform our focus on developing early career professionals, which includes established interncustomers’ and graduate programs, KBR offers a suite of world-class courses for employees in management and leadership roles. Together with the extension of our formal talent review processes in 2021, they help strengthen succession planning at all levels, supplementing the Board’s continued oversight of our Chief Executive Officer and Executive Leadership Team succession planning. During the year, we also introduced a formal Front Line Leaders program, designed to support employees newly transitioning into these critical roles, and began implementing a new approach to performance management, with frequent, real-time feedback conversations replacing traditional performance reviews.society’s greatest challenges today.
Leadership
Our other areaflagship leadership program, the Global Leadership Development Program, is designed to expand the capabilities of focusfuture executives. As well as developing strategic thinking through research projects ranging from sustainability investments to digital supply chain solutions, these leaders attended intense learning events focused on executive skills and leading courageously and with integrity. We also strengthen our future leadership by running regular Manager Excellence Programs, and in 2023, we launched our Front Line Leaders Program globally, to support employees newly transitioning into these critical roles.
Talent Development & Succession Planning
In 2023, we continued to expand the scope of our Talent Calibration conversations, covering over 4,100 KBR employees in this rigorous assessment of performance and potential. As well as providing organization-wide talent trends and data, these conversations lead to individual career plans and added rigor to our succession plans. The Board Nominations & Corporate Governance Committee received regular updates on this process throughout the year, culminating in detailed discussions on updated succession plans for the CEO and Executive Leadership Team.
Performance Management
2023 also saw the expansion of our new agile approach to performance management, focused on forward-looking discussions on performance and priorities between managers and their team members. Our employee survey showed that this modern, real-time performance management approach was on technical talent. In 2021,welcomed by a majority of participants, helping us retain critical talent, so in 2023 we welcomed 12 distinguished technical leadersadopted Agile Performance & Development across KBR.
Inclusion & Diversity
At KBR, we aim to the inaugural One KBR Technical Fellows program. This important program fosters ourbecome a magnet for diverse talent, known for a culture of innovation, fuels collaboration across diverse disciplinesbelonging and equality. Our commitment to Inclusion & Diversity (“I&D”) helps us innovate, helps our global Team of Teams perform and helps create an environment where everyone can belong. We believe we have made significant progress over many years and our progress is acknowledged by our employees. Their continued efforts help us attract, mentorto further build our reputation as a leader in this space, as exemplified by our maintaining a ranking on Forbes’s World’s Top Companies for Women list in 2023.
To help us continue our progress in I&D, we review trends and inspirepatterns using anonymized employee demographics to ensure we are providing equality of opportunity for all. We expanded our data capture further in 2023, encompassing veteran status and sexual orientation in relevant markets. Having this data helps us monitor our I&D progress, however, we respect our employees’ right to privacy. We maintain strict confidentiality for all those who voluntarily disclose and provide opt-out options for those who prefer not to disclose their personal information.
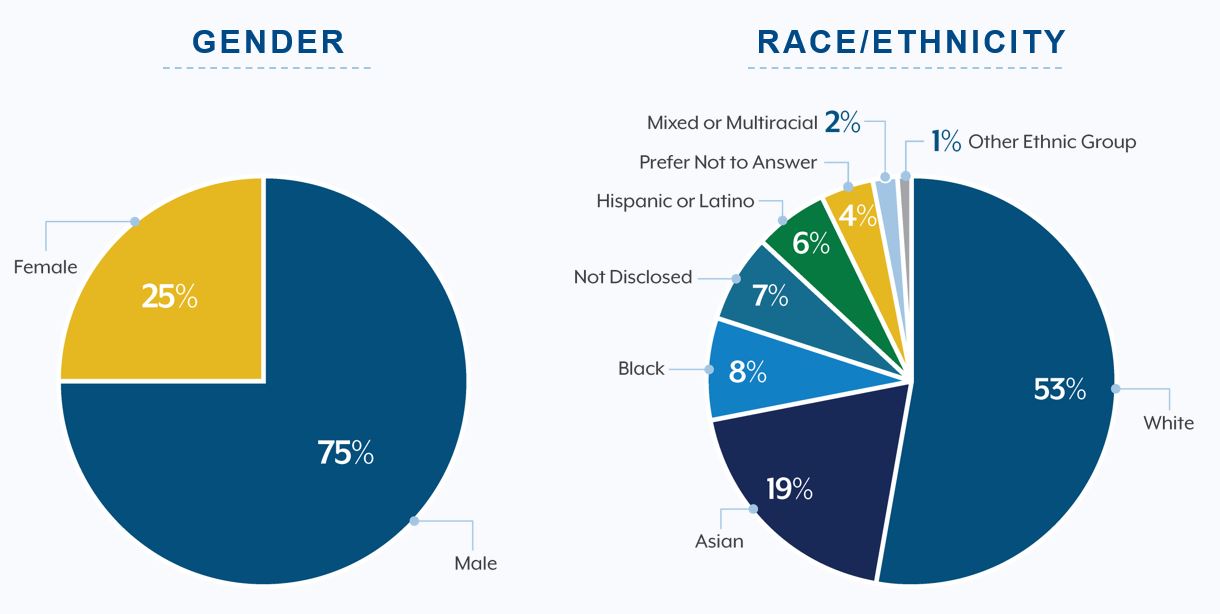
As of December 29, 2023, where permitted by law, our employees voluntarily self-disclosed the next generationfollowing gender and race/ethnicity demographics:
| | | | | | | | | | | |
| | | December 29, 2023 |
| White | | 47.8 | % |
| Asian | | 22.8 | % |
| Black | | 8.1 | % |
| Hispanic/Latino | | 6.1 | % |
| Prefer not to answer | | 5.7 | % |
| Not disclosed | | 5.3 | % |
| Other Ethic Group | | 2.2 | % |
| Multiracial | | 2.0 | % |
| | | | | | | | | | |
| | December 29, 2023 | | |
| Men | 73.9 | % | | |
| Women | 25.7 | % | | |
| Not Disclosed | 0.2 | % | | |
| Prefer not to answer | 0.1 | % | | |
| Other Gender Identity/Non-binary | 0.1 | % | | |
Our Board of talent.Directors is 33% female and 22% ethnic or racial minority. Our Executive Leadership Team ("ELT") is 22% female and 11% ethnic or racial minority.
In 2023, our I&D Council researched best practices for STEM outreach, communications, manager support, and inclusion for all. In 2024, we plan to incorporate their recommendations into our global plans as well as the local I&D Improvement Plans for every business and function.
Employee Engagement
In lineOur annual employee survey measures our progress through the eyes of our people. We partner with Great Place to Work to conduct the labor market tightening across the globe, we saw an increase in voluntary turnover in 2021 in some countries when pent up demand from early in the pandemic was released as economies rebounded. Our agile hiring practices allowedsurvey on our behalf, enabling us to keep pace with demand for talent, with applicant flowprovide the survey in multiple languages and staffing levels remaining at previous strong levels. This resilience was helped by our continued focus on our employees evidenced by the results of our People Perspectives Survey in which abenchmark how we perform compared to other similar organizations. A significant majority of our employees saidwho responded to the survey reported that they believe KBR is a great placeGreat Place to work. AsWork, resulting in KBR being certified as a Great Place to Work in several countries, including the U.S., U.K., Australia and India.
We continue to make improvements in a number of survey focus areas, including:
•Benefits – we improved our employee benefits offerings in 2023, such as the introduction of Next Gen Flex Work, which allows employees in eligible countries to work up to four weeks each year in a different location and provides an opportunity for sabbatical leave, as well as many strengths,the expansion of our Employee Stock Purchase Plan to new markets. These changes and improved communications resulted in an increase in employees’ positive perception of our benefits.
•Celebrations – with the introduction of One KBR Values Awards, expansion of celebratory events across different business areas and a deliberate focus on connections through our EVP, we were pleased to see survey responses improve positively for celebrating special events and for providing opportunities for special recognition. For example, in 2023 we held our first KBR Global Hackathon, which connected hundreds of employees to develop innovative solutions to challenges related to digitalization, sustainability and branding. We celebrated the achievements of the top teams in six regions, and each region’s overall winners attended the final in Abu Dhabi, during which the ELT selected the global winners. In 2024, this team will travel around the world with KBR, further building connections across business and geographic boundaries.
With over 16,000 employee feedbackresponses, the data from theour survey identified opportunities to improvewas reviewed in detail by different team leaders and weacross different business areas, resulting in tailored action plans that are developing plans to increase employees' engagementalready being executed across KBR.
With remote working commonplace, our communications programsEmployee Resource Groups
Our employees are encouraged to create and join multiple employee resource groups (“ERGs”) where they can continue to develop cultural competence across various categories of diversity, enhance their personal networks, develop leadership skills and actively contribute to workplace culture. In 2023, we continued to modernizeprovide technical and professional development, networking and community outreach opportunities through IMPACT, our long-standing ERG for early career professionals. We also have OK NoW, focused on Mental Health & Fitness, and a range of I&D-focused ERGs, which come together to collaborate in the All-In Community. With events ranging from book clubs and picnics to discussions on pay equity and mindfulness, the ERGs create a vibrant community for networking, advocacy and education across KBR. We also support and partner with charitable organizations through our ERGs.
Total Reward
Competition for talent continued to be fierce in 2023, compounded by high levels of inflation in the introductiongeneral economy. Recognizing the impact of the KBR podcast ‘In Orbit’,fluid economic environment on our employees, at the continued developmentbeginning of the year, we committed to carrying out an additional mid-year salary review. By staying current with pay trends and partnering with our Communities of Interest and our ‘People First’ video seriescustomers, we applied an additional increase in which leaders discussed how our people strategy is supporting KBRcompensation mid-year for select employees across the world. Our employees’ high level of engagement is deep-rooted with a majority of respondents feeling proud of what they accomplish and is a credit to their managers who scored highlyvarious levels in the survey’s Manager Effectiveness Index. Each business area has developed a plan to build on this positive responseorganization. Throughout 2023, we introduced improved benefits packages for many employees as described above, and address any local areas of concern as we continue to putbenchmark benefits in local markets and expand our people atofferings to help us attract and retain the heart of KBR.best and brightest talent.
Ethics and ComplianceTalent Acquisition
While the different components of our EVP outlined above help us attract and retain some of the best talent in KBR, we recognize that the ‘war for talent’ demands continued innovation and improvement in Talent Acquisition. In 2023, we continued to raise KBR’s brand awareness while providing an attractive and streamlined candidate journey to ensure we have the right people in the right place at the right time. We prioritize conductingappointed a global leader for talent acquisition, helping bring together our business with ethicscommunity of recruiters to identify and integrity. We are subjectinstitute best practices from sourcing to numerous compliance-related laws and regulations, including the FCPA, the U.K. Bribery Act, other applicable anti-bribery legislation and laws and regulations regarding trade and exports. The servicesonboarding.
During 2023, we provide to the U.S. federal government are subject to the FAR, the Truth in Negotiations Act, CAS, the Services Contract Act, DoD security regulations and many other laws and regulations. These laws and regulations affect how we transact businessalso embedded our Candidate Relationship Management platform that is integrated with our clientsHR system. This platform uses artificial intelligence to promote suitable career opportunities to candidates, helps implement ongoing marketing campaigns and in some instances, impose additional costsenables recruiters to focus on our business operations. We are also governed by our own Code of Business Conduct (our "Code")attracting and other compliance-related corporate policiessecuring talent rather than dedicating time and procedures that mandate compliance with these laws. Our Code is a guide for every employee in applying legal and ethical practicesresources to our everyday work. In particular, our Code describes our standards of integrity and relevant principles and areas of law most likely to affect our business. We regularly train our employees regarding our Code and other specific areas including anti-bribery compliance and international trade compliance.administrative matters.
As a result of this innovation and team effort, we hired over 7,900 employees in 2023, supporting our ability to deliver excellent solutions for our customers and meet our strategic growth targets. Of the new hires, 25% are female and 54% are an ethnic or racial minority.
Website Access
Our Annual Reports on Form 10-K, Quarterly Reports on Form 10-Q, Current Reports on Form 8-K and amendments to those reports filed or furnished pursuant to Section 13(a) or 15(d) of the Exchange Act are made available free of charge on our website at www.kbr.com as soon as reasonably practicable after we have electronically filed the material with, or furnished it to, the SEC. The SEC maintains a website that contains reports, proxy and information statements and other information regarding issuers like us that file electronically with the SEC at www.sec.gov.
Item 1A. Risk Factors
Risks Related to Operations of Our Business
The widespread outbreakA significant portion of a pandemicour revenues is generated by large, recurring business from certain significant customers, including the U.S. government. Any loss, cancellation or epidemic,delay in one or more projects by our significant customers in the outbreakfuture could negatively affect our financial performance.
A considerable percentage of an infectious disease, such as COVID-19, has materially impacted how we and our customers operaterevenues, particularly in our GS business segment, is generated from transactions with certain significant customers. Revenues from the U.S. government represented 58% of our total consolidated revenues for the year ended December 29, 2023. Budget uncertainty, the potential for U.S. government shutdowns, the use of continuing resolutions and the duration and extent to which they may materiallyfederal debt ceiling can adversely affect our future results of operations and financial performance remains uncertain.
The spread of COVID-19 across the globe has continued to negatively affect worldwide economic and commercial activity, disrupt global supply chainsindustry and the labor marketfunding for our contracts. If appropriations are delayed or a government shutdown were to occur and create significant volatilitywere to continue for an extended period of time, we could be at risk of contract cancellations and disruption of financialother disruptions and commodity markets. In response tononpayment. When the rapid global spread of the virus, national, stateU.S. government operates under a continuing resolution, new contract starts are restricted and local governments have continued to issue orders and recommendations to attempt to reduce the spread of the disease. To protect the health and safety offunding for our employees, we have continued to limit employee and contractor presence at our work locations. Employees who were not able to work effectively from home were brought back to work at our sites with strict safety protocols in place, which are in compliance with local regulations and guidance from the Centers for Disease Control and the World Health Organization. Fluctuation in infection rates have continued and the appearance of new and more easily transmissible variants of COVID-19, such as the Delta and Omicron variants, have resulted in periodic changes in restrictions that vary from region to region and require vigilant attention and rapid response. As a result, plans to return employees to our facilities under flexible working arrangements as a part of our reimagining how we deliver transformational journey were temporarily delayed.
In September 2021, the White House issued an executive order and guidance from the Safer Federal Workforce Task Force broadly requiring many U.S.-based federal contractors to be fully vaccinated by December 8, 2021 (or to have an approved accommodation). In early November 2021, the federal government extended that deadline to January 18, 2022. On December 7, 2021, a federal district judge issued an order, temporarily suspending the government from enforcing the federal contractor mandate. That order is on appeal. In order to ensure the health and safety of our employees and to be in compliance, we required our U.S. employees to be fully vaccinated, subject to any collective bargaining or other legal obligations (including approved religious or medical accommodations and exceptions). This requirement resulted in minimal attrition that was manageable through responsive recruitment processes.
Our business and operational plansprograms may be adversely affected by the global economic uncertainty caused by the COVID-19 pandemic due to a number of factors outside of our control that continue to develop, including:
•the duration, scope and severity of the pandemic, including the impact of variants and resurgences;
•the healthunavailable, reduced or availability of our workforce, including contractors and subcontractors, and restrictions that we and our customers, contractors and subcontractors impose, including limiting worksite access and facility shutdowns, to ensure the safety of employees and others;
•an overall tightening and increasingly competitive labor market resultingdelayed. Shifting funding priorities or federal budget compromises, also could result in labor shortages, lack of skilled labor, increased turnover or labor inflation;
•other workforce impacts, such as difficulty recruiting, retaining, training, motivating and developing employees due to evolving health and safety protocols; changing worker expectations and talent marketplace variability regarding flexible work models; and the challenges of maintaining our strong corporate culture, which values communication, collaboration and connections, despite a majority of employees working from home;
•supply chain disruptions that impact the ability or willingness of our vendors and suppliers to provide the equipment, parts or raw materials for our operations or otherwise fulfill their contractual obligations, which in turn could impair our ability to perform under our contracts or to deliver products on a timely basis;
•recommendations of, or restrictions imposed by, government and health authorities, including travel bans, quarantines and vaccine mandates to address the COVID-19 outbreak;
•potential contract delays, modifications or terminations;
•increased potential for the occurrence of operational hazards, including terrorism, cyber-attacks or domestic vandalism, as well as information system failures or communication network disruptions;
•reductions in the number and amounts of new government contract awards, delays in the timing of anticipated awardsoverall defense spending on an absolute or potential cancellations of such prospects as a result of the fiscal, economic and budgetary challenges facing our customers, including increased material and equipment costs resulting from inflation and supply chain disruptions;
•increased cost and reduced availability of capital for growth or capital expenditures;
•increased costs of operation attributed to inflation,inflation-adjusted basis, which costs may not be fully recoverable or adequately covered by insurance; and
•long-term disruption of the U.S. and global economy and financial and commodity markets.
The spread of COVID-19 has caused us to significantly modify our business practices, and we may take further actions as may be required by government authorities or that we determine are in the best interests of our employees, contractors, customers, suppliers and communities. There is no certainty that such measures will be sufficient to mitigate the risks posed by the virus, and our ability to perform critical functions could be adversely impacted.
As the potential effects of COVID-19 are difficult to predict, the duration of any potential business disruption or the extent to which COVID-19 may negatively affect our operating results is uncertain. Any potential impact will depend on future developments and new information that may emerge regarding the spread, severity and duration of the COVID-19 pandemic and the actions taken by authorities to contain it or treat its impact, all of which are beyond our control. These potential impacts, while uncertain, could adversely affectimpact our business, financial condition, results of operations and/or cash flows, as well as our ability to pay dividends to our shareholders.business.
Our results of operations and cash flows depend on the award of new contracts and the timing of the performance of theseexisting contracts.
Our revenues are directly orand indirectly derived from contract awards. Reductions in the number and amounts of new awards, delays in the timing of anticipated awards or potential cancellations of such prospects as a result of economic conditions, material and equipment pricing and availability or other factors could adversely impact our long-term projected results. It is particularly difficult to predict whether or when we will receive large-scale international and domestic projects as these contracts usually involve a lengthy and complex bidding and selection process. This process can be affected by a number of factors, including market conditions and governmental and environmental approvals.approvals, and in some cases, the customer's ability to secure the necessary financing for a project to proceed. As a portion of our revenues is generated from such projects, our results of operations and cash flows can fluctuate significantly from quarter to quarter depending on the timing of our contract awards and the commencement or progress of work under awarded contracts. In addition, many of these contracts are subject to financing and similar contingencies and, as a result, we are subject to the risk that the customer will not be able to secure the necessary financing for a project to proceed.
The uncertainty of our contract award timing can also present difficulties in matching workforce size with contract needs. In some cases, we maintain and bear the cost of a ready workforce that is larger than necessary under existing contracts in expectation of future workforce needs for anticipated contract awards. If an anticipated contract award is delayed or not received, we may incur additional costs resulting from reductions in staff or redundancy of facilities that could have a material adverse effect on our business, financial condition, results of operations and cash flows.
Following contract award, we may also encounter significant expense, delay, contract modifications or even contract loss. Additionally, certain contract awards (including the performance of such awards) have been and may in the future be contested and/or otherwise involved in ongoing legal proceedings, inquiries or other similar developments outside of our control, which may result in significant delays in the project timeline or the wholesale cancellation or termination of a project. Any project delays, cancellations or contract modifications following the award of a contract could have a material adverse effect on our business, financial condition, results of operations, backlog, revenue recognition timing and cash flows.
Ongoing international conflicts, and other geopolitical conditions, may adversely affect our business and results of operations.
APolitical, economic and other conditions in foreign countries and regions, including geopolitical risks, such as the current conflict between Russia and Ukraine and political and economic instability and conflict in the Middle East, may adversely affect our business and operations as a portion of our revenuesrevenue is generated by large, recurringderived from foreign operations. Additionally, the full scope, duration and broader implications of international conflicts, which may include additional international sanctions, embargoes, regional instability and geopolitical shifts; increased tensions between the United States and countries in which we operate; and the extent of the conflicts’ effects on our business from certain significant customers. A loss, cancellationand results of operations as well as the global economy, cannot be predicted. Any alleged or delayactual failure to comply with any sanctions and trade control measures implemented in projects byresponse to international conflicts may subject us to government scrutiny, civil and/or criminal proceedings, sanctions and other liabilities, which may have an adverse effect on our significant customersinternational operations, financial condition and results of operations.
To the extent current conflicts or other geopolitical conflicts adversely affect our business, they may also have the effect of heightening many of our other risks identified in this Annual Report on Form 10-K, any of which could materially and adversely affect our business and results of operations. Such risks include, but are not limited to, the following:
•adverse effects on macroeconomic conditions, including inflation, demand for our products and potential recessionary economic conditions;
•increased cyber security threats;
•adverse changes in trade policies, taxes, government regulations and tariffs;
•our ability to obtain compensation for increased costs incurred related to rising costs of equipment, materials and labor on fixed-price contracts;
•our ability to implement and execute our business strategy;
•disruptions in global supply chains;
•our exposure to foreign currency fluctuations; and
•constraints, volatility or disruption in the capital markets.
Global pandemics, epidemics, outbreaks of infectious diseases or public health crises have disrupted our business and could have a material adverse effect on our future could negatively affect ourresults of operations and financial performance.
A considerable percentageThe spread of COVID-19 and other pandemics, epidemics, outbreaks of infectious diseases or public health crises across the globe have disrupted, and may in the future disrupt our revenues, particularly in our GS business, segment, is generated from transactions with certain significant customers. Revenues from the U.S. government represented 70% of our total consolidated revenues for the year ended December 31, 2021. The loss of one or more of our significant customers, or the cancellation or delay in their projects,which could materially and adversely affect our revenues andfinancial condition, results of operations.operations, cash flows and/or future expectations. Our business, operations and financial performance have been, and may continue to be affected by the still ongoing macroeconomic impacts resulting from the COVID-19 pandemic. As a result, our financial performance and growth rates may differ from pre-pandemic historical periods, and our future results may fall below expectations. Any health crisis may negatively affect worldwide economic and commercial activity, disrupt global supply chains and the labor market and create significant volatility and disruption of financial and commodity markets. The extent to which our business will continue to be affected and may in the future be affected by pandemics, infectious disease outbreaks and other public health crises depends on a number of factors outside of our control, including but not limited to the extent and duration of labor disruptions, business operations disruptions from quarantines, travel restrictions and other requirements imposed by regulators and health authorities, delays, modifications and terminations of contracts, supply chain disruptions, increased cybersecurity and data protection risks, increased costs of doing business and other macroeconomic disruptions.
If we are unable to enforce our intellectual property rights, or if our intellectual property rights are challenged or become obsolete, our competitive position could be adversely impacted.
We utilize a variety of intellectual property rights in providing services to our customers. We view our portfolio of process and design technologies as one of our competitive strengths and we use it as part of our efforts to differentiate our service offerings. We may not be able to successfully preserve these intellectual property rights in the future, and these rights could be invalidated, circumvented, challenged or infringed upon. In addition, the laws of some foreign countries in which our services may be sold do not protect intellectual property rights to the same extent as the laws of the U.S. We also license technologies from third parties and there is a risk that our relationships with licensors may terminate, expire or be interrupted or harmed. If we are unable to protect and maintain our intellectual property rights, or if there are any successful intellectual property challenges or infringement proceedings against us, our ability to differentiate our service offerings could diminish. In addition, if our intellectual property rights or work processes become obsolete, we may not be able to differentiate our service offerings and some of our competitors may be able to offer more attractive services to our customers. As a result,We will also need to continue to respond to and anticipate changes resulting from disruptive technologies, including in areas of artificial intelligence and machine learning. If we are not successful in protecting and preserving our intellectual property rights and licenses, or in staying ahead of developing artificial intelligence and machine learning technologies and strategically incorporating them into our business, our business and financial performance could be materially and adversely affected.
We may not properly leverage or appropriately invest in technology advancements, which could diminish any sustainable competitive advantage in our service offerings resulting in the potential loss of market share and profits.
Our business is dependent on information technology as we operate in global markets with customers who demand innovation, technical and domain expertise and digitally-enabled, technology-led solutions. Robust information technology systems, platforms and products are integral in our efforts to differentiate our service offerings and maintain our competitive advantages. Disruptive technologies, including in areas of artificial intelligence and machine learning, are rapidly changing the environment in which we, our customers, and our competitors operate and could affect the nature of how we generate revenue. We will need to continue to respond to and anticipate these changes by enhancing our product and service offerings to maintain our competitive position.
It is strategically important that we lead the digital transformation occurring in our industry. WeHowever, we may not be successful in structuring our technology or developing, acquiring or implementing technology systems whichin ways that are competitive and responsive to the needs of our customers. We may lack sufficient resources to continue to make the significant technology investments to effectively compete with our competitors. Certain technology initiatives that management considers important to our long-term success will require capital investment, have significant risks associated with their execution and could take several years to implement. If we are unable to develop and implement these initiatives in a cost-effective, timely manner or at all, it could damage our relationships with our customers and negatively impact our financial condition and results of operations. There can be no assurance that others will not acquire similar or superior technologies sooner than we do or that we will acquire technologies on an exclusive basis or at a significant price advantage. If we do not accurately predict, prepare and respond to new technology innovations, market developments and changing customer needs, our revenues, profitability and long-term competitiveness could be materially adversely affected.
If we are unable to attract and retain senior management and key technical professionals with elite skills and appropriate government qualifications, our ability to pursue and compete for projects to grow our business may be adversely affected, our operating income may decrease and our reputation may be negatively impacted.
The reimagined KBR and itsKBR's forward-looking solutions strategy requires talent with dynamic and elite skills as KBR moves upmarket. Our rate of growth and the success of our business depend upon our ability to attract, develop, retain and replace key qualified technical and management professionals, either through direct hire, subcontracts or acquisition of other firms, who possess the elite skills to successfully deliver the solutions strategy. The market for these professionals is competitive in the sectors in which we compete, and we rely heavily upon the expertise and leadership of our professionals to perform, execute and complete projects as required by our clients.
We currently hold U.S. government-issued facility security clearances and a large number of our employees have qualified for and hold U.S. government-issued personal security clearances necessary to ultimately perform certain U.S. government contracts. Obtaining and maintaining security clearances for employees involves lengthy processes, and it is difficult to identify, recruit and retain employees who already hold security clearances.If our employees are unable to obtain or retain security clearances or if our employees who hold security clearances terminate employment with us and we are unable to find replacements with equivalent security clearances, we may be unable to perform our obligations to customers whose work requires cleared employees, or such customers could terminate their contracts or decide not to renew them upon their expiration. Our facility security clearances could be marked as "invalid" for several reasons including unapproved foreign ownership, control or influence, mishandling of classified materials or failure to properly report required activities. An inability to obtain or retain our facility security clearances or engage employees with the required security clearances for a particular contract could disqualify us from bidding for and winning new contracts with security requirements.
If we are unable to attract and retain a sufficient number of elite skilled professionals with appropriate government qualifications, our ability to pursue projects may be adversely affected, our operating income may decline, and our reputation may be damaged.
Our future success depends on the continued services of our executive officers as well as our ability to effectively transition to their successors. Our inability to attract, develop and retain qualified employees that can succeed our executive officers could have a material adverse effect on our operating income and reputation.
The nature of our business exposes us to potential liability claims and contract disputes that may exceed or be excluded from existing insurance coverage.
We engage in activities for large facilities where design, construction or systems failures can result in substantial injury or damage to employees or other third parties or delays in completion or commencement of commercial operations, exposing us to legal proceedings, investigations and disputes. The nature of our business results in clients, subcontractors and vendors occasionally presenting claims against us for recovery of costs they incurred in excess of what they expected to incur or for which they believe they are not contractually liable. If it is determined that we have liability, we may not be covered by insurance or, if covered, the dollar amount of these liabilities may exceed our policy limits. Our professional liability coverage is on a “claims-made” basis covering only claims actually made during the policy period currently in effect. In addition, even where insurance is maintained for such exposures, the policies have deductibles, which result in our assumption of exposure for a layer of coverage with respect to any such claims. Any liability not covered by our insurance, in excess of our insurance limits or if covered by insurance but subject to a high deductible, could result in a significant loss for us, which may reduce our profits and cash available for operations. Furthermore, there is risk of mass casualty or environmentally damaging events that may involve our and third-party personnel and property, which could lead to future claims and litigation, impact our reputation and investor confidence and ultimately result in reduced share price.
We occasionally bring claims against project owners for additional costs exceeding the contract price or for amounts not included in the original contract price. These types of claims occur due to matters such as owner-caused delays or changes from the initial project scope that may result in additional direct and indirect costs. Often these claims can be the subject of lengthy negotiations, arbitration or litigation proceedings, and it is difficult to accurately predict when these claims will be fully resolved. When these types of events occur and unresolved claims are pending, we may invest significant working capital in projects to cover cost overruns pending the resolution of the relevant claims. A failure to recover on these types of claims fully or promptly could have a material adverse impact on our liquidity and financial results.
For example, we have a 30% ownership interest in the JKC, joint venture ("JKC"), which was contracted to perform the engineering, procurement, supply, construction and commissioning of onshore LNG facilities for a client in Darwin, Australia (the "Ichthys LNG Project"). The construction and commissioning ofPrior to completion, the Ichthys LNG Project is complete, and the facility has been handed over to the client and is producing LNG. The project experienced significant cost increases associated with a variety of issues related to delays, changes in the scope of work and lower than expected subcontractor productivity. These issues resulted in significant unapproved change orders and claims against the client as well as estimated recoveries of claims against suppliers and subcontractors that have been included in the project estimates-at-completion. On October 21, 2021,While JKC entered into a binding settlement agreement (the "Settlement Agreement")agreements that resolved the outstanding claims and disputes between JKC and its client, Ichthys LNG Pty, Ltd (collectively, "the Parties"). As a resultand JKC and its consortium of the Settlement Agreement, the Parties agreedsubcontractors, we were required to withdraw all claims and terminate all ongoing arbitration and court proceedings between the Parties.record significant non-cash charges to equity in earnings (losses) of unconsolidated affiliates in connection with these disputes.
Dependence on third-party subcontractors and equipment manufacturers could adversely affect our financial performance on contracts.
We rely on third-party subcontractors and equipment manufacturers in order to complete many of our projects. Certain subcontractors and suppliers, such as those used on our U.S. government contracts, are subject to the same rigorous government requirements that we are and if they are unable to comply with these requirements, in many cases, there may beare limited alternative subcontractors and suppliers available in the market.market, particularly those with the requisite security clearances. We sometimes have disputes with our contracting parties, including disputes regarding the cost, quality and timeliness of work performed or customer concerns about the other party’s performance. We also have been and in the future could be adversely affected by actions or issues experienced by our contracting parties that are outside of our control, such as misconduct and reputational issues involving our contracting parties, which has and could in the future subject us to liability and reputational harm or adversely affect our ability to compete for contract awards. In addition, if any subcontractor or a manufacturer is unable to deliver its services, equipment or materials according to the negotiated terms for any reason including, but not limited to, the deterioration of its financial condition, we may be required to purchase the services, equipment or materials from another source at a higher price. This may reduce the profit we expect to realize or result in a loss on a project for which the services, equipment or materials were needed. Furthermore, if the amount we are required to pay for these goods and services exceeds the amount we have estimated in bidding for fixed-price contracts, we could experience losses in the performance of these contracts.
OurWe use of the cost-to-cost method of revenue recognition could resultestimates in a reduction or reversal of previously recordedrecognizing revenues, and profits.if we make changes to estimates used in recognizing revenues, our profitability may be adversely affected.
A significant portion of our revenues and profits are measured and recognized over time using the cost-to-cost method of revenue recognition. Our use of this accounting method results in recognition of revenues and profits over the life of a contract, based generally on the proportion of costs incurred to date to total costs expected to be incurred for the entire project. The effects of revisions to estimated revenues and costs are recorded when the amounts are known or can be reasonably estimated. In addition, we record unapproved change orders and claims against clients as well as estimated recoveries of claims against suppliers and subcontractors that have been included in the estimated profit at completion for certain projects. Revisions to these estimates could occur in any period and their effects could be material. The uncertainties inherent in estimating the progress towards completion or the recoverability of claims of long-term contracts make it possible for actual revenues and costs to vary materially from our estimates, including reductions or reversals of previously recorded revenues and profits.
We conduct a portion of our operations through joint ventures and partnerships, exposing us to risks and uncertainties, many of which are outside of our control.
We conduct a portion of our operations through project-specific joint ventures where control may be shared with unaffiliated third parties or control may be held by the unaffiliated third parties. These projects include the facilitation of nonrecourse financing, the design and construction of facilities, the provision of operation and maintenance services and warranty obligations for an agreed-upon period after the facilities have been completed. If a project is unable to obtain financing, we could incur losses on our investments and any related contractual receivables. As with any joint venture arrangement, differences in views among the joint venture partners may result in delayed decisions or in failures to agree on
major issues. We also cannot control the actions of our joint venture partners, including failure to comply with applicable laws or regulations, nonperformance and default or bankruptcy of our joint venture partners. Also, we often share liabilities on a joint and several basis with our joint venture partners under these arrangements. If our partners do not meet their contractual obligations, the joint venture may be unable to adequately perform and deliver its contracted services, requiring us to make additional investments or perform additional services to ensure the adequate performance and delivery of services to the customer, which could ultimately result in litigation. We could be liable for both our obligations and those of our partners, which may result in reduced profits, significant losses on the project and a negative impact to our cash flows. Additionally, these factors could have a material adverse effect on the business operations of the joint venture and, in turn, our business operations and reputation.
Operating through joint ventures in which we have a minority interest could result in us having limited control over many decisions made with respect to projects and internal controls relating to projects. These joint ventures may not be subject to the same requirements regarding internal controls that are applicable to us. As a result, internal control issues may arise, which could have a material adverse effect on our financial condition and results of operations.
The nature of our contracts, particularly those that are fixed-price, subjects us to risks associated with cost overruns, operating cost inflation and potential claims for liquidated damages.
We conduct our business under various types of contracts where costs must be estimated in advance of our performance. A portion of the value of our current backlog is attributable to fixed-price contracts where we bear a significant portion of the risk of cost overruns. These types of contracts are priced, in part, on cost and scheduling estimates that are based on assumptions including pricing and availability of experienced labor, equipment and materials as well as productivity, performance and future economic conditions. If these estimates prove inaccurate, if there are errors or ambiguities as to contract specifications or if circumstances change due to, among other things, the recent rise in interest rates, continued inflation, supply-chain disruptions, unanticipated technical problems, poor project execution, difficulties in obtaining permits or approvals, changes in local laws or labor conditions, weather delays, changes in theincreased costs of equipment and materials from inflation or other factors or our suppliers’ or subcontractors’ inability to perform, then cost overruns may occur. We may not be able to obtain compensation for additional work performed or expenses incurred. Additionally, we have in the past and may in the future be required to pay liquidated damages upon our failure to meet schedule or performance requirements of our contracts. Our failure to accurately estimate the resources and time required for fixed-price contracts or our failure to complete our contractual obligations within a specified time frame or cost estimate could result in reduced profits or, in certain cases, a loss for that contract. If the contract is significant, or we encounter issues that impact multiple contracts, cost overruns could have a material adverse effect on our business, financial condition and results of operations.
The transition period resulting from the Referendum of the United Kingdom's Membership of the European Union could adversely affect our business, financial condition and results of operations.
The U.K. formally exited the European Union (“Brexit”) on January 31, 2020, followed by a transition period from February through December 2020, during which the U.K. continued to remain in the European Union as it negotiated separate trade deals with the European Union and other countries. On December 24, 2020, the U.K. announced that it had reached agreement on a draft EU-UK Trade and Cooperation Agreement (“TCA”). The U.K. Parliament ratified the U.K.’s entry into, and implementation of, the TCA on December 30, 2020 pursuant to the EU (Future Relationship) Act 2020. The TCA offers the U.K. and European Union companies preferential access to each other’s markets, ensuring imported goods will be free of tariffs and quotas; however, economic relations between the U.K. and the European Union will now be on more restricted terms. Additionally, the TCA does not incorporate the full scope of the services sector, and businesses such as banking and finance continue to face uncertainty. In March 2021, the U.K. and the European Union agreed on a framework for voluntary regulatory cooperation and discussion on financial services issues in a Memorandum of Understanding, which is expected to be signed after formal steps are completed.
The effects of Brexit will continue to depend on any agreements the U.K. has signed or will sign in the future to retain access to European Union markets. Brexit could adversely affect U.K., European and worldwide economic and market conditions, could contribute to instability in some global financial and foreign exchange markets, including continued volatility in the value of the British pound sterling or could otherwise adversely affect trading agreements or similar cross-border cooperation arrangements (whether economic, tax, legal, regulatory or otherwise). Volatility in currency exchange rates primarily impacts the translation of the financial results of the U.K. portion of our GS business segment. Brexit could also disrupt the free movement of goods, services and people between the U.K. and the European Union, and result in increased legal and regulatory complexities, as well as potential higher costs of conducting business in Europe. These developments, or the perception that any of them could occur, may adversely affect our relationships with our existing and future customers, suppliers, employees and subcontractors and may have an adverse impact on our business, financial condition and results of operations.
We work in locations and on projects where there are high security risks, which could result in substantial costs, damage to our reputation and harm to our employees, contractors and clients.
Some of our services are performed in high-risk locations, including but not limited to, Iraq, Afghanistan and certain parts of Africa and the Middle East, where the country or surrounding area is suffering from political, social or economic issues, war or civil unrest. In those locations where we have employees or operations, we may incur substantial costs to maintain the safety of our personnel and clients. Despite these precautions, we have suffered the loss of employees and contractors in the past that resulted in claims and litigation. Furthermore, there is risk of mass casualty or environmentally damaging events that may involve our and third-party personnel and property, which could lead to future claims and litigation, impact our reputation and investor confidence and ultimately result in reduced share price.
Specifically, due to the complex humanitarian, logistical and multi-agency contractual challenges presented by OAW, several threats are present, including the threat of injury or death to Afghan guests, clients or third-party personnel, damage to client facilities and work performed by KBR or its subcontractors inconsistent (or alleged to be inconsistent) with the client contracts. This could result in significant financial claims by the client, unfavorable reports from the media and local communities, financial losses and significant damage to our reputation.
Additionally, as a result of our historical employment of Afghan nationals from 2002 to 2010 and the continuing obligation to provide verification of past employment to these individuals in relation to their application for Special Immigrant Visas ("SIVs"), if we are unable to verify past employment in a timely manner, we could be subject to investigation and/or at risk of damage to our reputation.
Our backlog of unfilled orders is subject to unexpected adjustments and cancellations and, therefore, may not be a reliable indicator of our future revenues or earnings.
As of December 31, 2021,29, 2023, the future revenues we expect to realize as a result of backlog was approximately $15.0$17.3 billion. We cannot guarantee that the revenues projected in our backlog will be realized or that the projects will be profitable. Many of our contracts are subject to cancellation, termination or suspension at the discretion of the customer. From time to time, changes in project scope may occur with respect to contracts reflected in our backlog and could reduce the dollar amount of our backlog or the timing of the revenues and profits that we ultimately earn. Projects may remain in our backlog for an extended period of time because of the nature of the project and the timing of the particular services or equipment required by the project. Delays, suspensions, cancellations, payment defaults, scope changes and poor project execution could materially reduce or eliminate profits that we actually realize from projects in backlog. We cannot predict the impact that future economic conditions may have on our backlog, which could include a diminished ability to replace backlog once projects are completed or could result in the termination, modification or suspension of projects currently in our backlog. Such developments could have a material adverse effect on our financial condition, results of operations and cash flows.
We make equity investments in privately financed projects in which we could sustain significant losses.
We participate in privately financed projects that enable governments and other customers to finance large-scale projects, such as the acquisition and maintenance of major military equipment, capital projects and service purchases. These projects typically include the facilitation of nonrecourse financing, the design and construction of facilities, the provision of operation and maintenance services and warranty obligations for an agreed-upon period after the facilities have been completed. We may incur contractually reimbursable costs and typically make investments prior to an entity achieving operational status or receiving project financing. If a project is unable to obtain financing, we could incur losses on our investments and any related contractual receivables. After completion of these projects, the return on our investments can be dependent on the operational success of the project and market factors that may not be under our control. As a result, we could sustain a loss on our equity investment in these projects.
We have made and may continue to make business combinations as a part of our business strategy, which may present certain risks and uncertainties.
We may continue to seek business acquisitions as a means of broadening our offerings and capturing additional market opportunities by our business segments. However, there is no guarantee that we will be successful in identifying target companies that meet our criteria for acquisition. We may also face increased competition from other potential acquirers who have greater financial resources or who are in a position to offer more favorable terms to the target company. This competition may limit our ability to pursue acquisition opportunities which could negatively affect our growth strategies. Additionally, future acquisitions may require us to obtain additional equity or debt financing, which may not be available on attractive terms, if at all.
The success of our historical and future business combinations also depends on our ability to integrate the operations of the acquired businesses efficiently and effectively with our existing operations and realize the anticipated benefits from them. The potential risks associated with successful integration and realization of benefits include, but are not limited to the following:
•our due diligence may not identify or fully assess valuation issues, potential liabilities or other acquisition risks;
•acquired entities may not achieve anticipated revenue targets, cost savings or other synergies or benefits, or acquisitions may not result in improved operating performance, which could adversely affect our operating income or operating margins, and we may be unable to recover investments in any such acquisitions;
•we may have difficulty integrating acquired businesses, resulting in unforeseen difficulties, such as incompatible accounting, information management or other control systems, and greater expenses than expected;
•we may have difficulty entering into new markets in which we are not experienced, in an efficient and cost-effective manner while maintaining adequate standards, controls and procedures;
•key personnel within an acquired organization may resign from their related positions resulting in a significant loss to our strategic and operational efficiency associated with the acquired company;
•the effectiveness of our daily operations may be reduced by the redirection of employees and other resources to acquisition and integration activities;
•we may assume liabilities of an acquired business (including litigation, tax liabilities, contingent liabilities, environmental issues), including liabilities that were unknown at the time of the acquisition, that pose future risks to our working capital needs, cash flows and the profitability of related operations;
•we may assume unprofitable projects that pose future risks to our working capital needs, cash flows and the profitability of related operations; or
•business acquisitions may include substantial transactional costs to complete the acquisition that exceed the estimated financial and operational benefits.
International and political events may adversely affect our operations.
A portion of our revenues is derived from foreign operations, which exposes us to risks inherent in doing business in each of the countries where we transact business. The occurrence of any of the risks described below could have a material adverse effect on our business operations and financial performance. With respect to any particular country, these risks may include, but not be limited to:
•expropriation and nationalization of our assets in that country;
•changes in government regimes and other developments that may cause, directly or indirectly, political and economic instability;
•costs to maintain the safety of our personnel and clients in high-risk locations, including but not limited to, certain parts of Africa and the Middle East, where the country or surrounding area is suffering from political, social or economic issues, war or civil unrest;
•changes in trade policies affecting the markets for our services (including but not limited to retaliatory tariffs between the United States and other countries);
•civil unrest, acts of terrorism, war or other armed conflict (including but not limited to potential U.S. sanctions on other countries);
•currency fluctuations, devaluations and conversion restrictions;
•confiscatory taxation or other adverse tax policies;
•uncertainties related to any geopolitical, economic and regulatory effects or changes due to recent or upcoming domestic and international elections;
•governmental activities or judicial actions that limit or disrupt markets, restrict payments, limit the movement of funds, result in the deprivation of contract rights or result in the inability for us to obtain or retain licenses required for operation; or
•increased polarization of political parties, in the U.S. and abroad, which may lead to more volatility in government spending or other developments such as trade wars or changes in military priorities.
Due to the unsettled political conditions in countries where we provide governmental logistical support, our financial performance is subject to the adverse consequences of war, the effects of terrorism, civil unrest, strikes, currency controls and governmental actions. Our operations are conducted in areas that have significant political risk. In addition, despite safety precautions, military action or unrest could disrupt our operations in such locations and elsewhere and increase our costs related to security worldwide.
We rely on internalInternal or external cybersecurity or privacy breaches, or systems and external information technology ("IT") systems to conduct our business, and disruption,interruption or failure or security breaches of these systems could adversely affectimpact our businessability to operate or expose us to significant financial losses and results of operations.reputational harm.
We utilize, develop, installAs a U.S. government contractor and maintain a numberprovider of information technology systems both for usIT services operating in multiple regulated industries and for our customers. Additionally,geographies, we utilize and rely on external systems maintained by our service providers. These activities may involve substantial risks to our ongoing business processes including, but not limited to, accurate and timely customer invoicing, employee payroll processing, vendor payment processing and financial reporting. If these implementation activities are not executed successfully or if we encounter significant delays in our implementation efforts, we could experience interruptions to our business processes. Under certain contracts with the U.S. government subject to the FAR and CAS, the adequacy of our business processes and related systems could be called into question. The occurrence of such events could have a material adverse impact on our business, financial condition, results of operations and cash flows.
Various privacy and security laws require us to protect sensitive and confidential information from disclosure. In addition, we are bound by our client and other contracts, as well as our own business practices, to protect our and certain third party confidential and proprietary information from disclosure. We rely upon industry accepted security measures and technology to secure such confidential and proprietary information maintained on our IT systems. However, our portfolio of hardware and software products, solutions and services and information contained within our enterprise IT systems and external systems maintained bypartners (including our service providers, may be vulnerablejoint venture partners, suppliers and subcontractors) handle a variety of sensitive information including personally identifiable information, personnel information, protected health information, classified and controlled unclassified information, and financial information, concerning our business, employees and customers. We and our business partners are continuously exposed to damage or disruption caused by circumstances beyond our controlcyber and other security threats, including cyberattacks such as catastrophic events, cyberattacks inclusive of malware/computer viruses, ransomware and phishing attacks, insider threats related to malicious and non-malicious activities from authorized and unauthorized employees or third parties, catastrophic events, power outages, natural disasters, computer system or network failures or physical break-ins. The failureWe also utilize third-party software in the performance of certain critical accounting, project management, and financial reporting systems. Technological developments in artificial intelligence and machine learning, particularly those that provide actors with the capability to use more sophisticated means to attack our systems, may exacerbate cybersecurity and data privacy risks. Any unauthorized electronic or physical intrusion or other security threat may jeopardize the protection of sensitive or other information stored or transmitted through our IT systems and networks and those of our internal or external IT systemsbusiness partners and third-party software providers. This could lead to perform as anticipated for any reason could disruptdisruptions in our business and result in decreased performance, significant remediation costs, transaction errors, loss of data (including personally identifiable information), processing inefficiencies, downtime, litigation and the loss of suppliers or customers. Under certain contracts with the U.S. government subject to the FAR and CAS, the adequacy of our business processes and related systems could be called into question. Any significant disruptions or failures could damage our reputation or have a material adverse effect on our business operations, financial performance, financial condition and reputation.
Additionally, we work with the defense industrial base industry and the U.S. government to gather and share threat intelligence and promote increased awareness and enhanced protections against cybersecurity threats. However, because of the evolving nature of these security threats, there can be no assurance that our policies, procedures and other controls will detect or prevent them, and we cannot predict their full impact. We may experience similar security threats to the IT systems that we develop, install or maintain under customer contracts, including customer contracts under which we may have access to or management responsibility for customer databases or networks that contain sensitive information relating to our customers, their employees or related third parties. Although we work cooperatively with our customers to seek to minimize the impacts of cyber and other security threats, we must usually rely on the safeguards used or required by those customers. In the event of unauthorized access to sensitive information for which we are responsible under customer contracts, our customers, their employees, or third parties may seek to hold us liable for any costs or other damages associated with the unauthorized access. In addition, government agencies may bring legal actions against us for violation of or noncompliance with regulatory requirements relating to any unauthorized access to sensitive information. Any remediation costs, damages or other liabilities related to unauthorized access of sensitive information of ours or our customers caused by cyber or other security threats may not be fully insured or indemnified by other means or our insurers. Occurrence of any unauthorized access caused by these security threats could adversely affect our reputation, business operations and impact our financial condition.results.
While we have security measures and technology in place designed to protect our and our clients’ proprietary or classified information, there can be no assurance that our efforts will prevent all threats to our computer systems. Because the techniques used to obtain unauthorized access or sabotage systems change frequently, become more sophisticated and generally are not identified until they are launched against a target, we may be unable to anticipate these techniques or to implement adequate preventative measures. As a result, we may be required to expend significant resources to protect against the threat of system disruptions and security breaches or to alleviate problems caused by these disruptions and breaches. Any of these events could damage our reputation, cause us to incur significant liability and have a material adverse effect on our business, financial condition and results of operations.
We continuously evaluate the need to upgrade and/or replace our systems and network infrastructure to protect our computing environment, to stay current on vendor supported products and to improve the efficiency of our systems and for other business reasons. The implementation of new systems and information technology could adversely impact our operations by imposing substantial capital expenditures, demands on management time and risks of delays or difficulties in transitioning to new systems. In addition, our systems implementations may not result in productivity improvements at the levels anticipated. Systems implementation disruption and any other information technology disruption, if not anticipated and appropriately mitigated, could have a material adverse effect on our business.
In addition, laws and regulations governing data privacy and the unauthorized disclosure of personal data, including the European Union General Data Protection Regulation ("GDPR"), the United Kingdom Data Protection Act, the California Consumer Privacy Act, the California Privacy Rights Act and other emerging U.S. state and global privacy laws pose increasingly complex compliance challenges and potentially elevate costs and may require changes to our business practices resulting from the variation of regulatory requirements and increased enforcement frequency. Failure to comply with these laws and regulations, including related regulatory enforcement and/or private litigation resulting from a potential privacy breach, could result in governmental investigations, significant fines and penalties, damages from private causes of action or reputational harm. Additionally, we are subject to laws, rules and regulations regarding cross-border transfers of personal data, including laws relating to transfer of personal data outside the European Economic Area. If we cannot rely on existing mechanisms for transferring personal data, we may be unable to transfer personal data of employees and clients in those regions, which could adversely affect our business, financial condition and operating results.
An impairment of all or part of our goodwill or our intangible assets could have a material adverse impact on our net earnings and net worth.
As of December 31, 2021,29, 2023, we had $2.1 billion of goodwill and $708$618 million of intangible assets recorded on our consolidated balance sheets. Goodwill represents the excess of cost over the fair market value of net assets acquired in business combinations. We perform an annual analysis of our goodwill on October 1 to determine if it has become impaired. We perform an interim analysis to determine if our goodwill has become impaired if events occur or circumstances change that would more likely than not reduce our enterprise fair value below its book value. These events or circumstances could include a significant change in the business climate, including a significant sustained decline in a reporting unit’s market value, legal factors, operating performance indicators, competition, sale or disposition of a significant portion of our business, potential government actions toward our facilities and various other factors. If the fair value of a reporting unit is less than its carrying value, we could be required to record an impairment charge. An impairment of all or a part of our goodwill or intangible assets could have a material adverse effect on our net earnings and net worth.
Our actual results could differ from the estimates and assumptions used to prepare our financial statements.
The preparation of our consolidated financial statements in conformity with U.S. GAAP requires us to make estimates and assumptions that affect the reported amounts of certain assets, and liabilities; the reported amounts ofliabilities, revenues and expenses for the periods covered and certain amounts disclosed in the notes to our consolidated financial statements. Areas requiring significant estimates and assumptions by our management include the following:
•project revenues, costs and profits on our contracts, including recognition of estimated losses on uncompleted contracts;
•award fees, costs and profits on government services contracts;
•client claims and recoveries of costs from subcontractors, vendors and others;
•provisions for income taxes and related valuation allowances and tax uncertainties;
•recoverability of goodwill;
•recoverability of other intangibles and long-lived assets and related estimated lives;
•recoverability of equity method investments;
•valuation of pension obligations and pension assets;
•accruals for estimated liabilities, including litigation accruals;
•consolidation of VIEs;
•valuation of share-based compensation; and
•valuation of assets and liabilities acquired in business combinations.
These estimates are based on information available through the date of the issuance of the financial statements and actual results could differ from those estimates, which could have a material adverse impact on our financial condition, and results of operations.operations and cash flows.
We ship a significant amount of cargo using seagoing vessels, exposing us to certain maritime risks.
We execute different projects in remote locations around the world and procure equipment and materials on a global basis. Depending on the type of contract, location, nature of the work and the sourcing of equipment and materials, we may charter seagoing vessels under time and bareboat charter arrangements and assume certain risks typical of those agreements. Such risks may include damage to the ship, liability for cargo and liability that charterers and vessel operators have to third
parties “at law.” In addition, we ship a significant amount of cargo and are subject to hazards of the shipping and transportation industry.
Risks Related to Our Industry
The U.S. government awards its contracts through a rigorous competitive process and our efforts to obtain future contracts from the U.S. government may be unsuccessful.
The U.S. government conducts a rigorous competitive process for awarding most contracts. In the services arena, the U.S. government uses multiple contracting approaches. Historically, omnibus contract vehicles have been used for work that is done on a contingency or as-needed basis. In more predictable “sustainment” environments, contracts may include fixed-price,
cost-reimbursable and time-and-materials elements. The U.S. government also favors multiple award task order contracts in which several contractors are selected as eligible bidders for future work. Such processes require successful contractors to continually anticipate customer requirements and develop rapid-response bid and proposal teams as well as maintain supplier relationships and delivery systems to react to emerging needs. In addition, U.S. government procurement practices sometimes emphasize price over qualitative factors, such as technical capability and past performance. As a result of these competitive pricing pressures, our profit margins on future U.S. government contracts may be reduced and may require us to make sustained efforts to reduce costs to remain competitive.
We face rigorous competition and pricing pressures for any additional contract awards from the U.S. government. Many of our existing contracts must be recompeted when their original period of performance ends. Recompetitions representends, representing opportunities for competitors to take market share away from us or for our customers to obtain more favorable terms. We may be required to qualify or continue to qualify under the various multiple award task order contract criteria. Therefore, it may be more difficult for us to win future awards from the U.S. government and we may have other contractors sharing in U.S. government awards that we win. Once a contract is awarded, it may be subject to a lengthy protest processprocess. Bid protests can result in significant expenses to us, contract modifications or even loss of the contract award and the resolution can extend the time until contract activity can begin and delay the recognition of sales and defer underlying cash flows and adversely affect our operating results. Our efforts to protest or challenge any bids for contracts that were not awarded to us also may be unsuccessful.
Our profitability and cash flow may vary based on the mix of our contracts and programs, our performance, and our ability to control costs.
Our profitability and cash flow may vary materially depending on the types of government contracts undertaken, the nature of services performed under those contracts, the costs incurred in performing the work, the achievement of other performance objectives and the stage of performance at which the right to receive fees is determined, particularly under award and incentive-fee contracts. Failure to perform to customer expectations and contract requirements may result in reduced fees or losses and may adversely affect our financial performance.
Our GS business segment primarily performs work in the U.S. under cost-reimbursable contracts with the DoD and other U.S. governmental agencies. If the U.S. government concludes costs charged to a contract are not reimbursable under the terms of the contract or applicable procurement regulations, these costs are disallowed or, if already reimbursed, we may be required to refund the reimbursed amounts to the customer. Such conditions may also include interest and other financial penalties.
Contract types primarily include fixed-price and cost-reimbursable contracts. Cost-reimbursable contracts provide for the payment of allowable costs incurred during performance of the contract plus a fee up to a ceiling based on the amount that has been funded. Cost, schedule or technical performance issues with respect to cost-reimbursable contracts could result in contract delays,reduced fees, lower profit rates, or ultimately, the lossprogram cancellation. Under fixed price contracts, we receive a fixed price irrespective of the contract.actual costs we incur and therefore we carry the burden of any cost overruns. Due to the fixed-price nature of the contracts, if our actual costs exceed our estimates, our margins and profits are reduced and we could incur a loss on the respective contract which could adversely affect our financial results.
Under both fixed-price and cost-reimbursable contracts, if we are unable to control costs, our operating results could be adversely affected. Costs to complete a contract may increase for many reasons, including technical and manufacturing challenges, schedule delays, workforce-related issues, the timeliness and availability of materials from suppliers, internal and subcontractor performance or product quality issues, inability to meet cost reduction initiatives or achieve efficiencies from digital transformation, changing laws or regulations, inflation and natural disasters. Certain contracts may impose other risks, such as forfeiting fees, paying penalties, or providing replacement systems in the event of performance failure. Many of our contracts include multiple option years exercisable at the customer’s discretion, which carries risk. The customer may decline to exercise an option, or the customer may exercise an option on a contract for which we expect to incur a loss or perform at a low margin, either of which could adversely affect our financial results.
The U.S. government may adopt new contract rules and regulations or revise its procurement practices in a manner adverse to us at any time.
We face rigorous competition and pricing pressures for any additional contract awards from the U.S. government. Our industry has experienced, and we expect it will continue to experience, significant changes to business practices as a result of an increased focus on affordability, efficiencies and recovery of costs, among other items. From time to time, new laws and regulations are enacted, and government agencies adopt new interpretations and enforcement priorities relative to laws and regulations already in effect. U.S. government agencies have and may continue to face restrictions or pressure regarding the type and amount of services that they may obtain from private contractors. Legislation, regulations and initiatives dealing with
procurement reform as well as any resulting shifts in the buying practices of U.S. government agencies, such as increased usage of fixed-price contracts, multiple-award contracts and small business set-aside contracts, could have adverse effects on government contractors, including us. In addition, U.S. government procurement practices sometimes emphasize price over qualitative factors, such as technical capability and past performance. As a result of these competitive pricing pressures, our profit margins on future U.S. government contracts may be reduced and may require us to make sustained efforts to reduce costs to remain competitive.
Our programs for the U.S. government often operate for periods of time under Undefinitized Contract Actions (UCAs), which means that we begin performing our obligations before the terms, specifications or price are finally agreed to between the parties. The U.S. government has (and has exercised in the past) the ability to unilaterally definitize contracts, which, absent a successful appeal, obligates us to perform under terms and conditions imposed by the U.S. government. This can affect our ability to negotiate mutually agreeable contract terms and, if a contract is unilaterally imposed upon on us, it may negatively affect our expected profit and cash flows on a program or impose burdensome terms.
Heightened competition could impact our ability to obtain contracts which could reduce our market share and profits.
We serve markets that are global and highly competitive. We compete with larger companies that have greater name recognition, financial resources and a larger technical staff. We also compete with smaller, more specialized companies that are able to concentrate their resources on particular areas. Additionally, we compete with the U.S. government’s own capabilities.
The markets in which we operate are characterized by rapidly changing technology and the needs of our customers change and evolve regularly. Therefore, our success depends on our ability to invest in and develop our people and technology to enable us to deliver services and products that address these changing needs. To remain competitive, we must consistently provide superior service, technology and performance on a cost-effective basis to our customers while understanding customer priorities and maintaining customer relationships. Our competitors may be able to provide our customers with differentiated or superior capabilities or technologies or more attractive contract terms than we can provide, including technical qualifications, past contract experience, geographic presence, price and the availability of qualified professional personnel. Some of our competitors have made or could make acquisitions of businesses, or establish teaming or other agreements among themselves or third parties, that allow them to offer more competitive and comprehensive solutions. As a result of such acquisitions or arrangements, our current or potential competitors may be able to accelerate the adoption of new technologies that better address customer needs, devote greater resources to bring these products and services to market, initiate or withstand substantial price competition or develop and expand their product and service offerings at a more accelerated rate. These competitive pressures in our market or our failure to compete effectively may result in fewer orders, reduced revenue and margins and loss of market share.
Some of our U.S. government work requires KBR and certain of its employees to qualify for and retain a government-issued security clearance. If we are unable to hire or retain employees with adequate security clearances, we may be unable to perform our obligations to customers.
We currently hold U.S. government-issued facility security clearances and a large number of our employees have qualified for and hold U.S. government-issued personal security clearances necessary to qualify for and ultimately perform certain U.S. government contracts. Obtaining and maintaining security clearances for employees involves lengthy processes, and it is difficult to identify, recruit and retain employees who already hold security clearances. If our employees are unable to obtain or retain security clearances or if our employees who hold security clearances terminate employment with us and we are unable to find replacements with equivalent security clearances, we may be unable to perform our obligations to customers whose work requires cleared employees, or such customers could terminate their contracts or decide not to renew them upon
their expiration. Our facility security clearances could be marked as "invalid" for several reasons including unapproved foreign ownership, control or influence, mishandling of classified materials or failure to properly report required activities. An inability to obtain or retain our facility security clearances or engage employees with the required security clearances for a particular contract could disqualify us from bidding for and winning new contracts with security requirements as well as result in the termination of any existing contracts requiring such clearances.
Our U.S. government contract work is regularly reviewed and audited by the U.S. government, U.S. government auditors and others, and these reviews can lead to withholding or delay of payments to us, non-receipt of award fees, legal actions, fines, penalties and liabilities and other remedies against us.
U.S. government contracts are subject to specific regulations such as the FAR, the Truth in Negotiations Act,Truthful Cost or Pricing Data Statute, CAS, the Service Contract Act and DoD security regulations. Failure to comply with any of these regulations, requirements or statutes may result in contract price adjustments, financial penalties or contract termination. Our U.S. government contracts are subject to audits, cost reviews and investigations by U.S. government contracting oversight agencies such as the DCAA. The DCAA reviews the adequacy of, and our compliance with, our internal control systems and policies, including our labor, billing, accounting, purchasing, property, estimating, compensation and management information systems. The DCAA has the authority to conduct audits and reviews to determine if we are complying with the requirements under the FAR and CAS, pertaining to the allocation, period assignment and allowability of costs assigned to U.S. government contracts. The DCAA presents its report findings to the DCMA. Should the DCMA determine that we have not complied with the terms of our contract or applicable statutes and regulations, payments to us may be disallowed, which could result in adjustments to previously reported revenues and refunding of previously collected cash proceeds. Additionally, we currently are and may be subject to additional qui tam litigation brought by private individuals on behalf of the U.S. government under the Federal False Claims Act, which could include claims for treble damages. These suits may remain under seal (and hence, be unknown to us) for some time while the U.S. government decides whether to intervene on behalf of the qui tam plaintiff. For more information, see Note 14 to our consolidated financial statements in Part II, Item 8 of this Annual Report on Form 10-K.
Given the demands of working for the U.S. government, we may have disagreements or experience performance issues. When performance issues arise under any of our U.S. government contracts, the U.S. government retains the right to pursue remedies, which could include termination under any affected contract. If any contract were so terminated, our ability to secure future contracts could be adversely affected. Other remedies that could be sought by our U.S. government customers for any
improper activities or performance issues include sanctions such as forfeiture of profits, suspension of payments, fines and suspensions or debarment from doing business with the U.S. government. Further, the negative publicity that could arise from disagreements with our customers or sanctions as a result thereof could have an adverse effect on our reputation in the industry, reduce our ability to compete for new contracts and may also have a material adverse effect on our business, financial condition, results of operations and cash flows.
Several of our contracts with the U.S. government are classified or subject to other security restrictions, which may limit investor insight into portions of our business.
A significant portion of our revenue is from contracts with the U.S. government that are classified or subject to security restrictions that preclude the disclosure of certain information. Additionally, a large number of our employees have security clearances which prohibit them from providing information to investors and other KBR employees without security clearances regarding certain clients and the related services we provide to them. As we are limited in our ability to provide information about these contracts and services, such as the scope of work, associated risks and any disputes or claims, our investors may have limited insight into a substantial portion of our business which may hinder their ability to fully evaluate the risks related to that portion of our business.
Demand for our services provided under government contracts areis directly affected by spending by our customers.
We derive a significant portion of our revenues from contracts with agencies and departments of the U.S., the U.K. and Australia governments, which is directly affected by changes in government spending and availability of adequate funding. Additionally, government regulations generally include the right for government agencies to modify, delay, curtail, renegotiate or terminate contracts at their convenience any time prior to their completion. As we are a significant government contractor, our financial performance is affected by the allocation and prioritization of government spending. Factors that could affect current and future government spending include:
•policy or spending changes implemented by the current administration, defense department or other government agencies;
•increased polarization of political parties;
•failure to pass budget appropriations, continuing funding resolutions or other budgetary decisions;decisions, including any failure of the U.S. federal government to manage its fiscal matters or to raise or further suspend the debt ceiling;
•changes, delays or cancellations of government programs or requirements;
•adoption of new laws or regulations that affect companies providing services to the governments;
•reduced buying power as a result of inflation;
•curtailment of the governments’ outsourcing of services to private contractors; or
•the level of political instability due to war, conflict or natural disasters.
We face uncertainty with respect to our government contracts due to the fiscal, economic and budgetary challenges facing our customers. Potential contract delays, modifications or terminations may arise from resolution of these issues and could cause our revenues, profits and cash flows to be lower than our current projections. The loss of work we perform for governments or decreases in governmental spending and outsourcing could have a material adverse effect on our business, results of operations and cash flows.
Fluctuations in commodity prices may affect our customers’ investment decisions which may result in existing project cancellations or delays or changes in the timing and funding of new awards.
Demand for many of our services in our commodity-based markets depends on capital spending by oil and natural gas companies, including national and international oil companies, and by industrial companies, which is directly affected by trends in the prices of oil, natural gas and commodities prices.other commodities. Fluctuations in oil, natural gas and commoditiescommodity prices can have a direct effect on the profitability and cash flow of such companies, which may impact their willingness to continue pursuing their current investments or make new capital investments. Additionally, commodity prices can also significantly affect the costs of projects. Rising commodity prices can negatively impact the potential returns on investments that are planned, as well as those in progress, and result in customers deferring new investments or canceling or delaying existing projects. To the extent commodity prices decline or fluctuate, or the perceived risk thereof, and our customers defer new investments or cancel or delay existing projects, the demand for our services may decrease, which could have a material adverse impact on our business, financial condition and results of operations.
Risks Related to Financial Conditions and Markets
Current or future economic conditions, including recession or inflation, in the credit markets may negatively affect the ability to operate our or our customers’ businesses, finance working capital, implement our acquisition strategy and access our cash and short-term investments.
We finance our business using cash provided by operations, but also depend on the availability of and access to credit markets, including bank credit lines, letters of credit and surety bonds. Our ability to obtain capital or financing on satisfactory terms will depend in part on prevailing market conditions as well as our operating results. The lack of adequate credit or funding or the unavailability of funding on terms satisfactory to us, could have a material adverse effect on our business and financial performance.
Disruptions of the capital markets could also adversely affect our clients’ ability to finance projects and could result in contract cancellations or suspensions, project delays and payment delays or defaults by our clients. In addition, clients may be unable to fund new projects, may choose to make fewer capital expenditures or otherwise slow their spending on our services or seek contract terms more favorable to them. Our government clients may face budget deficits that prohibit them from funding proposed and existing projects or that cause them to exercise their right to terminate our contracts with little or no prior notice. Furthermore, any financial difficulties suffered by our subcontractors or suppliers could increase our cost or adversely impact project schedules. These disruptions could materially impact our backlog and financial performance.
In addition, we are subject to the risk that the lending counterparties to our Revolver may be unable to meet their contractual obligations to us if they suffer catastrophic demands on their liquidity. We also routinely enter into contracts with counterparties, including vendors, suppliers and subcontractors that may be negatively affected by events in the capital markets. If those counterparties are unable to perform their obligations to us or our clients, we may be required to provide additional services or make alternate arrangements on less favorable terms with other parties to ensure adequate performance and delivery of service to our clients. These circumstances could also lead to disputes and litigation with our partners or clients, which could have a material adverse effect on our reputation, business, financial condition and results of operations.
Furthermore, our cash balances and short-term investments are maintained in accounts held at major banks and financial institutions located primarily in North America, the U.K. and Australia. Deposits are in amounts that exceed available
insurance. Although none of the financial institutions in which we hold our cash and investments have gone into bankruptcy, been forced into receivership or have been seized by their governments, there is a risk that this may occur in the future. If this were to occur, we would be at risk of not being able to access our cash and investments, which may result in a temporary decrease in liquidity that could impede our ability to fund operations or execute acquisitions.
We may be unable to obtain new contract awards if we are unable to provide our customers with letters of credit, surety bonds or other credit enhancements.
Customers may require us to provide credit enhancements, including letters of credit, bank guarantees or surety bonds. We are often required to provide performance guarantees to customers to indemnify the customer should we fail to perform our obligations under the contract. Failure to provide the required credit enhancements on terms required by a customer may result in an inability to bid, win or comply with the contract. Historically, we have had adequate letters of credit capacity but such capacity beyond our Senior Credit Facility is generally at the provider’s sole discretion. Due to events that affect the banking and insurance markets, generally, letters of credit or surety bonds may be difficult to obtain or may only be available at significant cost. Moreover, many projects are very large and complex, which often necessitates the use of a joint venture, often with a market competitor, to bid on and perform the contract. Entering into joint ventures or partnerships exposes us to the credit and performance risk of third parties, many of whom may not be financially as strong or may encounter financial difficulties. If our joint ventures or partners fail to perform, we may be required to complete the project activities. In addition, future projects may require us to obtain letters of credit that extend beyond the term of our Senior Credit Facility. Any inability to bid for or win new contracts due to the failure of obtaining adequate letters of credit, surety bonds or other customary credit enhancements could have a material adverse effect on our business prospects and future revenues.
Our Senior Credit Facility imposes restrictions that limit our operating flexibility and may result in additional expenses, and such facility may not be available if financial covenants are violated or if an event of default occurs.
Our Senior Credit Facility includes a $1 billion revolving credit facility which matures in November 2026. ItFebruary 2029, a Term Loan A with debt tranches denominated in U.S. dollars and British pound sterling and a Term Loan B. The Senior Credit Facility contains a number of covenants restricting, among other things, our ability to incur liens and indebtedness, sell assets, repurchase our equity shares and make certain types of investments. We are also subject to certain financial covenants,
including but not limited to maintenance of a maximum consolidated net leverage ratio and a consolidated interest coverage ratio as defined in the Senior Credit Facility agreement.
A breach of any covenant or our inability to comply with the required financial ratios could result in a default under our Senior Credit Facility, and we can provide no assurance that we will be able to obtain the necessary waivers or amendments from our lenders to remedy a default. In the event of any default not cured or waived, the lenders are not obligated to provide funding or issue letters of credit and could elect to require us to apply available cash to collateralize any outstanding letters of credit and declare any outstanding borrowings, together with accrued interest and other fees, to be immediately due and payable, thus requiring us to apply available cash to repay any borrowings then outstanding. If we are unable to cash collateralize our letters of credit or repay borrowings with respect to our Senior Credit Facility when due, our lenders could proceed against the guarantees of our major domestic subsidiaries. If any future indebtedness under our Senior Credit Facility is accelerated, we can provide no assurance that our assets would be sufficient to repay such indebtedness in full.
LIBOR is expected to no longer be available after June 30, 2023 for the primary U.S. dollar LIBOR settings used by the Company. As a result, thereWe have been significant efforts by market participants and government and regulatory bodies in the United States and abroad to identify suitable replacement rates and develop processes for migration to the use of the alternatives. Ouramended our Senior Credit Facility gives us the option(Amendment Nos. 7, 8 and 9 to our Senior Credit Facility) to transition our Term A-1 Facility, Term A-2 Facility, Revolving Credit Facility and Term B Facility from LIBOR to SOFR. Following these amendments, we no longer have any facilities or term loans that continue to use LIBOR as a funding benchmarkbenchmark.The composition and our interestcharacteristics of SOFR, a relatively new reference rate, swaps are based onnot the one-month U.S. dollarsame as those of LIBOR. Our Senior Credit Facility allows us and the administrative agent to replace LIBOR with an alternative benchmark rate, subject to the right of the majority of the lenders to object thereto, as set forthAs a result, there can be no assurance that SOFR will perform in the Senior Credit Facility. The International Swapssame way as LIBOR would have at any time or in response to changes including, but not limited to, interest and Derivatives Association has issued terms that can be applied to determine the alternative referenceyield rates, under swap transactions and the timing of the switch to such alternatives. Any discontinuation of LIBOR and use of an alternative benchmark rate under our credit facilitymarket volatility or our interest rate swap transactions is expected to be accompanied by a spread adjustment. The implementation of such alternative reference rates and spread adjustments could cause our funding costs to increase, including if there arises a differential between the alternative reference rate and/global economic, financial, political, or spread adjustment under our credit facility and the alternative reference rate and/or spread adjustment applicable to our interest rate hedges.
Our indebtedness and the associated covenants could materially adversely affect our ability to obtain additional financing, including for acquisitions and capital expenditures, limit our flexibility to manage our business, prevent us from fulfilling our financial obligations and restrict our use of capital.
We had approximately $1.9$1.8 billion of indebtedness outstanding as of December 31, 202129, 2023 which could have negative consequences to us, including, but not limited to:
•requiring us to dedicate cash flow from operations to the repayment of debt, interest and other related amounts, which reduces the funds we have available for other purposes, such as working capital, capital expenditures, acquisitions, payment of dividends and share repurchase programs;
•making it more difficult or expensive for us to obtain any necessary future financing for working capital, capital expenditures, debt service requirements, debt refinancing, acquisitions or other purposes;
•reducing our flexibility in planning for or reacting to changes in our industry and market conditions;
•causing us to be more vulnerable in the event of a downturn in our business;
•exposing us to increased interest rate risk given that a portion of our debt obligations are at variable interest rates; and
•increasing our risk of a covenant violation under our Senior Credit Facility.
We may be required to contribute additional cash to meet our significant underfundedany unfunded benefit obligations associated with defined benefit plans we manage.
We have frozen defined benefit pension plans for employees primarily in the U.S., the U.K. and Germany. At December 31, 2021,29, 2023, our defined benefit pension plans had an aggregate funding deficit (calculated as the excess of the projected benefit obligations over the fair value of plan assets) of approximately $88 million, the majority$15 million. The largest potential source of whichdeficit is related to our defined benefit pension plan in the U.K.U.K that is in a funding deficit position at December 29, 2023. In the future, our pension surpluses and deficits may increase or decrease depending on changes in the levels of interest rates, pension plan performance and other factors that may require us to make additional cash contributions to our pension plans and recognize further increases in our net pension cost to satisfy our funding requirements. If we are required or elect to make up all or a significant portion of the deficit for any underfunded benefit plans, our financial position could be materially and adversely affected.
Our U.K. defined benefit pension plan has an aggregate funding deficit. Our U.K. pension plan has been frozen to new participants for a number of years but can still have an aggregate funding deficit due to assumptions and factors noted below. For our frozen defined benefit pension plan in the U.K., the annual minimum funding requirements are based on a binding agreement with the plan trustees that is negotiated on a triennial basis. This agreement also includes other assurances and commitments regarding the business and assets that support the U.K. pension plan. It is possible that, following future valuations of our U.K. pension plan assets and liabilities or following future discussions with the trustees, the annual funding obligation will change. The future valuations under our U.K. pension plan can be affected by a number of assumptions and factors, including legislative changes, assumptions regarding interest rates, inflation, mortality and retirement rates, the investment strategy and performance of the plan assets and (in certain circumstance) actions by the U.K. pensions regulator. Adverse changes in the equity markets, interest rates or actuarial
assumptions and legislative or other regulatory actions could increase the risk that the funding requirements increase following the next triennial negotiation. A significant increase in our funding requirements for our U.K. pension plan could result in a material adverse effect on our cash flows and financial position.
We are subject to foreign currency exchange risks that could adversely affect our results of operations and our ability to reinvest earnings from operations. Our ability to mitigate our foreign exchange risk through hedging transactions may be limited.
We generally attempt to denominate our contracts in U.S. dollars or in the currencies of our costs. However, we enter into contracts that subject us to currency risk exposure, primarily when our contract revenues are denominated in a currency different from the contract costs. A portion of our consolidated revenues and consolidated operating expenses are in foreign currencies. As a result, we are subject to foreign currency risks, including risks resulting from changes in currency exchange rates and limitations on our ability to reinvest earnings from operations in one country to fund the financing requirements of our operations in other countries.
The governments of certain countries have or may in the future impose restrictive exchange controls on local currencies and it may not be possible for us to engage in effective hedging transactions to mitigate the risks associated with fluctuations of a particular currency. We are often required to pay all or a portion of our costs associated with a project in the local currency. As a result, we generally attempt to negotiate contract terms with our customer, who is often affiliated with the local government, or has a significant local presence, to provide that we are only paid in the local currency for amounts that match
our local expenses. If we are unable to match our local currency costs with revenues in the local currency, we would be exposed to the risk of adverse changes in currency exchange rates.
Risks Related to Our Common Stock
If we need to sell or issue additional shares of common stock to refinance existing debt or to finance future acquisitions, our existing shareholder ownership could be diluted. In addition, the convertible note hedge and warrant transactions that we entered into in connection with the pricing of the Convertible Notes may affect the value of our common stock.
Part of our business strategy is to expand into new markets and enhance our position in existing markets, both domestically and internationally, which may include the acquisition and merging of complementary businesses. To successfully fund and complete such potential acquisitions, or to refinance our existing debt, we may issue additional equity securities that may result in dilution of our existing shareholder ownership's earnings per share.
For example, we have previously issued convertible notes and may again in the future issue additional convertible notes. In addition, in connection with the pricing of the Convertible Notes, we entered into convertible note hedge transactions and warrant transactions with certain option counterparties. We also entered into warrant transactions withAlthough the option counterparties. The convertible note hedge transactions and warrant transactions are generallyno longer outstanding, we may enter into other hedge transactions and warrant transactions if we issue more convertible notes in the future. Convertible note hedge transactions are expected to reduce potential dilution to our common stock upon any conversion of the Convertible Notesany convertible notes and/or offset any cash payments we are required to make in excess of the principal amount of converted Convertible Notes,convertible notes, as the case may be. However, the warrant transactions could separately have a dilutive effect to the extent that the market value per share of our common stock exceeds the strike price of the warrants at the time of exercise.
Provisions in our charter documents, Delaware law and our Senior Credit Facility may inhibit a takeover or impact operational control that could adversely affect the value of our common stock.
Our certificate of incorporation and bylaws, as well as Delaware corporate law, contain provisions that could delay or prevent a change of control or changes in our management that a stockholder might consider favorable. These provisions include, among others, prohibiting stockholder action by written consent, advance notice for making nominations at meetings of stockholders, providing for the state of Delaware as the exclusive forum for lawsuits concerning certain corporate matters and the issuance of preferred stock with rights that may be senior to those of our common stock without stockholder approval. These provisions would apply even if a takeover offer may be considered beneficial by some of our stockholders. If a change of control or change in management is delayed or prevented, the market price of our common stock could decline. Additionally, our Senior Credit Facility contains a default provision that is triggered upon a change in control of at least 25%, which would impede a takeover and/or make a takeover more costly.
We may change our dividend policy in the future.
We have maintained a regular cash dividend program since 2007. We anticipate continuing to pay quarterly dividends during 2022.2024. However, any future payment of dividends, including the timing and amount of any such dividends, is at the
discretion of our Board of Directors and may depend upon our earnings, liquidity, financial condition, alternate capital deployment opportunities or any other factors that our Board of Directors considers relevant. A change in our regular cash dividend program could have an adverse effect on the market price of our common stock.
Risks Related to Regulations and Compliance
We could be adversely impacted if we fail to comply with international export and domestic laws, which are rigorously enforced by the U.S. government.
To the extent that we export products, technical data and services outside of the U.S., we are subject to laws and regulations governing trade and exports, including, but not limited to, the International Traffic in Arms Regulations and the Export Administration Regulations, and trade sanctions against embargoed countries, including sanctions and export restrictions related to Russia's invasion of Ukraine, which are administered by the Office of Foreign Asset Control within the Department of the Treasury. A failure to comply with these laws and regulations could result in civil or criminal sanctions, including the imposition of fines as well as the denial of export privileges and debarment from participation in U.S. government contracts. U.S. government contract violations could result in the imposition of civil and criminal penalties or sanctions, contract termination, forfeiture of profit or suspension of payment, any of which could result in losing our status as an eligible U.S. government contractor and cause us to suffer serious reputational harm, which could have a material adverse effect on our business, financial condition or results of operations.
We are subject to anti-bribery laws in the U.S. and other jurisdictions, violations of which could result in suspension or debarment of our ability to contract with the U.S. state or local governments, U.S. government agencies or the U.K. MoD, third-party claims, loss of customers, adverse financial impact, damage to reputation and adverse consequences on financing for current or future projects.
The FCPA, the U.K. Bribery Act and similar anti-bribery laws ("Anti-bribery Laws") in other jurisdictions generally prohibit companies and their intermediaries from making improper payments to government officials for the purpose of obtaining or retaining business. Our policies mandate compliance with these Anti-bribery Laws. We operate in many parts of the world that have experienced governmental corruption to some degree and, in certain circumstances, strict compliance with Anti-bribery Laws may conflict with local customs and practices. We train our staff concerning Anti-bribery Laws and we also inform our partners, subcontractors, agents and other third parties who work for us or on our behalf that they must comply with the requirements of these Anti-bribery Laws. We also have procedures and controls in place to monitor internal and external compliance. We cannot provide complete assurance that our internal controls and procedures will always protect us from the reckless or criminal acts committed by our employees or third parties working on our behalf. If we are found to be liable for violations of these laws (either due to our own acts or our inadvertence, or due to the acts or inadvertence of others), we could suffer from criminal or civil penalties or other sanctions, which could have a material adverse effect on our business.
Certain of our work sites are inherently dangerous and we are subject to various environmental and worker health and safety laws and regulations. If we fail to maintain safe work sites or to comply with these laws and regulations, we may suffer damage to our reputation and incur significant costs and penalties that could have a material adverse effect on our business, financial condition, results of operations and cash flows.
Certain work sites often expose our employees and others to chemical and manufacturing processes, highly-regulated materials, large pieces of mechanized equipment and moving vehicles. Additionally, our employees and others at certain project sites may be exposed to severe weather events or high security risks. Failure to implement effective safety procedures may result in injury, disability or loss of life to these parties. In addition, the projects may be delayed and we may be exposed to litigation or investigations.
Our operations are subject to a variety of environmental, worker health and safety laws and regulations governing the generation, management and use of regulated materials, the discharge of materials into the environment, the remediation of environmental contamination associated with the release of hazardous substances and human health and safety. Violations of these laws and regulations can cause significant delays and additional costs to a project. When we perform our services, our personnel and equipment may be exposed to radioactive and hazardous materials and conditions. We may be subject to claims alleging personal injury, property damage or natural resource damages by employees, customers and third parties as a result of alleged exposure to or contamination by hazardous substances. In addition, we may be subject to fines, penalties or other liabilities arising under environmental and employee safety laws. A claim, if not covered by insurance at all or only partially, could have a material adverse impact on our financial condition, results of operations and cash flows. In addition, more stringent regulation of our customers' operations with respect to the protection of the environment could also adversely affect their operations and reduce demand for our services.
Various U.S. federal, state and local as well as foreign environmental laws and regulations may impose liability for property damage and costs of investigation and cleanup of hazardous or toxic substances on property currently or previously owned by us or arising out of our waste management or environmental remediation activities. These laws may impose responsibility and liability without regard to knowledge or causation of the presence of contaminants. The liability under these laws may be joint and several. The ongoing costs of complying with existing environmental laws and regulations could be substantial and have a material adverse impact on our financial condition, results of operations and cash flows. Changes in the environmental laws and regulations, remediation obligations, enforcement actions, stricter interpretations of existing requirements, future discovery of contamination or claims for damages to persons, property, natural resources or the environment could result in material costs and liabilities that we currently do not anticipate.
Our effective tax rate and tax positions may vary.
We are subject to income taxes in the U.S. and numerous foreign jurisdictions. Significant judgment is required in determining certain components of our worldwide provision for income taxes and a change in tax laws, treaties or regulations, or their interpretation, in any country in which we operate could result in higher taxes on our earnings, which could have a material impact on our earnings and cash flows from operations. In the ordinary course of our business, there are certain transactions and calculations where the ultimate tax determination is uncertain. We are audited by various U.S. and foreign tax authorities in the ordinary course of business, and our tax estimates and tax positions could be materially affected by many factors including the final outcome of tax audits and related litigation, the introduction of new tax accounting standards, legislation, regulations and related interpretations, our global mix of earnings, the realizability of deferred tax assets and
changes in uncertain tax positions. In particular, international operations could adversely be affected by the Organization for Economic Co-operation and Development (OECD)’s proposed international taxation reform and introduction of a global minimum tax. A significant increase in tax rates could have a material adverse effect on our profitability and liquidity.
Risks Related to Climate Change
There is a rapidly evolving awareness and focus from stakeholders, such as investors, customers and current and future employees, with respect to global climate change and the related emphasis on environmental, social and governance practices, which could affect our business.
Continued attention to issues concerning climate change or other environmental matters may result in the imposition of additional environmental regulations, rules, standards and policies that seek to restrict, or otherwise impose limitations or costs upon our operations and the emission of greenhouse gases. International agreements, national, regional and state legislation and regulatory measures, including LNG exports, or other policies and restrictions on emissions of greenhouse gases could affect our clients, including those who are involved in the exploration, production or refining of fossil fuels and those who emit greenhouse gases through the combustion of fossil fuels, or through mining, manufacturing or the utilization or production of materials or goods. Such legislation or restrictions could increase the costs of projects for us and our clients or, in some cases, prevent a project from going forward, thereby potentially reducing the need for our services that could in turn have a material adverse effect on our operations and financial condition. However, policy changes and climate legislation could also increase the overall demand for our services as our clients and partners work to comply with such policies, such as by decarbonizing their industries, transitioning from fossil fuels to renewable energy sources and developing integrated and sustainable solutions, which could have a positive impact on our business. We cannot predict when or whether any of these various legislative and regulatory proposals may become law or what their effect will be on us and our customers.
Furthermore, investor and societal expectations with respect to environmental, social and governance ("ESG") matters have been rapidly evolving and increasing. We risk damage to our reputation if we do not act responsibly in the following key areas: inclusion and diversity, environmental stewardship, support for local communities and corporate governance and transparency. A failure to adequately meet stakeholders' expectations may result in loss of business, diluted market valuation, an inability to attract and retain customers and talented personnel, increased negative investor sentiment toward us and/or our customers and the diversion of investment to other industries, which could have a negative impact on our stock price and our access to and costs of capital.
In addition, standards for tracking and reporting ESG matters continue to evolve. New laws, regulations, policies and international accords relating to ESG matters, including sustainability, climate change, human capital and diversity, are being developed and formalized in Europe, the United States, Asia and elsewhere, which may entail specific, target-driven frameworks and/or disclosure requirements. Our selection of voluntary disclosure frameworks and standards, and the interpretation or application of those frameworks and standards, may change from time to time or differ from those of others, and may not be in line with any new and forthcoming related disclosure rules in the United States and abroad. Methodologies
for reporting ESG data may be updated and previously reported ESG data may be adjusted to reflect improvement in availability and quality of internal and third-party data, changing assumptions, changes in the nature and scope of our operations and other changes in circumstances. Our processes and controls for reporting ESG matters across our operations and supply chain are evolving along with multiple disparate standards for identifying, measuring and reporting ESG metrics, including ESG-related disclosures that may be required by the SEC, European and other regulators, and such standards may change over time, which could result in significant revisions to our current goals, reported progress in achieving such goals or ability to achieve such goals in the future. Any failure, or perceived failure, by us to comply fully with developing interpretations of ESG laws and regulations could harm our business, reputation, financial condition and operating results and require significant time and resources to make the necessary adjustments. If our ESG practices do not meet evolving investor or other stakeholder expectations and standards, then our reputation or our attractiveness as an investment, business partner, acquirer, service provider or employer could be negatively impacted.
Climate change and related environmental issues could have a material adverse impact on our business, financial condition and results of operations.
Climate change related events, such as increased frequency and severity of storms, floods, wildfires, droughts, hurricanes, freezing conditions and other natural disasters, may have a long-term impact on our business, financial condition and results of operations. Although we are proactively seeking measures to mitigate our business risks associated with climate change, we recognize that there are innate climate related risks regardless of where and how we conduct our businesses. As such, a potential disruption to our and our customer's businesses from a natural disaster may cause us to experience work stoppages, project delays, financial losses and additional costs to resume operations such as increased insurance costs or loss of coverage, legal liability and reputational damage.
We may be unable to achieve our sustainability commitments and targets which could result in the loss of investors and customers and damage to our reputation.
We are continuously committed to advancing our environmental, social and governance strategy as evidenced by the establishment and continued focus on delivering on our 2030 operational net-zero carbon ambitions after we achieved carbon neutrality in 2019. However, achievement of our sustainability commitments and targets is subject to risks and uncertainties, many of which are outside of our control. These risks and uncertainties include, but are not limited to: our ability to execute our operational strategies and achieve our goals within the currently projected costs and the expected timeframes; the availability and cost of alternative fuels, global electrical charging infrastructure, off-site renewable energy and other materials and components; unforeseen design, operational and technological difficulties; the outcome of research efforts and future technology developments, including the ability to scale projects and technologies on a commercially competitive basis such as carbon sequestration and/or other related processes; compliance with, and changes or additions to, global and regional regulations, taxes, charges, mandates or requirements relating to greenhouse gas emissions, carbon costs or climate-related goals; labor-related regulations and requirements that restrict or prohibit our ability to impose requirements on third party contractors; adapting products to customer preferences and customer acceptance of sustainable supply chain solutions; the actions of competitors and competitive pressures; an acquisition of or merger with another company that has not adopted similar carbon
negative goals or whose progress towards reaching its carbon negative goals is not as advanced as ours; and the pace of regional and global recovery from the COVID-19 pandemic.
Although we believe that our sustainability commitments and targets are achievable, there is no assurance that we will be able to successfully implement our strategies and achieve our 2030 operational net-zero targets. Investors have recently increased their focus on environmental, social and governance matters, including practices related to greenhouse gas emissions and climate change. Additionally, an increasing percentage of the investment community considers sustainability factors in making investment decisions, and an increasing number of entities are considering sustainability factors in awarding business. The implementation of these goals and initiatives may require considerable investments, and our goals, with all of their contingencies, dependencies and in certain cases, reliance on third-party verification and/or performance, are complex and ambitious and may change, and we cannot guarantee that we will achieve them. If we are unable to meet our commitments and targets and appropriately address sustainability enhancement, we may lose investors, customers or partners, our stock price may be negatively impacted, our reputation may be negatively affected and it may be more difficult for us to compete effectively, all of which could have an adverse effect on our business, results of operations and financial condition, as well as on the price of our common stock.
Item 1B. Unresolved Staff Comments
None.
Item 1C. Cybersecurity
Risk Management and Strategy
Cybersecurity risk is managed within the Company’s Enterprise Risk Management program. Our Enterprise Risk Management team works closely with our global Information Assurance team to continuously evaluate and address cybersecurity risks within the Enterprise Risk Management framework in alignment with our business objectives and operational needs. The Company has established a comprehensive global cybersecurity and information security framework to help safeguard the confidentiality, integrity and access of its information assets and to ensure regulatory, contractual and operational compliance. We understand the importance of preserving trust and protecting personal and other confidential and sensitive information. To assist us, we have a cybersecurity governance framework in place, which is designed to protect information and information systems from unauthorized access, use, disclosure, disruption, modification or destruction. The cybersecurity governance framework is built upon a foundation of advanced security technology, overseen by an experienced and trained team of experts with substantial knowledge of cybersecurity best practices. Our cybersecurity program includes controls designed to identify, protect against, detect, respond to and recover from cybersecurity and information security incidents.
The Company's cybersecurity and information security framework includes risk assessment and mitigation procedures through a threat intelligence-driven approach, application controls and enhanced security with ransomware defense. The framework is built upon the National Institute of Standards and Technology (NIST) Cyber Security Framework for measuring overall readiness to respond to cyber threats and incorporates International Organization for Standardizations (ISO) 27001 standards for general information technology security controls and Sarbanes-Oxley (SOX) for assessment of internal controls. KBR's global cybersecurity risk program also integrates the following cybersecurity frameworks across our regional operations: US Defense Federal Acquisition Regulation Supplement (DFARS) and NIST 800-171, UK Cyber Essentials and Australia's Essential Eight.
The Company utilizes policies and procedures, software, training programs and hardware solutions to protect and monitor its environment, including multifactor authentication on all critical systems, firewalls, intrusion detection and prevention systems, vulnerability and penetration testing and identity management systems. Our Chief Information Security Officer (CISO) oversees the Company’s approach to managing cybersecurity and digital risk. Our CISO reports to the General Counsel, is supported by and collaborates with the Company's executive leadership team and regularly engages with cross-functional teams at the Company, including Digital Technology, Legal, Audit, Human Resources, Facilities and Corporate Risk. Our Chief Compliance Officer (CCO), Chief Information Officer (CIO) and CISO oversee our dedicated technology risk management, which work in partnership with our internal audit department and data privacy team to review information technology-related internal controls with our independent registered public accounting firm as part of the overall internal controls process.
The Company provides mandatory annual security awareness education and training for all employees, new hires and contractors, conducts regular internal “phishing” testing and requires additional training for “clickers,” and publishes periodic tips to inform our user population of cyber best practices, any emerging external or internal threats and data privacy requirements applicable in the jurisdictions in which we operate.
We maintain a robust Cybersecurity Incident Response Plan, which provides a framework for handling cybersecurity incidents based on the severity of the incident and facilitates cross-functional coordination across the Company, and have established a global Security Operations Center to support enterprise visibility to cyber incidents in real time. Our Incident Response Plan includes the activities necessary to comply with applicable contractual and legal obligations and mitigate brand and reputational damage. We update our Cybersecurity Incident Response Plan on a regular basis.
We also engage with a range of external experts, including cybersecurity assessors, consultants and auditors, to assess and report on the effectiveness of our cybersecurity and data privacy controls, compliance with international and regional cybersecurity standards and our internal incident response preparedness, as well as to help identify areas for continued focus and improvement. The Company also has a third-party risk management program that assesses the cyber-related risks from our vendors and suppliers. We share threat intelligence and collaborate with organizations across different industries to share best practices, fight cybercrime, enhance privacy, discuss new technologies, better understand the evolving regulatory environment and advance capabilities in these areas. We also benchmark our activities and results against select peers.
Our cybersecurity team also regularly tests our controls through penetration testing, vulnerability scanning and attack simulation. We conduct annual cybersecurity penetration test exercises to evaluate the Company's cybersecurity controls, Cybersecurity Incident Response plans and identify areas for improvement. The Company conducts additional cybersecurity tabletop exercises moderated by an independent third party with respect to breach and other problematic information security scenarios. During each exercise, the moderator poses questions to participants and advises how other companies typically respond to similar situations. Participants have included the Company’s CEO; Presidents; Executive Vice President, General Counsel and Corporate Secretary; Executive Vice President and Chief Financial Officer; Senior Vice President, Finance Operations and Chief Accounting Officer; Vice President and Chief Compliance Officer; CIO; and CISO; and other members of executive management and employees, as well as our board of directors when appropriate.
Risks from Cybersecurity Threats
In the last three fiscal years, we have not experienced any material information security breach incidences and the expenses we have incurred from information security breach incidences were immaterial. We have not incurred any material penalties and settlements related to any cybersecurity breach. Other risks from cybersecurity threats have also not materially impacted our business strategy, results of operations or financial condition, and as of the date of this report, we do not reasonably believe that such risks will have a material impact on our business strategy, results of operations or financial condition.
Governance
Our CISO oversees the Company’s approach to managing cybersecurity and digital risk and leads our global Information Assurance team, which includes representatives based in several of our worldwide locations. Our CISO brings over 15 years of experience, which includes implementing and verifying effectiveness of cybersecurity controls in high-security environments, serving as a cybersecurity consultant and virtual CISO to clients in the government and defense sectors, and defining and executing cybersecurity strategy to enable business delivery while simultaneously protecting IP and privacy. Our CISO maintains the following internationally recognized certifications: ISC2 - Certified Information System Security Professional (CISSP) and Project Management Institute - Project Management Professional (PMP).
Our CIO oversees the Company’s information technology infrastructure and implements policies and procedures issued by the CISO within the Company. Our CIO brings over 30 years of experience, garnered across a diverse range of industries and countries, which includes implementing new systems and modifying existing systems for changes in policies and procedures.
Management's Role Managing Risk
Our CISO is responsible for the creation of the Company’s enterprise-wide cybersecurity and information security framework, including the design effectiveness of the Company’s cybersecurity controls. Our CIO is responsible for the implementation of the Company’s cybersecurity and information security framework and the day-to-day execution of our cybersecurity processes and controls. Our governance structure applies a separation of duties approach between our CISO and CIO. The CISO, reporting to the General Counsel, is responsible for monitoring and ensuring that the Company’s cyber policy, risk assessment, verification and training responsibilities are in accordance with the relevant cybersecurity and information security framework. The CIO, reporting to the Chief Financial Officer, is responsible for the Company’s IT security operations and the implementation of policies created by the CISO. All cyber incidents under our existing cyber policy are reported to both the CISO and CIO, which are then communicated through their reporting structure to the General Counsel and Chief Financial Offer. This structure ensures visibility from senior management of operations initiatives and cyber incidents while balancing risks with business needs. The CISO and CIO routinely provide operational updates to the General Counsel and Chief Financial Officer as needed, and updates are provided by the CISO and CIO to both the Cybersecurity and Audit Committees of our board of directors at least quarterly and more often as appropriate, as discussed more fully below.
Board of Directors Oversight
Our board of directors is committed to mitigating data privacy and cybersecurity risks and recognizes the importance of these issues as part of our risk management framework. While the board of directors maintains ultimate responsibility for the oversight of our data privacy and cybersecurity program and risks, it has delegated certain responsibilities to our Cybersecurity Committee and Audit Committee. This committee-level focus on data privacy and cybersecurity allows the board to further enhance its oversight of our cyber risk management framework at the enterprise level. The Cybersecurity and Audit Committees jointly assist the board of directors in its oversight of our data privacy and cybersecurity needs by staying apprised
of our data privacy and information security programs, strategy, policies, standards, architecture, processes and material risks and overseeing responses to security and data incidents. Our board of directors, Cybersecurity Committee and Audit Committee's principal role is one of oversight, recognizing that management is responsible for the design, implementation and maintenance of an effective program for protecting against and mitigating data privacy and cybersecurity risks. The board of directors receives information security and privacy awareness training, which covers, among other matters, the board's oversight obligations and the privacy and security programs in place at the company. Our Cybersecurity and Audit Committees receive updates from our CISO and CIO, at least quarterly and more often as appropriate, on data privacy and security risks, including any material incidents, relevant industry developments, threat vectors and risks identified in periodic penetration tests or vulnerability scans. The committees' updates also include material legal and legislative developments concerning data privacy and security, our approach to complying with applicable law and material engagement with regulators concerning data privacy and cybersecurity from the CISO and General Counsel. Additionally, outside counsel advises the board about best practices for cybersecurity oversight by the board, and the evolution of that oversight over time. Members of the board stay apprised of the rapidly evolving cyber threat landscape through our ongoing director education programming and provide guidance to management as appropriate in order to address the effectiveness of our overall data privacy and cybersecurity program. Four members of our board of directors, two of whom serve as members of the Cybersecurity Committee, have cybersecurity experience.
Item 2.Properties
Our operations are conducted at both owned and leased properties in domestic and foreign locations. Our corporate headquarters are located at 601 Jefferson Street, Houston, Texas 77002. While we have operations worldwide, the following table describes the locations of our more significant existing office facilities:
| | | | | | | | | | | | | | | | |
| Location | | Owned/Leased | | | | Business Segment |
| North America: | | | | | | |
| | | | | | |
| Houston, Texas | | Leased | | | | All |
| | | | | | |
Webster, TexasFulton, Maryland | | Leased | | | | Government Solutions |
| | | | | | |
Fulton,Columbia, Maryland | | Leased | | | | Government Solutions |
| | | | | | |
| Columbia, Maryland | | Leased | | | | Government Solutions
| | | | | | |
| | | | | | |
| | | | | | |
| Lexington Park, Maryland | | Leased | | | | Government Solutions |
| | | | | | |
Ann Arbor, MIChantilly, Virginia | | Leased | | | | Government Solutions |
| | | | | | |
Chantilly,Vienna, Virginia | | Leased | | | | Government Solutions |
| | | | | | |
Vienna,Fairfax, Virginia | | Leased | | | | Government Solutions |
| | | | | | |
Fairfax, Virginia | | Leased | | | | Government Solutions |
| | | | | | |
| Dayton/Beavercreek, Ohio | | Leased | | | | Government Solutions |
| | | | | | |
| Huntsville, Alabama | | Leased | | | | Government Solutions |
| | | | | | |
| Phoenix, Arizona | | Leased | | | | Government Solutions |
| | | | | | |
| El Segundo, California | | Leased | | | | | Government Solutions |
| | | | | | |
| Newark, Delaware | | Leased | | | | | Sustainable Technology Solutions |
| | | | | | |
| | | | | | |
| | | | | | |
| Europe, Middle East and Africa: | | | | | | |
| | | | | | |
| Leatherhead, United Kingdom | | Owned | | | | All |
| | | | | | |
Bristol, United Kingdom | | Leased | | | | Government Solutions |
| | | | | | |
| Glasgow, United Kingdom | | Leased | | | | Government Solutions |
| | | | | | |
| Wiltshire, United Kingdom | | Leased / Owned | | | | Government Solutions |
| | | | | | |
| Al Khobar, Saudi Arabia | | Leased | | | | Sustainable Technology Solutions |
| | | | | | |
Manama, Bahrain | | Leased | | | | All |
| | | | | | |
| Asia-Pacific: | | | | | | |
| | | | | | |
| Chennai, India | | Leased | | | | All |
| | | | | | |
| Majura Park, Australia | | Leased | | | | Government Solutions |
| | | | | | |
| | | | | | |
| | | | | | |
| Delhi (Gurgaon), India | | Leased | | | | Sustainable Technology Solutions |
| | | | | | |
| | | | | | |
| | | | | | |
Perth,Brisbane, Australia | | Leased | | | | Government Solutions |
| | | | | | |
| | | | | | |
| | | | | | |
Brisbane,Sydney, Australia | | Leased | | | | Government Solutions |
| | | | | | |
| | | | | | |
| | | | | | |
| Melbourne, Australia | | Leased | | | | Government Solutions |
We also own or lease numerous small facilities that include sales, administrative and offices as well as warehouses and equipment yards located throughout the world. Our owned Leatherhead property is pledged to secure certain pension obligations in the U.K., and we believe all properties that we currently occupy are suitable for their intended use.
Item 3.Legal Proceedings
Information relating to various commitments and contingencies is described in “Item 1A. Risk Factors” contained in Part I of this Annual Report on Form 10-K and in Notes 6, 1413 and 1514 to our consolidated financial statements in Part II, Item 8 of this Annual Report on Form 10-K and the information discussed therein is incorporated by reference into this Part I, Item 3.
Item 4.Mine Safety Disclosures
Not applicable.
PART II
Item 5.Market for Registrant’s Common Equity, Related Stockholder Matters and Issuer Purchases of Equity Securities
Our common stock is listed on the NYSE and trades under the symbol “KBR.” We have declared a dividend in each quarter during the years ended December 29, 2023 and December 31, 2021 and 2020,2022, and we currently expect that comparable quarterly cash dividends will continue to be paid for the foreseeable future. The declaration, payment and amount of future cash dividends will be at the discretion of our Board of Directors. On February 18, 2022,19, 2024, the Board of Directors declared a dividend of $0.12$0.15 per share, which will be paid on April 15, 2022.2024.
At January 31, 2022,2024, there were 6759 shareholders of record. In calculating the number of shareholders, we consider clearing agencies and security position listings as one shareholder for each agency or listing.
Share Repurchases
On February 25, 2014, the Board of Directors authorized a $350 million share repurchase program. As of December 31, 2019, $160 million remained available under this authorization. On February 19, 2020,October 18, 2022, the Board of Directors authorized an increase of approximately $190 million to our share repurchase program, returning the total authorization level to $350$500 million. As of December 31, 2021, $22529, 2023, $326 million remains available for repurchase under this authorization. On February 19, 2024, the Board of Directors authorized $174 million of share repurchases to be added to the prior authorizations. After the authorization on February 19, 2024, $500 million remains authorized and available for repurchase under this program. The authorization does not obligate the Company to acquire any particular number of shares of common stock and may be commenced, suspended or discontinued without prior notice. The share repurchases are intended to be funded through the Company’s current and future cash flows and the authorization does not have an expiration date.
The following is a summary of share repurchases of our common stock settled during the three months ended December 31, 2021,29, 2023, and the amount available to be repurchased under the authorized share repurchase program:
| | | | | | | | | | | | | | | | | | | | | | | |
| Purchase Period | Total Shares Repurchased (1) | | Average
Price Paid
per Share | |
Shares Repurchased
as Part of Publicly
Announced Plan | | Dollar Value of Maximum Number of Shares that May Yet Be
Purchased Under the Plan |
| October 1 - 31, 2021 | — | | | $ | — | | | — | | | $ | 250,299,457 | |
| November 1 - 30, 2021 | 480,385 | | | $ | 45.81 | | | 479,600 | | | $ | 228,330,004 | |
| December 1 - 31, 2021 | 69,339 | | | $ | 45.55 | | | 66,286 | | | $ | 225,310,393 | |
| Total | 549,724 | | | $ | — | | | 545,886 | | | $ | 225,310,393 | |
| | | | | | | | | | | | | | | | | | | | | | | |
| Purchase Period | Total Shares Repurchased (1) | | Average
Price Paid
per Share | |
Shares Repurchased
as Part of Publicly
Announced Plan | | Dollar Value of Maximum Number of Shares that May Yet Be
Purchased Under the Plan |
| September 30, 2023 | — | | | $ | — | | | — | | | $ | 326,215,513 | |
| October 1 - 31, 2023 | 72 | | | $ | 58.15 | | | — | | | $ | 326,215,513 | |
| November 1 - 30, 2023 | 10,088 | | | $ | 58.24 | | | — | | | $ | 326,215,513 | |
| December 1 - 29, 2023 | 11,096 | | | $ | 53.30 | | | — | | | $ | 326,215,513 | |
| Total | 21,256 | | | $ | — | | | — | | | $ | 326,215,513 | |
(1)Included within the shares repurchased herein are 3,83821,256 shares acquired from employees in connection with the settlement of income tax and related benefit withholding obligations arising from issuance of share-based equity awards under the KBR Stock and Incentive Plan at an average price of $44.76$55.66 per share.
Performance Graph
The following performance graph and related information shall not be deemed “soliciting material” or to be “filed” with the SEC, nor shall the information be incorporated by reference into any future filing under the Securities Act or the Exchange Act, except to the extent that the Company specifically incorporates it by reference into such filing.
The following performance graph compares the cumulative total shareholder return on shares of our common stock for the five-year period ended December 31, 2021,29, 2023, with the cumulative total return on the S&P 1500 IT Consulting & Other Services Index, the Russell 20001000 Index, the S&P MidCap 400 Index and the Dow Jones Heavy Construction Industry Index for the same period. The comparisons assume the investment of $100 on December 31, 20162018 and reinvestment of all dividends. The shareholder return is not necessarily indicative of future performance.
This year we added the S&P MidCap 400 Index to our performance graph as it is a widely used market capitalization index that we believe appropriately represents companies of comparable size to that of KBR.
| | 12/31/2016 | | 12/31/2017 | | 12/31/2018 | | 12/31/2019 | | 12/31/2020 | | 12/31/2021 |
| 12/31/2018 | | | 12/31/2018 | | 12/31/2019 | | 12/31/2020 | | 12/31/2021 | | 12/31/2022 | | 12/29/2023 |
| KBR | KBR | $ | 100.00 | | | $ | 121.18 | | | $ | 94.47 | | | $ | 192.37 | | | $ | 198.45 | | | $ | 308.92 | |
| S&P 1500 IT Consulting & Other Services | S&P 1500 IT Consulting & Other Services | $ | 100.00 | | | $ | 111.69 | | | $ | 93.13 | | | $ | 118.35 | | | $ | 130.85 | | | $ | 176.63 | |
| Russell 2000 | $ | 100.00 | | | $ | 113.14 | | | $ | 99.37 | | | $ | 122.94 | | | $ | 145.52 | | | $ | 165.45 | |
| Russell 1000 | |
| S&P MidCap 400 | S&P MidCap 400 | $ | 100.00 | | | $ | 114.45 | | | $ | 100.15 | | | $ | 124.23 | | | $ | 138.90 | | | $ | 171.15 | |
| Dow Jones Heavy Construction | Dow Jones Heavy Construction | $ | 100.00 | | | $ | 104.50 | | | $ | 76.67 | | | $ | 102.11 | | | $ | 123.25 | | | $ | 184.05 | |
Item 6.[Reserved]
Item 7.Management’s Discussion and Analysis of Financial Condition and Results of Operations
Introduction
The purpose of the MD&A is to provide our stockholders and other interested parties with information necessary to gain an understanding of our financial condition and disclose changes in our financial condition since the most recent fiscal year-end and results of operations during the current fiscal period as compared to the corresponding period of the preceding fiscal year. The MD&A should be read in conjunction with Part I of this Annual Report on Form 10-K as well as the consolidated financial statements and related notes included in Part II, Item 8 of this Annual Report on Form 10-K.
Company Overview
KBR Inc., a Delaware corporation ("KBR"), delivers science, technology, engineering and engineeringlogistics support solutions to governments and companies around the world. Drawing from its rich 100-year history and culture of innovation and mission focus, KBR creates sustainable value by combining deep domain expertise with its full life cycle capabilities to help clients meet their most pressing challenges. Our capabilities and offerings include the following:
•Scientific research such as quantum science and computing; health and human performance; materials science; life science research; and earth sciences;
•Defense systems engineering such as rapid prototyping; test and evaluation; aerospace acquisition support; systems and platform integration; and sustainment engineering;
•Operational support such as space domain awareness; C4ISR;C5ISR; human spaceflight and satellite operations; integrated supply chain and logistics; and military aviation support;
•Information operations such as cyber analytics and cybersecurity; data analytics; mission planning systems; virtual/augmented reality and technical training; and artificial intelligence and machine learning;
•Professional advisory services across the defense, renewable energy and critical infrastructure sectors; and
•TechnologySustainable decarbonization solutions that accelerate and enable energy transition and climate change solutions such as proprietary, sustainability-focused process licensing; advisory services focused on energy transition; high-end engineering, design and management program offerings; and digitally-enabled asset optimization solutions.
KBR's strategic growth vectors include:
•Defense modernization;
•Space superiority;
•Health and human performance;
•Sustainable technology;
•High-end engineering;
•Energy transition and security; and
•Sustainable technology.Technology-led asset optimization
Key customers include U.S. DoD agencies such as the U.S. Army, U.S. Navy and U.S. Air Force, Missile Defense Agency, National Geospatial-Intelligence Agency, National Reconnaissance Office and other intelligence agencies; U.S. civilian agencies such as NASA, U.S. Geological Survey and National Oceanic and Atmospheric Administration; the U.K. Ministry of Defence,MoD, London Metropolitan Police, and other U.K. Crown Services; the Royal Australian Air Force, Navy and Army; other national governments; and a wide range of commercial and industrial companies.
Our deployment priorities are to fund organic growth, maintain responsible leverage, maintain an attractive dividend, make strategic, accretive acquisitions and repurchase shares. OurAs demonstrated by our acquisitions of Frazer Nash Consultancy Limited, VIMA Group and others in the past few years, our acquisition thesis is centered around moving upmarket, expanding capabilities and broadening customer sets across strategic growth vectors. KBR also develops and prioritizes investment in technologies that are disruptive, innovative and sustainability- and safety-focused. These technologies and engineering solutions enable clients to achieve a cleaner, greener, more energy efficient global future.
On October 1, 2020, we acquired Centauri, a provider of high-end engineering
Our Business Segments
KBR's business is organized into two core business segments and development solutions for critical, well-funded, national security missions associated with space, intelligence, cyber and emerging technologies suchone non-core business segment as directed energy and missile defense. Additionalfollows:
Core business segments
•Government Solutions
•Sustainable Technology Solutions
Non-core business segment
•Other
See additional information relating to the Centauri acquisition is describedon our business segments in Note 42 to our consolidated financial statements.
On October 20, 2021, we acquired Frazer-Nash Consultancy Limited ("Frazer-Nash"), a leading provider of high-end systems engineering, assurancestatements and technology advisory services used to solve complex challenges. Frazer-Nash provides a broad range of professional advisory services across the defense, renewable energy and critical infrastructure sectors primarilyunder "Item 1. Business" in the U.K. and Australia. Additional information relating to the Frazer-Nash acquisition is described in Part II of this Annual Report on Form 10-K in Note 4 to our consolidated financial statements.10-K.
Business Environment and Trends
Government Outlook
On June 3, 2023, President Biden signed into law the Fiscal Responsibility Act of 2023, which suspends the public debt ceiling limit through January 2, 2025. This law includes provisions that will impact future fiscal year budgets for the United States. Key provisions in this law include statutory caps on discretionary funding in 2024 and 2025 and limits on discretionary funding for the years 2026 through 2029. The 2024 statutory cap on discretionary funding totals $1.6 trillion, which included $886 million for defense spending and $704 million for non-defense spending. The 2024 statutory cap on defense spending does not impact President Biden's proposed fiscal year 2022 U.S. defense2024 budget; however, the 2024 statutory cap on non-defense spending budget prioritizes and furthers a national security strategy to confront near peer threats aroundis 14% lower than President Biden's proposed fiscal 2024 budget. The effect of the world, enhancesnon-defense discretionary spending statutory cap on individual programs or KBR cannot be predicted at this time.
In December 2023, President Biden signed into law the DoD’s cybersecurity strategy and cyber warfare capabilities, increases the priority of military space superiority, directs innovation to meet long-range emerging threats and continues the restoration of military readiness. The budget includes a number of measures to strengthen emerging technologies including cyber-science and technologies, artificial intelligence, directed energy, hypersonics and biotechnologies. The National Defense Authorization Act ("NDAA") for fiscal year 2022 reflects a 5%2024. The NDAA authorizes programs, projects and policies to be carried out with funds appropriated by Congress as part of the annual budgetary process. The NDAA supports approximately $874 billion in fiscal year 2024 funding for national defense, $841 billion of which is for the DoD. The requested amount is an increase inof $27 billion when compared to the authorized defense spending over last year's enacted budget and represents an increase from the president's requested amount. for fiscal year 2023.
The unapproved fiscal 2022 non-defense discretionary spending proposal includes a 16% increase in funding, including a 6.5% increase in funding for NASA to support the continuation of scientific research and exploration as well as increased funding across all agencies to tackle climate change. However, as the U.S. Governmentgovernment has not yet enacted an annual budget for fiscal year 2022,2024; these proposed 2024 budgetary amounts are subject to change. To avert a government shutdown, a series ofthree continuing resolution funding measures have been enacted to finance all U.S. Government activitiesgovernment activities. The most recent "laddered" continuing resolution passed in January 2024 funds the government through March 11, 2022.2024, depending on the appropriation bill. Under the continuing resolution, partial-year funding at amounts consistent with appropriated levels for fiscal year 20212023 are available, subject to certain restrictions, but new spending initiatives are not authorized. Importantly,Uncertainty continues to exist regarding whether a divided Congress will be able to pass appropriation bills or additional continuing resolutions once the current continuing resolutions expire in March 2024. We believe our key programs will continue to be supported and funded despitein the continuing resolution financing mechanism. InThe effect of a potential government shutdown or the coming months, Congress will need to approve or revise President Biden’sfinalized fiscal year 20222024 budget proposal through enactmenton KBR or our individual programs cannot be predicted at this time. However, if a government shutdown were to occur and were to continue for an extended period, we could be at risk of appropriations billsprogram cancellations, schedule delays and other policy legislation,disruptions and nonpayment, which would then require final approval from President Biden to become law and complete the budget process. Additionally, on December 16, 2021, President Biden signed legislation increasingcould adversely affect our results of operations. We anticipate the federal debt limit by $2.5 trillion. The measure increases the debt limit to $31.4 trillion from the previous level of $28.9 trillion and is estimated to provide sufficient government borrowing capacity to last until early 2023.
In early 2021, the U.S. announced a full withdrawal of U.S. forces from Afghanistan. In connection with Operation Allies Welcome ("OAW"), KBR has been engaged by the U.S. DoD to provide humanitarian support across numerous military bases to those awaiting resettlement. Such support includes temporary housing, food service, medical care and other services. We expect this non-recurring OAW supportbudget will continue to be substantially completed in early 2022.subject to debate and compromise shaped by, among other things, heightened political tensions, the global security environment, inflationary pressures and macroeconomic conditions. The result may be shifting funding priorities, which could have material impacts on defense spending broadly and our programs.
Internationally, our Government Solutions work is performed primarily for the U.K. Ministry of DefenceMoD and the Australian Department of Defence. TheIn March 2023, the U.K. government has committed a 14%announced its intent to increase inits defense spendingbudget by £11 billion over the coming four years.next five years, increasing the defense budget to 2.25% of GDP by 2025. Recognizing the importance of strong defense and the role the U.K. plays across the globe, the U.K. has prioritized investment in military research and investment in key areas to advance and develop capabilities around artificial intelligence, cyber security and space superiority. It is expected the next general election in the United Kingdom will occur in 2024 (and no later than January 28, 2025). The effect of the next general election in the United Kingdom on KBR or our individual programs cannot be predicted at this time. The Australian government continues to invest in defense spending, with particular focus on enhancing regional security, modernizing defense capabilities, strengthening cyber defenses and promoting broader economic stability. The fiscal year budget for Australia for the
2023 - 2024 financial year was finalized, with the Australian government increasing defense spending by 5% to AUD 51.0 billion, or approximately 2.00% of GDP.
In November 2021, we announced that HomeSafe Alliance LLC (“HomeSafe”), a KBR led joint venture with Tier One Relocation, was awarded the global household goods contract by U.S. Transportation Command. The contract ceiling value is $20 billion with a potential 9-year term, inclusive of all options periods. HomeSafe is expected to be the exclusive household goods move management service provider for the U.S. Armed Forces, Department, U.K. and Australia announced AUKUS, a security pact that will promote a free and open Indo-Pacific through a shared long-term investment to strengthen their combined capabilities and enhance their ability to deter aggression. AUKUS’ first major initiative (Pillar 1) is a joint effort to provide Australia with conventionally armed, nuclear powered submarine ("NPS") capability and strengthen the capacity of Defense civiliansthe submarine workforce and their families. Underindustrial base. In 2023, these countries announced an arrangement for Australia to acquire a NPS through the AUKUS security pact. This arrangement outlines an approach that will provide Australia with the capability to operate and maintain a NPS before the expected sale of these submarines from the United States to Australia in the early 2030s (subject to Congressional approval). Pillar 2 of this contract, HomeSafe planssecurity pact will focus on enabling technologies to modernizemaintain a secure and infuse technology to improvestable trade through the domesticregion including undersea technologies, quantum technologies, advanced cyber, artificial intelligence and international relocation experience for all military personnelautonomy, hypersonic research and their families. The contract award is currently under protest.development, electronic warfare and innovation.
With defense and civil budgets driven in part by political instability, military conflicts, aging platforms and infrastructure and the need for technology advances, we expect continued opportunities to provide solutions and technologies to mission critical work aligned with our customers’ and our nation’s critical priorities.
Sustainable Technology Outlook
Long-range commercial market fundamentals are supported by global population growth, expanding global development and an acceleration of demand for energy transition, and renewable energy sources for which momentum continuesand climate change solutions. The globe is in search of the solution to build.the energy trilemma, the balance between energy affordability, ensuring energy security and achieving environmental sustainability. Clients continueare prioritizing their efforts to prioritize investmentsolve the energy trilemma by investing in digital solutions to optimize operations, increase end-product flexibility and energy efficiency, reduce unplanned downtime and to reduce theirminimize environmental footprint. As the global focus on energy security intensifies and companies continue to commit to near-term carbon neutrality and longer-range net-zero carbon emissions, we expect spending to continue in areas such as decarbonization; carbon capture, utilization and sequestration; biofuels; and circular economy. Further, leading companies across the world are proactively evaluating clean energy alternatives, including hydrogen and green ammonia which complements KBR's proprietary process technologytechnologies, solutions and capabilities.
We expect climate change and energy transition to continue to be areas of priority and investment as many countries, including the U.S., look to boost their economies and invest in a cleaner future. In advance ofSpecifically, on August 16, 2022, the Conference of the Parties 26 meeting in Scotland, the White House released details on its strategy to achieve greenhouse gas emission reduction targets as part of their agenda. On November 15, 2021, President Biden signed the bi-partisan Infrastructure Investment and JobsInflation Reduction Act bill into law which includes climate provisions focused on transportationintended to, among other things, incentivize domestic clean energy, manufacturing and resiliency.production. Additionally, in March 2023, the Canadian government announced its federal budget which includes billions of dollars for investment in the transition to a low-carbon economy.
Our Business
KBR's business is organized into two core business segments and one non-core business segment as follows:
Core business segments
•Government Solutions
•Sustainable Technology Solutions
Non-core business segment
•Other
See additional information on our business segments, including detail with respect to changes to our reportable segments, in Note 1 and 2 to our consolidated financial statements and under "Item 1. Business" in this Annual Report on Form 10-K.
Change in Fiscal Year End
On December 13, 2022, the Board of Directors approved a change in the fiscal year end from a calendar year ending on December 31 to a 52 – 53 week year ending on the Friday closest to December 31, effective as of the commencement of the Company's fiscal year on January 1, 2023. In a 52 week fiscal year, each of the Company’s quarterly periods will comprise 13 weeks. The additional week in a 53 week fiscal year is added to the fourth quarter, making such quarter consist of 14 weeks. The Company’s first 53 week fiscal year will occur in fiscal year 2024. The Company made the fiscal year change on a prospective basis and will not adjust operating results for prior periods. The change will impact the prior year comparability of each of the fiscal quarters and the annual period for the year ending December 29, 2023; however, the impact will not be material. The Company believes this change will improve comparability between periods by eliminating the year-over-year variability in calendar month productive days and provide a more consistent reporting cadence for operational leaders to aid in strategic decision making.
Due to this change in fiscal year, our fiscal year ended on December 29 in 2023 as compared to December 31 in 2022. The years ended December 29, 2023 and December 31, 2022 contained 363 days and 365 days, respectively.
Overview of 20212023 Financial Results and Significant Bookings
20212023 was a year of significant achievement for KBR as we continued to execute toward our long-term vision. The Company benefits from a significant base of long-term enduring contracts in our government business, a diverse portfolio of high quality proprietary process technologies, market tailwinds that benefit our capabilities and technologies in areas such as defense modernization, and energy transition, energy security and high-end engineering and a truly global client base. Together, these attributes distinguish KBR and have contributed directly to the company’sCompany’s growth in revenue and profitearnings during the year. While
In 2023, revenues and operating income increased for KBR when compared to 2022. These increases were driven by both our GS and STS business segments. Our GS business segment increased revenues in 2023 with contract growth and increased activity to support exercises, training and other activities within the historic humanitarian efforts in connection with OAW amplified revenue and profit, the core business in GS delivered strong organic growthEuropean Command during the year, despite being partially offset by revenue recognized in the previous year related to the OAW program. Our STS business segment increased revenues in 2023 due to increases in technology sales and STS delivered significantly increased 2021 earnings growth.engineering and professional services. Our teams continued to deliver operational performance, healthy profitability and strong cash flow. Importantly, we drove innovation and extended our footprint through new program wins and technology advances, developments and development. We continuedinvestments, such as our track recordadditional investment in Mura Technology in 2023. 2023 was also an important year for KBR with multiple obligations resolved during the year including the settlement of innovation, bringing new technologies to marketa legacy legal matter and advising, consultingthe maturity and delivering expertisesettlement of our Convertible Notes. Our outstanding warrants were also terminated in 2023, with final payment for the vital area of energy transition, hydrogen future and plastics circular economy. We progressedwarrant terminations being made in our strategic journey to advance upmarket to deliver innovative, digitally-enabled solutions by completing the Frazer-Nash acquisition. We also obtained a full and final resolution with the client on the Ichthys LNG project regarding material outstanding claims and disputes and we intend to pursue recovery from the consortium of subcontractors of the Combined Cycle Power Plant.January 2024.
Bookings to underpin the future were strong in our GS and STS businesses. Our GS business landed $6.7 billion in bookings and options,new awards, including a $127 million recompete award from$1.9 billion ceiling, 5-year Integrated Mission Operations Contract for the U.S. Departmentcontinued support of Transportation Volpe Center to modernize technicalNASA's human spaceflight programs which includes the International Space Station, Artemis and safety-related transportation systems; a $539 million U.S. Air ForceLow Earth Orbit Commercialization. Additional new awards included an award to support rapid prototypinga KBR joint venture for the Omnibus Multidiscipline Engineering Services III contract, worth up to $719 million, to aid NASA's development of space orbital systems in its Engineering and fielding of systems; a $195 million U.S. Air Force award to provide trusted microelectronics solutions; and more.Technology Directorate at Goddard Space Flight Center in Maryland. Our STS business landed $1.1 billionvarious awards during the year, including an award for modifications to the Pluto LNG facility in bookings, includingAustralia and numerous projects across the ammonia landscape including traditional, blue and green ammonia,various projects spanning carbon capture, utilization and multiple Hydro-PRT licensesstorage, hydrogen, biofuels and studies.renewables.
Results of Operations
The following tables set forth our results of operations for the periods presented, including by segment. A discussion regarding our financial condition and results of operations for the years ended December 31, 20202022 and 20192021 is included in Item 7. of Management’s Discussion and Analysis of Financial Condition and Results of Operations of our Current Report on Form 8-K, which was filed with the SEC on July 29, 2021. This Current Report on Form 8-K was filed to reflect changes to the presentation of our financial information as set forth in our Annual Report on Form 10-K for the year ended December 31, 2020,2022, as filed with the SEC on February 25, 2021, effective January 1, 2021, in order to give effect to a change in our segment reporting.17, 2023.
| Revenues | | | | | | 2021 vs. 2020 | | 2020 vs. 2019 |
| Consolidated Results | | Consolidated Results |
| Year Ended | | | Year Ended | | Change |
| December 29, | | | December 29, | | December 31, | | 2023 vs. 2022 | | 2022 vs. 2021 |
| Dollars in millions | Dollars in millions | 2021 | | 2020 | | $ | | % | | 2019 | | $ | | % | Dollars in millions | 2023 | | 2022 | | 2021 | | $ | | % | | $ | | % |
| Revenues | Revenues | $ | 7,339 | | | $ | 5,767 | | | $ | 1,572 | | | 27 | % | | $ | 5,639 | | | $ | 128 | | | 2 | % | Revenues | $ | 6,956 | | | $ | | $ | 6,564 | | | $ | | $ | 7,339 | | | $ | | $ | 392 | | | 6 | | 6 | % | | $ | (775) | | | (11) | | (11) | % |
| Cost of revenues | | Cost of revenues | $ | (5,979) | | | $ | (5,736) | | | $ | (6,533) | | | $ | 243 | | | 4 | % | | $ | (797) | | | (12) | % |
| Gross profit | | Gross profit | $ | 977 | | | $ | 828 | | | $ | 806 | | | $ | 149 | | | 18 | % | | $ | 22 | | | 3 | % |
| Equity in earnings (losses) of unconsolidated affiliates | | Equity in earnings (losses) of unconsolidated affiliates | $ | 114 | | | $ | (80) | | | $ | (170) | | | $ | 194 | | | n/m | | $ | 90 | | | 53 | % |
| Selling, general and administrative expenses | | Selling, general and administrative expenses | $ | (488) | | | $ | (420) | | | $ | (393) | | | $ | 68 | | | 16 | % | | $ | 27 | | | 7 | % |
| | Legal settlement of legacy matter | |
| Legal settlement of legacy matter | |
| Legal settlement of legacy matter | | $ | (144) | | | $ | — | | | $ | — | | | $ | 144 | | | n/m | | $ | — | | | — | % |
| Gain (loss) on disposition of assets and investments | | Gain (loss) on disposition of assets and investments | $ | (7) | | | $ | 19 | | | $ | 2 | | | $ | (26) | | | n/m | | $ | 17 | | | n/m |
| | Other | |
| Other | |
| Other | | $ | (4) | | | $ | (4) | | | $ | (14) | | | $ | — | | | — | % | | $ | (10) | | | (71) | % |
| Operating income | | Operating income | $ | 448 | | | $ | 343 | | | $ | 231 | | | $ | 105 | | | 31 | % | | $ | 112 | | | 48 | % |
| Interest expense | | Interest expense | $ | (115) | | | $ | (87) | | | $ | (80) | | | $ | 28 | | | 32 | % | | $ | 7 | | | 9 | % |
| Unrealized gain on other investment | | Unrealized gain on other investment | $ | — | | | $ | 16 | | | $ | 4 | | | $ | (16) | | | n/m | | $ | 12 | | | 300 | % |
Charges associated with Convertible Notes
| | Charges associated with Convertible Notes
| $ | (494) | | | $ | — | | | $ | — | | | $ | 494 | | | n/m | | $ | — | | | — | % |
| Other non-operating income (expense) | | Other non-operating income (expense) | $ | (5) | | | $ | 12 | | | $ | (9) | | | $ | (17) | | | n/m | | $ | 21 | | | n/m |
| Income (loss) before income taxes | | Income (loss) before income taxes | $ | (166) | | | $ | 284 | | | $ | 146 | | | $ | (450) | | | n/m | | $ | 138 | | | 95 | % |
| Provision for income taxes | | Provision for income taxes | $ | (95) | | | $ | (92) | | | $ | (111) | | | $ | 3 | | | 3 | % | | $ | (19) | | | (17) | % |
| Net income (loss) | | Net income (loss) | $ | (261) | | | $ | 192 | | | $ | 35 | | | $ | (453) | | | n/m | | $ | 157 | | | 449 | % |
| Less: Net income attributable to noncontrolling interests | | Less: Net income attributable to noncontrolling interests | $ | 4 | | | $ | 2 | | | $ | 8 | | | $ | 2 | | | 100 | % | | $ | (6) | | | (75) | % |
| Net income (loss) attributable to KBR | | Net income (loss) attributable to KBR | $ | (265) | | | $ | 190 | | | $ | 27 | | | $ | (455) | | | n/m | | $ | 163 | | | 604 | % |
n/m - not meaningful
Revenues. Revenues increased by $1.6 billion,$392 million, or 27%6%, to $7.3 billion$6,956 million in 2021,2023, compared to $5.8 billion$6,564 million in 2020.2022. The increase was primarily driven byattributed to contract growth across our GS business segment attributable to continued organic growthand increased revenues from technology sales and engineering and professional services in our GS business units, includingSTS business. Additionally, there was increased activity to support exercises, training and other activities within the European Command. These increases in revenue were offset by approximately $313 million of revenue recognized in 2022 from contingency work associated with the OAW program which contributed $1.6 billionthat wound down and substantially completed in 2021,early 2022 and the acquisitions of Centauri in October 2020 and Frazer-Nash in October 2021. This growth was partially offset by a reductiondecreases in revenue in our STS business segment following the Company's exit from commoditized construction services in 2020 and reduced activity in our GS business segment due to reduced activity in the Middle East and lower volume associated with the successful completionramp down of non-recurring construction work on ourfor the Aspire program.
| | | | | | | | | | | | | | | | | | | | | | | | | | | | | | | | | | | | | | | | | |
| Gross Profit |
| | | | | 2021 vs. 2020 | | | | 2020 vs. 2019 |
| Dollars in millions | 2021 | | 2020 | | $ | | % | | 2019 | | $ | | % |
| Gross profit | $ | 806 | | | $ | 666 | | | $ | 140 | | | 21 | % | | $ | 653 | | | $ | 13 | | | 2 | % |
The $140 million increase in overall gross profit of $149 million, or 18%, was primarily driven by improvements in ouritems increasing revenues discussed above, favorable STS business segment due to improved executionlicensing mix and market recovery in 2021, legacy provisions recognized in 2020 that did not recur in 2021 and the net favorable resolution of and provisioning forresolutions on various legacy matters in 2021. Gross profits also increased in our GS business segment thatthe current year. These increases were driven by organic growth, including activity of the OAW program, and the acquisitions of Centauri in October 2020 and Frazer-Nash in in October 2021. The increase was partially offset by higher amortization of intangiblesreduced volume from the Centauri and Frazer-Nash acquisitions and reduced activity in our GS business segment due to reduced activity in the Middle East and lower volumecontingency work associated with the successful completion of non-recurring construction work on our AspireOAW program.
| | | | | | | | | | | | | | | | | | | | | | | | | | | | | | | | | | | | | | | | | |
| Equity in Earnings (Losses) of Unconsolidated Affiliates |
| | | | | 2021 vs. 2020 | | | | 2020 vs. 2019 |
| Dollars in millions | 2021 | | 2020 | | $ | | % | | 2019 | | $ | | % |
| Equity in earnings (losses) of unconsolidated affiliates | $ | (170) | | | $ | 30 | | | $ | (200) | | | (667) | % | | $ | 35 | | | $ | (5) | | | (14) | % |
The overall decrease in equityEquity in earnings (losses) of unconsolidated affiliates was primarily driven. Equity in earnings (losses) of unconsolidated affiliates increased by $194 million to $114 million in earnings for the year ended December 29, 2023 compared to $80 million in losses for the year ended December 31, 2022. In 2022, a non-cash charge in the amount of $193$137 million recognizedwas recorded associated with the settlement agreement with the consortium of subcontractors of the Combined Cycle Power Plant for the Ichthys LNG Project that did not recur in 2023. In 2022, we also recorded a charge on a joint venture in our GS business segment that did not recur in 2023. Further, the increase in 2023 is attributed to equity in earnings from services on an LNG project that commenced in the second quarter of 2021 and an additional charge in the amount of $10 million for final warranty items associated with the joint venture's full and final settlement completed with the Ichthys LNG client in our STS business segment. In October 2021, JKC entered into a Settlement Agreement that resolved the outstanding claims and disputes between JKC and its client. As a result of the Settlement Agreement, the Parties agreed to withdraw all claims and terminate all ongoing arbitrations and court proceedings between the Parties.
| | | | | | | | | | | | | | | | | | | | | | | | | | | | | | | | | | | | | | | | | |
| Selling, General and Administrative Expenses | | | | | | | |
| | | | | 2021 vs. 2020 | | | | 2020 vs. 2019 |
| Dollars in millions | 2021 | | 2020 | | $ | | % | | 2019 | | $ | | % |
| Selling, general and administrative expenses | $ | (393) | | | $ | (335) | | | $ | 58 | | | 17 | % | | $ | (341) | | | $ | (6) | | | (2) | % |
Selling, general and administrative expenses. Selling, general and administrative expenses were $58$68 million higher in 20212023 compared to 2020,2022, which was primarily driven by increased expenses attributable to the Centauri and Frazer-Nash acquisitions and other corporate costs, partially offset by cost reductions to right-size the cost basegrowth in line with the business shift to exit non-strategic areasand favorable settlements and credits received in our STS business segment.
| | | | | | | | | | | | | | | | | | | | | | | | | | | | | | | | | | | | | | | | | |
| Acquisition and Integration Related Costs | | | | | | | |
| | | | | 2021 vs. 2020 | | | | 2020 vs. 2019 |
| Dollars in millions | 2021 | | 2020 | | $ | | % | | 2019 | | $ | | % |
| Acquisition and integration related costs | $ | (12) | | | $ | (9) | | | $ | 3 | | | n/m | | $ | (2) | | | $ | 7 | | | n/m |
The increasethe first quarter of 2022 that did not recur in acquisition and integration related costs was associated with the Company's acquisitions of Centauri in October 2020 and Frazer-Nash in October 2021.2023.
| | | | | | | | | | | | | | | | | | | | | | | | | | | | | | | | | | | | | | | | | |
| Goodwill Impairment, Restructuring Charges and Asset Impairments | | | | | 2021 vs. 2020 | | | | 2020 vs. 2019 |
| 2021 | | 2020 | | $ | | % | | 2019 | | $ | | % |
| Goodwill impairment | $ | — | | | $ | (99) | | | $ | (99) | | | n/m | | $ | — | | | $ | 99 | | | n/m |
| Restructuring charges and asset impairments | (2) | | | (214) | | | (212) | | | n/m | | — | | | 214 | | | n/m |
Gain (loss) on disposition of assets and investments.In 2020, as a result of the economic and market volatility, management initiated a restructuring plan and2023, we recognized goodwill impairments, restructuring chargesa loss on disposition of assets and asset impairments resultinginvestments of $7 million related to the sale of our operations in Russia. This loss was primarily due to $10 million in accumulated foreign currency adjustments that were reclassified from that plan.
| | | | | | | | | | | | | | | | | | | | | | | | | | | | | | | | | | | | | | | | | |
| Gain on Disposition of Assets and Investments | | | | | | | |
| | | | | 2021 vs. 2020 | | | | 2020 vs. 2019 |
| Dollars in millions | 2021 | | 2020 | | $ | | % | | 2019 | | $ | | % |
| Gain on disposition of assets and investments | $ | 2 | | | $ | 18 | | | $ | (16) | | | n/m | | $ | 17 | | | $ | 1 | | | n/m |
The decrease inAOCL. In 2022, we recognized a gain on disposition of assets and investments of $16 million was primarily driven byfrom the liquidationsale of a joint ventureour investment interest in 2020.
| | | | | | | | | | | | | | | | | | | | | | | | | | | | | | | | | | | | | | | | | |
| Interest Expense | | | | | | | |
| | | | | 2021 vs. 2020 | | | | 2020 vs. 2019 |
| Dollars in millions | 2021 | | 2020 | | $ | | % | | 2019 | | $ | | % |
| Interest expense | $ | (92) | | | $ | (83) | | | $ | 9 | | | 11 | % | | $ | (99) | | | $ | (16) | | | (16) | % |
Interest Expense. The increase in interest expense was primarily driven by increased expense associated with borrowingsincreases in the U.S. federal reserve funds rate from 2022 to finance the acquisitions of Centauri and Frazer-Nash.
| | | | | | | | | | | | | | | | | | | | | | | | | | | | | | | | | | | | | | | | | |
| Other Non-operating Income (Expense) | | | | | | | |
| | | | | 2021 vs. 2020 | | | | 2020 vs. 2019 |
| Dollars in millions | 2021 | | 2020 | | $ | | % | | 2019 | | $ | | % |
| Other non-operating income (expense) | $ | (5) | | | $ | 1 | | | $ | (6) | | | n/m | | $ | 5 | | | $ | (4) | | | (80) | % |
Unrealized gain on other investment. In 2022, we recognized an unrealized gain on other investment of $16 million related to the appreciation in the fair value of our Mura Technology investment as a result of a revaluation triggered by our incremental investment commitment. We did not record an unrealized gain on other investment in 2023.
Charges associated with Convertible Notes. In 2023, we recognized a loss of $494 million related to the cash election and repurchase of Convertible Notes and Warrant Unwind Agreements.
Other non-operating income (expense). Other non-operating income (expense) includes interest income, foreign exchange gains and losses and other non-operating income or expense items. The increase in expense wasnet decrease is primarily driven by foreign exchange gains and losses.
| | | | | | | | | | | | | | | | | | | | | | | | | | | | | | | | | | | | | | | | | |
| Provision for Income Taxes | | | | | | | | | | | | | |
| | | | | 2021 vs. 2020 | | | | 2020 vs. 2019 |
| Dollars in millions | 2021 | | 2020 | | $ | | % | | 2019 | | $ | | % |
| Income before provision for income taxes | $ | 134 | | | $ | (25) | | | $ | 159 | | | 636 | % | | $ | 268 | | | $ | (293) | | | (109) | % |
| (Provision) benefit for income taxes | $ | (108) | | | $ | (26) | | | $ | 82 | | | 315 | % | | $ | (59) | | | $ | (33) | | | (56) | % |
Provision for income taxes. The increase inprovision for income taxes for the year ended December 29, 2023 reflects a (57)% tax expense in 2021rate as compared to 2020 was driven by the following factors: a) an increase in income year over year since the impairment and restructuring charges of 2020 were non-recurring b) an equity adjustment on the LNG project and c) the enactment of a 32% tax rate change infor the U.K.
A reconciliation of ouryear ended December 31, 2022. The effective tax rates for 2021, 2020 and 2019rate of (57)%, as compared to the U.S. statutory federal rate of 21%, for the year ended December 29, 2023 was primarily impacted by the non-deductible portion of a legal settlement on a legacy matter and further information on the effects ofnon-deductible charge associated with the Tax Act is presentedcash election and Convertible Notes repurchase discussed in Note 13 to our consolidated financial statements.
| | | | | | | | | | | | | | | | | | | | | | | | | | | | | | | | | | | | | | | | | |
| Net Income Attributable to Noncontrolling Interests |
| | | | | 2021 vs. 2020 | | | | 2020 vs. 2019 |
| Dollars in millions | 2021 | | 2020 | | $ | | % | | 2019 | | $ | | % |
| Net income attributable to noncontrolling interests | $ | 8 | | | $ | 21 | | | (13) | | | (62) | % | | $ | 7 | | | $ | 14 | | | 200 | % |
22. The decrease in net income attributable to noncontrolling interestsimplication of these non-deductible items were partially offset by the release of a previously reserved position based on developments associated with the ongoing IRS examination and appeals process for certain years. The effective tax rate of 32% for the year ended December 31, 2022 was primarily driven by the resolutionnon-deductibility of a contingency matter on a completedlosses incurred with respect to the settlement of outstanding matters related to the Ichthys LNG project to which KBR is a JV partner. Excluding the tax impact of these items, our tax rate would be 26% and liquidation24% for the year ended December 29, 2023 and December 31, 2022, respectively. See Note 12 "Income Taxes" to our consolidated financial statements for further discussion on income taxes, including our reconciliation of the joint venture in 2020, partially offset by income earned relatedU.S. statutory tax rate to a Middle East joint venture project in our STS business segment.effective tax rate.
Results of Operations by Business Segment
We analyze the financial results for each of our two core business segments.segments and one non-core business segment. The business segments presented are consistent with our reportable segments discussed in Note 2 to our consolidated financial statements.
| | | | | | | | | | | | | | | | | | | | | | | | | | | | | | | | | | | | | | | | | |
| Years Ended December 31, |
| | | | | 2021 vs. 2020 | | | | 2020 vs. 2019 |
| Dollars in millions | 2021 | | 2020 | | $ | | % | | 2019 | | $ | | % |
| Revenues | | | | | | | | | | | |
| Government Solutions | $ | 6,149 | | | $ | 4,055 | | | $ | 2,094 | | | 52 | % | | $ | 4,042 | | | $ | 13 | | | — | % |
| Sustainable Technology Solutions | 1,190 | | | 1,712 | | | (522) | | | (30) | % | | 1,597 | | | 115 | | | 7 | % |
| | | | | | | | | | | | | |
| Total revenues | $ | 7,339 | | 0 | $ | 5,767 | | | $ | 1,572 | | | 27 | % | | $ | 5,639 | | | $ | 128 | | | 2 | % |
| | | | | | | | | | | | | |
| Gross profit (loss) | | | | | | | | | | | | | |
| Government Solutions | $ | 575 | | | $ | 493 | | | $ | 82 | | | 17 | % | | $ | 444 | | | $ | 49 | | | 11 | % |
| Sustainable Technology Solutions | 231 | | | 173 | | | 58 | | | 34 | % | | 209 | | | (36) | | | (17) | % |
| | | | | | | | | | | | | |
| Total gross profit | $ | 806 | | | $ | 666 | | | $ | 140 | | | 21 | % | | $ | 653 | | | $ | 13 | | | 2 | % |
| | | | | | | | | | | | | |
| Equity in earnings (losses) of unconsolidated affiliates | | | | | | | | |
| Government Solutions | $ | 29 | | | $ | 28 | | | $ | 1 | | | 4 | % | | $ | 29 | | | $ | (1) | | | (3) | % |
| Sustainable Technology Solutions | (199) | | | 2 | | | (201) | | | n/m | | 6 | | | (4) | | | n/m |
| | | | | | | | | | | | | |
| | | | | | | | | | | | | |
| Total equity in earnings (losses) of unconsolidated affiliates | $ | (170) | | | $ | 30 | | | $ | (200) | | | (667) | % | | $ | 35 | | | $ | (5) | | | (14) | % |
| | | | | | | | | | | | | |
| Selling, general and administrative expenses | $ | (393) | | | $ | (335) | | | $ | 58 | | | 17 | % | | $ | (341) | | | $ | (6) | | | (2) | % |
| | | | | | | | | | | | | |
| Acquisition and integration related costs | $ | (12) | | | $ | (9) | | | $ | 3 | | | n/m | | $ | (2) | | | $ | 7 | | | n/m |
| | | | | | | | | | | | | |
| Goodwill impairment | $ | — | | | $ | (99) | | | $ | (99) | | | n/m | | $ | — | | | $ | 99 | | | n/m |
| | | | | | | | | | | | | |
| Restructuring charges and asset impairment | $ | (2) | | | $ | (214) | | | $ | (212) | | | n/m | | $ | — | | | $ | 214 | | | n/m |
| | | | | | | | | | | | | |
| Gain on disposition of assets | $ | 2 | | | $ | 18 | | | $ | (16) | | | n/m | | $ | 17 | | | $ | 1 | | | n/m |
| | | | | | | | | | | | | |
| Total operating income | $ | 231 | | | $ | 57 | | | $ | 174 | | | 305 | % | | $ | 362 | | | $ | (305) | | | (84) | % |
| | | | | | | | | | | | | | | | | | | | | | | | | | | | | | | | | | | | | | | | | |
| Years Ended | | Change |
| December 29, | | December 31, | | December 31, | | 2023 vs. 2022 | | 2022 vs. 2021 |
| Dollars in millions | 2023 | | 2022 | | 2021 | | $ | | % | | $ | | % |
| Revenues | | | | | | | | | | | |
| Government Solutions | $ | 5,353 | | | $ | 5,320 | | | $ | 6,149 | | | $ | 33 | | | 1 | % | | $ | (829) | | | (13) | % |
| Sustainable Technology Solutions | 1,603 | | | 1,244 | | | 1,190 | | | 359 | | | 29 | % | | 54 | | | 5 | % |
| Total revenues | $ | 6,956 | | | $ | 6,564 | | | $ | 7,339 | | | $ | 392 | | | 6 | % | | $ | (775) | | | (11) | % |
| | | | | | | | | | | | | |
| Operating income | | | | | | | | | | | | | |
| Government Solutions | $ | 285 | | | $ | 441 | | | $ | 414 | | | $ | (156) | | | (35) | % | | $ | 27 | | | 7 | % |
| Sustainable Technology Solutions | 324 | | | 47 | | | (30) | | | 277 | | | n/m | | 77 | | | n/m |
| Other | (161) | | | (145) | | | (153) | | | (16) | | | (11) | % | | 8 | | | 5 | % |
| Operating income | $ | 448 | | | $ | 343 | | | $ | 231 | | | $ | 105 | | | 31 | % | | $ | 112 | | | 48 | % |
n/m - not meaningful
Government Solutions
GS revenues increased by $2.1 billion,$33 million, or 52%1%, to $6.1 billion$5,353 million in 20212023 compared to $4.1 billion$5,320 million in 2020. The2022. This increase was primarily driven by organic revenueattributable to activity to support exercises, training and other activities within the European Command and continued contract growth across each of our GS business units, including newsegment. These increases were partially offset by approximately $313 million of revenue recognized in 2022 from contingency work associated with the OAW program which contributed $1.6 billionthat was wound down and substantially completed in 2021.early 2022. Additionally, the increase is attributed to the acquisitions of Centauri in October 2020 and Frazer-Nash in October 2021. These increases were partiallywas offset by reduced activity in the Middle East and lower volume associated with the successful completionramp down of non-recurring services onconstruction work for the Aspire program.
GS gross profit increasedoperating income decreased by $82$156 million, or 17%35%, to $575$285 million in 20212023 compared to $493$441 million in 2020.2022. The increasedecrease was primarily driven by organic growth, including new work under the OAW program, and the Centauri and Frazer-Nash acquisitions discussed above. This was partially offset by the higher amortization of intangibles from the acquisitions, reduced activity$144 million charge recorded in the Middle East and lower volume associated withsecond quarter of 2023 related to the successful completionsettlement of non-recurring worka legacy legal matter. Additionally, operating income decreased $19 million primarily due to the gain on sale of our Aspire program.
GS equity earnings of unconsolidated affiliates increased by $1 million to $29 millioninvestment interest in 2021 compared to $28 million in 2020, which was primarily driven by better performance of joint ventures and increased work in our International business, partially offset by changes in project estimates in a domestic joint venture.three U.K. Road investments.
Sustainable Technology Solutions
STS revenues decreasedincreased by $522$359 million, or 30%29%, to $1.2 billion$1,603 million in 2021,2023 compared to $1.7 billion$1,244 million in 2020.2022. The decreaseincrease from 2022 to 2023 was primarily driven by the Company's exitincreased revenues from commoditized construction services in 2020.technology sales and engineering and professional services.
STS gross profitoperating income increased by $58$277 million or 34%, to $231$324 million in 2021,2023 compared to $173$47 million in 2020.2022. The increase was primarily driven by strong execution and market recovery in 2021, expenses recognized in 2020 that did not recur in 2021 andrelated to the net favorable resolution of and provision for legacy matters in 2021.
STS equity in earnings of unconsolidated affiliates decreased by $201 million to $199 million loss in 2021, compared to $2 million in equity earnings in 2020. The decrease was primarily driven byIchthys LNG project. In 2022, a non-cash charge in the amount of $193$137 million was recorded for the settlement agreement with the consortium of subcontractors of the Combined Cycle Power Plant that did not recur in 2023. Additionally, the increase was recognized duringrelated to increased technology sales and engineering and professional services, increased equity in earnings from services on an LNG project, a favorable resolution on a legacy matter in 2023 and a non-cash impact in 2022 that did not recur in 2023. The increases in 2023 were offset by a $7 million loss related to the second quartersale of 2021 and an additional chargeour operations in the amount ofRussia. This loss was primarily due to $10 million for final warranty items associated with the Ichthys LNG project recognized in the third quarter of 2021.accumulated foreign currency adjustments that were reclassified from AOCL.
Other
Other operating loss remained materially consistent between the years ended December 29, 2023 and December 31, 2022.
Backlog of Unfilled Orders
Backlog generally represents the estimated dollar amount of revenues we expect to realize in the future as a result of performing work on contracts and our pro-rata share of work to be performed by our unconsolidated joint ventures. We generally include total expectedestimated revenues in backlog when a contract is awarded under a legally binding agreement. In many instances, arrangements included in backlog are complex, nonrepetitive and may fluctuate over the contract period due to the release of contracted work in phases by the customer. Additionally, nearly all contracts allow customers to terminate the agreement at any time for convenience.convenience, and from time to time customers may dispute or try to renegotiate existing contracts. These and other factors may result in delays in our recognition of revenue from our backlog, and in differences between the amounts we book as backlog and the amounts we recognize as revenue. Certain contracts provide maximum dollar limits, with actual authorization to perform work under the contract agreed upon on a periodic basis with the customer. In these arrangements, only the amounts authorized are included in backlog. For projects where we act solely in a project management capacity, we only include the expected value of our services in backlog.
We define backlog, as it relates to U.S. government contracts, as our estimate of the remaining future revenue from existing signed contracts over the remaining base contract performance period (including customer approved option periods) for which work scope and price have been agreed with the customer. We define funded backlog as the portion of backlog for which funding currently is appropriated, less the amount of revenue we have previously recognized. We define unfunded backlog as the total backlog less the funded backlog. Our GS backlog does not include any estimate of future potential delivery orders that might be awarded under our government-wide acquisition contracts, agency-specific indefinite delivery/indefinite quantity contracts or other multiple-award contract vehicles, nor does it include option periods that have not been exercised by the customer.
Within our GS business segment, we calculate estimated backlog for long-term contracts associated with the U.K. government's PFIs based on the aggregate amount that our client would contractually be obligated to pay us over the life of the project. We update our estimates of the future work to be executed under these contracts on a quarterly basis and adjust backlog if necessary.
Refer to "Item 1A. Risk Factors" contained in Part 1 of this Annual Report on Form 10-K for a discussion of other factors that may cause backlog to ultimately convert into revenues at different amounts.
We have included in the table below our proportionate share of unconsolidated joint ventures' estimated backlog. As these projects are accounted for under the equity method, only our share of future earnings from these projects will be recorded in our results of operations. Our proportionate share of backlog for projects related to unconsolidated joint ventures totaled $2.6$4.1 billion at December 29, 2023, and $2.4$3.9 billion at December 31, 20212022.
As a result of U.S. Transportation Command lifting the stop work order on the HomeSafe contract in November 2022, we have recognized $54 million and 2020, respectively. Our$39 million in backlog included inas of December 29, 2023 and December 31, 2022, respectively, for our transition work. Additionally, for the table belowyear ended December 29, 2023, we recognized $0.8 billion for projects relatedour proportionate share of KZJV's backlog and for KBR services to consolidated joint venturesbe provided to KZJV as a result of receiving a full notice to proceed with noncontrolling interests includes 100%Phase 2 of the backlog associated with those joint ventures and totaled $37 million and $52 million at December 31, 2021 and 2020, respectively.Plaquemines LNG project.
The following table summarizes our backlog by business segment for the years ended December 31, 202129, 2023 and December 31, 2020,2022, respectively:
| | Dollars in millions | Dollars in millions | December 31, 2021 | | December 31, 2020 | Dollars in millions | December 29, 2023 | | December 31, 2022 |
| Government Solutions | Government Solutions | $ | 12,628 | | | $ | 12,661 | |
| Sustainable Technology Solutions | Sustainable Technology Solutions | 2,345 | | | 2,454 | |
| Total backlog | Total backlog | $ | 14,973 | | | $ | 15,115 | |
We estimate that as of December 31, 2021,29, 2023, 30% of our backlog will be executed within one year. Of this amount, 91%we estimate that 87% will be recognized in revenues on our consolidated statement of operations and 9%13% will be recorded by our unconsolidated joint ventures. As of December 31, 2021, $18029, 2023, $164 million of our backlog relates to active contracts that are in a loss position.
As of December 31, 2021, 12%29, 2023, 10% of our backlog was attributable to fixed-price contracts, 46%39% was attributable to PFIs, 29%36% was attributable to cost-reimbursable contracts and 13%15% was attributable to time-and-materials contracts. For contracts that contain fixed-price, cost-reimbursable and time-and-materials components, we classify the individual components as either fixed-price, cost-reimbursable or time-and materials according to the composition of the contract; however, for smaller contracts, we characterize the entire contract based on the predominant component. As of December 31, 2021, $9.529, 2023, $9.2 billion of our GS backlog was currently funded by our customers.
As of December 31, 2021,29, 2023, we had approximately $4.7$4.4 billion of priced option periods not yet exercised by the customer for U.S. government contracts that are not included in the backlog amounts presented above.
The difference between backlog of $15.0$17.3 billion and the remaining performance obligationobligations as defined by ASC 606 of $11.7$12.7 billion is primarily due to our proportionate share of backlog related to unconsolidated joint ventures which is not included in our remaining performance obligation.obligations. See Note 3 "Revenue" to our consolidated financial statements for discussion of the remaining performance obligations.
Liquidity and Capital Resources
Liquidity is provided by available cash and cash equivalents, cash generated from operations, our Senior Credit Facility (as defined below) and access to capital markets. Our operating cash flow can vary significantly from year to year and is affected by the mix, terms, timing and stage of completion of our projects. We often receive cash in the early phasesadvance on certain of our sustainable technology projects. On time-and-material and cost reimbursable contracts, we may utilize cash on hand or availability under our Senior Credit Facility to satisfy any periodic operating cash requirements for working capital, as we incur costs and subsequently invoice our customers.
Certain STS services projects may require us to provide credit support for our performance obligations to our customers in the form of letters of credit, surety bonds or guarantees. Our ability to obtain new project awards in the future may be dependent on our ability to maintain or increase our letter of credit and surety bonding capacity, which may be further dependent on the timely release of existing letters of credit and surety bonds. As the need for credit support arises, letters of credit may be issued under our $1 billion bankthe Revolver (as defined below) or with lending counterparties on a bilateral, syndicated or other basis.
As discussed in Note 1211 "Debt and Other Credit Facilities" of our consolidated financial statements, on November 18, 2021, we entered into Amendment No. 5 under8 on February 6, 2023, to our existing Credit Agreement, dated as of April 25, 2018, as amended ("Pro Rata Facilities"Credit Agreement"), consisting of a $1 billion revolving credit facility (the "Revolver"), a $442 million Term Loan A ("Term Loan A") with debt tranches denominated in US dollars, AustralianU.S. dollars and British pound sterling and a $512 million Term Loan B ("Term Loan B"), and together with an aggregate capacity of $1.954 billion. The Amendment, among other things, (i) established an additional tranche of £122.1 million inthe Revolver and Term Loan A, incurred by Kellogg Brown & Root Limited,the "Senior Credit Facility"). Amendment No. 8 (i) replaces the LIBOR-based reference borrowing rate with a wholly owned indirectSOFR-based reference borrowing rate for the U.S. dollar tranche of Term Loan A and the Revolver and (ii) implements the Company’s recent fiscal year change from a calendar year ending on December 31 to a 52-53 week year ending on the Friday closest to December 31, effective beginning with fiscal year 2023.
We entered into Amendment No. 9 to our Credit Agreement on June 6, 2023. Amendment No. 9 replaces the LIBOR-based reference borrowing rate with a SOFR-based reference borrowing rate for Term Loan B. We entered into Amendment No. 10 to our Credit Agreement on July 26, 2023. Amendment No. 10 provided for an additional $200 million loan tranche under Term Loan A. We borrowed the full $200 million principal amount available under this additional loan tranche, and this $200 million borrowing was applied as a partial repayment of the outstanding amounts of principal and accrued interest under the Revolver.
We entered into Amendment No.11 to our Credit Agreement on January 19, 2024. This amendment provides for an incremental Term Loan B facility in an aggregate principal amount of $1 billion and extends the Term Loan B maturity date to January 2031. We borrowed the full $1 billion principal amount available under this loan and primarily used the proceeds to repay all amounts of outstanding principal and accrued interest under the Company’s Term Loan B facility at December 29, 2023 and to partially repay outstanding principal and accrued interest under the Company’s Revolver. We entered into Amendment No.12 to our Credit Agreement on February 7, 2024. This amendment consolidated the USD denominated Term A-1, Term A-2 and Term A-4 loan facilities under our Credit Agreement into the amended USD denominated Term A-1 loan facility and continued the GBP denominated Term A-3 loan facility outstanding at December 29, 2023. Additionally, this amendment extended the maturity date of the $1 billion Revolver, amended Term A-1 loan facility and Term A-3 loan facility to February 2029. Immediately following execution of Amendment No. 12, we had approximately $500 million outstanding related to the remaining Term Loan A facilities and $117 million outstanding on our Revolver.
subsidiary of KBR, Inc., organized under the laws of England and Wales, (ii) increased capacity and flexibility under certain negative covenants, (iii) permits the netting of unrestricted cash up to a specified cap for purposes of calculating the leverage ratio and (iv) reduced the interest rate payable for applicable margins and commitment fees and extended the maturity dates to November 2026 for Term Loan A and the Revolver. The maturity date of Term Loan B remained unchanged maturing February 2027.
We believe that existing cash balances, internally generated cash flows, availability under our Senior Credit Facility and other lines of credit are sufficient to support our business operations for the next 12 months. As of December 31, 2021,29, 2023, we were in compliance with all financial covenants related to our debt agreements.
Cash and cash equivalents totaled $370$304 million at December 29, 2023 and $389 million at December 31, 2021 and $436 million at December 31, 20202022 and consisted of the following:
| | | | December 31, | | December 29, | | December 31, |
| Dollars in millions | Dollars in millions | 2021 | | 2020 | Dollars in millions | 2023 | | 2022 |
| Domestic U.S. cash | Domestic U.S. cash | $ | 34 | | | $ | 54 | |
| International cash | International cash | 220 | | | 231 | |
| Joint venture and Aspire Defence project cash | Joint venture and Aspire Defence project cash | 116 | | | 151 | |
| Total | Total | $ | 370 | | | $ | 436 | |
Our cash balances are held in numerous accounts throughout the world to fund our global activities.activities, including acquisitions, joint ventures and other business partnerships. Domestic cash relates to cash balances held by U.S. entities and is largely used to support project activities of those businesses as well as general corporate needs such as the payment of dividends to shareholders, repayment of debt and potential repurchases of our outstanding common stock.
Our international cash balances may be available for general corporate purposes but are subject to local restrictions, such as capital adequacy requirements and maintaining sufficient cash balances to support our U.K. pension plan and other obligations incurred in the normal course of business by those foreign entities. Repatriations of our undistributed foreign earnings are generally free of U.S. tax but may incur withholding and/or state taxes. We consider our future U.S. and non-U.S. cash needs as 1) our anticipated foreign working capital requirements, including funding of our U.K. pension plan, 2) the expected growth opportunities across all geographical markets and 3) our plans to invest in strategic growth opportunities, which may include acquisitions, joint ventures and other business partnerships around the world, including whether foreign earnings are permanently reinvested.
In 2021, we changed our permanent reinvestment assertion on the unremitted earnings, as well as all current and future earnings in a wholly owned subsidiary in India. We determined that the past unremitted earnings of $30 million is available for future repatriation for deployment in the U.S. Accordingly, we have recorded the income tax expense expected with the repatriation in 2021, which was less than $2 million. In addition, we changed our permanent reinvestment assertion on all current and future earnings in our subsidiaries in Saudi Arabia. The income tax expense associated with the current and future earnings will be reflected in the interim and annual periods in which the earnings are generated. The impact is not material to income tax expense. If management were to completely remove the indefinite investment assertion on all foreign subsidiaries, the exposure to local withholding taxes would be less than $9$7 million.
Joint venture cash and Aspire Defence project cash balances reflect the amounts held by joint venture entities that we consolidate for financial reporting purposes. These amounts are limited to those entities' activities and are not readily available for general corporate purposes; however, portions of such amounts may become available to us in the future should there be a distribution of dividends to the joint venture partners. We expect that the majority of the joint venture cash balances will be utilized for the corresponding joint venture purposes or for paying dividends. Joint venture cash and Aspire Defence project cash balances reflect the amounts held by joint venture entities that we consolidate for financial reporting purposes. These amounts are limited to those entities' activities and are not readily available for general corporate purposes; however, portions of such amounts may become available to us in the future should there be a distribution of dividends to the joint venture partners. We expect that the majority of the joint venture cash balances will be utilized for the corresponding joint venture purposes or for paying dividends.
As of December 31, 2021,29, 2023, substantially all of our excess cash was held in interest bearing operating accounts or short-term investment accounts with the primary objectives of preserving capital and maintaining liquidity.
Cash Flows
The following table summarizes our cash flows for the periods indicated:
| | | | | Years ended December 31, | | | Years ended, |
| | December 29, | | | | December 29, | | December 31, |
| Dollars in millions | Dollars in millions | | 2021 | | 2020 | | 2019 | Dollars in millions | | 2023 | | 2022 | | 2021 |
| Cash flows provided by operating activities | Cash flows provided by operating activities | | $ | 278 | | | $ | 367 | | | $ | 256 | |
| Cash flows used in investing activities | | (428) | | | (877) | | | (158) | |
| Cash flows provided by (used in) investing activities | |
| Cash flows provided by (used in) financing activities | Cash flows provided by (used in) financing activities | | 87 | | | 225 | | | (133) | |
| Effect of exchange rate changes on cash | Effect of exchange rate changes on cash | | (3) | | | 9 | | | 8 | |
| (Decrease) increase in cash and equivalents | | $ | (66) | | | $ | (276) | | | $ | (27) | |
| Increase (decrease) in cash and cash equivalents | |
Operating Activities. Cash provided by operations totaled $278$331 million and $367$396 million in 20212023 and 2020,2022, respectively, as compared to a net loss of $261 million and net income of $26 million and net loss of $51$192 million in 20212023 and 2020,2022, respectively. Cash flows from operating activities result primarily from earnings and are affected by changes in operating assets and liabilities, which consist primarily of working capital balances for projects. Working capital levels vary from year to year and are primarily affected by the Company's volume of work. These levels are also impacted by the mix, stage of completion and commercial terms of projects. Working capital requirements also vary by project depending on the type of client and location throughout the world.
The decrease in operating cash flows in 2023 compared to 2022 is primarily attributed to the $144 million payment made in the third quarter of 2023 related to the settlement of a legacy legal matter. This decrease was offset by increases in operating cash flows from changes in our pension funding amounts in the 2023. In 2022, we made an advance payment in October 2022 to our U.K. pension plan for approximately £29 million of the £33 million required minimum annual contributions. No similar advance payments were made in 2023. Additionally, there were increases in operating cash flows from changes in the primary components of our working capital. The primary components of our working capital accounts are accounts receivable, contract assets, accounts payable and contract liabilities. These components are impacted by the size and changes in the mix of our cost-reimbursable and time-and-materialtime-and-materials projects versus fixed price projects, and as a result, fluctuations in these components are not uncommon in our business. Specifically, the $476 million unfavorable cash flow impact related to accounts receivable and the $447 million favorable cash flow impact related to accounts payable were primarily driven by increased volume associated with the OAW program.
Investing activitiesActivities. Cash used in investing activities totaled $428$70 million in 2021, which included $4062023 and was primarily related to the second payment for an additional investment of $39 million net cash used for the acquisition of Frazer-Nashin Mura Technology and Harmonic and acquisition of a technology license, $29 million of cash used primarily for funding our proportionate share of JKC's ongoing legal and commercial costs and an investment in a plastics recycling technology and $30 million used for capital expenditures partiallyof $80 million. This was offset by proceeds receiveda return of $44investment of approximately $61 million whichfrom JKC resulting from the receipt of the second payment from the Subcontractor Settlement Agreement. See Note 9 "Equity Method Investments and Variable Interest Entities" for further details.
Cash provided by investing activities totaled $37 million in 2022 and was primarily due to a return of investment of approximately $190 million from JKC resulting from the receipt of the first payment from the Subcontractor Settlement Agreement, a return of investment from BRIS of $10 million as our cumulative distributions from inception of the joint venture exceeded our cumulative earnings and proceeds of $55 million from the sale of our investment interest in the Middle East Petroleum Corporation (EBIC Ammonia project).
Cash used in investing activities totaled $877three U.K. Road Projects. See Note 9 "Equity Method Investments and Variable Interest Entities" for further details. This was partially offset by our first payment related to an additional investment of $61 million in 2020Mura Technology, $71 million in capital expenditures, $13 million net cash paid upon divestiture of a joint venture acquired as part of a historical GS acquisition and was primarily attributable to$73 million netcash used for the acquisition of Centauri, net of cash acquired of $823 million, the acquisition of SMA and funding our proportionate share of JKC's ongoing legal and commercial costs.VIMA. See Note 4 "Acquisitions" for further details
Financing activities. Cash provided byused in financing activities totaled $87$359 million in 20212023 and was primarily due to borrowingsa net cash outflow of $290$567 million onfor the settlement and maturity of our Senior Credit Facilityoutstanding Convertible Notes, corresponding Note Hedge and $12warrants settled and paid during the year. Cash used in financing activities also included $72 million in net proceeds received from the issuance of dividend payments to common stock, offset by $82shareholders, $125 million for the repurchase of common stock under our share repurchase program, $61 million of dividend payments to common shareholders, $27 million in payments on borrowings related to our Senior Credit Facility, $13 million repayment on our finance lease obligations, $4 million repayment on our non-recourse debt associated with our Fasttrax joint venture and dividends paid to NCI shareholders of $23 million (of which $15 million was driven by the dividends paid to the minority interest of the sale of the EBIC Ammonia plant).
Cash provided by financing activities totaled $225 million in 2020 and was primarily due to approximately $245 million of net proceeds from the offering of our 4.750% Senior Notes due 2028 and borrowings of $260 million on our Senior Credit Facility, offset by $410 million in net payments on borrowings which includes voluntary principal payments related to the refinancing of our Senior Credit Facility, $11 million repayment on our non-recourse debt associated with our Fasttrax joint venture, $11 million repayment on our finance lease obligations, $54 million of dividend payments to common shareholders and $47 million for the repurchase of common stock under our share repurchase program."withhold to cover" program, $340 million in payments on our revolving credit facility and $17 million of principal payments related to our Senior Credit Facility. These decreases were partially offset by $785 million in borrowings related to our revolving credit facility and $5 million in net proceeds from the issuance of common stock. See Note 1211 "Debt and Other Credit Facilities" for further discussion of our Senior Credit FacilityFacility.
Cash used in financing activities totaled $399 million in 2022 and Note 19 "Share Repurchases" for further discussion onwas primarily due to $193 million of repurchases of common stock under our share repurchase program.program, $66 million of dividend payments to common shareholders, $116 million in net payments on borrowings related to our Senior Credit Facility, $11 million repayment on our finance lease obligations, $10 million for the repurchase of common stock under our "withheld to cover" program and dividends paid to NCI shareholders of $4 million. These decreases were partially offset by $5 million in net proceeds received from the issuance of common stock and $3 million in investments from NCI shareholders.
Future sources of cash. We believe that future sources of cash include cash flows from operations (including accounts receivable monetization arrangements), cash derived from working capital management and cash borrowings under the Senior Credit Facility.
Future uses of cash. We believe that future uses of cash include working capital requirements, joint venture capital calls, capital expenditures, dividends, pension funding obligations, repayments of borrowings, share repurchases, legal settlements of any currently outstanding legal matter or any future legal proceeding and strategic investments including acquisitions.acquisitions, joint ventures and other business partnerships. Our capital expenditures will be focused primarily on facilities and equipment to support our businesses. In addition, we will use cash to make payments under leases and various other obligations, including potential litigation payments, as they arise.
Other factors potentially affecting liquidity
Ichthys LNG Project.In reference to Note 6 "Unapproved Change Orders, and Claims, Against Clients and Estimated Recoveries As part of Claims Against Suppliers and Subcontractors” to our consolidated financial statements, in October 2021, JKC entered into a bindingthe settlement agreement (the “Settlement Agreement”) that resolved the outstanding claims and disputes between JKC and its client, Ichthys LNG, Pty, Ltd (collectively, “the Parties”). As a result of the Settlement Agreement, the Parties agreed to withdraw all claims and terminate all ongoing arbitrations and court proceedings between the Parties, including the following:
•Under the cost-reimbursable scope of the contract, JKC believed amounts paid or payable to the suppliers and subcontractors in settlement of their contract claims related to the cost-reimbursable scope were an adjustment to the contract price. JKC made claims for such contract price adjustments; however, the client disputed some of these contract price adjustments. In order to facilitate the continuation of work, the client agreed to a contractual mechanism (“Funding Deed”) in 2016 providing funding in the form of an interim contract price adjustment to JKC and consented to settlement of subcontractor claims as of that date related to the cost-reimbursable scope. In 2017, additional settlements pertaining to suppliers and subcontractors under the cost-reimbursable scope of the contract were presented to the client, and the client consented to payment to JKC but reserved its contractual rights. The Settlement Agreement fully resolved these matters.
•JKC was entitled to an amount of profit and overhead (“TRC Fee”) which was a fixed percentage of the target reimbursable costs ("TRC") under the reimbursable component of the contract which was to be agreed by the Parties. The Parties were unable to reach agreement. The Settlement Agreement fully resolved this matter.
•Claims for incurred costs related to scope increases and other factors for which JKC believed it is entitled to reimbursement under the contract.
In connection with preliminary settlement discussions, the Company recorded a non-cash charge to equity in earnings of unconsolidated affiliates in the amount of $193 million in the quarter ended June 30,October 2021, which reflected KBR’s proportionate share of the unpaid, unapproved change orders and claims. This non-cash charge does not impact JKC’s pursuit of subcontractor claims associated with the combined cycle power. In the quarter ended September 30, 2021, KBR recorded an additional charge of approximately $10 million for its proportionate share of final warranty items.
As part of the Settlement Agreement, KBR’s letters of credit were also reduced to $82 million from $164 million.
Additionally, as part of this settlement agreement, the Parties agreed to consult in good faith and to cooperate to seek maximum recovery from the insurance policies and paint manufacturer for the deterioration of paint and insulation on certain exterior areas of the plant. The Settlement Agreement does not impact pursuit of, or positions relatedParties agreed to JKC’s subcontractorcollectively pursue claims associated withagainst the combined cycle power plant, of whichpaint manufacturer, and JKC incurred substantial costs to complete the power planthas assigned claims under the fixed-price portioninsurance policy regarding the paint and insulation matters to the client. The parties have agreed that if, at the date of final resolution of the Ichthys LNG contract. JKC believes these costs are recoverableabove proceedings and claims with respect to the paint and insulation matters, the recovered amount from the Consortium who abandoned their contractual obligationpaint manufacturer and insurance claim is less than the stipulated ceiling amount in the settlement agreement, JKC will pay the client the difference between the stipulated ceiling amount and the recovered amount. JKC has provided for and continues to complete the power plant as the original subcontractor. We have initiated arbitrations and other legal proceedings to recover these costs which may take several years to resolve. Asmaintain a result, we funded our proportionate share of JKC's capital requirements to complete the power plant as these legal proceedings progress.provision for this contingent liability.
U.K. pension obligation. We have recognized on our consolidated balance sheetsheets a funding deficit of $88approximately $15 million (measured(calculated as the difference betweenexcess of the projected benefit obligations over the fair value of plan assets and the projected benefit obligationassets) as of December 31, 2021)29, 2023) for our frozen U.K. defined benefit pension plans.plan. The total amountsamount of employer pension contributions paid for the year ended December 31, 2021 were $4629, 2023 is $9 million and primarily related tofor our defined benefit plan in the U.K. On October 17, 2022, we made an advance payment to our U.K. pension plan for approximately £29 million of the £33 million required minimum annual contributions for the year ending December 29, 2023. The funding requirements for our U.K. pension plan are determined based on the U.K. Pensions Act 1995. Annual minimum funding requirements are based on a binding agreement with the trusteesTrustee of the U.K. pension plan that is negotiated on a triennial basis which is slated to commence in 2021basis. In June 2022, KBR and is required to be completed by April 2022. The currentthe Trustee executed an agreement calls forrequiring minimum annual contributions of approximately £33 million ($45(approximately $42 million at current exchange rates) untilfor the next minimum funding requirements are finalized.period through March 2028. This schedule of contributions will be reviewed by the Trustee and KBR no later than 15 months after the effective date of each actuarial valuation, due every three years. In the future, pension funding may increase or decrease depending on changes in the levels of interest rates, pension plan asset return performance and other factors. A significant increase in our funding requirements for the U.K. pension plan could result in a material adverse impact on our financial position.
Sales of Receivables. From time to time, we sell certain receivables to unrelated third-party financial institutions under various accounts receivable monetization programs. One such program is with MUFG Bank, Ltd. (“MUFG”) under a Master Accounts Receivable Purchase Agreement (the “RPA”), which provides the sale to MUFG of certain of our designated eligible receivables, with a significant portion of such receivables being owed by the U.S. government. We plan to continue to utilize these programs to ensure we have flexibility in regards to meeting our capital needs. Refer to Note 20 "Fair Value of Financial Instruments and Risk Management" to our consolidated financial statements for further discussion on our sales of receivables.
Credit Agreement and Senior Credit Facility
Information relating to our Senior Credit Facility is described in Note 1211 "Debt and Other Credit Facilities" to our consolidated financial statements in Part II, Item 8 of this Annual Report on Form 10-K and the information discussed therein is incorporated by reference into this Part II, Item 7.
Senior Notes
Information relating to our Senior Notes is described in Note 1211 "Debt and Other Credit Facilities" to our consolidated financial statements in Part II, Item 8 of this Annual Report on Form 10-K and the information discussed therein is incorporated by reference into this Part II, Item 7.
Convertible Senior Notes
InformationOn November 15, 2018, we issued and sold $350 million of 2.50% Convertible Senior Notes due 2023 (the "Convertible Notes") pursuant to an indenture between us and Citibank, N.A., as trustee. Concurrent with the issuance of the Convertible Notes, we entered into privately negotiated convertible note hedge transactions (the "Note Hedge Transactions") and warrant transactions (the "Warrant Transactions") with the option counterparties. In 2023, we settled our outstanding Convertible Notes and corresponding Note Hedge and unwound the warrants.
For more information relating to our Convertible Senior Notes, is described in Note 12Hedge Transactions and Warrant Transactions, refer to Note 11 "Debt and Other Credit Facilities" to our consolidated financial statements in Part II, Item 8and Note 22 "Cash Election and Repurchase of this Annual Report on Form 10-KConvertible Notes and the information discussed therein is incorporated by reference into this Part II, Item 7.
Nonrecourse Project Finance Debt
Information relating to our nonrecourse project debt is described in Note 12 "Debt and Other Credit Facilities"Warrant Unwind Agreements" to our consolidated financial statements in Part II, Item 8 of this Annual Report on Form 10-K and the information discussed therein is incorporated by reference into this Part II, Item 7.
Off-Balance Sheet Arrangements
Letters of credit, surety bonds and guarantees. In the ordinary course of business, we may enter into various arrangements providing financial or performance assurance to customers on behalf of certain consolidated and unconsolidated subsidiaries, joint ventures and other jointly executed contracts. Such off-balance sheet arrangements include letters of credit, surety bonds and corporate guarantees to support the creditworthiness or project execution commitments of these entities and typically have various expiration dates ranging from mechanical completion of the project being constructed to a period beyond completion in certain circumstances such as for warranties. We may also guarantee that a project, once completed, will achieve specified performance standards. If the project subsequently fails to meet guaranteed performance standards, we may incur additional costs, pay liquidated damages or be held responsible for the costs incurred by the client to achieve the required performance standards. The potential amount of future payments that we could be required to make under an outstanding performance arrangement is typically the remaining estimated cost of work to be performed by or on behalf of third parties. For cost reimbursablecost-reimbursable contracts, amounts that may become payable pursuant to guarantee provisions are normally recoverable from the client for work performed under the contract. For lump-sum or fixed-price contracts, the performance guarantee amount is the cost to complete the contracted work, less amounts remaining to be billed to the client under the contract. Remaining billable amounts could be greater or less than the cost to complete the project. If costs exceed the remaining amounts payable under the contract, we may have recourse to third parties, such as owners, subcontractors or vendors for claims.
In our joint venture arrangements, the liability of each partner is usually joint and several. This means that each joint venture partner may become liable for the entire risk of performance guarantees provided by each partner to the customer. Typically, each joint venture partner indemnifies the other partners for any liabilities incurred in excess of the liabilities the other party is obligated to bear under the respective joint venture agreement. We are unable to estimate the maximum potential amount of future payments that we could be required to make under outstanding performance guarantees related to joint venture projects due to a number of factors, including but not limited to, the nature and extent of any contractual defaults by our joint venture partners, resource availability, potential performance delays caused by the defaults, the location of the projects and the terms of the related contracts. See “Item 1A. Risk Factors” contained in Part I of this Annual Report on Form 10-K for information regarding our fixed-price contracts and operations through joint ventures and partnerships.
In certain limited circumstances, we enter into financial guarantees in the ordinary course of business, with financial institutions and other credit grantors, which generally obligate us to make payment in the event of a default by the borrower. These arrangements generally require the borrower to pledge collateral to support the fulfillment of the borrower’s obligation. We account for both financial and performance guarantees at fair value at issuance in accordance with ASC 460-10 Guarantees and, as of December 31, 2021,29, 2023, we had no material guarantees of the work or obligations of third parties recorded.
As of December 31, 2021,29, 2023, we had $1 billion in a committed line of credit on the Revolver under theour Senior Credit Facility and $522
$392 million of bilateral and uncommitted lines of credit to support the issuance of letters of credit. As of December 31, 2021,29, 2023, with respect to our Senior Credit Facility,Revolver, we had $364$505 million of outstanding borrowings previously issued to fund the acquisitions of Centauri and Frazer-Nash and $48borrowings. We also have $14 million of outstanding letters of credit.credit on our Senior Credit Facility. With respect to our $522$392 million of bilateral and uncommitted lines of credit, we had utilized $229$298 million for letters of credit as of December 31, 2021.29, 2023. The total remaining capacity of these committed and uncommitted lines of credit was approximately $880$575 million. Information relating to our letters of credit is described in Note 1211 "Debt and Other Credit Facilities" to our consolidated financial statements in Part II, Item 8 of this Annual Report on Form 10-K and the information discussed therein is incorporated by reference into this Part II, Item 7. Other than as discussed in this report, we have not engaged in any material off-balance sheet financing arrangements through special purpose entities.
Contractual Obligations and Commitments
Significant contractual obligations and commercial commitments as of December 31, 202129, 2023 are as follows:
| | | | | | | | | | | | | | | | | | | | | | | | | | | | | | | | | | | | | | | | | |
| | Payments Due |
| Dollars in millions | 2022 | | 2023 | | 2024 | | 2025 | | 2026 | | Thereafter | | Total |
| Debt obligations | $ | 121 | | | $ | 366 | | | $ | 27 | | | $ | 27 | | | $ | 379 | | | $ | 736 | | | $ | 1,656 | |
| Interest (a) | 70 | | | 68 | | | 62 | | | 61 | | | 57 | | | 22 | | | 340 | |
| Operating leases | 55 | | | 51 | | | 42 | | | 36 | | | 25 | | | 85 | | | 294 | |
| Finance leases | 9 | | | 6 | | | 4 | | | 2 | | | — | | | — | | | 21 | |
| Pension funding obligation (b) | 46 | | | 45 | | | 45 | | | 45 | | | 45 | | | 103 | | | 329 | |
| Purchase obligations (c) | 35 | | | 12 | | | — | | | — | | | — | | | — | | | 47 | |
| Deferral of tax payments (d) | 30 | | | — | | | — | | | — | | | — | | | — | | | 30 | |
| Total (e) | $ | 366 | | | $ | 548 | | | $ | 180 | | | $ | 171 | | | $ | 506 | | | $ | 85 | | | $ | 2,717 | |
| | | | | | | | | | | | | | | | | | | | | | | | | | | | | | | | | | | | | | | | | |
| | Payments Due |
| Dollars in millions | 2024 | | 2025 | | 2026 | | 2027 | | 2028 | | Thereafter | | Total |
| Debt obligations (a) | $ | 31 | | | $ | 31 | | | $ | 1,054 | | | $ | 485 | | | $ | 250 | | | $ | — | | | $ | 1,851 | |
| Interest (a) (b) | 95 | | | 107 | | | 95 | | | 13 | | | 12 | | | — | | | 322 | |
| Operating leases | 55 | | | 49 | | | 36 | | | 31 | | | 30 | | | 70 | | | 271 | |
| Finance leases | 12 | | | 7 | | | 1 | | | 1 | | | 1 | | | — | | | 22 | |
| Pension funding obligation (c) | 42 | | | 41 | | | 41 | | | 41 | | | 15 | | | — | | | 180 | |
| Purchase obligations (d) | 51 | | | 35 | | | 11 | | | 6 | | | — | | | — | | | 103 | |
| | | | | | | | | | | | | |
| Total (e) | $ | 286 | | | $ | 270 | | | $ | 1,238 | | | $ | 577 | | | $ | 308 | | | $ | 70 | | | $ | 2,749 | |
(a)Subsequent to December 29, 2023, we entered into Amendment No.11 and Amendment No.12 to our Credit Agreement. See Note 11 "Debt and Other Credit Facilities" for additional information.
(b)Determined based on long-term debt borrowings outstanding at the end of 20212023 using the interest rates in effect for the individual borrowings as of December 31, 2021,29, 2023, including the effects of interest rate swaps. The payments due for interest reflect the cash interest that will be paid, which includes interest on outstanding borrowings and commitment fees. These amounts exclude the amortization of discounts or debt issuance costs.
(b)(c)Included in our pension funding obligations are payments related to our agreement with the trustees of our U.K. pension plan. The agreement for this plan calls for minimum annual contributions of £33 million ($4542 million at current exchange rates) from 20222024 through the next valuation.
(c)(d)In the ordinary course of business, we enter into commitments to purchase software and related maintenance, materials, supplies and similar items. The purchase obligations disclosed above do not include purchase obligations that we enter into with vendors in the normal course of business that support direct project costs on existing contracting arrangements with our customers. We expect to recover such obligations from our customers.
(d)The Cares Act permitted deferral of the employer portion of payroll taxes through December 31, 2020 of which 50% was due by December 31, 2021 and the remaining 50% is due by December 31, 2022. We paid $30 million in 2021 and the remaining $30 million is expected to be paid in the fourth quarter of 2022.
(e)We have excluded uncertain tax positions totaling $89$74 million as of December 31, 2021.29, 2023. The ultimate timing of settlement of these obligations cannot be determined with reasonable assurance. See Note 1312 to our consolidated financial statements for further discussion on income taxes.
Transactions with Joint Ventures
In the normal course of business, we form incorporated and unincorporated joint ventures to execute projects. In addition to participating as a joint venture partner, we often provide engineering, procurement, construction, operations or maintenance services to the joint venture as a subcontractor. Where we provide services to a joint venture that we control and therefore consolidate for financial reporting purposes, we eliminate intercompany revenues and expenses on such transactions. In situations where we account for our interest in the joint venture under the equity method of accounting, we do not eliminate any portion of our subcontractor revenues or expenses, however, we recognize profit on our subcontractor scope of work only to the extent the joint venture's scope of work to the end customer is complete. We recognize profitrevenue over time on our services provided to joint ventures that we consolidate and our services provided to joint ventures that we record under the equity method of accounting. See Note 109 to our consolidated financial statements in Part II, Item 8 of this Annual Report on Form 10-K for more information. The information discussed therein is incorporated by reference into this Part II, Item 7.
Recent Accounting Pronouncements
Information relating to recent accounting pronouncements is described in Note 2321 to our consolidated financial statements in Part II, Item 8 of this Annual Report on Form 10-K and the information discussed therein is incorporated by reference into this Part II, Item 7.
U.S. Government Matters
Information relating to U.S. government matters commitments and contingencies is described in Note 1514 to our consolidated financial statements in Part II, Item 8 of this Annual Report on Form 10-K and the information discussed therein is incorporated by reference into this Part II, Item 7.
Legal Proceedings
Information relating to various commitments and contingencies is described in Notes 6, 1413 and 1514 to our consolidated financial statements in Part II, Item 8 of this Annual Report on Form 10-K and the information discussed therein is incorporated by reference into this Part II, Item 7.
Critical Accounting Policies and Estimates
The discussion and analysis of our financial condition and results of operations is based upon our consolidated financial statements which have been prepared in conformity with U.S. GAAP. The preparation of our consolidated financial statements requires us to make estimates and judgments that affect the determination of financial positions, results of operations, cash flows and related disclosures. Our significant accounting policies are described in Note 1 to our consolidated financial statements. The following discussion is intended to highlight and describe those accounting policies that are especially critical to the preparation of our consolidated financial statements and to provide a better understanding of our significant accounting estimates and assumptions about future events that affect the amounts reported in our consolidated financial statements. Significant accounting estimates are important to the representation of our financial position and results of operations and involve our most difficult, subjective or complex judgments. We base our estimates on historical experience and various other assumptions we believe to be reasonable according to the current facts and circumstances through the date of the issuance of our financial statements.
Contract Revenue and Contract Estimates. Our policy on revenue recognition is provided in Note 1 to our consolidated financial statements for the year ended December 31, 2021.29, 2023 and is also applied to the revenues of our equity method investments included in equity in earnings of unconsolidated affiliates. We recognize revenue on substantially all of our contracts over time, as performance obligations are satisfied, due to the continuous transfer of control to the customer. Our contracts are generally accounted for as a single performance obligation and are not segmented between types of services provided. We recognize revenue on those contracts over time using the cost-to-cost method, based primarily on contract costs incurred to date compared to total estimated contract costs at completion. Contract costs include all direct materials, labor and subcontractors costs and indirect costs related to contract performance. We believe this method is the most accurate measure of contract performance because it directly measures the value of the goods and services transferred to the customer. For all other contracts where we have the right to consideration from the customer in an amount that corresponds directly with the value received by the customer based on our performance to date, we recognize revenue when services are performed and contractually billable.which generally coincides with our ability to bill.
The cost-to-cost method of revenue recognition requires us to prepare estimates of cost to complete for contracts in progress. Due to the nature of the work performed on many of our performance obligations, the estimates of total revenue and cost at completion is complex, subject to many variables and require significant judgment. In making such estimates, judgments are required to evaluate contingencies such as weather, potential variances in schedule and the cost of materials, labor and productivity, the impact of change orders, liability claims, contract disputes and achievement of contractual performance standards. As a significant change in one or more of these estimates could affect the profitability of our contracts, we routinely review and update our significant contract estimates through a disciplined project review process in which management reviews the progress and execution of our performance obligations and estimates at completion. We have a long history of working with multiple types of projects and in preparing cost estimates. However, there are many factors that impact future cost as outlined in “Item 1A. Risk Factors” contained in Part I of this Annual Report on Form 10-K. These factors can affect the accuracy of our estimates and materially impact our future reported earnings. Changes in total estimated contract costs and losses, if any, are recognized on a cumulative catch-up basis in the period in which the changes are identified at the contract level. Such changes in contract estimates can result in the recognition of revenue in a current period for performance obligations which were satisfied or partially satisfied in a prior period. Changes in contract estimates may also result in the reversal of previously recognized revenue if the current estimate differs from the previous estimate.
It is common for our contracts to contain variable consideration in the form of incentive fees, performance bonuses, award fees, liquidated damages or penalties that may increase or decrease the transaction price. Variable consideration may be tied to our performance, cost targets, or achievement of milestones. Other contract provisions also give rise to variable consideration such as unapproved change orders and claims, and on certain contracts, index-based price adjustments. We estimate the amount of variable consideration at the most likely amount we expect to be entitled and include in the transaction price when it is probable that a significant reversal of cumulative revenue recognized will not occur. Our estimates of variable consideration and determination of whether to include such amounts in the transaction price are based largely on our assessment of legal enforceability, anticipated performance and any other information (historical, current or forecasted) that is reasonably available to us. Variable consideration
associated with claims and unapproved change orders is included in the transaction price only to the extent of costs incurred. We recognize claims against suppliers and subcontractors as a reduction in recognized costs when enforceability is established by the contract and the amounts are reasonably estimable and probable of recovery. Reductions in costs are recognized to the extent of the lesser of the amounts management expects to recover or actual costs incurred. As of December 31, 2021 and 2020, we had recorded $426 million and $1.0 billion, respectively, of claim revenue and subcontractor recoveries for costs incurred to date and such costs are included in our estimates at completion. See Note 6 to our consolidated financial statements for our discussion on unapproved change orders and claims.
Purchase Price Allocation. We allocateUnder cost-reimbursable contracts, the purchase price is generally variable based upon our actual allowable costs incurred for materials, equipment, reimbursable labor hours, overhead and G&A expenses. The FAR provides guidance on types of an acquired businesscosts that are allowable in establishing prices for goods and services provided to the identifiable assetsU.S. government and liabilitiesits agencies.Pricing, including the types of the acquireecosts that are allowable, for non-U.S. government agencies and commercial customers is based on estimated fair values. The excess of the purchase price over the amount allocatedspecific negotiations with each customer. We recognize revenue on cost-reimbursable contracts to the identifiable assetsextent it is not probable a significant reversal will occur.
Our estimates of variable consideration and liabilities, if any, is recorded as goodwill. Fair value estimatesdetermination of whether to include such amounts in the transaction price are based largely on the assumptions management believes a market participant would use in pricing the assetour assessment of legal enforceability, anticipated performance and are developed using widely accepted valuation techniques such as discounted cash flows. When determining the fair value of the assets and liabilities of an acquired business, we make judgments and estimates using allany other information (historical, current or forecasted) that is reasonably available information to us including, but not limited to, quoted market prices, carrying values, expected future cash flows, which includes consideration of future growth rates and margins, attrition rates, future changes in technology and brand awareness, loyalty and position and discount rates. We engage third-party appraisal firms when appropriate to assist in the fair value determination of intangible assets. The purchase price allocation recorded in a business combination may change during the measurement period, which is a period not to exceed one year from the date of acquisition, as additional information about conditions existing at the acquisition date becomes available.us.
Goodwill and Intangible Assets. Goodwill is tested annually for possible impairment as of October 1the first day of eachthe fourth fiscal quarter within our fiscal year, and on an interim basis when indicators of possible impairment exist. For purposes of impairment testing, goodwill is assigned to the applicable reporting units based on our current reporting structure. We have the option to first assess qualitative factors to determine whether it is more likely than not that the fair value of a reporting unit is less than its carrying value. Qualitative factors assessed for each of the applicable reporting units include, but are not limited to, changes in macroeconomic conditions, industry and market considerations, cost factors, discount rates, competitive environments and financial performance of the reporting units. If the qualitative assessment indicates that it is more likely than not that the carrying value of a reporting unit exceeds its estimated fair value, a quantitative test is required.
We alsoWhile we have the option to proceed directly to the quantitative test. Under the quantitative impairment test, the estimated fair value of each reporting unit is compared to its carrying value, including goodwill. If the carrying value of the reporting unit including goodwill exceeds its fair value, an impairment charge equal to the excess would be recognized, up to a maximum amount of goodwill allocated to that reporting unit. We can resume the qualitative assessment in any subsequent period for any reporting unit.
For 2021,2023, management performed a qualitative impairment assessment of our reporting units, of which there were no indications that it was more likely than not that the fair value of our reporting units were less than their respective carrying values. As such, a quantitative goodwill test was not required, and no goodwill impairment was recognized in 2021.
For the 2020 annual goodwill impairment test, we utilized the two-step process to compare the estimated fair value of each reporting unit to the to its carrying value resulting in goodwill impairment of $99 million. The fair values of reporting units were determined using a combination of two methods, one utilizing market revenue and earnings multiples (the market approach) and the other derived from discounted cash flow models with estimated cash flows based on internal forecasts of revenues and expenses over a specified period plus a terminal value (the income approach). Under the market approach, we estimated fair value by applying earnings and revenue market multiples ranging from 4.31 to 11.59 times earnings and 0.31 to 2.09 times revenue. Under the income approach, we estimated fair value by discounting each reporting unit’s estimated future cash flows using a weighted-average cost of capital reflecting current market conditions and the risk profile of the reporting unit. To arrive at our future cash flows, we used estimates of economic and market assumptions, including growth rates in revenues, costs, tax rates and future expected changes in operating margins and cash expenditures that are consistent with changes in our business strategy. The risk-adjusted discount rates applied to our future cash flows under the income approach in 2020 ranged from 9.0% to 10.2%. We believe these two approaches are appropriate valuation techniques and we generally
weight the two resulting values equally as an estimate of a reporting unit's fair value for the purposes of our impairment testing. However, we may weigh one value more heavily than the other when conditions merit doing so. Other significant estimates and assumptions include terminal value growth rates, future estimates of capital expenditures and changes in future working capital requirements. The fair value derived from the weighting of these two methods provides appropriate valuations that, in the aggregate, reasonably reconcile to our market capitalization, taking into account observable control premiums.
Intangible assets with indefinite lives are not amortized but are subject to annual impairment tests or on an interim basis when indicators of potential impairment exist. An intangible asset with an indefinite life is impaired if its carrying value exceeds its fair value. During the year ended December 31, 2021, there were no triggering events identified. During the year ended December 31, 2020, we recognized an impairment loss on indefinite-lived intangible assets associated with certain trade names acquired through previous business combinations of our legacy ES business of approximately $11 million.
Intangible assets with finite lives are amortized on a straight-line basis over the useful life of those assets, ranging from 1 year to 25 years. We perform an impairment test of finite-lived intangibles whenever events or changes in circumstances indicate their carrying value may be impaired. If events or changes in circumstances indicate the carrying value of a finite-lived intangible may be impaired, the sum of the undiscounted future cash flows expected to result from the use of the asset group would be compared to the asset group’s carrying value. If the asset group’s carrying amount exceed the sum of the undiscounted future cash flows, we would determine the fair value of the asset group and record an impairment loss.2023.
Deferred Taxes, Valuation Allowances and Tax Contingencies. As discussed in Note 1312 to our consolidated financial statements, deferred tax assets and liabilities are recognized for the expected future tax consequences of events that have been recognized in our consolidated financial statements or tax returns. We record a valuation allowance to reduce certain deferred tax assets to amounts that are more likely than not to be realized. We evaluate the realizability of our deferred tax assets by assessing the valuation allowance and by adjusting the amount of such allowance, if necessary. The factors used to assess the likelihood of realization include our forecast of the timing and character of future taxable income exclusive of reversing temporary differences and carryforwards, future reversals of existing taxable temporary differences, income available from carryback years and available tax planning strategies that could be implemented to realize the net deferred tax assets. To arrive at our forecast of the timing and character of future taxable income, we use estimates of economic and market assumptions, including growth rates in revenues, costs and estimates of future operating margins. These estimates can entail varying degrees of judgment based upon the amount of deferred tax assets assessed and length of the carryforward period.
We consider both positive and negative evidence when evaluating the need for a valuation allowance on our deferred tax assets in accordance with ASC 740. Available evidence includes historical financial information supplemented by currently available information about future years. Generally, historical financial information is more objectively verifiable than projections of future income and is therefore given more weight in our assessment. We consider cumulative losses in the most recent twelve quarters to be significant negative evidence that is difficult to overcome in considering whether a valuation allowance is required. Conversely, we consider a cumulative income position over the most recent twelve quarters to be significant positive evidence that a valuation allowance may not be required. Changes in the amount, timing and character of our forecasted taxable income could have a significant impact of our ability to utilize deferred tax assets and related valuation allowance.
We believe there is a reasonable possibility that within the next 12 months sufficient positive evidence may become available to allow us to conclude that a significant portion of the valuation allowance will no longer be needed. The release of the valuation allowance could be in the range of $15 million to $25 million and result in a decrease to income tax expense. The timing of any release is dependent upon the potential HomeSafe contract booking.
Our ability to utilize the unreserved foreign tax credit carryforwards is based on our ability to generate future taxable income from foreign sources of approximately $662at least $333 million prior to their expiration whereas our ability to utilize other net deferred tax assets exclusive of those associated with indefinite-lived intangible assets is based on our ability to generate U.S. forecastedfuture taxable income of approximately $610at least $933 million. Changes in our forecasted taxable income in the appropriate character and source as well as jurisdiction,applicable taxing jurisdictions within the carryforward periods could affect the ultimate realization of deferred tax assets.assets and our valuation allowance.
IncomeWe recognize the effect of income tax positions must meet aonly if it is more likely than not recognition threshold tothat those positions will be recognized. Incomesustained. Recognized income tax positions are measured at the largest amount that previously failed to meet the moreis greater than 50% likely than not thresholdof being realized. Changes in recognition or measurement are recognizedreflected in the first subsequent financial reporting period in which that threshold is met. Previously recognized tax positions that no longer meet the more likely than not threshold are derecognizedchange in the first subsequent financial reporting period in which that threshold is no longer met. We recognizejudgment occurs. The Company records potential interest and penalties related to unrecognized tax benefits in income tax expense.
Tax filings of our subsidiaries, unconsolidated affiliates and related entities are routinely examined by tax authorities in the normal course of business. These examinations may result in assessments of additional taxes, which we work to resolve with the tax authorities and through the judicial process. Predicting the outcome of disputed assessments involves some uncertainty. Factors such as the availability of settlement procedures, willingness of tax authorities to negotiate and the operation and impartiality of judicial systems vary across the different tax jurisdictions and may significantly influence the ultimate outcome. We review the facts for each assessment, and then utilize assumptions and estimates to determine the most likely outcome and provide taxes, interest and penalties as needed based on this outcome.
Legal, Investigation and Other Contingent Matters. We record liabilities for loss contingencies when it is probable that a liability has been incurred and the amount is reasonably estimable. We provide disclosuredisclose matters when there is a reasonable possibility that the ultimate loss will exceed our recorded liability bywe believe a material amountloss is at least reasonably possible but not probable or if the loss is not reasonably estimable but probable and is expected to be material to our financial statements. Generally, our estimates related to these matters are developed in
consultation with internal and external legal counsel. Our estimates are based upon an analysis of potential results, assuming a combination of litigation and settlement strategies. The precision of these estimates and the likelihood of future changes depend on a number of underlying assumptions and a range of possible outcomes. When possible, we attempt to resolve these matters through settlements, mediation and arbitration proceedings. If the actual settlement costs, final judgments or fines differ from our estimates, our future financial results may be materially and adversely affected. We record adjustments to our initial estimates of these types of contingencies in the periods when the change in estimate is identified. All legal expenses associated with these matters are expensed as incurred. See Notes 6, 1413 and 1514 to our consolidated financial statements for further discussion of our significant legal, investigation and other contingent matters.
Pensions. Our pension benefit obligations and expenses are calculated using actuarial models and methods. The moremost critical assumption and estimate used in the actuarial calculations is the discount rate for determining the current value of benefit obligations. Other assumptions and estimates used in determining benefit obligations and plan expenses include expected rate of return on plan assets, inflation rates and demographic factors such as retirement age, mortality and turnover. These assumptions and estimates are evaluated periodically and are updated accordingly to reflect our actual experience and expectations.
The discount rate used to determine the benefit obligations was computed using a yield curve approach that matches plan specific cash flows to a spot rate yield curve based on high quality corporate bonds. The expected long-term rate of return on assets was determined by a stochastic projection that takes into account asset allocation strategies, historical long-term performance of individual asset classes, an analysis of additional return (net of fees) generated by active management, risks using standard deviations and correlations of returns among the asset classes that comprise the plans' asset mix. Plan assets are comprised primarily of equity securities, fixed income funds and securities, hedge funds, real estate and other funds. As we have both domestic and international plans, these assumptions differ based on varying factors specific to each particular country or economic environment.
The discount rate utilizedused to calculate the projected benefit obligation at the measurement date for our U.S. pension plan increaseddecreased to 2.45%4.70% at December 29, 2023 from 4.91% at December 31, 2021 from 2.00% at December 31, 2020.2022. The discount rate utilizedused to determine the projected benefit obligation at the measurement date for our U.K. pension plan, which constitutes 97%96% of all pension plans, increaseddecreased to 1.80%4.79% at December 29, 2023 from 5.00% at December 31, 2021 from 1.40% at December 31, 2020.2022. Our expected long-term rates of return on plan assets utilized at the measurement date decreasedincreased to 5.19%6.64% from 5.72%6.63% for our U.S. pension plans and increased to 4.67%6.79% from 3.70%6.00% for our U.K. pension plans, for the years ended December 29, 2023 and December 31, 2021 and 2020,2022, respectively.
The following table illustrates the sensitivity to changes in certain assumptions, holding all other assumptions constant, for our pension plans:
| | Effect on |
| Pretax Pension Cost in 2022 | | Pension Benefit Obligation at December 31, 2021 |
| Effect on | | | Effect on |
| Pretax Pension Cost in 2024 | | | Pretax Pension Cost in 2024 | | Pension Benefit Obligation at December 29, 2023 |
| Dollars in millions | Dollars in millions | U.S. | | U.K. | | U.S. | | U.K. | Dollars in millions | U.S. | | U.K. | | U.S. | | U.K. |
| 25-basis-point decrease in discount rate | 25-basis-point decrease in discount rate | $ | — | | | $ | — | | | $ | 2 | | | $ | 88 | |
| 25-basis-point increase in discount rate | 25-basis-point increase in discount rate | $ | — | | | $ | — | | | $ | (2) | | | $ | (81) | |
| 25-basis-point decrease in expected long-term rate of return | 25-basis-point decrease in expected long-term rate of return | $ | — | | | $ | 5 | | | N/A | | N/A | 25-basis-point decrease in expected long-term rate of return | $ | — | | | $ | | $ | 4 | | | N/A | | N/A |
| 25-basis-point increase in expected long-term rate of return | 25-basis-point increase in expected long-term rate of return | $ | — | | | $ | (5) | | | N/A | | N/A | 25-basis-point increase in expected long-term rate of return | $ | — | | | $ | | $ | (4) | | | N/A | | N/A |
Unrecognized actuarial gains and losses are generally recognized using the corridor method over a period of approximately 22 years, which represents a reasonable systematic method for amortizing gains and losses for the employee group. Our unrecognized actuarial gains and losses arise from several factors, including experience and assumption changes in the obligations and the difference between expected returns and actual returns on plan assets. The difference between actual and expected returns is deferred as an unrecognized actuarial gain or loss on our consolidated statement of comprehensive income (loss) and is recognized as a decrease or an increase in future pension expense. Our pretax unrecognized net actuarial loss in accumulated other comprehensive loss at December 31, 202129, 2023 was $787 million, of which $26 million is expected to be recognized as a component of our expected 2022 pension expense compared to $33 million in 2021.$872 million.
The actuarial assumptions used in determining our pension benefits may differ materially from actual results due to changing market and economic conditions, changes in the legislative or regulatory environment, higher or lower withdrawal rates and longer or shorter life spans of participants. While we believe that the assumptions used are appropriate, differences in actual experience, expectations or changes in assumptions may materially affect our financial position or results of operations.
Our actuarial estimates of pension expense and expected return on plan assets are discussed in Note 1110 in the accompanying consolidated financial statements.
Item 7A. Quantitative and Qualitative Disclosures about Market Risk
Financial Market Risk. Cash and cash equivalents are deposited with major banks throughout the world. We invest excess cash and cash equivalents in short-term securities, primarily money market funds, which carry a fixed rate of return. We have not incurred any credit risk losses related to deposits of our cash and cash equivalents.
Foreign Currency Risk. Because of the global nature of our business, we are exposed to market risk associated with changes in foreign currency exchange rates. We have historically attempted to limit exposure to foreign currency fluctuations through provisions requiring the client to pay us in currencies corresponding to the currency in which cost is incurred. In addition to this natural hedge, we may use foreign exchange forward contracts and options to hedge material exposures when forecasted foreign currency revenues and costs are not denominated in the same currency and when efficient markets exist. These derivatives are generally designated as cash flow hedges and are carried at fair value. We do not enter into derivative financial instruments for trading purposes or make speculative investments in foreign currencies. We recorded a net loss of $8 million for the year ended December 31, 2021, and a net gain of $4 million for the years ended December 31, 2020 and 2019 in other non-operating income (expense) on our consolidated statements of operations. The net loss of $8 million during the year ended December 31, 2021 consisted primarily of foreign currency losses of approximately $7 million on certain intercompany balance positions denominated in various currencies and an additional $1 million loss related to changes in the fair value of balance sheet hedges.
We use derivative instruments, such as foreign exchange forward contracts, to hedge foreign currency risk related to non-functional currency assets and liabilities on our consolidated balance sheets. We do not enter into derivative financial instruments for trading purposes or make speculative investments in foreign currencies. Each period, these balance sheet hedges are marked to market through earnings and the change in their fair value is largely offset by remeasurement of the underlying assets and liabilities. Within other non-operating income (expense) on our consolidated statements of operations, we recorded a net loss of $6 million for the year ended December 29, 2023, a net gain of $4 million for the year ended December 31, 2022 and a net loss of $8 million for the year ended December 31, 2021 . The fair value of these derivatives was not material to our consolidated balance sheet for the periods presented. For more information, see Note 2220 to our consolidated financial statements in Part II, Item 8 of this Annual Report on Form 10-K and the information discussed therein is incorporated by reference into this Part II, Item 7A.
Interest Rate Risk. We are exposed to market risk for changes in interest rates for the Revolver and term loan borrowings under the Senior Credit Facility. We had $364$505 million of borrowings outstandingissued under the Revolver to partially fund the acquisitionsas of Centauri and Frazer-Nash and $952December 29, 2023. Additionally, we had $1,096 million outstanding under the term loan portions of the Senior Credit Facility as of December 31, 2021.29, 2023. Borrowings under the Senior Credit Facility bear interest at variable rates as described in Note 1211 "Debt and Other Credit Facilities" to our consolidated financial statements.
We manageuse interest rate exposureswaps to reduce interest rate risk and to manage net interest expense by enteringconverting our variable rate debt under our Senior Credit Facility into fixed-rate debt. During the year ended December 29, 2023, we amended all of our existing interest rate swap agreements pursuant to which we agree to exchange, at specified intervals, the difference between fixed and variable interest amounts calculated on an agreed-upon notional principal amount.term SOFR effective March 2023. In October 2018,March 2023, we entered into additional USD denominated interest rate swap agreements covering $500 million ofwith a notional value of our outstanding term loans. Under these swap agreements, we$205 million effective April 2023 and expiring January 2027. We will receive a one month LIBOR rateSOFR and pay an average monthlya fixed rate of 3.055%3.61%. We also entered into GBP denominated amortizing swaps with an initial notional value of £118 million that are effective April 2023 and expire in November 2026. As of December 29, 2023, the notional value of the GBP denominated amortizing swaps was £116 million. We will receive SONIA and pay a fixed rate of 3.81% for the term of the swaps that expireswaps. Additionally, in September 2022. In March 2020, we entered into additional swap agreements coveringNovember 2023, the notional value of $400 million of our outstanding loans which are effective beginning October 2022. Under theseSeptember 2022 interest rate swap agreements, weagreement expiring January 2027 increased to $350 million. We will receive a one-month LIBORSOFR and pay an average monthlya fixed rate of 0.965% for the term of the swaps that expire in January 2027.3.43%. The swap agreements were designated as cash flow hedges at inception in accordance with ASC Topic 815 Accounting for Derivative and Hedging TransactionsHedging. The total fair value of these derivative instrumentsthe interest rate swaps at December 29, 2023 was a $36 million net liability of approximately $3 million as of December 31, 2021,asset, of which $10$24 million is included in other current liabilities and $7assets, $18 million is included in other assets and $6 million is included in other liabilities. Information relating to our portfolio of interest rate swaps is described in Note 20 "Fair Value of Financial Instruments and Risk Management" to our consolidated financial statements, which is incorporated by reference into this Item 7A.
At December 31, 2021,29, 2023, we had fixed rate debt aggregating $1.1 billion$1,353 million and variable rate debt aggregating $816$498 million, after taking into account the effects of the interest rate swaps.swaps that were effective at December 29, 2023. Our weighted average interest rate for the year ended December 31, 202129, 2023 was 3.68%5.81%. If interest rates were to increase by 50 basis points, pre-tax interest expense would increase by approximately $4$2 million in the next twelve months net of the impact from our swap agreements, based on outstanding borrowings as of December 31, 2021.29, 2023.
Item 8. Financial Statements and Supplementary Data
Report of Independent Registered Public Accounting Firm
To the Shareholders and Board of Directors
KBR, Inc.:
Opinion on the Consolidated Financial Statements
We have audited the accompanying consolidated balance sheets of KBR, Inc. and subsidiaries (the Company) as of December 29, 2023 and December 31, 2021 and 2020,2022, the related consolidated statements of operations, comprehensive income (loss), shareholders’ equity, and cash flows for each of the fiscal years in the three‑yearthree-year period ended December 31, 2021,29, 2023, and the related notes and financial statement schedule II (collectively, the consolidated financial statements). In our opinion, the consolidated financial statements present fairly, in all material respects, the financial position of the Company as of December 29, 2023 and December 31, 2021 and 2020,2022, and the results of its operations and its cash flows for each of the years in the three‑yearthree-year period ended December 31, 2021,29, 2023, in conformity with U.S. generally accepted accounting principles.
We also have audited, in accordance with the standards of the Public Company Accounting Oversight Board (United States) (PCAOB), the Company’s internal control over financial reporting as of December 31, 2021,29, 2023, based on criteria established in Internal Control – Integrated Framework (2013) issued by the Committee of Sponsoring Organizations of the Treadway Commission, and our report dated February 22, 202220, 2024 expressed an unqualified opinion on the effectiveness of the Company’s internal control over financial reporting.
Basis for Opinion
These consolidated financial statements are the responsibility of the Company’s management. Our responsibility is to express an opinion on these consolidated financial statements based on our audits. We are a public accounting firm registered with the PCAOB and are required to be independent with respect to the Company in accordance with the U.S. federal securities laws and the applicable rules and regulations of the Securities and Exchange Commission and the PCAOB.
We conducted our audits in accordance with the standards of the PCAOB. Those standards require that we plan and perform the audit to obtain reasonable assurance about whether the consolidated financial statements are free of material misstatement, whether due to error or fraud. Our audits included performing procedures to assess the risks of material misstatement of the consolidated financial statements, whether due to error or fraud, and performing procedures that respond to those risks. Such procedures included examining, on a test basis, evidence regarding the amounts and disclosures in the consolidated financial statements. Our audits also included evaluating the accounting principles used and significant estimates made by management, as well as evaluating the overall presentation of the consolidated financial statements. We believe that our audits provide a reasonable basis for our opinion.
Critical Audit Matters
The critical audit matters communicated below are matters arising from the current period audit of the consolidated financial statements that were communicated or required to be communicated to the audit committee and that: (1) relate to accounts or disclosures that are material to the consolidated financial statements and (2) involved our especially challenging, subjective, or complex judgments. The communication of critical audit matters does not alter in any way our opinion on the consolidated financial statements, taken as a whole, and we are not, by communicating the critical audit matters below, providing a separate opinionsopinion on the critical audit matters or on the accounts or disclosures to which they relate.it relates.
Contract revenue and contract cost estimates
Estimated costs at completion
As discusseddescribed in NotesNote 1 and 6 to the consolidated financial statements, a portion of the Company'sCompany’s revenue and equity in earnings of certain unconsolidated affiliates is derived from contracts with revenue recognized over time using a cost-based input measure of progress. The Company measures progress toward completion using the cost-to-cost method which measures progress as the ratioto measure progress. Revenue recognition under this method requires judgments to prepare estimates of actualtotal contract costs, incurredspecifically assumptions related to dateestimated labor costs, and total contract revenue, including amounts related to the Company’s estimated costs at completion (EACs). In measuring progress, judgments are required to determine the estimated amount of costs to complete contracts in progress, including costs for labor and subcontractor commitments, and recoveries from claims against suppliers and subcontractors.contractually allowable costs.
We identified the evaluation of EACstotal contract costs and total contract revenues for revenues recognized using a cost-based input measure of progresscertain contracts as a critical audit matter. Evaluating the EACsCompany’s estimates of total contract costs for certain contracts in progress involves auditor judgment given the variability and uncertainty associated with (1) estimating costs, including estimated labor and subcontractor commitments,costs, to be incurred over a long-termthe contract period and (2) amounts expected to be recovered fromperiod. Evaluating the resolutionCompany’s estimates of disputestotal contract revenue for certain contracts requires an evaluation of subjective assumptions, including those related to claims against suppliers and subcontractors.
The following are the primary procedures we performed to address this critical audit matter. We evaluated the design and tested the operating effectiveness of certain internal controls related to the Company’s process for estimating total contract costs, at completion. This included controls over estimating costs, including labor and subcontractor commitments, as well as amounts expected to be recovered upon resolution of disputesspecifically assumptions related to claims against suppliersestimated labor costs, and subcontractors.total contract revenue, including amounts related to contractually allowable costs. We evaluated the Company’s ability to estimate these amounts by comparing the Company’s previous estimatesestimated project margins to actual results. We evaluatedTo assess the EACs for certain contracts by (1) reasonableness of these estimates, we performed audit procedures including:
•obtaining and inspectingreading contractual documents with subcontractors, (2) interviewing projectcustomers;
•inquiring of financial and operational personnel to gain an understanding of the statusCompany to identify factors that should be considered within the estimated costs at completion or indications of project activities, and (3) obtaining and potential management bias;
•analyzing underlying documentation for a selection of costs in the EACs, including labor costs and subcontractor commitments. We assessed the Company’s determination of entitlement to and probability of recovery of certain claims against suppliers and subcontractors by inspecting correspondence obtained from the Company’s external legal counsel. We involved professionals with specialized skills and knowledge who assisted in evaluating the Company’s estimated recovery for certain claims against suppliers and subcontractors by comparing the Company’s estimate against our independently developed range of recoveries.costs;
Fair value of acquired customer relationships•performing sensitivity analyses on labor costs; and
•comparing allowable cost assumptions to contract terms and considering historical results and trends
Election to use cash as the method to settle Convertible Notes and Note Hedge
As discussed in Note 4Notes 11 and 22 to the consolidated financial statements, on October 20, 2021in April 2023, the Company acquired Frazer-Nash Consultancy Limited (Frazer-Nash)elected cash as the settlement method (the election) to settle the Convertible Notes and accounted forNote Hedge. The election caused the transaction as a business combination. As a result of the transaction, the Company recorded $79 million for customer relationships intangible assets. The estimatedConvertible Notes’ conversion option to be recognized at fair value separate from the Convertible Notes, caused a discount to be recognized on the Convertible Notes, and caused the Note Hedge to be recognized at fair value outside of this identifiable intangible asset was determined using a discounted cash flow model.
We identified the evaluation of the fair valueCompany’s determination of acquired customer relationships in the Frazer-Nash business combinationaccounting treatment associated with the election as a critical audit matter. ThereSpecifically, complex auditor judgment was a high degree of subjectivity in evaluatingrequired to evaluate the discounted future cash flows usedCompany’s accounting treatment due to determine the fair valuecomplexity of the customer relationships including the forecasted revenue attributable to customer relationships, the attrition rate, and the weighted-average cost of capital (WACC).
The following are the primary procedures we performed to address this critical audit matter. We evaluated the design and tested the operating effectiveness of certain internal controls over the Company’s acquisition date valuation process. This included controls related to the determination of the fair value of the customer relationships, including the forecasted revenue attributable to customer relationships, the attrition rate, and the WACC. We evaluated the forecasted revenue attributable to customer relationships by comparing it to the acquired entity’s actual historical results. To assess the Company’s ability to estimate the acquired entity’s revenues, we compared the Company’s historical revenue forecasts to actual results for previous acquisitions.
We performed sensitivity analyses over attrition rate applied to the forecasted revenues attributable to customer relationships to assess its impact on the Company’s determination of the fair value ofaccounting treatment associated with the customer relationships. In addition, we involved valuation professionals with specialized skillselection. We assessed the Company’s accounting treatment by:
•obtaining and knowledge who assisted in:reading the underlying agreements, related amendments, and cash election notice to understand the contractual requirements and features requiring accounting analysis;
•evaluatinginquiring of management to obtain an understanding of the estimated annual attrition rate by comparingscope of the selected attrition rate against relevant historical customer attrition dataelection and to understand the election’s business purpose; and
•evaluating whether the WACCcontractual requirements, including those established by developing an independent range of WACCs using publicly available market data and comparing the resultcash election notice, were properly accounted for pursuant to the Company’s WACC
•reconciling the WACC to the weighted average return on assets and the internal rate of return.relevant accounting guidance.
/s/ KPMG LLP
We have served as the Company’s auditor since 2005.
Houston, Texas
February 22, 202220, 2024
KBR, Inc.
Consolidated Statements of Operations
(In millions, except for per share data)
| | | |
| December 29, | |
| December 29, | |
| December 29, | |
| | | | Years ended December 31, |
| | | 2021 | | 2020 | | 2019 |
| | Revenues | Revenues | $ | 7,339 | | | $ | 5,767 | | | $ | 5,639 | |
| | Revenues | |
| | Revenues | |
| Cost of revenues | |
| Cost of revenues | |
| Cost of revenues | Cost of revenues | (6,533) | | | (5,101) | | | (4,986) | |
| Gross profit | Gross profit | 806 | | | 666 | | | 653 | |
| Gross profit | |
| Gross profit | |
| Equity in earnings (losses) of unconsolidated affiliates | |
| Equity in earnings (losses) of unconsolidated affiliates | |
| Equity in earnings (losses) of unconsolidated affiliates | Equity in earnings (losses) of unconsolidated affiliates | (170) | | | 30 | | | 35 | |
| Selling, general and administrative expenses | Selling, general and administrative expenses | (393) | | | (335) | | | (341) | |
| Acquisition and integration related costs | (12) | | | (9) | | | (2) | |
| Goodwill impairment | — | | | (99) | | | — | |
| Restructuring charges and asset impairments | (2) | | | (214) | | | — | |
| Gain on disposition of assets and investments | 2 | | | 18 | | | 17 | |
| Selling, general and administrative expenses | |
| Selling, general and administrative expenses | |
| Legal settlement of legacy matter | |
| Legal settlement of legacy matter | |
| Legal settlement of legacy matter | |
| Gain (loss) on disposition of assets and investments | |
| Gain (loss) on disposition of assets and investments | |
| Gain (loss) on disposition of assets and investments | |
| | Other | |
| | Other | |
| | Other | |
| | Operating income | |
| | Operating income | |
| | Operating income | Operating income | 231 | | | 57 | | | 362 | |
| Interest expense | Interest expense | (92) | | | (83) | | | (99) | |
| Interest expense | |
| Interest expense | |
| Unrealized gain on other investment | |
| Unrealized gain on other investment | |
| Unrealized gain on other investment | |
| Charges associated with Convertible Notes | |
| Charges associated with Convertible Notes | |
| Charges associated with Convertible Notes | |
| Other non-operating income (expense) | Other non-operating income (expense) | (5) | | | 1 | | | 5 | |
| Income (loss) before income taxes and noncontrolling interests | 134 | | | (25) | | | 268 | |
| Income (loss) before income taxes | |
| Income (loss) before income taxes | |
| Income (loss) before income taxes | |
| Provision for income taxes | |
| Provision for income taxes | |
| Provision for income taxes | Provision for income taxes | (108) | | | (26) | | | (59) | |
| Net income (loss) | Net income (loss) | 26 | | | (51) | | | 209 | |
| Net income (loss) | |
| Net income (loss) | |
| Less: Net income attributable to noncontrolling interests | |
| Less: Net income attributable to noncontrolling interests | |
| Less: Net income attributable to noncontrolling interests | Less: Net income attributable to noncontrolling interests | 8 | | | 21 | | | 7 | |
| Net income (loss) attributable to KBR | Net income (loss) attributable to KBR | $ | 18 | | | $ | (72) | | | $ | 202 | |
| Net income (loss) attributable to KBR per share: | | | | | |
| Net income (loss) attributable to KBR | |
| Net income (loss) attributable to KBR | |
| Net income (loss) attributable to KBR per share | |
| Net income (loss) attributable to KBR per share | |
| Net income (loss) attributable to KBR per share | |
| Basic | |
| Basic | |
| Basic | Basic | $ | 0.13 | | | $ | (0.51) | | | $ | 1.42 | |
| Diluted | Diluted | $ | 0.12 | | | $ | (0.51) | | | $ | 1.41 | |
| Diluted | |
| Diluted | |
| Basic weighted average common shares outstanding | |
| Basic weighted average common shares outstanding | |
| Basic weighted average common shares outstanding | Basic weighted average common shares outstanding | 140 | | | 142 | | | 141 | |
| Diluted weighted average common shares outstanding | Diluted weighted average common shares outstanding | 145 | | | 142 | | | 142 | |
| Diluted weighted average common shares outstanding | |
| Diluted weighted average common shares outstanding | |
| Cash dividends declared per share | |
| Cash dividends declared per share | |
| Cash dividends declared per share | Cash dividends declared per share | $ | 0.44 | | | $ | 0.40 | | | $ | 0.32 | |
|
See accompanying notes to consolidated financial statements.
KBR, Inc.
Consolidated Statements of Comprehensive Income (Loss)
(In millions)
| | | | Years ended December 31, | | Year Ended, |
| December 29, | | | December 29, | | December 31, |
| 2023 | | | 2023 | | 2022 | | 2021 |
| | 2021 | | 2020 | | 2019 |
| | Net income (loss) | |
| Net income (loss) | |
| Net income (loss) | Net income (loss) | $ | 26 | | | $ | (51) | | | $ | 209 | |
| Other comprehensive income (loss): | Other comprehensive income (loss): | |
| Foreign currency translation adjustments | Foreign currency translation adjustments | (4) | | | 23 | | | (12) | |
| Foreign currency translation adjustments | |
| Foreign currency translation adjustments | |
| Pension and post-retirement benefits | Pension and post-retirement benefits | 227 | | | (136) | | | (73) | |
| Changes in fair value of derivatives | Changes in fair value of derivatives | 31 | | | (13) | | | (6) | |
| Other comprehensive income (loss) | 254 | | | (126) | | | (91) | |
| Other comprehensive (loss) income | |
| Income tax (expense) benefit: | Income tax (expense) benefit: | |
| Foreign currency translation adjustments | |
| Foreign currency translation adjustments | |
| Foreign currency translation adjustments | Foreign currency translation adjustments | (1) | | | 1 | | | 1 | |
| Pension and post-retirement benefits | Pension and post-retirement benefits | (44) | | | 26 | | | 11 | |
| Changes in fair value of derivatives | Changes in fair value of derivatives | (7) | | | 3 | | | 2 | |
| Income tax (expense) benefit | Income tax (expense) benefit | (52) | | | 30 | | | 14 | |
| Other comprehensive income (loss), net of tax | 202 | | | (96) | | | (77) | |
| Other comprehensive (loss) income, net of tax | |
| Comprehensive income (loss) | Comprehensive income (loss) | 228 | | | (147) | | | 132 | |
| Less: Comprehensive income attributable to noncontrolling interests | Less: Comprehensive income attributable to noncontrolling interests | 8 | | | 21 | | | 7 | |
| Comprehensive income (loss) attributable to KBR | Comprehensive income (loss) attributable to KBR | $ | 220 | | | $ | (168) | | | $ | 125 | |
See accompanying notes to consolidated financial statements.
KBR, Inc.
Consolidated Balance Sheets
(In millions, except share data)
| | | December 31, |
| December 29, | | | December 29, | | December 31, |
| | | 2021 | | 2020 | | 2023 | | 2022 |
| | Assets | Assets | |
| Assets | |
| Assets | |
| Current assets: | Current assets: | |
| Cash and equivalents | $ | 370 | | | $ | 436 | |
| Accounts receivable, net of allowance for credit losses of $13 and $13 | 1,411 | | | 899 | |
| Current assets: | |
| Current assets: | |
| Cash and cash equivalents | |
| Cash and cash equivalents | |
| Cash and cash equivalents | |
| Accounts receivable, net of allowance for credit losses of $8 and $9 | |
| Contract assets | Contract assets | 224 | | | 178 | |
| | Other current assets | Other current assets | 147 | | | 121 | |
| Other current assets | |
| Other current assets | |
| Total current assets | Total current assets | 2,152 | | | 1,634 | |
| Claims and accounts receivable | 30 | | | 30 | |
| Property, plant, and equipment, net of accumulated depreciation of $431 and $419 (including net PPE of $19 and $24 owned by a variable interest entity) | 136 | | | 130 | |
| | Pension assets | |
| Pension assets | |
| Pension assets | |
| Property, plant, and equipment, net of accumulated depreciation of $458 and $417 (including net PPE of $36 and $22 owned by a variable interest entity) | |
| Operating lease right-of-use assets | Operating lease right-of-use assets | 158 | | | 154 | |
| Goodwill | Goodwill | 2,060 | | | 1,761 | |
| Intangible assets, net of accumulated amortization of $291 and $228 | 708 | | | 683 | |
| Intangible assets, net of accumulated amortization of $382 and $332 | |
| Equity in and advances to unconsolidated affiliates | Equity in and advances to unconsolidated affiliates | 576 | | | 881 | |
| Deferred income taxes | Deferred income taxes | 226 | | | 297 | |
| Other assets | Other assets | 153 | | | 135 | |
| Total assets | Total assets | $ | 6,199 | | | $ | 5,705 | |
| Liabilities and Shareholders’ Equity | Liabilities and Shareholders’ Equity | | | |
| Current liabilities: | Current liabilities: | |
| Current liabilities: | |
| Current liabilities: | |
| Accounts payable | |
| Accounts payable | |
| Accounts payable | Accounts payable | $ | 1,026 | | | $ | 574 | |
| Contract liabilities | Contract liabilities | 313 | | | 356 | |
| Accrued salaries, wages and benefits | Accrued salaries, wages and benefits | 317 | | | 283 | |
| Nonrecourse project debt | — | | | 5 | |
| Operating lease liabilities | 41 | | | 44 | |
| Current maturities of long-term debt | |
| | Other current liabilities | |
| Other current liabilities | |
| Other current liabilities | Other current liabilities | 178 | | | 193 | |
| Total current liabilities | Total current liabilities | 1,875 | | | 1,455 | |
| Pension obligations | 88 | | | 381 | |
| | Employee compensation and benefits | |
| Employee compensation and benefits | |
| Employee compensation and benefits | Employee compensation and benefits | 111 | | | 110 | |
| Income tax payable | Income tax payable | 95 | | | 96 | |
| Deferred income taxes | Deferred income taxes | 70 | | | 26 | |
| Nonrecourse project debt | 2 | | | 2 | |
| | Long term debt | 1,852 | | | 1,584 | |
| | Long-term debt | |
| | Long-term debt | |
| | Long-term debt | |
| Operating lease liabilities | Operating lease liabilities | 188 | | | 186 | |
| | Other liabilities | Other liabilities | 217 | | | 256 | |
| Other liabilities | |
| Other liabilities | |
| Total liabilities | Total liabilities | 4,498 | | | 4,096 | |
| Commitments and Contingencies (Notes 6, 14 and 15) | 0 | | 0 |
| Commitments and Contingencies (Notes 6, 13 and 14) | | Commitments and Contingencies (Notes 6, 13 and 14) | | | |
| KBR shareholders’ equity: | KBR shareholders’ equity: | |
| Preferred stock, $0.001 par value, 50,000,000 shares authorized, NaN issued | — | | | — | |
| Common stock, $0.001 par value 300,000,000 shares authorized, 179,983,586 and 179,087,655 shares issued, and 139,786,136 and 140,766,052 shares outstanding, respectively | — | | | — | |
| PIC | 2,251 | | | 2,222 | |
| Preferred stock, $0.001 par value, 50,000,000 shares authorized, none issued | |
| Preferred stock, $0.001 par value, 50,000,000 shares authorized, none issued | |
| Preferred stock, $0.001 par value, 50,000,000 shares authorized, none issued | |
| Common stock, $0.001 par value 300,000,000 shares authorized, 181,713,586 and 180,807,960 shares issued, and 135,067,562 and 136,505,145 shares outstanding, respectively | |
| Paid-in capital in excess of par | |
| Retained earnings | Retained earnings | 1,260 | | | 1,305 | |
| Treasury stock, 40,197,450 shares and 38,321,603 shares, at cost, respectively | (943) | | | (864) | |
| AOCL | (881) | | | (1,083) | |
| Treasury stock, 46,646,024 shares and 44,302,815 shares, at cost, respectively | |
| Accumulated other comprehensive loss | |
| Total KBR shareholders’ equity | Total KBR shareholders’ equity | 1,687 | | | 1,580 | |
| Noncontrolling interests | Noncontrolling interests | 14 | | | 29 | |
| Total shareholders’ equity | Total shareholders’ equity | 1,701 | | | 1,609 | |
| Total liabilities and shareholders’ equity | Total liabilities and shareholders’ equity | $ | 6,199 | | | $ | 5,705 | |
.
See accompanying notes to consolidated financial statements.
KBR, Inc.
Consolidated Statements of Shareholders’ Equity
(In millions) | | | | | | | | | | | | | | | | | | | | | | | | | | | | | | | | | | | |
| Dollars in millions | Total | | PIC | | Retained
Earnings | | Treasury
Stock | | AOCL | | NCI |
| Balance at December 31, 2018 | $ | 1,718 | | | $ | 2,190 | | | $ | 1,235 | | | $ | (817) | | | $ | (910) | | | $ | 20 | |
| Cumulative adjustment for the adoption of ASC 842, net of tax | 21 | | | — | | | 21 | | | — | | | — | | | — | |
| Cumulative adjustment for the adoption of ASC 606 for our unconsolidated affiliates, net of tax | 25 | | | — | | | 25 | | | — | | | — | | | — | |
| Adjusted balance at January 1, 2019 | 1,764 | | | 2,190 | | | 1,281 | | | (817) | | | (910) | | | 20 | |
| | | | | | | | | | | |
| Share-based compensation | 12 | | | 12 | | | — | | | — | | | — | | | — | |
| | | | | | | | | | | |
| Common stock issued upon exercise of stock options | 5 | | | 5 | | | — | | | — | | | — | | | — | |
| Dividends declared to shareholders ($0.32/share) | (46) | | | — | | | (46) | | | — | | | — | | | — | |
| Repurchases of common stock | (4) | | | — | | | — | | | (4) | | | — | | | — | |
| Issuance of ESPP shares | 3 | | | (1) | | | — | | | 4 | | | — | | | — | |
| | | | | | | | | | | |
| Investments by noncontrolling interests | 1 | | | — | | | — | | | — | | | — | | | 1 | |
| Distributions to noncontrolling interests | (14) | | | — | | | — | | | — | | | — | | | (14) | |
| | | | | | | | | | | |
| Net income | 209 | | | — | | | 202 | | | — | | | — | | | 7 | |
| Other comprehensive income, net of tax | (77) | | | — | | | — | | | — | | | (77) | | | — | |
| Balance at December 31, 2019 | $ | 1,853 | | | $ | 2,206 | | | $ | 1,437 | | | $ | (817) | | | $ | (987) | | | $ | 14 | |
| Cumulative adjustment for the adoption of ASC 842, net of tax | (3) | | | — | | | (3) | | | — | | | — | | | — | |
| | | | | | | | | | | |
| Adjusted balance at January 1, 2020 | 1,850 | | | 2,206 | | | 1,434 | | | (817) | | | (987) | | | 14 | |
| | | | | | | | | | | |
| Share-based compensation | 12 | | | 12 | | | — | | | — | | | — | | | — | |
| | | | | | | | | | | |
| Common stock issued upon exercise of stock options | 4 | | | 4 | | | — | | | — | | | — | | | — | |
| Dividends declared to shareholders ($0.40/share) | (57) | | | — | | | (57) | | | — | | | — | | | — | |
| Repurchases of common stock | (51) | | | — | | | — | | | (51) | | | — | | | — | |
| Issuance of ESPP shares | 4 | | | — | | | — | | | 4 | | | — | | | — | |
| | | | | | | | | | | |
| | | | | | | | | | | |
| Distributions to noncontrolling interests | (4) | | | — | | | — | | | — | | | — | | | (4) | |
| Other noncontrolling interests activity | (2) | | | — | | | — | | | — | | | — | | | (2) | |
| Net income | (51) | | | — | | | (72) | | | — | | | — | | | 21 | |
| Other comprehensive income, net of tax | (96) | | | — | | | — | | | — | | | (96) | | | — | |
| Balance at December 31, 2020 | $ | 1,609 | | | $ | 2,222 | | | $ | 1,305 | | | $ | (864) | | | $ | (1,083) | | | $ | 29 | |
| | | | | | | | | | | |
| | | | | | | | | | | |
| | | | | | | | | | | |
| | | | | | | | | | | |
| | | | | | | | | | | |
| | | | | | | | | | | |
| | | | | | | | | | | |
| Share-based compensation | 12 | | | 12 | | | — | | | — | | | — | | | — | |
| | | | | | | | | | | |
| Common stock issued upon exercise of stock options | 12 | | | 12 | | | — | | | — | | | — | | | — | |
| Dividends declared to shareholders ($0.44/share) | (63) | | | — | | | (63) | | | — | | | — | | | — | |
| Repurchases of common stock | (82) | | | — | | | — | | | (82) | | | — | | | — | |
| Issuance of ESPP shares | 4 | | | 1 | | | — | | | 3 | | | — | | | — | |
| | | | | | | | | | | |
| Investments by noncontrolling interests | — | | | — | | | — | | | — | | | — | | | — | |
| Distributions to noncontrolling interests | (23) | | | — | | | — | | | — | | | — | | | (23) | |
| Other | 4 | | | 4 | | | — | | | — | | | — | | | — | |
| Net income | 26 | | | — | | | 18 | | | — | | | — | | | 8 | |
| Other comprehensive income (loss), net of tax | 202 | | | — | | | — | | | — | | | 202 | | | — | |
| Balance at December 31, 2021 | $ | 1,701 | | | $ | 2,251 | | | $ | 1,260 | | | $ | (943) | | | $ | (881) | | | $ | 14 | |
| | | | | | | | | | | |
| | | | | | | | | | | | | | | | | | | | | | | | | | | | | | | | | | | |
| Dollars in millions | Total | | PIC | | Retained
Earnings | | Treasury
Stock | | AOCL | | NCI |
| Balance at December 31, 2020 | $ | 1,582 | | | $ | 2,177 | | | $ | 1,323 | | | $ | (864) | | | $ | (1,083) | | | $ | 29 | |
| | | | | | | | | | | |
| | | | | | | | | | | |
| | | | | | | | | | | |
| | | | | | | | | | | |
| Share-based compensation | 12 | | | 12 | | | — | | | — | | | — | | | — | |
| | | | | | | | | | | |
| Common stock issued upon exercise of stock options | 12 | | | 12 | | | — | | | — | | | — | | | — | |
| Dividends declared to shareholders ($0.44/share) | (63) | | | — | | | (63) | | | — | | | — | | | — | |
| Repurchases of common stock | (82) | | | — | | | — | | | (82) | | | — | | | — | |
| Issuance of ESPP shares | 4 | | | 1 | | | — | | | 3 | | | — | | | — | |
| | | | | | | | | | | |
| | | | | | | | | | | |
| Distributions to noncontrolling interests | (23) | | | — | | | — | | | — | | | — | | | (23) | |
| Other | 4 | | | 4 | | | — | | | — | | | — | | | — | |
| Net income | 35 | | | — | | | 27 | | | — | | | — | | | 8 | |
| Other comprehensive income, net of tax | 202 | | | — | | | — | | | — | | | 202 | | | — | |
| Balance at December 31, 2021 | $ | 1,683 | | | $ | 2,206 | | | $ | 1,287 | | | $ | (943) | | | $ | (881) | | | $ | 14 | |
| | | | | | | | | | | |
| | | | | | | | | | | |
| | | | | | | | | | | |
| | | | | | | | | | | |
| Share-based compensation | 21 | | | 21 | | | — | | | — | | | — | | | — | |
| | | | | | | | | | | |
| Common stock issued upon exercise of stock options | 5 | | | 5 | | | — | | | — | | | — | | | — | |
| Dividends declared to shareholders ($0.48/share) | (67) | | | — | | | (67) | | | — | | | — | | | — | |
| Repurchases of common stock | (203) | | | — | | | — | | | (203) | | | — | | | — | |
| Issuance of ESPP shares | 6 | | | 3 | | | — | | | 3 | | | — | | | — | |
| | | | | | | | | | | |
| Investments by noncontrolling interests | 3 | | | — | | | — | | | — | | | — | | | 3 | |
| Distributions to noncontrolling interests | (4) | | | — | | | — | | | — | | | — | | | (4) | |
| Other noncontrolling interests activity | (3) | | | — | | | — | | | — | | | — | | | (3) | |
| Net income | 192 | | | — | | | 190 | | | — | | | — | | | 2 | |
| Other comprehensive loss, net of tax | (1) | | | — | | | — | | | — | | | (1) | | | — | |
| Balance at December 31, 2022 | $ | 1,632 | | | $ | 2,235 | | | $ | 1,410 | | | $ | (1,143) | | | $ | (882) | | | $ | 12 | |
| | | | | | | | | | | |
| | | | | | | | | | | |
| | | | | | | | | | | |
| Share-based compensation | 20 | | | 20 | | | — | | | — | | | — | | | — | |
| | | | | | | | | | | |
| Common stock issued upon exercise of stock options | 5 | | | 5 | | | — | | | — | | | — | | | — | |
| Dividends declared to shareholders ($0.54/share) | (73) | | | — | | | (73) | | | — | | | — | | | — | |
| Repurchases of common stock | (138) | | | — | | | — | | | (138) | | | — | | | — | |
| Issuance of ESPP shares | 6 | | | 3 | | | — | | | 3 | | | — | | | — | |
| | | | | | | | | | | |
| | | | | | | | | | | |
| Distributions to noncontrolling interests | (6) | | | — | | | — | | | — | | | — | | | (6) | |
| Convertible Notes Transactions | 242 | | | 242 | | | — | | | — | | | — | | | — | |
| Other noncontrolling interests activity | — | | | — | | | — | | | (1) | | | — | | | 1 | |
| Net income | (261) | | | — | | | (265) | | | — | | | — | | | 4 | |
| Other comprehensive income (loss), net of tax | (33) | | | — | | | — | | | — | | | (33) | | | — | |
| Balance at December 29, 2023 | $ | 1,394 | | | $ | 2,505 | | | $ | 1,072 | | | $ | (1,279) | | | $ | (915) | | | $ | 11 | |
| | | | | | | | | | | |
See accompanying notes to consolidated financial statements.
KBR, Inc.
Consolidated Statements of Cash Flows
(In millions)
| | Year Ended, | | | Year Ended, |
| December 29, | | | December 29, | | December 31, |
| | | | 2023 | | 2022 | | 2021 |
| | Cash flows from operating activities: | |
| Cash flows from operating activities: | |
| Cash flows from operating activities: | |
| Net income (loss) | |
| Net income (loss) | |
| Net income (loss) | |
| Adjustments to reconcile net (loss) income to net cash provided by operating activities: | |
| Charges associated with Convertible Notes | |
| Charges associated with Convertible Notes | |
| Charges associated with Convertible Notes | |
| Depreciation and amortization | |
| Equity in (earnings) losses of unconsolidated affiliates | |
| Deferred income tax (benefit) expense | |
| Loss (gain) on disposition of assets | |
| | | Years ended December 31, |
| | | 2021 | | 2020 | | 2019 |
| Unrealized gain on other investment | |
| | Cash flows from operating activities: | |
| Net income (loss) | $ | 26 | | | $ | (51) | | | $ | 209 | |
| Adjustments to reconcile net (loss) income to net cash provided by operating activities: | |
| Depreciation and amortization | 146 | | | 115 | | | 104 | |
| Equity in (earnings) losses of unconsolidated affiliates | 170 | | | (30) | | | (35) | |
| Deferred income tax (benefit) expense | 44 | | | (40) | | | (14) | |
| Gain on disposition of assets | (2) | | | (18) | | | (17) | |
| | Goodwill impairment | — | | | 99 | | | — | |
| Asset impairments | 2 | | | 98 | | | — | |
| Unrealized gain on other investment | |
| | | Unrealized gain on other investment | |
| Other | Other | 56 | | | 43 | | | 34 | |
| Changes in operating assets and liabilities, net of acquired businesses: | Changes in operating assets and liabilities, net of acquired businesses: | |
| Accounts receivable, net of allowance for credit losses | Accounts receivable, net of allowance for credit losses | (476) | | | 127 | | | (16) | |
| Accounts receivable, net of allowance for credit losses | |
| Accounts receivable, net of allowance for credit losses | |
| Contract assets | Contract assets | (48) | | | 39 | | | (31) | |
| Claims receivable | — | | | 29 | | | 39 | |
| | Accounts payable | |
| Accounts payable | |
| Accounts payable | Accounts payable | 447 | | | (40) | | | 23 | |
| Contract liabilities | Contract liabilities | (17) | | | (134) | | | 19 | |
| Accrued salaries, wages and benefits | Accrued salaries, wages and benefits | 38 | | | 38 | | | (9) | |
| Payments on operating lease liabilities | Payments on operating lease liabilities | (59) | | | (61) | | | (56) | |
| | Payments from unconsolidated affiliates, net | Payments from unconsolidated affiliates, net | 17 | | | 15 | | | 10 | |
| Payments from unconsolidated affiliates, net | |
| Payments from unconsolidated affiliates, net | |
| Distributions of earnings from unconsolidated affiliates | Distributions of earnings from unconsolidated affiliates | 47 | | | 38 | | | 69 | |
| | Pension funding | Pension funding | (46) | | | (46) | | | (45) | |
| Pension funding | |
| Pension funding | |
| | | Restructuring reserve | |
| | Restructuring reserve | |
| | Restructuring reserve | Restructuring reserve | (26) | | | 89 | | | — | |
| Other assets and liabilities | Other assets and liabilities | (41) | | | 57 | | | (28) | |
| Total cash flows provided by operating activities | Total cash flows provided by operating activities | 278 | | | 367 | | | 256 | |
| Cash flows from investing activities: | Cash flows from investing activities: | |
| Purchases of property, plant and equipment | Purchases of property, plant and equipment | (30) | | | (20) | | | (20) | |
| Proceeds from sale of assets or investments | 44 | | | 1 | | | 9 | |
| Investments in equity method joint ventures | (29) | | | (26) | | | (146) | |
| Purchases of property, plant and equipment | |
| Purchases of property, plant and equipment | |
| Net proceeds from sale of assets or investments | |
| Return of (investments in) equity method joint ventures, net | |
| Acquisitions of businesses, net of cash acquired | Acquisitions of businesses, net of cash acquired | (399) | | | (832) | | | — | |
| Acquisition of technology license | (7) | | | — | | | — | |
| Funding in other investment | |
| | Other | Other | (7) | | | — | | | (1) | |
| Total cash flows used in investing activities | $ | (428) | | | $ | (877) | | | $ | (158) | |
| Other | |
| Other | |
| | Total cash flows (used in) provided by investing activities | |
| | Total cash flows (used in) provided by investing activities | |
| | Total cash flows (used in) provided by investing activities | |
| | Year Ended, | | | Year Ended, |
| December 29, | | | December 29, | | December 31, |
| 2023 | | | 2023 | | 2022 | | 2021 |
| Cash flows from financing activities: | |
| Borrowings on short-term and long-term debt | |
| Borrowings on short-term and long-term debt | |
| Borrowings on short-term and long-term debt | |
| | Payments on short-term and long-term debt | |
| Payments on short-term and long-term debt | |
| Payments on short-term and long-term debt | |
| Payments on settlement of warrants | |
| Proceeds from the settlement of note hedge | |
| Payments to settle Convertible Notes | |
| Payments on revolving credit facility | |
| Debt issuance costs | |
| | | Years ended December 31, |
| | | 2021 | | 2020 | | 2019 |
| Cash flows from financing activities: | |
| Borrowings on long term debt | 164 | | | 359 | | | — | |
| Borrowings on revolving credit agreement | 126 | | | 260 | | | — | |
| Payments on short-term and long-term borrowings | (44) | | | (281) | | | (70) | |
| Payments of dividends to shareholders | |
| | Debt issuance costs | (3) | | | (5) | | | — | |
| | Payments of dividends to shareholders | |
| | Payments of dividends to shareholders | Payments of dividends to shareholders | (61) | | | (54) | | | (46) | |
| Net proceeds from issuance of common stock | Net proceeds from issuance of common stock | 12 | | | 4 | | | 5 | |
| Payments to reacquire common stock | Payments to reacquire common stock | (82) | | | (51) | | | (4) | |
| | Distributions to noncontrolling interests | Distributions to noncontrolling interests | (23) | | | (4) | | | (14) | |
| | Distributions to noncontrolling interests | |
| | Distributions to noncontrolling interests | |
| Other | Other | (2) | | | (3) | | | (4) | |
| Total cash flows provided by (used in) financing activities | 87 | | | 225 | | | (133) | |
| Total cash flows (used in) provided by financing activities | |
| Effect of exchange rate changes on cash | Effect of exchange rate changes on cash | (3) | | | 9 | | | 8 | |
| Decrease in cash and equivalents | (66) | | | (276) | | | (27) | |
| (Decrease) increase in cash and cash equivalents | |
| Cash and equivalents at beginning of period | Cash and equivalents at beginning of period | 436 | | | 712 | | | 739 | |
| Cash and equivalents at end of period | Cash and equivalents at end of period | $ | 370 | | | $ | 436 | | | $ | 712 | |
| Supplemental disclosure of cash flows information: | Supplemental disclosure of cash flows information: | | | | | |
| Cash paid for interest | Cash paid for interest | $ | 63 | | | $ | 53 | | | $ | 80 | |
| Cash paid for interest | |
| Cash paid for interest | |
| Cash paid for income taxes (net of refunds) | Cash paid for income taxes (net of refunds) | $ | 49 | | | $ | 49 | | | $ | 54 | |
| | Noncash investing activities | |
| Leasehold improvements paid by landlord | |
| Leasehold improvements paid by landlord | |
| Leasehold improvements paid by landlord | |
| Accrued but unpaid purchases of property, plant and equipment | |
| Noncash financing activities | Noncash financing activities | |
| Dividends declared | Dividends declared | $ | 15 | | | $ | 14 | | | $ | 11 | |
| Dividends declared | |
| Dividends declared | |
See accompanying notes to consolidated financial statements.
KBR, Inc.
Notes to Consolidated Financial Statements
Note 1. Significant Accounting Policies
Principles of Consolidation
The accompanying consolidated financial statements have been prepared in accordance with U.S. GAAP and include the accounts of KBR, Inc. and the subsidiaries it controls, including VIEs where it is the primary beneficiary. We account for investments over which we have significant influence, but not a controlling financial interest, using the equity method of accounting. See Note 109 to our consolidated financial statements for further discussion of our equity investments and VIEs. All material intercompany balances and transactions are eliminated in consolidation. Certain amounts in prior periods have been reclassified to conform with current period presentation.
Segment ReorganizationBasis of Presentation
EffectiveOn December 13, 2022, the Board of Directors approved a change in the fiscal year end from a calendar year ending on December 31 to a 52 – 53 week year ending on the Friday closest to December 31, effective as of the commencement of the Company's fiscal year on January 1, 2021, we implemented2023. In a strategic change52 week fiscal year, each of the Company’s quarterly periods will comprise 13 weeks. The additional week in a 53 week fiscal year is added to the structurefourth quarter, making such quarter consist of our internal organization14 weeks. The Company’s first 53 week fiscal year will occur in fiscal year 2024. The Company made the fiscal year change on a prospective basis and transitioned fromwill not adjust operating results for prior periods. The change will impact the prior year comparability of each of the fiscal quarters and the annual period for the year ending December 29, 2023; however, the impact will not be material. The Company believes this change will improve comparability between periods by eliminating the year-over-year variability in calendar month productive days and provide a 3-core business segment modelmore consistent reporting cadence for operational leaders to a 2-core business segment model comprised of Government Solutions and Sustainable Technology Solutions. The new Sustainable Technology Solutions segment is anchored by our innovative, proprietary process technologies. It also includes our highly synergistic advisory practice focused on energy transition and net-zero carbon emission consulting as well as the technology-led industrial solutions focused on innovative digital operations and maintenance ("O&M") solutions and advanced remote operations capabilities to improve throughput, reliability and environmental sustainability. Infusing high-end, sustainability expertise, client relationships and innovative, technology-led O&M solutions into Sustainable Technology Solutions is expected to increase resilience, generate new opportunities, simplify the business model and better position us to deliver its offerings across a broader industrial base.aid in strategic decision making.
Effective January 1, 2021, we reorganizedDue to this change in fiscal year, our reportable segments, which are equivalentfiscal year ended on December 29 in 2023 as compared to our operating segments,December 31 in 2022. The years ended December 29, 2023 and businesses as follows:December 31, 2022 contained 363 days and 365 days, respectively.
•Government Solutions includes the following 4 business units: Defense & Intel, formerly the Defense Systems Engineering and Centauri businesses; Science & Space, formerly called Space & Mission Solutions; Readiness & Sustainment, formerly called Logistics; and International.
•Sustainable Technology Solutions includes components of Energy Solutions, Technology Solutions and Non-strategic Business, with the exception of our Australian infrastructure business which moved to GS International in our Government Solutions segment.
•Other includes corporate and other.
Upon this segment change in 2021, all prior period information was recast to reflect this change in reportable segments. See Note 2 to our consolidated financial statements for further discussion on our segments.
Business Reorganization and Restructuring Activities
During fiscal year 2020, our management initiated and approved restructuring plans in response to the dislocation of the global energy market resulting from the decline in oil prices and the COVID-19 pandemic. The restructuring plan included the reorganization of KBR's management structure primarily within our legacy Energy Solutions business segment during the first and second quarters of 2020 and entailed approving strategic business restructuring activities and deciding to discontinue pursuing certain projects, principally lump-sum EPC and commoditized construction services. The restructuring plan is designed to refine our market focus, optimize costs and improve operational efficiencies. As a result of these restructuring activities and adverse market conditions, we performed interimour change in a fiscal year end, goodwill will be tested annually for possible impairment tests in 2020as of the first day of our goodwill, intangible assets, significant investmentsfourth quarter each fiscal year, and various other assets. See Note 7 "Restructuring Charges and Asset Impairments" and Note 9 "Goodwill and Goodwill Impairment" for further discussionon an interim basis when indicators of restructuring andpossible impairment charges recognized during the year ended December 31, 2020. These reorganization activities in 2020 did not have an impact on our identified reportable segments.exist.
See Note 2 to our consolidated financial statements for further discussion of our segments.
Use of Estimates
The preparation of our consolidated financial statements in conformity with U.S. GAAP requires us to make estimates and assumptions that affect the reported amounts of certain assets and liabilities, the reported amounts of revenues and expenses for the periods covered and certain amounts disclosed in the notes to our consolidated financial statements. These estimates are based on information available through the date of the issuance of the financial statements and actual results could differ from those estimates. Areas requiring significant estimates and assumptions by our management include the following:
•project revenues, costs and profits on our contracts, including recognition of estimated losses on uncompleted contracts
•award fees, costs and profits on government services contracts
•client claims and recoveries of costs from subcontractors, vendors and others
•provisions for income taxes and related valuation allowances and tax uncertainties
•recoverabilityevaluation of goodwill for impairment
•recoverabilityevaluation of other intangibles and long-lived assets and related estimated livesfor impairment
•recoverabilityevaluation of equity method investments for impairment
•valuation of pension obligations and pension assets
•accruals for estimated liabilities, including litigation accruals
•consolidation of VIEs
•valuation of share-based compensation
•valuation of assets and liabilities acquired in business combinations
Cash and Equivalents
We consider highly liquid investments with an original maturity of three months or less to be cash equivalents.
Revenue Recognition
We, and our equity method investments, recognize revenue in accordance with ASC Topic 606,Revenue from Contracts with Customers. Revenue is measured based on the amount of consideration specified in a contract with a customer. Revenue is recognized when and as our performance obligations under the terms of the contract are satisfied, which generally occurs with the transfer of control of the goods or services to the customer.
Contract Combination
To determine the proper revenue recognition method for contracts, we evaluate whether two or more contracts should be combined and accounted for as one single contract and whether the combined or single contract should be accounted for as more than one performance obligation. This evaluation requires judgment and the decision to combine a group of contracts or separate a combined or single contract into multiple performance obligations could change the amount of revenue and profit recorded in a given period. Contracts are considered to have a single performance obligation if the promise to transfer the individual goods or services is not separately identifiable from other promises in the contracts primarily because we provide a significant service of integrating a complex set of tasks and components into a single project or capability. Contracts that cover multiple phases of the product lifecycle (development, construction and maintenance & support) are typically considered to have multiple performance obligations even when they are part of a single contract.
For a limited number of contracts with multiple performance obligations, we allocate the transaction price to each performance obligation using our best estimate of the relative standalone selling price of each distinct good or service in the contract. In cases where we do not provide the distinct good or service on a standalone basis, which is more prevalent than not, the primary method used to estimate standalone selling price is the expected cost plus a margin approach, under which we forecast our expected costs of satisfying a performance obligation and then add an appropriate margin for that distinct good or service.
Contract Types
The Company performs work under contracts that broadly consists of fixed-price, cost-reimbursable, time-and-materials or a combination of the three.
Fixed-price contracts also include both lump-sum and unit-rate contracts. Under lump-sumfixed-price contracts, we perform a defined scope of work for a specified fee to cover all costs and any profit element. Lump-sumFixed-price contracts entail significant risk to us because they require us to predetermine the work to be performed, the project execution schedule and all the costs associated with the scope of work. Unit-rate contracts are essentially fixed-price contracts with the only variable being units of work to be performed. Although fixed-price contracts involve greater risk than cost-reimbursable contracts, they also are potentially more profitable because the owner/customer pays a premium to transfer project risks to us.
Time-and-materials contracts typically provide for negotiated fixed hourly rates for specified categories of direct labor. The rates cover the cost of direct labor, indirect expense and fee. These contracts can also allow for reimbursement of cost of material plus a fee, if applicable. In U.S. government contracting, this type of contract is generally used when there is uncertainty of the extent or duration of the work to be performed by the contractor at the time of contract award or it is not possible to anticipate costs with any reasonable degree of confidence. With respect to time-and-materials contracts, we assume the price risk because our costs of performance may exceed negotiated hourly rates. In commercial and non-U.S. government contracting, this contract type is generally used for defined and non-defined scope contracts where there is a higher degree of uncertainty and risks as to the scope of work. These types of contracts may also provide for a guaranteed maximum price where the total cost plus the fee cannot exceed an agreed upon guaranteed maximum price or not-to-exceed provisions.
Under cost-reimbursable contracts, the price is generally variable based upon our actual allowable costs incurred for materials, equipment, reimbursable labor hours, overhead and G&A expenses. Profit on cost-reimbursable contracts may be in the form of a fixed fee or a mark-up applied to costs incurred, or a combination of the two. The fee may also be an incentive fee based on performance indicators, milestones or targets and can be based on customer discretion or in form of an award fee determined based on customer evaluation of the Company's performance against contractual criteria. Cost-reimbursable contracts may also provide for a guaranteed maximum price where the total fee plus the total cost cannot exceed an agreed upon guaranteed maximum price. Cost-reimbursable contracts are generally less risky because the owner/customer retains many of the project risks, however it generally requires us to use our best efforts to accomplish the scope of the work within a specified time and budget. Cost-reimbursable contracts with the U.S. government are generally subject to the FAR and are competitively priced based on estimated or actual costs of providing the contractual goods or services. The FAR provides guidance on types of costs that are
allowable in establishing prices for goods and services provided to the U.S. government and its agencies. Pricing for non-U.S. government agencies and commercial customers, including the types of costs that are allowable, is based on specific negotiations with each customer.
See Note 3 to our consolidated financial statements for further discussion of our revenue by contract type.
Contract Costs
Contract costs include all direct materials, labor and subcontractor costs and an allocation of indirect costs related to contract performance. Customer-furnished materials are included in both contract revenue and cost of revenue when management concludes that the company is acting as a principal rather than as an agent. We recognize revenue, but not profit, on certain uninstalled materials that are not specifically produced or fabricated for a project, which revenue is recognized up to cost. Revenue for uninstalled materials is recognized when the cost is incurred and control is transferred to the customer, which revenue is recognized using the cost-to-cost method. Project mobilization costs incurred are generally charged tocapitalized as deferred assets and amortized on a straight-line basis over the project as incurred when they are an integrated partanticipated term of the contract or a specified period of performance consistent with the transfer of control of the performance obligation being transferred to the client. These costs incurred may be to transition the services, employees and equipment to or from the customer, a prior contract or prior contractor. Pre-contract costs are expensed as incurred unless they are expected to be recovered from the client.
Contract costs incurred for U.S. government contracts, including indirect costs, are subject to audit and adjustment by the DCAA. If the U.S. government concludes costs charged to a contract are not reimbursable under the terms of the contract or applicable procurement regulations, these costs are disallowed or, if already reimbursed, we may be required to refund the reimbursed amounts to the customer. Such conditions may also include interest and other financial penalties.
We provide limited warranties to customers for work performed under our contracts that typically extend for a limited duration following substantial completion of our work on a project. Such warranties are not sold separately and do not provide customers with a service in addition to assurance of compliance with agreed-upon specifications. Accordingly, these types of warranties are not considered to be separate performance obligations. Historically, warranty claims have not been material.
Variable Consideration
ItIn addition to the variable contract price under cost-reimbursable contracts, it is common for our contracts to contain variable consideration in the form of award fees, incentive fees, performance bonuses, liquidated damages or penalties that may increase or decrease the transaction price. These variable amounts generally are awarded upon achievement of certain performance metrics, program milestones or targets and can be based on customer discretion. Other contract provisions also give rise to variable consideration such as unapproved change orders and claims, and
on certain contracts, index-based price adjustments. We estimate the amount of variable consideration at the most likely amount to which we expect to be entitled. Variable consideration is included in the transaction price when it is probable that a significant reversal of cumulative revenue recognized will not occur or when the uncertainty associated with the variable consideration is resolved. Our estimates of variable consideration and determination of whether to include such amounts in the transaction price are based largely on our assessment of legal enforceability, anticipated performance and any other information (historical, current or forecasted) that is reasonably available to us.
Variable consideration associated with claims and unapproved change orders is included in the transaction price only to the extent of costs incurred. We recognize claims against vendors, subcontractors and others as a reduction in recognized costs when enforceability is established by the contract and the amounts are reasonably estimable and probable of recovery. Reductions in costs are recognized to the extent of the lesser of the amounts management expects to recover or actual costs incurred.
Contract Estimates and Modifications
Due to the nature of the work required to be performed on many of our performance obligations, the estimation of total revenue and cost at completion is complex and subject to many variables and requires significant judgment. As a significant change in estimated total revenue and cost could affect the profitability of our contracts, we routinely review and update our contract-related estimates through a disciplined project review process in which management reviews the progress and execution of our performance obligations and the EAC. As part of this process, management reviews information including, but not limited to, outstanding contract matters, progress towards completion, program schedule and the associated changes in estimates of revenues and costs. Management must make assumptions and estimates regarding the availability and productivity of labor, the complexity of the work to be performed, the availability and cost of materials, the performance of subcontractors
and the availability and timing of funding from the customer, along with other risks inherent in performing services under all contracts where we recognize revenue over time using the cost-to-cost method.
We recognize changes in contract estimates on a cumulative catch-up basis in the period in which the changes are identified. Such changes in contract estimates can result in the recognition of revenue in a current period for performance obligations which were satisfied or partially satisfied in prior period. Changes in contract estimates may also result in the reversal of previously recognized revenue if the current estimate differs from the previous estimate. If at any time the estimate of contract profitability indicates an anticipated loss on the contract, we recognize the total loss in the period it is identified. See Note 6 for changes in all other project-related estimates.
Contracts are often modified to account for changes in contract specifications and requirements. Most of our contract modifications are for goods or services that are not distinct from existing contracts due to the significant integration provided in the context of the contract and are accounted for as if they were part of the original contract. The effect of a contract modification on the transaction price and our measure of progress for the performance obligation to which it relates, is recognized as an adjustment to revenue (either as an increase in or a reduction of revenue) on a cumulative catch-up basis. We account for contract modifications prospectively when the modification results in the promise to deliver additional goods or services that are distinct and the increase in price of the contract is for the same amount as the stand-alone selling price of the additional goods or services included in the modification.
Contract Assets and Liabilities
Billing practices are governed by the contract terms of each project based upon costs incurred, achievement of milestones or predetermined schedules. Billings do not necessarily correlate with revenue recognized over time using the percentage-of-completion method. Contract assets include unbilled amounts typically resulting from revenue under long-term contracts when the percentage-of-completion method of revenue recognition is utilizedused, and revenue recognized exceeds the amount billed to the customer. Contract liabilities consist of advance payments and billings in excess of revenue recognized as well as deferred revenue.
Retainage, included in contract assets, represent the amounts withheld from billings by our clients pursuant to provisions in the contracts and may not be paid to us until the completion of specific tasks or the completion of the project and, in some instances, for even longer periods. Retainage may also be subject to restrictive conditions such as performance guarantees.
Our contract assets and liabilities are reported in a net position on a contract-by-contract basis at the end of each reporting period.
The payment terms of our contracts from time to time require the customer to make advance payments as well as interim payments as work progresses. The advance payment generally is not considered to contain a significant financing component as we expect to recognize those amounts in revenue within a year of receipt as work progresses on the related performance obligation.
Gross Profit
Gross profit represents revenues less the cost of revenues, which includes business segment overhead costs directly attributable to execution of contracts by the business segment.
Selling, General and Administrative Expenses
Our selling, general and administrative expenses represent expenses that are not associated with the execution of the contracts. Selling, general and administrative expenses include charges for such items as executive management, corporate business development, information technology, finance and accounting, human resources and various other corporate functions. The Company classifies indirect costs incurred within or allocated to its U.S. government customers as overhead (included in cost of revenues) or selling, general and administrative expenses in the same manner as such costs are defined in the Company’s disclosure statements under CAS.
Accounts Receivable
Accounts receivable include amounts billed and currently due from customers, amounts billable where the right to consideration is unconditional and amounts unbilled. Amounts billablebilled and unbilled amounts are recognized at estimated realizable value and consist of costs and fees, substantially all of which are expected to be billed and collected generally within one year. Unbilled amounts also include rate variances that are billable upon negotiation of final indirect rates with the DCAA.
We establish an allowance for credit losses based on the assessment of our clients' willingness and ability to pay. In addition to such allowances, there are often items in dispute or being negotiated that may require us to make an estimate as to the ultimate
outcome. Past due receivable balances are written off when our internal collection efforts have been unsuccessful in collecting the amounts due.
Additionally, we sell certain receivables to unrelated third-party financial institutions under various accounts receivable monetization programs. The receivables sold under the agreements do not allow for recourse for any credit risk related to our customers if such receivables are not collected by the third-party financial institutions. The Company accounts for these receivable transfers as a sale under Transfers and Servicing (Topic 860) as the receivables have been legally isolated from the Company, the financial institution has the right to pledge or exchange the assets received and we do not maintain effective control over the transferred accounts receivable. Our only continuing involvement with the transferred financial assets is as the collection and servicing agent. As a result, the accounts receivable balance on the consolidated balance sheets is presented net of the transferred amount. See Note 2220 to our consolidated financial statements for our discussionfurther information on sales of receivables.
Property, Plant and Equipment
Property, plant and equipment are reported at cost less accumulated depreciation except for those assets that have been written down to their fair values due to impairment. Expenditures for major additions and improvements are capitalized and minor replacements, maintenance and repairs are charged to expense as incurred. The cost of property, plant and equipment sold or otherwise disposed of and the related accumulated depreciation are removed from the accounts and any resulting gain or loss is included in operating income for the respective period. Depreciation is generally provided on the straight-line method over the estimated useful lives of the related assets. Leasehold improvements are amortized using the straight-line method over the shorter of the useful life of the improvement or the lease term. See Note 87 to our consolidated financial statements for our discussion on property, plant and equipment.
AcquisitionsBusiness Combinations
We account for business combinations using the acquisition method of accounting in accordance with ASC 805 - Business Combinations (Topic 805), which allocates the fair value of the purchase consideration to the tangible and intangible assets acquired and liabilities assumed based on their estimated fair values. The excess of the purchase consideration over the fair values of these identifiable assets and liabilities is recorded as goodwill. We engage third-party appraisal firms when appropriate to assist in the fair value determination of intangible assets. Initial purchase price allocations are subject to revisions within the measurement period, not to exceed one year from the date of acquisition. Acquisition-related expenses and transaction costs associated with business combinations are expensed as incurred.
Goodwill and Intangible Assets
Goodwill is an asset representing the excess cost over the fair market value of net assets acquired in business combinations. In accordance with ASC 350 - Intangibles - Goodwill and Other (Topic 350), goodwill is not amortized but is tested annually for impairment or on an interim basis when indicators of potential impairment exist. Goodwill is tested for impairment at the reporting unit level. Our reporting units are our operating segments or components of operating segments where discrete
financial information is available and segment management regularly reviews the operating results. For purposes of impairment testing, goodwill is allocated to the applicable reporting units based on our reporting structure.
We have the option to first assess qualitative factors to determine whether it is more likely than not that the fair value of a reporting unit is less than its carrying value. Qualitative factors assessed for each of the applicable reporting units include, but are not limited to, changes in macroeconomic conditions, industry and market considerations, cost factors, discount rates, competitive environments and financial performance of the reporting units. If the qualitative assessment indicates that it is more likely than not that the carrying value of a reporting unit exceeds its estimated fair value, a quantitative test is required.
We also have the option to proceed directly to the quantitative test. Under the quantitative impairment test, the estimated fair value of each reporting unit is compared to its carrying value, including goodwill. If the carrying value of the reporting unit including goodwill exceeds its fair value, an impairment charge equal to the excess would be recognized, up to a maximum amount of goodwill allocated to that reporting unit. We can resume the qualitative assessment in any subsequent period for any reporting unit.
For 2023, 2022 and 2021, management performed a qualitative impairment assessment of our reporting units, of which there were no indications that it was more likely than not that the fair value of our reporting units were less than their respective carrying values. As such, a quantitative goodwill test was not required, and no goodwill impairment was recognized in 2023, 2022 and 2021. For 2020, as impairment indicators were identified during the interim periods, we utilized the two-step process to perform an impairment test resulting in goodwill impairment of $99 million. See Note 98 to our consolidated financial statements for reported goodwill in each of our segments and goodwill impairment recognized.segments.
We had intangible assets with net carrying values of $708$618 million and $683$645 million as of December 29, 2023 and December 31, 2021 and 2020,2022, respectively. Intangible assets with indefinite lives are not amortized but are subject to annual impairment tests or on an interim basis when indicators of potential impairment exist. An intangible asset with an indefinite life is impaired if its carrying value exceeds its fair value. During the yearyears ended December 29, 2023, December 31, 2022 and December 31, 2021, there were no triggering events identified. During the year ended December 31, 2020, certain of our trade name intangible assets with an indefinite life were impaired. Intangible assets with finite lives are amortized on a straight-line basis over the useful life of those assets, ranging from 1 year to 25 years. See Note 98 to our consolidated financial statements for further discussion of our intangible assets.
Equity Method Investments
We account for non-marketable investments using the equity method of accounting if the investment gives us the ability to exercise significant influence over, but not control, of an investee. Significant influence generally exists if we have an ownership interest representing between 20% and 50% of the voting stock of the investee. Under the equity method of accounting, investments are stated at initial cost and are adjusted for subsequent additional investments and our proportionate share of earnings or losses and distributions.
Equity in earnings (losses) of unconsolidated affiliates, in the consolidated statements of operations, reflects our proportionate share of the investee's net income, including any associated affiliate taxes. Our proportionate share of the investee’s other comprehensive income (loss), net of income taxes, is recorded in the consolidated statements of shareholders’ equity and consolidated statements of comprehensive income (loss). In general, the equity investment in our unconsolidated affiliates is equal to our current equity investment plus those entities' undistributed earnings.
We evaluate our equity method investments for impairment at least annually or whenever events or changes in circumstances indicate, in management’s judgment, that the carrying value of an investment may have experienced an other-than-temporary decline in value. When evidence of loss in value has occurred, management compares the estimated fair value of the investment to the carrying value of the investment to determine whether an impairment has occurred. If the estimated fair value is less than the carrying value and management considers the decline in value to be other than temporary, the excess of the carrying value over the estimated fair value is recognized in the financial statements as an impairment. See Note 109 to our consolidated financial statements for our discussion on equity method investments.
In cases whereWe evaluate distributions received from our equity method investments using the nature of distribution approach. Under this approach, we are unable to exercise significant influence overevaluate the nature of activities of the investee that generated the distribution. The distributions received are either classified as a return on investment, which is presented as a component of operating activities on our consolidated statements of cash flows, or whenas a return of investment, which is presented as a component of investing activities on our investmentconsolidated statements of cash flows. For BRIS only, we apply the cumulative earnings approach for the cash flow classification of distributions as information is not available to evaluate the nature of the activities of the joint venture.
Other Investments
Other investments are investments in equity securities of privately held companies without readily determinable fair values and are included in other assets on our consolidated balance is reduced to zero from our proportionate share of losses, thesheets. These investments are accounted for under the measurement alternative, provided that KBR does not have the ability to exercise significant influence or control over the investees. We measure the investments at cost, method. Underless any impairment, and adjust the cost method,carrying value to fair value resulting from observable transactions for identical or similar investments of the same issuer. If it is determined that impairment indicators exist and the carrying value is less than the fair value, we adjust the carrying value of the investment to its fair value and record the related impairment. The gains and losses on the investments are carried at cost and adjusted only for other-than-temporary declinesrecognized in fair value, distributions of earnings or additional investments. In cases where we have a constructive or legal obligation to fund deficits of the joint venture, we record such deficits asunrealized gain (loss) on other current liabilitiesinvestment on our consolidated balance sheets.statements of operations.
Joint Ventures and VIEs
The majority of our joint ventures are VIEs. We account for VIEs in accordance with ASC 810 - Consolidation (Topic 810), which requires the consolidation of VIEs in which a company has both the power to direct the activities of the VIE that most significantly impact the VIE’s economic performance and the obligation to absorb losses or the right to receive the benefits from the VIE that could potentially be significant to the VIE. If a reporting enterprise meets these conditions, then it has a controlling financial interest and is the primary beneficiary of the VIE. Our unconsolidated VIEs are accounted for under the equity method of accounting.
We assess all newly created entities and those with which we become involved to determine whether such entities are VIEs and, if so, whether or not we are their primary beneficiary. Most of the entities we assess are incorporated or unincorporated joint ventures formed by us and our partner(s) for the purpose of executing a project or program for a customer and are generally dissolved upon completion of the project or program. Many of our long-term, commercial projects are executed through such joint ventures. Although the joint ventures in which we participate own and hold contracts with the customers, the services required by the contracts are typically performed by the joint venture partners, or by other subcontractors under subcontracts with the joint ventures. Typically, these joint ventures are funded by advances from the project owner, and accordingly, require little or no equity investment by the joint venture partners but may require subordinated financial support from the joint venture partners such as letters of credit, performance and financial guarantees or obligations to fund losses incurred by the joint venture. Other joint ventures, such as PFIs, generally require the partners to invest equity and take an ownership position in an entity that manages and operates an asset after construction is complete. The assets of joint ventures are restricted for use to the obligations of the particular joint venture and are not available for our general operations.
We perform a qualitative assessment to determine whether we are the primary beneficiary once an entity is identified as a VIE. Thereafter, we continue to re-evaluate whether we are the primary beneficiary of the VIE in accordance with ASC 810 - Consolidation. A qualitative assessment begins with an understanding of the nature of the risks in the entity as well as the nature of the entity’s activities. These include the terms of the contracts entered into by the entity, ownership interests issued by the entity and how they were marketed and the parties involved in the design of the entity. We then identify all of the variable interests held by parties involved with the VIE including, among other things, equity investments, subordinated debt financing, letters of credit, financial and performance guarantees and contracted service providers. Once we identify the variable interests, we determine those activities which are most significant to the economic performance of the entity and which variable interest holder has the power to direct those activities. Though infrequent, some of our assessments reveal no primary beneficiary because the power to direct the most significant activities that impact the economic performance is held equally by two or more variable interest holders who are required to provide their consent prior to the execution of their decisions. Most of the VIEs with which we are involved have relatively few variable interests and are primarily related to our equity investment, significant service contracts and other subordinated financial support. See Note 109 to our consolidated financial statements for our discussion on variable interest entities.
Occasionally, we may determine that we are the primary beneficiary as a result of a reconsideration event associated with an existing unconsolidated VIE. We account for the change in control under the acquisition method of accounting for business combinations in accordance with ASC 805.
Deconsolidation of a Subsidiary
We account for a gain or loss on deconsolidation of a subsidiary or derecognition of a group of assets in accordance with ASC 810-10-40-5. We measure the gain or loss as the difference between (a) the aggregate of fair value of any consideration received, the fair value of any retained noncontrolling investment and the carrying amount of any noncontrolling interest in the former subsidiary at the date the subsidiary is deconsolidated and (b) the carrying amount of the former subsidiary’s assets and liabilities or the carrying amount of the group of assets.
Pensions
We account for our defined benefit pension plans in accordance with ASC 715 - Compensation - Retirement Benefits, which requires an employer to:
•recognize on its balance sheet the funded status (measured as the difference between the fair value of plan assets and the benefit obligation) of the pension plan;
•recognize, through comprehensive income, certain changes in the funded status of a defined benefit plan in the year in which the changes occur;
•measure plan assets and benefit obligations as of the end of the employer’s fiscal year; and
•disclose additional information.
Our pension benefit obligations and expenses are calculated using actuarial models and methods. The more critical assumption and estimate used in the actuarial calculations is the discount rate for determining the current value of benefit obligations. Other assumptions and estimates used in determining benefit obligations and plan expenses include expected rate of return on plan assets, inflation rates and demographic factors such as retirement age, mortality and turnover. These assumptions and estimates are evaluated periodically (typically annually) and are updated accordingly to reflect our actual experience and expectations.
The discount rate used to determine the benefit obligations was computed using a yield curve approach that matches plan specific cash flows to a spot rate yield curve based on high quality corporate bonds. The expected long-term rate of return on assets was determined by a stochastic projection that takes into account asset allocation strategies, historical long-term performance of individual asset classes, an analysis of additional return (net of fees) generated by active management, risks using standard deviations and correlations of returns among the asset classes that comprise the plans' asset mix. Plan assets are comprised primarily of equity funds and securities, fixed income funds and securities, hedge funds, real estate and other funds.
As we have both domestic and international plans, these assumptions differ based on varying factors specific to each particular country, participant demographics or economic environment.
Unrecognized actuarial gains and losses are generally recognized using the corridor method over a period of approximately 22 years, which represents a reasonable systematic method for amortizing gains and losses for the employee group. Our unrecognized actuarial gains and losses arise from several factors, including experience and assumption changes in the obligations and the difference between expected returns and actual returns on plan assets. The difference between actual and expected returns is deferred as an unrecognized actuarial gain or loss on our consolidated statement of comprehensive income (loss) and is recognized as a decrease or an increase in future pension expense.
Income Taxes
We recognize the amount of taxes payable or refundable for the year and deferred tax assets and liabilities for the expected future tax consequences of events that have been recognized in the financial statements or tax returns. We provide a valuation allowance for deferred tax assets if it is more likely than not that these items will not be realized. See Note 1312 to our consolidated financial statements for our discussion on income taxes.
Income taxes are accounted for under the asset and liability method. We provide a valuation allowance for deferred tax assets if it is more likely than not that these items will not be realized. Deferred tax assets and liabilities are recognized for the future tax consequences attributable to differences between the financial statement carrying amounts of existing assets and liabilities and their respective tax bases and operating loss and tax credit carryforwards. A current tax asset or liability is recognized for the estimated taxes refundable or payable on tax returns. Deferred tax assets and liabilities are measured using enacted tax rates expected to apply to taxable income in the years in which those temporary differences are expected to be recovered or settled. The effect on deferred tax assets and liabilities of a change in tax rates is recognized in income in the period that includes the enactment date.
In assessing the realizability of deferred tax assets, we consider whether it is more likely than not that some portion or all of the deferred tax assets will not be realized. The ultimate realization of deferred tax assets is dependent upon the generation of future taxable income during the periods in which those temporary differences become deductible. A valuation allowance is provided for deferred tax assets if it is more likely than not that these items will not be realized. We consider the scheduled reversal of deferred tax liabilities, income available from carryback years, projected future taxable income and available tax planning strategies in making this assessment. Additionally, we use forecasts of certain tax elements such as taxable income and foreign tax credit utilization in making this assessment of realization. Given the inherent uncertainty involved with the use of such estimates and assumptions, there can be significant variation between estimated and actual results.
We have operations in numerous countries other than the United States. Consequently, we are subject to the jurisdiction of a significant number of taxing authorities. The income earned in these various jurisdictions is taxed on differing bases, including income actually earned, income deemed earned and revenue-based tax withholding. The final determination of our tax liabilities involves the interpretation of local tax laws, tax treaties and related authorities in each jurisdiction. Changes in the operating environment, including changes in tax law and currency/repatriation controls, could impact the determination of our tax liabilities for a tax year.
We recognize the effect of income tax positions only if it is more likely than not that those positions will be sustained. Recognized income tax positions are measured at the largest amount that is greater than 50% likely of being realized. Changes in recognition or measurement are reflected in the period in which the change in judgment occurs. The Company records potential interest and penalties related to unrecognized tax benefits in income tax expense.
Tax filings of our subsidiaries, unconsolidated affiliates and related entities are routinely examined by tax authorities in the normal course of business. These examinations may result in assessments of additional taxes, which we work to resolve with the tax authorities and through the judicial process. Predicting the outcome of disputed assessments involves some uncertainty. Factors such as the availability of settlement procedures, willingness of tax authorities to negotiate and the operation and impartiality of judicial systems vary across the different tax jurisdictions and may significantly influence the ultimate outcome. We review the facts for each assessment, and then utilize assumptions and estimates to determine the most likely outcome and provide taxes, interest and penalties as needed based on this outcome.
Derivative Instruments
We enter into derivative financial transactions to hedge existing or forecasted risk to changing foreign currency exchange rates and interest rate risk on variable rate debt. We do not enter into derivative transactions for speculative or trading purposes. We recognize all derivatives at fair value on the balance sheet. Derivatives that are not designated as hedges in accordance with ASC 815 - Derivatives and Hedging (Topic 815), are adjusted to fair value and such changes are reflected in the results of operations. If the derivative is designated as a cash flow hedge, all changes in the fair value of derivatives are recognized in other comprehensive income (loss) untiland are subsequently reclassified into earnings in the period in which the hedged item is recognized in earnings. The ineffective portion of a designated hedge's change in fair value is recognized inforecasted transaction affects earnings. See Note 2220 to our consolidated financial statements for our discussion on derivative instruments.
Recognized gains or losses on derivatives entered into to manage project related foreign exchange risk are included in gross profit. Foreign currency gains and losses for hedges of non-project related foreign exchange risk are reported within other non-operating income (expense) on our consolidated statements of operations. Realized gains or losses on derivatives used to manage interest rate risk are included in interest expense in our consolidated statements of operations.
Concentration of Credit Risk
Financial instruments which potentially subject our company to concentrations of credit risk consist principally of cash and cash equivalents and trade receivables. Our cash is primarily held with major banks and financial institutions throughout the world. We believe the risk of any potential loss on deposits held in these institutions is minimal.
Contracts with clients usually contain standard provisions allowing the client to curtail or terminate contracts for convenience. Upon such a termination, we are generally entitled to recover costs incurred, settlement expenses and profit on work completed prior to termination and demobilization cost.
We have revenues and receivables from transactions with an external customer that amounts to 10% or more of our revenues (which are generally not collateralized). We generated significant revenues from transactions with the U.S. government and U.K. government within our GS business segment. No other customers represented 10% or more of consolidated revenues in any of the periods presented.
The following tables present summarized data related totable summarizes our transactionsrevenues and accounts receivable for contracts with U.S. and U.K governmental agencies.U.K. government agencies for which we are the prime contractor, as well as for contracts in which we are a subcontractor and the ultimate customer is a U.S. or U.K. government agency, respectively.
| Revenues and percentage of consolidated revenues from major customers: | | | | Years ended December 31, | | Year ended, |
| December 29, | | | December 29, | | December 31, |
| Dollars in millions | Dollars in millions | 2021 | | 2020 | | 2019 | Dollars in millions | 2023 | | 2022 | | 2021 |
| U.S. government | U.S. government | $ | 5,122 | | 70 | % | | $ | 3,079 | | 53 | % | | $ | 3,014 | | 53 | % | U.S. government | $ | 4,000 | | 58 | 58 | % | | $ | 4,034 | | 61 | 61 | % | | $ | 5,122 | | 70 | 70 | % |
| U.K. government | U.K. government | $ | 508 | | 7 | % | | $ | 573 | | 10 | % | | $ | 659 | | 12 | % | U.K. government | $ | 634 | | 9 | 9 | % | | $ | 584 | | 9 | 9 | % | | $ | 508 | | 7 | 7 | % |
| | Accounts receivable and percentage of consolidated accounts receivable from major customers: | Accounts receivable and percentage of consolidated accounts receivable from major customers: | | |
| Accounts receivable and percentage of consolidated accounts receivable from major customers: | |
| Accounts receivable and percentage of consolidated accounts receivable from major customers: | |
| | | |
| | | |
| | | | December 31, |
| Dollars in millions | Dollars in millions | 2021 | | 2020 | |
| Dollars in millions | |
| Dollars in millions | |
| U.S. government | |
| U.S. government | |
| U.S. government | U.S. government | $ | 1,062 | | 75 | % | | $ | 501 | | 56 | % | |
| U.K. government | U.K. government | $ | 81 | | 6 | % | | $ | 47 | | 5 | % | |
| U.K. government | |
| U.K. government | |
Noncontrolling interest
Noncontrolling interests represent the equity investments of the minority owners in our joint ventures and other subsidiary entities that we consolidate in our financial statements.
Foreign currency
Our reporting currency is the U.S. dollar. The functional currency of our non-U.S. subsidiaries is typically the currency of the primary environment in which they operate. Where the functional currency for a non-U.S. subsidiary is not the U.S. dollar, translation of all of the assets and liabilities (including long-term assets, such as goodwill) to U.S. dollars is based on exchange rates in effect at the balance sheet date. Translation of revenues and expenses to U.S. dollars is based on the average rate during the period and shareholders’ equity accounts are translated at historical rates. Translation gains or losses, net of income tax effects, are reported in accumulated other comprehensive loss on our consolidated balance sheets.
Transaction gains and losses that arise from foreign currency exchange rate fluctuations on transactions denominated in a currency other than the functional currency are recognized in income each reporting period when these transactions are either settled or remeasured. Transaction gains and losses on intra-entity foreign currency transactions and balances including advances and demand notes payable, on which settlement is not planned or anticipated in the foreseeable future, are recorded in accumulated other comprehensive loss on our consolidated balance sheets.
Share-based compensation
We account for share-based payments, including grants of employee stock options, restricted stock-based awards and performance cash units, in accordance with ASC 718 - Compensation-Stock Compensation, which requires that all share-based payments (to the extent that they are compensatory) be recognized as an expense in our consolidated statements of operations based on their fair values on the award date and the estimated number of shares of common stock we ultimately expect to vest. We recognize share-based compensation expense on a straight-line basis over the service period of the award, which is no greater than 53 years. If an award is modified after the grant date, incremental compensation cost is recognized immediately as of the modification. The benefits of tax deductions in excess of the compensation cost recognized for the options (excess tax benefits) are classified as additional paid-in-capital and cash retained as a result of these excess tax benefits is presented in the statements of cash flows as financing cash inflows. See Note 2018 to our consolidated financial statements for our discussion on share-based compensation and incentive plans.
Commitments and Contingencies
We record liabilities for loss contingencies arising from claims, assessments, litigation, fines and penalties, and other sources when it is probable that a liability has been incurred and the amount of the assessment can be reasonably estimated. Legal costs incurred in connection with loss contingencies are expensed as incurred.
Impact of Adoption of New Accounting Standards
In 2017, the United Kingdom's Financial Conduct Authority announced that after 2021 it would no longer compel banks to submit the rates required to calculate the London Interbank Offered Rate (LIBOR), which have been widely used as reference rates for various securities and financial contracts, including loans, debts and derivatives. The Financial Conduct Authority continued to publish some USD LIBOR tenors (overnight, 1-month, 3-month, 6-month and 12-month) through June 30, 2023. As of December 29, 2023, all of our debt instruments that referenced LIBOR base rates have been amended to utilize SOFR or SOFR-based reference borrowing rates. We have adhered to the ISDA 2020 IBOR Fallbacks Protocol, which now governs our derivatives following the final termination of USD LIBOR index benchmark. ASU 2020-04, Reference Rate Reform (Topic 848): Facilitation of the Effects of Reference Rate Reform on Financial Reporting, as amended, helped limit the accounting impact from contract modifications, including hedging relationships, due to the transition from LIBOR to alternative reference rates that were completed by December 31, 2022. This deadline was extended to December 31, 2024 pursuant to ASU 2022-06, Reference Rate Reform (Topic 848): Deferral of the Sunset Date of Topic 848. We elected to apply the optional expedient in ASC 848 in connection with transitioning our interest rate swaps from LIBOR to term SOFR that allowed the amended swaps to be considered as a continuation of the existing hedges. As a result, the reference rate transition did not have an impact on our hedge accounting or a material impact to our consolidated financial statements. Additionally, the transition of our Senior Credit Facility from LIBOR to an alternate reference rate, did not have a significant impact to our financial results, financial position or cash flows as we elected to apply the optional expedients.
Additional Balance Sheet Information
Other Current Assets. The components of other current assets on our consolidated balance sheets as of December 29, 2023 and December 31, 2021 and 20202022 are presented below:
| | | | December 31, | | December 29, | | December 31, |
| Dollars in millions | Dollars in millions | 2021 | | 2020 | Dollars in millions | 2023 | | 2022 |
| | Prepaid expenses | Prepaid expenses | $ | 75 | | | $ | 71 | |
| | Prepaid expenses | |
| | Prepaid expenses | |
| Value-added tax receivable | Value-added tax receivable | 21 | | | 22 | |
| Advances to subcontractors | Advances to subcontractors | 15 | | | 10 | |
| Other miscellaneous assets | Other miscellaneous assets | 36 | | | 18 | |
| Total other current assets | Total other current assets | $ | 147 | | | $ | 121 | |
Other Current Liabilities. The components of other current liabilities on our consolidated balance sheets as of December 29, 2023 and December 31, 2021 and 20202022 are presented below:
| | | | | | | | | | | |
| | December 31, |
| Dollars in millions | 2021 | | 2020 |
| Current maturities of long-term debt | $ | 16 | | | $ | 12 | |
| Reserve for estimated losses on uncompleted contracts | 17 | | | 16 | |
| Retainage payable | 13 | | | 22 | |
| Income taxes payable | 2 | | | 16 | |
| Restructuring reserve | 17 | | | 32 | |
| | | |
| Value-added tax payable | 34 | | | 29 | |
| | | |
| Dividend payable | 16 | | | 14 | |
| Other miscellaneous liabilities | 63 | | | 52 | |
| Total other current liabilities | $ | 178 | | | $ | 193 | |
Impact of Adoption of New Accounting Standards
Effective January 1, 2020, we adopted ASU No. 2016-13, Financial Instruments - Credit Losses (Topic 326) - Measurement of Credit Losses on Financial Instruments, using the modified retrospective approach. This ASU replaces the incurred loss impairment model that recognizes losses when a probable threshold is met with a requirement to recognize lifetime expected credit losses immediately when a financial asset, including receivables, is recorded. The estimate of expected credit losses considers not only historical information, but also current and future economic conditions and events. As a result of the adoption, we recorded a cumulative effect adjustment to retained earnings of $3 million, net of tax of $1 million, on our opening consolidated balance sheet as of January 1, 2020. See Note 22 "Financial Instruments and Risk Management" for further discussion related to credit losses.
Effective January 1, 2020, we adopted ASU No. 2017-04, Intangibles - Goodwill and Other (Topic 350) - Simplifying the Test for Goodwill Impairment. This ASU eliminates Step 2 from the goodwill impairment test. In addition, income tax effects from any tax deductible goodwill on the carrying amount of the reporting unit should be considered when measuring the goodwill impairment loss, if applicable. The amendments also eliminate the requirements for any reporting unit with a zero or negative carrying amount to perform a qualitative assessment and, if it fails that qualitative test, to perform Step 2 of the goodwill impairment test. An entity still has the option to perform the qualitative assessment for a reporting unit to determine if the quantitative impairment test is necessary. As a result of the adoption of this standard in 2020, we used Step 1 to measure the goodwill impairment losses recognized during the first and second quarters of 2020 without proceeding to Step 2 of the goodwill impairment test as required under the previous standard. See Note 9 "Goodwill and Goodwill Impairment" for discussion of goodwill impairment recognized.
Effective January 1, 2021, we adopted ASU No. 2019-12, Income Taxes (Topic 740): Simplifying the Accounting for Income Taxes. This ASU removes specific exceptions to the general principles in ASC Topic 740 related to the incremental approach for intraperiod tax allocation, accounting for basis differences for ownership changes in foreign investments and interim period income tax accounting for year-to-date losses that exceed anticipated losses. The ASU also improves financial statement preparers’ application of income tax-related guidance and simplifies GAAP for franchise taxes that are partially based on income, transactions with a government that result in a step up in the tax basis of goodwill, separate financial statements of legal entities that are not subject to tax and enacted changes in tax laws in interim periods. The adoption of this standard did not have a material impact on our financial position, results of operations or cash flows.
In January 1, 2021. we adopted ASU No. 2018-14, Disclosure Framework - Changes to the Disclosure Requirements for Defined Benefit Plans. This ASU amends ASC 715 to add, remove and clarify certain disclosure requirements related to defined benefit pension and other post-retirement plans. The adoption of this standard did not have impact on our financial position, results of operations or cash flows.
| | | | | | | | | | | |
| | December 29, | | December 31, |
| Dollars in millions | 2023 | | 2022 |
| Value-added tax payable | $ | 41 | | | $ | 32 | |
| Operating lease liabilities | 48 | | | 48 | |
| Dividend payable | 18 | | | 17 | |
| | | |
| | | |
| | | |
| | | |
| Derivative Liability - Warrants | 33 | | | — | |
| | | |
| Other miscellaneous liabilities | 109 | | | 123 | |
| Total other current liabilities | $ | 249 | | | $ | 220 | |
Note 2. Business Segment Information
We provide a wide range of professional services and the management of our business is heavily focused on major projects or programs within each of our reportable segments. At any given time, government programs and joint ventures
represent a substantial part of our operations. Our reportable segments follow the same accounting policies as those described in Note 1 to our consolidated financial statements.
We are organized into 2two core business segments, Government Solutions and Sustainable Technology Solutions and 1one non-core business segment as described below:
Government Solutions. Our Government Solutions business segment provides full life-cycle support solutions to defense, intelligence, space, aviation and other programs and missions for military and other government agencies primarily in the U.S., U.K. and Australia. KBR's services cover the full spectrum spanning research and development, advanced prototyping, acquisition support, systems engineering, C4ISR,C5ISR, cyber analytics, space domain awareness, test and evaluation, systems integration and program management, global supply chain management, and operations readiness and support. With the acquisition of Frazer-Nash Consultancy Limited ("Frazer-Nash") on October 20, 2021 (described in Note 4 to the consolidated financial statements), our GS business segment also provides a broad range ofsupport and professional advisory services to deliver high-end systems engineering, systems assurance and technology to customers across the defense, renewable energy and critical infrastructure sectors primarily in the U.K. and Australia.sectors.
Sustainable Technology Solutions. Our Sustainable Technology Solutions business segment is anchored by our portfolio of over 7080 innovative, proprietary, sustainability-focused process technologies that we license spanning 4accelerate and enable energy transition across the industrial base in four primary areas:verticals: ammonia/syngas/fertilizers,syngas, chemical/petrochemicals, clean refining and circular process/circular economy solutions. STS also includes ourprovides highly synergistic services including advisory and consulting practice focused on broad-based energy transition and net-zero carbon emission consulting, oursolutions, high-end engineering, design and professional services offerings,program management centered around decarbonization, energy efficiency, environmental impact and asset optimization, as well as our technology-led industrial solutions build on our KBR INSITE® platform. KBR INSITE® is a proprietary, digital, cloud-based operationsdigitally-enabled operating and maintenance platform that identifies opportunities for our clients to achieve sustainable improvements in production, reliability, environment impact, energy efficiency and ultimately profitability. Frommonitoring solutions. Through early planning throughand scope definition, advanced technologies and facility life-cycle support,optimization, our STS business segment works closely with customers to provide what we believe is the optimal approach to maximize their return on investment.
Other. Our non-core Other segment includes corporate expenses and selling, general and administrative expenses not allocated to the business segments above.
Operations by Reportable Segment
| | | | | | | | | | | | | | | | | |
| | Years ended December 31, |
| Dollars in millions | 2021 | | 2020 | | 2019 |
| Revenues: | | | | | |
| Government Solutions | $ | 6,149 | | | $ | 4,055 | | | $ | 4,042 | |
| Sustainable Technology Solutions | 1,190 | | | 1,712 | | | 1,597 | |
| | | | | |
| Total revenues | $ | 7,339 | | | $ | 5,767 | | | $ | 5,639 | |
| Gross profit: | | | | | |
| Government Solutions | $ | 575 | | | $ | 493 | | | $ | 444 | |
| Sustainable Technology Solutions | 231 | | | 173 | | | 209 | |
| | | | | |
| Total gross profit | $ | 806 | | | $ | 666 | | | $ | 653 | |
| Equity in earnings (losses) of unconsolidated affiliates: | | | | | |
| Government Solutions | $ | 29 | | | $ | 28 | | | $ | 29 | |
| Sustainable Technology Solutions | (199) | | | 2 | | | 6 | |
| | | | | |
| Total equity in earnings (losses) of unconsolidated affiliates | $ | (170) | | | $ | 30 | | | $ | 35 | |
| Selling, general and administrative expenses: | | | | | |
| Government Solutions | $ | (192) | | | (163) | | | (135) | |
| Sustainable Technology Solutions | (72) | | | (83) | | | (90) | |
| Other | (129) | | | (89) | | | (116) | |
| Total selling, general and administrative expenses | $ | (393) | | | (335) | | | (341) | |
| | | | | |
| Acquisition and integration related costs | (12) | | | (9) | | | (2) | |
| Goodwill impairment | — | | | (99) | | | — | |
| Restructuring charges and asset impairments | (2) | | | (214) | | | — | |
| Gain on disposition of assets | 2 | | | 18 | | | 17 | |
| Operating income | $ | 231 | | | $ | 57 | | | $ | 362 | |
| Interest expense | (92) | | | (83) | | | (99) | |
| Other non-operating income (expense) | (5) | | | 1 | | | 5 | |
| Income (loss) before income taxes and noncontrolling interests | $ | 134 | | | $ | (25) | | | $ | 268 | |
| | | | | | | | | | | | | | | | | |
| Years ended December 31, |
| Dollars in millions | 2021 | | 2020 | | 2019 |
| Capital expenditures: | | | | | |
| Government Solutions | $ | 18 | | | $ | 13 | | | $ | 7 | |
| Sustainable Technology Solutions | 2 | | | 3 | | | 4 | |
| Other | 10 | | | 4 | | | 9 | |
| Total | $ | 30 | | | $ | 20 | | | $ | 20 | |
| Depreciation and amortization: | | | | | |
| Government Solutions | $ | 108 | | | $ | 60 | | | $ | 61 | |
| Sustainable Technology Solutions | 16 | | | 26 | | | 23 | |
| Other | 22 | | | 29 | | | 20 | |
| Total | $ | 146 | | | $ | 115 | | | $ | 104 | |
and Balance Sheet Information by Reportable Segment
The following table presents operations and balance sheet information by reportable segment. Assets specific to business segments include receivables, contract assets, other current assets, claims and accounts receivable, certain identified property, plant and equipment, equity in and advances to related companies and goodwill. The remaining assets, such as cash and the remaining property, plant and equipment, are considered to be shared among the business segments and are therefore reported in "Other."
| | | | | | | | | | | |
| | December 31, |
| Dollars in millions | 2021 | | 2020 |
| Total assets: | | | |
| Government Solutions | $ | 4,245 | | | $ | 3,379 | |
| Sustainable Technology Solutions | 1,145 | | | 1,440 | |
| Other | 809 | | | 886 | |
| Total | $ | 6,199 | | | $ | 5,705 | |
| Goodwill (Note 9): | | | |
| Government Solutions | $ | 1,890 | | | $ | 1,589 | |
| Sustainable Technology Solutions | 170 | | | 172 | |
| | | |
| Total | $ | 2,060 | | | $ | 1,761 | |
| Equity in and advances to related companies (Note 10): | | | |
| Government Solutions | $ | 126 | | | $ | 145 | |
| Sustainable Technology Solutions | 450 | | | 736 | |
| | | |
| Total | $ | 576 | | | $ | 881 | |
| | | | | | | | | | | | | | | | | | | | | | | |
| Government Solutions | | Sustainable Technology Solutions | | Other | | Total |
| Dollars in millions | | | |
| December 29, 2023 | | | | | | | |
| Revenue | $ | 5,353 | | | $ | 1,603 | | | $ | — | | | $ | 6,956 | |
| Equity in earnings (losses) of unconsolidated affiliates | 42 | | | 72 | | | — | | | 114 | |
| Operating income (loss) | 285 | | | 324 | | | (161) | | | 448 | |
| | | | | | | |
| Depreciation and amortization | 96 | | | 19 | | | 26 | | | 141 | |
| | | | | | | |
| | | | | | | |
| Total Assets | 3,737 | | | 996 | | | 832 | | | 5,565 | |
| December 31, 2022 | | | | | | | |
| Revenue | $ | 5,320 | | | $ | 1,244 | | | $ | — | | | $ | 6,564 | |
| Equity in earnings (losses) of unconsolidated affiliates | 27 | | | (107) | | | — | | | (80) | |
| Operating income (loss) | 441 | | | 47 | | | (145) | | | 343 | |
| | | | | | | |
| Depreciation and amortization | 95 | | | 14 | | | 28 | | | 137 | |
| | | | | | | |
| | | | | | | |
| Total Assets | 3,735 | | | 915 | | | 916 | | | 5,566 | |
| December 31, 2021 | | | | | | | |
| Revenue | $ | 6,149 | | | $ | 1,190 | | | $ | — | | | $ | 7,339 | |
| Equity in earnings (losses) of unconsolidated affiliates | 29 | | | (199) | | | — | | | (170) | |
| Operating income (loss) | 414 | | | (30) | | | (153) | | | 231 | |
| | | | | | | |
| Depreciation and amortization | 108 | | | 16 | | | 22 | | | 146 | |
Selected Geographic Information
Revenues by geography are determined based on the location of services provided. Long-lived assets by country are determined based on the location of tangible assets.
| | | | | | | | | | | | | | | | | |
| | Years ended December 31, |
| Dollars in millions | 2021 | | 2020 | | 2019 |
| Revenues: | | | | | |
| United States | $ | 4,923 | | | $ | 3,031 | | | $ | 2,705 | |
| Middle East | 590 | | | 857 | | | 1,027 | |
| Europe | 1,039 | | | 961 | | | 1,058 | |
| Australia | 367 | | | 324 | | | 288 | |
| Canada | 3 | | | 46 | | | 39 | |
| Africa | 179 | | | 152 | | | 197 | |
| Asia | 199 | | | 203 | | | 214 | |
| Other countries | 39 | | | 193 | | | 111 | |
| Total | $ | 7,339 | | | $ | 5,767 | | | $ | 5,639 | |
| | | | December 31, | | December 29, | | December 31, |
| Dollars in millions | Dollars in millions | 2021 | | 2020 | Dollars in millions | 2023 | | 2022 |
| Property, plant & equipment, net: | Property, plant & equipment, net: | | | |
| United States | United States | $ | 70 | | | $ | 70 | |
| United States | |
| United States | |
| United Kingdom | United Kingdom | 49 | | | 45 | |
| Other | Other | 17 | | | 15 | |
| Total | Total | $ | 136 | | | $ | 130 | |
Note 3. Revenue
Disaggregated Revenue
We disaggregate our revenue from customers by business unit, geographic destination and contract type for each of our segments, as we believe it best depicts how the nature, amount, timing and uncertainty of our revenue and cash flows are affected by economic factors. See details in the tables below.
Revenue by business unit and reportable segment was as follows:
| | | Year Ended December 31, | |
| | | Year Ended | |
| | | Year Ended | |
| | | Year Ended | |
| | | | | December 29, | |
| | | | | December 29, | |
| | | | | December 29, | |
| Dollars in millions | |
| Dollars in millions | |
| Dollars in millions | Dollars in millions | | 2021 | | 2020 | | 2019 | |
| | Government Solutions | Government Solutions | | | |
| | Government Solutions | |
| | Government Solutions | |
| Science & Space | |
| Science & Space | |
| Science & Space | Science & Space | | $ | 1,018 | | | $ | 967 | | | $ | 863 | | |
| Defense & Intel | Defense & Intel | | 1,475 | | | 959 | | | 782 | | |
| Defense & Intel | |
| Defense & Intel | |
| Readiness & Sustainment | |
| Readiness & Sustainment | |
| Readiness & Sustainment | Readiness & Sustainment | | 2,644 | | | 1,153 | | | 1,400 | | |
| International | International | | 1,012 | | | 976 | | | 997 | | |
| International | |
| International | |
| Total Government Solutions | Total Government Solutions | | 6,149 | | | 4,055 | | | 4,042 | | |
| Total Government Solutions | |
| Total Government Solutions | |
| | Sustainable Technology Solutions | |
| | Sustainable Technology Solutions | |
| | Sustainable Technology Solutions | Sustainable Technology Solutions | | 1,190 | | | 1,712 | | | 1,597 | | |
| | | Total revenue | Total revenue | | $ | 7,339 | | | $ | 5,767 | | | $ | 5,639 | | |
| | Total revenue | |
| | Total revenue | |
Government Solutions revenue earned from key U.S. government customers includes U.S. DoD agencies and NASA, and is reported as Science & Space, Solutions, Defense & Intel and Readiness & Sustainment and International.Sustainment. Government Solutions revenue earned from non-U.S. government customers primarily includes the U.K. MoD and the Australian Defence Force, and is reported as International.
Revenue by geographic destination was as follows:
| | Year Ended December 31, 2021 |
| Year Ended December 29, 2023 | |
| Year Ended December 29, 2023 | |
| Year Ended December 29, 2023 | |
|
Dollars in millions |
Dollars in millions | Government Solutions | | Sustainable Technology Solutions | | | Total |
Dollars in millions | |
Dollars in millions | | Government Solutions | | Sustainable Technology Solutions | | | | | | Total |
| United States | United States | $ | 4,493 | | | $ | 430 | | | | $ | 4,923 | |
| Europe | |
| Middle East | Middle East | 393 | | | 197 | | | | 590 | |
| Europe | 816 | | | 223 | | | | 1,039 | |
| Australia | Australia | 351 | | | 16 | | | | 367 | |
| Canada | 1 | | | 2 | | | | 3 | |
| | Africa | |
| Africa | |
| Africa | Africa | 87 | | | 92 | | | | 179 | |
| Asia | Asia | 7 | | | 192 | | | | 199 | |
| Other countries | Other countries | 1 | | | 38 | | | | 39 | |
| Total revenue | Total revenue | $ | 6,149 | | | $ | 1,190 | | | | $ | 7,339 | |
| | Year Ended December 31, 2020 |
| Year Ended December 31, 2022 | |
| Year Ended December 31, 2022 | |
| Year Ended December 31, 2022 | |
|
Dollars in millions |
Dollars in millions | Government Solutions | | Sustainable Technology Solutions | | | Total |
Dollars in millions | |
Dollars in millions | | Government Solutions | | Sustainable Technology Solutions | | | | | | Total |
| United States | United States | $ | 2,280 | | | $ | 751 | | | | $ | 3,031 | |
| Europe | |
| Middle East | Middle East | 622 | | (a) (b) | 235 | | | | 857 | |
| Europe | 743 | | | 218 | | | | 961 | |
| Australia | Australia | 272 | | | 52 | | | | 324 | |
| Canada | 1 | | | 45 | | | | 46 | |
| | Africa | |
| Africa | |
| Africa | Africa | 81 | | | 71 | | | | 152 | |
| Asia | Asia | — | | | 203 | | | | 203 | |
| Other countries | Other countries | 56 | | | 137 | | | | 193 | |
| Total revenue | Total revenue | $ | 4,055 | | | $ | 1,712 | | | | $ | 5,767 | |
| | Year Ended December 31, 2019 |
| Year Ended December 31, 2021 | |
| Year Ended December 31, 2021 | |
| Year Ended December 31, 2021 | |
|
Dollars in millions |
Dollars in millions | Government Solutions | | Sustainable Technology Solutions | | | Total |
Dollars in millions | |
Dollars in millions | | Government Solutions | | Sustainable Technology Solutions | | | | | | Total |
| United States | United States | $ | 2,110 | | | $ | 595 | | | | $ | 2,705 | |
| Europe | |
| Middle East | Middle East | 795 | | (a) (b) | 232 | | | | 1,027 | |
| Europe | 796 | | | 262 | | | | 1,058 | |
| Australia | Australia | 209 | | | 79 | | | | 288 | |
| Canada | 1 | | | 38 | | | | 39 | |
| | Africa | |
| Africa | |
| Africa | Africa | 76 | | | 121 | | | | 197 | |
| Asia | Asia | — | | | 214 | | | | 214 | |
| Other countries | Other countries | 55 | | | 56 | | | | 111 | |
| Total revenue | Total revenue | $ | 4,042 | | | $ | 1,597 | | | | $ | 5,639 | |
Many of our
Our contracts contain bothcost reimbursable, time-and-materials and fixed price cost reimbursable and time-and-material components. We define contract type based on the component that represents the majority of the contract. Revenue by contract type was as follows:
| | Year Ended December 31, 2021 |
| Year Ended December 29, 2023 | | | Year Ended December 29, 2023 |
| | Dollars in millions | Dollars in millions | Government Solutions | | Sustainable Technology Solutions | | Total |
| Cost Reimbursable | $ | 4,175 | | | $ | — | | | $ | 4,175 | |
| Dollars in millions | |
| Dollars in millions | | Government Solutions | | Sustainable Technology Solutions | | Total |
| Cost-Reimbursable | |
| Time-and-Materials | Time-and-Materials | 903 | | | 739 | | | $ | 1,642 | |
| Fixed Price | 1,071 | | | 451 | | | $ | 1,522 | |
| Fixed-Price | |
| Total revenue | Total revenue | $ | 6,149 | | | $ | 1,190 | | | $ | 7,339 | |
| | Year Ended December 31, 2020 |
| Year Ended December 31, 2022 | | | Year Ended December 31, 2022 |
| | Dollars in millions | Dollars in millions | Government Solutions | | Sustainable Technology Solutions | | Total |
| Cost Reimbursable | $ | 2,409 | | | $ | — | | | $ | 2,409 | |
| Dollars in millions | |
| Dollars in millions | | Government Solutions | | Sustainable Technology Solutions | | Total |
| Cost-Reimbursable | |
| Time-and-Materials | Time-and-Materials | 608 | | | 1,215 | | | 1,823 | |
| Fixed Price | 1,038 | | | 497 | | | 1,535 | |
| Fixed-Price | |
| Total revenue | Total revenue | $ | 4,055 | | | $ | 1,712 | | | $ | 5,767 | |
| | Year Ended December 31, 2021 | | | Year Ended December 31, 2021 |
| | Year Ended December 31, 2019 |
| | Dollars in millions | |
| Dollars in millions | |
| Dollars in millions | Dollars in millions | Government Solutions | | Sustainable Technology Solutions | | Total | Government Solutions | | Sustainable Technology Solutions | | Total |
| Cost Reimbursable | Cost Reimbursable | $ | 2,501 | | | $ | — | | | $ | 2,501 | |
| Time-and-Materials | Time-and-Materials | 452 | | | 1,077 | | | 1,529 | |
| Fixed Price | Fixed Price | 1,089 | | | 520 | | | 1,609 | |
| Total revenue | Total revenue | $ | 4,042 | | | $ | 1,597 | | | $ | 5,639 | |
Performance Obligations
Changes in estimates are recognized on a cumulative catch-up basis in the current period associated with performance obligations satisfied in a prior period due to the release of a constrained milestone, modification in contract price or scope or a change in the likelihood of a contingency being resolved. We recognized revenue of $19 million, $49 million and $15 million from performance obligations satisfied in previous periods for such matters of $15 million, $49 million and $19 million for the years ended December 29, 2023, December 31, 2022 and December 31, 2021, 2020 and 2019, respectively.
On December 31, 2021,29, 2023, we had $11.7$12.7 billion of transaction price allocated to remaining performance obligations. We expect to recognize approximately 31%34% of our remaining performance obligations as revenue within one year, 34%39% in years two through five and 35%27% thereafter. Revenue associated with our remaining performance obligations to be recognized beyond one year includes performance obligations primarily related to the Aspire Defence and Fasttrax projects,project, which havehas contract terms extending through 2041 and 2023, respectively.2041. Remaining performance obligations do not include variable consideration that was determined to be constrained as of December 31, 2021.29, 2023.
Contract Assets and Contract Liabilities
Contract assets were $224$177 million and $178$252 million and contract liabilities were $313$359 million and $356$275 million, at December 29, 2023 and December 31, 2021 and 2020,2022, respectively. The increasedecrease in contract assets was primarily attributed to revenue recognized on certain contracts partially offset by the timing of billings. The decreaseincrease in contract liabilities was due to the timing of advance payments and revenue recognized during the period. We recognized revenue of $194$202 million for the year ended December 31, 2021,29, 2023, which was previously included in the contract liability balance at December 31, 2020.2022.
Accounts Receivable
| | December 31, |
| December 29, | | | December 29, | | December 31, |
| Dollars in millions | Dollars in millions | 2021 | | 2020 | Dollars in millions | 2023 | | 2022 |
| Unbilled | Unbilled | $ | 698 | | | $ | 476 | |
| Trade & other | Trade & other | 713 | | | 423 | |
| Accounts receivable, net | Accounts receivable, net | $ | 1,411 | | | $ | 899 | |
Note 4. Acquisitions
Frazer-Nash Consultancy Limited
On October 20, 2021, we acquired Frazer-Nash in accordance with an agreement with Babcock InternationalVIMA Group PLC, a leading UK based provider of specialist systems, engineering and technology solutions. The acquired business of Frazer-Nash provides innovative engineering and technology related professional advisory services across the defense, energy and critical infrastructure sectors primarily in the U.K. and Australia. It is reported within our GS business segment. We accounted for this transaction using the acquisition method under ASC 805, Business Combinations. The aggregate consideration paid was approximately $392 million in cash, subject to other post-closing adjustments. The Company funded the acquisition through a combination of cash on-hand and borrowings under the Revolver.
During the year ended December 31, 2021, the Company incurred $4 million in acquisition-related costs with the acquisition of Frazer-Nash, which are included in acquisition and integration related costs on the consolidated statements of operations. The acquired Frazer-Nash business contributed $31 million of revenues and $2 million of gross profit within our GS business segment during the year ended December 31, 2021.
As of December 31, 2021, the estimated fair values of net assets acquired were preliminary, with possible updates primarily in our finalization of tax returns. The following table summarizes the consideration paid for this acquisition and the fair value of assets and liabilities assumed as of the acquisition date as follows:
| | | | | |
Dollars in millions | Frazer-Nash |
Fair value of total consideration paid | $ | 392 | |
Recognized amounts of identifiable assets acquired and liabilities assumed: | |
Cash and equivalents | 7 | |
Accounts receivable | 33 | |
Other current assets | 5 | |
Total current assets | 45 | |
Property, plant, and equipment, net | 6 | |
Operating lease right-of-use assets | 6 | |
Intangible assets, net | 89 | |
| |
| |
Total assets | 146 | |
| |
Accounts payable | 13 | |
| |
| |
| |
Other current liabilities | 6 | |
Total current liabilities | 19 | |
| |
Deferred income taxes | 21 | |
Operating lease liabilities | 6 | |
| |
Total liabilities | 46 | |
| |
Net assets acquired | 100 | |
Goodwill | $ | 292 | |
The goodwill recognized of $292 million arising from this acquisition primarily relates to future growth opportunities based on an expanded service offering from intellectual capital and a highly skilled assembled workforce and other expected synergies from the combined operations. For U.S. tax purposes, the transaction is treated as a stock deal. As a result, there is no step-up in tax basis and the goodwill recognized is not deductible for tax purposes.
The following table summarizes the fair value of intangible assets and the related weighted-average useful lives:
| | | | | | | | | | | |
| Dollars in millions | Fair Value | | Weighted Average Amortization Period (in years) |
| Backlog | $ | 10 | | | 1 |
| Customer relationships | 79 | | | 16 |
| Total intangible assets | $ | 89 | | | 14 |
The backlog intangible asset is comprised solely of contracted orders that had not yet been fulfilled. The customer relationships intangible assets consists of established relationships with existing customers that resulted in repeat purchases and customer loyalty. The backlog and customer relationships intangible assets were valued using the income approach, specifically the multi-period excess earnings method in which the value is derived from an estimation of the after-tax cash flows specifically attributable to backlog and customer relationships. The analysis included assumptions for forecasted revenues and EBITDA margins, contributory asset charge rates, weighted average cost of capital and a tax amortization benefit.
Harmonic Limited
On July 1, 2021,August 2, 2022, we acquired certain assetsVIMA Group, a U.K.-based leading provider of digital transformation solutions to defense and assumed certain liabilities of Harmonic Limited ("Harmonic"). The acquired business of Harmonic provides transformation and delivery consultancy project services to UK businesses andother public sector clients. VIMA Group is reported within our GS business segment. We accounted for this transaction as an acquisition of a business using the acquisition method under ASC 805, Business Combinations. Combinations (Topic 805).
The agreed-upon purchase price for the acquisition was $19 million, which$82 million. The purchase price consisted of cash paid at closing of $17$75 million, funded from cash on handsubject to certain working capital and other closing adjustments, $4 million of deferred consideration and contingent consideration with an estimated fair value of $2$3 million that iswas contingent upon the achievement of certain performance targets over the period from closing through MarchDecember 31, 2024.2022. As the targets were not met, no consideration was paid and we recorded a benefit of $3 million in our consolidated statements of operations for the year ended December 31, 2022. We recognized $2 million as an intangible backlog asset, $11 million in customer relationships, $3 million in net working capital, $2 million in deferred income tax liability and goodwill$68 million of $14 milliongoodwill arising from the acquisition, which relates primarily to future growth opportunities. As of December 31, 2021, the estimated fair values of net assets acquired were preliminary. The goodwill recognized is not deductible for tax purposes.
Centauri Platform Holdings, LLC
On October 1, 2020, we acquired Centauri in accordance with an agreement and plan of merger, pursuant to which a wholly owned subsidiary of KBR merged with and into Centauri, with Centauri continuing as the surviving company and a wholly owned subsidiary of KBR. Centauri provides high-end engineering and development solutions for critical, well-funded, national security missions associated with space, intelligence, cyber and emerging technologies such as directed energy and missile defense and is reported under the GS business segment. The acquisition expands KBR's military space and intelligence business and builds upon the Company's existing cybersecurity and missile defense solutions. Furthermore, the addition of Centauri advances KBR's strategic transformation of becoming a leading provider of high-end, mission-critical technical services and solutions.
The aggregate consideration paid was approximately $830 million. The Company funded the acquisition through a combination of cash on-hand, borrowings under our Senior Credit Facility, net proceeds from the private offering of $250 million aggregate principal amount of our 4.750% Senior Notes due 2028 (the "Senior Notes") and proceeds from the sale of receivables. See Note 12 "Debt and Other Credit Facilities" for further discussion of our Senior Credit Facility and Senior Notes and Note 22 "Fair Value of Financial Instruments and Risk Management" for further discussion of our sale of receivables.
During the years ended December 31, 2021 and 2020, the Company recognized direct, incremental costs related to this acquisition of $6 million and $9 million, respectively, which are included in acquisition and integration related costs on the consolidated statements of operations. The acquired Centauri business contributed $125 million of revenues and $19 million of gross profit for the year ended December 31, 2020.
future growth opportunities. The purchase price allocation for the Centauri business combination is final as of December 31, 2021. No purchase price allocation adjustments were recorded during the measurement period. The following table summarizes the consideration paid for this acquisition and the fair value of assets and liabilities assumed as of the acquisition date as follows:
| | | | | |
Dollars in millions | Centauri |
Fair value of total consideration paid | $ | 830 | |
Recognized amounts of identifiable assets acquired and liabilities assumed: | |
Cash and equivalents | 7 | |
Accounts receivable | 78 | |
Contract assets | 19 | |
Other current assets | 1 | |
Total current assets | 105 | |
Property, plant, and equipment, net | 18 | |
Operating lease right-of-use assets | 36 | |
Intangible assets, net | 226 | |
| |
Other assets | 1 | |
Total assets | 386 | |
| |
Accounts payable | 29 | |
Contract liabilities | 2 | |
Accrued salaries, wages and benefits | 39 | |
Operating lease liabilities | 6 | |
| |
Total current liabilities | 76 | |
| |
Deferred income taxes | 19 | |
Operating lease liabilities | 30 | |
Other liabilities | 7 | |
Total liabilities | 132 | |
| |
Net assets acquired | 254 | |
Goodwill | $ | 576 | |
The goodwill recognized of $576 million arising from this acquisition primarily related to future growth opportunities based on an expanded service offering from intellectual capital and a highly skilled assembled workforce and other expected synergies from the combined operations.considered final. For U.S. tax purposes, the transaction is treated as a stock deal. As a result, there is no step-up in tax basis in the individual assets and liabilities acquired and the goodwill recognized is not deductible for tax purposes.
The following table summarizes the fair value of intangible assets and the related weighted-average useful lives:
| | | | | | | | | | | |
| Dollars in millions | Fair Value | | Weighted Average Amortization Period (in years) |
| Funded backlog | $ | 28 | | | 1 |
| Customer relationships | 198 | | | 15 |
| Total intangible assets | $ | 226 | | | 13 |
The backlog intangible asset is comprised solely of funded backlog that represents revenue that is already fully awarded and funded as of the acquisition date.The customer relationships intangible assets consists of unfunded backlog as of the acquisition date and revenue arising from existing, recompete and follow-on programs. The funded backlog and customer relationships intangible assets were valued using the income approach, specifically the multi-period excess earnings method in which the value is derived from an estimation of the after-tax cash flows specifically attributable to funded backlog and customer relationships. The analysis included assumptions for forecasted revenues and EBITDA margins, contributory asset charge rates, weighted average cost of capital and a tax amortization benefit.
Scientific Management Associates (Operations) Pty Ltd
On March 6, 2020, we acquired certain assets and assumed certain liabilities related to the government defense business of Scientific Management Associates (Operations) Pty Ltd ("SMA"). The acquired business of SMA provides technical training services to the Royal Australian Navy and is reported within our GS business segment. We accounted for this transaction using the acquisition method under ASC 805, Business Combinations. The agreed-upon purchase price for the acquisition was $13 million, less purchase price adjustments totaling $4 million resulting in net cash consideration paid of $9 million. We recognized goodwill of $12 million arising from the acquisition, which relates primarily to future growth opportunities to expand services provided to the Royal Australian Navy. During the first quarter of 2021, contingent consideration liability that was recorded at the time of acquisition was settled for $1 million.
Supplemental Pro Forma Information
The following unaudited supplemental pro forma results of operations have been prepared from historical financial statements that have been adjusted to give effect to the acquisition of Frazer-Nash and Centauri as though they had been acquired on January 1, 2020 and January 1, 2019, respectively. Pro forma adjustments were primarily related to the amortization of intangibles, interest on borrowings related to the acquisitions, significant nonrecurring transactions and acquisition related transaction costs. Accordingly, this supplemental pro forma financial information is presented for informational purposes only and is not necessarily indicative of what the actual results of operations of the combined company would have been had the acquisitions occurred on January 1, 2020 and January 1, 2019, nor is it indicative of future results of operations.
| | | | | | | | | | | | | | | | | |
| Year Ended December 31, |
| Dollars in millions | 2021 | | 2020 | | 2019 |
| (Unaudited) |
| Revenue | $ | 7,465 | | | $ | 6,317 | | | $ | 6,137 | |
| Net income attributable to KBR | $ | 28 | | | $ | (64) | | | $ | 172 | |
| Diluted earnings per share | $ | 0.19 | | | $ | (0.45) | | | $ | 1.20 | |
Note 5. Cash and Cash Equivalents
We consider all highly liquid investments with an original maturity of three months or less to be cash equivalents. Cash and cash equivalents include cash balances held by our wholly owned subsidiaries as well as cash held by joint ventures that we consolidate. Joint venture and the Aspire project cash balances are limited to specific project activities and are not available for other projects, new acquisitions and joint ventures, general cash needs or distribution to us without approval of the board of directors of the respective entities. We expectThe cash and cash equivalents held in consolidated joint ventures and the Aspire project are expected to use this cashbe used for their respective project costs and distributions of earnings.
The components of our cash and cash equivalents balance are as follows:
| | | | December 31, 2021 | | December 29, 2023 |
| Dollars in millions | Dollars in millions | International (a) | | Domestic (b) | | Total | Dollars in millions | International (a) | | Domestic (b) | | Total |
| Operating cash and equivalents | $ | 218 | | | $ | 34 | | | $ | 252 | |
| Operating cash and cash equivalents | |
| Short-term investments (c) | Short-term investments (c) | 2 | | | — | | | 2 | |
| Cash and equivalents held in consolidated joint ventures and Aspire Defence subcontracting entities | 116 | | | — | | | 116 | |
| Cash and cash equivalents held in consolidated joint ventures and Aspire Defence subcontracting entities (d) | |
| Total | Total | $ | 336 | | | $ | 34 | | | $ | 370 | |
| | | | December 31, 2020 | | December 31, 2022 |
| Dollars in millions | Dollars in millions | International (a) | | Domestic (b) | | Total | Dollars in millions | International (a) | | Domestic (b) | | Total |
| Operating cash and equivalents | $ | 228 | | | $ | 54 | | | $ | 282 | |
| Operating cash and cash equivalents | |
| Short-term investments (c) | Short-term investments (c) | 3 | | | — | | | 3 | |
| Cash and equivalents held in consolidated joint ventures and Aspire Defence subcontracting entities | 151 | | | — | | | 151 | |
| Cash and cash equivalents held in consolidated joint ventures and Aspire Defence subcontracting entities (d) | |
| Total | Total | $ | 382 | | | $ | 54 | | | $ | 436 | |
(a)Includes deposits held by non-U.S. entities with operating accounts that constitute offshore cash for tax purposes.
(b)Includes U.S. dollar and foreign currency deposits held in U.S. entities with operating accounts that constitute onshore cash for tax purposes but may reside either in the U.S. or in a foreign country.
(c)Includes time deposits, money market funds and other highly liquid short-term investments.
(d)Includes short-term investments held by Aspire Defence subcontracting entities for $83 million and $46 million as of December 29, 2023 and December 31, 2022, respectively.
Note 6. Unapproved Change Orders and Claims Against Clients and Estimated Recoveries of Claims Against Suppliers and Subcontractors
The amounts of unapproved change orders and claims against clients and estimated recoveries of claims against suppliers and subcontractors included in determining the profit or loss on contracts that has been recorded to date are as follows:
| | Dollars in millions | Dollars in millions | 2021 | | 2020 | Dollars in millions | 2023 | | 2022 |
| Amounts included in project estimates-at-completion at January 1, | Amounts included in project estimates-at-completion at January 1, | $ | 1,048 | | | $ | 978 | |
| (Decrease) increase in project estimates | (228) | | | (1) | |
| Net increase (decrease) in project estimates | |
| Approved change orders | Approved change orders | (374) | | | (6) | |
| Foreign currency impact | Foreign currency impact | (20) | | | 77 | |
| | Amounts included in project estimates-at-completion at December 31, | $ | 426 | | | $ | 1,048 | |
| Amounts recognized over time based on progress at December 31, | $ | 426 | | | $ | 1,048 | |
| Amounts included in project-related estimates-at-completion at end of fiscal year | |
| Amounts included in project-related estimates-at-completion at end of fiscal year | |
| Amounts included in project-related estimates-at-completion at end of fiscal year | |
KBR and its joint ventures have been pursuing approval and collection of amounts due under major unapproved client change orders and subcontractor claims. The remaining commercial matters may not be resolved in the near term. Our current estimates for approval and recoveries may differ materially from the amounts we have recorded and could have a material adverse effect on our results of operations, financial position and cash flows.
Asbalance as of December 31, 2021 and 2020, the majority of unapproved change orders and claims against client and estimated recoveries of claims against suppliers and subcontractors29, 2023 primarily relates to the Ichthys LNG Project discussed below.
Ichthys LNG Project
We have a 30% ownership interestprojects in the JKC joint venture ("JKC"), which was contracted to perform the engineering, procurement, supply, construction and commissioning of onshore LNG facilities for a client in Darwin, Australia (the "Ichthys LNG Project"). The construction and commissioning of the Ichthys LNG Project is complete, and the facility has been handed over to the client and is producing LNG.
Settlement Agreement with the Client
In October 2021, JKC entered into a binding settlement agreement (the “Settlement Agreement”) that resolved the outstanding claims and disputes between JKC and its client, Ichthys LNG Pty, Ltd (collectively, “the Parties”). As a result ofour Government Solutions segment.
the Settlement Agreement, the Parties agreed to withdraw all claims and terminate all ongoing arbitrations and court proceedings between the Parties, including the following:
•Under the cost-reimbursable scope of the contract, JKC believed amounts paid or payable to the suppliers and subcontractors in settlement of their contract claims related to the cost-reimbursable scope were an adjustment to the contract price. JKC made claims for such contract price adjustments; however, the client disputed some of these contract price adjustments. In order to facilitate the continuation of work, the client agreed to a contractual mechanism (“Funding Deed”) in 2016 providing funding in the form of an interim contract price adjustment to JKC, consented to settlement of subcontractor claims as of that date related to the cost-reimbursable scope, but reserved its right to dispute. In 2017, additional settlements pertaining to suppliers and subcontractors under the cost-reimbursable scope of the contract were presented to the client, and the client consented to payment to JKC but reserved its contractual rights. The Settlement Agreement fully resolved these matters capping JKC's recovery to amounts previously funded by the client.
•JKC was entitled to an amount of profit and overhead which was a fixed percentage of the target reimbursable costs under the reimbursable component of the contract. The Parties were unable to reach agreement on incremental amounts claimed by JKC. The Settlement Agreement fully resolved this matter.
•Claims for incurred costs related to scope increases and other factors for which JKC believed it is entitled to reimbursement under the contract along with claims asserted by the client.
In connection with preliminary settlement discussions, the Company recorded a non-cash charge to equity in earnings of unconsolidated affiliates in the amount of $193 million in the quarter ended June 30, 2021, which reflected KBR’s proportionate share of the unpaid, unapproved change orders and claims. In the quarter ended September 30, 2021, KBR recorded an additional charge of approximately $10 million for its proportionate share of final warranty items.
As part of the Settlement Agreement, KBR’s letters of credit were also reduced to $82 million from $164 million.
The Settlement Agreement does not impact pursuit of, or positions related to, JKC’s subcontractor claims associated with the combined cycle power plant described below.
Paint and Insulation Claims Against Insurer and Paint Manufacturer
There has been deterioration of paint and insulation on certain exterior areas of the plant. As part of the Settlement Agreement, the Parties agreed to consult in good faith and to cooperate to seek maximum recovery from the insurance policies and paint manufacturer for the paint and insulation matters. The Parties agreed to collectively pursue claims against the paint manufacturer, and JKC has assigned claims under the insurance policy regarding the paint and insulation matters to the client.
Under the Settlement Agreement, the parties have agreed that if, at the date of final resolution of the above proceedings and claims with respect to the paint and insulation matters, the recovered amount from the paint manufacturer and insurance claim is less than the stipulated ceiling amount in the Settlement Agreement, JKC will pay the client the difference between the stipulated ceiling amount and the recovered amount. JKC has provided for and continues to maintain its contingent liability.
Combined Cycle Power Plant
Pursuant to JKC's fixed-price scope of its contract with its client, JKC awarded a fixed-price EPC contract to a subcontractor for the design, construction and commissioning of the Combined Cycle Power Plant (the "Power Plant"). The subcontractor was a consortium consisting of General Electric and GE Electrical International Inc. and a joint venture between UGL Infrastructure Pty Limited and CH2M Hill (collectively, the "Consortium"). On January 25, 2017, JKC received a Notice of Termination from the Consortium, and the Consortium ceased work on the Power Plant and abandoned the construction site. JKC believes the Consortium materially breached its subcontract and repudiated its obligation to complete the Power Plant, plus undertook actions making it more difficult and more costly for the works to be completed by others after the Consortium abandoned the site. Subsequently, the Consortium filed a request for arbitration with the ICC asserting that JKC repudiated the contract. The Consortium also sought an order that the Consortium validly terminated the subcontract. JKC has responded to this request, denying JKC committed any breach of its subcontract with the Consortium and restated its claim that the Consortium breached and repudiated its subcontract with JKC and is liable to JKC for all costs to complete the Power Plant.
In March 2017, JKC prevailed in a legal action against the Consortium requiring the return of materials, drawings and tools following their unauthorized removal from the site by the Consortium. After taking over the work, JKC discovered incomplete and defective engineering designs, defective workmanship on the site, missing, underreported and defective
materials and the improper termination of key vendors/suppliers. JKC's investigations also indicate that progress of the work claimed by the Consortium was over-reported. JKC has completed the Consortium's work and the incurred costs significantly exceed the awarded fixed-price subcontract value. JKC's cost to complete the Power Plant includes re-design efforts, additional materials and significant re-work.
JKC is pursuing recourse against the Consortium to recover all of the costs to complete the Power Plant, plus the additional interest, and/or general damages. Each of the Consortium partners has joint and several liability with respect to all obligations under the subcontract.
Costs incurred to complete the Power Plant that have been determined to be probable of recovery from the Consortium under U.S. GAAP have been included as a reduction of cost in our estimate of profit at completion. The estimated recoveries exclude interest, liquidated damages and other related costs which JKC intends to pursue recovery from the Consortium. Amounts expected to be recovered from the Consortium are included in the table above at the beginning of this Note 6.
As of December 31, 2021, JKC's claims against the Consortium were approximately $1.6 billion (net of subcontractor bonds and remaining original lump sum subcontract value) for recovery of JKC's costs. The opening hearing of the power plant arbitration was held in April 2021. The final hearing is expected to be held in April and May 2022. The previous hearing dates were vacated due to the COVID-19 delay and the current dates may continue to be impacted by the COVID-19 pandemic.
JKC asked the Australian courts to require the parent company guarantors of the Consortium to issue payment to JKC in advance of the completion of the arbitration proceedings. The court concluded that the parent companies are responsible for Consortium’s liability resulting from the arbitration outcome, but they are not required to pay in advance of the arbitration. JKC continues to pursue the resolution of this matter and will seek collection from the Consortium and their parent guarantors who are all jointly and severally liable for any damages owed to JKC.
To the extent JKC is unsuccessful in prevailing in the Arbitration or the Consortium members are unable to satisfy their financial obligations in the event of a decision favorable to JKC, we would be responsible for our pro-rata portion of unrecovered costs from the Consortium. This could have a material adverse impact on the profit at completion of the overall contract and thus on our consolidated statements of operations and financial position.
See Note 10 "Equity Method Investments and Variable Interest Entities" to our consolidated financial statements for further discussion regarding our equity method investment in JKC.
Changes in all other Project-related Estimates
There are many factors that may affect the accuracy of our cost estimates and ultimately our future profitability. These
include, but are not limited to, the availability and costs of resources (such as labor, materials and equipment), productivity
weather, and ongoing resolution of legacy projects and legal matters.matters, including any new or ongoing dispute with our business partners and others in our supply chain. We generally realize both lower and higher than expected margins on projects in any given period. We recognize revisions of revenues and costs in the period in which the revisions are known. This may result in the recognition of costs before the recognition of related revenue recovery, if any.
During the year ended December 31, 20212022 within our STS business segment, we recognized a non-cash charge to equity in earnings of unconsolidated affiliates of $193$137 million as a result of changes in estimates on the Ichthys LNG project duringProject in connection with a settlement agreement (the "Subcontractor Settlement Agreement") entered into to resolve outstanding claims and disputes between JKC and the second quarterconsortium of 2021 and an additional $10 million charge for final warranty items during the third quarter of 2021.subcontractors. Additionally, during the year ended December 31, 2021,2022, within our GS business segment, we recognizedrecorded a favorable changecharge to equity in earnings of $37unconsolidated affiliates on a joint venture acquired from a historical GS acquisition of $10 million based on our funding obligations of projected losses. This joint venture was divested in gross profit associated with the settlementfourth quarter of a legacy EPC project matter, partially offset by $20 million related to the resolution of other legacy matters.2022.
Sanctions and trade control measures were implemented against Russia due to the ongoing conflict between Russia and Ukraine. These measures impacted our ability to operate in the region as we carried out efforts to wind down our operations in Russia. During the year ended December 31, 2020,2022, we recognized a favorablean unfavorable change of $16 million in estimated revenues and gross profit and incurred $6 million in severance and asset impairments costs associated with variable consideration resulting from resolutionour winding down of a contingency of a legacy EPC project during the first quarter of 2020.
Note 7. Restructuring Charges and Asset Impairments
During 2020, our management initiated and approved a broad restructuring planoperations in response to the dislocation of the global energy market resulting from the decline in oil prices and the COVID-19 pandemic. As part of the plan, management approved strategic business restructuring activities and decided to discontinue pursuing certain projects, principally lump-sum EPC and commoditized construction services. The restructuring plan was designed to refine our market focus, optimize costs and improve operational efficiencies. The restructuring charges were substantially completed inRussia. During the year ended December 31, 2020.29, 2023, we recognized a loss on disposition of assets and investments of $7 million related to the sale of our operations in Russia. This loss was primarily due to $10 million in accumulated foreign currency adjustments that were reclassified to the statement of operations from AOCL.
We recorded restructuring charges and asset impairments of $2 million for the year ended December 31, 2021. For the year ended December 31, 2020, we recorded restructuring charges and asset impairments as follows:
| | | | | | | | | | | | | | | | | | | | | | | | | | | | | | | | | | | |
| Dollars in millions | Severance | | Lease Abandonment | | Other | | Total Restructuring Charges | | Asset Impairments | | Total Restructuring Charges & Asset Impairments |
| Government Solutions | $ | 2 | | | $ | — | | | $ | — | | | $ | 2 | | | $ | 2 | | | $ | 4 | |
| Sustainable Technology Solutions | 29 | | | 4 | | | 6 | | | 39 | | | 47 | | | 86 | |
| Other | 1 | | | 54 | | | 20 | | | 75 | | | 49 | | | 124 | |
| Total | $ | 32 | | | $ | 58 | | | $ | 26 | | | $ | 116 | | | $ | 98 | | | $ | 214 | |
The restructuring liability at December 31, 2021 was $66 million, of which $17 million is included in other current liabilities and $49 million is included in other liabilities. A reconciliation of the beginning and ending restructuring liability balances is provided in the following table.
| | | | | | | | | | | | | | | | | | | | | | | |
| Dollars in millions | Severance | | Lease Abandonment | | Other | | Total |
| Balance at January 1, 2021 | $ | 15 | | | $ | 52 | | | $ | 24 | | | $ | 91 | |
| | | | | | | |
| Lease restructuring charges related to operating lease liabilities | — | | | 2 | | | — | | | 2 | |
| Cash payments / settlements during the period | (9) | | | (7) | | | (5) | | | (21) | |
| Currency translation and other adjustments | (3) | | | — | | | (3) | | | (6) | |
| Balance at December 31, 2021 | $ | 3 | | | $ | 47 | | | $ | 16 | | | $ | 66 | |
The restructuring liability at December 31, 2020 was $91 million, of which $32 million is included in other current liabilities and $59 million is included in other liabilities. A reconciliation of the beginning and ending restructuring liability balances is provided in the following table.
| | | | | | | | | | | | | | | | | | | | | | | |
| Dollars in millions | Severance | | Lease Abandonment | | Other | | Total |
| Balance at January 1, 2020 | $ | — | | | $ | — | | | $ | — | | | $ | — | |
| Restructuring charges accrued during the period | 32 | | | 58 | | | 26 | | | $ | 116 | |
| Lease restructuring charges related to operating lease liabilities | — | | | (4) | | | — | | | $ | (4) | |
| Cash payments / settlements during the period | (16) | | | (2) | | | (3) | | | $ | (21) | |
| Currency translation and other adjustments | $ | (1) | | | $ | — | | | $ | 1 | | | $ | — | |
| Balance at December 31, 2020 | $ | 15 | | | $ | 52 | | | $ | 24 | | | $ | 91 | |
| | | | | | | |
Note 8.7. Property, Plant and Equipment
The components of our property, plant and equipment balance are as follows:
| | | Estimated
Useful
Lives in Years | | December 31, | | Estimated
Useful
Lives in Years | | December 29, | | December 31, |
| Dollars in millions | Dollars in millions | | 2021 | | 2020 | Dollars in millions | | 2023 | | 2022 |
| Land | Land | N/A | | $ | 5 | | | $ | 5 | |
| Buildings and property improvements | Buildings and property improvements | 1-35 | | 131 | | | 129 | |
| Equipment and other | Equipment and other | 1-25 | | 431 | | | 415 | |
| Total | Total | | 567 | | | 549 | |
| Less accumulated depreciation | Less accumulated depreciation | | (431) | | | (419) | |
| Net property, plant and equipment | Net property, plant and equipment | | $ | 136 | | | $ | 130 | |
Property, plant and equipment includes approximately $39$48 million and $36$40 million of equipment and other assets under finance lease obligations as of December 29, 2023, and December 31, 2021, and 2020,2022, respectively. Depreciation expense, including amortization expense for finance ROU assets, was $42$50 million, $36$40 million and $33$42 million for the years ended December 29, 2023, December 31, 2022 and December 31, 2021, 2020 and 2019, respectively.
Note 9.8. Goodwill and Intangible Assets
Goodwill
The changes in the carrying amount of goodwill in each of the Company’s reportable segments for the years ended December 29, 2023 and December 31, 2021 and 20202022 were as follows:
| | | | | | | | | | | | | | | | | |
| Dollars in millions | Government Solutions | | Sustainable Technology Solutions | | Total |
| | | | | |
| | | | | |
| | | | | |
| Balance as of January 1, 2020 | $ | 978 | | | $ | 287 | | | $ | 1,265 | |
| Goodwill acquired during the period (Note 4) | 589 | | | — | | | 589 | |
| | | | | |
| Goodwill reallocation | 19 | | | (19) | | | — | |
| Impairment loss | — | | | (99) | | | (99) | |
| Foreign currency translation | 3 | | | 3 | | | 6 | |
| | | | | |
| | | | | |
| | | | | |
| | | | | |
| Balance as of January 1, 2021 | $ | 1,589 | | | $ | 172 | | | $ | 1,761 | |
| Goodwill acquired during the period (Note 4) | 306 | | | — | | | 306 | |
| | | | | |
| | | | | |
| | | | | |
| Foreign currency translation | (5) | | | (2) | | | (7) | |
| Balance as of December 31, 2021 | $ | 1,890 | | | $ | 170 | | | $ | 2,060 | |
2020 Goodwill Impairment
In connection with our business reorganization and restructuring activities during the first quarter of 2020, we changed our internal management reporting structure, which resulted in changes to the underlying reporting units within our legacy Energy Solutions business segment. Additionally, given the significant adverse economic and market conditions associated with the dislocation of the global energy market and COVID-19 pandemic as well as the significant decline in the price of our common shares during the first quarter of 2020, we performed an interim impairment test of goodwill resulting in goodwill impairment of $62 million for the three months ended March 31, 2020. The goodwill impairment was associated with a reporting unit in our legacy Energy Solutions business segment.
As a result of the ongoing economic and market volatility as well as management's decision to discontinue pursuing certain projects within our legacy Energy Solutions business segment during the second quarter of 2020, we performed an interim impairment test of goodwill resulting in goodwill impairment of $37 million for the three months ended June 30, 2020. The goodwill impairment was associated with a reporting unit within our STS business segment. One reporting unit within our GS business segment had a negative carrying amount of net assets as of June 30, 2020 and goodwill of approximately $19 million. No change in the composition of our reporting units resulted from our segment reorganization, effective January 1, 2021, and as such, no reallocation of goodwill was required.
For reporting units in our STS business segment, fair value was determined using a blended approach utilizing discounted cash flow models with estimated cash flows based on internal forecasts of revenues and expenses over a specified period plus a terminal value. For all other reporting units, fair values were determined using a blended approach including market earnings multiples and discounted cash flow models. Under the market approach, we estimated fair value by applying earnings and revenue market multiples to a reporting unit’s operating performance for the trailing twelve-month period. The income approach estimates fair value by discounting each reporting unit’s estimated future cash flows using a weighted-average cost of capital that reflects current market conditions and the risk profile of the reporting unit. To arrive at our future cash flows, we used estimates of economic and market assumptions, including growth rates in revenues, costs, estimates of future expected changes in operating margins, tax rates and cash expenditures. Other significant estimates and assumptions include terminal value growth rates, future estimates of capital expenditures and changes in future working capital requirements. | | | | | | | | | | | | | | | | | |
| Dollars in millions | Government Solutions | | Sustainable Technology Solutions | | Total |
| | | | | |
| | | | | |
| | | | | |
| Balance as of January 1, 2022 | $ | 1,890 | | | $ | 170 | | | $ | 2,060 | |
| Goodwill acquired during the period (Note 4) | 68 | | | — | | | 68 | |
| | | | | |
| | | | | |
| | | | | |
| Foreign currency translation | (40) | | | (1) | | | (41) | |
| | | | | |
| | | | | |
| | | | | |
| | | | | |
| Balance as of January 1, 2023 | $ | 1,918 | | | $ | 169 | | | $ | 2,087 | |
| | | | | |
| | | | | |
| | | | | |
| | | | | |
| Foreign currency translation | 22 | | | — | | | 22 | |
| Balance as of December 29, 2023 | $ | 1,940 | | | $ | 169 | | | $ | 2,109 | |
Intangible Assets
Intangible assets are comprised of customer relationships, trade names, licensing agreements and other. The cost and accumulated amortization of our intangible assets were as follows:
| | Dollars in millions | Dollars in millions | December 31, 2021 | Dollars in millions | December 29, 2023 |
| Weighted Average Remaining Useful Lives | | Intangible Assets, Gross | | Accumulated Amortization | | Intangible Assets, Net |
| Weighted Average Remaining Useful Lives | | | Weighted Average Remaining Useful Lives | | Intangible Assets, Gross | | Accumulated Amortization | | Intangible Assets, Net |
| Trademarks/trade names | Trademarks/trade names | Indefinite | | $ | 50 | | | $ | — | | | $ | 50 | |
| Customer relationships | Customer relationships | 14 | | 546 | | | (124) | | | 422 | |
| Developed technologies | Developed technologies | 18 | | 75 | | | (39) | | | 36 | |
| Contract backlog | Contract backlog | 18 | | 303 | | | (113) | | | 190 | |
| Other | Other | 11 | | 25 | | | (15) | | | 10 | |
| Total intangible assets | Total intangible assets | | $ | 999 | | | $ | (291) | | | $ | 708 | |
| | December 31, 2020 |
| Weighted Average Remaining Useful Lives | | Intangible Assets, Gross | | Accumulated Amortization | | Intangible Assets, Net |
| December 31, 2022 | |
| December 31, 2022 | |
| December 31, 2022 | |
| Weighted Average Remaining Useful Lives | | | Weighted Average Remaining Useful Lives | | Intangible Assets, Gross | | Accumulated Amortization | | Intangible Assets, Net |
| Trademarks/trade names | Trademarks/trade names | Indefinite | | $ | 50 | | | $ | — | | | $ | 50 | |
| Customer relationships | Customer relationships | 15 | | 470 | | | (100) | | | 370 | |
| Developed technologies | Developed technologies | 19 | | 75 | | | (37) | | | 38 | |
| Contract backlog | Contract backlog | 18 | | 291 | | | (76) | | | 215 | |
| Other | Other | 13 | | 25 | | | (15) | | | 10 | |
| Total intangible assets | Total intangible assets | | $ | 911 | | | $ | (228) | | | $ | 683 | |
Intangibles subject to amortization are impaired if the carrying value of the intangible is not recoverable and exceeds its fair value. Intangibles that are not subject to amortization are reviewed annually for impairment or more often if events or circumstances change that would create a triggering event. In 2020, in connection withDuring the energy market decline, we recognized an impairment loss on indefinite-livedyears ended December 29, 2023, December 31, 2022 and December 31, 2021, no impairments related to our intangible assets associated with certain trade names acquired through previous business combinations of our legacy ES business of approximately $11 million within restructuring charges and asset impairments.were recorded.
Our intangibles amortization expense is presented below:
| | Years ended December 31, |
| Year Ended | | | Year Ended |
| December 29, | | | December 29, | | December 31, |
| Dollars in millions | Dollars in millions | 2021 | | 2020 | | 2019 | Dollars in millions | 2023 | | 2022 | | 2021 |
| Intangibles amortization expense | Intangibles amortization expense | $ | 66 | | | $ | 42 | | | $ | 33 | |
Our expected intangibles amortization expense for the next five years is presented below:
| | Dollars in millions | Dollars in millions | Expected future
intangibles
amortization expense | Dollars in millions | Expected future
intangibles
amortization expense |
| 2022 | $ | 51 | |
| 2023 | $ | 43 | |
| 2024 | 2024 | $ | 42 | |
| 2025 | 2025 | $ | 42 | |
| 2026 | 2026 | $ | 42 | |
| Beyond 2026 | $ | 438 | |
| 2027 | |
| 2028 | |
| Beyond 2028 | |
Note 10.9. Equity Method Investments and Variable Interest Entities
We conduct some of our operations through joint ventures, which operate through partnerships, corporations and undivided interests and other business forms and are principally accounted for using the equity method of accounting. Additionally, the majority of our joint ventures are VIEs.
The following table presents a rollforward of our equity in and advances to unconsolidated affiliates:
| | | | | | | | | | | |
| Dollars in millions | 2021 | | 2020 |
| Beginning balance at January 1, | $ | 881 | | | $ | 846 | |
| | | |
| | | |
| Equity in earnings (losses) of unconsolidated affiliates | (170) | | | 30 | |
| Distributions of earnings of unconsolidated affiliates (a) | (72) | | | (38) | |
| Advances to (payments from) unconsolidated affiliates, net | (17) | | | (15) | |
| Investments (b) | 29 | | | 26 | |
| Impairment of equity method investments (c) | — | | | (19) | |
| Sale of equity method investment (d) | (39) | | | — | |
| Foreign currency translation adjustments | (10) | | | 50 | |
| Other (e) | (26) | | | 1 | |
| | | |
| | | |
| | | |
| Balance at December 31, | $ | 576 | | | $ | 881 | |
| | | | | | | | | | | |
| December 29, | | December 31, |
| Dollars in millions | 2023 | | 2022 |
| Beginning balance at January 1, | $ | 188 | | | $ | 576 | |
| | | |
| | | |
| Equity in earnings (losses) of unconsolidated affiliates (a) | 114 | | | (80) | |
| Distributions of earnings of unconsolidated affiliates (b) | (63) | | | (53) | |
| Payments from unconsolidated affiliates, net | (18) | | | (14) | |
| (Return of) investments in equity method investment, net (c) | (60) | | | (198) | |
| | | |
| Sale of equity method investment (d) (a) | — | | | (31) | |
| Foreign currency translation adjustments | 3 | | | (15) | |
| Other (e) | 42 | | | 3 | |
| | | |
| | | |
| | | |
| Ending balance | $ | 206 | | | $ | 188 | |
(a)The Brown & Root Industrial ServicesDuring 2022, a non-cash charge of $137 million was recorded for settlement agreements associated with the Ichthys LNG project. Additionally, during the third quarter of 2022, we recorded a charge against a joint venture declaredacquired from a historical GS acquisition of $10 million based on our funding obligations of projected losses. In the fourth quarter of 2022, we divested this joint venture and recorded an incremental loss on sale of $3 million. The remaining equity in earnings (losses) of unconsolidated affiliates in 2023 and 2022 is related to normal activities within our other joint ventures.
(b)In the normal course of business, our joint ventures will declare a distribution in the fourthcurrent quarter of 2021 that wasis not paid until the subsequent quarter. As such, the distributions declared during the current quarter may not agree to KBR until January 2022.
(b)Investments include $26 million and $24 million in funding contributions to JKC for years ended December 31, 2021, and 2020, respectively.the distributions of earnings from unconsolidated affiliates on our consolidated statements of cash flows.
(c)During the year ended December 31, 2020, as29, 2023, we received a resultreturn of the significant adverse economic and market conditions associated with the dislocationinvestment from JKC of the global energy market and COVID-19 pandemic, we recognized an impairment of $13approximately $61 million related to the second payment received from the Subcontractor Settlement Agreement. For the year ended December 31, 2022,we received a return of investment from JKC of approximately $190 million related to the first payment from the Subcontractor Settlement Agreement and from BRIS of $10 million as our investment in acumulative distributions from inception of the joint venture project located in the Middle East and a $6 million impairment related to other equity method investments.exceeded our cumulative earnings.
(d)During the thirdfirst quarter of 2021,2022, we sold two of our investment interest in the Middle East Petroleum Corporation (EBIC Ammonia project).four U.K. Road investments. The carrying value of our investment was $39$22 million. We received $43$18 million in cash proceeds and the purchaser agreed to assume the $4 million of consortium relief. In the second quarter of 2022, we sold an additional U.K. Road investment with a carrying value of $19 million and recorded a gain of $4approximately $16 million upon receipt of $35 million in cash proceeds, in addition to receipt of $2 million of which $1 million was attributable to our non-controlling interests. Subsequent todeferred consideration from the receipt of the cash proceeds, we distributed the non-controlling interests' proportionate share of $15 million.first quarter 2022 sales.
(e)During the year ended December 31, 2021,29, 2023, Other included unearned incomethe reclassification of the net liability position of $47 million related to the Ichthys LNG project, which was previously recorded outsideour investment in JKC. The net liability position is attributed to our proportionate share of the equity method investment balanceprovision that JKC continues to maintain for the paint and will not be realized as a result ofinsulation claims against the settlement proceedings. See Note 6 "Unapproved Change Ordersinsurer and Claims Against Clients and Estimated Recoveries of Claims Against Suppliers and Subcontractors" for additional information.paint manufacturer, partially offset by certain tax benefits.
Equity Method Investments
Brown & Root Industrial Services Joint Venture. On September 30, 2015, we executed an agreement with Bernhard Capital Partners ("BCP"), a private equity firm, to establish the Brown & Root Industrial Services joint venture in North America. In connection with the formation of the joint venture, we contributed our Industrial Services Americas business and
received cash consideration of $48 million and a 50% interest in the joint venture. As a result of the transaction, we no longer had a controlling interest in this Industrial Services business and deconsolidated it effective September 30, 2015. The Brown & Root Industrial Services joint venture offers engineering, construction and reliability-driven maintenance services for the refinery, petrochemical, chemical, specialty chemicals and fertilizer markets. Our interest in this venture is accounted for using the equity method and we have determined that the Brown & Root Industrial Services joint venture is not a VIE. Results from this joint venture are included in our STS business segment.
Summarized financial information
Summarized financial information for all jointly owned operations including VIEs that are accounted for using the equity method of accounting is as follows:
Balance Sheet
| | | | December 31, | | December 29, | | December 31, |
| Dollars in millions | Dollars in millions | 2021 | | 2020 | Dollars in millions | 2023 | | 2022 |
| Current assets | Current assets | $ | 2,382 | | | $ | 3,216 | |
| Noncurrent assets | Noncurrent assets | 2,996 | | | 3,227 | |
| Total assets | Total assets | $ | 5,378 | | | $ | 6,443 | |
| | Current liabilities | Current liabilities | $ | 955 | | | $ | 1,018 | |
| Current liabilities | |
| Current liabilities | |
| Noncurrent liabilities | Noncurrent liabilities | 2,652 | | | 2,831 | |
| Total liabilities | Total liabilities | $ | 3,607 | | | $ | 3,849 | |
Statements of Operations
| | | | Years ended December 31, | | Years Ended |
| December 29, | | | December 29, | | December 31, |
| Dollars in millions | Dollars in millions | 2021 | | 2020 | | 2019 | Dollars in millions | 2023 | | 2022 | | 2021 |
| Revenues | Revenues | $ | 1,294 | | | $ | 2,032 | | | $ | 2,592 | |
| | Operating income | $ | (650) | | | $ | 54 | | | $ | 92 | |
| Net income | $ | (698) | | | $ | 28 | | | $ | 48 | |
| Operating income (loss) | |
| Operating income (loss) | |
| Operating income (loss) | |
| Net income (loss) | |
Unconsolidated Variable Interest Entities
For the VIEs in which we participate, our maximum exposure to loss consists of our equity investment in the VIE and any amounts owed to us for services we may have provided to the VIE, reduced by any unearned revenues on the project. Our maximum exposure to loss may also include our obligation to fund our proportionate share of any future losses incurred. Where our performance and financial obligations are joint and several to the client with our joint venture partners, we may be further exposed to losses above our ownership interest in the joint venture.
The following summarizes the total assets and total liabilities recorded on our consolidated balance sheets related to our unconsolidated VIEs in which we have a significant variable interest but are not the primary beneficiary.
| | | |
| | | | December 31, 2021 | December 29, 2023 |
| Dollars in millions | Dollars in millions | Total Assets | | Total Liabilities | |
| Affinity joint venture (U.K. MFTS project) | Affinity joint venture (U.K. MFTS project) | $ | 10 | | | $ | 7 | | |
| Affinity joint venture (U.K. MFTS project) | |
| Affinity joint venture (U.K. MFTS project) | |
| Aspire Defence Limited | |
| Aspire Defence Limited | |
| Aspire Defence Limited | Aspire Defence Limited | $ | 65 | | | $ | 5 | | |
| JKC joint venture (Ichthys LNG project) | JKC joint venture (Ichthys LNG project) | $ | 354 | | | $ | 1 | | |
| U.K. Road project joint ventures | $ | 42 | | | $ | — | | |
| Middle East Petroleum Corporation (EBIC Ammonia project) | $ | — | | | $ | — | | |
| JKC joint venture (Ichthys LNG project) | |
| JKC joint venture (Ichthys LNG project) | |
| | Plaquemines LNG project | |
| | Plaquemines LNG project | |
| | Plaquemines LNG project | |
|
| | Dollars in millions | Dollars in millions | December 31, 2020 |
| Total Assets | | Total Liabilities | |
| Dollars in millions | | Dollars in millions | December 31, 2022 |
| | Affinity joint venture (U.K. MFTS project) | |
| Affinity joint venture (U.K. MFTS project) | |
| Affinity joint venture (U.K. MFTS project) | Affinity joint venture (U.K. MFTS project) | $ | 11 | | | $ | 9 | | |
| Aspire Defence Limited | Aspire Defence Limited | $ | 68 | | | $ | 5 | | |
| Aspire Defence Limited | |
| Aspire Defence Limited | |
| JKC joint venture (Ichthys LNG project) | JKC joint venture (Ichthys LNG project) | $ | 606 | | | $ | 44 | | |
| U.K. Road project joint ventures | $ | 59 | | | $ | — | | |
| Middle East Petroleum Corporation (EBIC Ammonia project) | $ | 31 | | | $ | 1 | | |
| JKC joint venture (Ichthys LNG project) | |
| JKC joint venture (Ichthys LNG project) | |
| | Plaquemines LNG project | |
| | Plaquemines LNG project | |
| | Plaquemines LNG project | |
|
Affinity. In February 2016, Affinity, a joint venture between KBR and Elbit Systems, was awarded a service contract by a third party to procure, operate and maintain aircraft and aircraft-related assets over an 18-year contract period, in support of the UKMFTS project. The contract has been determined to contain a leasing arrangement and various other services between the joint venture and the customer. KBR owns a 50% interest in Affinity. In addition, KBR owns a 50% interest in the two joint ventures, Affinity Capital Works and Affinity Flying Services, which provide procurement, operations and management support services under subcontracts with Affinity. The remaining 50% interest in these entities is held by Elbit Systems. KBR has provided its proportionate share of certain limited financial and performance guarantees in support of the partners' contractual obligations. The three project-related entities are VIEs; however, KBR is not the primary beneficiary of any of these entities. We account for KBR's interests in each entity using the equity method of accounting within our GS business segment. The project is funded through KBR and Elbit Systems provided equity, subordinated debt and non-recourse third party commercial bank debt. Our maximum exposure to loss includes our equity investments in the project entities as of December 31, 2021.29, 2023.
Aspire Defence project. In April 2006, Aspire Defence Limited, a joint venture between KBR and two other project sponsors, was awarded a privately financed project contract by the U.K. MoD to upgrade and provide a range of services to the British Army’s garrisons at Aldershot and around Salisbury Plain in the U.K. In addition to a package of ongoing services to be delivered over 35 years, the project included a nine-year construction program to improve soldiers’ single living, technical and administrative accommodations, along with leisure and recreational facilities. The initial construction program was completed in 2014. In late 2016, Aspire Defence Limited was awarded a significant contract variation, expanding services to be provided under the existing contract including new construction, program management services and facilities maintenance across the garrisons. Aspire Defence Limited manages the existing properties and is responsible for design, refurbishment, construction and integration of new and modernized facilities. We indirectly own a 45% interest in Aspire Defence Limited, the contracting company that is the holder of the 35-year concession contract. The project is funded through equity and subordinated debt provided by the project sponsors and the issuance of publicly-held senior bonds which are nonrecourse to KBR and the other project sponsors. The contracting company is a VIE; however, we are not the primary beneficiary of this entity as of December 31, 2018.entity. We account for our interest in Aspire Defence Limited using the equity method of accounting. As of December 31, 2021, included in our GS segment, our assets and liabilities associated with our investment in this project, within our consolidated balance sheets, were $65 million and $5 million, respectively. Our maximum exposure to loss includes our equity investments in the project entities and amounts payable to us for services provided to these entities less unearned revenues to be provided to these entities as of December 31, 2021.29, 2023.
Prior to January 15, 2018, we also owned a 50% interest in the joint ventures that provide the construction and the related support services under subcontract arrangements with Aspire Defence Limited. On January 15, 2018, Carillion plc, our U.K. partner in these joint ventures, entered into compulsory liquidation. As a result, KBR began consolidating the subcontracting entities in its financial statements effective January 15, 2018.
Ichthys LNG project. In January 2012, we formedThe Ichthys LNG project, a joint venture to provide EPC servicesproject to construct the Ichthys Onshore LNG Export Facility in Darwin, Australia, ("Ichthys LNG project"). The project is being executed through two entities
(collectively, (collectively, "JKC"), which are VIEs, in which we own a 30% equity interest. We account for our investments using the equity method of accounting. At December 31, 2021,29, 2023, our assets and liabilities associated with our investment in JKC recorded in our consolidated balance sheets under our STS business segment were $354$0 million and $1$48 million, respectively. The liability of $48 million is primarily related to the net liability position associated with our investment in JKC. These assets include expected cost recoveries from unapproved change orders and claims as well as estimated recoveries of claims against suppliers and subcontractors arising from issues related to changes to the work scope, delays and lower than planned subcontractor activity.insurers. See Note 6 to our consolidated financial statements for further discussion on the significant contingencies as well as unapproved change orders and claims related to this project.
U.K. Road projects. Plaquemines LNG project. KZJV is a joint venture with Zachary Group that performs certain design, engineering, procurement and construction-related services for a LNG facility in Plaquemines Parish, Louisiana. KBR owns a 45% interest in KZJV, which is a VIE for which we are joint and several to the client with our joint venture partner. We are involved in 4 privately financed projects, executed through joint ventures,not the primary beneficiary as we do not have the power to design, build, operate and maintain roadwaysdirect the activities of the VIE that most significantly impact its economic performance. The investment is accounted for certain government agencies in the U.K. We have a 25% ownership interest in each of these joint ventures and account for themwithin our STS business segment using the equity method of accounting. The joint ventures have obtained financing through third parties that is nonrecourse to the joint venture partners. These joint ventures are VIEs; however, we are not the primary beneficiary. At December 31, 2021, included in our GS business segment, our assets and liabilities associated with our investment in this project recorded in our consolidated balance sheets were $42 million and none, respectively. Our maximum exposure to loss includes our equity investments in these ventures.
During the fourth quarter of 2021, we entered into an agreement to sell our interest in 3 of the U.K. Road projects. The settlement date of this transaction is expected to occur in the first quarter of 2022.
EBIC Ammonia project. Prior to the third quarter of 2021, we had an investment in a development corporation that has an indirect interest in the Egypt Basic Industries Corporation ("EBIC") ammonia plant project located in Egypt. We performed the EPC work for the project and completed our operations and maintenance services for the facility in the first half of 2012. Historically, we owned 65% of this development corporation and consolidated it for financial reporting purposes. The development corporation owns a 25% ownership interest in a company that consolidates the ammonia plant which is considered a VIE. The development corporation accounts for its investment in the company using the equity method of accounting. The VIE is funded through debt and equity. Indebtedness of EBIC under its debt agreement was nonrecourse to us. We were not the primary beneficiary of the VIE. During the third quarter of 2021, we sold our investment interest in the EBIC Ammonia project.
Related Party Transactions
We often provide engineering, construction management and other subcontractor services to our unconsolidated joint ventures and our revenues include amounts related to these services. For the years ended December 29, 2023, December 31, 2022 and December 31, 2021, 2020 and 2019, our revenues included $361$567 million, $511$413 million and $684$361 million, respectively, related to the services we provided primarily to our joint ventures, primarily the Aspire Defence Limited joint venture within our GS business segment and a joint venture within our STS business segment.
Amounts included in our consolidated balance sheets related to services we provided to our unconsolidated joint ventures and undistributed earnings for the years ended December 29, 2023 and December 31, 2021 and 20202022 are as follows:
| | | | December 31, | | December 29, | | December 31, |
| Dollars in millions | Dollars in millions | 2021 | | 2020 | Dollars in millions | 2023 | | 2022 |
| Accounts receivable, net of allowance for doubtful accounts | $ | 35 | | | $ | 83 | |
| Contract assets (a) | $ | 2 | | | $ | 2 | |
| Accounts receivable, net of allowance for doubtful accounts (a) | |
| | Other current assets | |
| Other current assets | |
| Other current assets | Other current assets | $ | 25 | | | $ | — | |
| Contract liabilities (a) | Contract liabilities (a) | $ | 5 | | | $ | 53 | |
|
(a)Reflects contract assetsAccounts receivable and contract liabilities primarily related to joint ventures within our STS business segment.
Consolidated Variable Interest Entities
We consolidate VIEs if we determine we are the primary beneficiary of the project entity because we control the activities that most significantly impact the economic performance of the entity. The following is a summary of the significant VIEs where we are the primary beneficiary:
| | Dollars in millions | Dollars in millions | December 31, 2021 | Dollars in millions | December 29, 2023 |
| Total Assets | | Total Liabilities | Total Assets | | Total Liabilities |
| | Fasttrax Limited (Fasttrax project) | Fasttrax Limited (Fasttrax project) | $ | 23 | | | $ | 8 | |
| Fasttrax Limited (Fasttrax project) | |
| Fasttrax Limited (Fasttrax project) | |
| Aspire Defence subcontracting entities (Aspire Defence project) | Aspire Defence subcontracting entities (Aspire Defence project) | $ | 439 | | | $ | 245 | |
| HomeSafe | |
|
Dollars in millions |
Dollars in millions | December 31, 2020 |
Dollars in millions | December 31, 2022 |
| Total Assets | | Total Liabilities | Total Assets | | Total Liabilities |
| | Fasttrax Limited (Fasttrax project) | Fasttrax Limited (Fasttrax project) | $ | 45 | | | $ | 18 | |
| Fasttrax Limited (Fasttrax project) | |
| Fasttrax Limited (Fasttrax project) | |
| Aspire Defence subcontracting entities (Aspire Defence project) | Aspire Defence subcontracting entities (Aspire Defence project) | $ | 448 | | | $ | 205 | |
| HomeSafe | |
Fasttrax Limited project. In December 2001, theThe Fasttrax joint venture ("Fasttrax") was created to provide to the U.K. MoD a fleet of 91 new HETs capable of carrying a 72-ton Challenger II tank. Fasttrax owns, operates and maintains the HET fleet and provides heavy equipment transportation services to the British Army. The purchase of the assets was completed in 2004, and thecurrent project includes operating and service contracts related to the assets extendMoD HET fleet through 2023. Fasttrax's entity structure includes a parent entity and its 100% owned subsidiary, Fasttrax Limited. KBR and its partner each own a 50% interest in the parent entity, which is considered a VIE. We determined that we are the primary beneficiary of this project entity because we control the activities that most significantly impact economic performance of the entity. Therefore, we consolidate this VIE.
The purchase of the HETs by the joint venture was financed through two series of bonds secured by the assets of Fasttrax Limited and a bridge loan. Assets collateralizing Fasttrax’s senior bonds include cash and cash equivalents of $6$1 million and net property, plant and equipment of approximately $13$3 million as of December 31, 2021. See Note 1229, 2023. The total amount of debt outstanding at December 29, 2023 related to our consolidated financial statements for further details regarding our nonrecourse project-finance debt of this VIE consolidated by KBR including the total amount of debt outstanding at December 31, 2021.was $2 million.
Aspire Defence project (subcontracting entities). As discussed above, we assumed operational management of the Aspire Defence subcontracting entities in January 2018. These subcontracting entities exclusively provide the construction and the related support services under subcontract arrangements with Aspire Defence Limited. These entities are considered VIEs, and, because we are the primary beneficiary, they are consolidated for financial reporting purposes.
HomeSafe. HomeSafe, a KBR led joint venture with Tier One Relocation, was established to be the exclusive provider of household goods move management services for the U.S. Armed Forces, U.S. DoD civilians and their families. KBR owns a 72% interest in HomeSafe. The joint venture is a VIE that is consolidated for financial reporting purposes and is accounted for within our GS business segment. We determined that we are the primary beneficiary of this project entity because we control the activities that most significantly impact economic performance of the entity.
Note 11.10. Retirement Benefits
Defined Contribution Retirement Plans
We have elective defined contribution plans for our employees in the U.S. and retirement savings plans for our employees in the U.K., Canada and other locations. Our defined contribution plans provide retirement benefits in return for services rendered. These plans provide an individual account for each participant and have terms that specify how contributions to the participant’s account are to be determined rather than the amount of retirement benefits the participant is to receive. Contributions to these plans are based on pretax income discretionary amounts determined on an annual basis. Our expense for the defined contribution plans totaled $119 million in 2023, $104 million in 2022 and $84 million in 2021, $83 million in 2020 and $63 million in 2019.2021.
Defined Benefit Pension Plans
We have 2two frozen defined benefit pension plans in the U.S., 1one frozen and one active plan in the U.K. and 1one frozen plan in Germany. Substantially all of our defined benefit plans are funded pension plans, which define an amount of pension benefit to be provided, usually as a function of years of service or compensation.
We used a December 3129 as the measurement date for all plans in 20212023 and 2020.December 31 as the measurement date for all plans in 2022. Plan assets, expenses and obligations for our defined benefit pension plans are presented in the following tables.
| | | | | | | | | | | | | | | | | | | | | | | |
| United States | | Int’l | | United States | | Int’l |
| Dollars in millions | 2021 | | 2020 |
| Change in projected benefit obligations: | | | | | | | |
| Projected benefit obligations at beginning of period | $ | 80 | | | $ | 2,326 | | | $ | 76 | | | $ | 1,988 | |
| | | | | | | |
| | | | | | | |
| Service cost | — | | | 3 | | | — | | | 2 | |
| Interest cost | 2 | | | 33 | | | 2 | | | 39 | |
| Foreign currency exchange rate changes | — | | | (4) | | | — | | | 75 | |
| Actuarial (gain) loss | (3) | | | (180) | | | 6 | | | 287 | |
| Other | — | | | (1) | | | — | | | (1) | |
| | | | | | | |
| Benefits paid | (5) | | | (75) | | | (4) | | | (64) | |
| Projected benefit obligations at end of period | $ | 74 | | | $ | 2,102 | | | $ | 80 | | | $ | 2,326 | |
| Change in plan assets: | | | | | | | |
| Fair value of plan assets at beginning of period | $ | 64 | | | $ | 1,961 | | | $ | 60 | | | $ | 1,727 | |
| | | | | | | |
| Actual return on plan assets | 7 | | | 94 | | | 7 | | | 189 | |
| Employer contributions | 1 | | | 47 | | | 2 | | | 44 | |
| Foreign currency exchange rate changes | — | | | (3) | | | — | | | 66 | |
| Benefits paid | (5) | | | (75) | | | (4) | | | (64) | |
| Other | (1) | | | (1) | | | (1) | | | (1) | |
| Fair value of plan assets at end of period | $ | 66 | | | $ | 2,023 | | | $ | 64 | | | $ | 1,961 | |
| Funded status | $ | (8) | | | $ | (79) | | | $ | (16) | | | $ | (365) | |
| | | | | | | | | | | | | | | | | | | | | | | |
| Overfunded | | Underfunded |
| United States | | Int’l | | United States | | Int’l |
| Dollars in millions | 2023 |
| Change in projected benefit obligations: | | | | | | | |
| Projected benefit obligations at beginning of period | $ | — | | | $ | 17 | | | $ | 59 | | | $ | 1,208 | |
| Service cost | — | | | 1 | | | — | | | — | |
| Interest cost | — | | | 1 | | | 3 | | | 60 | |
| Foreign currency exchange rate changes | — | | | 1 | | | — | | | 67 | |
Actuarial (gain) loss (1) | — | | | (1) | | | 2 | | | 15 | |
| Other | — | | | — | | | — | | | — | |
| Benefits paid | — | | | (1) | | | (6) | | | (63) | |
| | | | | | | |
| Projected benefit obligations at end of period | $ | — | | | $ | 18 | | | $ | 58 | | | $ | 1,287 | |
| Change in plan assets: | | | | | | | |
| Fair value of plan assets at beginning of period | $ | — | | | $ | 16 | | | $ | 52 | | | $ | 1,251 | |
| Actual return on plan assets | — | | | 1 | | | 7 | | | 12 | |
| Employer contributions | — | | | 1 | | | — | | | 8 | |
| Foreign currency exchange rate changes | — | | | 1 | | | — | | | 70 | |
| Benefits paid | — | | | (1) | | | (5) | | | (64) | |
| Other | — | | | — | | | (1) | | | — | |
| Fair value of plan assets at end of period | $ | — | | | $ | 18 | | | $ | 53 | | | $ | 1,277 | |
| Funded status | $ | — | | | $ | — | | | $ | (5) | | | $ | (10) | |
(1) Actuarial (gains) losses primarily driven by change in discount rates.
| | | | | | | | | | | | | | | | | | | | | | | |
| Overfunded | | Underfunded |
| United States | | Int’l | | United States | | Int’l |
| Dollars in millions | 2022 |
| Change in projected benefit obligations: | | | | | | | |
| Projected benefit obligations at beginning of period | $ | — | | | $ | 2,066 | | | $ | 74 | | | $ | 35 | |
| | | | | | | |
| Service cost | — | | | 1 | | | — | | | 1 | |
| Interest cost | — | | | 34 | | | 2 | | | 1 | |
| Foreign currency exchange rate changes | — | | | (220) | | | — | | | (4) | |
Actuarial gain(1) | — | | | (614) | | | (12) | | | (12) | |
| Other | — | | | (1) | | | — | | | — | |
| | | | | | | |
| Benefits paid | — | | | (61) | | | (5) | | | (1) | |
| Projected benefit obligations at end of period | $ | — | | | $ | 1,205 | | | $ | 59 | | | $ | 20 | |
| Change in plan assets: | | | | | | | |
| Fair value of plan assets at beginning of period | $ | — | | | $ | 1,992 | | | $ | 66 | | | $ | 31 | |
| | | | | | | |
| Actual return on plan assets | — | | | (539) | | | (9) | | | (12) | |
| Employer contributions | — | | | 73 | | | — | | | 1 | |
| Foreign currency exchange rate changes | — | | | (213) | | | — | | | (3) | |
| Benefits paid | — | | | (61) | | | (5) | | | (1) | |
| Other | — | | | (1) | | | — | | | — | |
| Fair value of plan assets at end of period | $ | — | | | $ | 1,251 | | | $ | 52 | | | $ | 16 | |
| Funded status | $ | — | | | $ | 46 | | | $ | (7) | | | $ | (4) | |
(1) Actuarial gains primarily driven by change in discount rates.
The Accumulated Benefit Obligation ("ABO") is the present value of benefits earned to date. The ABO for our United States pension plans was $74$58 million and $80$59 million as of December 29, 2023 and December 31, 2021 and 2020,2022, respectively. The ABO for our international pension plans was $2.1 billion$1,305 million and $2.3 billion$1,225 million as of December 29, 2023 and December 31, 2021 and 2020,2022, respectively.
| | United States | | Int’l | | United States | | Int’l |
| United States | | | United States | | Int’l | | United States | | Int’l |
| Dollars in millions | Dollars in millions | 2021 | | 2020 | Dollars in millions | 2023 | | 2022 |
| Amounts recognized on the consolidated balance sheets | Amounts recognized on the consolidated balance sheets | | | |
| Other assets | $ | — | | | $ | 1 | | | $ | — | | | $ | — | |
| Pension obligations | $ | (8) | | | $ | (80) | | | $ | (16) | | | $ | (365) | |
| Pension Assets | |
| Pension Assets | |
| Pension Assets | |
| Other Liabilities | |
Net periodic pension cost for our defined benefit plans included the following components:
| | | | United States | | Int’l | | United States | | Int’l | | United States | | Int’l | | United States | | Int’l | | United States | | Int’l | | United States | | Int’l |
| Dollars in millions | Dollars in millions | 2021 | | 2020 | | 2019 | Dollars in millions | 2023 | | 2022 | | 2021 |
| Components of net periodic benefit cost | Components of net periodic benefit cost | | | | | |
| Service cost | |
| Service cost | |
| Service cost | Service cost | $ | — | | | $ | 3 | | | $ | — | | | $ | 2 | | | $ | — | | | $ | 2 | |
| Interest cost | Interest cost | 2 | | | 33 | | | 2 | | | 39 | | | 3 | | | 50 | |
| Expected return on plan assets | Expected return on plan assets | (3) | | | (87) | | | (3) | | | (59) | | | (3) | | | (77) | |
| Prior service cost amortization | Prior service cost amortization | — | | | 1 | | | — | | | 1 | | | — | | | 1 | |
| | Recognized actuarial loss | Recognized actuarial loss | 2 | | | 31 | | | 2 | | | 22 | | | 2 | | | 16 | |
| Net periodic benefit cost | $ | 1 | | | $ | (19) | | | $ | 1 | | | $ | 5 | | | $ | 2 | | | $ | (8) | |
| Recognized actuarial loss | |
| Recognized actuarial loss | |
| Net periodic (benefit) cost | |
The amounts in accumulated other comprehensive loss that have not yet been recognized as components of net periodic benefit cost at December 29, 2023 and December 31, 2021 and 2020,2022, net of tax were as follows:
| | United States | | Int’l | | United States | | Int’l |
| United States | | | United States | | Int’l | | United States | | Int’l |
| Dollars in millions | Dollars in millions | 2021 | | 2020 | Dollars in millions | 2023 | | 2022 |
| Unrecognized actuarial loss, net of tax of $8 and $198, $10 and $240, respectively | $ | 17 | | | $ | 564 | | | $ | 24 | | | $ | 740 | |
| Unrecognized actuarial loss, net of tax of $7 and $221, $8 and $195, respectively | |
| Total in accumulated other comprehensive loss | Total in accumulated other comprehensive loss | $ | 17 | | | $ | 564 | | | $ | 24 | | | $ | 740 | |
Estimated amounts that will be amortized from accumulated other comprehensive income, net of tax, intoThe weighted-average assumptions used to determine net periodic benefit cost in 2022 arewere as follows:
| | | | | | | | | | | |
| Dollars in millions | United States | | Int’l |
| Actuarial loss | $ | 1 | | | $ | 20 | |
| Total | $ | 1 | | | $ | 20 | |
| | | | | | | | | | | | | | | | | | | | | | | | | | | | | | | | | | | |
| |
| United States | | Int'l | | United States | | Int'l | | United States | | Int'l |
| 2023 | | 2022 | | 2021 |
| Discount rate | 4.91 | % | | 5.00 | % | | 2.45 | % | | 1.80 | % | | 2.00 | % | | 1.40 | % |
| Expected return on plan assets | 6.63 | % | | 5.92 | % | | 5.19 | % | | 4.73 | % | | 5.19 | % | | 4.67 | % |
| | | | | | | | | | | | | | | | | | | | | | | | | | | | | | | | | | | |
Weighted-average assumptions used to determine
net periodic benefit cost | |
| United States | | Int'l | | United States | | Int'l | | United States | | Int'l |
| 2021 | | 2020 | | 2019 |
| Discount rate | 2.00 | % | | 1.40 | % | | 2.89 | % | | 2.05 | % | | 3.98 | % | | 2.90 | % |
| Expected return on plan assets | 5.19 | % | | 4.67 | % | | 5.72 | % | | 3.70 | % | | 6.09 | % | | 5.09 | % |
| | Weighted-average assumptions used to determine benefit obligations at measurement date | |
| | United States | | Int'l | | United States | | Int'l |
| | 2021 | | 2020 |
| United States | |
| United States | |
| United States | | | Int'l | | United States | | Int'l |
| 2023 | | | 2023 | | 2022 |
| Discount rate | Discount rate | 2.45 | % | | 1.80 | % | | 2.00 | % | | 1.40 | % | Discount rate | 4.70 | % | | 4.79 | % | | 4.91 | % | | 5.00 | % |
Plan fiduciaries of our retirement plans set investment policies and strategies and oversee the investment direction, which includes selecting investment managers, commissioning asset-liability studies and setting long-term strategic targets. Long-term strategic investment objectives include preserving the funded status of the plan and balancing risk and return and have diversified asset types, fund strategies and fund managers. Targeted asset allocation ranges are guidelines, not limitations and occasionally plan fiduciaries will approve allocations above or below a target range.
The target asset allocation for our U.S. and International plans for 20222024 is as follows:
| | Asset Allocation | 2022 Targeted |
| 2024 Targeted | | | 2024 Targeted |
| | | United States | | Int'l | | United States | | Int'l |
| Equity funds and securities | Equity funds and securities | 52 | % | | 22 | % | Equity funds and securities | 52 | % | | 14 | % |
| Fixed income funds and securities | Fixed income funds and securities | 39 | % | | 53 | % | Fixed income funds and securities | 39 | % | | 67 | % |
| Hedge funds | Hedge funds | — | % | | 7 | % | Hedge funds | — | % | | — | % |
| Real estate funds | Real estate funds | 1 | % | | 5 | % | Real estate funds | 1 | % | | 7 | % |
| Other | Other | 8 | % | | 13 | % | Other | 8 | % | | 12 | % |
| Total | Total | 100 | % | | 100 | % | Total | 100 | % | | 100 | % |
The range of targeted asset allocations for our International plans for 2024 and 2023, by asset class, are as follows:
| | | | | | | | | | | | | | | | | | | | | | | |
| International Plans | 2024 Targeted | | 2023 Targeted |
| | Percentage Range | | Percentage Range |
| | Minimum | | Maximum | | Minimum | | Maximum |
| Equity funds and securities | 11 | % | | 17 | % | | 20 | % | | 50 | % |
| Fixed income funds and securities | 53 | % | | 80 | % | | 30 | % | | 100 | % |
| Hedge funds | — | % | | — | % | | — | % | | 7 | % |
| Real estate funds | 6 | % | | 9 | % | | — | % | | 10 | % |
| Other | 10 | % | | 15 | % | | — | % | | 35 | % |
The range of targeted asset allocations for our InternationalU.S. plans for 20222024 and 2021,2023, by asset class, are as follows:
| | | | | | | | | | | | | | | | | | | | | | | |
| International Plans | 2022 Targeted | | 2021 Targeted |
| | Percentage Range | | Percentage Range |
| | Minimum | | Maximum | | Minimum | | Maximum |
| Equity funds and securities | 20 | % | | 50 | % | | 20 | % | | 50 | % |
| Fixed income funds and securities | 30 | % | | 100 | % | | 35 | % | | 100 | % |
| Hedge funds | — | % | | 7 | % | | — | % | | 7 | % |
| Real estate funds | — | % | | 10 | % | | — | % | | 10 | % |
| Other | — | % | | 34 | % | | — | % | | 34 | % |
The range of targeted asset allocations for our U.S. plans for 2022 and 2021, by asset class, are as follows:
| | Domestic Plans | Domestic Plans | 2022 Targeted | | 2021 Targeted | Domestic Plans | 2024 Targeted | | 2023 Targeted |
| | | Percentage Range | | Percentage Range | | Percentage Range | | Percentage Range |
| | | Minimum | | Maximum | | Minimum | | Maximum | | Minimum | | Maximum | | Minimum | | Maximum |
| | Equity funds and securities | Equity funds and securities | 41 | % | | 62 | % | | 41 | % | | 62 | % |
| Equity funds and securities | |
| Equity funds and securities | | 41 | % | | 62 | % | | 41 | % | | 62 | % |
| Fixed income funds and securities | Fixed income funds and securities | 31 | % | | 47 | % | | 31 | % | | 47 | % | Fixed income funds and securities | 31 | % | | 47 | % | | 31 | % | | 47 | % |
| Real estate funds | Real estate funds | 1 | % | | 1 | % | | 1 | % | | 1 | % | Real estate funds | 1 | % | | 1 | % | | 1 | % | | 1 | % |
| Other | Other | 7 | % | | 10 | % | | 7 | % | | 10 | % | Other | 7 | % | | 10 | % | | 7 | % | | 10 | % |
ASC 820 - Fair Value Measurement addresses fair value measurements and disclosures, defines fair value, establishes a framework for using fair value to measure assets and liabilities and expands disclosures about fair value measurements. This standard applies whenever other standards require or permit assets or liabilities to be measured at fair value. ASC 820 establishes a three-tier value hierarchy, categorizing the inputs used to measure fair value. The inputs and methodology used for valuing securities are not an indication of the risk associated with investing in those securities. The following isRefer to Note 20 "Financial Instruments and Risk Management" for a description of the primary valuation methodologies and classification used for assets measured at fair value.
Fair values of our Level 1 assets are based on observable inputs such as unadjusted quoted prices for identical assets in active markets. These consist of securities valued at the closing price reported on the active market on which the individual securities are traded.
Fair values of our Level 2 assets are based on inputs other than the quoted prices in active markets that are observable either directly or indirectly, such as quoted prices for similar assets; quoted prices that are in inactive markets; inputs other than quoted prices that are observable for the asset; and inputs that are derived principally from or corroborated by observable market data by correlation or other means.
Fair values of our Level 3 assets are based on unobservable inputs in which there is little or no market data and require us to develop our own assumptions.
A summary of total investments for KBR’s defined benefit pension plan assets measured at fair value is presented below.
| | | | Fair Value Measurements at Reporting Date | | Fair Value Measurements at Reporting Date |
| Dollars in millions | Dollars in millions | Total | | Level 1 | | Level 2 | | Level 3 | Dollars in millions | Total | | Level 1 | | Level 2 | | Level 3 |
| Asset Category at December 31, 2021 | | | | | | | |
| Asset Category at December 29, 2023 | |
| United States plan assets | United States plan assets | |
| United States plan assets | |
| United States plan assets | |
| Investments measured at net asset value (a) | |
| Investments measured at net asset value (a) | |
| Investments measured at net asset value (a) | Investments measured at net asset value (a) | $ | 65 | | | $ | — | | | $ | — | | | $ | — | |
| Cash and equivalents | Cash and equivalents | 1 | | | 1 | | | — | | | — | |
| Total United States plan assets | Total United States plan assets | $ | 66 | | | $ | 1 | | | $ | — | | | $ | — | |
| International plan assets | International plan assets | | | | | | | |
| Equities | |
| Equities | |
| Equities | Equities | $ | 88 | | | $ | — | | | $ | — | | | $ | 88 | |
| Fixed income | Fixed income | — | | | — | | | — | | | — | |
| Real estate | Real estate | 1 | | | — | | | — | | | 1 | |
| Cash and cash equivalents | Cash and cash equivalents | 6 | | | 6 | | | — | | | — | |
| Other | Other | 48 | | | — | | | — | | | 48 | |
| Investments measured at net asset value (a) | Investments measured at net asset value (a) | 1,880 | | | — | | | — | | | — | |
| Total international plan assets | Total international plan assets | $ | 2,023 | | | $ | 6 | | | $ | — | | | $ | 137 | |
| Total plan assets at December 31, 2021 | $ | 2,089 | | | $ | 7 | | | $ | — | | | $ | 137 | |
| Total plan assets at December 29, 2023 | |
| | | | | | | | | | | | | | | | | | | | | | | |
| | Fair Value Measurements at Reporting Date |
| Dollars in millions | Total | | Level 1 | | Level 2 | | Level 3 |
| Asset Category at December 31, 2020 | | | | | | | |
| United States plan assets | | | | | | | |
| Investments measured at net asset value (a) | $ | 62 | | | $ | — | | | $ | — | | | $ | — | |
| Cash and equivalents | $ | 2 | | | $ | 2 | | | $ | — | | | $ | — | |
| Total United States plan assets | $ | 64 | | | $ | 2 | | | $ | — | | | $ | — | |
| International plan assets | | | | | | | |
| Equities | $ | 108 | | | $ | — | | | $ | — | | | $ | 108 | |
| Fixed income | 1 | | | — | | | — | | | 1 | |
| Real estate | 2 | | | — | | | — | | | 2 | |
| Cash and cash equivalents | 4 | | | 4 | | | — | | | — | |
| Other | 40 | | | — | | | — | | | 40 | |
| Investments measured at net asset value (a) | 1,806 | | | — | | | — | | | — | |
| Total international plan assets | $ | 1,961 | | | $ | 4 | | | $ | — | | | $ | 151 | |
| Total plan assets at December 31, 2020 | $ | 2,025 | | | $ | 6 | | | $ | — | | | $ | 151 | |
| | | | | | | | | | | | | | | | | | | | | | | |
| | Fair Value Measurements at Reporting Date |
| Dollars in millions | Total | | Level 1 | | Level 2 | | Level 3 |
| Asset Category at December 31, 2022 | | | | | | | |
| United States plan assets | | | | | | | |
| Investments measured at net asset value (a) | $ | 52 | | | $ | — | | | $ | — | | | $ | — | |
| Cash and equivalents | — | | | — | | | — | | | — | |
| Total United States plan assets | $ | 52 | | | $ | — | | | $ | — | | | $ | — | |
| International plan assets | | | | | | | |
| Equities | $ | 60 | | | $ | — | | | $ | — | | | $ | 60 | |
| Fixed income | — | | | — | | | — | | | — | |
| Real estate | 1 | | | — | | | — | | | 1 | |
| Cash and cash equivalents | 31 | | | 31 | | | — | | | — | |
| Other | 52 | | | — | | | — | | | 52 | |
| Investments measured at net asset value (a) | 1,123 | | | — | | | — | | | — | |
| Total international plan assets | $ | 1,267 | | | $ | 31 | | | $ | — | | | $ | 113 | |
| Total plan assets at December 31, 2022 | $ | 1,319 | | | $ | 31 | | | $ | — | | | $ | 113 | |
(a) Certain investments that are measured at fair value using the net asset value per share (or its equivalent) practical expedient have not been classified in the fair value hierarchy. The fair value amounts presented in this table are intended to permit reconciliation of the fair value hierarchy to the amounts presented in the consolidated balance sheet.
The fair value measurement of plan assets using significant unobservable inputs (Level 3) changed each year due to the following:
| | Dollars in millions | Dollars in millions | Total | | Equities | | Fixed Income | | Real Estate | | Other | Dollars in millions | Total | | Equities | | Fixed Income | | Real Estate | | Other |
| International plan assets | International plan assets | | | | | | | | | |
| Balance as of December 31, 2019 | $ | 149 | | | $ | 103 | | | $ | 1 | | | $ | 2 | | | $ | 43 | |
| Return on assets held at end of year | 2 | | | 1 | | | — | | | — | | | 1 | |
| Return on assets sold during the year | 2 | | | — | | | — | | | — | | | 2 | |
| Purchases, sales and settlements | (6) | | | — | | | — | | | — | | | (6) | |
| | Foreign exchange impact | 4 | | | 4 | | | — | | | — | | | — | |
| Balance as of December 31, 2020 | $ | 151 | | | $ | 108 | | | $ | 1 | | | $ | 2 | | | $ | 40 | |
| Balance as of December 31, 2021 | |
| Balance as of December 31, 2021 | |
| Balance as of December 31, 2021 | |
| Return on assets held at end of year | Return on assets held at end of year | (15) | | | (21) | | | — | | | (1) | | 0 | 7 | |
| Return on assets sold during the year | Return on assets sold during the year | 38 | | | 36 | | | — | | | — | | | 2 | |
| Purchases, sales and settlements, net | Purchases, sales and settlements, net | (37) | | | (35) | | | (1) | | | — | | | (1) | |
| | Foreign exchange impact | Foreign exchange impact | — | | | — | | | — | | | — | | | — | |
| Balance as of December 31, 2021 | $ | 137 | | | $ | 88 | | | $ | — | | | $ | 1 | | | $ | 48 | |
| Foreign exchange impact | |
| Foreign exchange impact | |
| Balance as of December 31, 2022 | |
| Return on assets held at end of year | |
| Return on assets sold during the year | |
| Purchases, sales and settlements, net | |
| | Foreign exchange impact | |
| Foreign exchange impact | |
| Foreign exchange impact | |
| Balance as of December 29, 2023 | |
Contributions. Funding requirements for each plan are determined based on the local laws of the country where such plans reside. In certain countries the funding requirements are mandatory while in other countries they are discretionary. We expect to contribute $46$42 million to our pension plans in 2022.2024. On October 17, 2022, we made an advance payment to our U.K. pension plan for approximately £29 million of the £33 million required minimum annual contributions for the year ending December 29, 2023.
Benefit payments. The following table presents the expected benefit payments over the next 10 years.
| | | | | | | | | | | |
| | Pension Benefits |
| Dollars in millions | United States | | Int’l |
| 2022 | $ | 5 | | | $ | 60 | |
| 2023 | $ | 5 | | | $ | 62 | |
| 2024 | $ | 5 | | | $ | 64 | |
| 2025 | $ | 5 | | | $ | 65 | |
| 2026 | $ | 5 | | | $ | 67 | |
| Years 2027 - 2031 | $ | 23 | | | $ | 360 | |
Multiemployer Pension Plans
We participate in multiemployer plans in Canada. Generally, the plans provide defined benefits to substantially all employees covered by collective bargain agreements. Under the terms of these agreements, our obligations are discharged upon plan contributions and are not subject to any assessments for unfunded liabilities upon our termination or withdrawal.
Our aggregate contributions to these plans were immaterial in the years ended December 31, 2021, 2020 and 2019. At December 31, 2021, none of the plans in which we participate is individually significant to our consolidated financial statements. | | | | | | | | | | | |
| | Pension Benefits |
| Dollars in millions | United States | | Int’l |
| 2024 | $ | 6 | | | $ | 65 | |
| 2025 | $ | 5 | | | $ | 67 | |
| 2026 | $ | 5 | | | $ | 70 | |
| 2027 | $ | 5 | | | $ | 72 | |
| 2028 | $ | 5 | | | $ | 74 | |
| Years 2029 - 2033 | $ | 22 | | | $ | 405 | |
Deferred Compensation Plans
Our Elective Deferral Plan is a nonqualified deferred compensation program that provides benefits payable to officers, certain key employees or their designated beneficiaries and non-employee directors at specified future dates, upon retirement, or death. The elective deferral plan is unfunded except for $13 million and $11$12 million of mutual funds designated for a portion of our employee deferral plan included in other assets on our consolidated balance sheets at December 29, 2023 and December 31, 2021 and 2020,2022, respectively. The mutual funds are measured at fair value using Level 1 inputs under ASC 820 and may be liquidated in the near term without restrictions. Our obligations under our employee deferred compensation plan were $64$66 million and $57 million as of December 29, 2023 and December 31, 2021 and 2020,2022, respectively, and are included in employee compensation and benefits in our consolidated balance sheets.
Note 12.11. Debt and Other Credit Facilities
Our outstanding debt consisted of the following at the dates indicated:
| | Dollars in millions | Dollars in millions | December 31, 2021 | | December 31, 2020 | Dollars in millions | December 29, 2023 | | December 31, 2022 |
| | Term Loan A | Term Loan A | 441 | | | 285 | |
| | Term Loan A | |
| | Term Loan A | |
| Term Loan B | Term Loan B | 511 | | | 516 | |
| Convertible Senior Notes | 350 | | | 350 | |
| Senior Notes | Senior Notes | 250 | | | 250 | |
| Senior Credit Facility | 364 | | | 260 | |
| Revolver | |
| Convertible Senior Notes (a) | |
| Unamortized debt issuance costs and discount - Convertible Senior Notes (a) | |
| Unamortized debt issuance costs - Term Loan A | Unamortized debt issuance costs - Term Loan A | (4) | | | (4) | |
| Unamortized debt issuance costs and discount - Term Loan B | Unamortized debt issuance costs and discount - Term Loan B | (13) | | | (16) | |
| Unamortized debt issuance costs and discount - Convertible Senior Notes | (27) | | | (40) | |
| Unamortized debt issuance costs and discount - Senior Notes | Unamortized debt issuance costs and discount - Senior Notes | (4) | | | (5) | |
| Total debt | Total debt | 1,868 | | | 1,596 | |
| Less: current portion | Less: current portion | 16 | | | 12 | |
| Total long-term debt, net of current portion | Total long-term debt, net of current portion | $ | 1,852 | | | $ | 1,584 | |
(a) The settlement and maturity of the Convertible Senior Notes occurred on November 1, 2023. See "Convertible Senior Notes" section below for additional information.
Senior Credit Facility
On November 18, 2021, weWe entered into Amendment No. 5 under8 on February 6, 2023, to our existing Credit Agreement, dated as of April 25, 2018, as amended ("Pro Rata Facilities"Credit Agreement"), consisting of a $1 billion revolving credit facility (the "Revolver"), a $442 million Term Loan A ("Term Loan A") with debt tranches denominated in US dollars, AustralianU.S. dollars and British pound sterling and a $512 million Term Loan B ("Term Loan B"), and together with an aggregate capacity of $1.954 billion. The Amendment, among other things, (i) established an additional tranche of £122.1 million inthe Revolver and Term Loan A, incurred by Kellogg Brown & Root Limited,the "Senior Credit Facility"). Amendment No. 8 (i) replaces the LIBOR-based reference borrowing rate with a wholly owned indirect subsidiarySOFR-based reference borrowing rate for the U.S. dollar tranche of KBR, Inc., organized under the laws of England and Wales, (ii) increased capacity and flexibility under certain negative covenants, (iii) permits the netting of unrestricted cash up to a specified cap for purposes of calculating the leverage ratio and (iv) reduced the interest rate payable for applicable margins and commitment fees and extended the maturity dates to November 2026 for Term Loan A and the Revolver and (ii) implements the Company’s recent fiscal year change from a calendar year ending on December 31 to a 52-53 week year ending on the Friday closest to December 31, effective beginning with fiscal year 2023.
We entered into Amendment No. 9 to our Credit Agreement on June 6, 2023. Amendment No. 9 replaces the LIBOR-based reference borrowing rate with a SOFR-based reference borrowing rate for Term Loan B. We entered into Amendment
No. 10 to our Credit Agreement on July 26, 2023. Amendment No. 10 provided for an additional $200 million loan tranche under Term Loan A. We borrowed the full $200 million principal amount available under this additional loan tranche, and this $200 million borrowing was applied as a partial repayment of the outstanding amounts of principal and accrued interest under the Revolver.
We had borrowings of $785 million and repayments of $340 million on our Senior Credit Facility that occurred during the year ended December 29, 2023. The borrowings on our Senior Credit Facility were primarily related to funding our repurchase and maturity of Convertible Senior Notes in 2023 and our termination of outstanding warrants in 2023. See Note 22 "Cash Election and Repurchase of Convertible Notes and Warrant Unwind Agreements" for additional information.
We entered into Amendment No.11 to our Credit Agreement on January 19, 2024. This amendment provides for an incremental Term Loan B facility in an aggregate principal amount of $1 billion and extends the Term Loan B maturity date to January 2031. We borrowed the full $1 billion principal amount available under this loan and primarily used the proceeds to repay all amounts of outstanding principal and accrued interest under the Company’s Term Loan B facility at December 29, 2023 and to partially repay outstanding principal and accrued interest under the Company’s Revolver. TheWe entered into Amendment No.12 to our Credit Agreement on February 7, 2024. This amendment consolidated the USD denominated Term A-1, Term A-2 and Term A-4 loan facilities under our Credit Agreement into the amended USD denominated Term A-1 loan facility and continued the GBP denominated Term A-3 loan facility outstanding at December 29, 2023. Additionally, this amendment extended the maturity date of the $1 billion Revolver, amended Term A-1 loan facility and Term A-3 loan facility to February 2029. Immediately following execution of Amendment No. 12, we had approximately $500 million outstanding related to the remaining Term Loan B remained unchanged maturing February 2027.A facilities and $117 million outstanding on our Revolver.
The interest rates with respect to the Revolver and Term Loan A are based on, at the Company's option, the respectiveapplicable adjusted reference rate plus an additional margin or base rate plus additional margin. The interest rate with respect to the Term Loan B is LIBORSOFR plus 2.75%. plus an additional margin, per annum. Additionally, there is a commitment fee with respectapplicable to available amounts under the Revolver.
The details of the applicable margins and commitment fees under the amended Senior Credit Facility are based on the Company's consolidated net leverage ratio as follows:
| | | | | | | | | | | | | | | | | | | | | | |
| | Revolver and Term Loan A | | | | |
| Consolidated Net Leverage Ratio | | Reference Rate (a) | | Base Rate | | | | Commitment Fee |
| Greater than or equal to 4.25 to 1.00 | | 2.25 | % | | 1.25 | % | | | | 0.33 | % |
| Less than 4.25 to 1.00 but greater than or equal to 3.25 to 1.00 | | 2.00 | % | | 1.00 | % | | | | 0.30 | % |
| Less than 3.25 to 1.00 but greater than or equal to 2.25 to 1.00 | | 1.75 | % | | 0.75 | % | | | | 0.28 | % |
| Less than 2.25 to 1.00 but greater than or equal to 1.25 to 1.00 | | 1.50 | % | | 0.50 | % | | | | 0.25 | % |
| Less than 1.25 to 1.00 | | 1.25 | % | | 0.25 | % | | | | 0.23 | % |
(a)The reference rate for the Revolver and the U.S. dollar tranchetranches of Term Loan A is LIBOR, the Australian dollar tranche is BBSYSOFR plus 10 bps Credit Spread Adjustment and the British pound sterling tranche is SONIA.SONIA plus 12 bps Credit Spread Adjustment
The Term Loan A provides for quarterly principal payments of 0.625% of the aggregate principal amount commencingthat commenced with the fiscal quarter endingended March 31, 2022, increasing to 1.25% starting with the quarter ending March 31,29, 2024. The Term Loan B provides for quarterly principal payments of 0.25% of the initial aggregate principal amounts commencingthat commenced with the fiscal quarter endingended June 30, 2020. Term Loan A and the Revolver mature in February 2029 and Term Loan B matures in January 2031.
The Senior Credit Facility contains financial covenants of a maximum consolidated net leverage ratio and a consolidated interest coverage ratio (as such terms are defined in the Senior Credit Facility). Our consolidated net leverage ratio as of the last day of any fiscal quarter may not exceed 4.50 to 1 through 2022, reducing to 4.25 to 1 in 2023 and 4.00 to 1 in 2024 and thereafter. Our consolidated interest coverage ratio may not be less than 3.00 to 1 as of the last day of any fiscal quarter. As of December 31, 2021,29, 2023, we were in compliance with our financial covenants related to our debt agreements.
Convertible Senior Notes
Convertible Senior Notes. On November 15, 2018, we issued and sold $350 million of 2.50% Convertible Senior Notes due 2023 (the "Convertible Notes") pursuant to an indenture between us and Citibank, N.A., as trustee. The Convertible Notes arewere senior unsecured obligations and bearbore interest at 2.50% per year, and interest iswas payable on May 1 and November 1 of each year. The Convertible Notes mature on November 1, 2023 and may not be redeemed by us prior to maturity.
The Convertible Notes are convertible intoIn April 2023, we elected cash shares of our common stock or a combination of cash and shares of our common stock, at our election. It is our current intent and policyas the settlement method to settle the principal balance of the Convertible Notes in cash at our election, and any excess value upon early conversion in shares of our common stock. The initial conversion priceor maturity of the Convertible Notes is approximately $25.51 (subjectNotes. On June 1, 2023, we entered into privately negotiated transactions to adjustmentrepurchase $100 million in certain circumstances), based on the initial conversion rate of 39.1961 Common Shares per $1,000 principal amount of the outstanding Convertible Notes. PriorNotes (the “Convertible Notes repurchase”), using funds borrowed under our Revolver to May 1, 2023,pay the purchase price. Concurrent with the Convertible Notes will be convertible only uponrepurchase, we entered into agreements with the occurrenceoption counterparties to terminate the corresponding portions of certain eventsthe Note Hedge Transactions and during certain periods,Warrant Transactions (collectively, the "Unwind Agreements"). See Note 22 "Cash Election and thereafter, until the closeRepurchase of business on the second scheduled trading day immediately preceding the maturity date. Convertible Notes and Warrant Unwind Agreements" for additional information regarding these transactions.
On November 10, 2021,August 23, 2023, we declared a quarterly cash dividend of $0.11$0.135 per Common Share, which exceeded our per share dividend threshold and adjusted the conversion rate to 39.452439.6890 Common Shares per $1,000 principal amount of Convertible Notes at a strike price of $25.35. The impact of dilution on our earnings per share from Convertible Notes is measured using$25.20. This was the “treasury stock method”. As of December 31, 2021, the "if-converted" valueconversion rate upon maturity of the Convertible Notes exceeded the $350 million principal amount by approximately $308 million.
The net carrying value of the equity component related to the Convertible Senior Notes was $57 million as of December 31, 2021 and 2020. The amount of interest cost recognized relating to the contractual interest coupon was $9 million for the years ended December 31, 2021, 2020 and 2019, respectively. The amortization of the discount and debt issuance costs was $14 million, $13 million and $12 million for the years ended December 31, 2021, 2020 and 2019, respectively. The effective interest rate on the liability component was 6.50% for the years ended December 31, 2021 and 2020.November 1, 2023.
Convertible Notes Call Spread Overlay. Concurrent with the issuance of the Convertible Notes, we entered into privately negotiated convertible note hedge transactions (the "Note Hedge Transactions") and warrant transactions (the "Warrant Transactions") with the option counterparties. These transactions represent a call spread overlay, whereby the cost of the Note Hedge Transactions we purchased to cover the cash outlay upon conversion of the Convertible Notes was reduced by the sales price of the Warrant Transactions. EachSee Note 22 "Cash Election and Repurchase of these transactions is described below.Convertible Notes and Warrant Unwind Agreements" for information regarding the unwind agreements for our outstanding warrants. No warrants were outstanding as of December 29, 2023.
The Note Hedge Transactions cost an aggregate of $62 million and are expected generally to reduce the potential dilution of common stock and/or offset the cash payments we are required to make in excess of the principal amount upon conversion of the Convertible Notes in the event that the market price of our common stock is greater than the strike price of the Note Hedge Transactions, which was initially $25.51 (subject to adjustment), corresponding approximately to the initial conversion price of the Convertible Notes. The Note Hedge Transactions were accounted for by recording the cost as a reduction to PIC based on the Note Hedge Transactions meeting certain scope exceptions provided under ASC Topic 815.
We received proceeds of $22 million for the Warrant Transactions, in which we sold net-share-settled warrants to the option counterparties in an amount equal to the number of shares of our common stock initially underlying the Convertible Notes, subject to customary anti-dilution adjustments. The original strike price of the warrants was $40.02 per share. The updated strike price as of December 31, 2021 was $39.76. The Warrant Transactions could have a dilutive effect to our stockholders to the extent the market price per share of our common stock, as measured under the terms of the Warrant Transactions, exceeds the applicable strike price of the warrants. The Warrant Transactions have been accounted for by recording the proceeds received as PIC.
The Note Hedge Transactions and the Warrant Transactions arewere separate transactions, in each case entered into by us with the option counterparties, and arewere not part of the terms of the Convertible Notes and willdid not affect any holder's rights under the Convertible Notes.Notes.
Convertible Notes Maturity. The Convertible Notes matured November 1, 2023, and were settled in cash for $593 million of which $250 million related to the remaining principal and $343 million related to the value of the conversion option. Concurrently with the maturity of the Convertible Notes, the Note Hedge Transactions were settled with payments to the Company totaling $343 million. The aggregate cash conversion consideration of $593 million was fulfilled with proceeds received from Note Hedge Transactions totaling $343 million, a $200 million borrowing on our Revolver and $50 million in available cash. Prior to maturity and settlement on November 1, 2023, any changes related to the fair value of the derivative asset were directly offset by the change in fair value of the embedded derivative liability. No amounts were recognized on our statement of operations as a result of the maturity of the Convertible Notes on November 1, 2023.
Senior Notes
On September 30, 2020, we issued and sold $250 million aggregate principal amount of 4.750% Senior Notes due 2028 (the "Senior Notes") pursuant to an indenture among us, the guarantors party thereto and Citibank, N.A., as trustee. The Senior Notes are senior unsecured obligations and are fully and unconditionally guaranteed by each of our existing and future domestic subsidiaries that guarantee our obligations under the Senior Credit Facility and certain other indebtedness. The net proceeds from the offering were approximately $245 million, after deducting fees and estimated offering expenses and were used to finance a portion of the purchase price for the acquisition of Centauri and pay related fees and expenses. Interest is payable semi-annually in arrears on March 30 and September 30 of each year, beginning on March 30, 2021, and the principal is due on September 30, 2028.
At any time prior to September 30, 2023, we may redeemcould have redeemed all or part of the Senior Notes at a redemption price equal to 100% of the principal amount of the Senior Notes redeemed, plus accrued and unpaid interest, if any, to (but not including) the redemption date, plus a specified “make-whole premium.” On or after September 30, 2023, we may redeem all or part of the Senior Notes at our option, at the redemption prices set forth in the Senior Notes, plus accrued and unpaid interest, if any, to (but not including) the redemption date. At any time prior to September 30, 2023, we may redeemcould have redeemed up to 35% of the original aggregate principal amount of the Senior Notes with the net cash proceeds of certain equity offerings at a redemption price equal to 104.750% of the principal amount of the Senior Notes, together with accrued and unpaid interest, if any, to (but not including) the redemption date. If we undergo a change of control, we may be required to make an offer to
holders of the Senior Notes to repurchase all of the Senior Notes at a purchase price equal to 101% of the principal amount thereof, plus accrued and unpaid interest.
Letters of credit, surety bonds and guarantees
In connection with certain projects, we are required to provide letters of credit, surety bonds or guarantees to our customers in the ordinary course of business as credit support for contractual performance guarantees, advanced payments received from customers and future funding commitments. As of December 31, 2021,29, 2023, we had $1 billion in a committed line of credit on the Revolver under theour Senior Credit Facility and $522$392 million of bilateral and uncommitted lines of credit to support the issuance of letters of credit. As of December 31, 2021,29, 2023, with respect to our Senior Credit Facility,Revolver, we had $364$505 million of outstanding borrowings previously issued to fund the acquisitions of Centauri and Frazer-Nash and $48borrowings. We also have $14 million of outstanding letters of credit.credit on our Senior Credit Facility. With respect to our $522$392 million of bilateral and uncommitted lines of credit, we had utilized $229$298 million for letters of credit as of December 31, 2021.29, 2023. The total remaining capacity of these committed and uncommitted lines of credit was approximately $880$575 million. Of the letters of credit outstanding under the Senior Credit Facility, none have expiry dates beyond the maturity date of the Senior Credit Facility. Of the total letters of credit outstanding $85under our bilateral facilities, $83 million relate to our joint venture operations where the letters of credit are posted using our capacity to support our pro-rata share of obligations under various contracts executed by joint ventures of which we are a member.
We may also guarantee that a project, once completed, will achieve specified performance standards. If the project subsequently fails to meet guaranteed performance standards, we may incur additional costs, pay liquidated damages or be held responsible for the costs incurred by the client to achieve the required performance standards. The potential amount of future payments that we could be required to make under an outstanding performance arrangement is typically the remaining estimated cost of work to be performed by or on behalf of third parties. Amounts that may be required to be paid in excess of the estimated costs to complete contracts in progress are not estimable. For cost reimbursable contracts, amounts that may become payable pursuant to guarantee provisions are normally recoverable from the client for work performed under the contract. For lump-sum or fixed-price contracts, the performance guarantee amount is the cost to complete the contracted work, less amounts remaining to be billed to the client under the contract. Remaining billable amounts could be greater or less than the cost to complete the project. If costs exceed the remaining amounts payable under the contract, we may have recourse to third parties, such as owners, subcontractors or vendors for claims.
In our joint venture arrangements, the liability of each partner is usually joint and several. This means that each joint venture partner may become liable for the entire risk of performance guarantees provided by each partner to the customer. Typically, each joint venture partner indemnifies the other partners for any liabilities incurred in excess of the liabilities the other party is obligated to bear under the respective joint venture agreement. We are unable to estimate the maximum potential amount of future payments that we could be required to make under outstanding performance guarantees related to joint venture projects due to a number of factors, including but not limited to the nature and extent of any contractual defaults by our joint
venture partners, resource availability, potential performance delays caused by the defaults, the location of the projects and the terms of the related contracts.
Nonrecourse Project Debt
Fasttrax Limited, a consolidated joint venture in which we indirectly own a 50% equity interest with an unrelated partner, was awarded a concession contract in 2001 with the U.K. MoD to provide a Heavy Equipment Transporter Service to the British Army. Fasttrax Limited operates and maintains 91 HETs for a term of 22 years. The purchase of the HETs by the joint venture was financed through two series of bonds secured by the assets of Fasttrax Limited and subordinated debt from the joint venture partners. The secured bonds are an obligation of Fasttrax Limited and are not a debt obligation of KBR as they are nonrecourse to the joint venture partners. Accordingly, in the event of a default on the notes, the lenders may only look to the assets of Fasttrax Limited for repayment.
The secured bonds were issued in two classes consisting of Class A 3.5% Index Linked Bonds in the amount of £56.0 million and Class B 5.9% Fixed Rate Bonds in the amount of £20.7 million. Semi-annual payments on both classes of bonds continued through maturity in March 2021. The subordinated notes payable to each of the partners initially bear interest at 11.25% increasing to 16.00% over the term of the notes until maturity in 2025. For financial reporting purposes, only our partner's portion of the subordinated notes appears in the consolidated financial statements.
The following table summarizes the combined principal installments for both classes of bonds and subordinated notes, including inflation adjusted bond indexation, until maturity in 2025 as of December 31, 2021:
| | | | | |
| Dollars in millions | Payments Due |
| 2022 | $ | 1 | |
| 2023 | $ | — | |
| 2024 | $ | 1 | |
| 2025 | $ | — | |
| |
| |
Note 13.12. Income Taxes
The United States and foreign components of income (loss) before income taxes and noncontrolling interests were as follows:
| | | | | | | | | | | | | | | | | |
| Years ended December 31, |
| Dollars in millions | 2021 | | 2020 | | 2019 |
| United States | $ | 165 | | | $ | (208) | | | $ | 2 | |
| Foreign: | | | | | |
| United Kingdom | 56 | | | 76 | | | 105 | |
| Australia | (199) | | | 37 | | | 15 | |
| Canada | (2) | | | (2) | | | 3 | |
| Middle East | 39 | | | 69 | | | 87 | |
| Africa | 3 | | | 4 | | | 5 | |
| Other | 72 | | | (1) | | | 51 | |
| Subtotal | (31) | | | 183 | | | 266 | |
| Total | $ | 134 | | | $ | (25) | | | $ | 268 | |
| | | | | | | | | | | | | | | | | |
| Years ended, |
| December 29, | | December 31, | | December 31, |
| Dollars in millions | 2023 | | 2022 | | 2021 |
| United States | $ | (465) | | | $ | 138 | | | $ | 177 | |
| Foreign: | | | | | |
| United Kingdom | 133 | | | 161 | | | 56 | |
| Australia | 49 | | | (103) | | | (199) | |
| Canada | 1 | | | — | | | (2) | |
| Middle East | 45 | | | 16 | | | 39 | |
| Africa | 6 | | | 7 | | | 3 | |
| Other | 65 | | | 65 | | | 72 | |
| Subtotal | 299 | | | 146 | | | (31) | |
| Total | $ | (166) | | | $ | 284 | | | $ | 146 | |
The total income taxes included in the statements of operations and in shareholders' equity were as follows:
| | | | Years ended December 31, | | Years ended, |
| December 29, | | | December 29, | | December 31, |
| Dollars in millions | Dollars in millions | 2021 | | 2020 | | 2019 | Dollars in millions | 2023 | | 2022 | | 2021 |
| (Provision) benefit for income taxes | $ | (108) | | | $ | (26) | | | $ | (59) | |
| Provision for income taxes | |
| Shareholders' equity, foreign currency translation adjustment | Shareholders' equity, foreign currency translation adjustment | (1) | | | 1 | | | 1 | |
| Shareholders' equity, pension and post-retirement benefits | Shareholders' equity, pension and post-retirement benefits | (44) | | | 26 | | | 11 | |
| Shareholders' equity, changes in fair value of derivatives | Shareholders' equity, changes in fair value of derivatives | (7) | | | 3 | | | 2 | |
| Total income taxes | Total income taxes | $ | (160) | | | $ | 4 | | | $ | (45) | |
The components of the provision for income taxes were as follows:
| | | | | | | | | | | | | | | | | |
| Dollars in millions | Current | | Deferred | | Total |
| Year ended December 31, 2021 | | | | | |
| Federal | $ | (1) | | | $ | (24) | | | $ | (25) | |
| Foreign | (49) | | | (22) | | | (71) | |
| State and other | (15) | | | 3 | | | (12) | |
| Provision for income taxes | $ | (65) | | | $ | (43) | | | $ | (108) | |
| | | | | |
| Year ended December 31, 2020 | | | | | |
| Federal | $ | — | | | $ | 29 | | | $ | 29 | |
| Foreign | (62) | | | 11 | | | (51) | |
| State and other | (4) | | | — | | | (4) | |
| (Provision) benefit for income taxes | $ | (66) | | | $ | 40 | | | $ | (26) | |
| | | | | |
| Year ended December 31, 2019 | | | | | |
| Federal | $ | (4) | | | $ | 15 | | | $ | 11 | |
| Foreign | (67) | | | 1 | | | (66) | |
| State and other | (2) | | | (2) | | | (4) | |
| (Provision) benefit for income taxes | $ | (73) | | | $ | 14 | | | $ | (59) | |
| | | | | | | | | | | | | | | | | |
| Dollars in millions | Current | | Deferred | | Total |
| Year ended December 29, 2023 | | | | | |
| Federal | $ | — | | | $ | (3) | | | $ | (3) | |
| Foreign | (65) | | | (14) | | | (79) | |
| State and other | (17) | | | 4 | | | (13) | |
| Provision for income taxes | $ | (82) | | | $ | (13) | | | $ | (95) | |
| | | | | |
| Year ended December 31, 2022 | | | | | |
| Federal | $ | (10) | | | $ | (7) | | | $ | (17) | |
| Foreign | (36) | | | (26) | | | (62) | |
| State and other | (9) | | | (4) | | | (13) | |
| Provision for income taxes | $ | (55) | | | $ | (37) | | | $ | (92) | |
| | | | | |
| Year ended December 31, 2021 | | | | | |
| Federal | $ | (1) | | | $ | (28) | | | $ | (29) | |
| Foreign | (49) | | | (22) | | | (71) | |
| State and other | (14) | | | 3 | | | (11) | |
| Provision for income taxes | $ | (64) | | | $ | (47) | | | $ | (111) | |
The components of our total foreign income tax provision were as follows:
| | | | Years ended December 31, | | Years ended, |
| December 29, | | | December 29, | | December 31, |
| Dollars in millions | Dollars in millions | 2021 | | 2020 | | 2019 | Dollars in millions | 2023 | | 2022 | | 2021 |
| United Kingdom | United Kingdom | $ | (22) | | | $ | (14) | | | $ | (19) | |
| Australia | Australia | (23) | | | (6) | | | (6) | |
| Canada | — | | | (1) | | | (1) | |
| | Middle East | Middle East | (9) | | | (18) | | | (20) | |
| Africa | — | | | — | | | (1) | |
| Middle East | |
| Middle East | |
| | Other | |
| Other | |
| Other | Other | (17) | | | (12) | | | (19) | |
| Foreign provision for income taxes | Foreign provision for income taxes | $ | (71) | | | $ | (51) | | | $ | (66) | |
Our effective tax rates on income from operations differed from the statutory U.S. federal income tax rate of 21% as a result of the following:
| | Years ended December 31, |
| 2021 | | 2020 | | 2019 |
| Years ended, | | | Years ended, |
| December 29, | | | December 29, | | December 31, |
| 2023 | | | 2023 | | 2022 | | 2021 |
| U.S. statutory federal rate, expected (benefit) provision | U.S. statutory federal rate, expected (benefit) provision | 21 | % | | 21 | % | | 21 | % | U.S. statutory federal rate, expected (benefit) provision | 21 | % | | 21 | % | | 21 | % |
| Increase (reduction) in tax rate from: | Increase (reduction) in tax rate from: | |
| Tax impact from foreign operations | |
| Tax impact from foreign operations | |
| Tax impact from foreign operations | Tax impact from foreign operations | — | % | | 2 | % | | 7 | % | 2 | % | | 1 | % | | — | % |
| Noncontrolling interests and equity earnings | Noncontrolling interests and equity earnings | 41 | % | | (3) | % | | — | % | Noncontrolling interests and equity earnings | (1) | % | | 8 | % | | 38 | % |
| State and local income taxes, net of federal benefit | State and local income taxes, net of federal benefit | 2 | % | | — | % | | 2 | % | State and local income taxes, net of federal benefit | 2 | % | | 2 | % | | 2 | % |
| Other permanent differences, net | Other permanent differences, net | 5 | % | | 4 | % | | 3 | % | Other permanent differences, net | 5 | % | | 4 | % | | 4 | % |
| Contingent liability accrual | 1 | % | | 2 | % | | 1 | % |
| Other non-deductible expenditures | | Other non-deductible expenditures | — | % | | 2 | % | | 1 | % |
| U.S. taxes on foreign unremitted earnings | U.S. taxes on foreign unremitted earnings | 1 | % | | (1) | % | | 3 | % | U.S. taxes on foreign unremitted earnings | — | % | | — | % | | 1 | % |
| Change in valuation allowance | (4) | % | | — | % | | (10) | % |
| Change in federal and foreign valuation allowance | | Change in federal and foreign valuation allowance | (3) | % | | (2) | % | | (4) | % |
| Research and development credits, net of provision | Research and development credits, net of provision | — | % | | — | % | | (5) | % | Research and development credits, net of provision | — | % | | (6) | % | | — | % |
| Non-deductible goodwill and restructuring charges | — | % | | (130) | % | | — | % |
| Release of previously reserved position | | Release of previously reserved position | (2) | % | | — | % | | — | % |
| U.K. statutory rate change | U.K. statutory rate change | 14 | % | | — | % | | — | % | U.K. statutory rate change | — | % | | 2 | % | | 13 | % |
| Non-Deductible portion associated with legal settlement of legacy matter | | Non-Deductible portion associated with legal settlement of legacy matter | (11) | % | | — | % | | — | % |
| Non-Deductible portion of Charges associated with Convertible Notes | | Non-Deductible portion of Charges associated with Convertible Notes | (70) | % | | — | % | | — | % |
| Effective tax rate on income from operations | Effective tax rate on income from operations | 81 | % | | (105) | % | | 22 | % | Effective tax rate on income from operations | (57) | % | | 32 | % | | 76 | % |
|
The primary components of our deferred tax assets and liabilities were as follows:
| | | | Years ended December 31, | | Years ended, |
| December 29, | | | December 29, | | December 31, |
| Dollars in millions | Dollars in millions | 2021 | | 2020 | Dollars in millions | 2023 | | 2022 |
| Deferred tax assets: | Deferred tax assets: | | | |
| Employee compensation and benefits | |
| Employee compensation and benefits | |
| Employee compensation and benefits | Employee compensation and benefits | $ | 88 | | | $ | 149 | |
| Foreign tax credit carryforwards | Foreign tax credit carryforwards | 200 | | | 243 | |
| | Loss carryforwards | Loss carryforwards | 111 | | | 105 | |
| Other credit carryforwards | 27 | | | 31 | |
| Loss carryforwards | |
| Loss carryforwards | |
| Research and development and other credit carryforwards | |
| Insurance accruals | Insurance accruals | 10 | | | 8 | |
| Allowance for bad debt | 4 | | | 4 | |
| Allowance for credit losses | |
| Lease obligation and accrued liabilities | Lease obligation and accrued liabilities | 82 | | | 82 | |
| Contract liabilities | Contract liabilities | 35 | | | 7 | |
| Capitalized research expenditures | |
| Other | Other | 56 | | | 67 | |
| Total gross deferred tax assets | Total gross deferred tax assets | 613 | | | 696 | |
| Valuation allowances | Valuation allowances | (204) | | | (220) | |
| Net deferred tax assets | Net deferred tax assets | 409 | | | 476 | |
| Deferred tax liabilities: | Deferred tax liabilities: | |
| | Right-of-use assets | Right-of-use assets | (37) | | | (37) | |
| | Right-of-use assets | |
| | Right-of-use assets | |
| Intangible amortization | Intangible amortization | (103) | | | (80) | |
| Indefinite-lived intangible amortization | Indefinite-lived intangible amortization | (72) | | | (60) | |
| Other | Other | (41) | | | (28) | |
| Total gross deferred tax liabilities | Total gross deferred tax liabilities | (253) | | | (205) | |
| Deferred income tax (liabilities) assets, net | Deferred income tax (liabilities) assets, net | $ | 156 | | | $ | 271 | |
The valuation allowance for deferred tax assets was $204$148 million and $220$217 million at December 29, 2023 and December 31, 2021 and 2020,2022, respectively. The net change in the total valuation allowance was a decrease of $16$69 million in 20212023 and an increase of $20$13 million in 2020. In 2021, KBR saw the benefit of a decrease2022. The change in our valuation allowance associated with the ability to utilize foreign tax credits, while the movement in the 2020 balance2023 was mainly driven by a build-up in our stateproposed net operating losses.loss amendments on previously filed state income tax returns and the utilization of previously valued foreign tax credits in the U.S.
The valuation allowance balance at December 31, 2021 was29, 2023 is primarily related to foreign tax credit carryforwards and foreign and state net operating loss carryforwards that, in the judgment of management, are not more likely than not to be realized. In
assessing the realizability of deferred tax assets, management considers whether it is more likely than not that some portion or all of the deferred tax assets will not be realized. The ultimate realization of deferred tax assets is dependent on the generation of future taxable income during the periods in which those temporary differences become deductible. Management considers the scheduled reversal of deferred tax liabilities (including the impact of available carryback and carryforward periods), income available from carryback years, projected future taxable income and tax-planning strategies in making this assessment.
We believe there is a reasonable possibility that within the next 12 months sufficient positive evidence may become available to allow us to conclude that a significant portion of the valuation allowance will no longer be needed. The release of the valuation allowance could result in a decrease to income tax expense. The timing of any release is dependent upon the potential HomeSafe contract booking.
Income related to the U.S. branches totaled $94 million, $56 million $68 million and $90$56 million for the fiscal years 2021, 2020,2023, 2022, and 2019,2021, respectively, and is included in the foreign component of income in the notes to theour consolidated financial statements in our Form 10-K.statements.
The total income (loss) related to the U.S., inclusive of branches and exclusive of non-recurring restructuringcharges associated with Convertible Notes and impairment charges,the legal settlement of a legacy matter, totaled $92$267 million, ($26)$194 million and $221 million for the fiscal years 2021, 2020,2023, 2022, and 2019,2021, respectively.
We concluded that future taxable income and the reversal of deferred tax liabilities excluding those associated with indefinite-lived intangible assets, were the only sources of taxable income available in determining the amount of valuation allowance to be recorded against our deferred tax assets. The deferred tax liabilities we relied on are projected to reverse in the same jurisdiction and are of the same character as the temporary differences that gave rise to the deferred tax assets. The deferred tax liabilities are projected to reverse in the same periods as the deferred tax assets and are projected to reverse beginning in fiscal year 20222024 through fiscal year 2030.2029. We estimated future
taxable income by jurisdiction exclusive of reversing temporary differences and carryforwards and applied our foreign tax credit carryforwards based on the sourcing and character of those estimates and considered any limitations.
Our ability to utilize the unreserved foreign tax credit carryforwards is based on our ability to generate future taxable income from foreign sources of at least $662$333 million prior to their expiration whereas our ability to utilize other net deferred tax assets exclusive of those associated with indefinite-lived intangible assets is based on our ability to generate U.S. forecastedfuture taxable income of at least $610$933 million. While our current projections of taxable income exceed these amounts, changes in our forecasted taxable income in the applicable taxing jurisdictions within the carryforward periods could affect the ultimate realization of deferred tax assets and our valuation allowance.
The net deferred tax balance by major jurisdiction after valuation allowance as of December 31, 202129, 2023 was as follows:
| | Dollars in millions | Dollars in millions | Net Gross Deferred Asset (Liability) | | Valuation Allowance | | Deferred Asset (Liability), net | Dollars in millions | Net Gross Deferred Asset (Liability) | | Valuation Allowance | | Deferred Asset (Liability), net |
| United States | United States | $ | 362 | | | $ | (166) | | | $ | 196 | |
| United Kingdom | United Kingdom | (61) | | | — | | | (61) | |
| Australia | Australia | 11 | | | — | | | 11 | |
| Canada | Canada | 22 | | | (21) | | | 1 | |
| Other | Other | 26 | | | (17) | | | 9 | |
| Total | Total | $ | 360 | | | $ | (204) | | | $ | 156 | |
At December 31, 2021,29, 2023, the amount of gross tax attributes available prior to the offset with related uncertain tax positions were as follows:
| | | | | | | | | | | |
| |
| Dollars in millions | December 31, 202129, 2023 | | Expiration |
| Foreign tax credit carryforwards | $ | 200118 | | | 2022-20292024-2029 |
| Foreign net operating loss carryforwards | $ | 129118 | | | 2022-20412024-2043 |
| Foreign net operating loss carryforwards | $ | 4124 | | | Indefinite |
| State net operating loss carryforwards | $ | 1,388830 | | | Various |
| Research and development and other credit carryforwards | $ | 64 | | | 2024-2043 |
As a result of the enactment of the U.S. Tax Cuts and Jobs Act in December 2017, substantially all of our previously untaxedWe provide for taxes on accumulated and current E&P on certain foreign subsidiaries. As of certainDecember 29, 2023, the cumulative amount of ourpermanently reinvested foreign subsidiaries wereearnings is $2.1 billion. These previously unremitted earnings have been subject to U.S. tax.Repatriations of However, these foreignundistributed earnings will notcould be subject to additional U.S. tax but may incur withholdingtaxes (withholding and/or state taxes.Althoughtaxes) if remitted, or deemed remitted, as a dividend. The tax effects of remitting earnings, if any, are recognized when we have provided for taxesplan on our previously untaxed accumulated and current E&P of certain of our foreign subsidiaries pursuant to the Tax Act, weremitting these earnings. We consider our future U.S. and non-U.S. cash needs such as 1) our anticipated foreign working capital requirements, including funding of our U.K. pension plan, 2) the expected growth opportunities across all geographical markets and 3) our plans to invest in strategic growth opportunities that may include acquisitions around the world. As
The Organization for Economic Co-operation and Development (OECD) has a framework to implement a global minimum corporate tax of 15% for companies with global revenues and profits above certain thresholds (referred to as Pillar 2), with certain aspects of Pillar 2 effective January 1, 2024 and other aspects effective January 1, 2025. While it is uncertain whether the U.S. will enact legislation to adopt Pillar 2, certain countries in which we operate have adopted legislation, and other countries are in the process of introducing legislation to implement Pillar 2. We do not expect Pillar 2 to have a material impact on our effective tax rate or our consolidated results of operation, financial position, and cash flows.
The Inflation Reduction Act was signed into law by the President on August 16, 2022, which enacts a 15% corporate minimum tax effective in 2023 for C-Corporations with book profits greater than $1 billion and imposes a 1% tax on the fair market value of stock repurchases by a publicly traded U.S. corporation after December 31, 2021,2022, which will be accounted for separately from income taxes when incurred. The Inflation Reduction Act also creates or extends certain tax-related energy incentives. KBR currently does not expect the cumulative amount of permanently reinvested foreign earnings is $2.3 billion. With the enactmenttax-related provision of the TaxInflation Reduction Act these previously unremitted earningsto have now been subject to U.S. tax. However, these undistributed earnings could be subject to additional taxes (withholding and/or state taxes) if remitted, or deemed remitted, as a dividend.material impact on our financial results.
A reconciliation of the beginning and ending amount of total unrecognized tax benefits is as follows:
| | Dollars in millions | Dollars in millions | 2021 | | 2020 | | 2019 | Dollars in millions | 2023 | | 2022 | | 2021 |
| Balance at January 1, | Balance at January 1, | $ | 96 | | | $ | 97 | | | $ | 90 | |
| Increases related to current year tax positions | Increases related to current year tax positions | — | | | 1 | | | 2 | |
| | Increases related to prior year tax positions | Increases related to prior year tax positions | — | | | 6 | | | 7 | |
| Increases related to prior year tax positions | |
| Increases related to prior year tax positions | |
| Decreases related to prior year tax positions | Decreases related to prior year tax positions | (4) | | | (7) | | | — | |
| Settlements | Settlements | — | | | — | | | — | |
| Lapse of statute of limitations | Lapse of statute of limitations | (2) | | | (3) | | | (1) | |
| Other, primarily due to exchange rate fluctuations affecting non-U.S. tax positions | Other, primarily due to exchange rate fluctuations affecting non-U.S. tax positions | (1) | | | 2 | | | (1) | |
| Balance at December 31, | $ | 89 | | | $ | 96 | | | $ | 97 | |
| Ending Balance | |
The total amount of unrecognized tax benefits that, if recognized, would affect our effective tax rate was approximately $75$60 million as of December 31, 2021.29, 2023. The difference between this amount and the amounts reflected in the tabular reconciliation above relates primarily to deferred income tax benefits on uncertain tax positions. In the next twelve months, it is reasonably possible that our uncertain tax positions could change by approximately $21$16 million due to settlements with tax authorities and the expirations of statutes of limitations. The settlements of $16 million in 2023 are related to the release of a previously reserved IRS audit position based on developments associated with the ongoing IRS examination and appeals process for certain years.
We recognize accrued interest and penalties related to uncertain tax positions in income tax expense in our consolidated statements of operations. Our accrual for interest and penalties was $31$40 million and $29$34 million as of December 29, 2023 and December 31, 2021 and 2020,2022, respectively. During the years ended December 31,29, 2023, 2022 and 2021, 2020 and 2019 we recognized net interest and penalty charges of $1$3 million, $4$2 million and $3$1 million related to uncertain tax positions.
KBR is the parent of a group of domestic companies that are members of a U.S. consolidated federal income tax return. We also file income tax returns in various states and foreign jurisdictions. With few exceptions, we are no longer subject to examination by tax authorities for U.S. federal or state and local income tax for years before 2007.
KBR is subject to a tax sharing agreement primarily covering periods prior to the April 2007 separation from Halliburton. The tax sharing agreement provides, in part, that KBR will be responsible for any audit settlements directly attributable to our business activity for periods prior to our separation from our former parent. As of December 31, 2021 and 2020, we have recorded $5 million in other liabilities on our consolidated balance sheets for tax related items under the tax sharing agreement. The balance is not due until receipt by KBR of a future foreign tax credit refund claim filed with the IRS.
Note 14.13. Commitments and Contingencies
We are a party to litigation and other proceedings that arise in the ordinary course of our business, including matters arising under provisions relating to the protection of the environment.business. These types of matters could result in fines, penalties, cost reimbursements or contributions, compensatory or treble damages or non-monetary sanctions or relief. We believe the probability is remote that the outcome of any individual matter, including the matters described below, will have a material adverse effect on the corporation as a whole, notwithstanding that the unfavorable resolution of any matter may have a material effect on our net earnings and cash flows in any particular reporting period. Among the factors that we consider in this assessment are the nature of existing legal proceedings and claims, the asserted or possible damages or loss contingency (if estimable), the progress of the case, existing law and precedent, the opinions or views of legal counsel and other advisers, our experience in similar cases and the experience of other companies, the facts available to us at the time of assessment and how we intend to respond to the proceeding or claim. Our assessment of these factors may change over time as individual proceedings or claims progress.
Although we cannot predict the outcome of legal or other proceedings with certainty, when it is probable that a loss has beenwill be incurred and the amount is reasonably estimable, U.S. GAAP requires us to accrue an estimate of the probable loss or range of loss. In the event a loss oris probable, but the probable loss is not reasonably estimable, we are required to make a statement that such an estimate cannot be made. We follow a thorough process in which we seek to estimate the reasonably possible loss or range of loss, and only if we are unable to make such an estimate do we conclude and disclose that an estimate cannot be made. Accordingly, unless otherwise indicated below in our discussion, of legal proceedings, a reasonably possible loss or range of loss associated with any individual legal proceedingcontingency cannot be estimated. See further discussion of material legal proceedings and ongoing litigation in Note 14 below.
Chadian Employee Class Action. In May 2018, former employees of our former Chadian subsidiary, Subsahara Services, Inc. ("SSI"), filed a class action suit claiming unpaid damages arising from the ESSO Chad Development Project for Exxon Mobil Corporation ("Exxon") dating back to the early 2000s. Exxon is also named as a defendant in the case. The SSI employees previously filed 2 class action cases in or around 2005 and 2006 for alleged unpaid overtime and bonuses. The Chadian Labour Court ruled in favor of the SSI employees in the unpaid overtime case resulting in a settlement of approximately $25 million which was reimbursed by Exxon under its contract with SSI. The second case for alleged unpaid bonuses was ultimately dismissed by the Supreme Court of Chad.
The current case claims $122 million in unpaid bonuses characterized as damages rather than employee bonuses to avoid the previous Chadian Supreme Court dismissal and a 5-year statute of limitations on wage-related claims. SSI’s initial defense was filed and a hearing was held in December 2018. A merits hearing was held in February 2019. In March 2019, the Labour Court issued a decision awarding the plaintiffs approximately $34 million including a $2 million provisional award. Exxon and SSI have appealed the award and requested suspension of the provisional award which was approved on April 2, 2019. Exxon and SSI filed a submission to the Court of Appeal on June 21, 2019 and filed briefs at a hearing on February 28, 2020. The plaintiffs failed to file a response on March 13, 2020 and a hearing was scheduled for April 17, 2020. The hearing was postponed due to COVID-19 but took place on September 18, 2020. On October 9, 2020 the appellate court of Moundou awarded the plaintiffs approximately $19 million. SSI filed an appeal of this decision to the Chadian Supreme Court on December 28, 2020. SSI’s request for suspension on the enforceability of the award from the Chadian Supreme Court was granted on January 4, 2021. A hearing took place on December 21, 2021, and while a decision was not issued at the hearing the Reporting Judge of the Chadian Supreme Court had indicated, with regard to the fourth plea concerning the unicity of judicial matters, that this ground alone justified quashing the decision. This reversal seemed so obvious for the Reporting Judge that he explained that it was useless to continue studying the following pleas for appeal. On February 9, 2022, the Chadian Supreme Court issued an abstract of their forthcoming decision upholding the lower court’s ruling. We are still awaiting a full decision by the Chadian Supreme Court.
Regardless, at this time, based on our assessment of existing law and precedent, the opinions of legal counsel and other advisers, and the facts available to us at the time of assessment, we do not believe a risk of material loss is probable related to this matter. SSI is no longer an existing entity in Chad or the United States. Further, we believe any amounts ultimately paid to the former employees related to this adverse ruling would be paid by Exxon based on the applicable contract and past actions by Exxon with respect to costs and awards related to this matter.
North West Rail Link Project. We participate in an unincorporated joint venture with two partners to provide engineering and design services in relation to the operations, trains and systems of a metro rail project in Sydney, Australia. The project commenced in 2014 and during its execution encountered delays and disputes resulting in claims and breach notices submitted to the joint venture by the client. Since November 2018, the client has submitted multiple claims alleging breach of contract and breach of duty by the joint venture in its execution of the services, claiming losses and damages of up to approximately $301 million Australian dollars. KBR has a 33% participation interest in the joint venture and the partners have joint and several liability with respect to all obligations under the contract. We believe the gross amount of the claims
significantly exceeds the client’s entitlement as well as the joint venture’s limits of liability under the contract and that the claims will be covered by project-specific professional indemnity insurance subject to deductibles.
As of December 31, 2021, we have accrued a probable and reasonably estimable potential loss in an amount that is immaterial. At this time, fact discovery and expert review are still ongoing. The joint venture, joint venture insurers and client continue to be engaged in discussions concerning potential resolution of the claims.
Environmental
We are subject to numerous environmental, legal and regulatory requirements related to our operations worldwide. In the U.S, these laws and regulations include, among others: the Comprehensive Environmental Response, Compensation and Liability Act; the Resources Conservation and Recovery Act; the Clean Air Act; the Clean Water Act and the Toxic Substances Control Act. In addition to federal and state laws and regulations, other countries where we do business often have numerous environmental regulatory requirements by which we must abide in the normal course of our operations. These requirements apply to our business segments where we perform construction and industrial maintenance services or operate and maintain facilities.
We continue to monitor conditions at sites owned or previously owned. These locations were primarily utilized for manufacturing or fabrication work and are no longer in operation. The use of these facilities created various environmental issues including deposits of metals, volatile and semi-volatile compounds and hydrocarbons impacting surface and subsurface soils and groundwater. The range of remediation costs could change depending on our ongoing site analysis and the timing and techniques used to implement remediation activities. We do not expect that costs related to environmental matters will have a material adverse effect on our consolidated financial position or results of operations. Based on the information presently available to us, the assessment and remediation costs associated with all environmental matters are immaterial and we do not anticipate incurring additional costs.
Existing or pending climate change legislation, regulations, international treaties or accords are not expected to have a short-term material direct effect on our business, the markets that we serve or on our results of operations or financial position. However, climate change legislation could have a direct effect on our customers or suppliers, which could impact our business. For example, our commodity-based markets depend on the level of activity of mineral and oil and gas companies and existing or future laws, regulations, treaties or international agreements related to climate change, including incentives to conserve energy or use alternative energy sources, which could impact our business if such laws, regulations, treaties or international agreements reduce the worldwide demand for minerals, oil and natural gas. We continue to monitor developments in this area.
Insurance Programs
Our employee-related health care benefits program is self-funded. Our workers’ compensation, automobile and general liability insurance programs include a deductible applicable to each claim. Claims in excess of our deductible are paid by the insurer. The liabilities are based on claims filed and estimates of claims incurred but not reported. As of December 31, 2021,29, 2023, liabilities for anticipated claim payments and incurred but not reported claims for all insurance programs totaled approximately $47$37 million, comprised of $18 million included in accrued salaries, wages and benefits, $3 million included in other current liabilities and $16 million included in other liabilities all on our consolidated balance sheets. As of December 31, 2022, liabilities for anticipated claim payments and incurred but not reported claims for all insurance programs totaled approximately $41 million, comprised of $19 million included in accrued salaries, wages and benefits, $3 million included in other current liabilities and $25 million included in other liabilities all on our consolidated balance sheets. As of December 31, 2020, liabilities for unpaid and incurred but not reported claims for all insurance programs totaled approximately $42 million, comprised of $14 million included in accrued salaries, wages and benefits, $2 million included in other current liabilities and $26$19 million included in other liabilities all on our consolidated balance sheets.
Note 15.14. U.S. Government Matters
We provide services to various U.S. governmental agencies, including the U.S. DoD, NASA and the Department of State. The negotiation, administration and settlement of our contracts are subject to audit by the DCAA. The DCAA serves in an advisory role to the DCMA, which is responsible for the administration of the majority of our contracts. The scope of these audits includes, among other things, the validity of direct and indirect incurred costs, provisional approval of annual billing rates, approval of annual overhead rates, compliance with the FAR and CAS, compliance with certain unique contract clauses and audits of certain aspects of our internal control systems. Based on the information received to date, we do not believe any completed or ongoing government audits will have a material adverse impact on our results of operations, financial position or cash flows. The U.S. government also retains the right to pursue various remedies under any of these contracts which could result in challenges to expenditures, suspension of payments, fines and suspensions or debarment from future business with the U.S. government.
The Company accrued for probable and reasonably estimable unallowable costs associated with open government matters related to our GS business in the amounts of $76$45 million and $54$61 million for the years ended December 31, 2021,29, 2023, and December 31, 2020, and2022, respectively, which are recorded in other liabilities on our consolidated balance sheets.
Legacy U.S. Government Matters
Between 2002 and 2011, we provided significant support to the U.S. Army and other U.S. government agencies in support of the war in Iraq under the LogCAP III contract. We have been in the process of closing out the LogCAP III contract since 2011, and we expect the contract closeout process to continue for at least another year. As a result of our work under LogCAP III, there are claims and disputes pending between us and the U.S. government that need to be resolved in order to close the contract. The contract closeout process includes resolving objections raised byadministratively closing the U.S. government through a billing dispute process referred to as Form 1s and MFRs.individual task orders issued under the contract. We continue to work with the U.S. government to resolve thesethe issues and are engaged in efforts to reach mutually acceptable resolutionsclose the remaining task orders, which includes ongoing litigation of these outstanding matters. However, for certain of these matters, we have filed claims with the ASBCA or the COFC.third-party vendor disputes. We also have matters related to ongoing litigation or investigations involving U.S. government contracts. We anticipate billing additional labor, vendor resolution and litigation costs as we resolve the open matters in the future.
Investigations, Qui Tams and Litigation
The following matters relate to ongoing litigation or federal investigations involving U.S. government contracts. Many of these matters involve allegations of violations of the FCA, which prohibits in general terms fraudulent billings to the U.S. government. Suits brought by private individuals are called "qui tams." In the event we prevail in defending these allegations, a majority of our defense costs will be billable under the LogCAP III contract. All costs billed under LogCAP III are subject to audit by the DCAA for reasonableness.
First Kuwaiti Trading Company arbitration. In April 2008, FKTC, one of our LogCAP III subcontractors providing housing containers, filed for arbitration with the American Arbitration Association all itsfor several claims under various LogCAP III subcontracts. After complete hearingsa series of arbitration proceedings and related litigation between KBR and the U.S. government, the panel
heard the final claims and we received an award on all claims,July 27, 2022. FKTC filed a motion for correction of the award asking the tribunal to change its findings. The tribunal denied FKTC's motion in an order issued on October 20, 2022. On January 5, 2023, FKTC filed a motion to vacate the arbitral award in the Eastern District of Virginia Federal District Court. KBR filed its response on February 2, 2023. On March 22, 2023, both parties presented oral arguments. On May 12, 2023, the District Court issued its order denying FKTC’s motion to vacate the arbitration panelaward and confirming the award. On June 12, 2023, the parties submitted their briefs in support of their calculations of the final award amount. KBR sought to confirm the net award of $16 million in KBR’s favor plus post-judgment interest. FKTC sought to offset amounts awarded to KBR with amounts FKTC $17 million plusclaimed it was owed based on unpaid principal and post award interest for claims involving damages on lost or unreturned vehicles.the awards issued in its favor in the prior arbitration proceedings, totaling $70 million. KBR disagreed with FKTC’s interest claim and calculation. On September 22, 2023, the Court issued a decision finding the net amount due in favor of KBR from FKTC is $8 million. FKTC has appealed this ruling. In addition, we determined that we owein March 2022, FKTC $32filed a civil action in Kuwait civil court against KBR seeking $100 million in connection with other subcontracts provideddamages. This action is duplicative of the claims decided in arbitration. In September 2022, we are reimbursedfiled a motion to dismiss this action for these same costs bylack of jurisdiction due to the U.S. government. We lost our claims againstarbitration agreement between KBR and FKTC. On December 7, 2023, the government as referenced belowKuwait Court of Cassation issued a ruling ordering KBR to pay an immaterial provisional damage award and have exercised our offset or clawback rights as againstrequiring FKTC to refile its case in the arbitration.FKTC does not agree withCourt of First Instance for adjudication. Based on our rightassessment of offsetexisting law and a final hearing will be neededprecedent, the opinions or views of legal counsel and the facts available to resolve this issue and our other counterclaims against FKTC.A hearing took place on January 31 - February 1, 2022. Managementus, no amounts were accrued a probable and reasonably estimable loss amount to cover either liability as determined by the panel or a negotiated settlement with FKTC on this matter.of December 29, 2023.
Howard qui tam. In March 2011, Geoffrey Howard and Zella Hemphill filed a complaint in the U.S. District Court for the Central District of Illinois alleging that KBR mischarged the government $628 million for unnecessary materials and equipment.equipment in violation of the FCA. In October 2014, the DOJ declined to intervene and the case was partially unsealed. Depositions of some DCMA and KBR personnel have taken place and more which were expected to occur in early 2020 were postponed due to COVID-19 but resumed in 2021. KBR and the relators filed various motions, including a motion to dismiss by KBR. Although KBR's motion to dismissKBR, which was not granted it remains an option on appeal.denied. Fact discovery has been completed and expert discovery is expectedreports were completed. We also filed a motion for summary judgment and motions to continue through July 2022. Weexclude relators' experts. At the request of the parties, the court ordered a 90-day stay of the proceedings on December 28, 2022, which was later extended several times. Although we believe the allegations of fraud by the relators are without merit, we participated in mediation and baseddiscussions with the relators while continuing to prepare for trial. Any proposed framework for resolving the litigation required agreements on our assessmentdamages and attorneys' fees, as well as necessary determinations by the Department of existing lawthe Army and precedent,approval by the opinions or views of legal counselDOJ. On June 30, 2023, KBR executed a settlement agreement with the relators and the facts availableDepartment of Justice. Under the terms of the settlement, KBR denies any liability or wrongful conduct. Pursuant to usthe settlement, KBR paid $109 million, of which $57 million comprised restitution damages, and $35 million to the relators as attorney’s fees. Payment of December 31, 2021, we are not able to estimate a reasonably possible lossthe settlement was made on July 10, 2023, and accordingly, no amounts have been accrued.
DOJ False Claims Act complaint - Iraq Subcontractor. In January 2014,KBR recorded the DOJ filed a complaint in the U.S. District Court for the Central Districtassociated charge of Illinois against KBR and 2 former KBR subcontractors, including FKTC, alleging that 3 former KBR employees were offered and accepted kickbacks from these subcontractors in exchange for favorable treatment in the award and performance of subcontracts to be awarded$144 million during the course of KBR's performance of the LogCAP III contract in Iraq. The complaint alleges that as a result of the kickbacks, KBR submitted invoices with inflated or unjustified subcontract prices, resulting in alleged violations of the FCA and the Anti-Kickback Act. The DOJ's investigation dates back to 2004. We self-reported most of the violations and tendered credits to the U.S. government as appropriate. On May 22, 2014, FKTC filed a motion to dismiss, which the U.S. government opposed. Following the submission of our answer in April 2014, the U.S. government was granted a Motion to Strike certain affirmative defenses in March 2015. We do not believe this limits KBR's ability to fully defend all allegations in this matter.
Discovery for this complaint is now complete. On March 30, 2020, the Court granted KBR’s motion to transfer the case to the Southern District of Texas and the court allowed one additional deposition to take place. KBR and the U.S government filed various dispositive motions which remained under consideration by the Court for an extended period. In March 2021, while granting some of KBR’s motions for summary judgment, the court also concluded that we breached the FCA as a matter of law as to several subcontracts. We filed for two motions for reconsideration, one addressing the ruling on KBR’s motion for summary judgment and one addressing the U.S. government’s motion. A hearing was held and the Court issued a ruling on both motions, granting in part and denying in part on both motions. The Court also set a trial date for February 2022 which has now been postponed to May 2022. As ofyear ended December 31, 2021, we have accrued a probable and reasonably estimable loss amount, which is included in other liabilities on our consolidated balance sheets.
Other matters
KBR Contract Claim on FKTC containers. KBR previously filed a claim before the ASBCA to recover the costs paid to FKTC to settle its requests for equitable adjustment. The DCMA had disallowed the majority of those costs. Those contract claims were stayed in 2013 at the request of the DOJ so that they could pursue the FCA case referenced above. Those claims were reinstated in 2016. We tried our contract appeal in September 2017. In November 2018, we received an unfavorable ruling from the ASBCA disallowing all of our costs paid to FKTC. KBR's motion for reconsideration by a senior panel of judges at the ASBCA was denied. KBR filed its brief on appeal in September 2019. Oral arguments occurred in May 2020 and a decision in the government's favor was issued on September 1, 2020. We made final payment to the U.S. government in the fourth quarter of 2021.29, 2023.
Note 16. Claims and Accounts Receivable
Our claims and accounts receivable balance not expected to be collected within the next 12 months was $30 million as of December 31, 2021, and 2020. Claims and accounts receivable primarily reflect claims filed with the U.S. government related to payments not yet received for costs incurred under various U.S. government cost-reimbursable contracts within our GS business segment. As of December 31, 2021 and 2020, $29 million of the total claims and accounts receivable balance relate to contracts where our reimbursable costs have exceeded the U.S. government's funded values on the underlying task orders or task orders where the U.S. government has not authorized us to bill. The remaining $1 million as of December 31, 2021 and 2020 relate to Form 1s issued by the U.S. government questioning or objecting to costs billed to them. We believe the remaining disputed costs will be resolved in our favor, at which time the U.S. government will be required to obligate funds from appropriations for the year in which resolution occurs.
Note 17.15. Leases
We enter into lease arrangements primarily for real estate, project equipment, transportation and information technology assets in the normal course of our business operations. Real estate leases accounted for approximately 89%91% of our lease obligations at December 31, 2021.29, 2023. An arrangement is determined to be a lease at inception if it conveys the right to control the use of identified property and equipment for a period of time in exchange for consideration. We have elected not to recognize an ROU asset and lease liability for leases with an initial term of 12 months or less. Many of our equipment leases, primarily associated with the performance of projects for U.S. government customers, include 1one or more renewal option periods, with renewal terms that can extend the lease term in one year increments. The exercise of these lease renewal options is at our sole discretion and is generally dependent on the period of project performance, or extension thereof, determined by our customers. When it is reasonably certain that we will exercise the option, we include the impact of the option in the lease term to determine total future lease payments. Because most of our lease agreements do not explicitly state the discount rate, we use our incremental borrowing rate on the commencement date to calculate the present value of future lease payments.
Certain leases include payments that are based solely on an index or rate. These variable lease payments are included in the calculation of the ROU asset and lease liability. Other variable lease payments, such as usage-based amounts, are excluded from the ROU asset and lease liability, and are expensed as incurred. In addition to the present value of the future lease payments, the calculation of the ROU asset also includes any deferred rent, lease pre-payments and initial direct costs of obtaining the lease, such as commissions.
In addition to the base rent, real estate leases typically contain provisions for common-area maintenance and other similar services, which are considered non-lease components for accounting purposes. We exclude these non-lease components in calculating the ROU asset and lease liability for real estate leases and expense them as incurred. For all other types of leases, non-lease components are included in calculating our ROU assets and lease liabilities.
The operating ROU asset and current and noncurrent operating lease liabilities are disclosed on our consolidated balance sheets. The current operating lease liabilities are included in other current liabilities on our consolidated balance sheets. The finance ROU asset is included in property,property, plant and equipment and the current and noncurrent finance lease liabilities are included in otherother current liabilities and otherother liabilities, respectively, on our consolidated balance sheets.
The components of our operating lease costs for the years ended December 29, 2023, December 31, 2022 and December 31, 2021 2020 and 2019 were as follows:
| | Year Ended December 31, |
| Years ended | | | Years ended |
| December 29, | | | December 29, | | December 31, |
| Dollars in millions | Dollars in millions | 2021 | | 2020 | | 2019 | Dollars in millions | 2023 | | 2022 | | 2021 |
| Operating lease cost | Operating lease cost | $ | 51 | | | $ | 50 | | | $ | 54 | |
| Short-term lease cost | Short-term lease cost | 528 | | | 112 | | | 121 | |
| | Total lease cost | Total lease cost | $ | 579 | | | $ | 162 | | | $ | 175 | |
| | Total lease cost | |
| | Total lease cost | |
Operating lease cost includes operating lease ROU asset amortization of $38$46 million, $37$47 million and $38 million for the years ended December 29, 2023, December 31, 2022 and December 31, 2021, 2020 and 2019, respectively, and other noncash operating lease costs related to the accretion of operating lease liabilities and straight-line lease accounting of $16 million, $14 million and $13 million for the years ended December 29, 2023, December 31, 2022 and December 31, 2021, and 2020 and $16 million for the year ended December 31, 2019.respectively.
Total short-term lease commitments as of December 31, 202129, 2023 were approximately $416$178 million. Additional information related to leases was as follows:
| | December 31, | | December 31, | | December 31, |
| December 29, | | | December 29, | | December 31, |
| Dollars in millions | Dollars in millions | 2021 | | 2020 | | 2019 | Dollars in millions | 2023 | | 2022 | | 2021 |
| Cash paid for amounts included in the measurement of lease liabilities | Cash paid for amounts included in the measurement of lease liabilities | | | | | |
| Operating cash flows from operating leases | |
| Operating cash flows from operating leases | |
| Operating cash flows from operating leases | Operating cash flows from operating leases | $ | 59 | | | $ | 61 | | | $ | 56 | |
| Financing cash flows from finance leases | Financing cash flows from finance leases | $ | 13 | | | $ | 11 | | | $ | 6 | |
| Right-of-use assets obtained in exchange for new operating lease liabilities | Right-of-use assets obtained in exchange for new operating lease liabilities | $ | 33 | | | $ | 62 | | | $ | 20 | |
| Right-of-use assets obtained in exchange for new finance lease liabilities | Right-of-use assets obtained in exchange for new finance lease liabilities | $ | 11 | | | $ | 34 | | | $ | 13 | |
| Weighted-average remaining lease term-operating (in years) | Weighted-average remaining lease term-operating (in years) | 6 years | | 6 years | | 8 years | Weighted-average remaining lease term-operating (in years) | 6 years | | 7 years | | 6 years |
| Weighted-average remaining lease term-finance (in years) | Weighted-average remaining lease term-finance (in years) | 3 years | | 3 years | | 3 years | Weighted-average remaining lease term-finance (in years) | 2 years | | 2 years | | 3 years |
| Weighted-average discount rate-operating leases | Weighted-average discount rate-operating leases | 6.3 | % | | 6.8 | % | | 7.6 | % | Weighted-average discount rate-operating leases | 6.2 | % | | 6.0 | % | | 6.3 | % |
| Weighted-average discount rate-finance leases | Weighted-average discount rate-finance leases | 4.0 | % | | 4.7 | % | | 5.6 | % | Weighted-average discount rate-finance leases | 4.2 | % | | 3.1 | % | | 4.0 | % |
The following is a maturity analysis of the future undiscounted cash flows associated with our lease liabilities as of December 31, 2021: | | | | | | | | | | | | | | | | | | | | | | | | | | | | | | | | | | | | | | | | | |
| Year |
| Dollars in millions | 2022 | | 2023 | | 2024 | | 2025 | | 2026 | | Thereafter | | Total |
| Future payments - operating leases | $ | 55 | | | $ | 51 | | | $ | 42 | | | $ | 36 | | | $ | 25 | | | $ | 85 | | | $ | 294 | |
| Future payments - finance leases | 9 | | | 6 | | | 4 | | | 2 | | | — | | | — | | | 21 | |
| Total future payments - all leases | $ | 64 | | | $ | 57 | | | $ | 46 | | | $ | 38 | | | $ | 25 | | | $ | 85 | | | $ | 315 | |
| | | Dollars in millions | Dollars in millions | Operating Leases | | Finance Leases | | Total | Dollars in millions | Operating Leases | | Finance Leases |
| 2024 | |
| 2025 | |
| 2026 | |
| 2027 | |
| 2028 | |
| Thereafter | |
| Total future payments | Total future payments | $ | 294 | | | $ | 21 | | | $ | 315 | |
| Less imputed interest | Less imputed interest | (65) | | | (1) | | | (66) | |
| Present value of future lease payments | Present value of future lease payments | $ | 229 | | | $ | 20 | | | $ | 249 | |
| Less current portion of lease obligations | Less current portion of lease obligations | (41) | | | (9) | | | (50) | |
| Noncurrent portion of lease obligations | Noncurrent portion of lease obligations | $ | 188 | | | $ | 11 | | | $ | 199 | |
|
Note18.Note 16. Accumulated Other Comprehensive Loss
Changes in AOCL, net of tax, by component
| | Dollars in millions | Dollars in millions | Accumulated foreign currency translation adjustments | | Accumulated pension liability adjustments | | Changes in fair value of derivatives | | Total | Dollars in millions | Accumulated foreign currency translation adjustments | | Accumulated pension liability adjustments | | Changes in fair value of derivatives | | Total |
| Balance at December 31, 2019 | $ | (315) | | | $ | (654) | | | $ | (18) | | | $ | (987) | |
| Balance at December 31, 2021 | |
| Other comprehensive income (loss) adjustments before reclassifications | Other comprehensive income (loss) adjustments before reclassifications | 36 | | | (130) | | | (21) | | | (115) | |
| Amounts reclassified from AOCL | Amounts reclassified from AOCL | (12) | | | 20 | | | 11 | | | 19 | |
| Net other comprehensive income (loss) | Net other comprehensive income (loss) | 24 | | | (110) | | | (10) | | | (96) | |
| Balance at December 31, 2020 | $ | (291) | | | $ | (764) | | | $ | (28) | | | $ | (1,083) | |
| Balance at December 31, 2022 | |
| Other comprehensive income (loss) adjustments before reclassifications | Other comprehensive income (loss) adjustments before reclassifications | (11) | | | 168 | | | 12 | | | 169 | |
| Amounts reclassified from AOCL | Amounts reclassified from AOCL | 6 | | | 15 | | | 12 | | | 33 | |
| Net other comprehensive income (loss) | Net other comprehensive income (loss) | (5) | | | 183 | | | 24 | | | 202 | |
| Balance at December 31, 2021 | $ | (296) | | | $ | (581) | | | $ | (4) | | | $ | (881) | |
| Balance at December 29, 2023 | |
Reclassifications out of AOCL, net of tax, by component
| | Years ended | |
| Dollars in millions | |
| Dollars in millions | |
| Dollars in millions | Dollars in millions | December 31, 2021 | | December 31, 2020 | | Affected line item on the Consolidated Statements of Operations | December 29, 2023 | | December 31, 2022 | | Affected line item on the Consolidated Statements of Operations |
| Accumulated foreign currency adjustments | Accumulated foreign currency adjustments | | | | | |
| Reclassification of foreign currency adjustments | |
| Reclassification of foreign currency adjustments | |
| Reclassification of foreign currency adjustments | Reclassification of foreign currency adjustments | $ | (6) | | | $ | 12 | | | Net income attributable to noncontrolling interests and Gain on disposition of assets and investments | $ | (10) | | | $ | | $ | (13) | | | Net income attributable to noncontrolling interests and Gain (loss) on disposition of assets and investments | | Net income attributable to noncontrolling interests and Gain (loss) on disposition of assets and investments |
| Tax benefit | Tax benefit | — | | | — | | | Provision for income taxes | Tax benefit | — | | | — | | — | | | Provision for income taxes | | Provision for income taxes |
| Net accumulated foreign currency | Net accumulated foreign currency | $ | (6) | | | $ | 12 | | |
| | Accumulated pension liability adjustments | Accumulated pension liability adjustments | |
| Amortization of actuarial loss (a) | $ | (32) | | | $ | (24) | | | See (a) below |
| | Accumulated pension liability adjustments | |
| | Accumulated pension liability adjustments | |
| Amortization of prior service cost | |
| Amortization of prior service cost | |
| Amortization of prior service cost | | $ | (1) | | | $ | (1) | | | See (a) below |
| Recognized actuarial loss | | Recognized actuarial loss | (1) | | | (23) | | | See (a) below |
| Tax benefit | Tax benefit | 17 | | | 4 | | | Provision for income taxes | Tax benefit | 1 | | | 5 | | 5 | | | Provision for income taxes | | Provision for income taxes |
| Net pension and post-retirement benefits | Net pension and post-retirement benefits | $ | (15) | | | $ | (20) | | | Net of tax | Net pension and post-retirement benefits | $ | (1) | | | $ | | $ | (19) | | | Net of tax | | Net of tax |
| | Changes in fair value for derivatives | Changes in fair value for derivatives | |
| Changes in fair value for derivatives | |
| Changes in fair value for derivatives | |
| Foreign currency hedge and interest rate swap settlements | |
| Foreign currency hedge and interest rate swap settlements | |
| Foreign currency hedge and interest rate swap settlements | Foreign currency hedge and interest rate swap settlements | $ | (16) | | | $ | (13) | | | Other non-operating income (expense) | $ | 24 | | | $ | | $ | (4) | | | Other non-operating income (expense) | | Other non-operating income (expense) |
| Tax benefit | Tax benefit | 4 | | | 2 | | | Provision for income taxes | Tax benefit | (5) | | | 1 | | 1 | | | Provision for income taxes | | Provision for income taxes |
| Net changes in fair value of derivatives | Net changes in fair value of derivatives | $ | (12) | | | $ | (11) | | | Net of tax | Net changes in fair value of derivatives | $ | 19 | | | $ | | $ | (3) | | | Net of tax | | Net of tax |
(a)This item is included in the computation of net periodic pension cost. See Note 1110 to our consolidated financial statements for further discussion.
Shares of common stock
| | | | | |
Shares in millions | Shares |
Balance at December 31, 2019 | 178.3 | |
Common stock issued | 0.8 | |
Balance at December 31, 2020 | 179.1 | |
Common stock issued | 0.9 | |
Balance at December 31, 2021 | 180.0 | |
Shares of treasury stock
| | | | | | | | | | | |
| Shares and dollars in millions | Shares | | Amount |
| Balance at December 31, 2019 | 36.5 | | | $ | 817 | |
| Treasury stock acquired, net of ESPP shares issued | 1.8 | | | 47 | |
| Balance at December 31, 2020 | 38.3 | | | 864 | |
| Treasury stock acquired, net of ESPP shares issued | 1.9 | | | 79 | |
| Balance at December 31, 2021 | 40.2 | | | $ | 943 | |
Dividends
We declared dividends totaling $63 million and $57 million in 2021 and 2020, respectively. On February 18, 2022, the Board of Directors declared a dividend of $0.12 per share, which will be paid on April 15, 2022.
Note 19.17. Share Repurchases
Authorized Share Repurchase Program
On February 25, 2014, the Board of Directors authorized a plan to repurchase up to $350 million of our outstanding shares of common stock, which replaced and terminated the August 26, 2011 share repurchase program. As of December 31, 2019, $160 million remained available under this authorization. On February 19, 2020,October 18, 2022, the Board of Directors authorized an increase of approximately $190 million to our share repurchase program, returning the total authorization level to $350$500 million. As of December 31, 2021, $22529, 2023, $326 million remains available for repurchase under this authorization. On February 19, 2024, the Board of Directors authorized $174 million of share repurchases to be added to the prior authorizations. After the authorization on February 19, 2024, $500 million remains authorized and available for repurchase under this program. The authorization does not obligate the Company to acquire any particular number of shares of common stock and may be commenced, suspended or discontinued without prior notice. The share repurchases are intended to be funded through the Company’s current and future cash flows and the authorization does not have an expiration date.
Share Maintenance Programs
Stock options and restricted stock awards granted under the KBR, Inc. 2006 Stock and Incentive Plan ("KBR Stock Plan") may be satisfied using shares of our authorized but unissued common stock or our treasury share account.
The ESPP allows eligible employees to withhold up to 10% of their earnings, subject to some limitations, to purchase shares of KBR common stock. These shares are issued from our treasury share account.
Withhold to Cover Program
We have in place a "withheld"withhold to cover" program, which allows us to withhold common shares from employees in connection with the settlement of income tax and related benefit withholding obligations arising from the issuance of share-based equity awards under the KBR Stock Plan.
The table below presents information on our annual share repurchases activity under these programs:
| | | | | | | | | | | | | | | | | |
| Year Ended December 31, 2021 |
| Number of Shares | | Average Price per Share | | Dollars in Millions |
| Repurchases under the $350 million authorized share repurchase program | 1,874,343 | | | $ | 41.52 | | | $ | 78 | |
| | | | | |
| Withheld to cover shares | 148,535 | | | 32.39 | | | 4 | |
| Total | 2,022,878 | | | $ | 40.85 | | | $ | 82 | |
| | | | | |
| Year ending December 31, 2020 |
| Number of Shares | | Average Price per Share | | Dollars in Millions |
| Repurchases under the $350 million authorized share repurchase program | 1,823,434 | | | $ | 25.70 | | | $ | 47 | |
| | | | | |
| Withheld to cover shares | 168,671 | | | 25.65 | | | 4 | |
| Total | 1,992,105 | | | $ | 25.70 | | | $ | 51 | |
| | | | | | | | | | | | | | | | | |
| Year Ended December 29, 2023 |
| Number of Shares | | Average Price per Share | | Dollars in Millions |
| Repurchases under the $500 million authorized share repurchase program | 2,222,293 | | | $ | 56.23 | | | $ | 125 | |
| | | | | |
| Withhold to cover shares | 240,098 | | | 54.22 | | | 13 | |
| Total | 2,462,391 | | | $ | 56.03 | | | $ | 138 | |
| | | | | |
| Year Ended December 31, 2022 |
| Number of Shares | | Average Price per Share | | Dollars in Millions |
| Repurchases under the $500 million authorized share repurchase program | 4,029,686 | | | $ | 47.94 | | | $ | 193 | |
| | | | | |
| Withhold to cover shares | 199,642 | | | 48.64 | | | 10 | |
| Total | 4,229,328 | | | $ | 47.97 | | | $ | 203 | |
Note 20.18. Share-based Compensation and Incentive Plans
KBR Stock Plan
In November 2006, KBR established the KBR Stock Plan, which provides for the grant of any or all of the following types of share-based compensation listed below:
•stock options, including incentive stock options and nonqualified stock options;
•stock appreciation rights, in tandem with stock options or freestanding;
•restricted stock;
•restricted stock units;
•cash performance awards; and
•stock value equivalent awards.
In May 2012, the KBR Stock Plan was amended to add 2 million shares of our common stock available for issuance under the KBR Stock Plan and increase certain sublimits.sub-limits.
In May 2016, the KBR Stock Plan was further amended to add 4.4 million shares of our common stock available for issuance under the KBR Stock Plan. Additionally, this amendment increased the sublimit under the Stock Plan in the form of restricted stock awards, restricted stock unit awards, stock value equivalent awards or pursuant to performance awards denominated in common stock by 4.4 million. Under the terms of the KBR Stock Plan, 16.4 million shares of common stock have been reserved for issuance to employees and non-employee directors. The plan specifies that no more than 9.9 million shares can be awarded as restricted stock, restricted stock units, stock value equivalents or pursuant to performance awards denominated in common stock.
At December 31, 2021,29, 2023, approximately 5.03.9 million shares were available for future grants under the KBR Stock Plan, of which approximately 1.70.5 million shares remained available for restricted stock awards or restricted stock unit awards.
KBR Stock Options
Under the KBR Stock Plan, stock options are granted with an exercise price not less than the fair market value of the common stock on the date of the grant and a term no greater than 10 years. The term and vesting periods are established at the discretion of the Compensation Committee at the time of each grant. The fair value of options at the date of grant arewere estimated using the Black-Scholes-Merton option pricing model. The expected volatility of KBR options granted in each year is based upon a blended rate that uses the historical and implied volatility of common stock for KBR. The expected term of KBR
options granted was based on KBR's historical experience. The estimated dividend yield iswas based upon KBR’s annualized dividend rate divided by the market price of KBR’s stock on the option grant date. The risk-free interest rate iswas based upon the yield of U.S. government issued treasury bills or notes on the option grant date. We amortize the fair value of the stock options over the vesting period on a straight-line basis. Options are granted from shares authorized by our Board of Directors. There were no stock options granted in 2021, 20202023, 2022 or 2019.2021.
The following table presents stock options granted, exercised, forfeited and expired under KBR share-based compensation plans for the year ended December 31, 2021.
| | | | | | | | | | | | | | | | | | | | | | | |
| KBR stock options activity summary | Number
of Shares | | Weighted
Average
Exercise Price
per Share | | Weighted
Average
Remaining
Contractual
Term (years) | | Aggregate
Intrinsic Value
(in millions) |
| Outstanding at December 31, 2020 | 1,218,508 | | | $ | 28.02 | | | 2.34 | | $ | 0.58 | |
| Granted | — | | | — | | | | | |
| Exercised | (414,108) | | | 29.77 | | | | | |
| Forfeited | — | | | — | | | | | |
| Expired | (187,053) | | | 36.70 | | | | | |
| Outstanding at December 31, 2021 | 617,347 | | | $ | 24.27 | | | 2.18 | | $ | 1.45 | |
| Exercisable at December 31, 2021 | 617,347 | | | $ | 24.19 | | | 2.18 | | $ | 1.45 | |
The total intrinsic values of options exercised for the years ended December 31, 2021, 2020 and 2019 were $0.6 million, $0.1 million and $0.3 million, respectively. As of December 31, 2021,29, 2023, there were 152,799 options outstanding and exercisable with a weighted average exercise price of $19.92. All remaining outstanding and exercisable options expire by the end of 2025. During 2023, 246,387 options were exercised with a weighted average exercise price of $21.91. As of December 29, 2023, there was no unrecognized compensation cost, net of estimated forfeitures, related to non-vested KBR stock options. There was no stock option compensation expense in 2021, 20202023, 2022 and 2019.2021.
KBR Restricted stock
Restricted shares issued under the KBR Stock Plan are restricted as to sale or disposition. These restrictions lapse periodically over a period of time not exceeding 10 years. Restrictions may also lapse for early retirement and other conditions in accordance with our established policies. Upon termination of employment, shares on which restrictions have not lapsed must be returned to us, resulting in restricted stock forfeitures. The fair market value of the stock on the date of grant is amortized and ratably charged to income over the period during which the restrictions lapse on a straight-line basis. For awards with performance conditions, an evaluation is made each quarter as to the likelihood of meeting the performance criteria. Share-based compensation is then adjusted to reflect the number of shares expected to vest and the cumulative vesting period met to date.
The following table presents the restricted stock awards and restricted stock units granted, vested and forfeited during 20212023 under the KBR Stock Plan.
| | Restricted stock activity summary | Restricted stock activity summary | Number of
Shares | | Weighted
Average
Grant-Date
Fair Value per
Share | Restricted stock activity summary | Number of
Shares | | Weighted
Average
Grant-Date
Fair Value per
Share |
| Nonvested shares at December 31, 2020 | 1,187,479 | | | $ | 21.54 | |
| Nonvested shares at December 31, 2022 | |
| Granted | Granted | 491,871 | | | 33.97 | |
| Vested | Vested | (477,153) | | | 21.37 | |
| Forfeited | Forfeited | (75,897) | | | 26.99 | |
| Nonvested shares at December 31, 2021 | 1,126,300 | | | $ | 26.85 | |
| Nonvested shares at December 29, 2023 | |
The weighted average grant-date fair value per share of restricted KBR shares granted to employees during 2023, 2022 and 2021 2020was $56.09, $47.94 and 2019 was $33.97, $26.66 and $19.01, respectively. Restricted stock compensation expense was $15 million, $15 million, and $12 million for each of the years ended December 31,2023, 2022 and 2021, 2020 and 2019.respectively. Total income tax benefit recognized in net income for share-based compensation arrangements during 2023, 2022 and 2021 2020 and 2019 was $2$3 million, $3 million, and $3$2 million, respectively. As of December 31, 2021,29, 2023, there was $17$22 million of unrecognized compensation cost, net of estimated forfeitures, related to KBR’s non-vested restricted stock and restricted stock units, which is expected to be recognized over a weighted average period of 0.431.73 years. The total fair value of shares vested was $21 million in 2023, $31 million in 2022 and $16 million in 2021 $13 million in 2020 and $14 million in 2019 based on the weighted-average fair value on the vesting date. The total fair value of shares vested was $14 million in 2023, $15 million in 2022 and $10 million in 2021 $9 million in 2020 and $11 million in 2019 based on the weighted-average fair value on the date of grant.
Share-based compensation expensePerformance-Based Stock Awards
If an award is modified afterUnder the grant date, incremental compensation cost is recognized immediately asKBR Stock Plan, a portion of the modification. Share-basedLong-term Performance Cash and Stock Awards is settled in KBR shares. These awards vest and shares are issued at the end of a three-year period. The ultimate number of shares issued could range from 0% to 200% of the original shares granted depending upon KBR's performance in relation to the Total Shareholder Return ("TSR") performance objective. Stock compensation expense consists offor these awards was $6 million, $6 million and $4 million recorded to cost of revenues and $8 million to selling, general and administrative expenses on our consolidated statements of operations. The benefits of tax deductions in excess of the compensation cost recognized for the options (excess tax benefits) are classified as additional paid-in-capitalyears ended December 29, 2023, December 31, 2022 and cash retained as a result of these excess tax benefits is presented in the statements of cash flows as financing cash inflows.
| | | | | | | | | | | | | | | | | |
| Share-based compensation summary table | Years ended December 31, |
| Dollars in millions | 2021 | | 2020 | | 2019 |
| Share-based compensation | $ | 12 | | | $ | 12 | | | $ | 12 | |
| Income tax benefit recognized in net income for share-based compensation | $ | 2 | | | $ | 3 | | | $ | 3 | |
| Incremental compensation cost | $ | — | | | $ | 1 | | | $ | — | |
Incremental compensation cost resulted from modifications of previously granted share-based awards which allowed certain employees to retain their awards after leaving the Company. Excess tax benefits realized from the exercise of share-based compensation awards are recognized as paid-in capital in excess of par.December 31, 2021, respectively.
KBR Cash Performance Based Award Units ("Cash Performance Awards")
Under the KBR Stock Plan, for Cash Performance Awards granted in 2021, 20202023, 2022 and 2019,2021, performance is based 50% on average Total Shareholder Return ("TSR"),TSR, as compared to the average TSR of KBR’s peers, and 50% on KBR’s Book-to-Bill for 2023 and 2022 and Job Income Sold ("JIS"). for 2021. In accordance with the provisions of ASC 718 - Compensation-Stock Compensation, the TSR portion for the performance award units are classified as liability awards and remeasured at the end of each reporting period at fair value until settlement. The fair value approach uses the Monte Carlo valuation method which analyzes the companies comprising KBR’s peer group, considering volatility, interest rate, stock beta and TSR through the grant date. The Book-to-Bill calculation for 2023 and 2022 and JIS calculation for 2021 is based on the Company's Book-to-Bill and JIS earned at a target level averaged over a three year period. The Book-to-Bill and JIS portion of the Cash Performance Award is also classified as a liability award and remeasured at the end of each reporting period based on our estimate of the amount to be paid at the end of the vesting period. The cash performance award units may only be paid in cash.
Under the KBR Stock Plan, in 2021,2023, we granted $1819 million performance based award units ("Cash Performance Awards") with a three-year performance period from January 1, 20212023 to December 31, 2023.2025. In 2020,2022, we granted $1916 million Cash Performance Awards with a three-year performance period from January 1, 20202022 to December 31, 2022.2024. In 2019,2021, we granted $1913 million Cash Performance Awards with a three-year performance period from January 1, 20192021 to December 31, 2021.2023. Cash Performance Awards forfeited, net of previous plan payout, totaled 5 million units, 72 million units and 34 million units during the years ended December 29, 2023, December 31, 2022 and December 31, 2021, 2020 and 2019, respectively. At December 31, 2021,29, 2023, the outstanding balance for Cash Performance Awards is 4642 million units. Cash Performance Awards are not considered earned until required performance conditions are met. Additionally, approval by the Compensation Committee of the Board of Directors is required before earned Cash Performance Awards are paid.
Cost for the Cash Performance Awards is accrued over the requisite service period. For the years ended December 29, 2023, December 31, 2022 and December 31, 2021, 2020 and 2019, we recognized $30$21 million, $17$20 million and $34$26 million, respectively, in expense for Cash Performance Awards. The expense associated with these Cash Performance Awards is included in cost of services and general and administrative expense in our consolidated statements of operations. The liability for Cash Performance Awards includes $25$20 million recorded within accrued salaries, wages and benefits and $18$19 million recorded within employee compensation and benefits on our consolidated balance sheets as of December 31, 2021.The29, 2023. The liability for Cash Performance Awards includes $21$19 million recorded within accrued salaries, wages and benefits, and $17 million recorded within employee compensation and benefits on our consolidated balance sheets as of December 31, 2020.2022.
KBR Employee Stock Purchase Plan ("ESPP")
Under the ESPP, eligible employees may withhold up to 10% of their earnings, subject to some limitations, to purchase shares of KBR’s common stock. Unless KBR’s Board of Directors determines otherwise, each six-month offering period commences at the beginning of February and August of each year. EmployeesIn 2023, employees who participateparticipated in the ESPP will receivereceived a 5% discount on the stock price at the end of each period. In 2024, employees who participate in the ESPP will receive a 6% discount on the stock price at the end of each period. During 20212023 and 2020,2022, our employees purchased approximately 147,000119,000 and 182,000124,000 shares, respectively, through the ESPP. These shares were issued from our treasury share account.
Note 21.19. Income (loss) per Share and Certain Related Information
Income (loss) per share
Basic income (loss) per share is based upon the weighted average number of common shares outstanding during the period. Dilutive income (loss) per share includes additional common shares that would have been outstanding if potential common shares with a dilutive effect had been issued using the if-converted method for Convertible Debt and the treasury stock method.method for all other instruments.
A reconciliationsummary of the number of shares used for the basic and diluted net income (loss) per share calculations is as follows:
| | | | Years ended December 31, | | Years ended, |
| December 29, | | | December 29, | | December 31, |
| Shares in millions | Shares in millions | 2021 | | 2020 | | 2019 | Shares in millions | 2023 | | 2022 | | 2021 |
| Net income (loss) attributable to KBR: | |
| Net Income (loss) attributable to KBR | |
| Net Income (loss) attributable to KBR | |
| Net Income (loss) attributable to KBR | |
| Less earnings allocable to participating securities | |
| Basic net income (loss) attributable to KBR | |
| Reversal of Convertible Debt interest expense | |
| Diluted net income (loss) attributable to KBR | |
| | Weighted average common shares outstanding: | |
| Weighted average common shares outstanding: | |
| Weighted average common shares outstanding: | |
| Basic weighted average common shares outstanding | Basic weighted average common shares outstanding | 140 | | | 142 | | | 141 | |
| Stock options, restricted shares and convertible debt (a) | 5 | | | — | | | 1 | |
| Diluted weighted average common shares outstanding (b) | 145 | | | 142 | | | 142 | |
| Basic weighted average common shares outstanding | |
| Basic weighted average common shares outstanding | |
| Convertible Debt | |
| Warrants | |
| Stock options and restricted shares | |
| Diluted weighted average common shares outstanding | |
| | Net income (loss) attributable to KBR per share: | |
| Net income (loss) attributable to KBR per share: | |
| Net income (loss) attributable to KBR per share: | |
| Basic | |
| Basic | |
| Basic | | $(1.96) | | $1.36 | | $0.19 |
| Diluted | | Diluted | $(1.96) | | $1.26 | | $0.19 |
(a)
For
Due to our net loss position for the year ended December 31, 2021 and 2019, there was a diluted impact primarily related to29, 2023, our Convertible Debt.
(b)In periods for which we report abasic net loss attributable to KBR basic net loss per share and diluted net loss attributable to KBR per share are identical as the effect of all potential common shares is anti-dilutive and therefore excluded.
We useapply the treasury stockif-converted method for calculating any potential dilutive effect of the conversion spread onto our Convertible Debt onwhen calculating diluted net income (loss) attributable to KBR per share because upon conversion, it is our current intent and policy to settleuntil the date of election of cash as the settlement method. Under the if-converted method, the principal amount of our Convertible Notes in cash and any excess in sharesconversion spread of ourthe Convertible Debt, to the extent dilutive, are assumed to be converted into common stock. stock at the beginning of the period and net income (loss) attributable to KBR is adjusted to reverse the effect of any interest expense associated with the Convertible Debt.
For the yearsyear ended December 31, 20212022, the Warrant Transactions (as defined in Note 11, "Debt and 2019, the Convertible NotesOther Credit Facilities", to our consolidated financial statements) impacted the calculation of diluted net income (loss) per share as the average price of our common stock exceeded the conversionadjusted strike price of $25.35 and $25.51, respectively. However, for$39.63. For the year ended December 31, 2020,2021, the Convertible Notes had no dilutive effect as we reported a net loss attributable to KBR. Additionally,Warrant Transactions did not impact diluted net income (loss) per share did not include any effect from the Warrant Transactions (as defined in Note 12, "Debt and Other Credit Facilities", to our consolidated financial statements) as the average price of our common stock during the period did not exceed the exerciseadjusted strike price of $39.76, $39.88 and $40.02 for$39.76.
For the yearsyear ended December 31, 2021, 2020 and 2019, respectively. We expect29, 2023, the Warrant Transactions to have a dilutive effect on diluted net income (loss) per share incalculation excluded the year ending December 31, 2022.
For purposes of applyingfollowing weighted-average potential common shares because their inclusion would have been anti-dilutive: 4.0 million related to the two-class method in computing income (loss) per share, there were $0.1Convertible Debt, 10.2 million related to the Warrant Transactions and $1.51.4 million net earnings allocatedrelated to participating securities, or a negligible amount per share, for the years ended December 31, 2021our stock options and 2019, respectively. There were no net earnings allocated to participating securities forrestricted stock awards. For the year ended December 31, 2020. The2022, the diluted net income (loss) per share calculation did not include 0.1excluded the following weighted-average potential common shares because their inclusion would have been anti-dilutive: 11.2 million 1.1related to the
Warrant Transactions and 0.5 million related to our stock options and 1.3 million antidilutive weighted average shares forrestricted stock awards. For the yearsyear ended December 31, 2021, 2020the diluted net income (loss) per share calculation excluded the following weighted-average potential common shares because their inclusion would have been anti-dilutive: 13.5 million related to the Convertible Debt, 13.5 million related to the Warrant Transactions and 2019, respectively.0.7 million related to our stock options and restricted stock awards.
Shares of common stock
| | | | | |
| Shares in millions | Shares |
| Balance at December 31, 2021 | 180.0 | |
| Common stock issued | 0.8 | |
| Balance at December 31, 2022 | 180.8 | |
| Common stock issued | 0.9 | |
| Balance at December 29, 2023 | 181.7 | |
Shares of treasury stock
| | | | | | | | | | | |
| Shares and dollars in millions | Shares | | Amount |
| Balance at December 31, 2021 | 40.2 | | | $ | 943 | |
| Treasury stock acquired, net of ESPP shares issued | 4.1 | | | 200 | |
| Balance at December 31, 2022 | 44.3 | | | 1,143 | |
| Treasury stock acquired, net of ESPP shares issued | 2.3 | | | 136 | |
| Balance at December 29, 2023 | 46.6 | | | $ | 1,279 | |
Dividends
We declared dividends totaling $73 million and $67 million in 2023 and 2022, respectively. On February 19, 2024, the Board of Directors declared a dividend of $0.15 per share, which will be paid on April 15, 2024.
Note 22.20. Fair Value of Financial Instruments and Risk Management
Fair value measurements. The fair value of an asset or liability is the price that would be received to sell an asset or transfer a liability (an exit price) in the principal or most advantageous market for the asset or liability in an orderly transaction between market participants on the measurement date. The Company utilizes a fair value hierarchy that maximizes the use of observable inputs and minimizes the use of unobservable inputs when measuring fair value and defines three levels of inputs that may be used to measure fair value. Level 1 inputs are quoted prices in active markets for identical assets or liabilities. Level 2 inputs are inputs other than quoted prices included in Level 1 that are observable for the asset or liability, either directly or indirectly, including quoted prices for similar assets or liabilities in active markets, quoted prices in markets that are not active, inputs other than quoted prices that are observable for the asset or liability or inputs derived from observable market data. Level 3 inputs are unobservable inputs that are supported by little or no market activity and are significant to the fair value of the assets or liabilities.
The carrying amount of cash and cash equivalents, accounts receivable and accounts payable, as reflected in the consolidated balance sheets, approximates fair value due to the short-term maturities of these financial instruments. The carrying values and estimated fair values of our financial instruments that are not required to be recorded at fair value in our consolidated balance sheets are provided in the following table.
| | | | | | | | | | | | | | | | | | | | | | | | | | | | | |
| | | December 31, 2021 | | December 31, 2020 |
| Dollars in millions | | | Carrying Value | | Fair Value | | Carrying Value | | Fair Value |
| Liabilities (including current maturities): | | | | | | | | | |
| Term Loan A | Level 2 | | $ | 441 | | | $ | 441 | | | $ | 285 | | | $ | 285 | |
| Term Loan B | Level 2 | | 511 | | 514 | | 516 | | 517 |
| Convertible Notes | Level 2 | | 350 | | 669 | | 350 | | 480 |
| Senior Notes | Level 2 | | 250 | | 256 | | 250 | | | 262 | |
| Senior Credit Facility | Level 2 | | 364 | | 364 | | 260 | | | 260 | |
| Nonrecourse project debt | Level 2 | | 2 | | 2 | | 7 | | 7 |
| | | | | | | | | | | | | | | | | | | | | | | | | | | | | |
| | | December 29, 2023 | | December 31, 2022 |
| Dollars in millions | | | Carrying Value | | Fair Value | | Carrying Value | | Fair Value |
| Liabilities (including current maturities): | | | | | | | | | |
| Term Loan A | Level 2 | | $ | 595 | | | $ | 595 | | | $ | 398 | | | $ | 398 | |
| Term Loan B | Level 2 | | 501 | | 503 | | 506 | | 511 |
| Convertible Notes and Conversion Option | Level 2 | | — | | — | | 350 | | 731 |
| Senior Notes | Level 2 | | 250 | | 231 | | 250 | | 220 |
| Revolver | Level 2 | | 505 | | 505 | | 260 | | 260 |
| Derivative Liability - Warrants | Level 2 | | 33 | | | 33 | | | — | | | — | |
The carrying value of the debt instruments listed above exclude debt issuance costs for the respective instrument. See Note 1211 "Debt and Other Credit Facilities" for the debt issuance costs of these instruments and further discussion of our term loans, convertibles notes,Convertibles Notes, Senior Notes and nonrecourse project debt.Revolver. The decrease in carrying value of the Convertible Notes and conversion option is due to the maturity and settlement of the Convertible Notes on November 1, 2023. See Note 11 "Debt and Other Credit Facilities" for additional information regarding the maturity of the Convertible Notes. See Note 22 "Cash Election and Repurchase of Convertible Notes and Warrant Unwind Agreements" for information regarding the increase in the derivative liability for warrants in 2023.
The following disclosures for foreign currency risk and interest rate risk includes the fair value hierarchy levels for our assets and liabilities that are measured at fair value on a recurring basis.
Foreign currency risk. We conduct business globally in numerous currencies and are therefore exposed to foreign currency fluctuations. We may use derivative instruments to reduce the volatility of earnings and cash flows associated with changes in foreign currency exchange rates. We do not use derivative instruments for speculative trading purposes. We generally utilize foreign exchange forwards and currency option contracts to hedge exposures associated with forecasted future cash flows and to hedge exposures present on our balance sheet.
As of December 31, 2021,29, 2023, the gross notional value of our foreign currency exchange forwards and option contracts used to hedge balance sheet exposures was $49$15 million, all of which had durations of 1816 days or less. We also had approximately $8$3 million (gross notional value) of cash flow hedges which had durations of 296 months or less. The cash flow hedges are primarily related to the British Pound.pound sterling.
The fair value of our balance sheet hedges and cash flow hedges are included in other current assets, other assets, other current liabilities and other current liabilities on our consolidated balance sheets at December 29, 2023, and December 31, 2021, and 2020,2022, respectively. The fair values of these derivatives are considered Level 2 under ASC 820, Fair Value Measurement, as they are based on quoted prices directly observable in active markets.
The following table summarizes the recognized changes in fair value of our balance sheet hedges offset by remeasurement of balance sheet positions. These amounts are recognized in our consolidated statements of operations for the periods presented. The net of our changes in fair value of hedges and the remeasurement of our assets and liabilities is included in other non-operating income (expense) on our consolidated statements of operations.
| | Years ended December 31, |
| Years ended December 31, | | | Years ended December 31, |
| December 29, | | | December 29, | | December 31, |
| Gains (losses) dollars in millions | Gains (losses) dollars in millions | 2021 | | 2020 | Gains (losses) dollars in millions | 2023 | | 2022 |
| Balance Sheet Hedges - Fair Value | Balance Sheet Hedges - Fair Value | $ | — | | | $ | (5) | |
| Balance Sheet Position - Remeasurement | Balance Sheet Position - Remeasurement | (8) | | | 9 | |
| Net | Net | $ | (8) | | | $ | 4 | |
Interest rate risk. We use interest rate swaps to reduce interest rate risk and to manage net interest expense by converting a portion of our LIBOR based loansvariable rate debt under our Senior Credit Facility into fixed-rate loans. In October 2018,debt. During the year ended December 29, 2023, we entered intoamended all of our existing interest rate swap agreements to term SOFR, effective March 2023. We elected to apply the optional expedient in ASC 848 in connection with transitioning our interest rate swaps from LIBOR to term SOFR that allowed the amended swaps to be considered as a notional value of $500 million, which are effective beginning October 2018 and mature in September 2022. Under the October 2018 swap agreements, we receive one-month LIBOR and pay a monthly fixed rate of 3.055% for the termcontinuation of the swaps. Inexisting hedges. As a result, the reference rate transition did not have an impact on our hedge accounting or a material impact to our consolidated financial statements. Additionally, in March 2020,2023, we entered into additional USD and GBP denominated interest rate swap agreements with aagreements.
Our portfolio of interest rate swaps consists of the following:
| | | | | | | | | | | | | | | | | | | | | | | |
| Dollars in millions | Notional Amount at December 29, 2023 | | Pay Fixed Rate (Weighted Average) | | Receive Variable Rate | | Settlement and Termination |
| March 2020 Interest Rate Swaps | $ | 400 | | | 0.89 | % | | Term SOFR | | Monthly through January 2027 |
| September 2022 Interest Rate Swaps (a) | $ | 350 | | | 3.43 | % | | Term SOFR | | Monthly through January 2027 |
| March 2023 Interest Rate Swaps | $ | 205 | | | 3.61 | % | | Term SOFR | | Monthly through January 2027 |
| March 2023 Amortizing Interest Rate Swaps | £ | 116 | | | 3.81 | % | | Term SONIA | | Monthly through November 2026 |
(a)Effective November 2023, the notional value of $400increased to $350 million which are effective beginning October 2022 and maturethrough maturity in January 2027. Under the March 2020 swap agreements, we receive a one-month LIBOR and pay a monthly fixed rate of 0.965% for the term of the swaps.
Our interest rate swaps are reported at fair value using Level 2 inputs. The fair value of the interest rate swaps at December 31, 202129, 2023 was $3a $36 million net liability,asset, of which $10$24 million is included in other current liabilities and $7assets, $18 million is included in other assets.assets and $6 million is included in other liabilities. The unrealized net lossesgains on these interest rate swaps was $3$36 million and is included in AOCL as of December 31, 2021.29, 2023. The fair value of the interest rate swaps at December 31, 20202022, was $33a $48 million liability,net asset, of which $15$19 million is included in other current liabilitiesassets and $18$29 million is included in other liabilities.assets. The unrealized net lossesgains on these interest rate swaps was $33$48 million and is included in AOCL as of December 31, 2020.2022.
Credit Losses. We are exposed to credit losses primarily related to our professional services, project delivery and technologies offered in our STS business segment. We do not consider our GS business segment to be at risk for credit losses because substantially all services within this segment are provided to agencies of the U.S., U.K. and Australian governments. We determined our allowance for credit losses by using a loss-rate methodology, in which we assessed our historical write-off of receivables against our total receivables and contract asset balances over several years. From this historical loss-rate approach, we also considered the current and forecasted economic conditions expected to be in place over the life of our receivables and contract assets.
We monitor our ongoing credit exposure through an active review of our customers’ receivables balance against contract terms and due dates. Our activities include timely performance of our accounts receivable reconciliations, assessment of our aging of receivables, dispute resolution and payment confirmation. We also monitor any change in our historical write-off of receivables utilized in our loss-rate methodology and assess for any forecasted change in market conditions to adjust our credit reserve.
At December 31, 2021, our STS business segment that is subject to credit risk reported approximately $327 million of financial assets consisting primarily of accounts receivable and contract assets, net of allowance for credit losses of $13 million. Based on an aging analysis at December 31, 2021, 84% of our accounts receivable related to this segment was outstanding for less than 90 days.
Sales of Receivables. From time to time, we sell certain receivables to unrelated third-party financial institutions under various accounts receivable monetization programs. One such program is with MUFG Bank, Ltd. (“MUFG”) under a Master Accounts Receivable Purchase Agreement (the “RPA”), which provides the sale to MUFG of certain of our designated eligible receivables, with a significant portion of such receivables being owed by the U.S. government. The receivables sold under the agreements do not allow for recourse for any credit risk related to our customers if such receivables are not collected by the third-party financial institutions. The Company accounts for these receivable transfers as a sale under ASC Topic 860, Transfers and Servicing, as the receivables have been legally isolated from the Company, the financial institution has the right to pledge or exchange the assets received and we do not maintain effective control over the transferred accounts receivable. Our only continuing involvement with the transferred financial assets is as the collection and servicing agent. As a result, the accounts receivable balance on the consolidated balance sheets is presented net of the transferred amount. During the year ended December 31, 2021,29, 2023, the Company has derecognized $2,991$3,077 million of accounts receivables from the balance sheet under these agreements, of which certain receivables totaling $2,957$3,022 million were sold under the MUFG RPA. The fair value of the sold receivables approximated their book value due to their short-term nature. The fees incurred are presented in other non-operating income (expense) on the consolidated statements of operations.
Activity for third-party financial institutions consisted of the following:
| | Year Ended | | Year Ended | |
| Years ended | |
| Years ended | |
| Years ended | |
| Dollars in millions | |
| Dollars in millions | |
| Dollars in millions | Dollars in millions | December 31, 2021 | | December 31, 2020 | |
| Beginning balance | Beginning balance | $ | 112 | | | — | | |
| Beginning balance | |
| Beginning balance | |
| Sale of receivables | |
| Sale of receivables | |
| Sale of receivables | Sale of receivables | 2,991 | | | 779 | | |
| Settlement of receivables | Settlement of receivables | (2,622) | | | (647) | | |
| Cash collection, not yet remitted | — | | | (20) | | |
| Settlement of receivables | |
| Settlement of receivables | |
| Cash collected, not yet remitted | |
| Cash collected, not yet remitted | |
| Cash collected, not yet remitted | |
| Outstanding balances sold to financial institutions | Outstanding balances sold to financial institutions | $ | 481 | | | $ | 112 | | |
| Outstanding balances sold to financial institutions | |
| Outstanding balances sold to financial institutions | |
Other Investments. Other investments include investments in equity securities of privately held companies without readily determinable fair values and are included in other assets on our consolidated balance sheets. These investments are accounted for under the measurement alternative, provided that KBR does not have the ability to exercise significant influence or control over the investees.
In June 2022, we entered into an agreement to invest an additional £80 million in Mura Technology ("Mura"). Funding occurred in two tranches with the first payment made in June 2022 and the second payment made in April 2023, increasing KBR's aggregate investment in Mura to approximately 17%. The additional payment in 2023 increased the carrying value of our investment to $128 million at December 29, 2023. The carrying value of our investment was $83 million at December 31, 2022.
Note 23.21. Recent Accounting Pronouncements
New accounting pronouncements requiring implementation in future periods are discussed below.
In March 2020,November 2023, the FASB issued ASU No. 2020-04, Reference Rate Reform2023-07, Segment Reporting (Topic 848) - Facilitation280): Improvements to Reportable Segment Disclosures. ASU 2023-07 requires disclosure of significant segment expenses that are regularly provided to the chief operating decision maker (“CODM”) and included within each reported measure of segment profit or loss, an amount and description of its composition for other segment items to reconcile to segment profit or loss, and the title and position of the Effectsentity’s CODM. The amendments in this update also expand the interim segment disclosure requirements. ASU 2023-07 will be effective for our 2024 fiscal year and for interim periods starting in our first quarter of the Interbank Offered Rate Transition on Financial Reportingfiscal year 2025. We expect this ASU to provide optional relief from applying generally accepted accounting principlesonly impact our disclosures with no impacts to contracts, hedging relationshipsour results of operations, cash flows and other transactions affected by reference rate reform. financial condition.
In addition, in January 2021,December 2023, the FASB issued ASU No. 2021-01, Reference Rate Reform2023-09, Income Taxes (Topic 848) – Scope,740): Improvements to clarifyIncome Tax Disclosures. The ASU requires that certain optional expedients and exceptions in Topic 848 for contract modifications and hedge accounting apply to derivatives that are affected by the discounting transition. The guidance is effective upon issuance and generally can be applied through December 31, 2022. We are currently evaluating the future impact of adoption of this standard.
In August 2020, the FASB issued ASU No. 2020-06, Debt-Debt Conversion and other Options (Subtopic 470-20) and Derivatives and Hedging - Contracts in Entity's Own Equity (Subtopic 815-40): Accounting for Convertible Instruments and Contracts in an Entity's Own Equity. This guidance simplifies the accounting for convertible instruments by reducing the number of accounting models available for convertible debt instruments. This guidance also eliminates the treasury stock method to calculate diluted earnings per share for certain convertible instruments and requires the use of the if-converted method. ASU 2020-06 is effective for us for annual reporting periods beginning after December 15, 2021, and for interim periods within those annual periods, and can be applied utilizing either a modified or full retrospective transition method. We have adopted this standard as of January 1, 2022 using the full retrospective method. There was no material impact to our consolidated financial statements for the years ended December 31, 2020 and 2021. For the year ending December 31, 2022, the adoption of this standard will not materially impact our financial performance, position or cash flow, but it may result in an increaseentity disclose specific categories in the numbereffective tax rate reconciliation as well as provide additional information for reconciling items that meet a quantitative threshold. Further, the ASU requires certain disclosures of diluted weighted average shares outstanding utilizedstate versus federal income tax expense and taxes paid. The amendments in our diluted income (loss) per share calculation.
In May 2021, the FASB issuedthis ASU No. 2021-04. Earnings Per Share (Topic 260), Debt - Modifications and Extinguishments (Subtopic 470-50), Compensation - Stock Compensation (Topic 718), and Derivatives and Hedging - Contracts in Entity’s Own Equity (Subtopic 815-40): Issuer’s Accounting for Certain Modifications or Exchanges of Freestanding Equity-Classified Written Call Options. This ASU provides guidance for a modification or an exchange of a freestanding equity-classified written call option that is not within the scope of another Topic. It specifically addresses measurement, treatment and recognition of a freestanding equity-classified written call option modification or exchange. ASU No. 2021-04 is effective for all entitiesare required to be adopted for fiscal years beginning after December 15, 2021, including interim periods within2024. Early adoption is permitted for annual financial statements that have not yet been issued. We expect this ASU to only impact our disclosures with no impacts to our results of operations, cash flows and financial condition.
Note 22. Cash Election and Repurchase of Convertible Notes and Warrant Unwind Agreements
Cash Election for Convertible Notes. Upon issuance of the Convertible Notes, we had the right to elect to settle the Convertible Notes in cash, shares of our common stock or a combination of cash and shares of our common stock. As a result, our conversion option qualified for the equity scope exception under ASC 815 Derivatives and Hedging (“ASC 815”) that does not require the conversion option to be accounted for as a separate instrument. The Note Hedge Transactions and Warrant Transactions also qualified for the equity scope exception under ASC 815.
In April 2023, we elected cash as the settlement method to settle the principal and any excess value upon early conversion or maturity of the Convertible Notes and Note Hedge. Upon that election, both instruments no longer qualified for the equity scope exception under ASC 815. The conversion option of the Convertible Notes was deemed to be embedded, which required bifurcation from the host contract, and the Note Hedge was reclassified to a freestanding derivative instrument.
Upon bifurcation of the Convertible Notes' conversion option, we recorded an embedded derivative liability at fair value of $454 million, a debt discount of $350 million reducing the carrying value of our Convertible Notes to zero, and a
those fiscal years,$104 million loss. Upon reclassification of the Note Hedge, we recorded a derivative asset of $454 million at fair value, with an offset of $454 million to PIC. Prior to maturity and should be applied prospectively. The adoptionsettlement on November 1, 2023, any changes related to the fair value of this standard is not expected to have a material impactthe derivative asset were directly offset by the change in fair value of the embedded derivative liability. Upon maturity and settlement of the Convertible Notes and Note Hedge on November 1, 2023, the derivative asset and embedded derivative liability were removed from our financial statements.consolidated balance sheet.
In October 2021,We recorded $282 million of accretion during the FASB issued ASU 2021-08, Business Combinations (Topic 805): Accounting for Contract Assetsyear ended December 29, 2023, and Contract Liabilities from Contractsaccelerated the accretion of $69 million as a loss on debt extinguishment associated with Customers, which requires entitiesthe repurchase of $100 million of Convertible Senior Notes in the second quarter of 2023. At December 29, 2023, all accretion related to recognize and measure contract assets and contract liabilities acquired in a business combination in accordance with ASC 2014-09, Revenue from Contracts with Customers (Topic 606). The update will generally result in an entity recognizing contract assets and contract liabilities at amounts consistent with those recorded by the acquiree immediately before the acquisition date rather than at fair value. The new standard is effective on a prospective basis for fiscal years beginning after December 15, 2022, with early adoption permitted. We are currently evaluating the future impact of adoption of this standard.Convertible Notes has been recognized.
In November 2021, the FASB issued ASU 2021-10, Government Assistance (Topic 832), Disclosures by Business Entities About Government Assistance, which requires entitiesConvertible Senior Notes Repurchase and Unwind Agreements. On June 1, 2023, we entered into privately negotiated transactions to provide disclosures on material government assistance transactions for annual reporting periods. The disclosures include information around the naturerepurchase $100 million in principal amount of the assistance,outstanding Convertible Notes (the “Convertible Notes repurchase”), using funds borrowed under our Revolver to pay the related accounting policies usedpurchase price. Concurrent with the Convertible Notes repurchase, we entered into agreements with the option counterparties to account for government assistance,terminate the effect of government assistance on the entity’s financial statements and any significant terms and conditionscorresponding portions of the agreements, including commitmentsNote Hedge Transactions and contingencies. Warrant Transactions (collectively, the "June Unwind Agreements"). We paid $250 million related to the Convertible Notes repurchase and received a net amount of $49 million related to the Unwind Agreements.
The new standard is effectiveportion of warrants settled in cash during the second quarter of 2023 no longer qualified for usthe equity scope exception under ASC 815 upon execution of the June Unwind Agreements on JanuaryJune 1, 20222023. This resulted in the recognition of a derivative liability of $89 million, with an offset of $89 million to PIC. Upon settlement of the June Unwind Agreements, during the second quarter of 2023 we recognized $12 million in loss due to the change in fair value of the derivative liability between the initial recognition date and only impacts annual financial statement footnote disclosures. Therefore, the adoption will not have a material effectsettlement date. This loss was recorded within "Charges associated with Convertible Notes" on our consolidated financial statements.statement of operations.
The Convertible Notes repurchase was accounted for as a debt extinguishment under ASC 470 Debt (“ASC 470”). ASC 470 requires the settlement consideration of $250 million to be allocated to both the carrying value of the debt instrument and the embedded derivative liability related to the conversion option. We recognized a loss on extinguishment of debt of $70 million due to the difference between the consideration paid of $250 million and the carrying value of the conversion option’s derivative liability and Convertible Notes, net of debt discount on the date of repurchase.
Warrant Unwind Agreements in November 2023. On November 7, 2023, we entered into agreements with the option counterparties to settle the remaining warrants in cash (collectively, the "November Unwind Agreements"). The warrants settled as part of the November Unwind Agreements no longer qualified for the equity scope exception under ASC 815 upon execution of the November Unwind Agreements on November 7, 2023. This resulted in the recognition of a derivative liability of $123 million, with an offset of $123 million to PIC. Upon settlement of the November Unwind Agreements, we recognized $26 million in loss due to the change in fair value of the derivative liability between the initial recognition date and settlement date for each counterparty. This loss was recorded within "Charges associated with Convertible Notes" on our consolidated statement of operations. The Company paid $116 million in December 2023 and $33 million in January 2024 related to the November Unwind Agreements. At December 29, 2023, the derivative liability recorded within Other Current Liabilities on our Consolidated Balance Sheet was $33 million. No warrants were outstanding as of December 29, 2023.
See below for summary of items related to the cash election and repurchase of Convertible Notes and Note Hedge Transactions on our Consolidated Statement of Operations for the year ended December 29, 2023.
| | | | | | | | | | | | | | | | | |
| | | | Year Ended |
| | | | | | | | | |
| Dollars in millions | | | | | December 29, 2023 | | | |
| Consolidated Statement of Operations | | | | | | | | |
| Loss on derivative bifurcation | | | | | $ | 104 | | | | |
| Loss on debt extinguishment | | | | | 70 | | | | |
| Loss on settlement of warrants | | | | | 38 | | | | |
| Accretion of Convertible Notes debt discount | | | | | 282 | | | | |
| Charges associated with Convertible Notes | | | | | $ | 494 | | | | |
| | | | | | | | | |
Item 9.Changes In and Disagreements with Accountants on Accounting and Financial Disclosures
Not applicable.
Item 9A. Controls and Procedures
Management’s Evaluation of Disclosure Controls and Procedures
In accordance with Rules 13a-15(b) under the Securities and Exchange Act of 1934, as amended (the “Exchange Act”), we carried out an evaluation, under the supervision and with the participation of management, including our Chief Executive Officer and Chief Financial Officer, of the effectiveness of our disclosure controls and procedures (as defined in Rules 13a-15(e) and 15d-15(e)) as of the end of the period covered by this report. Our disclosure controls and procedures are designed to ensure that information required to be disclosed in reports filed or submitted under the Exchange Act is accumulated and communicated to our management, including our Chief Executive Officer and Chief Financial Officer, as appropriate, to allow timely decisions regarding required disclosure and is recorded, processed, summarized and reported within the time periods specified in the rules and forms of the SEC. Based on that evaluation, our Chief Executive Officer and Chief Financial Officer concluded that our disclosure controls and procedures were effective as of December 31, 202129, 2023 at the reasonable assurance level.
Management does not expect that our disclosure controls and procedures will prevent all errors and all fraud. A control system, no matter how well designed and operated, can provide only reasonable, not absolute, assurance that the control system's objectives will be met. There are inherent limitations in all control systems, including the realities that judgments in decision-making can be faulty, and that breakdowns can occur because of simple error or mistake. Additionally, controls can be circumvented by the intentional acts of one or more persons. Further, the design of a control system must reflect the fact that there are resource constraints, and the benefits of controls must be considered relative to their costs. The design of any system of controls is based in part upon certain assumptions about the likelihood of future events, and while our disclosure controls and procedures are designed to be effective under circumstances where they should reasonably be expected to operate effectively, there can be no assurance that any design will succeed in achieving its stated goals under all potential future conditions. Because of the inherent limitations in all control systems, no evaluation of controls can provide absolute assurance that all control issues and instances of fraud, if any, have been detected.
Management’s Annual Report on Internal Control Over Financial Reporting
Management is responsible for establishing and maintaining adequate internal control over financial reporting (as defined in Rule 13a-15(f) and Rule 15d-15(f) under the Exchange Act). Our internal control over financial reporting is a process designed by management, under the supervision of our Chief Executive Officer and Chief Financial Officer, to provide reasonable assurance regarding the reliability of financial reporting and the preparation of financial statements for external purposes in accordance with generally accepted accounting principles.
Because of its inherent limitations, internal control over financial reporting may not prevent or detect misstatements. Also, projections of any evaluation of effectiveness to future periods are subject to the risk that controls may become inadequate because of changes in conditions, or that the degree of compliance with the policies or procedures may deteriorate.
Management, including our Chief Executive Officer and Chief Financial Officer, carried out an evaluation of the effectiveness of our internal control over financial reporting as of December 31, 2021.29, 2023. In conducting this evaluation, our management used the criteria for effective internal control over financial reporting described in Internal Control-Integrated Framework (2013) issued by the Committee of Sponsoring Organizations of the Treadway Commission. Based on that evaluation, management has determined our internal control over financial reporting was effective as of December 31, 2021.
As disclosed in Note 4 to our consolidated financial statements, we acquired Frazer-Nash Consultancy Limited and Harmonic Limited during 2021. As permitted by guidelines established by the Securities and Exchange Commission for newly acquired businesses, we excluded these acquisitions from the scope of our annual report on internal controls over financial reporting for the year ended December 31, 2021. These acquisitions comprised approximately $39 million of our consolidated total assets as of December 31, 2021 and $43 million of our consolidated revenues for the year ended December 31, 2021. We are in the process of integrating these businesses into our overall internal controls over financial reporting and plan to include them in our scope for the year ended December 31, 2022.29, 2023.
The effectiveness of our internal control over financial reporting as of December 31, 202129, 2023 has been audited by KPMG LLP, an independent registered public accounting firm, as stated in their report, which is included in this Annual Report on Form 10-K.
Changes in Internal Control Over Financial Reporting
There have been no changes in our internal control procedures over financial reporting that have materially affected, or are reasonably likely to materially affect, our internal controls over financial reporting during the quarter ended December 31, 2021.29, 2023.
Report of Independent Registered Public Accounting Firm
To the Shareholders and Board of Directors
KBR, Inc.:
Opinion on Internal Control Over Financial Reporting
We have audited KBR, Inc. and subsidiaries’subsidiaries' (the Company) internal control over financial reporting as of December 31, 2021,29, 2023, based on criteria established in Internal Control - – Integrated Framework (2013) issued by the Committee of Sponsoring Organizations of the Treadway Commission. In our opinion, the Company maintained, in all material respects, effective internal control over financial reporting as of December 31, 2021,29, 2023, based on criteria established in IInternalnternal Control -– Integrated Framework (2013) issued by the Committee of Sponsoring Organizations of the Treadway Commission.
We also have audited, in accordance with the standards of the Public Company Accounting Oversight Board (United States) (PCAOB), the consolidated balance sheets of the Company as of December 29, 2023 and December 31, 2021 and 2020,2022, the related consolidated statements of operations, comprehensive income (loss), shareholders’ equity, and cash flows for each of the fiscal years in the three-year period ended December 31, 2021,29, 2023, and the related notes and financial statement schedule II (collectively, the consolidated financial statements), and our report dated February 22, 202220, 2024 expressed an unqualified opinion on those consolidated financial statements.
The Company acquired Frazer-Nash Consultancy Limited and Harmonic Limited during 2021, and management excluded from its assessment of the effectiveness of the Company’s internal control over financial reporting as of December 31, 2021, Frazer-Nash Consultancy Limited and Harmonic Limited's internal control over financial reporting associated with total assets of $39 million and total revenues of $43 million included in the consolidated financial statements of the Company as of and for the year ended December 31, 2021. Our audit of internal control over financial reporting of the Company also excluded an evaluation of the internal control over financial reporting of Frazer-Nash Consultancy Limited and Harmonic Limited..
Basis for Opinion
The Company’s management is responsible for maintaining effective internal control over financial reporting and for its assessment of the effectiveness of internal control over financial reporting, included in the accompanying Management's Annual Report on Internal Control Over Financial Reporting. Our responsibility is to express an opinion on the Company’s internal control over financial reporting based on our audit. We are a public accounting firm registered with the PCAOB and are required to be independent with respect to the Company in accordance with the U.S. federal securities laws and the applicable rules and regulations of the Securities and Exchange Commission and the PCAOB.
We conducted our audit in accordance with the standards of the PCAOB. Those standards require that we plan and perform the audit to obtain reasonable assurance about whether effective internal control over financial reporting was maintained in all material respects. Our audit of internal control over financial reporting included obtaining an understanding of internal control over financial reporting, assessing the risk that a material weakness exists, and testing and evaluating the design and operating effectiveness of internal control based on the assessed risk. Our audit also included performing such other procedures as we considered necessary in the circumstances. We believe that our audit provides a reasonable basis for our opinion.
Definition and Limitations of Internal Control Over Financial Reporting
A company’s internal control over financial reporting is a process designed to provide reasonable assurance regarding the reliability of financial reporting and the preparation of financial statements for external purposes in accordance with generally accepted accounting principles. A company’s internal control over financial reporting includes those policies and procedures that (1) pertain to the maintenance of records that, in reasonable detail, accurately and fairly reflect the transactions and dispositions of the assets of the company; (2) provide reasonable assurance that transactions are recorded as necessary to permit preparation of financial statements in accordance with generally accepted accounting principles, and that receipts and expenditures of the company are being made only in accordance with authorizations of management and directors of the company; and (3) provide reasonable assurance regarding prevention or timely detection of unauthorized acquisition, use, or disposition of the company’s assets that could have a material effect on the financial statements.
Because of its inherent limitations, internal control over financial reporting may not prevent or detect misstatements. Also, projections of any evaluation of effectiveness to future periods are subject to the risk that controls may become inadequate because of changes in conditions, or that the degree of compliance with the policies or procedures may deteriorate.deteriorate.
/s/ KPMG LLP
Houston, Texas
February 22, 202220, 2024
Item 9B. Other Information
Not applicable.
Item 9C. Disclosure Regarding Foreign Jurisdictions that Prevent Inspections
Not applicable.
PART III
Item 10. Directors, Executive Officers and Corporate Governance
The information required by this Item is incorporated herein by reference to the KBR, Inc. Company Proxy Statement for our 20222024 Annual Meeting of Stockholders.
KBR has adopted a “code of ethics,” as defined in Item 406(b) of SEC Regulation S-K. KBR’s code of ethics, known as the Code of Business Conduct, applies to all directors, officers and employees of KBR, including our principal executive officer, principal financial officer, principal accounting officer and controllers and also applies to all employees of KBR’s agents. The Code of Business Conduct is available on our website, www.kbr.com. KBR intends to satisfy the disclosure requirements regarding amendments to, or waivers from, any provision of the Code of Business Conduct by posting such information on our website.
Item 11. Executive Compensation
The information required by this Item is incorporated herein by reference to the KBR, Inc. Company Proxy Statement for our 20222024 Annual Meeting of Stockholders.Stockholders, except as to information required pursuant to Item 402(v) of SEC Regulation S-K relating to pay versus performance.
Item 12. Security Ownership of Certain Beneficial Owners and Management and Related Stockholder Matters
The information required by this Item is incorporated herein by reference to the KBR, Inc. Company Proxy Statement for our 20222024 Annual Meeting of Stockholders.
Item 13. Certain Relationships and Related Transactions, and Director Independence
The information required by this Item is incorporated herein by reference to the KBR, Inc. Company Proxy Statement for our 20222024 Annual Meeting of Stockholders.
Item 14. Principal Accounting Fees and Services
The information required by this Item is incorporated herein by reference to the KBR, Inc. Company Proxy Statement for our 20222024 Annual Meeting of Stockholders.
PART IV
Item 15. Exhibits and Financial Statement Schedules.
| | | | | |
| (a) | The following documents are filed as part of this report or incorporated by reference: |
| 1. | The consolidated financial statements of KBR listed on page 6065 of this annual report on Form 10-K. (The report of KBR Inc.'s independent registered public accounting firm (PCAOB ID: 185) with respect to the above referenced financial statements are included in Item 8 and Item 9A of this Form 10-K. Their consent appears as Exhibit 23 of this Form 10-K. |
| 2. | The exhibits of KBR listed below under Item 15(b); all exhibits are incorporated herein by reference to a prior filing as indicated, unless designated by a * or **. |
| (b) | Exhibits: |
EXHIBIT INDEX
| | | | | | | | |
Exhibit
Number | | Description |
| | |
| 3.1 | | |
| | |
| 3.2 | | |
| | |
| 4.1 | | |
| | |
| 4.2 | | |
| | |
4.3 | | |
| | |
4.4 | | |
| | |
4.54.3 | | |
| | |
4.64.4 | | |
| | |
4.74.5 | | |
| | |
| 10.1 | | |
| | |
| 10.2 | | |
| | |
| 10.3 | | |
| | |
10.4 | | |
| | |
10.510.4 | | |
| | |
10.610.5 | | Credit Agreement, dated as of April 25, 2018, by and among KBR, Inc., Bank of America, N.A., as Administrative Agent, Swing Line Lender and a Letter of Credit Issuer, and the other lenders party thereto (incorporated by reference to Exhibit 10.1 to KBR’s current report on Form 8-K filed April 27, 2018; File No. 001-33146) |
| | |
10.710.6 | | First Amendment to Credit Agreement, dated November 12, 2018, among KBR, Inc., Bank of America, N.A., as Administrative Agent, Swing Line Lender and a Letter of Credit Issuer, and the other lenders party thereto (incorporated by reference to Exhibit 10.1 to KBR’s current report on Form 8-K filed November 13, 2018; File No. 001-33146) |
| | |
10.810.7 | | |
| | |
| | | | | | | | |
10.1110.10 | | |
| | |
10.1210.11 | | GuarantyAmendment No. 6 to Credit Agreement, dated as of May 18, 2016 by17, 2022, with Bank of America, N.A., as administrative agent, swing line lender and betweena letter of credit issuer, the lenders party thereto, and each of the subsidiaries of KBR Inc. in favor of Wyle Inc.party thereto (incorporated by reference to Exhibit 10.1 to KBR's current report on Form 8-K filed May 23, 2016;17, 2022; File No. 001-33146) |
| | |
10.1310.12 | | GuarantyAmendment No. 7 to the Credit Agreement, dated as of August 12, 2016 byDecember 30, 2022, with Bank of America, N.A., as administrative agent, swing line lender and betweena letter of credit issuer, the lenders party thereto and each of the subsidiaries of KBR Inc. in favor of Honeywell International Inc.party thereto (incorporated by reference to Exhibit 10.1 to KBR's current report on Form 8-K filed August 12, 2016;December 30, 2022; File No. 001-33146) |
| | |
10.1410.13 | | Guaranty,Amendment No. 8 to the Credit Agreement, dated as of February 22, 2018, by6, 2023, with Bank of America, N.A., as administrative agent, swing line lender and betweena letter of credit issuer, the lenders party thereto and each of the subsidiaries of KBR Inc. and Kamco Holdings, Inc.party thereto (incorporated by reference to Exhibit 10.1 to KBR’sKBR's current report on Form 8-K filed February 23, 2018;6, 2023; File No. 001-33146) |
| | |
10.1510.14 | | Commitment Letter, effectiveAmendment No. 9 to the Credit Agreement, dated as of February 22, 2018, by and amongJune 6, 2023, with Bank of America, N.A., Merrill Lynch, Pierce, Fenner & Smith Incorporatedas administrative agent, swing line lender and KBR, Inc. (incorporated by reference to Exhibit 10.2 to KBR’s current report on Form 8-K filed February 23, 2018; File No. 001-33146) |
| | |
10.16 | | Purchase Agreement, dated November 12, 2018, among KBR, Inc., Merrill Lynch, Pierce, Fenner & Smith Incorporateda letter of credit issuer, the lenders party thereto and each of the other initial purchasers named in Schedule Asubsidiaries of the Company party thereto (incorporated by reference to Exhibit 10.1 to KBR’s current report on Form 8-K filed November 16, 2018;June 8, 2023; File No. 001-33146) |
| | |
| 10.15 | |
|
| | |
| 10.16 | | |
| | |
| 10.17 | | LetterAmendment No. 12 to the Credit Agreement, dated November 12, 2018,as of February 7, 2024 with Bank of America, N.A., as administrative agent, swing line lender and a letter of credit issuer, the lenders party thereto and each of the subsidiaries of the Company party thereto (incorporated by reference to Exhibit 10.1 to KBR’s current report on Form 8-K filed on February 13, 2024, File No. 001-33146) |
| | |
| 10.18 | | |
| | |
10.1810.19 | | |
| | |
10.1910.20 | | LetterWarrant Amendment Agreement, dated November 12, 2018,June 1, 2023, between KBR, Inc. and Citibank, N.A., regarding the Convertible Note Hedge Transactions (incorporated by reference to Exhibit 10.410.3 to KBR’s currentquarterly report on Form 8-K10-Q for the period ended June 30, 2023 filed November 16, 2018;on July 27, 2023; File No. 001-33146) |
| | |
10.20*10.21 | | |
| | |
10.21*10.22 | | |
| | |
10.22*10.23 | | |
| | |
10.23+10.24+ | | |
| | |
10.24+10.25+ | | |
| | |
10.25+10.26+ | | |
| | |
| | | | | | | | |
10.28+10.29+ | | |
| | |
10.29+ | | |
| | |
| 10.30+ | | |
| | |
| 10.31+ | | |
| | |
| 10.32+ | | |
| | |
| 10.33+ | | |
| | |
| 10.34+ | | |
| | |
| 10.35+ | | |
| | |
| 10.36+ | | |
| | |
10.37+ | | |
| | |
10.38+ | | |
| | |
10.39+ | | |
| | |
10.40+ | | |
| | |
10.41+ | | |
| | |
10.42+ | | |
| | |
10.43+ | | |
| | |
10.44+ | | |
| | | | | | | | |
| | |
10.45+ | | |
| | |
10.46+ | | |
| | |
10.47+ | | |
| | |
10.48+10.37+ | | |
| | |
10.49+10.38+ | | |
| | |
10.50+10.39+ | | |
| | |
10.51+10.40+ | | |
| | |
10.52+10.41+ | | |
| | |
| *10.42+ | | |
| 10.53+ | |
| 10.43+ | | |
| | |
10.54+10.44+ | | |
| | |
10.55+10.45+ | | |
| | |
10.56+10.46+ | | |
| | |
10.57+10.47+ | | |
| | |
10.58+10.48+ | | |
| | |
| | | | | | | | |
| 10.49+ | | |
| | |
| 10.50+ | | |
| | |
| 10.51+ | | |
| | |
| 10.52+ | | |
| | |
| 10.53+ | | |
| | |
| 10.54+ | | |
| | |
| 10.55+ | | |
| | |
| 10.56+ | | |
| | |
| 10.57+ | | |
| | |
| 10.58+ | | |
| | |
| 10.59+ | | |
| | |
| 10.60+ | | |
| | |
| 10.61+ | | |
| | |
| 10.62+ | | |
| | |
| 10.63+ | | |
| | |
| 10.64+ | | |
| | |
| *21.1 | | |
| | |
| *23.1 | | |
| | |
| *31.1 | | |
| | |
| *31.2 | | |
| | |
| **32.1 | | |
| | |
| | | | | | | | |
| ***101 | | The following materials from KBR annual report on Form 10-K for the period ended December 31, 2021,29, 2023, formatted in XBRL (Extensible Business Reporting Language): (i) Consolidated Statements of Operations, (ii) Consolidated Statements of Comprehensive Income (Loss), (iii) Consolidated Balance Sheets, (iv) Consolidated Statements of Shareholders' Equity, (v) Consolidated Statements of Cash Flows, and (vi) Notes to Consolidated Financial Statements |
| | |
| ***104 | | Cover Page Interactive Data File (formatted as Inline XBRL and contained in Exhibit 101) |
| | |
| | | | | | | | |
| + | Management contracts or compensatory plans or arrangements |
| | |
| * | Filed with this annual report on Form 10-K |
| | |
| ** | Furnished with this annual report on Form 10-K |
| | |
| *** | Interactive data files | |
SIGNATURES
Pursuant to the requirements of Section 13 or 15(d) of the Securities Exchange Act of 1934, the registrant has duly caused this report to be signed on its behalf by the undersigned, thereunto duly authorized.
| | | | | |
| KBR, INC. |
| (Registrant) |
| |
| By: | /s/ Stuart J. B. Bradie |
| | Stuart J. B. Bradie |
| President and Chief Executive Officer |
Dated: February 22, 202220, 2024
Pursuant to the requirements of the Securities Exchange Act of 1934, this report has been signed below by the following persons on behalf of the registrant and in the capacities and on the dates indicated:
| | | | | | | | |
| Signature | | Title |
| | |
| /s/ Stuart J. B. Bradie | | Principal Executive Officer, |
| Stuart J. B. Bradie | | President, Chief Executive Officer and Director |
| |
| /s/ Mark W. Sopp | | Principal Financial Officer, |
| Mark W. Sopp | | Executive Vice President and Chief Financial Officer |
| |
| /s/ Shad E. Evans | | Principal Accounting Officer, |
| Shad E. Evans | | Senior Vice President of Finance Operations and Chief Accounting Officer |
| | |
| /s/ Mark E. Baldwin | | Director |
| Mark E. Baldwin | | |
| | |
| /s/ Lynn A. Dugle | | Director |
| Lynn A. Dugle | | |
| | |
| /s/ Lester L. Lyles | | Director |
| Lester L. Lyles | | |
| | |
| /s/ John A. Manzoni | | Director |
| John A. Manzoni | | |
| | |
| /s/ Wendy M. Masiello | | Director |
| Wendy M. Masiello | | |
| | |
| /s/ Jack B. Moore | | Director |
| Jack B. Moore | | |
| | |
| /s/ Ann D. Pickard | | Director |
| Ann D. Pickard | | |
| | |
| /s/ Carlos A. Sabater | | Director |
| Carlos A. Sabater | | |
| | |
| /s/ Umberto della Sala | | Director
Umberto della Sala | | |
| | |
/s/ Vincent R. Stewart | | Director |
Vincent R. Stewart | | |
| | |
Dated: February 22, 202220, 2024
KBR, Inc.
Schedule II—Valuation and Qualifying Accounts
The table below presents valuation and qualifying accounts for continuing operations.
| | | | | | | | | | | | | | | | | | | | | | | | | | | | | |
| (Dollars in Millions) | | | Additions | | | | |
| Descriptions | Balance at
Beginning
Period | | Charged to
Costs and
Expenses | | Charged to
Other
Accounts | | Deductions | | Balance at
End of Period |
| Year ended December 31, 2021: | | | | | | | | | |
| Deducted from accounts and notes receivable: | | | | | | | | | |
| Allowance for credit losses | $ | 13 | | | $ | — | | | $ | — | | | $ | — | (a) | | $ | 13 | |
| Reserve for losses on uncompleted contracts | $ | 16 | | | $ | 4 | | | $ | — | | | $ | (3) | | | $ | 17 | |
| Reserve for potentially disallowable costs incurred under government contracts | $ | 54 | | | $ | 42 | | | $ | — | | | $ | (20) | | | $ | 76 | |
| Year ended December 31, 2020: | | | | | | | | | |
| Deducted from accounts and notes receivable: | | | | | | | | | |
| Allowance for credit losses | $ | 14 | | | $ | 11 | | | $ | — | | | $ | (12) | (a) | | $ | 13 | |
| Reserve for losses on uncompleted contracts | $ | 10 | | | $ | 14 | | | $ | — | | | $ | (8) | | | $ | 16 | |
| Reserve for potentially disallowable costs incurred under government contracts | $ | 58 | | | $ | 24 | | | $ | — | | | $ | (28) | | | $ | 54 | |
| Year ended December 31, 2019: | | | | | | | | | |
| Deducted from accounts and notes receivable: | | | | | | | | | |
| Allowance for credit losses | $ | 9 | | | $ | 13 | | | $ | 3 | (b) | | $ | (11) | (a) | | $ | 14 | |
| Reserve for losses on uncompleted contracts | $ | 6 | | | $ | 12 | | | $ | — | | | $ | (8) | | | $ | 10 | |
| Reserve for potentially disallowable costs incurred under government contracts | $ | 55 | | | $ | 5 | | | $ | — | | | $ | (2) | | | $ | 58 | |
(a)Receivable write-offs, net of recoveries
(b)Reserves of $3 million were recorded as a reduction in revenue
See accompanying report of independent registered public accounting firm.


