`
UNITED STATES
SECURITIES AND EXCHANGE COMMISSION
Washington, D.C. 20549
FORM 10-K
(Mark One)
x ANNUAL REPORT PURSUANT TO SECTION 13 OR 15(d) OF THE SECURITIES EXCHANGE
ACT OF 1934
For the fiscal year ended December 31, 20102011
OR
¨o TRANSITION REPORT PURSUANT TO SECTION 13 OR 15(d) OF THE SECURITIES EXCHANGE
ACT OF 1934
For the transition period from _________ to __________
Commission file number: 1-32733
RESOURCE CAPITAL CORP.
(Exact name of registrant as specified in its charter)
| | |
(State(State or other jurisdiction
of incorporation or organization) | | (I.R.S. Employer Identification No.) |
712 5th Avenue, 12th Floor, New York, NY 10019 |
| (Address of principal executive offices) (Zip code) |
| |
|
| (Registrant’s telephone number, including area code) |
| |
| Securities registered pursuant to Section 12(b) of the Act: |
Common Stock, $.001 par value | | New York Stock Exchange (NYSE) |
| Title of each class | | Name of each exchange on which registered |
Common Stock, $.001 par value | | New York Stock Exchange (NYSE) |
| Securities registered pursuant to Section 12(g) of the Act: |
| None |
Indicate by check mark if the registrant is a well-known seasoned issuer, as defined in Rule 405 of the Securities Act. Yes o No xR
Indicate by check mark if the registrant is not required to file reports pursuant to Section 13 or Section 15(d) of the Act. Yes o No xR
Indicate by check mark whether the registrant (1) has filed all reports required to be filed by Section 13 or 15(d) of the Securities Exchange Act of 1934 during the preceding 12 months (or for such shorter period that the registrant was required to file such reports), and (2) has been subject to such filing requirements for the past 90 days. Yes xR No o
Indicate by check mark whether the registrant has submitted electronically and posted on its corporate Web site, if any, every Interactive Data File required to be submitted and posted pursuant to Rule 405 of Regulation S-T during the preceding 12 months (or for such shorter period that the registrant was required to submit and post such files). Yes o RNo o¨
Indicate by check mark if disclosure of delinquent filers pursuant to Item 405 of Regulation S-K is not contained herein, and will not be contained, to the best of registrant's knowledge, in definitive proxy or information statements incorporated by reference in Part III of this Form 10-K or any amendment to this Form 10-K. xR
Indicate by check mark whether the registrant is a large accelerated filer, an accelerated filer, a non-accelerated filer, or a smaller reporting company. See definition of “large accelerated filer,” “accelerated filer” and “smaller reporting company” in Rule 12b-2 of the Exchange Act.
Large accelerated filer | ¨ | | Accelerated filer | R |
Non-accelerated filer | ¨ | (Do not check if a smaller reporting company) | Smaller reporting company | ¨ |
Indicate by check mark whether the registrant is a shell company (as defined in Rule 12b-2 of the Act). Yes o No xR
The aggregate market value of the voting common equity held by non-affiliates of the registrant, based on the closing price of such stock on the last business day of the registrant’s most recently completed second fiscal quarter (June 30, 2010)2011) was approximately $259,621,338.$432,599,993.
The number of outstanding shares of the registrant’s common stock on March 8, 20112012 was 61,943,67083,173,755 shares.
DOCUMENTS INCORPORATED BY REFERENCE
[None]
RESOURCE CAPITAL CORP. AND SUBSIDIARIES
ON FORM 10-K
| | | |
| | | | |
| | |
| PART I | | |
| | | |
| | Item 1: | | 3 |
| | | |
| | Item 1A: | | 15 |
| | | |
| | Item 1B: | | 3234 |
| | | |
| | Item 2: | | 3234 |
| | | |
| | Item 3: | | 3234 |
| | | |
| | Item 4: | | 3234 |
| | |
| PART II | | |
| | | | |
| Item 5: | | 3235 |
| | | |
| | Item 6: | | 3437 |
| | | |
| | Item 7: | | 3538 |
| | | |
| | Item 7A: | | 6772 |
| | | |
| | Item 8: | | 6974 |
| | | |
| | Item 9: | | 117128 |
| | | |
| | Item 9A: | | 117128 |
| | | |
| | Item 9B: | | 119130 |
| | |
| PART III | | |
| | | |
| | Item 10: | | 119130 |
| | | |
| | Item 11: | | 124134 |
| | | |
| | Item 12: | | 128140 |
| | | |
| | Item 13: | | 130141 |
| | | |
| | Item 14: | | 132145 |
| | |
| PART IV | | |
| | | |
| | Item 15: | | 133146 |
| |
| 135148 |
This report contains certain forward-looking statements. Forward-looking statements relate to expectations, beliefs, projections, future plans and strategies, anticipated events or trends and similar expressions concerning matters that are not historical facts. In some cases, you can identify forward-looking statements by terms such as “anticipate,” “believe,” “could,” “estimate,” “expects,” “intend,” “may,” “plan,” “potential,” “project,” “should,” “will” and “would” or the negative of these terms or other comparable terminology.
Forward-looking statements contained in this report are based on our beliefs, assumptions and expectations regarding our future performance, taking into account all information currently available to us. These beliefs, assumptions and expectations can change as a result of many possible events or factors, not all of which are known to us or are within our control. If a change occurs, our business, financial condition, liquidity and results of operations may vary materially from those expressed in our forward-looking statements. Forward-looking statements we make in this report are subject to various risks and uncertainties that could cause actual results to vary from our forward-looking statements, including:
| | ● | the factors described in this report, including those set forth under the sections captioned “Risk Factors,” “Business,” and “Management’s Discussion and Analysis of Financial Conditions and Results of Operations;” |
| | ● | changes in our industry, interest rates, the debt securities markets, real estate markets or the general economy; |
| | ● | increased rates of default and/or decreased recovery rates on our investments; |
| | ● | availability, terms and deployment of capital; |
| | ● | availability of qualified personnel; |
| | ● | changes in governmental regulations, tax rates and similar matters; |
| | ● | changes in our business strategy; |
| | ● | availability of investment opportunities in commercial real estate-related and commercial finance assets; |
| | ● | the degree and nature of our competition; |
| | ● | the adequacy of our cash reserves and working capital; and |
| | ● | the timing of cash flows, if any, from our investments. |
We caution you not to place undue reliance on these forward-looking statements which speak only as of the date of this report. All subsequent written and oral forward-looking statements attributable to us or any person acting on our behalf are expressly qualified in their entirety by the cautionary statements contained or referred to in this section. Except to the extent required by applicable law or regulation, we undertake no obligation to update these forward-looking statements to reflect events or circumstances after the date of this filing or to reflect the occurrence of unanticipated events.
PART I
General
We are a specialtydiversified real estate finance company that focuses primarily on commercial real estate and commercial finance. We areis organized and conductconducts our operations to qualify as a real estate investment trust, or REIT, for federal income tax purposes under Subchapter M of the Internal Revenue Code of 1986, as amended. Our investment strategy focuses on commercial real estate, and commercial real estate-related assets and, to a lesser extent, commercial finance assets. We invest in the following asset classes: commercial real estate-related assets such as commercial real estate property, whole loans, A-notes, B-notes, mezzanine loans, commercial mortgage back securities and investments in real estate joint ventures as well as commercial finance assets such as bank loans, lease receivables and other asset-back securities, trust preferred securities, debt tranches of collateralize debt obligations, structured note investments and private equity investment principally issued by financial institutions. Our objective is to provide our stockholders with total returns over time, including quarterly distributions and capital appreciation, while seeking to manage the risks associated with our investment strategy. We invest in a combination of real estate-related assets and, to a lesser extent, higher-yielding commercial finance assets. We have financed a substantial portion of our portfolio investments through borrowing strategies seeking to match the maturities and repricing dates of our financings with the maturities and repricing dates of those investments, and have sought to mitigate interest rate risk through derivative instruments.
We are externally managed by Resource Capital Manager, Inc., which we refer to as the Manager, a wholly-owned indirect subsidiary of Resource America, Inc. (NASDAQ: REXI), a specialized asset management company that uses industry specific expertise to evaluate, originate, service and manage investment opportunities through ourits commercial real estate, commercial finance and financial fund management operating segments. As of December 31, 2010,2011, Resource America managed approximately $12.0$13.3 billion of assets in these sectors. To provide its services, the Manager draws upon Resource America, its management team and their collective investment experience.
Our investments target the following asset classes:
| | |
| Commercial real estate-related assets | | ● First mortgage loans, which we refer to as whole loans; ● First priority interests in first mortgage real estate loans, which we refer to as A notes; ● Subordinated interests in first mortgage real estate loans, which we refer to as B notes; ● Mezzanine debt related to commercial real estate that is senior to the borrower’s equity position but subordinated to other third-party financing; ● Commercial mortgage-backed securities, which we refer to as CMBS; and ● Commercial real estate, or CRE, primarily multifamily properties. |
| | |
| Commercial finance assets | | ● Senior secured corporate loans, which we refer to as bank loans; ● Other asset-backed securities, which we refer to as other ABS; ● Lease receivables, principallyPreferred equity investment in a commercial leasing enterprise comprised of small- and middle-ticket commercial direct financing leases and notes; ● Structured note investments and residential mortgage-backed securities, which we refer to as RMBS, which comprise our trading securities portfolio; ● Debt tranches of collateralized debt obligations and collateralized loan obligations, which we refer to as CDOs and CLOs, respectively. |
BeginningDuring 2011, the economic environment became more positive in the second half of 2007, there have been unprecedented disruptionsUnited States which resulted in the credit markets, abrupt and significant devaluations of assets directly or indirectly linkedseveral positive operating developments for us. Our ability to the U.S. real estate finance markets, and the attendant removal of liquidity, both long and short term, fromaccess the capital markets. These conditions have had,markets improved as we raised $83.6 million through our dividend reinvestment and we expect will continue to have, an adverse effect on us and companies we finance, particularly with respect to our legacy commercial real estate related assets. During the years ended December 31, 2010 and 2009, we recorded provisions for loan and lease losses of $43.3 million and $61.4 million, respectively. All of the 2010 provisions are directly attributable to our commercial real estate loan portfolio, which were offset slightly by reductions with respect to the bank loan portfolio. We also recorded net impairment losses of $26.8 million and $13.5 million during the years ended December 31, 2010 and 2009, respectively, on our available-for-sale and held-to-maturity securities. The vast majority of these impairments come from our CMBS portfolio. In addition, we recorded losses through other comprehensive income of $19.3 million and $47.6 million on our available-for-sale portfolio as of December 31, 2010 and 2009, respectively. Based on these trends, our legacy CRE investments worsened, while the bank loan and lease receivable portfolios improved.
The events occurring in the credit markets from the second half of 2007 until mid to late 2010, have impacted our financing and investing strategies and, as a result, our ability to originate new investments and to grow. Historically, we have used CDOs as a principal source of long-term match-funded financing; however, the market for securities issued by new securitizations collateralized by assets similar to those in our investment portfolio had largely disappeared through early to mid 2010. Short-term financing through warehouse lines of credit and repurchase agreements had become largely unavailable and unreliable as increasing volatility in the valuation of assets similar to those we originate had increased the risk of margin calls. During 2010, we began to see the frozen credit markets thaw and we closed on a new $120.0 million securitization with respect to an equipment leasing portfolio in May 2010. In addition, in February 2011, weshare purchase program, or DRIP, entered into a $100.0 million two year term facility with Wells Fargo Bank, National Association in February 2011 to purchase CMBS.CMBS, entered into a $150.0 million repurchase facility with Wells Fargo in February 2012 to originate CRE loans and closed our fourth CLO securitization, Apidos CLO VIII, in October 2011. Our asset quality improved, resulting in substantial decreases in 2011 in both our provision for loan losses (to $13.9 million in 2011 from $43.3 million in 2010) and impairment losses (to $6.9 million in 2011 from $26.8 million in 2010), although we did experience a moderate increase (recorded through other comprehensive income) in losses with respect to our available-for-sale portfolio (to $32.0 million in 2011 from $19.3 million in 2010), which we attribute principally to market factors rather than economic problems with the portfolio assets.
On the asset side,In terms of our investments and investment portfolio growth, we began to see increased opportunities to deploy our capital. We invested $5.0 million through Resource TRS, our taxable REIT subsidiary, in structured finance vehicles, principally CLO equity, which we have classified as trading securities. Because of the success of that new investment, we committed an additional $8.0 million through February 2011. We also began to cautiously reenter the CRE lending market in the fourth quarter of 2010 and through FebruaryDecember 2011 have closed on three13 new whole loans totaling $24.2$159.6 million. We also purchased three newly underwritten18 newly-underwritten CMBS for $7.2$72.8 million in Februaryduring the 12 months ended December 31, 2011 in conjunction with the aforementioned Wells Fargo CMBS facility. Furthermore, in January 2011, we’ve continued to invest in the lease receivable portfolio and made a preferred stock investment in Leaf Commercial Capital, Inc, a recently formed equipment leasing enterprise and a subsidiary of our Manager. In February 2011, we purchased a company that manages $1.9 billion of bank loan assets and are entitled to collect senior, subordinated and incentive management fees. TheseBased upon these recent asset purchases and credit market events, indicate that we expect to be able to invest a significant portion of our available unrestricted and restricted cash balances and, as a result, modestly grow our net interest income in 2011.
2012.
Because of our investments in CREs and the resulting significant tax depreciation charges, we now use Funds from Operations, or FFO, as our primary operating metric to determine distributions to shareholders. We compute FFO in accordance with the standards established by the National Association of Real Estate Investment Trusts, or NAREIT. We expect that our FFO will be greater than our GAAP net income primarily because real estate related depreciation and amortization is not deducted in the calculation for FFO.
We calculate our
Historically, we had calculated distributions to our shareholders based on our estimate of our REIT taxable income, which may vary greatlyincome. We now evaluate our performance based on several performance measures, including FFO and Adjusted Funds from ourOperations, or AFFO, in addition to net income calculatedincome. We compute FFO in accordance with U.S. generally acceptedthe standards established by the National Association of Real Estate Investment Trusts as net income (computed in accordance with GAAP), excluding gains or losses on the sale of depreciable real estate, the cumulative effect of changes in accounting principles, real estate-related depreciation and amortization, and after adjustments for unconsolidated/uncombined partnerships and joint ventures. AFFO is a computation made by analysts and investors to measure a real estate company’s cash flow generated by operations. We calculate AFFO by adding or subtracting from FFO: non-cash impairment losses resulting from fair value adjustments on financial instruments, non-cash provision for loan losses, straight-line rental effects, share based compensation, amortization of various deferred items and intangible assets, gains on debt extinguishment, several REIT tax planning adjustments considered non-recurring by management and capital expenditures that are related to our real estate owned. Management believes that FFO and AFFO are appropriate measures of our operating performance in that they are frequently used by analysts, investors and other parties in the evaluation of REITs. Management uses FFO and AFFO as measures of our operating performance, and believes they are also useful to investors, because they facilitate an understanding of our operating performance after adjustment for certain non-cash items, such as real estate depreciation, share-based compensation and various other items required by GAAP, and capital expenditures, that may not necessarily be indicative of current operating performance and that may not accurately compare our operating performance between periods. While the our calculation of AFFO may differ from the methodology used for calculating AFFO by other REITs and our AFFO may not be comparable to AFFO reported by other REITs, we also believe that FFO and AFFO may provide investors with an additional useful measure to compare its performance with some other REITs. Neither FFO nor AFFO is equivalent to net income or cash generated from operating activities determined in accordance with GAAP. Furthermore FFO and AFFO do not represent amounts available for management’s discretionary use because of needed capital replacement or expansion, debt service obligations or other commitments or uncertainties. Neither FFO nor AFFO should be considered as an alternative to net income as an indicator of our operating performance or as an alternative to cash flow from operating activities as a measure of our liquidity. We expect that our FFO will continue to be greater than REIT taxable income will be comprised primarilyfor several reasons, namely, accelerated tax depreciation from our CRE assets (both wholly-owned and through joint ventures) and the exclusion of our net investment income and our fee income. We expect that our REIT taxable income will be greater than our GAAP net income primarily because asset impairments and provisions for loan and lease losses are not deductible until realized for tax purposes as well as net book to tax adjustments for our taxable foreign REIT subsidiaries and fee income received byfrom our taxable REIT subsidiaries, or TRSs, that is dividended to us and included in ourTRS, from REIT taxable income but deferred or eliminated for GAAP purposes.until that income is paid to us in a dividend. For further discussion, see “Management’s Discussion and Analysis of Financial Condition and Results of Operations.”
Our Business Strategy
The core components of our business strategy are:
Managing our investment portfolio. As of December 31, 2010,2011, we managed $1.9$2.3 billion of assets, including $1.5$1.9 billion of assets financed and held in CDOs. The core of our management process is credit analysis which we use to actively monitor our existing investments and as a basis for evaluating new investments. Senior management of our Manager and Resource America has extensive experience in underwriting the credit risk associated with our targeted asset classes and conducts detailed due diligence on all credit-sensitive investments, including the use of proprietary credit stratifications and collateral stress analysis.analyses. After making an investment, the Manager and Resource America engage in active monitoring of our investments for early detection of troubled and deteriorating assets. If a default occurs, we will use our senior management team’s asset management skillsexperience in seeking to mitigate the severity of any losses, and we will seek to optimize the recovery from assets if we foreclose upon them.
Managing our interest rate and liquidity risk. We generally seek to manage interest rate and liquidity risk so as to reduce the effects of interest rate changes on us. On our long-term financing we seek to match the maturity and repricing dates of our investments with the maturities and repricing dates of our financing. Historically, we have used CDO vehicles structured for us by our Manager to achieve this goal. From 2008 through 2010,2011, we financed new investments predominantly through existing capacity in our CDOs or through cash available from principal repayments on or payoffs of existing investments. As credit markets have begun to reopen, we also expect to cautiously utilize new leverage to finance new investments. We also seek to mitigate interest rate risk through the use of derivative instruments.instruments, principally interest rate swaps and interest rate caps.
Historically, we managedWe manage our interest rate and liquidity risk on our short-term financing, principally repurchase agreements, by limiting the amount of our financial exposure under the facilities to either a stated investment amount or a fixed guaranty amount. AsDuring the past 12 months, as a result of current market conditions,our new Wells Fargo CMBS facility, we had $55.9 million of short-term debt and $15.8 million of derivative instruments associated with this debt as of December 31, 2010 we had paid off our short term repurchase agreements.2011.
Investment in real estate and commercial finance assets. We expect to continue to invest in commercial real estate whole loans, B notes, mezzanine debt, CMBS rated below AAA by Standard & Poors, or S&P, commercial finance assets, including bank loans and to a lesser extent, direct financing leasesother ABS, structured note investments and notes,debt tranches of CDOs and CLOs, subject to the availability of investment funds and financing. Our equity at December 31, 20102011 was invested 76.7%63% in commercial real estate loans, 18.4%31% in commercial bank loans, 3.1%and 6% in lease receivables and 1.8% in structured notes.other investments. In 2011,2012, we expect to recycle liquidity within our CDO structures to make investments and replace loans that have been paid down or paid off and to replace loans that may be sold.sold and to originate new loans through our $150 million Wells Fargo facility closed in February 2012.
Debt repurchase. We have been able to take advantage of market illiquidity that resulted in limited trading of CDO notes issued in our two commercial real estate, or CRE CDO securitizations by buying these debt securities at substantial discounts to par. This strategy, which has generated significant gains on the extinguishment of the debt, has allowed us to mitigate credit losses in our loan and lease portfolio and impairment losses in our investment securities portfolio. In 2010,2011, we bought $91.4$10.0 million par value of our CRE CDO debt, a discount to par of 38%39%, for approximately $56.7$6.1 million. As a result, our gain on the extinguishment of debt for 20102011 was $34.6$3.9 million which offset in part the credit and impairment losses we realized in 2010.2011.
Diversification of investments. We seek to manage our investment risk by maintaining a diversified portfolio of real estate-related and commercial finance assets. As funds become available for investment or reinvestment, we seek to maintain that diversification while allocating our capital to those sectors that we believe are the most economically attractive. The percentage of assets that we may invest in certain of our targeted asset classes is subject to the federal income tax requirements for REIT qualification and the requirements for exclusion from Investment Company Act regulation.
Our Operating Policies and Strategies
Investment guidelines. We have established investment policies, procedures and guidelines that are reviewed and approved by our investment committee and board of directors. The investment committee meets regularly to monitor the execution of our investment strategies and our progress in achieving our investment objectives. As a result of our investment strategies and targeted asset classes, we acquire our investments primarily for income. We do not have a policy that requires us to focus our investments in one or more particular geographic areas.
Financing policies. We have used leverage in order to increase potential returns to our stockholders and for financing our portfolio. We do not speculate on changes in interest rates. While we have identified our leverage targets for each of our targeted asset classes, our investment policies require no minimum or maximum leverage and our investment committee has the discretion, without the need for further approval by our board of directors, to increase the amount of leverage we incur above our targeted range for individual asset classes.classes subject, however to any leverage constraints that may be imposed by existing financing arrangements.
We have historically used borrowing and securitization strategies, substantially through CDOs, to accomplish our long-term match funding financing strategy. Recent creditCredit markets had significantly limited our ability to execute our long term financing strategy. We will continueHowever, we began to looksee positive developments in credit markets during 2011 and we were able to invest our restricted cashaccess new financing. As a result of recent improvements in our CRE CDO structures and reinvesting loan repayments received in new investments. We also willability to access credit markets, we expect to cautiously use leverage through our two Wells Fargo facilities, and other credit arrangements we may be able to obtain to finance new investments where we believe we can achieve attractive risk-adjusted returns in today’s markets.returns.
Hedging and interest rate management strategy. We use derivative financial instruments to hedge a portion of the interest rate risk associated with our borrowings. Under the federal income tax laws applicable to REITs, we generally will be able to enter into transactions to hedge indebtedness that we may incur, or plan to incur, to acquire or carry real estate assets, provided that our total gross income from such hedges and other non-qualifying sources must not exceed 25% of our total gross income. These hedging transactions may include interest rate swaps, collars, caps or floors, puts and calls and options.
Credit and risk management policies. Our Manager focuses its attention on credit and risk assessment from the earliest stage of the investment selection process. In addition, the Manager screens and monitors all potential investments to determine their impact on maintaining our REIT qualification under federal income tax laws and our exclusion from investment company status under the Investment Company Act of 1940. Risks related to portfolio management, including the management of risks related to credit losses, interest rate volatility, liquidity and counterparty credit are generally managed on a portfolio-by-portfolio basis by each of Resource America’s asset management divisions, although there is often interaction and cooperation between divisions in this process.
Our Investment Strategy
General
The following table describes our investment-class allocations and certain characteristics of each class as of December 31, 2010 (dollars in thousands):
| | | | | | | | | | | | | |
| Loans Held for Investment: | | | | | | | | | | | | |
Commercial real estate loans: | | | | | | | | | | | | |
Mezzanine loans | | $ | 117,245 | | | $ | 134,330 | | | | 8.09% | | | | 4.48% | |
B notes | | | 57,451 | | | | 56,644 | | | | 3.41% | | | | 5.62% | |
Whole loans | | | 441,372 | | | | 398,538 | | | | 24.01% | | | | 4.17% | |
Bank loans | | | 856,436 | | | | 850,500 | | | | 51.24% | | | | 3.57% | |
| | | | 1,472,504 | | | | 1,440,012 | | | | 86.75% | | | | | |
| Loans held for sale: | | | | | | | | | | | | | | | | |
Bank loans | | | 4,027 | | | | 4,027 | | | | 0.24% | | | | 3.07% | |
Commercial loans | | | 24,566 | | | | 24,566 | | | | 1.48% | | | | 5.90% | |
| | | | 28,593 | | | | 28,593 | | | | 1.72% | | | | | |
| Investments in Available-for-Sale Securities: | | | | | | | | | | | | | | | | |
CMBS | | | 83,224 | | | | 63,938 | | | | 3.85% | | | | 5.08% | |
Other ABS | | | − | | | | 22 | | | | −% | | | | −% | |
| | | | 83,224 | | | | 63,960 | | | | 3.85% | | | | | |
| Investment Securities-Trading: | | | | | | | | | | | | | | | | |
Structured notes | | | 7,984 | | | | 17,723 | | | | 1.07% | | | | −% | |
| | | | | | | | | | | | | | | | | |
Investment in lease receivables: | | | 109,682 | | | | 109,612 | | | | 6.61% | | | | 10.50% | |
Total portfolio/weighted average | | $ | 1,701,987 | | | $ | 1,659,900 | | | | 100.00% | | | | | |
Our Investment Strategy
General
The following table describes our investment-class allocations and certain characteristics of each class as of December 31, 2011 (dollars in thousands):
| | | | | | | | | | | | | |
| Loans Held for Investment: | | | | | | | | | | | | |
Commercial real estate loans: | | | | | | | | | | | | |
Mezzanine loans | | $ | 67,874 | | | $ | 67,046 | | | | 3.26% | | | | 4.88% | |
B notes | | | 16,435 | | | | 16,338 | | | | 0.80% | | | | 8.68% | |
Whole loans | | | 544,673 | | | | 522,937 | | | | 25.45% | | | | 4.81% | |
Bank loans | | | 1,170,599 | | | | 1,142,907 | | | | 55.63% | | | | 4.03% | |
Loans receivable-related party | | | 9,497 | | | | 9,497 | | | | 0.46% | | | | 8.35% | |
| | | | 1,809,078 | | | | 1,758,725 | | | | 85.60% | | | | | |
| Loans held for sale: | | | | | | | | | | | | | | | | |
Bank loans | | | 3,154 | | | | 3,154 | | | | 0.15% | | | | 1.94% | |
| | | | 3,154 | | | | 3,154 | | | | 0.15% | | | | | |
| Investments in Available-for-Sale Securities: | | | | | | | | | | | | | | | | |
CMBS | | | 161,512 | | | | 132,820 | | | | 6.46% | | | | 4.69% | |
ABS (2) | | | 28,513 | | | | 25,224 | | | | 1.23% | | | | 2.79% | |
| | | | 190,025 | | | | 158,044 | | | | 7.69% | | | | | |
| Investment Securities-Trading: | | | | | | | | | | | | | | | | |
Structured notes | | | 27,345 | | | | 31,553 | | | | 1.54% | | | | N/A (3) | |
RMBS | | | 8,729 | | | | 7,120 | | | | 0.35% | | | | N/A (3) | |
| | | | 36,074 | | | | 38,673 | | | | 1.89% | | | | | |
| Other (non-interest bearing): | | | | | | | | | | | | | | | | |
Investment in real estate | | | 48,027 | | | | 48,027 | | | | 2.34% | | | | N/A | |
Investment in unconsolidated entities | | | 47,899 | | | | 47,899 | | | | 2.33% | | | | N/A | |
| | | | 95,926 | | | | 95,926 | | | | 4.67% | | | | | |
Total portfolio/weighted average | | $ | 2,134,257 | | | $ | 2,054,522 | | | | 100.00% | | | | | |
| (1) | The fair value of our investments represents our management’s estimate of the price that a market participant would pay for such assets. Management bases this estimate on the underlying interest rates and credit spreads for fixed-rate securities and, to the extent available, quoted market prices. |
| (2) | ABS includes both ABS and Other ABS investments. The fair value of the ABS includes $23,000 fair value for Other ABS at December 31, 2011. ABS includes both ABS and Other ABS investments. The fair value of the ABS includes $23,000 fair value for Other ABS at December 31, 2011. |
| (3) | There is no stated rate associated with these securities. |
Commercial Real Estate-Related Investments
Whole loans. We originate primarily first mortgage loans, or whole loans, directly to borrowers. The direct origination of whole loans enables us to better control the structure of the loans and to maintain direct lending relationships with the borrowers. We may create senior tranches of a loan, consisting of an A note (described below), B notes (described below), mezzanine loans or other participations, which we may hold or sell to third parties. We do not obtain ratings on these investments. At origination, our whole loan investments had loan to value, or LTV, ratios of up to 80%. We expect to hold our whole loans to their maturity. Since the beginning of 2008 through December 31, 2010,2011, we modified 2726 commercial real estate loans, or CRE loans.
Senior interests in whole loans (A notes). We invest in senior interests in whole mortgage loans, referred to as A notes, either directly originated or purchased from third parties. We do not obtain ratings on these investments. At the date of investment, our A note investments had LTV ratios of up to 70%. We expect to hold our A note investments to their maturity.
Subordinate interests in whole loans (B notes). We invest in subordinate interests in whole loans, referred to as B notes, which we either directly originate or purchase from third parties. B notes are loans secured by a first mortgage but are subordinated to an A note. The subordination of a B note is generally evidenced by an intercreditor or participation agreement between the holders of the A note and the B note. In some instances, the B note lender may require a security interest in the stock or partnership interests of the borrower as part of the transaction. B note lenders have the same obligations, collateral and borrower as the A note lender, but typically are subordinated in recovery upon a default to the A note lender. B notes share certain credit characteristics with second mortgages in that both are subject to greater credit risk with respect to the underlying mortgage collateral than the corresponding first mortgage or A note. We do not obtain ratings on these investments. At the date of investment, our B note investments had LTV ratios of between 55% and 80%. Typical B note investments will have terms of three years to five years, and are generally structured with an original term of up to three years, with one-year extensions that bring the loan to a maximum term of five years. We expect to hold our B note investments to their maturity.
In addition to the interest payable on the B note, we may earn fees charged to the borrower under the note or additional income by receiving principal payments in excess of the discounted price (below par value) we paid to acquire the note. Our ownership of a B note with controlling class rights may, in the event the financing fails to perform according to its terms, cause us to elect to pursue our remedies as owner of the B note, which may include foreclosure on, or modification of, the note. In some cases, the owner of the A note may be able to foreclose or modify the note against our wishes as owner of the B note. As a result, our economic and business interests may diverge from the interests of the owner of the A note.
Mezzanine financing. We invest in mezzanine loans that are senior to the borrower’s equity in, and subordinate to a first mortgage loan on, a property. These loans are secured by pledges of ownership interests, in whole or in part, in entities that directly own the real property. In addition, we may require other collateral to secure mezzanine loans, including letters of credit, personal guarantees of the principals of the borrower, or collateral unrelated to the property. We may structure our mezzanine loans so that we receive a stated fixed or variable interest rate on the loan as well as a percentage of gross revenues and a percentage of the increase in the fair market value of the property securing the loan, payable upon maturity, refinancing or sale of the property. Our mezzanine loans may also have prepayment lockouts, penalties, minimum profit hurdles and other mechanisms to protect and enhance returns in the event of premature repayment. At the date of investment,Historically, at inception, our mezzanine investments had LTV ratios between 65% and 90%. We expect the stated maturity of our mezzanine financings to range from three to five years. Mezzanine loans may have maturities that match the maturity of the related mortgage loans but may have shorter or longer terms. We expect to hold these investments to maturity.
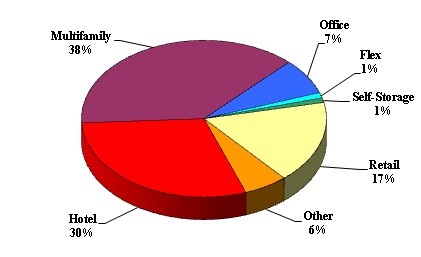
The following charts describe the loan type, property type and the geographic breakdown of our commercial real estate loan portfolio as of December 31, 20102011 (based on par value):
Loan Type
Property Type
Geographic by State
Property Type
Geographic Area By State
As these charts demonstrate, our portfolio contains a diversified mix of property types with approximately 93%92% of the portfolio focusfocusing on four types, Multifamily 27%types: Multifamily−38%, Office 23%Hotel−30%, Hotel 32%Retail−17% and Retail 11%Office−7%.
Our geographic mix includes approximately 38%42% of our portfolio in California, which we split into Southern (26%(28%) and Northern (12%(14%) regions. Within the Southern California region, we have 90%99% of our portfolio in whole loans with 79% in three property types, Hotel Hotel−49%, Office 16%Retail−22% and Retail 13%Multifamily−9%. Within the Northern CACalifornia region, we have 81%92% of our portfolio in whole loans with 81%92% in two property types, Multifamily 50%types: Multifamily−63% and Retail 31%Retail−29%. As noted in these statistics, this portfolio is made up primarily of whole loans where we are able to better control the structure of the loan and maintain a direct lending relationship with the borrower. We view the investment and credit strategy as being adequately diversified across property type and loan type across both the Southern and Northern California regions.
CMBS. We invest in CMBS, which are securities that are secured by or evidence interests in a pool of mortgage loans secured by commercial properties. These securities may be senior or subordinate and may be either investment grade or non-investment grade. The majority of our CMBS investments have been rated by at least one nationally recognized rating agency.
The yields on CMBS depend on the timely payment of interest and principal due on the underlying mortgage loans and defaults by the borrowers on such loans may ultimately result in deficiencies and defaults on the CMBS. In the event of a default, the trustee for the benefit of the holders of CMBS has recourse only to the underlying pool of mortgage loans and, if a loan is in default, to the mortgaged property securing such mortgage loan. After the trustee has exercised all of the rights of a lender under a defaulted mortgage loan and the related mortgaged property has been liquidated, no further remedy will be available. However, holders of relatively senior classes of CMBS will be protected to a certain degree by the structural features of the securitization transaction within which such CMBS were issued, such as the subordination of the relatively more junior classes of the CMBS.
Commercial Real Estate Investments
In 2011, we began to invest directly in ownership of commercial real estate as we restructured two real estate loans to take control of properties where we believe we can protect capital and ultimately generate capital appreciation. We also acquired two multifamily real estate assets, one through a joint venture and another as wholly-owned by us. We primarily use a related-party, Resource Real Estate, a subsidiary of Resource America to manage these assets on our behalf.
Other Real Estate Investments
We invest in joint ventures and other interests that finance the acquisition of distressed commercial properties and mortgage loans on distressed commercial properties. These interests have the objective of repositioning the directly owned properties and the collateral underlying the mortgages, where applicable, to enhance their value and realize capital appreciation. During 2010,2011, these investments did not constitute a material portion of our assets. During 2011,2012, depending upon our capital position, credit market conditions and the availability of investment opportunities, we may seek to expand our investments in this area. Our investment is included in investments in unconsolidated subsidiaries at December 31, 20102011 on our consolidated balance sheet.
Structured note investments and Residential Real Estate-Related Investments, or RMBS
Historically, we had investedWe invest in agencystructured note investments and RMBS and non-agency ABS-RMBS portfolios. We soldas part of our agency RMBS portfolio in September 2006. We sold thesetrading portfolio. Structured note investments are investments in 2006structured finance vehicles, principally CLO equity, which we have classified as trading securities. These securities are typically subordinate to investment grade or non-investment grade assets. The majority of our structured notes have not been rated by any nationally recognized rating agencies. These bonds pay subordinated share payments typically quarterly and 2007.payments are determined through the waterfall of the structured vehicle in which we have purchased an interest. We also invest in RMBS, which are securities that are secured by or evidence by good interests in a pool of residential mortgage loans. These securities may be issued by government-sponsored agencies or other entities and may or may not be rated investment grade by rating agencies. We expect that our RMBS will include loan pools with home equity loans (loans that are secured by subordinate liens), residential B or C loans (loans where the borrower’s FICO score, a measure used to rate the financial strength of the borrower, is low, generally below 625), “Alt-A” loans (where the borrower’s FICO score is between 675 and 725) and “high LTV” loans (loans where the LTV 95% or greater).
Commercial Finance Investments
Subject to limitations imposed by REIT qualification standards and requirements for exclusion from regulation under the Investment Company Act of 1940, which we refer to as the Investment Company Act, we may invest in the following commercial finance assets:
Bank loans. We acquire senior and subordinated, secured and unsecured loans made by banks or other financial entities. Bank loans may also include revolving credit facilities, under which the lender is obligated to advance funds to the borrower under the credit facility as requested by the borrower from time to time. We expect that some amount of these loans will be secured by mortgages and liens on the assets of the borrowers. Certain of these loans may have an interest-only payment schedule, with the principal amount remaining outstanding and at risk until the maturity of the loan. These loans may include restrictive financial and operating covenants. We also have invested, to a lesser extent, in bonds which pay holders a coupon periodically until maturity of the bonds, when the face value is due.
The following chart describes the industry breakdown of our bank loans as of December 31, 2010 (based on par value):
Bank Loans by Industry
(1) All other is made up of the following industries (by percentage):
Diversified/conglomerate manufacturing | 3.3% |
Leisure, amusement, motion pictures, entertainment | 3.1% |
Aerospace and defense | 3.0% |
Hotels, motels, inn and gaming | 2.4% |
Finance | 1.9% |
Machinery (non-agriculture, non-construction, non-electronic) | 1.7% |
Ecological | 1.6% |
Cargo transport | 1.5% |
Utilities | 1.4% |
Oil and gas | 1.3% |
Buildings and real estate | 1.3% |
Diversified natural resources, precious metals and minerals | 1.2% |
Personal and nondurable consumer products (mfg. only) | 1.2% |
Mining, steel, iron and non-precious metals | 1.1% |
Farming and agriculture | 1.0% |
Packaging and forest products | 0.9% |
Beverage, food and tobacco | 0.6% |
Containers, packaging and glass | 0.6% |
Home and office furnishings, housewares and durable consumer products | 0.4% |
Textiles and leather | 0.3% |
Temporary staffing | 0.1% |
Insurance | 0.1% |
Lease receivables. We invest in small- and middle-ticket full payout lease receivables. Under full payout leases and notes, the payments we receive over the term of the financing will return our invested capital plus an appropriate return without consideration of the value of the leased equipment at the end of the lease or note term, known as the residual, and the obligor will acquire the equipment at the end of the payment term. We focus on equipment and other assets that are essential for businesses to conduct their operations so that end users will be highly motivated to make required monthly payments. We focus on equipment in the following areas:
| ●
| general office equipment, such as office machinery, furniture and telephone and computer systems; |
| ●
| medical and dental practices and equipment for diagnostic and treatment use; |
| ●
| energy and climate control systems; |
| ●
| industrial equipment, including manufacturing, material handling and electronic diagnostic systems; and |
| ●
| agricultural equipment and facilities. |
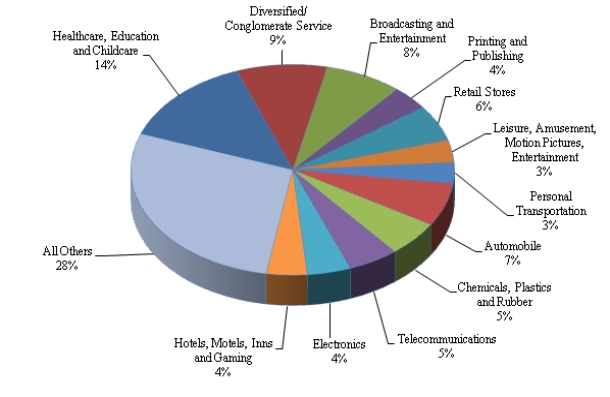
The following charts describechart describes the industry and the geographic breakdown of our lease receivablesbank loans as of December 31, 20102011 (based on par value):
Lease ReceivablesBank Loans by Industry
| Personal, Food and Miscellaneous Services | 3.2% |
| CDO | 2.6% |
| Aerospace and Defense | 2.5% |
| Diversified/conglomerate manufacturing | 2.4% |
| Mining, Steel, Iron and Non-Precious Metals | 2.0% |
| Buildings and Real Estate | 1.7% |
| Finance | 1.4% |
| Packaging and Forest Products | 1.4% |
| Containers, Packaging and Glass | 1.4% |
| Diversified Natural Resources, Precious Metals and Minerals | 1.2% |
| Personal and Non Durable Consumer Products (Mfg. Only) | 1.2% |
| Beverage, Food and Tobacco | 1.1% |
| Oil and Gas | 1.0% |
| Ecological | 0.9% |
| Cargo Transport | 0.8% |
| Home and Office Furnishings, Housewares and Durable Consumer Products | 0.7% |
| Machinery (Non-Agriculture, Non-Construction, Non-Electronic) | 0.7% |
| Utilities | 0.7% |
| Insurance | 0.3% |
| Farming and Agriculture | 0.2% |
| Grocery | 0.2% |
| Textiles and Leather | 0.2% |
| Contractor - Specialty Services | 0.1% |
| Consumer Non-Durables | 0.1% |
Geographic by State

Trust preferred securities and other ABS. We have one investment (less than 0.1% of our total assets) in trust preferred securities. Trust preferred securities are issued by a special purpose trust that holds a subordinated debenture or other debt obligation issued by a company to the trust. The sponsoring company holds the equity interest in the trust, with the preferred securities of the trust being sold to investors. The trust invests the proceeds of the preferred securities in the sponsoring company through the purchase of a debenture issued by it that tracks the terms of the trust preferred securities. Issuers of trust preferred securities have been generally affiliated with financial institutions because, under then-existing regulatory and tax structures, unlike the proceeds from debt securities the proceeds from trust preferred securities could be treated as primary regulatory capital by the financial institution, while it could deduct the interest it paid on the debt obligation held by the trust from its income for federal income tax purposes.
Competition
See Item 1A “Risk Factors” - “RisksFactors -Risks Relating to Our Business”Business.”
Management Agreement
We have a management agreement with the Manager and Resource America under which the Manager provides the day-to-day management of our operations. The management agreement requires the Manager to manage our business affairs in conformity with the policies and the investment guidelines established by our board of directors. The Manager’s role as manager is under the supervision and direction of our board of directors. The Manager is responsible for the selection, purchase and sale of our portfolio investments, our financing activities, and providing us with investment advisory services. The Manager also provides us with a Chairman of the Board, a Chief Financial Officer, threeseveral accounting professionals and an investor relations officer (on a shared basis). The Manager receives fees and is reimbursed for its expenses as follows:
| | ● | A monthly base management fee equal to 1/12th of the amount of our equity multiplied by 1.50%. Under the management agreement, ‘‘equity’’ is equal to the net proceeds from any issuance of shares of common stock less offering-related costs, plus or minus our retained earnings (excluding non-cash equity compensation incurred in current or prior periods) less any amounts we have paid for common stock repurchases. The calculation is adjusted for one-time events due to changes in accounting principles generally accepted in the United States, which we refer to as GAAP, as well as other non-cash charges, upon approval of our independent directors. |
| | ● | Incentive compensation, calculated as follows: (i) 25% of the dollar amount by which (A) our adjusted operating earnings (before incentive compensation but after the base management fee) for such quarter per common share (based on the weighted average number of common shares outstanding for such quarter) exceeds (B) an amount equal to (1) the weighted average of the price per share of the common shares in the initial offering by us and the prices per share of the common shares in any subsequent offerings by us, in each case at the time of issuance thereof, multiplied by (2) the greater of (a) 2.00% and (b) 0.50% plus one-fourth of the Ten Year Treasury Rate for such quarter, multiplied by (ii) the weighted average number of common shares outstanding during such quarter subject to adjustment to exclude events pursuant to changes in GAAP or the application of GAAP, as well as non-recurring or unusual transactions or events, after discussion between the Manager and the Independent Directors and approval by a majority of the Independent Directors in the case of non-recurring or unusual transactions or events. |
| | ● | Reimbursement of out-of-pocket expenses and certain other costs incurred by the Manager that relate directly to us and our operations. |
| | ● | Pursuant to an amendment to the management agreement on October 16, 2009, the Manager will, in addition to a Chief Financial Officer, provide us with threeseveral accounting professionals, each of whom will be exclusively dedicated to our operations, and a director of investor relations who will be 50% dedicated to our operations. The amendment also provides that we will reimburse the Manager for the expense of the wages, salaries and benefits of the Chief Financial Officer and threeseveral accounting professionals and 50% of the salary and benefits of the director of investor relations. In addition, we began reimbursing our Chairmanthe Manager for the wages, salary and benefits of our Chairman in February 2010. |
Incentive compensation is paid quarterly to the extent any is earned. Up to seventy-five percent (75%) of the incentive compensation will be paid in cash and at least twenty-five percent (25%) will be paid in the form of a stock award. The Manager may elect to receive more than 25% of its incentive compensation in stock. All shares are fully vested upon issuance. However, the Manager may not sell such shares for one year after the incentive compensation becomes due and payable unless the management agreement is terminated. Shares payable as incentive compensation are valued as follows:
| | ● | if such shares are traded on a securities exchange, at the average of the closing prices of the shares on such exchange over the thirty day period ending three days prior to the issuance of such shares; |
| | ● | if such shares are actively traded over-the-counter, at the average of the closing bid or sales price as applicable over the thirty day period ending three days prior to the issuance of such shares; and |
| | ● | if there is no active market for such shares, at the fair market value as reasonably determined in good faith by our board of directors. |
In conjunction with our offering of our common stock in December 2009, we and Resource America agreed that for the quarters ending on December 31, 2009 and March 31, 2010, the total incentive management fee payable to the Manager pursuant would not exceed $1.5 million per quarter.
The initial term of the management agreement expired on March 31, 2009. The agreement provides for automatic one year renewals on each March 31 thereafter until terminated. Our board of directors reviews the Manager’s performance annually. The management agreement may be terminated annually upon the affirmative vote of at least two-thirds of our independent directors, or by the affirmative vote of the holders of at least a majority of the outstanding shares of our common stock, based upon unsatisfactory performance that is materially detrimental to us or a determination by our independent directors that the management fees payable to the Manager are not fair, subject to the Manager’s right to prevent such a compensation termination by accepting a mutually acceptable reduction of management fees. Our board of directors must provide 180 days’ prior notice of any such termination. If we terminate the management agreement, the Manager is entitled to a termination fee equal to four times the sum of the average annual base management fee and the average annual incentive compensation earned by the Manager during the two 12-month periods immediately preceding the date of termination, calculated as of the end of the most recently completed fiscal quarter before the date of termination.
We may also terminate the management agreement for cause with 30 days’ prior written notice from our board of directors. No termination fee is payable with respect to a termination for cause. The management agreement defines cause as:
| | ● | the Manager’s continued material breach of any provision of the management agreement following a period of 30 days after written notice thereof; |
| | ● | the Manager’s fraud, misappropriation of funds, or embezzlement against us; |
| | ● | the Manager’s gross negligence in the performance of its duties under the management agreement; |
| | ● | the bankruptcy or insolvency of the Manager, or the filing of a voluntary bankruptcy petition by the Manager; |
| | ● | the dissolution of the Manager; and |
| | ● | a change of control (as defined in the management agreement) of the Manager if a majority of our independent directors determines, at any point during the 18 months following the change of control, that the change of control was detrimental to the ability of the Manager to perform its duties in substantially the same manner conducted before the change of control. |
Cause does not include unsatisfactory performance that is materially detrimental to our business.
The management agreement will terminate at the Manager’s option, without payment of the termination fee, if we become regulated as an investment company under the Investment Company Act, with such termination deemed to occur immediately before such event.
Regulatory Aspects of Our Investment Strategy: Exclusion from Regulation Under the Investment Company Act.
We operate our business so as to be excluded from regulation under the Investment Company Act. Because we conduct our business through wholly-owned subsidiaries, we must ensure not only that we qualify for an exclusion from regulation under the Investment Company Act, but also that each of our subsidiaries so qualifies.
We believe that RCC Real Estate, Inc., the subsidiary that as of December 31, 20102011 held all of our commercial real estate loan assets, is excluded from Investment Company Act regulation under Sections 3(c)(5)(C) and 3(c)(6), provisions designed for companies that do not issue redeemable securities and are primarily engaged in the business of purchasing or otherwise acquiring mortgages and other liens on and interests in real estate. To qualify for this exclusion, at least 55% of RCC Real Estate’s assets must consist of mortgage loans and other assets that are considered the functional equivalent of mortgage loans for purposes of the Investment Company Act, and interests in real properties, which we refer to as “qualifying real estate assets.” Moreover, 80% of RCC Real Estate’s assets must consist of qualifying real estate assets and other real estate-related assets. RCC Real Estate has not issued, and does not intend to issue, redeemable securities.
We treat our investments in whole mortgage loans, specific types of B notes and specific types of mezzanine loans as qualifying real estate assets for purposes of determining our eligibility for the exclusion provided by Section 3(c)(5)(C) to the extent such treatment is consistent with guidance provided by the SEC or its staff. We believe that SEC staff guidance allows us to treat B notes as qualifying real estate assets where we have unilateral rights to instruct the servicer to foreclose upon a defaulted mortgage loan, replace the servicer in the event the servicer, in its discretion, elects not to foreclose on such a loan, and purchase the A note in the event of a default on the mortgage loan. We believe, based upon an analysis of existing SEC staff guidance, that we may treat mezzanine loans as qualifying real estate assets where (i) the borrower is a special purpose bankruptcy-remote entity whose sole purpose is to hold all of the ownership interests in another special purpose entity that owns commercial real property, (ii) both entities are organized as limited liability companies or limited partnerships, (iii) under their organizational documents and the loan documents, neither entity may engage in any other business, (iv) the ownership interests of either entity have no value apart from the underlying real property which is essentially the only asset held by the property-owning entity, (v) the value of the underlying property in excess of the amount of senior obligations is in excess of the amount of the mezzanine loan, (vi) the borrower pledges its entire interest in the property-owning entity to the lender which obtains a perfected security interest in the collateral, and (vii) the relative rights and priorities between the mezzanine lender and the senior lenders with respect to claims on the underlying property is set forth in an intercreditor agreement between the parties which gives the mezzanine lender certain cure and purchase rights in case there is a default on the senior loan. If the SEC staff provides future guidance that these investments are not qualifying real estate assets, we will treat them, for purposes of determining our eligibility for the exclusion provided by Section 3(c)(5)(C), as real estate-related assets or miscellaneous assets, as appropriate. Historically, we have held “whole pool certificates” in mortgage loans, although, at December 31, 2011 and 2010, we had no whole pool certificates in our portfolios. Pursuant to existing SEC staff guidance, we consider whole pool certificates to be qualifying real estate assets. A whole pool certificate is a certificate that represents the entire beneficial interest in an underlying pool of mortgage loans. By contrast, a certificate that represents less than the entire beneficial interest in the underlying mortgage loans is not considered to be a qualifying real estate asset for purposes of the 55% test, but constitutes a real estate-related asset for purposes of the 80% test. We do not expect that investments in CDOs, other ABS, bank loans, lease receivables, trust preferred securities and private equity will constitute qualifying real estate assets. Moreover, to the extent that these investments are not backed by mortgage loans or other interests in real estate, they will not constitute real estate-related assets. Instead, they will constitute miscellaneous assets, which can constitute no more than 20% of RCC Real Estate’s assets.
To the extent RCC Real Estate holds its commercial real estate loan assets through wholly or majority-owned CDO subsidiaries, RCC Real Estate also intends to conduct its operations so that it will not come within the definition of an investment company set forth in Section 3(a)(1)(C) of the Investment Company Act because less than 40% of the value of its total assets on an unconsolidated basis will consist of “investment securities,” which we refer to as the 40% test. “Investment securities” exclude U.S. government securities and securities of majority-owned subsidiaries that are not themselves investment companies and are not relying on the exception from the definition of investment company under Section 3(c)(1) or Section 3(c)(7) of the Investment Company Act. Certain of the wholly-owned CDO subsidiaries of RCC Real Estate rely on Section 3(c)(5)(C) for their Investment Company Act exemption, with the result that RCC Real Estate’s interests in the CDO subsidiaries do not constitute “investment securities” for the purpose of the 40% test.
Our other subsidiaries, RCC Commercial, Inc., or RCC Commercial, andRCC Commercial II, Inc., or RCC Commercial II, Resource TRS, Inc., or Resource TRS, Resource TRS II, Inc., or Resource TRS II and Resource TRS III, Inc. or Resource TRS III do not qualify for the Section 3(c)(5)(C) exclusion. However, we believe they qualify for exclusion under either Section 3(c)(1) or 3(c)(7). As required by these exclusions, we will not allow either entity to make, or propose to make, a public offering of its securities. In addition, with respect to those subsidiaries for which we rely upon the Section 3(c)(1) exclusion, and as required thereby, we limit the number of holders of their securities to not more than 100 persons calculated in accordance with the attribution rules of Section 3(c)(1) and, with respect to those subsidiaries for which we rely on the Section 3(c)(7) exclusion, and as required thereby, we limit ownership of their securities to “qualified purchasers.” If we form other subsidiaries, we must ensure that they qualify for an exemption or exclusion from regulation under the Investment Company Act.
Moreover, we must ensure that Resource Capital Corp. itself qualifies for an exclusion from regulation under the Investment Company Act. We will do so by monitoring the value of our interests in our subsidiaries. At all times, we must ensure that Resource Capital Corp. meets the 40% test. Our interest in RCC Real Estate does not constitute an “investment security” for purposes of the 40% test, but our interest in RCC Commercial does, and our interest in Resource TRS may in the future, constitute “investment securities.” Accordingly, we must monitor the value of our interest in these two subsidiaries to ensure that the value of our interests in them never exceeds 40% of the value of our total assets.
We have not received, nor have we sought, a no-action letter from the SEC regarding how our investment strategy fits within the exclusions from regulation under the Investment Company Act. To the extent that the SEC provides more specific or different guidance regarding the treatment of assets as qualifying real estate assets or real estate-related assets, we may have to adjust our investment strategy. Any additional guidance from the SEC could further inhibit our ability to pursue our investment strategy.
Employees
We have no direct employees. Under our management agreement, the Manager provides us with all management and support personnel, including a Chief Financial Officer, and services necessary for our day-to-day operations. To provide its services, the Manager draws upon the expertise and experience of Resource America. As of December 31, 2011, Resource America had 742 employees involved in asset management, including 108 asset management professionals and 634 asset management support personnel. Pursuant to an amendment on October 16, 2009, the Manager providesmust provide us with threeseveral accounting professionals, each of whom is exclusively dedicated to our operations, and a director of investor relations who is 50% dedicated to our operations. Under the amendment, we bear the expense of the wages, salaries and benefits of the Chief Financial Officer and threethe accounting professionals dedicated to us, and 50% of the salary and benefits of the director of investor relations. In addition, in February 2010, we began reimbursing our Chairmanthe Manager for the wages, salary, and benefits in February 2010. We depend uponof our Chairman of the Manager and Resource America for personnel and administrative infrastructure. To provide its services, the Manager draws upon the expertise and experience of Resource America. As of December 31, 2010, Resource America had 688 employees involved in asset management, including 100 asset management professionals and 588 asset management support personnel, respectively.Board, who is exclusively dedicated to us.
Corporate Governance and Internet Address
We emphasize the importance of professional business conduct and ethics through our corporate governance initiatives. Our board of directors consists of a majority of independent directors, as defined in the Securities Exchange Act of 1934, as amended, and relevant New York Stock Exchange, or NYSE, rules. The audit, compensation and nominating/corporate governance committees of our board of directors are composed exclusively of independent directors. We have adopted corporate governance guidelines and a code of business conduct and ethics, which delineate our standards for our officers and directors, and employees of our manager.
Our internet address is www.resourcecapitalcorp.com.www.resourcecapitalcorp.com. We make available, free of charge through a link on our site, all reports filed with the SEC as soon as reasonably practicable after such filing. Our site also contains our code of business conduct and ethics, corporate governance guidelines and the charters of the audit committee, nominating and governance committee and compensation committee of our board of directors. A complete list of our filings is available on the Securities and Exchange Commission’s website at www.sec.gov. Any of our filings are also available at the Securities and Exchange Commission’s Public Reference Room at 100 F Street, N.E., Room 1580, Washington, D.C. 20549. The Public Reference Room may be contacted at telephone number (800) 732-0330 for further information.
This section describes material risks affecting our business. In connection with the forward-looking statements that appear in this annual report, you should carefully review the factors discussed below and the economic cautionary statements referred to in “Forward-Looking Statements.”
Impact of Current Economic Conditions
Continuance of current economicEconomic conditions could further harmin the United States during the past four year have had an adverse impact on our financial condition, which has reduced our income and our ability to make distributions to our stockholders. Continuance of these conditions could further adversely affect our financial conditions.
Although credit market conditions have improved over those of the previous two years, there are still significant limitations on the availability of credit, significant declines in the value of real estate and real estate related assets, impairment of the ability of manysome borrowers to repay their obligations and illiquiditylimited liquidity in the markets for real estate and real estate-related assets. Since mid-2007, economic and credit market confidenceconditions have had significant adverse effects on us, causing us to record material impairment charges with respect to investments we hold and significant increases in our provision for loan losses, the unavailability oflosses. Moreover, these conditions have made it difficult, and, until 2011 virtually impossible, for us to access new financing to support new investments.investment growth. As a result, our income, our ability to make distributions, and the price of our common stock have declined significantly. ContinuationFailure of current economic and credit market conditions to improve materially could further harm our financial condition, income, ability to make distributions to our stockholders and the price of our common stock.
We cannot predict the effects on us of actions taken by the U.S. government and governmental agencies in response to economic conditions in the United States
In response to economic and market conditions, the U.S. government and a number of governmental agencies have established or proposed a series of programs designed to stabilizeimprove the financial system and credit markets, and to stimulate economic growth. The U.S. government and many state and local governments are incurring substantial budget deficits and seeking financing in international and national credit markets. We are unable to evaluate whether these programs and actions have had or will have in the future a beneficial impact upon our financial condition, income, or ability to make distributions to our stockholders.
Risks Related to Our Financing
Our portfolio has been financed in material part through the use of leverage, which may reduce the return on our investments and cash available for distribution.
Our portfolio has been financed in material part through the use of leverage.leverage and, as credit market conditions permit, we will seek such financing in the future. Using leverage subjects us to risks associated with debt financing, including the risks that:
| | ● | the cash provided by our operating activities will not be sufficient to meet required payments of principal and interest, |
| | ● | the cost of financing may increase relative to the income from the assets financed, reducing the income we have available to pay distributions, and |
| | ● | our investments may have maturities that differ from the maturities of the related financing and, consequently, the risk that the terms of any refinancing we obtain will not be as favorable as the terms of existing financing. |
If we are unable to secure refinancing of our currently outstanding financing, when due, on acceptable terms, we may be forced to dispose of some of our assets at disadvantageous terms or to obtain financing at unfavorable terms, either of which may result in losses to us or reduce the cash flow available to meet our debt service obligations or to pay distributions.
Financing that we may obtain and financing we have obtained through CDOs, does require us to maintain a specified ratio of the amount of the financing to the value of the assets financed. A decrease in the value of these assets may lead to margin calls or calls for the pledge of additional assets which we will have to satisfy. We may not have sufficient funds or unpledged assets to satisfy any such calls.calls, which could result in our loss of distributions from and interests in affected CDOs, which would reduce our assets, income and ability to make distributions.
Under current economic and market conditions, we are significantly constrained in our ability to obtain the capital and financing necessary for growth. As a result,growth has been limited, which has limited our profitability, ability to make distributions and the market price of our common stock have been harmed.stock. Continuation or further deterioration of current conditions could further harmconstrain our profitability, ability to make distributions and the market price of our common stock.
We depend upon the availability of adequate debt and equity capital for growth in our operations. Although we successfully completed an offering of common stock in December 2009, andrecently have raised equity capital through our dividend reinvestment and stock purchase program have entered into two credit facilities and completed one CLO, in general our ability to obtain debt financing and, to a lesser extent, equity capital has been significantlyis still constrained as a result of current economic and market conditions, which has impairedlimited our profitability, our ability to make distributions and the market price of our common stock. Moreover,In addition, as a REIT, we must distribute annually at least 90% of our REIT taxable income, determined without regard to the deduction for dividends paid and excluding net capital gain, to our stockholders and are therefore not able to retain significant amounts of our earnings for new investments. While Rev. Proc. 2010-12, allows us to satisfy this requirement by distributing common shares for up to 90% of the amount of a required distribution, such regulatory relief is only available through December 2011. Moreover, although Resource TRS, our TRS, may retain earnings as new capital, we are subject to REIT qualification requirements which limit the value of TRS stock and securities relative to the other assets owned by a REIT. Continuation or further deterioration of current economic and market conditions could further impairconstrain our ability to acquire and finance assets, thereby reducingaffecting or eliminating our profitability and our ability to make distributions, impairingand the market price of our common stock. Moreover, even if debt and equity capital were to become more readily available to us, we cannot assure you that it would be on terms that would enable us to strengthen our profitability or ability to make distributions.
We are exposed to loss if lenders under our repurchase agreement, warehouse facilities, or other short-term lenders liquidate our portfolio. Moreover, assets acquired by us pursuant to our repurchase agreements, warehouse facilities or other short-term debt may not be suitable for refinancing through future securitization transactions, which may require us to seeks more costly financing for theses assets or to liquidate assets.
We have entered into repurchase agreements, and may in the future enter into other repurchase agreements, warehouse facilities or other debt with similar terms. Our lenders have the right under our current repurchase agreement, and may have the right under such other debt, to liquidate assets acquired thereunder upon the occurrence of certain events, such as an event of default. We are exposed to loss if the proceeds received by the lender upon any such liquidation are insufficient to satisfy our obligation to the lender. We are also subject to the risk that the assets subject to such repurchase agreements, warehouse facilities or other debt with similar terms might not be suitable for refinancing through future securitization transactions. If we are unable to refinance these assets through future securitization transactions, we might be required to seek more costly financing for these assets or to liquidate assets.
We will lose money on our repurchase transaction if the counterparty to the transaction defaults on its obligation to resell the underlying security back to us at the end of the transaction term, or if the value of the underlying security has declined as of the end of the term or if we default in our obligations under the repurchase agreement.
When engaged in repurchase transactions, we generally sell securities to the transaction counterparty and receive cash from the counterparty. The counterparty must resell the securities back to us at the end of the term of the transaction. Because the cash we receive from the counterparty when we initially sell the securities to the counterparty is less than the market value of those securities, if the counterparty defaults on its obligation to resell the securities back to us we will incur a loss on the transaction. We will also incur a loss if the value of the underlying securities has declined as of the end of the transaction term, as we will have to repurchase the securities for their initial value but would receive securities worth less than that amount. Any losses we incur on our repurchase transactions would reduce our earnings, and thus our cash available for distribution to our stockholders.
Our financing of our REIT qualifying assets with repurchase agreements and warehouse facilities could adversely affect our ability to qualify as a REIT.
We have entered into and intend to enter into, sale and repurchase agreements under which we nominally sell certain REIT qualifying assets to a counterparty and simultaneously enter into an agreement to repurchase the sold assets. We believe that we will be treated for U.S. federal income tax purposes as the owners of the assets that are the subject of any such agreement notwithstanding that we may transfer recorder ownership of the assets to the counterparty during the term of the agreement. It is possible, however, that the Internal Revenue Service, or IRS, could assert that we did not own the assets during the terms of the sale and repurchase agreement, in which case our ability to qualify as a REIT would be adversely affected. If any of our REIT qualifying assets are subject to a repurchase agreement and are sold by the counterparty in connection with a margin call, the loss of those assets could impair our ability to qualify as a REIT. Accordingly, unlike other REITs, we may be subject to additional risk regarding our ability to qualify and maintain our qualification as a REIT.
Historically, we have financed most of our investments through CDOs and have retained the equity. CDO equity receives distributions from the CDO only if the CDO generates enough income to first pay the holders of its debt securities and its expenses.
Historically, we have financed most of our investments through CDOs in which we retained the equity interest. Depending on market conditions, credit availability, and resolution of current credit market conditions, we may seek to use CDOs to finance our investments in the future. The equity interests of a CDO are subordinate in right of payment to all other securities issued by the CDO. The equity is usually entitled to all of the income generated by the CDO after the CDO pays all of the interest due on the debt securities and other expenses. However, there will be little or no income available to the CDO equity if there are excessive defaults by the issuers of the underlying collateral which would significantly reduce the value of that interest. Reductions in the value of the equity interests we have in a CDO, if we determine that they are other than temporary, will reduce our earnings. In addition, the equity securities of CDOs are generally illiquid, and because they represent a leveraged investment in the CDO’s assets, the value of the equity securities will generally have greater fluctuations than the value of the underlying collateral.
If our CDO financings fail to meet their performance tests, including over-collaterizationover-collateralization requirements, our net income and cash flow from these CDOs will be eliminated.
Our CDOs generally provide that the principal amount of their assets must exceed the principal balance of the related securities issued by them by a certain amount, commonly referred to as “over-collateralization.” The CDO terms provide that, if delinquencies and/or losses exceed specified levels, based on the analysis by the rating agencies (or any financial guaranty insurer) of the characteristics of the assets collateralizing the securities issued by the CDO issuer, the required level of over-collateralization may be increased or may be prevented from decreasing as would otherwise be permitted if losses or delinquencies did not exceed those levels. In addition, a failure by a CDO to satisfy an over-collateralization test typically results in accelerated distributions to the holders of the senior debt securities issued by the CDO entity, resulting in reduction or elimination of distributions to more junior securities until the over-collateralizatoinover-collateralization requirements have been met or the senior debt securities have been paid in full. Our equity holdings are and, when we acquire debt interests in CDOs, our debt interests, if any, generally are subordinate in right of payment to the other classes of debt securities issued by the CDO entity. Accordingly, if overcollateralization tests are not met, distributions on the subordinated debt and equity we hold in these CDOs will cease, resulting in a substantial reduction in our cash flow. Other tests (based on delinquency levels, interest coverage or other criteria) may restrict our ability to receive cash distributions from assets collateralizing the securities issued by the CDO entity. Although at December 31, 2010,2011, all of our CDOs met their performance tests, we cannot assure you that our CDOs will satisfy the performance tests in the future. For information concerning compliance by our CDOs with their over-collateralization tests, see “Management’s Discussion and Analysis of Financial Condition and Results of Operation - Summary of CDO and CLO Performance Statistics.”
If any of our CDOs fails to meet collateralization or other tests relevant to the most senior debt issued and outstanding by the CDO issuer, an event of default may occur under that CDO. If that occurs, our Manager’s ability to manage the CDO likely would be terminated and our ability to attempt to cure any defaults in the CDO would be limited, which would increase the likelihood of a reduction or elimination of cash flow and returns to us in those CDOs for an indefinite time.
If we issue debt securities, the terms may restrict our ability to make cash distributions, require us to obtain approval to sell our assets or otherwise restrict our operations in ways which could make it difficult to execute our investment strategy and achieve our investment objectives.
Any debt securities we may issue in the future will likely be governed by an indenture or other instrument containing covenants restricting our operating flexibility. Holders of senior securities may be granted the right to hold a perfected security interest in certain of our assets, to accelerate payments due under the indenture if we breach financial or other covenants, to restrict distributions, and to require approval to sell assets. These covenants could limit our ability to operate our business or manage our assets effectively. Additionally, any convertible or exchangeable securities that we issue may have rights, preferences and privileges more favorable than those of our common stock. We, and indirectly our stockholders, will bear the cost of issuing and servicing such securities.
Depending upon market conditions, we may in the future seek financing through CDOs, which would expose us to risks relating to the accumulation of assets for use in the CDOs.
Historically, we have financed a significant portion of our assets through the use of CDOs and CLOs, and have accumulated assets for these financings through short-term credit facilities, typically repurchase agreement facilities. Depending upon market conditions,condition, and, consequently, the extent to which such financing is available to us, we may seek similar financing arrangements in the future. These arrangements could expose us to a number of credit risks, including the following:
| | ● | If we accumulate assets for a CDO or CLO on a short-term credit facility and do not complete the CDO or CLO financing, or if a default occurs under the facility, the short-term lender will sell the assets and we would be responsible for the amount by which the original purchase price of the assets exceeds their sale price, up to the amount of our investment or guaranty. |
| | ● | An event of default under one short-term facility may constitute a default under other credit facilities we may have, potentially resulting in asset sales and losses to us, as well as increasing our financing costs or reducing the amount of investable funds available to us. |
| | ● | We may be unable to acquire a sufficient amount of eligible assets to maximize the efficiency of a CDO or CLO issuance, which would require us to seek other forms of term financing or liquidate the assets. We may not be able to obtain term financing on acceptable terms, or at all, and liquidation of the assets may be at prices less than those we paid, resulting in losses to us. |
| | ● | Using short-term financing to accumulate assets for a CDO or CLO issuance may require us to obtain new financing as the short-term financing matures. Residual financing may not be available on acceptable terms, or at all. Moreover, an increase in short-term interest rates at the time that we seek to enter into new borrowings would reduce the spread between the income on our assets and the cost of our borrowings. This would reduce returns on our assets, which would reduce earnings and, in turn, cash available for distribution to our stockholders. |
| | ● | We will lose money on our repurchase transactions if the counterparty to the transaction defaults on its obligation to resell the underlying security back to us at the end of the transaction term, or if the value of the underlying security has declined as of the end of the term or if we default on our obligations under the repurchase agreements. |
Our hedging transactions may not completely insulate us from interest rate risk and may result in poorer overall investment performance than if we had not engaged in any hedging transactions.
Subject to maintaining our qualification as a REIT, we pursue various hedging strategies to seek to reduce our exposure to losses from adverse changes in interest rates. Our interest rate hedging activity varies in scope depending upon market conditions relating to, among other factors, the level and volatility of interest rates and the type of assets we hold. There are practical limitations on our ability to insulate our portfolio from all of the negative consequences associated with changes in short-term interest rates, including:
| | ● | Available interest rate hedges may not correspond directly with the interest rate risk against which we seek protection. |
| | ● | The duration of the hedge may not match the duration of the related liability. |
| | ● | Interest rate hedging can be expensive, particularly during periods of rising and volatile interest rates. Hedging costs may include structuring and legal fees and fees payable to hedge counterparties to execute the hedge transaction. |
| | ● | Losses on a hedge position may reduce the cash available to make distributions to stockholders, and may exceed the amounts invested in the hedge position. |
| | ● | The amount of income that a REIT may earn from hedging transactions, other than through a TRS, is limited by federal tax provisions governing REITs. |
| | ● | The credit quality of the party owing money on the hedge may be downgraded to such an extent that it impairs our ability to sell or assign our side of the hedging transaction. |
| | ● | The party owing money in the hedging transaction may default on its obligation to pay. |
We have adopted written policies and procedures governing our hedging activities. Under these policies and procedures, our board of directors is responsible for approving the types of hedging instruments we may use, absolute limits on the notional amount and term of a hedging instrument and parameters for the credit-worthiness of hedge counterparties. The senior managers responsible for each of our targeted asset classes are responsible for executing transactions using the services of independent interest rate risk management consultants, documenting the transactions, monitoring the valuation and effectiveness of the hedges, and providing reports concerning our hedging activities and the valuation and effectiveness of our hedges, to the audit committee of our board of directors no less often than quarterly. Our guidelines also require us to engage one or more experienced third partythird-party advisors to provide us with assistance in the identification of interest rate risks, the analysis, selection and timing of risk protection strategies, the administration and negotiation of hedge documentation, settlement or disposition of hedges, compliance with hedge accounting requirements and measurement of hedge effectiveness and valuation.
Hedging against a decline in the values of our portfolio positions does not eliminate the possibility of fluctuations in the values of the positions or prevent losses if the values of the positions decline. Hedging transactions may also limit the opportunity for gain if the values of the portfolio positions should increase. Moreover, we may not be able to hedge against an interest rate fluctuation that is generally anticipated by the market.
The success of our hedging transactions will depend on the Manager’s ability to correctly predict movements of interest rates. Therefore, unanticipated changes in interest rates may result in poorer overall investment performance than if we had not engaged in any such hedging transactions. In addition, the degree of correlation between price movements of the instruments used in a hedging strategy and price movements in the portfolio positions being hedged may vary. Moreover, for a variety of reasons, we may not seek to establish a perfect correlation between such hedging instruments and the portfolio holdings being hedged. Any such imperfect correlation may prevent us from achieving the intended hedge and expose us to risk of loss.
Hedging instruments often are not traded on regulated exchanges, guaranteed by an exchange or its clearing house, or regulated by any U.S. or foreign governmental authorities and involve risks of default by the hedging counterparty and illiquidity.
Subject to maintaining our qualification as a REIT, part of our investment strategy involves entering into puts and calls on securities or indices of securities, interest rate swaps, caps and collars, including options and forward contracts, and interest rate lock agreements, principally Treasury lock agreements, to seek to hedge against mismatches between the cash flows from our assets and the interest payments on our liabilities. Hedging instruments often are not traded on regulated exchanges, guaranteed by an exchange or its clearing house, or regulated by any U.S. or foreign governmental authorities. Consequently, there are no requirements with respect to record keeping, financial responsibility or segregation of customer funds and positions. Furthermore, the enforceability of agreements underlying derivative transactions may depend on compliance with applicable statutory and commodity and other regulatory requirements and, depending on the identity of the counterparty, applicable international requirements. The business failure of a counterparty with whom we enter into a hedging transaction will most likely result in a default. Default by a party with whom we entered into a hedging transaction may result in the loss of unrealized profits and force us to cover our resale commitments, if any, at the then current market price. Although generally we seek to reserve the right to terminate our hedging positions, we may not always be able to dispose of or close out a hedging position without the consent of the hedging counterparty, and we may not be able to enter into an offsetting contract in order to cover our risk. A liquid secondary market may not exist for hedging instruments purchased or sold, and we may have to maintain a position until exercise or expiration, which could result in losses.
We may enter into hedging instruments that could expose us to unexpected losses in the future.
We have entered and may in the future enter into hedging instruments that require us to fund cash payments under certain circumstances, for example, upon the early termination of the instrument caused by an event of default or other early termination event, or the decision by a counterparty to request additional collateral for margin it is contractually owed under the terms of the instrument. The amount due would be equal to the unrealized loss of the open positions with the counterparty and could also include other fees and charges. These liabilities will be reflected in our consolidated balance sheet, and our ability to fund these obligations will depend on the liquidity of our assets and access to capital at the time, and the need to fund these obligations could adversely impact our financial condition.
Approximately 92%91% of our hedging arrangements are with a single counterparty and, as a consequence, our hedging strategy may fail if that counterparty defaults in its obligations.
As of December 31, 2010,2011, approximately 92%91% of our outstanding hedges, with a notional amount of $166.8$152.1 million, were with Credit Suisse International, or CS. Were CS to default in its obligations under these hedging arrangements, we would lose the hedge protection for which we had contracted which, depending upon market conditions, could result in significant losses to us. We cannot assure you that we could replace the defaulted hedges or that the terms of any replacement hedges we could obtain would be on similar terms, or as to the cost to us of obtaining replacement hedges.
Risks Related to Our Operations
We may change our investment strategy without stockholder consent, which may result in riskier investments than those currently targeted.
Subject to maintaining our qualification as a REIT and our exclusion from regulation under the Investment Company Act, we may change our investment strategy, including the percentage of assets that may be invested in each class, or in the case of securities, in a single issuer, at any time without the consent of our stockholders, which could result in our making investments that are different from, and possibly riskier than, the investments described in this report. A change in our investment strategy may increase our exposure to interest rate and real estate market fluctuations, all of which may reduce the market price of our common stock and impair our ability to make distributions to stockholders. Furthermore, a change in our asset allocation could result in our making investments in asset categories different from those described in this report.
We believe AFFO is an appropriate measure of our operating performance; however, in certain instances AFFO may not be reflective of actual economic results.
We utilize AFFO as a measure of our operating performance and believe that it is useful to investors because it facilitates an understanding of our operating performance after adjustment for certain non-cash expenses , such as non-cash impairment losses resulting from fair value adjustments on financial instruments, non-cash provision for loan losses, straight-line rental effects, share based compensation, amortization of various deferred items and intangible assets, gains on debt extinguishment, REIT tax planning adjustments considered non-recurring by management and capital expenditures that are related to our real estate owned. Additionally, we believe that AFFO serves as a good measure of our operating performance because it facilitates evaluation of our Company without the effects of selected items required in accordance with GAAP that may not necessarily be indicative of current operating performance and that may not accurately compare our operating performance between periods. Nonetheless, in certain instances, AFFO may not necessarily be reflective of our actual economic results.
We believe potentially increasing capital expenditures could reduce our AFFO.
Substantial capital expenditures for acquisition, renovation or unforeseen circumstances could reduce our AFFO.
Terrorist attacks and other acts of violence or war may affect the market for our common stock, the industry in which we conduct our operations and our profitability.
Terrorist attacks may harm our results of operations and your investment. We cannot assure you that there will not be furtherfuture terrorist attacks against the United States or U.S. businesses. These attacks or armed conflicts may directly impact the propertyour assets, properties or other assets underlying our ABSloans or debt securities or the securities markets in general. Losses resulting from these types of events are uninsurable.
More generally, any of these events could cause consumer confidence and spending to decrease or result in increased volatility in the United States and worldwide financial markets and economy. Adverse economic conditions could harm the value of some or all of the investments in our portfolio or the securities markets in general which could harm our operating results and revenues and may result in the volatility of the value of our securities.
If we fail to maintain an effective system of internal controls, we may not be able to accurately report our financial results or prevent fraud.
If we fail to maintain an effective system of internal control, fail to correct any matters in the design or operating effectiveness of internal control over financial reporting, or fail to prevent fraud, our stockholders could lose confidence in our financial reporting, which could harm our business and the trading price of our common stock.
Some of our investments may be illiquid, which may result in our realizing less than their recorded value should we need to sell such investments quickly.
We have made investments, and expect to make additional investments, in securities and other assets for which there is no public market. A portion of these securities or other assets may be subject to legal and other restrictions on resale or will otherwise be less liquid than publicly-traded securities. If we are required to liquidate all or a portion of our portfolio quickly, we may realize significantly less than the value at which we have previously recorded our investments. In addition, we may face other restrictions on our ability to liquidate an investment in a business entity to the extent that we, the Manager or Resource America has or could be attributed with material non-public information regarding such business entity.
We may have to repurchase assets that we have sold in connection with CDOs and other securitizations.
If any of the assets that we originate or acquire and sell or securitize do not comply with representations and warranties that we make about their characteristics, the borrowers and the underlying assets, we may have to purchase these assets from the CDO or securitization vehicle, or replace them with substitute loans or securities. In addition, in the case of loans or securities that we have sold instead of retained, we may have to indemnify purchasers for losses or expenses incurred as a result of a breach of a representation or warranty. Any significant repurchases or indemnification payments could materially reduce our liquidity, earnings and ability to make distributions.
We may be exposed to environmental liabilities with respect to properties to which we take title.
In the course of our business, we mayhave taken title to, and expect will in the future take title to, real estate through foreclosure on collateral underlying real estate investments. IfWhen we do take title to any property, we could be subject to environmental liabilities with respect to it. In such a circumstance, we may be held liable to a governmental entity or to third parties for property damage, personal injury, investigation, and clean-up costs they incur as a result of environmental contamination, or may have to investigate or clean up hazardous or toxic substances, or chemical releases at a property. The costs associated with investigation or remediation activities could be substantial and could reduce our income and ability to make distributions.
If our allowance for loan and lease losses is not adequate to cover actual or estimated future loan and lease losses, our earnings may decline.
We maintain an allowance for loan and lease losses to provide for loan defaults and non-performance by borrowers of their obligations. Our allowance for loan and lease losses may not be adequate to cover actual or estimated future loan and lease losses and future provisions for loan and lease losses could materially reduce our income. We base our allowance for loan and lease losses on prior experience, as well as an evaluation of risks in the current portfolio. However, losses may exceed our current estimates. The amount of future losses is susceptible to changes in economic, operating and other conditions that may be beyond our control, including changes in interest rates, changes in borrowers’ creditworthiness and the value of collateral securing loans and leases. Additionally, if we seek to expand our loan and lease portfolios, we may need to make provisions for loan and lease losses to ensure that the allowance remains at levels deemed appropriate by our management for the size and quality of our portfolios. While we believe that our allowance for loan and lease losses is adequate to cover our anticipated losses, we cannot assure you that will continue to be the case or that we will not further increase the allowance for loan and lease losses. Any increase in our allowance for loan losses will reduce our income and, if sufficiently large, could cause us to incur loss.
Our due diligence may not reveal all of an entity’s liabilities and other weaknesses in its business.
Before investing in any entity, we will assess the strength and skills of the entity’s management, the value of any collateral securing debt, the ability of the entity and the collateral to service the debt and other factors that we believe are material to the performance of the investment. In making the assessment and otherwise conducting customary due diligence, we will rely on the resources available to us and, in some cases, an investigation by third parties. This process is particularly important and subjective with respect to newly-organized entities because there may be little or no information publicly available about the entities or, with respect to debt securities, any underlying collateral. Our due diligence processes, however, may not uncover all facts that may be relevant to an investment decision.
Risks Related to Our Investments
Declines in the market values of our investments may reduce periodic reported results, credit availability and our ability to make distributions.
We classify a substantial portion of our assets for accounting purposes as “available-for-sale.” As a result, changes in the market values of those assets are directly charged or credited to accumulated other comprehensive loss and could reduce our stockholders’ equity. A decline in these values will reduce the book value of our assets. Moreover, if the decline in value of an available-for-sale asset is other than temporary, we are required by GAAP to record the decline as an asset impairment which will reduce our earnings. As a result of market conditions for our “available-for-sale” investments, we recognized $26.6$6.9 million of other-than-temporary impairment through our consolidated statements of operations during the year ended December 31, 2010.2011.
A decline in the market value of our assets may also adversely affect us in instances where we have borrowed money based on the market value of those assets. If the market value of those assets declines, the lender may require us to post additional collateral to support the loan. If we were unable to post the additional collateral, we would have to repay some portion or all of the loan, which may require us to sell assets, which could potentially be under adverse market conditions. As a result, our earnings would be reduced or we could sustain losses, and cash available to make distributions could be reduced or eliminated.
Increases in interest rates and other factors could reduce the value of our investments, result in reduced earnings or losses and reduce our ability to pay distributions.
A significant risk associated with our investment in commercial real estate-related loans, CMBS and other debt instruments is the risk that either or both of long-term and short-term interest rates increase significantly. If long-term rates increase, the market value of our assets would decline. Even if assets underlying investments we may own in the future are guaranteed by one or more persons, including government or government-sponsored agencies, those guarantees do not protect against declines in market value of the related assets caused by interest rate changes. At the same time, with respect to assets that are not match-funded or that have been acquired with variable rate or short-term financing, an increase in short-term interest rates would increase our interest expense, reducing our net interest spread.spread or possibly resulting in negative cash flow from those assets. This could result in reduced profitability and distributions.distributions or losses.
Investing in mezzanine debt and mezzanine or other subordinated tranches of CMBS, bank loans and other ABS involves greater risks of loss than senior secured debt investments.
Subject to maintaining our qualification as a REIT and exclusion from regulation under the Investment Company Act, we invest in mezzanine debt and expect to invest in mezzanine or other subordinated tranches of CMBS, bank loans and other ABS. These types of investments carry a higher degree of risk of loss than senior secured debt investments such as our whole loan investments because, in the event of default and foreclosure, holders of senior liens will be paid in full before mezzanine investors and, depending on the value of the underlying collateral at the time of foreclosure, there may not be sufficient assets to pay all or any part of amounts owed to mezzanine investors. Moreover, our mezzanine and other subordinate debt investments may have higher loan-to-value ratios than conventional senior lien financing, resulting in less equity in the collateral and increasing the risk of loss of principal. If a borrower defaults or declares bankruptcy, we may be subject to agreements restricting or eliminating our rights as a creditor, including rights to call a default, foreclose on collateral, accelerate maturity or control decisions made in bankruptcy proceedings. In addition, the prices of lower credit quality securities are generally less sensitive to interest rate changes than more highly rated investments, but more sensitive to economic downturns or individual issuer developments because the ability of obligors of instruments underlying the securities to make principal and interest payments may be impaired. In such event, existing credit support relating to the securities’ structure may not be sufficient to protect us against loss of our principal.
We historically have historically invested in small- and middle-ticket lease receivables to small- and mid-size businesses which may have greater risks of default than leases or loans to larger businesses.
We historically have historically invested in small- and middle-ticket lease receivables. As a result of our investment in LEAF Commercial Capital, Inc., or LCC, (including the contribution of all of our lease receivables to it), we currently do not directly invest in lease receivables. However, we are not prohibited from investing in lease receivables and may do so in the future. Investing in small- and middle- ticket lease receivables involves risk. Many of the obligors are small- to mid-size businesses. As a result, we maywould be subject to higher risks of lease default than if ourthe obligors were larger businesses. WhileIf we will seek to repossess and re-lease or sell the equipment subject to a defaulted lease or note, we may not be able to do so on advantageous terms. If an obligor files for protection under the bankruptcy laws, we maycould experience difficulties and delays in recovering the equipment. Moreover, the equipment maycould be returned in poor condition and we maycould be unable to enforce important lease provisions against an insolvent obligor, including the contract provisions that require the obligor to return the equipment in good condition. In some cases, an obligor’s deteriorating financial condition maycould make trying to recover what the obligor owes impractical. The costs of recovering equipment upon an obligor’s default, enforcing the obligor’s obligations under the lease, and transporting, storing, repairing and finding a new obligor or purchaser for the equipment maycould be high. Higher than expected lease defaults willcould result in a loss of anticipated revenues. TheseAny such losses maycould impair our ability to make distributions and reduce the market price of our common stock.
Private equity investments involve a greater risk of loss than traditional debt financing.
On occasion, we have made private equity investments. Typically, these investments are subordinate to debt financing and are not secured. Should the issuer default on our investment, we would only be able to proceed against the entity that issued the private equity in accordance with the terms of the security, and not any property owned by the entity. In the event of bankruptcy or foreclosure, we would only be able to recoup our investment after any lenders to the entity are paid. As a result, we may not recover some or all of our investment, which could result in losses. Moreover, depending upon the existence of a market for the issuer’s securities, the length of time we have held the investment and any rights we may have to require registration under the Securities Act, these investments may be highly illiquid so that we may not be able to sell these investments at times we would like to do so or at prices that reflect our cost or the value of the investment on our financial statements.
We record some of our portfolio investments at fair value as estimated by our management and, as a result, there will be uncertainty as to the value of these investments.
We currently hold, and expect that we will hold in the future, portfolio investments that are not publicly traded, including the securities of Resource TRS.traded. The fair value of securities and other investments that are not publicly traded may not be readily determinable. We value these investments quarterly at fair value as determined under policies approved by our board of directors. Because such valuations are inherently uncertain, may fluctuate over short periods of time and may be based on estimates, our determinations of fair value may differ materially from the values that would have obtained if a ready market for them existed. The value of our common stock will likely decrease if our determinations regarding the fair value of these investments are materially higher than the values that we ultimately realize upon their disposal.
Our assets include bank loans and other ABS which will carry higher risks of loss than our real estate-related portfolio.
Subject to maintaining our qualification as a REIT and exclusion from regulation under the Investment Company Act, we invest in bank loans and other ABS. Our bank loan investments or our other ABS investments, which are principally backed by small business and bank loans, may not be secured by mortgages or other liens on assets or may involve higher loan-to-value ratios than our real estate-related investments. Our bank loan investments, and our ABS backed by loans, involve loans with a par amount of $207.8 million$1.2 billion at December 31, 20102011 that have an interest-only payment schedule or a schedule that does not fully amortize principal over the term of the loan, which will make repayment of the loan depend upon the borrower’s liquidity or ability to refinance the loan at maturity. Numerous factors affect a borrower’s ability to repay or refinance loans at maturity, including national and local economic conditions, a downturn in a borrower’s industry, loss of one or more principal customers and conditions in the credit markets. A deterioration in a company’s financial condition or prospects may be accompanied by a deterioration in the collateral for the bank loan or any ABS backed by such company’s loans.
Risks Related to Our Manager
We depend on the Manager and Resource America and may not find suitable replacements if the management agreement terminates.
We have no employees. Our officers, portfolio managers, administrative personnel and support personnel are employees of Resource America. We have no separate facilities and completely rely on the Manager and, because the Manager has no direct employees, Resource America, which has significant discretion as to the implementation of our operating policies and investment strategies. If our management agreement terminates, we may be unable to find a suitable replacement for them. Moreover, we believe that our success depends to a significant extent upon the experience of the Manager’s and Resource America’s executive officers and senior portfolio managers, and in particular Jonathan Z. Cohen, Thomas C. Elliott, Jeffrey F. Brotman, Jeffrey D. Blomstrom, David J. Bryant, Christopher D. Allen, Gretchen Bergstresser, David Bloom, Crit DeMent, Joan Sapinsley and Alan F. Feldman, whose continued service is not guaranteed. The departure of any of the executive officers or senior portfolio managers could harm our investment performance.
We must pay the Manager the base management fee regardless of the performance of our portfolio.
The Manager is entitled to receive a monthly base management fee equal to 1/12 of our equity, as defined in the management agreement, times 1.50%, regardless of the performance of our portfolio. The Manager’s entitlement to substantial non-performance based compensation might reduce its incentive to devote its time and effort to seeking profitable opportunities for our portfolio. This in turn could hurt our ability to make distributions to our stockholders.
The incentive fee we pay the Manager may induce it to make riskier investments.
In addition to its base management fee, the Manager will receive incentive compensation, payable quarterly, equal to 25% of the amount by which our adjusted operating earnings, as defined in the management agreement, exceed the weighted average prices for our common stock in all of our offerings multiplied by the greater of 2.00% or 0.50% plus one-fourth of the average 10-year treasury rate for such quarter, multiplied by the weighted average number of common shares outstanding during the quarter. In evaluating investments and other management strategies, the opportunity to earn incentive compensation based on net income may lead the Manager to place undue emphasis on the maximization of net income at the expense of other criteria, such as preservation of capital, in order to achieve higher incentive compensation. Investments with higher yields generally have higher risk of loss than investments with lower yields.
The Manager manages our portfolio pursuant to very broad investment guidelines and our board does not approve each investment decision, which may result in our making riskier investments.
The Manager is authorized to follow very broad investment guidelines. While our directors periodically review our investment guidelines and our investment portfolio, they do not review all of our proposed investments. In addition, in conducting periodic reviews, the directors may rely primarily on information provided to them by the Manager. Furthermore, the Manager may use complex strategies, and transactions entered into by the Manager may be difficult or impossible to unwind by the time they are reviewed by the directors. The Manager has great latitude within the broad investment guidelines in determining the types of investments it makes for us. Poor investment decisions could impair our ability to make distributions to our stockholders.
Our management agreement was not negotiated at arm’s-length and, as a result, may not be as favorable to us as if it had been negotiated with a third party.third-party.
OurAt the time the management agreement was negotiated, our officers and threetwo of our directors, Edward E. Cohen and Jonathan Z. Cohen, and Steven J. Kessler were also officers or directors of the Manager or Resource America at the time the management agreement was negotiated.America. As a consequence, our management agreement was not the result of arm’s-length negotiations and its terms, including fees payable, may not be as favorable to us as if it had been negotiated with an unaffiliated third party.third-party.
Termination of the management agreement by us without cause is difficult and could be costly.
Termination of our management agreement without cause is difficult and could be costly. We may terminate the management agreement without cause only annually following its initial term upon the affirmative vote of at least two-thirds of our independent directors or by a vote of the holders of at least a majority of our outstanding common stock, based upon unsatisfactory performance by the Manager that is materially detrimental to us or a determination that the management fee payable to the Manager is not fair. Moreover, with respect to a determination that the management fee is not fair, the Manager may prevent termination by accepting a mutually acceptable reduction of management fees. We must give not less than 180 days’ prior notice of any termination. Upon any termination without cause, the Manager will be paid a termination fee equal to four times the sum of the average annual base management fee and the average annual incentive compensation earned by it during the two 12-month periods immediately preceding the date of termination, calculated as of the end of the most recently completed fiscal quarter before the date of termination.
The Manager and Resource America may engage in activities that compete with us.
Our management agreement does not prohibit the Manager or Resource America from investing in or managing entities that invest in asset classes that are the same as or similar to our targeted asset classes, except that they may not raise funds for, sponsor or advise any new publicly-traded REIT that invests primarily in mortgage-backed securities, or MBS, in the United States. The Manager’s policies regarding resolution of conflicts of interest may be varied by it if economic, market, regulatory or other conditions make their application economically inefficient or otherwise impractical. Moreover, our officers, other than our Chief Financial Officer and threeseveral accounting professionals on his staff, and the officers, directors and employees of Resource America who provide services to us are not required to work full time on our affairs, and devote significant time to the affairs of Resource America. As a result, there may be significant conflicts between us, on the one hand, and the Manager and Resource America on the other, regarding allocation of the Manager’s and Resource America’s resources to the management of our investment portfolio.
We have engaged in transactions with entities affiliated with the Manager. Our policies and procedures may be insufficient to address any conflicts of interest that may arise.
We have established procedures and policies regarding review, approval and ratification of transactions which may give rise to a conflict of interest between us and persons affiliated or associated with the Manager. In the ordinary course of our business, we have ongoing relationships and have engaged in transactions with entities affiliated or associated with the Manager. Our procedures may not be sufficient to address any conflicts of interest that arise.
Our Manager’s liability is limited under the management agreement, and we have agreed to indemnify our Manager against certain liabilities.
Our Manager does not assume any responsibility under the management agreement other than to render the services called for under it, and will not be responsible for any action of our board of directors in following or declining to follow its advice or recommendations. Resource America, the Manager, their directors, managers, officers, employees and affiliates will not be liable to us, any subsidiary of ours, our directors, our stockholders or any subsidiary’s stockholders for acts performed in accordance with and pursuant to the management agreement, except by reason of acts constituting bad faith, willful misconduct, gross negligence, or reckless disregard of their duties under the management agreement. We have agreed to indemnify the parties for all damages and claims arising from acts not constituting bad faith, willful misconduct, gross negligence, or reckless disregard of duties, performed in good faith in accordance with and pursuant to the management agreement.
We depend upon information systems of our manager to conduct our operations. Systems failures could significantly disrupt our business.
Our business depends on communications and information systems of our manager. Any failure or interruption of their systems could cause delays or other problems in our activities which could harm our operating results, cause the market price of our common stock to decline and reduce our ability to make distributions.
Risks Related to Real Estate Investments
The B notes in which we invest may be subject to additional risks relating to the privately negotiated structure and terms of the transaction, which may result in losses to us.
A B note is a loan typically secured by a first mortgage on a single large commercial property or group of related properties and subordinated to a senior note secured by the same first mortgage on the same collateral. As a result, if a borrower defaults, there may not be sufficient funds remaining for B note owners after payment to the senior note owners. Since each transaction is privately negotiated, B notes can vary in their structural characteristics and risks. For example, the rights of holders of B notes to control the process following a borrower default may be limited in certain investments. We cannot predict the terms of each B note investment we will make. Further, B notes typically are secured by a single property, and so reflect the increased risks associated with a single property compared to a pool of properties. B notes also are less liquid than other forms of commercial real estate debt investments, such as CMBS, and, as a result, we may be unable to dispose of underperforming or non-performing investments. The higher risks associated with the subordinate position of our B note investments could subject us to increased risk of loss.
Our real estate debt investments will be subject to the risks inherent in the real estate securing or underlying those investments which could result in losses to us.
Commercial mortgage loans are secured by, and mezzanine loans depend on, the performance of the underlying, multifamily or commercial property and are subject to risks of delinquency and foreclosure, and risks of loss, that are greater than similar risks associated with loans made on the security of single-family residential property. The ability of a borrower to repay a loan secured by or dependent upon an income-producing property typically depends primarily upon the successful operation of the property rather than upon the existence of independent income or assets of the borrower. If the net operating income of the property is reduced, the borrower’s ability to repay the loan may be impaired. Net operating income of an income producing property can be affected by, among other things:
| | ● | tenant mix, success of tenant businesses and property management decisions,decisions; |
| | ● | property location and condition,condition; |
| | ● | competition from comparable types of properties,properties; |
| | ● | changes in laws that increase operating expenses or limit rents that may be charged,charged; |
| | ● | any need to address environmental contamination at the property,property; |
| | ● | the occurrence of any uninsured casualty at the property,property; |
| | ● | changes in national, regional or local economic conditions and/or the conditions of specific industry segments in which our lessees may operate,operate; |
| | ● | declines in regional or local real estate values,values; |
| | ● | declines in regional or local rental or occupancy rates,rates; |
| | ● | increases in interest rates, real estate tax rates and other operating expenses,expenses; |
| | ● | increases in costs of construction material; |
| | ● | changes in governmental rules, regulations and fiscal policies, including environmental legislation, and |
| | ● | acts of God, terrorism, social unrest and civil disturbances. |
Although we currently hold no residential mortgage loans in our portfolio, in the past our portfolio has included substantial residential mortgage investments. Residential mortgage loans are subject to risks of delinquency and foreclosure, and risks of loss. The ability of a borrower to repay these loans depends upon the borrower’s income or assets. A number of factors, including national, regional or local economic downturns, acts of God, terrorism, social unrest and civil disturbances, may impair borrowers’ abilities to repay their loans. Economic problems specific to a borrower, such as loss of a job or medical problems may also impair a borrower’s ability to repay his or her loan.
We risk loss of principal on defaulted mortgage loans we hold to the extent of any deficiency between the value we can realize from the sale of the collateral securing the loan upon foreclosure, and the loan’s principal and accrued interest. Moreover, foreclosure of a mortgage loan can be an expensive and lengthy process which could reduce the net amount we can realize on the foreclosed mortgage loan. In a bankruptcy of a mortgage loan borrower, the mortgage loan will be deemed to be secured only to the extent of the value of the underlying collateral at the time of bankruptcy as determined by the bankruptcy court, and the lien securing the mortgage loan will be subject to the avoidance powers of the bankruptcy trustee or debtor-in-possession to the extent the lien is unenforceable under state law.
For a discussion of other risks associated with mezzanine loans, see “-Investing in mezzanine debt or mezzanine or other subordinated tranches of CMBS, bank loans and other ABS involves greater risks of loss than senior secured debt instruments.”
Our investment portfolio may have material geographic, sector, property-type and sponsor concentrations.
We may have material geographic concentrations related to our direct or indirect investments in real estate loans and properties. We also have material concentrations in the property types and industry sectors that are in our loan portfolio. Where we have any kind of concentration risk in our investments, an adverse development in that area of concentration could reduce the value of our investment and our return on that investment and, if the concentration affects a material amount of our investments, impair our ability to execute our investment strategies successfully, reduce our earnings and reduce our ability to make distributions.
Risks Related to Our Organization and Structure
Our charter and bylaws contain provisions that may inhibit potential acquisition bids that you and other stockholders may consider favorable, and the market price of our common stock may be lower as a result.
Our charter and bylaws contain provisions that may have an anti-takeover effect and inhibit a change in our board of directors. These provisions include the following:
| | ● | There are ownership limits and restrictions on transferability and ownership in our charter. For purposes of assisting us in maintaining our REIT qualification under the Internal Revenue Code, our charter generally prohibits any person from beneficially or constructively owning more than 9.8% in value or number of shares, whichever is more restrictive, of any class or series of our outstanding capital stock. This restriction may: |
| | – | discourage a tender offer or other transactions or a change in the composition of our board of directors or control that might involve a premium price for our shares or otherwise be in the best interests of our stockholders; or |
| | – | result in shares issued or transferred in violation of such restrictions being automatically transferred to a trust for a charitable beneficiary, resulting in the forfeiture of those shares. |
| | ● | Our charter permits our board of directors to issue stock with terms that may discourage a third partythird-party from acquiring us. Our board of directors may amend our charter without stockholder approval to increase the total number of authorized shares of stock or the number of shares of any class or series and issue common or preferred stock having preferences, conversion or other rights, voting powers, restrictions, limitations as to distributions, qualifications, or terms or conditions of redemption as determined by our board. Thus, our board could authorize the issuance of stock with terms and conditions that could have the effect of discouraging a takeover or other transaction in which holders of some or a majority of our shares might receive a premium for their shares over the then-prevailing market price. |
| | ● | Our charter and bylaws contain other possible anti-takeover provisions. Our charter and bylaws contain other provisions that may have the effect of delaying or preventing a change in control of us or the removal of existing directors and, as a result, could prevent our stockholders from being paid a premium for their common stock over the then-prevailing market price. |
Maryland takeover statutes may prevent a change in control of us, and the market price of our common stock may be lower as a result.
Maryland Control Share Acquisition Act. Maryland law provides that “control shares” of a corporation acquired in a “control share acquisition” will have no voting rights except to the extent approved by a vote of two-thirds of the votes eligible to be cast on the matter under the Maryland Control Share Acquisition Act. The act defines “control shares” as voting shares of stock that, if aggregated with all other shares of stock owned by the acquirer or in respect of which the acquirer is able to exercise or direct the exercise of voting power (except solely by virtue of a revocable proxy), would entitle the acquirer to exercise voting power in electing directors within one of the following ranges of voting power: one-tenth or more but less than one-third, one-third or more but less than a majority, or a majority or more of all voting power. A “control share acquisition” means the acquisition of control shares, subject to specific exceptions.
If voting rights or control shares acquired in a control share acquisition are not approved at a stockholders’ meeting or if the acquiring person does not deliver an acquiring person statement as required by the Maryland Control Share Acquisition Act then, subject to specific conditions and limitations, the issuer may redeem any or all of the control shares for fair value. If voting rights of such control shares are approved at a stockholders’ meeting and the acquirer becomes entitled to vote a majority of the shares entitled to vote, all other stockholders may exercise appraisal rights.
Our bylaws contain a provision exempting acquisitions of our shares from the Maryland Control Share Acquisition Act. However, our board of directors may amend our bylaws in the future to repeal this exemption.
Business combinations. Under Maryland law, “business combinations” between a Maryland corporation and an interested stockholder or an affiliate of an interested stockholder are prohibited for five years after the most recent date on which the interested stockholder becomes an interested stockholder. These business combinations include a merger, consolidation, share exchange or, in circumstances specified in the statute, an asset transferor issuance or reclassification of equity securities. An interested stockholder is defined as:
| | ● | any person who beneficially owns ten percent or more of the voting power of the corporation’s shares; or |
| | ● | an affiliate or associate of the corporation who, at any time within the two-year period before the date in question, was the beneficial owner of ten percent or more of the voting power of the then outstanding voting stock of the corporation. |
A person is not an interested stockholder under the statute if the board of directors approved in advance the transaction by which such person otherwise would have become an interested stockholder. However, in approving a transaction, the board of directors may provide that its approval is subject to compliance, at or after the time of approval, with any terms and conditions determined by the board.
After the five-year prohibition, any business combination between the Maryland corporation and an interested stockholder generally must be recommended by the board of directors of the corporation and approved by the affirmative vote of at least:
| | ● | 80% of the votes entitled to be cast by holders of outstanding shares of voting stock of the corporation; and |
| | ● | two-thirds of the votes entitled to be cast by holders of voting stock of the corporation other than shares held by the interested stockholder with whom or with whose affiliate the business combination is to be effected or held by an affiliate or associate of the interested stockholder. |
These super-majority vote requirements do not apply if the corporation’s common stockholders receive a minimum price, as defined under Maryland law, for their shares in the form of cash or other consideration in the same form as previously paid by the interested stockholder for its shares.
The statute permits exemptions from its provisions, including business combinations that are exempted by the board of directors before the time that the interested stockholder becomes an interested stockholder.
Our rights and the rights of our stockholders to take action against our directors and officers are limited, which could limit your recourse in the event of actions not in your best interests.
Our charter limits the liability of our directors and officers to us and our stockholders for money damages, except for liability resulting from:
| | ● | actual receipt of an improper benefit or profit in money, property or services; or |
| | ● | a final judgment based upon a finding of active and deliberate dishonesty by the director or officer that was material to the cause of action adjudicated. |
In addition, our charter authorizes us to indemnify our present and former directors and officers for actions taken by them in those capacities to the maximum extent permitted by Maryland law. Our bylaws require us to indemnify each present or former director or officer, to the maximum extent permitted by Maryland law, in the defense of any proceeding to which he or she is made, or threatened to be made, a party by reason of his or her service to us. In addition, we may be obligated to fund the defense costs incurred by our directors and officers.
Our right to take action against the Manager is limited.
The obligation of the Manager under the management agreement is to render its services in good faith. It will not be responsible for any action taken by our board of directors or investment committee in following or declining to follow its advice and recommendations. Furthermore, as discussed above under “− Risks Related to Our Manager,” it will be difficult and costly for us to terminate the management agreement without cause. In addition, we will indemnify the Manager, Resource America and their officers and affiliates for any actions taken by them in good faith.
We have not established a minimum distribution payment level and we cannot assure you of our ability to make distributions in the future. We may in the future use uninvested offering proceeds or borrowed funds to make distributions.
We expect to make quarterly distributions to our stockholders in amounts such that we distribute all or substantially all of our taxable income in each year, subject to certain adjustments. We have not established a minimum distribution payment level, and our ability to make distributions may be impaired by the risk factors described in this report. All distributions will be made at the discretion of our board of directors and will depend on our earnings, our financial condition, maintenance of our REIT qualification and other factors as our board of directors may deem relevant from time to time. We may not be able to make distributions in the future. In addition, some of our distributions may include a return of capital. To the extent that we decide to make distributions in excess of our current and accumulated taxable earnings and profits, such distributions would generally be considered a return of capital for federal income tax purposes. A return of capital is not taxable, but it has the effect of reducing the holder’s tax basis in its investment. Although we currently do not expect that we will do so, we have in the past and may in the future also use proceeds from any offering of our securities that we have not invested or borrowed funds to make distributions. If we use uninvested offering proceeds to pay distributions in the future, we will have less funds available for investment and, as a result, our earnings and cash available for distribution would be less than we might otherwise have realized had such funds been invested. Similarly, if we borrow to fund distributions, our future interest costs would increase, thereby reducing our future earnings and cash available for distribution from what they otherwise would have been.
Loss of our exclusion from regulation under the Investment Company Act would require significant changes in our operations and could reduce the market price of our common stock and our ability to make distributions.
In order to be excluded from regulation under the Investment Company Act, we must comply with the requirements of one or more of the exclusions from the definition of investment company. Because we conduct our business through wholly-owned subsidiaries, we must ensure not only that we qualify for an exclusion from regulation under the Investment Company Act, but also that each of our subsidiaries so qualifies. If we fail to qualify for an exclusion, we could be required to restructure our activities or register as an investment company. Either alternative would require significant changes in our operations and could reduce the market price of our common stock. For example, if the market value of our investments in assets other than qualifying real estate assets or real estate-related assets were to increase beyond the levels permitted under the Investment Company Act exclusion upon which we rely or if assets in our portfolio were deemed not to be qualifying real estate assets as a result of SEC staff guidance, we might have to sell those assets or acquire additional qualifying real estate assets in order to maintain our exclusion. Any such sale or acquisition could occur under adverse market conditions. If we were required to register as an investment company, our use of leverage to fund our investment strategies would be significantly limited, which would limit our profitability and ability to make distributions, and we would become subject to substantial regulation concerning management, operations, transactions with affiliated persons, portfolio composition, including restrictions with respect to diversification and industry concentration, and other matters.
Rapid changes in the values of our real-estate related investments may make it more difficult for us to maintain our qualification as a REIT or exclusion from regulation under the Investment Company Act.
If the market value or income potential of our real estate-related investments declines as a result of current economic conditions, increased interest rates, prepayment rates or other factors, we may need to increase our real estate-related investments and income and/or liquidate our non-qualifying assets in order to maintain our REIT qualification or exclusion from registration under the Investment Company Act. If the decline in real estate asset values and/or income occurs quickly, this may be especially difficult to accomplish. This difficulty may be exacerbated by the illiquid nature of many of our non-real estate assets. We may have to make investment decisions that we otherwise would not make absent REIT qualification and Investment Company Act considerations.
Tax Risks
Complying with REIT requirements may cause us to forego otherwise attractive opportunities.
To qualify as a REIT for federal income tax purposes, we must continually satisfy various tests regarding the sources of our income, the nature and diversification of our assets, the amounts we distribute to our stockholders and the ownership of our common stock. In order to meet these tests, we may be required to forego investments we might otherwise make. Thus, compliance with the REIT requirements may hinder our investment performance.
In particular, at least 75% of our assets at the end of each calendar quarter must consist of real estate assets, government securities, cash and cash items. For this purpose, “real estate assets” generally include interests in real property, such as land, buildings, leasehold interests in real property, stock of other entities that qualify as REITs, interests in mortgage loans secured by real property, investments in stock or debt instruments during the one-year period following the receipt of new capital and regular or residual interests in a real estate mortgage investment conduit, or REMIC. In addition, the amount of securities of a single issuer, other than a TRS, that we hold must generally not exceed either 5% of the value of our gross assets or 10% of the vote or value of such issuer’s outstanding securities.
Certain of the assets that we hold or intend to hold, including interests in CDOs or corporate leveraged loans, are not qualified and will not be qualified real estate assets for purposes of the REIT asset tests. ABS-RMBS and CMBS securities should generally qualify as real estate assets. However, to the extent that we own non-REMIC collateralized mortgage obligations or other debt instruments secured by mortgage loans (rather than by real property) or secured by non-real estate assets, or debt securities that are not secured by mortgages on real property, those securities are likely not qualifying real estate assets for purposes of the REIT asset test, and will not produce qualifying real estate income. Further, whether securities held by warehouse lenders or financed using repurchase agreements are treated as qualifying assets or as generating qualifying real estate income for purposes of the REIT asset and income tests depends on the terms of the warehouse or repurchase financing arrangement.
We generally will be treated as the owner of any assets that collateralize CDO transactions to the extent that we retain all of the equity of the securitization vehicle and do not make an election to treat such securitization vehicle as a TRS, as described in further detail below. It may be possible to reduce the impact of the REIT asset and gross income requirements by holding certain assets through our TRSs, subject to certain limitations as described below.
Our qualification as a REIT and exemption from U.S. federal income tax with respect to certain assets may depend on the accuracy of legal opinions or advice rendered or given or statements by the issuers of securities in which we invest, and the inaccuracy of any such opinions, advice or statements may adversely affect our REIT qualification and result in significant corporate level tax.
When purchasing securities, we have relied and may rely on opinions or advice of counsel for the issuer of such securities, or statements, made in related offering documents, for purposes of determining whether such securities represent debt or equity securities for U.S. federal income tax purposes, and also to what extent those securities constitute REIT real estate assets for purposes of the REIT asset tests and produce income which qualifies under the 75% REIT gross income test. In addition, when purchasing CDO equity, we have relied and may rely on opinions or advice of counsel regarding the qualification of interests in the debt of such CDOs for U.S. federal income tax purposes. The inaccuracy of any such opinions, advice or statements may adversely affect our REIT qualification and result in significant corporate-level tax.
We may realize excess inclusion income that would increase our tax liability and that of our stockholders.
If we realize excess inclusion income and allocate it to stockholders, this income cannot be offset by net operating losses of the stockholders. If the stockholder is a tax-exempt entity, then this income would be fully taxable as unrelated business taxable income under Section 512 of the Internal Revenue Code. If the stockholder is a foreign person, it would be subject to federal income tax withholding on this income without reduction or exemption pursuant to any otherwise applicable income tax treaty.
Excess inclusion income could result if we hold a residual interest in a REMIC. Excess inclusion income also could be generated if we issue debt obligations, such as certain CDOs, with two or more maturities and the terms of the payments on these obligations bore a relationship to the payments that we received on our mortgage related securities securing those debt obligations, i.e., if we were to own an interest in a taxable mortgage pool. While we do not expect to acquire significant amounts of residual interests in REMICs, we do own residual interests in taxable mortgage pools, which means that we will likely generate significant amounts of excess inclusion income.
If we realize excess inclusion income, we will be taxed at the highest corporate income tax rate on a portion of such income that is allocable to the percentage of our stock held in record name by “disqualified organizations,” which are generally cooperatives, governmental entities and tax-exempt organizations that are exempt from unrelated business taxable income. To the extent that our stock owned by “disqualified organizations” is held in record name by a broker/dealer or other nominee, the broker/dealer or other nominee would be liable for the corporate level tax on the portion of our excess inclusion income allocable to the stock held by the broker/dealer or other nominee on behalf of “disqualified organizations.” We expect that disqualified organizations will own our stock. Because this tax would be imposed on us, all of our investors, including investors that are not disqualified organizations, would bear a portion of the tax cost associated with the classification of us or a portion of our assets as a taxable mortgage pool. A regulated investment company or other pass through entity owning stock in record name will be subject to tax at the highest corporate rate on any excess inclusion income allocated to its owners that are disqualified organizations. Finally, if we fail to qualify as a REIT, our taxable mortgage pool securitizations will be treated as separate corporations, for federal income tax purposes that cannot be included in any consolidated corporate tax return.
Failure to qualify as a REIT would subject us to federal income tax, which would reduce the cash available for distribution to our stockholders.
We believe that we have been organized and operated in a manner that has enabled us to qualify as a REIT for federal income tax purposes commencing with our taxable year ended on December 31, 2005. However, the federal income tax laws governing REITs are extremely complex, and interpretations of the federal income tax laws governing qualification as a REIT are limited. Qualifying as a REIT requires us to meet various tests regarding the nature of our assets and our income, the ownership of our outstanding stock, and the amount of our distributions on an ongoing basis.
If we fail to qualify as a REIT in any calendar year and we do not qualify for certain statutory relief provisions, we will be subject to federal income tax, including any applicable alternative minimum tax on our taxable income, at regular corporate rates. Distributions to stockholders would not be deductible in computing our taxable income. Corporate tax liability would reduce the amount of cash available for distribution to our stockholders. Under some circumstances, we might need to borrow money or sell assets in order to pay that tax. Furthermore, if we fail to maintain our qualification as a REIT and we do not qualify for the statutory relief provisions, we no longer would be required to distribute substantially all of our REIT taxable income, determined without regard to the dividends paid deduction and not including net capital gains, to our stockholders. Unless our failure to qualify as a REIT werewas excused under federal tax laws, we could not re-elect to qualify as a REIT until the fifth calendar year following the year in which we failed to qualify. In addition, if we fail to qualify as a REIT, our taxable mortgage pool securitizations will be treated as separate corporations for U.S. federal income tax purposes.
Failure to make required distributions would subject us to tax, which would reduce the cash available for distribution to our stockholders.
In order to qualify as a REIT, in each calendar year we must distribute to our stockholders at least 90% of our REIT taxable income, determined without regard to the deduction for dividends paid and excluding net capital gain. To the extent that we satisfy the 90% distribution requirement, but distribute less than 100% of our taxable income, we will be subject to federal corporate income tax on our undistributed income. In addition, we will incur a 4% nondeductible excise tax on the amount, if any, by which our distributions in any calendar year are less than the sum of:
| | ● | 85% of our ordinary income for that year; |
| | ● | 95% of our capital gain net income for that year; and |
| | ● | 100% our undistributed taxable income from prior years. |
We intend to make distributions to our stockholders in a manner intended to satisfy the 90% distribution requirement and to distribute all or substantially all of our net taxable income to avoid both corporate income tax and the 4% nondeductible excise tax. There is no requirement that a domestic TRS distribute its after-tax net income to its parent REIT or their stockholders and Resource TRS may determine not to make any distributions to us. However, non-U.S. TRSs, such as Apidos CDO I, Apidos CDO III, and Apidos Cinco CDO, and Apidos CLO VIII, which we discuss in “Management’s Discussion and Analysis of Financial Conditions and Results of Operations,” will generally be deemed to distribute their earnings to us on an annual basis for federal income tax purposes, regardless of whether such TRSs actually distribute their earnings.earnings.-
Generally, dividends payable in stock are not treated as dividends for purposes of the deduction for dividends, or as taxable dividends to the recipient. A complex set of rules applies when a distribution is made partially in stock and partially in cash and different shareholders receive different proportions of each. The Internal Revenue Service, in Revenue Procedure 2010-12, has given guidance with respect to certain stock distributions by publicly traded REITS (and RICs). That Revenue Procedure applies to distributions made on or after January 1, 2008 and declared with respect to a taxable year ending on or before December 31, 2011. It provides that publicly-traded REITS can distribute stock (common shares in our case) to satisfy their REIT distribution requirements if stated conditions are met. These conditions include that at least 10% of the aggregate declared distributions be paid in cash and the shareholders be permitted to elect whether to receive cash or stock, subject to the limit set by the REIT on the cash to be distributed in the aggregate to all shareholders. We did not use this Revenue Procedure with respect to any distributions for our 2008, 2009, 2010 and 20102011 taxable years, but may do so for distributions with respect to 2011.2012.
Our taxable income may substantially exceed our net income as determined by GAAP because, for example, realized capital losses will be deducted in determining our GAAP net income but may not be deductible in computing our taxable income. In addition, we may invest in assets that generate taxable income in excess of economic income or in advance of the corresponding cash flow from the assets, referred to as phantom income. Although some types of phantom income are excluded to the extent they exceed 5% of our REIT taxable income in determining the 90% distribution requirement, we will incur corporate income tax and the 4% nondeductible excise tax with respect to any phantom income items if we do not distribute those items on an annual basis. As a result, we may generate less cash flow than taxable income in a particular year. In that event, we may be required to use cash reserves, incur debt, or liquidate non-cash assets at rates or times that we regard as unfavorable in order to satisfy the distribution requirement and to avoid corporate income tax and the 4% nondeductible excise tax in that year.
If we make distributions in excess of our current and accumulated earnings and profits, they will be treated as a return of capital, which will reduce the adjusted basis of your stock. To the extent such distributions exceed your adjusted basis, you may recognize a capital gain.
Unless you are a tax-exempt entity, distributions that we make to you generally will be subject to tax as ordinary income to the extent of our current and accumulated earnings and profits as determined for federal income tax purposes. If the amount we distribute to you exceeds your allocable share of our current and accumulated earnings and profits, the excess will be treated as a return of capital to the extent of your adjusted basis in your stock, which will reduce your basis in your stock but will not be subject to tax. To the extent the amount we distribute to you exceeds both your allocable share of our current and accumulated earnings and profits and your adjusted basis, this excess amount will be treated as a gain from the sale or exchange of a capital asset. For risks related to the use of uninvested offering proceeds or borrowings to fund distributions to stockholders, see “− Risks Related to Our Organization and Structure − We have not established a minimum distribution payment level and we cannot assure you of our ability to make distributions in the future.”
Our ownership of and relationship with our TRSs will be limited and a failure to comply with the limits would jeopardize our REIT qualification and may result in the application of a 100% excise tax.
A REIT may own up to 100% of the securities of one or more TRSs. A TRS may earn specified types of income or hold specified assets that would not be qualifying income or assets if earned or held directly by the parent REIT. Both the subsidiary and the REIT must jointly elect to treat the subsidiary as a TRS. A corporation of which a TRS directly or indirectly owns more than 35% of the voting power or value of the stock will automatically be treated as a TRS. Overall, no more than 25% (20% for our 2009 and prior taxable years) of the value of a REIT’s assets may consist of stock or securities of one or more TRSs. A TRS will pay federal, state and local income tax at regular corporate rates on any income that it earns, whether or not it distributes that income to us. In addition, the TRS rules limit the deductibility of interest paid or accrued by a TRS to its parent REIT to assure that the TRS is subject to an appropriate level of corporate taxation. The rules also impose a 100% excise tax on certain transactions between a TRS and its parent REIT that are not conducted on an arm’s-length basis.
Resource TRS will pay federal, state and local income tax on its taxable income, and its after-tax net income is available for distribution to us but is not required to be distributed to us. Income that is not distributed to us by Resource TRS will not be subject to the REIT 90% distribution requirement and therefore will not be available for distributions to our stockholders. We anticipate that the aggregate value of the securities of Resource TRS, together with the securities we hold in our other TRSs, including Apidos CDO I, Apidos CDO III, and Apidos Cinco CDO, and Apidos CLO VIII will be less than 25% of the value of our total assets, including our TRS securities. We will monitor the compliance of our investments in TRSs with the rules relating to value of assets and transactions not on an arm’s-length basis. We cannot assure you, however, that we will be able to comply with such rules.
Complying with REIT requirements may limit our ability to hedge effectively.
The REIT provisions of the Internal Revenue Code substantially limit our ability to hedge mortgage-backed securitiesMBS and related borrowings. Under these provisions, our annual gross income from qualifying and non-qualifying hedges of our borrowings, together with any other income not generated from qualifying real estate assets, cannot exceed 25% of our gross income. In addition, our aggregate gross income from non-qualifying hedges, fees and certain other non-qualifying sources cannot exceed 5% of our annual gross income determined without regard to income from qualifying hedges. As a result, we might have to limit our use of advantageous hedging techniques or implement those hedges through Resource TRS. This could increase the cost of our hedging activities or expose us to greater risks associated with changes in interest rates than we would otherwise want to bear.
The tax on prohibited transactions will limit our ability to engage in transactions, including certain methods of securitizing mortgage loans, that would be treated as sales for federal income tax purposes.
A REIT’s net income from prohibited transactions is subject to a 100% tax. In general, prohibited transactions are sales or other dispositions of property, other than foreclosure property, but including mortgage loans, held primarily for sale to customers in the ordinary course of business. We might be subject to this tax if we were able to sell or securitize loans in a manner that was treated as a sale of the loans for federal income tax purposes. Therefore, in order to avoid the prohibited transactions tax, we may choose not to engage in certain sales of loans and may limit the structures we utilize for our securitization transactions even though such sales or structures might otherwise be beneficial to us.
Tax law changes could depress the market price of our common stock.
The federal income tax laws governing REITs or the administrative interpretations of those laws may be amended at any time. We cannot predict when or if any new federal income tax law or administrative interpretation, or any amendment to any existing federal income tax law or administrative interpretation, will become effective and any such law or interpretation may take effect retroactively. Tax law changes could depress our stock price or restrict our operations.
Dividends paid by REITs do not qualify for the reduced tax rates provided for under current law.
Dividends paid by REITs are generally not eligible for the reduced 15% maximum tax rate for dividends paid to individuals under current law. The more favorable rates applicable to regular corporate dividends could cause stockholders who are individuals to perceive investments in REITs to be relatively less attractive than investments in the stock of non-REIT corporations that pay dividends to which more favorable rates apply, which could reduce the value of the stocks of REITs.
We may lose our REIT qualification or be subject to a penalty tax if the Internal Revenue Service successfully challenges our characterization of income inclusions from our foreign TRSs.
We likely will be required to include in our income, even without the receipt of actual distributions, earnings from our foreign TRSs, including from our current and contemplated equity investments in CDOs, such as our investment in Apidos CDO I, Apidos CDO III, Apidos Cinco CDO, and Apidos Cinco CDO.CLO VIII. We intend to treat certain of these income inclusions as qualifying income for purposes of the 95% gross income test applicable to REITs but not for purposes of the REIT 75% gross income test. The provisions that set forth what income is qualifying income for purposes of the 95% gross income test provide that gross income derived from dividends, interest and other enumerated classes of passive income qualify for purposes of the 95% gross income test. Income inclusions from equity investments in our foreign TRSs are technically neither dividends nor any of the other enumerated categories of income specified in the 95% gross income test for U.S. federal income tax purposes, and there is no clear precedent with respect to the qualification of such income for purposes of the REIT gross income tests. However, based on advice of counsel, we intend to treat such income inclusions, to the extent distributed by a foreign TRS in the year accrued, as qualifying income for purposes of the 95% gross income test. In addition, in 2011, the IRS issued a private letter ruling to a REIT reaching a result consistent with our treatment. Nevertheless, because this income does not meet the literal requirements of the REIT provisions, it is possible that the IRS could successfully take the position that it is not qualifying income. In the event that it was determined not to qualify for the 95% gross income test, we would be subject to a penalty tax with respect to the income to the extent it and other nonqualifying income exceeds 5% of our gross income and/or we could fail to qualify as a REIT. See “Federal Income Tax Consequences of Our Qualification as a REIT.” In addition, if such income was determined not to qualify for the 95% gross income test, we would need to invest in sufficient qualifying assets, or sell some of our interests in our foreign TRSs to ensure that the income recognized by us from our foreign TRSs or such other corporations does not exceed 5% of our gross income, or cease to qualify as a REIT.
We may lose our REIT qualification or be subject to a penalty tax if we modify mortgage loans or acquired distressed debt in a way that causes us to fail our REIT gross income or asset taxes.
Many of the terms of our mortgage loans, mezzanine loans and B-notes and the loans supporting our MBS have been modified and may in the future be modified to avoid foreclosure actions and for other reasons. If the terms of the loan are modified in a manner constituting a “significant modification,” such modification triggers a deemed exchange for tax purposes of the original loan for the modified loan. The IRS recently issued Revenue Procedure 2011-16, which addresses the treatment of modified mortgage loans and distressed debt for purposes of the REIT gross income and asset tests. Under existing Treasury Regulations, if a loan is secured by real property and other property and the highest principal amount of the loan outstanding during a taxable year exceeds the fair market value of the real property securing the loan as of (1) the date we agreed to acquire or originate the loan or (2) in the event of certain significant modifications, the date we modified the loan, then a portion of the interest income from such a loan will not be qualifying income for purposes of the 75% gross income test, but will be qualifying income for purposes of the 95% gross income test. Although the law is not entirely clear, a portion of the loan may not be treated as a qualifying “real estate asset” for purposes of the 75% asset test. The non-qualifying portion of such a loan would be subject to, among other requirements, the 10% value test.
Revenue Procedure 2011-16 provides a safe harbor pursuant to which we will not be required to redetermine the fair market value of the real property securing a loan for purposes of the REIT gross income and asset tests in connection with a loan modification that is: (1) occasioned by a borrower default; or (2) made at a time when we reasonably believe that the modification to the loan will substantially reduce a significant risk of default on the original loan. No assurance can be provided all of our loan modifications have or will qualify for the safe harbor in Revenue Procedure 2011-16. To the extent we significantly modify loans in a manner that does not qualify for that safe harbor, we will be required to redetermine the value of the real property securing the loan at the time it was significantly modified. In determining the value of the real property securing such a loan, we generally will not obtain third party appraisals, but rather will rely on internal valuations. No assurance can be provided that the IRS will not successfully challenge our internal valuations. If the terms of our mortgage loans, mezzanine loans and B-Notes and loans supporting our mortgage backed securities are significantly modified in a manner that does not qualify for the safe harbor in Revenue Procedure 2011-16 and the fair market value of the real property securing such loans has decreased significantly, we could fail the 75% gross income test, the 75% asset test and/or the 10% value test. Unless we qualified for relief under certain cure provisions in the Code, such failures could cause us to fail to qualify as a REIT.
We and our subsidiaries have and may invest in future acquire distressed debt, including distressed mortgage loans, mezzanine loans, B-Notes and MBS. Revenue Procedure 2011-16 provides that the IRS will treat a distressed mortgage loan acquired by a REIT that is secured by real property and other property as producing in part non-qualifying income for the 75% gross income test. Specifically, Revenue Procedure 2011-16 indicates that interest income on a loan will be treated as qualifying income based on the ratio of (1) the fair market value of the real property securing the loan determined as of the date the REIT committed to acquire the loan and (2) the face amount of the loan (and not the purchase price or current value of the loan). The face amount of a distressed mortgage loan and other distressed debt will typically exceed the fair market value of the real property securing the debt on the date the REIT commits to acquire the debt. We believe that we will continue to invest in distressed debt in a manner consistent with complying with the 75% gross income test and maintaining our qualification as a REIT.
Revenue Procedure 2011-16 provides a safe harbor pursuant to which we will not be required to redetermine the fair market value of the real property securing a loan for purposes of the REIT gross income and asset tests in connection with a loan modification that is: (1) occasioned by a borrower default; or (2) made at a time when we reasonably believe that the modification to the loan will substantially reduce a significant risk of default on the original loan. No assurance can be provided that all of the loan modifications have or will be qualify for the safe harbor in Revenue Procedure 2011-16. To the extent we significantly modify loans in a manner that does not qualify for that safe harbor, we will be required to redetermine the value of the real property securing the loan at the time it was significantly modified. In determining the value of the real property securing such a loan, we generally will not obtain third party appraisals, but rather will rely on internal valuations. No assurance can be provided that the IRS will not successfully challenge our internal valuations. If the terms of our mortgage loans, mezzanine loans and B-Notes and loans supporting our MBS are significantly modified in a manner that does not qualify for the safe harbor in Revenue Procedure 2011-16 and the fair market value of the real property securing such loans has decreased significantly, we could fail the 75% gross income test, the 75% asset test and/or the 10% value test. Unless we qualified for relief under certain cure provisions in the Code, such failures could cause us to fail to qualify as a REIT.
The failure of a loan subject to a repurchase agreement or a mezzanine loan to qualify as a real estate asset would adversely affect our ability to qualify as a REIT.
We have entered into and we intend to continue to enter into sale and repurchase agreements under which we nominally sell certain of our loan assets to a counterparty and simultaneously enter into an agreement to repurchase the sold assets. We believe that we have been and will be treated for U.S. federal income tax purposes as the owner of the loan assets that are the subject of any such agreement notwithstanding that the agreement may transfer record ownership of the assets to the counterparty during the term of the agreement. It is possible, however, that the IRS could assert that we did not own the loan assets during the term of the sale and repurchase agreement, in which case we could fail to qualify as a REIT.
In addition, we have acquired and will continue to acquire mezzanine loans, which are loans secured by equity interest in a partnership or limited liability company that directly or indirectly owns real property. In Revenue Procedure 2003-65, the IRS provided a safe harbor pursuant to which a mezzanine loan, if it meets each of the requirements contained in the Revenue Procedure, will be treated by the IRS as a real estate asset for purposes of the REIT asset tests, and interest derived from the mezzanine loan will be treated as qualifying mortgage interest for purposes of the REIT 75% income test. Although the Revenue Procedure provides a safe harbor on which taxpayers may rely, it does not prescribe rules of substantive tax law. We have acquired and will continue to acquire mezzanine loans that may not meet all of the requirements for reliance on this safe harbor. In the event we own a mezzanine loan that does not meet the safe harbor, the IRS could challenge the loan’s treatment as a real estate asset for purposes of the REIT asset and income tests, and if the challenge were sustained, we could fail to qualify as a REIT.
| ITEM 1B. | | UNRESOLVED STAFF COMMENTSCOMMENTS |
None.
None.
Philadelphia, Pennsylvania:
We maintain offices through our Manager. Our Manager maintains executive and corporate offices at One Crescent Drive in the Philadelphia Navy Yard in Philadelphia, Pennsylvania under a lease for 13,484 square feet that expires in May 2019. Certain of its financial fund management and certain real estate operations are also located in these offices. OurCertain of its real estate and commercial finance operations are located in another building at One Commerce Square, 2005 Market Street, Philadelphia, Pennsylvania under a lease for 59,448 square feet that expires in August 2013. In addition, our Manager also leases 21,554 square feet for additional executiveof office space and for certain of our real estate operations at 1845 Walnut Street, Philadelphia, Pennsylvania.Pennsylvania, which is primarily sublet to Atlas Energy, L.P., an affiliated entity of the Manager. This lease, which expires in May 2013. We believe2013, is in an office building in which the Manager owns a 5% equity interest.
New York, New York:
Our Manager also maintains additional executive offices in a 12,930 square foot location at 712 5th Avenue, New York, New York under a lease agreement that our facilities are adequate for our current needs.expires in July 2020. A portion of this office space is sublet to The Bancorp, Inc.
We are not a party to any material legal proceedings.
| ITEM 4. | | [OMITTED AND RESERVED] |
Not applicable.
PART II
| ITEM 5. | | MARKET FOR REGISTRANT’S COMMON EQUITY, RELATED STOCKHOLDER MATTERS AND ISSUER PURCHASES OF EQUITY SECURITIES |
Market Information
Our common stock has been listed on the New York Stock Exchange under the symbol “RSO” since our initial public offering in February 2006. The following table sets forth for the indicated periods the high and low prices for our common stock, as reported on the New York Stock Exchange, and the dividends declared and paid during our past two fiscal years:
| | | | | | | | | | | |
| Fiscal 2011 | | | | | | | | | | |
Fourth Quarter | | | $ | 6.08 | | | $ | 4.55 | | | $ | 0.25 | (1) |
Third Quarter | | | $ | 6.46 | | | $ | 4.54 | | | $ | 0.25 | |
Second Quarter | | | $ | 6.78 | | | $ | 6.17 | | | $ | 0.25 | |
First Quarter | | | $ | 7.60 | | | $ | 6.59 | | | $ | 0.25 | |
| | | | | | | | | | | | | | | | | | | | | | |
| Fiscal 2010 | | | | | | | | | | | | | | | | | | | | | |
Fourth Quarter | | $ | 7.65 | | | $ | 6.27 | | | $ | 0.25 | (1) | | $ | 7.65 | | | $ | 6.27 | | | $ | 0.25 | |
Third Quarter | | $ | 6.68 | | | $ | 5.17 | | | $ | 0.25 | | | $ | 6.68 | | | $ | 5.17 | | | $ | 0.25 | |
Second Quarter | | $ | 7.47 | | | $ | 5.15 | | | $ | 0.25 | | | $ | 7.47 | | | $ | 5.15 | | | $ | 0.25 | |
First Quarter | | $ | 7.18 | | | $ | 5.05 | | | $ | 0.25 | | | $ | 7.18 | | | $ | 5.05 | | | $ | 0.25 | |
| | | | | | | | | | | | | | |
| Fiscal 2009 | | | | | | | | | | | | | |
Fourth Quarter | | $ | 5.40 | | | $ | 4.33 | | | $ | 0.25 | | |
Third Quarter | | $ | 6.21 | | | $ | 2.76 | | | $ | 0.30 | | |
Second Quarter | | $ | 3.89 | | | $ | 2.96 | | | $ | 0.30 | | |
First Quarter | | $ | 3.83 | | | $ | 1.50 | | | $ | 0.30 | | |
| (1) | We distributed a regular dividend of $0.25 on January 26, 2011,27, 2012, to stockholders of record as of December 31, 2010.30, 2011. |
We are organized and conduct our operations to qualify as a real estate investment trust, or a REIT, which requires that we distribute at least 90% of our REIT taxable income. Therefore, we intend to continue to declare quarterly distributions on our common stock. No assurance, however, can be given as to the amounts or timing of future distributions as such distributions are subject to our earnings, financial condition, capital requirements and such other factors as our board of directors seemsdeems relevant.
As of March 8, 2011,2012, there were 61,943,670 83,173,755 common shares outstanding held by 281persons466 persons of record.
See Item 12 – “Security Ownerships of Certain Beneficial Owners and Management and Related Stockholder Matters” for information relating to securities authorized for issuance under our equity compensation plans.
Recent Sales of Unregistered Securities; Use of Proceeds from Registered Securities
In accordance with the provisions of the management agreement, on January 31, 2010,2011, July 31, 20102011 and October 31, 20102011 we issued 73,815, 124,6881,414, 29,808 and 53,49045,938 shares of common stock, respectively, to our Manager. These shares represented 25% of the Manager’s quarterly incentive compensation fee that accrued for the three months ended December 31, 2009,2010, for the three months ended June 30, 20102011 and for the three months ended September 30, 2010,2011, respectively. The issuance of these shares was exempt from the registration requirements of the Securities Act pursuant to Section 4(2) thereof.
Performance Graph
The following line graph presentation compares cumulative total shareholder returns of our common stock with the Russell 2000 Index and the NAREIT All REIT Index for the period from February 10, 2006 to December 31, 2010.2011. The graph and table assume that $100 was invested in each of our common stock, the Russell 2000 Index and the NAREIT All REIT Index on February 10, 2006, and that all dividends were reinvested. This data was furnished by the Research Data Group.
| ITEM 6. | | SELECTED FINANCIAL DATADATA |
SELECTED CONSOLIDATED FINANCIAL INFORMATION OF
RESOURCE CAPITAL CORP AND SUBSIDIARIES
The following selected financial and operating information should be read in conjunction with Item 7 – “Management’s Discussion and Analysis of Financial Condition and Results of Operations” and our financial statements, including the notes, included elsewhere herein (in thousands, except share data).
| | | As of and for the years ended | |
| | | | |
| | | | | | | | | | | | | | | | |
| Consolidated Statement of Operations Data: | | | | | | | | | | | | | | | |
| REVENUES: | | | | | | | | | | | | | | | |
Interest income | | $ | 103,911 | | | $ | 97,593 | | | $ | 134,341 | | | $ | 176,995 | | | $ | 137,075 | |
Interest expense | | | 36,466 | | | | 45,427 | | | | 79,619 | | | | 121,564 | | | | 101,851 | |
Net interest income | | | 67,445 | | | | 52,166 | | | | 54,722 | | | | 55,431 | | | | 35,224 | |
| | | | | | | | | | | | | | | | | | | | | |
OPERATING EXPENSES | | | 32,608 | | | | 16,059 | | | | 12,438 | | | | 13,415 | | | | 11,144 | |
| | | | | | | | | | | | | | | | | | | | | |
| | | | 34,837 | | | | 36,107 | | | | 42,284 | | | | 42,016 | | | | 24,080 | |
| | | | | | | | | | | | | | | | | | | | | |
| OTHER (EXPENSES) REVENUES: | | | | | | | | | | | | | | | | | | | | |
Impairment losses on investment securities | | | (29,042 | ) | | | (27,490 | ) | | | (26,611 | ) | | | (48,853 | ) | | | (2,612 | ) |
Recognized in other comprehensive loss | | | (2,238 | ) | | | (14,019 | ) | | | (26,611 | ) | | | (22,576 | ) | | | (2,612 | ) |
Net impairment losses recognized in earnings | | | (26,804 | ) | | | (13,471 | ) | | | − | | | | (26,277 | ) | | | − | |
Net realized gain (loss) on investment securities available-for-sale and loans | | | 4,821 | | | | 1,890 | | | | (1,637 | ) | | | (15,098 | ) | | | (8,627 | ) |
Net realized gain on investments securities-trading | | | 5,052 | | | | − | | | | − | | | | − | | | | − | |
Net unrealized gain on investments securities-trading | | | 9,739 | | | | − | | | | − | | | | − | | | | − | |
Gain on deconsolidation | | | − | | | | − | | | | − | | | | 14,259 | | | | − | |
Provision for loan and lease losses | | | (43,321 | ) | | | (61,383 | ) | | | (46,160 | ) | | | (6,211 | ) | | | − | |
Gain on the extinguishment of debt | | | 34,610 | | | | 44,546 | | | | 1,750 | | | | − | | | | − | |
Gain on the settlement of loan | | | − | | | | − | | | | 574 | | | | − | | | | − | |
Other income (expense) | | | 513 | | | | (1,350 | ) | | | 115 | | | | 201 | | | | 153 | |
Total other (expense) revenue | | | (15,390 | ) | | | (29,768 | ) | | | (45,358 | ) | | | (33,126 | ) | | | (8,474 | ) |
NET INCOME (LOSS) | | $ | 19,447 | | | $ | 6,339 | | | $ | (3,074 | ) | | $ | 8,890 | | | $ | 15,606 | |
| | | | | | | | | | | | | | | | | | | | | |
| Consolidated Balance Sheet Data: | | | | | | | | | | | | | | | | | | | | |
Cash and cash equivalents | | $ | 29,488 | | | $ | 51,991 | | | $ | 14,583 | | | $ | 6,029 | | | $ | 5,354 | |
Restricted cash | | | 168,192 | | | | 85,125 | | | | 60,394 | | | | 119,482 | | | | 30,721 | |
Investment securities-trading | | | 17,723 | | | | − | | | | − | | | | − | | | | − | |
Investment securities available-for-sale, pledged as collateral, at fair value | | | 57,998 | | | | 39,304 | | | | 22,466 | | | | 65,464 | | | | 420,997 | |
Investment securities available-for-sale, at fair value | | | 5,962 | | | | 5,238 | | | | 6,794 | | | | − | | | | − | |
Investment securities held-to-maturity, pledged as collateral | | | 29,036 | | | | 31,401 | | | | 28,157 | | | | 18,517 | | | | 3,978 | |
Property available-for-sale | | | 4,444 | | | | − | | | | − | | | | − | | | | − | |
Loans, pledged as collateral and net of allowances of $34.2 million, $47.1 million, $43.9 million, $0 and $0 | | | 1,443,271 | | | | 1,557,757 | | | | 1,684,622 | | | | 1,748,122 | | | | 1,236,310 | |
Loans held for sale | | | 28,593 | | | | 8,050 | | | | − | | | | − | | | | − | |
Lease receivables, net of allowances of $70,000, $1.1 million, $450,000, $293,000 and $0, net of unearned income | | | 109,612 | | | | 927 | | | | 104,015 | | | | 95,030 | | | | 88,970 | |
Total assets | | | 1,934,200 | | | | 1,791,404 | | | | 1,936,031 | | | | 2,072,148 | | | | 1,802,829 | |
Borrowings | | | 1,543,251 | | | | 1,534,874 | | | | 1,699,763 | | | | 1,760,969 | | | | 1,463,853 | |
Total liabilities | | | 1,585,874 | | | | 1,562,574 | | | | 1,749,726 | | | | 1,800,542 | | | | 1,485,278 | |
Total stockholders’ equity | | | 348,326 | | | | 228,830 | | | | 186,305 | | | | 271,606 | | | | 317,551 | |
| | | | | | | | | | | | | | | | | | | | | |
| Per Share Data: | | | | | | | | | | | | | | | | | | | | |
Dividends declared per common share | | $ | 1.00 | | | $ | 1.15 | | | $ | 1.60 | | | $ | 1.62 | | | $ | 1.49 | |
Net income (loss) per share – basic | | $ | 0.41 | | | $ | 0.25 | | | $ | (0.12 | ) | | $ | 0.36 | | | $ | 0.89 | |
Net income (loss) per share − diluted | | $ | 0.41 | | | $ | 0.25 | | | $ | (0.12 | ) | | $ | 0.36 | | | $ | 0.87 | |
| Weighted average number of shares outstanding - basic | | | 47,715,082 | | | | 25,205,403 | | | | 24,757,386 | | | | 24,610,468 | | | | 17,538,273 | |
| Weighted average number of shares outstanding - diluted | | | 47,907,281 | | | | 25,355,821 | | | | 24,757,386 | | | | 24,860,184 | | | | 17,881,355 | |
| | | As of and for the Years Ended December 31, | |
| | | | | | | | | | | | | | | | |
| Consolidated Statement of Operations Data: | | | | | | | | | | | | | | | |
| REVENUES: | | | | | | | | | | | | | | | |
Interest income | | $ | 110,194 | | | $ | 103,911 | | | $ | 97,593 | | | $ | 134,341 | | | $ | 176,995 | |
Interest expense | | | 30,431 | | | | 36,466 | | | | 45,427 | | | | 79,619 | | | | 121,564 | |
Net interest income | | | 79,763 | | | | 67,445 | | | | 52,166 | | | | 54,722 | | | | 55,431 | |
Other revenues | | | 14,400 | | | | − | | | | − | | | | − | | | | − | |
Total revenues | | | 94,163 | | | | 67,445 | | | | 52,166 | | | | 54,722 | | | | 55,431 | |
| | | | | | | | | | | | | | | | | | | | | |
OPERATING EXPENSES | | | 41,345 | | | | 32,608 | | | | 16,059 | | | | 12,438 | | | | 13,415 | |
| | | | | | | | | | | | | | | | | | | | | |
| | | | 52,818 | | | | 34,837 | | | | 36,107 | | | | 42,284 | | | | 42,016 | |
| OTHER REVENUES (EXPENSES): | | | | | | | | | | | | | | | | | | | | |
Net impairment losses recognized in earnings | | | (6,898 | ) | | | (26,804 | ) | | | (13,471 | ) | | | − | | | | (26,277 | ) |
Net realized gain (loss) on investment securities available-for-sale and loans | | | 2,622 | | | | 4,821 | | | | 1,890 | | | | (1,637 | ) | | | (15,098 | ) |
Net realized and unrealized gain on investments securities-trading | | | 858 | | | | 14,791 | | | | − | | | | − | | | | − | |
Gain on deconsolidation | | | − | | | | − | | | | − | | | | − | | | | 14,259 | |
Provision for loan and lease losses | | | (13,896 | ) | | | (43,321 | ) | | | (61,383 | ) | | | (46,160 | ) | | | (6,211 | ) |
Gain on the extinguishment of debt | | | 3,875 | | | | 34,610 | | | | 44,546 | | | | 1,750 | | | | − | |
Gain on the settlement of loan | | | − | | | | − | | | | − | | | | 574 | | | | − | |
Other (expense) income | | | (1,663 | ) | | | 513 | | | | (1,350 | ) | | | 115 | | | | 201 | |
Total other (expense) | | | (15,102 | ) | | | (15,390 | ) | | | (29,768 | ) | | | (45,358 | ) | | | (33,126 | ) |
NET INCOME (LOSS) | | $ | 37,716 | | | $ | 19,447 | | | $ | 6,339 | | | $ | (3,074 | ) | | $ | 8,890 | |
| | | | | | | | | | | | | | | | | | | | | |
| Consolidated Balance Sheet Data: | | | | | | | | | | | | | | | | | | | | |
Cash and cash equivalents | | $ | 43,116 | | | $ | 29,488 | | | $ | 51,991 | | | $ | 14,583 | | | $ | 6,029 | |
Restricted cash | | | 142,806 | | | | 168,192 | | | | 85,125 | | | | 60,394 | | | | 119,482 | |
Investment securities trading | | | 38,673 | | | | 17,723 | | | | − | | | | − | | | | − | |
Investment securities available-for-sale, pledged as collateral, at fair value | | | 153,366 | | | | 57,998 | | | | 39,304 | | | | 22,466 | | | | 65,464 | |
Investment securities available-for-sale, at fair value | | | 4,678 | | | | 5,962 | | | | 5,238 | | | | 6,794 | | | | − | |
Investment securities held-to-maturity, pledged as collateral | | | − | | | | 29,036 | | | | 31,401 | | | | 28,157 | | | | 18,517 | |
Property available-for-sale | | | 2,980 | | | | 4,444 | | | | − | | | | − | | | | − | |
Investment in real estate | | | 48,027 | | | | − | | | | − | | | | − | | | | − | |
Loans, pledged as collateral and net of allowances of $27.5 million, $34.2 million, $47.1 million, $43.9 million and $0 | | | 1,772,063 | | | | 1,443,271 | | | | 1,557,757 | | | | 1,684,622 | | | | 1,748,122 | |
Loans held for sale | | | 3,154 | | | | 28,593 | | | | 8,050 | | | | − | | | | − | |
Lease receivables, net of allowances of $0 $70,000, $1.1 million, $450,000, and $293,000, net of unearned income | | | − | | | | 109,612 | | | | 927 | | | | 104,015 | | | | 95,030 | |
Investments in unconsolidated entities | | | 47,899 | | | | 6,791 | | | | 3,605 | | | | 1,548 | | | | 1,805 | |
Intangible assets | | | 19,813 | | | | − | | | | − | | | | − | | | | − | |
Total assets | | | 2,299,627 | | | | 1,934,200 | | | | 1,791,404 | | | | 1,936,031 | | | | 2,072,148 | |
Borrowings | | | 1,808,986 | | | | 1,543,251 | | | | 1,534,874 | | | | 1,699,763 | | | | 1,760,969 | |
Total liabilities | | | 1,869,937 | | | | 1,585,874 | | | | 1,562,574 | | | | 1,749,726 | | | | 1,800,542 | |
Total stockholders’ equity | | | 429,690 | | | | 348,326 | | | | 228,830 | | | | 186,305 | | | | 271,606 | |
| | | As of and for the Years Ended December 31, | |
| | | | | | | | | | | | | | | | |
| Per Share Data: | | | | | | | | | | | | | | | |
Dividends declared per common share | | $ | 1.00 | | | $ | 1.00 | | | $ | 1.15 | | | $ | 1.60 | | | $ | 1.62 | |
Net income (loss) per share – basic | | $ | 0.54 | | | $ | 0.41 | | | $ | 0.25 | | | $ | (0.12 | ) | | $ | 0.36 | |
Net income (loss) per share − diluted | | $ | 0.53 | | | $ | 0.41 | | | $ | 0.25 | | | $ | (0.12 | ) | | $ | 0.36 | |
| Weighted average number of shares outstanding - basic | | | 70,410,131 | | | | 47,715,082 | | | | 25,205,403 | | | | 24,757,386 | | | | 24,610,468 | |
| Weighted average number of shares outstanding - diluted | | | 70,809,088 | | | | 47,907,281 | | | | 25,355,821 | | | | 24,757,386 | | | | 24,860,184 | |
| ITEM 7. | | MANAGEMENT’S DISCUSSION AND ANALYSIS OF FINANCIALFINANCIAL CONDITION AND RESULTS OF OPERATIONS |
The following discussion provides information to assist you in understanding our financial condition and results of operations. This discussion should be read in conjunction with our consolidated financial statements and related notes appearing elsewhere in this report. This discussion contains forward-looking statements. Actual results could differ materially from those expressed in or implied by those forward looking statements. Please see “Forward-Looking Statements” and “Risk Factors” for a discussion of certain risks, uncertainties and assumptions associated with those statements.
Overview
We are a specialty finance company that focuses primarily on commercial real estateCRE assets, CMBS and commercial finance.finance assets. We are organized and conduct our operations to qualify as a REIT under Subchapter M of the Internal Revenue Code of 1986, as amended. Our objective is to provide our stockholders with total returns over time, including quarterly distributions and capital appreciation, while seeking to manage the risks associated with our investment strategy. We invest in a combination of real estate-related assets and, to a lesser extent, higher-yielding commercial finance assets. We have financed a substantial portion of our portfolio investments through borrowing strategies seeking to match the maturities and repricing dates of our financings with the maturities and repricing dates of those investments, and have sought to mitigate interest rate risk through derivative instruments.
We are externally managed by Resource Capital Manager, Inc., a wholly-owned indirect subsidiary of Resource America, Inc. (NASDAQ: REXI), or Resource America, a specialized asset management company that uses industry specific expertise to evaluate, originate, service and manage investment opportunities through its commecialcommercial real estate, commercial finance and financial fund management operating segments. As of December 31, 2010,2011, Resource America managed approximately $12.0$13.3 billion of assets in these sectors. To provide its services, the Manager draws upon Resource America, its management team and their collective investment experience.
We generate our income primarily from the spread between the revenues we receive from our assets and the cost to finance the purchase of those assets and hedgefrom hedging interest rate risks. We generate revenues from the interest and fees we earn on our whole loans, A notes, B notes, mezzanine debt, commercial mortgage-backed securities, or CMBS, real estate rental income, bank loans, payments on lease receivables andmanagement of externally originated bank loans, other asset-backed securities, or ABS.ABS, structured note investments and an investment in an equipment leasing business. Historically, we have used a substantial amount of leverage to enhance our returns and we have financed each of our different asset classes with different degrees of leverage. The cost of borrowings to finance our investments comprisesis a significant part of our expenses. Our net income depends on our ability to control these expenses relative to our revenue. In our bank loans, CMBS lease receivables and other ABS portfolios, we historically have used warehouse facilities as a short-term financing source and collateralized debt obligations, or CDOs, and, to a lesser extent, other term financing as a long-term financing source.sources. In our commercial real estate loan portfolio, we historically have used repurchase agreements as a short-term financing source, and CDOs and, to a lesser extent, other term financing as a long-term financing source.sources. Our other term financing has consisted of long-term match-funded financing provided through long-term bank financing and asset-backed financing programs, depending upon market conditions and credit availability.
Ongoing problemsAlthough economic conditions in the United States have had some modest improvements, ongoing conditions in real estate and credit markets continue to impact our operations, particularly our ability to generate capitalboth us and financing to execute our investment strategies. These problems have also affected a number of our commercial real estate borrowers and,borrowers. We have entered into loan modifications with respect to 2726 of our commercial real estate loans, caused us to enter into loan modifications.including 16 in 2011. We have increased our allowance for loan and lease losses to reflect the effect of these conditions on our borrowers and have recorded both temporary and other than temporary impairments in the market valuation of the CMBS and other ABS in our investment portfolio.portfolio, although as a result of the modest improvement in the United States economy and the strengthened financial condition of our borrowers, the aggregate amount of these changes were substantially less than in 2010. While we believe we have appropriately valued the assets in our investment portfolio at December 31, 2010,2011, we cannot assure you that further impairments will not occur or that our assets will otherwise not be adversely effectedaffected by market conditions.
ThePrior to mid-2010 events occurring in the credit markets have impacted our financing and investing strategies and, as a result, our ability to originate new investments and to grow. The market for securities issued by new securitizations collateralized by assets similar to those in our investment portfolio had largely disappeared until mid 2010.mid-2010. During 2011 and 2010, however, we began to see thea loosening of previously frozen credit markets begin to thaw and in May 2010 we closed a new $120.0 million securitization on our equipment leasing portfolio. In addition, in February 2011, we entered into a $100.0 million, two year term facility with Wells Fargo to purchase CMBS. BecauseIn June 2011 we obtained a warehouse facility to finance the purchase of rising U.S. treasury ratesbank loans with Citibank N.A. through Apidos CLO VIII, Ltd, or Apidos CLO VIII. More recently, we entered into a $10.0 million revolving credit facility with The Bancorp Bank, a related party and hedge contracts that matured,in February 2012, we received proceeds from margin calls relatedentered into a $150.0 million master repurchase and securities agreement with Wells Fargo Bank, National Association to our interest rate derivativesfinance the origination of $2.1 million during the year ended December 31, 2010.
Credit market conditions and the recessionary economy have also resulted in an increasing number of loan modifications, particularly in our commercial real estate or CRE loans. Borrowers have experienced deteriorationWe continue to engage in the performance of the properties we have financed or delays in implementing their business plans. In order to assist our borrowers in effectuating their business plans, including the leasing and repositioning of the underlying assets, we have been willing to enter into loan modifications that would adapt ourdiscussions with potential financing to their particular situations. The most common loan modifications have included term extensions and modest interest rate reductions through the lowering of London Interbank Offered Rate, or LIBOR, floors, offset by increased interest rate spreads over LIBOR. In exchange for the loan modifications, we have received partial principal pay-downs, new equity investment commitments in the properties from the borrowers or their principals, additional fees and other structural improvements and credit enhancements to the loans. Since the beginning of 2008 through December 31, 2010, we have modified 27sources about providing commercial real estate or CRE, loans. Management determinedterm financing to augment and cautiously grow our loan origination platform. We caution investors that one ofeven if credit through these modifications was due to financial distress of the borrower and accordingly, qualified as a troubled debt restructuring. We expect thatmarkets becomes more available, we may have more CRE loan modifications in the future. Subsequentnot be able to year end, management modified an additional loan due to financial stress of the borrower.obtain economically favorable terms.
As economic conditions improve and we beginproceed to access the credit markets on acceptable terms, our principal strategies are to manage our liquidity and originate new assets primarily through capital recycling as loan payoffs and paydowns occur and through existing capacities within our completed securitizations.securitizations and available credit facilities. The following is a summary of repayments we received during the year ended December 31, 2010:2011:
| | ● | $17.710.0 million of commercial real estate loans paid off; |
| | ● | $31.733.1 million of commercial real estate loan principal repayments; |
| | ● | $36.869.7 million at commercial real estate loan sale proceeds; |
| | ● | $267.0380.7 million of bank loan principal repayments; and |
| | ● | $57.6142.3 million of bank loan sale proceeds. |
We have used recycled capital in our CRE CDO and bank loan CLO structures to make new investments at discounts to par. We expect that the reinvested capital and related discountdiscounts will produce additional income as the discount isdiscounts are accreted throughinto interest income. In addition, the purchase of these investments at discounts allows us to build collateral in the CDO and CLO structures since we receive credit in these structures for these investments at par. During 2010 and 2009,2011, we purchased CMBSbank loans which had $88.7$827.2 million par value at a discount to par of 22.5%, and bank loans which had $608.8 million par value at a discount to par of 9.0%3.0%. From the net discounts of approximately $32.8$25.0 million, and $55.0accounting for $2.4 million of net discount recognized due to payoffs and paydowns during the year 2011, we expect to recognize income of approximately $5.5 million and $9.4$6.3 million in our CRE CDO and bank loan CLO portfolio respectively, in 2011.2012.
As a result of the success of our bank loan portfolio in 2011 and slower than anticipated commercial real estate loan origination, compliance with the 75% gross income test for REIT qualification (where we are required to generate a minimum of 75% of our gross income from qualifying real estate income, as defined in the Internal Revenue Code) became more difficult. As a result, we took steps during the fourth quarter of 2011 to enable us to continue to satisfy the 75% gross income test. First, we reduced our non-real estate and thus, non-qualifying income from the Apidos I and Apidos III CLOs through the election of RCC Commercial to be treated as a taxable REIT subsidiary beginning on October 27, 2011 and ending on December 31, 2011. Second, we further reduced our non real estate income by selling multiple positions in Apidos Cinco CLO in November 2011, at substantial losses.
In 2012 and thereafter, we expect to be able to satisfy the 75% gross income test through growth in our investments in commercial real estate or CRE, loans and CRE equity positions, a process we began in 2011. These loans will generate a full year of gross real estate and, thus, qualifying income in 2012. We expect to originate additional CRE loans and expect to be fully-invested in our second CRE CDO by the second quarter of 2012, which will generate substantial gross real estate interest income and thus augment, qualifying income. Additionally, we acquired in 2011, and expect to continue to acquire in 2012, equity positions in commercial real estate that we expect will generate substantial gross rental income that also qualifies for the 75% gross income test.
During 2010, we invested $5.0 million through Resource TRS, our taxable REIT subsidiary, in structured finance vehicles, principally CLO equity, which we have classified as trading securities. Because of the success of that new investment, we committed an additional $8.0 million through February 2011. Beginning in October 2010 through FebruaryDecember 2011, we have underwritten three13 new CRE loans for a total of $24.2$159.6 million. We also purchased three18 newly underwritten CMBS for $7.2$72.8 million beginning in February 2011 in conjunctionthrough December 2011 financed with the Wells Fargo facility. Furthermore, in JanuaryIn 2011, we have continuedadded to invest in the lease receivable portfolio and made aour preferred stock investment in LeafLEAF Commercial Capital, Inc,Inc., or LCC, a recently formedrecapitalized equipment leasing enterprise associated with our Manager, and held a subsidiary of our Manager.$36.3 million investment in LCC at December 31, 2011. In February 2011, we purchased a company that manages $1.9 billion of bank loan assets and are entitled to collect senior, subordinated and incentive management fees. TheseIn October 2011, we closed Apidos CLO VIII, a $350.0 million CLO transaction and issued $317.6 million of senior notes and $34.7 million of subordinated notes in conjunction with the closing. Apidos CLO VIII provides financing for bank loans and we own a 43% interest in the equity of the CLO. Due to these recent asset purchasesinvestments, our increased ability to access credit markets and credit market events indicate that we expect to be ableour ability to invest a significant portion of our available unrestricted and restricted cash balances and, as a result,during 2012, we expect to modestly growincrease our net interest income in 2011.2012. However, because we believe that economic conditions in the United States are fragile, and could be significantly harmed by occurrences over which we have no control, we cannot assure you that we will be able to meet our expectations, or that we will not experience net interest income reductions.
As of December 31, 2011, we had invested 63.0% of our current investment portfolio in CRE assets, 30.6% in commercial bank loans and generate dividends for our shareholders.
6.4% in other investments. As of December 31, 2010, we had invested 76.7% of our portfolio in CRE assets, 18.4% in commercial bank loans, 3.1% in lease receivables and 1.8% in structured notes. As of December 31, 2009, we had invested 76.4% of our portfolio in CRE assets, 23.2% in commercial bank loans and 0.4% in lease receivables.
Results of Operations
Our net income for the year ended December 31, 2011 was $37.7 million, or $0.54 per share-basic ($0.53 per share-diluted), as compared to net income for the year ended December 31, 2010 wasof $19.4 million, or $0.41 per share (basic and diluted), and as compared to net income of $6.3 million, or $0.25 per share (basic and diluted), for the year ended December 31, 2009, and compared to a net loss of $3.1 million, or ($0.12) per share (basic and diluted), for the year ended December 31, 2008.
2009.
Interest Income
The following tables set forth information relating to our interest income recognized for the periods presented (in thousands, except percentages):
| | | Years Ended | |
| | | | |
| | | | | | | | | | |
| Interest income: | | | | | | | | | |
Interest income from loans: | | | | | | | | | |
Bank loans | | $ | 43,970 | | | $ | 35,770 | | | $ | 53,172 | |
Commercial real estate loans | | | 32,866 | | | | 48,793 | | | | 63,936 | |
Total interest income from loans | | | 76,836 | | | | 84,563 | | | | 117,108 | |
| | | | | | | | | | | | | |
Interest income from securities: | | | | | | | | | | | | |
CMBS-private placement | | | 9,768 | | | | 5,404 | | | | 4,425 | |
Securities held-to-maturity | | | 1,466 | | | | 1,807 | | | | 1,934 | |
Other ABS | | | 200 | | | | 14 | | | | 19 | |
Total interest income from securities available-for-sale | | | 11,434 | | | | 7,225 | | | | 6,378 | |
| | | | | | | | | | | | | |
Leasing | | | 11,306 | | | | 4,336 | | | | 8,180 | |
| | | | | | | | | | | | | |
Interest income – other: | | | | | | | | | | | | |
Interest income – other (1) | | | − | | | | − | | | | 997 | |
Preference payments on structured notes | | | 3,112 | | | | − | | | | − | |
Temporary investment in over-night repurchase agreements | | | 1,223 | | | | 1,469 | | | | 1,678 | |
Total interest income – other | | | 4,335 | | | | 1,469 | | | | 2,675 | |
Total interest income | | $ | 103,911 | | | $ | 97,593 | | | $ | 134,341 | |
| | | Years Ended | |
| | | | |
| | | | | | | | | | |
| Interest income: | | | | | | | | | |
Interest income from loans: | | | | | | | | | |
Bank loans | | $ | 54,833 | | | $ | 44,828 | | | $ | 37,064 | |
Commercial real estate loans | | | 31,906 | | | | 32,866 | | | | 48,793 | |
Total interest income from loans | | | 86,739 | | | | 77,694 | | | | 85,857 | |
| | | | | | | | | | | | | |
Interest income from securities: | | | | | | | | | | | | |
CMBS-private placement | | | 9,610 | | | | 9,768 | | | | 5,404 | |
RMBS | | | 1,521 | | | | − | | | | − | |
ABS | | | 1,613 | | | | 1,466 | | | | 1,807 | |
Other ABS | | | − | | | | 200 | | | | 14 | |
Total interest income from securities | | | 12,744 | | | | 11,434 | | | | 7,225 | |
| | | | | | | | | | | | | |
Leasing | | | − | | | | 11,306 | | | | 4,336 | |
| | | | | | | | | | | | | |
Interest income – other: | | | | | | | | | | | | |
Preference payments on structured notes (1) | | | 10,432 | | | | 3,112 | | | | − | |
Temporary investment in over-night repurchase agreements | | | 279 | | | | 365 | | | | 175 | |
Total interest income – other | | | 10,711 | | | | 3,477 | | | | 175 | |
Total interest income | | $ | 110,194 | | | $ | 103,911 | | | $ | 97,593 | |
| (1) | Represents cash receivedYields on our 90% equity investmentthese quarterly payers reflect payments for full distribution periods and in Ischus CDO II in excesssome cases we owned the position for a portion of our investment. Income on this investment was recognized using the cost recovery method.year. |
| | | Year Ended | | | Year Ended | | | Year Ended | | | Year Ended | | | Year Ended | | | Year Ended | |
| | | | | | | | | | | | | | | | | | | |
| | | | | | | | | | | | | | | | | | | |
| | | | | | | | | | | | | | | | | | | | | | | | | | | | | | | | | | | | | |
| Interest income: | | | | | | | | | | | | | | | | | | | | | | | | | | | | | | | | | | | | |
Interest income from loans: | | | | | | | | | | | | | | | | | | | | | | | | | | | | | | | | | | | | |
Bank loans | | | 4.82% | | | $ | 907,582 | | | | 3.87% | | | $ | 943,854 | | | | 5.62% | | | $ | 947,753 | | | | 5.63% | | | $ | 963,427 | | | | 4.91% | | | $ | 907,582 | | | | 4.01% | | | $ | 943,854 | |
Commercial real estate loans | | | 4.68% | | | $ | 694,153 | | | | 6.12% | | | $ | 785,380 | | | | 7.48% | | | $ | 840,874 | | | | 4.95% | | | $ | 646,121 | | | | 4.68% | | | $ | 694,153 | | | | 6.12% | | | $ | 785,380 | |
| | | | | | | | | | | | | | | | | | | | | | | | | | | | | | | | | | | | | | | | | | | | | | | | | |
Interest income from securities: | | | | | | | | | | | | | | | | | | | | | | | | | | | | | | | | | | | | | | | | | | | | | | | | |
CMBS-private placement | | | 6.97% | | | $ | 140,377 | | | | 5.90% | | | $ | 90,784 | | | | 5.76% | | | $ | 76,216 | | | | 5.53% | | | $ | 170,605 | | | | 6.9% | | | $ | 140,377 | | | | 5.90% | | | $ | 90,784 | |
Securities held-to-maturity | | | 4.12% | | | $ | 35,295 | | | | 5.28% | | | $ | 33,249 | | | | 7.72% | | | $ | 25,782 | | |
RMBS | | | | 2.93% | | | $ | 51,844 | | | | N/A | | | | N/A | | | | N/A | | | | N/A | |
ABS | | | | 4.85% | | | $ | 32,897 | | | | 4.12% | | | $ | 35,295 | | | | 5.28% | | | $ | 33,249 | |
Other ABS | | | 8.71% | | | $ | 2,300 | | | | 4.98% | | | $ | 281 | | | | 0.32% | | | $ | 6,000 | | | | N/A | | | | N/A | | | | 8.71% | | | $ | 2,300 | | | | 4.98% | | | $ | 281 | |
| | | | | | | | | | | | | | | | | | | | | | | | | | | | | | | | | | | | | | | | | | | | | | | | | |
Leasing | | | 15.61% | | | $ | 75,008 | | | | 6.88% | | | $ | 65,300 | | | | 8.68% | | | $ | 94,864 | | | | N/A | | | | N/A | | | | 15.61% | | | $ | 75,008 | | | | 6.88% | | | $ | 65,300 | |
| | | | | | | | | | | | | | | | | | | | | | | | | | |
Preference payments on structured notes | | | | 32.95% | | | $ | 31,663 | | | | 37.69% | | | $ | 8,257 | | | | N/A | | | | N/A | |
The following tables summarize interest income for the years indicated (in thousands, except percentages):
| | | | Unamortized (Discount) Premium | | | Net Amortization /Accretion | | | | | | | | | | | | | | | Unamortized (Discount) Premium | | | Net Amortization /Accretion | | | | | | | | | | |
| | | | | | | | | | | | | | | | | | | | |
| Year Ended December 31, 2011: | | | | | | | | | | | | | | | | | | | |
Bank loans | | | | 3.76% | | | $ | (31,787 | ) | | $ | 15,539 | | | $ | 36,932 | | | $ | 2,362 | | | $ | 54,833 | |
Commercial real estate loans | | | | 4.64% | | | $ | (160 | ) | | | 12 | | | | 30,249 | | | | 1,645 | | | | 31,906 | |
Total interest income from loans | | | | | | | | | | | | 15,551 | | | | 67,181 | | | | 4,007 | | | | 86,739 | |
| | | | | | | | | | | | | | | | | | | | | | | | | | |
CMBS-private placement | | | | 3.60% | | | $ | (13,238 | ) | | | 3,174 | | | | 6,436 | | | | − | | | | 9,610 | |
RMBS | | | | | | | | | | | | − | | | | 1,521 | | | | − | | | | 1,521 | |
ABS | | | | 2.60% | | | $ | (3,812 | ) | | | 524 | | | | 1,089 | | | | − | | | | 1,613 | |
Other ABS | | | | | | | | | | | | − | | | | − | | | | − | | | | − | |
Total interest income from securities | | | | | | | | | | | | 3,698 | | | | 9,046 | | | | − | | | | 12,744 | |
| | | | | | | | | | | | | | | | | | | | | | | | | | |
Leasing | | | | | | | | | | | | − | | | | − | | | | − | | | | − | |
| | | | | | | | | | | | | | | | | | | | | | | | | | |
Preference payments on structured notes | | | | | | | | | | | | − | | | | 10,432 | | | | − | | | | 10,432 | |
Other | | | | | | | | | | | | − | | | | 279 | | | | − | | | | 279 | |
Total interest income – other | | | | | | | | | | | | − | | | | 10,711 | | | | − | | | | 10,711 | |
| | | | | | | | | | | | | | | | | | | | | | | | | | |
Total interest income | | | | | | | | | | | $ | 19,249 | | | $ | 86,938 | | | $ | 4,007 | | | $ | 110,194 | |
| | | | | | | | | | | | | | | | | | | | | | | | | | |
Year Ended December 31, 2010: | | | | | | | | | | | | | | | | | | | | | | | | | | | | | | | | | | | | | | | | | |
Bank loans | | | 3.24% | | $ | (26,568 | ) | | $ | 13,919 | | | $ | 30,051 | | | $ | − | | | $ | 43,970 | | | | 3.245 | | | $ | (26,568 | ) | | $ | 13,919 | | | $ | 30,051 | | | $ | 858 | | | $ | 44,828 | |
Commercial real estate loans | | | 4.50% | | $ | (171 | ) | | | (15 | ) | | | 32,163 | | | | 718 | | | | 32,866 | | | | 4.50% | | | $ | (171 | ) | | | (15 | ) | | | 32,163 | | | | 718 | | | | 32,866 | |
Total interest income from loans | | | | | | | | | | 13,904 | | | | 62,214 | | | | 718 | | | | 76,836 | | | | | | | | | | | | 13,904 | | | | 62,214 | | | | 1,576 | | | | 77,694 | |
| | | | | | | | | | | | | | | | | | | | | | | | | | | | | | | | | | | | | | | | | | | | | | | | |
CMBS-private placement | | | 3.79% | | $ | (23,294 | ) | | | 4,359 | | | | 5,410 | | | | − | | | | 9,768 | | | | 3.795 | | | $ | (20,932 | ) | | | 4,359 | | | | 5,409 | | | | − | | | | 9,768 | |
Securities held-to-maturity | | | 2.45% | | $ | (2,844 | ) | | | 409 | | | | 1,056 | | | | − | | | | 1,466 | | | | 2.45% | | | $ | (2,844 | ) | | | 409 | | | | 1,057 | | | | − | | | | 1,466 | |
Other ABS | | | | | | | | | | − | | | | 200 | | | | − | | | | 200 | | | | | | | | | | | | − | | | | 200 | | | | − | | | | 200 | |
Total interest income from securities | | | | | | | | | | 4,768 | | | | 6,666 | | | | − | | | | 11,434 | | | | | | | | | | | | 4,768 | | | | 6,666 | | | | − | | | | 11,434 | |
| | | | | | | | | | | | | | | | | | | | | | | | | | | | | | | | | | | | | | | | | | | | | | | | |
Leasing | | | | | | | | | | − | | | | 11,306 | | | | − | | | | 11,306 | | | | | | | | | | | | − | | | | 11,306 | | | | − | | | | 11,306 | |
| | | | | | | | | | | | | | | | | | | | | | | | | | | | | | | | | | | | | | | | | | | | | | | | |
Preference payments on structured notes | | | | | | | | | | − | | | | 3,112 | | | | − | | | | 3,112 | | | | | | | | | | | | − | | | | 3,112 | | | | − | | | | 3,112 | |
Other | | | | | | | | | | − | | | | 1,223 | | | | − | | | | 1,223 | | | | | | | | | | | | − | | | | 365 | | | | − | | | | 365 | |
Total interest income – other | | | | | | | | | | − | | | | 4,335 | | | | − | | | | 4,335 | | | | | | | | | | | | − | | | | 3,477 | | | | − | | | | 3,477 | |
| | | | | | | | | | | | | | | | | | | | | | | | | | | | | | | | | | | | | | | | | | | | | | | | |
Total interest income | | | | | | | | | $ | 18,672 | | | $ | 84,521 | | | $ | 718 | | | $ | 103,911 | | | | | | | | | | | $ | 18,672 | | | $ | 83,663 | | | $ | 1,576 | | | $ | 103,911 | |
| | | | | | | | | | | | | | | | | | | | | | | | | | | | | | | | | | | | | | | | | | | | | | | | |
Year Ended December 31, 2009: | | | | | | | | | | | | | | | | | | | | | | | | |
| Year Ended December 31, 2009: | | | | | | | | | | | | | | | | | | | | | | | | | |
Bank loans | | | 3.13% | | $ | (27,682 | ) | | $ | 6,955 | | | $ | 28,815 | | | $ | − | | | $ | 35,770 | | | | 3.13% | | | $ | (27,682 | ) | | $ | 6,955 | | | $ | 28,815 | | | $ | 1,294 | | | $ | 37,064 | |
Commercial real estate loans | | | 5.96% | | $ | (30 | ) | | | 66 | | | | 48,094 | | | | 633 | | | | 48,793 | | | | 5.96% | | | $ | (30 | ) | | | 66 | | | | 48,094 | | | | 633 | | | | 48,793 | |
Total interest income from loans | | | | | | | | | | 7,021 | | | | 76,909 | | | | 633 | | | | 84,563 | | | | | | | | | | | | 7,021 | | | | 76,909 | | | | 1,927 | | | | 85,857 | |
| | | | | | | | | | | | | | | | | | | | | | | | | | | | | | | | | | | | | | | | | | | | | | | | |
CMBS-private placement | | | 4.28% | | $ | (29,030 | ) | | | 1,460 | | | | 3,944 | | | | − | | | | 5,404 | | | | 4.28% | | | $ | (29,030 | ) | | | 1,460 | | | | 3,944 | | | | − | | | | 5,404 | |
Securities held-to-maturity | | | 4.54% | | $ | (3,103 | ) | | | 238 | | | | 1,569 | | | | − | | | | 1,807 | | | | 4.54% | | | $ | (3,103 | ) | | | 238 | | | | 1,569 | | | | − | | | | 1,807 | |
Other ABS | | | | | | | | | | − | | | | 14 | | | | − | | | | 14 | | | | | | | | | | | | − | | | | 14 | | | | − | | | | 14 | |
Total interest income from securities | | | | | | | | | | 1,698 | | | | 5,527 | | | | − | | | | 7,225 | | | | | | | | | | | | 1,698 | | | | 5,527 | | | | − | | | | 7,225 | |
| | | | | | | | | | | | | | | | | | | | | | | | | | | | | | | | | | | | | | | | | | | | | | | | |
Leasing | | | | | | | | | | − | | | | 4,336 | | | | − | | | | 4,336 | | | | | | | | | | | | − | | | | 4,336 | | | | − | | | | 4,336 | |
| | | | | | | | | | | | | | | | | | | | | | | | | | | | | | | | | | | | | | | | | | | | | | | | |
Preference payments on structured notes | | | | | | | | | | − | | | | − | | | | − | | | | − | | | | | | | | | | | | − | | | | − | | | | − | | | | − | |
Other | | | | | | | | | | − | | | | 1,469 | | | | − | | | | 1,469 | | | | | | | | | | | | − | | | | 175 | | | | − | | | | 175 | |
Total interest income – other | | | | | | | | | | − | | | | 1,469 | | | | − | | | | 1,469 | | | | | | | | | | | | − | | | | 175 | | | | − | | | | 175 | |
| | | | | | | | | | | | | | | | | | | | | | | | | | | | | | | | | | | | | | | | | | | | | | | | |
Total interest income | | | | | | | | | $ | 8,719 | | | $ | 88,241 | | | $ | 633 | | | $ | 97,593 | | | | | | | | | | | $ | 8,719 | | | $ | 86,947 | | | $ | 1,927 | | | $ | 97,593 | |
| | | | | | | | | | | | | | | | | | | | | | | | | |
Year Ended December 31, 2008: | | | | | | | | | | | | | | | | | | | | | | | | |
Bank loans | | | 5.53% | | $ | (8,459 | ) | | $ | 946 | | | $ | 52,226 | | | $ | − | | | $ | 53,172 | | |
Commercial real estate loans | | | 7.18% | | $ | (8 | ) | | | 88 | | | | 63,059 | | | | 789 | | | | 63,936 | | |
Total interest income from loans | | | | | | | | | | 1,034 | | | | 115,285 | | | | 789 | | | | 117,108 | | |
| | | | | | | | | | | | | | | | | | | | | | | | | |
CMBS-private placement | | | 5.18% | | $ | (3,680 | ) | | | 444 | | | | 3,981 | | | | − | | | | 4,425 | | |
Securities held-to-maturity | | | 7.54% | | $ | (87 | ) | | | − | | | | 1,934 | | | | − | | | | 1,934 | | |
Other ABS | | | | | | | | | | − | | | | 19 | | | | − | | | | 19 | | |
Total interest income from securities | | | | | | | | | | 444 | | | | 5,934 | | | | − | | | | 6,378 | | |
| | | | | | | | | | | | | | | | | | | | | | | | | |
Leasing | | | | | | | | | | − | | | | 8,180 | | | | − | | | | 8,180 | | |
| | | | | | | | | | | | | | | | | | | | | | | | | |
Preference payments on structured notes | | | | | | | | | | − | | | | − | | | | − | | | | − | | |
Other | | | | | | | | | | − | | | | 2,675 | | | | − | | | | 2,675 | | |
Total interest income – other | | | | | | | | | | − | | | | 2,675 | | | | − | | | | 2,675 | | |
| | | | | | | | | | | | | | | | | | | | | | | | | |
Total interest income | | | | | | | | | $ | 1,478 | | | $ | 132,074 | | | $ | 789 | | | $ | 134,341 | | |
Year Ended December 31, 2011 as compared to Year Ended December 31, 2010
Aggregate interest income increased $6.3 million (6%) to $110.2 million for the year ended December 31, 2011, from $103.9 million for the year ended December 31, 2010. We attribute this increase to the following:
Interest Income from Loans. Aggregate interest income from loans increased $9.0 million (12%) to $86.7 million for the year ended December 31, 2011 from $77.7 million for the year ended December 31, 2010.
Interest income on bank loans increased $10.0 million (22%) to $54.8 million for the year ended December 31, 2011 from $44.8 million for the year ended December 31, 2010. The increase for the year ended December 31, 2011 resulted primarily from the following:
| ● | an increase in the weighted average balance of $55.8 million to $963.4 million for the year ended December 31, 2011 from $907.6 million for the year ended December 31, 2010, principally as a result of our new CLO, for which we began acquiring assets in July 2011; |
| ● | an increase in the weighted average rate to 3.76% on bank loans for the year ended December 31, 2011 from 3.24% for the year ended December 31, 2010 primarily because of the increase in spread on these assets; and |
| ● | timing of paydowns and payoffs which cause us to accelerate discounts into income. The bank loan market experienced increased prepayment speeds beginning in the third quarter of 2010 which have slowed considerably since the second quarter of 2011. |
The interest income on bank loans was partially offset by CRE loans which produced $31.9 million of interest income for the year ended December 31, 2011 as compared to $32.9 million for the year ended December 31, 2010, a decrease of $960,000 (3%). This decrease is primarily related to the decrease of $48.0 million in weighted average balance of loans to $646.1 million for the year ended December 31, 2011 from $694.2 million for the year ended December 31, 2010 as a result of the sale of $131.6 million (par value), conversions of loans to equity investments in real estate of $39.6 million (par value), and the payoff and paydown of $14.4 million (par value), from April 2010 through December 2011. We began to reinvest these proceeds, classified as restricted cash on our balance sheet, during the fourth quarter of 2010, with the majority of it being reinvested during the second and third quarters of 2011.
Interest Income from Securities. Aggregate interest income from securities increased $1.3 million (11%) to $12.7 million for the year ended December 31, 2011 from $11.4 million for the year ended December 31, 2010. The increase in interest income from securities resulted principally from the following:
Interest income from RMBS was $1.5 million for the year ended December 31, 2011 and was principally the result of RMBS positions purchased as part of our trading portfolio beginning in the fourth quarter of 2010. We had no such interest income for the year ended December 31, 2010.
The increase in interest income from RMBS was partially offset by a decrease in interest income from CMBS-private placement of $158,000 (2%) to $9.6 million for the year ended December 31, 2011 from $9.8 million for the year ended December 31, 2010. We attribute the decrease to a decrease in the weighted average yield to 5.53% for the year ended December 31, 2011 from 6.97% for the year ended December 31, 2010, primarily as a result of a decrease of $1.2 million in accretion income to $3.2 million during the year ended December 31, 2011 from $4.4 million during the year ended December 31, 2010. The decrease in accretion income resulted from the impairment of $42.1 million of CMBS, at par, and with associated discounts of $3.1 million during the second quarter of 2011 and the elimination of accretion of those discounts into income. We no longer recognize discount accretion after we recognize impairment on securities.
The decrease in weighted average yield was partially offset by an increase in the weighted average balance of assets of $30.2 million to $170.6 million for the year ended December 31, 2011 from $140.4 million for the year ended December 31, 2010 principally as a result of the purchase of $102.4 million par value of assets during the year ended December 31, 2011, and during the last half of the year ended December 31, 2010, primarily through a new financing facility.
Interest Income – Leasing. Our equipment leasing portfolio generated $11.3 million of interest income for the year ended December 31, 2010. There was no such income for the year ended December 31, 2011 as a result of the transfer of our leasing portfolio to LCC as part of our preferred equity investment in LCC. Our restructured investment in LCC, however, generated dividend income, as discussed in “- Other Revenue.”
Interest Income – Other. Aggregate interest income-other increased $7.2 million (208%) to $10.7 million for the year ended December 31, 2011, as compared to $3.5 million for the year ended December 31, 2010 principally from preference payments on structured notes which generated $10.4 million for the year ended December 31, 2011 as compared to $3.1 million for the year ended December 31, 2010. We began purchasing assets for this portfolio in June 2010. Payments on these positions vary from period to period and are based on cash flows from the underlying assets rather than on a contractual interest rate.
Year Ended December 31, 2010 as compared to Year Ended December 31, 2009
Aggregate interest income increased $6.3 million (6%) to $103.9 million for the year ended December 31, 2010, from $97.6 million for the year ended December 31, 2009. We attribute this increase to the following:
Interest Income from Loans
Interest income from Loans.�� Aggregate interest income from loans decreased $7.8$8.2 million (9%(10%) to $76.8$77.7 million for the year ended December 31, 2010 from $84.6$85.9 million for the year ended December 31, 2009.
Commercial real estate loans produced $32.9 million of interest income for the year ended December 31, 2010 as compared to $48.8 million for the year ended December 31, 2009, a decrease of $15.9 million (33%). This decrease resulted from the following:
| | ● | a decrease in the weighted average balance of assets of $91.2 million to $694.2 million for the year ended December 31, 2010 from $785.4 million for the year ended December 31, 2009 primarily as a result of payoffs and paydowns and to a lesser extent write-offs of impaired loans; and |
| | ● | a decrease in the weighted average yield on our assets to 4.68% for the year ended December 31, 2010 from 6.12% for the year ended December 31, 2009 primarily due to decreases in LIBOR floors, which is a reference index for the rates payable on these loans, from loan modifications during 2009 and 2010. There were $310.9 million of loans with a weighted average LIBOR floor of 2.37% as of December 31, 2009 that decreased to $157.4 million of loans with a weighted average LIBOR floor of 2.24% as of December 31, 2010. |
The decrease in interest income from commercial real estate loans was partially offset by an increase in interest income on bank loans which generated $44.0$44.8 million of interest income for the year ended December 31, 2010 as compared to $35.8$37.1 million for the year ended December 31, 2009, an increase of $8.2$7.8 million (23%(21%). This increase resulted primarily from an increase in the weighted average yield earned by our bank loans to 4.82%4.91% for the year ended December 31, 2010 from 3.87%4.01% for the year ended December 31, 2009. This was principally a result of an increase in accretion income to $13.9 million for the year ended December 31, 2010 as compared to $7.0 million for the year ended December 31, 2009. The increase in accretion income is the result of the purchase of $608.8 million of bank loans at discounts during 2009 and 2010 and the accretion of those discounts into income. These discounted loan purchases are made as we reinvest the proceeds from loan payoffs from our borrowers and from the loans we have sold, typically for credit reasons.
The increase in bank loan accretion income was partially offset by a decrease in the weighted average balance on these loans of $36.3 million to $907.6 million for the year ended December 31, 2010, from $943.9 million for the year ended December 31, 2009, as a result of write-offs of several loans in the last quarter of 2009 and the first quarter of 2010 as well as the timing of when loans were sold or paid down and thethose proceeds reinvested.
Interest Income from Securities
Securities.Aggregate interest income from securities available-for-sale increased $4.2 million (58%) to $11.4 million for the year ended December 31, 2010 from $7.2 million for the year ended December 31, 2009. The increase in interest income from securities available-for-sale resulted principally from the following:
Interest income from CMBS-private placement increased $4.4 million (81%) to $9.8 million for the year ended December 31, 2010 from $5.4 million for the year ended December 31, 2009. We attribute the increase primarily to the following:
| | ● | an increase in the weighted average balance of assets of $49.6 million to $140.0$140.4 million for the year ended December 31, 2010 from $90.8 million for the year ended December 31, 2009, principally as a result of the purchase of $37.1 million par value of assets during the year ended December 31, 2010, and during the last half of the year ended December 31, 2009. This was partially offset by the impairment and subsequent non-payment of $24.8 million par value of assets during the fourth quarter of 2009 and in 2010; and |
| | ● | an increase in the weighted average yield to 6.97% for the year ended December 31, 2010 from 5.90% for the year ended December 31, 2009 primarily as a result of an increase of $2.9 million in accretion income to $4.4 million during the year ended December 31, 2010 from $1.5 million during the year ended December 31, 2009. The increase in accretion income resulted from the purchase of $91.9 million of CMBS at discounts during the last quarter of 2009 and during 2010 and accretion of those discounts into income. We make these discounted security purchases as we reinvest the proceeds from the loan and security payoffs from our borrowers and from the loans and securities we have sold, typically for credit reasons. |
Interest Income - Leasing
– Leasing.Our equipment leasing portfolio generated $11.3 million of interest income for the year ended December 31, 2010 as compared to $4.3 million for the year ended December 31, 2009, an increase of $7.0 million (161%). This increase for the year ended December 31, 2010 was due to the acquisition of $120.0 million in new leases during the year ended December 31, 2010 financed by a new securitization. The increase for the year ended December 31, 2010 was partially offset by the sale of the majority of our legacy leasing portfolio, at par, as of June 30, 2009. The legacy portfolio was sold to reduce our leverage and exposure to certain lease receivables that were underwritten under older, more aggressive credit standards. In May 2010, we acquired a new leasing portfolio which was underwritten with stricter credit standards, using longer term debt that gave us a prepayment option upon meeting specific terms.
Interest Income – Other.Aggregate interest income-other increased $2.8$3.3 million (195%(1,887%) to $4.3$3.5 million for the year ended December 31, 2010, as compared to $1.5 million$175,000 for the year ended December 31, 2009 principally from preference payments on structured notes which generated $3.1 million for the year ended December 31, 2010. We had no investment in these securities during the year ended December 31, 2009. These payments vary from period to period and are based on cash flows from the underlying assets rather than on a contractual interest rate.
Year Ended December 31, 2009 as compared to Year Ended December 31, 2008
Aggregate interest income decreased $36.7 million (27%) to $97.6 million for the year ended December 31, 2009, from $134.3 million for the year ended December 31, 2008. We attribute this decrease to the following:
Interest Income from Loans
Aggregate interest income from loans decreased $32.5 million (28%) to $84.6 million for the year ended December 31, 2009 from $117.1 million for the year ended December 31, 2008.
Bank loans generated $35.8 million of interest income for the year ended December 31, 2009 as compared to $53.2 million for the year ended December 31, 2008, a decrease of $17.4 million (33%). This decrease resulted primarily from a decrease in the weighted average yield earned by our bank loans to 3.87% for the year ended December 31, 2009 from 5.62% for the year ended December 31, 2008. This was principally a result of the decrease in LIBOR which is a reference index for the rates payable on these loans. The effect of the decrease in the weighted average rate was partially offset by an increase of $6.0 million in accretion income as a result of the purchase of assets at discounts during the year ended December 31, 2009.
Commercial real estate loans produced $48.8 million of interest income for the year ended December 31, 2009 as compared to $63.9 million for the year ended December 31, 2008, a decrease of $15.1 million (24%). This decrease resulted from the following:
| ●
| a decrease in the weighted average balance of assets of $55.5 million to $785.4 million for the year ended December 31, 2009 from $840.9 million for the year ended December 31, 2008 primarily as a result of payoffs and paydowns and to a lesser extent as a result of valuation allowances resulting from interest adjustments taken on several loans; and |
| ●
| a decrease in the weighted average yield on our assets to 6.12% for the year ended December 31, 2009 from 7.48% for the year ended December 31, 2008 primarily due to decreases in LIBOR floors, which is a reference index for the rates payable on these loans from loan modifications during 2009. Management determined that five of these modifications were due to financial distress of the borrowers and, accordingly, qualified as a troubled debt restructuring. There were $401.3 million of loans with a weighted average LIBOR floor of 4.71% as of December 31, 2008 which decreased to $310.9 million of loans with a weighted average LIBOR floor of 2.37% as of December 31, 2009. |
Interest Income from Securities
Aggregate interest income from securities available-for-sale increased $847,000 (13%) to $7.2 million for the year ended December 31, 2009 from $6.4 million for the year ended December 31, 2008. The increase in interest income from securities available-for-sale resulted principally from the following:
CMBS-private placement increased $993,000 (22%) to $5.4 million for the year ended December 31, 2009 from $4.4 million for the year ended December 31, 2008. The increase is primarily attributed to the following:
| ●
| an increase in the weighted average balance of assets of $14.6 million to $90.8 million for the year ended December 31, 2009 from $76.2 million for the year ended December 31, 2008 principally as a result of the purchase of $54.8 million par value of assets during the year ended December 31, 2009, largely during the last half of the year; and |
| ●
| an increase in the weighted average yield to 5.90% for the year ended December 31, 2009 from 5.76% for the year ended December 31, 2008 primarily as a result of an increase of $1.0 million in accretion income from assets purchased at discounts during the year ended December 31, 2009. |
Interest Income - Leasing
Our equipment leasing portfolio generated $4.3 million of interest income for the year ended December 31, 2009 as compared to $8.2 million for the year ended December 31, 2008, a decrease of $3.8 million (47%). This decrease is primarily the result of our sale of the majority of the leasing portfolio, at par, as of June 30, 2009.
Interest Income - Other
Aggregate interest income-other decreased $1.2 million (45%) to $1.5 million for the year ended December 31, 2009, as compared to $2.7 million for the year ended December 31, 2008. The decrease in interest income-other resulted principally from the following:
| ●
| A decrease in interest income-other to $0 for the year ended December 31, 2009, as compared to $997,000 for the year ended December 31, 2008. The decrease is the result of our having written down our equity investment in Ischus CDO II to $0 in December 2008. Prior to that disposition, we used the cost recovery method to recognize the income on this investment. We sold our interest in Ischus CDO II in November 2007 and, as a result, deconsolidated it at that time. For the three months ended March 31, 2008, $997,000 of interest income was recognized on this investment. No such income has been recognized since March 2008. |
| ●
| A decrease in interest from temporary investments in over-night repurchase agreements of $209,000 (12%) to $1.5 million for the year ended December 31, 2009, as compared to $1.7 million for the year ended December 31, 2008 primarily as a result of lower rates earned on our over-night repurchase agreements. |
Interest Expense
Year Ended December 31, 2010 as compared to Year Ended December 31, 2009
The following tables set forth information relating to our interest expense incurred for the periods presented by asset class (in thousands, except percentages):
| | | Years Ended | | | Years Ended | |
| | | | | | | |
| | | | | | | | | | | | | | | | | | | |
| Interest expense: | | | | | | | | | | | | | | | | | | |
Bank loans | | $ | 9,573 | | | $ | 15,394 | | | $ | 35,165 | | | $ | 11,348 | | | $ | 9,573 | | | $ | 15,394 | |
Commercial real estate loans | | | 8,068 | | | | 11,072 | | | | 27,924 | | | | 6,397 | | | | 8,068 | | | | 11,072 | |
CMBS-private placement | | | − | | | | − | | | | 163 | | | | 651 | | | | − | | | | − | |
Leasing | | | 5,737 | | | | 2,143 | | | | 4,357 | | | | − | | | | 5,737 | | | | 2,143 | |
Hedging instruments | | | | 8,415 | | | | 9,438 | | | | 13,516 | |
General | | | 13,088 | | | | 16,818 | | | | 12,010 | | | | 3,620 | | | | 3,650 | | | | 3,302 | |
Total interest income | | $ | 36,466 | | | $ | 45,427 | | | $ | 79,619 | | |
Total interest expense | | | $ | 30,431 | | | $ | 36,466 | | | $ | 45,427 | |
| | | Year Ended | | | Year Ended | | | Year Ended | |
| | | | | | | | | | |
| | | | | | | | | | |
| | | | | | | | | | | | | | | | | | | |
| Interest expense: | | | | | | | | | | | | | | | | | | |
Bank loans | | | 1.16% | | | $ | 981,000 | | | | 1.04% | | | $ | 906,000 | | | | 1.68% | | | $ | 906,000 | |
Commercial real estate loans | | | 1.28% | | | $ | 499,416 | | | | 1.46% | | | $ | 543,345 | | | | 1.70% | | | $ | 649,258 | |
CMBS-private placement | | | 2.44% | | | $ | 25,721 | | | | N/A | | | $ | − | | | | N/A | | | | N/A | |
Leasing | | | N/A | | | | N/A | | | | 8.81% | | | $ | 65,176 | | | | 4.42% | | | $ | 44,388 | |
Hedging instruments | | | 5.27% | | | $ | 160,132 | | | | 4.90% | | | $ | 181,821 | | | | 4.76% | | | $ | 272,720 | |
General | | | 7.02% | | | $ | 51,548 | | | | 7.47% | | | $ | 50,000 | | | | 6.36% | | | $ | 50,000 | |
| | | Year Ended | | | Year Ended | | | Year Ended | |
| | | | | | | | | | |
| | | | | | | | | | |
| | | | | | | | | | | | | | | | | | | |
| Interest expense: | | | | | | | | | | | | | | | | | | |
Bank loans | | | 1.04% | | | $ | 906,000 | | | | 1.68% | | | $ | 906,000 | | | | 3.82% | | | $ | 906,000 | |
Commercial real estate loans | | | 1.46% | | | $ | 543,345 | | | | 1.70% | | | $ | 649,258 | | | | 3.91% | | | $ | 696,492 | |
CMBS-private placement | | | N/A | | | $ | − | | | | N/A | | | $ | − | | | | 4.34% | | | $ | 3,597 | |
Leasing | | | 8.81% | | | $ | 65,176 | | | | 4.42% | | | $ | 44,388 | | | | 4.67% | | | $ | 89,778 | |
General | | | 5.45% | | | $ | 231,821 | | | | 5.01% | | | $ | 322,720 | | | | 3.00% | | | $ | 383,860 | |
Aggregate interest expense decreased $6.1 million (17%) to $30.4 million for the year ended December 31, 2011, from $36.5 million for the year ended December 31, 2010. We attribute this decrease to the following:
Interest expense on bank loans was $11.3 million for the year ended December 31, 2011, as compared to $9.6 million for the year ended December 31, 2010, an increase of $1.7 million (19%). This increase resulted primarily from the following:
| ● | an increase in the weighted average balance of the related financings of $75.0 million to $981.0 million for the year ended December 31, 2011 as compared to $906.0 million for the year ended December 31, 2010 due to the financing of new asset purchases primarily financed by our warehouse line for a new CLO which closed in October 2011. |
| ● | an increase in the weighted average rate to 1.16% for the year ended December 31, 2011 from 1.04% for the year ended December 31, 2010 primarily as a result of the increase in LIBOR, a reference index for the rates payable on most of these financings. |
Interest expense on commercial real estate loans was $6.4 million for the year ended December 31, 2011, as compared to $8.1 million for the year ended December 31, 2010, a decrease of $1.7 million (21%). This decrease resulted primarily from the following:
| ● | a decrease in the weighted average yield due to decreased amortization of financing costs as a result of fewer CDO note repurchases during the year ended December 31, 2011 as compared to the year ended December 31, 2010. |
| ● | a decrease in the weighted average balance of the related financings of $43.9 million to $499.4 million for the year ended December 31, 2011 as compared to $543.3 million for the year ended December 31, 2010, primarily due to the repurchase of $10.0 million and $91.4 million of CDO notes in 2011 and 2010, respectively. In addition, the reinvestment period of one of our CDOs ended in September 2011 and, consequently, the subsequent paydowns received on loans held by that CDO were used to paydown $23.0 million of notes issued by the CDO. |
Interest expense on CMBS-private placement was $651,000 for the year ended December 31, 2011. There was no such expense for the year ended December 31, 2010. The increase is due entirely to a Master Repurchase Agreement with Wells Fargo Bank, National Association that we entered into in February 2011 to use in acquiring highly-rated CMBS.
Interest expense with respect to our leasing portfolio was $5.7 million for the year ended December 31, 2010. There was no such expense for the year ended December 31, 2011 as a result of the transfer of our leasing portfolio to LCC in exchange for a preferred equity interest in LCC and the simultaneous transfer of the related debt.
Interest expense on hedging instruments decreased $1.0 million (11%) to $8.4 million for the year ended December 31, 2011 as compared to $9.4 million for the year ended December 31, 2010. The decrease in the hedging expense was primarily due to a change in the composition of interest rate swaps we held on our books during the year ended December 31, 2011 as compared to 2010 as a result of the maturities of the hedges related to our CRE portfolio in 2011 and 2010 and the purchase of new hedges relating to securities we purchased using the Wells Fargo repurchase facility in 2011.
Year Ended December 31, 2010 as compared to Year Ended December 31, 2009
Aggregate interest expense decreased $8.9 million (20%) to $36.5 million for the year ended December 31, 2010, from $45.4 million for the year ended December 31, 2009. We attribute this decrease to the following:
Interest expense on bank loans was $9.6 million for the year ended December 31, 2010, as compared to $15.4 million for the year ended December 31, 2009, a decrease of $5.8 million (38%). This decrease resulted primarily from a decrease in the weighted average yield on this debt to 1.04% for the year ended December 31, 2010 from 1.68% for the year ended December 31, 2009 as a result of the decrease in LIBOR which is a reference index for the rates payable on most of these notes.
Interest expense on commercial real estate loans was $8.1 million for the year ended December 31, 2010, as compared to $11.1 million for the year ended December 31, 2009, a decrease of $3.0 million (27%). This decrease resulted primarily from the following:
| | ● | a decrease in the weighted average balance of the related financings of $106.0 million to $543.3 million for the year ended December 31, 2010 as compared to $649.3 million for the year ended December 31, 2009, primarily due to the repurchase of $146.9 million of the CDO notes in 2009 and 2010; and |
| | ● | a decrease in the weighted average yield on our financings to 1.46% for the year ended December 31, 2010 from 1.70% for the year ended December 31, 2009 primarily due to the decrease in LIBOR which is a reference index for the rates payable on most of thesethe CDO notes. |
Interest expense on our equipment leasing portfolio was $5.7 million for the year ended December 31, 2010, as compared to $2.1 million for the year ended December 31, 2009, an increase of $3.6 million (168%). The increase is the result of the addition of a new securitization entered into in April 2010 in conjunction with our acquisition of $120.0 million of new leases. The increase was partially offset by a decrease in interest expense related to our legacy leasing portfolio when the debt was transferred to Resource America at the time the portfolio was sold on June 30, 2009.
GeneralHedging instruments interest expense was $13.1$9.4 million for the year ended December 31, 2010, as compared to $16.8$13.5 million for the year ended December 31, 2009, a decrease of $3.7$4.1 million (22%(30%). This decrease was primarily from the sale of our legacy leasing portfolio, at par, in June 2009 which also resulted in the transfer of the related interest rate hedges and a decrease in that associated cost.
Other Revenue
Year Ended December 31, 2009 as comparedThe following table sets forth information relating to Year Ended December 31, 2008our other revenue incurred for the periods presented (in thousands):
| | | Years Ended | |
| | | | |
| | | | | | | | | | |
| Other revenue: | | | | | | | | | |
Rental income | | $ | 3,656 | | | $ | − | | | $ | − | |
Dividend income | | | 2,955 | | | | − | | | | − | |
Fee income | | | 7,789 | | | | − | | | | − | |
Total other revenue | | $ | 14,400 | | | $ | − | | | $ | − | |
Aggregate interest expense decreased $34.2 million (43%) to $45.4Rental income was $3.7 million for the year ended December 31, 2009, from $79.6 million for the year ended December 31, 2008. We attribute this decrease2011 and is related to the following:
Interest expense on bank loans was $15.4 million for the year ended December 31, 2009, as compared to $35.2 million for the year ended December 31, 2008, a decrease of $19.8 million (56%). This decrease resulted primarily from a decreaseour property available-for-sale and our investments in the weighted average yield on this debt to 1.68% for the year ended December 31, 2009 from 3.82% for the year ended December 31, 2008 as a result of the decrease in LIBOR which is a reference index for the rates payable on most of these notes.
Interest expense on commercial real estate loans was $11.1 million for the year ended December 31, 2009, as compared to $27.9 million for the year ended December 31, 2008, a decrease of $16.9 million (60%). This decrease resulted from the following:
| ●
| a decrease in the weighted average yield on our financings to 1.70% for the year ended December 31, 2009 from 3.91% for the year ended December 31, 2008 primarily due to the decrease in LIBOR which is a reference index for the rates payable on most of these notes; and |
| ●
| a decrease in the weighted average balance of the related financings of $47.2 million to $649.3 million for the year ended December 31, 2009 from $696.5 million for the year ended December 31, 2008 as a result of our buyback of $55.5 million in notes and the payoff of $17.1 million in repurchase agreement debt during the year. |
Interest expense on CMBS-private placement was $0 for the year ended December 31, 2009, as compared to $163,000 for the year ended December 31, 2008 due to the elimination of advance rates on our pledged CMBS-private placement collateral in November 2008 as a result of policy changes surrounding advance rates by our lender.
Interest expense on our equipment leasing portfolio was $2.1 million for the year ended December 31, 2009, as compared to $4.4 million for the year ended December 31, 2008, a decrease of $2.2 million (51%). The decrease for the year ended December 31, 2009 is primarily the result of the sale of most of the leasing portfolio and the simultaneous transfer of all of the related debt to Resource America who purchased the leases, at par, as of June 30, 2009.during 2011.
The decrease in interest expense was partially offset by an increase in general interest expense. General interest expense was $16.8
We received dividend income of $3.0 million for the year ended December 31, 2009, as compared2011 from our preferred equity investment in LCC. There was no such investment at December 31, 2010. On November 16, 2011, we entered into an agreement whereby we exchanged our old preferred interest in LCC for a new preferred interest in LCC. Our resulting interest will be accounted for under the equity method subsequent to $12.0November 16, 2011 and therefore, we will no longer record dividend income.
We generated management fee income of $7.8 million for the year ended December 31, 2008, an increase2011, which is related to our February 2011 acquisition of $4.8 million (40%). This increase resulted primarily from an increase of $5.6 million on our interest rate derivativesa company that fix the rate we pay under these agreements. Duringmanages bank loan assets that entitles us to collect senior, subordinated, and incentive fees related to five collateralized loan obligation issuers, or CLOs. We had no such investment or income for the year ended December 31, 2009 and 2008, the fixed rate we paid exceeded the floating rate we received due to the decrease in LIBOR. The increase in derivative expense was partially offset by a decrease in interest expense related to our unsecured junior subordinated debentures held by unconsolidated trusts that issued trust preferred securities as a result of a decrease in the LIBOR rate which is a reference index for the rates payable by these debentures. This decrease in LIBOR was partially offset by an increase in the spread on this debt as a result of an amendment to the indentures for this debt in September 2009.2010.
Non-InvestmentOperating Expenses
The following table sets forth information relating to our non-investmentoperating expenses incurred for the periods presented (in thousands):
| | | Years Ended | | | Years Ended | |
| | | | | | | |
| | | | | | | | | | | | | | | | | | | |
| Non-investment expenses: | | | | | | | | | | |
| Operating expenses: | | | | | | | | | | |
Management fees-related party | | $ | 13,216 | | | $ | 8,363 | | | $ | 6,301 | | | $ | 11,022 | | | $ | 13,216 | | | $ | 8,363 | |
Equity compensation-related party | | | 2,221 | | | | 1,240 | | | | 540 | | | | 2,526 | | | | 2,221 | | | | 1,240 | |
Professional services | | | 3,627 | | | | 3,866 | | | | 3,349 | | | | 3,791 | | | | 3,627 | | | | 3,866 | |
Insurance | | | 759 | | | | 828 | | | | 641 | | | | 658 | | | | 759 | | | | 828 | |
Rental operating expense | | | | 2,743 | | | | 46 | | | | − | |
General and administrative | | | | 3,950 | | | | 3,015 | | | | 1,764 | |
Depreciation on operating leases | | | 4,003 | | | | − | | | | − | | | | − | | | | 4,003 | | | | − | |
General and administrative | | | 3,061 | | | | 1,764 | | | | 1,848 | | |
Depreciation and amortization | | | | 4,619 | | | | − | | | | − | |
Income tax expense (benefit) | | | 5,721 | | | | (2 | ) | | | (241 | ) | | | 12,036 | | | | 5,721 | | | | (2 | ) |
Total non-investment expenses | | $ | 32,608 | | | $ | 16,059 | | | $ | 12,438 | | |
Total operating expenses | | | $ | 41,345 | | | $ | 32,608 | | | $ | 16,059 | |
Year Ended December 31, 2011 as compared to the Year Ended December 31, 2010
Management fees – related party decreased $2.2 million (17%) to $11.0 million for the year ended December 31, 2011 as compared to $13.2 million for the year ended December 31, 2010. These amounts represent compensation in the form of base management fees and incentive management fees pursuant to our management agreement as well as fees to the manager of our structured note portfolio. The changes are described below:
| ● | Base management fees increased by $1.6 million (29%) to $7.0 million for the year ended December 31, 2011 as compared to $5.4 million for the year ended December 31, 2010. This increase was due to increased stockholders’ equity, a component in the formula by which base management fees are calculated, primarily as a result of the receipt of $83.6 million of net proceeds from the sales of common stock through our Dividend Reinvestment and Stock Purchase Plan or DRIP, during the years ended December 31, 2011 as well as the receipt of $46.6 million from the proceeds of our March 2011 common stock offering. |
| ● | Incentive management fees to our Manager, which are based upon the excess of adjusted operating earnings over a variable base rate, decreased $2.7 million (61%) to $1.7 million for the year ended December 31, 2011 from $4.4 million for the year ended December 31, 2010. The fees for the year ended December 31, 2010 were driven by $34.6 million of gains on the extinguishment of debt as compared to $3.9 million of gains on the extinguishment of debt for the year ended December 31, 2011. The incentive fee is calculated for each quarter and the calculation in any quarter is not affected by the results of any other quarter. |
| ● | Incentive management fees related to our structured finance manager decreased by $1.1 million to $2.3 million for the year ended December 31, 2011 from $3.4 million for the year ended December 31, 2010. The decrease in fees is primarily related to the decline in the performance of this portfolio at December 31, 2011. |
Equity compensation – related party increased $305,000 (14%) to $2.5 million for the year ended December 31, 2011 as compared to $2.2 million for the year ended December 31, 2010. These expenses relate to the amortization of annual grants of restricted common stock to our non-employee independent directors, and annual and discretionary grants of restricted stock to several employees of Resource America who provide investment management services to us through our Manager. The increase in expense was primarily the result of the issuance of new grants during 2011. The increase was partially offset by our quarterly remeasurement of the value of unvested stock.
Rental operating expense increased $2.7 million to $2.7 million for the year ended December 31, 2011 as compared to $46,000 for the year ended December 31, 2010 and is related to property available-for-sale and investments in real estate, which increase through several acquisitions in 2011. There was one such asset at December 31, 2010 compared to four at December 31, 2011 due to the acquisition of three properties during the year ended December 31, 2011.
General and administrative expense increased $935,000 (31%) to $4.0 million for the year ended December 31, 2011 from $3.1 million for the year ended December 31, 2010. The increase is primarily the result of the following:
| ● | an increase of $257,000 related to transaction costs in connection with our acquisition of an investment in real estate in September 2011; |
| ● | increase of $194,000 related to franchise taxes because of increased profitability and equity in our taxable REIT subsidiaries; |
| ● | an increase of $168,000 related to our agreement to reimburse Resource America for the wages, salary and benefits of our Chairman, our Chief Financial Officer, several accounting professionals, and 50% of the salary and benefits of a director of investor relations. |
Depreciation on operating leases was $4.0 million for the year ended December 31, 2010. There was no such expense for the year ended December 31, 2011. The expense is related to the depreciation of the assets in the leasing securitization we acquired in May 2010 which were converted to a preferred equity investment in LCC in January 2011.
Depreciation and amortization was $4.6 million for the year ended December 31, 2011 and is related to our acquisition of Resource Capital Asset Management, or RCAM, in February 2011 and our acquisition of real estate in the second and third quarters of 2011. There were no such investments during the year ended December 31, 2010.
Income tax expense increased $6.3 million (110%) to $12.0 million for the year ended December 31, 2011 as compared to $5.7 million for the year ended December 31, 2010, of which $4.6 million is due to two of our legacy CLO structures (Apidos I and Apidos III) being taxable during the fourth quarter of 2011, which we do not expect to continue into 2012. The balance of the increased tax expense is primarily due to increased profitability in our trading portfolio. We expect our effective tax rate on these taxable REIT subsidiaries to be between 45% and 48% for the year ended December 31, 2012.
Year Ended December 31, 2010 as compared to the Year Ended December 31, 2009
Management fees – related party increased $4.9 million (58%) to $13.2 million for the year ended December 31, 2010 as compared to $8.4 million for the year ended December 31, 2009. These amounts represent compensation in the form of base management fees and incentive management fees pursuant to our management agreement as well as fees to the manager of our structured note portfolio. The base management fees increased by $1.6 million (43%) to $5.4 million for the year ended December 31, 2010 as compared to $3.8 million for the year ended December 31, 2009. This increase was due to increased stockholders’ equity, a component in the formula by which base management feeschanges are calculated, primarily as a result of the receipt of $76.8 million of net proceeds from the sales of common stock through our Dividend Reinvestment Plan or DRIP during the year ended December 31, 2010 as well as the receipt of $42.4 million from the proceeds of our May 2010 common stock offering. Incentive management fees increased $2.8 million to $7.4 million for the year ended December 31, 2010 from $4.6 million for the year ended December 31, 2009 primarily as a result of income from our structured finance portfolio. There was no such portfolio and therefore no such income during the year ended December 31, 2009. Management fees also include fees of $438,000 for the year ended December 31, 2010 to our structured finance manager.described below:
| ● | Base management fees increased by $1.6 million (43%) to $5.4 million for the year ended December 31, 2010 as compared to $3.8 million for the year ended December 31, 2009. This increase was due to increased stockholders’ equity, a component in the formula by which base management fees are calculated, primarily as a result of the receipt of $76.8 million of net proceeds from the sales of common stock through our DRIP during the year ended December 31, 2010 as well as the receipt of $42.4 million from the proceeds of our May 2010 common stock offering. |
| ● | Incentive management fees which are based upon the excess of adjusted operating earnings over a variable base rate, increased $2.8 million to $7.4 million for the year ended December 31, 2010 from $4.6 million for the year ended December 31, 2009 primarily as a result of income from our structured finance portfolio. There was no such portfolio and therefore no such income during the year ended December 31, 2009. |
| ● | Management fees also include fees of $438,000 for the year ended December 31, 2010 to our structured finance manager. There was no such fee or portfolio in the prior year. |
Equity compensation – related party increased $981,000 (79%) to $2.2 million for the year ended December 31, 2010 as compared to $1.2 million for the year ended December 31, 2009. These expenses relate to the amortization of annual grants of restricted common stock to our non-employee independent directors, and annual and discretionary grants of restricted stock to several employees of Resource America who provide investment management services to us through our Manager. The increase in expense was primarily the result of an increase in our stock price and its impact on our quarterly remeasurement of the value of unvested stock and options as well as issuances of new grants during the year.
Professional services decreased $239,000 (6%) to $3.6 million for the year ended December 31, 2010 as compared to $3.9 million for the year ended December 31, 2009 primarily due to a decrease of $399,000 of servicing fees related to our legacy leasing portfolio which was sold in June 2009.
Depreciation on operating leases was $4.0 million for the year ended December 31, 2010 as compared to $0 for the year ended December 31, 2009 and is related to the $120.0 million of new leases we acquired in April 2010. There was no such portfolio or expense during the year ended December 31, 2009.
General and administrative expense increased $1.3 million (74%) to $3.1 million for the year ended December 31, 2010 from $1.8 million for the year ended December 31, 2009. $1.1 million of the increase is related to our agreement to reimburse Resource America for the wages, salary and benefits of our Chief Financial Officer, threeseveral accounting professionals and 50% of the salary and benefits of a director of investor relations. The reimbursements began in October 2009. In addition, we began reimbursing our ChairmanResource America for wages, salary and benefits of our Chairman in February 2010 and an additional accounting professional in November 2010.
Income tax expense increased $5.7 million to an expense of $5.7 million for the year ended December 31, 2010, as compared to a benefit of $2,000 for the year ended December 31, 2009 due to higher pre-tax income for the year ended December 31, 2010. In addition, the benefit incurred for the year ended December 31, 2009, was relatively low when compared to pre-tax loss due to the fact that a valuation allowance was established against certain deferred tax assets that were deemed to not be realizable at that time. The valuation has been removed for the year ended December 31, 2010 due to a change in circumstances regarding the ability to realize the deferred tax assets.
Year Ended December 31, 2009 as compared to the Year Ended December 31, 2008
Management fees – related party increased $2.1 million (33%) to $8.4 million for the year ended December 31, 2009 as compared to $6.3 million for the year ended December 31, 2008. These amounts represent compensation in the form of base management fees and incentive management fees pursuant to our management agreement. The base management fees decreased by $750,000 (17%) to $3.8 million for the year ended December 31, 2009 as compared to $4.5 million for the year ended December 31, 2008. This decline was due to decreased stockholders’ equity, a component in the formula by which base management fees are calculated, primarily as a result of significant additional provisions for loan and lease losses and asset impairments during 2009. Incentive management fees increased by $2.8 million (160%) to $4.6 million for the year ended December 31, 2009 from $1.8 million for the year ended December 31, 2008. The incentive fee is calculated for each quarter and the calculation in any quarter is not affected by the results of any other quarter. The increase is the result of fees of $3.1 million and $1.5 million for the three months ended September 30, 2009 and December 31, 2009, respectively, primarily as a result of the gains on extinguishment of debt we realized during the six months ended December 31, 2009.
Equity compensation – related party increased $700,000 (130%) to $1.2 million for the year ended December 31, 2009 as compared to $540,000 for the year ended December 31, 2008. These expenses relate to the amortization of annual grants of restricted common stock to our non-employee independent directors, and annual and discretionary grants of restricted stock to several employees of Resource America who provide investment management services to us through our Manager. The increase in expense was primarily the result of an increase in our stock price and its impact on our quarterly remeasurement of the value of unvested stock and options as well as issuances of new grants during the year.
Professional services increased $517,000 (15%) to $3.9 million for the year ended December 31, 2009 as compared to $3.3 million for the year ended December 31, 2008 due to an increase of $864,000 in legal fees due to restructurings of our CRE loans as well as compliance work performed. This increase was partially offset by a decrease in lease servicing expense of $455,000 as a result of the sale of the majority of the leasing portfolio on June 30, 2009.
Income tax benefit decreased $239,000 (99%) to a benefit of $2,000 for the year ended December 31, 2009 as compared to a benefit of $241,000 for the year ended December 31, 2008 due to the establishment of a valuation allowance against deferred tax assets related to Resource TRS, our domestic taxable REIT subsidiary.
Other (Expense)/Income
The following table sets forth information relating to our other income (expense) incurred for the periods presented (in thousands):
| | | Years Ended | |
| | | | |
| Other (Expense) Revenue | | | | | | | | | |
Net impairment losses recognized in earnings | | $ | (6,898 | ) | | $ | (26,804 | ) | | $ | (13,471 | ) |
Net realized gains (losses) on investment securities available-for sale and loans | | | 2,622 | | | | 4,821 | | | | 1,890 | |
Net realized and unrealized (loss) gain on investment securities-trading | | | 858 | | | | 14,791 | | | | − | |
Provision for loan and lease losses | | | (13,896 | ) | | | (43,321 | ) | | | (61,383 | ) |
Gain on the extinguishment of debt | | | 3,875 | | | | 34,610 | | | | 44,546 | |
Other income (expense) | | | (1,663 | ) | | | 513 | | | | (1,350 | ) |
Total other expense | | $ | (15,102 | ) | | $ | (15,390 | ) | | $ | (29,768 | ) |
Year Ended December 31, 2011 as compared to Year Ended December 31, 2010
Net impairment losses recognized in earnings decreased $19.9 million (74%) to a loss of $6.9 million for the year ended December 31, 2011 from a loss of $26.8 million for the year ended December 31, 2010. Impairment charges for the year ended December 31, 2011 consisted of $4.6 million on two CMBS positions and $2.2 million on our investment in preferred stock and warrants in LCC. Impairment for the year ended December 31, 2010 related to impairment charges of $26.6 million taken on five CMBS positions.
Net realized gains on investment securities available-for-sale and loans decreased $2.2 million (46%) to $2.6 million for the year ended December 31, 2011 from $4.8 million for the year ended December 31, 2010. The decrease is primarily the result of decreased gains from sales of investments in our CMBS portfolio during the year ended December 31, 2011 of $1.5 million as well as increased losses from sales of ABS of $1.5 million during the year ended December 31, 2011 as a result of tax planning with respect to our 75% gross income test for REIT qualification. The losses were partially offset by increased gains from the sale of Apidos loans of $675,000 during the year ended December 31, 2011.
Net realized and unrealized gain on investment securities-trading decreased $13.9 million (94%) to a gain of $858,000 for the year ended December 31, 2011, from a gain of $14.8 million for the year ended December 31, 2010. The decrease in gains is the result of fewer sales of structured finance securities as well as unrealized losses on the positions we still hold due to the decline in fair market value.
Our provision for loan and lease losses decreased $29.4 million (68%) to a provision of $13.9 million for the year ended December 31, 2011, as compared to a provision of $43.3 million for the year ended December 31, 2010.
The following table summarizes information relating to our provision for loan and lease losses for the periods presented (in thousands):
| | | Year Ended | |
| | | | |
| | | | | | | |
CRE loan portfolio | | $ | 6,478 | | | $ | 44,357 | |
Bank loan portfolio | | | 7,418 | | | | (1,348 | ) |
Lease receivables | | | − | | | | 312 | |
| | | $ | 13,896 | | | $ | 43,321 | |
| | | Years Ended | |
| | | | |
| | | | | | | | | | |
Impairment losses on investment securities | | $ | (29,042 | ) | | $ | (27,490 | ) | | $ | (26,611 | ) |
Recognized in other comprehensive loss | | | (2,238 | ) | | | (14,019 | ) | | | (26,611 | ) |
Net impairment losses recognized in earnings | | | (26,804 | ) | | | (13,471 | ) | | | − | |
Net realized gains (losses) on investment securities available-for sale and loans | | | 4,821 | | | | 1,890 | | | | (1,637 | ) |
Net realized gain on investment securities-trading | | | 5,052 | | | | − | | | | − | |
Net unrealized gain on investment securities-trading | | | 9,739 | | | | − | | | | − | |
Provision for loan and lease losses | | | (43,321 | ) | | | (61,383 | ) | | | (46,160 | ) |
Gain on the extinguishment of debt | | | 34,610 | | | | 44,546 | | | | 1,750 | |
Gain on the settlement of a loan | | | − | | | | − | | | | 574 | |
Other income (expense) | | | 513 | | | | (1,350 | ) | | | 115 | |
Total | | $ | (15,390 | ) | | $ | (29,768 | ) | | $ | (45,358 | ) |
48
The principal reason for the decrease for the year ended December 31, 2011 was improved credit conditions for the borrowers in our CRE portfolio where we have seen a reduction in the magnitude of impaired and defaulted loans due in large part to successful restructuring of 26 loans. For the year ended December 31, 2011, we had five positions for which we took provisions. The positions had a total par value of $84.4 million and were written down to $63.4 million for a weighted average write down percentage of 24.9% of par. We had eight positions for which we took a provision during the year ended December 31, 2010. The positions had a total par value of $88.9 million and were written down to $51.7 million for a weighted average write-down percentage of 41.8% of par. The decrease in provisions for the year ended December 31, 2011 was partially offset by reserves on our bank loan portfolio principally related to reserves taken on two specific loans in December 2011 as well as by the sale of loans at losses, primarily during the three months ended December 31, 2011.
Gain on the extinguishment of debt was $3.9 million for the year ended December 31, 2011 and is due to the buyback of $10.0 million of the debt issued by our two CRE CDOs during the period. The notes, issued at par, were bought back as an investment by us at a weighted average price of 61.3% of par. Gain on the extinguishment of debt was $34.6 million during the year ended December 31, 2010 and is due to the buyback of $91.4 million of debt issued by the CRE CDOs. The notes, issued at par, were repurchased as an investment by us at a weighted average price of 62.1% of par. The related deferred debt issuance costs were immaterial.
Year Ended December 31, 2010 as compared to Year Ended December 31, 2009
Net impairment losses recognized in earnings were $26.8 million during the year ended December 31, 2010 and consisted primarily of other-than-temporary impairment losses of $26.6 million on five CMBS-private placement positions. Losses during the year ended December 31, 2009 consisted of $6.9 million on two CMBS-private placement positions, $5.7 million on our other ABS position and $895,000 on one of our investment securities held-to-maturity.
Net realized gains on investment securities available-for-sale and loans increased $2.9 million (155%) to $4.8 million for the year ended December 31, 2010 from $1.9 million for the year ended December 31, 2009. The increase is primarily due to $5.0 million of net gains on the sale of CMBS – private placement positions during the year ended December 31, 2010 as compared to $160,000 of net gains on CMBS – private placement positions during the year ended December 31, 2009, reflecting a positive effect of a market rally in CMBS pricing on our portfolio. These gains were partially offset by $1.3 million of losses on our ABS held-to-maturity portfolio from the sale of securities due to our evaluation of the creditworthiness of the underlying assets. These gains were also partially offset by a decrease of $489,000 from trading lossesloss differences on our Apidos loans recognized as held-for-sale ofwhich were losses $114,000 during the year ended December 31, 2010 versus tradingas compared to gains of $375,000 on that same portfolio for the year ended December 31, 2009 as a result of timing differences of when positions were recognized for sale and sold.
Net realized gainand unrealized gains on investment securities-trading was $5.1$14.8 million for the year ended December 31, 2010. The gains are the result of sales of structured finance securities as well as the result of marking the structured finance positions we still held to market as of December 31, 2010. No such portfolio existed prior to June 2010. The gains are the result of sales of structured finance securities.
Net unrealized gain on investment securities-trading was $9.7 million for the year ended December 31, 2010. No such portfolio existed prior to June 2010. The gains are the result of marking the structured finance positions to market as of December 31, 2010.
Our provision for loan and lease losses decreased $18.1 million (29%) to $43.3 million for the year ended December 31, 2010, as compared to $61.4 million for the year ended December 31, 2009.
The following table summarizes information relating to our provision for loan and lease losses for the periods presented (in thousands):
| | | Year Ended | |
| | | | |
| | | | | | | |
CRE loan portfolio | | $ | 44,357 | | | $ | 31,856 | |
Bank loan portfolio | | | (1,348 | ) | | | 26,855 | |
Lease receivables | | | 312 | | | | 2,672 | |
| | | $ | 43,321 | | | $ | 61,383 | |
The principal reason for the decrease in 2010 from the 2009 period was the significant improvement in market conditions with respect to assets in our bank loan portfolio. There was also a decrease in the provision on our lease receivables which was primarily due to the sale of the legacy portfolio and subsequent acquisition of a new leasing portfolio which was underwritten with stricter credit standards. TheThese improvements in the provision were partially offset by provisions for our CRE portfolio, which hashad declined in value. During the year ended December 31, 2010, we had 11 loans for which we had taken provisions as compared to four loans for the year ended December 31, 2009 as a result of our impairment analysis. We also increased our general reserve by $3.1 million during the year ended December 31, 2010 as a result of market conditions.
Gain on the extinguishment of debt decreased $9.9 million (22%) during the year ended December 31, 2010 to $34.6 million for the year ended December 31, 2010 from $44.5 million for the year ended December 31, 2009. During the year ended December 31, 2010, we bought back $91.4 million of debt issued by Resource Real Estate Funding CDO 2006-1, or RREF CDO 2006-1 and Resource Real Estate Funding CDO 2007-1, or RREF CDO 2007-1.our two CRE CDOs. The notes, issued at par, were repurchased as an investment by us at a weighted average price of 62.1% of par resulting in a gain of $34.6 million. During the year ended December 31, 2009, we bought back $55.5 million of debt issued by RREF CDO 2006-1 and RREF CDO 2007-1.our two CRE CDOs. The notes, issued at par, were repurchased as an investment by us at a weighted average price of 19.8% of par resulting in a gain of $44.5 million. The related deferred debt issuance costs were immaterial in all transactions.immaterial.
Other income/(expense) income increased $1.9 million to income of $513,000 for the year ended December 31, 2010 as compared to expense of $1.4 million for the year ended December 31, 2009. The increase in income was primarily due to a non-recurring charge of $1.4 million during the year ended December 31, 2009 that was the result of an accrual for a liability related to a settlement on our equity position in the Ischus CDO II portfolio.
Year Ended December 31, 2009 as compared to Year Ended December 31, 2008
Net impairment losses recognized in earnings were $13.5 million during the year ended December 31, 2009 and consisted of other-than-temporary impairment losses of $6.9 million on two CMBS-private placement positions, $5.7 million on our other ABS position, and $895,000 on one of our investment securities held-to-maturity.
Net realized gains (losses) on securities available-for-sale and loans increased $3.5 million to a gain of $1.9 million for the year ended December 31, 2009 from a loss of $1.6 million for the year ended December 31, 2008. The primary component of the increased gain during the year ended December 31, 2009 was an increase of $1.4 million in net gains from the sale of loans and held-to-maturity securities in our bank loan portfolio. In addition, the year ended December 31, 2008 contains net losses of $2.0 million from the sale of CMBS – private placement securities as compared to $190,000 of gains during the year ended December 31, 2009, a net increase in gains of $2.2 million for the year ended December 31, 2009.
Other (expense) income increased $1.5 million to an expense of $1.4 million for the year ended December 31, 2009 as compared to income of $115,000 for the year ended December 31, 2008. The increasedecrease in expense was primarily due to a charge of $1.4 million that was the result of an accrual for a liability related to a settlement on our equity position in the Ischus CDO II portfolio.
Our provision for loan and lease losses increased $15.2 million (33%) to $61.4 million for the year ended December 31, 2009 as compared to $46.2 million for the year ended December 31, 2008.
The following table summarizes information relating to our provision for loan and lease losses for the periods presented (in thousands):
| | | Year Ended | |
| | | | |
| | | | | | | |
CRE loan portfolio | | $ | 31,856 | | | $ | 14,817 | |
Bank loan portfolio | | | 26,855 | | | | 30,442 | |
Lease receivables | | | 2,672 | | | | 901 | |
| | | $ | 61,383 | | | $ | 46,160 | |
The principal reason for the increased provision is overall worsening credit marketsportfolio in 2009. We increasedsold our general allowance for loan and lease lossesinterest in 2009 by $8.0 million for bank loans, $8.1 million for CRE loans and $0.7 million on our leasing portfolio. Also, due to payment defaults, we took an $18.8 million provision on specifically impaired bank loans and a $2.0 million provision on our leasing portfolio during the year ended December 31, 2009. Lastly, because of a decision to liquidate a substantial portion of collateralIschus CDO II in our largest CRE position, we took a $23.8 million provision on that portfolio of loans during the year ended December 31, 2009.November 2007.
Gain on the extinguishment of debt increased $42.8 million during the year ended December 31, 2009 to $44.5 million for the year ended December 31, 2009 from $1.8 million for the year ended December 31, 2008. During the year ended December 31, 2009, we bought back $55.5 million of debt issued by RREF CDO 2006-1 and RREF CDO 2007-1. The notes, issued at par, were bought back as an investment by us at a weighted average price of 19.8% of par resulting in a gain of $44.5 million. During the year ended December 31, 2008, we bought back $5.0 million of debt issued by RREF CDO 2007-1. The notes, issued at par, were bought back as an investment by us at a price of 65% of par resulting in a gain of $1.8 million. The related deferred debt issuance costs were immaterial in all transactions.
Gain on the settlement of a loan during the year ended December 31, 2008 is due to the reimbursement of a loss related to the termination of a hedge after the paydown of a commercial real estate loan. Under the terms of the agreement, we were to be reimbursed for any such termination costs. There was no similar transaction during the year ended December 31, 2009.
Financial Condition
Summary
Our total assets at December 31, 20102011 were $1.9$2.3 billion as compared to $1.8$1.9 billion at December 31, 2009.2010. The increase in total assets was principally due to the additionpurchase of lease receivables toassets for our investment portfolio as a result of a new leasing securitization entered intoApidos CLO VIII which closed in May 2010.October 2011.
Investment Portfolio
The following tables summarize the amortized cost and net carrying amount of our investment portfolio as of December 31, 20102011 and 2009,2010, classified by interest rate type. The following table includes both (i) the amortized cost of our investment portfolio and the related dollar price, which is computed by dividing amortized cost by par amount, and (ii) the net carrying amount of our investment portfolio and the related dollar price, which is computed by dividing the net carrying amount by par amount (in thousands, except percentages):
| | | | | | | | | | | | | | | Net carrying amount less amortized cost | | | | |
| | | | | | | | | | | | | | | | | | |
| Floating rate | | | | | | | | | | | | | | | | | | |
| CMBS-private placement | | $ | 31,127 | | | | 100.00% | | | $ | 9,569 | | | | 30.74% | | | $ | (21,558 | ) | | | -69.26% | |
Structured notes | | | 7,984 | | | | 34.09% | | | | 17,723 | | | | 75.67% | | | | 9,739 | | | | 41.58% | |
Other ABS | | | − | | | | 0.00% | | | | 22 | | | | 0.26% | | | | 22 | | | | 0.26% | |
B notes (1) | | | 26,485 | | | | 99.94% | | | | 26,071 | | | | 98.38% | | | | (414 | ) | | | -1.56% | |
Mezzanine loans (1) | | | 83,699 | | | | 100.00% | | | | 82,680 | | | | 98.78% | | | | (1,019 | ) | | | -1.22% | |
Whole loans (1) | | | 441,372 | | | | 99.92% | | | | 419,207 | | | | 94.91% | | | | (22,165 | ) | | | -5.01% | |
Bank loans (2) | | | 856,436 | | | | 96.99% | | | | 850,500 | | | | 96.32% | | | | (5,936 | ) | | | -0.67% | |
Loans held for sale (3) | | | 13,593 | | | | 55.92% | | | | 13,593 | | | | 55.92% | | | | − | | | | 0.00% | |
ABS held-to-maturity (4) | | | 29,036 | | | | 91.08% | | | | 25,941 | | | | 81.37% | | | | (3,095 | ) | | | -9.71% | |
Total floating rate | | | 1,489,732 | | | | 95.86% | | | | 1,445,306 | | | | 93.01% | | | | (44,426 | ) | | | -2.85% | |
| Fixed rate | | | | | | | | | | | | | | | | | | | | | | | | |
CMBS – private placement | | | 52,097 | | | | 48.30% | | | | 54,369 | | | | 50.41% | | | | 2,272 | | | | 2.11% | |
B notes (1) | | | 30,966 | | | | 99.53% | | | | 30,482 | | | | 97.97% | | | | (484 | ) | | | -1.56% | |
Mezzanine loans (1) | | | 38,545 | | | | 100.23% | | | | 31,012 | | | | 80.64% | | | | (7,533 | ) | | | -19.59% | |
Loans held for sale (3) | | | 15,000 | | | | 75.00% | | | | 15,000 | | | | 75.00% | | | | − | | | | 0.00% | |
Lease receivables (5) | | | 109,682 | | | | 100.00% | | | | 109,612 | | | | 99.94% | | | | (70 | ) | | | -0.06% | |
Total fixed rate | | | 246,290 | | | | 80.20% | | | | 240,475 | | | | 78.30% | | | | (5,815 | ) | | | -1.90% | |
Grand total | | $ | 1,736,022 | | | | 93.28% | | | $ | 1,685,781 | | | | 90.58% | | | $ | (50,241 | ) | | | -2.70% | |
| | | | | | | | | | | | | | | | | | | | | | | | | |
| | | | | | | | | | | | | | | | | | | | | | | | |
| Floating rate | | | | | | | | | | | | | | | | | | | | | | | | |
| CMBS-private placement | | $ | 32,043 | | | | 100.00% | | | $ | 11,185 | | | | 34.91% | | | $ | (20,858 | ) | | | -65.09% | |
Other ABS | | | 24 | | | | 0.29% | | | | 24 | | | | 0.29% | | | | − | | | | −% | |
B notes (1) | | | 26,479 | | | | 99.92% | | | | 26,263 | | | | 99.11% | | | | (216 | ) | | | -0.81% | |
Mezzanine loans (1) | | | 124,048 | | | | 100.00% | | | | 123,058 | | | | 99.20% | | | | (990 | ) | | | -0.80% | |
Whole loans (1) | | | 403,230 | | | | 99.81% | | | | 381,710 | | | | 94.49% | | | | (21,520 | ) | | | -5.32% | |
Bank loans (2) | | | 857,202 | | | | 96.87% | | | | 798,614 | | | | 90.25% | | | | (58,588 | ) | | | -6.62% | |
Loans held for sale (3) | | | 8,050 | | | | 78.88% | | | | 8,050 | | | | 78.88% | | | | − | | | | −% | |
ABS held-to-maturity (4) | | | 31,401 | | | | 88.77% | | | | 21,287 | | | | 60.18% | | | | (10,114 | ) | | | -28.59% | |
Total floating rate | | | 1,482,477 | | | | 97.23% | | | | 1,370,191 | | | | 89.82% | | | | (112,286 | ) | | | -7.41% | |
| Fixed rate | | | | | | | | | | | | | | | | | | | | | | | | |
CMBS – private placement | | | 60,067 | | | | 64.08% | | | | 33,333 | | | | 35.56% | | | | (26,734 | ) | | | -28.52% | |
B notes (1) | | | 54,977 | | | | 100.05% | | | | 54,527 | | | | 99.23% | | | | (450 | ) | | | -0.82% | |
Mezzanine loans (1) | | | 58,638 | | | | 100.28% | | | | 53,200 | | | | 90.98% | | | | (5,438 | ) | | | -9.30% | |
Whole loans (1) | | | 80,305 | | | | 99.78% | | | | 79,647 | | | | 98.96% | | | | (658 | ) | | | -0.82% | |
Lease receivables (5) | | | 2,067 | | | | 100.05% | | | | 927 | | | | 44.87% | | | | (1,140 | ) | | | -55.18% | |
Total fixed rate | | | 256,054 | | | | 88.38% | | | | 221,634 | | | | 76.50% | | | | (34,420 | ) | | | -11.88% | |
Grand total | | $ | 1,738,531 | | | | 95.78% | | | $ | 1,591,800 | | | | 87.70% | | | $ | (146,731 | ) | | | -8.08% | |
| | | | | | | | | | | | | | | Net carrying amount less amortized cost | | | | |
| | | | | | | | | | | | | | | | | | |
| Floating rate | | | | | | | | | | | | | | | | | | |
RMBS | | $ | 8,729 | | | | 18.60% | | | $ | 7,120 | | | | 15.17% | | | $ | (1,609 | ) | | | -3.43% | |
| CMBS-private placement | | | 28,691 | | | | 100.00% | | | | 8,311 | | | | 28.97% | | | | (20,380 | ) | | | -71.03% | |
Structured notes | | | 27,345 | | | | 41.53% | | | | 31,553 | | | | 47.93% | | | | 4,208 | | | | 6.40% | |
ABS | | | 28,513 | | | | 88.21% | | | | 25,201 | | | | 77.96% | | | | (3,312 | ) | | | -10.25% | |
Other ABS | | | − | | | | 0.00% | | | | 23 | | | | 0.28% | | | | 23 | | | | 0.28% | |
Mezzanine loans (2) | | | 53,908 | | | | 99.97% | | | | 53,077 | | | | 98.43% | | | | (831 | ) | | | -1.54% | |
Whole loans (2) | | | 537,708 | | | | 99.79% | | | | 515,176 | | | | 95.61% | | | | (22,532 | ) | | | -4.18% | |
Bank loans (3) | | | 1,170,599 | | | | 97.33% | | | | 1,142,907 | | | | 95.03% | | | | (27,692 | ) | | | -2.30% | |
Loans held for sale (4) | | | 3,154 | | | | 54.59% | | | | 3,154 | | | | 54.59% | | | | − | | | | 0.00% | |
Total floating rate | | | 1,858,647 | | | | 93.71% | | | | 1,786,522 | | | | 90.08% | | | | (72,125 | ) | | | -3.63% | |
| Fixed rate | | | | | | | | | | | | | | | | | | | | | | | | |
CMBS – private placement | | | 132,821 | | | | 71.94% | | | | 124,509 | | | | 67.44% | | | | (8,312 | ) | | | -4.50% | |
B notes (2) | | | 16,435 | | | | 99.13% | | | | 16,182 | | | | 97.61% | | | | (253 | ) | | | -1.52% | |
Mezzanine loans (2) | | | 13,966 | | | | 100.35% | | | | 13,361 | | | | 96.00% | | | | (605 | ) | | | -4.35% | |
Whole loans (2) | | | 6,965 | | | | 99.47% | | | | 6,965 | | | | 99.47% | | | | − | | | | 0.00% | |
| Loans receivable-related party | | | 9,497 | | | | 100.00% | | | | 9,497 | | | | 100.00% | | | | − | | | | 0.00% | |
Total fixed rate | | | 179,684 | | | | 77.58% | | | | 170,514 | | | | 73.62% | | | | (9,170 | ) | | | -3.96% | |
| Other (non-interest bearing) | | | | | | | | | | | | | | | | | | | | | | | | |
Investment in real estate | | | 48,027 | | | | 100.00% | | | | 48,027 | | | | 100.00% | | | | − | | | | 0.00% | |
Investment in unconsolidated entities | | | 47,899 | | | | 100.00% | | | | 47,899 | | | | 100.00% | | | | − | | | | 0.00% | |
Total other | | | 95,926 | | | | 100.00% | | | | 95,926 | | | | 100.00% | | | | − | | | | 0.00% | |
Grand total | | $ | 2,134,257 | | | | 92.36% | | | $ | 2,052,962 | | | | 88.84% | | | $ | (81,295 | ) | | | -3.52% | |
| | | | | | | | | | | | | | | | | | | | | | | | |
| Floating rate | | | | | | | | | | | | | | | | | | | | | | | | |
| CMBS-private placement | | $ | 31,127 | | | | 100.00% | | | $ | 9,569 | | | | 30.74% | | | $ | (21,558 | ) | | | -69.26% | |
Structured notes | | | 7,984 | | | | 34.09% | | | | 17,723 | | | | 75.67% | | | | 9,739 | | | | 41.58% | |
ABS held-to-maturity (1) | | | 29,036 | | | | 91.08% | | | | 25,941 | | | | 81.37% | | | | (3,095 | ) | | | -9.71% | |
Other ABS | | | − | | | | 0.00% | | | | 22 | | | | 0.26% | | | | 22 | | | | 0.26% | |
B notes (2) | | | 26,485 | | | | 99.94% | | | | 26,071 | | | | 98.38% | | | | (414 | ) | | | -1.56% | |
Mezzanine loans (2) | | | 83,699 | | | | 100.00% | | | | 82,680 | | | | 98.78% | | | | (1,019 | ) | | | -1.22% | |
Whole loans (2) | | | 441,372 | | | | 99.92% | | | | 419,207 | | | | 94.91% | | | | (22,165 | ) | | | -5.01% | |
Bank loans (3) | | | 856,436 | | | | 96.99% | | | | 850,500 | | | | 96.32% | | | | (5,936 | ) | | | -0.67% | |
Loans held for sale (4) | | | 13,593 | | | | 55.92% | | | | 13,593 | | | | 55.92% | | | | − | | | | 0.00% | |
Total floating rate | | | 1,489,732 | | | | 95.86% | | | | 1,445,306 | | | | 93.01% | | | | (44,426 | ) | | | -2.85% | |
| Fixed rate | | | | | | | | | | | | | | | | | | | | | | | | |
CMBS – private placement | | | 52,097 | | | | 48.30% | | | | 54,369 | | | | 50.41% | | | | 2,272 | | | | 2.11% | |
B notes (2) | | | 30,966 | | | | 99.53% | | | | 30,482 | | | | 97.97% | | | | (484 | ) | | | -1.56% | |
Mezzanine loans (2) | | | 38,545 | | | | 100.23% | | | | 31,012 | | | | 80.64% | | | | (7,533 | ) | | | -19.59% | |
Loans held for sale (4) | | | 15,000 | | | | 75.00% | | | | 15,000 | | | | 75.00% | | | | − | | | | 0.00% | |
Lease receivables (5) | | | 109,682 | | | | 100.00% | | | | 109,612 | | | | 99.94% | | | | (70 | ) | | | -0.06% | |
| Loans receivable-related party | | | 9,927 | | | | 100.00% | | | | 9,927 | | | | 100.00% | | | | − | | | | 0.00% | |
Total fixed rate | | | 256,217 | | | | 80.20% | | | | 250,402 | | | | 78.30% | | | | (5,815 | ) | | | -1.90% | |
| Other (non-interest bearing) | | | | | | | | | | | | | | | | | | | | | | | | |
Investment in unconsolidated entities | | | 6,791 | | | | 100.00% | | | | 6,791 | | | | 100.00% | | | | − | | | | 0.00% | |
Total other | | | 6,791 | | | | 100.00% | | | | 6,791 | | | | 100.00% | | | �� | − | | | | 0.00% | |
Grand total | | $ | 1,752,740 | | | | 93.28% | | | $ | 1,702,499 | | | | 90.58% | | | $ | (50,241 | ) | | | -2.70% | |
| (1) | ABS held-to-maturity are carried at amortized cost less other-than-temporary impairments. |
| (2) | Net carrying amount includes an allowance for loan losses of $24.2 million at December 31, 2011, allocated as follows: B notes ($253,000), mezzanine loans ($1.4 million) and whole loans ($22.5 million). Net carrying amount includes an allowance for loan losses of $31.6 million at December 31, 2010, allocated as follows: B notes ($899,000), mezzanine loans ($8.5 million) and whole loans ($22.2 million). Net carrying amount includes an allowance for loan losses of $29.3 million at December 31, 2009, allocated as follows: B notes ($666,000), mezzanine loans ($6.4 million) and whole loans ($22.2 million). |
(2)(3) | The bank loan portfolio is carried at amortized cost less allowance for loan loss and was $853.8 million$1.2 billion at December 31, 2010.2011. The amount disclosed represents net realizable value at December 31, 2010,2011, which includes a $2.6$3.3 million allowance for loan losses at December 31, 2010.2011. The bank loan portfolio was $839.4$853.8 million (net of allowance of $17.8$2.6 million) at December 31, 2009.2010. |
(3)(4) | Loans held for sale are carried at the lower of cost or market. Amortized cost is equal to fair value. |
(4) | ABS held-to-maturity are carried at amortized cost less other-than-temporary impairments. |
| (5) | Net carrying amount includes a $70,000 and $1.1 million allowance for lease receivable losses at December 31, 2010 and 2009, respectively.2010. |
Commercial Mortgage-Backed Securities-Private Placement. The determination of other-than-temporary impairment is a subjective process, and different judgments and assumptions could affect the timing of loss realization. We review our portfolios and make other-than-temporary impairment determinations at least quarterly. We consider the following factors when determining if there is an other-than-temporary impairment on a security:
| ●
| the length of time the market value has been less than amortized cost; |
| ●
| the severity of the impairment; |
| ●
| the expected loss of the security as generated by third party software; |
| ●
| credit ratings from the rating agencies; |
| ●
| underlying credit fundamentals of the collateral backing the security; and |
| ●
| whether, based upon our intent, it is more likely than not that we will sell the security before the recovery of the amortized cost basis. |
At December 31, 2010 and 2009, we held $64.0 million and $44.5 million, respectively, (net of net unrealized losses of $19.3 million and $47.6 million, respectively) of CMBS recorded at fair value. To determine fair value, we use two methods, either a dealer quote or an internal valuation model, depending upon when the position was purchased and the current level of market activity. As of December 31, 2010 and 2009, $53.7 million and $29.7 million, respectively, of investment securities available-for-sale were valued using dealer quotes and $10.3 million and $14.8 million, respectively, were valued using the weighted average of the three measures discussed below.
For securities purchased in 2009 and thereafter, we obtain a quote from a dealer, which typically will be the dealer who sold us the security. We have been advised that, in formulating their quotes, dealers may use recent trades in the particular security, if any, market activity in similar securities, if any, or internal valuation models. These quotes are non-binding. As a result of how the dealers develop their quotes, the market illiquidity and low levels of trading activity as of December 31, 2009, we categorized all of these investment securities available-for-sale in Level 3 in the fair value hierarchy. Due to the increased level of trading activity in 2010, we moved some of these securities into Level 2 in the fair value hierarchy. We evaluate the reasonableness of the quotes we receive by applying our own valuation models. If there is a material difference between a quote we receive and the value indicated by our valuation models, we will evaluate the difference. As part of that evaluation, we will discuss the difference with the dealer, who may revise their quote based upon these discussions. Alternatively, we may revise our valuation models.
For investment securities available-for-sale purchased prior to 2009, we determine fair value based on taking a weighted average of the following three measures:
| ●
| dealer quotes, as described above; |
| ●
| quotes on more actively-traded, higher-rated securities issued in a similar time period, adjusted for differences in rating and seniority; and |
| ●
| the value resulting from an internal valuation model using an income approach based upon an appropriate risk-adjusted yield, time value and projected losses using default assumptions based upon an historical analysis of underlying loan performance. |
In the aggregate, we purchased our CMBS-private placement portfolio at a discount. At December 31, 20102011 and 2009,2010, the remaining discount to be accreted into income over the remaining lives of the securities was $26.1$13.2 million and $29.1$20.9 million, respectively. These securities are classified as available-for-sale and, as a result, are carried at their fair value.
During the year ended December 31, 2011, we recognized a $4.6 million other-than-temporary impairment on one position that supported our CMBS investments, bringing the fair value to $200,000. During the year ended December 31, 2010, we recognized $26.6 million of other-than-temporary impairmentimpairments on five positions that supported our CMBS investments, bringing the combined fair value of these positions to $215,000. During the year ended December 31, 2009, we recognized $12.6 million of other-than-temporary impairment on two positions that supported our CMBS investments and one of our other-ABS investments bringing the combined fair value of these positions to $206,000. The assumed default of the underlyingthese collateral positions in our cash flow model yielded a value that would result inof less than a full recovery of our cost basis. The net impairment losses were recognized in earnings in the consolidated statements of operations. All of our other-than-temporary impairment losses are related to credit losses. While our remaining securities classified as available-for-sale have continued to decline in fair value on a net basis, we concluded that the decline continues to be temporary. We perform an on-going review of third-party reports and updated financial data on the underlying property financial information to analyze current and projected loan performance. Rating agency downgrades are considered with respect to our income approach when determining other-than-temporary impairment and, when inputs are stressed, the resulting projected cash flows reflect a full recovery of principal. We do not believe that any other of our securities classified as available-for-sale were other-than-temporarily impaired as of December 31, 2010.
The following table summarizes our CMBS investments (in thousands, except percentages):
| | | Fair Value at December 31, 2010 | | | | | | | | | Mark to Market Change on Same Ratings | | | Fair Value at December 31, 2011 | |
| Moody’s Ratings Category: | | | | | | | | | | | | | | | |
Aaa | | $ | − | | | $ | 59,727 | | | $ | − | | | $ | − | | | $ | 59,727 | |
Aa1 through Aa3 | | | 4,493 | | | | 4,115 | | | | − | | | | (4,493 | ) | | | 4,115 | |
A1 through A3 | | | 18,570 | | | | 5,038 | | | | − | | | | (12,930 | ) | | | 10,678 | |
Baa1 through Baa3 | | | 28,660 | | | | 10,666 | | | | − | | | | (11,487 | ) | | | 27,839 | |
Ba1 through Ba3 | | | 1,480 | | | | − | | | | (1,923 | ) | | | 3,945 | | | | 3,502 | |
B1 through B3 | | | 517 | | | | − | | | | (960 | ) | | | 1,403 | | | | 960 | |
Caa1 through Caa3 | | | 6,739 | | | | − | | | | (1,874 | ) | | | 2,286 | | | | 7,151 | |
Ca through C | | | 3,479 | | | | − | | | | − | | | | (1,385 | ) | | | 2,094 | |
Non-Rated | | | − | | | | 9,301 | | | | − | | | | 7,453 | | | | 16,754 | |
Total | | $ | 63,938 | | | $ | 88,847 | | | $ | (4,757 | ) | | $ | (15,208 | ) | | $ | 132,820 | |
| | | | | | | | | | | | | | | | | | | | | |
| S&P Ratings Category: | | | | | | | | | | | | | | | | | | | | |
AAA | | $ | − | | | $ | 59,727 | | | $ | (783 | ) | | $ | 783 | | | $ | 59,727 | |
A+ through A- | | | 9,562 | | | | − | | | | − | | | | (3,639 | ) | | | 5,923 | |
BBB+ through BBB- | | | 36,385 | | | | 7,915 | | | | − | | | | (25,121 | ) | | | 19,179 | |
BB+ through BB- | | | 7,690 | | | | 16,350 | | | | (3,200 | ) | | | 289 | | | | 21,129 | |
B+ through B- | | | − | | | | − | | | | (2,310 | ) | | | 4,620 | | | | 2,310 | |
CCC+ through CCC- | | | 10,220 | | | | − | | | | − | | | | (3,577 | ) | | | 6,643 | |
D | | | 81 | | | | − | | | | (366 | ) | | | 901 | | | | 616 | |
Non-Rated | | | − | | | | 4,855 | | | | − | | | | 12,438 | | | | 17,293 | |
Total | | $ | 63,938 | | | $ | 88,847 | | | $ | (6,659 | ) | | $ | (13,306 | ) | | $ | 132,820 | |
The following table summarizes our CMBS-private placement as of December 31, 2010 and 2009 (in thousands, except percentages). Dollar price is computed by dividing amortized cost by par amount.
| | | | | | | |
| | | | | | | | | | | | | |
| Moody’s Ratings Category: | | | | | | | | | | | | |
Aaa | | $ | − | | | | −% | | | $ | 11,690 | | | | 64.70% | |
Aa1 through Aa3 | | | 3,345 | | | | 66.90% | | | | 9,639 | | | | 50.73% | |
A1 through A3 | | | 16,853 | | | | 81.24% | | | | 4,826 | | | | 56.14% | |
Baa1 through Baa3 | | | 24,763 | | | | 67.26% | | | | 2,021 | | | | 33.68% | |
Ba1 through Ba3 | | | 1,604 | | | | 14.70% | | | | 10,443 | | | | 100.00% | |
B1 through B3 | | | 4,678 | | | | 93.56% | | | | 24,449 | | | | 85.27% | |
Caa1 through Caa3 | | | 24,603 | | | | 97.57% | | | | 12,832 | | | | 98.71% | |
Ca through C | | | 7,377 | | | | 20.90% | | | | 16,210 | | | | 73.68% | |
Total | | $ | 83,223 | | | | 59.88% | | | $ | 92,110 | | | | 73.23% | |
| | | | | | | | | | | | | | | | | |
| S&P Ratings Category: | | | | | | | | | | | | | | | | |
AAA | | $ | − | | | | −% | | | $ | 5,997 | | | | 59.97% | |
AA+ through AA- | | | − | | | | −% | | | | 3,659 | | | | 40.65% | |
A+ through A- | | | 9,306 | | | | 86.60% | | | | 6,544 | | | | 62.75% | |
BBB+ through BBB- | | | 31,072 | | | | 70.91% | | | | 11,955 | | | | 59.49% | |
BB+ through BB- | | | 6,575 | | | | 50.58% | | | | 7,847 | | | | 78.76% | |
B+ through B- | | | − | | | | −% | | | | 9,081 | | | | 90.81% | |
CCC+ through CCC- | | | 36,211 | | | | 64.52% | | | | 47,027 | | | | 83.54% | |
D | | | 59 | | | | 0.39% | | | | − | | | | | |
Total | | $ | 83,223 | | | | 59.88% | | | $ | 92,110 | | | | 73.23% | |
| | | | | | | | | | | | | | | | | |
Weighted average rating factor | | | 3,653 | | | | | | | | 2,971 | | | | | |
Structured notes.Investment Securities, Trading. The following table summarizes our structured notes and RMBS securities, which are classified as investment securities-trading, which aresecurities, trading and carried at fair value (in thousands):
| | | | | | | | | | | | | | | | | | | | | | | | | |
December 31, 2010: | | | | | | | | | | | | | |
| December 31, 2011: | | | | | | | | | | | | | |
Structured notes | | | $ | 27,345 | | | $ | 6,098 | | | $ | (1,890 | ) | | $ | 31,553 | |
Residential mortgage-backed securities, or RMBS | | | | 8,729 | | | | 100 | | | | (1,709 | ) | | | 7,120 | |
Total | | | $ | 36,074 | | | $ | 6,198 | | | $ | (3,599 | ) | | $ | 38,673 | |
| | | | | | | | | | | | | | | | | | |
| December 31, 2010: | | | | | | | | | | | | | | | | | |
Structured notes | | $ | 7,984 | | | $ | 9,739 | | | $ | − | | | $ | 17,723 | | | $ | 7,984 | | | $ | 9,739 | | | $ | − | | | $ | 17,723 | |
Total | | $ | 7,984 | | | $ | 9,739 | | | $ | − | | | $ | 17,723 | | | $ | 7,984 | | | $ | 9,739 | | | $ | − | | | $ | 17,723 | |
We purchased 2627 securities and sold 1311 securities during the year ended December 31, 2010,2011, for a net realized gain of $5.1$8.0 million. We held 1327 and 11 investment securities-tradingsecurities, trading as of December 31, 2010. We did not hold any such investment at2011 and December 31, 2009.2010, respectively.
Other Asset-Backed Securities. At December 31, 2011 and 2010, we held two other ABS positions with a fair value of $23,000. At December 31, 2009, the positions had a fair value of $24,000. During the year ended December 31, 2009, we recognized other-than-temporary impairment of $5.7 million on one of the positions. The fair value of the ABS positions decreased due to a principal paydown received during the year ended December 31, 2010. These securities are classified as available-for-sale and carried at fair value.
Real Estate Loans. The following table is a summary of the loans in our commercial real estate loan portfolio at the dates indicated (in thousands):
| | | | | | | | | | |
| December 31, 2011: | | | | | | | | | | |
Whole loans, floating rate (1) (5) | | | 32 | | | $ | 537,708 | | | LIBOR plus 2.50% to LIBOR plus 5.75% | | April 2012 to February 2019 |
Whole loans, fixed rate | | | 1 | | | | 6,965 | | | | 10.00% | | June 2012 |
B notes, fixed rate | | | 1 | | | | 16,435 | | | | 8.68% | | April 2016 |
Mezzanine loans, floating rate | | | 3 | | | | 53,908 | | | LIBOR plus 2.50% to LIBOR plus 7.45% | | May 2012 to December 2012 |
Mezzanine loans, fixed rate | | | 2 | | | | 13,966 | | | 8.99% to 11.00% | | January 2016 to September 2016 |
Total (3) | | | 39 | | | $ | 628,982 | | | | | | |
| | | | | | | | | | | | | | |
| December 31, 2010: | | | | | | | | | | | | | |
Whole loans, floating rate (1) | | | 25 | | | $ | 441,372 | | | LIBOR plus 1.50% to LIBOR plus 5.75% | | May 2011 to January 2018 |
B notes, floating rate | | | 2 | | | | 26,485 | | | LIBOR plus 2.50% to LIBOR plus 3.01% | | July 2011 to October 2011 |
B notes, fixed rate | | | 2 | | | | 30,966 | | | 7.00% to 8.68% | | July 2011 to April 2016 |
Mezzanine loans, floating rate | | | 6 | | | | 93,266 | | | LIBOR plus 2.15% to LIBOR plus 3.00% | | May 2011 to January 2013 |
Mezzanine loans, fixed rate (2) | | | 5 | | | | 53,545 | | | 8.14% to 11.00% | | January 2016 to September 2016 |
Total (3) | | | 40 | | | $ | 645,634 | | | | | | |
| | | | | | | Contracted | | |
December 31, 2010: | | | | | | | | | |
Whole loans, floating rate (1) | | | 25 | | | $ | 441,372 | | LIBOR plus 1.50% to LIBOR plus 5.75% | | May 2011 to January 2018 |
B notes, floating rate | | | 2 | | | | 26,485 | | LIBOR plus 2.50% to LIBOR plus 3.01% | | July 2011 to October 2011 |
B notes, fixed rate | | | 2 | | | | 30,966 | | 7.00% to 8.68% | | July 2011 to April 2016 |
| Mezzanine loans, floating rate | | | 6 | | | | 93,266 | | LIBOR plus 2.15% to LIBOR plus 3.00% | | May 2011 to January 2013 |
Mezzanine loans, fixed rate (3) | | | 5 | | | | 53,545 | | 8.14% to 11.00% | | January 2016 to September 2016 |
Total (2) | | | 40 | | | $ | 645,634 | | | | |
| | | | | | | | | | | | |
December 31, 2009: | | | | | | | | | | | |
Whole loans, floating rate (1) | | | 22 | | | $ | 403,230 | | LIBOR plus 1.50% to LIBOR plus 4.40% | | May 2010 to February 2017 |
Whole loans, fixed rate (1) | | | 5 | | | | 80,305 | | 6.98% to 10.00% | | May 2010 to August 2012 |
B notes, floating rate | | | 2 | | | | 26,479 | | LIBOR plus 2.50% to LIBOR plus 3.01% | | July 2010 to October 2010 |
B notes, fixed rate | | | 3 | | | | 54,977 | | 7.00% to 8.68% | | July 2011 to July 2016 |
| Mezzanine loans, floating rate | | | 7 | | | | 124,048 | | LIBOR plus 2.15% to LIBOR plus 3.45% | | May 2010 to January 2013 |
Mezzanine loans, fixed rate | | | 5 | | | | 58,638 | | 8.14% to 11.00% | | May 2010 to September 2016 |
Total (2) | | | 44 | | | $ | 747,677 | | | | |
| (1) | Whole loans had $5.0$5.2 million and $5.6$5.0 million in unfunded loan commitments as of December 31, 20102011 and 2009,2010, respectively. These commitments are funded as the loans require additional funding and the related borrowers have satisfied the requirements to obtain this additional funding. |
| (2) | The total does not include an allowance for loan losses of $31.6 million and $29.3 million recorded as of December 31, 2010 and 2009, respectively. |
(3) | Fixed rate mezzanine loan dates exclude a loan that matured in May 2010, and iswas in default and hashad been on non-accrual status since its default. The loan was written off in March 2011. |
| (3) | The total does not include an allowance for loan losses of $24.2 million and $31.6 million recorded as of December 31, 2011 and 2010, and December 31, 2009, respectively..respectively. |
| (4) | Maturity dates do not include possible extension options that may be available to the borrowers. |
Subsequent to December 31, 2010, we entered into and completed sale agreements for two commercial real estate loans. One was a loan secured by an office tower in New York City that we sold at 75% of par, resulting in a loss of $5.1 million after writing off unamortized loan origination costs. The second loan was secured by a portfolio of office complexes throughout the United States that sold at 50% of par, resulting in a loss of $9.6 million of which $290,000 had been previously allocated as part of our general reserve. We classified both loans as loans held for sale as of December 31, 2010.| (5) | Floating rate whole loans include a $2.0 million mezzanine portion of a whole loan that has a fixed rate of 15.0% and a preferred equity loan for $302,000 that has a fixed rate of 10% as of December 31, 2011. |
During the year ended December 31, 2010,2011, we acceptedconverted a bankruptcy court-approved settlement onloan collateralized by a portfolio of condominiums that had been in default since July 2009 and after receiving a settlement pay-down of $2.3 million, our loan balance was reducedmulti-family apartment property to $5.0 million.an equity position. After a review of the projected sale proceeds,fair value of the apartment building, we determined that a provision of $648,000gain or loss on conversion was needed and upon foreclosure, we have nownot required. We classified thethis property as property available-for-saleinvestments in real estate with a fair value of $4.4$22.4 million at June 14, 2011.
During the year ended December 31, 2011, we converted a loan collateralized by an office building to an equity position. After a review of the fair value of the office building, we determined a provision of $1.7 million was needed. We classified this property as investments in real estate with a fair value of $10.7 million at June 24, 2011.
Bank Loans. At December 31, 2011, our consolidated securitizations, Apidos CDO I, Apidos CDO II, Apidos Cinco CDO and Apidos CDO VIII, held a total of $1.1 billion of bank loans at fair value. The bank loans held by these entities secure the CDO notes they issued. The aggregate bank loans held increased by $291.5 million over their holdings at December 31, 2010. This increase was principally due to the acquisition of $334.8 million par value of bank loans through the closing of Apidos CLO VIII in October 2011. These increases were partially offset by the reduced market price for these bank loans at December 31, 2011 as compared to December 31, 2010.
We have determined that Apidos CDO I, Apidos CDO III, Apidos Cinco CDO and Apidos CDO VIII are variable interest entities, or VIEs, and that we are the primary beneficiary for each vehicle. As a result, we consolidated Apidos CDO I, Apidos CDO III, Apidos Cinco CDO and Apidos CLO VIII as of December 31, 2011. We own 100% of the equity of Apidos CDO I, Apidos CDO III and Apidos CDO Cinco. We own approximately 43% of the equity of Apidos CDO VIII.
The following table summarizes our bank loan investments (in thousands):
| | | | | | | | |
| | | | | | | | | | | | | | |
| Moody’s ratings category: | | | | | | | | | | | | | |
Baa1 through Baa3 | | | $ | 44,952 | | | $ | 44,956 | | | $ | 27,262 | | | $ | 27,517 | |
Ba1 through Ba3 | | | | 648,543 | | | | 644,497 | | | | 432,153 | | | | 437,801 | |
B1 through B3 | | | | 439,871 | | | | 427,282 | | | | 351,147 | | | | 347,755 | |
Caa1 through Caa3 | | | | 19,710 | | | | 12,774 | | | | 20,879 | | | | 16,690 | |
Ca | | | | 5,765 | | | | 2,397 | | | | 7,062 | | | | 2,858 | |
No rating provided | | | | 14,912 | | | | 14,155 | | | | 21,960 | | | | 21,906 | |
Total | | | $ | 1,173,753 | | | $ | 1,146,061 | | | $ | 860,463 | | | $ | 854,527 | |
| S&P ratings category: | | | | | | | | | | | | | | | | | |
BBB+ through BBB- | | | $ | 84,623 | | | $ | 84,615 | | | $ | 54,560 | | | $ | 55,078 | |
BB+ through BB- | | | | 561,375 | | | | 559,211 | | | | 373,971 | | | | 379,074 | |
B+ through B- | | | | 478,684 | | | | 465,564 | | | | 360,581 | | | | 358,504 | |
CCC+ through CCC- | | | | 27,097 | | | | 19,401 | | | | 29,707 | | | | 22,171 | |
CC+ through CC- | | | | 4,490 | | | | 1,512 | | | | 1,633 | | | | 1,280 | |
C+ through C- | | | | − | | | | − | | | | − | | | | − | |
| D | | | | 352 | | | | 343 | | | | 1,050 | | | | 431 | |
No rating provided | | | | 17,132 | | | | 15,415 | | | | 38,961 | | | | 37,989 | |
Total | | | $ | 1,173,753 | | | $ | 1,146,061 | | | $ | 860,463 | | | $ | 854,527 | |
Weighted average rating factor | | | | 1,969 | | | | | | | | 2,061 | | | | | |
The following table provides information as to the lien position and status of our bank loans. All except $850,000 of the first lien loans at December 31, 2010 are held by the indicated CDOs, which we consolidate (in thousands):
| | | | |
| | | | | | | | | | | | | | | | |
| December 31, 2011: | | | | | | | | | | | | | | | |
| Loans held for investment: | | | | | | | | | | | | | | | |
First lien loans | | $ | 295,318 | | | $ | 242,628 | | | $ | 293,442 | | | $ | 311,923 | | | $ | 1,143,311 | |
Second lien loans | | | 5,281 | | | | 5,746 | | | | 6,438 | | | | 6,845 | | | | 24,310 | |
Subordinated second lien loans | | | 163 | | | | 122 | | | | − | | | | − | | | | 285 | |
Defaulted first lien loans | | | 1,397 | | | | 599 | | | | 697 | | | | − | | | | 2,693 | |
Defaulted second lien loans | | | − | | | | − | | | | − | | | | − | | | | − | |
Total | | | 302,159 | | | | 249,095 | | | | 300,577 | | | | 318,768 | | | | 1,170,599 | |
| First lien loans held for sale at fair value | | | − | | | | 198 | | | | 2,018 | | | | 938 | | | | 3,154 | |
Total | | $ | 302,159 | | | $ | 249,293 | | | $ | 302,595 | | | $ | 319,706 | | | $ | 1,173,753 | |
| | | | | | | | | | | | | | | | | | | | | |
| December 31, 2010: | | | | | | | | | | | | | | | | | | | | |
| Loans held for investment: | | | | | | | | | | | | | | | | | | | | |
First lien loans | | $ | 288,163 | | | $ | 236,142 | | | $ | 296,208 | | | $ | − | | | $ | 820,513 | |
Second lien loans | | | 12,902 | | | | 10,011 | | | | 11,513 | | | | − | | | | 34,426 | |
Subordinated second lien loans | | | 163 | | | | 122 | | | | − | | | | − | | | | 285 | |
Defaulted second lien loans | | | − | | | | − | | | | 362 | | | | − | | | | 362 | |
Total | | | 301,228 | | | | 246,275 | | | | 308,083 | | | | − | | | | 855,586 | |
| First lien loans held for sale at fair value | | | 2,822 | | | | − | | | | 1,205 | | | | − | | | | 4,027 | |
Total | | $ | 304,050 | | | $ | 246,275 | | | $ | 309,288 | | | $ | − | | | $ | 859,613 | |
Bank Loans.Asset-backed securities. In November 2011, the investment securities held-to-maturity portfolio was reclassified to investment securities available-for-sale since management no longer intended to hold these positions until maturity. These investments are now held at fair value with any unrealized gain or loss is reported in the stockholder’s equity section of the balance sheet. At December 31, 2010,2011, we held a total of $850.5$25.2 million of bank loans at fair value of ABS available-for-sale through Apidos CDO I, Apidos CDO III and Apidos Cinco CDO, all of which secure the debt issued by these entities. This is an increase of $51.9 million over our holdings at December 31, 2009. The increase in total bank loans was principally due to improved market prices for bank loans during the year ended December 31, 2010. We own 100% of the equity issued by Apidos CDO I, Apidos CDO III and Apidos Cinco CDO which we have determined are variable interest entities, or VIEs, of which we are the primary beneficiary. See “-Variable Interest Entities.” As a result, we consolidated Apidos CDO I, Apidos CDO III and Apidos Cinco CDO as of December 31, 2010.
The following table summarizes our bank loan investments as of December 31, 2010 and 2009 (in thousands, except percentages). Dollar price is computed by dividing amortized cost by par amount.
| | | | | | | | |
| | | | | | | | | | | | | | |
| Moody’s ratings category: | | | | | | | | | | | | | |
Baa1 through Baa3 | | | $ | 27,262 | | | | 98.94% | | | $ | 38,419 | | | | 98.09% | |
Ba1 through Ba3 | | | | 432,153 | | | | 97.27% | | | | 404,345 | | | | 96.91% | |
B1 through B3 | | | | 351,147 | | | | 96.31% | | | | 355,456 | | | | 96.33% | |
Caa1 through Caa3 | | | | 20,879 | | | | 95.73% | | | | 44,265 | | | | 99.79% | |
Ca | | | | 7,062 | | | | 100.00% | | | | 13,697 | | | | 88.68% | |
No rating provided | | | | 21,960 | | | | 96.02% | | | | 9,070 | | | | 91.64% | |
Total | | | $ | 860,463 | | | | 96.88% | | | $ | 865,252 | | | | 96.67% | |
| S&P ratings category: | | | | | | | | | | | | | | | | | |
BBB+ through BBB- | | | $ | 54,560 | | | | 99.13% | | | $ | 73,495 | | | | 98.23% | |
BB+ through BB- | | | | 373,971 | | | | 97.25% | | | | 353,595 | | | | 97.11% | |
B+ through B- | | | | 360,581 | | | | 96.21% | | | | 337,208 | | | | 96.12% | |
CCC+ through CCC- | | | | 29,707 | | | | 95.43% | | | | 42,198 | | | | 96.65% | |
CC+ through CC- | | | | 1,633 | | | | 100.18% | | | | 3,104 | | | | 100.13% | |
C+ through C- | | | | − | | | | −% | | | | − | | | | −% | |
| D | | | | 1,050 | | | | 100.00% | | | | 8,602 | | | | 95.91% | |
No rating provided | | | | 38,961 | | | | 97.39% | | | | 47,050 | | | | 94.85% | |
Total | | | $ | 860,463 | | | | 96.88% | | | $ | 865,252 | | | | 96.67% | |
Weighted average rating factor | | | | 2,061 | | | | | | | | 2,131 | | | | | |
Asset-backed securities held-to-maturity.At December 31, 2010, we held a total of $25.9 million fair value of ABS held-to-maturity held at fair value through Apidos CDO I, Apidos CDO III and Apidos Cinco CDO, all of which secure the debt issued by these entities. This is an increase of $4.6 million over
The following table summarizes our holdingsABS at December 31, 2009. The increase in total ABS held-to-maturity was principally due to the improved market prices and the purchase of $1.3 million parfair value of ABS held-to-maturity during the year ended December 31, 2010. The effects of the pricing improvement and additional purchases were partially offset by the sale of two securities that were sold due to credit rating deterioration.(in thousands):
During the year ended December 31, 2009, one collateral position that supported the ABS held-to-maturity weakened to the point that default of this position became probable. The assumed default of this collateral position in our cash flow model yielded a value that would result in less than a full recovery of our cost basis. Accordingly, we recognized an $895,000 other-than-temporary impairment on our ABS held-to-maturity investment during the three months ended September 30, 2009 bringing the combined fair value to $925,000. We recognized this impairment through the consolidated statements of operations in 2009.
| | | | | | | |
| | | | | | | | | | | | | |
| Moody’s ratings category: | | | | | | | | | | | | |
Aaa | | $ | 8,252 | | | $ | 8,051 | | | $ | − | | | $ | − | |
Aa1 through Aa3 | | | 1,723 | | | | 1,593 | | | | 2,766 | | | | 3,025 | |
A1 through A3 | | | 6,446 | | | | 6,366 | | | | 7,625 | | | | 8,117 | |
Baa1 through Baa3 | | | 2,647 | | | | 2,543 | | | | 1,950 | | | | 1,950 | |
Ba1 through Ba3 | | | 5,043 | | | | 3,592 | | | | 2,503 | | | | 2,338 | |
B1 through B3 | | | 3,613 | | | | 2,346 | | | | 4,998 | | | | 3,881 | |
Caa1 through Caa3 | | | − | | | | − | | | | 9,194 | | | | 6,630 | |
| No rating provided | | | 789 | | | | 710 | | | | − | | | | − | |
Total | | $ | 28,513 | | | $ | 25,201 | | | $ | 29,036 | | | $ | 25,941 | |
| | | | | | | | | | | | | | | | | |
| S&P ratings category: | | | | | | | | | | | | | | | | |
AA+ through AA- | | $ | 8,138 | | | $ | 7,928 | | | $ | 5,099 | | | $ | 5,437 | |
A+ through A- | | | 7,467 | | | | 7,347 | | | | 5,292 | | | | 5,705 | |
BBB+ through BBB- | | | 950 | | | | 866 | | | | 3,516 | | | | 3,479 | |
BB+ through BB- | | | 1,592 | | | | 1,335 | | | | 3,062 | | | | 2,765 | |
B+ through B- | | | 3,639 | | | | 3,200 | | | | − | | | | − | |
CCC+ through CCC- | | | − | | | | − | | | | − | | | | − | |
No rating provided | | | 6,727 | | | | 4,525 | | | | 12,067 | | | | 8,555 | |
Total | | $ | 28,513 | | | $ | 25,201 | | | $ | 29,036 | | | $ | 25,941 | |
Weighted average rating factor | | | 582 | | | | | | | | 3,105 | | | | | |
The following table summarizes our ABS held-to-maturity, at cost as of December 31, 2010 and 2009 (in thousands, except percentages). Dollar price is computed by dividing amortized cost by par amount.
| | | | | | | |
| | | | | | | | | | | | | |
| Moody’s ratings category: | | | | | | | | | | | | |
Aa1 through Aa3 | | $ | 2,766 | | | | 85.40% | | | $ | 2,854 | | | | 82.89% | |
A1 through A3 | | | 7,625 | | | | 79.02% | | | | 303 | | | | 75.75% | |
Baa1 through Baa3 | | | 1,950 | | | | 100.00% | | | | − | | | | −% | |
Ba1 through Ba3 | | | 2,503 | | | | 93.57% | | | | 4,427 | | | | 95.72% | |
B1 through B3 | | | 4,998 | | | | 98.10% | | | | 4,319 | | | | 97.63% | |
Caa1 through Caa3 | | | 9,194 | | | | 99.16% | | | | 9,913 | | | | 99.14% | |
Ca | | | − | | | | −% | | | | 3,550 | | | | 79.22% | |
No rating provided | | | − | | | | −% | | | | 6,035 | | | | 75.44% | |
Total | | $ | 29,036 | | | | 91.08% | | | $ | 31,401 | | | | 88.77% | |
| S&P ratings category: | | | | | | | | | | | | | | | | |
AA+ through AA- | | $ | 5,099 | | | | 83.41% | | | $ | − | | | | −% | |
A+ through A- | | | 5,292 | | | | 78.96% | | | | − | | | | −% | |
BBB+ through BBB- | | | 3,516 | | | | 96.99% | | | | − | | | | −% | |
B+ through B- | | | 3,062 | | | | 97.98% | | | | − | | | | −% | |
No rating provided | | | 12,067 | | | | 98.57% | | | | 31,401 | | | | 88.77% | |
Total | | $ | 29,036 | | | | 91.08% | | | $ | 31,401 | | | | 88.77% | |
Weighted average rating factor | | | 3,105 | | | | | | | | 4,028 | | | | | |
The following table provides information as to the lien status of our bank loans. All, except $850,000 of first lien loans, are held by the indicated CDOs, which we consolidate (in thousands):
| | | | |
| | | | | | | | | | | | | |
December 31, 2010: | | | | | | | | | | | | |
| Loans held for investment: | | | | | | | | | | | | |
First lien loans | | $ | 288,163 | | | $ | 236,142 | | | $ | 296,208 | | | $ | 820,513 | |
Second lien loans | | | 12,902 | | | | 10,011 | | | | 11,513 | | | | 34,426 | |
Subordinated second lien loans | | | 163 | | | | 122 | | | | − | | | | 285 | |
Defaulted second lien loans | | | − | | | | − | | | | 362 | | | | 362 | |
Total | | | 301,228 | | | | 246,275 | | | | 308,083 | | | | 855,586 | |
| First lien loans held for sale at fair value | | | 2,822 | | | | − | | | | 1,205 | | | | 4,027 | |
Total | | $ | 304,050 | | | $ | 246,275 | | | $ | 309,288 | | | $ | 859,613 | |
| | | | | | | | | | | | | | | | | |
December 31, 2009: | | | | | | | | | | | | | | | | |
| Loans held for investment: | | | | | | | | | | | | | | | | |
First lien loans | | $ | 284,564 | | | $ | 232,861 | | | $ | 295,457 | | | $ | 812,882 | |
Second lien loans | | | 11,507 | | | | 9,096 | | | | 10,657 | | | | 31,260 | |
Subordinated second lien loans | | | 163 | | | | 122 | | | | − | | | | 285 | |
Defaulted first lien loans | | | 4,511 | | | | 5,579 | | | | 1,685 | | | | 11,775 | |
Defaulted second lien loans | | | 500 | | | | 500 | | | | − | | | | 1,000 | |
Total | | | 301,245 | | | | 248,158 | | | | 307,799 | | | | 857,202 | |
| First lien loans held for sale at fair value | | | 4,064 | | | | 2,077 | | | | 1,909 | | | | 8,050 | |
Total | | $ | 305,309 | | | $ | 250,235 | | | $ | 309,708 | | | $ | 865,252 | |
(1) | All loans are senior and secured unless otherwise noted. |
Lease Receivables. Investments in lease receivables, net of unearned income, were as follows (in thousands):
| | | | | | | |
| | | | | | | | | | | | | |
Leases, net of unearned income | | $ | 75,908 | | | $ | 1,397 | | | $ | − | | | $ | 75,908 | |
Operating leases | | | 17,900 | | | | − | | | | − | | | | 17,900 | |
Notes receivable | | | 15,874 | | | | 670 | | | | − | | | | 15,874 | |
Subtotal | | | 109,682 | | | | 2,067 | | | | − | | | | 109,682 | |
Allowance for lease losses | | | (70 | ) | | | (1,140 | ) | | | − | | | | (70 | ) |
Total | | $ | 109,612 | | | $ | 927 | | | $ | − | | | $ | 109,612 | |
Leases not meeting anyOn January 4, 2011, our wholly-owned subsidiary, Resource TRS, acquired an interest in LCC, a newly-formed equipment financing subsidiary of LEAF Financial Corporation, or LEAF Financial, a subsidiary of Resource America. Resource TRS contributed initial capital of approximately $26.2 million to LCC in the form of approximately $5.2 million in cash, and all of its interest in LEAF Receivables Funding 3, a wholly-owned subsidiary of Resource TRS which held a portfolio of equipment, equipment leases and notes. As part of the criteriatransaction, LEAF Financial contributed its assets relating to beits equipment lease and note origination, servicing and finance business to LCC. Also, senior management personnel of LEAF Financial, or collectively, the Management Parties, contributed capital to LCC in the form of all of the shares of common stock they owned in LEAF Financial in exchange for 10% of the shares of LCC common stock on a fully-diluted basis. This transaction resulted in the deconsolidation of our leasing investments.
In return for Resource TRS’s capital investments, LCC issued to Resource TRS 2,626,783 shares of LCC Series A preferred stock and warrants to purchase 4,800 shares of LCC common stock for an exercise price of $0.01 per share. LCC exercised its rights granted to it under the share purchase agreement during the nine months ended September 30, 2011 and we acquired an additional $10.0 million of Series A preferred stock, representing 48% of LCC’s common stock on a fully-diluted basis, which we classified as direct financing leases are deemed to be operating leases. Under the accounting for operating leases, the cost of the leased equipment, including acquisition fees associated with lease placements, is recorded as an asset and depreciatedsecurities available-for-sale on a straight-line basis over the equipment’s estimated useful life, generally up to seven years. Rental income consists primarily of monthly periodic rental payments due under the terms of the leases. We recognize rental income on a straight-line basis and record it as interest income in our consolidated statementbalance sheet. The preferred stock carries a coupon of operations. We recognized $5.0 million10%, of which 2% is received in rental income duringcash and 8% is paid-in-kind. During the year ended December 31, 2010.2011, $2.4 million of paid-in-kind interest was paid in the form of additional shares of Series A preferred stock as elected by LCC.
We haveOn July 20, 2011, we entered into an agreement with LCC, pursuant to which we provided a $10.0 million loan to LCC, which was funded on November 4, 2011. The loan was to mature on January 20, 2013 and bore interest at a fixed rate of 8.0% per annum on the right to requireunpaid principal balance, payable quarterly. The loan was secured by all the assets of LEAF Capital Funding, to repurchase credit impaired contracts or replace such contracts with performing contracts.LLC and LEAF Financial’s interest in LEAF Receivables Funding would have to repurchase or provide substitute contracts for each credit impaired contract at an amount equal to the discounted contract balance plus any overdue payments. The foregoing is limited to 5%3. On November 16, 2011, LLC used $8.5 million of the aggregate discounted contract balance of$11.2 million they received from a stock purchase agreement transaction to repay $8.4 million in principal plus all outstanding accrued interest on the loan, representing approximately 85% of the contracts sold by LEAF Fundingoutstanding indebtedness owed to us.
Restricted cash. At December 31, 2010, we had restricted cash of $168.2 million, which consisted of $160.5 million of restricted cashBoth parties agreed that the loan was considered paid in our five CDOs, $5.2 million of restricted cash in our leasing securitization and $2.5 million held in a margin account, related to our swap portfolio. At December 31, 2009, we had restricted cash of $85.1 million, which consisted of $80.5 million of restricted cash in our five CDOs and $4.6 million held in a margin account, related to our swap portfolio. The increase of $83.1 million is primarily related to paydowns, payoffs and sales of loans and to a lesser extent, CMBS during the year ended December 31, 2010 in our CRE CDOs. The majority of this cash had not been reinvestedfull as of December 31, 2010. 2011. Accordingly, we recorded a charge to Additional Paid-In Capital to eliminate the remaining debt of $1.6 million.
Interest Receivable. At December 31, 2010,On November 16, 2011, we, hadtogether with LEAF Financial and LCC, entered into a stock purchase agreement with Eos Partners, L.P., or Eos, a private investment firm, and its affiliates. In exchange for our prior interest receivablein LCC, we received 31,341 shares of $6.3Series A Preferred Stock, 4,872 shares of newly issued 8% Series B Redeemable Preferred Stock, or the Series B Preferred Stock, and 2,364 shares of newly issued Series D Redeemable Preferred Stock, or the Series D Preferred Stock, collectively representing, on a fully-diluted basis, a 26.7% interest in LCC. Our investment in LEAF was valued at $36.3 million which consistedbased on a third-party valuation. Several approaches, including discounted expected cash flows, market approach and comparable sales transactions were used to estimate the fair value of $6.3 million of interest on our securities, loans and lease receivables and $9,000 of interest earned on escrow and sweep accounts. At December 31, 2009, we had interest receivable of $5.8 million, which consisted of $5.7 million of interest on our securities, loans and lease receivables and $9,000 of interest earned on escrow and sweep accounts. The increase of $576,000 is the result of an increase of $666,000investment in interest receivable on our bank loan portfolio due to the increase in weighted average rate which increasedLEAF as a result of fewer defaulted positions at December 31, 2010,the transaction. These approaches required assumptions and estimates of many critical factors, including revenue and market growth, operating cash flows, market multiples, and discount rates, which were based on the current economic environment and credit market conditions. Accordingly, we recorded a $1.2loss of $2.2 million increase in conjunction with the transaction. Subsequent to this transaction, our resulting interest will be accounted for under the equity method.
In accordance with the agreement, we and Resource America have undertaken a contingent obligation with respect to the value of the equity on structured notes which we did not holdthe balance sheet of LEAF Receivables Funding 3. To the extent that the value of the equity on the balance sheet of LEAF Receivables Funding 3 is less than approximately $18.7 million (the value of the equity of LRF 3 on the date it was contributed to LCC by us), as of the final testing date within 90 days of December 31, 2009. This increase was partially offset by a $1.1 million decrease2013, we and Resource America have agreed to be jointly and severally obligated to contribute cash to LCC to make up the deficit. We do not believe it is probable or estimable that we will be required to fund LCC in interest receivable on our commercial real estate loan portfolio due to loan modifications which resulted in decreases in weighted average rates and a decrease of $174,000 on our CMBS portfolio due to $35.0 million of impaired CMBS at par being on non-accrual status as of December 31, 2010.accordance with the SPA.
Other Assets. The following table summarizes our other assets as of December 31, 2010 and 2009 (in thousands):
| | | December 31, | |
| | | | | | | |
Fixed assets | | $ | − | | | $ | 1 | |
Other receivables | | | 1,374 | | | | 555 | |
Prepaid assets | | | 590 | | | | 612 | |
Principal paydown | | | 468 | | | | 1,084 | |
Total | | $ | 2,432 | | | $ | 2,252 | |
Other assets increased $181,000 to $2.4 million as of December 31, 2010 from $2.3 million as of December 31, 2009. This increase resulted primarily from an increase of $819,000 in other receivables principally due to receivables on our leasing portfolio. There was no such portfolio at December 31, 2009. These increases were partially offset by a decrease of $616,000 in principal receivables on our bank loans portfolio due to the timing of when principal was due and received, and a $22,000 decrease in prepaid assets due to a decrease in our prepaid insurance and other prepaid administrative services.
Hedging Instruments. Our hedges at December 31, 2010 and 2009 were fixed-for-floating interest rate swap agreements whereby we swapped the floating rate of interest on the liabilities we hedged for a fixed rate of interest. With interest rates at historically low levels and the forward curve projecting steadily increasing rates, we expect that the fair value of our hedges will modestly improve in 2011. We intend to continue to seek such hedges for our floating rate debt in the future. Our hedges at December 31, 2010 were as follows (in thousands):
| | | | | | | | | | | | | | |
| Interest rate swap | 1 month LIBOR | | $ | 12,965 | | | | 4.63% | | 12/04/06 | | 07/01/11 | | $ | (282 | ) |
| Interest rate swap | 1 month LIBOR | | | 12,150 | | | | 5.44% | | 06/08/07 | | 03/25/12 | | | (759 | ) |
| Interest rate swap | 1 month LIBOR | | | 12,750 | | | | 5.27% | | 07/25/07 | | 08/06/12 | | | (971 | ) |
| Interest rate swap | 1 month LIBOR | | | 34,255 | | | | 4.13% | | 01/10/08 | | 05/25/16 | | | (2,309 | ) |
| Interest rate swap | 1 month LIBOR | | | 1,681 | | | | 5.72% | | 07/09/07 | | 10/01/16 | | | (161 | ) |
| Interest rate swap | 1 month LIBOR | | | 1,880 | | | | 5.68% | | 07/13/07 | | 03/12/17 | | | (350 | ) |
| Interest rate swap | 1 month LIBOR | | | 81,556 | | | | 5.58% | | 06/08/07 | | 04/25/17 | | | (7,603 | ) |
| Interest rate swap | 1 month LIBOR | | | 1,726 | | | | 5.65% | | 06/28/07 | | 07/15/17 | | | (159 | ) |
| Interest rate swap | 1 month LIBOR | | | 3,850 | | | | 5.65% | | 07/19/07 | | 07/15/17 | | | (355 | ) |
| Interest rate swap | 1 month LIBOR | | | 4,023 | | | | 5.41% | | 08/07/07 | | 07/25/17 | | | (343 | ) |
| Total | | | $ | 166,836 | | | | 5.17% | | | | | | $ | (13,292 | ) |
In addition, we also had an interest rate cap agreement with a fair value of $60 and a notional amount of $14.8 million outstanding as of December 31, 2010 which reduced our exposure to variability in future cash flows attributable to LIBOR. The interest rate cap is a non-designated cash flow hedge and, as a result, we record the change in fair value through the consolidated statement of operations. The interest rate cap had an effective date of January 8, 2009, has a maturity date of August 5, 2011 and has a cap rate of 2.00%. The interest rate cap had a fair value of $45,000 as of December 31, 2009.
As of December 31, 2009, we had entered into hedges with a notional amount of $217.9 million and maturities ranging from February 2010 to July 2017. At December 31, 2009, the fair value on our interest rate swap agreements was ($12.8) million.
Equipment-backed Securitized Notes. In May 2010, we acquired Equipment Contract Backed Notes, Series 2010-2, issued by LEAF Funding 3, a $120.0 million transaction that provides financing for leases. The investments held by LEAF Funding 3 collateralize the debt it issued and, as a result, the investments are not available to us, our creditors or stockholders. LEAF Funding 3 issued a total of $120.0 million of senior notes at a weighted average price of $93.5 to unrelated investors generating proceeds of $112.2 million. We amortize the discount at issuance over the lives of the notes using the effective yield method, adjusted for the effects of estimated prepayments on the notes. We had $14.8 million of equity invested in LEAF Funding 3 as of December 31, 2010.
The equipment contract backed notes issued to investors by LEAF Funding 3 consist of the following classes: (i) $95.5 million of class A notes; (ii) $7.0 million of class B notes; (iii) $6.4 million of class C notes; (iv) $6.4 million of class D notes; and (v) $4.7 million of class E notes. All of the notes issued bear a fixed rate of interest 5.0%. The class A notes mature in May 2016 and the class B through E notes mature in December 2017. The balance of the Senior Notes after scheduled amortization was $102.0 million as of December 31, 2010 and we had $5.9 million of unamortized original issuance discounts, $1.1 million of unamortized debt issuance costs for a net basis of $95.0 million as of December 31, 2010.
Collateralized Debt Obligations. As of December 31, 2010, we had executed and retained equity in five CDO transactions as follows:
| ●
| In June 2007, we closed RREF CDO 2007-1, a $500.0 million CDO transaction that provided financing for commercial real estate loans. The investments held by RREF CDO 2007-1 collateralized $390.0 million of senior notes issued by the CDO vehicle, of which RCC Real Estate, Inc., or RCC Real Estate, a subsidiary of ours, purchased 100% of the class H senior notes, class K senior notes, class L senior notes and class M senior notes for $68.0 million at closing, $5.0 million of the Class J senior notes purchased in February 2008, $2.5 million of the Class J senior notes in November 2009, $11.9 million of the Class E senior notes, $11.9 million of the Class F senior notes and $7.3 million of the Class G senior notes in December 2009, an additional $250,000 of the Class J senior notes in January 2010, $7.5 million of Class B senior notes in June 2010 and $15.0 million of Class A-2 note in December 2010. In addition, RREF 2007-1 CDO Investor, LLC, a subsidiary of RCC Real Estate, purchased a $41.3 million equity interest representing 100% of the outstanding preference shares. At December 31, 2010, the notes issued to outside investors, net of repurchased notes, had a weighted average borrowing rate of 0.82%. |
| ●
| In May 2007, we closed Apidos Cinco CDO, a $350.0 million CDO transaction that provided financing for bank loans. The investments held by Apidos Cinco CDO collateralized $322.0 million of senior notes issued by the CDO vehicle, of which RCC Commercial Inc., or RCC Commercial, a subsidiary of ours, purchased a $28.0 million equity interest representing 100% of the outstanding preference shares. At December 31, 2010, the notes issued to outside investors had a weighted average borrowing rate of 0.79%. |
| ●
| In August 2006, we closed RREF CDO 2006-1, a $345.0 million CDO transaction that provided financing for commercial real estate loans. The investments held by RREF CDO 2006-1 collateralized $308.7 million of senior notes issued by the CDO vehicle, of which RCC Real Estate purchased 100% of the class J senior notes and class K senior notes for $43.1 million at closing and $7.5 million of the Class F senior notes in June 2009, $3.5 million of the Class E senior note and $4.0 million of the Class F senior notes in September 2009, an additional $20.0 million of Class A-1 senior notes in February 2010, $12.0 million of Class A-2 senior notes, $6.9 million of Class B senior notes, $7.7 million of Class C senior notes in April 2010, $7.5 million of Class D senior notes in June 2010 and $20.0 million of Class A-1 senior notes in July 2010. In addition, RREF 2006-1 CDO Investor, LLC, a subsidiary of RCC Real Estate, purchased a $36.3 million equity interest representing 100% of the outstanding preference shares. At December 31, 2010, the notes issued to outside investors, net of repurchased notes had a weighted average borrowing rate of 1.33%. |
| ●
| In May 2006, we closed Apidos CDO III, a $285.5 million CDO transaction that provided financing for bank loans. The investments held by Apidos CDO III collateralized $262.5 million of senior notes issued by the CDO vehicle, of which RCC Commercial purchased $23.0 million equity interest representing 100% of the outstanding preference shares. At December 31, 2010, the notes issued to outside investors had a weighted average borrowing rate of 0.75%. |
| ●
| In August 2005, we closed Apidos CDO I, a $350.0 million CDO transaction that provided financing for bank loans. The investments held by Apidos CDO I collateralize $321.5 million of senior notes issued by the CDO vehicle, of which RCC Commercial purchased $28.5 million equity interest representing 100% of the outstanding preference shares. At December 31, 2010, the notes issued to outside investors had a weighted average borrowing rate of 0.87%. |
Trust Preferred Securities. In May and September 2006, we formed Resource Capital Trust I and RCC Trust II, respectively, for the sole purpose of issuing and selling trust preferred securities. Resource Capital Trust I and RCC Trust II are not consolidated into our consolidated financial statements because we are not deemed to be the primary beneficiary of either trust. We own 100% of the common shares of each trust, each of which issued $25.0 million of preferred shares to unaffiliated investors. Our rights as the holder of the common shares of each trust are subordinate to the rights of the holders of preferred shares only in the event of a default; otherwise, our economic and voting rights are pari passu with the preferred shareholders. We record each of our investments in the trusts’ common shares of $774,000 as an investment in unconsolidated trusts and record dividend income upon declaration by each trust.
In October 2009, we amended our unsecured junior subordinated debentures held by RCT I and RCT II with a total value outstanding of $51.5 million. The amendment provides for an interest rate increase of 2% (from LIBOR plus 3.95% to LIBOR plus 5.95%) on both issuances for a period of two years and a one-time restructuring fee of $250,000 in exchange for the waiver of financial covenants under our guarantee. The covenant waiver expires on January 1, 2012. The junior subordinated debentures debt issuance costs are included in borrowings in the consolidated balance sheets. We record interest expense on the junior subordinated debentures and amortization of debt issuance costs in our consolidated statements of operations. The debt issuance costs associated with the junior subordinated debentures for RCT I and RCT II at December 31, 2010 were $590,000 and $604,000, respectively. The debt issuance costs associated with the junior subordinated debentures for RCT I and RCT II at December 31, 2009 were $742,000 and $754,000, respectively. The interest rate adjustment took effect as of October 1, 2009 and expires on September 30, 2011. The rates for RCT I and RCT II at December 31, 2010, were 6.25% and 6.24%, respectively and 6.18% and 6.19% at December 31, 2009, respectively. The additional cost is approximately $260,000 per quarter.
Secured Term Facility. In April 2010, Resource TRS entered into a loan and security agreement with The Bancorp Bank to finance the purchase of lease receivables. The maximum amount of the borrowing under this agreement was $6.5 million. Borrowings under this agreement bore interest at six percent (6%) per annum. The facility was repaid in full and was terminated on May 27, 2010. There were no such borrowings as of December 31, 2009.
Financing Receivables
The disclosures in this footnote are required per new guidance issued by the FASB that requires companies to provide more information about the credit quality of their financing receivables including, but not limited to, significant purchases and sales of financing receivables, aging information and credit quality indicators.
The following tables show the allowance for loan and lease receivable losses and recorded investments in loans and lease receivables for the years indicated (in thousands):
| | | Commercial Real Estate Loans | | | | | | | | | Loans Receivable-Related Party | | | | | | Commercial Real Estate Loans | | | | | | | | | Loans Receivable-Related Party | | | | |
December 31, 2010: | | | | | | | | | | | | | | | | |
| December 31, 2011: | | | | | | | | | | | | | | | | |
Allowance for losses at January 1, 2011 | | | $ | 31,617 | | | $ | 2,616 | | | $ | 70 | | | $ | − | | | $ | 34,303 | |
Provision for loan loss | | | | 6,478 | | | | 7,418 | | | | − | | | | − | | | | 13,896 | |
Loans charged-off | | | | (13,874 | ) | | | (6,737 | ) | | | (70 | ) | | | − | | | | (20,681 | ) |
Recoveries | | | | − | | | | − | | | | − | | | | − | | | | − | |
Allowance for losses at December 31, 2011 | | | $ | 24,221 | | | $ | 3,297 | | | $ | − | | | $ | − | | | $ | 27,518 | |
| Ending balance: | | | | | | | | | | | | | | | | | | | | | |
Individually evaluated for impairment | | | $ | 17,065 | | | $ | 1,593 | | | $ | − | | | $ | − | | | $ | 18,658 | |
Collectively evaluated for impairment | | | $ | 7,156 | | | $ | 1,704 | | | $ | − | | | $ | − | | | $ | 8,860 | |
Loans acquired with deteriorated credit quality | | | $ | − | | | $ | − | | | $ | − | | | $ | − | | | $ | − | |
| Loans: | | | | | | | | | | | | | | | | | | | | | |
| Ending balance: | | | | | | | | | | | | | | | | | | | | | |
Individually evaluated for impairment | | | $ | 113,038 | | | $ | 2,693 | | | $ | − | | | $ | − | | | $ | 115,731 | |
Collectively evaluated for impairment | | | $ | 515,944 | | | $ | 1,171,060 | | | $ | − | | | $ | 9,497 | | | $ | 1,696,501 | |
Loans acquired with deteriorated credit quality | | | $ | − | | | $ | − | | | $ | − | | | $ | − | | | $ | − | |
| | | | | | | | | | | | | | | | | | | | | | |
| December 31, 2010: | | | | | | | | | | | | | | | | | | | | | |
Allowance for losses at January 1, 2010 | | $ | 29,297 | | | $ | 17,825 | | | $ | 1,140 | | | $ | − | | | $ | 48,262 | | | $ | 29,297 | | | $ | 17,825 | | | $ | 1,140 | | | $ | − | | | $ | 48,262 | |
Provision for loan loss | | | 44,357 | | | | (1,348 | ) | | | 312 | | | | − | | | | 43,321 | | | | 44,357 | | | | (1,348 | ) | | | 312 | | | | − | | | | 43,321 | |
Loans charged-off | | | (42,037 | ) | | | (13,861 | ) | | | (1,432 | ) | | | − | | | | (57,330 | ) | | | (42,037 | ) | | | (13,861 | ) | | | (1,432 | ) | | | − | | | | (57,330 | ) |
Recoveries | | | − | | | | − | | | | 50 | | | | − | | | | 50 | | | | − | | | | − | | | | 50 | | | | − | | | | 50 | |
Allowance for losses at December 31, 2010 | | $ | 31,617 | | | $ | 2,616 | | | $ | 70 | | | $ | − | | | $ | 34,303 | | | $ | 31,617 | | | $ | 2,616 | | | $ | 70 | | | $ | − | | | $ | 34,303 | |
| | | | | | | | | | | | | | | | | | | | | | |
| Ending balance: | | | | | | | | | | | | | | | | | | | | | | | | | | | | | | | | | | | | | | | | |
Individually evaluated for impairment | | $ | 20,844 | | | $ | 112 | | | $ | 4,107 | | | $ | − | | | $ | 25,063 | | | $ | 20,844 | | | $ | 112 | | | $ | − | | | $ | − | | | $ | 20,956 | |
Collectively evaluated for impairment | | $ | 10,773 | | | $ | 2,504 | | | $ | 70 | | | $ | − | | | $ | 13,347 | | | $ | 10,773 | | | $ | 2,504 | | | $ | 70 | | | $ | − | | | $ | 13,347 | |
Loans acquired with deteriorated credit quality | | $ | − | | | $ | − | | | $ | − | | | $ | − | | | $ | − | | | $ | − | | | $ | − | | | $ | − | | | $ | − | | | $ | − | |
| | | | | | | | | | | | | | | | | | | | | | |
Loans: | | | | | | | | | | | | | | | | | | | | | |
| Loans: | | | | | | | | | | | | | | | | | | | | | |
| Ending balance: | | | | | | | | | | | | | | | | | | | | | | | | | | | | | | | | | | | | | | | | |
Individually evaluated for impairment | | $ | 42,219 | | | $ | 362 | | | $ | 10,024 | | | $ | − | | | $ | 52,605 | | | $ | 153,620 | | | $ | 362 | | | $ | 10,024 | | | $ | − | | | $ | 164,006 | |
Collectively evaluated for impairment | | $ | 603,415 | | | $ | 860,101 | | | $ | 99,658 | | | $ | 9,927 | | | $ | 1,573,101 | | | $ | 492,015 | | | $ | 860,101 | | | $ | 99,658 | | | $ | 9,927 | | | $ | 1,461,700 | |
Loans acquired with deteriorated credit quality | | $ | − | | | $ | − | | | $ | − | | | $ | − | | | $ | − | | | $ | − | | | $ | − | | | $ | − | | | $ | − | | | $ | − | |
| | | | | | | | | | | | | | | | | | | | | | |
December 31, 2009: | | | | | | | | | | | | | | | | | | | | | |
Allowance for losses at January 1, 2009 | | $ | 15,109 | | | $ | 28,758 | | | $ | 450 | | | $ | − | | | $ | 44,317 | | |
Provision for loan loss | | | 31,856 | | | | 26,855 | | | | 2,672 | | | | − | | | | 61,383 | | |
Loans charged-off | | | (17,668 | ) | | | (37,788 | ) | | | (1,994 | ) | | | − | | | | (57,450 | ) | |
Recoveries | | | − | | | | − | | | | 12 | | | | − | | | | 12 | | |
Allowance for losses at December 31, 2009 | | $ | 29,297 | | | $ | 17,825 | | | $ | 1,140 | | | $ | − | | | $ | 48,262 | | |
| | | | | | | | | | | | | | | | | | | | | | |
| Ending balance: | | | | | | | | | | | | | | | | | | | | | |
Individually evaluated for impairment | | $ | 18,764 | | | $ | 9,578 | | | $ | 2,617 | | | $ | − | | | $ | 30,959 | | |
Collectively evaluated for impairment | | $ | 10,533 | | | $ | 23,780 | | | $ | 1,140 | | | $ | − | | | $ | 35,453 | | |
Loans acquired with deteriorated credit quality | | $ | − | | | $ | − | | | $ | − | | | $ | − | | | $ | − | | |
| | | | | | | | | | | | | | | | | | | | | | |
Loans: | | | | | | | | | | | | | | | | | | | | | |
| Ending balance: | | | | | | | | | | | | | | | | | | | | | |
Individually evaluated for impairment | | $ | 66,797 | | | $ | 12,772 | | | $ | 2,617 | | | $ | − | | | $ | 82,186 | | |
Collectively evaluated for impairment | | $ | 680,880 | | | $ | 852,480 | | | $ | (550 | ) | | $ | − | | | $ | 1,532,810 | | |
Loans acquired with deteriorated credit quality | | $ | − | | | $ | − | | | $ | − | | | $ | − | | | $ | − | | |
Credit quality indicators
Bank Loans
We use a risk grading matrix to assign grades to bank loans. Loans are graded at inception and updates to assigned grades are made continually as new information is received. Loans are graded on a scale of 1-5 with 1 representing our highest rating and 5 representing our lowest rating. We consider such things as performance of the underlying company, liquidity, collectability of interest, enterprise valuation, default probability, ratings from rating agencies, and industry dynamics.
Credit risk profiles of bank loans for the years indicated were as follows (in thousands):
| | | | | | | | | | | | | | | | | | | | | | | |
| As of December 31, 2011: | | | | | | | | | | | | | | | | | | | | | | |
Bank loans | | | $ | 1,076,298 | | | $ | 19,739 | | | $ | 60,329 | | | $ | 11,540 | | | $ | 2,693 | | | $ | 3,154 | | | $ | 1,173,753 | |
| | | | | | | | | | | | | | | | | | | | | | | | | | | | | | | | | | | | | | | | | | | | |
| As of December 31, 2010: | | | | | | | | | | | | | | | | | | | | | | | | | | | | | | | | | | | | | | | | | | | |
Bank loans | | $ | 759,817 | | | $ | 43,858 | | | $ | 48,486 | | | $ | 7,940 | | | $ | 362 | | | $ | 759,161 | | | $ | 43,858 | | | $ | 45,115 | | | $ | 7,940 | | | $ | 362 | | | $ | 4,027 | | | $ | 860,463 | |
| | | | | | | | | | | | | | | | | | | | | | |
| As of December 31, 2009: | | | | | | | | | | | | | | | | | | | | | |
Bank loans | | $ | 680,761 | | | $ | 62,102 | | | $ | 88,320 | | | $ | 21,505 | | | $ | 12,564 | | |
All of our bank loans are performing with the exception of one loan which defaulted on December 30, 2011 with a carrying amount of $2.7 million as of December 31, 2011. As of December 31, 2010, all but one of our bank loans were performing with a par amount of $362,000 which has been in default since September 2010.2010 and sold in November 2011.
Commercial Real Estate Loans
We use a risk grading matrix to assign grades to commercial real estate loans. Loans are graded at inception and updates to assigned grades are made continually as new information is received. Loans are graded on a scale of 1-4 with 1 representing our highest rating and 4 representing our lowest rating. In addition to the underlying performance of the loan collateral, we consider such things as the strength of underlying sponsorship, payment history, collectability of interest, structural credit enhancements, market trends and loan terms.
Credit risk profiles of commercial real estate loans for the years indicated were as follows (in thousands):
| | | | | | | | | | | | | | | | | | | |
| As of December 31, 2011: | | | | | | | | | | | | | | | | | | |
Whole loans | | $ | 329,085 | | | $ | 87,598 | | | $ | 90,225 | | | $ | 37,765 | | | $ | − | | | $ | 544,673 | |
B notes | | | 16,435 | | | | − | | | | − | | | | − | | | | − | | | | 16,435 | |
Mezzanine loans | | | 23,347 | | | | − | | | | 44,527 | | | | − | | | | − | | | | 67,874 | |
| | | $ | 368,867 | | | $ | 87,598 | | | $ | 134,752 | | | $ | 37,765 | | | $ | − | | | $ | 628,982 | |
| As of December 31, 2010: | | | | | | | | | | | | | | | | | | | | | | | | |
Whole loans | | $ | 123,350 | | | $ | 16,143 | | | $ | 264,660 | | | $ | 37,219 | | | $ | − | | | $ | 441,372 | |
B notes | | | 16,538 | | | | − | | | | 40,913 | | | | − | | | | − | | | | 57,451 | |
Mezzanine loans | | | 32,635 | | | | − | | | | 84,610 | | | | 5,000 | | | | 24,566 | | | | 146,811 | |
| | | $ | 172,523 | | | $ | 16,143 | | | $ | 390,183 | | | $ | 42,219 | | | $ | 24,566 | | | $ | 645,634 | |
| | | | | | | | | | | | | | | | |
| As of December 31, 2010: | | | | | | | | | | | | | | | |
Whole loans | | $ | 123,350 | | | $ | 16,143 | | | $ | 264,660 | | | $ | 37,219 | | | | | |
B notes | | $ | 16,538 | | | $ | − | | | $ | 40,913 | | | $ | − | | | | | |
Mezzanine loans | | $ | 32,635 | | | $ | − | | | $ | 109,176 | | | $ | 5,000 | | | | | |
| | | | | | | | | | | | | | | | | | | | | |
| As of December 31, 2009: | | | | | | | | | | | | | | | | | | | | |
Whole loans | | $ | 183,617 | | | $ | − | | | $ | 204,743 | | | $ | 95,174 | | | | | |
B notes | | $ | 81,456 | | | $ | − | | | $ | − | | | $ | − | | | | | |
Mezzanine loans | | $ | 117,635 | | | $ | − | | | $ | 55,052 | | | $ | 10,000 | | | | | |
All of our real estate loans were performing as of December 31, 2011. As of December 31, 2010, all but one of our commercial real estate loans, are performing with the exception of one loan with a par amount of $5.0 million, which has been in default since May 2010.2010, were performing. That loan was charged off in March 2011.
Lease receivables
We evaluate the adequacy of the allowance for credit losses in lease receivables based upon, among other factors, management’s historical experience with the commercial finance portfolios we manage, an analysis of contractual delinquencies, economic conditions and trends, industry statistics and equipment finance portfolio characteristics, as adjusted for expected recoveries. In evaluating historic performance of leases and loans, a migration analysis is performed that estimates the likelihood that an account progresses through delinquency stages to ultimate write-off. We fully reserve, net of recoveries, all leases and loans after they are 180 days past due.
Loan and Lease Receivable Portfolios Aging Analysis
The following table shows the loan and lease receivable portfolio aging analysis for the years indicated at cost basis (in thousands):
| | | | | | | | | Greater | | | | | | | | | | | | Total Loans | |
| | | | 30-59 | | | | 60-89 | | | than 90 | | | Total Past | | | | | | Total Loans | | | > 90 Days and | |
| | | | | | | | | | | | | | | | | | | | | | |
| December 31, 2010: | | | | | | | | | | | | | | | | | | | | | | | |
Whole loans | | $ | − | | | $ | − | | | $ | − | | | $ | − | | | $ | 441,372 | | | $ | 441,372 | | | $ | − | |
B notes | | | − | | | | − | | | | − | | | | − | | | | 57,451 | | | | 57,451 | | | | − | |
Mezzanine loans | | | − | | | | − | | | | 5,000 | | | | 5,000 | | | | 141,811 | | | | 146,811 | | | | − | |
Bank loans | | | − | | | | − | | | | − | | | | − | | | | 860,463 | | | | 860,463 | | | | − | |
Lease receivables | | | 630 | | | | 237 | | | | 829 | | | | 1,696 | | | | 107,986 | | | | 109,682 | | | | − | |
Loans receivable- related party | | | − | | | | − | | | | − | | | | − | | | | 9,927 | | | | 9,927 | | | | − | |
Total loans | | $ | 630 | | | $ | 237 | | | $ | 5,829 | | | $ | 6,696 | | | $ | 1,619,010 | | | $ | 1,625,706 | | | $ | − | |
| | | | | | | | | | | | | | | | | | | | | | | | | | | | | |
| December 31, 2009: | | | | | | | | | | | | | | | | | | | | | | | | | | | | |
Whole loans | | $ | − | | | $ | − | | | $ | 7,378 | | | $ | 7,378 | | | $ | 476,157 | | | $ | 483,535 | | | $ | − | |
B notes | | | − | | | | − | | | | − | | | | − | | | | 81,456 | | | | 81,456 | | | | − | |
Mezzanine loans | | | − | | | | − | | | | − | | | | − | | | | 182,686 | | | | 182,686 | | | | − | |
Bank loans | | | − | | | | − | | | | − | | | | − | | | | 865,252 | | | | 865,252 | | | | − | |
Lease receivables | | | − | | | | − | | | | 1,815 | | | | 1,815 | | | | 252 | | | | 2,067 | | | | − | |
Loans receivable- related party | | | − | | | | − | | | | − | | | | − | | | | − | | | | − | | | | − | |
Total loans | | $ | − | | | $ | − | | | $ | 9,193 | | | $ | 9,193 | | | $ | 1,605,803 | | | $ | 1,614,996 | | | $ | − | |
| | | | | | | | | | | | | | | | | | | | | Total Loans > 90 Days and Accruing | |
| December 31, 2011: | | | | | | | | | | | | | | | | | | | | | |
Whole loans | | $ | − | | | $ | − | | | $ | − | | | $ | − | | | $ | 544,673 | | | $ | 544,673 | | | $ | − | |
B notes | | | − | | | | − | | | | − | | | | − | | | | 16,435 | | | | 16,435 | | | | − | |
Mezzanine loans | | | − | | | | − | | | | − | | | | − | | | | 67,874 | | | | 67,874 | | | | − | |
Bank loans | | | − | | | | − | | | | − | | | | − | | | | 1,173,753 | | | | 1,173,753 | | | | − | |
Lease receivables | | | − | | | | − | | | | − | | | | − | | | | − | | | | − | | | | − | |
Loans receivable- related party | | | − | | | | − | | | | − | | | | − | | | | 9,497 | | | | 9,497 | | | | − | |
Total loans | | $ | − | | | $ | − | | | $ | − | | | $ | − | | | $ | 1,812,232 | | | $ | 1,812,232 | | | $ | − | |
| | | | | | | | | | | | | | | | | | | | | | | | | | | | | |
| December 31, 2010: | | | | | | | | | | | | | | | | | | | | | | | | | | | | |
Whole loans | | $ | − | | | $ | − | | | $ | − | | | $ | − | | | $ | 441,372 | | | $ | 441,372 | | | $ | − | |
B notes | | | − | | | | − | | | | − | | | | − | | | | 57,451 | | | | 57,451 | | | | − | |
Mezzanine loans | | | − | | | | − | | | | 5,000 | | | | 5,000 | | | | 141,811 | | | | 146,811 | | | | − | |
Bank loans | | | − | | | | − | | | | − | | | | − | | | | 860,463 | | | | 860,463 | | | | − | |
Lease receivables | | | 630 | | | | 237 | | | | 829 | | | | 1,696 | | | | 107,986 | | | | 109,682 | | | | − | |
Loans receivable- related party | | | − | | | | − | | | | − | | | | − | | | | 9,927 | | | | 9,927 | | | | − | |
Total loans | | $ | 630 | | | $ | 237 | | | $ | 5,829 | | | $ | 6,696 | | | $ | 1,619,010 | | | $ | 1,625,706 | | | $ | − | |
Impaired Loans and Lease Receivables
The following tables show impaired loans and lease receivables for the years indicated (in thousands):
| | | | | | | | | | | | Average | | | | |
| | | | | | Unpaid | | | | | | Investment | | | Interest | |
| | | Recorded | | | Principal | | | Specific | | | in Impaired | | | Income | |
| | | | | | | | | | | | | | | | |
| December 31, 2011: | | | | | | | | | | | | | | | |
Loans and lease receivables without a specific valuation allowance: | | | | | | | | | | | | | | | |
Whole loans | | $ | 75,273 | | | $ | 75,273 | | | $ | − | | | $ | 75,263 | | | $ | 2,682 | |
B notes | | $ | − | | | $ | − | | | $ | − | | | $ | − | | | $ | − | |
Mezzanine loans | | $ | − | | | $ | − | | | $ | − | | | $ | − | | | $ | − | |
Bank loans | | $ | − | | | $ | − | | | $ | − | | | $ | − | | | $ | − | |
Loans and lease receivables with a specific valuation allowance: | | | | | | | | | | | | | | | | | | | | |
Whole loans | | $ | 37,765 | | | $ | 37,765 | | | $ | (17,065 | ) | | $ | 36,608 | | | $ | 920 | |
B notes | | $ | − | | | $ | − | | | $ | − | | | $ | − | | | $ | − | |
Mezzanine loans | | $ | − | | | $ | − | | | $ | − | | | $ | − | | | $ | − | |
Bank loans | | $ | 2,693 | | | $ | 2,693 | | | $ | (1,593 | ) | | $ | 2,693 | | | $ | − | |
| | | | | | | | | | | | | | | | | | | | | |
| Total: | | | | | | | | | | | | | | | | | | | | |
Whole loans | | $ | 113,038 | | | $ | 113,038 | | | $ | (17,065 | ) | | $ | 111,871 | | | $ | 3,602 | |
B notes | | | − | | | | − | | | | − | | | | − | | | | − | |
Mezzanine loans | | | − | | | | − | | | | − | | | | − | | | | − | |
Bank loans | | | 2,693 | | | | 2,693 | | | | (1,593 | ) | | | 2,693 | | | | − | |
| | | $ | 115,731 | | | $ | 115,731 | | | $ | (18,658 | ) | | $ | 114,564 | | | $ | 3,602 | |
| | | | | | | | | | | | Average | | | | |
| | | | | | Unpaid | | | | | | Investment | | | Interest | |
| | | Recorded | | | Principal | | | Specific | | | in Impaired | | | Income | |
| | | | | | | | | | | | | | | | |
| December 31, 2010: | | | | | | | | | | | | | | | |
Loans and lease receivables without a specific valuation allowance: | | | | | | | | | | | | | | | |
Whole loans | | $ | 111,401 | | | $ | 111,401 | | | $ | − | | | $ | 58,058 | | | $ | 1,133 | |
B notes | | $ | − | | | $ | − | | | $ | − | | | $ | − | | | $ | − | |
Mezzanine loans | | $ | − | | | $ | − | | | $ | − | | | $ | − | | | $ | − | |
Bank loans | | $ | − | | | $ | − | | | $ | − | | | $ | − | | | $ | − | |
Lease receivables | | $ | − | | | $ | − | | | $ | − | | | $ | − | | | $ | − | |
Loans and lease receivables with a specific valuation allowance: | | | | | | | | | | | | | | | | | | | | |
Whole loans | | $ | 37,219 | | | $ | 37,219 | | | $ | (15,844 | ) | | $ | 36,740 | | | $ | 993 | |
B notes | | $ | − | | | $ | − | | | $ | − | | | $ | − | | | $ | − | |
Mezzanine loans | | $ | 5,000 | | | $ | 5,000 | | | $ | (5,000 | ) | | $ | 5,000 | | | $ | − | |
Bank loans | | $ | 362 | | | $ | 362 | | | $ | (112 | ) | | $ | 8,971 | | | $ | − | |
Lease receivables | | $ | 10,024 | | | $ | 10,024 | | | $ | (4,107 | ) | | $ | 4,791 | | | $ | − | |
| | | | | | | | | | | | | | | | | | | | | |
| Total: | | | | | | | | | | | | | | | | | | | | |
Whole loans | | $ | 148,620 | | | $ | 148,620 | | | $ | (15,844 | ) | | $ | 94,798 | | | $ | 2,126 | |
B notes | | | − | | | | − | | | | − | | | | − | | | | − | |
Mezzanine loans | | | 5,000 | | | | 5,000 | | | | (5,000 | ) | | | 5,000 | | | | − | |
Bank loans | | | 362 | | | | 362 | | | | (112 | ) | | | 8,971 | | | | − | |
Lease receivables | | | 10,024 | | | | 10,024 | | | | (4,107 | ) | | | 4,791 | | | | − | |
| | | $ | 164,006 | | | $ | 164,006 | | | $ | (25,063 | ) | | $ | 113,560 | | | $ | 2,126 | |
Troubled-Debt Restructurings
The following tables show the loan and lease receivable portfolio troubled-debt restructurings (in thousands):
| | | | | | Pre-Modification Outstanding Recorded Balance | | | Post-Modification Outstanding Recorded Balance | |
| December 31, 2011: | | | | | | | | | |
Whole loans | | | 3 | | | $ | 67,985 | | | $ | 64,573 | |
B notes | | | − | | | | − | | | | − | |
Mezzanine loans | | | − | | | | − | | | | − | |
Bank loans | | | − | | | | − | | | | − | |
Loans receivable - related party | | | 1 | | | | 7,981 | | | | 7,981 | |
Total loans | | | 4 | | | $ | 75,966 | | | $ | 72,554 | |
As of December 31, 2011 and 2010, there were no troubled-debt restructurings that subsequently defaulted. There was one loan, with a par value of $37.8 million, that was deemed a troubled debt restructuring in 2010 which continued to require maturity extensions and monthly advances against the mezzanine balance during 2011.
Investments in Real Estate
The table below summarizes our investments in real estate (in thousands):
| | | | |
| | | | | | | |
Multi-family property | | $ | 38,577 | | | | 2 | |
Office property | | | 10,149 | | | | 1 | |
Subtotal | | | 48,726 | | | | | |
Less: Accumulated depreciation | | | (699 | ) | | | | |
Investments in real estate | | $ | 48,027 | | | | | |
We had no investments in real estate as of December 31, 2010.
Acquisitions. During the year ended December 31, 2011, we converted two loans we had originated to investments in real estate and acquired one real estate asset, summarized as follows:
| | | | | | | | | | | | Average | | | | |
| | | | | | Unpaid | | | | | | Investment | | | Interest | |
| | | Recorded | | | Principal | | | Specific | | | in Impaired | | | Income | |
| | | | | | | | | | | | | | | | |
December 31, 2010: | | | | | | | | | | | | | | | |
Loans and lease receivables without a specific valuation allowance: | | | | | | | | | | | | | | | |
Whole loans | | $ | 111,401 | (1) | | $ | 111,401 | | | $ | − | | | $ | 58,058 | | | $ | 1,133 | |
B notes | | $ | − | | | $ | − | | | $ | − | | | $ | − | | | $ | − | |
Mezzanine loans | | $ | − | | | $ | − | | | $ | − | | | $ | − | | | $ | − | |
Bank loans | | $ | − | | | $ | − | | | $ | − | | | $ | − | | | $ | − | |
Lease receivables | | $ | − | | | $ | − | | | $ | − | | | $ | − | | | $ | − | |
Loans and lease receivables with a specific valuation allowance: | | | | | | | | | | | | | | | | | | | | |
Whole loans | | $ | 37,219 | | | $ | 37,219 | | | $ | (15,844 | ) | | $ | 36,740 | | | $ | 993 | |
B notes | | $ | − | | | $ | − | | | $ | − | | | $ | − | | | $ | − | |
Mezzanine loans | | $ | 5,000 | | | $ | 5,000 | | | $ | (5,000 | ) | | $ | 5,000 | | | $ | − | |
Bank loans | | $ | 362 | | | $ | 362 | | | $ | (112 | ) | | $ | 8,971 | | | $ | − | |
Lease receivables | | $ | 10,024 | | | $ | 10,024 | | | $ | (4,107 | ) | | $ | 4,791 | | | $ | − | |
| Total: | | | | | | | | | | | | | | | | | | | | |
Whole loans | | $ | 148,620 | | | $ | 148,620 | | | $ | (15,844 | ) | | $ | 94,798 | | | $ | 2,126 | |
B notes | | | − | | | | − | | | | − | | | | − | | | | − | |
Mezzanine loans | | | 5,000 | | | | 5,000 | | | | (5,000 | ) | | | 5,000 | | | | − | |
Bank loans | | | 362 | | | | 362 | | | | (112 | ) | | | 8,971 | | | | − | |
Lease receivables | | | 10,024 | | | | 10,024 | | | | (4,107 | ) | | | 4,791 | | | | − | |
| | | $ | 164,006 | | | $ | 164,006 | | | $ | (25,063 | ) | | $ | 113,560 | | | $ | 2,126 | |
| ● | On June 14, 2011, we converted a loan that we had originated to equity with a fair value of $22.4 million at acquisition. The loan was collateralized by a 400 unit multi-family property in Memphis, Tennessee. The property was 93.8% occupied at acquisition. |
| ● | On June 24, 2011, we converted a loan that we had originated to equity with a fair value of $10.7 million at acquisition. The loan was collateralized by an office building in Pacific Palisades, California. The property was 60% occupied at acquisition. |
| ● | On August 1, 2011, we entered into an agreement to purchase Whispertree Apartments, a 504 multi-family property located in Houston, Texas, for $18.1 million, the fair value. The property was 95% occupied at acquisition. In conjunction with the purchase of this property, we entered into a mortgage in the amount of $13.6 million. |
A summary of the aggregated estimated fair value of the assets and liabilities acquired on the respective dates of acquisition are presented below (in thousands):
| | | |
| Assets acquired: | | | |
Investments in real estate | | $ | 48,683 | |
Cash and cash equivalents | | | 177 | |
Restricted cash | | | 2,360 | |
Intangible assets | | | 2,490 | |
Other assets | | | 391 | |
Total assets acquired | | | 54,101 | |
| Liabilities assumed: | | | | |
Accounts payable and other liabilities | | | 673 | |
Total liabilities assumed | | | 673 | |
Estimated fair value of net assets acquired | | $ | 53,428 | |
We acquired Whispertree Apartments and accounted for this transaction as a business combination in accordance with FASB ASC Topic 805. In the fourth quarter of 2011, we obtained the final appraisal of the property. Based on the final appraisal, we adjusted the value of the land and the value of the building by $3.9 million, respectively, as of the acquisition date. Accordingly, these adjustments were recognized and are reflected in the consolidated financial statements as of December 31, 2011.
Restricted cash. At December 31, 2011, we had restricted cash of $142.8 million, which consisted of $138.1 million of restricted cash on our six CDOs, $1.5 million held in a margin account related to our swap portfolio and $3.2 million held in restricted accounts at our investment properties. At December 31, 2010, we had restricted cash of $168.2 million, which consisted of $160.5 million of restricted cash in our five CDOs, $5.2 million of restricted cash in our leasing securitization and $2.5 million held in a margin account, related to our swap portfolio. The decrease of $25.4 million is primarily related to loan settlements in our CDOs and to a lesser extent, the expiration of the reinvestment period for two of our CDOs, Apidos CDO I and RREF CDO 2006-1, whereby any repaid principal will now be used to repay the principal balance of the notes outstanding.
Interest Receivable. At December 31, 2011, we had interest receivable of $8.8 million, which consisted of $8.8 million of interest on our securities, loans and lease receivables and $15,000 of interest earned on escrow and sweep accounts. At December 31, 2010, we had interest receivable of $6.3 million, which consisted of $6.3 million of interest on our securities, loans and lease receivables and $9,000 of interest earned on escrow and sweep accounts. The increase in interest receivable is due to the following:
| ● | an increase of $697,000 in interest receivable on our bank loan portfolio due to the acquisition of $334.8 million par value of bank loans through the closing of Apidos CLO VIII in October 2011, |
| ● | a $1.2 million increase in interest receivable on structured notes due to the timing of when payments on structured notes are due and received, and |
| ● | an increase of $317,000 in interest receivable on our CMBS held as a result of new purchases through our Wells Fargo facility in 2011. |
Other Assets. The following table summarizes our other assets as of December 31, 2011 and 2010 (in thousands):
| | | | |
| | | | | | | |
Management fees receivable | | $ | 1,171 | | | $ | − | |
Other receivables | | | 1,191 | | | | 1,374 | |
Prepaid assets | | | 1,626 | | | | 590 | |
Principal paydown | | | 105 | | | | 468 | |
Total | | $ | 4,093 | | | $ | 2,432 | |
Other assets increased $1.7 million to $4.1 million as of December 31, 2011 from $2.4 million as of December 31, 2010. This increase resulted primarily from the following:
| ● | an increase of $1.2 million in management fees receivable which are related to our investment in an asset management subsidiary which entitles us to collect senior, subordinated and incentive fees related to five collateralized loan obligations; and |
| ● | an increase of $1.0 million in prepaid assets which is primarily related to the acquisition of new real estate properties, as well as our directors’ and officers’ insurance policy and the timing of when we pay the related premium costs. |
These increases were partially offset by a decrease of $360,000 in principal paydowns due to the timing of our receipt of payments on our leasing and bank loan portfolios and a decrease of $180,000 in other receivables which is principally due to receivables on the leasing portfolio that we had sold in 2011 in connection with the LCC transactions.
Hedging Instruments. Our hedges at December 31, 2011 and 2010 were fixed-for-floating interest rate swap agreements whereby we swapped the floating rate of interest on the liabilities we hedged for a fixed rate of interest. With interest rates at historically low levels and the forward curve projecting steadily increasing rates as well as the scheduled maturity of two hedges during 2012, we expect that the fair value of our hedges will modestly improve in 2012. We intend to continue to seek such hedges for our floating rate debt in the future. Our hedges at December 31, 2011 were as follows (in thousands):
| | | | | | | | | | | | | | | |
| CRE Swaps | | | | | | | | | | | | | | |
| Interest rate swap | | 1 month LIBOR | | $ | 12,150 | | | | 5.44% | | 06/26/07 | | 03/25/12 | | | (147 | ) |
| Interest rate swap | | 1 month LIBOR | | | 12,750 | | | | 5.27% | | 07/25/07 | | 08/06/12 | | | (378 | ) |
| Interest rate swap | | 1 month LIBOR | | | 33,124 | | | | 4.13% | | 01/10/08 | | 05/25/16 | | | (1,837 | ) |
| Interest rate swap | | 1 month LIBOR | | | 1,681 | | | | 5.72% | | 07/12/07 | | 10/01/16 | | | (192 | ) |
| Interest rate swap | | 1 month LIBOR | | | 1,880 | | | | 5.68% | | 07/13/07 | | 03/12/17 | | | (431 | ) |
| Interest rate swap | | 1 month LIBOR | | | 80,940 | | | | 5.58% | | 06/26/07 | | 04/25/17 | | | (8,879 | ) |
| Interest rate swap | | 1 month LIBOR | | | 1,726 | | | | 5.65% | | 07/05/07 | | 07/15/17 | | | (201 | ) |
| Interest rate swap | | 1 month LIBOR | | | 3,850 | | | | 5.65% | | 07/26/07 | | 07/15/17 | | | (448 | ) |
| Interest rate swap | | 1 month LIBOR | | | 4,023 | | | | 5.41% | | 08/10/07 | | 07/25/17 | | | (443 | ) |
| Total CRE Swaps | | | | | 152,124 | | | | | | | | | | | (12,956 | ) |
| | | | | | | | | | | | | | | | | | |
| CMBS Swaps | | | | | | | | | | | | | | | | | |
| Interest rate swap | | 1 month LIBOR | | | 86 | | | | 0.64% | | 02/23/11 | | 11/01/13 | | | − | |
| Interest rate swap | | 1 month LIBOR | | | 28 | | | | 0.51% | | 03/18/11 | | 11/01/13 | | | − | |
| Interest rate swap | | 1 month LIBOR | | | 103 | | | | 0.55% | | 03/28/11 | | 11/01/13 | | | − | |
| Interest rate swap | | 1 month LIBOR | | | 152 | | | | 0.55% | | 04/15/11 | | 11/18/13 | | | − | |
| Interest rate swap | | 1 month LIBOR | | | 3,266 | | | | 1.11% | | 04/26/11 | | 01/15/14 | | | (28 | ) |
| Interest rate swap | | 1 month LIBOR | | | 4,215 | | | | 0.84% | | 03/31/11 | | 01/18/14 | | | (13 | ) |
| Interest rate swap | | 1 month LIBOR | | | 4,130 | | | | 1.93% | | 02/14/11 | | 05/01/15 | | | (108 | ) |
| Interest rate swap | | 1 month LIBOR | | | 758 | | | | 1.30% | | 07/19/11 | | 03/18/16 | | | (10 | ) |
| Interest rate swap | | 1 month LIBOR | | | 3,043 | | | | 1.95% | | 04/11/11 | | 03/18/16 | | | (95 | ) |
| Total CMBS Swaps | | | | | 15,781 | | | | | | | | | | | (254 | ) |
| | | | | | | | | | | | | | | | | | |
| Total Interest Rate Swaps | | | | $ | 167,905 | | | | 4.87% | | | | | | $ | (13,210 | ) |
We had no interest rate cap agreements as of December 31, 2011. We had an interest rate cap agreement with a fair value of $60 and a notional amount of $14.8 million outstanding as of December 31, 2010 which reduced our exposure to variability in future cash flows attributable to LIBOR.
As of December 31, 2010, we had entered into hedges with a notional amount of $166.8 million and maturities ranging from July 2011 to July 2017. At December 31, 2010, the fair value on our interest rate swap agreements was ($13.3) million.
Apidos CLO VIII Warehouse Facility - In June 2011, we formed Apidos CLO VIII and entered into a warehouse facility provided by Citibank, N.A. to purchase bank loans to include in Apidos CLO VIII. This agreement, secured by our pledge of the preference shares we hold in Apidos CLO VIII, expired upon the closing of Apidos CLO VIII on October 13, 2011.
CMBS – Term Repurchase Facility. In February 2011, our wholly-owned subsidiaries, RCC Real Estate and RCC Commercial, entered into a master repurchase agreement with Wells Fargo Bank, National Association to be used as a warehouse facility to finance the purchase of highly-rated CMBS. We guaranteed RCC Real Estate and RCC Commercial’s performance of their obligations under the repurchase agreement. We have certain financial covenants, one of which is to maintain a leverage ratio of no greater than 9.0 to 1.0 as defined in the agreement. We are in full compliance with all covenants as of December 31, 2011. At December 31, 2011, RCC Real Estate had borrowed $55.9 million, all of which we had guaranteed, less unamortized deferred debt issuance costs for a net of $55.4 million. At December 31, 2011, borrowings under the repurchase agreement were secured by CMBS with an estimated fair value of $64.3 million and had a weighted average interest rate of one-month LIBOR plus 1.25%, or 1.54%.
Revolving Credit Facility. On July 7, 2011, RCC and RCC Real Estate entered into a $10.0 million revolving credit facility with The Bancorp Bank. The facility will provide bridge financing for up to five business days which will enable us to fund real estate loans to third parties prior to their sale to our CRE CDOs. The facility is evidenced by a Revolving Judgment Note and Security Agreement to Bancorp Bank. The facility is secured by a pledge of $32.9 million par value of the Class A-1 notes of Resource Real Estate Funding CDO 2006-1, or RREF CDO 2006-1, which are owned by RCC Real Estate. The note becomes due and payable on September 30, 2012. We are in compliance with all covenants related to this facility as of December 31, 2011. There were no borrowings outstanding and we were in compliance with all covenants at December 31, 2011.
Collateralized Debt Obligations. As of December 31, 2011, we had executed and retained equity in six CDO transactions as follows:
| ● | In October 2011, we closed Apidos CLO VIII, a $350.0 million CLO transaction that provided financing for bank loans. The investments held by Apidos CLO VIII collateralized $317.6 million of senior notes issued by the CDO vehicle. Resource TRS III purchased a $15.0 million equity interest representing approximately 43% of the outstanding preference shares. At December 31, 2011, the notes issued to outside investors had a weighted average borrowing rate of 2.42%. |
| ● | In September 2007, we closed Resource Real Estate Funding CDO 2007-1, or RREF CDO 2007-1, a $500.0 million CDO transaction that provided financing for commercial real estate loans. The investments held by RREF CDO 2007-1 collateralized $458.8 million of senior notes issued by the CDO vehicle, of which RCC Real Estate, Inc., or RCC Real Estate, a subsidiary of ours, purchased 100% of the class H senior notes, class K senior notes, class L senior notes and class M senior notes for $68.0 million at closing, $5.0 million of the Class J senior notes in February 2008, an additional $2.5 million of the Class J senior notes in November 2009, and $11.9 million of the Class E senior notes, $11.9 million of the Class F senior notes and $7.3 million of the Class G senior notes in December 2009, $250,000 of the Class J senior notes in January 2010, $5.0 million of the Class A-2 senior notes in August 2011, and $5.0 million of the Class A-2 senior notes in September 2011. In addition, RREF 2007-1 CDO Investor, LLC, a subsidiary of RCC Real Estate, purchased a $41.3 million equity interest representing 100% of the outstanding preference shares. At December 31, 2011, the notes issued to outside investors, net of repurchased notes, had a weighted average borrowing rate of 0.85%. |
| ● | In May 2007, we closed Apidos Cinco CDO, a $350.0 million CDO transaction that provided financing for bank loans. The investments held by Apidos Cinco CDO collateralized $322.0 million of senior notes issued by the CDO vehicle. Resource Commercial II holds a $28.0 million equity interest representing 100% of the outstanding preference shares. At December 31, 2011, the notes issued to outside investors had a weighted average borrowing rate of 0.95%. |
| ● | In August 2006, we closed RREF CDO 2006-1, a $345.0 million CDO transaction that provided financing for commercial real estate loans. The investments held by RREF CDO 2006-1 collateralized $308.7 million of senior notes issued by the CDO vehicle. RCC Real Estate purchased 100% of the class J senior notes and class K senior notes for $43.1 million at closing and $7.5 million of the Class F senior notes in September 2009, $3.5 million of the Class E senior note and $4.0 million of the Class F senior notes in September 2009 and $20.0 million of the Class A-1 senior notes in February 2010. In addition, RREF 2006-1 CDO Investor, LLC, a subsidiary of RCC Real Estate, purchased a $36.3 million equity interest representing 100% of the outstanding preference shares. At December 31, 2011, the notes issued to outside investors, net of repurchased notes, had a weighted average borrowing rate of 1.44%. The reinvestment period expired in September 2011 and the CDO has begun paying down the senior notes as principal is collected. Through December 31, 2011, $23.0 million of the Class A-1 senior notes was paid down. |
| ● | In May 2006, we closed Apidos CDO III, a $285.5 million CDO transaction that provided financing for bank loans. The investments held by Apidos CDO III collateralized $262.5 million of senior notes issued by the CDO vehicle. RCC Commercial purchased a $23.0 million equity interest representing 100% of the outstanding preference shares. At December 31, 2011, the notes issued to outside investors had a weighted average borrowing rate of 0.99%. |
| | | | | | | | | | | | Average | | | | |
| | | | | | Unpaid | | | | | | Investment | | | Interest | |
| | | Recorded | | | Principal | | | Specific | | | in Impaired | | | Income | |
| | | | | | | | | | | | | | | | |
December 31, 2009: | | | | | | | | | | | | | | | |
Loans and lease receivables without a specific valuation allowance: | | | | | | | | | | | | | | | |
Whole loans | | $ | 7,378 | (1) | | $ | 7,378 | | | $ | − | | | $ | 7,378 | | | $ | − | |
B notes | | $ | − | | | $ | − | | | $ | − | | | $ | − | | | $ | − | |
Mezzanine loans | | $ | 10,517 | (1) | | $ | 10,517 | | | $ | − | | | $ | 10,517 | | | $ | − | |
Bank loans | | $ | − | | | $ | − | | | $ | − | | | $ | − | | | $ | − | |
Lease receivables | | $ | − | | | $ | − | | | $ | − | | | $ | − | | | $ | − | |
Loans and lease receivables with a specific valuation allowance: | | | | | | | | | | | | | | | | | | | | |
Whole loans | | $ | 66,797 | | | $ | 66,797 | | | $ | (18,764 | ) | | $ | 79,804 | | | $ | 2,307 | |
B notes | | $ | − | | | $ | − | | | $ | − | | | $ | − | | | $ | − | |
Mezzanine loans | | $ | − | | | $ | − | | | $ | − | | | $ | − | | | $ | − | |
Bank loans | | $ | 12,772 | | | $ | 12,772 | | | $ | (9,578 | ) | | $ | 1,693 | | | $ | − | |
Lease receivables | | $ | 2,617 | | | $ | 2,617 | | | $ | (2,617 | ) | | $ | − | | | $ | − | |
| Total: | | | | | | | | | | | | | | | | | | | | |
Whole loans | | $ | 74,175 | | | $ | 74,175 | | | $ | (18,764 | ) | | $ | 87,182 | | | $ | 2,307 | |
B notes | | | − | | | | − | | | | − | | | | − | | | | − | |
Mezzanine loans | | | 10,517 | | | | 10,517 | | | | − | | | | 10,517 | | | | − | |
Bank loans | | | 12,772 | | | | 12,772 | | | | (9,578 | ) | | | 1,693 | | | | − | |
Lease receivables | | | 2,617 | | | | 2,617 | | | | (2,617 | ) | | | − | | | | − | |
| | | $ | 100,081 | | | $ | 100,081 | | | $ | (30,959 | ) | | $ | 99,392 | | | $ | 2,307 | |
(1) | Specific allowances were not taken on whole loans● | In August 2005, we closed Apidos CDO I, a $350.0 million CDO transaction that provided financing for bank loans. The investments held by Apidos CDO I collateralize $321.5 million of $111.4senior notes issued by the CDO vehicle. RCC Commercial purchased a $28.5 million at par value asequity interest representing 100% of the outstanding preference shares. At December 31, 20102011, the notes issued to outside investors had a weighted average borrowing rate of 1.00%. The reinvestment period expired in July 2011 and whole loans of $7.4 million and mezzanine loans of $10.5 million at par valuethe CDO has begun paying down the senior notes as ofprincipal is collected. Through December 31, 2009 that were evaluated for and deemed to be troubled debt restructurings, or TDRs. These TDRs do not have an associated specific loan loss allowance because2011, $5.5 million of the principal and interest amount is considered recoverable based on expected collateral performance and / or guarantees made by the borrowers.Class A-1 senior notes was paid down. |
On June 21, 2011, we surrendered to the respective trustees, for cancellation without consideration, certain notes issued by RREF CDO 2007-1 and RREF CDO 2006-1. In RREF CDO 2007-1, we surrendered $7.5 million of the Class B notes, $6.5 million of the Class F notes, $6.25 million of the Class G notes and $10.625 million of the Class H notes. In RREF CDO 2006-1, we surrendered $6.9 million of the Class B notes, $7.7 million of the Class C notes, $5.52 million of the Class D notes, $7.0 million of the Class E notes and $5.25 million of the Class F notes. The surrendered notes were cancelled by the trustee under the applicable indentures, and the obligations due under those notes were deemed extinguished. The effect of these cancellations improves each respective CDO’s performance with respect to its over-collateralization and interest coverage tests, with which they already complied before cancellation, as well as secures our long term interest in these structured vehicles.
Trust Preferred Securities. In May and September 2006, we formed Resource Capital Trust I and RCC Trust II, respectively, for the sole purpose of issuing and selling trust preferred securities. Resource Capital Trust I and RCC Trust II are not consolidated into our consolidated financial statements because we are not deemed to be the primary beneficiary of either trust. We own 100% of the common shares of each trust, each of which issued $25.0 million of preferred shares to unaffiliated investors. Our rights as the holder of the common shares of each trust are subordinate to the rights of the holders of preferred shares only in the event of a default; otherwise, our economic and voting rights are pari passu with the preferred shareholders. We record each of our investments in the trusts’ common shares of $774,000 as an investment in unconsolidated trusts and record dividend income upon declaration by each trust.
In October 2009, we amended our unsecured junior subordinated debentures held by RCT I and RCT II with a total value outstanding of $51.5 million. The amendment provides for an interest rate increase of 2% (from LIBOR plus 3.95% to LIBOR plus 5.95%) on both issuances for a period of two years and a one-time restructuring fee of $250,000 in exchange for the waiver of financial covenants under our guarantee. The interest rate adjustment took effect as of October 1, 2009 and expired on September 30, 2011. The rates for RCT I and RCT II at December 31, 2011, were 4.32% and 4.38%, respectively and 6.25% and 6.24% at December 31, 2010, respectively. The covenant waiver expired on January 1, 2012. The junior subordinated debentures debt issuance costs are included in borrowings in the consolidated balance sheets. We record interest expense on the junior subordinated debentures and amortization of debt issuance costs in our consolidated statements of operations. The debt issuance costs associated with the junior subordinated debentures for RCT I and RCT II at December 31, 2011 were $450,000 and $467,000, respectively. The debt issuance costs associated with the junior subordinated debentures for RCT I and RCT II at December 31, 2010 were $590,000 and $604,000, respectively.
Stockholders’ Equity
Stockholders’ equity at December 31, 2011 was $429.7 million and gave effect to $14.3 million of unrealized losses on cash flow hedges and $32.0 million of unrealized losses on our available-for-sale portfolio, shown as a component of accumulated other comprehensive loss. Stockholders’ equity at December 31, 2010 was $348.3 million and gave effect to $13.3 million of unrealized losses on cash flow hedges and $19.3 million of unrealized losses on our available-for-sale portfolio, shown as a component of accumulated other comprehensive loss. Stockholders’ equity at December 31, 2009 was $228.8 million and gave effect to $12.8 million of unrealized losses on cash flow hedges and $47.6 million of unrealized losses on our available-for-sale portfolio, shown as a component of accumulated other comprehensive loss. The increase in stockholders’ equity during the year ended December 31, 20102011 was principally due to the receipt of $42.8$46.6 million related to a common stock offering in May 2010March 2011 combined with $76.8$83.6 of proceeds from sales of our common stock through our DRIP in 2011.
Funds from Operations
We now evaluate our performance based on several performance measures, including Funds from Operations, or FFO, and Adjusted Funds from Operations, or AFFO, in addition to net income. We compute FFO in accordance with the standards established by the National Association of Real Estate Investment Trusts as net income (computed in accordance with GAAP), excluding gains or losses on the sale of depreciable real estate, the cumulative effect of changes in accounting principles, real estate-related depreciation and amortization, and after adjustments for unconsolidated/ uncombined partnerships and joint ventures.
AFFO is a computation made by analysts and investors to measure a real estate company’s cash flow generated by operations. We calculate AFFO by adding or subtracting from FFO: non-cash impairment losses resulting from fair value adjustments on financial instruments, non-cash provision for loan losses, straight-line rental effects, share based compensation, amortization of various deferred items and intangible assets, gains on debt extinguishment, several REIT tax planning adjustments considered non-recurring by management and capital expenditures that are related to our DRIP in 2010. real estate owned.
As a result of “available-for-sale” accounting treatment, unrealized fluctuations in market values of certain assets do not impact our income determined in accordance with accounting principles generally accepted in the United States of America, or GAAP, or our taxable income, but rather are reflected on our consolidated balance sheets by changing the carrying value of the asset and stockholders’ equity under “Accumulated Other Comprehensive Loss.” By accounting for our assets in this manner, we hope to provide useful information to stockholders and creditors and to preserve flexibility to sell assets in the future without having to change accounting methods.
Management believes that FFO and AFFO are appropriate measures of the Company’s operating performance in that they are frequently used by analysts, investors and other parties in the evaluation of REITs. Management uses FFO and AFFO as measures of our operating performance, and believe they are also useful to investors, because they facilitate an understanding of our operating performance after adjustment for certain non-cash items, such as real estate depreciation, share-based compensation and various other items required by GAAP, and capital expenditures, that may not necessarily be indicative of current operating performance and that may not accurately compare our operating performance between periods.
Adjusted Net IncomeWhile the our calculations of AFFO may differ from the methodology used for calculating AFFO by other REITs and our AFFO may not be comparable to AFFO reported by other REITs, we also believe that FFO and AFFO may provide us and our investors with an additional useful measure to compare its performance with some other REITs. Neither FFO nor AFFO is equivalent to net income or cash generated from operating activities determined in accordance with GAAP. Furthermore FFO and AFFO do not represent amounts available for management’s discretionary use because of needed capital replacement or expansion, debt service obligations or other commitments or uncertainties. Neither FFO nor AFFO should be considered as an alternative to net income as an indicator of our operating performance or as an alternative to cash flow from operating activities as a measure of its liquidity.
The following table reconciles GAAP net income to adjusted net income, which is a non-GAAP financial measure.Funds from Operations and Adjusted Funds from Operations for the periods presented (in thousands):| | | Year Ended | |
| | | December 31, | |
| | | | |
Net income − GAAP | | $ | 37,716 | |
| Adjustments: | | | | |
Real estate depreciation and amortization | | | 2,606 | |
Impairment charges on repossessed real estate assets (1) | | | 1,449 | |
FFO | | | 41,771 | |
| Adjustments: | | | | |
| Non-cash items: | | | | |
Impairment losses on financial instruments | | | 6,898 | |
Provisions for loan losses | | | 317 | |
Straight line rental adjustments | | | (17 | ) |
Share-based compensation | | | 2,526 | |
Amortization of deferred costs (non real estate) and intangible assets | | | 5,870 | |
(Gains) on debt extinguishment | | | (3,875 | ) |
REIT tax planning adjustments (3) | | | 11,751 | |
| Cash items: | | | | |
Capital expenditures | | | (1,296 | ) |
AFFO | | $ | 63,945 | |
Weighted average shares – diluted | | | 70,809 | |
AFFO per share – diluted | | $ | 0.90 | |
| | | Years Ended | |
| | | | |
| | | | | | | | | | |
Net income (loss) − GAAP | | $ | 19,447 | | | $ | 6,339 | | | $ | (3,074 | ) |
| Adjustments: | | | | | | | | | | | | |
Provision for loan and lease losses (2) | | | 43,321 | | | | 61,383 | | | | 46,159 | |
Asset impairments | | | 26,804 | | | | 13,471 | | | | − | |
Gains on the extinguishment of debt | | | (34,610 | ) | | | (44,546 | ) | | | (1,750 | ) |
Adjusted net income, excluding non-cash items (1) | | $ | 54,962 | | | $ | 36,647 | | | $ | 41,335 | |
| Adjusted net income per share – diluted, excluding non-cash items | | $ | 1.15 | | | $ | 1.45 | | | $ | 1.67 | |
| (1) | During 2010, we evaluated our performance based on several performance measures, including adjusted net income (loss),Amount represents impairment charges recorded by us in additionconnection with real estate debt converted to net income and estimated REIT taxable income. Adjusted net income represents net income available to common shares, computed in accordance with GAAP, before provision for loan and lease losses, gain on the extinguishment of debt and non-operating capital items. These items are recorded in accordance with GAAP and are typically non-cash or non-operating items that do not impact our operating performance or ability to pay a dividend. equity. |
Management views adjusted net income as a useful and appropriate supplement to GAAP net income (loss) because it helps management evaluate our performance without the effects of certain GAAP adjustments that may not have a direct financial impact on our current operating performance and dividend paying ability. Management uses adjusted net income to evaluate the performance of our investment portfolios, ability to manage its expenses and dividend paying ability before the impact of non-cash adjustments and non-operating capital gain or loss recorded in accordance with GAAP. We believe this is a useful performance measure for investors to evaluate these aspects of our business as well. The most significant adjustments we exclude in determining adjusted earnings as of December 31, 2010 and 2009 are the provision for loan and lease losses, loss from asset impairments and gain on the extinguishment of debt. Management excludes all such items from our calculation of adjusted net income because these items are not charges or losses which would impact our current operating performance. However, by excluding these significant items, adjusted net income reduces an investor’s understanding of our operating performance by excluding management’s expectation of possible future gains or losses from our investment portfolio.
Adjusted net income, as a non-GAAP financial measurement, does not purport to be an alternative to GAAP net income, or a measure of operating performance or cash flows from operating activities determined in accordance with GAAP as a measure of liquidity. Instead, adjusted net income should be reviewed in connection with net income and cash flows from operating, investing and financing activities in our consolidated financial statements to help analyze management’s expectation of potential future losses from our investment portfolio and other non-cash or capital matters that impact our financial results. Adjusted net income and other supplemental performance measures are defined in various ways throughout the REIT industry. Investors should consider these differences when comparing our adjusted net income to these other REITs.
| (2) | Non-cash charges for loanComparative FFO and lease losses.AFFO data is not provided since we did not own depreciable real property during the comparable period in 2010. |
| (3) | During the three months ended December 31, 2011, we took actions to remain in compliance with respect to its 75% REIT gross income test. First, we transferred two of its CLOs, with non-qualifying income, into a taxable REIT subsidiary for the period October 27, 2011 and ending on December 31, 2011. This transfer increased the tax provision during the three months and year ended December 31, 2011 by $4.7 million. In addition, we sold several positions and generated tax losses to further reduce our non-qualifying income by $7.0 million for the year ended December 31, 2011. We believe these actions were unique to the 2011 75% REIT gross income test and do not anticipate the significant impact of these transactions to recur in 2012. |
REIT Taxable Income
We calculate estimated REIT taxable income, which is a non-GAAP financial measure, according to the requirements of the Internal Revenue Code. The following table reconciles GAAP net income to estimated REIT taxable income for the periods presented (in thousands):
| | | Years Ended | | | Years Ended | |
| | | | | | | |
| | | | | | | | | | | | | | | | | | | |
Net income (loss) – GAAP | | $ | 19,447 | | | $ | 6,339 | | | $ | (3,074 | ) | |
Net income – GAAP | | | $ | 37,716 | | | $ | 19,447 | | | $ | 6,339 | |
Taxable REIT subsidiary’s (loss) income | | | (9,833 | ) | | | 3,138 | | | | − | | | | (6,033 | ) | | | (9,833 | ) | | | 3,138 | |
Adjusted net income (loss) | | | 9,614 | | | | 9,477 | | | | (3,074 | ) | |
Adjusted net income | | | | 31,683 | | | | 9,614 | | | | 9,477 | |
| | | | | | | | | | | | | | | | | | | | | | | | | |
| Adjustments: | | | | | | | | | | | | | | | | | | | | | | | | |
Share-based compensation to related parties | | | 805 | | | | 543 | | | | (1,620 | ) | | | 274 | | | | 805 | | | | 543 | |
Capital carryover (utilization)/losses from the sale of securities | | | (5,013 | ) | | | 4,818 | | | | 2,000 | | | | (23,274 | ) | | | (5,013 | ) | | | 4,818 | |
Provision for loan and lease losses unrealized | | | 44,357 | | | | 26,877 | | | | 14,817 | | | | 6,478 | | | | 44,357 | | | | 26,877 | |
Asset impairments | | | 26,638 | | | | 13,471 | | | | − | | | | 4,649 | | | | 26,638 | | | | 13,471 | |
Equity in income of real estate joint venture | | | (14,493 | ) | | | - | | | | − | | |
Equity in income (loss) of real estate joint venture | | | | 2,540 | | | | (14,493 | ) | | | − | |
Tax gain on sale of real estate joint venture | | | 1,443 | | | | - | | | | − | | | | − | | | | 1,443 | | | | − | |
Investments in real estate | | | | 1,788 | | | | − | | | | − | |
Deferral of extinguishment of debt income | | | − | | | | (28,530 | ) | | | − | | | | − | | | | − | | | | (28,530 | ) |
Net book to tax adjustment for the inclusion of our taxable foreign REIT subsidiaries | | | (22,204 | ) | | | (6,277 | ) | | | 27,115 | | | | (10,211 | ) | | | (22,204 | ) | | | (6,277 | ) |
Subpart F income limitation | | | − | | | | 9,872 | | | | − | | | | − | | | | − | | | | 9,872 | |
Distributable earnings from nonconsolidating taxable REIT subsidiary | | | 1,000 | | | | − | | | | − | | | | − | | | | 1,000 | | | | − | |
Other net book to tax adjustments | | | (1,423 | ) | | | 1,212 | | | | 16 | | | | (90 | ) | | | (1,423 | ) | | | 1,212 | |
Estimated REIT taxable income | | $ | 40,724 | | | $ | 31,463 | | | $ | 39,254 | | | $ | 13,837 | | | $ | 40,724 | | | $ | 31,463 | |
We believe that a presentation of estimated REIT taxable income provides useful information to investors regarding our financial condition and results of operations as we use this measurement to determine the amount of dividends that we are required to declare to our stockholders in order to maintain our status as a REIT for federal income tax purposes. Since we, as a REIT, expect to make distributions based on estimated taxable earnings, we expect that our distributions may at times be more or less than our reported GAAP earnings. Total taxable income is the aggregate amount of taxable income generated by us and by our domestic and foreign taxable REIT subsidiaries. Estimated REIT taxable income excludes the undistributed taxable income of our domestic TRS, if any such income exists, which is not included in REIT taxable income until distributed to us. There is no requirement that our domestic TRS distribute its earning to us. Estimated REIT taxable income, however, includes the taxable income of our foreign TRSs because we are generally required to recognize and report their taxable income on a current basis. Because not all companies use identical calculations, this presentation of estimated REIT taxable income may not be comparable to other similarly-titled measures of other companies.
In order to maintain our qualification as a REIT and to avoid corporate-level income tax on the income we distribute to our stockholders, we intend to make regular quarterly distributions of all or substantially all of our estimated net REIT taxable income to holders of our common stock. This requirement can impact our liquidity and capital resources.
Liquidity and Capital Resources
In fiscalFor the year ended 2011, our principal sources of current liquidity were $46.6 million of net proceeds from our March 2011 offering and $83.6 million of proceeds from sales of common stock through our DRIP and funds available for reinvestment in existing CDO financings of $110.9 million at December 31, 2011. For the year ended 2010, our principal sources of current liquidity were $42.8 million of net proceeds from our May 2010 offering and $76.8 million of proceeds from sales of common stock through our DRIP and funds available in existing CDO financings of $160.5 million at December 31, 2010. In fiscal 2009, our principal sources of current liquidity were $43.4 million of net proceeds from our December 2009 offering and $8.9 million of proceeds from sales of common stock through our DRIP and funds available in existing CDO financings of $80.5 million at December 31, 2009.
Our on-going liquidity needs consist principally of funds to make investments, makeincluding debt repurchases, make distributions to our stockholders and pay our operating expenses, including our management fees.fees and debt service. Our ability to meet our on-going liquidity needs will be subject to our ability to generate cash from operations and, with respect to our investments, our ability to maintain and/or obtain additional debt financing and equity capital together with the funds referred to above. Historically, we have financed a substantial portion of our portfolio investments through CDOs that essentially match the maturity and repricing dates of these financing vehicles with the maturities and repricing dates of our investments. We derive substantial operating cash from our equity investments in our CDOs, which if the CDOs fail to meet certain tests, will cease. Through December 31, 2010, we have not experienced difficulty in maintaining our existing CDO financing and have passed all of the critical tests required by these financings. However, we cannot assure you that we will continue to meet all such critical tests in the future. If we are unable to renew, replace or expand our sources of existing financing on substantially similar terms, we may be unable to implement our investment strategies successfully and may be required to liquidate portfolio investments. If required, a sale of portfolio investments could be at prices lower than the carrying value of such assets, which would result in losses and reduced income.
The following table sets forth collateralized debt obligations – distributions and coverage test summary for the periods presented (in thousands):
| | | | | | | | Annualized | | | | | | | | | | | | | | Annualized | | | | | | | |
| | | | | | | | Interest | | | | | | | | | | | | | | Interest | | | | | | | |
| | | | | | | | Coverage | | | Overcollateralization | | | | | | | | Coverage | | | Overcollateralization | |
| | | | | | | | | | | | | | | | | | | | | | | |
| | | | | Years Ended | | | As of | | | As of | | | As of Initial | | | | | Years Ended | | | As of | | | As of | | | As of Initial | |
| | | | | December 31, | | | December 31, | | | December 31, | | | December 31, | | | Measurement | | |
| �� | | | | | December 31, | | | December 31, | | | December 31, | | | December 31, | | | Measurement | |
| | | | | | | | | | | | | | | | | | | | | | | | | | | | | | | | | | |
| | | | | (actual) | | | (actual) | | | | | | | | | | | | | | (actual) | | | (actual) | | | | | | | | | | |
| Apidos CDO I | | CLO | | $ | 7,695 | | | $ | 6,643 | | | $ | 8,528 | | | $ | 12,854 | | | $ | 17,136 | | | CLO | | $ | 9,305 | | | $ | 7,695 | | | $ | 2,588 | | | $ | 14,187 | | | $ | 17,136 | |
| Apidos CDO III | | CLO | | $ | 6,552 | | | $ | 6,390 | | | $ | 3,483 | | | $ | 8,531 | | | $ | 11,269 | | | CLO | | $ | 8,351 | | | $ | 6,552 | | | $ | 4,961 | | | $ | 9,634 | | | $ | 11,269 | |
| Apidos Cinco CDO | | CLO | | $ | 7,792 | | | $ | 7,553 | | | $ | 4,488 | | | $ | 21,030 | | | $ | 17,774 | | | CLO | | $ | 9,941 | | | $ | 7,792 | | | $ | 4,924 | | | $ | 19,623 | | | $ | 17,774 | |
| RREF 2006-1 | | CRE CDO | | $ | 8,929 | | | $ | 13,222 | | | $ | 7,555 | | | $ | 18,446 | | | $ | 24,941 | | | CRE CDO | | $ | 11,637 | | | $ | 8,929 | | | $ | 13,590 | | | $ | 53,698 | | | $ | 24,941 | |
| RREF 2007-1 | | CRE CDO | | $ | 15,068 | | | $ | 20,536 | | | $ | 11,918 | | | $ | 14,024 | | | $ | 26,032 | | | CRE CDO | | $ | 10,743 | | | $ | 15,068 | | | $ | 8,806 | | | $ | 39,293 | | | $ | 26,032 | |
| (1) | Distributions on retained equity interests in CDOs (comprised of note investment and preference share ownership). |
| (2) | Interest coverage includes annualized amounts based on the most recent trustee statements. |
| (3) | Interest coverage cushion represents the amount by which annualized interest income expected exceeds the annualized amount payable on all classes of CDO notes senior to our preference shares. |
| (4) | Overcollateralization cushion represents the amount by which the collateral held by the CDO issuer exceeds the maximum amount required. |
At February 28, 2011,29, 2012, after paying the 20102011 fourth quarter dividend, our liquidity of $215.0$158.3 million consists of two primary sources:
| | ● | unrestricted cash and cash equivalents of $9.4$44.7 million, and restricted cash of $2.5$1.0 million in margin call accounts;accounts and $2.9 million in the form of real estate escrows, reserves and deposits; and |
| | ● | capital available for reinvestment in our five CDO entities of $203.1$109.7 million, of which $0.9$1.6 million is designated to finance future funding commitments on CRE loans. |
In addition, we have availability through two CRE term facilities to finance the purchase of highly-rated CMBS securities and originate commercial real estate loans of $38.6 million and $150.0 million, respectively.
Our leverage ratio may vary as a result of the various funding strategies we use. As of December 31, 20102011 and 2009,2010, our leverage ratio was 4.44.2 times and 6.74.4 times, respectively. The decrease in leverage ratio was primarily due to the offering proceeds received during our May 2010March 2011 offering, DRIP issuances and the repurchase of our CDO debt at substantial discounts during the year ended December 31, 2010.2011 and was offset by our Wells Fargo CMBS repurchase facility and closing of our newest CLO, Apidos CLO VIII.
Contractual Obligations and Commitments
The table below summarizes our contractual obligations as of December 31, 2010. The table below excludes contractual commitments related to our derivatives, which we discuss in Item 7A − “Quantitative and Qualitative Disclosures about Market Risk,” because those contracts do not have fixed and determinable payments.| | | Contractual Commitments (dollars in thousands) | |
| | | | |
| | | | | | | | | | | | | | | | |
CDOs (1) | | $ | 1,668,049 | | | $ | − | | | $ | − | | | $ | − | | | $ | 1,668,049 | |
Repurchase Agreements (2) | | | 55,406 | | | | 55,406 | | | | − | | | | − | | | | − | |
Unsecured junior subordinated debentures (3) | | | 50,631 | | | | − | | | | − | | | | − | | | | 50,631 | |
Revolving Credit Facility | | | − | | | | − | | | | − | | | | − | | | | − | |
Base management fees (4) | | | 7,496 | | | | 7,496 | | | | − | | | | − | | | | − | |
Total | | $ | 1,781,582 | | | $ | 62,902 | | | $ | − | | | $ | − | | | $ | 1,718,680 | |
| | | Contractual Commitments (dollars in thousands) | |
| | | | |
| | | | | | | | | | | | | | | | |
CDOs | | $ | 1,397,880 | | | $ | − | | | $ | − | | | $ | − | | | $ | 1,397,880 | (1) |
Equipment contract backed notes, Series 2010-2 | | | 95,016 | | | | − | | | | − | | | | − | | | | 95,016 | (2) |
Unsecured junior subordinated debentures | | | 51,548 | | | | − | | | | − | | | | − | | | | 51,548 | (3) |
Base management fees (4) | | | 6,258 | | | | 6,258 | | | | − | | | | − | | | | − | |
Total | | $ | 1,550,702 | | | $ | 6,258 | | | $ | − | | | $ | − | | | $ | 1,544,444 | |
| (1) | Contractual commitment doescommitments do not include $28.9$10.5 million, $39.2$13.9 million, $32.2$11.0 million, $38.3$61.1 million, $14.7 million and $69.0$25.5 million of interest expense payable through the non-call dates of July 2010, May 2011, JuneSeptember 2011, October 2013, August 2011 and JuneSeptember 2012, respectively, on Apidos CDO I, Apidos Cinco CDO, Apidos CDO III, Apidos CLO VIII, RREF CDO 2006-1 and RREF CDO 2007-1. The non-call date represents the earliest period under which the CDO assets can be sold, resulting in repayment of the CDO notes. |
| (2) | Contractual commitments do not include $34.9 million$48,000 of interest expense payable through the maturity date of May 2016January 18, 2012 on our equipment-backed securitized notes.repurchase agreements. |
| (3) | Contractual commitment doescommitments do not include $57.9$49.2 million and $59.0$50.2 million of interest expense payable through the maturity dates of JuneSeptember 2036 and October 2036, respectively, on our trust preferred securities. |
| (4) | Calculated only for the next 12 months based on our current equity, as defined in our management agreement. Our management agreement also provides for an incentive fee arrangement that is based on operating performance. Because the incentive fee is not a fixed and determinable amount, it is not included in this table. |
At December 31, 2010,2011, we had 1018 interest rate swap contracts with a notional value of $166.8$167.9 million. These contracts are fixed-for-floating interest rate swap agreements under which we contracted to pay a fixed rate of interest for the term of the hedge and will receive a floating rate of interest. See “– Financial Condition – Hedging Instruments.” As of December 31, 2010,2011, the average fixed pay rate of our interest rate hedges was 5.17%4.87% and our receive rate was one-month LIBOR, or 0.26%0.29%. In addition, we also had an interest rate cap agreement with a notional amount of $14.8 million outstanding which reduced our exposure to variability in future cash flows attributable to LIBOR.
Off-Balance Sheet Arrangements
As of December 31, 2010,2011, we did not maintain any relationships with unconsolidated entities or financial partnerships, such as entities often referred to as structured finance, special purpose or variable interest entities, established for the purpose of facilitating off-balance sheet arrangements or contractually narrow or limited purposes. Further, as of December 31, 2010,2011, we had not guaranteed any obligations of unconsolidated entities or entered into any commitment or letter of intent to provide additional funding to any such entities.
We have certain unfunded commitments related to our commercial real estate loan portfolio that we may be required to fund in the future. Our unfunded commitments generally fall into two categories: (1) pre-approved capital improvement projects; and (2) new or additional construction costs subject, in each case, to the borrower meeting specified criteria. Upon completion of the improvements or construction, we would receive additional loan interest income on the advanced amount. As of December 31, 2010,2011, we had five loans with unfunded commitments totaling $5.0$5.2 million, of which $1.3$1.6 million will be funded by restricted cash in RREF CDO 2007-1.
On November 16, 2011, we together with LEAF Financial and LCC, subsidiaries of Resource America, entered into a stock purchase agreement and related agreements (collectively the “SPA”) with Eos Partners, L.P., a private investment firm, and its affiliates (“Eos”). In accordance with the SPA, we and Resource America have undertaken a contingent obligation with respect to the value of the equity on the balance sheet of LEAF Receivables Funding 3, a wholly-owned subsidiary of LCC which owns equipment, equipment leases and notes, see Note 19 “Related-Party Transactions” in the notes to consolidated financial statements.
Critical Accounting Policies and Estimates
Our consolidated financial statements are prepared by management in accordance with GAAP. The preparation of financial statements in conformity with GAAP requires that we make estimates and assumptions that may affect the value of our assets or liabilities and our financial results. We believe that certain of our policies are critical because they require us to make difficult, subjective and complex judgments about matters that are inherently uncertain. The critical policies summarized below relate to valuation of investment securities, accounting for derivative financial instruments and hedging activities, income taxes, allowance for loan and lease losses and variable interest entities. We have reviewed these accounting policies with our board of directors and believe that all of the decisions and assessments upon which our financial statements are based were reasonable at the time made based upon information available to us at the time. We rely on the Manager’s experience and analysis of historical and current market data in order to arrive at what we believe to be reasonable estimates.
Valuation of Investment Securities
We classify our investment portfolio as either tradingavailable-for-sale investments, available-for-saletrading investments or held-to-maturity investments. Although we generally plan to hold most of our investments to maturity, we may, from time to time, sell any of our investments due to changes in market conditions or in accordance with our investment strategy. For a discussion of the basis of fair value analysis, and of the determination of whether an asset’s valuation should be characterized as Level 1, Level 2 or Level 3, see Note 17,21, “Fair Value of Financial Instruments” in the notes to consolidated financial statements.
We report securities available-for-sale at fair value, with unrealized gains and losses reported as a component of accumulated other comprehensive income (loss) in stockholders’ equity. As of December 31, 20102011 and 2009,2010, we had aggregate unrealized losses on our available-for-sale securities of $19.3$32.0 million and $47.6$19.3 million, respectively, which, if not recovered, may result in the recognition of future losses. To determine fair value, we use two methods, either a dealer quote or an internal valuation model, depending upon when the position was purchased and the current level of market activity.
For investment securities purchased in 2009 and thereafter,with higher levels of market activity, we obtain a quote from a dealer, which typically will be the dealer who sold us the security. We have been advised that, in formulating their quotes, dealers may use recent trades in the particular security, if any, market activity in similar securities, if any, or internal valuation models. These quotes are non-binding. As a result ofDependent upon how the dealers develop their quotes, the market illiquidityliquidity and low levels of trading activity, as of December 31, 2009, we categorized all of these investment securities available-for-sale in Level 2 or 3 in the fair value hierarchy. Due to the increased level of trading activity in 2010, we moved some of these securities into Level 2 in the fair value hierarchy. We evaluate the reasonableness of the quotes we receive by applying our own valuation models. If there is a material difference between a quote we receive and the value indicated by our valuation models, we will evaluate the difference. As part of that evaluation, we will discuss the difference with the dealer, who may revise their quote based upon these discussions. Alternatively, we may revise our valuation models.
For investment securities purchased prior to 2009,with lower levels of market activity, we determine fair value based on taking a weighted average of the following three measures:
| | ● | dealer quotes, as described above; |
| | ● | quotes on more actively-traded, higher rated securities issued in a similar time period, adjusted for differences in rating and seniority; and |
| | ● | the value resulting from an internal valuation model using an income approach based upon an appropriate risk-adjusted yield, time value and projected losses using default assumptions based upon an historical analysis of underlying loan performance. |
We are required to determine when an investment is considered impaired (i.e., decline in fair value below its amortized cost), evaluate whether the impairment is other than temporary (i.e., the investment value will not be recovered over its remaining life), and, if the impairment is other than temporary, recognize an impairment loss equal to the difference between the investment’s cost and its fair value.
Our investment securities-trading are reported at fair value. To determine fair value, we use dealer quotes or bids which are testedvalidated by applying an income approach that uses appropriate prepayment, default and recovery rates. We record any changes in fair value in on our results of operations as net realized and unrealized gain on investinvestment securities-trading.
We record investment securities transactions on the trade date. We record purchases of newly issued securities when all significant uncertainties regarding the characteristics of the securities are removed, generally shortly before settlement date. We determine realized gains and losses on investment securities on the specific identification method.
Accounting for Derivative Financial Instruments and Hedging Activities
Our policies permit us to enter into derivative contracts, including interest rate swaps and interest rate caps, as a means of mitigating our interest rate risk on forecasted interest expense associated with the benchmark rate on forecasted rollover/reissuance of repurchase agreements or the interest rate repricing of repurchase agreements, or other similar hedged items, for a specified future time period.
As of December 31, 2010,2011, we had engaged in 1018 interest rate swaps with a notional value of $166.8$167.9 million and a fair value of ($13.3)13.2) million to seek to mitigate our interest rate risk for specified future time periods as defined in the terms of the hedge contracts. As of December 31, 2009,2010, we had engaged in 1310 interest rate swaps with a notional value of $217.9$166.8 million and a fair value of ($12.8)13.3) million to seek to mitigate our interest rate risk for specified future time periods as defined in the terms of the hedge contracts. The contracts we have entered into have been designated as cash flow hedges and are evaluated at inception and on an ongoing basis in order to determine whether they qualify for hedge accounting. The hedge instrument must be highly effective in achieving offsetting changes in the hedged item attributable to the risk being hedged in order to qualify for hedge accounting. A hedge instrument is highly effective if changes in the fair value of the derivative provide an offset to at least 80% and not more than 125% of the changes in fair value or cash flows of the hedged item attributable to the risk being hedged. The interest rate swap contracts are carried on our consolidated balance sheets at fair value. Any ineffectiveness which arises during the hedging relationship must be recognized in interest expense or income during the period in which it arises. Before the end of the specified hedge time period, the effective portion of all contract gain and losses (whether realized or unrealized) is recorded in other comprehensive income or loss.�� Realized gains and losses on the interest rate hedges are reclassified into earnings as an adjustment to interest expense during the period after the swap repricing date through the remaining maturity of the swap. For taxable income purposes, realized gains and losses on interest rate cap and swap contracts are reclassified into earnings over the term of the hedged transactions as designated for tax.
We are not required to account for derivative contracts using hedge accounting as described above. If we decided not to designate the derivative contracts as hedges and to monitor their effectiveness as hedges, or if we entered into other types of financial instruments that did not meet the criteria to be designated as hedges, changes in the fair values of these instruments would be recorded in our statement of operations, potentially resulting in increased volatility in our earnings. We had no interest rate cap agreements at December 31, 2011. We had one non-designated interest rate cap agreement with a fair value of $0 and $45,000 and a notional amount of $14.8 million outstanding at December 31, 2010 and 2009, respectively, which reduced our exposure to variability in future cash flows attributable to LIBOR. We recorded interest expense of $46,000 and $89,000 for the year ended December 31, 2010 and 2009, respectively.
Income Taxes
The objectives of accounting for income taxes are to recognize the amount of taxes payable or refundable for the current year and the future tax consequences of events that have been recognized in our consolidated financial statements or tax returns.
The tax rates we use to determine deferred tax assets or liabilities are the enacted tax rates in effect for the year in which we expect the differences to reverse. We recognize effects of tax rate changes on deferred tax liabilities and deferred tax assets, as well as other changes in income tax laws in net earnings in the period during which such changes are enacted. The future realization of deferred tax assets depends upon the generation of future taxable income during the periods in which those temporary differences become deductible. We continually evaluate our ability to realize the tax benefits associated with deferred tax assets by analyzing forecasted taxable income using both historical and projected future operating results, the reversal of existing temporary differences, taxable income in prior carryback years (if permitted) and the availability of tax planning strategies. We must establish a valuation allowance unless we determine that it is more likely than not that we will ultimately realize the tax benefit associated with a deferred tax asset.
Allowance for Loan and Lease Losses
We maintain an allowance for loan and lease losses. Loans and leases held for investment are first individually evaluated for impairment, and then evaluated as a homogeneous pool as loans with substantially similar characteristics for impairment. We perform the reviews at least quarterly.
We consider an individual loan to be impaired when, based on current information and events, management believes it is probable that we will be unable to collect all amounts due according to the contractual terms of the loan agreement. When a loan is impaired, we increase the allowance for loan losses by the amount of the excess of the amortized cost basis of the loan over its fair value. Fair value may be determined based on the present value of estimated cash flows; on market price, if available; or the fair value of the collateral less estimated disposition costs. When we consider a loan, or a portion thereof, uncollectible and pursuit of the collection is not warranted, we will record a charge-off or write-down of the loan against the allowance for credit losses.
We evaluate the adequacy of the allowance for credit losses on lease receivables based upon, among other factors, management’s historical experience with the lease receivables portfolios it manages, an analysis of contractual delinquencies, economic conditions and trends, industry statistics and equipment finance portfolio characteristics, as adjusted for expected recoveries. In evaluating historic performance of leases, a migration analysis is performed, which estimates the likelihood that an account progresses through delinquency stages to ultimate write-off. We base the allowance for losses upon our previous loss history, economic conditions and trends. Our policy is to charge-off to the allowance those financings for which management believes the collectability is unlikely.
An impaired loan or lease may remain on accrual status during the period in which we are pursuing repayment of the loan or lease; however, we place the loan or lease on non-accrual status at such time as either (i) management believes that scheduled debt service payments will not be met within the coming 12 months; (ii) the loan or lease becomes 90 days delinquent; (iii) management determines the borrower is incapable of, or has ceased efforts toward curing the cause of the impairment; or (iv) the net realizable value of the loan’s underlying collateral approximates our carrying value for the loan. While on non-accrual status, we recognize interest income only when an actual payment is received.
Variable Interest Entities
Under current accounting standards, we mustWe consolidate the assets, liabilities and results of operations of aentities that are variable interest entity,entities, or VIE, into our financial statements ifVIEs where we have a controlling financial interest in it. We consider all counterparties to a transaction to determine whether a counterpartydetermined that we are the primary beneficiary of such entities. Once it is a VIE and, if so, whether our involvement with the entity results indetermined that we hold a variable interest in the entity. We perform analysesa VIE, management performs a qualitative analysis to determine whether(i) if we have the power to direct the matters that most significantly impact the VIE’s financial performance; and (ii) if we have the obligation to absorb the losses of the VIE that could potentially be significant to the VIE or the right to receive the benefits of the VIE that could potentially be significant to the VIE. If our variable interest possesses both of these characteristics, we are deemed to be the primary beneficiary.beneficiary and would be required to consolidate the VIE. This assessment must be done on an ongoing basis. The portions of these entities that we do not own are presented as noncontrolling interests as of the dates and for the periods presented in the consolidated financial statements. As of December 31, 2010,2011, we determined that RREF CDO 2007-1, RREF CDO 2006-1, Apidos CDO I, Apidos CDO III and Apidos Cinco CDO and LEAF Funding 3Apidos CLO VIII were VIEs and that we were the primary beneficiary.
Recent Accounting Pronouncements
In JanuaryJune 2011, the Financial Accounting Standards Board (“FASB”)FASB issued guidance which changes the presentation of comprehensive income. It eliminates the option to present comprehensive income as part of the changes in stockholders’ equity. In addition, it requires consecutive disclosure of comprehensive income either as part of the statement of net income or in a statement immediately following. Finally, the guidance requires disclosure on the face of the financial statements of any reclassifications between net income and other comprehensive income. The guidance is effective for fiscal years and periods within those years beginning after December 15, 2011. In December 2011, the FASB updated the guidance to defer the requirement related to the presentation of certain reclassification adjustments. Adoption will require adjusted disclosure of our comprehensive income.
In April 2011, the FASB issued guidance which revises the criteria for assessing effective control for repurchase agreements and other agreements that both entitle and obligate a transferor to repurchase or redeem financial assets before their maturity. The determination of whether the transfer of a financial asset subject to a repurchase agreement is a sale is based, in part, on whether the entity maintains effective control over the financial asset. The amendments in this guidance will be effective for interim and annual reporting periods beginning on or after December 15, 2011, and will be applied prospectively to transactions or modifications of existing transactions that occur on or after the effective date. Early adoption is not permitted. We are currently evaluating the effect of the adoption on our consolidated financial statements.
In April 2011, the FASB issued guidance to delayclarify the disclosures about troubled debtregarding troubled-debt restructurings originally effective as of December 15, 2010. The new guidance is now anticipated to besurrounding troubled-debt restructuring was effective for interim and annual periods endingbeginning after June 15, 2011. We expect that adoption will requireAdoption of this guidance required additional disclosuredisclosures in the notes to our consolidated financial statements.statements (see Note 12).
In July 2010, the FASB issued guidance that will require companies to provide more information about the credit quality of their financing receivables in the disclosures to financial statements including, but not limited to, significant purchases and sales of financing receivables, aging information and credit quality indicators. The guidance became effective for us as of December 15, 2010. Adoption required additional disclosure (see Note 9).
In February 2010, the FASB issued guidance which removes the requirement to disclose a date through which subsequent events have been evaluated in both issued and revised financial statements. Revised financial statements include financial statements revised as a result of either a correction of error or retrospective application of GAAP. This guidance was effective upon issuance.
In January 2010, the FASB issued guidance that requiresrequired new disclosures and clarifiesclarified some existing disclosure requirements about fair value measurements. The new pronouncement requires a reporting entity: (1) to disclose separately the amounts of significant transfers in and out of Level 1 and Level 2 fair value measurements and describe the reasons for the transfers; and (2) to present separately information about purchases, sales, issuances and settlements in the reconciliation forof fair value measurements using significant unobservable inputs. In addition, it clarifiesclarified the requirements of the following existing disclosures: (1) for purposes of reporting fair value measurement for each class of assets and liabilities, a reporting entity needs to use judgment in determining the appropriate classes of assets and liabilities, and (2) a reporting entity should provide disclosures about the valuation techniques and inputs used to measure fair value for both recurring and nonrecurring fair value measurements. The new guidance was effective for interim and annual reporting periods beginning after December 15, 2009, except for the disclosures about purchases, sales, issuances, and settlements in the rollforward of activity in Level 3 fair value measurements which will bebecame effective for us in fiscal 2011. Adoption2011 and required additional disclosures. The new guidance required enhanced disclosure to delineate such categories in the notes to our consolidated financial statementsfootnotes (see Note 17) with respect to the guidance effective on and after December 15, 2009.21).
In December 2009, the FASB issued guidance for improving financial reporting for enterprises involved with VIEs regarding power to direct the activities of a VIE as well as obligations to absorb the losses. This guidance was effective for interim and annual periods beginning after November 15, 2009. Adoption of this guidance did not have a material impact on our consolidated financial statements.
In June 2009, the FASB issued guidance for consolidation of VIEs which changed the consolidation guidance applicable to a VIE and amended the guidance governing the determination of whether an enterprise is the primary beneficiary of a VIE and, therefore, required to consolidate an entity, by requiring a qualitative analysis rather than a quantitative analysis. This standard also requires continuous reassessment of whether an enterprise is the primary beneficiary of a VIE as well as enhanced disclosures about an enterprise’s involvement with a VIE. This guidance was effective for interim and annual periods beginning after November 15, 2009. Adoption of this guidance did not have a material impact on our consolidated financial statements. We will do a continuous reassessment of our conclusion as stipulated in this statement.
In June 2009, the FASB issued guidance for accounting for transfers of financial assets. The guidance eliminated the concept of a “qualifying special-purpose entity,” changed the requirements for derecognizing financial assets and requires greater transparency of related disclosures. This statement is effective for fiscal years beginning after November 15, 2009. Adoption of this statement did not have a material impact on our consolidated financial statements.
Inflation
Virtually all of our assets and liabilities are interest rate sensitive in nature. As a result, interest rates and other factors influence our performance far more than does inflation. Changes in interest rates do not necessarily correlate with inflation rates or changes in inflation rates. Our financial statements are prepared in accordance with GAAP and our distributions are determined by our board of directors based primarily by our net income as calculated for tax purposes; in each case, our activities and balance sheet are measured with reference to historical cost and/or fair market value without considering inflation.
| ITEM 7A. | | QUANTITATIVE AND QUALITATIVE DISCLOSURES ABOUT MARKET RISK |
As of December 31, 20102011 and 2009,2010, the primary component of our market risk was interest rate risk, as described below. While we do not seek to avoid risk completely, we do seek to assume risk that can be quantified from historical experience, to actively manage that risk, to earn sufficient compensation to justify assuming that risk and to maintain capital levels consistent with the risk we undertake or to which we are exposed.
Effect on Fair Value
A component of interest rate risk is the effect changes in interest rates will have on the market value of our assets. We face the risk that the market value of our assets will increase or decrease at different rates than that of our liabilities, including our hedging instruments.
We primarily assess our interest rate risk by estimating the duration of our assets and the duration of our liabilities. Duration essentially measures the market price volatility of financial instruments as interest rates change. We generally calculate duration using various financial models and empirical data. Different models and methodologies can produce different duration numbers for the same securities.
The following sensitivity analysis tables show, at December 31, 2010,2011, the estimated impact on the fair value of our interest rate-sensitive investments and liabilities of changes in interest rates, assuming rates instantaneously fall 100 basis points and rise 100 basis points (dollars in thousands):
| | | | | | | |
| | | Interest rates fall 100 basis points | | | | | | Interest rates rise 100 basis points | | | Interest rates fall 100 basis points | | | | | | Interest rates rise 100 basis points | |
CMBS – private placement (1): | | | | | | | | | | | | | | | | | | |
Fair value | | $ | 56,491 | | | $ | 54,125 | | | $ | 51,939 | | | $ | 121,534 | | | $ | 119,274 | | | $ | 117,101 | |
Change in fair value | | $ | 2,336 | | | $ | − | | | $ | (2,216 | ) | | $ | 2,260 | | | | | | | $ | (2,173 | ) |
Change as a percent of fair value | | | 4.31 | % | | | − | % | | | 4.09 | % | | | 1.89% | | | | | | | | 1.82% | |
| | | | | | | | | | | | | | | | | | | | | | | | | |
| Hedging instruments: | | | | | | | | | | | | | | | | | | | | | | | | |
Fair value | | $ | (20,622 | ) | | $ | (13,292 | ) | | $ | (6,162 | ) | | $ | (18,851 | ) | | $ | (13,210 | ) | | $ | (6,782 | ) |
Change in fair value | | $ | (7,330 | ) | | $ | − | | | $ | 7,130 | | | $ | (5,641 | ) | | | | | | $ | 6,428 | |
Change as a percent of fair value | | | 55.15 | % | | | − | % | | | 53.64 | % | | | 42.70% | | | | | | | | 48.66% | |
| (1) | Includes the fair value of available-for-sale investments that are sensitive to interest rate change. |
For purposes of the table, we have excluded our investments with variable interest rates that are indexed to LIBOR. Because the variable rates on these instruments are short-term in nature, we are not subject to material exposure to movements in fair value as a result of changes in interest rates.
It is important to note that the impact of changing interest rates on fair value can change significantly when interest rates change beyond 100 basis points from current levels. Therefore, the volatility in the fair value of our assets could increase significantly when interest rates change beyond 100 basis points from current levels. In addition, other factors impact the fair value of our interest rate-sensitive investments and hedging instruments, such as the shape of the yield curve, market expectations as to future interest rate changes and other market conditions. Accordingly, in the event of changes in actual interest rates, the change in the fair value of our assets would likely differ from that shown above and such difference might be material and adverse to our stockholders.
Risk Management
To the extent consistent with maintaining our status as a REIT, we seek to manage our interest rate risk exposure to protect our portfolio of fixed-rate commercial real estate mortgages and CMBS and related debt against the effects of major interest rate changes. We generally seek to manage our interest rate risk by:
| | ● | monitoring and adjusting, if necessary, the reset index and interest rate related to our mortgage-backed securities and our borrowings; |
| | ● | attempting to structure our borrowing agreements for our CMBS to have a range of different maturities, terms, amortizations and interest rate adjustment periods; and |
| | ● | using derivatives, financial futures, swaps, options, caps, floors and forward sales, to adjust the interest rate sensitivity of our fixed-rate commercial real estate mortgages and CMBS and our borrowing which we discuss in “Financial Condition-Hedging Instruments.” |
| ITEM 8. | | FINANCIAL STATEMENTS AND SUPPLEMENTARY DATA |
REPORT OF INDEPENDENT REGISTERED PUBLIC ACCOUNTING FIRM
Board of Directors and Stockholders
Resource Capital Corp.
We have audited the accompanying consolidated balance sheets of Resource Capital Corp. (a Maryland corporation) and its subsidiaries as of December 31, 20102011 and 2009,2010, and the related consolidated statements of operations, changes in stockholders’(collectively Resource Capital Corp. or the Company) equity, and cash flows for each of the three years in the period ended December 31, 2010.2011. Our audits of the basic financial statements included the financial statement schedules listed in the index appearing under item 15 (a) 2. These consolidated financial statements and financial statement schedules are the responsibility of ourthe Company’s management. Our responsibility is to express an opinion on these consolidated financial statements and financial statement schedules based on our audits.
We conducted our audits in accordance with the standards of the Public Company Accounting Oversight Board (United States). Those standards require that we plan and perform the audit to obtain reasonable assurance about whether the financial statements are free of material misstatement. An audit includes examining, on a test basis, evidence supporting the amounts and disclosures in the financial statements. An audit also includes assessing the accounting principles used and significant estimates made by management, as well as evaluating the overall financial statement presentation. We believe that our audits provide a reasonable basis for our opinion.
In our opinion, the consolidated financial statements referred to above present fairly, in all material respects, the consolidated financial position of Resource Capital Corp. and its subsidiaries as of December 31, 20102011 and 2009,2010, and the results of their consolidated operations and their consolidated cash flows for each of the three years in the period ended December 31, 20102011, in conformity with accounting principles generally accepted in the United States of America. Also, in our opinion, the related financial statement schedules, when considered in relation to the basic consolidated financial statements taken as a whole, present fairly, in all material respects, the information set forth therein.
We also have audited, in accordance with the standards of the Public Company Accounting Oversight Board (United States), Resource Capital Corp. and its subsidiaries’’s internal control over financial reporting as of December 31, 2010,2011, based on criteria established in Internal Control—Integrated Framework issued by the Committee of Sponsoring Organizations of the Treadway Commission (COSO) and our report dated March 14, 20112012 expressed an unqualified opinion on internal control over financial reporting.opinion.
/s/ Grant Thornton LLP
Philadelphia, Pennsylvania
March 14, 2011
RESOURCE CAPITAL CORP. AND SUBSIDIARIES
CONSOLIDATED BALANCE SHEETS
(in thousands, except share and per share data)2012
| | | | |
| | | | | | | |
| ASSETS | | | | | | |
Cash and cash equivalents | | $ | 29,488 | | | $ | 51,991 | |
Restricted cash | | | 168,192 | | | | 85,125 | |
Investment securities-trading | | | 17,723 | | | | − | |
Investment securities available-for-sale, pledged as collateral, at fair value | | | 57,998 | | | | 39,304 | |
Investment securities available-for-sale, at fair value | | | 5,962 | | | | 5,238 | |
Investment securities held-to-maturity, pledged as collateral | | | 29,036 | | | | 31,401 | |
Property available-for-sale | | | 4,444 | | | | − | |
Loans, pledged as collateral and net of allowances of $34.2 million and $47.1 million | | | 1,443,271 | | | | 1,557,757 | |
Loans held for sale | | | 28,593 | | | | 8,050 | |
Lease receivables, pledged as collateral, net of allowances of $70,000 and $1.1 million and net of unearned income | | | 109,612 | | | | 927 | |
Loans receivable–related party | | | 9,927 | | | | − | |
Investments in unconsolidated entities | | | 6,791 | | | | 3,605 | |
Dividend reinvestment plan proceeds receivable | | | 10,000 | | | | − | |
Interest receivable | | | 6,330 | | | | 5,754 | |
Deferred tax asset | | | 4,401 | | | | − | |
Other assets | | | 2,432 | | | | 2,252 | |
Total assets | | $ | 1,934,200 | | | $ | 1,791,404 | |
| LIABILITIES | | | | | | | | |
Borrowings | | $ | 1,543,251 | | | $ | 1,534,874 | |
Distribution payable | | | 14,555 | | | | 9,170 | |
Accrued interest expense | | | 1,618 | | | | 1,516 | |
Derivatives, at fair value | | | 13,292 | | | | 12,767 | |
Deferred tax liability | | | 9,798 | | | | − | |
Accounts payable and other liabilities | | | 3,360 | | | | 4,247 | |
Total liabilities | | | 1,585,874 | | | | 1,562,574 | |
| STOCKHOLDERS’ EQUITY | | | | | | | | |
Preferred stock, par value $0.001: 100,000,000 shares authorized; no shares issued and outstanding | | | − | | | | − | |
Common stock, par value $0.001: 500,000,000 shares authorized; 58,183,425 and 36,545,737 shares issues and outstanding (including 534,957 and 437,319 unvested restricted shares) | | | 58 | | | | 36 | |
Additional paid-in capital | | | 528,373 | | | | 405,517 | |
Accumulated other comprehensive loss | | | (33,918 | ) | | | (62,154 | ) |
Distributions in excess of earnings | | | (146,187 | ) | | | (114,569 | ) |
Total stockholders’ equity | | | 348,326 | | | | 228,830 | |
TOTAL LIABILITIES AND STOCKHOLDERS’ EQUITY | | $ | 1,934,200 | | | $ | 1,791,404 | |
The accompanying notes are an integral part of these statements
RESOURCE CAPITAL CORP. AND SUBSIDIARIES
CONSOLIDATED STATEMENTS OF OPERATIONS
(in thousands, except share and per share data)
| | | | |
| | | | | | | | | | |
| REVENUES | | | | | | | | | |
Interest income: | | | | | | | | | |
Loans | | $ | 76,836 | | | $ | 84,563 | | | $ | 117,108 | |
Securities | | | 11,434 | | | | 7,225 | | | | 6,378 | |
Leases | | | 11,306 | | | | 4,336 | | | | 8,180 | |
Interest income – other | | | 4,335 | | | | 1,469 | | | | 2,675 | |
Total interest income | | | 103,911 | | | | 97,593 | | | | 134,341 | |
Interest expense | | | 36,466 | | | | 45,427 | | | | 79,619 | |
Net interest income | | | 67,445 | | | | 52,166 | | | | 54,722 | |
| | | | | | | | | | | | | |
| OPERATING EXPENSES | | | | | | | | | | | | |
Management fees − related party | | | 13,216 | | | | 8,363 | | | | 6,301 | |
Equity compensation – related party | | | 2,221 | | | | 1,240 | | | | 540 | |
Professional services | | | 3,627 | | | | 3,866 | | | | 3,349 | |
Insurance | | | 759 | | | | 828 | | | | 641 | |
Depreciation on operating leases | | | 4,003 | | | | − | | | | − | |
General and administrative | | | 3,061 | | | | 1,764 | | | | 1,848 | |
Income tax expense (benefit) | | | 5,721 | | | | (2 | ) | | | (241 | ) |
Total expenses | | | 32,608 | | | | 16,059 | | | | 12,438 | |
| | | | | | | | | | | | | |
| | | | 34,837 | | | | 36,107 | | | | 42,284 | |
| | | | | | | | | | | | | |
| OTHER (EXPENSE) REVENUE | | | | | | | | | | | | |
Impairment losses on investment securities | | | (29,042 | ) | | | (27,490 | ) | | | (26,611 | ) |
Recognized in other comprehensive loss | | | (2,238 | ) | | | (14,019 | ) | | | (26,611 | ) |
Net impairment losses recognized in earnings | | | (26,804 | ) | | | (13,471 | ) | | | − | |
| | | | | | | | | | | | | |
Net realized gain (loss) on investment securities available-for-sale and loans | | | 4,821 | | | | 1,890 | | | | (1,637 | ) |
Net realized gain on investment securities-trading | | | 5,052 | | | | − | | | | − | |
Net unrealized gain on investment securities-trading | | | 9,739 | | | | − | | | | − | |
Provision for loan and lease losses | | | (43,321 | ) | | | (61,383 | ) | | | (46,160 | ) |
Gain on the extinguishment of debt | | | 34,610 | | | | 44,546 | | | | 1,750 | |
Gain on the settlement of loan | | | − | | | | − | | | | 574 | |
Other income (expense) | | | 513 | | | | (1,350 | ) | | | 115 | |
Total other expense | | | (15,390 | ) | | | (29,768 | ) | | | (45,358 | ) |
| | | | | | | | | | | | | |
NET INCOME (LOSS) | | $ | 19,447 | | | $ | 6,339 | | | $ | (3,074 | ) |
| | | | | | | | | | | | | |
NET INCOME (LOSS) PER SHARE – BASIC | | $ | 0.41 | | | $ | 0.25 | | | $ | (0.12 | ) |
| | | | | | | | | | | | | |
| NET INCOME (LOSS) PER SHARE – DILUTED | | $ | 0.41 | | | $ | 0.25 | | | $ | (0.12 | ) |
| | | | | | | | | | | | | |
WEIGHTED AVERAGE NUMBER OF SHARES OUTSTANDING – BASIC | | | 47,715,082 | | | | 25,205,403 | | | | 24,757,386 | |
| | | | | | | | | | | | | |
WEIGHTED AVERAGE NUMBER OF SHARES OUTSTANDING – DILUTED | | | 47,907,281 | | | | 25,355,821 | | | | 24,757,386 | |
| | | | | | | | | | | | | |
DIVIDENDS DECLARED PER SHARE | | $ | 1.00 | | | $ | 1.15 | | | $ | 1.60 | |
The accompanying notes are an integral part of these statements
RESOURCE CAPITAL CORP. AND SUBSIDIARIES
CONSOLIDATED STATEMENTS OF CHANGES IN STOCKHOLDERS’ EQUITY
Years Ended December 31, 2010, 2009 and 2008
(in thousands, except share and per share data)
| | | | | | | | Additional Paid-In Capital | | Accumulated Other Comprehensive Loss | | | | Distributions in Excess of Earnings | | | | | Total Stockholders’ Equity | | | Comprehensive (Loss)/Income | |
Balance, January 1, 2008 | | | 25,103,532 | | | $ | 25 | | $ | 357,976 | | $ | (38,323 | ) | $ | −− | | $ | (45,301 | ) | $ | (2,771 | ) | | $ | 271,606 | | | | |
Net proceeds from dividend reinvestment and stock purchase plan | | | 10,831 | | | | − | | | 40 | | | − | | | − | | | − | | | − | | | | 40 | | | | − | |
Offering costs | | | − | | | | − | | | (22 | ) | | − | | | − | | | − | | | − | | | | (22 | ) | | | − | |
Retirement of treasury shares | | | − | | | | − | | | (2,771 | ) | | − | | | − | | | − | | | 2,771 | | | | − | | | | − | |
Stock based compensation | | | 234,871 | | | | 1 | | | 340 | | | − | | | − | | | − | | | − | | | | 341 | | | | − | |
Amortization of stock based compensation | | | − | | | | − | | | 540 | | | − | | | − | | | − | | | − | | | | 540 | | | | − | |
Forfeiture of unvested stock | | | (4,367 | ) | | | − | | | − | | | − | | | − | | | − | | | − | | | | − | | | | | |
Net income | | | − | | | | − | | | − | | | − | | | (3,074 | ) | | − | | | − | | | | (3,074 | ) | | | (3,074 | ) |
Available-for-sale securities, fair value adjustment | | | − | | | | − | | | − | | | (24,288 | ) | | − | | | − | | | − | | | | (24,288 | ) | | | (24,288 | ) |
Designated derivatives, fair value adjustment | | | − | | | | − | | | − | | | (18,096 | ) | | − | | | − | | | − | | | | (18,096 | ) | | | (18,096 | ) |
Distributions on common stock | | | − | | | | − | | | − | | | − | | | 3,074 | | | (43,816 | ) | | − | | | | (40,742 | ) | | | | |
Comprehensive loss | | | − | | | | − | | | − | | | − | | | − | | | − | | | − | | | | − | | | $ | (45,458 | ) |
Balance, December 31, 2008 | | | 25,344,867 | | | | 26 | | | 356,103 | | | (80,707 | ) | | − | | | (89,117 | ) | | − | | | | 186,305 | | | | | |
Proceeds from common stock offering | | | 10,294,455 | | | | 10 | | | 46,316 | | | − | | | − | | | − | | | − | | | | 46,326 | | | | − | |
Proceeds from dividend reinvestment and stock purchase plan | | | 1,895,043 | | | | 1 | | | 8,994 | | | − | | | − | | | − | | | − | | | | 8,995 | | | | − | |
Offering costs | | | − | | | | − | | | (2,964 | ) | | − | | | − | | | − | | | − | | | | (2,964 | ) | | | − | |
Repurchase and retirement of treasury shares | | | (1,400,000 | ) | | | (1 | | | (5,039 | ) | | − | | | − | | | − | | | | | | | (5,040 | ) | | | − | |
Stock based compensation | | | 419,563 | | | | | | | 867 | | | − | | | − | | | − | | | − | | | | 867 | | | | − | |
Amortization of stock based compensation | | | − | | | | − | | | 1,240 | | | − | | | − | | | − | | | − | | | | 1,240 | | | | − | |
Forfeiture of unvested stock | | | (8,191 | ) | | | − | | | − | | | − | | | − | | | − | | | − | | | | − | | | | − | |
Net income | | | − | | | | − | | | − | | | − | | | 6,339 | | | − | | | − | | | | 6,339 | | | | 6,339 | |
Securities available-for-sale, fair value adjustment, net | | | − | | | | − | | | − | | | (729 | ) | | − | | | − | | | − | | | | (729 | ) | | | (729 | ) |
Designated derivatives, fair value adjustment | | | − | | | | − | | | − | | | 19,282 | | | − | | | − | | | − | | | | 19,282 | | | | 19,282 | |
Distributions on common stock | | | − | | | | − | | | − | | | − | | | (6,339 | ) | | (25,452 | ) | | − | | | | (31,791 | ) | | | | |
| Comprehensive income | | | − | | | | − | | | − | | | − | | | − | | | − | | | − | | | | − | | | $ | 24,892 | |
Balance, December 31, 2009 | | | 36,545,737 | | | $ | 36 | | $ | 405,517 | | $ | (62,154 | ) | $ | − | | $ | (114,569 | ) | $ | − | | | $ | 228,830 | | | | | |
Proceeds from dividend reinvestment and stock purchase plan | | | 12,422,956 | | | | 12 | | | 76,797 | | | − | | | − | | | − | | | − | | | | 76,809 | | | | − | |
Proceeds from common stock offering | | | 8,625,000 | | | | 9 | | | 45,273 | | | − | | | − | | | − | | | − | | | | 45,282 | | | | − | |
Offering costs | | | − | | | | − | | | (2,875 | ) | | − | | | − | | | − | | | − | | | | (2,875 | ) | | | − | |
Stock based compensation | | | 589,732 | | | | 1 | | | 1,440 | | | − | | | − | | | − | | | − | | | | 1,441 | | | | − | |
Amortization of stock based compensation | | | − | | | | − | | | 2,221 | | | − | | | − | | | − | | | − | | | | 2,221 | | | | − | |
Net income | | | − | | | | − | | | − | | | − | | | 19,447 | | | − | | | − | | | | 19,447 | | | | 19,447 | |
Securities available-for-sale, fair value adjustment, net | | | − | | | | − | | | − | | | 28,329 | | | − | | | − | | | − | | | | 28,329 | | | | 28,329 | |
Designated derivatives, fair value adjustment | | | − | | | | − | | | − | | | (93 | ) | | − | | | − | | | − | | | | (93 | ) | | | (93 | ) |
Distributions on common stock | | | − | | | | − | | | − | | | − | | | (19,447 | ) | | (31,618 | ) | | − | | | | (51,065 | ) | | | | |
| Comprehensive income | | | − | | | | − | | | − | | | − | | | − | | | − | | | − | | | | − | | | $ | 47,683 | |
Balance, December 31, 2010 | | | 58,183,425 | | | $ | 58 | | $ | 528,373 | | $ | (33,918 | ) | $ | − | | $ | (146,187 | ) | $ | − | | | $ | 348,326 | | | | | |
The accompanying notes are an integral part of this statement
RESOURCE CAPITAL CORP. AND SUBSIDIARIES
CONSOLIDATED STATEMENTS OF CASH FLOWS
(in thousands)
| | | Years Ended | |
| | | | |
| | | | | | | | | | |
| CASH FLOWS FROM OPERATING ACTIVITIES: | | | | | | | | | |
Net income (loss) | | $ | 19,447 | | | $ | 6,339 | | | $ | (3,074 | ) |
Adjustments to reconcile net income to net cash provided by operating activities: | | | | | | | | | | | | |
Provision for loan and lease losses | | | 43,321 | | | | 61,383 | | | | 46,160 | |
Depreciation and amortization of term facilities | | | 875 | | | | 1,355 | | | | 1,019 | |
Depreciation on operating leases | | | 4,003 | | | | − | | | | − | |
Accretion of net discounts on investments | | | (18,672 | ) | | | (8,719 | ) | | | (1,478 | ) |
Amortization of discount on notes of CDOs | | | 1,963 | | | | 1,032 | | | | 173 | |
Amortization of debt issuance costs on notes of CDOs | | | 4,226 | | | | 4,058 | | | | 3,129 | |
Amortization of stock-based compensation | | | 2,221 | | | | 1,240 | | | | 540 | |
Amortization of terminated derivative instruments | | | 387 | | | | 499 | | | | 205 | |
Deferred income tax benefits | | | 5,397 | | | | − | | | | − | |
Non-cash incentive compensation to the Manager | | | 1,098 | | | | 1,143 | | | | 440 | |
Purchase of securities, trading | | | (16,317 | ) | | | − | | | | − | |
Principal payments on securities, trading | | | 37 | | | | − | | | | − | |
Proceeds from sales of securities, trading | | | 13,357 | | | | − | | | | − | |
Net unrealized gain on investment securities-trading | | | (9,739 | ) | | | − | | | | − | |
Unrealized losses on non-designated derivative instruments | | | 46 | | | | 95 | | | | − | |
Net realized (gains) and losses on investments | | | (4,821 | ) | | | (1,890 | ) | | | 1,637 | |
Net impairment losses recognized in earnings | | | 26,804 | | | | 13,471 | | | | − | |
Gain on the extinguishment of debt | | | (34,610 | ) | | | (44,546 | ) | | | (1,750 | ) |
| Gain on the settlement of loan | | | − | | | | − | | | | (574 | ) |
Net realized gain on investments trading | | | (5,052 | ) | | | − | | | | − | |
Changes in operating assets and liabilities: | | | | | | | | | | | | |
(Increase) decrease in restricted cash | | | (6,543 | ) | | | 10,596 | | | | 4,113 | |
(Increase) decrease in interest receivable, net of purchased interest | | | (701 | ) | | | 2,697 | | | | 3,526 | |
Decrease in accounts receivable | | | − | | | | 424 | | | | 574 | |
Decrease in principal paydowns receivable | | | 616 | | | | − | | | | − | |
Increase in management fee payable | | | 25 | | | | 474 | | | | 221 | |
(Decrease) increase in security deposits | | | (264 | ) | | | (791 | ) | | | 353 | |
Increase (decrease) in accounts payable and accrued liabilities | | | 104 | | | | 2,714 | | | | (962 | ) |
Increase (decrease) in accrued interest expense | | | 181 | | | | (3,168 | ) | | | (2,729 | ) |
Increase in other assets | | | (6,855 | ) | | | (1,784 | ) | | | (573 | ) |
Net cash provided by operating activities | | | 20,534 | | | | 46,622 | | | | 50,950 | |
| CASH FLOWS FROM INVESTING ACTIVITIES: | | | | | | | | | | | | |
(Increase) decrease in restricted cash | | | (76,524 | ) | | | (35,327 | ) | | | 54,976 | |
Purchase of securities available-for-sale | | | (28,697 | ) | | | (28,958 | ) | | | − | |
Principal payments on securities available-for-sale | | | 1,240 | | | | 21 | | | | 2,359 | |
Proceeds from sale of securities available-for-sale | | | 19,144 | | | | 1,909 | | | | 8,000 | |
Investment in unconsolidated entity | | | (3,186 | ) | | | (2,066 | ) | | | − | |
Equity contribution to VIE | | | (7,333 | ) | | | − | | | | − | |
Purchase of loans | | | (340,355 | ) | | | (243,786 | ) | | | (186,759 | ) |
Principal payments received on loans | | | 316,400 | | | | 177,589 | | | | 161,653 | |
Proceeds from sale of loans | | | 94,419 | | | | 130,078 | | | | 34,853 | |
Purchase of lease receivables | | | (28,161 | ) | | | | | | | (42,490 | ) |
Payments received on lease receivables | | | 13,985 | | | | 8,655 | | | | 27,823 | |
Proceeds from sale of lease receivables | | | 1,579 | | | | 2,125 | | | | 5,034 | |
Investment in loans – related parties | | | (10,000 | ) | | | − | | | | − | |
Payments received on loans – related parties | | | 73 | | | | − | | | | − | |
Distribution from unconsolidated entities | | | − | | | | − | | | | 257 | |
Proceeds from sale of interest in subsidiary | | | − | | | | 7,545 | | | | − | |
Net cash (used in) provided by investing activities | | | (47,416 | ) | | | 17,785 | | | | 65,706 | |
RESOURCE CAPITAL CORP. AND SUBSIDIARIES
CONSOLIDATED STATEMENTS OF CASH FLOWS − (Continued)
(in thousands)
| | | Years Ended | |
| | | December 31, | |
| | | | | | | | | | |
| CASH FLOWS FROM FINANCING ACTIVITIES: | | | | | | | | | |
Net proceeds from issuances of common stock (net of offering costs of $2,772, $2,964 and $0) | | | 42,510 | | | | 43,362 | | | | − | |
Net proceeds from dividend reinvestment and stock purchase plan (net of offering costs of $103, $0 and $22) | | | 76,706 | | | | 8,995 | | | | 18 | |
Repurchase of common stock | | | − | | | | (5,040 | ) | | | − | |
Proceeds from borrowings: | | | | | | | | | | | | |
Repurchase agreements | | | − | | | | 18 | | | | 239 | |
Collateralized debt obligations | | | − | | | | − | | | | 35,912 | |
Secured term facility | | | 6,500 | | | | − | | | | 26,342 | |
Payments on borrowings: | | | | | | | | | | | | |
Repurchase agreements | | | − | | | | (17,108 | ) | | | (99,319 | ) |
Secured term facility | | | (369 | ) | | | (13,395 | ) | | | (22,367 | ) |
Retirement of debt | | | (56,740 | ) | | | − | | | | − | |
Equipment-backed securities notes | | | (18,046 | ) | | | − | | | | − | |
Repurchase of issued bonds | | | − | | | | (10,974 | ) | | | (3,250 | ) |
Settlement of derivative instruments | | | − | | | | − | | | | (4,178 | ) |
Payment of debt issuance costs | | | (502 | ) | | | (293 | ) | | | (333 | ) |
Distributions paid on common stock | | | (45,680 | ) | | | (32,564 | ) | | | (41,166 | ) |
Net cash provided by (used in) financing activities | | | 4,379 | | | | (26,999 | ) | | | (108,102 | ) |
NET (DECREASE) INCREASE IN CASH AND CASH EQUIVALENTS | | | (22,503 | ) | | | 37,408 | | | | 8,554 | |
CASH AND CASH EQUIVALENTS AT BEGINNING OF PERIOD | | | 51,991 | | | | 14,583 | | | | 6,029 | |
CASH AND CASH EQUIVALENTS AT END OF PERIOD | | $ | 29,488 | | | $ | 51,991 | | | $ | 14,583 | |
| | | | | | | | | | | | | |
| NON-CASH INVESTING AND FINANCING ACTIVITIES: | | | | | | | | | | | | |
Distributions on common stock declared but not paid | | $ | 14,555 | | | $ | 9,170 | | | $ | 9,942 | |
Issuance of restricted stock | | $ | 338 | | | $ | 242 | | | $ | 1,435 | |
Transfer of lease receivables | | $ | − | | | $ | 89,763 | | | $ | − | |
Transfer of secured term facility | | $ | − | | | $ | (82,319 | ) | | $ | − | |
Assumption of equipment-backed securitized notes | | $ | 112,223 | | | $ | − | | | $ | − | |
Acquisition of lease receivables | | $ | (100,305 | ) | | $ | − | | | $ | − | |
Settlement of a secured term facility | | $ | (6,131 | ) | | $ | − | | | $ | − | |
Settlement of debt issuance costs | | $ | (1,012 | ) | | $ | − | | | $ | − | |
Increase in bank loan investments | | $ | − | | | $ | 1,148 | | | $ | − | |
Decrease in bank loan investments | | $ | − | | | $ | (1,148 | ) | | $ | − | |
Property received on foreclosure of a real estate loan: | | | | | | | | | | | | |
Loans, pledged as collateral | | $ | (4,444 | ) | | $ | | | | $ | − | |
Property available-for-sale | | $ | 4,444 | | | $ | | | | $ | − | |
| SUPPLEMENTAL DISCLOSURE: | | | | | | | | | | | | |
Interest expense paid in cash | | $ | 37,911 | | | $ | 48,138 | | | $ | 94,879 | |
Income taxes paid in cash | | $ | − | | | $ | − | | | $ | 627 | |
The accompanying notes are an integral part of these statements
RESOURCE CAPITAL CORP. AND SUBSIDIARIES
(in thousands, except share and per share data)
| | | | |
| | | | | | | |
| ASSETS | | | | | | |
Cash and cash equivalents | | $ | 43,116 | | | $ | 29,488 | |
Restricted cash | | | 142,806 | | | | 168,192 | |
Investment securities, trading | | | 38,673 | | | | 17,723 | |
Investment securities available-for-sale, pledged as collateral, at fair value | | | 153,366 | | | | 57,998 | |
Investment securities available-for-sale, at fair value | | | 4,678 | | | | 5,962 | |
Investment securities held-to-maturity, pledged as collateral | | | − | | | | 29,036 | |
Property available-for-sale | | | 2,980 | | | | 4,444 | |
Investment in real estate | | | 48,027 | | | | − | |
Loans, pledged as collateral and net of allowances of $27.5 million and $34.2 million | | | 1,772,063 | | | | 1,443,271 | |
Loans held for sale | | | 3,154 | | | | 28,593 | |
Lease receivables, pledged as collateral, net of allowances of $0 and $70,000 and net of unearned income | | | − | | | | 109,612 | |
Loans receivable–related party | | | 9,497 | | | | 9,927 | |
Investments in unconsolidated entities | | | 47,899 | | | | 6,791 | |
Dividend reinvestment plan proceeds receivable | | | − | | | | 10,000 | |
Interest receivable | | | 8,836 | | | | 6,330 | |
Deferred tax asset | | | 626 | | | | 4,401 | |
Intangible assets | | | 19,813 | | | | − | |
Other assets | | | 4,093 | | | | 2,432 | |
Total assets | | $ | 2,299,627 | | | $ | 1,934,200 | |
| LIABILITIES | | | | | | | | |
Borrowings | | $ | 1,808,986 | | | $ | 1,543,251 | |
Distribution payable | | | 19,979 | | | | 14,555 | |
Accrued interest expense | | | 3,260 | | | | 1,618 | |
Derivatives, at fair value | | | 13,210 | | | | 13,292 | |
Accrued tax liability | | | 12,567 | | | | 30 | |
Deferred tax liability | | | 5,624 | | | | 9,798 | |
Accounts payable and other liabilities | | | 6,311 | | | | 3,330 | |
Total liabilities | | | 1,869,937 | | | | 1,585,874 | |
| STOCKHOLDERS’ EQUITY | | | | | | | | |
Preferred stock, par value $0.001: 100,000,000 shares authorized; no shares issued and outstanding | | | − | | | | − | |
Common stock, par value $0.001: 500,000,000 shares authorized; 79,877,516 and 58,183,425 shares issued and outstanding (including 1,428,931 and 534,957 unvested restricted shares) | | | 80 | | | | 58 | |
Additional paid-in capital | | | 659,700 | | | | 528,373 | |
Accumulated other comprehensive loss | | | (46,327 | ) | | | (33,918 | ) |
Distributions in excess of earnings | | | (183,763 | ) | | | (146,187 | ) |
Total stockholders’ equity | | | 429,690 | | | | 348,326 | |
TOTAL LIABILITIES AND STOCKHOLDERS’ EQUITY | | $ | 2,299,627 | | | $ | 1,934,200 | |
The accompanying notes are an integral part of these statements
RESOURCE CAPITAL CORP. AND SUBSIDIARIES
(in thousands, except share and per share data)
| | | | |
| | | | | | | | | | |
| REVENUES | | | | | | | | | |
Interest income: | | | | | | | | | |
Loans | | $ | 86,739 | | | $ | 77,694 | | | $ | 85,857 | |
Securities | | | 12,744 | | | | 11,434 | | | | 7,225 | |
Leases | | | − | | | | 11,306 | | | | 4,336 | |
Interest income – other | | | 10,711 | | | | 3,477 | | | | 175 | |
Total interest income | | | 110,194 | | | | 103,911 | | | | 97,593 | |
Interest expense | | | 30,431 | | | | 36,466 | | | | 45,427 | |
Net interest income | | | 79,763 | | | | 67,445 | | | | 52,166 | |
Rental income | | | 3,656 | | | | − | | | | − | |
Dividend income | | | 2,955 | | | | − | | | | − | |
Fee income | | | 7,789 | | | | − | | | | − | |
Total revenues | | | 94,163 | | | | 67,445 | | | | 52,166 | |
| | | | | | | | | | | | | |
| OPERATING EXPENSES | | | | | | | | | | | | |
Management fees − related party | | | 11,022 | | | | 13,216 | | | | 8,363 | |
Equity compensation – related party | | | 2,526 | | | | 2,221 | | | | 1,240 | |
Professional services | | | 3,791 | | | | 3,627 | | | | 3,866 | |
Insurance | | | 658 | | | | 759 | | | | 828 | |
Rental operating expense | | | 2,743 | | | | 46 | | | | − | |
General and administrative | | | 3,950 | | | | 3,015 | | | | 1,764 | |
Depreciation on operating leases | | | − | | | | 4,003 | | | | − | |
Depreciation and amortization | | | 4,619 | | | | − | | | | − | |
Income tax expense | | | 12,036 | | | | 5,721 | | | | (2 | ) |
Total operating expenses | | | 41,345 | | | | 32,608 | | | | 16,059 | |
| | | | 52,818 | | | | 34,837 | | | | 36,107 | |
| | | | | | | | | | | | | |
| OTHER (EXPENSE) REVENUE | | | | | | | | | | | | |
Net impairment losses recognized in earnings | | | (6,898 | ) | | | (26,804 | ) | | | (13,471 | ) |
Net realized gain on investment securities available-for-sale and loans | | | 2,622 | | | | 4,821 | | | | 1,890 | |
Net realized and unrealized gain on investment securities, trading | | | 858 | | | | 14,791 | | | | − | |
Provision for loan and lease losses | | | (13,896 | ) | | | (43,321 | ) | | | (61,383 | ) |
Gain on the extinguishment of debt | | | 3,875 | | | | 34,610 | | | | 44,546 | |
Other (expense) income | | | (1,663 | ) | | | 513 | | | | (1,350 | ) |
Total other expense | | | (15,102 | ) | | | (15,390 | ) | | | (29,768 | ) |
| | | | | | | | | | | | | |
NET INCOME | | $ | 37,716 | | | $ | 19,447 | | | $ | 6,339 | |
| | | | | | | | | | | | | |
NET INCOME PER SHARE – BASIC | | $ | 0.54 | | | $ | 0.41 | | | $ | 0.25 | |
| | | | | | | | | | | | | |
NET INCOME PER SHARE – DILUTED | | $ | 0.53 | | | $ | 0.41 | | | $ | 0.25 | |
| | | | | | | | | | | | | |
WEIGHTED AVERAGE NUMBER OF SHARES OUTSTANDING – BASIC | | | 70,410,131 | | | | 47,715,082 | | | | 25,205,403 | |
| | | | | | | | | | | | | |
WEIGHTED AVERAGE NUMBER OF SHARES OUTSTANDING – DILUTED | | | 70,809,088 | | | | 47,907,281 | | | | 25,355,821 | |
| | | | | | | | | | | | | |
DIVIDENDS DECLARED PER SHARE | | $ | 1.00 | | | $ | 1.00 | | | $ | 1.15 | |
The accompanying notes are an integral part of these statements
RESOURCE CAPITAL CORP. AND SUBSIDIARIES
Years Ended December 31, 2011, 2010 and 2009
(in thousands, except share and per share data)
| | | | | | | | | | | | | | | | | | | | | | |
| | | | | | | | | | | | Accumulated Other Comprehensive Loss | | | | | | Distributions in Excess of Earnings | | | Total Stockholders’ Equity | | | Comprehensive (Loss)/Income | |
Balance, January 1, 2009 | | | 25,344,867 | | | $ | 26 | | | $ | 356,103 | | | $ | (80,707 | ) | | $ | − | | | $ | (89,117 | ) | | $ | 186,305 | | | | |
| Proceeds from common stock offering | | | 10,294,455 | | | | 10 | | | | 46,315 | | | | − | | | | − | | | | − | | | | 46,325 | | | | |
Proceeds from dividend reinvestment and stock purchase plan | | | 1,895,043 | | | | 1 | | | | 8,994 | | | | − | | | | − | | | | − | | | | 8,995 | | | | |
Offering costs | | | − | | | | − | | | | (2,964 | ) | | | − | | | | − | | | | − | | | | (2,964 | ) | | | |
Repurchase and retirement of treasury shares | | | (1,400,000 | ) | | | (1 | ) | | | (5,038 | ) | | | − | | | | − | | | | − | | | | (5,039 | ) | | | |
Stock based compensation | | | 419,563 | | | | | | | | 867 | | | | − | | | | − | | | | − | | | | 867 | | | | |
Amortization of stock based compensation | | | − | | | | − | | | | 1,240 | | | | − | | | | − | | | | − | | | | 1,240 | | | | |
Forfeiture of unvested stock | | | (8,191 | ) | | | − | | | | − | | | | − | | | | − | | | | − | | | | − | | | | |
Net income | | | − | | | | − | | | | − | | | | − | | | | 6,339 | | | | − | | | | 6,339 | | | $ | 6,339 | |
Securities available-for-sale, fair value adjustment, net | | | − | | | | − | | | | − | | | | (729 | ) | | | − | | | | − | | | | (729 | ) | | | (729 | ) |
Designated derivatives, fair value adjustment | | | − | | | | − | | | | − | | | | 19,282 | | | | − | | | | − | | | | 19,282 | | | | 19,282 | |
Distributions on common stock | | | − | | | | − | | | | − | | | | − | | | | (6,339 | ) | | | (25,452 | ) | | | (31,791 | ) | | | | |
Comprehensive income | | | − | | | | − | | | | − | | | | − | | | | − | | | | − | | | | − | | | $ | 24,892 | |
Balance, January 1, 2010 | | | 36,545,737 | | | $ | 36 | | | $ | 405,517 | | | $ | (62,154 | ) | | $ | − | | | $ | (114,569 | ) | | $ | 228,830 | | | | | |
Proceeds from dividend reinvestment and stock purchase plan | | | 12,422,956 | | | | 12 | | | | 76,797 | | | | − | | | | − | | | | − | | | | 76,809 | | | | | |
Proceeds from common stock offering | | | 8,625,000 | | | | 9 | | | | 45,273 | | | | − | | | | − | | | | − | | | | 45,282 | | | | | |
Offering costs | | | − | | | | − | | | | (2,875 | ) | | | − | | | | − | | | | − | | | | (2,875 | ) | | | | |
Stock based compensation | | | 589,732 | | | | 1 | | | | 1,440 | | | | − | | | | − | | | | − | | | | 1,441 | | | | | |
Amortization of stock based compensation | | | − | | | | − | | | | 2,221 | | | | − | | | | − | | | | − | | | | 2,221 | | | | | |
Net income | | | − | | | | − | | | | − | | | | − | | | | 19,447 | | | | − | | | | 19,447 | | | $ | 19,447 | |
Securities available-for-sale, fair value adjustment, net | | | − | | | | − | | | | − | | | | 28,329 | | | | − | | | | − | | | | 28,329 | | | | 28,329 | |
Designated derivatives, fair value adjustment | | | − | | | | − | | | | − | | | | (93 | ) | | | − | | | | − | | | | (93 | ) | | | (93 | ) |
Distributions on common stock | | | − | | | | − | | | | − | | | | − | | | | (19,447 | ) | | | (31,618 | ) | | | (51,065 | ) | | | | |
Comprehensive income | | | − | | | | − | | | | − | | | | − | | | | − | | | | − | | | | − | | | $ | 47,683 | |
Balance, January 1, 2011 | | | 58,183,425 | | | $ | 58 | | | $ | 528,373 | | | $ | (33,918 | ) | | $ | − | | | $ | (146,187 | ) | | $ | 348,326 | | | | | |
Proceeds from dividend reinvestment and stock purchase plan | | | 13,511,300 | | | | 14 | | | | 83,561 | | | | − | | | | − | | | | − | | | | 83,575 | | | | | |
Proceeds from common stock offering | | | 6,900,000 | | | | 7 | | | | 47,603 | | | | − | | | | − | | | | − | | | | 47,610 | | | | | |
Offering costs | | | − | | | | | | | | (1,274 | ) | | | − | | | | − | | | | − | | | | (1,274 | ) | | | | |
Related party debt forgiveness | | | − | | | | − | | | | (1,552 | ) | | | − | | | | − | | | | | | | | (1,552 | ) | | | | |
Stock based compensation | | | 1,286,593 | | | | 1 | | | | 463 | | | | − | | | | − | | | | − | | | | 464 | | | | | |
Amortization of stock based compensation | | | − | | | | | | | | 2,526 | | | | − | | | | − | | | | − | | | | 2,526 | | | | | |
Forfeitures | | | (3,802 | ) | | | − | | | | − | | | | − | | | | − | | | | − | | | | − | | | | | |
Net income | | | − | | | | − | | | | − | | | | − | | | | 37,716 | | | | − | | | | 37,716 | | | $ | 37,716 | |
Securities available-for-sale, fair value adjustment, net | | | − | | | | − | | | | − | | | | (12,718 | ) | | | − | | | | − | | | | (12,718 | ) | | | (12,718 | ) |
Designated derivatives, fair vaule adjustment | | | − | | | | − | | | | − | | | | 309 | | | | − | | | | − | | | | 309 | | | | 309 | |
Distributions on common stock | | | − | | | | − | | | | − | | | | − | | | | (37,716 | ) | | | (37,576 | ) | | | (75,292 | ) | | | | |
Comprehensive income | | | − | | | | − | | | | − | | | | − | | | | − | | | | − | | | | − | | | $ | 25,307 | |
Balance, December 31, 2011 | | | 79,877,516 | | | $ | 80 | | | $ | 659,700 | | | $ | (46,327 | ) | | $ | − | | | $ | (183,763 | ) | | $ | 429,690 | | | | | |
The accompanying notes are an integral part of this statement
RESOURCE CAPITAL CORP. AND SUBSIDIARIES
(in thousands)
| | | Years Ended | |
| | | | |
| | | | | | | | | | |
| CASH FLOWS FROM OPERATING ACTIVITIES: | | | | | | | | | |
Net income | | $ | 37,716 | | | $ | 19,447 | | | $ | 6,339 | |
Adjustments to reconcile net income to net cash provided by operating activities: | | | | | | | | | | | | |
Provision for loan and lease losses | | | 13,896 | | | | 43,321 | | | | 61,383 | |
Depreciation of real estate investments | | | 729 | | | | − | | | | − | |
Amortization of intangible assets | | | 3,890 | | | | − | | | | − | |
Amortization of term facilities | | | 570 | | | | 875 | | | | 1,355 | |
Depreciation on operating leases | | | − | | | | 4,003 | | | | − | |
Accretion of net discounts on loans held for investment | | | (15,588 | ) | | | (18,672 | ) | | | (8,719 | ) |
Accretion of net discounts on securities available-for-sale | | | (3,698 | ) | | | − | | | | − | |
Amortization of discount on notes of CDOs | | | 274 | | | | 1,963 | | | | 1,032 | |
Amortization of debt issuance costs on notes of CDOs | | | 3,341 | | | | 4,226 | | | | 4,058 | |
Amortization of stock-based compensation | | | 2,526 | | | | 2,221 | | | | 1,240 | |
Amortization of terminated derivative instruments | | | 227 | | | | 387 | | | | 499 | |
Deferred income tax benefits | | | (398 | ) | | | 5,397 | | | | − | |
Non-cash incentive compensation to the Manager | | | 430 | | | | 1,098 | | | | 1,143 | |
Purchase of securities, trading | | | (38,904 | ) | | | (16,317 | ) | | | − | |
Principal payments on securities, trading | | | 643 | | | | 37 | | | | − | |
Proceeds from sales of securities, trading | | | 18,131 | | | | 13,357 | | | | − | |
Net realized and unrealized gain on investment securities-trading | | | (858 | ) | | | (14,791 | ) | | | − | |
Unrealized losses on non-designated derivative instruments | | | − | | | | 46 | | | | 95 | |
Net realized gains on investments | | | (2,622 | ) | | | (4,821 | ) | | | (1,890 | ) |
Net impairment losses recognized in earnings | | | 6,898 | | | | 26,804 | | | | 13,471 | |
Gain on the extinguishment of debt | | | (3,875 | ) | | | (34,610 | ) | | | (44,546 | ) |
Changes in operating assets and liabilities: | | | | | | | | | | | | |
(Increase) decrease in restricted cash | | | (5,628 | ) | | | (6,543 | ) | | | 10,596 | |
(Increase) decrease in interest receivable, net of purchased interest | | | (2,513 | ) | | | (701 | ) | | | 2,697 | |
Decrease in accounts receivable | | | − | | | | − | | | | 424 | |
Decrease in principal paydowns receivable | | | 363 | | | | 616 | | | | − | |
Increase in management fee payable | | | 974 | | | | 25 | | | | 474 | |
Increase (decrease) in security deposits | | | 80 | | | | (264 | ) | | | (791 | ) |
Increase in accounts payable and accrued liabilities | | | 15,370 | | | | 104 | | | | 2,714 | |
Increase (decrease) in accrued interest expense | | | 1,696 | | | | 181 | | | | (3,168 | ) |
Increase in other assets | | | (633 | ) | | | (6,855 | ) | | | (1,784 | ) |
Net cash provided by operating activities | | | 33,037 | | | | 20,534 | | | | 46,622 | |
| CASH FLOWS FROM INVESTING ACTIVITIES: | | | | | | | | | | | | |
Decrease (increase) in restricted cash | | | 31,014 | | | | (76,524 | ) | | | (35,327 | ) |
Purchase of securities available-for-sale | | | (117,044 | ) | | | (28,697 | ) | | | (28,958 | ) |
Principal payments on securities available-for-sale | | | 11,810 | | | | 1,240 | | | | 21 | |
Proceeds from sale of securities available-for-sale | | | 13,747 | | | | 19,144 | | | | 1,909 | |
Investment in unconsolidated entity | | | (4,762 | ) | | | (3,186 | ) | | | (2,066 | ) |
Investments in real estate assets | | | (689 | ) | | | − | | | | − | |
Equity contribution to VIE | | | − | | | | (7,333 | ) | | | − | |
Purchase of loans | | | (970,309 | ) | | | (340,355 | ) | | | (243,786 | ) |
Principal payments received on loans | | | 424,600 | | | | 316,400 | | | | 177,589 | |
Proceeds from sale of loans | | | 212,042 | | | | 94,419 | | | | 130,078 | |
Purchase of investments in real estate | | | (19,299 | ) | | | − | | | | − | |
Proceeds from sale of real estate | | | 1,464 | | | | − | | | | − | |
Purchase of lease receivables | | | − | | | | (28,161 | ) | | | − | |
Payments received on lease receivables | | | − | | | | 13,985 | | | | 8,655 | |
RESOURCE CAPITAL CORP. AND SUBSIDIARIES
CONSOLIDATED STATEMENTS OF CASH FLOWS − (Continued)
(in thousands)
| | | Years Ended | |
| | | | |
| | | | | | | | | | |
| CASH FLOWS FROM INVESTING ACTIVITIES: (Continued) | | | | | | | | | |
Proceeds from sale of lease receivables | | | − | | | | 1,579 | | | | 2,125 | |
Purchase of intangible asset | | | (21,213 | ) | | | − | | | | − | |
Investment in loans – related parties | | | (10,000 | ) | | | (10,000 | ) | | | − | |
Payments received on loans – related parties | | | 10,430 | | | | 73 | | | | − | |
Distribution from unconsolidated entities | | | − | | | | − | | | | − | |
Proceeds from sale of interest in subsidiary | | | − | | | | − | | | | 7,545 | |
Net cash (used in) provided by investing activities | | | (438,209 | ) | | | (47,416 | ) | | | 17,785 | |
| CASH FLOWS FROM FINANCING ACTIVITIES: | | | | | | | | | | | | |
Net proceeds from issuances of common stock (net of offering costs of $1,263, $2,772 and $2,964) | | | 46,347 | | | | 42,510 | | | | 43,362 | |
Net proceeds from dividend reinvestment and stock purchase plan (net of offering costs of $11, $103, and $0) | | | 83,564 | | | | 76,706 | | | | 8,995 | |
Repurchase of common stock | | | − | | | | − | | | | (5,040 | ) |
Proceeds from borrowings: | | | | | | | | | | | | |
Repurchase agreements | | | 55,852 | | | | − | | | | 18 | |
Collateralized debt obligations | | | 323,244 | | | | − | | | | − | |
Mortgage Payable | | | 13,600 | | | | − | | | | − | |
Secured term facility | | | − | | | | 6,500 | | | | − | |
Payments on borrowings: | | | | | | | | | | | | |
Repurchase agreements | | | − | | | | − | | | | (17,108 | ) |
Collateralized debt obligations | | | (28,542 | ) | | | − | | | | − | |
Secured term facility | | | − | | | | (369 | ) | | | (13,395 | ) |
Equipment-backed securities notes | | | − | | | | (18,046 | ) | | | − | |
Repurchase of issued bonds | | | (6,125 | ) | | | (56,740 | ) | | | (10,974 | ) |
Settlement of derivative instruments | | | − | | | | − | | | | − | |
Payment of debt issuance costs | | | (6,385 | ) | | | (502 | ) | | | (293 | ) |
Proceeds from CDO retained notes | | | 7,114 | | | | − | | | | − | |
Distributions paid on common stock | | | (69,869 | ) | | | (45,680 | ) | | | (32,564 | ) |
Net cash provided by (used in) financing activities | | | 418,800 | | | | 4,379 | | | | (26,999 | ) |
NET INCREASE (DECREASE) IN CASH AND CASH EQUIVALENTS | | | 13,628 | | | | (22,503 | ) | | | 37,408 | |
CASH AND CASH EQUIVALENTS AT BEGINNING OF PERIOD | | | 29,488 | | | | 51,991 | | | | 14,583 | |
CASH AND CASH EQUIVALENTS AT END OF PERIOD | | $ | 43,116 | | | $ | 29,488 | | | $ | 51,991 | |
| | | | | | | | | | | | | |
| SUPPLEMENTAL DISCLOSURE: | | | | | | | | | | | | |
Interest expense paid in cash | | $ | 32,596 | | | $ | 37,911 | | | $ | 48,138 | |
Income taxes paid in cash | | $ | − | | | $ | − | | | $ | − | |
The accompanying notes are an integral part of these statements
RESOURCE CAPITAL CORP. AND SUBSIDIARIES
DECEMBER 31, 20102011
NOTE 1 − ORGANIZATION AND BASIS OF PRESENTATION
Resource Capital Corp. and subsidiaries’ (collectively the ‘‘Company’’) principal business activity is to purchase and manage a diversified portfolio of commercial real estate-related assets and commercial finance assets. The Company’s investment activities are managed by Resource Capital Manager, Inc. (‘‘Manager’’) pursuant to a management agreement (the ‘‘Management Agreement’’). The Manager is a wholly-owned indirect subsidiary of Resource America, Inc. (“Resource America”) (NASDAQ: REXI). The following subsidiaries are consolidated onin the Company’s financial statements:
| | ● | RCC Real Estate, Inc. (“RCC Real Estate”) holds real estate investments, including commercial real estate loans, and commercial real estate-related securities.securities and investments in real estate. RCC Real Estate owns 100% of the equity of the following variable interest entities (“VIEs”): |
| | – | Resource Real Estate Funding CDO 2006-1 (“RREF CDO 2006-1”), a Cayman Islands limited liability company and qualified real estate investment trust (“REIT”) subsidiary (“QRS”). RREF CDO 2006-1 was established to complete a collateralized debt obligation (“CDO”) issuance secured by a portfolio of commercial real estate loans and commercial mortgage-backed securities.securities (“CMBS”). |
| | – | Resource Real Estate Funding CDO 2007-1 (“RREF CDO 2007-1”), a Cayman Islands limited liability company and QRS. RREF CDO 2007-1 was established to complete a CDO issuance secured by a portfolio of commercial real estate loans, commercial mortgage-backed securities and property available-for-sale. |
| | ● | RCC Commercial, Inc. (“RCC Commercial”) holds bank loan investments and commercial real estate-related securities.investments. RCC Commercial owns 100% of the equity of the following VIEs: |
| | – | Apidos CDO I, Ltd. (“Apidos CDO I”), a Cayman Islands limited liability company and taxable REIT subsidiary (“TRS”). Apidos CDO I was established to complete a CDO issuance secured by a portfolio of bank loans.loans and asset-backed securities (“ABS”). |
| | – | Apidos CDO III, Ltd. (“Apidos CDO III”), a Cayman Islands limited liability company and TRS. Apidos CDO III was established to complete a CDO issuance secured by a portfolio of bank loans.loans and ABS. |
| ● | RCC Commercial II, Inc. (“Commercial II”) holds bank loan investments and commercial real estate-related securities. Commercial II owns 100% of the equity of the following VIE: |
| | – | Apidos Cinco CDO, Ltd. (“Apidos Cinco CDO”), a Cayman Islands limited liability company and TRS. Apidos Cinco CDO was established to complete a CDO issuance secured by a portfolio of bank loans.loans and ABS. |
| | ● | Resource TRS, Inc. (“Resource TRS”), a TRS directly owned by the Company, holds the Company’s directly-owned TRS,equity investment in a leasing company and holds all of its structured notes. |
| ● | Resource TRS II, Inc. (“Resource TRS II”), a TRS directly owned by the Company, holds the Company’s lease receivables and structured notes andinterests in bank loan CDOs not originated by the Company. Resource TRS II owns 100% of the equity of the following VIE: |
| | – | LEAF Receivables Funding 3, LLC,Resource Capital Asset Management (“LEAF Funding 3”RCAM”), a domestic limited liability company, is entitled to collect senior, subordinated, and incentive fees related to five CDO issuers to which it provides management services through Apidos Capital Management, a subsidiary or Resource America. |
| ● | Resource TRS III, Inc. (“Resource TRS III”), a TRS directly owned by the Company, holds the Company’s interests in bank loan CDOs originated by the Company. Resource TRS III owns 43% of the equity of the following VIE: |
| – | Apidos CLO VIII, Ltd (“Apidos CLO VIII”), a Cayman Islands limited liability company and TRS. Apidos CLO VIII was established to complete a securitizationCDO issuance secured by a portfolio of lease receivables.bank loans. |
NOTE 2 − SUMMARY OF SIGNIFICANT ACCOUNTING POLICIES
Principles of Consolidation
The accompanying consolidated financial statements have been prepared in conformity with accounting principles generally accepted in the United States of America (“GAAP”). The consolidated financial statements include the accounts of the Company.
The Company has a 100% interest valued at $1.5 million in the common shares (three percent of the total equity) in two trusts, Resource Capital Trust I (“RCT I”) and RCC Trust II (“RCT II”). The Company completed a qualitative analysis to determine whether or not it is the primary beneficiary of each of the trusts. The Company does not have the power to direct the activities of either trust, nor does it have the obligation to absorb losses or recognize the benefits that could potentially be significant to these trusts. Therefore, the Company is not deemed to be the primary beneficiary of either trust and they are not consolidated into the Company’s consolidated financial statements. The Company records its investments in RCT I and RCT II’s common shares of $774,000 each as investments in unconsolidated trusts using the cost method and records dividend income upon declaration by RCT I and RCT II. For the years ended December 31, 2010, and 2009, the Company recognized $3.6 million and $3.0 million, respectively, of interest expense with respect to the subordinated debentures it issued to RCT I and RCT II which included $302,000 and $189,000, respectively, of amortization of deferred debt issuance costs. The Company will do a continuous reassessment as to whether it should be deemed to be the primary beneficiary of the trusts.
All inter-company transactions and balances have been eliminated.
RESOURCE CAPITAL CORP. AND SUBSIDIARIES
NOTES TO CONSOLIDATED FINANCIAL STATEMENTS – (Continued)
DECEMBER 31, 20102011
NOTE 2 − SUMMARY OF SIGNIFICANT ACCOUNTING POLICIES − (Continued)
Use of Estimates
The preparation of financial statements in conformity with GAAP requires management to make estimates and assumptions that affect the reported amounts of assets and liabilities and disclosure of contingent assets and liabilities at the date of the financial statements, and the reported amounts of revenues and expenses during the reporting period. Actual results could differ from those estimates. Estimates affecting the accompanying consolidated financial statements include the net realizable and fair values of the Company’s investments and derivatives, the estimated life used to calculate depreciation, amortization, and accretion of premiums and discounts, respectively, on investments and provisions for loan and lease losses.
Cash and Cash Equivalents
Cash and cash equivalents include cash on hand and all highly liquid investments with original maturities of three months or less at the time of purchase. At December 31, 20102011 and 2009,2010, this included $2.6$4.8 million and $5.7$2.6 million, respectively, held in a prime brokerage account, $25.6$26.0 million and $43.4$25.6 million, respectively, held in a money market account, $12.0 million and $1.3 million, and $2.9 millionrespectively, held in checking accounts, respectively.and $299,000 and $0, respectively, held in accounts at the Company’s investment properties.
Investment Securities
The Company classifies its investment portfolio as trading, investments, available-for-sale or held-to-maturity. The Company, from time to time, may sell any of its investments due to changes in market conditions or in accordance with its investment strategy.
The Company’s available-for-saleinvestment securities, trading are reported at fair value. Seevalue (see Note 16, “Fair Value of Financial Instruments” for information regarding21). To determine fair value, accountingthe Company uses dealer quotes or bids which are validated using an income approach utilizing appropriate prepayment, default, and therecovery rates. Any changes in fair value hierarchy.are recorded in the Company’s results of operations as net realized and unrealized gain (loss) on investment securities, trading.
The Company’s investment securities available-for-sale are reported at fair value (see Note 21). To determine fair value, the Company uses two methods, either a dealer quote or an internal valuation model, depending upon when the position was purchased and the current level of market activity.
For securities purchased in 2009 and thereafter,with higher levels of market activity, the Company obtains a quote from a dealer, which typically will be the dealer who sold the Company the security. The Company has been advised that, in formulating their quotes, dealers may use recent trades in the particular security, if any, market activity in similar securities, if any, or internal valuation models. These quotes are non-binding. As a result ofBased on how the dealers develop their quotes, the market illiquidityliquidity and low levels of trading, activity as of December 31, 2009, the Company categorized all ofcategorizes these investment securities available-for-sale ininvestments as either Level 3 in the fair value hierarchy. Due to the increased level of trading activity in 2010, the Company moved some of these securities into2 or Level 23 in the fair value hierarchy. The Company evaluates the reasonableness of the quotes it receives by applying its own valuation models. If there is a material difference between a quote the Company receives and the value indicated by its valuation models, the Company will evaluate the difference. As part of that evaluation, the Company will discuss the difference with the dealer, who may revise theirits quote based upon these discussions. Alternatively, the Company may revise its valuation models.
For investment securities available-for-sale purchased prior to 2009,with lower levels of market activity, the Company determines fair value based on taking a weighted average of the following three measures:
| | ● | dealer quotes, as described above; |
| | ● | quotes on more actively-traded, higher-rated securities issued in a similar time period, adjusted for differences in rating and seniority; and |
| | ● | the value resulting from an internal valuation model using an income approach based upon an appropriate risk-adjusted yield, time value and projected losses using default assumptions based upon an historical analysis of underlying loan performance. |
RESOURCE CAPITAL CORP. AND SUBSIDIARIES
NOTES TO CONSOLIDATED FINANCIAL STATEMENTS – (Continued)
DECEMBER 31, 2011
NOTE 2 − SUMMARY OF SIGNIFICANT ACCOUNTING POLICIES − (Continued)
Investment Securities – (Continued)
On a quarterly basis, the Company evaluates its available-for-sale investments for other-than-temporary impairment. An available-for-sale investment is impaired when its fair value has declined below its amortized cost basis. An impairment is considered other-than-temporary when the amortized cost basis of the investment will not be recovered over its remaining life. In addition, the Company’s intent to sell as well as the likelihood that the Company will be required to sell the security before the recovery of the amortized cost basis is considered. Where credit quality is believed to be the cause of the other-than-temporary impairment, that component of the impairment is recognized as an impairment loss in the statement of operations. Where other market components are believed to be the cause of the impairment, that component of the impairment is recognized on the balance sheet as other comprehensive loss.
RESOURCE CAPITAL CORP. AND SUBSIDIARIES
NOTES TO CONSOLIDATED FINANCIAL STATEMENTS – (Continued)
DECEMBER 31, 2010
NOTE 2 − SUMMARY OF SIGNIFICANT ACCOUNTING POLICIES − (Continued)
Investment Securities – (Continued)
The Company’s investment securities-trading are reported at fair value. To determine fair value, the Company uses dealer quotes or bids which are validated using an income approach utilizing appropriate prepayment, default and recovery rates. Any changes in fair value are recorded on the Company’s results of operations as net unrealized gain on investment securities - trading.
Investment securities transactions are recorded on the trade date. Realized gains and losses on investment securities are determined on the specific identification method.
Investment Interest Income Recognition
Interest income on the Company’s mortgage-backed and other asset-backed securities is accrued using the effective yield method based on the actual coupon rate and the outstanding principal amount of the underlying mortgages or other assets. Premiums and discounts are amortized or accreted into interest income over the lives of the securities also using the effective yield method, adjusted for the effects of estimated prepayments. For an investment purchased at par, the effective yield is the contractual interest rate on the investment. If the investment is purchased at a discount or at a premium, the effective yield is computed based on the contractual interest rate increased for the accretion of a purchase discount or decreased for the amortization of a purchase premium. The effective yield method requires the Company to make estimates of future prepayment rates for its investments that can be contractually prepaid before their contractual maturity date so that the purchase discount can be accreted, or the purchase premium can be amortized, over the estimated remaining life of the investment. The prepayment estimates that the Company uses directly impact the estimated remaining lives of its investments. Actual prepayment estimates are reviewed as of each quarter end or more frequently if the Company becomes aware of any material information that would lead it to believe that an adjustment is necessary. If prepayment estimates are incorrect, the amortization or accretion of premiums and discounts may have to be adjusted, which would have an impact on future income.
Loans
The Company acquires whole loans through direct origination, through the acquisition of participations in commercial real estate loans and corporate leveraged loans in the secondary market and through syndications of newly originated loans. Loans are held for investment; therefore, the Company initially records them at their acquisition price, and subsequently, accounts for them based on their outstanding principal plus or minus unamortized premiums or discounts. The Company may sell a loan held for investment in certain instances, where the credit fundamentals underlying a particular loan have changed in such a manner that the Company’s expected return on investment may decrease. Once the determination has been made by the Company that it no longer will hold the loan for investment, the Company identifies these loans as “Loans held for sale” and will account for them at the lower of amortized cost or fair value.
Loan Interest Income Recognition
Interest income on loans includes interest at stated rates adjusted for amortization or accretion of premiums and discounts. Premiums and discounts are amortized or accreted into income using the effective yield method. If a loan with a premium or discount is prepaid, the Company immediately recognizes the unamortized portion as a decrease or increase to interest income. In addition, the Company defers loan origination fees and loan origination costs and recognizes them over the life of the related loan against interest income using the effective yield method.
RESOURCE CAPITAL CORP. AND SUBSIDIARIES
NOTES TO CONSOLIDATED FINANCIAL STATEMENTS – (Continued)
DECEMBER 31, 2011
NOTE 2 − SUMMARY OF SIGNIFICANT ACCOUNTING POLICIES − (Continued)
Allowance for Loan and Lease LossesLoss
The Company maintains an allowance for loan and lease losses.loss. Loans held for investment are first individually evaluated for impairment so specific reserves can be applied. Loans for which a specific reserve is not applicable are then evaluated for impairment as a homogeneous pool of loans with substantially similar characteristics so that a general reserve can be established, if needed. The reviews are performed at least quarterly.
RESOURCE CAPITAL CORP. AND SUBSIDIARIES
NOTES TO CONSOLIDATED FINANCIAL STATEMENTS – (Continued)
DECEMBER 31, 2010
NOTE 2 − SUMMARY OF SIGNIFICANT ACCOUNTING POLICIES − (Continued)
Allowance for Loan and Lease Losses – (Continued)
The Company considers a loan to be impaired when,if one of two conditions exists. The first condition is if, based on current information and events, management believes it is probable that the Company will be unable to collect all amounts due according to the contractual terms of the loan agreement. The second condition is if the loan is deemed to be a troubled-debt restructuring (“TDR”) where a concession has been given to a borrower in financial difficulty. These TDRs may not have an associated specific loan loss allowance if the principal and interest amount is considered recoverable based on current market conditions, expected collateral performance and / or guarantees made by the borrowers.
When a loan is impaired under either of these two conditions, the allowance for loan losses is increased by the amount of the excess of the amortized cost basis of the loan over its fair value. Fair value may be determined based on the present value of estimated cash flows; on market price, if available; or on the fair value of the collateral less estimated disposition costs. When a loan, or a portion thereof, is considered uncollectible and pursuit of collection is not warranted, the Company will record a charge-off or write-down of the loan against the allowance for loan losses.
The Company evaluates the adequacy of the allowance for credit losses on lease receivables based upon, among other factors, management’s historical experience with the lease receivables portfolios it manages, an analysis of contractual delinquencies, economic conditions and trends, industry statistics and equipment finance portfolio characteristics, as adjusted for expected recoveries. In evaluating historic performance of leases, a migration analysis is performed, which estimates the likelihood that an account progresses through delinquency stages to ultimate write-off. The Company’s policy is to charge-off to the allowance those financings for which management believes the collectability is unlikely.
The balance of impaired loans and leases was $164.0 million and $100.1 million at December 31, 2010 and 2009, respectively. The total balance of impaired loans and leases with a valuation allowance at December 31, 2010 and 2009 was $52.6 million and $82.2 million, respectively. The total balance of impaired loans and leases without a specific valuation allowance was $111.4 million and $17.9 million at December 31, 2010 and 2009, respectively. The specific valuation allowance related to these impaired loans and leases was $25.1 million and $31.0 million at December 31, 2010 and 2009, respectively. The average balance of impaired loans and leases was $130.2 million and $112.6 million during 2010 and 2009, respectively. The Company did not recognize any income on impaired loans and leases during 2010 and 2009 once each individual loan or lease became impaired unless cash was received.
An impaired loan or lease may remain on accrual status during the period in which the Company is pursuing repayment of the loan or lease;loan; however, the loan or lease would be placed on non-accrual status at such time as (i) management believes that scheduled debt service payments will not be met within the coming 12 months; (ii) the loan or lease becomes 90 days delinquent; (iii) management determines the borrower is incapable of, or has ceased efforts toward, curing the cause of the impairment; or (iv) the net realizable value of the loan’s underlying collateral approximates the Company’s carrying value of such loan. While on non-accrual status, the Company recognizes interest income only when an actual payment is received.
Comprehensive Gain/Income/(Loss)
Comprehensive loss for the Company includes net income and the change in net unrealized gains/(losses) on available-for-sale securities and derivative instruments used to hedge exposure to interest rate fluctuations and protect against declines in the market value of assets resulting from general market trends.
Income Taxes
The Company operates in such a manner as to qualify as a REITreal estate investment trust (“REIT”) under the provisions of the Internal Revenue Code of 1986, as amended (the "Code"); therefore, applicable REIT taxable income is included in the taxable income of its shareholders, to the extent distributed by the Company. To maintain REIT status for federal income tax purposes, the Company is generally required to distribute at least 90% of its REIT taxable income to its shareholders as well as comply with certain other qualification requirements as defined under the Code. As a REIT, the Company is not subject to federal corporate income tax to the extent that it distributes 100% of its REIT taxable income each year.
Taxable income, from non-REIT activities managed through Resource TRS,the Company’s taxable REIT subsidiaries, is subject to federal, state and local income taxes. Resource TRSThe Company’s taxable REIT subsidiaries’ income taxes are accounted for under the asset and liability method. Under the asset and liability method, deferred income taxes are recognized for the temporary differences between the financial reporting basis and tax basis of Resource TRS' assets and liabilities.
RESOURCE CAPITAL CORP. AND SUBSIDIARIES
NOTES TO CONSOLIDATED FINANCIAL STATEMENTS – (Continued)
DECEMBER 31, 2010
NOTE 2 − SUMMARY OF SIGNIFICANT ACCOUNTING POLICIES − (Continued)
Income Taxes – (Continued)
Apidos CDO I, Apidos CDO III and Apidos Cinco CDO, Apidos CDO I 2009-1 Cayman SPV, Ltd., and Apidos CDO III Cayman 2009-1 SPV, Ltd., the Company’s foreign TRSs, are organized as exempted companies incorporated with limited liability under the laws of the Cayman Islands, and are generally exempt from federal and state income tax at the corporate level because their activities in the United States are limited to trading in stock and securities for their own account. Therefore, despite their status as TRSs,taxable REIT subsidiaries, they generally will not be subject to corporate tax on their earnings and no provision for income taxes is required; however, because they are “controlled foreign corporations,” the Company will generally be required to include Apidos CDO I’s, Apidos CDO III’s and Apidos Cinco CDO’s current taxable income in its calculation of REIT taxable income.
RESOURCE CAPITAL CORP. AND SUBSIDIARIES
NOTES TO CONSOLIDATED FINANCIAL STATEMENTS – (Continued)
DECEMBER 31, 2011
NOTE 2 − SUMMARY OF SIGNIFICANT ACCOUNTING POLICIES − (Continued)
Income Taxes – (Continued)
On October 27, 2011, the Company reorganized the ownership structure of Apidos CDO I and Apidos CDO III. As a result, for the period January 1, 2011 through October 26, 2011, the earnings from Apidos CDO I and Apidos CDO III are included the Company’s calculation of REIT taxable income. For the period October 27, 2011 and ending on December 31, 2011, the earnings from Apidos CDO I and Apidos CDO III are excluded from the Company’s calculation of REIT taxable income and are subject to corporate tax. Accordingly, a provision for income taxes for the earnings from October 27, 2011 through December 31, 2011 has been recorded.
On October 13, 2011, the Company acquired approximately 43% of the equity of Apidos CLO VIII, which is a foreign TRS, organized as an exempted company incorporated with limited liability under the laws of the Cayman Islands. This equity is directly owned by a domestic TRS of the Company; therefore, its earnings are excluded from the Company’s calculation of REIT taxable income and are subject to corporate tax. Accordingly, a provision for income taxes has been recorded.
Stock Based Compensation
Issuances of restricted stock and options are accounted for using the fair value based methodology whereby the fair value of the award is measured on the grant date and expensed monthly to equity compensation expense-related party on the consolidated statements of operations with a corresponding entry to additional paid-in capital. For issuances to the Company’s Manager and to non-employees, the unvested stock and options are adjusted quarterly to reflect changes in fair value as performance under the agreement is completed. For issuances to the Company’s five non-employee directors, the amount is not remeasured under the fair value-based method. The compensation for each of these issuances is amortized over the service period and included in equity compensation expense.
Net Income Per Share
The Company calculates basic income per share by dividing net income for the period by weighted-average shares of its common stock, including vested restricted stock and participating securities, outstanding for that period. Diluted income per share takes into account the effect of dilutive instruments, such as stock options and unvested restricted stock, but uses the average share price for the period in determining the number of incremental shares that are to be added to the weighted-average number of shares outstanding.
Derivative Instruments
The Company’s policies permit it to enter into derivative contracts, including interest rate swaps and interest rate caps, to add stability to its interest expense and to manage its exposure to interest rate movements or other identified risks. The Company has designated these transactions as cash flow hedges. The contracts or hedge instruments are evaluated at inception and at subsequent balance sheet dates to determine if they qualify for hedge accounting which requires that the Company recognize all derivatives on the balance sheet at fair value. The Company records changes in the estimated fair value of the derivative in other comprehensive income to the extent that it is effective. Any ineffective portion of a derivative’s change in fair value is immediately recognized in earnings.
Recent Accounting StandardsInvestments in Real Estate
In January 2011, the Financial Accounting Standards Board (“FASB”) issued guidance to delay the disclosures regarding troubled debt restructurings originally effective asInvestments in real estate are carried net of December 15, 2010. The guidance is now anticipated to be effective for interim and annual periods ending after June 15, 2011. The Company expects that adoption will require additional disclosures in the notesaccumulated depreciation. Costs directly related to the Company’s consolidated financial statements.acquisition are expensed as incurred. Ordinary repairs and maintenance which are not reimbursed by the tenants are expensed as incurred. Costs related to the improvement of the real property are capitalized and depreciated over their useful life.
In July 2010, the FASB issued guidance that required companies to provide more information about the credit quality of their financing receivables in the disclosures to financial statements including, but not limited to, significant purchases and sales of financing receivables, aging information and credit quality indicators. The guidance was effective for the Company as of December 15, 2010. Adoption required additional disclosure (see Note 9).
In February 2010, the FASB issued guidance which removed the requirement to disclose a date through which subsequent events have been evaluated in both issued and revised financial statements. Revised financial statements include financial statements revised as a result of either a correction of error or retrospective application of accounting principles generally accepted in the United States (“GAAP”). This guidance was effective upon issuance.
RESOURCE CAPITAL CORP. AND SUBSIDIARIES
NOTES TO CONSOLIDATED FINANCIAL STATEMENTS – (Continued)
DECEMBER 31, 20102011
NOTE 2 − SUMMARY OF SIGNIFICANT ACCOUNTING POLICIES − (Continued)
Investments in Real Estate – (Continued)
Acquisitions of real estate assets and any related intangible assets are recorded initially at fair value under Financial Accounting Standards Board (“FASB”) Accounting Standards Codification (“ASC”) Topic 805, “Business Combinations.” The Company allocates the purchase price of its investments in real estate to land, building, site improvements, the value of in-place leases and the value of above or below market leases. The value allocated to above or below market leases is amortized over the remaining lease term as an adjustment to rental income. The Company amortizes the value allocated to in-place leases over the weighted average remaining lease term to depreciation and amortization expense. The Company depreciates real property using the straight-line method over the estimated useful lives of the assets as follows:
| Category | | Term |
Building | | 25 – 40 years |
Site improvements | | Lesser of the remaining life of building or useful life |
Long-Lived and Intangible Assets
Long-lived assets and certain identifiable intangibles to be held and used are reviewed for impairment whenever events or changes in circumstances indicate that the carrying value of such assets may not be recoverable. The review of recoverability is based on an estimate of the future undiscounted cash flows (excluding interest charges) expected to result from the long-lived asset’s use and eventual disposition. If impairment has occurred, the loss will be measured as the excess of the carrying amount of the asset over the fair value of the asset.
Other than an impairment charge of $1.7 million the Company took on conversion of a loan investment into equity of a real estate property in June 2011. No impairment charges were recorded on the Company’s investment in real estate or intangible assets during the year ended December 31, 2011.
Recent Accounting Standards
In June 2011, the FASB issued guidance which changes the presentation of comprehensive income. It eliminates the option to present comprehensive income as part of the changes in stockholders’ equity. In addition, it requires consecutive disclosure of comprehensive income either as part of the statement of net income or in a statement immediately following. Finally, the guidance requires disclosure on the face of the financial statements of any reclassifications between net income and other comprehensive income. The guidance is effective for fiscal years and periods within those years beginning after December 15, 2011. In December 2011, the FASB updated the guidance to defer the requirement related to the presentation of certain reclassification adjustments. Adoption will require adjusted disclosure of the Company’s comprehensive income.
In April 2011, the FASB issued guidance which revises the criteria for assessing effective control for repurchase agreements and other agreements that both entitle and obligate a transferor to repurchase or redeem financial assets before their maturity. The determination of whether the transfer of a financial asset subject to a repurchase agreement is a sale is based, in part, on whether the entity maintains effective control over the financial asset. The amendments in this guidance will be effective for interim and annual reporting periods beginning on or after December 15, 2011, and will be applied prospectively to transactions or modifications of existing transactions that occur on or after the effective date. Early adoption is not permitted. The Company is currently evaluating the effect of the adoption on its consolidated financial statements.
In April 2011, the FASB issued guidance to clarify the disclosures regarding TDRs originally effective as of December 15, 2010. The new guidance surrounding TDRs was effective for interim and annual periods beginning after June 15, 2011. Adoption of this guidance required additional disclosures in the notes to the Company’s consolidated financial statements (see Note 13).
RESOURCE CAPITAL CORP. AND SUBSIDIARIES
NOTES TO CONSOLIDATED FINANCIAL STATEMENTS – (Continued)
DECEMBER 31, 2011
NOTE 2 − SUMMARY OF SIGNIFICANT ACCOUNTING POLICIES − (Continued)
Recent Accounting Standards – (Continued)
In January 2010, the FASB issued guidance that required new disclosures and clarified some existing disclosure requirements about fair value measurements. The new pronouncement requires a reporting entity: (1) to disclose separately the amounts of significant transfers in and out of Level 1 and Level 2 fair value measurements and describe the reasons for the transfers; and (2) to present separately information about purchases, sales, issuances and settlements in the reconciliation of fair value measurements using significant unobservable inputs. In addition, it clarified the requirements of the following existing disclosures: (1) for purposes of reporting fair value measurement for each class of assets and liabilities, a reporting entity needs to use judgment in determining the appropriate classes of assets and liabilities, and (2) a reporting entity should provide disclosures about the valuation techniques and inputs used to measure fair value for both recurring and nonrecurring fair value measurements. The new guidance was effective for interim and annual reporting periods beginning after December 15, 2009, except for the disclosures about purchases, sales, issuances, and settlements in the rollforward of activity in Level 3 fair value measurements which became effective for the Company in fiscal 2011. Adoption of the guidance effective December 15, 20092011 and required additional disclosures. The new guidance required enhanced disclosure to delineate such categories in the notes to the Company’s consolidated financial statementsfootnotes (see Note 17)22).
In December 2009, the FASB issued new guidance for improving financial reporting for enterprises involved with VIEs regarding power to direct the activities of a VIE as well as obligations to absorb the losses. This guidance is effective for interim and annual periods beginning after November 15, 2009. Adoption of this statement did not have an impact on the Company’s consolidated financial statements.
In June 2009, the FASB issued guidance for consolidation of VIEs which changes the consolidation guidance applicable to a VIE and amends the guidance governing the determination of whether an enterprise is the primary beneficiary of a VIE and therefore, required to consolidate an entity, by requiring a qualitative analysis rather than a quantitative analysis. This standard also requires continuous reassessment of whether an enterprise is the primary beneficiary of a VIE as well as enhanced disclosures about an enterprise’s involvement with a VIE. This guidance was effective for interim and annual periods beginning after November 15, 2009. The Company evaluated the potential impact of adopting this statement and concluded that it will continue to consolidate the VIEs that it has identified in Note 1 to the consolidated financial statements. The Company will do a continuous reassessment of its conclusion as stipulated in this statement.
In June 2009, the FASB issued guidance for accounting for transfers of financial assets. The guidance eliminates the concept of a “qualifying special-purpose entity,” changes the requirements for derecognizing financial assets and requires greater transparency of related disclosures. This statement was effective for fiscal years beginning after November 15, 2009. Adoption of this statement did not have a material impact on the Company’s consolidated financial statements.
Reclassifications
Certain reclassifications have been made to the 20092010 and 20082009 consolidated financial statements to conform to the 20102011 presentation.
NOTE 3 – SUPPLEMENTAL CASH FLOW INFORMATION
Supplemental disclosure of cash flow information (in thousands):
| | | | |
| | | | | | | | | | |
| Non-cash investing activities include the following: | | | | | | | | | |
Transfer of lease receivables | | $ | − | | | $ | − | | | $ | 89,763 | |
Acquisition of lease receivables | | $ | − | | | $ | (100,305 | ) | | $ | − | |
Contribution of lease receivables and other assets | | $ | 117,840 | | | $ | − | | | $ | − | |
Conversion of equity in LEAF Funding 3 to preferred stock and warrants | | $ | (21,000 | ) | | $ | − | | | $ | − | |
Increase in bank loan investments | | $ | − | | | $ | − | | | $ | 1,148 | |
Decrease in bank loan investments | | $ | − | | | $ | − | | | $ | (1,148 | ) |
Net purchase of loans on warehouse line | | $ | (52,735 | ) | | $ | − | | | $ | − | |
Loans, pledged as collateral | | $ | − | | | $ | (4,444 | ) | | $ | − | |
Property available-for-sale | | $ | − | | | $ | 4,444 | | | $ | − | |
Acquisition of real estate investments | | $ | (33,073 | ) | | $ | − | | | $ | − | |
Conversion of loans to investment in real estate | | $ | 34,550 | | | $ | − | | | $ | − | |
Conversion of PIK interest in securities available-for-sale | | $ | 2,364 | | | $ | − | | | $ | − | |
| | | | | | | | | | | | | |
| Non-cash financing activities include the following: | | | | | | | | | | | | |
Distributions on common stock declared but not paid | | $ | 19,979 | | | $ | 14,555 | | | $ | 9,170 | |
Issuance of restricted stock | | $ | 1,203 | | | $ | 338 | | | $ | 242 | |
Transfer of secured term facility | | $ | − | | | $ | − | | | $ | (82,319 | ) |
Assumption of equipment-backed securitized notes | | $ | − | | | $ | 112,223 | | | $ | − | |
Settlement of a secured term facility | | $ | − | | | $ | (6,131 | ) | | $ | − | |
Settlement of debt issuance costs | | $ | − | | | $ | (1,012 | ) | | $ | − | |
Contribution of equipment-backed securitized notes and other liability | | $ | (96,840 | ) | | $ | − | | | $ | − | |
Acquisition of loans on warehouse line | | $ | 52,735 | | | $ | − | | | $ | − | |
RESOURCE CAPITAL CORP. AND SUBSIDIARIES
NOTES TO CONSOLIDATED FINANCIAL STATEMENTS – (Continued)
DECEMBER 31, 2011
NOTE 4 − RESTRICTED CASH
Restricted cash as of December 31, 2011 consisted of $138.1 million held in six consolidated CDO trusts, $3.2 million held in restricted accounts at the Company’s investment properties and $1.5 million in cash collateralizing outstanding margin calls on the Company’s cash flow hedges. Restricted cash as of December 31, 2010 consisted of $160.5 million held in five consolidated CDO trusts, $5.2 million held in a securitization of lease receivables and $2.5 million in cash collateralizing outstanding margin calls on the Company’s cash flow hedges. Restricted cash
NOTE 5 – INVESTMENT SECURITIES-TRADING
The following table summarizes the Company's structured notes and residential mortgage-back securities (“RMBS”), which are classified as investment securities, trading and carried at fair value (in thousands):
| | | | | | | | | | | | | |
December 31, 2011: | | | | | | | | | | | | |
Structured notes | | $ | 27,345 | | | $ | 6,098 | | | $ | (1,890 | ) | | $ | 31,553 | |
RMBS | | | 8,729 | | | | 100 | | | | (1,709 | ) | | | 7,120 | |
Total | | $ | 36,074 | | | $ | 6,198 | | | $ | (3,599 | ) | | $ | 38,673 | |
| | | | | | | | | | | | | | | | | |
December 31, 2010: | | | | | | | | | | | | | | | | |
Structured notes | | $ | 7,984 | | | $ | 9,739 | | | $ | − | | | $ | 17,723 | |
Total | | $ | 7,984 | | | $ | 9,739 | | | $ | − | | | $ | 17,723 | |
The Company purchased 27 securities and sold 11 securities during the year ended December 31, 2011, for a realized gain of $8.0 million. The Company held 27 investments securities-trading as of December 31, 2009 consisted2011. The Company purchased 26 securities and sold 13 securities during the year ended December 31, 2010, for a realized gain of $80.5 million$5.1 million. The Company held 11 investments securities-trading as of restricted cashDecember 31, 2010.
NOTE 6 – INVESTMENT SECURITIES AVAILABLE-FOR-SALE
In November 2011, the investment securities held-to-maturity were reclassified to investment securities available-for-sale since the Company no longer intended to hold these positions until maturity. Comparable prior year data for the Company’s ABS can be found in our five CDOsNote 7.
The following table summarizes the Company's investment securities including those pledged as collateral and $4.6 million held in a margin account, related to our swap portfolio. classified as available-for-sale, which are carried at fair value (in thousands):
| | | | | | | | | | | | | |
| December 31, 2011: | | | | | | | | | | | | |
CMBS | | $ | 161,512 | | | $ | 1,192 | | | $ | (29,884 | ) | | $ | 132,820 | |
ABS | | | 28,513 | | | | 215 | | | | (3,527 | ) | | | 25,201 | |
Other asset-backed | | | − | | | | 23 | | | | − | | | | 23 | |
Total | | $ | 190,025 | | | $ | 1,430 | | | $ | (33,411 | ) | | $ | 158,044 | |
| | | | | | | | | | | | | | | | | |
| December 31, 2010: | | | | | | | | | | | | | | | | |
CMBS | | $ | 83,223 | | | $ | 7,292 | | | $ | (26,578 | ) | | $ | 63,937 | |
ABS | | | − | | | | − | | | | − | | | | − | |
Other asset-backed | | | − | | | | 23 | | | | − | | | | 23 | |
Total | | $ | 83,223 | | | $ | 7,315 | | | $ | (26,578 | ) | | $ | 63,960 | |
| (1) | As of December 31, 2011 and 2010, $153.4 million and $58.0 million, respectively, of securities were pledged as collateral security under related financings. |
RESOURCE CAPITAL CORP. AND SUBSIDIARIES
NOTES TO CONSOLIDATED FINANCIAL STATEMENTS – (Continued)
DECEMBER 31, 20102011
NOTE 4 – INVESTMENT SECURITIES-TRADING
The following table summarizes the Company's structured notes, which are classified as investment securities-trading, which are carried at fair value (in thousands):
| | | | | | | | | | | | | |
December 31, 2010: | | | | | | | | | | | | |
Structured notes | | $ | 7,984 | | | $ | 9,739 | | | $ | − | | | $ | 17,723 | |
Total | | $ | 7,984 | | | $ | 9,739 | | | $ | − | | | $ | 17,723 | |
The Company purchased 26 securities and sold 13 securities during the year ended December 31, 2010, for a gain of $5.1 million. The Company held 13 investment securities-trading as of December 31, 2010. The Company did not hold any such investment at December 31, 2009.
NOTE 5 – INVESTMENT SECURITIES AVAILABLE-FOR-SALE
The following table summarizes the Company's mortgage-backed securities (“MBS”) and other asset-backed securities (“ABS”), including those pledged as collateral and classified as available-for-sale, which are carried at fair value (in thousands):
| | | | | | | | | | | | | |
December 31, 2010: | | | | | | | | | | | | |
Commercial mortgage-backed securities | | $ | 83,223 | | | $ | 7,292 | | | $ | (26,578 | ) | | $ | 63,937 | |
Other asset-backed | | | − | | | | 23 | | | | − | | | | 23 | |
Total | | $ | 83,223 | | | $ | 7,315 | | | $ | (26,578 | ) | | $ | 63,960 | |
| | | | | | | | | | | | | | | | | |
December 31, 2009: | | | | | | | | | | | | | | | | |
Commercial mortgage-backed securities | | $ | 92,110 | | | $ | 2,622 | | | $ | (50,214 | ) | | $ | 44,518 | |
Other asset-backed | | | 24 | | | | − | | | | − | | | | 24 | |
Total | | $ | 92,134 | | | $ | 2,622 | | | $ | (50,214 | ) | | $ | 44,542 | |
(1) | As of December 31, 2010 and 2009, $58.0 million and $39.3 million, respectively, of securities were pledged as collateral security under related financings. |
(2) | As of December 31, 2010 and 2009, other asset-backed securities are carried at fair value, $23,000 and $24,000, respectively, due to other-than-temporary impairment. |
RESOURCE CAPITAL CORP. AND SUBSIDIARIES
NOTES TO CONSOLIDATED FINANCIAL STATEMENTS – (Continued)
DECEMBER 31, 2010
NOTE 56 – INVESTMENT SECURITIES AVAILABLE-FOR-SALE – (Continued)
The following table summarizes the estimated maturities of the Company’s MBSCMBS and other ABS according to their estimated weighted average life classifications (in thousands, except percentages):
| | | | | | | | | | | | | | | | | | |
December 31, 2010: | | | | | | | | | | |
| December 31, 2011: | | | | | | | | | | |
Less than one year | | | $ | 61,137 | (1) | | $ | 65,485 | | | | 2.73% | |
Greater than one year and less than five years | | | | 69,376 | | | | 91,826 | | | | 4.75% | |
Greater than five years | | | | 25,596 | | | | 29,527 | | | | 3.90% | |
Greater than ten years | | | | 1,935 | | | | 3,187 | | | | 3.84% | |
Total | | | $ | 158,044 | | | $ | 190,025 | | | | 3.82% | |
| | | | | | | | | | | | | | |
| December 31, 2010: | | | | | | | | | | | | | |
Less than one year | | $ | 3,264 | (1) | | $ | 6,911 | | | | 1.51% | | | $ | 3,264 | (2) | | $ | 6,911 | | | | 1.51% | |
Greater than one year and less than five years | | | 29,004 | | | | 46,138 | | | | 3.45% | | | | 29,004 | | | | 46,138 | | | | 3.45% | |
Greater than five years | | | 31,692 | | | | 30,174 | | | | 5.64% | | | | 31,692 | | | | 30,174 | | | | 5.64% | |
Total | | $ | 63,960 | | | $ | 83,223 | | | | 4.08% | | | $ | 63,960 | | | $ | 83,223 | | | | 4.08% | |
| | | | | | | | | | | | | | |
December 31, 2009: | | | | | | | | | | | | | |
Less than one year | | $ | 7,503 | | | $ | 20,043 | | | | 1.50% | | |
Greater than one year and less than five years | | | 4,346 | | | | 12,728 | | | | 2.24% | | |
Greater than five years | | | 32,693 | | | | 59,363 | | | | 5.76% | | |
Total | | $ | 44,542 | | | $ | 92,134 | | | | 4.35% | | |
| (1) | $6.7 million of CMBS maturing in this category are collateralized by floating-rate loans and, as permitted under the CMBS terms, are expected to extend their maturities, because, beyond their contractual extensions which expired or will expire this year, the servicer may allow further extensions of the underlying floating rate loans. The Company expects that the remaining $53.5 million of CMBS will either be extended or be paid in full. |
| (2) | All of the $3.3 million of commercial mortgage-backed securities, or CMBS maturing in this category are collateralized by floating-rate loans and, as permitted under the CMBS terms, are expected to extend their respective maturity dates until at least November 2011 as the debtors in the floating-rate structures have a contractual right to extend with options ranging from two one-year options to three one-year options. Beyond the contractual extensions, the servicer may allow further extensions of the underlying floating rate loans. |
The contractual maturities of the CMBS investment securities available-for-sale range from November 2011August 2012 to February 2019.July 2022. The contractual maturities of the ABS investment securities available-for-sale range from March 2012 to August 2022.
The following table shows the fair value and gross unrealized losses, aggregated by investment category and length of time, ofthat those individual investment securities available-for-sale that have been in a continuous unrealized loss position (in thousands):
| | | | | | | | | | |
| | | | | | | | | | | | | | | | | | | |
| December 31, 2011: | | | | | | | | | | | | | | | | | | |
CMBS | | $ | 99,974 | | | $ | (17,096 | ) | | $ | 8,281 | | | $ | (12,788 | ) | | $ | 108,255 | | | $ | (29,884 | ) |
ABS | | | 13,583 | | | | (935 | ) | | | 4,473 | | | | (2,592 | ) | | | 18,056 | | | | (3,527 | ) |
Total temporarily impaired securities | | $ | 113,557 | | | $ | (18,031 | ) | | $ | 12,754 | | | $ | (15,380 | ) | | $ | 126,311 | | | $ | (33,411 | ) |
| | | | | | | | | | | | | | | | | | | | | | | | | |
| December 31, 2010: | | | | | | | | | | | | | | | | | | | | | | | | |
CMBS | | $ | 10,134 | | | $ | (4,383 | ) | | $ | 8,302 | | | $ | (22,195 | ) | | $ | 18,436 | | | $ | (26,578 | ) |
ABS | | | − | | | | − | | | | − | | | | − | | | | − | | | | − | |
Total temporarily impaired securities | | $ | 10,134 | | | $ | (4,383 | ) | | $ | 8,302 | | | $ | (22,195 | ) | | $ | 18,436 | | | $ | (26,578 | ) |
| | | | | | | | | | |
| | | | | | | | | | | | | | | | | | | |
December 31, 2010: | | | | | | | | | | | | | | | | | | |
Commercial mortgage- backed private placement | | $ | 10,134 | | | $ | (4,383 | ) | | $ | 8,302 | | | $ | (22,195 | ) | | $ | 18,436 | | | $ | (26,578 | ) |
Total temporarily impaired securities | | $ | 10,134 | | | $ | (4,383 | ) | | $ | 8,302 | | | $ | (22,195 | ) | | $ | 18,436 | | | $ | (26,578 | ) |
| | | | | | | | | | | | | | | | | | | | | | | | | |
December 31, 2009: | | | | | | | | | | | | | | | | | | | | | | | | |
Commercial mortgage- backed private placement | | $ | 11,193 | | | $ | (1,073 | ) | | $ | 14,588 | | | $ | (49,141 | ) | | $ | 25,781 | | | $ | (50,214 | ) |
Total temporarily impaired securities | | $ | 11,193 | | | $ | (1,073 | ) | | $ | 14,588 | | | $ | (49,141 | ) | | $ | 25,781 | | | $ | (50,214 | ) |
RESOURCE CAPITAL CORP. AND SUBSIDIARIES
NOTES TO CONSOLIDATED FINANCIAL STATEMENTS – (Continued)
DECEMBER 31, 2011
NOTE 6 – INVESTMENT SECURITIES AVAILABLE-FOR-SALE – (Continued)
The Company holdsheld eight and seven and 13CMBS investment securities available-for-sale that have been in a loss position for more than 12 months as of December 31, 2011 and 2010, and 2009, respectively. The Company held seven ABS investment securities available-for-sale that have been in a loss position for more than 12 months as of December 31, 2011. The unrealized losses in the above table are considered to be temporary impairments due to market factors and are not reflective of credit deterioration.
RESOURCE CAPITAL CORP. AND SUBSIDIARIES
NOTES TO CONSOLIDATED FINANCIAL STATEMENTS – (Continued)
DECEMBER 31, 2010
NOTE 5 – INVESTMENT SECURITIES AVAILABLE-FOR-SALE – (Continued)
The determination of other-than-temporary impairment is a subjective process, and different judgments and assumptions could affect the timing of loss realization. The Company reviews its portfolios and makes other-than-temporary impairment determinations at least quarterly. The Company considers the following factors when determining if there is an other-than-temporary impairment on a security:
| | ● | the length of time the market value has been less than amortized cost; |
| | ● | the severity of the impairment; |
| | ● | the expected loss of the security as generated by third party software; |
| ●
| credit ratings from the rating agencies; |
| ●
| underlying credit fundamentals of the collateral backing the securities; and |
| ●
| whether, based upon the Company’s intent, it is more likely than not that the Company will sell the security before the recovery of the amortized cost basis. |
At December 31, 2010 and 2009, the Company held $64.0 million and $44.5 million, respectively, (net of net unrealized losses of $19.3 million and $47.6 million, respectively) of CMBS recorded at fair value. To determine fair value, the Company uses two methods, either a dealer quote or an internal valuation model, depending upon when the position was purchased and the current level of market activity. As of December 31, 2010 and 2009, $53.7 million and $29.7 million, respectively, of investment securities available-for-sale were valued using dealer quotes and $10.3 million and $14.8 million, respectively, were valued as set forth in Note 2, “Summary of Significant Accounting Policies-Investment Securities.”
During the year ended December 31, 2010, the Company recognized $26.6 million of other-than-temporary impairment on five positions that supported the Company’s CMBS investments bringing the combined fair value of these positions to $215,000. During the year ended December 31, 2009, the Company recognized $12.6 million of other-than-temporary impairment on two positions that supported the Company’s CMBS investments and one of its other-ABS investments bringing the combined fair value of these positions to $206,000. The assumed default of the underlying collateral positions in the Company’s cash flow model yielded a value that would result in less than a full recovery of the Company’s cost basis. The net impairment losses were recognized in earnings in the consolidated statements of operations. All of the Company’s other-than-temporary impairment losses are related to credit losses. While the Company’s remaining securities classified as available-for-sale have continued to decline in fair value on a net basis, the Company concluded that the decline continues to be temporary. The Company performs an on-going review of third-party reports and updated financial data on the underlying property financial information to analyze current and projected loan performance. Rating agency downgrades are considered with respect to the Company’s income approach when determining other-than-temporary impairment and, when inputs are stressed, the resulting projected cash flows reflect a full recovery of principal. The Company does not believe that any other of its securities classified as available-for-sale were other-than-temporarily impaired as of December 31, 2010.
During the years ended December 31, 2010 and 2009, the Company recognized a gain of $5.0 million and $160,000, respectively, into earnings related to the sale of several CMBS private placement positions.
Changes in interest rates may also have an effect on the rate of mortgage principal prepayments and, as a result, prepayments on MBS in the Company’s investment portfolio. At December 31, 2010, the aggregate discount exceeded the aggregate premium on the Company’s MBS by approximately $20.9 million. At December 31, 2009, the aggregate discount exceeded the aggregate premium on the Company’s MBS by approximately $29.1 million.
RESOURCE CAPITAL CORP. AND SUBSIDIARIES
NOTES TO CONSOLIDATED FINANCIAL STATEMENTS – (Continued)
DECEMBER 31, 2010
NOTE 6 – INVESTMENT SECURITIES HELD-TO-MATURITY
The following table summarizes the Company's securities held-to-maturity which are carried at amortized cost (in thousands):
| | | | | | | | | | | | | |
December 31, 2010: | | | | | | | | | | | | |
Securities held-to-maturity | | $ | 29,036 | | | $ | 752 | | | $ | (3,847 | ) | | $ | 25,941 | |
Total | | $ | 29,036 | | | $ | 752 | | | $ | (3,847 | ) | | $ | 25,941 | |
| | | | | | | | | | | | | | | | | |
December 31, 2009: | | | | | | | | | | | | | | | | |
Securities held-to-maturity | | $ | 31,401 | | | $ | 267 | | | $ | (10,348 | ) | | $ | 21,320 | |
Total | | $ | 31,401 | | | $ | 267 | | | $ | (10,348 | ) | | $ | 21,320 | |
The following table summarizes the estimated maturities of the Company’s securities held-to-maturity according to their contractual lives (in thousands):
| | | | | | | | | |
December 31, 2010: | | | | | | | | | |
Greater than one year and less than five years | | $ | 4,830 | | | $ | 5,000 | | | | 6.14% | |
Greater than five years and less than ten years | | | 15,073 | | | | 15,891 | | | | 1.97% | |
Greater than ten years | | | 6,038 | | | | 8,145 | | | | 4.11% | |
Total | | $ | 25,941 | | | $ | 29,036 | | | | | |
| | | | | | | | | | | | | |
December 31, 2009: | | | | | | | | | | | | |
Greater than five years and less than ten years | | $ | 15,628 | | | $ | 19,667 | | | | 3.06% | |
Greater than ten years | | | 5,692 | | | | 11,734 | | | | 4.14% | |
Total | | $ | 21,320 | | | $ | 31,401 | | | | | |
The following table shows the fair value and gross unrealized losses, aggregated by investment category and length of time, of those individual investment securities that have been in a continuous unrealized loss position (in thousands):
| | | | | | | | | | |
| | | | | | | | | | | | | | | | | | | |
December 31, 2010: | | | | | | | | | | | | | | | | | | |
Securities held-to-maturity | | $ | 1,038 | | | $ | (1 | ) | | $ | 11,923 | | | $ | (3,846 | ) | | $ | 12,961 | | | $ | (3,847 | ) |
Total temporarily impaired securities | | $ | 1,038 | | | $ | (1 | ) | | $ | 11,923 | | | $ | (3,846 | ) | | $ | 12,961 | | | $ | (3,847 | ) |
| | | | | | | | | | | | | | | | | | | | | | | | | |
December 31, 2009: | | | | | | | | | | | | | | | | | | | | | | | | |
Securities held-to-maturity | | $ | 2,530 | | | $ | (44 | ) | | $ | 10,980 | | | $ | (10,304 | ) | | $ | 13,510 | | | $ | (10,348 | ) |
Total temporarily impaired securities | | $ | 2,530 | | | $ | (44 | ) | | $ | 10,980 | | | $ | (10,304 | ) | | $ | 13,510 | | | $ | (10,348 | ) |
RESOURCE CAPITAL CORP. AND SUBSIDIARIES
NOTES TO CONSOLIDATED FINANCIAL STATEMENTS – (Continued)
DECEMBER 31, 2010
NOTE 6 – INVESTMENT SECURITIES HELD-TO-MATURITY – (Continued)
The Company holds 12 and 14 investment securities held-to-maturity that have been in a loss position for more than 12 months as of December 31, 2010 and 2009, respectively. The unrealized losses in the above table are considered to be temporary impairments due to market factors and are not reflective of credit deterioration. The Company does not believe that any of its investments classified as held-to-maturity were other-than-temporarily impaired as of December 31, 2010.
The determination of other-than-temporary impairment is a subjective process, and different judgments and assumptions could affect the timing of loss realization. The Company reviews its portfolios and makes other-than-temporary impairment determinations at least quarterly. The Company considers the following factors when determining if there is an other-than-temporary impairment on a security:
| ●
| the severity of the impairment; |
| ●
| the expected loss of the security as generated by third party software;a third-party valuation model; |
| | ● | original and current credit ratings from the rating agencies; |
| | ● | underlying credit fundamentals of the collateral backing the securities; and |
| ● | whether, based upon the Company’s intent, it is more likely than not that the Company will sell the security before the recovery of the amortized cost basis; |
| | ● | third-party support for default, for recovery, prepayment speed and reinvestment price assumptions. |
At December 31, 2011 and 2010, the Company held $132.8 million and $64.0 million, respectively, (net of net unrealized losses of $28.7 million and $19.3 million, respectively), of CMBS recorded at fair value. To determine fair value, the Company uses two methods, either a dealer quote or an internal valuation model, depending upon the current level of market activity. As of December 31, 2011 and 2010, $123.9 million and $53.7 million, respectively, of investment securities available-for-sale were valued using dealer quotes and $8.9 million and $10.3 million, respectively, were valued using a weighted average of three measures (see Note 2).
At December 31, 2011, the Company held $25.2 million, (net of net unrealized losses of $3.3 million), of ABS recorded at fair value (see Note 2). These securities were classified as securities held-to-maturity as of December 31, 2010. To determine their fair value, the Company uses dealer quotes.
During the year ended December 31, 2009, based2011, the Company recognized $4.6 million of other-than-temporary impairment on a credit rating downgrade and the cash flow analysis performed, a collateralone fixed rate position that supported the Company’s CMBS investments, held-to-maturity became impaired asbringing the fair value of this position to $200,000. During the year ended December 31, 2010, the Company recognized $26.6 million of other-than-temporary impairment on five fixed rate positions that supported the Company’s CMBS investments, bringing the fair value of these positions to $215,000. The assumed default of the underlying collateral positions in the Company’s cash flow model yielded a value of less than full recovery of the Company’s cost basis. As a result, the Company recognized an $895,000 other-than-temporary impairment on one of its investments held-to-maturity as of December 31, 2009. As a result of the impairment charges, the cost of this security was written down to fair value throughThe net impairment losses were recognized in earnings in the consolidated statements of operations. All of the Company’s other-than-temporary impairment losses are related to credit losses.
During the year ended December 31, 2011, the Company recognized a gain of $3.5 million related to the sale of one CMBS private placement position. During the year ended December 31, 2010, the Company recognized a gain of $5.0 million related to the sale of five CMBS private placement positions.
During the years ended December 31, 20102011 and 2009, based on the downgrading of the issuers’ published credit rating,2010, the Company sold $8.1 million and $3.5 million and $6.6 million of ABS securities. In November 2011, the ABS investment securities held-to-maturity respectively including the position it impaired during the year ended December 31, 2009. The Company has the intent and abilityportfolio was reclassified to hold its remaininginvestment securities until maturity.available-for-sale.
Changes in interest rates may also have an effect on the rate of mortgage principal prepayments and, as a result, prepayments on CMBS in the Company’s investment portfolio. At December 31, 2011, the aggregate discount exceeded the aggregate premium on the Company’s CMBS by approximately $13.2 million. At December 31, 2010, the aggregate discount exceeded the aggregate premium on the Company’s CMBS by approximately $20.9 million. At December 31, 2011 and 2010 the discount on the Company’s ABS portfolio was $3.8 million and $2.8 million, respectively. There were no premiums on the Company’s ABS investment portfolio.
RESOURCE CAPITAL CORP. AND SUBSIDIARIES
NOTES TO CONSOLIDATED FINANCIAL STATEMENTS – (Continued)
DECEMBER 31, 20102011
NOTE 7 – INVESTMENT SECURITIES HELD-TO-MATURITY
In November 2011, the Company’s investment securities held-to-maturity were reclassified to investment securities available-for-sale since the Company no longer intended to hold these positions until maturity. These investments are now held at fair value with any unrealized gain or loss is reported in the stockholder’s equity section of the balance sheet. Comparable current year data for the Company’s ABS can be found in Note 6.
The following table summarizes the Company's investment securities held-to-maturity which are carried at amortized cost (in thousands):
| | | | | | | | | | | | | |
| December 31, 2010: | | | | | | | | | | | | |
ABS | | $ | 29,036 | | | $ | 752 | | | $ | (3,847 | ) | | $ | 25,941 | |
Total | | $ | 29,036 | | | $ | 752 | | | $ | (3,847 | ) | | $ | 25,941 | |
The following table summarizes the estimated maturities of the Company’s securities held-to-maturity according to their contractual lives (in thousands):
| | | | | | | | | |
| December 31, 2010: | | | | | | | | | |
Less than one year | | $ | − | | | $ | − | | | | − % | |
Greater than one year and less than five years | | | 5,000 | | | | 4,830 | | | | 6.14% | |
Greater than five years and less than ten years | | | 15,891 | | | | 15,073 | | | | 1.97% | |
Greater than ten years | | | 8,145 | | | | 6,038 | | | | 4.11% | |
Total | | $ | 29,036 | | | $ | 25,941 | | | | | |
The following table shows the fair value and gross unrealized losses, aggregated by investment category and length of time, of those individual investment securities that have been in a continuous unrealized loss position (in thousands):
| | | | | | | | | | |
| | | | | | | | | | | | | | | | | | | |
| December 31, 2010: | | | | | | | | | | | | | | | | | | |
ABS | | $ | 1,038 | | | $ | (1 | ) | | $ | 11,923 | | | $ | (3,846 | ) | | $ | 12,961 | | | $ | (3,847 | ) |
Total temporarily impaired securities | | $ | 1,038 | | | $ | (1 | ) | | $ | 11,923 | | | $ | (3,846 | ) | | $ | 12,961 | | | $ | (3,847 | ) |
The Company held 12 investment securities held-to-maturity that had been in a loss position for more than 12 months as of December 31, 2010. The unrealized losses in the above table were considered to be temporary impairments due to market factors and were not reflective of credit deterioration.
RESOURCE CAPITAL CORP. AND SUBSIDIARIES
NOTES TO CONSOLIDATED FINANCIAL STATEMENTS – (Continued)
DECEMBER 31, 2011
NOTE 8 – INVESTMENTS IN REAL ESTATE
The table below summarizes the Company’s investments in real estate (in thousands):
| | | | |
| | | | | | | |
Multi-family property | | $ | 38,577 | | | | 2 | |
Office property | | | 10,149 | | | | 1 | |
Subtotal | | | 48,726 | | | | | |
Less: Accumulated depreciation | | | (699 | ) | | | | |
Investments in real estate | | $ | 48,027 | | | | | |
The Company had no investments in real estate as of December 31, 2010.
Acquisitions
During the year ended December 31, 2011, the Company converted two loans it had originated to investments in real estate and acquired one real estate asset, summarized as follows:
| ● | On June 14, 2011, the Company converted a loan that it had originated to equity with a fair value of $22.4 million at acquisition. The loan was collateralized by a 400 unit multi-family property in Memphis, Tennessee. The property was 93.8% occupied at acquisition. |
| ● | On June 24, 2011, the Company converted a loan that it had originated to equity with a fair value of $10.7 million at acquisition. The loan was collateralized by an office building in Pacific Palisades, California. The property was 60% occupied at acquisition. In conjunction with the purchase of this property, we entered into a mortgage in the amount of $13.6 million. |
| ● | On August 1, 2011, the Company, through its subsidiary RCC Real Estate, purchased Whispertree Apartments, a 504 multi-family property located in Houston, Texas, for $18.1 million, the fair value. The property was 95% occupied at acquisition. |
A summary of the aggregate estimated fair value of the assets and liabilities acquired on the respective dates of acquisition are presented below (in thousands):
| | | |
| Assets acquired: | | | |
Investments in real estate | | $ | 48,683 | |
Cash and cash equivalents | | | 177 | |
Restricted cash | | | 2,360 | |
Intangible assets | | | 2,490 | |
Other assets | | | 391 | |
Total assets acquired | | | 54,101 | |
| Liabilities assumed: | | | | |
Accounts payable and other liabilities | | | 673 | |
Total liabilities assumed | | | 673 | |
Estimated fair value of net assets acquired | | $ | 53,428 | |
The Company accounted for the acquisition of Whispertree Apartments as a business combination in accordance with FASB ASC Topic 805. In the fourth quarter of 2011, the Company obtained the final appraisal of the property. Based on the final appraisal, the Company adjusted the value of the land and the value of the building by $3.9 million, respectively, as of the acquisition date. Accordingly, these adjustments were recognized and are reflected in the consolidated financial statements as of December 31, 2011.
RESOURCE CAPITAL CORP. AND SUBSIDIARIES
NOTES TO CONSOLIDATED FINANCIAL STATEMENTS – (Continued)
DECEMBER 31, 2011
NOTE 8 – INVESTMENTS IN REAL ESTATE – (Continued)
Acquisitions – (Continued)
The following unaudited pro forma information, after including the acquisition of real properties, is presented below as if the acquisitions occurred on January 1, 2010. The pro forma results are not necessarily indicative of the results which actually would have occurred if the acquisition had occurred on the first day of the periods presented, nor is it indicative of the Company’s future results (in thousands):
| | | Years Ended | |
| | | | |
| | | | | | | |
| Description: | | | | | | |
Total revenue, as reported | | $ | 94,163 | | | $ | 67,445 | |
Pro forma revenue | | $ | 99,012 | | | $ | 74,830 | |
Net income, reported | | $ | 52,818 | | | $ | 34,837 | |
Pro forma net income | | $ | 51,548 | | | $ | 33,640 | |
| | | | | | | | | |
Earnings per share – basic, reported | | $ | 0.54 | | | $ | 0.41 | |
Earnings per share per – diluted, reported | | $ | 0.53 | | | $ | 0.41 | |
Pro forma earnings per share - basic | | $ | 0.73 | | | $ | 0.71 | |
Pro forma earnings per share - diluted | | $ | 0.73 | | | $ | 0.70 | |
These amounts have been calculated after adjusting the results of the acquired properties to reflect the additional depreciation and amortization that would have been charged assuming the fair value adjustments to the Company’s investments in real estate had been applied from January 1, 2010.
NOTE 9 – LOANS HELD FOR INVESTMENT
The following is a summary of the Company’s loans (in thousands):
| | | | | Unamortized | | | | | | | | | Unamortized | | | | |
December 31, 2010: | | | | | | | | | | |
| December 31, 2011: | | | | | | | | | | |
Bank loans (3) | | $ | 887,667 | | | $ | (27,204 | ) | | $ | 860,463 | | | $ | 1,205,826 | | | $ | (32,073 | ) | | $ | 1,173,753 | |
Commercial real estate loans: | | | | | | | | | | | | | | | | | | | | | | | | |
Whole loans | | | 441,706 | | | | (334 | ) | | | 441,372 | | | | 545,828 | | | | (1,155 | ) | | | 544,673 | |
B notes | | | 57,613 | | | | (162 | ) | | | 57,451 | | | | 16,579 | | | | (144 | ) | | | 16,435 | |
Mezzanine loans (3) | | | 146,668 | | | | 143 | | | | 146,811 | | | | 67,842 | | | | 32 | | | | 67,874 | |
Total commercial real estate loans | | | 645,987 | | | | (353 | ) | | | 645,634 | | | | 630,249 | | | | (1,267 | ) | | | 628,982 | |
Subtotal loans before allowances | | | 1,533,654 | | | | (27,557 | ) | | | 1,506,097 | | | | 1,836,075 | | | | (33,340 | ) | | | 1,802,735 | |
Allowance for loan loss | | | (34,233 | ) | | | − | | | | (34,233 | ) | | | (27,518 | ) | | | − | | | | (27,518 | ) |
Total | | $ | 1,499,421 | | | $ | (27,557 | ) | | $ | 1,471,864 | | | $ | 1,808,557 | | | $ | (33,340 | ) | | $ | 1,775,217 | |
| | | | | | | | | | | | | | | | | | | | | | | | | |
December 31, 2009: | | | | | | | | | | | | | |
| December 31, 2010: | | | | | | | | | | | | | |
Bank loans (3) | | $ | 893,183 | | | $ | (27,931 | ) | | $ | 865,252 | | | $ | 887,667 | | | $ | (27,204 | ) | | $ | 860,463 | |
Commercial real estate loans: | | | | | | | | | | | | | | | | | | | | | | | | |
Whole loans | | | 484,464 | | | | (929 | ) | | | 483,535 | | | | 441,706 | | | | (334 | ) | | | 441,372 | |
B notes | | | 81,450 | | | | 6 | | | | 81,456 | | | | 57,613 | | | | (162 | ) | | | 57,451 | |
Mezzanine loans | | | 182,523 | | | | 163 | | | | 182,686 | | |
Mezzanine loans (3) | | | | 146,668 | | | | 143 | | | | 146,811 | |
Total commercial real estate loans | | | 748,437 | | | | (760 | ) | | | 747,677 | | | | 645,987 | | | | (353 | ) | | | 645,634 | |
Subtotal loans before allowances | | | 1,641,620 | | | | (28,691 | ) | | | 1,612,929 | | | | 1,533,654 | | | | (27,557 | ) | | | 1,506,097 | |
Allowance for loan loss | | | (47,122 | ) | | | − | | | | (47,122 | ) | | | (34,233 | ) | | | − | | | | (34,233 | ) |
Total | | $ | 1,594,498 | | | $ | (28,691 | ) | | $ | 1,565,807 | | | $ | 1,499,421 | | | $ | (27,557 | ) | | $ | 1,471,864 | |
RESOURCE CAPITAL CORP. AND SUBSIDIARIES
NOTES TO CONSOLIDATED FINANCIAL STATEMENTS – (Continued)
DECEMBER 31, 2011
NOTE 9 – LOANS HELD FOR INVESTMENT – (Continued)
| (1) | Amounts include deferred amendment fees of $636,000$286,000 and $249,000$636,000 being amortized over the life of the bank loans and $124,000$123,000 and $681,000$124,000 being amortized over the life of the commercial real estate loans as of December 31, 20102011 and 2009,2010, respectively. |
| (2) | Substantially all loans are pledged as collateral under various borrowings at December 31, 20102011 and 2009,2010, respectively. |
| (3) | Amounts include $3.2 million of bank loans as of December 31, 2011 and $4.0 million of bank loans and $24.6 million of mezzanine loans held for sale as of December 31, 2010 and $8.1 million of bank loans held for sale as of December 31, 2009.2010. |
As ofAt December 31, 2011 and 2010, approximately 41.9% and 2009, approximately 38.0% and 39.0%, respectively, of the Company’s commercial real estate loan portfolio was concentrated in commercial real estate loans located in CaliforniaCalifornia; approximately 9.1% and 10.4% and 12.4%8.8%, respectively, werein Arizona; 1.6% and 10.4%, respectively, was concentrated in New York. As ofYork; and approximately 8.0% in Florida. At December 31, 2011 and 2010, approximately 13.9% and 2009, approximately 10.7% and 12.4%, respectively, of the Company’s bank loan portfolio was concentrated in the collective industry grouping of healthcare, education and childcare.
At December 31, 2011, the Company’s bank loan portfolio consisted of $1.2 billion (net of allowance of $3.3 million) of floating rate loans, which bear interest ranging between the London Interbank Offered Rate (“LIBOR”) plus 1.1% and LIBOR plus 10.6% with maturity dates ranging from March 2012 to September 2019. At December 31, 2010, the Company’s bank loan portfolio consisted of $857.9 million (net of allowance of $2.6 million) of floating rate loans, which bear interest ranging between the London Interbank Offered Rate (“LIBOR”)LIBOR plus 0.5% and LIBOR plus 9.5% with maturity dates ranging from March 2011 to December 2017.
At December 31, 2009,The following is a summary of the weighted average life of the Company’s bank loan portfolio consisted of $847.4 million (net of allowance of $17.8 million) of floating rate loans, which bore interest ranging between LIBOR plus 0.50% and LIBOR plus 18.25% with maturity dates ranging from June 2011 to August 2022.at amortized cost (in thousands):
| | | Years Ended | |
| | | | |
| | | | | | | |
Less than one year | | $ | 1,968 | | | $ | 4,245 | |
Greater than one year and less than five years | | | 684,376 | | | | 643,699 | |
Five years or greater | | | 487,409 | | | | 212,519 | |
| | | $ | 1,173,753 | | | $ | 860,463 | |
RESOURCE CAPITAL CORP. AND SUBSIDIARIES
NOTES TO CONSOLIDATED FINANCIAL STATEMENTS – (Continued)
DECEMBER 31, 20102011
NOTE 79 – LOANS HELD FOR INVESTMENT – (Continued)
The following is a summary of the weighted average life of the Company’s bank loans’, at amortized cost (in thousands):
| | | December 31, | | | December 31, | |
| | | | | | | |
Less than one year | | $ | 4,245 | | | $ | 1,148 | |
Greater than one year and less than five years | | | 643,699 | | | | 801,175 | |
Five years or greater | | | 212,519 | | | | 62,929 | |
| | | $ | 860,463 | | | $ | 865,252 | |
The following is a summary of the Company’s commercial real estate loans (in thousands):
| | | | | | | | | | | | | | | | | | | |
December 31, 2010: | | | | | | | | | | |
| December 31, 2011: | | | | | | | | | | | |
Whole loans, floating rate (1) (5) | | | | 32 | | | $ | 537,708 | | | LIBOR plus 2.50% to LIBOR plus 5.75% | | April 2012 to February 2019 |
Whole loans, fixed rate | | | | 1 | | | | 6,965 | | | | 10.00% | | June 2012 |
B notes, fixed rate | | | | 1 | | | | 16,435 | | | | 8.68% | | April 2016 |
Mezzanine loans, floating rate | | | | 3 | | | | 53,908 | | | LIBOR plus 2.50% to LIBOR plus 7.45% | | May 2012 to December 2012 |
Mezzanine loans, fixed rate (2) | | | | 2 | | | | 13,966 | | | 8.99% to 11.00% | | January 2016 to September 2016 |
Total (3) | | | | 39 | | | $ | 628,982 | | | | | | |
| | | | | | | | | | | | | | | |
| December 31, 2010: | | | | | | | | | | | | | | |
Whole loans, floating rate (1) | | | 25 | | | $ | 441,372 | | LIBOR plus 1.50% to LIBOR plus 5.75% | | May 2011 to January 2018 | | | 25 | | | $ | 441,372 | | | LIBOR plus 1.50% to LIBOR plus 5.75% | | May 2011 to January 2018 |
B notes, floating rate | | | 2 | | | | 26,485 | | LIBOR plus 2.50% to LIBOR plus 3.01% | | July 2011 to October 2011 | | | 2 | | | | 26,485 | | | LIBOR plus 2.50% to LIBOR plus 3.01% | | July 2011 to October 2011 |
B notes, fixed rate | | | 2 | | | | 30,966 | | 7.00% to 8.68% | | July 2011 to April 2016 | | | 2 | | | | 30,966 | | | 7.00% to 8.68% | | July 2011 to April 2016 |
Mezzanine loans, floating rate | | | 6 | | | | 93,266 | | LIBOR plus 2.15% to LIBOR plus 3.00% | | May 2011 to January 2013 | | | 6 | | | | 93,266 | | | LIBOR plus 2.15% to LIBOR plus 3.00% | | May 2011 to January 2013 |
Mezzanine loans, fixed rate (2) | | | 5 | | | | 53,545 | | 8.14% to 11.00% | | January 2016 to September 2016 | | | 5 | | | | 53,545 | | | 8.14% to 11.00% | | January 2016 to September 2016 |
Total (3) | | | 40 | | | $ | 645,634 | | | | | | | 40 | | | $ | 645,634 | | | | | | |
| | | | | | | | | | | | | |
December 31, 2009: | | | | | | | | | | | | |
Whole loans, floating rate (1) | | | 22 | | | $ | 403,230 | | LIBOR plus 1.50% to LIBOR plus 4.40% | | May 2010 to February 2017 | |
Whole loans, fixed rate (1) | | | 5 | | | | 80,305 | | 6.98% to 10.00% | | May 2010 to August 2012 | |
B notes, floating rate | | | 2 | | | | 26,479 | | LIBOR plus 2.50% to LIBOR plus 3.01% | | July 2010 to October 2010 | |
B notes, fixed rate | | | 3 | | | | 54,977 | | 7.00% to 8.68% | | July 2011 to July 2016 | |
Mezzanine loans, floating rate | | | 7 | | | | 124,048 | | LIBOR plus 2.15% to LIBOR plus 3.45% | | May 2010 to January 2013 | |
Mezzanine loans, fixed rate | | | 5 | | | | 58,638 | | 8.14% to 11.00% | | May 2010 to September 2016 | |
Total (3) | | | 44 | | | $ | 747,677 | | | | | |
| (1) | Whole loans had $5.0$5.2 million and $5.6$5.0 million in unfunded loan commitments as of December 31, 20102011 and 2009,2010, respectively. These commitments are funded as the loans require additional funding and the related borrowers have satisfied the requirements to obtain this additional funding. |
| (2) | Fixed rate mezzanine loan dates exclude a loan that matured in May 2010, and iswas in default and hashad been on non-accrual status as of December 31, 2010 and December 31, 2009, respectively.since its default. The loan was written off in March 2011. |
| (3) | The total does not include an allowance for loan losses of $31.6$24.2 million and $29.3$31.6 million recorded as of December 31, 20102011 and 2009,2010, respectively. |
| (4) | Maturity dates do not include possible extension options that may be available to the borrowers. |
| (5) | Floating rate whole loans includes a $2.0 million mezzanine portion of a whole loan that has a fixed rate of 15.0% and a preferred equity loan for $302,000 that has a fixed rate of 10% as of December 31, 2011. |
During the year ended December 31, 2011, the Company converted a loan collateralized by a multi-family apartment property to an equity position. After determining the fair value of the apartment building, the Company determined that there was no gain or loss on conversion of the property. The Company classified this property as investments in real estate with a carrying value of $21.1 million at December 31, 2011.
RESOURCE CAPITAL CORP. AND SUBSIDIARIES
NOTES TO CONSOLIDATED FINANCIAL STATEMENTS – (Continued)
DECEMBER 31, 20102011
NOTE 79 – LOANS HELD FOR INVESTMENT – (Continued)
Subsequent to December 31, 2010, the Company entered into and completed sale agreements for two commercial real estate loans. One was a loan secured by an office tower in New York City where the Company had engaged a consulting firm to market the property which sold at 75% of par, resulting in a loss of $5.1 million after writing off unamortized loan origination costs. As part of the agreement, the consulting company earned the maximum fee of $500,000. The second loan was secured by a portfolio of office complexes throughout the United States that sold at 50% of par resulting in a loss of $9.6 million of which $290,000 had been previously allocated as part of the Company’s general reserve. The Company classified both loans as loans held for sale as of December 31, 2010.
During the year ended December 31, 2010,2011, the Company acceptedconverted a bankruptcy court-approved settlement on a portfolio of condominiums that had been in default since July 2009 and after receiving a settlement pay-down of $2.3 million that brought the loan balancecollateralized by an office building to $5.0 million.an equity position. After a review of the projected sale proceeds,fair value of the office building, the Company determined a provision of $648,000$1.7 million was needed and upon foreclosure, theneeded. The Company classified thethis property as property available-for-saleinvestments in real estate with a faircarrying value of $4.4$10.0 million at December 31, 2010.2011.
The following is a summary of the weighted average life of the Company’s commercial real estate loans, at amortized cost (in thousands):
| | | | | | | | | | | | | | | | | | | | | |
December 31, 2010: | | | | | | | | | | |
| December 31, 2011: | | | | | | | | | | | | | |
B notes | | $ | 40,913 | | | $ | − | | | $ | 16,538 | | | $ | − | | | $ | − | | | $ | 16,435 | | | $ | 16,435 | |
Mezzanine loans (1) | | | − | | | | 34,676 | | | | 107,135 | | |
Mezzanine loans | | | | 38,072 | | | | 5,319 | | | | 24,483 | | | | 67,874 | |
Whole loans | | | 108,303 | | | | 87,084 | | | | 245,985 | | | | 97,327 | | | | 3,250 | | | | 444,096 | | | | 544,673 | |
Total (2) | | $ | 149,216 | | | $ | 121,760 | | | $ | 369,658 | | |
Total (1) | | | $ | 135,399 | | | $ | 8,569 | | | $ | 485,014 | | | $ | 628,982 | |
(1) Mezzanine loans exclude one loan with an amortized cost of $5.0 million which matured in May 2010 and is in default.| (1) | Weighted average life of commercial real estate loans assumes full exercise of extension options available to borrowers. |
(2) Weighted average life of commercial real estate loans assumes full exercise of extension options available to borrowers.
The following is a summary of the allocation of the allowance for loan loss with respect to the Company’s commercial real estate and bank loans (in thousands, except percentages) by asset class:
| Description | | | | | Percentage of Total Allowance | | | | | | Percentage of Total Allowance | |
December 31, 2010: | | | | | | | |
| December 31, 2011: | | | | | | | |
B notes | | $ | 899 | | | | 2.6% | | | $ | 253 | | | | 0.92% | |
Mezzanine loans | | | 8,553 | | | | 25.0% | | | | 1,437 | | | | 5.23% | |
Whole loans | | | 22,165 | | | | 64.8% | | | | 22,531 | | | | 81.87% | |
Bank loans | | | 2,616 | | | | 7.6% | | | | 3,297 | | | | 11.98% | |
Total | | $ | 34,233 | | | | | | | $ | 27,518 | | | | | |
| | | | | | | | | | | | | | | | | |
December 31, 2009: | | | | | | | | | |
| December 31, 2010: | | | | | | | | | |
B notes | | $ | 667 | | | | 1.4% | | | $ | 899 | | | | 2.6% | |
Mezzanine loans | | | 6,453 | | | | 13.7% | | | | 8,553 | | | | 25.0% | |
Whole loans | | | 22,177 | | | | 47.1% | | | | 22,165 | | | | 64.8% | |
Bank loans | | | 17,825 | | | | 37.8% | | | | 2,616 | | | | 7.6% | |
Total | | $ | 47,122 | | | | | | | $ | 34,233 | | | | | |
As of December 31, 2011, the Company had recorded an allowance for loan losses of $27.5 million consisting of a $3.3 million allowance on the Company’s bank loan portfolio and a $24.2 million allowance on the Company’s commercial real estate portfolio as a result of the impairment of one bank loan and four commercial real estate loans as well as the maintenance of a general reserve with respect to these portfolios.
As of December 31, 2010, the Company had recorded an allowance for loan losses of $34.2 million consisting of a $2.6 million allowance on the Company’s bank loan portfolio and a $31.6 million allowance on the Company’s commercial real estate portfolio as a result of the impairment of one bank loan and eight commercial real estate loans as well as the provisionmaintenance of a general reserve with respect to these portfolios.
RESOURCE CAPITAL CORP. AND SUBSIDIARIES
NOTES TO CONSOLIDATED FINANCIAL STATEMENTS – (Continued)
DECEMBER 31, 20102011
NOTE 710 – LOANS HELD FOR INVESTMENT – (Continued)INVESTMENTS IN UNCONSOLIDATED ENTITIES
As of December 31, 2009,On November 16, 2011, the Company had recorded an allowancetogether with LEAF Financial and LEAF Commercial Capital, Inc. (“LCC”), a commercial finance company specializing in equipment leasing formed in January 2011, subsidiaries of Resource America, entered into a stock purchase agreement and related agreements (collectively the “SPA”) with Eos Partners, L.P., a private investment firm, and its affiliates (“Eos”). In exchange for loan lossesits prior interest in LCC, the Company received 31,341 shares of $47.1 million consistingSeries A Preferred Stock, 4,872 shares of newly issued 8% Series B Redeemable Preferred Stock (the “Series B Preferred Stock”) and 2,364 shares of newly issued Series D Redeemable Preferred Stock (the “Series D Preferred Stock”), collectively representing, on a $17.8 million allowance onfully-diluted basis assuming conversion, a 26.7% interest in LCC. Several approaches were used, including discounted expected cash flows, market approach and comparable sales transactions to estimate the Company’s bank loan portfolio and a $29.3 million allowance on the Company’s commercial real estate portfoliofair value of its investment in LCC as a result of the impairmenttransaction. These approaches required assumptions and estimates of seven bank loansmany critical factors, including revenue and three commercial real estate loansmarket growth, operating cash flows, market multiples, and discount rates, which were based on the current economic environment and credit market conditions. The Company’s investment in LCC was valued at $36.3 million based on a third-party valuation. Accordingly, the Company recorded a loss of $2.2 million in conjunction with the transaction. Subsequent to this transaction, the Company’s resulting interest will be accounted for under the equity method.
The Company has a 100% interest valued at $1.5 million in the common shares (three percent of the total equity) in two trusts, Resource Capital Trust I (“RCT I”) and RCC Trust II (“RCT II”). The Company completed a qualitative analysis to determine whether or not it is the primary beneficiary of each of the trusts. The Company does not have the power to direct the activities of either trust, nor does it have the obligation to absorb losses or the right to receive benefits that could potentially be significant to these trusts. Therefore, the Company is not deemed to be the primary beneficiary of either trust and they are not consolidated into the Company’s consolidated financial statements. The Company records its investments in RCT I and RCT II’s common shares of $774,000 each as well asinvestments in unconsolidated trusts using the provisioncost method and records dividend income upon declaration by RCT I and RCT II. For the years ended December 31, 2011, and 2010, the Company recognized $3.0 million and $3.6 million, respectively, of a general reserveinterest expense with respect to these portfolios.the subordinated debentures it issued to RCT I and RCT II which included $277,000 and $302,000, respectively, of amortization of deferred debt issuance costs. The Company will continuously reassess as to whether it should be deemed to be the primary beneficiary of the trusts.
NOTE 811 –LEASE RECEIVABLES
In May 2010, the Company closed a $120.0 million securitization. The securitization, LEAF Equipment Leasing Income Fund III, L.P. (“LEAF Funding 3,3”), issued equipment-backed securitized notes at a weighted average discounted price of 93.6% with a weighted average interest rate of 7.85% and a weighted average life of 1.89 years. At closing, $14.4 million of the proceeds were placed into a restricted account and were used as new leases were originated by LEAF Funding 3 together with an additional equity contribution by the Company of approximately $1.2 million. The notes can be prepaid upon reaching 15% of the original issuance amount through an auction call provision or upon reaching 10% through a standard clean-up. The transaction was structured and purchased by a third party,third-party, who then sold the securitization to the Company. The Company had $21.0 million of equity invested in LEAF Funding 3 as of December 31, 2010. The Company evaluated this transaction and determined that the securitization was a VIE and that the Company was the primary beneficiary. Therefore, the securitization hashad been consolidated onto the Company’s consolidated financial statements. TheOn January 4, 2011, the Company will domade an investment, in conjunction with a continuous reassessmentdebt financing commitment from Guggenheim Securities, in LCC. LEAF contributed its leasing platform and directly-held leases and loans to LCC while the Company and Guggenheim Securities committed to investing up to $44.0 million of its conclusion, as required.capital (which included an option in LCC to require the Company to invest an additional $10 million at a later date) in the form of preferred stock and subordinated debt, respectively, into LCC. A portion of the Company’s investment consisted of the contribution of leases and loans and equity in these investments it had acquired from LEAF. In return, the Company received 2,626 shares of LEAF Commercial Series A preferred stock and warrants to purchase 4,800 shares of LCC common stock for an exercise price of $0.01 per share (representing 48% of LCC’s common stock on a fully-diluted basis). Subsequently, on November 16, 2011, in connection with an investment made by Eos, the Company’s investment was converted into series A, B and D preferred stock (see Note 10).
The Company has the right to require LEAF Funding to repurchase credit impaired contracts or replace such contracts with performing contracts. LEAF Funding would have to repurchase or provide substitute contracts for each credit impaired contract at an amount equal to the discounted contract balance plus any overdue payments. LEAF Fundings repurchase obligation is limited to leases with aggregate discounted contract balances of no more than 5% of the aggregate discounted contract balance of all of the contracts sold by LEAF Funding to the Company.
The Company’s lease receivables had weighted average initial lease and loan terms of 53 months and 65 months as of December 31, 2010 and 2009, respectively. The interest rates on lease receivables range from 8% to 14% and from 8.0% to 15.0% as of December 31, 2010 and 2009, respectively. Investments in leases, net of unearned income, were as follows (in thousands):
| | | | |
| | | | | | | |
Leases, net of unearned income | | $ | 75,908 | | | $ | 1,397 | |
Operating leases | | | 17,900 | | | | − | |
Notes receivable | | | 15,874 | | | | 670 | |
Subtotal | | | 109,682 | | | | 2,067 | |
Allowance for lease losses | | | (70 | ) | | | (1,140 | ) |
Total | | $ | 109,612 | | | $ | 927 | |
The components of net investment in leases are as follows (in thousands):
| | | | |
| | | | | | | |
Total future minimum lease payments | | $ | 86,191 | | | $ | 1,610 | |
Unguaranteed residual | | | 4,393 | | | | − | |
Unearned income | | | (14,676 | ) | | | (213 | ) |
Total | | $ | 75,908 | | | $ | 1,397 | |
RESOURCE CAPITAL CORP. AND SUBSIDIARIES
NOTES TO CONSOLIDATED FINANCIAL STATEMENTS – (Continued)
DECEMBER 31, 20102011
NOTE 811 –LEASE RECEIVABLES – (Continued)
The components of net investment in operating leases are as follows (in thousands):
| | | | |
| | | | | | | |
Investment in operating leases | | $ | 21,903 | | | $ | − | |
Accumulated depreciation | | | (4,003 | ) | | | − | |
Total | | $ | 17,900 | | | $ | − | |
The Company did not have any direct financing leases as of December 31, 2011. As of December 31, 2010, or 2009. the leases in the Company’s portfolio had weighted average initial lease and loan terms of 53 months. The interest rates on lease receivables ranged from 8% to 14% as of December 31, 2010.
Leases not meeting any of the criteria to be classified as direct financing leases arewere deemed to be operating leases. Under the accounting for operating leases, the cost of the leased equipment, including acquisition fees associated with lease placements, iswas recorded as an asset and depreciated on a straight-line basis over the equipment’s estimated useful life, generally up to seven years. Rental income consistsconsisted primarily of monthly periodic rental payments due under the terms of the leases. The Company recognizesrecognized rental income on a straight-line basis and recordsrecorded it as interest income in the consolidated statement of operations. The Company recognized $5.0 million and $61,000, respectively, in rental income during the yearsyear ended December 31, 2010 and 2009.2010.
NOTE 912 –FINANCING RECEIVABLES
The disclosures in this footnote are required per newpursuant to guidance issued by the FASB that requires companies to provide more information about the credit quality of their financing receivables including, but not limited to, significant purchases and sales of financing receivables, aging information and credit quality indicators.
The following tables show the allowance for loan and lease receivable losses and recorded investments in loans and lease receivables for the years indicated (in thousands):
| | | Commercial Real Estate Loans | | | | | | | | | Loans Receivable-Related Party | | | | | | Commercial Real Estate Loans | | | | | | | | | Loans Receivable- Related Party | | | | |
December 31, 2010: | | | | | | | | | | | | | | | | |
Allowance for losses at January 1, 2010 | | $ | 29,297 | | | $ | 17,825 | | | $ | 1,140 | | | $ | − | | | $ | 48,262 | | |
| December 31, 2011: | | | | | | | | | | | | | | | | |
Allowance for losses at January 1, 2011 | | | $ | 31,617 | | | $ | 2,616 | | | $ | 70 | | | $ | − | | | $ | 34,303 | |
Provision for loan loss | | | 44,357 | | | | (1,348 | ) | | | 312 | | | | − | | | | 43,321 | | | | 6,478 | | | | 7,418 | | | | − | | | | − | | | | 13,896 | |
Loans charged-off | | | (42,037 | ) | | | (13,861 | ) | | | (1,432 | ) | | | − | | | | (57,330 | ) | | | (13,874 | ) | | | (6,737 | ) | | | (70 | ) | | | − | | | | (20,681 | ) |
Recoveries | | | − | | | | − | | | | 50 | | | | − | | | | 50 | | | | − | | | | − | | | | − | | | | − | | | | − | |
Allowance for losses at December 31, 2010 | | $ | 31,617 | | | $ | 2,616 | | | $ | 70 | | | $ | − | | | $ | 34,303 | | |
| | | | | | | | | | | | | | | | | | | | | | |
Allowance for losses at December 31, 2011 | | | $ | 24,221 | | | $ | 3,297 | | | $ | − | | | $ | − | | | $ | 27,518 | |
| Ending balance: | | | | | | | | | | | | | | | | | | | | | | | | | | | | | | | | | | | | | | | | |
Individually evaluated for impairment | | $ | 28,844 | | | $ | 112 | | | $ | 4,107 | | | $ | − | | | $ | 25,063 | | | $ | 17,065 | | | $ | 1,593 | | | $ | − | | | $ | − | | | $ | 18,658 | |
Collectively evaluated for impairment | | $ | 10,773 | | | $ | 2,504 | | | $ | 70 | | | $ | − | | | $ | 13,347 | | | $ | 7,156 | | | $ | 1,704 | | | $ | − | | | $ | − | | | $ | 8,860 | |
Loans acquired with deteriorated credit quality | | $ | − | | | $ | − | | | $ | − | | | $ | − | | | $ | − | | | $ | − | | | $ | − | | | $ | − | | | $ | − | | | $ | − | |
| | | | | | | | | | | | | | | | | | | | | | |
| Loans: | | | | | | | | | | | | | | | | | | | | | | | | | | | | | | | | | | | | | | | | |
| Ending balance: | | | | | | | | | | | | | | | | | | | | | | | | | | | | | | | | | | | | | | | | |
Individually evaluated for impairment | | $ | 42,219 | | | $ | 362 | | | $ | 10,024 | | | $ | − | | | $ | 52,605 | | | $ | 113,038 | | | $ | 2,693 | | | $ | − | | | $ | − | | | $ | 115,731 | |
Collectively evaluated for impairment | | $ | 603,415 | | | $ | 860,101 | | | $ | 99,658 | | | $ | 9,927 | | | $ | 1,573,101 | | | $ | 515,944 | | | $ | 1,171,060 | | | $ | − | | | $ | 9,497 | | | $ | 1,696,501 | |
Loans acquired with deteriorated credit quality | | $ | − | | | $ | − | | | $ | − | | | $ | − | | | $ | − | | | $ | − | | | $ | − | | | $ | − | | | $ | − | | | $ | − | |
RESOURCE CAPITAL CORP. AND SUBSIDIARIES
NOTES TO CONSOLIDATED FINANCIAL STATEMENTS – (Continued)
DECEMBER 31, 20102011
NOTE 912 –FINANCING RECEIVABLES – (Continued)
| | | Commercial Real Estate Loans | | | | | | | | | Loans Receivable-Related Party | | | | | | Commercial Real Estate Loans | | | | | | | | | Loans Receivable-Related Party | | | | |
December 31, 2009: | | | | | | | | | | | | | | | | |
Allowance for losses at January 1, 2009 | | $ | 15,109 | | | $ | 28,758 | | | $ | 450 | | | $ | − | | | $ | 44,317 | | |
| December 31, 2010: | | | | | | | | | | | | | | | | |
Allowance for losses at January 1, 2010 | | | $ | 29,297 | | | $ | 17,825 | | | $ | 1,140 | | | $ | − | | | $ | 48,262 | |
Provision for loan loss | | | 31,856 | | | | 26,855 | | | | 2,672 | | | | − | | | | 61,383 | | | | 44,357 | | | | (1,348 | ) | | | 312 | | | | − | | | | 43,321 | |
Loans charged-off | | | (17,668 | ) | | | (37,788 | ) | | | (1,994 | ) | | | − | | | | (57,450 | ) | | | (42,037 | ) | | | (13,861 | ) | | | (1,432 | ) | | | − | | | | (57,330 | ) |
Recoveries | | | − | | | | − | | | | 12 | | | | − | | | | 12 | | | | − | | | | − | | | | 50 | | | | − | | | | 50 | |
Allowance for losses at December 31, 2009 | | $ | 29,297 | | | $ | 17,825 | | | $ | 1,140 | | | $ | − | | | $ | 48,262 | | |
Allowance for losses at December 31, 2010 | | | $ | 31,617 | | | $ | 2,616 | | | $ | 70 | | | $ | − | | | $ | 34,303 | |
| | | | | | | | | | | | | | | | | | | | | | | | | | | | | | | | | | | | | | | | | |
| Ending balance: | | | | | | | | | | | | | | | | | | | | | | | | | | | | | | | | | | | | | | | | |
Individually evaluated for impairment | | $ | 18,764 | | | $ | 9,578 | | | $ | 2,617 | | | $ | − | | | $ | 30,959 | | | $ | 20,844 | | | $ | 112 | | | $ | − | | | $ | − | | | $ | 20,956 | |
Collectively evaluated for impairment | | $ | 10,533 | | | $ | 23,780 | | | $ | 1,140 | | | $ | − | | | $ | 35,453 | | | $ | 10,773 | | | $ | 2,504 | | | $ | 70 | | | $ | − | | | $ | 13,347 | |
Loans acquired with deteriorated credit quality | | $ | − | | | $ | − | | | $ | − | | | $ | − | | | $ | − | | | $ | − | | | $ | − | | | $ | − | | | $ | − | | | $ | − | |
| | | | | | | | | | | | | | | | | | | | | | | | | | | | | | | | | | | | | | | | | |
| Loans: | | | | | | | | | | | | | | | | | | | | | | | | | | | | | | | | | | | | | | | | |
| Ending balance: | | | | | | | | | | | | | | | | | | | | | | | | | | | | | | | | | | | | | | | | |
Individually evaluated for impairment | | $ | 66,797 | | | $ | 12,772 | | | $ | 2,617 | | | $ | − | | | $ | 82,186 | | | $ | 153,620 | | | $ | 362 | | | $ | 10,024 | | | $ | − | | | $ | 164,006 | |
Collectively evaluated for impairment | | $ | 680,880 | | | $ | 852,480 | | | $ | (550 | ) | | $ | − | | | $ | 1,532,810 | | | $ | 492,014 | | | $ | 860,101 | | | $ | 99,658 | | | $ | 9,927 | | | $ | 1,461,700 | |
Loans acquired with deteriorated credit quality | | $ | − | | | $ | − | | | $ | − | | | $ | − | | | $ | − | | | $ | − | | | $ | − | | | $ | − | | | $ | − | | | $ | − | |
Credit quality indicators
Bank Loans
The Company uses a risk grading matrix to assign grades to bank loans. Loans are graded at inception and updates to assigned grades are made continually as new information is received. Loans are graded on a scale of 1-5 with 1 representing the Company’s highest rating and 5 representing its lowest rating. The Company also designates loans that are sold after the period end at the lower of their fair market value or cost, net of any allowances and costs associated with the loan sales. The Company considers such things as performance of the underlying company, liquidity, collectability of interest, enterprise valuation, default probability, ratings from rating agencies, and industry dynamics.dynamics in grading its bank loans.
Credit risk profiles of bank loans for the years indicated were as follows (in thousands):
| | | | | | | | | | | | | | | | | | | | | | | | | | | | | | | | | | | | | |
| As of December 31, 2010: | | | | | | | | | | | | | | | | |
As of December 31, 2011: | | | | | | | | | | | | | | | | | | | | | | |
Bank loans | | $ | 759,817 | | | $ | 43,858 | | | $ | 48,486 | | | $ | 7,940 | | | $ | 362 | | | $ | 1,076,298 | | | $ | 19,739 | | | $ | 60,329 | | | $ | 11,540 | | | $ | 2,693 | | | $ | 3,154 | | | $ | 1,173,753 | |
| As of December 31, 2009: | | | | | | | | | | | | | | | | | | | | | |
| | | | | | | | | | | | | | | | | | | | | | | | | | | | | | | | | | | | | | | | | | | | | | | | | |
As of December 31, 2010: | | | | | | | | | | | | | | | | | | | | | | | | | | | | | |
Bank loans | | $ | 680,761 | | | $ | 62,102 | | | $ | 88,320 | | | $ | 21,505 | | | $ | 12,564 | | | $ | 759,161 | | | $ | 43,858 | | | $ | 45,115 | | | $ | 7,940 | | | $ | 362 | | | $ | 4,027 | | | $ | 860,463 | |
All of the Company’s bank loans are performing with the exception of one loan which defaulted on December 30, 2011 with a parcarrying amount of $2.7 million as of December 31, 2011. As of December 31, 2010, all of the Company’s bank loans were performing with the exception of one loan with a carrying amount of $362,000, which hashad been in default since September 2010.2010 and which was sold in November 2011.
RESOURCE CAPITAL CORP. AND SUBSIDIARIES
NOTES TO CONSOLIDATED FINANCIAL STATEMENTS – (Continued)
DECEMBER 31, 20102011
NOTE 912 –FINANCING RECEIVABLES – (Continued)
Commercial Real Estate Loans
The Company uses a risk grading matrix to assign grades to commercial real estate loans. Loans are graded at inception and updates to assigned grades are made continually as new information is received. Loans are graded on a scale of 1-4 with 1 representing the Company’s highest rating and 4 representing its lowest rating. The Company designates loans that are sold after the period end at the lower of their fair market value or cost, net of any allowances and costs associated with the loan sales. In addition to the underlying performance of the loan collateral, the Company considers such things as the strength of underlying sponsorship, payment history, collectability of interest, structural credit enhancements, market trends and loan terms.terms in grading its commercial real estate loans.
Credit risk profiles of commercial real estate loans for the years indicated were as follows (in thousands):
| | | | | | | | | | | | | | | | |
| As of December 31, 2010: | | | | | | | | | | | | | | | |
Whole loans | | $ | 123,350 | | | $ | 16,143 | | | $ | 264,660 | | | $ | 37,219 | | | | | |
B notes | | $ | 16,538 | | | $ | − | | | $ | 40,913 | | | $ | − | | | | | |
Mezzanine loans | | $ | 32,635 | | | $ | − | | | $ | 109,176 | | | $ | 5,000 | | | | | |
| | | | | | | | | | | | | | | | | | | | | |
| As of December 31, 2009: | | | | | | | | | | | | | | | | | | | | |
Whole loans | | $ | 183,617 | | | $ | − | | | $ | 204,743 | | | $ | 95,174 | | | | | |
B notes | | $ | 81,456 | | | $ | − | | | $ | − | | | $ | − | | | | | |
Mezzanine loans | | $ | 117,635 | | | $ | − | | | $ | 55,052 | | | $ | 10,000 | | | | | |
| | | | | | | | | | | | | | | | | | | |
| As of December 31, 2011: | | | | | | | | | | | | | | | | | | |
Whole loans | | $ | 329,085 | | | $ | 87,598 | | | $ | 90,225 | | | $ | 37,765 | | | $ | − | | | $ | 544,673 | |
B notes | | | 16,435 | | | | − | | | | − | | | | − | | | | − | | | | 16,435 | |
Mezzanine loans | | | 23,347 | | | | − | | | | 44,527 | | | | − | | | | − | | | | 67,874 | |
| | | $ | 368,867 | | | $ | 87,598 | | | $ | 134,752 | | | $ | 37,765 | | | $ | − | | | $ | 628,982 | |
| As of December 31, 2010: | | | | | | | | | | | | | | | | | | | | | | | | |
Whole loans | | $ | 123,350 | | | $ | 16,143 | | | $ | 264,660 | | | $ | 37,219 | | | $ | − | | | $ | 441,372 | |
B notes | | | 16,538 | | | | − | | | | 40,913 | | | | − | | | | − | | | | 57,451 | |
Mezzanine loans | | | 32,635 | | | | − | | | | 84,610 | | | | 5,000 | | | | 24,566 | | | | 146,811 | |
| | | $ | 172,523 | | | $ | 16,143 | | | $ | 390,183 | | | $ | 42,219 | | | $ | 24,566 | | | $ | 645,634 | |
All of the Company’s commercial real estate loans are performing with the exceptionas of December 31, 2011. As of December 31, 2010, all our commercial real estate loans were performing except for one loan with a par amount of $5.0 million which has been in default since May 2010.2010 and was charged-off in the quarter ended March 31, 2011.
Lease receivables
The Company does not have any lease receivables as of December 31, 2011, although it did have lease receivables as of December 31, 2010. If the Company holds lease receivables, it evaluates the adequacy of the allowance for credit losses in lease receivables based upon, among other factors, management’s historical experience with theits commercial finance portfolios, it manages, an analysis of contractual delinquencies, economic conditions and trends, industry statistics and equipment finance portfolio characteristics, as adjusted for expected recoveries. In evaluating historic performance of leases and loans, a migration analysis is performed that estimates the likelihood that an account progresses through delinquency stages to ultimate write-off. The Company fully reserves, net of recoveries, all leases and loans after they are 180 days past due.
RESOURCE CAPITAL CORP. AND SUBSIDIARIES
NOTES TO CONSOLIDATED FINANCIAL STATEMENTS – (Continued)
DECEMBER 31, 20102011
NOTE 912 –FINANCING RECEIVABLES – (Continued)
Loan and Lease Receivable Portfolios Aging Analysis
The following table shows the loan and lease receivable portfolio aging analysis for the years indicated at cost basis (in thousands):
| | | | | | | | | Greater | | | | | | | | | | | | Total Loans | |
| | | | 30-59 | | | | 60-89 | | | than 90 | | | Total Past | | | | | | Total Loans | | | > 90 Days and | |
| | | | | | | | | | | | | | | | | | | | | | |
| December 31, 2010: | | | | | | | | | | | | | | | | | | | | | | | |
Whole loans | | $ | − | | | $ | − | | | $ | − | | | $ | − | | | $ | 441,372 | | | $ | 441,372 | | | $ | − | |
B notes | | | − | | | | − | | | | − | | | | − | | | | 57,451 | | | | 57,451 | | | | − | |
Mezzanine loans | | | − | | | | − | | | | 5,000 | | | | 5,000 | | | | 141,811 | | | | 146,811 | | | | − | |
Bank loans | | | − | | | | − | | | | − | | | | − | | | | 860,463 | | | | 860,463 | | | | − | |
Lease receivables | | | 630 | | | | 237 | | | | 829 | | | | 1,696 | | | | 107,986 | | | | 109,682 | | | | − | |
Loans receivable- related party | | | − | | | | − | | | | − | | | | − | | | | 9,927 | | | | 9,927 | | | | − | |
Total loans | | $ | 630 | | | $ | 237 | | | $ | 5,829 | | | $ | 6,696 | | | $ | 1,619,010 | | | $ | 1,625,706 | | | $ | − | |
| | | | | | | | | | | | | | | | | | | | | | | | | | | | | |
| December 31, 2009: | | | | | | | | | | | | | | | | | | | | | | | | | | | | |
Whole loans | | $ | − | | | $ | − | | | $ | 7,378 | | | $ | 7,378 | | | $ | 476,157 | | | $ | 483,535 | | | $ | − | |
B notes | | | − | | | | − | | | | − | | | | − | | | | 81,456 | | | | 81,456 | | | | − | |
Mezzanine loans | | | − | | | | − | | | | − | | | | − | | | | 182,686 | | | | 182,686 | | | | − | |
Bank loans | | | − | | | | − | | | | − | | | | − | | | | 865,252 | | | | 865,252 | | | | − | |
Lease receivables | | | − | | | | − | | | | 1,815 | | | | 1,815 | | | | 252 | | | | 2,067 | | | | − | |
Loans receivable- related party | | | − | | | | − | | | | − | | | | − | | | | − | | | | − | | | | − | |
Total loans | | $ | − | | | $ | − | | | $ | 9,193 | | | $ | 9,193 | | | $ | 1,605,803 | | | $ | 1,614,996 | | | $ | �� | |
| | | | | | | | | | | | | | | | | | | | | Total Loans > 90 Days and Accruing | |
| December 31, 2011: | | | | | | | | | | | | | | | | | | | | | |
Whole loans | | $ | − | | | $ | − | | | $ | − | | | $ | − | | | $ | 544,673 | | | $ | 544,673 | | | $ | − | |
B notes | | | − | | | | − | | | | − | | | | − | | | | 16,435 | | | | 16,435 | | | | − | |
Mezzanine loans | | | − | | | | − | | | | − | | | | − | | | | 67,874 | | | | 67,874 | | | | − | |
Bank loans | | | − | | | | − | | | | − | | | | − | | | | 1,173,753 | | | | 1,173,753 | | | | − | |
Lease receivables | | | − | | | | − | | | | − | | | | − | | | | − | | | | − | | | | − | |
Loans receivable- related party | | | − | | | | − | | | | − | | | | − | | | | 9,497 | | | | 9,497 | | | | − | |
Total loans | | $ | − | | | $ | − | | | $ | − | | | $ | − | | | $ | 1,812,232 | | | $ | 1,812,232 | | | $ | − | |
| | | | | | | | | | | | | | | | | | | | | | | | | | | | | |
| December 31, 2010: | | | | | | | | | | | | | | | | | | | | | | | | | | | | |
Whole loans | | $ | − | | | $ | − | | | $ | − | | | $ | − | | | $ | 441,372 | | | $ | 441,372 | | | $ | − | |
B notes | | | − | | | | − | | | | − | | | | − | | | | 57,451 | | | | 57,451 | | | | − | |
Mezzanine loans | | | − | | | | − | | | | 5,000 | | | | 5,000 | | | | 141,811 | | | | 146,811 | | | | − | |
Bank loans | | | − | | | | − | | | | − | | | | − | | | | 860,463 | | | | 860,463 | | | | − | |
Lease receivables | | | 630 | | | | 237 | | | | 829 | | | | 1,696 | | | | 107,986 | | | | 109,682 | | | | − | |
Loans receivable- related party | | | − | | | | − | | | | − | | | | − | | | | 9,927 | | | | 9,927 | | | | − | |
Total loans | | $ | 630 | | | $ | 237 | | | $ | 5,829 | | | $ | 6,696 | | | $ | 1,619,010 | | | $ | 1,625,706 | | | $ | − | |
RESOURCE CAPITAL CORP. AND SUBSIDIARIES
NOTES TO CONSOLIDATED FINANCIAL STATEMENTS – (Continued)
DECEMBER 31, 20102011
NOTE 912 –FINANCING RECEIVABLES – (Continued)
Impaired Loans and Lease Receivables
The following tabletables show impaired loans and lease receivables for the years indicated (in thousands):
| | | | | | | | | | | | Average | | | | |
| | | | | | Unpaid | | | | | | Investment | | | Interest | |
| | | Recorded | | | Principal | | | Specific | | | in Impaired | | | Income | |
| | | | | | | | | | | | | | | | |
December 31, 2010: | | | | | | | | | | | | | | | |
Loans and lease receivables without a specific valuation allowance: | | | | | | | | | | | | | | | |
Whole loans | | $ | 111,401 | (1) | | $ | 111,401 | | | $ | − | | | $ | 58,058 | | | $ | 1,133 | |
B notes | | $ | − | | | $ | − | | | $ | − | | | $ | − | | | $ | − | |
Mezzanine loans | | $ | − | | | $ | − | | | $ | − | | | $ | − | | | $ | − | |
Bank loans | | $ | − | | | $ | − | | | $ | − | | | $ | − | | | $ | − | |
Lease receivables | | $ | − | | | $ | − | | | $ | − | | | $ | − | | | $ | − | |
Loans and lease receivables with a specific valuation allowance: | | | | | | | | | | | | | | | | | | | | |
Whole loans | | $ | 37,219 | | | $ | 37,219 | | | $ | (15,844 | ) | | $ | 36,740 | | | $ | 993 | |
B notes | | $ | − | | | $ | − | | | $ | − | | | $ | − | | | $ | − | |
Mezzanine loans | | $ | 5,000 | | | $ | 5,000 | | | $ | (5,000 | ) | | $ | 5,000 | | | $ | − | |
Bank loans | | $ | 362 | | | $ | 362 | | | $ | (112 | ) | | $ | 8,971 | | | $ | − | |
Lease receivables | | $ | 10,024 | | | $ | 10,024 | | | $ | (4,107 | ) | | $ | 4,791 | | | $ | − | |
| Total: | | | | | | | | | | | | | | | | | | | | |
Whole loans | | $ | 148,620 | | | $ | 148,620 | | | $ | (15,844 | ) | | $ | 94,798 | | | $ | 2,126 | |
B notes | | | − | | | | − | | | | − | | | | − | | | | − | |
Mezzanine loans | | | 5,000 | | | | 5,000 | | | | (5,000 | ) | | | 5,000 | | | | − | |
Bank loans | | | 362 | | | | 362 | | | | (112 | ) | | | 8,971 | | | | − | |
Lease receivables | | | 10,024 | | | | 10,024 | | | | (4,107 | ) | | | 4,791 | | | | − | |
| | | $ | 164,006 | | | $ | 164,006 | | | $ | (25,063 | ) | | $ | 113,560 | | | $ | 2,126 | |
December 31, 2009: | | | | | | | | | | | | | | | |
Loans and lease receivables without a specific valuation allowance: | | | | | | | | | | | | | | | |
Whole loans | | $ | 7,378 | (1) | | $ | 7,378 | | | $ | − | | | $ | 7,378 | | | $ | − | |
B notes | | $ | − | | | $ | − | | | $ | − | | | $ | − | | | $ | − | |
Mezzanine loans | | $ | 10,517 | (1) | | $ | 10,517 | | | $ | − | | | $ | 10,517 | | | $ | − | |
Bank loans | | $ | − | | | $ | − | | | $ | − | | | $ | − | | | $ | − | |
Lease receivables | | $ | − | | | $ | − | | | $ | − | | | $ | − | | | $ | − | |
Loans and lease receivables with a specific valuation allowance: | | | | | | | | | | | | | | | | | | | | |
Whole loans | | $ | 66,797 | | | $ | 66,797 | | | $ | (18,764 | ) | | $ | 79,804 | | | $ | 2,307 | |
B notes | | $ | − | | | $ | − | | | $ | − | | | $ | − | | | $ | − | |
Mezzanine loans | | $ | − | | | $ | − | | | $ | − | | | $ | − | | | $ | − | |
Bank loans | | $ | 12,772 | | | $ | 12,772 | | | $ | (9,578 | ) | | $ | 1,693 | | | $ | − | |
Lease receivables | | $ | 2,617 | | | $ | 2,617 | | | $ | (2,617 | ) | | $ | − | | | $ | − | |
| Total: | | | | | | | | | | | | | | | | | | | | |
Whole loans | | $ | 74,175 | | | $ | 74,175 | | | $ | (18,764 | ) | | $ | 87,182 | | | $ | 2,307 | |
B notes | | | − | | | | − | | | | − | | | | − | | | | − | |
Mezzanine loans | | | 10,517 | | | | 10,517 | | | | − | | | | 10,517 | | | | − | |
Bank loans | | | 12,772 | | | | 12,772 | | | | (9,578 | ) | | | 1,693 | | | | − | |
Lease receivables | | | 2,617 | | | | 2,617 | | | | (2,617 | ) | | | − | | | | − | |
| | | $ | 100,081 | | | $ | 100,081 | | | $ | (30,959 | ) | | $ | 99,392 | | | $ | 2,307 | |
(1) | Specific allowances were not taken on whole loans of $111.4 million at par value as of December 31, 2010 and whole loans of $7.4 million and mezzanine loans of $10.5 million at par value as of December 31, 2009 that were evaluated for and deemed to be troubled debt restructurings, or TDRs. These TDRs do not have an associated specific loan loss allowance because the principal and interest amount is considered recoverable based on expected collateral performance and / or guarantees made by the borrowers. |
| | | | | | | | | | | | Average | | | | |
| | | | | | Unpaid | | | | | | Investment | | | Interest | |
| | | Recorded | | | Principal | | | Specific | | | in Impaired | | | Income | |
| | | | | | | | | | | | | | | | |
| December 31, 2011: | | | | | | | | | | | | | | | |
Loans and lease receivables without a specific valuation allowance: | | | | | | | | | | | | | | | |
Whole loans | | $ | 75,273 | | | $ | 75,273 | | | $ | − | | | $ | 75,263 | | | $ | 2,682 | |
B notes | | $ | − | | | $ | − | | | $ | − | | | $ | − | | | $ | − | |
Mezzanine loans | | $ | − | | | $ | − | | | $ | − | | | $ | − | | | $ | − | |
Bank loans | | $ | − | | | $ | − | | | $ | − | | | $ | − | | | $ | − | |
Loans and lease receivables with a specific valuation allowance: | | | | | | | | | | | | | | | | | | | | |
Whole loans | | $ | 37,765 | | | $ | 37,765 | | | $ | (17,065 | ) | | $ | 36,608 | | | $ | 920 | |
B notes | | $ | − | | | $ | − | | | $ | − | | | $ | − | | | $ | − | |
Mezzanine loans | | $ | − | | | $ | − | | | $ | − | | | $ | − | | | $ | − | |
Bank loans | | $ | 2,693 | | | $ | 2,693 | | | $ | (1,593 | ) | | $ | 2,693 | | | $ | − | |
| | | | | | | | | | | | | | | | | | | | | |
| Total: | | | | | | | | | | | | | | | | | | | | |
Whole loans | | $ | 113,038 | | | $ | 113,038 | | | $ | (17,065 | ) | | $ | 111,871 | | | $ | 3,602 | |
B notes | | | − | | | | − | | | | − | | | | − | | | | − | |
Mezzanine loans | | | − | | | | − | | | | − | | | | − | | | | − | |
Bank loans | | | 2,693 | | | | 2,693 | | | | (1,593 | ) | | | 2,693 | | | | − | |
| | | $ | 115,731 | | | $ | 115,731 | | | $ | (18,658 | ) | | $ | 114,564 | | | $ | 3,602 | |
| | | | | | | | | | | | | | | | | | | | | |
December 31, 2010: | | | | | | | | | | | | | | | | | | | | |
Loans and lease receivables without a specific valuation allowance: | | | | | | | | | | | | | | | | | | | | |
Whole loans | | $ | 111,401 | | | $ | 111,401 | | | $ | − | | | $ | 58,058 | | | $ | 1,133 | |
B notes | | $ | − | | | $ | − | | | $ | − | | | $ | − | | | $ | − | |
Mezzanine loans | | $ | − | | | $ | − | | | $ | − | | | $ | − | | | $ | − | |
Bank loans | | $ | − | | | $ | − | | | $ | − | | | $ | − | | | $ | − | |
Lease receivables | | $ | − | | | $ | − | | | $ | − | | | $ | − | | | $ | − | |
Loans and lease receivables with a specific valuation allowance: | | | | | | | | | | | | | | | | | | | | |
Whole loans | | $ | 37,219 | | | $ | 37,219 | | | $ | (15,844 | ) | | $ | 36,740 | | | $ | 993 | |
B notes | | $ | − | | | $ | − | | | $ | − | | | $ | − | | | $ | − | |
Mezzanine loans | | $ | 5,000 | | | $ | 5,000 | | | $ | (5,000 | ) | | $ | 5,000 | | | $ | − | |
Bank loans | | $ | 362 | | | $ | 362 | | | $ | (112 | ) | | $ | 8,971 | | | $ | − | |
Lease receivables | | $ | 10,024 | | | $ | 10,024 | | | $ | (4,107 | ) | | $ | 4,791 | | | $ | − | |
| | | | | | | | | | | | | | | | | | | | | |
| Total: | | | | | | | | | | | | | | | | | | | | |
Whole loans | | $ | 148,620 | | | $ | 148,620 | | | $ | (15,844 | ) | | $ | 94,798 | | | $ | 2,126 | |
B notes | | | − | | | | − | | | | − | | | | − | | | | − | |
Mezzanine loans | | | 5,000 | | | | 5,000 | | | | (5,000 | ) | | | 5,000 | | | | − | |
Bank loans | | | 362 | | | | 362 | | | | (112 | ) | | | 8,971 | | | | − | |
Lease receivables | | | 10,024 | | | | 10,024 | | | | (4,107 | ) | | | 4,791 | | | | − | |
| | | $ | 164,006 | | | $ | 164,006 | | | $ | (25,063 | ) | | $ | 113,560 | | | $ | 2,126 | |
RESOURCE CAPITAL CORP. AND SUBSIDIARIES
NOTES TO CONSOLIDATED FINANCIAL STATEMENTS – (Continued)
DECEMBER 31, 20102011
NOTE 1012 –FINANCING RECEIVABLES – (Continued)
Troubled-Debt Restructurings
The following tables show troubled-debt restructurings for the Company’s loan and lease receivable portfolios (in thousands):
| | | | | | Pre-Modification Outstanding Recorded Balance | | | Post-Modification Outstanding Recorded Balance | |
| Year Ended December 31, 2011: | | | | | | | | | |
Whole loans | | | 3 | | | $ | 67,985 | | | $ | 64,573 | |
B notes | | | − | | | | − | | | | − | |
Mezzanine loans | | | − | | | | − | | | | − | |
Bank loans | | | − | | | | − | | | | − | |
Loans receivable - related party | | | 1 | | | | 7,981 | | | | 7,981 | |
Total loans | | | 4 | | | $ | 75,966 | | | $ | 72,554 | |
As of December 31, 2011 and 2010, there were no troubled-debt restructurings that subsequently defaulted. There was one loan, with a par value of $37.8 million, that was deemed a troubled debt restructuring in 2010 which continued to require maturity extensions and monthly advances against the mezzanine balance during 2011.
NOTE 13 – INTANGIBLE ASSETS
Intangible assets represent identifiable intangible assets acquired as a result of the Company’s acquisition of RCAM in February 2011, its conversion of loans to investments in real estate in June 2011, and the acquisition of real estate in August 2011. The Company amortizes identified intangible assets to expense over their estimated lives or period of benefit using the straight-line method. The Company evaluates intangible assets for impairment as events and circumstances change. The Company recorded amortization expense of intangible assets of $3.9 million for the year ended December 31, 2011, and expects to record amortization expense of approximately $3.3 million for the year ended December 31, 2012, $2.7 million for the year ended December 31, 2013, $2.6 million for the years ended December 31, 2014 and 2015 and $2.5 million for the year ended December 31, 2016. The weighted average remaining amortization period is eight years at December 31, 2011 and amortization for the year ended December 31, 2011 was $3.9 million. There was no such expense for the year ended December 31, 2010.
The following table summarizes intangible assets at December 31, 2011 (in thousands). No such assets existed at December 31, 2010.
| | | | | | | | | | |
| December 31, 2011: | | | | | | | | | |
Investment in RCAM | | $ | 21,213 | | | $ | (2,237 | ) | | $ | 18,976 | |
Investments in real estate: | | | | | | | | | | | | |
In-place leases | | | 2,461 | | | | (1,634 | ) | | | 827 | |
Above (below) market leases | | | 29 | | | | (19 | ) | | | 10 | |
| | | | 2,490 | | | | (1,653 | ) | | | 837 | |
Total intangible assets | | $ | 23,703 | | | $ | (3,890 | ) | | $ | 19,813 | |
RESOURCE CAPITAL CORP. AND SUBSIDIARIES
NOTES TO CONSOLIDATED FINANCIAL STATEMENTS – (Continued)
DECEMBER 31, 2011
NOTE 14 – BORROWINGS
The Company historically has financed the acquisition of its investments, including investment securities, loans and lease receivables, primarily through the use of secured and unsecured borrowings in the form of CDOs, securitized notes, repurchase agreements, secured term facilities, warehouse facilities and trust preferred securities issuances and other secured and unsecured borrowings.issuances. Certain information with respect to the Company’s borrowings at December 31, 20102011 and 20092010 is summarized in the following table (in thousands, except percentages):
| | | | | | Weighted Average Borrowing Rate | | Weighted Average Remaining Maturity | | | | | | | | Weighted Average Borrowing Rate | | Weighted Average Remaining Maturity | | | |
December 31, 2010: | | | | | | | | | | | |
| December 31, 2011: | | | | | | | | | | | |
RREF CDO 2006-1 Senior Notes (1) | | | $ | 157,803 | | | | 1.44% | | 34.6 years | | $ | 264,796 | |
RREF CDO 2007-1 Senior Notes (2) | | | | 315,882 | | | | 0.85% | | 34.8 years | | | 422,641 | |
Apidos CDO I Senior Notes (3) | | | | 314,884 | | | | 1.04% | | 5.6 years | | | 315,088 | |
Apidos CDO III Senior Notes (4) | | | | 261,209 | | | | 0.99% | | 8.5 years | | | 260,167 | |
Apidos Cinco CDO Senior Notes (5) | | | | 319,959 | | | | 0.95% | | 8.4 years | | | 326,164 | |
Apidos CLO VIII Senior Notes (6) | | | | 298,312 | | | | 2.42% | | 9.8 years | | | 334,122 | |
Apidos CLO VIII Securitized Borrowings (10) | | | | 21,364 | | | | − % | | 9.8 years | | | − | |
Unsecured Junior Subordinated Debentures (7) | | | | 50,631 | | | | 4.35% | | 24.7 years | | | − | |
Repurchase Agreements (8) | | | | 55,406 | | | | 1.54% | | 18.0 days | | | 64,321 | |
Mortgage Payable (9) | | | | 13,536 | | | | 4.23% | | 6.6 years | | | 18,100 | |
Total | | | $ | 1,808,986 | | | | 1.38% | | 15.3 years | | $ | 2,005,399 | |
| | | | | | | | | | | | | | | |
| December 31, 2010: | | | | | | | | | | | | | | |
RREF CDO 2006-1 Senior Notes (1) | | $ | 173,053 | | | | 1.33% | | 35.6 years | | $ | 215,063 | | | $ | 173,053 | | | | 1.33% | | 35.6 years | | $ | 299,002 | |
RREF CDO 2007-1 Senior Notes (2) | | | 325,025 | | | | 0.82% | | 35.8 years | | | 367,792 | | | | 325,025 | | | | 0.82% | | 35.8 years | | | 390,600 | |
Apidos CDO I Senior Notes (3) | | | 319,748 | | | | 0.87% | | 6.6 years | | | 309,746 | | | | 319,748 | | | | 0.87% | | 6.6 years | | | 327,318 | |
Apidos CDO III Senior Notes (4) | | | 260,682 | | | | 0.75% | | 9.5 years | | | 250,309 | | | | 260,682 | | | | 0.75% | | 9.5 years | | | 265,418 | |
Apidos Cinco CDO Senior Notes (5) | | | 319,373 | | | | 0.79% | | 9.4 years | | | 319,563 | | | | 319,373 | | | | 0.79% | | 9.4 years | | | 335,227 | |
Equipment Contract Backed Notes, Series 2010-2 (6) | | | 95,016 | | | | 5.00% | | 5.4 years | | | 109,612 | | | | 95,016 | | | | 5.00% | | 5.4 years | | | 109,612 | |
Unsecured Junior Subordinated Debentures (7) | | | 50,354 | | | | 6.24% | | 25.7 years | | | − | | | | 50,354 | | | | 6.24% | | 25.7 years | | | − | |
Total | | $ | 1,543,251 | | | | 1.30% | | 17.6 years | | $ | 1,572,085 | | | $ | 1,543,251 | | | | 1.30% | | 17.6 years | | $ | 1,727,177 | |
| | | | | | | | | | | | | | | |
December 31, 2009: | | | | | | | | | | | | | | |
RREF CDO 2006-1 Senior Notes (1) | | $ | 240,227 | | | | 1.11% | | 36.6 years | | $ | 267,153 | | |
RREF CDO 2007-1 Senior Notes (2) | | | 346,673 | | | | 0.81% | | 36.8 years | | | 435,225 | | |
Apidos CDO I Senior Notes (3) | | | 319,103 | | | | 0.86% | | 7.6 years | | | 290,578 | | |
Apidos CDO III Senior Notes (4) | | | 260,158 | | | | 0.71% | | 10.5 years | | | 237,499 | | |
Apidos Cinco CDO Senior Notes (5) | | | 318,791 | | | | 0.78% | | 10.4 years | | | 299,874 | | |
Unsecured Junior Subordinated Debentures (7) | | | 50,052 | | | | 6.18% | | 26.7 years | | | − | | |
Repurchase agreements (8) | | | (130 | ) | | | | | | | | − | | |
Total | | $ | 1,534,874 | | | | 1.02% | | 20.4 years | | $ | 1,530,329 | | |
| (1) | Amount represents principal outstanding of $174.9$159.1 million and $243.5$174.9 million less unamortized issuance costs of $1.8$1.2 million and $3.3$1.8 million as of December 31, 20102011 and 2009,2010, respectively. This CDO transaction closed in August 2006. |
| (2) | Amount represents principal outstanding of $328.5$318.6 million and $351.2$328.5 million less unamortized issuance costs of $3.5$2.7 million and $4.6$3.5 million as of December 31, 20102011 and 2009,2010, respectively. This CDO transaction closed in JuneSeptember 2007. |
| (3) | Amount represents principal outstanding of $321.5$315.9 million less unamortized issuance costs of $1.1 million as of December 31, 2011 and $1.8 million as of December 31, 2010 and $2.4 million as of December 31, 2009.2010. This CDO transaction closed in August 2005. |
| (4) | Amount represents principal outstanding of $262.5 million less unamortized issuance costs of $1.3 million as of December 31, 2011 and $1.8 million as of December 31, 2010 and $2.3 million as of December 31, 2009.2010. This CDO transaction closed in May 2006. |
| (5) | Amount represents principal outstanding of $322.0 million less unamortized issuance costs of $2.0 million as of December 31, 2011 and $2.6 million as of December 31, 2010 and $3.3 million as of December 31, 2009.2010. This CDO transaction closed in May 2007. |
| (6) | Amount represents principal outstanding of $96.1$303.9 million less unamortized issuance costs of $1.1$5.5 million as of December 31, 2010.2011. This CDO transaction closed in May 2010.October 2011. |
| (7) | Amount represents junior subordinated debentures issued to RCT I and RCT II in May 2006 and September 2006, respectively. |
| (8) | Amount represents principal outstanding of $55.9 million less unamortized deferred debt costs of $494,000 related to a commercial real estateCMBS repurchase facility as of December 31, 2009. The facility matured in April 2010 and had no2011. |
| (9) | Amount represents principal outstanding borrowingsof $13.6 million less unamortized real estate financing costs of $65,000 as of December 31, 2009.2011. This real estate transaction closed in August 2011. |
| (10) | The debentures are collateralized by the same assets as the Apidos CLO VIII Senior Notes. |
RESOURCE CAPITAL CORP. AND SUBSIDIARIES
NOTES TO CONSOLIDATED FINANCIAL STATEMENTS – (Continued)
DECEMBER 31, 20102011
NOTE 1014 – BORROWINGS − (Continued)
Collateralized Debt Obligations
Resource Real Estate Funding CDO 2007-1
In June 2007, the Company closed RREF CDO 2007-1, a $500.0 million CDO transaction that provides financing for commercial real estate loans and commercial mortgage-backed securities. The investments held by RREF CDO 2007-1 collateralize the debt it issued and, as a result, the investments are not available to the Company, its creditors or stockholders. RREF CDO 2007-1 issued a total of $265.6 million of senior notes at par to unrelated investors. RCC Real Estate purchased 100% of the class H senior notes (rated BBB+:Fitch), class K senior notes (rated BBB-:Fitch), class L senior notes (rated BB:Fitch) and class M senior notes (rated B: Fitch) for $68.0 million. In addition, Resource Real Estate Funding 2007-1 CDO Investor, LLC, a subsidiary of RCC Real Estate, purchased a $41.3 million equity interest representing 100% of the outstanding preference shares. The senior notes purchased by RCC Real Estate are subordinated in right of payment to all other senior notes issued by RREF CDO 2007-1 but are senior in right of payment to the preference shares. The equity interest is subordinated in right of payment to all other securities issued by RREF CDO 2007-1.
The senior notes issued to investors by RREF CDO 2007-1 consist of the following classes: (i) $180.0 million of class A-1 notes bearing interest at one-month LIBOR plus 0.28%; (ii) $50.0 million of unissued class A-1R notes, which allow the CDO to fund future funding obligations under the existing whole loan participations that have future funding commitments; the undrawn balance of the class A-1R notes will accrue a commitment fee at a rate per annum equal to 0.18%, the drawn balance will bear interest at one-month LIBOR plus 0.32%; (iii) $57.5 million of class A-2 notes bearing interest at one-month LIBOR plus 0.46%; (iv) $22.5 million of class B notes bearing interest at one-month LIBOR plus 0.80%; (v) $7.0 million of class C notes bearing interest at a fixed rate of 6.423%; (vi) $26.8 million of class D notes bearing interest at one-month LIBOR plus 0.95%; (vii) $11.9 million of class E notes bearing interest at one-month LIBOR plus 1.15%; (viii) $11.9 million of class F notes bearing interest at one-month LIBOR plus 1.30%; (ix) $11.3 million of class G notes bearing interest at one-month LIBOR plus 1.55%; (x) $11.3 million of class H notes bearing interest at one-month LIBOR plus 2.30%; (xi) $11.3 million of class J notes bearing interest at one-month LIBOR plus 2.95%; (xii) $10.0 million of class K notes bearing interest at one-month LIBOR plus 3.25%; (xiii) $18.8 million of class L notes bearing interest at a fixed rate of 7.50% and (xiv) $28.8 million of class M notes bearing interest at a fixed rate of 8.50%. All of the notes issued mature in September 2046, although the Company has the right to call the notes anytime after July 2017 until maturity. The weighted average interest rate on all notes issued to outside investors and net of repurchased notes was 0.82%0.85% and 0.81%0.82% at December 31, 2011 and 2010, and 2009, respectively.
During the year ended December 31, 2011, the Company repurchased $10.0 million of class A-2 notes at a weighted average price of 61.25% to par which resulted in a $3.9 million gain. During the year ended December 31, 2010, the Company repurchased $250,000 of the Class J notes, $7.5 million of Class B notes and $15.0 million of the Class A-2 notes in RREF CDO 2007-1 at a weighted average price of 55.81% to par which resulted in a $10.1 million gain, reported as a part of the gain on the extinguishment of debt in the consolidated statements of operations. During
In connection with the year ended December 31, 2009,Company’s ownership of certain notes held by RREF CDO 2007-1 on June 21, 2011, the Company repurchased $2.5surrendered for cancellation, without consideration, to the trustee of RREF CDO 2007-1 the following outstanding notes, which previously eliminated in consolidation: $7.5 million of the Class JB notes, $11.9$6.5 million of Class E note, $11.9 million ofthe Class F notes, and $7.2$6.25 million of the Class G notes and $10.625 million of the Class H notes. The surrendered notes were cancelled by the trustee pursuant to the applicable indenture, and the obligations due under those notes were deemed extinguished. The effect of these cancellations was to improve the CDO’s performance with respect to its over-collateralization and interest coverage tests, with which it was already in RREF CDO 2007-1 at a weighted average price of 25.66%compliance before the cancellation, as well as to par which resultedsecure the Company’s long-term interest in a $24.9 million gain, reported as a gain on the extinguishment of debt in the consolidated statements of operations.this structured vehicle.
As a result of the Company’s ownership of senior notes, both the notes repurchased subsequent to closing and those retained at the CDO’s closing eliminate in consolidation.
RESOURCE CAPITAL CORP. AND SUBSIDIARIES
NOTES TO CONSOLIDATED FINANCIAL STATEMENTS – (Continued)
DECEMBER 31, 20102011
NOTE 1014 – BORROWINGS − (Continued)
Collateralized Debt Obligations – (Continued)
Resource Real Estate Funding CDO 2006-1
In August 2006, the Company closed RREF CDO 2006-1, a $345.0 million CDO transaction that provides financing for commercial real estate loans. The investments held by RREF CDO 2006-1 collateralize the debt it issued and, as a result, the investments are not available to the Company, its creditors or stockholders. RREF CDO 2006-1 issued a total of $308.7 million of senior notes at par to investors of which RCC Real Estate purchased 100% of the class J senior notes (rated BB: Fitch) and class K senior notes (rated B:Fitch) for $43.1 million. In addition, Resource Real Estate Funding 2006-1 CDO Investor, LLC, a subsidiary of RCC Real Estate, purchased a $36.3 million equity interest representing 100% of the outstanding preference shares. The senior notes purchased by RCC Real Estate are subordinated in right of payment to all other senior notes issued by RREF CDO 2006-1 but are senior in right of payment to the preference shares. The equity interest is subordinated in right of payment to all other securities issued by RREF CDO 2006-1. The reinvestment period for RREF 2006-1 ended in September 2011 which will result in the sequential pay down of notes. As of December 31, 2011 $23.0 million of Class A-1 notes have been paid down.
The senior notes issued to investors by RREF CDO 2006-1 consist of the following classes: (i) $129.4 million of class A-1 notes bearing interest at one-month LIBOR plus 0.32%; (ii) $17.4 million of class A-2 notes bearing interest at one-month LIBOR plus 0.35%; (iii) $5.0 million of class A-2 notes bearing interest at a fixed rate of 5.842%; (iv) $6.9 million of class B notes bearing interest at one-month LIBOR plus 0.40%; (v) $20.7 million of class C notes bearing interest at one-month LIBOR plus 0.62%; (vi) $15.5 million of class D notes bearing interest at one-month LIBOR plus 0.80%; (vii) $20.7 million of class E notes bearing interest at one-month LIBOR plus 1.30%; (viii) $19.8 million of class F notes bearing interest at one-month LIBOR plus 1.60%; (ix) $17.3 million of class G notes bearing interest at one-month LIBOR plus 1.90%; (x) $12.9 million of class H notes bearing interest at one-month LIBOR plus 3.75%, (xi) $14.7 million of Class J notes bearing interest at a fixed rate of 6.00% and (xii) $28.4 million of Class K notes bearing interest at a fixed rate of 6.00%. As a result of the Company’s ownership of the Class J and K senior notes, these notes eliminate in consolidation. All of the notes issued mature in August 2046, although the Company has the right to call the notes anytime after August 2016 until maturity. The weighted average interest rate on all notes issued to outside investors and net of repurchased notes was 1.33%1.44% and 1.11%1.33% at December 31, 2011 and 2010, and 2009, respectively.
During the year ended December 31, 2011, the Company did not repurchase any notes. During the year ended December 31, 2010, the Company repurchased $40.0 million of the Class A-1 notes, $12.0 million of Class A-2 notes, $6.9 million of Class B notes, $7.7 million of Class C notes and $2.0 million of the Class D notes in RREF CDO 2006-1 at a weighted average price of 64.2% to par which resulted in a $24.5 million gain reported as a gain on the extinguishment of debt in the consolidated statements of operations. During
In connection with the year ended December 31, 2009,Company’s ownership of certain notes held by RREF CDO 2006-1, on June 21, 2011 the Company repurchased $11.5surrendered for cancellation, without consideration, to the trustee of RREF CDO 2006-1 the following outstanding notes, which previously eliminated in consolidation: $6.9 million of the Class FB notes, $3.5$7.7 million of the Class C notes, $5.52 million of the Class D notes, and $7.0 million of the Class E notes and $5.25 million of the Class F notes. The surrendered notes were cancelled by the trustee pursuant to the applicable indenture, and the obligations due under those notes were deemed extinguished. The effect of these cancellations was to improve the CDO’s performance with respect to its over-collateralization and interest coverage tests, with which it was already in RREF CDO 2006-1 at a weighted average price of 10.80%compliance before the cancellation, as well as to par which resultedsecure the Company’s long-term interest in a $19.6 million gain reported as a gain on the extinguishment of debt in its consolidated statements of operations.this structured vehicle.
As a result of the Company’s ownership of senior notes, both the notes repurchased subsequent to closing and those retained at the CDO’s closing eliminate in consolidation.
Secured Term FacilityApidos CLO VIII Warehouse
In April 2010,June 2011, the Company formed Apidos CLO VIII and entered into a loan and securitywarehouse facility provided by Citibank, N.A. to purchase bank loans to include in Apidos CLO VIII. This agreement, withsecured by $15.0 million of preference shares of Apidos CLO VIII, expired upon the closing of Apidos CLO VIII on October 13, 2011. The Bancorp Bank to finance the purchase of lease receivables. The maximum amount of the Company’s borrowing under this agreement was $6.5 million. Borrowings under this agreementfacility bore interest at six percent (6%) per annum.a rate of three-month LIBOR plus 1.0% for the first nine months and 1.4% thereafter. The facility was repaid in full and was terminated on May 27, 2010. There were no such borrowings asApidos CLO VIII warehouse transferred $53.7 million of Decembersettled trades at closing.
RESOURCE CAPITAL CORP. AND SUBSIDIARIES
NOTES TO CONSOLIDATED FINANCIAL STATEMENTS – (Continued)
DECEMBER 31, 2009.2011
NOTE 14 – BORROWINGS − (Continued)
Collateralized Debt Obligations – (Continued)
Equipment Contract Backed Notes, Series 2010-2
In May 2010, the Company acquired Equipment Contract Backed Notes, Series 2010-2, issued by LEAF Funding 3, a $120.0 million transaction that provided financing for leases. The investments held by LEAF Funding 3 collateralizecollateralized the debt it issued and, as a result, the investments arewere not available to the Company, its creditors or stockholders. LEAF Funding 3 issued a total of $120.0 million of senior notes at a weighted average price of $93.52$93.6 to unrelated investors generating proceeds of $112.2 million. TheBefore contributing its interest in LEAF Funding 3 to LCC (see Note 10), the Company will amortizeamortized the discount at issuance over the lives of the notes using the effective yield method, adjusted for the effects of estimated prepayments on the notes. The Company had $21.0 million of equity invested in LEAF Funding 3 as of December 31, 2010.
RESOURCE CAPITAL CORP. AND SUBSIDIARIES
NOTES TO CONSOLIDATED FINANCIAL STATEMENTS – (Continued)
DECEMBER 31, 2010
NOTE 10 – BORROWINGS − (Continued)
Collateralized Debt Obligations – (Continued)
Equipment Contract Backed Notes, Series 2010-2 – (Continued)
The equipment contract backed notes issued to investors by As a result of the recapitalization of LCC whereby the assets and borrowings were exchanged for preferred stock, the Company had no equity invested in LEAF Funding 3 consistas of the following classes: (i) $95.5 million of class A notes; (ii) $7.0 million of class B notes; (iii) $6.4 million of class C notes; (iv) $6.4 million of class D notes; and (v) $4.7 million of class E notes. All of the notes issued bear a fixed rate of interest of 5.0%. The class A notes mature in May 2016 and the class B through E notes mature in December 2017.31, 2011.
Apidos Cinco CDO
In May 2007, the Company closed Apidos Cinco CDO, a $350.0 million CDO transaction that provides financing for bank loans. The investments held by Apidos Cinco CDO collateralize the debt it issued and, as a result, the investments are not available to the Company, its creditors or stockholders. Apidos Cinco CDO issued a total of $322.0 million of senior notes at par to investors and RCC commercial purchased a $28.0 million equity interest representing 100% of the outstanding preference shares. The equity interest is subordinated in right of payment to all other securities issued by Apidos Cinco CDO.
The senior notes issued to investors by Apidos Cinco CDO consist of the following classes: (i) $37.5 million of class A-1 notes bearing interest at LIBOR plus 0.24%; (ii) $200.0 million of class A-2a notes bearing interest at LIBOR plus 0.23%; (iii) $22.5 million of class A-2b notes bearing interest at LIBOR plus 0.32%; (iv) $19.0 million of class A-3 notes bearing interest at LIBOR plus 0.42%; (v) $18.0 million of class B notes bearing interest at LIBOR plus 0.80%; (vi) $14.0 million of class C notes bearing interest at LIBOR plus 2.25% and (vii) $11.0 million of class D notes bearing interest at LIBOR plus 4.25%. All of the notes issued mature on May 14, 2020, although the Company has the right to call the notes anytime after May 14, 2011 until maturity. The weighted average interest rate on all notes was 0.79%0.95% and 0.78%0.79% at December 31, 2011 and 2010, and 2009, respectively.
Apidos CDO III
In May 2006, the Company closed Apidos CDO III, a $285.5 million CDO transaction that provides financing for bank loans. The investments held by Apidos CDO III collateralize the debt it issued and, as a result, the investments are not available to the Company, its creditors or stockholders. Apidos CDO III issued a total of $262.5 million of senior notes at par to investors and RCC Commercial purchased a $23.0 million equity interest representing 100% of the outstanding preference shares. The equity interest is subordinated in right of payment to all other securities issued by Apidos CDO III.
The senior notes issued to investors by Apidos CDO III consist of the following classes: (i) $212.0 million of class A-1 notes bearing interest at 3-month LIBOR plus 0.26%; (ii) $19.0 million of class A-2 notes bearing interest at 3-month LIBOR plus 0.45%; (iii) $15.0 million of class B notes bearing interest at 3-month LIBOR plus 0.75%; (iv) $10.5 million of class C notes bearing interest at 3-month LIBOR plus 1.75%; and (v) $6.0 million of class D notes bearing interest at 3-month LIBOR plus 4.25%. All of the notes issued mature on JuneSeptember 12, 2020, although the Company has the right to call the notes anytime after JuneSeptember 12, 2011 until maturity. The weighted average interest rate on all notes was 0.75%0.99% and 0.71%0.75% at December 31, 2011 and 2010, and 2009, respectively.
Apidos CDO I
In August 2005, the Company closed Apidos CDO I, a $350.0 million CDO transaction that provides financing for bank loans. The investments held by Apidos CDO I collateralize the debt it issued and, as a result, the investments are not available to the Company, its creditors or stockholders. Apidos CDO I issued a total of $321.5 million of senior notes at par to investors and RCC Commercial purchased a $28.5 million equity interest representing 100% of the outstanding preference shares. The equity interest is subordinated in right of payment to all other securities issued by Apidos CDO I. The reinvestment period for Apidos CDO I ended in July 2011 which will result in the sequential pay down of notes. As of December 31, 2011 $5.5 million of Class A-1 Notes have been paid down.
RESOURCE CAPITAL CORP. AND SUBSIDIARIES
NOTES TO CONSOLIDATED FINANCIAL STATEMENTS – (Continued)
DECEMBER 31, 2011
NOTE 14 – BORROWINGS − (Continued)
Collateralized Debt Obligations – (Continued)
Apidos CDO I – (Continued)
The senior notes issued to investors by Apidos CDO I consist of the following classes: (i) $265.0$259.5 million of class A-1 notes bearing interest at 3-month LIBOR plus 0.26%; (ii) $15.0 million of class A-2 notes bearing interest at 3-month LIBOR plus 0.42%; (iii) $20.5 million of class B notes bearing interest at 3-month LIBOR plus 0.75%; (iv) $13.0 million of class C notes bearing interest at 3-month LIBOR plus 1.85%; and (v) $8.0 million of class D notes bearing interest at a fixed rate of 9.251%. All of the notes issued mature on July 27, 2017, although the Company has the right to call the notes anytime after July 27, 2010 until maturity. The weighted average interest rate on all notes was 0.87%1.04% and 0.86%0.87% at December 31, 2011 and 2010, and 2009, respectively.
RESOURCE CAPITAL CORP. AND SUBSIDIARIES
NOTES TO CONSOLIDATED FINANCIAL STATEMENTS – (Continued)
DECEMBER 31, 2010
NOTE 10 – BORROWINGS − (Continued)Apidos CLO VIII
In October 2011, the Company closed Apidos CLO VIII, a $350.0 million CLO transaction that provides financing for bank loans. The investments held by Apidos CLO VIII collateralize the debt it issued and, as a result, the investments are not available to the Company, its creditors or stockholders. Apidos CLO VIII issued a total of $317.6 million of senior notes at a discount of 4.4% to investors and RCC commercial purchased a $15.0 million interest representing 43% of the outstanding subordinated debt. The remaining 57% of subordinated debt is owned by unrelated third parties. The interest is subordinated in right of payment to all other securities issued by Apidos CLO VIII.
The senior notes issued to investors by Apidos CLO VIII consist of the following classes: (i) $231.2 million of class A-1 notes bearing interest at LIBOR plus 1.50%; (ii) $35.0 million of class A-2 notes bearing interest at LIBOR plus 2.00%; (iii) $17.3 million of class B-1 notes bearing interest at LIBOR plus 2.50%; (iv) $6.8 million of class B-2 notes bearing interest at LIBOR plus 2.50%; (v) $14.1 million of class C notes bearing interest at LIBOR plus 3.10% and (vi) $13.2 million of class D notes bearing interest at LIBOR plus 4.50%. All of the notes issued mature on October 17, 2021, although the Company has the right to call the notes anytime from October 17, 2013 until maturity. The weighted average interest rate on all notes was 2.42% at December 31, 2011.
Unsecured Junior Subordinated Debentures
In May 2006 and September 2006, the Company formed RCT I and RCT II, respectively, for the sole purpose of issuing and selling capital securities representing preferred beneficial interests. Although the Company owns 100% of the common securities of RCT I and RCT II, RCT I and RCT II are not consolidated into the Company’s consolidated financial statements because the Company is not deemed to be the primary beneficiary of these entities. In connection with the issuance and sale of the capital securities, the Company issued junior subordinated debentures to RCT I and RCT II of $25.8 million each, representing the Company’s maximum exposure to loss. The debt issuance costs associated with the junior subordinated debentures for RCT I and RCT II are included in borrowings and are being amortized into interest expense in the consolidated statements of operationsincome using the effective yield method over a ten year period.
In October 2009, the Company amended the trust agreements and unsecured junior subordinated debentures held by RCT I and RCT II with a total value outstanding of $51.5 million. The amendment providesprovided for an interest rate increase of 2% (from LIBOR plus 3.95% to LIBOR plus 5.95%) on both issuances for a period of two years and a one-time restructuring fee of $250,000 in exchange for the waiver of financial covenants under the Company’s guarantee. The debt issuance costs associated with the junior subordinated debentures for RCT I and RCT II at December 31, 20102011, were $590,000$449,927 and $604,000,$466,983, respectively. The debt issuance costs associated with the junior subordinated debentures for RCT I and RCT II at December 31, 20092010 were $742,000$590,000 and $754,000,$604,000, respectively. The interest rate adjustment took effect as of October 1, 2009 and expiresexpired on September 30, 2011.2011, when the rates reverted to LIBOR plus 3.95%. The rates for RCT I and RCT II, at December 31, 2011, were 4.32% and 4.38%, respectively. The rates for RCT I and RCT II, at December 31, 2010, were 6.25% and 6.24%, respectively. The rates for RCT I and RCT II, at December 31, 2009, were 6.18% and 6.19%, respectively. The covenant waiver expireswaivers expired on January 1, 2012.2012, at which time the Company was in compliance with them.
RESOURCE CAPITAL CORP. AND SUBSIDIARIES
NOTES TO CONSOLIDATED FINANCIAL STATEMENTS – (Continued)
DECEMBER 31, 2011
NOTE 14 – BORROWINGS − (Continued)
Collateralized Debt Obligations – (Continued)
Unsecured Junior Subordinated Debentures – (Continued)
The rights of holders of common securities of RCT I and RCT II are subordinate to the rights of the holders of capital securities only in the event of a default; otherwise, the common securities’ economic and voting rights are pari passu with the capital securities. The capital and common securities of RCT I and RCT II are subject to mandatory redemption upon the maturity or call of the junior subordinated debentures held by each. Unless earlier dissolved, RCT I will dissolve on May 25, 2041 and RCT II will dissolve on September 29, 2041. The junior subordinated debentures are the sole assets of RCT I and RCT II, and mature on JuneSeptember 30, 2036 and October 30, 2036, respectively, and may be called at par by the Company any time after JuneSeptember 30, 2011 and October 30, 2011, respectively. The Company records its investments in RCT I and RCT II’s common securities of $774,000 each as investments in unconsolidated trusts and records dividend income upon declaration by RCT I and RCT II.
NOTE 11 – SHARE ISSUANCE AND REPURCHASERepurchase and Credit Facilities
On May 25, 2010,CMBS – Term Repurchase Facility
In February 2011, the Company sold 8,625,000 sharesCompany’s wholly-owned subsidiaries, RCC Real Estate and RCC Commercial, entered into a master repurchase agreement with Wells Fargo Bank, National Association to be used as a warehouse facility to finance the purchase of common stock, including 1,125,000 shares exercised through the underwriters’ over-allotment option, at a price of $5.25 per share.highly-rated CMBS. The Company received net proceedsguaranteed RCC Real Estate’s and RCC Commercial’s performance of approximately $42.8 million after payment of underwriting discounts and commissions of approximately $2.5 million and other offering expenses of approximately $197,000.
Under a dividend reinvestment plan authorized bytheir obligations under the board of directors on November 18, 2010, the Company is authorized to issue up to 8.0 million shares of common stock. Under this plan which succeeded the March 2010 plan, the Company has issued 1,392,037 shares, at a weighted-average share price of $7.38 per share, and received proceeds of $10.0repurchase agreement. At December 31, 2011, RCC Real Estate had borrowed $55.9 million (net of $494,000 of deferred debt issuance costs), all during December 2010.
Under a dividend reinvestment plan authorized by the board of directors on March 22, 2010, the Company is authorized to issue up to 8.0 million shares of common stock. Under this plan, which succeeded the June 2008 plan, the Company has issued 7,903,562 shares, at a weighted-average share price of $6.33 per share, and received proceeds of $48.8 million (net of costs) from April 2010 through November 2010.
Under a dividend reinvestment plan authorized by the board of directors on June 12, 2008, the Company was authorized to issue up to 5.5 million shares of common stock. Under this plan, the Company had issued 3.1guaranteed. At December 31, 2011, borrowings under the repurchase agreement were secured by highly-rated CMBS with an estimated fair value of $64.3 million sharesand a weighted average interest rate of common stock during the three months ended March 31, 2010 at a weighted-average share price of $5.91 per share and received proceeds of $18.0 million (net of costs)one-month LIBOR plus 1.25%, or 1.54%. The Company had issued 5.0 million shares of common stockno repurchase agreements at December 31, 2010.
The following table shows information about the amount at risk under this plan.facility (dollars in thousands);
| | | | | | Weighted Average Maturity in Days | | | Weighted Average Interest Rate | |
| December 31, 2011: | | | | | | | | | |
Wells Fargo Bank, National Association. | | $ | 8,461 | | | | 18 | | | | 1.54% | % |
| (1) | Equal to the estimated fair value of securities or loans sold, plus accrued interest income, minus the sum of repurchase agreement liabilities plus accrued interest expense. |
Revolving Credit Facility
On July 7, 2011, the Company and RCC Real Estate entered into a $10.0 million revolving credit facility with The Bancorp Bank (“Bancorp”). The facility will provide bridge financing for up to five business days which will enable the Company and RCC Real Estate to fund real estate loans to third parties prior to their sale to the Company’s CRE CDOs. The facility is evidenced by a Revolving Judgment Note and Security Agreement by and among the borrowers and Bancorp entered into July 7, 2011. The facility is secured by a pledge of $32.9 million of the Class A-1 notes of RREF CDO 2006-1, which are owned by RCC Real Estate. The note becomes due and payable on September 30, 2012. The Company had no borrowings under this revolving credit facility as of December 31, 2011.
Mortgage Payable
On August 1, 2011, the Company, through its subsidiary, RCC Real Estate, purchased Whispertree Apartments, a 504 unit multi-family property located in Houston, Texas, for $18.1 million. The property was 95% occupied at acquisition. In conjunction with the purchase of the property, the Company entered into a seven year mortgage of $13.6 million with a lender. The mortgage bears interest at a rate of one-month LIBOR plus 3.95%. As of December 31, 2011 the borrowing rate was 4.23%.
RESOURCE CAPITAL CORP. AND SUBSIDIARIES
NOTES TO CONSOLIDATED FINANCIAL STATEMENTS – (Continued)
DECEMBER 31, 20102011
NOTE 1115 – STOCK INCENTIVE PLANS AND SHARE ISSUANCE AND REPURCHASE – (Continued)
Upon formation of the Company, the 2005 Stock Incentive Plan (the “2005 Plan”) was adopted for the purpose of attracting and retaining executive officers, employees, directors and other persons and entities that provide services to the Company. The 2005 Plan authorizes the issuance of up to 1,533,333 shares of common stock in the form of options to purchase common stock, stock awards, performance shares and stock appreciation rights.
In July 2007, the Company’s shareholders approved the 2007 Omnibus Equity Compensation Plan (the “2007 Plan”). The 2007 Plan authorizes the issuance of up to 2,000,000 shares of common stock in the form of options to purchase common stock, stock awards, performance shares and stock appreciation rights. On June 23, 2011, the 2007 Omnibus Equity Compensation Plan was been amended to: (i) increase the number of shares authorized for issuance under the Omnibus Plan from 2,000,000 shares to 5,400,000 shares; (ii) extend the expiration date of the Omnibus Plan to June 23, 2021; (iii) provide that the Administrator making certain determinations after a Change of Control will be comprised of the same persons who constitute the Administrator immediately before the Change of Control; and (iv) make other clarifying and updating amendments to the Omnibus Plan.
On June 23, 2011, the 2007 Omnibus Equity Compensation Plan was amended to: (i) increase the number of shares authorized for issuance under the Omnibus Plan from 2,000,000 shares to 5,400,000 shares; (ii) extend the expiration date of the Omnibus Plan to June 23, 2021; (iii) provide that the Administrator of the Omnibus Plan making certain determinations after a change of control (as defined in the Omnibus Plan) will be comprised of the same persons who constitute the Administrator immediately before the Change of Control; and (iv) make other clarifying and updating amendments to the Omnibus Plan. In August 2011, the Company’s shareholders approved this amendment.
On March 30, 2011, the Company sold 6,900,000 shares of common stock in an underwritten public offering, including 900,000 shares exercised through the underwriters’ over-allotment option, at a price of $6.90 per share. The Company received net proceeds of approximately $46.6 million after payment of underwriting discounts and commissions of approximately $966,000 and before other offering expenses of approximately $228,000.
Under a share repurchasedividend reinvestment plan authorized by the board of directors on July 26, 2007,March 10, 2011, the Company is authorized to repurchaseissue up to 2.510.0 million shares of its outstanding common shares. Nostock. Under this plan, which succeeded the November 2010 plan referred to below, the Company has issued 6,939,813 shares, were repurchased during the year endedat a weighted-average share price of $5.76 per share, and received proceeds of $39.1 million (net of costs) through December 31, 2010. The2011.
Under an earlier dividend reinvestment plan authorized by the board of directors on November 18, 2010, the Company has repurchasedwas authorized to issue up to 8.0 million shares of common stock. Under this plan, the Company had issued 6,571,468 shares from January 2011 through May 2011 at a totalweighted-average share price of 1,663,000 shares$6.93 per share and received proceeds of $44.4 million (net of costs). At June 2011, the Company had issued all of the common stock authorized under this program as of December 31, 2010.plan.
NOTE 1216 – SHARE-BASED COMPENSATION
The following table summarizes restricted common stock transactions:
| | | | | | | | | | | | | | | | | | | |
Unvested shares as of January 1, 2010 | | | 52,632 | | | | 384,687 | | | | 437,319 | | |
Unvested shares as of January 1, 2011 | | | | 16,939 | | | | 518,018 | | | | 534,957 | |
Issued | | | 16,939 | | | | 320,800 | | | | 337,739 | | | | 15,200 | | | | 1,191,165 | | | | 1,206,365 | |
Vested | | | (52,632 | ) | | | (187,469 | ) | | | (240,101 | ) | | | (16,939 | ) | | | (291,650 | ) | | | (308,589 | ) |
Forfeited | | | − | | | | − | | | | − | | | | − | | | | (3,802 | ) | | | (3,802 | ) |
Unvested shares as of December 31, 2010 | | | 16,939 | | | | 518,018 | | | | 534,957 | | |
Unvested shares as of December 31, 2011 | | | | 15,200 | | | | 1,413,731 | | | | 1,428,931 | |
The Company is required to value any unvested shares of restricted common stock granted to non-employees at the current market price. The estimated fair value of the unvested shares of restricted stock granted during the years ended December 31, 2011 and 2010, and 2009, including the grant date fair value of shares issued to the Company’s five non-employee directors, was $8.2 million and $1.8 million, and $709,000, respectively.
On April 12, 2010,January 26, 2011, the Company issued 4,895316,480 shares of restricted common stock under its 2005 Stock Incentive Plan. These restricted shares will vest 33.3% on each of April 12, 2011, 2012Amended and 2013.
On February 10, 2010, the Company issued 142,501 shares of restricted common stock under its 2005 Stock Incentive Plan andRestated 2007 Omnibus Equity Compensation Plan. These restricted shares will vest 33.3%in full on each of February 10,January 27, 2014.
RESOURCE CAPITAL CORP. AND SUBSIDIARIES
NOTES TO CONSOLIDATED FINANCIAL STATEMENTS – (Continued)
DECEMBER 31, 2011 2012 and 2013.
NOTE 16 – SHARE-BASED COMPENSATION – (Continued)
On February 1, 20102011 and March 8, 2010,2011, the Company granted 4,0833,120 and 12,85612,080 shares of restricted stock, respectively, under its 2005 Stock Incentive PlanAmended and Restated 2007 Omnibus Equity Compensation Plan respectively, to the Company’s non-employee directors as part of their annual compensation. These shares vest in full on the first anniversary of the date of grant.
On January 14, 2010,February 8, 2011, the Company issued 173,404593,271 shares of restricted common stock under its Amended and Restated 2007 Omnibus Equity Compensation Plan. Of this issuance, 69,156 of these restricted shares will vest on February 8, 2013 and the remaining 524,115 of these restricted shares will vest on February 10, 2014.
On February 23, 2011, the Company issued 1,414 shares of restricted common stock under its Amended and Restated 2007 Omnibus Equity Compensation Plan. These shares will vest in full on February 24, 2014.
In connection with the July 2006 hiring of a commercial mortgage direct loan origination team by Resource Real Estate, Inc. (“Resource Real Estate”), a subsidiary of Resource America, the Company agreed to issue up to 100,000 shares of common stock and options to purchase an additional 100,000 shares of common stock if certain loan origination performance thresholds were achieved by this origination team for the Company’s account. The performance thresholds were two-tiered. Upon the achievement of $400.0 million of direct originations of commercial real estate loans, 60,000 restricted shares of common stock and options to purchase an additional 60,000 shares of common stock were issuable. This hurdle was met in September 2007. Upon the achievement of an additional $300.0 million of direct originations of commercial real estate loans, a second tranche of 40,000 restricted shares of common stock and options to purchase another 40,000 shares of common stock were issuable. The restricted shares vest over a two-year period after issuance and the options to purchase shares of common stock vest over a three-year period after issuance. On May 16, 2011, 40,000 shares of restricted common stock and 40,000 options to purchase an additional shares were issued as a result of the achievement of an additional $300.0 million of direct originations. The restricted shares vest 50% on May 16, 2012 and 50% on May 16, 2013. The options vest 33.3% per year beginning on May 16, 2012.
On August 25, 2011, the Company issued 240,000 shares of restricted common stock under its Amended and Restated 2007 Omnibus Equity Compensation Plan. These shares will vest 33.3% on each of January 22,May 15, 2012, 2013 and 2014. In connection with this grant, the Company agreed to issue up to 336,000 additional shares of common stock if certain loan origination performance thresholds are achieved by personnel from the Company’s loan origination team. The performance criteria are measured at the end of three annual measurement periods beginning April 1, 2011. The agreement, with respect to the issuance of the 336,000 shares also provides dividend equivalent rights pursuant to which the dividends that would have been paid on the shares had they been issued on the date of grant will be paid at the end of each annual measurement period if the performance criteria are met. If the performance criteria are not met, the accrued dividends will be forfeited. As a consequence, the Company will not record the dividend equivalent rights until earned. At December 31, 2011, 2012 and 2013.there was $168,000 of dividends payable upon achievement of the performance criteria. If earned, the performance shares will vest over the subsequent 18 months at the rate of one-sixth per quarter.
The following table summarizes stock option transactions:
| | | | | | Weighted Average Exercise Price | | | Weighted Average Remaining Contractual Term (in years) | | | Aggregate Intrinsic Value (in thousands) | |
| Outstanding as of January 1, 2010 | | | 607,666 | | | $ | 14.99 | | | | | | | |
Granted | | | − | | | | − | | | | | | | |
Exercised | | | − | | | | − | | | | | | | |
Forfeited | | | (5,000 | ) | | | 15.00 | | | | | | | |
| Outstanding as of December 31, 2010 | | | 602,666 | | | $ | 14.99 | | | | 5 | | | $ | 564 | |
Exercisable at December 31, 2010 | | | 602,666 | | | $ | 14.99 | | | | 5 | | | $ | 564 | |
RESOURCE CAPITAL CORP. AND SUBSIDIARIES
NOTES TO CONSOLIDATED FINANCIAL STATEMENTS – (Continued)
DECEMBER 31, 2010
NOTE 12 – SHARE-BASED COMPENSATION – (Continued)
The stock options have a weighted average remaining contractual term of fivefour years. Upon exercise of options, new shares are issued.
The following table summarizes the status of the Company’s unvested stock options as of December 31, 2010:2011:
| Unvested Options | | | | | Weighted Average Grant Date Fair Value | |
Unvested at January 1, 2011 | | | − | | | $ | − | |
Granted | | | 40,000 | | | $ | 6.40 | |
Vested | | | − | | | $ | − | |
Forfeited | | | − | | | $ | − | |
Unvested at December 31, 2011 | | | 40,000 | | | $ | 6.40 | |
| Unvested Options | | | | | Weighted Average Grant Date Fair Value | |
Unvested at January 1, 2010 | | | 21,666 | | | $ | 14.88 | |
Granted | | | − | | | $ | − | |
Vested | | | (21,666 | ) | | $ | 14.88 | |
Forfeited | | | − | | | $ | − | |
Unvested at December 31, 2010 | | | − | | | $ | − | |
RESOURCE CAPITAL CORP. AND SUBSIDIARIES
NOTES TO CONSOLIDATED FINANCIAL STATEMENTS – (Continued)
DECEMBER 31, 2011
NOTE 16 – SHARE-BASED COMPENSATION – (Continued)
The following table summarizes the status of the Company’s vested stock options as of December 31, 2010:2011:
| Vested Options | | | | | Weighted Average Exercise Price | | Weighted Average Remaining Contractual Term (in years) | | Aggregate Intrinsic Value (in thousands) |
Vested as of January 1, 2011 | | | 602,666 | | | $ | 14.99 | | | | |
Vested | | | − | | | $ | − | | | | |
Exercised | | | − | | | $ | − | | | | |
Forfeited | | | (1,000 | ) | | $ | 15.00 | | | | |
Vested as of December 31, 2011 | | | 601,666 | | | $ | 14.99 | | 3 | | $ 174 |
| Vested Options | | | | | Weighted Average Exercise Price | | | Weighted Average Remaining Contractual Term (in years) | | | Aggregate Intrinsic Value (in thousands) | |
| Unvested as of January 1, 2010 | | | 586,000 | | | $ | 14.99 | | | | | | | |
Granted | | | 21,666 | | | $ | 14.88 | | | | | | | |
Exercised | | | − | | | $ | − | | | | | | | |
Forfeited | | | (5,000 | ) | | $ | 15.00 | | | | | | | |
| Vested as of December 31, 2010 | | | 602,666 | | | $ | 14.99 | | | | 5 | | | $ | 564 | |
The stock option transactions are valued using the Black-Scholes model with the following assumptions:
| | | | | | | |
| | | | | | | | | | | | | | | | | | | |
Expected life | | 5 years | | | 7 years | | | 8 years | | | 4 years | | | 5 years | | | 7 years | |
Discount rate | | | 1.09% | | | | 3.53% | | | | 2.94% | | | | 0.53% | | | | 1.09% | | | | 3.53% | |
Volatility | | | 80.70% | | | | 137.86% | | | | 127.20% | | | | 62.10% | | | | 80.70% | | | | 137.86% | |
Dividend yield | | | 15.75% | | | | 20.33% | | | | 33.94% | | | | 16.58% | | | | 15.75% | | | | 20.33% | |
The estimated fair value of each option granted atduring the year ended December 31, 2011 was $0.624. There were no options granted during the years ended December 31, 2010 and 2009 was $0.936 and $0.897, respectively. 2009.
For the years ended December 31, 2011, 2010 2009 and 2008,2009, the components of equity compensation expense were as follows (in thousands):
| | | | |
| | | | | | | | | | |
Options granted to Manager and non-employees | | $ | 11 | | | $ | 15 | | | $ | (52 | ) |
Restricted shares granted to Manager and non-employees | | | 2,098 | | | | 1,113 | | | | 486 | |
Restricted shares granted to non-employee directors | | | 112 | | | | 112 | | | | 106 | |
Total equity compensation expense | | $ | 2,221 | | | $ | 1,240 | | | $ | 540 | |
RESOURCE CAPITAL CORP. AND SUBSIDIARIES
NOTES TO CONSOLIDATED FINANCIAL STATEMENTS – (Continued)
DECEMBER 31, 2010| | | | |
| | | | | | | | | | |
Options granted to Manager and non-employees | | $ | 15 | | | $ | 11 | | | $ | 15 | |
Restricted shares granted to Manager and non-employees | | | 2,399 | | | | 2,098 | | | | 1,113 | |
Restricted shares granted to non-employee directors | | | 112 | | | | 112 | | | | 112 | |
Total equity compensation expense | | $ | 2,526 | | | $ | 2,221 | | | $ | 1,240 | |
NOTE 12 – SHARE-BASED COMPENSATION – (Continued)
During the years ended December 31, 2011, 2010 and 2009, the Manager received 80,228, 251,993 and 169,431 shares, respectively, as incentive compensation valued at $463,000, $1.4 million and $867,000, respectively, pursuant to the Management Agreement. The incentive management fee is paid one quarter in arrears.
Apart from incentive compensation payable under the Management Agreement, the Company has established no formal criteria for equity awards as of December 31, 2010.2011. All awards are discretionary in nature and subject to approval by the compensation committee.
RESOURCE CAPITAL CORP. AND SUBSIDIARIES
NOTES TO CONSOLIDATED FINANCIAL STATEMENTS – (Continued)
DECEMBER 31, 2011
NOTE 1317 –EARNINGS PER SHARE
The following table presents a reconciliation of basic and diluted earnings per share for the periods presented as follows (in thousands, except share and per share amounts):
| | | | | | | |
| | | | | | | | | | | | | | | | | | | |
Basic: | | | | | | | | | | | | | | | | | | |
Net Income (loss) | | $ | 19,447 | | | $ | 6,339 | | | $ | (3,074 | ) | |
Net Income | | | $ | 37,716 | | | $ | 19,447 | | | $ | 6,339 | |
Weighted average number of shares outstanding | | | 47,715,082 | | | | 25,205,403 | | | | 24,757,386 | | | | 70,410,131 | | | | 47,715,082 | | | | 25,205,403 | |
Basic net income (loss) per share | | $ | 0.41 | | | $ | 0.25 | | | $ | (0.12 | ) | | $ | 0.54 | | | $ | 0.41 | | | $ | 0.25 | |
| | | | | | | | | | | | | | | | | | | | | | | | | |
Diluted: | | | | | | | | | | | | | | | | | | | | | | | | |
Net Income (loss) | | $ | 19,447 | | | $ | 6,339 | | | $ | (3,074 | ) | |
Net Income | | | $ | 37,716 | | | $ | 19,447 | | | $ | 6,339 | |
Weighted average number of shares outstanding | | | 47,715,082 | | | | 25,205,403 | | | | 24,757,386 | | | | 70,410,131 | | | | 47,715,082 | | | | 25,205,403 | |
Additional shares due to assumed conversion of dilutive instruments | | | 192,199 | | | | 150,418 | | | | − | | | | 398,957 | | | | 192,199 | | | | 150,418 | |
Adjusted weighted-average number of common shares outstanding | | | 47,907,281 | | | | 25,355,821 | | | | 24,757,386 | | | | 70,809,088 | | | | 47,907,281 | | | | 25,355,821 | |
Diluted net income (loss) per share | | $ | 0.41 | | | $ | 0.25 | | | $ | (0.12 | ) | | $ | 0.53 | | | $ | 0.41 | | | $ | 0.25 | |
Potentially dilutive shares relating to 253,975 shares of restricted stock are641,666 options were not included in the calculation of diluted net (loss)income per share for the year ended December 31, 2008 because the effect was anti-dilutive.
NOTE 1418 – THE MANAGEMENT AGREEMENT
On March 8, 2005, the Company entered into a Management Agreement with the Manager and Resource America pursuant to which the Manager provides the Company investment management, administrative and related services. The agreement was amended June 30, 2008 and further amended on October 16, 2009. Under the agreement, the Manager receives fees and is reimbursed for its expenses as follows:
| | ·● | A monthly base management fee equal to 1/12th of the amount of the Company’s equity multiplied by 1.50%. Under the management agreement, ‘‘equity’’ is equal to the net proceeds from any issuance of shares of common stock less offering related costs, plus or minus the Company’s retained earnings (excluding non-cash equity compensation incurred in current or prior periods) less any amounts the Company has paid for common stock repurchases. The calculation is adjusted for one-time events due to changes in GAAP, as well as other non-cash charges, upon approval of the independent directors of the Company. |
RESOURCE CAPITAL CORP. AND SUBSIDIARIES
NOTES TO CONSOLIDATED FINANCIAL STATEMENTS – (Continued)
DECEMBER 31, 2010
NOTE 14 – THE MANAGEMENT AGREEMENT – (Continued)
| | ·● | Incentive compensation is calculated as follows: (i) twenty-five percent (25%) of the dollar amount by which (A) the Company’s adjusted operating earnings (before incentive compensation but after the base management fee) for such quarter per common share (based on the weighted average number of common shares outstanding for such quarter) exceeds (B) an amount equal to (1) the weighted average of the price per share of the common shares in the initial offering by the Company and the prices per share of the Common Shares in any subsequent offerings by the Company, in each case at the time of issuance thereof, multiplied by (2) the greater of (a) 2.00% and (b) 0.50% plus one-fourth of the Ten Year Treasury Rate for such quarter, multiplied by (ii) the weighted average number of common shares outstanding during such quarter, subject to adjustment, to exclude events pursuant to changes in GAAP or the application of GAAP, as well as non-recurring or unusual transactions or events, after discussion between the Manager and the Independent Directors and approval by a majority of the independent directors in the case of non-recurring or unusual transactions or events. On August 17, 2010, the Company entered into an amendment (the “Amendment”) to its Amended and Restatedthe Management Agreement dated as of June 30, 2008, by and amongpursuant to which the Company, the Manager and Resource America. Pursuant to the Amendment, fees paid by a taxable REIT subsidiary of the Company to employees, agents or affiliates of the Manager with respect to profits of such taxable REIT subsidiary (or any subsidiary thereof) will be deducted from the Company’s quarterly calculation of incentive compensation payable to the Manager. Additionally, any income taxes payable by a taxable REIT subsidiary of the Company will be excluded from the Company’s calculation of operating earnings. |
| | ·● | Reimbursement of out-of-pocket expenses and certain other costs incurred by the Manager that relate directly to the Company and its operations. |
RESOURCE CAPITAL CORP. AND SUBSIDIARIES
NOTES TO CONSOLIDATED FINANCIAL STATEMENTS – (Continued)
DECEMBER 31, 2011
NOTE 18 – THE MANAGEMENT AGREEMENT – (Continued)
| | ·● | The Manager provides the Company with a Chief Financial Officer and threeseveral accounting professionals, each of whom is exclusively dedicated to the Company’s operations. The Manager also provides the Company with a director of investor relations who is 50% dedicated to the Company’s operations. The Company bears the expense of the wages, salaries and benefits of the Chief Financial Officer and threeseveral accounting professionals, and bears 50% of the salary and benefits of the director of investor relations. In addition, in February 2010, the Company began reimbursing its Chairmanthe Manager for the wages, salary, and benefits in February 2010.of its Chairman of the Board, who is exclusively dedicated to the operations of the Company. |
Incentive compensation is paid quarterly. Up to 75% of the incentive compensation is paid in cash and at least 25% is paid in the form of an award of common stock. The Manager may elect to receive more than 25% of its incentive compensation in common stock. All shares are fully vested upon issuance. However, the Manager may not sell such shares for one year after the incentive compensation becomes due and payable. Shares payable as incentive compensation are valued as follows:
| | ·● | if such shares are traded on a securities exchange, at the average of the closing prices of the shares on such exchange over the thirty day period ending three days prior to the issuance of such shares; |
| | ·● | if such shares are actively traded over-the-counter, at the average of the closing bid or sales price as applicable over the thirty day period ending three days prior to the issuance of such shares; and |
| | ·● | if there is no active market for such shares, the value is the fair market value thereof, as reasonably determined in good faith by the board of directors of the Company. |
As amended, the Management Agreement had an initial term ended March 31, 2009 and automatically renewed for awith automatic annual one-year renewals unless at the end of the initial term annually unlessor any renewal term at least two-thirds of the independent directors or a majority of the outstanding common shares agreed not to renew the Management Agreement. The current term of the Management Agreement ends on March 31, 2011.2012. With a two-thirds vote of the independent directors, the independent directors may elect to terminate the Management Agreement because of the following:
| | ·● | unsatisfactory performance; and/or |
| | ·● | unfair compensation payable to the Manager where fair compensation cannot be agreed upon by the Company (pursuant to a vote of two-thirds of the independent directors) and the Manager. |
In the event that the Management Agreement is terminated based on the above provisions, the Company must pay the Manager a termination fee equal to four times the sum of the average annual base management fee and the average annual incentive during the two 12-month periods immediately preceding the date of such termination. The Company is also entitled to terminate the Management Agreement for cause (as defined therein) without payment of any termination fee.
RESOURCE CAPITAL CORP. AND SUBSIDIARIES
NOTES TO CONSOLIDATED FINANCIAL STATEMENTS – (Continued)
DECEMBER 31, 2010
NOTE 14 – THE MANAGEMENT AGREEMENT – (Continued)
In conjunction with the December 2009 common stock offering, it was determined that for the quarters ending on December 31, 2009 and March 31, 2010, the total incentive management fee payable to the Manager pursuant to the Amended and Restated Management Agreement dated as of June 30, 2008, shallwould not exceed $1.5 million per quarter.
The base management fee for the years ended December 31, 2011, 2010 and 2009 and 2008 was $7.0 million, $5.4 million and $3.8 million, respectively. The manager earned an incentive management fee of $3.6 million of which $3.2 million was paid in cash, which also included $1.9 million related to the Company’s investment management agreement with a subsidiary of the Manager, and $4.5 million, respectively.$430,000 was paid in stock (75,746 shares) for the period from January 1, 2011 to December 31, 2011. The manager earned an incentive management fee of $7.4 million of which $6.3 million was paid in cash, which also included $3.4 million related to the Company’s investment management agreement with a subsidiary of the Manager, and $1.1 million was paid in stock (182,660 shares) for the period from January 1, 2010 to December 31, 2010.
On February 24, 2011, the Company entered into further amendment to the Management Agreement. Pursuant to this amendment, the Company agreed to pay Apidos Capital Management, LLC (an affiliate of the Manager) (“ACM”) such fees as are set forth in a Services Agreement dated as of February 24, 2011 among a subsidiary of the Company, RCAM and ACM. The manager earned anServices Agreement provides for 10% of all base collateral management fees and additional collateral management fees paid to RCAM and 50% of all incentive collateral management fees will be paid by RCAM to ACM. During the period ended December 31, 2011, RCAM paid ACM $1.0 million in fees.
RESOURCE CAPITAL CORP. AND SUBSIDIARIES
NOTES TO CONSOLIDATED FINANCIAL STATEMENTS – (Continued)
DECEMBER 31, 2011
NOTE 18 – THE MANAGEMENT AGREEMENT – (Continued)
At December 31, 2011, the Company was indebted to the Manager for base management fees of $625,000, incentive management feefees to a subsidiary of $4.6the Manager under the Company’s investment management agreement of $1.9 million, $117,000 of which $3.4 million was paid in cashfees payable to ACM from RCAM, and $1.2 million was paid in stock (217,149 shares) for the period from January 1, 2009 to December 31, 2009. The manager earned an incentive management feeexpense reimbursements of $1.8 million of which $1.3 million was paid in cash and $440,000 was paid in stock (86,489 shares) for the period from January 1, 2008 to December 31, 2008.
$272,000. At December 31, 2010, the Company was indebted to the Manager for base management fees of $522,000 incentive management fees of $131,000, incentive management fees to a subsidiary of the Manager under the Company’s investment management agreement of $1.0 million and expense reimbursements of $256,000. At December 31, 2009, the Company was indebted to the Manager for base management fees of $371,000 incentive management fees of $1.5 million and expense reimbursements of $129,000.
NOTE 1519 – RELATED-PARTY TRANSACTIONS
Relationship with Resource America and Certain of its Subsidiaries
Relationship with Resource America and Certain of its Subsidiaries. At December 31, 2010,2011, Resource America owned 2,444,0022,524,230 shares, or 4.2%3.2%, of the Company’s outstanding common stock. In addition, at that date, Resource America also held 2,166 options to purchase 2,166 shares of commonrestricted stock.
The Company is managed by the Manager pursuant to the Management Agreement, thatwhich provides for both base and incentive management fees. For the years ended December 31, 2011, 2010 2009 and 2008,2009, the Manager earned base management fees of approximately $7.0 million, $5.4 million $3.8 million and $4.5$3.8 million, respectively, and earnedincentive management fees of $1.7 million, $4.4 million and $4.6 million and $1.8 million, respectively, of incentive management fees.million. The Company also reimburses the Manager and Resource America for expenses and employees of Resource America who perform legal, accounting, due diligence and other services that outside professionals or consultants would otherwise perform. On October 16, 2009, the Company entered into an amendment to the management agreement. Pursuant to the amendment, the Manager must provide the Company with a Chief Financial Officerperform and three accounting professionals, each of whom will be exclusively dedicated to the operations of the Company. The Manager must also provide the Company with a director of investor relations who will be 50% dedicated to the Company’s operations. The Company will bear the expense offor the wages, salaries and benefits of certain Resource America personnel dedicated to the Chief Financial Officer and three accounting professionals and 50% of the salary and benefits of the director of investor relations. In addition, the Company began reimbursing its Chairman for wages, salary, and benefits in February 2010.Company’s operation. For the years ended December 31, 2011, 2010 2009 and 2008,2009, the Company paid the Manager $2.5 million, $1.8 million $664,000 and $392,000,$664,000, respectively, as expense reimbursements. ForSee Note 18 for a description of the management agreement and fees paid and payable to the Manager (see Note 14).Manager.
On November 24, 2010, the Company entered into an Investment Management Agreement with Resource Capital Markets, Inc. (“RCM”), a wholly-owned subsidiary of Resource America. The initial agreement provided that: (a) RCM may invest up to $5.0 million of the Company’s funds, with the investable amount being adjusted by portfolio gains/(losses) and collections, and offset by expenses, taxes and realized management fees, and (b) RCM can earn a management fee in any year that the net profits earned exceed a preferred return. On June 17, 2011, the company entered into a revised Investment Management Agreement with RCM which would provide an additional $8.0 million of the Company’s funds. The management fee is 20% of the amount by which the net profits exceed the preferred return. During the years ended December 31, 2011, 2010 and 2009, RCM earned $1.9 million, $2.9 million, and $0 in management fees, respectively. The Company has reinvested gains from its activity and holds $38.7 million in fair market value of trading securities as of December 31, 2011, an increase of $21.0 million from $17.7 million at fair market value as of December 31, 2010. In addition, the Company and RCM have established an escrow account that allocates the net profit or net losses of the portfolio on a yearly basis based on the net asset value of the account. During the years ended December 31, 2011, 2010 and 2009, RCM earned $444,000, $438,000 and $0, respectively, as its share of the net profits as defined in the Investment Management Agreement.
At December 31, 2011, the Company was indebted to the Manager for base management fees of $625,000, incentive management fees to a subsidiary of the Manager under the Company’s investment management agreement of $1.9 million and expense reimbursements of $272,000. At December 31, 2010, the Company was indebted to the Manager for base management fees of $522,000 incentive management fees of $131,000, and expense reimbursements of $256,000. At December 31, 2009, the Company was indebted to the Manager for base management fees of $371,000, incentive management fees to a subsidiary of $1.5the Manager under the Company’s investment management agreement of $1.0 million and expense reimbursements of $129,000.$256,000.
As of each of December 31, 20102011 and 2009,2010, the Company had executed seven and six CDO transactions, respectively, which were structured for the Company by the Manager. Under the Management Agreement, the Manager was not separately compensated by the Company for executing these transactions and is not separately compensated for managing the CDO entities and their assets.
RESOURCE CAPITAL CORP. AND SUBSIDIARIES
NOTES TO CONSOLIDATED FINANCIAL STATEMENTS – (Continued)
DECEMBER 31, 2011
NOTE 19 – RELATED-PARTY TRANSACTIONS – (Continued)
Relationship with LEAF Financial. LEAF Financial, a wholly-owned subsidiary of Resource America, originates and manages equipment leases and notes on behalf of the Company.
On November 16, 2011, the Company together with LEAF Financial and LCC, subsidiaries of Resource America, entered into a SPA with Eos Partners, L.P., a private investment firm, and its affiliates (“Eos”). In exchange for its prior interest in LCC, the Company received 31,341 shares of Series A Preferred Stock, 4,872 shares of newly issued 8% Series B Redeemable Preferred Stock and 2,364 shares of newly issued Series D Redeemable Preferred Stock, collectively representing, on a fully-diluted basis, a 26.7% interest in LCC. The Company utilized several approaches, including discounted expected cash flows, market approach and comparable sales transactions to estimate the fair value of its investment in LEAF as a result of the transaction. These approaches required assumptions and estimates of many critical factors, including revenue and market growth, operating cash flows, market multiples, and discount rates, which were based on the current economic environment and credit market conditions. The Company’s investment in LEAF was valued at $36.3 million based on a third-party valuation. Accordingly, the Company recorded a loss of $2.2 million in conjunction with the transaction.
In accordance with the SPA, the Company and Resource America have undertaken a contingent obligation with respect to the value of the equity on the balance sheet of LEAF Receivables Funding 3, a wholly-owned subsidiary of LCC which owns equipment, equipment leases and notes. To the extent that the value of the equity on the balance sheet of LEAF Receivables Funding 3 is less than approximately $18.7 million (the value of the equity of LRF 3 on the date it was contributed to LCC by TRS), as of the final testing date within 90 days of December 31, 2013, the Company and Resource America have agreed to be jointly and severally obligated to contribute cash to LCC to make up the deficit. The Company does not believe it is probable or estimable that it will be required to fund LCC in accordance with the SPA.
On July 20, 2011, the Company entered into an agreement with LCC, pursuant to which the Company provided a $10.0 million loan to LCC, of which the total amount was funded as of November 4, 2011. The loan was to mature on January 20, 2013 and bears interest at a fixed rate of 8.0% per annum on the unpaid principal balance, payable quarterly. The loan was secured by all the assets of LEAF Capital Funding, LLC and LEAF Financial’s interest in LEAF Receivables Funding 3. On November 16, 2011, LLC used $8.5 million of the $11.2 million they received from the Eos transaction to repay $8.4 million in principal plus all outstanding accrued interest on the loan, representing approximately 85% of the outstanding indebtedness owed to the Company. Both parties agreed that the loan was considered paid in full as of December 31, 2011. Accordingly, the Company recorded a charge to Additional Paid-In Capital to eliminate the remaining debt of $1.6 million.
On January 4, 2011, the Company’s wholly-owned subsidiary, Resource TRS, made a preferred investment in LCC, a newly-formed equipment financing subsidiary of LEAF Financial. Resource TRS contributed initial capital of approximately $26.2 million to LCC in the form of approximately $5.2 million in cash, and all of its interest in LEAF Receivables Funding 3, a wholly-owned subsidiary of Resource TRS, which held a portfolio of equipment, equipment leases and notes. As part of the transaction, LEAF Financial contributed its assets relating to its equipment lease and note origination, servicing and finance business to LCC. Also, senior management personnel of LEAF Financial contributed capital to LCC in the form of all of the shares of common stock they owned in LEAF Financial in exchange for 10% of the shares of LCC common stock on a fully-diluted basis. The foregoing capital investments in LCC were made pursuant to a Transfer and Contribution Agreement among the registrant, LEAF Financial, LCC, Resource TRS and the Management Parties (“TCA”).
Pursuant to the TCA, in return for Resource TRS’s capital investments, LCC issued to Resource TRS 2,626,783 shares of LCC Series A preferred stock and warrants to purchase 4,800 shares of LCC common stock for an exercise price of $0.01 per share. The shares receivable upon exercise of the warrants represent 48% of LCC’s common stock on a fully-diluted basis. The investment is classified as securities available-for-sale on the Company’s consolidated balance sheet.
As set forth in the TCA, on January 4, 2011, Resource TRS also delivered to LCC a Share Purchase Agreement under which LCC was permitted to require Resource TRS to purchase up to an additional $10.0 million of Series A preferred stock, of which all $10.0 million was purchased during the second quarter of 2011.
RESOURCE CAPITAL CORP. AND SUBSIDIARIES
NOTES TO CONSOLIDATED FINANCIAL STATEMENTS – (Continued)
DECEMBER 31, 2011
NOTE 19 – RELATED-PARTY TRANSACTIONS – (Continued)
On March 5, 2010, the Company entered into agreements with Lease Equity Appreciation Fund II, L.P. (“LEAF II”), pursuant to which the Company provided an $8.0 million credit facility to LEAF II, of which all $8.0 million has been funded. The credit facility had a one year term at 12% per year, payable quarterly, and was secured by all the assets of LEAF II Receivables Funding, LLC (“LEAF Funding II”), including its entire ownership interest in LEAF II. The Company received a 1% origination fee in connection with the establishment of the facility. The facility originally matured on March 3, 2011 and was extended until September 3, 2011 with a 1% extension fee paid on the outstanding loan balance. On June 3, 2011, the Company entered into an amendment to extend the maturity to February 15, 2012 and to decrease the interest rate from 12% to 10% per annum resulting in a troubled-debt restructuring under current accounting guidance. On February 15, 2012, the note was further amended to extend the maturity to February 15, 2013 with a 1% extension fee accrued and added to the amount outstanding. The loan amount outstanding at December 31, 2011 was $7.8 million.
Relationship with Apidos Capital Management. ACM, a subsidiary of Resource America, manages internally and externally originated bank loan assets on the Company’s behalf. On February 24, 2011, a subsidiary of the Company purchased 100% of the ownership interests in Churchill Pacific Asset Management LLC ("CPAM") from Churchill Financial Holdings LLC for $22.5 million. Through CPAM, the Company is entitled to collect senior, subordinated and incentive fees related to five Collateralized Loan Obligations (“CLOs”) totaling approximately $1.9 billion in assets managed by CPAM. CPAM is assisted by ACM, in managing the five CLOs. CPAM subsequently changed its name to Resource Capital Asset Management (“RCAM”). ACM is entitled to 10% of all subordinated fees and 50% of the incentive fees received by RCAM. For the period from acquisition through December 31, 2011, ACM was paid $1.0 million from subordinated fees received.
Relationship with Resource Real Estate. Resource Real Estate, a subsidiary of Resource America, originates, finances and manages the Company’s commercial real estate loan portfolio, including whole loans, A notes, B notes, mezzanine loans, and investments in real estate. The Company reimburses Resource Real Estate for loan origination costs associated with all loans originated. At December 31, 2011 and, 2010, the Company had no indebtedness to Resource Real Estate for loan origination costs in connection with the Company’s commercial real estate loan portfolio.
On August 1, 2011, the Company, through its subsidiary, RCC Real Estate, entered into an agreement to purchase Whispertree Apartments, a multi-family apartment building, for $18.1 million. Resource Real Estate Management, LLC (“RREM”), an affiliate of the Company, was appointed as asset manager. RREM performs lease review and approval, debt service collection, loan workout, foreclosure, disposition and/or entitlements and permitting, as applicable. RREM is also responsible for engaging third parties to perform day-to-day property management, property leasing, rent collection, maintenance, and capital improvements. RREM is entitled to a monthly asset management fee equal to the greater of 4.0% of the gross receipts generated from the property or $12,600. As of December 31, 2011, the Company had paid RREM fees of $63,000.
On June 21, 2011, the Company entered into a joint venture with an unaffiliated third-party to form CR SLH Partners, L.P. (“SLH Partners”) to purchase a defaulted promissory note secured by a mortgage on a multi-family apartment building not further referenced. The Company purchased a 10% equity interest in the venture and also loaned SLH Partners $7.0 million to finance the project secured by the first mortgage lien on the property. The Company received a commitment fee equal to 1.0% of the loan amount at the commencement of the loan. The loan matures on September 21, 2012 and bears interest at a fixed rate of 10.0% per annum on the unpaid principal balance, payable monthly. In the event of default, interest will accrue and be payable at a rate of 5.0% in excess of the fixed rate. RREM was appointed as asset manager of the venture. RREM performs lease review and approval, debt service collection, loan workout, foreclosure, disposition and/or entitlements and permitting, as applicable. RREM is also be responsible for engaging third parties to perform day-to-day property management, property leasing, rent collection, maintenance, and capital improvements. RREM receives an annual asset management fee equal to 2.0% of the gross receipts generated from the property.
On January 15, 2010, the Company loaned $2.0 million to Resource Capital Partners, Inc. (“RCP”), a wholly-owned subsidiary of the Manager, so that it could acquire a 5.0% limited partnership interest in Resource Real Estate Opportunity Fund, L.P. (“RRE Opportunity Fund”). RCP is the general partner of the RRE Opportunity Fund. The loan is secured by RCP’s partnership interest in the RRE Opportunity Fund. The promissory note bears interest at a fixed rate of 8.0% per annum on the unpaid principal balance. In the event of default, interest will accrue and be payable at a rate of 5.0% in excess of the fixed rate. Interest is payable quarterly. Mandatory principal payments must also be made to the extent distributable cash or other proceeds from the partnership represent a return of RCP’s capital. The loan matures on January 14, 2015, and RCP has options to extend the loan for two additional 12-month periods. Principal payments of $262,000 and $70,000 were made during the years ended December 31, 2011 and 2010, respectively. The loan balance was $1.7 million and $1.9 million at December 31, 2011 and 2010, respectively.
RESOURCE CAPITAL CORP. AND SUBSIDIARIES
NOTES TO CONSOLIDATED FINANCIAL STATEMENTS – (Continued)
DECEMBER 31, 20102011
NOTE 1519 – RELATED-PARTY TRANSACTIONS – (Continued)
Relationship with Resource America and Certain of its Subsidiaries – (Continued)
TheOn December 1, 2009, the Company purchased a membership interest in RRE VIP Borrower, LLC (an unconsolidated VIE that holds the Company’s interests in a real estate joint venture) from Resource America at book value. This joint venture, which is structured as a credit facility with Värde Investment Partners, LP acting as lender, finances the acquisition of distressed properties and mortgage loans and has the objective of repositioning both the directly owneddirectly-owned properties and the properties underlying the mortgage loans to enhance their value. The Company acquired the membership interests for $2.1 million. The agreement requires the Company to contribute 3% to 5% (depending on the asset agreement) of the total funding required for each asset acquisition on a monthly basis. RREM acts as asset manager of the venture and receives a monthly asset management fee equal to 1% of the combined investment calculated as of the last calendar day of the month. For the years ended December 31, 2011 and 2010, the Company paid RREM management fees of $34,000 and $28,000, respectively. The investment balance of $5.2$3.6 million and $2.1$5.2 million at December 31, 20102011 and 2009,2010, respectively, is recorded as an investment in unconsolidated entities on the Company’s consolidated balance sheet.sheet using the equity method.
On August 9, 2006, the Company, through its subsidiary, RCC Real Estate, originated a loan to Lynnfield Place, a multi-family apartment property, in the amount of $22.4 million. The loan was then purchased by RREF CDO 2006-1. The loan, which matures on May 9, 2018, carries an interest rate of LIBOR plus a spread of 3.50% with a LIBOR floor of 2.50%. On June 14, 2011, RCC Real Estate converted the loan to equity. The loan was kept outstanding and continues to be used as collateral in RREF CDO 2006-1. RREM was appointed as asset manager as of August 1, 2011. RREM performs lease review and approval, debt service collection, loan workout, foreclosure, disposition and/or entitlements and permitting, as applicable. RREM is also responsible for engaging third parties to perform day-to-day property management, property leasing, rent collection, maintenance, and capital improvements. RREM is entitled to a monthly asset management fee equal to 4.0% of the gross receipts generated from the property. As of December 31, 2011, RREF CDO 2006-1 paid RREM management fees of $63,000.
Relationship with The Bancorp. On March 14, 2011, the Company paid Bancorp a loan commitment fee in the amount of $31,500 in connection with Bancorp’s commitment to establish a certain credit facility for the benefit of the Company. On July 7, 2011, the Company and RCC Real Estate entered into a $10.0 million revolving credit facility with Bancorp. The facility will provide bridge financing for up to five business days which will enable the Company and RCC Real Estate to fund real estate loans to third parties prior to their sale to the Company’s CRE CDOs. The facility is evidenced by a Revolving Judgment Note and Security Agreement by and among the borrowers and Bancorp entered into July 7, 2011. The facility is secured by a pledge of $32.9 million of the Class A-1 notes of RREF CDO 2006-1 which are owned by RCC Real Estate. The note becomes due and payable on September 30, 2012.
On January 15, 2010, the Company made a loan of $2.0 million to Resource Capital Partners, Inc. so that it could acquire a 5.0% limited partnership interest in Resource Real Estate Opportunity Fund, L.P. The loan is secured by Resource Capital Partner’s partnership interest in the Resource Real Estate Opportunity Fund, L.P. The promissory note bears interest at a fixed rate of 8.0% per annum on the unpaid principal balance. In the event of default, interest will accrue and be payable at a rate of 5.0% in excess of the fixed rate. Interest is payable quarterly. Mandatory principal payments must also be made to the extent distributable cash or other proceeds from the partnership represents a return of Resource Capital Partners, Inc.’s capital. The loan matures on January 14, 2015, with Resource Capital Partners, Inc. having options to extend the loan for two additional 12-month periods each.
On November 24, 2010, the Company entered into an Investment Management Agreement with Resource Capital Markets, Inc. (“RCM”), a wholly-owned subsidiary of Resource America, which provided that: (a) RCM may invest up to $5.0 million and the investable amount being adjusted by portfolio gains/(losses) and collections, and offset by expenses, taxes and realized management fees, and (b) RCM can earn a management fee in any year that the net profits earned exceed a preferred return, the fee basis is 20% of the amount by which the net profits exceed the preferred return. During the year ended December 31, 2010, RCM earned $1.0 million in management fees associated with realized profits and $1.9 million in management fees associated with unrealized profits. RCM commenced trading in June 2010 in these privately issued securities through Resource TRS upon the conceptual approval of the investment by the Company’s Board. The Company has since reinvested gains from this activity and holds $17.7 million of these trading securities, at fair market value as of December 31, 2010. In addition, the Company and RCM have established an escrow account that allocates the net profit or net losses of the portfolio on a yearly basis based on the net asset value of the account established by Resource TRS. This account provides an additional incentive to RCM to generate net profits during any year and provides the Company a return on any possible net losses, if any were to occur during any subsequent calendar year. During the year ended December 31, 2010, RCM earned $438,000 as their share of the net profits as defined in the agreement.
Relationship with LEAF
LEAF Financial Corp. (“LEAF”), a majority-owned subsidiary of Resource America, originates and manages lease receivables on the Company’s behalf. On May 27, 2010, the Company closed a $120.0 million securitization adding to the Company’s existing lease receivables. The securitization, LEAF Funding 3, issued equipment-backed securitized notes at a weighted average discounted price of 93.6%. At closing, $14.4 million of proceeds were placed into a restricted account. As of September 30, 2010, all proceeds related to the commitment have been funded. The Company had $21.0 million of equity invested in LEAF Funding 3 as of December 31, 2010.
The Company purchases lease receivables from LEAF at a price equal to their book value plus a reimbursable origination cost not to exceed 1% to compensate LEAF for its origination costs. During the year ended December 31, 2010, the Company acquired $131.7 million of notes from LEAF, including $102,000 of origination cost reimbursements. These acquisitions are directly related to the LEAF Funding 3 securitization discussed above. During the year ended December 31, 2009, the Company did not acquire any lease receivables from LEAF. In addition, the Company pays LEAF an annual servicing fee, equal to 1% of the book value of managed assets, for servicing the Company’s lease receivables. At December 31, 2010 and 2009, the Company was indebted to LEAF for servicing fees in connection with the Company’s equipment finance portfolio of $6,000 and $8,000, respectively. LEAF servicing fees for the years ended December 31, 2010, 2009 and 2008 were $87,000, $505,000 and $953,000, respectively.
RESOURCE CAPITAL CORP. AND SUBSIDIARIES
NOTES TO CONSOLIDATED FINANCIAL STATEMENTS – (Continued)
DECEMBER 31, 2010
NOTE 15 – RELATED-PARTY TRANSACTIONS – (Continued)
Relationship with LEAF – (Continued)
The Company has the right to require LEAF Funding to repurchase credit impaired contracts or replace such contracts with performing contracts. LEAF Funding would have to repurchase or provide substitute contracts for each credit impaired contract at an amount equal to the discounted contract balance plus any overdue payments. LEAF Fundings’ repurchase obligation is limited to 5% of the aggregate discounted contract balance of all of the contracts sold by LEAF Funding to the Company.
On March 5, 2010, the Company entered into agreements with Lease Equity Appreciation Fund II, L.P. (“LEAF II”), that provide an $8.0 million credit facility to LEAF II, of which all $8.0 million was funded by March 31, 2010, for a one year term at 12% payable quarterly, with a 1% loan origination fee which is secured by all assets of LEAF II, including its entire ownership interest in LEAF II Receivables Funding, LLC. The note originally matured on March 3, 2011 but has been extended until June 3, 2011 with a 1% extension fee on the current outstanding loan balance. The loan amount outstanding at December 31, 2010 was $7.9 million.
During the year ended December 31, 2010, the Company sold two lease receivables back to LEAF at a price equal to their book value. The total sale proceeds received were $139,000. During the year ended December 31, 2009, the Company did not sell any lease receivables back to LEAF.
Relationship with Resource Real Estate
Resource Real Estate, a subsidiary of Resource America, originates, finances and manages the Company’s commercial real estate loan portfolio, including whole loans, A notes, B notes and mezzanine loans. The Company reimburses Resource Real Estate for loan origination costs associated with all loans originated. At December 31, 2010 and 2009, the Company had no indebtedness to Resource Real Estate for loan origination costs in connection with the Company’s commercial real estate loan portfolio.
Relationship with Law Firm
. Until 1996, director Edward E. Cohen, a director who was the Company’s Chairman from its inception until November 2009, was of counsel to Ledgewood, P.C., a law firm. In addition, one of the Company’s executive officers, Jeffrey F. Brotman, was employed by Ledgewood until 2007. Mr. E. Cohen receives certain debt service payments from Ledgewood related to the termination of his affiliation with Ledgewood and its redemption of his interest in the firm. Mr. Brotman also receives certain debt service payments from Ledgewood related to the termination of his affiliation with the firm. For the years ended December 31, 2011, 2010 2009 and 2008,2009, the Company paid Ledgewood $238,000, $311,000 $660,000 and $164,000,$660,000, respectively, in connection with legal services rendered to the Company.
NOTE 1620 – DISTRIBUTIONS
In order to qualify as a REIT, the Company must currently distribute at least 90% of its taxable income. In addition, the Company must distribute 100% of its taxable income in order not to be subject to corporate federal income taxes on retained income. The Company anticipates it will distribute substantially all of its taxable income to its stockholders. Because taxable income differs from cash flow from operations due to non-cash revenues or expenses (such as provisions for loan and lease losses and depreciation), in certain circumstances, the Company may generate operating cash flow in excess of its distributions or, alternatively, may be required to borrow to make sufficient distribution payments.
RESOURCE CAPITAL CORP. AND SUBSIDIARIES
NOTES TO CONSOLIDATED FINANCIAL STATEMENTS – (Continued)
DECEMBER 31, 20102011
NOTE 1620 – DISTRIBUTIONS – (Continued)
The Company’s 20112012 dividends will be determined by the Company’s board of directors which will also consider the composition of any dividends declared, including the option of paying a portion in cash and the balance in additional common shares. Generally, dividends payable in stock are not treated as dividends for purposes of the deduction for dividends, or as taxable dividends to the recipient. However, the Internal Revenue Service, in Revenue Procedures 2009-15 and 2010-12, has givengave guidance with respect to certain stock distributions by publicly traded REITs. These Revenue Procedures applyapplied to distributions made on or after January 1, 2008 and declared with respect to a taxable year ending on or before December 31, 2011. They provideprovided that publicly-traded REITs cancould distribute stock to satisfy their REIT distribution requirements if stated conditions arewere met. These conditions include that at least 10% of the aggregate declared distributions be paid in cash and the shareholders be permitted to elect whether to receive cash or stock, subject to the limit set by the REIT on the cash to be distributed in the aggregate to all shareholders. The Company did not use these Revenue Procedures with respect to any distributions for its 20092010 and 20102011 taxable years, but may do so for distributions with respect to 2011.years.
During the year ended December 31, 2011, the Company declared and paid distributions totaling $75.3 million, or $1.00 per share. This includes $20.0 million, in the aggregate, declared on December 12, 2011 and paid on January 27, 2012 to stockholders of record as of December 31, 2011. During the year ended December 31, 2010, the Company declared and paid distributions totaling $51.1 million, or $1.00 per share. This includes $14.6 million, in the aggregate, declared on December 16, 2010 and paid on January 26, 2011 to stockholders of record as of December 31, 2010. During the year ended December 31, 2009, the Company declared and paid distributions totaling $31.8 million, or $1.15 per share. This includes $9.2 million, in the aggregate, declared on December 14, 2009 and paid on January 26, 2010 to stockholders of record as of December 31, 2009. During the year ended December 31, 2008, the Company declared and paid distributions totaling $40.7 million, or $1.60 per share. For tax purposes, 93%25% of the distributions declared in 2010 has2011 have been classified as ordinary income and 7% has75% have been classified as a non-dividend distribution. For 2009 and 2008, 100%In 2010, 93% of the distributions declared were classified as ordinary income.income and 7% were classified as a non-dividend distribution.
NOTE 1721 – FAIR VALUE OF FINANCIAL INSTRUMENTS
In analyzing the fair value of its investments accounted for on a fair value basis, the Company follows the fair value hierarchy which requires an entity to maximize the use of observable inputs and minimize the use of unobservable inputs when measuring fair value. The Company determines fair value based on quoted prices when available or, if quoted prices are not available, through the use of alternative approaches, such as discounting the expected cash flows using market interest rates commensurate with the credit quality and duration of the investment. The hierarchy followed defines three levels of inputs that may be used to measure fair value:
Level 1 - Quoted prices in active markets for identical assets and liabilities that the reporting entity has the ability to access at the measurement date.
Level 2 - Inputs other than quoted prices included within Level 1 that are observable for the asset and liability or can be corroborated with observable market data for substantially the entire contractual term of the asset or liability.
Level 3 - Unobservable inputs that reflect the entity’s own assumptions about the assumptions that market participants would use in the pricing of the asset or liability and are consequently not based on market activity, but rather through particular valuation techniques.
The determination of where an asset or liability falls in the hierarchy requires significant judgment. The Company evaluates its hierarchy disclosures each quarter; depending on various factors, it is possible that an asset or liability may be classified differently from quarter to quarter. However, the Company expects that changes in classifications between levels will be rare.
Certain assets and liabilities are measured at fair value on a recurring basis. The following is a discussion of these assets and liabilities as well as the valuation techniques applied to each for fair value measurement.
The Company reports its investment securities available-for-sale at fair value. To determine fair value, the Company uses two methods, either a dealer quote or an internal valuation model, depending upon when the position was purchased and the current level of market activity.
RESOURCE CAPITAL CORP. AND SUBSIDIARIES
NOTES TO CONSOLIDATED FINANCIAL STATEMENTS – (Continued)
DECEMBER 31, 20102011
NOTE 1721 – FAIR VALUE OF FINANCIAL INSTRUMENTS – (Continued)
For securities purchased in 2009 and thereafter,with higher levels of market activity, the Company obtains a quote from a dealer, which typically will be the dealer who sold the Company the security. The Company has been advised that, in formulating their quotes, dealers may use recent trades in the particular security, if any, market activity in similar securities, if any, or internal valuation models. These quotes are non-binding. As a result ofBased on how the dealers develop their quotes, the market illiquidityliquidity and low levels of trading, activity as of December 31, 2009, the Company categorized all ofcategorizes these investment securities available-for-sale ininvestments as either Level 3 in the fair value hierarchy. Due to the increased level of trading activity in 2010, the Company moved some of these securities into2 or Level 23 in the fair value hierarchy. The Company evaluates the reasonableness of the quotes it receives by applying its own valuation models. If there is a material difference between a quote the Company receives and the value indicated by its valuation models, the Company will evaluate the difference. As part of that evaluation, the Company will discuss the difference with the dealer, who may revise theirits quote based upon these discussions. Alternatively, the Company may revise its valuation models.
For investment securities available-for-sale purchased prior to 2009,with lower levels of market activity, the Company determines fair value based on taking a weighted average of the following three measures:
| | ● | dealer quotes, as described above; |
| | ● | quotes on more actively-traded, higher-rated securities issued in a similar time period, adjusted for differences in rating and seniority; and |
| | ● | the value resulting from an internal valuation model using an income approach based upon an appropriate risk-adjusted yield, time value and projected losses using default assumptions based upon an historical analysis of underlying loan performance. |
The Company reports its investment securities-tradingsecurities, trading at fair value, which is based on a dealer quotes or bids which are validated using an income approach utilizing appropriate prepayment, default and recovery rates. Any changes in fair value are recorded on the Company’s results of operations as net unrealized gain on investment securities-trading.securities, trading.
Derivatives (interest rate swaps and interest rate caps), both assets and liabilities, are reported at fair value, and are valued by a third-party pricing agent using an income approach with models that use, as their primary inputs, readily observable market parameters. This valuation process considers factors including interest rate yield curves, time value, credit factors and volatility factors. Although the Company has determined that the majority of the inputs used to value its derivatives fall within Level 2 of the fair value hierarchy, the credit valuation adjustments associated with its derivatives utilize Level 3 inputs, such as estimates of current credit spreads, to evaluate the likelihood of default by the Company and its counterparties. The Company has assessed the significance of the impact of the credit valuation adjustments on the overall valuation of its derivative positions and has determined that the credit valuation adjustments have become significant to the overall valuation of some of its derivatives. As a result, the Company has transferred derivatives with credit valuation adjustments to Level 3 in the fair value hierarchy as of December 31, 2010 from Level 2 ofin the fair value hierarchy as of September 30,December 31, 2010.
RESOURCE CAPITAL CORP. AND SUBSIDIARIES
NOTES TO CONSOLIDATED FINANCIAL STATEMENTS – (Continued)
DECEMBER 31, 2011
NOTE 21 – FAIR VALUE OF FINANCIAL INSTRUMENTS – (Continued)
The following table presents information about the Company’s assets (including derivatives that are presented net) measured at fair value on a recurring basis as of December 31, 2010 and indicates the fair value hierarchy of the valuation techniques utilized by the Company to determine such fair value.value as follows (in thousands):
| | | | | | | | | | | | | | | | | | | | | | | | | |
December 31, 2011: | | | | | | | | | | | | | |
| Assets: | | | | | | | | | | | | | | | | | | | | | | | | |
Investment securities-trading | | $ | − | | | $ | − | | | $ | 17,723 | | | $ | 17,723 | | |
Investment securities, trading | | | $ | − | | | $ | − | | | $ | 38,673 | | | $ | 38,673 | |
Investment securities available-for-sale | | | − | | | | 38,303 | | | | 25,657 | | | | 63,960 | | | $ | − | | | $ | 138,209 | | | $ | 19,835 | | | $ | 158,044 | |
Total assets at fair value | | $ | − | | | $ | 38,303 | | | $ | 43,380 | | | $ | 81,683 | | | $ | − | | | $ | 138,209 | | | $ | 58,508 | | | $ | 196,717 | |
| | | | | | | | | | | | | | | | | | | | | | | | | | | | | | | | | |
| Liabilities: | | | | | | | | | | | | | | | | | | | | | | | | | | | | | | | | |
Derivatives (net) | | $ | − | | | $ | 2,363 | | | $ | 10,929 | | | $ | 13,292 | | | $ | − | | | $ | 1,210 | | | $ | 12,000 | | | $ | 13,210 | |
Total liabilities at fair value | | $ | − | | | $ | 2,363 | | | $ | 10,929 | | | $ | 13,292 | | | $ | − | | | $ | 1,210 | | | $ | 12,000 | | | $ | 13,210 | |
| | | | | | | | | | | | | | | | | | |
December 31, 2010: | | | | | | | | | | | | | | | | | |
| Assets: | | | | | | | | | | | | | | | | | |
Investment securities, trading | | | $ | − | | | $ | − | | | $ | 17,723 | | | $ | 17,723 | |
Investment securities available-for-sale | | | | − | | | | 38,303 | | | | 25,657 | | | | 63,960 | |
Total assets at fair value | | | $ | − | | | $ | 38,303 | | | $ | 43,380 | | | $ | 81,683 | |
| | | | | | | | | | | | | | | | | | |
| Liabilities: | | | | | | | | | | | | | | | | | |
Derivatives (net) | | | $ | − | | | $ | 2,363 | | | $ | 10,929 | | | $ | 13,292 | |
Total liabilities at fair value | | | $ | − | | | $ | 2,363 | | | $ | 10,929 | | | $ | 13,292 | |
RESOURCE CAPITAL CORP. AND SUBSIDIARIES
NOTES TO CONSOLIDATED FINANCIAL STATEMENTS – (Continued)
DECEMBER 31, 2010
NOTE 17 – FAIR VALUE OF FINANCIAL INSTRUMENTS – (Continued)
The following table presents additional information about assets which are measured at fair value on a recurring basis for which the Company has utilized Level 3 inputs (in thousands).:
| | | | | | | |
Beginning balance, January 1, 2010 | | $ | 44,542 | | | $ | 44,542 | |
| Total gains or losses (realized/unrealized): | | | | | | | | |
Included in earnings | | | (6,936 | ) | | | (6,936 | ) |
Purchases | | | 19,671 | | | | 40,415 | |
Sales | | | | (19,468 | ) |
Paydowns | | | | (1,276 | ) |
Transfers out of Level 3 | | | (43,090 | ) | | | (43,090 | ) |
Unrealized losses – included in accumulated other comprehensive income | | | 29,193 | | | | 29,193 | |
Ending balance, December 31, 2010 | | $ | 43,380 | | |
Beginning balance, January 1, 2011 | | | | 43,380 | |
| Total gains or losses (realized/unrealized): | | | | | |
Included in earnings | | | | 2,948 | |
Purchases | | | | 38,887 | |
Sales | | | | (18,181 | ) |
Paydowns | | | | (3,212 | ) |
Transfers out of Level 3 | | | | (4,437 | ) |
Unrealized losses – included in accumulated other comprehensive income | | | | (877 | ) |
Ending balance, December 31, 2011 | | | $ | 58,508 | |
RESOURCE CAPITAL CORP. AND SUBSIDIARIES
NOTES TO CONSOLIDATED FINANCIAL STATEMENTS – (Continued)
DECEMBER 31, 2011
NOTE 21 – FAIR VALUE OF FINANCIAL INSTRUMENTS – (Continued)
The following table presents additional information about liabilities which are measured at fair value on a recurring basis for which the Company has utilized Level 3 inputs (in thousands).:
| | | | | | | |
Beginning balance, January 1, 2010 | | $ | − | | | $ | − | |
Transfers into Level 3 | | | 10,929 | | | | 10,929 | |
Ending balance, December 31, 2010 | | $ | 10,929 | | |
Beginning balance, January 1, 2011 | | | | 10,929 | |
Unrealized losses – included in accumulated other comprehensive income | | | | 1,071 | |
Ending balance, December 31, 2011 | | | $ | 12,000 | |
The Company had $8.4 million $26.8 million and $13.5 million of losses included in earnings due to the other-than-temporary impairment charges of six, six and four assets during the years ended December 31, 2011, 2010, and 2009 respectively. These losses are included in the consolidated statements of operations as net impairment losses recognized in earnings. There were no such losses during the year ended December 31, 2008.
Loans held for sale consist of bank loans and commercial real estate loans (“CRE loans”) identified for sale due to credit issues.concerns. Interest on loans held for sale is recognized according to the contractual terms of the loan and included in interest income on loans. The fair value of bank loans held for sale and impaired bank loans is based on what secondary markets are currently offering for these loans. As such, the Company classifies these loans as recurringnonrecurring Level 2. The amount of the adjustment for fair value for bank loans held for sale for the years ended December 31, 2011, 2010 and 2009 was $2.3 million $114,000, and $375,000, respectively. For the Company’s CRE loans where there is no market, fair value is measured using discounted cash flow analysis and other valuation techniques and these loans are classified as nonrecurring Level 3. The amount of nonrecurring fair value losses for impaired loans for the years ended December 31, 2011, 2010 and 2009 was $11.4 million, $31.6 million and $45.7 million, respectively, and is included in the consolidated statements of operations as provision for loan and lease losses.
Property available-for-sale is estimated based on recent sales prices of prior similar condominium units in the property and the appraised value of a similar condominium unit in the property less costs to sell
The following table summarizes the Company’s financial assets and liabilities measured at fair value on a nonrecurring basis as of December 31, 2010 and indicates the fair value hierarchy of the valuation techniques utilized by the Company to determine such fair value.value, as follows (in thousands):
| | | | | | | | | | | | | | | | | | | | | | | | | |
December 31, 2011: | | | | | | | | | | | | | |
Assets: | | | | | | | | | | | | | | | | | | | | | | | | |
Loans held for sale | | $ | − | | | $ | 4,027 | | | $ | 24,566 | | | $ | 28,593 | | | $ | − | | | $ | 3,154 | | | $ | − | | | $ | 3,154 | |
Impaired loans | | | − | | | | 250 | | | | 132,777 | | | | 133,027 | | | | − | | | | 1,099 | | | | − | | | | 1,099 | |
Property available-for-sale | | | − | | | | − | | | | 4,444 | | | | 4,444 | | |
Total assets at fair value | | | $ | − | | | $ | 4,253 | | | $ | − | | | $ | 4,253 | |
| | | | | | | | | | | | | | | | | | |
December 31, 2010: | | | | | | | | | | | | | | | | | |
Assets: | | | | | | | | | | | | | | | | | |
Loans held for sale | | | $ | − | | | $ | 4,027 | | | $ | 24,566 | | | $ | 28,593 | |
Impaired loans | | | | − | | | | 250 | | | | 132,777 | | | | 133,027 | |
Equity | | | − | | | | − | | | | 147 | | | | 147 | | | | − | | | | − | | | | 147 | | | | 147 | |
Total assets at fair value | | $ | − | | | $ | 4,277 | | | $ | 161,934 | | | $ | 166,211 | | | $ | − | | | $ | 4,277 | | | $ | 157,490 | | | $ | 161,767 | |
RESOURCE CAPITAL CORP. AND SUBSIDIARIES
NOTES TO CONSOLIDATED FINANCIAL STATEMENTS – (Continued)
DECEMBER 31, 2010
NOTE 17 – FAIR VALUE OF FINANCIAL INSTRUMENTS – (Continued)
The Company is required to disclose the fair value of financial instruments for which it is practicable to estimate that value. The fair value of short-term financial instruments such as cash and cash equivalents, restricted cash, dividend reinvestment plan proceeds receivable, interest receivable, distribution payable and accrued interest expense approximates their carrying value on the consolidated balance sheet. The fair value of the Company’s investment securities-trading is reported in Note 4.5. The fair value of the Company’s investment securities available-for-sale is reported in Note 5.6. The fair value of the Company’s investment securities held-to-maturity is reported in Note 6.7. The fair value of the Company’s derivative instruments is reported in Note 18.22.
RESOURCE CAPITAL CORP. AND SUBSIDIARIES
NOTES TO CONSOLIDATED FINANCIAL STATEMENTS – (Continued)
DECEMBER 31, 2011
NOTE 21 – FAIR VALUE OF FINANCIAL INSTRUMENTS – (Continued)
The fair values of the Company’s remaining financial instruments that are not reported at fair value on the consolidated balance sheet are reported below.
| | | Fair Value of Financial Instruments | | | Fair Value of Financial Instruments | |
| | | (in thousands) | | | (in thousands) | |
| | | | | | | | | | | | | |
| | | | | | | | | | | | | | | | | | | | | | | | | |
Loans held-for-investment | | $ | 1,443,271 | | | $ | 1,439,376 | | | $ | 1,557,757 | | | $ | 1,514,696 | | | $ | 1,778,624 | | | $ | 1,755,541 | | | $ | 1,443,271 | | | $ | 1,439,376 | |
Loans receivable–related party | | $ | 9,927 | | | $ | 9,927 | | | $ | − | | | $ | − | | | $ | 9,497 | | | $ | 9,497 | | | $ | 9,927 | | | $ | 9,927 | |
CDOs | | $ | 1,397,880 | | | $ | 905,790 | | | $ | 1,484,952 | | | $ | 857,262 | | |
CDO notes payable | | | $ | 1,668,049 | | | $ | 1,012,696 | | | $ | 1,397,880 | | | $ | 905,790 | |
Junior subordinated notes | | $ | 50,354 | | | $ | 16,848 | | | $ | 50,052 | | | $ | 16,546 | | | $ | 50,631 | | | $ | 17,125 | | | $ | 50,354 | | | $ | 16,848 | |
NOTE 18–22– INTEREST RATE RISK AND DERIVATIVE INSTRUMENTS
A significant market risk to the Company is interest rate risk. Interest rates are highly sensitive to many factors, including governmental monetary and tax policies, domestic and international economic and political considerations and other factors beyond the Company’s control. Changes in the general level of interest rates can affect net interest income, which is the difference between the interest income earned on interest-earning assets and the interest expense incurred in connection with the interest-bearing liabilities, by affecting the spread between the interest-earning assets and interest-bearing liabilities. Changes in the level of interest rates also can affect the value of the Company’s interest-earning assets and the Company’s ability to realize gains from the sale of these assets. A decline in the value of the Company’s interest-earning assets pledged as collateral for borrowings could result in the counterparties demanding additional collateral pledges or liquidation of some of the existing collateral to reduce borrowing levels.
The Company seeks to manage the extent to which net income changes as a function of changes in interest rates by matching adjustable-rate assets with variable-rate borrowings. During periods of changing interest rates, interest rate mismatches could negatively impact the Company’s consolidated financial condition, consolidated results of operations and consolidated cash flows. In addition, the Company mitigates the potential impact on net income of periodic and lifetime coupon adjustment restrictions in its investment portfolio by entering into interest rate hedging agreements such as interest rate caps and interest rate swaps.
In the next twelve months, the Company expects to reclassify $227,000$279,000 from accumulated other comprehensive loss to earnings. The amount relates to the termination of 18 hedges during the years ended December 31, 2006, 2007 and 2008 and the requirement for the remaining gains and losses to be amortized over the life of the remaining debt. In addition, in the next twelve months, the Company expects to pay $7.4$7.2 million in net interest expense for its hedges.
During the years ended December 31, 2011, 2010 2009 and 2008,2009, the Company recognized expense of $227,000, $224,000 $499,000 and $211,000,$499,000, respectively, into earnings related to the amortization of gains and losses on 18 terminated hedges.
At December 31, 2011, the Company had 18 interest rate swap contracts outstanding whereby the Company paid an average fixed rate of 4.87% and received a variable rate equal to one-month LIBOR. The aggregate notional amount of these contracts was $167.9 million at December 31, 2011. The counterparties for the Company’s designated interest rate hedge contracts are Credit Suisse International and Wells Fargo Bank, National Association, with which the Company has master netting agreements.
At December 31, 2010, the Company had 10 interest rate swap contracts outstanding whereby the Company paid an average fixed rate of 5.17% and received a variable rate equal to one-month LIBOR. The aggregate notional amount of these contracts was $166.8 million at December 31, 2010. In addition, the Company also hashad one interest rate cap agreement with an aggregate notional amount of $14.8 million outstanding whereby it reduced its exposure to variability in future cash flows attributable to LIBOR.LIBOR which matured in 2011. The interest rate cap is a non-designated cash flow hedge and, as a result, the change in fair value is recorded through the consolidated statements of operations. The counterparty for all the Company’s designated interest rate hedge contracts is Credit Suisse International with which the Company has a master netting agreement.
RESOURCE CAPITAL CORP. AND SUBSIDIARIES
NOTES TO CONSOLIDATED FINANCIAL STATEMENTS – (Continued)
DECEMBER 31, 20102011
NOTE 18–22 – INTEREST RATE RISK AND DERIVATIVE INSTRUMENTS – (Continued)
At December 31, 2009, the Company had 13 interest rate swap contracts outstanding whereby the Company paid an average fixed rate of 5.18% and received a variable rate equal to one-month LIBOR. The aggregate notional amount of these contracts was $217.9 million at December 31, 2009. In addition, as described in the prior paragraph, the Company also had one interest rate cap agreement with an aggregate notional amount of $14.8 million outstanding. The counterparty for all the Company’s designated interest rate hedge contracts as of December 31, 2009 was Credit Suisse International.
The estimated fair value of the Company’s interest rate swaps was ($13.3)13.2) million and ($12.8)13.3) million as of December 31, 20102011 and 2009,2010, respectively. The Company had aggregate unrealized losses of $14.7$14.3 million and $14.6$14.7 million on the interest rate swap agreements, as of December 31, 20102011 and 2009,2010, respectively, which is recorded in accumulated other comprehensive loss. In connection with the August 2006 close of RREF CDO 2006-1, the Company realized a swap termination loss of $119,000, which is being amortized over the term of RREF CDO 2006-1. The amortization is reflected in interest expense in the Company’s consolidated statements of operations.income. In connection with the JuneSeptember 2007 close of RREF CDO 2007-1, the Company realized a swap termination gain of $2.6 million, which is being amortized over the term of RREF CDO 2007-1. The accretion is reflected in interest expense in the Company’s consolidated statements of operations.income. In connection with the termination of a $53.6 million swap related to RREF CDO 2006-1 during the nine months ended September 30, 2008, the Company realized a swap termination loss of $4.2 million, which is being amortized over the term of a new $45.0 million swap. The amortization is reflected in interest expense in the Company’s consolidated statements of operations.income. In connection with the payoff of a fixed-rate commercial real estate loan during the three months ended September 30, 2008, the Company terminated a $12.7 million swap and realized a $574,000 swap termination loss, which is being amortized over the term of the terminated swap. The amortization is reflected in interest expense in the Company’s consolidated statements of operations.income.
The following tables present the fair value of the Company’s derivative financial instruments as well as their classification on the balance sheet as of December 31, 2010 and on the consolidated statement of operations for the year ended December 31, 2010:years presented:
| Fair Value of Derivative Instruments as of December 31, 2010 | |
| (in thousands) | |
| | | | | | | | |
| | | | |
| | | | | | | | |
Interest rate cap agreement | | $ | 14,841 | | Derivatives, at fair value | | $ | − | |
| | | | | | | | | | |
Interest rate swap contracts | | $ | 166,836 | | Derivatives, at fair value | | $ | (13,292 | ) |
| | | | | | | | | | |
| | | | | | Accumulated other comprehensive loss | | $ | 13,292 | |
| Fair Value of Derivative Instruments as of December 31, | |
| (in thousands) | |
| | |
| | | | |
| | | | | | | | |
Interest rate swap contracts 2011 | | $ | 167,905 | | Derivatives, at fair value | | $ | (13,210 | ) |
Interest rate swap contracts 2010 | | $ | 166,836 | | Derivatives, at fair value | | $ | (13,292 | ) |
Interest rate cap 2010 | | $ | 14,841 | | Derivatives, at fair value | | $ | − | |
| | | | | | | | | | |
Interest rate swap contracts 2011 | | $ | 167,905 | | Accumulated other comprehensive loss | | $ | 13,210 | |
Interest rate swap contracts 2010 | | $ | 166,836 | | Accumulated other comprehensive loss | | $ | 13,292 | |
Interest rate cap 2010 | | $ | 14,841 | | Accumulated other comprehensive loss | | $ | − | |
| The Effect of Derivative Instruments on the Statement of Operations for the | |
| Year Ended December 31, 2010 | |
| (in thousands) | |
| | | | | | | | |
| | | | |
| | | | | Statement of Operations Location | | | |
Interest rate cap agreement | | $ | 14,841 | | Interest expense | | $ | 46 | |
| | | | | | | | | | |
Interest rate swap contracts | | $ | 166,836 | | Interest expense | | $ | 9,438 | |
(1) Negative values indicate a decrease to the associated balance sheet or consolidated statement of operations line items.| (1) | Negative values indicate a decrease to the associated balance sheet. |
(Back to Index)| The Effect of Derivative Instruments on the Statement of Income for the | |
| Years Ended December 31, | |
| (in thousands) | |
| | |
| | | | |
| | | | | Statement of Income Location | | Amount of Loss Reclassified from Accumulated Other Comprehensive Income into Income (Effective Portion) | |
Interest rate swap contracts 2011 | | $ | 167,905 | | Interest expense | | $ | 8,415 | |
Interest rate swap contracts 2010 | | $ | 166,836 | | Interest expense | | $ | 8,438 | |
Interest rate swap contracts 2009 | | $ | 217,907 | | Interest expense | | $ | 13,516 | |
RESOURCE CAPITAL CORP. AND SUBSIDIARIES
NOTES TO CONSOLIDATED FINANCIAL STATEMENTS – (Continued)
DECEMBER 31, 2010
NOTE 19 – STOCK INCENTIVE PLANS
Upon formation of the Company, the 2005 Stock Incentive Plan (the “2005 Plan”) was adopted for the purpose of attracting and retaining executive officers, employees, directors and other persons and entities that provide services to the Company. The 2005 Plan authorizes the issuance of up to 1,533,333 shares of common stock in the form of options to purchase common stock, stock awards, performance shares and stock appreciation rights.
In July 2007, the Company’s shareholders approved the 2007 Omnibus Equity Compensation Plan (the “2007 Plan”). The 2007 Plan authorizes the issuance of up to 2,000,000 shares of common stock in the form of options to purchase common stock, stock awards, performance shares and stock appreciation rights.
NOTE 2023 – INCOME TAXES
The Company has made an election to be taxed, and believes it qualifies, as a REIT under Sections 856 through 860 of the Internal Revenue Code. To maintain REIT status for federal income tax purposes, the Company is generally required to distribute at least 90% of its REIT taxable income to its shareholders as well as comply with certain other qualification requirements as defined under the Internal Revenue Code. Accordingly, theThe Company is not subject to federal corporate income tax to extent that it distributes 100% of its REIT taxable income each year. Taxable income from non-REIT activities managed through Resource TRS, the Company's taxable REIT subsidiary,subsidiaries is subject to federal, state and local income taxes.
RESOURCE CAPITAL CORP. AND SUBSIDIARIES
NOTES TO CONSOLIDATED FINANCIAL STATEMENTS – (Continued)
DECEMBER 31, 2011
NOTE 23 – INCOME TAXES – (Continued)
The Company’s taxable REIT subsidiaries’ income taxes are accounted for under the asset and liability method. Under this method, deferred income taxes are recognized for the temporary differences between the financial reporting basis and tax basis of Resource TRS' assets and liabilities.
The following table details the components of Resource TRS’ income taxes (in thousands):
| | | | | | | |
| | | | | | | | | | | | | | | | | | | |
| Provision (benefit) for income taxes: | | | | | | | | | | | | | | | | | | |
Current: | | | | | | | | | | | | | | | | | | |
Federal | | $ | 324 | | | $ | (325 | ) | | $ | (331 | ) | | $ | 7,839 | | | $ | 324 | | | $ | (325 | ) |
State | | | − | | | | − | | | | (25 | ) | | | 4,596 | | | | − | | | | − | |
| Total current | | | 324 | | | | (325 | ) | | | (356 | ) | | | 12,435 | | | | 324 | | | | (325 | ) |
| | | | | | | | | | | | | | | | | | | | | | | | | |
Deferred: | | | | | | | | | | | | | | | | | | | | | | | | |
Federal | | | 4,134 | | | | 248 | | | | 88 | | | | (305 | ) | | | 4,134 | | | | 248 | |
State | | | 1,263 | | | | 75 | | | | 27 | | | | (94 | ) | | | 1,263 | | | | 75 | |
Total deferred | | | 5,397 | | | | 323 | | | | 115 | | | | (399 | ) | | | 5,397 | | | | 323 | |
Income tax provision (benefit) | | $ | 5,721 | | | $ | (2 | ) | | $ | (241 | ) | | $ | 12,036 | | | $ | 5,721 | | | $ | (2 | ) |
A reconciliation between the federal statutory income tax rate and Resource TRS’ effective income tax rate is as follows:
| | | | | | | |
| | | | | | | | | | | | | | | | | | | |
Statutory tax rate | | | 35% | | | | 35% | | | | 35% | % | | | 35% | | | | 35% | | | | 35% | |
State and local taxes, net of federal benefit | | | 10% | | | | 8% | | | | 9% | % | | | 15% | | | | 10% | | | | 8% | |
Valuation allowance for deferred tax assets | | | (8)% | | | | (39)% | | | | −% | % | | | - % | | | | (8)% | | | | (39)% | |
Subpart F income | | | | 11% | | | | − % | | | | − % | |
Basis difference in LEAF Commercial Capital investment | | | | 6% | | | | − % | | | | − % | |
Other items | | | −% | | | | (4)% | | | | 2% | % | | | - % | | | | − % | | | | (4)% | |
| | | | 37% | | | | −% | | | | 46% | % | | | 67% | | | | 37% | | | | − % | |
The components of deferred tax assets and liabilities are as follows (in thousands):
| | | | |
| | | | | | | |
| Deferred tax assets related to: | | | | | | |
Lease accounting | | $ | − | | | $ | 3,283 | |
Investment in securities | | | 119 | | | | − | |
Intangible assets basis difference | | | 490 | | | | − | |
Federal, state and local loss carryforwards | | | 17 | | | | 855 | |
Provision for loan and lease losses | | | − | | | | 32 | |
Accrued expenses | | | − | | | | 231 | |
Total deferred tax assets | | | 626 | | | | 4,401 | |
Valuation allowance | | | − | | | | − | |
Total deferred tax assets | | $ | 626 | | | $ | 4,401 | |
| | | | | | | | | |
| Deferred tax liabilities related to: | | | | | | | | |
Unrealized income/loss on investments | | $ | (1,188 | ) | | $ | (4,450 | ) |
Equity investments | | | (394 | ) | | | − | |
Basis difference in LEAF Commercial Capital investment | | | (3,390 | ) | | | − | |
Subpart F income | | | (652 | ) | | | − | |
Property and equipment basis differences | | | − | | | | (5,348 | ) |
Total deferred tax liabilities | | $ | (5,624 | ) | | $ | (9,798 | ) |
RESOURCE CAPITAL CORP. AND SUBSIDIARIES
NOTES TO CONSOLIDATED FINANCIAL STATEMENTS – (Continued)
DECEMBER 31, 20102011
NOTE 2023 – INCOME TAXES – (Continued)
The components of Resource TRS’ deferred tax assets and liabilities are as follows (in thousands):
| | | | |
| | | | | | | |
| Deferred tax assets related to: | | | | | | |
Lease accounting | | $ | 3,283 | | | $ | − | |
Foreign, state and local loss carryforwards | | | 855 | | | | 703 | |
Provision for loan and lease losses | | | 32 | | | | 521 | |
Accrued expenses | | | 231 | | | | − | |
Total deferred tax assets | | | 4,401 | | | | 1,224 | |
Valuation allowance | | | − | | | | (1,224 | ) |
Total deferred tax assets | | $ | 4,401 | | | $ | − | |
| | | | | | | | | |
| Deferred tax liabilities related to: | | | | | | | | |
Unrealized income/loss on investments | | $ | (4,450 | ) | | $ | − | |
Property and equipment basis differences | | | (5,348 | ) | | | − | |
Total deferred tax liabilities | | $ | (9,798 | ) | | $ | − | |
As of December 31, 2010, Resource TRS had federal, state and local net operating tax loss carryforwards (“NOLs”) of $5.6 million that will expire between 2011 and 2031, which resulted in a deferred tax asset of $855,000. Based on changes in estimates of taxable income projections, Resource TRS has decreased its gross valuation allowance from $2.9 million to $0 (tax effected benefit of $1.2 million).
Apidos CDO I, Apidos CDO III and Apidos Cinco CDO, the Company’s foreign TRSs, are organized as exempted companies incorporated with limited liability under the laws of the Cayman Islands, and are generally exempt from federal and state income tax at the corporate level because their activities in the United States are limited to trading in stock and securities for their own account. Therefore, despite their status as taxable REIT subsidiaries,TRSs, they generally will not be subject to corporate tax on their earnings and no provision for income taxes is required; however, because they are “controlled foreign corporations,” the Company will generally be required to include Apidos CDO I’s, Apidos CDO III’s and Apidos Cinco CDO’s current taxable income in its calculation of REIT taxable income.
On October 27, 2011, the Company reorganized the ownership structure of Apidos CDO I and Apidos CDO III. As a result, for the period January 1, 2011 through October 26, 2011, the earnings from Apidos CDO I and Apidos CDO III were included the Company’s calculation of REIT taxable income. For the period October 27, 2011 and ending on December 31, 2011, the earnings from Apidos CDO I and Apidos CDO III were excluded from the Company’s calculation of REIT taxable income and are subject to corporate tax. Accordingly, a provision for income taxes on the earnings from October 27, 2011 through December 31, 2011 has been recorded.
On October 13, 2011, the Company acquired approximately 43% of the equity of Apidos CLO VIII, which is a foreign TRS, organized as an exempted company incorporated with limited liability under the laws of the Cayman Islands. This equity is directly owned by a domestic TRS of the Company; therefore, its earnings are excluded from the Company’s calculation of REIT taxable income and are subject to corporate tax. Accordingly, a provision for income taxes has been recorded.
Effective January 1, 2007, the Company adopted the provisions of FASB’s guidance for uncertain tax positions. This implementation did not have an impact on the Company’s balance sheet or results of operations. The guidance prescribes that a tax position should only be recognized if it is more likely than not that the position will be sustained upon examination by the appropriate taxing authority. A tax position that meets this threshold is measured as the largest amount of benefit that is greater than 50 percent likely of being realized upon ultimate settlement. The Company is required to disclose its accounting policy for classifying interest and penalties, the amount of interest and penalties charged to expense each period as well as the cumulative amounts recorded in the consolidated balance sheets. The Company will continue to classify any tax penalties as other operating expenses and any interest as interest expense. The Company does not have any unrecognized tax benefits that would affect the Company’s financial position.
As of December 31, 2010,2011, income tax returns for the calendar years 20072008 - 20102011 remain subject to examination by Internal Revenue Service ("IRS") and/or any state or local taxing jurisdiction. The Company has not executed any agreements with the IRS or any state and/or local taxing jurisdiction to extend a statue of limitations in relation to any previous year.
RESOURCE CAPITAL CORP. AND SUBSIDIARIES
NOTES TO CONSOLIDATED FINANCIAL STATEMENTS – (Continued)
DECEMBER 31, 20102011
NOTE 2124 – QUARTERLY RESULTS
The following is a presentation of the quarterly results of operations for the years ended December 31, 20102011 and 2009:2010:
| | | | | | | | | | | | | | | | | | | | | | | | | |
| | | (unaudited) | | | (unaudited) | | | (unaudited) | | | (unaudited) | | | (unaudited) | | | (unaudited) | | | (unaudited) | | | (unaudited) | |
| | | (in thousands, except per share data) | | | (in thousands, except per share data) | |
| Year ended December 31, 2010 | | | | | | | | | | | | | |
| Year ended December 31, 2011: | | | | | | | | | | | | | |
Interest income | | | $ | 25,229 | | | $ | 25,262 | | | $ | 26,145 | | | $ | 33,558 | |
Interest expense | | | �� | 6,933 | | | | 7,062 | | | | 7,175 | | | | 9,261 | |
Net interest income | | | $ | 18,296 | | | $ | 18,200 | | | $ | 18,970 | | | $ | 24,297 | |
Net income | | | $ | 13,142 | | | $ | 9,219 | | | $ | 14,944 | | | $ | 413 | |
| | | | | | | | | | | | | | | | | | |
Net income per share − basic | | | $ | 0.22 | | | $ | 0.13 | | | $ | 0.20 | | | $ | 0.01 | |
Net income per share − diluted | | | $ | 0.22 | | | $ | 0.13 | | | $ | 0.20 | | | $ | 0.01 | |
| | | | | | | | | | | | | | | | | | |
| Year ended December 31, 2010: | | | | | | | | | | | | | | | | | |
Interest income | | $ | 21,709 | | | $ | 24,460 | | | $ | 29,249 | | | $ | 28,493 | | | $ | 21,709 | | | $ | 24,460 | | | $ | 29,249 | | | $ | 28,493 | |
Interest expense | | | 7,937 | | | | 8,929 | | | | 10,089 | | | | 9,511 | | | | 7,937 | | | | 8,929 | | | | 10,089 | | | | 9,511 | |
Net interest income | | $ | 13,772 | | | $ | 15,531 | | | $ | 19,160 | | | $ | 18,982 | | | $ | 13,772 | | | $ | 15,531 | | | $ | 19,160 | | | $ | 18,982 | |
Net income (loss) | | $ | 1,406 | | | $ | 13,362 | | | $ | 14,053 | | | $ | (9,374 | ) | | $ | 1,406 | | | $ | 13,362 | | | $ | 14,053 | | | $ | (9,374 | ) |
| | | | | | | | | | | | | | | | | | | | | | | | | | | | | | | | | |
Net income (loss) per share − basic | | $ | 0.04 | | | $ | 0.30 | | | $ | 0.27 | | | $ | (0.17 | ) | | $ | 0.04 | | | $ | 0.30 | | | $ | 0.27 | | | $ | (0.17 | ) |
Net income (loss) per share − diluted | | $ | 0.04 | | | $ | 0.30 | | | $ | 0.27 | | | $ | (0.17 | ) | | $ | 0.04 | | | $ | 0.30 | | | $ | 0.27 | | | $ | (0.17 | ) |
| | | | | | | | | | | | | | | | | | |
| Year ended December 31, 2009 | | | | | | | | | | | | | | | | | |
Interest income | | $ | 26,622 | | | $ | 25,274 | | | $ | 22,501 | | | $ | 23,196 | | |
Interest expense | | | 13,877 | | | | 12,748 | | | | 9,203 | | | | 9,599 | | |
Net interest income | | $ | 12,745 | | | $ | 12,526 | | | $ | 13,298 | | | $ | 13,597 | | |
Net (loss) income | | $ | (12,152 | ) | | $ | (5,127 | ) | | $ | 11,528 | | | $ | 12,090 | | |
| | | | | | | | | | | | | | | | | | |
Net (loss) income per share − basic | | $ | (0.50 | ) | | $ | (0.21 | ) | | $ | 0.48 | | | $ | 0.43 | | |
Net (loss) income per share − diluted | | $ | (0.50 | ) | | $ | (0.21 | ) | | $ | 0.47 | | | $ | 0.43 | | |
NOTE 2225 – SUBSEQUENT EVENTS
The Company has evaluated subsequent events through the filing of this form and determined that there have not been any events that have occurred that would require adjustments to or disclosures in the consolidated financial statements, other than listed below.
On December 16, 2010,12, 2011, the Company declared a quarterly distribution of $0.25 per share of common stock, $14.6$20.0 million in the aggregate, which was paid on January 26,27, 2011 to stockholders of record as of December 31, 2010.30, 2011.
The Company received $16.0 million in proceeds from the issuance of 2,914,978 shares of common stock through the Company’s dividend reinvestment plan during January 2012 and February 2012.
Under a dividend reinvestment plan authorized by the board of directors on February 16, 2012, the Company is authorized to issue up to 15.0 million shares of common stock. This plan will supersede the March 2011 plan.
On January 4, 2011, the Company made an investment, in conjunction with a debt financing commitment from Guggenheim Securities, in LEAF Commercial Capital, Inc. (“LCC”). LCC is a newly formed commercial finance company specializing in equipment leasing and is a subsidiary of LEAF. LEAF contributed its leasing platform and directly-held leases and loans to LCC while the Company and Guggenheim Securities committed to investing up to $44.0 million of capital (which includes the option to invest an additional $10 million at a later date) in the form of preferred stock and subordinated debt, respectively, into LCC. A portion of the Company’s investment consisted of the contribution of leases and loans and equity in these investments it had acquired from LEAF. In return, the Company received 2,626 shares of LEAF Commercial Series A preferred stock and warrants to purchase 4,800 shares of LCC common stock for an exercise price of $0.01 per share (representing 48% of LCC’s common stock on a fully-diluted basis).
On February 1, 2011,27, 2012, the Company entered into a master repurchase and securities agreement with Wells Fargo Bank, National Association to finance the purchaseorigination of securities.commercial real estate loans. The maximum amount of the facility is $100.0$150.0 million with an origination fee of 37.5 basis points and has a two yearan initial 18 month term with atwo one year optionoptions to extend.
On February 8, 2011, the Company sold a mezzanine loan secured by an office building with an amortized cost of $20.1 million for $15.0 million and recorded a $5.1 million provision for loan losses as of December 31, 2010, accordingly. This loan is classified as a loan held for sale on the consolidated balance sheet as of December 31, 2010.
RESOURCE CAPITAL CORP. AND SUBSIDIARIES
NOTES TO CONSOLIDATED FINANCIAL STATEMENTS – (Continued)
DECEMBER 31, 2010
NOTE 22 – SUBSEQUENT EVENTS – (Continued)
On February 6, 2011, the Company sold a mezzanine loan secured by an office building with an amortized cost of $19.1 million for $9.6 million and recorded a $9.3 million provision after a general provision of $290,000 covered some of the losses as of December 31, 2010. This loan is classified as a loan held for sale on the consolidated balance sheet as of December 31, 2010.
On February 24, 2011, the Company announced that it had entered into a definitive agreement that will expand its management in broadly syndicated bank loans. A subsidiary of the Company has agreed to purchase 100% of the ownership interests in Churchill Pacific Asset Management LLC ("CPAM") from Churchill Financial Holdings LLC ("Churchill") for $22.5 million. Through CPAM, the Company will be entitled to collect senior, subordinated and incentive fees related to five Collateralized Loan Obligations (“CLOs”) totaling approximately $1.9 billion in assets managed by CPAM. CPAM will be assisted by Apidos Capital Management, LLC, in managing the five CLOs. CPAM has subsequently changed its name to Resource Capital Asset Management.
The Company received $20.0 million in proceeds related to the issuance of 2.8 million shares of common stock on the Company’s dividend reinvestment plan during January 2011 and February 2011.
| ITEM 9. | | CHANGES AND DISAGREEMENTS WITH ACCOUNTANTS ON ACCOUNTING AND FINANCIAL DISCLOSURE |
None.
| ITEM 9A. | | CONTROLS AND PROCEDURESPROCEDURES |
Disclosure Controls and Procedures
We maintain disclosure controls and procedures that are designed to ensure that information required to be disclosed in our Securities Exchange Act of 1934 reports is recorded, processed, summarized and reported within the time periods specified in the Securities and Exchange Commission’s rules and forms, and that such information is accumulated and communicated to our management, including our Chief Executive Officer and our Chief Financial Officer, as appropriate, to allow timely decisions regarding required disclosure. In designing and evaluating the disclosure controls and procedures, our management recognized that any controls and procedures, no matter how well designed and operated, can provide only reasonable assurance of achieving the desired control objectives, and our management necessarily was required to apply its judgment in evaluating the cost-benefit relationship of possible controls and procedures.
Under the supervision of our Chief Executive Officer and Chief Financial Officer, we have carried out an evaluation of the effectiveness of our disclosure controls and procedures as of the end of the period covered by this report. Based upon that evaluation, our Chief Executive Officer and Chief Financial Officer concluded that our disclosure controls and procedures are effective at the reasonable assurance level.
Management’s Report on Internal Control Over Financial Reporting
Our management is responsible for establishing and maintaining adequate internal control over financial reporting as defined in Rules 13a-15(f) and 15d-15(f) under the Exchange Act. Because of its inherent limitations, internal control over financial reporting may not prevent or detect misstatements. Projections of any evaluation of effectiveness to future periods are subject to the risks that controls may become inadequate because of changes in conditions, or that the degree of compliance with the policies or procedures may deteriorate.
Management assessed the effectiveness of our internal control over financial reporting as of December 31, 2010.2011. In making this assessment, management used the criteria set forth by the Committee of Sponsoring Organizations of the Treadway Commission in Internal Control-Integrated FrameworkFramework. Based on this assessment, management believes that, as of December 31, 2010,2011, our internal control over financial reporting is effective.
Our independent registered public accounting firm, Grant Thornton LLP, audited our internal control over financial reporting as of December 31, 2010.2011. Their report, dated March 14, 2011,2012, expressed an unqualified opinion on our internal control over financial reporting. This report is included in this Item 9A.
Changes in Internal Control of Financial Reporting
There were no significant changes in our internal control over financial reporting during the fiscal yearthree months ended December 31, 20102011 that have materially affected, or are reasonably likely to materially affect, our internal control over financial reporting.
REPORT OF INDEPENDENT REGISTERED PUBLIC ACCOUNTING FIRM
Board of Directors and Stockholders
Resource Capital Corp.
We have audited Resource Capital Corp. (a Maryland Corporation) and its subsidiaries’ (a Maryland Corporation)(the Company) internal control over financial reporting as of December 31, 2010,2011, based on criteria established in Internal Control—Integrated Framework issued by the Committee of Sponsoring Organizations of the Treadway Commission (COSO). Resource Capital Corp. and its subsidiaries’ managementManagement is responsible for maintaining effective internal control over financial reporting and for its assessment of the effectiveness of internal control over financial reporting, included in the accompanying Management Report on Internal Control over Financial Reporting. Our responsibility is to express an opinion on Resource Capital Corp. and its subsidiaries’the Company’s internal control over financial reporting based on our audit.
We conducted our audit in accordance with the standards of the Public Company Accounting Oversight Board (United States). Those standards require that we plan and perform the audit to obtain reasonable assurance about whether effective internal control over financial reporting was maintained in all material respects. Our audit included obtaining an understanding of internal control over financial reporting, assessing the risk that a material weakness exists, testing and evaluating the design and operating effectiveness of internal control based on the assessed risk, and performing such other procedures as we considered necessary in the circumstances. We believe that our audit provides a reasonable basis for our opinion.
A company’s internal control over financial reporting is a process designed to provide reasonable assurance regarding the reliability of financial reporting and the preparation of financial statements for external purposes in accordance with generally accepted accounting principles. A company’s internal control over financial reporting includes those policies and procedures that (1) pertain to the maintenance of records that, in reasonable detail, accurately and fairly reflect the transactions and dispositions of the assets of the Company; (2) provide reasonable assurance that transactions are recorded as necessary to permit preparation of financial statements in accordance with generally accepted accounting principles, and that receipts and expenditures of the Company are being made only in accordance with authorizations of management and directors of the Company;company; and (3) provide reasonable assurance regarding prevention or timely detection of unauthorized acquisition, use, or disposition of the Company’scompany’s assets that could have a material effect on the financial statements.
Because of its inherent limitations, internal control over financial reporting may not prevent or detect misstatements. Also, projections of any evaluation of effectiveness to future periods are subject to the risk that controls may become inadequate because of changes in conditions, or that the degree of compliance with the policies or procedures may deteriorate.
In our opinion, Resource Capital Corp. and its subsidiaries maintained, in all material respects, effective internal control over financial reporting as of December 31, 2010,2011, based on criteria established in Internal Control—Integrated Framework issued by COSO.
We also have audited, in accordance with the standards of the Public Company Accounting Oversight Board (United States), the consolidated balance sheets of Resource Capital Corp. and its subsidiaries as of December 31, 20102011 and 2009,2010, and the related consolidated statements of operations, changes in stockholders’ equity, and cash flows for each of the three years in the period ended December 31, 20102011 and our report dated March 14, 20112012 expressed an unqualified opinion.
/s/ Grant Thornton LLP
Philadelphia, Pennsylvania
March 14, 20112012
| ITEM 9B. | | OTHER INFORMATION |
None.
PART III
All members of the board of directors are elected for a term of one year or until their successors are elected and qualified. Information is set forth below regarding the principal occupation of each of our directors. There are no family relationships among the directors and executive officers except that Jonathan Z. Cohen, our Chief Executive Officer, President and a director, is a son of Edward E. Cohen, a director and, until November 2009, our Chairman of the Board.
Names of Directors, Principal Occupation and Other Information
Walter T. Beach, age 44,45, has been a director since March 2005. Mr. Beach has been Managing Director of Beach Investment Counsel, Inc., an investment management firm, since 1997. From 1993 to 1997, Mr. Beach was a Senior Analyst and Director of Research at Widmann, Siff and Co., Inc., an investment management firm where, beginning in 1994, he was responsible for the firm’s investment decisions for its principal equity product. Before that he was an associate and financial analyst at Essex Financial Group, a consulting and merchant banking firm, and an analyst at Industry Analysis Group, an industry and economic consulting firm. Mr. Beach has served as a director of The Bancorp, Inc., a publicly-traded (NASDAQ: TBBK) bank holding company, and its subsidiary bank, The Bancorp Bank, since 1999. Mr. Beach has also served as a director of Institutional Financial Markets, Inc. and its predecessor, Cohen & Company, a publicly-traded (AMEX: IFMI) financial services company specializing in credit related fixed income investments, since December 2009.
Edward E. Cohen, age 72,73, has been a director since March 2005 and was our Chairman from March 2005 to November 2009. Mr. Cohen wasis Chairman of Resource America, the corporate parent of our manager, a position he has held since 1990. He was Resource America’s Chief Executive Officer from 1988 to 2004 and its President from 2000 to 2003. He is Chairman and Chief Executive Officer of Atlas Energy, Inc. (f/k/a/ Atlas America, Inc.), a publicly-traded (NASDAQ: ATLS) energy company, from 2000 to February 2011; Chairman of Atlas Pipeline Holdings GP, LLC, a wholly-owned subsidiary of Atlas Energy that ishas been the general partner of Atlas Energy, L.P., a publicly-traded (NYSE: AHD) energy company, from 2006 to February 2011; Chief Executive Officer and President of Atlas Pipeline Holdings, GP since February 2011; and Chairman of the Managing Board of Atlas Pipeline Partners GP, LLC a wholly-owned subsidiary ofsince its formation in 1999 and was Chief Executive Officer from 1999 to 2009. Atlas Energy thatPipeline GP is the general partner of Atlas Pipeline Partners, L.P., a publicly-traded (NYSE: APL) natural gas pipeline company, sincelimited partnership. He has also been the Chairman of the Board of Atlas Energy GP, LLC from its formation in 1999.2006 through February 2011 and was Chief Executive Officer from 2006 until February 2009 and Chief Executive Officer and President since February 2011. Atlas Energy GP is the general partner of Atlas Energy, L.P., a publicly-traded (NYSE: ATLS) energy limited partnership. He iswas also the Chairman of the Board and Chief Executive Officer of Atlas Energy, Inc., formerly known as Atlas America, Inc., from its formation in 2000 until its sale in February 2011. He was also a director of TRM Corporation, a then publicly-traded consumer services company, from 1998 to July 2007. He also has been Chairman of the Board of Brandywine Construction & Management, Inc., a privately-held real estate management company.company, since 1994. From 1981 to 1999 he was Chairman of the Executive Committee of JeffBanks, Inc., a bank holding company acquired by Hudson United Bancorporation. From 1969 to 1989 he was Chairman of the Executive Committee of State National Bank of Maryland (now a part of Wachovia Bank).
Jonathan Z. Cohen, age 40,41, has been our Chief Executive Officer, President and a director since March 2005. Mr. Cohen has been President since 2003, Chief Executive Officer since 2004 and a Directordirector since 2002 of Resource America. He was Chief Operating Officer of Resource America from 2002 to 2004, Executive Vice President of Resource America from 2001 to 2003, and a Senior Vice President from 1999 to 2001. He has been Vice Chairman of the Managing Board of Atlas Pipeline Partners GP since its formation in 1999,1999. He has also been Chairman of the Board of Atlas Energy GP since February 2011 and was Vice Chairman from 2006 until February 2011. He was also Vice Chairman of the Board of Atlas Energy, Inc. from its formation in 2000 tountil its sale in February 2011 and Vice Chairman of Atlas Pipeline Holdings GP from 2006 to February 2011, and Chairman of Atlas Pipeline Holdings GP since 2011. He was the Vice Chairman of RAIT Investment Trust, (now RAIT Financial Trust) a publicly-traded (NYSE: RAS) REIT, from 2003 to 2006, and Secretary, trustee and a member of RAIT’s investment committee from 1997 to 2006.
William B. Hart, age 67,68, has been a director since March 2005. Mr. Hart was Chairman of the Board of Trustees of the National Trust for Historic Preservation from 1999 to 2004. He was also a director of Anthem, Inc. (now Wellpoint, Inc.), a publicly-traded (NYSE: WLP) health insurance company, from 2000 to 2004. Mr. Hart was Director of SIS Bancorp from 1995 to 2000. From 1988 to 1999, Mr. Hart served in various positions with Blue Cross/Blue Shield of New Hampshire, ending as Chairman of the Audit Committee and Chairman of the Board of Directors from 1996 to 1999. He also served as President of the Foundation for the National Capital Region, Washington, DC, from 1993 to 1996 and President of The Dunfey Group, a private investment firm, from 1986 to 1998. From 1986 to 1994 he was a director of First NH Banks where he was Chairman of the Audit Committee from 1992 to 1994.
Gary Ickowicz, age 55,56, has been a director since February 2007. Mr. Ickowicz has been the Managing Partner of IR Capital LLC, a real estate company that owns and operates real estate assets in the New York Metropolitan area since 2008. He was a Managing Principal of Lazard Freres Real Estate Investors, a manager of funds invested in debt and equity securities of North American real estate assets and enterprises since 2001.from 2001 to 2011. He was a director of Lazard Freres’s real estate investment banking unit from 1989 through 2001. Since 2000 he has been a director of Grant Street Settlement, and since 2002 he has been a director of NCC/Neumann, both not-for-profit developers of senior housing. SinceFrom 2001 to 2011, he has beenwas a director of Commonwealth Atlantic Properties, Inc., a privately-held REIT. From 2001 to 2006 he was a director of Kimsouth, Inc., a joint venture with Kimco Realty Corporation, a publicly-traded (NYSE: KIM) REIT.
Steven J. Kessler, age 68,69, has been our chairmanChairman since November 2009 and was our Senior Vice President - Finance from September 2005 to November 2009 and, before that, served as our Chief Financial Officer, Chief Accounting Officer and Treasurer from March 2005 to September 2005. Mr. Kessler has been Executive Vice President of Resource America since 2005 and was Chief Financial Officer from 1997 to December 2009 and Senior Vice President from 1997 to 2005. He was a Trustee of GMH Communities Trust, a previously publicly traded (NYSE: GCT)then publicly-traded specialty housing REIT, from 2004 to 2008 when GCT was sold. He was Vice President - Finance and Acquisitions at Kravco Company, a then national shopping center developer and operator, from 1994 to 1997. From 1983 to 1993 he was employed by Strouse Greenberg & Co., a regional full service real estate company, ending as Chief Financial Officer and Chief Operating Officer. Before that, he was a partner at Touche Ross & Co. (now Deloitte & Touche LLP), independent public accountants.
Murray S. Levin, age 68,69, has been a director since March 2005. Mr. Levin is a senior litigation partner at Pepper Hamilton LLP, a law firm with which he has been associated since 1970. Mr. Levin served as the first American president of the Association Internationale des Jeunes Avocats (Young Lawyers International Association), headquartered in Western Europe. He is a past president of the American Chapter and a member of the board of governors of the Union Internationale des Avocats (International Association of Lawyers), a Paris-based organization that is the world’s oldest international lawyers association.
P. Sherrill Neff, age 59,60, has been a director since March 2005. Mr. Neff is a founder of Quaker BioVentures, Inc.,Partners, a life sciences venture and growth equity fund, and has been a Partner since 2002. From 1994 to 2002 he was President and Chief Financial Officer, and from 1994 to 2003, a director of Neose Technologies, Inc., a then-publicly-traded (NASDAQ: NTEC)then publicly-traded life sciences company. Mr. Neff was also a director of The Bancorp, Inc. (NASDAQ: TBBK), a publicly traded bank holding company, from its formation in 1999 until 2002.2002, and a director of Resource America from 1998 to 2005. Mr. Neff is on the boards of directors of six privately-held Quaker BioVenturesPartners portfolio companies, including Amicus Therapeutics, Inc. (NASDAQ: FOLD) and five privately held companies. He is a member of the board of directors of the National Venture Capital Association.
The board of directors has not adopted specific minimum qualifications for service on our board, but rather seeks a mixture of skills that are relevant to our business as an externally-managed REIT that focuses primarily upon investments in commercial real estate and commercial finance assets, principally loans and interests in loans. The following presents a brief summary of the attributes of each director that led to the conclusion that he should serve as such:
Mr. Beach has extensive experience in finance and investment management and a strong financial background.
Mr. E. Cohen has lengthy experience in real estate and real estate finance (a principal business of Resource America), corporate finance (through the formation and funding of public companies such as Atlas Energy, Atlas America, Atlas Pipeline, and Resource America, and his banking experience) and operations of both public and private companies, and is affiliated with the Manager.
Mr. J. Cohen has significant real estate, real estate finance and operational experience as an officer (currently Chief Executive Officer and President) and director of Resource America, and is affiliated with the Manager.
Mr. Hart has extensive experience in finance and investment management, both as an officer and director of banks and insurance companies, as well as an officer of a private investment firm.
Mr. Ickowicz has broad real estate and real estate finance experience as a principal in the real estate operations of an international investment bank, as a director of a REIT and as a director threeof several real estate ventures.
Mr. Kessler has a significant financial and accounting background in real estate as the former Chief Financial Officer of Resource America and, previously, as a principal financial officer for a major operator of commercial real estate.
Mr. Levin has a lengthy and diverse legal background and has practiced complex litigation for over forty years.
Mr. Neff has significant experience in investments, operations and finance as a principal or officer of a venture fund and a public company and, prior thereto, as an investment banker.
Non-Director Executive Officers
Jeffrey D. Blomstrom, age 42,43, has been our Senior Vice President since March 2005. Mr. Blomstrom has been President and Managing Director of Resource Financial Fund Management, Inc., an asset management subsidiary of Resource America, since 2003. Mr. Blomstrom serves as the head of collateral origination and as a member of the credit committee for Trapeza Capital, Resource America’s trust preferred securitysecurities collateral manager. From 2001 to 2003 Mr. Blomstrom was a Managing Director at Cohen and Company. From 2000 to 2001 he was Senior Vice President of iATMglobal.net, Inc., an ATM software development company. Mr. Blomstrom was, from 1999 to 2000, an associate at Covington & Burling, a law firm, where he focused on mergers and acquisitions and corporate governance.
David E. Bloom, age 46,47, has been our Senior Vice President-Real Estate Investments since March 2005. Mr. Bloom has been Senior Vice President of Resource America since 2001. He has also been President of Resource Real Estate, Inc., a wholly-owned real estate subsidiary of Resource America, since 2004 and was President of Resource Capital Partners, an indirecta wholly-owned real estate subsidiary of Resource America, from 2002 to 2006. From 2001 to 2002 he was President of Resource Properties, a former real estate subsidiary of Resource America. Before that he was Senior Vice President at Colony Capital, LLC, an international real estate opportunity fund, from 1999 to 2001. From 1998 to 1999 he was Director at Sonnenblick-Goldman Company, a real estate investment bank. From 1995 to 1998 he was an attorney at the law firm of Willkie Farr & Gallagher, LLP.
Jeffrey F. Brotman, 47,48, has been our Executive Vice President since June 2009 and Executive Vice President of Resource America since June 2007. He was co-founder of Ledgewood, P.C. (a Philadelphia-based law firm) and affiliated with the firm from 1992 until June 2007, serving as managing partner from 1995 until March 2006. Mr. Brotman is also a non-active certified public accountant and an Adjunct Professor at the University of Pennsylvania Law School. Mr. Brotman was Chairman of the Board of Directors of TRM Corporation (a then publicly-traded consumer services company) from September 2006 until September 2008 and was its President and Chief Executive Officer from March 2006 through June 2007.
David J. Bryant, age 53,54, has been our Senior Vice President, Chief Financial Officer, Chief Accounting Officer and Treasurer since June 2006. From 2005 to 2006 Mr. Bryant served as Senior Vice-President, Real Estate Services, at Pennsylvania Real Estate Investment Trust, a publicly-traded (NYSE: PEI) REIT principally engaged in owning, managing, developing and leasing malls and strip centers in the eastern United States. From 2000 to 2005, Mr. Bryant served as PEI’s Senior Vice President - Finance and Treasurer, and was its principal accounting officer. From 1994 to 2000, Mr. Bryant was Vice President –Finance and Controller at PEI and its predecessor, The Rubin Organization. Mr. Bryant is also a certified treasury professional and a non-active certified public accountant.
Other Significant Employees
The following sets forth certain information regarding other significant employees of the Manager and Resource America who provide services to us:
Christopher D. Allen, age 41,42, has been our Senior Vice President-Commercial Lending since March 2005. Mr. Allen has been a Managing Director of Resource Financial Fund Management, a wholly-owned subsidiary of Resource America since 2003. At Resource Financial Fund Management, Mr. Allen is in charge of identifying, implementing and overseeing new leveraged loan and CDO products. He is a member of the investment committee of Apidos Capital Management, LLC, a wholly-owned asset management subsidiary of Resource America, where he serves as the Chief Operating Officer. Before joining Resource Financial Fund Management, from 2002 to 2003 he was a Vice President at Trenwith Securities, the investment banking arm of BDO Seidman, LLP, where he was in charge of corporate finance, mergers and acquisitions and restructuring transactions. From 1994 to 1997 he was an Associate with Citicorp Venture Capital working on leveraged buyout and recapitalization transactions.
Gretchen L. Bergstresser, age 48,49, has been our Senior Vice President-Bank Loans since March 2005. Ms. Bergstresser has been the President and Senior Portfolio Manager of Apidos Capital Management, LLC since 2005. Before joining Apidos Capital Management LLC, from 2003 to 2005 she was the Managing Director and Portfolio Manager of MJX Asset Management, a multi-billion dollar boutique asset management firm managing leveraged loans across five structured vehicles. From 1996 to 2003 Ms. Bergstresser was CDO Portfolio Manager and Head Par Loan Trader at Eaton Vance Management, an investment management company. From 1995 to 1996 she was a Vice President in the Diversified Finance Division of Bank of Boston. From 1991 to 1995 she was a Vice President at ING (U.S.), Capital Markets, an investment banking firm.
Crit DeMent, age 58, has been our Senior Vice President-Equipment Leasing since March 2005. Mr. DeMent has been Chairman and Chief Executive Officer of LEAF Financial Corporation, a majority-owned commercial finance subsidiary of Resource America, since 2001. Mr. DeMent has been Chairman and Chief Executive Officer of LEAF financial subsidiary, LEAF Commercial Capital Inc., since January 2011. From 2000 to 2001 he was President of the Small Ticket Group, an equipment leasing division of European American Bank. Before that, he was President and Chief Operating Officer of Fidelity Leasing, Inc., then the equipment leasing subsidiary of Resource America, and its successor, the Technology Finance Group of CitiCapital Vendor Finance, from 1996 to 2000. From 1987 to 1996 he was Vice President of Marketing for Tokai Financial Services, an equipment leasing firm.
Thomas C. Elliott, age 37,38, has been our Senior Vice President-Finance and Operations since September 2006 and, prior to that, was our Chief Financial Officer, Chief Accounting Officer and Treasurer from September 2005 to June 2006. He was our Senior Vice President - Assets and Liabilities Management from June 2005 until September 2005 and, before that, served as our Vice President - Finance from March 2005. Mr. Elliott has been Chief Financial Officer of Resource America since December 2009 and Senior Vice President since 2005. He was Senior Vice President - Finance and Operations of Resource America from 2006 to December 2009; Senior Vice President – Finance from 2005 to 2006 and Vice President - Finance from 2001 to 2005. From 1997 to 2001 Mr. Elliott was a Vice President at Fidelity Leasing, where he managed all capital market functions, including the negotiation of all securitizations and credit and banking facilities in the U.S. and Canada. Mr. Elliott also oversaw the financial controls and budgeting departments.
Alan F. Feldman, age 47,48, has been our Senior Vice President-Real Estate Investments since March 2005. Mr. Feldman has been Chief Executive Officer of Resource Real Estate since 2004 and Senior Vice President of Resource America since 2002. Mr. Feldman was President of Resource Properties from 2002 to 2005. From 1998 to 2002, Mr. Feldman was Vice President at Lazard Freres & Co., an investment banking firm, specializing in real estate mergers and acquisitions, asset and portfolio sales and recapitalization. From 1992 through 1998, Mr. Feldman was Executive Vice President of PREIT-RUBIN, Inc. the management subsidiary of Pennsylvania Real Estate Investment Trust and its predecessor, The Rubin Organization. Before that, from 1990 to 1992, he was a Director at Strouse, Greenberg & Co., a regional full service real estate company.
Kevin M. Finkel, age 39, has been our Vice President-Real Estate Investments since January 2006. He has also been employed by Resource Capital Partners since 2002, having been its Vice President and Director of Acquisitions from 2003 to 2006 and President since 2006. Mr. Finkel has also been an officer of Resource Real Estate since 2004, and is currently its Executive Vice President and Director of Acquisitions. In 2000, Mr. Finkel was an investment banking Associate at Lehman Brothers. From 1998 to 1999, Mr. Finkel was an Associate at Barclays Capital, the investment banking division of Barclays Bank PLC. From 1994 to 1998, Mr. Finkel was an investment banker at Deutsche Bank Securities, the investment banking division of Deutsche Bank AG.
Kyle Geoghegan, age 42,43, has been our Senior Vice President – Loan Originations since 2007. Mr. Geoghegan has been a Managing Director of Resource Real Estate Funding, Inc., a real estate subsidiary of Resource America, since July 2006. Mr. Geoghegan co-manages the whole loan origination platform for Resource Real Estate Funding and is based in Los Angeles. Mr. Geoghegan worked at Bear Stearns from January 1998 to May 2006, serving as a Managing Director who co-managed the Bear Stearns Commercial Mortgage office in Los Angeles. Prior to joining Bear Stearns, Mr. Geoghegan spent four years as a real estate loan officer at PNC Bank in Philadelphia, PA, primarily originating construction and bridge loans.
Yvana Melini,David Jansky, age 35,41, has been our Vice President and Director of Asset Management since 2008. Ms. Melini has served as Vice President of Debt Asset ManagementResource Capital Markets, Inc., a subsidiary of Resource America, since April 2008. Mr. Jansky was head of Global ABS CDOs in the Structured Credit Products group at J.P. Morgan from 2005 to 2008. Prior thereto, he was an Executive Director at Credit Suisse First Boston from 2002 to 2005. Mr. Jansky was also responsible for Resource Real Estate since 2006. From 2000 to 2006, Ms. Melini servedstructuring CDOs as a Vice President of both the Structured Asset Managementat Deutsche Bank from 1997 to 2000 and CMBS Credit Administration groups for Capmark Finance, Inc. (formerly GMAC Commercial Mortgage Corporation). Prioras an Associate at Merrill Lynch from 1996 to her employment with Capmark, Ms. Melini served as Senior Underwriter for the Northeast Commercial Real Estate Lending division of Washington Mutual Bank. Ms. Melini has also privately consulted on various due diligence projects for large institutional investors and B-note buyers within the CMBS marketplace.1997.
Darryl Myrose, age 37,38, has been our Senior Vice President – Loan Originations since 2007. Mr. Myrose has been a Managing Director of Resource Real Estate Funding since July 2006. Mr. Myrose co-manages the whole loan origination platform for Resource Real Estate Funding and is based in Los Angeles. Mr. Myrose worked at Bear Stearns from April 1996 to May 2006, serving as a Managing Director who co-managed the Bear Stearns Commercial Mortgage office in Los Angeles. Prior to joining Bear Stearns, Mr. Myrose was employed with Clarion Advisors (formerly Jones Lang Wootton Realty Advisors) where he was an asset management analyst.
Thomas C. Powers, age 46,47, has been our Vice President – Loan Originations since 2007. Mr. Powers has been Senior Vice President of Resource Real Estate Funding since January 2008 and was Vice President from 2006 to 2008. Mr. Powers is responsible for all real estate asset management including investment origination and transaction management. Mr. Powers has over 20 years of commercial real estate, workout and risk management experience. Prior to joining Resource Real Estate Funding, Mr. Powers was a senior member of the real estate credit risk management and workout group at Merrill Lynch. Prior to his employment with Merrill Lynch, Mr. Powers worked in the project finance group at UBS Investment Bank.
Joan M. Sapinsley, age 58,59, has been our Senior Vice President – CMBS since 2007. Ms. Sapinsley joined Resource Financial Fund Management, Inc. in February 2007 as Managing Director and manages our CMBS portfolio. Prior to joining Resource Financial Fund Management, Ms. Sapinsley was a Managing Director at TIAA,Teachers Insurance and Annuity Association (“TIAA”), where she worked from 1992 through 2006 purchasing CMBS. She was responsible for all single borrower and single asset CMBS, as well as subordinate CMBS and B-notes. She also directed TIAA’s conduit origination and securitization activities. Before TIAA, Ms. Sapinsley was a Director in the Financial Services Group of Cushman & Wakefield, a global commercial real estate company, and a real estate consultant at Laventhol & Horwath.Horwath, an accounting firm.
Michael S. Yecies, age 43,44, has been our Chief Legal Officer and Secretary since March 2005 and our Senior Vice President since July 2007. Mr. Yecies has been Senior Vice President of Resource America since 2005, Chief Legal Officer and Secretary since 1998 and was Vice President from 1998 to 2005. From 1994 to 1998 he was an attorney at the law firm of Duane Morris LLP.
Section 16(a) Beneficial Ownership Reporting Compliance
Section 16(a) of the Exchange Act requires our officers, directors and persons who own more than ten percent10% of a registered class of our equity securities to file reports of ownership and changes in ownership with the Securities and Exchange Commission and to furnish us with copies of all such reports.
Based solely on our review of the reports received by us, we believe that, during fiscal 2010,2011, our officers, directors and greater than ten percent shareholders complied with all applicable filings requirements.
Code of Ethics
We have adopted a code of business conduct and ethics applicable to all directors, officers and employees. Our code of conduct is available on our website: www.resourcecapitalcorp.com. We intend to satisfy the disclosure requirement under Item 5.05 of Form 8-K regarding an amendment to, or waiver of,from, a provision of this code of conduct by posting such information on our website, unless otherwise required by applicable law or regulation.
Information Concerning the Audit Committee
Our Board of Directors has a standing audit committee. The audit committee reviews the scope and effectiveness of audits by the independent accountants, is responsible for the engagement of independent accountants, and reviews the adequacy of our internal financial controls. Members of the committee are Messrs. Neff (Chairman), Beach and Hart. The board of directors has determined that each member of the audit committee meets the independence standards for audit committee members set forth in the listing standards of the New York Stock Exchange, or NYSE, including those set forth in Rule 10A-3(b)(1) of the Securities Exchange Act of 1934, and that Messrs. Beach and Neff each qualifies as an “audit committee financial expert” as that term is defined in the rules and regulations thereunder.
| ITEM 11. | | EXECUTIVE COMPENSATION |
Compensation Discussion and Analysis
We are required to provide information regarding the compensation program in place for our Chief Executive Officer, Chief Financial Officer and the three other most highly-compensated executive officers. In the following discussion, we refer to our Chief Executive Officer, Chief Financial Officer and the other most highly-compensated executive officers whose compensation for fiscal 20102011 exceeded $100,000 as our “Named Executive Officers” or “NEOs.”
Objectives of Our Compensation Program
We have no employees. We are managed by our Manager pursuant to a management agreement, between our Manager and us. All of our NEOs are employees of our Manager or one of its affiliates. We have not paid, and do not intend to pay, any cash compensation to our NEOs although we reimburse the Manager for the wages, salary and benefits established and paid by the Manager to our Chairman and Chief Financial Officer. However, our Compensation Committee may, from time to time, grant equity awards in the form of restricted stock, stock options or performance awards to our NEOs pursuant to our 2005 Stock Incentive Plan and/or the Amended and Restated 2007 Omnibus Equity Compensation Plan. These awards are designed to align the interests of our NEOs with those of our stockholders, by allowing our NEOs to share in the creation of value for our stockholders through stock appreciation and dividends. These equity awards are generally subject to time-based vesting requirements designed to promote the retention of management and to achieve strong performance for our company. These awards further provide us flexibility in our ability to enable our Manager to attract, motivate and retain talented individuals at our Manager.
Setting Executive Compensation
Our NEOs are employees of Resource America, which determines the base salary, cash incentive compensation and, for grants of Resource America equity securities, equity incentive compensation that is paid to our NEOs. A portion of the base salary and cash incentive compensation paid to them is derived from the fees paid by us under the management agreement. We do not control how such fees are allocated by Resource America to its employees. For a description of our management agreement, see Item 1: “Business-Management Agreement.” We disclose the cash amounts paid by Resource America to our Chief Financial Officer (for which we reimburse Resource America), our only NEO who devotes his full business time to our affairs, in the Summary Compensation Table below.
When Resource America makes its determination of the amount of compensation it will award to one of our NEOs, including in particular the amount of Resource America securities that Resource America will grant as equity incentive compensation, Resource America also considers, but does not determine, the amount of our securities we propose to grant as equity incentive compensation to that NEO. Similarly, in determining the amount of equity incentive compensation we grant to one of our NEOs, our compensation committee considers, but does not determine, the compensation that Resource America proposes to grant to that NEO, including Resource America’s grant of Resource America securities as equity incentive compensation. Our respective compensation committees base their analyses and determinations upon recommendations submitted by Jonathan Z. Cohen, who is chief executive officer of both companies, for all of our NEOs other than himself. Resource America’s compensation committee determines the amount of compensation Resource America will award Mr. J. Cohen, while our compensation committee determines the amount of any Resource Capital equity incentive compensation we award to Mr. J. Cohen. These analyses and determinations are not based upon any particular compensation matrix or formula, but instead are based upon qualitative evaluations by Mr. J. Cohen and the compensation committees. Our compensation committee does not make recommendations to Resource America as to the amount of compensation Resource America grants to our NEOs, nor does Resource America’s compensation committee make recommendations to us regarding the amount of equity incentive compensation awarded by us to our NEOs.
Our compensation committee operates under a written charter adopted by our Board of Directors, a copy of which is available on our website at www.resourcecapitalcorp.com. Our compensation committee determines compensation amounts after the end of Resource America’s fiscal year and makes equity awards after our fiscal year end. Awards made after our fiscal year end are reflected in our Summary Compensation Table but not our Grants of Plan-Based Awards table until our following fiscal year. Our compensation committee has the discretion to issue equity awards at other times during our fiscal year.
Elements of Our Compensation Program
As described above, our NEOs do not receive cash compensation from us, although beginning in October 2009, we agreed to reimburse Resource America for the wages, salary and benefits of our Chief Financial Officer. In addition, we began reimbursing Resource America for our Chairman forthe wages, salary and benefits of our Chairman in February 2010. However, our compensation committee may, from time to time, grant equity awards in the form of restricted stock, stock options or performance awards to our NEOs pursuant to our 2005 Stock Incentive Plan and/or the Amended and Restated 2007 Omnibus Equity Compensation Plan as followsfollows:
Stock Options. Stock options provide value to the executive only if our stock price increases after the grants are made. Stock options typically vest 33.3% per year.
Restricted Stock. Restricted stock units reward stockholder value creation slightly differently than stock options: restricted stock units are impacted by all stock price changes, both increases and decreases. Restricted stock units generally vest 33.3% per year and include a right to receive dividends on unvested shares.
Resource America Restricted Stock. As described above, Resource America’s compensation committee approves awards of Resource America restricted stock to NEOs. These awards generally vest 25% per year, and may include a right to receive dividends on unvested shares.
Resource America Stock Options. As described above, Resource America’s compensation committee approves awards of Resource America options to receive restricted stock to NEOs. These awards generally vest 25% per year.
Supplemental Incentive Arrangement with David Bloom. In December 2007, Resource America entered into an agreement with David Bloom, our Senior Vice President – Real Estate Investments, which provides for awards to him of our restricted stock and Resource America restricted stock. With respect to our restricted stock, Mr. Bloom was awarded 120,000 shares, 60,000 of which were subject to vesting over time and 60,000 of which were to vest based on the achievement of predetermined, objective performance goals over a multi-year performance period. We paypaid dividends on unvested awards. With respect to the shares that vestvested over time, 15% vested on June 30, 2008, 15% vested on June 30, 2009 and 70% vested on March 9, 2011. Performance-based shares were to be earned on achievement of performance goals over the performance period beginning July 1, 2007 and ending June 30, 2010, with one-third of the shares potentially being earned at the end of each 12-month measurement period. AsAt the end of December 31, 2010,the measurement period, one-third of such shares had been earned and two-thirds of such shares had been forfeited.
How We Determined 20102011 Compensation
In 2011As discussed above, our Compensation Committee decidedbelieves that it is important for our NEOs, who are employees of our Manager, to issue more substantial stock awardsremain significantly aligned to our NEOs than in past years as partshareholders. Accordingly, we have traditionally made grants of a long-term compensation planrestricted stock to retain, motivate and incentivize employees who are critical to our continued success over the coming years. To enhance the retentive nature ofsuch NEOs.
For 2010, such stock awards all such stock awards cliffwere more substantial than in the past and will vest in full three years after the dates of grant.grant to enhance their retentive value. For 2011, our Compensation Committee determined that based upon our performance, such stock awards should be more in keeping with years other than 2010 and, accordingly, approved the awards discussed below, which vest 33.33% per year over three years. Among the factors considered by our Compensation Committee were our continued growth, distributions to our shareholders and our ability to raise and deploy capital. Our Compensation Committee considered these stock awards in addition to considering the total compensation that Resource America proposed for our NEOs.
In light of the long-term compensation plan discussed above, and our improved performance,
For Mr. Bryant, our Compensation Committee decided to significantly increasedetermined that no stock award would be granted for 2011, after considering the valueamount of the bonus awards to our NEOs. The Committee recognized our NEOs’ prudent management efforts in a challenging environment, and believed that significant restrictedprevious stock awards, werethe increase in his base compensation and the awarding of a $200,000 cash bonus, which was the same cash bonus amount as for 2010. Our Compensation Committee further determined that, in the aggregate, such compensation paid to Mr. Bryant for 2011 was reasonable and appropriate, to recognize those effortstaking into consideration his accomplishments, previous cash and retain their services.stock awards and level of ownership of our stock.
Upon our CEO’s recommendation, other than for himself, our Compensation Committee madeapproved the following awards for fiscal 2010:
2011:
| | ● | Mr. J. Cohen was awarded 62,056 shares of restricted stock for fiscal 2011, as compared to 138,504 shares of restricted stock for fiscal 2010, as compared to 57,803 shares of restricted stock for fiscal 2009.2010. |
| | ● | Mr. Blomstrom was awarded 17,452 shares of restricted stock for fiscal 2011, as compared to 82,987 shares of restricted stock for fiscal 2010, as compared to 14,450 shares of restricted stock for fiscal 2009.2010. |
| | ● | Mr. Bloom was awarded 21,815 shares of restricted stock for fiscal 2011, as compared to 27,662 shares of restricted stock for fiscal 2010, as compared to 19,267 shares of restricted stock for fiscal 2009.2010. See “- Elements of Our Compensation Program-Supplemental Incentive Arrangements with David Bloom.” |
| | ● | Mr. Brotman was awarded 35,460 shares of restricted stock for fiscal 2011, as compared to 83,102 shares of restricted stock for fiscal 2010, as compared to 19,267 shares of restricted stock for fiscal 2009.2010. |
| | ● | Mr. Bryant was awarded 0 shares of restricted stock for fiscal 2011, as compared to 27,662 shares of restricted stock for fiscal 2010, as compared to 19,267 shares of restricted stock for fiscal 2009.2010. Mr. Bryant was also awarded 0 shares of restricted Resource America stock for fiscal 2011, as compared to 3,654 shares of restricted Resource America stock for fiscal 2010, as compared to 5,980 shares of restricted Resource America stock for fiscal 2009. 2010. |
Report of the Compensation Committee Report
The compensation committee has reviewed and discussed the forgoing Compensation Discussion and Analysis with management and, based on its review and discussions, the compensation committee recommended to the Board of Directors that the Compensation Discussion and Analysis be included in this filing.
This report has been provided by the compensation committee of the Board of Directors of Resource Capital Corp.
Walter T. Beach, Chairman
Murray S. Levin
P. Sherrill Neff
The following table sets forth certain information concerning the compensation earned for fiscal 2011, 2010 2009 and 20082009 for our NEOs:
SUMMARY COMPENSATION
Name and Principal Position | | | | | | | | | | | | | Option | | | All Other Compen-sation ($)(3) | | | | | | | | | | | | | | | | | All Other Compen-sation ($) (3) | | | | |
| Jonathan Z. Cohen | | 2010 | | | − | | | | − | | | | 999,999 | | | | − | | | | − | | | | 999,999 | | | 2011 | | | − | | | | − | | | | 349,996 | | | | − | | | | 349,996 | |
| Chief Executive Officer, | | 2009 | | | − | | | | − | | | | 299,998 | | | | − | | | | − | | | | 299,998 | | | 2010 | | | − | | | | − | | | | 999,999 | | | | − | | | | 999,999 | |
President and Director | | 2008 | | | − | | | | − | | | | − | | | | − | | | | − | | | | − | | | 2009 | | | − | | | | − | | | | 299,998 | | | | − | | | | 299,998 | |
| | | | | | | | | | | | | | | | | | | | | | | | | | | | | | | | | | | | | | | | | | | | | | | | | |
| David J. Bryant | | 2010 | | | 240,000 | (1) | | | 200,000 | (1) | | | 199,996 | | | | − | | | | 24,993 | | | | 664,990 | | | 2011 | | | 275,000 | (1) | | | 200,000 | (1) | | | − | | | | − | | | | 475,000 | |
| Senior Vice President, | | 2009 | | | 240,000 | (1) | | | 140,000 | (1) | | | 99,996 | | | | − | | | | 24,996 | | | | 504,992 | | | 2010 | | | 240,000 | (1) | | | 200,000 | (1) | | | 199,996 | | | | 24,993 | | | | 664,990 | |
Chief Financial Officer, Chief Accounting Officer and Treasurer | | 2008 | | | 240,000 | (1) | | | 120,000 | (1) | | | 49,999 | | | | − | | | | 15,425 | | | | 425,424 | | | 2009 | | | 240,000 | (1) | | | 140,000 | (1) | | | 99,996 | | | | 24,996 | | | | 504,992 | |
| | | | | | | | | | | | | | | | | | | | | | | | | | | | | | | | | | | | | | | | | | | | | | | | | |
| Jeffrey D. Blomstrom | | 2010 | | | − | | | | − | | | | 599,996 | | | | − | | | | − | | | | 599,996 | | | 2011 | | | − | | | | − | | | | 100,000 | | | | − | | | | 100,000 | |
| Senior Vice President | | 2009 | | | − | | | | − | | | | 74,996 | | | | − | | | | − | | | | 74,996 | | | 2010 | | | − | | | | − | | | | 599,996 | | | | − | | | | 599,996 | |
| | | 2008 | | | − | | | | − | | | | − | | | | − | | | | − | | | | − | | | 2009 | | | − | | | | − | | | | 74,996 | | | | − | | | | 74,996 | |
| | | | | | | | | | | | | | | | | | | | | | | | | | | | | | | | | | | | | | | | | | | | | | | | | |
| David E. Bloom | | 2010 | | | − | | | | − | | | | 199,996 | | | | − | | | | 10,000 | | | | 209,996 | | | 2011 | | | − | | | | − | | | | 125,000 | | | | − | | | | 125,000 | |
| Senior Vice President−, | | 2009 | | | − | | | | − | | | | 99,996 | | | | − | | | | 35,000 | | | | 134,996 | | |
| Senior Vice President− | | | 2010 | | | − | | | | − | | | | 199,996 | | | | 10,000 | | | | 209,996 | |
Real Estate Investments | | 2008 | | | − | | | | − | | | | 151,777 | | | | − | | | | 80,400 | | | | 232,177 | | | 2009 | | | − | | | | − | | | | 99,996 | | | | 35,000 | | | | 134,996 | |
| | | | | | | | | | | | | | | | | | | | | | | | | | | | | | | | | | | | | | | | | | | | | | | | | |
| Jeffrey F. Brotman | | 2010 | | | − | | | | − | | | | 599,996 | | | | − | | | | − | | | | 599,996 | | | 2011 | | | − | | | | − | | | | 199,994 | | | | − | | | | 199,994 | |
| Executive Vice President | | 2009 | | | − | | | | − | | | | 99,996 | | | | − | | | | − | | | | 99,996 | | | 2010 | | | − | | | | − | | | | 599,996 | | | | − | | | | 599,996 | |
| | | 2008 | | | − | | | | − | | | | − | | | | − | | | | − | | | | − | | | 2009 | | | − | | | | − | | | | 99,996 | | | | − | | | | 99,996 | |
| (1) | Mr. Bryant’s salary and bonus were paid by Resource America. We began to reimburse Resource America for Mr. Bryant’s salary and bonus in October 2009. Amounts represent salary and bonus earned for the years indicated, but may not have been paid in full in the respective years. |
| (2) | Grant date fair value, valued in accordance with FASB Accounting Standards Codification Topic 718 as the closing price of our common stock on the grant date. |
| (3) | 2010 amount represents awardand 2009 amounts for Mr. Bryant represent awards of Resource America restricted stock earned during 2010 and 2009, respectively, valued at the closing price of Resource America common stock on the datedates of the grant in February 2010. 2008 amount represents award of options to purchase Resource America2010 and February 2009. Amounts for Mr. Bloom represent dividend equivalent rights on restricted common stock. The grant date fair value is $3.09 per option, using the Black-Scholes option pricing model to estimate the fair valuestock granted, but not yet earned. See “- Elements of each option grantedOur Compensation Program-Supplemental Incentive Arrangements with assumptions for (a) expected dividend yield of 3.4%, (b) risk-free interest rate of 3.8%, (c) expected volatility of 49.5%, and (d) an expected life of 6.3 years.David Bloom.” |
GRANTS OF PLAN-BASED AWARDS TABLE
During 2010,2011, we made restricted stock awards to our NEOs. There were no stock options granted to such officers during 2011. The following table sets forth information with respect to each of these awards on a grant-by-grant basis. Dividends are payable on these awards of our stock, which vest in full three years after the date of grant. Dividends are payable on the Resource America restricted stock, which vests 25% per year over a four year period after issuance.
| | | | All other stock awards: number of shares of stock (#) | | | Grant date fair value of stock awards ($) (1), (2) | |
| Jonathan Cohen | | | | | | | | |
Our restricted stock | | 01/26/11 | | | 138,504 | | | | 999,999 | |
| | | | | | | | | | | |
| David J. Bryant | | | | | | | | | | |
Our restricted stock | | 02/08/11 | | | 27,662 | | | | 199,996 | |
Resource America restricted stock | | 02/07/11 | | | 3,654 | | | | 24,993 | |
| | | | | | | | | | | |
| Jeffrey D. Blomstrom | | | | | | | | | | |
Our restricted stock | | 02/08/11 | | | 82,987 | | | | 599,996 | |
| | | | | | | | | | | |
| David E. Bloom | | | | | | | | | | |
Our restricted stock | | 02/08/11 | | | 27,662 | | | | 199,996 | |
| | | | | | | | | | | |
| Jeffrey F. Brotman | | | | | | | | | | |
Our restricted stock | | 01/26/11 | | | 83,102 | | | | 599,996 | |
| | | | All other stock awards: number of shares of stock (#) | | All other option awards: number of securities underlying options (#) | | Exercise or base price of option awards ($/Sh) | | Grant date fair value of stock and option awards ($)(1) | |
| Jonathan Cohen | | | | | | | | | | | |
Our restricted stock | | 01/22/10 | | | 57,803 | | | | | | | 299,998 | |
| | | | | | | | | | | | | | |
| David J. Bryant | | | | | | | | | | | | | |
Our restricted stock | | 01/22/10 | | | 19,267 | | | | | | | 99,996 | |
Resource America restricted stock | | 02/10/10 | | | 5,980 | | | | | | | 24,996 | |
| | | | | | | | | | | | | | |
| David E. Bloom | | | | | | | | | | | | | |
Our restricted stock | | 01/22/10 | | | 19,267 | | | | | | | 99,996 | |
| (1) | Does not include shares of restricted stock granted in 2012 as compensation earned in fiscal 2011 as follows: Mr. J. Cohen – 62,056 shares; Mr. Blomstrom – 17,452 shares; Mr. Bloom – 21,815 shares; and Mr. Brotman – 35,460 shares. |
| (2) | Based on the closing price of our stock on the respective grant datedates with the exception of Mr. Bryant’s Resource America stock grant, which was valued based on the closing price of Resource America’s stock on the respective grant date. |
OUTSTANDING EQUITY AWARDS AT FISCAL YEAR-END
| | | | | | |
| Name | | Number of Securities Underlying Unexercised Options (#) Exercisable | | | Number of Securities Underlying Unexercised Options (#) Unexercisable | | | Equity Incentive Plan Awards: Number of Securities Underlying Unexercised Unearned Options (#) | | | Option Exercise Price($) | | Option Expiration Date | | Number of Shares or Units of Stock That Have Not Vested (#) | | | Market Value of Shares or Units of Stock That Have Not Vested ($) (1) | | | Equity Incentive Plan Awards: Number of Unearned Shares, Units or Other Rights That Have Not Vested (#) | | | Equity Incentive Plan Awards: Market or Payout Value of Unearned Shares, Units or Other Rights That Have Not Vested ($) (1) | |
| | | | | | | | | | | | | | | | | | | | | | | | | | |
| Jonathan Z. Cohen | | | 100,000 | | | | − | | | | − | | | | 15.00 | | 03/07/15 | | | 57,803 | | | | 426,586 | | | | − | | | | − | |
| | | | | | | | | | | | | | | | | | | | | | | | | | | | | | | | | | |
| David J. Bryant | | | 10,000 | | | | − | | | | − | | | | 15.00 | | 03/07/15 | | | 23,763 | | | | 175,371 | | | | − | | | | − | |
| | | | − | | | | 5,000 | (2) | | | | | | | 8.14 | | 05/21/18 | | | 6,100 | (3) | | | 41,846 | (3) | | | − | | | | − | |
| | | | | | | | | | | | | | | | | | | | | | | | | | | | | | | | | | |
| David E. Bloom | | | 100,000 | | | | − | | | | − | | | | 15.00 | | 03/07/15 | | | 67,561 | | | | 498,600 | | | | − | | | | − | |
| ● | Restricted stock awards; |
| ● | Resource America restricted stock awards. |
The following table sets forth information with respect to each of these awards on an award-by-award basis.
| | | | | | |
| Name | | Number of Securities Underlying Unexercised Options (#) Exercisable | | | Number of Securities Underlying Unexercised Options (#) Unexercisable | | | Option Exercise Price($) | | Option Expiration Date | | Number of Shares or Units of Stock That Have Not Vested (#) (5) | | | Market Value of Shares or Units of Stock That Have Not Vested ($) (1) | |
| | | | | | | | | | | | | | | | | |
| Jonathan Z. Cohen | | | 100,000 | | | | − | | | | 15.00 | | 03/07/15 | | | 177,040 | | | | 993,194 | |
| | | | | | | | | | | | | | | | | | | | | | |
| David J. Bryant | | | 10,000 | | | | − | | | | 15.00 | | 03/07/15 | | | 40,507 | | | | 227,244 | |
| | | | 3,750 | | | | 1,250 | (2) | | | 8.14 | | 05/21/18 | | | 8,139 | (3) | | | 37,928 | (4) |
| | | | | | | | | | | | | | | | | | | | | | |
| Jeffrey D. Blomstrom | | | 10,000 | | | | − | | | | 15.00 | | 03/07/15 | | | 92,621 | | | | 519,604 | |
| | | | | | | | | | | | | | | | | | | | | | |
| David E. Bloom | | | 100,000 | | | | − | | | | 15.00 | | 03/07/15 | | | 40,507 | | | | 227,244 | |
| | | | | | | | | | | | | | | | | | | | | | |
| Jeffrey F. Brotman | | | − | | | | − | | | | N/A | | N/A | | | 95,947 | | | | 538,263 | |
| (1) | Based on the closing price of our common stock $7.38 on December 31, 2010.30, 2011 of $5.61. |
| (2) | Represents options to purchase shares of Resource America common stock that vest ¼25% on each anniversary date through May 21, 2012. |
| (3) | Represents shares of Resource America common stock. |
| (4) | Based upon a price of $6.86, the closing price of Resource America’s common stock on December 31, 2010.30, 2011 of $4.66. |
| (5) | Includes shares of our restricted stock that vest in 2012, 2013 and 2014, respectively as follows: Mr. J. Cohen – 19,267 shares, 19,269 shares and 138,504 shares; Mr. Bryant – 6,422 shares, 6,423 shares and 27,662 shares; Mr. Blomstrom – 4,816 shares, 4,818 shares and 82,987 shares; Mr. Bloom – 6,422 shares, 6,423 shares and 27,662 shares; and Mr. Brotman – 6,422 shares, 6,423 shares and 83,102 shares. |
2010
2011 OPTION EXERCISES AND STOCK VESTED
| | | | |
| | Number of Shares Acquired on Vesting (#) | | | Value Realized on Vesting ($) (1) | |
| Jonathan Z. Cohen | | | 7,265 | | | | 36,688 | |
| | | | | | | | | |
| David J. Bryant (our stock) | | | 28,211 | | | | 170,934 | |
(Resource America stock) | | | 460 | | | | 2,197 | |
| | | | | | | | | |
| David E. Bloom | | | 36,766 | | | | 220,140 | |
| | | | |
| | Number of Shares Acquired on Vesting (#) | | | Value Realized on Vesting ($) (1) | |
| Jonathan Z. Cohen | | | 19,267 | | | | 135,832 | |
| | | | | | | | | |
| David J. Bryant (our stock) | | | 10,918 | | | | 78,546 | |
(Resource America stock) | | | 1,615 | | | | 10,570 | |
| | | | | | | | | |
| Jeffrey D. Blomstrom | | | 8,413 | | | | 60,571 | |
| | | | | | | | | |
| David E. Bloom | | | 54,716 | | | | 395,931 | |
| | | | | | | | | |
| Jeffrey F. Brotman | | | 6,422 | | | | 45,275 | |
| (1) | Represents the per share market value of ourthe respective common stock on the vesting datedates multiplied by the number of shares vesting. |
Director Compensation
We compensate only independent directors for their services as directors; however, we reimburse Resource America for all of the wages, salary and benefits established and paid by Resource America to our Chairman of the Board. In fiscal 2011, we reimbursed Resource America $378,000 for Mr. Kessler’s compensation and related business expenses, since Resource America employs Mr. Kessler; Mr. Kessler, however, is dedicated exclusively to his service as our Chairman. In addition, in January 2011, we awarded Mr. Kessler 13,850 shares of restricted stock with a grant date fair value of approximately $100,000. Mr. Kessler had 8,221 shares vest in 2011 and realized $58,588 upon vesting. Our 2011 compensation package for independent directors was comprised of cash (annual retainer) and restricted stock awards. The annual pay package is designed to attract and retain highly-qualified, independent professionals to represent our stockholders. Our compensation package is also designed to create alignment between our directors and our stockholders through the use of equity-based grants.
For 2011, the Board approved compensation for each independent director consisting of an annual cash retainer of $52,500 and an annual stock award valued at $22,500 on the date of grant on the anniversary of the date each of them became a director. The following table sets forth director compensation for each of our independent directors and the Chairman of our Board of Directors for 2010.2011:
| | Fees Earned or Paid in Cash ($) | | | | | | Fees Earned or Paid in Cash ($) | | | | | | | |
| Walter T. Beach | | 52,500 | | 22,498 | | 74,998 | | | 52,500 | | | | 22,499 | | | | 74,999 | |
| William B. Hart | | 52,500 | | 22,498 | | 74,998 | | | 52,500 | | | | 22,499 | | | | 74,999 | |
| Murray S. Levin | | 52,500 | | 22,498 | | 74,998 | | | 52,500 | | | | 22,499 | | | | 74,999 | |
| P Sherrill Neff | | 52,500 | | 22,498 | | 74,998 | |
| P. Sherrill Neff | | | | 52,500 | | | | 22,499 | | | | 74,999 | |
| Gary Ickowicz | | 52,500 | | 22,497 | | 74,997 | | | 52,500 | | | | 22,495 | | | | 74,995 | |
| Edward E. Cohen | | − | | − | | − | | | − | | | | − | | | | − | |
Steven J. Kessler (3) | | − | | 99,996 | | 99,996 | | | 378,000 | | | | 99,997 | | | | 477,997 | |
| (1) | Table excludes Mr. J. Cohen, an NEO, whose compensation is set forth in the Summary Compensation Table. |
| (2) | On March 8, 2010,2011, Messrs. Beach, Hart, Levin and Neff, were each granted 3,2143,020 shares based upon a price of $7.00,$7.45, the closing price on that day. On February 1, 2010,2011, Mr. Ickowicz was granted 4,0833,120 shares based upon a price of $5.51,$7.21, the closing price on that day. |
(3) | We do not compensate our non-independent directors for their service on our Board. However, in fiscal 2010, we reimbursed RAI $323,000 for Mr. Kessler’s compensation and related business expenses, since Resource America employs Mr. Kessler but he devotes substantially all of his business time to his service as our Chairman. In addition, Mr. Kessler received a stock award from the Company valued at approximately $100,000 in January 2010. |
Compensation Committee Interlocks and Insider Participation
The compensation committee of the board during 20102011 consisted of Messrs. Beach, Levin and Neff. None of such persons was an officer or employee during 2011, or former officer or employee, of our company or any of its subsidiaries during 2010.subsidiaries. None of our executive officers was a director or executive officer of any entity of which any member of the compensation committee was a director or executive officer during 2010.2011.
| ITEM 12. | | SECURITY OWNERSHIP OF CERTAIN BENEFICIAL OWNERS AND |
| | MANAGEMENT AND RELATED STOCKHOLDERS MATTERS |
The following table sets forth the number and percentage of shares of common stock owned, as of March 8, 2011,2012, by (a) each person who, to our knowledge, is the beneficial owner of more than 5% of the outstanding shares of common stock, (b) each of our present directors, (c) each of our executive officers and (d) all of our named executive officers and directors as a group. This information is reported in accordance with the beneficial ownership rules of the Securities and Exchange Commission under which a person is deemed to be the beneficial owner of a security if that person has or shares voting power or investment power with respect to such security or has the right to acquire such ownership within 60 days. Shares of common stock issuable pursuant to options or warrants are deemed to be outstanding for purposes of computing the percentage of the person or group holding such options or warrants but are not deemed to be outstanding for purposes of computing the percentage of any other person.
| | | Shares beneficially owned | | | | | |
Executive officers and directors: (2) | | | | | | | | | | | | |
Walter T. Beach (4) (5) | | | 1,049,032 | | | | 1.80 | % | | | 385,931 | | | | * | |
Edward E. Cohen (3) | | | 574,120 | | | | * | | |
| Edward E. Cohen | | | | 574,120 | | | | * | |
Jonathan Z. Cohen (3) | | | 933,163 | | | | 1.60 | % | | | 995,219 | | | | 1.20 | % |
William B. Hart (5) | | | 34,416 | | | | * | | | | 38,335 | | | | * | |
Gary Ickowicz (5) | | | 16,996 | | | | * | | | | 20,829 | | | | * | |
Steven J. Kessler (3) | | | 98,919 | | | | * | | | | 133,865 | | | | * | |
Murray S. Levin (5) | | | 28,416 | | | | * | | | | 32,335 | | | | * | |
P. Sherrill Neff (5) | | | 34,416 | | | | * | | | | 38,335 | | | | * | |
| | | | | | | | | | | | | | | | | |
Jeffrey D. Blomstrom (3) | | | 119,263 | | | | * | | | | 136,715 | | | | * | |
David E. Bloom (3) | | | 248,024 | | | | * | | | | 262,296 | | | | * | |
Jeffrey F. Brotman (3) | | | 102,369 | | | | * | | | | 137,829 | | | | * | |
David J. Bryant (3) | | | 104,460 | | | | * | | | | 105,460 | | | | * | |
| All executive officers and directors as a group (12 persons) | | | 3,343,594 | | | | 5.72 | % | | | 2,861,269 | | | | 3.43 | % |
* Less than 1%.
| (1) | Includes 255,000 shares of common stock issuable upon exercise of stock options. |
| (2) | The address for all of our executive officers and directors is c/o Resource Capital Corp., 712 Fifth Avenue, 12th Floor, New York, New York 10019. |
| (3) | Includes unvested restricted stock awards granted to certain officers and directors as follows: (i) on December 26, 2007: 60,000 shares to Mr. Bloom; 15% of these shares vested on each of June 30, 2008 and June 30, 2009 and 70% vested on March 9, 2011; (ii) on January 14, 2008: Mr. Blomstrom – 10,78722,270 shares; Mr. Bloom – 18,87828,238 shares; Mr. Brotman – 41,883 shares; Mr. Bryant – 13,4846,423 shares; Mr. E.J. Cohen – 10,78781,325 shares; and Mr. Kessler – 5,39315,288 shares; all of these shares vest 33.33%33.3% per year; (iii) on January 22, 2010: Mr. Blomstrom – 14,450 shares, Mr. Bloom – 19,267 shares; Mr. Brotman – 19,267 shares; Mr. Bryant – 19,267 shares; Mr. J. Cohen – 57,803 shares; and Mr. Kessler – 19,267 shares; all these shares vest 33.33% per year; (iv) on January 26, 2011;(ii) Mr. Brotman – 83,102 shares; Mr. J. Cohen – 138,504 shares,shares; and Mr. Kessler – 13,850 shares; and (v)all of these shares vest in full on February 8, 2011;January 26, 2014; (iii) Mr. Blomstrom – 82,987 shares; Mr. Bloom – 27,662 shares; and Mr. Bryant – 27,662 shares; all of these shares vest 100% in three years..full on February 8, 2014. Each such person has the right to receive distributions on and vote, but not to transfer, all such shares. |
| (4) | Includes (i) 1,013,478346,459 shares purchased by Beach Asset Management, LLC, Beach Investment Counsel, Inc. and/or Beach Investment Management, LLC, investment management firms for which Mr. Beach is a principal for themselves or accounts managed by them and for which Mr. Beach possesses investment and/or voting power over the shares.power. The address for these investment management firms is Five Tower Bridge, 300 Barr Harbor Drive, Suite 220, West Conshohocken, Pennsylvania 19428. |
| (5) | Includes (i) 3,0203,919 shares of restricted stock issued to each of Messrs Beach, Hart, Levin and Neff on March 8, 20112012 which vest on March 8, 2012;2013; and (ii) 3,1203,833 shares of restricted stock issued to Mr. Ickowicz on February 1, 2011,2012, which vest on February 1, 2012.2013. Each non-employee director has the right to receive distributions on and vote, but not to transfer, such shares. |
Equity Compensation Plan Information
The following table summarizes certain information about our 2005 Stock Incentive Plan and Amended and Restated 2007 Omnibus Equity Compensation Plan as of December 31, 20102011.
| | (a) | (b) | (c) | (a) | (b) | (c) |
| Plan category | Number of securities to be issued upon exercise of outstanding options, warrants and rights | Weighted-average exercise price of outstanding options, warrants and rights | Number of securities remaining available for future issuance under equity compensation plans excluding securities reflected in column (a) | Number of securities to be issued upon exercise of outstanding options, warrants and rights | Weighted-average exercise price of outstanding options, warrants and rights | Number of securities remaining available for future issuance under equity compensation plans excluding securities reflected in column (a) |
Equity compensation plans approved by security holders: | | | | | | |
| Options | 602,666 | $ 14.99 | | 641,666 | $ 14.45 | |
| Restricted stock | | 1,428,931 | N/A | |
Total | 1,137,623 | | 1,237,789 (1) (2) | 2,070,597 | | 3,476,226 (1) |
| (1) | Upon the July 2006 hiring of certain significant employees of the Manager, we agreed to pay up to 100,000 shares of restricted stock and 100,000 options to purchase restricted stock upon the achievement of certain performance thresholds, the first of which was met in June 2007 and, as a result, 60,000 shares of restricted stock and 60,000 options to purchase restricted stock were issued at that time. As of December 31, 2010, 40,000 shares of restricted stock and 40,000 options to purchase restricted stock are unissued. These shares and options to purchase restricted stock, which have been reserved for future issuance under the plans, have been deducted from the number of securities remaining available for future issuance. See Item 8, “Financial Statements and Supplementary Data” at Note 12 for a more detailed discussion. |
(2) | We agreed to award certain personnel up to 132,683336,000 shares of restricted stock upon the achievement of certain performance thresholds. During the year ended December 31, 2010, 95,183 of those shares were forfeited. The remaining 37,500 shares, which have been reserved for future issuance under the plans, have not been deducted from the number of securities remaining available for future issuance. |
| ITEM 13. | | CERTAIN RELATIONSHIPS AND RELATED TRANSACTIONS |
| | AND DIRECTOR INDEPENDENCE |
Relationships and Related Transactions
Relationship with Resource America and Certain of its Subsidiaries. Resource America, entities affiliated with it and our executive officers and directors collectively beneficially own 5,385,499 shares of common stock, representing approximately 6.5% of our common stock on a fully-diluted basis. Our executive officers are also officers of our Manager and/or of Resource America or its subsidiaries.
We have entered into a management agreement under which the Manager receives substantial fees. We describe these fees in Item 1 − “Business − Management Agreement.” For the year ended December 31, 2010,2011, Resource Capital Manager, or the Manager, earned base management fees of approximately $5.4$7.0 million and incentive compensationmanagement fees of $4.4$1.7 million (including $1.1 million$430,000 paid in the form of 182,66075,746 shares of common stock). We also reimburse the Manager for financial services expense, rent and other expenses incurred in the performance of its duties under the management agreement. Pursuant to an amendment to the management agreement on October 16, 2009, the Manager must provide us with a Chief Financial Officer and three accounting professionals, each of whom will be exclusively dedicated to our operations. The Manager will also provide us with a director of investor relations who will be 50% dedicated to our operations. The amendment provides that we will bear 100% of the expense of the wages, salaries and benefits of the Chairman, Chief Financial Officer and three accounting professionals and 50% of the salary and benefits of the director of investor relations. For the years ended December 31, 2010 and 2009, we paid aggregate reimbursements to the Manager of $1.8 million and $664,000, respectively. In addition, we are required to reimburse the Manager and Resource America for expenses forand employees of Resource America who perform legal, accounting, due diligence and other services that outside professionals or consultants would otherwise perform. No suchOn October 16, 2009, we entered into an amendment of the Management Agreement. Pursuant to the amendment, the Manager must provide us with a Chief Financial Officer and several accounting professionals, each of whom will be exclusively dedicated to our operations. The Manager must also provide us with a director of investor relations who will be 50% dedicated to our operations. We bear the expense reimbursements were madeof the wages, salaries and benefits of the Chief Financial Officer and several accounting professionals and 50% of the salary and benefits of the director of investor relations. In addition, in February 2010, we began reimbursing the Manager for the wages, salary, and benefits of our Chairman of the Board, who is exclusively dedicated to our operations. For the year ended December 31, 2010. 2011, we paid the Manager $2.5 million.
On November 24, 2010, we entered into an Investment Management Agreement with Resource Capital Markets, Inc., or RCM, a wholly-owned subsidiary of Resource America. The agreement provides that: (a) RCM may invest up to $13.0 million of our funds, with the investable amount being adjusted by portfolio gains and losses and collections, and offset by expenses, taxes and realized management fees, and (b) RCM can earn a management fee in any year that the net profits earned exceed a preferred return. The management fee is 20% of the amount by which the net profits exceed the preferred return. During the year ended December 31, 2011, RCM earned $1.9 million in management fees. We have reinvested gains from its activity and hold $38.7 million in fair market value of trading securities as of December 31, 2011. In addition, we and RCM have established an escrow account that allocates the net profit or net losses of the portfolio on a yearly basis based on the net asset value of the account. During the year ended December 31, 2011, RCM earned $444,000 as its share of the net profits as defined in the Investment Management Agreement.
At December 31, 2011, we were indebted to the Manager for base management fees of $625,000 and incentive management fees to a subsidiary of the Manager under our investment management agreement of $1.9 million and expense reimbursements of $272,000. At December 31, 2010, we were indebted to the Manager for base management fees of $522,000, incentive management fees of $131,000, incentive management fees to a subsidiary of the Manager under our investment management agreement of $1.0 million and expense reimbursements of $256,000.
As of December 31, 2011 and 2010, we had executed seven and six CDO transactions, respectively, which were structured for us by the Manager. The Manager was not separately compensated by us for executing these transactions and is not separately compensated by us for managing the CDO entities and their assets.
Relationship with LEAF Financial. On January 4, 2011, our wholly-owned subsidiary, Resource America, entities affiliated with itTRS, made a preferred investment in LCC, a newly-formed equipment financing subsidiary of LEAF Financial. Resource TRS contributed initial capital of approximately $26.2 million to LCC in the form of approximately $5.2 million in cash, and our executive officersall of its interest in LEAF Receivables Funding 3, a wholly-owned subsidiary of Resource TRS, which held a portfolio of equipment, equipment leases and directors collectively beneficially own 5,788,415notes. As part of the transaction, LEAF Financial contributed its assets relating to its equipment lease and note origination, servicing and finance business to LCC. Also, senior management personnel of LEAF Financial contributed capital to LCC in the form of all of the shares of common stock representing approximatelythey owned in LEAF Financial in exchange for 10% of ourthe shares of LCC common stock on a fully-diluted basis. Our executive officers are also officersThe foregoing capital investments in LCC were made pursuant to a Transfer and Contribution Agreement, or TCA, among the registrant, LEAF Financial, LCC, Resource TRS and the Management Parties.
Pursuant to the TCA, in return for Resource TRS’s capital investments, LCC issued to Resource TRS 2,626,783 shares of LCC Series A preferred stock and warrants to purchase 4,800 shares of LCC common stock for an exercise price of $0.01 per share. The shares receivable upon exercise of the warrants represent 48% of LCC’s common stock on a fully-diluted basis. The investment is classified as securities available-for-sale on our Manager and/or of Resource America or its subsidiaries.consolidated balance sheet.
LEAF Financial Corp.As set forth in the TCA, on January 4, 2011, Resource TRS also delivered to LCC a majority-owned subsidiaryShare Purchase Agreement under which LCC was permitted to require Resource TRS to purchase up to an additional $10.0 million of Resource America, originates and manages our equipment lease and note investments. We purchase these investments from LEAF Financial at a price equal to their book value plus a reimbursable origination cost not to exceed 1% to compensate LEAF Financial for its origination costs. In addition, we pay LEAF Financial an annual servicing fee, equal to 1%Series A preferred stock, of which all $10.0 million was purchased during the book valuesecond quarter of managed assets, for servicing our equipment lease investments. During the year ended December 31, 2010, we paid LEAF Financial Corp. $87,000 in annual servicing fees.2011.
On May 27, 2010,July 20, 2011, we closedprovided a $120.0$10.0 million securitization addingloan to our existing lease receivables.LCC, of which the total amount was funded as of November 4, 2011. The securitization, LEAF Funding 3, issued equipment-backed securitized notesloan matures on January 20, 2013 and bears interest at a weighted average discounted pricefixed rate of 93.6%. At closing, $14.48.0% per annum on the unpaid principal balance, payable quarterly. In the event of default, interest will accrue and be payable at a rate of 5.0% in excess of the fixed rate. The loan is secured by all the assets of LEAF Capital Funding, LCC and LEAF Financial’s interest in LEAF Receivables Funding 3. On November 16, 2011, LLC used $8.5 million of proceeds were placed intothe $11.2 million they received from a restricted account. Asstock purchase agreement transaction to repay $8.4 million in principal plus all outstanding accrued interest on the loan, representing approximately 85% of September 30, 2010, all proceeds relatedthe outstanding indebtedness owed to us. Both parties agreed that the commitment have been funded. We had $21.0 million of equity investedloan was considered paid in LEAF Funding 3full as of December 31, 2010.2011. Accordingly, we recorded a charge to Additional Paid-In Capital to eliminate the remaining debt of $1.6 million.
On November 16, 2011, we, together with LEAF Financial and LCC, subsidiaries of Resource America, entered into a stock purchase agreement and related agreements, which we refer to collectively as the SPA, with Eos Partners, L.P., or Eos, a private investment firm, and its affiliates. In exchange for our prior interest in LCC, we received 31,341 shares of Series A Preferred Stock, 4,872 shares of newly issued 8% Series B Redeemable Preferred Stock (the “Series B Preferred Stock”) and 2,364 shares of newly issued Series D Redeemable Preferred Stock (the “Series D Preferred Stock”), collectively representing, on a fully-diluted basis, a 26.7% interest in LCC. Our investment in LEAF was valued at $36.3 million based on a third-party valuation. Accordingly, we recorded a loss of $2.2 million in conjunction with the transaction.
On November 24, 2010,In accordance with the SPA, we entered into an Investment Management Agreement with Resource Capital Markets, Inc. (“RCM”), a wholly-owned subsidiary ofand Resource America which encompassedhave undertaken a contingent obligation with respect to the following: (a) RCM may invest up to $5.0 million andvalue of the investable amount may be adjusted by portfolio gains/losses, collections and offset by expenses, taxes and realized management fees, and (b) RCM can earn a management fee in any yearequity on the balance sheet of LEAF Receivables Funding 3. To the extent that the net profits earned exceed the preferred return, the fee basis is 20%value of the amountequity on the balance sheet of LEAF Receivables Funding 3 is less than approximately $18.7 million (the value of the net profits exceedequity of LEAF Receivables Funding 3 on the preferred returns. During the year ended December 31, 2010, RCM earned $1.5 million in management fees associated with realized profits and $1.9 million in management fees associated with unrealized profits. RCM commenced trading in June 2010 in these privately issued securities through our TRS upon the conceptual approvaldate it was contributed to LCC), as of the investment by our Board. We have since reinvested gains from this activity and hold $17.7 million of these trading securities, at fair market value asfinal testing date within 90 days of December 31, 2010. In addition,2013, we and Resource America have established an escrow accountagreed to be jointly and severally obligated to contribute cash to LCC to make up the deficit. We do not believe it is probable or estimable that we will be required to fund LCC in accordance with RCM that allocates the net profit or net losses of the portfolio on a yearly basis based on the net asset value of the account established by Resource TRS. This account provides an additional incentiveSPA.
On March 5, 2010, we entered into agreements with LEASELease Equity Appreciation Fund II, LP (“L.P., or LEAF II”), that provideII, pursuant to which we provided an $8.0 million credit facility to LEAF II, of which all $8.0 million was funded on March 31, 2010, forhas been funded. The credit facility had a one year term at 12% per year, payable quarterly, with a 1% loan origination fee which isand was secured by all the assets of LEAF II Receivables Funding, LLC, including its entire ownership interest in LEAF II Receivables Funding, LLC.II. We received a 1% origination fee in connection with the establishment of the facility. The notefacility originally matured on March 3, 2011 but has beenand was extended until JuneSeptember 3, 2011 with a 1% extension fee paid on the current outstanding loan balance. On June 3, 2011, we entered into an amendment to extend the maturity to February 15, 2012 and decrease the interest rate from 12% to 10% per annum resulting in a troubled-debt restructuring under current accounting guidance. On February 15, 2012, the note was further amended to extend the maturity to February 15, 2013 with a 1% extension fee accrued and added to the amount outstanding. The loan amount outstanding at December 31, 20102011 was $7.9$7.8 million.
Relationship with Apidos Capital Management. On February 24, 2011, one of our subsidiaries purchased 100% of the ownership interests in Churchill Pacific Asset Management LLC, or CPAM, from Churchill Financial Holdings LLC for $22.5 million. Through CPAM, we are entitled to collect senior, subordinated and incentive fees related to five CLO issuers totaling approximately $1.9 billion in assets managed by CPAM. CPAM is assisted by Apidos Capital Management in managing the five CLOs. CPAM subsequently changed its name to Resource Capital Asset Management. Apidos Capital Management is entitled to 10% of all subordinated fees and 50% of the incentive fees received by Resource Capital Asset Management. For the period from acquisition through December 31, 2011, Apidos Capital Management was paid $1.0 million from subordinated fees received.
(Backpurchase Whispertree Apartments, a multi-family apartment building, for $18.1 million. Resource Real Estate Management, LLC, or RREM, a subsidiary of Resource America, was appointed as asset manager. RREM performs lease review and approval, debt service collection, loan workout, foreclosure, disposition and/or entitlements and permitting, as applicable. RREM is also responsible for engaging third parties to Index)perform day-to-day property management, property leasing, rent collection, maintenance, and capital improvements. RREM is entitled to a monthly asset management fee equal to the greater of 4.0% of the gross receipts generated from the property or $12,600. As of December 31, 2011, we had paid RREM fees of $63,000.
On June 21, 2011, we entered into a joint venture with an unaffiliated third-party to form SLH Partners, L.P. to purchase a defaulted promissory note secured by a mortgage on a multi-family apartment building. We purchased a 10% equity interest in the venture and also loaned SLH Partners $7.0 million to finance the project secured by the first mortgage lien on the property. We received a commitment fee equal to 1.0% of the loan amount at the commencement of the loan. The loan matures on September 21, 2012 and bears interest at a fixed rate of 10.0% per annum on the unpaid principal balance, payable monthly. In the event of default, interest will accrue and be payable at a rate of 5.0% in excess of the fixed rate. RREM was appointed as asset manager of the venture. RREM performs lease review and approval, debt service collection, loan workout, foreclosure, disposition and/or entitlements and permitting, as applicable. RREM is also responsible for engaging third parties to perform day-to-day property management, property leasing, rent collection, maintenance, and capital improvements. RREM receives an annual asset management fee equal to 2.0% of the gross receipts generated from the property.
On January 15, 2010, we loaned $2.0 million to Resource Capital Partners, Inc., or RCP, a wholly-owned subsidiary of Resource America, so that it could acquire a 5.0% limited partnership interest in Resource Real Estate Opportunity Fund, L.P., or RRE Opportunity Fund. RCP is the general partner of the RRE Opportunity Fund. The loan is secured by Resource Capital Partner’sRCP’s partnership interest in the Resource Real EstateRRE Opportunity Fund, L.P.Fund. The promissory note bears interest at a fixed rate of 8.0% per annum on the unpaid principal balance. In the event of default, interest will accrue and be payable at a rate of 5.0% in excess of the fixed rate. Interest is payable quarterly. Mandatory principal payments must also be made to the extent distributable cash or other proceeds from the partnership representsrepresent a return of Resource Capital Partners, Inc.’sRCP’s capital. The loan matures on January 14, 2015, with Resource Capital Partners, Inc. havingand RCP has options to extend the loan for two additional 12-month periods each.periods. Principal payments of $262,000 were made during the year ended December 31, 2011. The loan balance was $1.7 million at December 31, 2011.
Until 1996, director Edward E. Cohen,On December 1, 2009, we purchased a director who wasmembership interest in RRE VIP Borrower, LLC (an unconsolidated VIE that holds our Chairmaninterests in a real estate joint venture) from our inception until November 2009, wasResource America at book value. This joint venture, which is structured as a credit facility with Värde Investment Partners, LP acting as lender, finances the acquisition of counseldistressed properties and mortgage loans and has the objective of repositioning both the directly-owned properties and the properties underlying the mortgage loans to Ledgewood, P.C.,enhance their value. We acquired the membership interests for $2.1 million. The agreement requires us to contribute 3% to 5% (depending on the asset agreement) of the total funding required for each asset acquisition on a law firm. In addition, onemonthly basis. RREM acts as asset manager of our executive officers, Jeffrey F. Brotman, was employed by Ledgewood until 2007.the venture and receives a monthly asset management fee equal to 1% of the combined investment calculated as of the last calendar day of the month. For the year ended December 31, 2010,2011, we paid RREM management fees of $34,000. The investment balance of $3.6 million at December 31, 2011 is recorded as an investment in unconsolidated entities on our consolidated balance sheet using the equity method.
On August 9, 2006, our subsidiary, RCC Real Estate, originated a loan to Lynnfield Place, a multi-family apartment property, in the amount of $22.4 million. The loan was then purchased by RREF CDO 2006-1. The loan, which matures on May 9, 2018, carries an interest rate of LIBOR plus a spread of 3.50% with a LIBOR floor of 2.50%. On June 14, 2011, RCC Real Estate converted a loan collateralized by a multi-family building to an equity position. The loan was kept outstanding and continues to be used as collateral in RREF CDO 2006-1. RREM was appointed as asset manager as of August 1, 2011. RREM performs lease review and approval, debt service collection, loan workout, foreclosure, disposition and/or entitlements and permitting, as applicable. RREM is also responsible for engaging third parties to perform day-to-day property management, property leasing, rent collection, maintenance, and capital improvements. RREM is entitled to a monthly asset management fee equal to 4.0% of the gross receipts generated from the property. For the year ended December 31, 2011, we paid RREM management fees of $63,000.
Relationship with The Bancorp. The Bancorp, Inc. (Nasdaq: TBBK), or TBBK, is a bank holding company that was organized in 2000 with Resource America’s participation. Mr. Daniel G. Cohen, or Mr. D. Cohen, is the chairman of the board and Mrs. Betsy Z. Cohen, or Mrs. B. Cohen, is the Chief Executive Officer of TBBK and its subsidiary bank. Mrs. B. Cohen is the wife of Mr. E. Cohen, and Mr. E. Cohen and Mrs. B. Cohen are the parents of Messrs. J. Cohen and D. Cohen. On March 14, 2011, we paid TBBK a loan commitment fee in the amount of $31,500 in connection with Bancorp’s commitment to establish a certain credit facility for our benefit. On July 7, 2011, we and RCC Real Estate entered into a $10.0 million revolving credit facility with TBBK. The facility will provide bridge financing for up to five business days which will enable us and RCC Real Estate to fund real estate loans to third parties prior to their sale to the our CRE CDOs. The facility is evidenced by a Revolving Judgment Note and Security Agreement by and among the borrowers and TBBK entered into July 7, 2011. The facility is secured by a pledge of $32.9 million of the Class A-1 notes of RREF CDO 2006-1 that are owned by RCC Real Estate. The note becomes due and payable on September 30, 2012.
Relationship with Law Firm.Ledgewood $311,000 foris a law firm that has provided legal services.services to us since 1991. Mr. Edward E. Cohen, who was of counsel to Ledgewood until April 1996, receives certain debt service payments from Ledgewood related to the termination of his affiliation with the firmLedgewood and its redemption of his interest in the firm. ForFrom 1995 until March 2006, Mr. Jeffrey F. Brotman was the year ended December 31, 2010, those payments were $50,000.managing member of Ledgewood. Mr. Brotman also receives certain debt serviceremained of counsel to Ledgewood through June 2007, at which time he became an Executive Vice President. In connection with his separation, Mr. Brotman will receive payments from Ledgewood related to the termination of his affiliation with the firm. For the year ended December 31, 2010, those payments were $5,000.through 2012.
Policies and Procedures Regarding Related Transactions
Under our Management Agreement with the Manager and Resource America, we have established policies regarding the offer of potential investments to us, our acquisition of those investments and the allocation of those investments among other programs managed by the Manager or Resource America. We have also established policies regarding investing in investment opportunities in which the Manager or Resource America has an interest and regarding investing in any investment fund or CDO structured, co-structured or managed by the Manager or Resource America.
The Manager and Resource America must offer us the right to consider all investments they identify that are within the parameters of our investment strategies and policies. For all potential investments other than in equipment leases and notes, ifIf the Manager and Resource America identify an investment that is appropriate both for us and for one or more other investment programs managed by them, but the amount available is less than the amount sought by all of their investment programs, they will allocate the investment among us and such other investment programs in proportion to the relative amounts of the investment sought by each. If the portion of the investment allocable to a particular investment program would be too small for it to be appropriate for that investment program, either because of economic or market inefficiency, regulatory constraints (such as REIT qualification or exclusion from regulation under the Investment Company Act) or otherwise, that portion will be reallocated among the other investment programs. Investment programs that do not receive an allocation will have preference in future investments where investment programs are seeking more of the investment than is available so that, on an overall basis, each investment program is treated equitably.
To equitably allocate investments that the Manager or Resource America has acquired at varying prices, the Manager and Resource America will allocate the investment so that each investment program will pay approximately the same average price.
With respect to equipment leases and notes, if an investment is appropriate for more than one investment program, including us, the Manager and Resource America will allocate the investment based on the following factors:
| ●
| which investment program has been seeking investments for the longest period of time; |
| ●
| whether the investment program has the cash required for the investment; |
| ●
| whether the amount of debt to be incurred with respect to the investment is acceptable for the investment program; |
| ●
| the effect the investment will have on the investment program’s cash flow; |
| ●
| whether the investment would further diversify, or unduly concentrate, the investment program’s investments in a particular lessee, class or type of equipment, location or industry; and |
| ●
| whether the term of the investment is within the term of the investment program. |
The Manager and Resource America may make exceptions to these general policies when other circumstances make application of the policies inequitable or uneconomic.
The Manager has also instituted policies designed to mitigate potential conflicts of interest between it and us, including:
| | ● | We will not be permitted to invest in any investment fund or CDO structured, co-structured or managed by the Manager or Resource America other than those structured, co-structured or managed on our behalf. The Manager and Resource America will not receive duplicate management fees from any such investment fund or CDO to the extent we invest in it. |
| | ● | We will not be permitted to purchase investments from, or sell investments to, the Manager or Resource America, except that we may purchase investments that have been originated by those entitiesthe Manager or Resource America within 60 days before our investment. |
| ● | Any transactions between entities managed by the Manager or Resource America and us must be approved by a majority of our independent directors. |
Except as described above or provided for in our management agreement with the Manager and Resource America, we have not adopted a policy that expressly prohibits transactions between us or any of our directors, officers, employees, security-holders or affiliates. However, our code of business conduct and ethics prohibits any transaction that involves an actual or potential conflict except for transactions permitted under guidelines which may be adopted by our Board of Directors. No such guidelines have been adopted as of the date of this report. In addition, our Board of Directors may approve a waiver of the code of ethics and business conduct for a specific transaction, which must be reported to our stockholders to the extent required by applicable law or NYSE rule. No such waivers have been granted through the date hereof.
Director Independence
Our common stock is listed on the NYSE under the symbol “RSO” and as a result, we are subject to itsthe NYSE’s listing standards. The board of directorsBoard has determined that each of Messrs. Beach, Hart, Ickowicz, Levin and Neff each satisfy the requirement for independence set out in Section 303A.02 of the rules of the NYSE and that each of these directors has no material relationship with us (other than being a director and/or a stockholder). There are no directors who are not independent who serve on the compensation, nominating, or audit committees of our board of directors. There are no directors who are not independent within applicable NYSE rules who serve on the compensation, nominating or audit committees of our board of directors. In making its independence determinations, the board of directorsBoard sought to identify and analyze all of the facts and circumstances relating to any relationship between a director, his immediate family or affiliates and our company and our affiliates and did not rely on categorical standards other than those contained in the NYSE rule referenced above.rules.
Audit Fees
The aggregate fees billed by our independent auditors, Grant Thornton LLP, for professional services rendered for the audit of our annual financial statements for the years ended December 31, 20102011 and 20092010 (including a review of internal controls for 20102011 and 20092010 as required under Section 404 of the Sarbanes-Oxley Act of 2002) and for the reviews of the consolidated financial statements included in our Quarterly Reports on Form 10-Q during each of the years then ended were $698,000 and $499,000, and $617,000, respectively.
The aggregate fees billed by Grant Thornton LLP for audit services in connection with the filing of our registration statements with the Securities and Exchange Commission were approximately $79,000$0 and $117,000$79,000 for the years ended December 31, 2011 and 2010, and 2009, respectively.
Audit-Related Fees
The aggregateWe did not incur fees billed by Grant Thornton LLP for audit-related services, including consulting on accounting issues, were $0 and $0 for the years ended December 31, 2011 and 2010, and 2009, respectively.
Tax Fees
There were $28,000$44,000 and $0$28,000 fees paid to Grant Thornton LLP for professional services related to tax compliance, tax advice or tax planning for the years ended December 31, 20102011 and 2009.2010.
All Other Fees
We did not incur fees in 20102011 and 20092010 for other services not included above.
Audit Committee Pre-Approval Policies and Procedures.
The Audit Committee will, on at least an annual basis, review audit and non-audit services performed by Grant Thornton LLP as well as the fees charged by Grant Thornton LLP for such services. Our policy is that all audit and non-audit services must be pre-approved by the Audit Committee. All services and fees were pre-approved during the year-ended December 31, 2011.
PART IV
| ITEM 15. | | EXHIBITS AND FINANCIAL STATEMENT SCHEDULES |
(a) | (a) | The following documents are filed as part of this Annual Report on Form 10-K: |
Report of Independent Registered Public Accounting Firm
2. Financial Statement Schedules
3. Exhibits
| Exhibit No. | | Description |
| 3.1 | | Restated Certificate of Incorporation of Resource Capital Corp. (1) |
| |
| 3.2 | | Amended and Restated Bylaws of Resource Capital Corp. (1) |
| |
| 4.1 | | Form of Certificate for Common Stock for Resource Capital Corp. (1) |
4.2(a) | |
| 4.2(a) | Junior Subordinated Indenture between Resource Capital Corp. and Wells Fargo Bank, N.A., dated May 25, 2006. (2) |
4.2(b) | |
| 4.2(b) | Amendment to Junior Subordinated Indenture and Junior Subordinated Note due 2036 between Resource Capital Corp. and Wells Fargo Bank, N.A., dated October 26, 2009 and effective September 30, 2009. (6) |
4.3(a) | |
| 4.3(a) | Amended and Restated Trust Agreement among Resource Capital Corp., Wells Fargo Bank, N.A., Wells Fargo Delaware Trust Company and the Administrative Trustees named therein, dated May 25, 2006. (2) |
4.3(b) | | Amendment to Amended and Restated Trust Agreement and Preferred Securities Certificate among Resource Capital Corp., Wells Fargo Bank, N.A. and the Administrative Trustees named therein, dated October 26, 2009 and effective September 30, 2009. (6)
|
4.4 | 4.3(b) | Amended Junior Subordinated Note due 2036 in the principal amount of $25,774,000, dated October 26, 2009. (6)
|
4.5(a) | | Junior Subordinated Indenture between Resource Capital Corp. and Wells Fargo Bank, N.A., dated September 29, 2006. (3)
|
4.5(b) | | Amendment to Junior Subordinated Indenture and Junior Subordinated Note due 2036 between Resource Capital Corp. and Wells Fargo Bank, N.A., dated October 26, 2009 and effective September 30, 2009. (6)
|
4.6(a) | | Amended and Restated Trust Agreement among Resource Capital Corp., Wells Fargo Bank, N.A., Wells Fargo Delaware Trust Company and the Administrative Trustees named therein, dated September 29, 2006. (3)
|
4.6(b) | | Amendment to Amended and Restated Trust Agreement and Preferred Securities Certificate among Resource Capital Corp., Wells Fargo Bank, N.A. and the Administrative Trustees named therein, dated October 26, 2009 and effective September 30, 2009. (6) |
4.7 | |
| 4.4 | Amended Junior Subordinated Note due 2036 in the principal amount of $25,774,000, dated October 26, 2009. (6) |
| |
| 4.5(a) | Junior Subordinated Indenture between Resource Capital Corp. and Wells Fargo Bank, N.A., dated September 29, 2006. (3) |
10.1(a) | |
| 4.5(b) | Amendment to Junior Subordinated Indenture and Junior Subordinated Note due 2036 between Resource Capital Corp. and Wells Fargo Bank, N.A., dated October 26, 2009 and effective September 30, 2009. (6) |
| |
| 4.6(a) | Amended and Restated Trust Agreement among Resource Capital Corp., Wells Fargo Bank, N.A., Wells Fargo Delaware Trust Company and the Administrative Trustees named therein, dated September 29, 2006. (3) |
| |
| 4.6(b) | Amendment to Amended and Restated Trust Agreement and Preferred Securities Certificate among Resource Capital Corp., Wells Fargo Bank, N.A. and the Administrative Trustees named therein, dated October 26, 2009 and effective September 30, 2009. (6) |
| |
| 4.7 | Amended Junior Subordinated Note due 2036 in the principal amount of $25,774,000, dated October 26, 2009. (6) |
| |
| 10.1(a) | Amended and Restated Management Agreement between Resource Capital Corp., Resource Capital Manager, Inc. and Resource America, Inc. dated as of June 30, 2008. (4) |
10.1(b) | |
| 10.1(b) | First Amendment to Amended and Restated Management Agreement between Resource Capital Corp., Resource Capital Manager, Inc. and Resource America, Inc. dated as of June 30, 2008. (5) |
10.1(c) | |
| 10.1(c) | Second Amendment to Amended and Restated Management Agreement between Resource Capital Corp., Resource Capital Manager, Inc. and Resource America, Inc. dated as of August 17, 2010. (8) |
| |
| 10.1(d) | Third Amendment to Amended and Restated Management Agreement between Resource Capital Corp., Resource Capital Manager, Inc. and Resource America, Inc. dated as of February 24, 2011. (11) |
10.2 | |
| 10.2 | Transfer and Contribution Agreement by and among LEAF Financial Corporate, Resource TRS, Inc., Resource Capital Corp. and LEAF Commercial Capital, Inc. dated January 4, 2011 (9) |
| 10.3(a) | | Master Repurchase and Securities Contract by and among RCC Commercial, Inc., RCC Real Estate Inc. and Wells Fargo Bank, National Association, dated February, 1, 2011.(10) | |
10.3(b) | | |
| 10.3(b) | Guarantee Agreement made by Resource Capital Corp. in favor of Wells Fargo Bank, National Association, dated February 1, 2011.(10) | |
| |
| 10.4 | | 2005 Stock Incentive Plan. (1) |
| |
| 10.5 | | Amended and Restated 2007 Omnibus Equity Compensation Plan. |
| |
| 10.6(a) | (7)Purchase Agreement by and between Churchill Financial Holdings, LLC and Resource TRS II, Inc., dated February 11, 2011. (12)
|
21.1 | |
| 10.6(b) | Guaranty by Resource Capital Corp., as guarantor, dated February 11, 2011. (12) |
| |
| 10.7 | Services Agreement between Resource Capital Asset Management, LLC and Apidos Capital Management, LLC, dated February 24, 2011. (11) |
| |
| 10.8 | Revolving Judgment Note And Security Agreement between Resource Capital Corp and RCC Real Estate and the Bancorp Bank, dated July 7, 2011 (13) |
| |
| 21.1 | List of Subsidiaries of Resource Capital Corp. |
23.1 | |
| 23.1 | Consent of Grant Thornton LLP |
31.1 | |
| 31.1 | Rule 13a-14(a)/Rule 15d-14(a) Certification of Chief Executive Officer. |
31.2 | |
| 31.2 | Rule 13a-14(a)/Rule 15d-14(a) Certification of Chief Financial Officer. |
32.1 | |
| 32.1 | Certification Pursuant to 18 U.S.C. Section 1350. |
32.2 | |
| 32.2 | Certification Pursuant to 18 U.S.C. Section 1350. |
| |
| 99.1 | Master Repurchase and Securities Contract for $150,000,000 between RCC Real Estate SPE 4, LLC, as Seller, and Wells Fargo Bank, National Association, as Buyer, dated February 27, 2012. (14) |
| |
| 99.2 | Guaranty made by Resource Capital Corp. as guarantor, in favor of Wells Fargo Bank, National Association, Dated February 27, 2012. (14) |
| |
| 101 | Interactive Data Files |
| (1) | Filed previously as an exhibit to the Company’s registration statement on Form S-11, Registration No. 333-126517. |
| (2) | Filed previously as an exhibit to the Company’s Quarterly Report on Form 10-Q for the quarter ended JuneSeptember 30, 2006. |
| (3) | Filed previously as an exhibit to the Company’s Quarterly Report on Form 10-Q for the quarter ended September 30, 2006. |
| (4) | Filed previously as an exhibit to the Company’s Current Report on Form 8-K filed on July 3, 2008. |
| (5) | Filed previously as an exhibit to the Company’s Current Report on Form 8-K filed on October 20, 2009. |
| (6) | Filed previously as an exhibit to the Company’s Quarterly Report on Form 10-Q for the quarter ended September 30, 2009. |
| (7) | Filed previously as an exhibit to the Company’s Annual Report on Form 10-K for the year ended December 31, 2008. |
| (8) | Filed previously as an exhibit to the Company’s Current Report on Form 8-K filed on August 19, 2010. |
| (9) | Filed previously as an exhibit to the Company’s Current Report on Form 8-K filed on January 6, 2011. |
| (10) | Filed previously as an exhibit to the Company’s Annual Report on Form 10-K for the year ended December 31, 2010. |
| (11) | Filed previously as an exhibit to the Company’s Current Report on Form 8-K filed on March 2, 2011 |
| (12) | Filed previously as an exhibit to the Company’s Quarterly Report on Form 10-Q for the quarter ended March 31, 2011. |
| (13) | Filed previously as an exhibit to the Company’s Current Report on Form 8-K filed on July 7, 2011. |
| (14) | Filed previously as an exhibit to the Company’s Current Report on Form 8-K filed on March 2, 2012. |
Pursuant to the requirements of Section 13 or 15(d) of the Securities Exchange Act of 1934, the registrant has duly caused this report to be signed on its behalf by the undersigned hereunto duly authorized.
| | RESOURCE CAPITAL CORP. (Registrant) |
| | |
March 14, 20112012 | By: /s/ Jonathan Z. Cohen |
| | Jonathan Z. Cohen |
| | Chief Executive Officer and President |
Pursuant to the requirements of the Securities Exchange Act of 1934, this report has been signed below by the following persons on behalf of the registrant and in the capacities and on the dates indicated.
| | Chairman of the Board | March 14, 20112012 |
| STEVEN J. KESSLER | | | |
| | | |
| | Director, President and Chief Executive Officer | |
| JONATHAN Z. COHEN | | | |
| | | |
| | Director | |
| WALTER T. BEACH | | | |
| | | |
| | Director | |
| EDWARD E. COHEN | | | |
| | | |
| | Director | |
| WILLIAM B. HART | | | |
| | | |
| | Director | |
| GARY ICKOWICZ | | | |
| | | |
| | Director | |
| MURRAY S. LEVIN | | | |
| | | |
| | Director | |
| P. SHERRILL NEFF | | | |
| | | |
| | Senior Vice President | |
| DAVID J. BRYANT | | Chief Financial Officer, | |
| | Chief Accounting Officer and Treasurer | |
| | | | |
148
Resource Capital Corp.
Valuation and Qualifying Accounts
(dollars in thousands)
| | | Balance at beginning of period | | | | | | | | | | | | | | | Balance at beginning of period | | | | | | | | | | | | | |
| Allowance for loan and lease loss: | | | | | | | | | | | | | | | | | | | | | | | | | | | | | | |
Year Ended December 31, 2011 | | | $ | 34,303 | | | $ | 13,896 | | | $ | (20,681 | ) | | $ | − | | | $ | 27,518 | |
| | | | | | | | | | | | | | | | | | | | | | |
Year Ended December 31, 2010 | | $ | 48,262 | | | $ | 43,321 | | | $ | (57,330 | ) | | $ | 50 | | | $ | 34,303 | | | $ | 48,262 | | | $ | 43,321 | | | $ | (57,330 | ) | | $ | 50 | | | $ | 34,303 | |
| | | | | | | | | | | | | | | | | | | | | | | | | | | | | | | | | | | | | | | | | |
Year Ended December 31, 2009 | | $ | 44,317 | | | $ | 61,383 | | | $ | (57,450 | ) | | $ | 12 | | | $ | 48,262 | | | $ | 44,317 | | | $ | 61,383 | | | $ | (57,450 | ) | | $ | 12 | | | $ | 48,262 | |
| | | | | | | | | | | | | | | | | | | | | | |
Year Ended December 31, 2008 | | $ | 5,918 | | | $ | 46,160 | | | $ | (7,761 | ) | | $ | - | | | $ | 44,317 | | |
Real Estate and Accumulated Depreciation
December 31, 2011
(dollars in thousands)
| Column A | | Column B | | | Column C | | | Column D | | | Column E | | | Column F | | | Column G | | Column H | | Column I |
| | | | | | | | Cost Capitalized Subsequent to Acquisition | | | Gross Amount at which Carried at Close of Period | | | | | | | | | | Life on which Depreciation in Latest Income is Computed |
| | | | | | Buildings and Land Improvements | | | Improvements Carrying Costs | | | Buildings and Land Improvements Total | | | | | | | | | | |
| Real estate owned: | | | | | | | | | | | | | | | | | | | | | |
Multi-family Houston, TX | | $ | 13,600 | | | $ | 18,100 | | | $ | 43 | | | $ | 16,938 | | | $ | 159 | | | | 1978 | | 8/01/2011 | | 27.5 years |
| | | | | | | | | | | | | | | | | | | | | | | | | | | | |
Multi-family Memphis, TN | | | 22,400 | | | | − | | | | − | | | | 21,081 | | | | 400 | | | | 1973 | | 6/14/2011 | | 27.5 years |
| | | | | | | | | | | | | | | | | | | | | | | | | | | | |
Office Building Pacific Palisades, CA | | | 12,150 | | | | − | | | | − | | | | 10,008 | | | | 140 | | | | 1980 | | 6/24/2011 | | 27.5 years |
| | | | | | | | | | | | | | | | | | | | | | | | | | | | |
| | | $ | 48,150 | | | $ | 18,100 | | | $ | 43 | | | $ | 48,027 | | | $ | 699 | | | | | | | | |
| | | | |
| | | | | | | | | | |
Balance, beginning of year | | $ | − | | | $ | − | | | $ | − | |
| | | | | | | | | | | | | |
| Additions: | | | | | | | | | | | | |
Acquisitions | | | 16,895 | | | | − | | | | − | |
Acquired through conversion of loan to equity | | | − | | | | − | | | | − | |
Improvements | | | 43 | | | | − | | | | − | |
Other | | | 31,089 | | | | − | | | | − | |
| | | | 48,027 | | | | − | | | | − | |
| Deductions: | | | | | | | | | | | | |
Cost of real estate sold | | | − | | | | − | | | | − | |
Other − write-down | | | − | | | | − | | | | − | |
| | | | | | | | | | | | | |
Balance, end of year | | $ | 48,027 | | | $ | − | | | $ | − | |
Resource Capital Corp.
Mortgage Loans on Real Estate
As of December 31, 20102011
(Dollars in thousands)
| | | | | | | | | | | | | | | | | Net Carrying Amount of Loans | |
| Whole Loans: | | | | | | | | | | | | | | | | | | |
Borrower A | | Hotel/ Palm Springs, CA | | LIBOR + 4.40% | | 01/05/2018 | | | I/O | | | | − | | | $ | 21,102 | | | $ | 21,102 | |
Borrower B | | Multi-Family/ Renton, WA | | LIBOR + 3.50% | | 02/10/2012 | | | I/O | | | | − | | | | 30,850 | | | | 30,848 | |
Borrower C | | Hotel/ Tucson, AZ | | LIBOR + 3.50% | | 02/01/2019 | | | I/O | | | | − | | | | 31,500 | | | | 31,500 | |
Borrower D-1 | | Hotel/ Los Angeles, CA | | LIBOR + 3.00% | | 10/05/2017 | | | I/O | (4) | | | − | | | | 28,000 | | | | 28,000 | |
Borrower D-2 | | Hotel/ Los Angeles, CA | | LIBOR + 3.00% | | 10/05/2017 | | | N/A | (4) | | | − | | | | 9,765 | | | | 9,765 | |
Borrower E | | Multi-Family/ Northglenn, CO | | LIBOR + 3.00% | | 03/05/2012 | | | I/O | | | | − | | | | 28,000 | | | | 28,000 | |
Borrower F-1 | | Retail/ Hayward, CA | | LIBOR + 2.50% | | 01/05/2019 | | | I/O | (5) | | | − | | | | 23,000 | | | | 23,000 | |
Borrower F-2 | | Retail/ Hayward, CA | | LIBOR + 2.50% | | 01/05/2019 | | | I/O | (5) | | | − | | | | 2,005 | | | | 2,005 | |
Borrower G-1 | | Multi-Family/ San Francisco, CA | | LIBOR + 3.65% | | 02/08/2017 | | | I/O | (6) | | | − | | | | 15,593 | | | | 15,593 | |
Borrower G-2 | | Multi-Family/ San Francisco, CA | | LIBOR + 3.65% | | 02/08/2017 | | | N/A | (6) | | | − | | | | 5,857 | | | | 5,857 | |
Borrower H | | Hotel/ Studio City, CA | | LIBOR + 3.20% | | 04/05/2012 | | | I/O | | | | − | | | | 27,171 | | | | 27,171 | |
Borrower I | | Land/ Studio City, CA | | LIBOR + 2.95% | | 04/05/2012 | | | I/O | | | | − | | | | 27,112 | | | | 27,112 | |
Borrower J | | Hotel/ Miami, FL | | LIBOR + 4.50% | | 09/09/2012 | | | I/O | | | | − | | | | 21,750 | | | | 21,750 | |
Borrower K | | Retail Greenville, SC | | LIBOR + 4.00% | | 12/05/2016 | | | I/O | | | | − | | | | 19,250 | | | | 19,103 | |
Borrower L-1 | | Multi-Family Parksville, MD | | LIBOR + 3.00% | | 07/05/2016 | | | I/O | (7)(8) | | | − | | | | 23,000 | | | | 22,823 | |
Borrower L-2 | | Multi-Family Parksville, MD | | 15.00% | | 07/05/2016 | | | I/O | (7) | | | − | | | | 2,000 | | | | 1,968 | |
All other Whole Loans individually less than 3% | | | | | | | | | | | | | | | | | 229,873 | | | | 229,076 | |
| Total Whole Loans | | | | | | | | | | | | | | | | $ | 545,828 | | | $ | 544,673 | |
| | | | | | | | | | | | | | | | Net | |
| | | | | Interest | | Final | | Periodic | | | | Face | | | Carrying | |
| | | Description/ | | Payment | | Maturity | | Payment | | Prior | | Amount of | | | Amount of | |
| | | | | | | | | | | | | | | | |
| Whole Loans: | | | | | | | | | | | | | | | | |
Borrower A | | Hotel/ Palm Springs, CA | | LIBOR + 4.40% | | 01/05/2018 | | I/O | | − | $ | 20,800 | | $ | 20,475 | |
Borrower B | | Multi-Family/ Renton, WA | | LIBOR + 3.50% | | 01/10/2012 | | I/O | | − | | 30,850 | | | 30,303 | |
Borrower C | | Hotel/ Tucson, AZ | | LIBOR + 3.50% | | 12/01/2016 | | I/O | | − | | 30,500 | | | 30,023 | |
Borrower D-1 | | Hotel/ Los Angeles, CA | | LIBOR + 3.00% | | 06/05/2011 | | I/O (4) | | − | | 28,000 | | | 20,700 | |
Borrower D-2 | | Hotel/ Los Angeles, CA | | LIBOR + 3.00% | | 06/05/2011 | | I/O (4) | | − | | 7,550 | | | − | |
Borrower E | | Multi-Family/ Northglenn, CO | | LIBOR + 3.00% | | 03/05/2012 | | I/O | | − | | 28,000 | | | 27,562 | |
Borrower F-1 | | Retail/ Hayward, CA | | LIBOR + 2.50% | | 01/05/2012 | | I/O (5) | | − | | 23,000 | | | 22,640 | |
Borrower F-2 | | Retail/ Hayward, CA | | LIBOR + 2.50% | | 01/05/2012 | | I/O (5) | | − | | 1,295 | | | 1,272 | |
Borrower G-1 | | Multi-Family/ San Francisco, CA | | LIBOR + 3.65% | | 02/08/2017 | | I/O (6) | | − | | 15,593 | | | 15,349 | |
Borrower G-2 | | Multi-Family/ San Francisco, CA | | LIBOR + 3.65% | | 02/08/2017 | | I/O (6) | | − | | 5,857 | | | 5,754 | |
Borrower H | | Hotel/ Studio City, CA | | LIBOR + 3.20% | | 02/05/2010 | | I/O | | − | | 25,050 | | | 24,648 | |
Borrower I | | Land/ Studio City, CA | | LIBOR + 2.95% | | 02/05/2010 | | I/O | | − | | 26,150 | | | 25,729 | |
Borrower J | | Multi-Family/ Memphis, TN | | LIBOR + 2.75% | | 05/09/2011 | | I/O | | − | | 22,400 | | | 22,050 | |
Borrower K | | Hotel Miami, FL | | LIBOR + 3.75% | | 09/09/2011 | | I/O | | − | | 21,000 | | | 20,672 | |
All other Whole Loans individually less than 3% | | | | | | | | | | | | 155,661 | | | 152,030 | |
| Total Whole Loans | | | | | | | | | | | | 441,706 | | | 419,207 | |
| | | | | | | | | | | | | | | | | |
| Mezzanine Loans: | | | | | | | | | | | | | | | | |
Borrower J | | Hotel/ Various | | LIBOR + 2.85% | | 05/9/2010 | | I/O | | − | | 38,072 | | | 37,477 | |
All other Mezzanine Loans individually less than 3% | | | | | | | | | | | | 84,085 | | | 76,215 | |
| Total Mezzanine Loans | | | | | | | | | | | | 122,157 | | | 113,692 | |
| | | | | | | | | | | | | | | | | |
| B Notes: | | | | | | | | | | | | | | | | |
All other B Notes individually less than 3% | | | | | | | | | | | | 57,613 | | | 56,553 | |
| Total B Notes | | | | | | | | | | | | 57,613 | | | 56,553 | |
| | | | | | | | | | | | | | | | | |
| Total Loans | | | | | | | | | | | $ | 621,476 | | $ | 589,452 | |
SCHEDULE IV
Resource Capital Corp.
Mortgage Loans on Real Estate
As of December 31, 2011
(Dollars in thousands)
(Continued)
| | | | | | | | | | | | | | | | | | | | Net Carrying Amount of Loans | |
| Mezzanine Loans: | | | | | | | | | | | | | | | | | | | | | |
Borrower M | | Hotel/ Various | | | LIBOR + 2.85% | | | 05/9/2010 | | | | I/O | | | | − | | | $ | 38,072 | | | $ | 38,072 | |
All other Mezzanine Loans individually Less than 3% | | | | | | | | | | | | | | | | | | | | 29,770 | | | | 29,802 | |
| Total Mezzanine Loans | | | | | | | | | | | | | | | | | | | | 67,842 | | | | 67,874 | |
| | | | | | | | | | | | | | | | | | | | | | | | | | |
| B Notes: | | | N/A | | | | N/A | | | | N/A | | | | N/A | | | | N/A | | | | | | | | | |
All other B Notes individually less than 3% | | | | | | | | | | | | | | | | | | | | | | | 16,579 | | | | 16,435 | |
| Total B Notes | | | | | | | | | | | | | | | | | | | | | | | 16,579 | | | | 16,435 | |
| Total Loans | | | | | | | | | | | | | | | | | | | | | | $ | 630,249 | (9) | | $ | 628,982 | (10) |
Explanatory Notes:
| (1) | IO means= interest only.only |
| (2) | Represents only Third Party Liensthird-party liens |
| (3) | Does not include unfunded commitments. |
| (4) | Borrower D is a whole loan and the participations above represent the Senior (D-1) and Mezzanine (D-2) portions. |
| (5) | Borrower F is a whole loan and the participations above represent the Senior (F-1) and Mezzanine (F-2) portions. |
| (6) | Borrower G is a whole loan and the participations above represent the Senior (G-1) and Mezzanine (G-2) portions. |
| (7) | Borrower L is a whole loan and the participations above represents the Senior (L-1) and Mezzanine (L-2) portions. |
| (8) | Borrower L-1 is a whole loan that is categorized as a floating rate loan in the footnotes and MD&A. |
| (9) | All loans are current with respect to principal and interest payments due. |
(8)(10) | The net carrying amount of loans includes an allowance for loan loss of $31.6$24.2 million at December 31, 20102011 allocated as follows: Whole Loans ($22.222.6 million); Mezzanine Loans ($8.51.4 million) and B Notes ($899,000)253,000). |