UNITED STATES
SECURITIES AND EXCHANGE COMMISSION
Washington, D.C. 20549
FORM 10-K
(MARK ONE)
x ANNUAL REPORT PURSUANT TO
SECTION 13, 15(d), OR 37 OF THE SECURITIES EXCHANGE ACT OF 1934
For the fiscal year ended September 30, 20172021
OR
o TRANSITION REPORT PURSUANT TO SECTION 13 OR 15(d) OF THE SECURITIES EXCHANGE ACT OF 1934
For the transition period from _____ to _____
Commission file number 000-52313
TENNESSEE VALLEY AUTHORITY
(Exact name of registrant as specified in its charter)
|
| | | | | | | | | | |
A corporate agency of the United States created by an act of Congress (State or other jurisdiction of incorporation or organization) | | 62-0474417 (IRS Employer Identification No.) |
|
400 W. Summit Hill Drive Knoxville, Tennessee (Address of principal executive offices) | | 37902 (Zip Code) |
(865) 632-2101
(Registrant’sRegistrant's telephone number, including area code)
Securities registered pursuant to Section 12(b) of the Act: None
| | | | | | | | |
| Title of each class | Trading Symbol(s) | Name of each exchange on which registered |
| N/A | N/A | N/A |
Securities registered pursuant to Section 12(g) of the Act: None
Indicate by check mark if the registrant is a well-known seasoned issuer, as defined in Rule 405 of the Securities Act.
Yes o No x
Indicate by check mark if the registrant is not required to file reports pursuant to Section 13 or Section 15(d) of the Act.
Yes o No x
Indicate by check mark whether the registrant (1) has filed all reports required to be filed by Section 13, 15(d), or 37 of the Securities Exchange Act of 1934 during the preceding 12 months (or for such shorter period that the registrant was required to file such reports), and (2) has been subject to such filing requirements for the past 90 days.
Yes x No o
Indicate by check mark whether the registrant has submitted electronically and posted on its corporate Web site, if any, every Interactive Data File required to be submitted and posted pursuant to Rule 405 of Regulation S-T (§ 232.405 of this chapter) during the preceding 12 months (or for such shorter period that the registrant was required to submit and post such files).
Yes x No o
Indicate by check mark whether the registrant is a large accelerated filer, an accelerated filer, a non-accelerated filer, a smaller reporting company, or an emerging growth company. See the definitions of “large"large accelerated filer,” “accelerated" "accelerated filer,” “smaller" "smaller reporting company,”" and "emerging growth company" in Rule 12b-2 of the Exchange Act.
Large accelerated filer o Accelerated filer Emerging growth company o
Non-accelerated filer x(Do not check if a smaller reporting company) Smaller reporting company oEmerging growth company o
Non-accelerated filer xAccelerated filer o
If an emerging growth company, indicate by check mark if the registrant has elected not to use the extended transition period for complying with any new or revised financial accounting standards provided pursuant to Section 13(a) of the Exchange Act. o
Indicate by check mark whether the registrant has filed a report on and attestation to its management's assessment of the effectiveness of its internal control over financial reporting under Section 404(b) of the Sarbanes-Oxley Act (15 U.S.C. 7262(b)) by the registered public accounting firm that prepared or issued its audit report. x
Indicate by check mark whether the registrant is a shell company (as defined in Rule 12b-2 of the Exchange Act).
Yes o No x
|
| | |
| Table of Contents |
GLOSSARY OF COMMON ACRONYMS....................................................................................................................................................................................................... ACRONYMS....................................................................................................................................................................................................... | |
FORWARD-LOOKING INFORMATION......................................................................................................................................................................................................... INFORMATION......................................................................................................................................................................................................... | |
GENERAL INFORMATION............................................................................................................................................................................................................................ INFORMATION............................................................................................................................................................................................................................ | |
| |
| |
| |
| ITEM 1. BUSINESS...................................................................................................................................................................................................................................... | |
The Corporation................................................................................................................................................................................................................................. Corporation................................................................................................................................................................................................................................. | |
Service Area....................................................................................................................................................................................................................................... Area....................................................................................................................................................................................................................................... | |
Customers.......................................................................................................................................................................................................................................... | |
Rates.................................................................................................................................................................................................................................................. | |
| Rates.................................................................................................................................................................................................................................................. | |
| Power Supply and Load Management Resources............................................................................................................................................................................. | |
Fuel Supply......................................................................................................................................................................................................................................... Supply......................................................................................................................................................................................................................................... | |
Transmission...................................................................................................................................................................................................................................... | |
Weather and Seasonality.................................................................................................................................................................................................................... Seasonality.................................................................................................................................................................................................................... | |
Competition........................................................................................................................................................................................................................................ | |
Research and Development............................................................................................................................................................................................................... Development............................................................................................................................................................................................................... | |
Flood Control Activities....................................................................................................................................................................................................................... Activities....................................................................................................................................................................................................................... | |
Environmental Stewardship Activities................................................................................................................................................................................................. Activities................................................................................................................................................................................................. | |
Economic Development Activities...................................................................................................................................................................................................... Activities...................................................................................................................................................................................................... | |
Regulation.......................................................................................................................................................................................................................................... | |
Taxation and Tax Equivalents............................................................................................................................................................................................................. Equivalents............................................................................................................................................................................................................. | |
Environmental Matters....................................................................................................................................................................................................................... Matters....................................................................................................................................................................................................................... | |
Employees.......................................................................................................................................................................................................................................... | |
| |
ITEM 1A. RISK FACTORS............................................................................................................................................................................................................................ FACTORS............................................................................................................................................................................................................................ | |
| |
ITEM 1B. UNRESOLVED STAFF COMMENTS............................................................................................................................................................................................ COMMENTS............................................................................................................................................................................................ | |
| |
ITEM 2. PROPERTIES.................................................................................................................................................................................................................................. PROPERTIES.................................................................................................................................................................................................................................. | |
Generating Properties........................................................................................................................................................................................................................ Properties........................................................................................................................................................................................................................ | |
Transmission Properties..................................................................................................................................................................................................................... Properties..................................................................................................................................................................................................................... | |
Natural Resource Stewardship Properties......................................................................................................................................................................................... Properties......................................................................................................................................................................................... | |
Buildings............................................................................................................................................................................................................................................. | |
Disposal of Property........................................................................................................................................................................................................................... Property........................................................................................................................................................................................................................... | |
| |
ITEM 3. LEGAL PROCEEDINGS.................................................................................................................................................................................................................. PROCEEDINGS.................................................................................................................................................................................................................. | |
| |
ITEM 4. MINE SAFETY DISCLOSURES...................................................................................................................................................................................................... | |
| |
| |
| |
| SECURITIES............ | |
| |
ITEM 6. SELECTED FINANCIAL DATA........................................................................................................................................................................................................ | |
| |
| OPERATIONS................................................................... | |
| Business and Mission......................................................................................................................................................................................................................... | |
Executive Overview............................................................................................................................................................................................................................ | |
| Results of Operations......................................................................................................................................................................................................................... | |
| Liquidity and Capital Resources......................................................................................................................................................................................................... | |
| Off-Balance Sheet Arrangements....................................................................................................................................................................................................... | |
| Key Initiatives and Challenges........................................................................................................................................................................................................... | |
Critical Accounting Policies and Estimates......................................................................................................................................................................................... Estimates......................................................................................................................................................................................... | |
Fair Value Measurements................................................................................................................................................................................................................... | |
New Accounting Standards and Interpretations................................................................................................................................................................................. Interpretations................................................................................................................................................................................. | |
Legislative and Regulatory Matters.................................................................................................................................................................................................... Matters.................................................................................................................................................................................................... | |
| Environmental Matters....................................................................................................................................................................................................................... | |
| Legal Proceedings.............................................................................................................................................................................................................................. | |
Risk Management Activities............................................................................................................................................................................................................... Activities............................................................................................................................................................................................................... | |
| |
| RISK........................................................................................................................... | |
| |
| DATA.......................................................................................................................................................... | |
Consolidated Statements of Operations............................................................................................................................................................................................. | |
Consolidated Statements of Comprehensive Income (Loss)............................................................................................................................................................. | |
Consolidated Balance Sheets............................................................................................................................................................................................................Statements of Operations............................................................................................................................................................................................. |
|
| |
| Consolidated Statements of Comprehensive Income (Loss)............................................................................................................................................................. | |
Consolidated Statements of Cash Flows...........................................................................................................................................................................................Flows........................................................................................................................................................................................... | |
| Capital............................................................................................................................................................. | |
|
| |
| Notes to Consolidated Financial Statements..................................................................................................................................................................................... | |
| Firm............................................................................................................................................................... | |
| |
| DISCLOSURE............................................................... | |
| | | | | |
| |
ITEM 9A. CONTROLS AND PROCEDURES............................................................................................................................................................................................... PROCEDURES............................................................................................................................................................................................... | |
Disclosure Controls and Procedures.................................................................................................................................................................................................. Procedures.................................................................................................................................................................................................. | |
Internal Control over Financial Reporting........................................................................................................................................................................................... Reporting........................................................................................................................................................................................... | |
| Firm................................................................................................................................................................ | |
| |
ITEM 9B. OTHER INFORMATION................................................................................................................................................................................................................ INFORMATION................................................................................................................................................................................................................ | |
| |
| |
| |
| GOVERNANCE............................................................................................................................. | |
| Directors.............................................................................................................................................................................................................................................. | |
| Executive Officers............................................................................................................................................................................................................................... | |
| Disclosure and Financial Code of Ethics............................................................................................................................................................................................ | |
| Committees of the TVA Board............................................................................................................................................................................................................ | |
| |
ITEM 11. EXECUTIVE COMPENSATION..................................................................................................................................................................................................... COMPENSATION..................................................................................................................................................................................................... | |
| Compensation Discussion and Analysis............................................................................................................................................................................................. | |
| CEO Pay Ratio Disclosure................................................................................................................................................................................................................. | |
| Executive Compensation Tables and Narrative Disclosures.............................................................................................................................................................. | |
| Retirement and Pension Plans........................................................................................................................................................................................................... | |
| Nonqualified Deferred Compensation................................................................................................................................................................................................ | |
Potential Payments on Account of Retirement/Resignation, Retirement, Termination without Cause, Termination with Cause, Death, or Disability........................................... | |
| Other Agreements.............................................................................................................................................................................................................................. | |
| Director Compensation....................................................................................................................................................................................................................... | |
| Compensation Committee Interlocks and Insider Participation.......................................................................................................................................................... | |
| Compensation Committee Report...................................................................................................................................................................................................... | |
| |
| MATTERS...................................... | |
| |
| INDEPENDENCE......................................................................................... | |
| Director Independence....................................................................................................................................................................................................................... | |
| Related Party Transactions................................................................................................................................................................................................................ | |
| |
| SERVICES...................................................................................................................................................................... | |
| |
| |
| |
| SCHEDULES..................................................................................................................................................................... | |
| |
SIGNATURES................................................................................................................................................................................................................................................ | |
EXHIBIT INDEX............................................................................................................................................................................................................................................. | |
| SIGNATURES................................................................................................................................................................................................................................................ | |
|
| | | | | | | |
| GLOSSARY OF COMMON ACRONYMS |
Following are definitions of some of the terms or acronyms that may be used in this Annual Report on Form 10-K for the fiscal year ended September 30, 20172021 (the “Annual Report”"Annual Report"): |
|
| Term or Acronym | | Definition |
AFUDCACE | | Allowance for funds used during constructionAffordable Clean Energy |
AOCIACPA | | Anti-Cherrypicking Amendment |
| ANI | | American Nuclear Insurers |
| AOCI | | Accumulated other comprehensive income (loss) |
| ARO | | Asset retirement obligation |
| ART | | Asset Retirement Trust |
ASLBBonds | | Atomic Safety and Licensing Board |
BLEU | | Blended low-enriched uranium |
Bonds | | Bonds, notes, or other evidences of indebtedness |
BSERCAA | | Best system of emission reduction |
CAA | | Clean Air Act |
CAIRCCR | | Clean Air Interstate Rule |
CCR | | Coal combustion residuals |
| CERCLA | | Comprehensive Environmental Response, Compensation, and Liability Act |
CME | | Chicago Mercantile Exchange |
CO2 | | Carbon dioxide |
COLCOVID-19 | | Combined construction and operating license applicationCoronavirus Disease 2019 |
COLACOLA(s) | | Cost-of-living adjustmentadjustment(s) |
| CSAPR | | Cross-State Air Pollution Rule |
| CTs | | Combustion turbine unit(s) |
| CVA | | Credit valuation adjustment |
| CY | | Calendar year |
DCPDBOT | | Down-blend offering for Tritium |
| DCP | | Deferred Compensation Plan |
| DER | | Distributed Energy Resources |
| DOE | | Department of Energy |
| EIS | | Environmental Impact Statement |
EPAELGs | | Effluent Limitation Guidelines |
| EMPs | | Electromagnetic pulses |
| EO(s) | | Executive Order(s) |
| EPA | | Environmental Protection Agency |
| EPRI | | Electric Power Research Institute |
ERSERC | | EnergyRight® Solutions programs
Enterprise Risk Council |
ESPAFASB | | Early Site Permit Application |
FASB | | Financial Accounting Standards Board |
FCMFERC | | Futures Commission Merchant |
FERC | | Federal Energy Regulatory Commission |
| FPA | | Federal Power Act |
| FTP | | Financial Trading Program |
| GAAP | | Accounting principles generally accepted in the United States of America |
| GHG | | Greenhouse gas |
GPHAP | | Generation PartnersHazardous Air Pollutants |
GPPIRP | | Green Power Providers |
GPS | | Green Power Switch®
|
GWh | | Gigawatt hour(s) |
IRP | | Integrated Resource Plan |
IRUsIwD | | Indefeasible rights of useInclusion with Diversity |
| JSCCG | | John Sevier Combined Cycle Generation LLC |
kWKOC | | KilowattsKnoxville Office Complex |
kWhkW | | Kilowatt hour(s)Kilowatts |
LPCkWh | | Kilowatt hours |
| LPCs | | Local power company customer of TVAcustomers |
LTDCPLTA | | Long-Term Agreement |
| LTDCP | | Long-Term Deferred Compensation Plan |
| MATS | | Mercury and Air Toxics Standards |
| | | | | | | | |
| MD&A | | Management’sManagement's Discussion and Analysis of Financial Condition and Results of Operations |
| MLGW | | Memphis Light, Gas and Water Division |
MLPsmmBtu | | Master Limited Partnerships |
mmBtu | | Million British thermal unit(s) |
MOXMtM | | Mixed oxideMark-to-market |
MtMMW | | Mark-to-market |
| Megawatts |
| NAAQS | | |
MW | | Megawatt |
NAAQS | | National Ambient Air Quality Standards |
| NAV | | Net asset value |
| NDT | | Nuclear Decommissioning Trust |
| NEIL | | Nuclear Electric Insurance Limited |
| NEPA | | National Environmental Policy Act |
| NERC | | North American Electric Reliability Corporation |
| NES | | Nashville Electric Service |
NO2x | | Nitrogen dioxideoxides |
NOx
NPDES | | Nitrogen oxides |
NPDES | | National Pollutant Discharge Elimination System |
| NRC | | Nuclear Regulatory Commission |
| NSR | | New Source Review |
NYSENuclear Development | | Nuclear Development, LLC |
| NWP | | Nationwide Permit |
| NYSE | | New York Stock Exchange |
| OCI | | Other comprehensive income (loss) |
| OMB | | Office of Management and Budget |
| PARRS | | Putable Automatic Rate Reset Securities |
| PM | | Particulate matter |
QERQTE | | Quadrennial Energy Review |
QTE | | Qualified technological equipment and software |
RECsRCRA | | Resource Conservation and Recovery Act |
| RECs | | Renewable Energy Certificates |
| REIT | | Real Estate Investment Trust |
| RSO | | Renewable Standard Offer |
| SCCG | | Southaven Combined Cycle Generation LLC |
| SCRs | | Selective catalytic reduction systems |
| SEC | | Securities and Exchange Commission |
SERPSELC | | Southern Environmental Law Center |
| SERP | | Supplemental Executive Retirement Plan |
| SHLLC | | Southaven Holdco LLC |
SMRSIPs | | State implementation plans |
| SMR | | Small modular reactor(s) |
SO2 | | Sulfur dioxide |
SOASPC | | Summer Place Complex |
| SOA | | Society of Actuaries |
| SSSL | | Seven States Southaven, LLC |
TCWNTDEC | | Tennessee Clean Water Network |
TDEC | | Tennessee Department of Environment & Conservation |
| TIPS | | Treasury Inflation-Protected Securities |
TOU | | Time-of-use |
| TVA Act | | The Tennessee Valley Authority Act of 1933, as amended 16 U.S.C. §§ 831-831ee |
TVARSTVA Board | | TVA Board of Directors |
| TVARS | | Tennessee Valley Authority Retirement System |
| U.S. Treasury | | United States Department of the Treasury |
| USACE | | U.S. Army Corps of Engineers |
| VIE | | Variable interest entity |
| XBRL | | eXtensible Business Reporting Language |
FORWARD-LOOKING INFORMATION
This Annual Report on Form 10-K for the fiscal year ended September 30, 2021 ("Annual Report") contains forward-looking statements relating to future events and future performance. All statements other than those that are purely historical may be forward-looking statements. In certain cases, forward-looking statements can be identified by the use of words such as "may," "will," "should," "expect," "anticipate," "believe," "intend," "project," "plan," "predict," "assume," "forecast," "estimate," "objective," "possible," "probably," "likely," "potential," "speculate," the negative of such words, or other similar expressions.
Although the Tennessee Valley Authority ("TVA") believes that the assumptions underlying theany forward-looking statements are reasonable, TVA does not guarantee the accuracy of these statements. Numerous factors could cause actual results to differ materially from those in theany forward-looking statements. These factors include, among other things:
•The continuing impact of the Coronavirus Disease 2019 ("COVID-19") pandemic on TVA's operating results, financial condition, and cash flows, the demand for electricity, TVA's workforce and operations, the availability of fuel and critical parts, supplies, and services, the financial markets, and the business and financial condition of TVA's customers and counterparties;
•The duration and severity of the COVID-19 pandemic, actions taken to contain its spread and mitigate its effects, and broader impacts of the COVID-19 pandemic on economic and market conditions, including impacts on interest rates, commodity prices, investment performance, and foreign currency exchange rates;
•New, amended, or existing laws, regulations, executive orders ("EOs"), or administrative orders or interpretations, including those related to climate change and other environmental matters, and the costs of complying with these laws, regulations, EOs, or administrative orders;orders or interpretations;
•The cost of complying with known, anticipated, or new emissions reduction requirements, some of which could render continued operation of many of TVA's aging coal-fired generation units not cost-effective andor result in their removal from service, perhaps permanently;
•Significant reductions in demand for electricity produced through non-renewable or centrally located generation sources whichthat may result from, among other things, economic downturns, increased energy efficiency and conservation, increased utilization of distributed generation and microgrids, and improvements in alternative generation and energy storage technologies;
•Changes in customer preferences for energy produced from cleaner generation sources;
•Changes in technology;
•Actions taken, or inaction, by the United States ("U.S.") government relating to the national or TVA debt ceiling or automatic spending cuts in government programs;
•Costs andor liabilities that are not anticipated in TVA’sTVA's financial statements for third-party claims, natural resource damages, environmental clean-upcleanup activities, or fines or penalties associated with unexpected events such as failures of a facility or infrastructure;
•Addition or loss of customers by TVA or theTVA's local power company customers of TVA ("LPCs");
•Significant delays, cost increases, or cost overruns associated with the construction and maintenance of generation, transmission, navigation, flood control, or related assets;
Changes in•Requirements or decisions changing the amount or timing or amount of funding obligations associated with TVA's pension andplans, other post-retirement benefit plans, or health care obligations and related funding;plans;
•Increases in TVA's financial liabilities for decommissioning its nuclear facilities or retiring other assets;
•Risks associated with the operation of nuclear facilities or other generation and related facilities, including coal combustion residualresiduals ("CCR") facilities;
•Physical attacks on TVA's assets;
•Cyber attacks on TVA's assets or the assets of third parties upon which TVA relies;
•The outcome of legal or administrative proceedings, including the CCR proceedings involving the Gallatin Fossil Plant as well as any other CCR proceedings that may be brought in the future;proceedings;
•The failure of TVA's generation, transmission, navigation, flood control, and related assets and infrastructure, including CCR facilities and spent nuclear fuel storage facilities, to operate as anticipated, resulting in lost revenues, damages, andor other costs that are not reflected in TVA’sTVA's financial statements or projections;
•Differences between estimates of revenues and expenses and actual revenues earned and expenses incurred;
•Weather conditions;conditions including changing weather patterns, extreme weather conditions, and other events such as flooding, droughts, wildfires, and snow or ice storms that may result from climate change;
•Catastrophic events such as fires, earthquakes, explosions, solar events, electromagnetic pulses ("EMPs"), geomagnetic disturbances, droughts, floods, hurricanes, tornadoes, or other casualty events or pandemics, wars, national emergencies, terrorist activities, andor other similar events, especially if these events occur in or near TVA's service area;
•Events at a TVA facility, which, among other things, could result in loss of life, damage to the environment, damage to or loss of the facility, and damage to the property of others;
•Events or changes involving transmission lines, dams, and other facilities not operated by TVA, including those that affect the reliability of the interstate transmission grid of which TVA's transmission system is a part and those that increase flows across TVA's transmission grid;
•Disruption of fuel supplies, which may result from, among other things, economic conditions, weather conditions, production or transportation difficulties, labor challenges, cyber attacks, mine closures or reduced mine production, an increase in fuel exports, or environmental laws or regulations affecting TVA's fuel suppliers or transporters;
•Purchased power price volatility and disruption of purchased power supplies;
•Events which affect the supply of water for TVA's generation facilities;
•Changes in TVA's determinations of the appropriate mix of generation assets;
•Ineffectiveness of TVA's efforts at adapting its organization to an evolving marketplace and remaining cost competitive;
•Inability to use regulatory accounting or loss of regulatory accounting approval for certain costs;
•Inability to obtain, or loss of, regulatory approval for the construction or operation of assets;
•The requirement or decision to make additional contributions to TVA's pension or other post-retirement benefit plans or to TVA's Nuclear Decommissioning Trust ("NDT") or Asset Retirement Trust ("ART");
•Limitations on TVA's ability to borrow money which may result from, among other things, TVA's approaching or substantially reaching the limit on bonds, notes, and other evidences of indebtedness (collectively, "Bonds") specified in the Tennessee Valley Authority Act of 1933, as amended 16 U.S.C. §§ 831-831ee (the “TVA Act”("TVA Act");
•An increase in TVA's cost of capital whichthat may result from, among other things, changes in the market for TVA's debt securities, changes in the credit rating of TVA or the U.S. government, or, potentially, an increased reliance by TVA on alternative financing should TVA approach its debt limit;
•Changes in the economy and volatility in financial markets;
•Reliability andor creditworthiness of counterparties;
•Changes in the market price of commodities such as coal, uranium, natural gas, fuel oil, crude oil, construction materials, reagents, electricity, andor emission allowances;
•Changes in the market price of equity securities, debt securities, andor other investments;
•Changes in interest rates, currency exchange rates, andor inflation rates;
•Ineffectiveness of TVA's disclosure controls and procedures or its internal controlscontrol over financial reporting;
•Inability to eliminate identified deficiencies in TVA's systems, standards, controls, or corporate culture;
•Inability to attract or retain a skilled workforce;
•Inability to respond quickly enough to current or potential customer demands or needs;
•Events at a nuclear facility, whether or not operated by or licensed to TVA, which, among other things, could lead to increased regulation or restriction on the construction, ownership, operation, andor decommissioning of nuclear facilities or on the storage of spent fuel, obligate TVA to pay retrospective insurance premiums, reduce the availability and affordability of insurance, increase the costs of operating TVA's existing nuclear units, andor cause TVA to forego future construction at these or other facilities;
•Loss of quorum of the TVA Board of Directors (the "TVA("TVA Board");
•Changes in the membershippriorities of the TVA Board or TVA senior management; andor
•Other unforeseeable events.
See also Item 1A, Risk Factors, and Item 7, Management’sManagement's Discussion and Analysis of Financial Condition and Results of Operations. New factors emerge from time to time, and it is not possible for managementTVA to predict all such factors or to assess the extent to which any factor, or combination of factors, may impact TVA’sTVA's business or cause results to differ materially from those contained in any forward-looking statement. TVA undertakes no obligation to update any forward-looking statement to reflect developments that occur after the statement is made.
GENERAL INFORMATION
Fiscal Year
References to years (2017, 2016,(2021, 2020, etc.) in this Annual Report on Form 10-K for the fiscal year ended September 30, 2021are to TVA’sTVA's fiscal years ending September 30 except for references to years in the biographical information about directors and executive officers in Item 10, Directors, Executive Officers and Corporate Governance, as well as to years that are preceded by “CY,”"CY," which references are to calendar years.
Notes
References to “Notes”"Notes" are to the Notes to Consolidated Financial Statements contained in Item 8, Financial Statements and Supplementary Data in this Annual Report.
Property
TVA does not own real property.property and real property interests (collectively, "real property"). TVA acquires real property in the name of the United States ("U.S."), and such legal title in real property is entrusted to TVA as the agent of the United StatesU.S. to accomplish the purposes of the TVA Act. TVA acquires personal property in the name of TVA. Accordingly, unless the context indicates the reference is to TVA’sTVA's personal property, any statement in this Annual Report referring to TVA property shall be read as referring to the real property of the United States whichU.S. that has been entrusted to TVA as its agent.
Available Information
TVA files annual, quarterly, and current reports with the Securities and Exchange Commission ("SEC") under Section 37 of the Securities Exchange Act of 1934. TVA’s1934 (the "Exchange Act"). TVA's SEC filings are available to the public over the internet on the SEC’sSEC's website at www.sec.gov or on TVA's website at www.tva.gov. Information contained on or accessible through TVA's website shall not be deemed to be incorporated into, or to be a part of, this Annual Report.Report or any other report or document that TVA files with the SEC.
PART I
ITEM 1. BUSINESS
The Corporation
General
The Tennessee Valley Authority ("TVA") is a corporate agency and instrumentality of the United States ("U.S.") that was created in 1933 by federal legislation enacted by the U.S. Congress in response to a requestproposal by President Franklin D. Roosevelt. TVA was created to, among other things, improve navigation on the Tennessee River, reduce the damage from destructive flood waters within the Tennessee River system and downstream on the lower Ohio and Mississippi Rivers, further the economic development of TVA’sTVA's service area in the southeastern United States,U.S., and sell the electricity generated at the facilities TVA operates. Today, TVA operates the nation’snation's largest public power system and supplies power to a population of over nineapproximately 10 million people.
TVA also manages the Tennessee River, its tributaries, and certain shorelines to provide, among other things, year-round navigation, flood damage reduction, and affordable and reliable electricity. Consistent with these primary purposes, TVA also manages the river system to provide recreational opportunities, adequate water supply, improved water quality, cultural and natural resource protection, and economic development. TVA performs these management duties in cooperation with other federal and state agencies whichthat have jurisdiction and authority over certain aspects of the river system. In addition, the TVA Board of Directors (the "TVA("TVA Board") has established two councils — the Regional Resource Stewardship Council and the Regional Energy Resource Council — under the Federal Advisory Committee Act to advise TVA on its stewardship activities in the Tennessee Valley and its energy resource activities.
Initially, all TVA operations were funded by federal appropriations. Direct appropriations for the TVA power program ended in 1959, and appropriations for TVA’sTVA's stewardship, economic development, and multipurpose activities ended in 1999. Since 1999, TVA has funded all of its operations almost entirely from the sale of electricity and power system financings. TVA’sTVA's power system financings consist primarily of the sale of debt securitiesbonds, notes, or other evidences of indebtedness (collectively, "Bonds") and secondarily of alternative forms of financing, such as lease arrangements. As a wholly-owned government corporation, TVA is not authorized to issue equity securities.
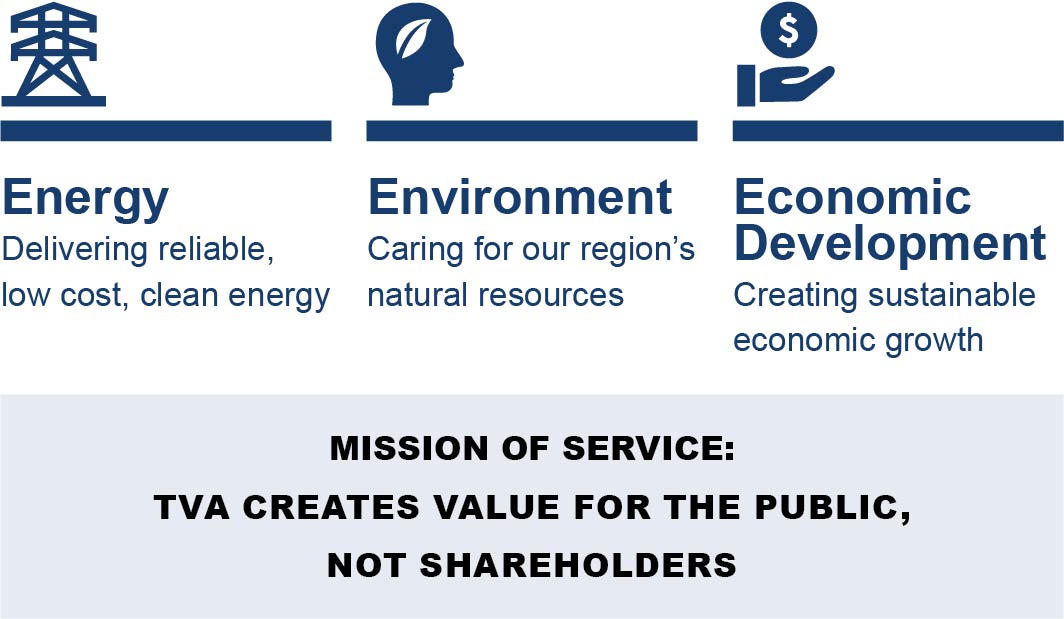
TVA's Mission of Service
TVA was built for the people, created by federal legislation, and charged with a unique mission - to improve the quality of life in a seven-state region through the integrated management of the region's resources. TVA's mission focuses on three key areas:
•Energy — Delivering reliable, low cost, clean energy;
•Environment — Caring for the region's natural resources; and
•Economic Development — Creating sustainable economic growth.
TVA's Strategic Priorities
While TVA's mission has not changed since it was established in 1933, the climate in which TVA operates continues to evolve. To continue to deliver its mission of service while evolving for future success, TVA must realize five strategic priorities:
•Powerful Partnerships — Promoting progress through the shared success of TVA's customers and stakeholders;
•People Advantage — Amplifying the energy, passion, and creativity within each TVA employee;
•Operational Excellence — Building on TVA's best-in-class reputation for reliable service and competitively priced power;
•Igniting Innovation — Pursuing innovative solutions for TVA and its customers and communities; and
•Financial Strength — Investing in the future, while keeping energy costs as low as possible.
Service Area
TVA's service area, the area in which it sells power, is defined by the Tennessee Valley Authority Act of 1933, as amended ("TVA Act.Act"). TVA supplies power in most of Tennessee, northern Alabama, northeastern Mississippi, and southwestern Kentucky, and in portions of northern Georgia, western North Carolina, and southwestern Virginia. Under the TVA Act, subject to certain minor exceptions, TVA may not, without specific authorization from the U.S. Congress,enactment of authorizing federal legislation, enter into contracts that would have the effect of making it, or the wholesale customers ofthat distribute TVA power ("local power company customers" or "LPCs") that distribute TVA power,, a source of power supply outside the area for which TVA or its LPCs were the primary source of power supply on July 1, 1957. This provision is referred to as the “fence”"fence" because it bounds TVA’sTVA's sales activities, essentially limiting TVA to power sales within a defined service area.
See Power Supply and Load Management Resources— Coal-Fired for a discussion of coal-fired units.Resources.
In addition, the Federal Power Act ("FPA") includes a provision that helps protect TVA’sTVA's ability to sell power within its service area. This provision, called the "anti-cherrypicking" provision, prevents the Federal Energy Regulatory Commission ("FERC") from ordering TVA to provide access to its transmission lines to others to deliver power to customers within TVA’sTVA's defined service area. As a result, the anti-cherrypicking provision reduces TVA’sTVA's exposure to loss of its customers. However, there have been some efforts to circumvent the anti-cherrypicking provision, and the protection of the provision could be limited and perhaps eliminated by federal legislation at some time in the future. See Competition, Item 1A, Risk Factors — Regulatory, Legislative, and Legal Risks— TVA may lose its protected service territory, and Note 23 — Commitments and Contingencies — Legal Proceedings — Challenge to Anti-Cherrypicking Amendment.
In 2017,2021, the revenues generated from TVA’sTVA's electricity sales were $10.6$10.4 billion and accounted for virtually all of TVA’sTVA's revenues. TVA’sSee Note 18 — Revenue for details regarding revenues by state for each of the last three yearsyears.
COVID-19 Pandemic
In March 2020, the World Health Organization declared the outbreak of the Coronavirus Disease 2019 ("COVID-19") to be a pandemic, which continues to be a serious challenge throughout the U.S. TVA implemented a company-wide pandemic plan to address specific aspects of the COVID-19 pandemic, including impacts from variants. TVA's pandemic plan continually evolves based on medical guidance and federal, regional, and local requirements and guidelines.
TVA has put in place measures to protect its workforce, stakeholders, and critical operations, such as extending the timeframe for workforce reintegration and continuing to implement strong physical and cybersecurity measures. Generation, transmission, and distribution functions are detailedactively monitored, and TVA's operations and delivery of energy to customers have not been materially impacted by the COVID-19 pandemic at this time. While TVA experienced a reduction in revenue for the table below.year ended September 30, 2020, based on current internal models, TVA estimates that the COVID-19 pandemic had little impact on TVA's sales volume for the year ended September 30, 2021. TVA continues to assess potential supplier risk, and through September 30, 2021, TVA has seen an increase in supplier impacts as a result of COVID-19, such as delays and price fluctuations, but has not experienced significant business disruptions at this time.
|
| | | | | | | | | | | |
Operating Revenues By State For the years ended September 30 (in millions) |
| | 2017 | | 2016 | | 2015 |
| Alabama | $ | 1,524 |
| | $ | 1,504 |
| | $ | 1,582 |
|
| Georgia | 252 |
| | 255 |
| | 267 |
|
| Kentucky | 665 |
| | 640 |
| | 660 |
|
| Mississippi | 1,016 |
| | 999 |
| | 1,023 |
|
| North Carolina | 57 |
| | 58 |
| | 58 |
|
| Tennessee | 7,041 |
| | 6,968 |
| | 7,189 |
|
| Virginia | 47 |
| | 48 |
| | 50 |
|
| Subtotal | 10,602 |
| | 10,472 |
| | 10,829 |
|
| Off-system sales | 6 |
| | 7 |
| | 18 |
|
Revenue capitalized during pre-commercial plant operations(1) | (22 | ) | | (18 | ) | | — |
|
| Revenue from sales of electricity | 10,586 |
| | 10,461 |
| | 10,847 |
|
| Other revenues | 153 |
| | 155 |
| | 156 |
|
| Total operating revenues | $ | 10,739 |
| | $ | 10,616 |
| | $ | 11,003 |
|
Note
(1) Represents revenue capitalized during pre-commercial operationsThe COVID-19 pandemic is an evolving situation, and TVA will continue to monitor and adjust its response as necessary to ensure reliable service while protecting the safety and health of $22 million at Watts Bar Nuclear Plant ("Watts Bar") Unit 2, Paradise Combined Cycle Plant,its workforce. See Item 7, Management's Discussion and Allen Combined Cycle Plant in 2017Analysis of Financial Condition and $18 million at Watts Bar Unit 2 in 2016. See Note 1Results of Operations — Pre-Commercial Plant Operations.Key Initiatives — COVID-19 Pandemic for an expanded discussion of the impact to TVA and related initiatives.
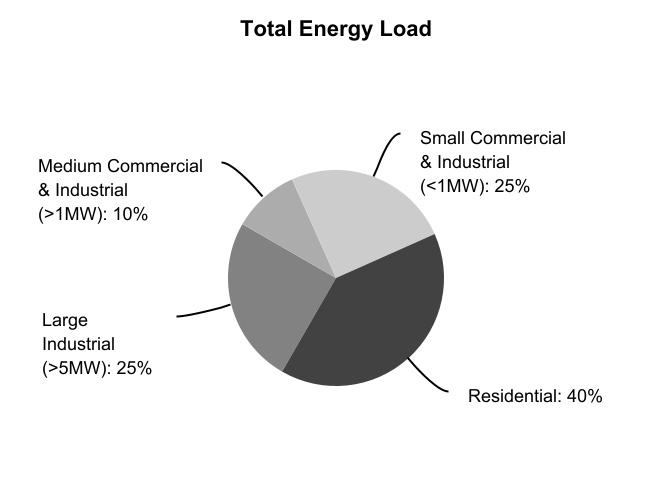
Customers
TVA is primarily a wholesaler of power, selling power to LPCs whichthat then resell power to their customers at retail rates. TVA’sTVA's LPCs consist of (1) municipalities and other local government entities ("municipalities") and (2) customer-owned entities ("cooperatives"). These municipalities and cooperatives operate public power electric systems whose primary purpose is not to make a profit but to supply electricity to the general public or the cooperative'scooperatives' members. TVA also sells power directly to certain end-use customers, primarily large commercial and industrial loads and federal agencies with loads larger than 5,000 kilowatts ("kW"). Whether TVA or aan LPC serves a new power customer is determined by reference to the applicable TVA-LPC wholesale power contract. TheEach contract contains a formula that balances the size of the LPC and the amount of any TVA infrastructure investment to determine which party is entitled to serve the new customer. In addition, power in excess of the needs of the TVA system may, where consistent with the provisions of the TVA Act, be sold under exchange power arrangements with other specific electric systems. See Item 7, Management's Discussion and Analysis of Financial Condition and Results of Operations — Results of Operations — Financial Results — Operating Revenues.and Note 18 — Revenue for details regarding operating revenues for each of the last three years.
|
| | | | | | | | | | | |
Operating Revenues by Customer Type For the years ended September 30 (in millions) |
| | 2017 | | 2016 | | 2015 |
| Revenue from sales of electricity | | | | | |
| Local power companies | $ | 9,741 |
| | $ | 9,696 |
| | $ | 9,998 |
|
| Industries directly served | 735 |
| | 649 |
| | 701 |
|
| Federal agencies and other | 132 |
| | 134 |
| | 148 |
|
Revenue capitalized during pre-commercial plant operations(1) | (22 | ) | | (18 | ) | | — |
|
| Revenue from sales of electricity | 10,586 |
| | 10,461 |
| | 10,847 |
|
| Other revenues | 153 |
| | 155 |
| | 156 |
|
| Total operating revenues | $ | 10,739 |
| | $ | 10,616 |
| | $ | 11,003 |
|
Note
(1) Represents revenue capitalized during pre-commercial operations of $22 million at Watts Bar Unit 2, Paradise Combined Cycle Plant, and Allen Combined Cycle Plant in 2017 and $18 million at Watts Bar Unit 2 in 2016. See Note 1 — Pre-Commercial Plant Operations.
Local Power CompaniesCompany Customers
Revenues from LPCs accounted for approximately 91 percent of TVA’sTVA's total operating revenues in 2017. At September 30, 2017,for 2021. TVA had wholesale power contracts with 154 LPCs.153 LPCs at September 30, 2021. Each of these contracts requires the LPC to purchase from TVA all of itsthe electric power andrequired for service to the LPC's customers; however, flexibility agreements available to LPCs that have executed long-term contracts with TVA allow LPCs to locally generate or purchase up to approximately five percent of average total hourly energy consumed within the TVA service area. Nearly allsales over 2015 - 2019 in order to meet their individual customers' needs. LPCs purchase power under contracts that requirewith terms of five ten, or fifteen20 years notice to terminate.
The number of LPCs with the contract arrangements described below, the revenues derived from such arrangements in 2017, and the percentage of TVA’s 2017 total operating revenues represented by these revenues are summarized in the table below.
|
| | | | | | | | | |
TVA Local Power Company Customer Contracts At September 30, 2017 |
Contract Arrangements(1) | Number of LPCs | | Sales to LPCs in 2017 (in millions) | | Percentage of Total Operating Revenues in 2017 |
| 20-year termination notice | 2 |
| | $ | 36 |
| | 0.3 | % |
| 15-year termination notice | 10 |
| | 351 |
| | 3.3 | % |
| 12-year termination notice | 1 |
| | 24 |
| | 0.2 | % |
| 10-year termination notice | 53 |
| | 3,554 |
| | 33.1 | % |
| 6-year termination notice | 1 |
| | 46 |
| | 0.4 | % |
| 5-year termination notice | 87 |
| | 5,730 |
| | 53.3 | % |
| Total | 154 |
| | $ | 9,741 |
| | 90.6 | % |
Note
(1) Ordinarily, the LPCs and TVA have the same termination notice period; however, in contracts with five of the LPCs with five-year termination notices, TVA has a 10-year termination notice (which becomes a five-year termination notice if TVA loses its discretionary wholesale rate-setting authority). Two of the LPCs have five-year termination notices or a shorter period if any act of Congress, court decision, or regulatory change requires or permits that election. Also, under TVA’s contract with Bristol Virginia Utilities, a five-year termination notice may not be given by the LPC until January 2018.
TVA’sTVA's two largest LPCs — Memphis Light, Gas and Water Division ("MLGW") and Nashville Electric Service ("NES") — have contracts with a five-year and 10-yeara 20-year termination notice periods,period, respectively. Sales to MLGW and NES accounted for 10nine percent and nineeight percent, respectively, of TVA’sTVA's total operating revenues for 2021. Certain LPCs, including MLGW, are evaluating options for future energy choices. In addition, in 2017.January 2021, four LPCs filed a complaint and petition with FERC asking FERC to order TVA to provide transmission and interconnection service to the LPCs or other suppliers that want to serve them. In August 2021, one of the LPCs notified FERC of its withdrawal from the complaint and petition. The remaining three LPCs accounted for three percent of TVA's total operating revenues for the year ended September 30, 2021. See Note 23 — Commitments and Contingencies — Legal Proceedings — Challenge to Anti-Cherrypicking Amendment for updates to this legal proceeding.
TVA and LPCs continue to work together to meet the changing needs of consumers around the Tennessee Valley. In 2019, the TVA Board approved a Partnership Agreement option that better aligns the length of LPC power contracts with TVA's long-term commitments. Under the partnership arrangement, the LPC power contracts automatically renew each year and have a 20-year termination notice. The partnership arrangements can be terminated under certain circumstances, including TVA's failure to limit rate increases as provided for in the agreements going forward. Participating LPCs receive benefits including a 3.1
percent wholesale bill credit in exchange for their long-term commitment, which enables TVA to recover its long-term financial commitments over a commensurate period. In June 2020, TVA provided participating LPCs a flexibility option that allows them to locally generate or purchase up to approximately five percent of average total hourly energy sales over 2015 - 2019 in order to meet their individual customers' needs. As of November 12, 2021, 145 LPCs had signed the 20-year Partnership Agreement with TVA, and 74 LPCs had signed a Flexibility Agreement.
The power contracts between TVA and LPCs provide for the purchase of power by LPCs at the wholesale rates established by the TVA Board. Under Section 10 of the TVA Act, the TVA Board is authorized to regulate LPCs to carry out the purposes of the TVA Act through contract terms and conditions as well as through rules and regulations. TVA regulates LPCs primarily through the provisions of TVA’sTVA's wholesale power contracts. All of the power contracts between TVA and the LPCs require that power purchased from TVA be sold and distributed to the ultimate consumer without discrimination among consumers of the same class and prohibit directlydirect or indirectlyindirect discriminatory rates, rebates, or other special concessions. In addition, there are a number of wholesale power contract provisions through which TVA seeks to ensure that the electric system revenues of the LPCs are used only for electric system purposes. Furthermore, almost all of these contracts specify the resale rates and charges at which the LPC must resell TVA power to its customers. These rates are revised from time to time, subject to TVA approval, to reflect changes in costs, including changes in the wholesale cost of power.
TVA also regulates LPC policies for customer deposits, termination of service for nonpayment,non-payment, information to consumers, and billing through a service practice policy framework. TVA’sTVA's regulatory framework provides for consistent regulatory policy for ratepayers across the Tennessee Valley, while recognizing local considerations. The regulatory provisions in TVA’sTVA's wholesale power contracts are designed to carry out the objectives of the TVA Act, including the objective of providing for an adequate supply of power at the lowest feasible rates. See Rates — Rate Methodology below.
Other Customers
Revenues from directly served industrial customers accounted for approximately seven percent of TVA’sTVA's total operating revenues in 2017.2021. Contracts with these customers are subject to termination by the customer or TVA upon a minimum notice period that varies according to a number of factors, including the customer’scustomer's contract demand and the period of time service has been provided. TVA also serves seven federal customers, includingincluding U.S. Department of Energy ("DOE") facilities and military installations, which accounted for approximately one percent of TVA’sTVA's total operating revenues in 2017.2021.
Other revenue consists primarily of wheeling and network transmission charges, sales of excess steam that is a by-product of power production, delivery point charges for interconnection points between TVA and the customer, and certain other minor items. Other revenue accounted for approximately one percent of TVA's total operating revenues in 2021.
Rates
Rate Authority
The TVA Act gives the TVA Board sole responsibility for establishing the rates TVA charges for power. These rates are not subject to judicial review or to review or approval by any state or other federal regulatory body. Under the TVA Act, TVA is required to charge rates for power that will produce gross revenues sufficient to provide funds for:
•Operation, maintenance, and administration of its power system;
•Payments to states and counties in lieu of taxes ("tax equivalents");
•Debt service on outstanding indebtedness;
•Payments to the U.S. Treasury in repayment of and as a return on the government's appropriation investment in TVA's power facilities (the "Power Program Appropriation Investment"); and
•Such additional margin as the TVA Board may consider desirable for investment in power system assets, retirement of outstanding bonds, notes, or other evidences of indebtedness ("Bonds")Bonds in advance of their maturity, additional reduction of the Power Program Appropriation Investment, and other purposes connected with TVA’sTVA's power business.
In setting TVA’s rates, the TVA Board is charged by the TVA Act to havebusiness, having due regard for the primary objectives of the TVA Act, including the objective that power shall be sold at rates as low as are feasible. See Note 19 — Proprietary Capital.
TVA fulfilled its requirement to repay $1.0 billion of the Power Program Appropriation Investment in 2014; therefore, the repayment of this amount is no longer a component of rate setting.
Rate Methodology
In view of demand for electricity, the level of competition, and other relevant factors, TVA believes it is reasonable to assume that rates, set at levels that will recover TVA's costs, can be charged and collected from customers. Further, the TVA Board has the discretion to determine when costs will be recovered in rates. As a result of these factors, TVA records certain assets and liabilities that result from the self-regulated ratemaking process that could not otherwise be so recorded under accounting principles generally accepted in the United States. See Note 1 — Cost-Based Regulation and Note 7.
TVA uses a seasonal time of use wholesale rate structure that is comprised of base demand and energy rates, a basefuel rate, and a fuel rate that is automatically determined each month by the operation of the fuel cost adjustment formula.grid access charge ("GAC"). In setting the base rates, TVA uses a debt-service coverage ("DSC") methodology to derive annual revenue requirements in a manner similar to that used by other public power entities that also use the DSC rate methodology. Under the DSC methodology, rates are calculated so that an entity will be able to cover its operating costs and to
satisfy its obligations to pay principal and interest on debt.debt, plus an additional margin. This ratemaking approach is particularly suitable for use by entities financed primarily, if not entirely, by debt, such as TVA.
TVA's revenue requirements for costs or projected costs (other than the fuel, purchased power,TVA, and related costs
covered by the fuel rate) are calculated under the DSC methodology in order to producehelps ensure that TVA produces gross revenues sufficient to fund requirements specified in the TVA Act listed under Rate Authority above. above.
The DSC methodology reflects the cause-and-effect relationship between TVA's costs and the corresponding rates it
charges for power. Once the revenue requirements (or projected costs) are determined, they are compared to the projected revenues for the year in question, at existing rates, to arrive at the shortfall or surplus of revenues as compared to the projected costs. Power rates are adjusted by the TVA Board to a level deemed to be sufficient to produce revenues approximately equal to projected costs (exclusive of the costs collected through the fuel rate).
A comprehensive rate restructuring was approved by the TVA Board on August 21, 2015, and implemented on October 1, 2015. The rate restructuring resulted in structural changes to base rates to improve cost alignment with capacity-related on-peak demand charges and seasonal time-of-use ("TOU") energy rates that differ by on-peak and off-peak periods to better reflect how TVA incurs generation costs. Minor changes in revenue allocation were made to improve alignment with cost-of-service, to keep industrial rates competitive, and to keep residential rates affordable. The 2015 TOU rate was unanimously adopted by TVA’s LPCs and by nearly all of TVA’s directly served customers.
TVA recovers fuel costs and tax equivalentsequivalent payments associated with fuel cost adjustments through a monthly rate adjustment reflecting the forecasted costs paid by TVA forof fuel. PriorFuel costs are allocated to fiscal year 2016, all customers paid the same monthly base fuel rate. On August 21, 2015, the TVA Board approved a new methodology to more accurately allocate fuel costs to twothree groups of customers: Standard Service (residential and small commercial customers), large manufacturing customers with contract demands greater than 5 megawatts ("MW"), and Non-Standard Service (large commercial and industrial customers), eachlarge general service customers with a different monthly fuel rate better reflecting their group’s contribution to total fuel costs. contract demands greater than 5 MW. Fuel costs are now allocated to these customer groupsthree classes of customers in relation to their average hourly loads and TVA's hourly incremental dispatch costs.cost. Total monthly fuel costs include costs for natural gas, fuel oil, coal, purchased power, emission allowances, nuclear fuel, and other fuel-related commodities as well as realized gains and losses on derivatives purchased to hedge the costs of such commodities.
In 2013,prior years, TVA, LPCs, and directly served industries developed changes to TVA's rate structures that focus on TVA's long-term pricing efforts. These changes improved pricing by better aligning rates with underlying cost drivers and by sending improved pricing signals, while maintaining competitive industrial rates and keeping residential rates affordable. The rate structures also reduced wholesale energy rates for Standard Service and introduced a GAC at an offsetting rate to better recover fixed costs. This approach more accurately reflects the wholesale cost of energy and recognizes the value of the grid's reliability and associated fixed costs. TVA's modernized approach to pricing provides bill stability while maintaining reliability and fairness for all TVA's customers. TVA Board approved continuing the collection of Environmental Adjustment ("EA") chargeswill continue to fund investment in environmental projects. TVA’s EA was modified in 2015 to conform to the new wholesale and large-customer base rate designs. While revised slightly, the EA was designed to collect approximately the same revenue as before the rate structuring, approximately $415 million and $421 million in 2017 and 2016, respectively.
Subsequent to discussionscollaborate with LPCs over the past two years, TVA made a rate change proposal to LPCs around the need for further improvements to wholesale and retail pricing during the fourth quarter of 2017. It is intended that changes keep rates low, ensure fairness in rates, and bring more stability in bills while being more responsive to customer choices. The proposed changes account for reliable grid servicedirectly served industries as necessary to ensure 24/7 on-demand energy when distributed energy resources mayalignment with this approach.
not be available. In addition, it is anticipated that the proposed changes would allow consumers to make more informed investment decisions and stimulate economic growth.
On August 23, 2017, the TVA Board approved an annual base rate adjustment with the goal of increasing 2018 revenues by approximately $195 million. This adjustment equates to an approximately 2.4 percent wholesale rate increase (excluding fuel).
Power Supply and Load Management Resources
General
TVA seeks to balance production capabilities with power supply requirements by promoting the conservation and efficient use of electricity and, when necessary, buying, building, or leasing assets or entering into power purchase agreements.agreements ("PPAs"). TVA also intendsseeks to employ a diverse mix of energy generating sources and is workingworks toward obtaining greater amounts of its power supply from clean (low or zero carbon emitting) resources.
TVA is making investments in its generating portfolio to modernize the fleet while also allowing TVA to maintain competitive rates and high reliability and work toward carbon emission reductions. As TVA continues to evaluate the impact of retiring its coal-fired fleet by 2035, it is also evaluating adding flexible lower carbon-emitting gas plants as a bridging strategy to maintain reliability, such as the ongoing projects at TVA’s Paradise and Colbert sites. In addition, TVA is committed to investing in the future of nuclear with the evaluation of emerging advanced nuclear technologies, such as small modular reactors ("SMRs"), and has uprated the existing Browns Ferry units to generate more low-cost, reliable, and carbon-free energy. TVA is also implementing the Hydro Life Extension Program with a focus on improving the availability and flexibility of the hydroelectric fleet. See Item 7, Management's Discussion and Analysis of Financial Condition and Results of Operations — Key Initiatives — Generation Resources — Extended Power Uprate, Natural Gas-Fired Units, and Small Modular Reactors, in addition to Renewable Energy Resources — Hydro Modernization Program below.
In addition, TVA and other utilities across the southeastern United States are exploring the creation of an automated energy exchange platform across the region to facilitate more short-term power exchanges. The energy exchange would be an enhancement to the existing market. See Item 7, Management's Discussion and Analysis of Financial Condition and Results of Operations — Key Initiatives — Automated Energy Exchange Platform.
Power generating facilities operated by TVA at September 30, 2017,2021, included three nuclear sites, 17 natural gas and/or oil-fired sites, five coal-fired sites, 29 conventional hydroelectric sites, one pumped-storage hydroelectric site, eight coal-fired sites, three nuclear sites, 16 natural gas and/or oil-fired sites, one diesel generator site, 16and 13 solar energy sites, digester gas cofiring capacity at one coal-fired site, and biomass cofiring potential (located at coal-fired sites), although certain of these facilities were out of service as of September 30, 2017.installations. See Item 2, Properties — Generating Properties — Net Capability for a discussion of the units at these facilities. TVA also acquires power under power purchase agreementsPPAs of varying durations, including short-term contracts of less than 24-hours in duration. See Item 7, Management's Discussion and Analysis of Financial Condition and Results of Operations — Results of Operations — Financial Results — Operating Expenses.
The following charts showtable shows TVA's generation and purchased power by generating source as a percentage of all
electric power generated and purchased (based on kilowatt hours ("kWh")) for the periods indicated: | | | | | | | | | | | | | | | | | | | | |
Total Power Supply by Generating Source For the years ended September 30 |
Generation Resource(1) | | 2021 | | 2020 | | 2019 |
| Nuclear | | 41% | | 42% | | 39% |
| Natural gas and/or oil-fired | | 21% | | 22% | | 20% |
| Coal-fired | | 15% | | 13% | | 17% |
| Hydroelectric | | 10% | | 10% | | 10% |
| Purchased power (non-renewable) | | 8% | | 8% | | 9% |
| Purchased power (renewable) | | 5% | | 5% | | 5% |
Note Note
Renewable(1) TVA's non-hydro renewable resources (non-hydro) from TVA facilities are less than one percent for all periods shown, and therefore are not represented on the chartstable above. Purchased power (renewable) contains the majority of non-hydro renewable energy supply.
Nuclear
At September 30, 2017,2021, TVA had three nuclear sites consisting of seven units in operation. The units at Browns Ferry Nuclear Plant ("Browns Ferry") are boiling water reactor units, and the units at Sequoyah Nuclear Plant ("Sequoyah") and Watts Bar Nuclear Plant ("Watts Bar") are pressurized water reactor units. StatisticsOperating information for each of these operating units areis included in the table below.
| | | | | | | | | | | | | | | | | | | | |
TVA Nuclear Power At September 30, 2021 |
Nuclear Unit | | Summer Net Capability (MW) | | Net Capacity Factor for 2021 (%) | | Date of Expiration
of Operating
License |
Browns Ferry Unit 1(1) | | 1,227 | | 87.7 | | 2033 |
Browns Ferry Unit 2(1) | | 1,208 | | 83.3 | | 2034 |
Browns Ferry Unit 3(1) | | 1,227 | | 99.3 | | 2036 |
| Sequoyah Unit 1 | | 1,152 | | 85.9 | | 2040 |
| Sequoyah Unit 2 | | 1,140 | | 97.2 | | 2041 |
| Watts Bar Unit 1 | | 1,157 | | 95.4 | | 2035 |
| Watts Bar Unit 2 | | 1,164 | | 74.8 | | 2055 |
|
| | | | | | |
TVA Nuclear Power At September 30, 2017 |
Nuclear Unit | | Nameplate Capacity (MW) | | Net Capacity Factor for 2017 (%) | | Date of Expiration of Operating License |
| Sequoyah Unit 1 | | 1,221 | | 83.5 | | 2040 |
| Sequoyah Unit 2 | | 1,221 | | 86.5 | | 2041 |
| Browns Ferry Unit 1 | | 1,264 | | 89.1 | | 2033 |
| Browns Ferry Unit 2 | | 1,190 | | 82.6 | | 2034 |
| Browns Ferry Unit 3 | | 1,190 | | 97.4 | | 2036 |
| Watts Bar Unit 1 | | 1,270 | | 83.6 | | 2035 |
| Watts Bar Unit 2 | | 1,220 | | 54.8 | | 2055 |
Extended Power Uprate. On August 14, 2017,(1) Summer net capability for Browns Ferry includes the Nuclear Regulatory Commission ("NRC") approved TVA’s request for a 465 MWimpact of the extended power uprate ("EPU") project at Browns Ferry. TVA plans to begin implementing the EPU project during the plant refueling outageswhich was finalized in the spring2021 through issuance of 2018 for Unit 3, the fall of 2018 for Unit 1, and the spring of 2019 for Unit 2. Full EPU power is expected be achieved following the noted outages for each unit. related engineering memos. See Item 7, Management’sManagement's Discussion and Analysis of Financial Condition and Results of Operations — Key Initiatives and Challenges — Generation Resources — Extended Power Uprate and Note 21—Administrative Proceeding Regarding Browns Ferry Nuclear Plant Extended Power Uprate.
Other Nuclear Initiatives. TVA has submittedThe NRC issued an Early Site Permit Application to the NRCTVA in December 2019 to license small modular reactors ("SMRs")SMRs at TVA’sTVA's Clinch River Nuclear Site in Oak Ridge, Tennessee. See Item 7, Management’sManagement's Discussion and Analysis of Financial Condition and Results of Operations — Key Initiatives and Challenges — Generation Resources — Small Modular Reactors.
Other Nuclear Matters. Operating nuclear facilities subjects TVA to waste disposal, decommissioning, and insurance requirements, as well as litigation risks. See Fuel Supply — Nuclear Fuel below for a discussion of spent nuclear fuel and low-level radioactive waste, Note 21 23 — Commitments and Contingencies — Contingencies for a discussion of TVA's nuclear decommissioning liabilities and the related trust and nuclear insurance, and Note 21 23 — Commitments and Contingencies — Legal Proceedings and Item 7, Management's Discussion and Analysis of Financial Condition and Results of Operations — Key Initiatives and Challenges — Apparent Violations of NRC Regulations for a discussion of legal and administrative proceedings related to TVA's nuclear program, which discussions are incorporated herein by reference.
Natural Gas and/or Oil-Fired
At September 30, 2021, TVA's natural gas and oil-fired fleet consisted of 101 combustion turbine power blocks (86 simple-cycle units, one cogeneration unit, and 14 combined-cycle power units), accounting for 12,183 MW of summer net capability. Sixty-six of the simple-cycle units are currently capable of quick-start response allowing full generation capability in approximately 10 minutes. The economic dispatch of natural gas-fired plants depends on both the day-to-day price of natural gas and the price of other available intermediate resources such as coal-fired plants. TVA uses simple-cycle units to meet peaking or backup power needs. TVA's 2019 IRP projects significant solar expansion over the next decade. The natural gas-fired fleet supports that expansion by providing reliability across all hours, as well as the flexibility to help manage ramping and intermittency. As TVA evaluates its coal-fired fleet, it will also evaluate adding flexible lower carbon-emitting gas plants as a bridging strategy.
See Item 2, Properties — Generating Properties, Note 8 — Leases, Note 11 — Variable Interest Entities, andNote 14 — Debt and Other Obligations for a discussion of lease arrangements into which TVA has entered in connection with certain combustion turbine units. Because of TVA's strategy of portfolio diversification and reduction of air emissions, TVA may decide to make further strategic investments in natural gas-fired facilities in the future by purchase, construction, or lease. See Item 7, Management's Discussion and Analysis of Financial Condition and Results of Operations — Key Initiatives and Challenges — Generation Resources— Natural Gas-Fired Units for a discussion of ongoing projects at certain natural gas-fired facilities.
Coal-Fired
At September 30, 2021, TVA began itshad five coal-fired plant construction program in the 1940s, and its coal-firedplants consisting of 25 active units, were placed in service between 1951 and 1973. Coal-fired units are either active or retired.accounting for 6,580 MW of summer net capability. TVA considers units to be in an active state when the unit is generating, available for service, or temporarily unavailable due to equipment failures, inspections, or repairs. All other coal-fired units are considered retired. AsIn 2018, the TVA Board approved a plan to perform assessments of September 30, 2017,Bull Run Fossil Plant ("Bull Run") and Paradise Fossil Plant ("Paradise"). Results of these assessments were presented to the TVA had eight coal-fired plants consistingBoard at its February 2019 meeting, and the Board approved the retirement of 33 active units, accounting for 9,055 MW of summer net capability,Paradise Unit 3 by December 2020 and 26 retired units.Bull Run by December 2023. Paradise Unit 3 was taken offline on February 1, 2020, effectively retiring the plant.
Coal-fired plants have been subject to increasingly stringent regulatory requirements over the last few decades, including those under the Clean Air Act ("CAA"), the Clean Water Act ("CWA"), and the regulations promulgated thereunder.Resource Conservation and Recovery Act ("RCRA"). TVA has committed to a programmatic approach for the evaluation of its sites where coal combustion residuals ("CCR") are stored to meet all applicable state and federal regulations. Increasing regulatory costs and carbon reduction efforts have caused TVA to consider whether or not to make the required capital investments to continue operating theseits coal-fired facilities. In April 2011, TVA entered into two agreements (collectively, the "Environmental Agreements") to address a dispute under the CAA. The first agreement is a Federal Facilities Compliance Agreement with the Environmental Protection Agency ("EPA"). The second agreement is with Alabama, Kentucky, North Carolina, Tennessee,See Item 7, Management's Discussion and three environmental advocacy groups: the Sierra Club, National Parks Conservation Association,Analysis of Financial Condition and Our Children’s Earth Foundation. Under the Environmental Agreements, TVA agreed to retire 18Results of its 59 coal-fired units by the end of 2017Operations — Key Initiatives and was generally absolved from any liability, subject to certain limitations and exceptions, under the New Source Review ("NSR") requirements of the CAA for maintenance, repair, and component replacement projects that were commenced at TVA's coal-fired units prior to the execution of the agreements. TVA also agreed to retire, repower, or install air pollution controls on 16 of the remaining coal-fired units. Failure to comply with the terms of the Environmental Agreements would subject TVA to penalties stipulated in the agreements. TVA is taking the actions necessary to comply with the Environmental Agreements, and is confident that it has adequate capacity to meet the needs of its customers after units are retired under the Environmental Agreements. See Natural Gasand/or Oil-Fired below.Challenges — Generation Resources— Coal Combustion Residuals Facilities.
The following table summarizes the actions TVA is required to take under the Environmental Agreements and other coal-fired generation related actions taken or to be taken by TVA.
|
| | | | | |
Fossil Plant
| Units | Existing Scrubbers and SCRs(1)
| Requirements Under Environmental Agreements
| Actions Taken by TVA | Actions Planned to be Taken by TVA |
Allen | 3 | SCRs on all three units | - Install scrubbers or retire no later than December 31, 2018 | - The TVA Board approved the construction of a gas-fired plant at the current location of the Allen coal-fired site | - Retire Units 1-3 after completion of the gas-fired plant, before December 31, 2018 |
Bull Run | 1 | Scrubber and SCRs on unit | - Continuously operate existing emission control equipment | - Continuously operate existing emission control equipment | - Continuously operate existing emission control equipment |
Colbert | 5 | SCR on Unit 5 | - Remove from service, control(2), convert(3), or retire Units 1-4 no later than June 30, 2016
- Remove from service, control(2), or retire Unit 5 no later than December 31, 2015
- Control or retire removed from service units within three years
| - Retired Units 1-5 on April 16, 2016 | - No further action required |
Cumberland | 2 | Scrubbers and SCRs on both units | - Continuously operate existing emission control equipment | - Continuously operate existing emission control equipment | - Continuously operate existing emission control equipment |
Gallatin | 4 | None | - Control(2), convert(3), or retire all four units no later than December 31, 2017
| - The TVA Board approved adding scrubbers and SCRs on all four units
- Scrubbers added to four units during 2016
- Two SCRs placed in service in 2017 | - Place remaining two SCRs in service by December 31, 2017 |
John Sevier | 4 | None | - Retire two units no later than December 31, 2012
- Remove from service two units no later than December 31, 2012 and control(2), convert(3), or retire those units no later than December 31, 2015
| - Retired Units 1 and 2 on December 31, 2012
- Retired Units 3 and 4 on June 25, 2014 | - No further action required |
Johnsonville | 10 | None | - Retire six units no later than December 31, 2015
- Retire four units no later than December 31, 2017 | - Retired Units 5-10 on December 31, 2015
| - Retire Units 1-4 by December 31, 2017
|
Kingston | 9 | Scrubbers and SCRs on all nine units | - Continuously operate existing emission control equipment | - Continuously operate existing emission control equipment | - Continuously operate existing emission control equipment |
Paradise | 3 | Scrubbers and SCRs on all three units | - Upgrade scrubbers on Units 1 and 2 no later than December 31, 2012
- Continuously operate emission control equipment on Units 1-3 | - The TVA Board approved the construction of a gas-fired plant at the current location of the Paradise coal-fired plant
- Upgraded scrubbers on Units 1 and 2 - Retired Units 1 and 2 on April 15, 2017 | - Continuously operate existing emission control equipment on Unit 3 |
Shawnee | 10 | None | - Control(2), convert(3), or retire Units 1 and 4 no later than December 31, 2017
| - Retired Unit 10 on June 30, 2014 | - Add scrubbers and SCRs on Units 1 and 4 by December 31, 2017
- Continuously operate existing emission control equipment |
Widows Creek | 8 | Scrubbers and SCRs on Units 7 and 8 | - Retire two of Units 1-6 no later than July 31, 2013
- Retire two of Units 1-6 no later than July 31, 2014
- Retire two of Units 1-6 no later than July 31, 2015 - Continuously operate existing emissions control equipment on Units 7 and 8 | - Retired Units 3 and 5 on July 31, 2013
- Retired Units 1, 2, 4, and 6 on July 31, 2014
- Retired Units 7 and 8 on September 30, 2015 | - No further action required |
Notes
(1) Selective catalytic reduction systems ("SCRs")
(2) If TVA decides to add emission controls to these units, TVA must continuously operate the emission controls once they are installed.
(3) Convert to renewable biomass
After TVA completes the actions described in the above table, TVA anticipates that it will have 7,891 MW of summer net capability of coal-fired generation, a reduction of 6,682 MW from TVA's coal-fired capacity as of September 30, 2010. TVA is moving toward a more balanced generation plan with greater reliance on lower-cost and cleaner energy generation technologies.TVA’s long-range plans will continue to consider the costs and benefits of significant environmental investments at its remaining coal-fired plants.
Natural Gas and/or Oil-Fired
On Since September 30, 2017, TVA’s natural gas and oil-fired fleet consisted of 102 combustion turbine power blocks (87 simple-cycle units and 15 combined-cycle power blocks). The 87 simple-cycle units provide a maximum of 5,731 MW of2010, TVA has reduced its summer net capability. The 15 combined-cycle power blocks provide a maximumcapability of 5,672 MW of summer net capability. Eightycoal-fired units by 7,653 MW. Following the publication of the simple-cycle units and one combined-cycle power block are fueled by either natural gas or fuel oil. The remaining seven simple-cycle units and 14 combined-cycle power blocks are fueled by natural gas only. Sixty2019 IRP, TVA began conducting end-of-life evaluations of the simple-cycle unitsremaining coal fleet to inform long-term planning. TVA’s recent evaluation confirms that the aging coal fleet is among the oldest in the nation and is experiencing deterioration of material condition and performance challenges. The performance challenges are currently capable of quick-start response allowing full generation capability in approximately 10 minutes. The economic dispatch of natural gas-fired plants depends on bothprojected to increase due to the day-to-day price of natural gascoal fleet’s advancing age and the pricedifficulty of other available intermediate resources like coal-fired plants.adapting the coal fleet’s generation within the changing generation profile. Additionally, the coal fleet is contributing to environmental, economic, and reliability risks. TVA uses simple-cycle units to meet peaking or backup power needs.
TVA’s strategyis evaluating the impact of portfolio diversification and air emissions reductions includesretiring the addition of natural gas-fired plants to its generation fleet. In April 2017, TVA completed a natural gas-fired facility at the Paradise Fossil Plant ("Paradise") with a generation capacity of approximately 1,100 MW. At September 30, 2017, TVA had one natural gas-fired generation facility under construction. The facility, with an expected generation capacity of approximately 1,100 MW, is being constructed at the Allen Fossil Plant ("Allen"). This facility is expected to be completed in 2018. Upon completionbalance of the facility at Allen, the existing coal-fired units will be retired.fleet by 2035, and that evaluation includes environmental review, public input, and TVA Board approval. See Item 7,Management's Discussion and Analysis of Financial Condition and Results of Operations — Key Initiatives and Challenges — Generation Resources — Natural Gas-Fired Units.
See Item 2, Properties — Generating Properties, Note 9, Note 10, andNote 13for a discussion of lease arrangements into which TVA has entered in connection with certain combustion turbine units. Because of TVA's strategy of portfolio diversification and reduction of air emissions, TVA may decide to make further strategic investments in natural gas-fired facilities in the future by purchase, construction, or lease.
Hydroelectric
Conventional Hydroelectric Dams. TVA maintains 29 conventional hydroelectric dams with 109 generating units throughout the Tennessee River system for the production of electricity. At September 30, 2017, these units accounted for 3,777 MW of summer net capability. The amount of electricity that TVA is able to generate from its hydroelectric plants depends on a number of factors, including the amount of precipitation and runoff, initial water levels, generating unit availability, and the need for water for competing water management objectives. When these factors are unfavorable, TVA must increase its reliance on higher cost generation plants and purchased power. In addition, a portion of energy generated by nine U.S. Army Corps of Engineers ("USACE") dams on the Cumberland River system contribute to the TVA power system. See Weather and Seasonality below andItem 7,Management's Discussion and Analysis of Financial Condition and Results of Operations— Key Initiatives and Challenges — Dam Safety and Remediation Initiatives.Generation Resources — Optimum Energy Portfolio.
Raccoon Mountain Pumped-Storage Plant. The four units at Raccoon Mountain Pumped-Storage Plant ("Raccoon Mountain") were placed in service during 1978 and 1979. The units, with a total net summer capability of 1,616 MW, are utilized to balance the transmission system as well as generate power. TVA uses electricity generated by its coal-fired and nuclear plants during periods of low demand to operate pumps that fill the reservoir at Raccoon Mountain. Then, during period of high or peak demand, the water is released and the pumps reverse to work as power generating turbines.
Hiwassee Hydro Unit 2. Hiwassee Hydro Unit 2 has a unique reversible turbine/generator that acts as a pump and a turbine enhancing TVA’s ability to balance baseload generation. Hiwassee Hydro Unit 2 has a summer net capability of 86 MW.
Hydro Modernization Program. In 1992, TVA began a Hydro Modernization Program to address reliability issues related to its hydroelectric units. At September 30, 2017, modernization had been completed on 59 conventional hydroelectric units, including Pickwick Landing Dam ("Pickwick") Unit 4 and Watauga Unit 1 in 2017, and Raccoon Mountain. The modernization projects resulted in 432 MW of increased capacity from the conventional hydroelectric units, with an average efficiency gain of approximately five percent. Pickwick Unit 3 and South Holston Unit 1 are currently undergoing major maintenance projects to ensure long-term reliability. Hydroelectric generation will continue to be an important part of TVA's energy mix, so TVA continues to assess its remaining conventional hydroelectric units for opportunities to improve reliability through major maintenance projects.
Other Renewable Energy Resources
TVA's renewable energy portfolio includes both TVA-owned assets and renewable energy purchases. TVA owns 16 solar sites. Certain coal-fired units have the capability for digester gas and biomass cofiring, which is accounted for as coal-fired generation summer net capability. The TVA-owned solar sites provide approximately 1 MW of summer net capability.
TVA tracks its renewable energy claims through the management of renewable energy certificates ("RECs"). The RECs, which each represent 1 MWh of renewable energy generation, are principally associated with non-hydroelectric renewable energy. In May 2017, TVA retired over 4.5 million RECs, which were principally from purchased power. Additionally, TVA retires RECs on behalf of customers in the Green Power Switch®("GPS") program and other customer-based programs that enable customers to claim RECs.
Diesel Generators
As of At September 30, 2017,2021, TVA had one diesel generator plant consisting of five units, and this facility accounted for 9
MW of summer net capability. These units are not currently dispatched for generation to the transmission grid.
Raccoon Mountain Pumped-Storage Plant
At September 30, 2021, TVA had four units at Raccoon Mountain Pumped-Storage Plant ("Raccoon Mountain") with a total net summer capability of 1,635 MW. These units are utilized to balance the transmission system as well as generate power. TVA uses electricity generated by its fleet during periods of low demand to operate pumps that fill the reservoir at Raccoon Mountain. Then, during periods of high or peak demand, the water is released and the pumps reverse to work as power generating turbines.
Renewable Energy Resources
As more consumers and businesses are demanding cleaner energy, the utility industry is evolving to meet those needs. As TVA also evolves, it will see impacts to the way it does business through the pricing of products, transmission of energy, and
development of new products and services for its customers in support of changing customer preferences. Many companies are focusing on sustainability and requiring more energy efficiency and renewable energy options. In addition, TVA also seeks to obtain greater amounts of its power supply from clean resources to work towards carbon emission reductions. As a result, TVA is increasing its renewable energy portfolio, by investing in existing assets and securing power purchase agreements for out-of-Valley wind and in-Valley solar. New utility-scale solar is increasing, in part driven by customers’ demand through TVA’s Green Invest Program. TVA also encourages renewable power and offers renewable solutions through various current programs and offerings. Finally, TVA is investing in its hydroelectric fleet through the Hydro Life Extension Program. See Distributed Energy Resources below for information on renewable energy solutions and Power Purchase and Other Agreements below for information on TVA’s power purchase agreements, including renewable agreements.
Conventional Hydroelectric Dams. TVA maintains 29 conventional hydroelectric dams with 109 generating units throughout the Tennessee River system for the production of electricity. As of September 30, 2021, these units accounted for 3,750 MW of summer net capability. The amount of electricity that TVA is able to generate from its hydroelectric plants depends on a number of factors, including the amount of precipitation and runoff, initial water levels, generating unit availability, and the need for water for competing water management objectives. When these factors are unfavorable, TVA must increase its reliance on higher cost generation plants and purchased power. In addition, a portion of energy generated by nine U.S. Army Corps of Engineers ("USACE") dams on the Cumberland River system contributes to the TVA power system. See Weather and Seasonality below andItem 7,Management's Discussion and Analysis of Financial Condition and Results of Operations — Key Initiatives and Challenges — Dam Safety and Remediation Initiatives.
Hiwassee Hydro Unit 2 has a unique reversible turbine/generator that acts as a pump and a turbine enhancing TVA's ability to balance baseload generation. At September 30, 2021, Hiwassee Hydro Unit 2 accounted for 86 MW of the conventional hydroelectric summer net capability.
Hydro Modernization Program. TVA's Hydro Modernization Program began in 1992 and focused on units with potential to increase peaking capacity and improve reliability. With the completion of Pickwick Landing Dam ("Pickwick") Unit 2 in 2020, the initial Hydro Modernization Program has concluded with modernization completed on 62 conventional hydroelectric units under the program. The modernization projects resulted in 453 MW of increased capacity from the conventional hydroelectric units, with an average efficiency gain of approximately five percent. Hydroelectric generation will continue to be an important part of TVA's energy mix since it plays a vital role in carbon reduction initiatives, the ability to integrate other renewables into the power portfolio, and, ultimately, TVA's ability to meet changing customer preferences for cleaner energy sources. As such, TVA is implementing the Hydro Life Extension Program with a focus on improving the availability and flexibility of the hydroelectric fleet to help meet these changing customer preferences.
Self-Directed Solar. During 2015,2019, the TVA Board approved the 2015 Integrated Resource Planopportunity for TVA to explore being directly involved in the development of a utility-scale solar project, contingent on the successful completion of environmental reviews under National Environmental Policy Act ("IRP"NEPA") as a guide and other applicable laws. A project structure has been developed that will allow TVA to work with financial partners for solar development, and in making decisions aboutSeptember 2021, TVA purchased land for this planned 200 MW development. As of September 30, 2021, TVA had spent approximately $24 million on the project and expects to spend an additional $293 million through 2024.
Other Renewable Energy Resources. TVA's other renewable energy resources include TVA-owned solar and renewable energy purchases, a majority associated with TVA may userenewable programs. In addition to the hydroelectric units above, TVA owns 13 solar installations that account for approximately 1 MW of summer net capability. See Distributed Energy Resources below for a description of TVA's current renewable energy offerings and Power Purchase and Other Agreements for information on renewable energy purchases.
TVA tracks its renewable energy commitments and claims through the management of Renewable Energy Certificates ("RECs"). The RECs, which each represent 1 megawatt-hour ("MWh") of renewable energy generation, are principally associated with wind, solar, biomass, and low-impact hydroelectric. TVA continues to evaluate ways to adjust to customer preferences and requirements for cleaner and greener energy, including the acquisition of RECs from renewable purchased power that can be sold to customers to meet their needs. Overall, TVA will procure needed renewable supply through a diversified approach, which could include a competitive procurement process, strategic partnerships, or construction of renewable facilities to meet these needs.
Total Renewable Energy Resources. As of September 30, 2021, TVA's total renewable capacity, including TVA-owned and operated facilities, operating and contracted PPAs, and TVA's self-directed solar project, amounted to 8,269 MW.
Notes
(1) Contracted resources are executed power purchase agreements expected to come online at a future demanddate.
(2) Hydroelectric power consists of 3,750 MW from TVA-owned conventional hydroelectric facilities and 402 MW from a renewable PPA.
(3) Biomass consists of 49 MW of operating resources and 5 MW of contracted resources.
TVA's operating renewables by location and by source are detailed below:
Notes
(1) In-Valley refers to the renewable energy that is sourced within TVA's service territory. Out-of-Valley refers to the renewable energy that is sourced outside of TVA's service territory and solely consists of wind power.
(2) See Power Purchase and Other Agreements below. PPAs also includes capability from various historical renewable energy programs primarily with individuals and small businesses.
Distributed Energy Resources
Consumer desire for electricityenergy choice, among other things, is driving the expectation for flexible options in the Tennessee Valley. The purpose of integrated resource planning is to meet future power demand by identifying the need for generating capacityelectric industry. TVA and determining the best mix of resources to meet the need on a least-cost, system-wide basis. These resources, together with other options that are typically connected to the distribution systems of the LPCs, represent a new component in the utility marketplace called distributed energy resources ("DER"). The 2015 IRP affirms the merits of a diverse portfolio including energy efficiency/demand response resources and renewable energy. Changes to TVA load forecasts and the recognition of the increasing penetration of generation and energy management technologies require an awareness of the evolving role of energy efficiency, demand response, and renewable generation.
TVA is primarily a wholesale power provider, and the LPCs are the service provider for most end-use customers. Due to this public power business model, TVA is working with LPCs and others in the region to optimize new and existing DER offerings and delivery mechanisms. TVA plans to engage LPCs as it considers new and innovative ways to ensure that evolving resource portfolios remain reliable and provide the most value to all customers. This engagement is part of an emerging DER strategytogether to leverage the strengths of the Tennessee Valley public power model withto provide distributed energy solutions that are economical, sustainable, and flexible. TVA will focus on the safety and reliability impacts of these resources as they are interconnected to the grid and will ensure that the pricing of electricity remains as low as feasible. Additional regulatory considerations and analysis may be required as the distributed energy resources that are economic, sustainable,("DER") market, technologies, and flexible and considers three key focus areas:programs evolve.
Partnerships that position TVA customers as trusted energy advisors,
Pricing aligned to cover cost while adding value to the customer and the TVA system, and
Programs that enable innovation, flexibility, and fair and equitable consumer choice.
DER Programs and Offerings. TVA encourages renewable power through various current programs and offerings. These solutions include:
Small-scale Solutions. The IRP consideredGreen Connect Program, launched in January 2021, connects residential customers interested in on-site solar installations with qualified solar installers.
Mid-scale Solutions. The Flexibility Research Project was a broad rangejoint pilot project with LPCs to enable solutions for situations where the end-use consumer needs onsite renewable or distributed generation. The Flexibility Research Project ceased accepting new applications in January 2021 as TVA introduced other flexible programs and offerings discussed in this section.
Utility-scale Solutions. The Green Invest Program matches customer demand with renewable supply through a Green Invest Agreement. The goal of feasible supply-sidethe Green Invest program is to meet the long-term sustainability needs of customers at scale. TVA will procure the needed renewable supply through a diversified approach, which could include a competitive procurement process, strategic partnerships, or construction of renewable facilities to meet these needs. In addition, Generation Flexibility is a solution available to long-term LPC partners and demand-side options and assessed them with respect to economic and environmental impacts. Energy efficiency was modeled as a selectable, supply-side equivalent resource. Implementing energy efficiency programs will require close cooperation among TVA, local stakeholders, LPCs, and electric customers, particularly aroundsupports the deployment of additional energy efficiency resources. The success of energy efficiency depends on end-use customer participation. Energy efficiency standards, including DOE standards, TVA’s energy efficiency programs, and individual customer and consumer actions, accounted for seven percent of TVA’s 2017 resource mix and six percent of TVA’s 2016 resource mix.
TVA, in cooperation with its customers, continuesup to implement a broad portfolio of programs and projects through the EnergyRight® Solutions ("ERS") program. The ERS program includes electrification, energy efficiency, demand response, and system load enhancement programs and projects designed to help reduce long-term energy supply costs in the TVA service area. Through these programs, TVA realized 379 gigawatt hours ("GWh") and 381 GWh of energy efficiency savings in 2017 and 2016, respectively. This portfolio also provided 1,547 MW and 1,6142,000 MW of demand response in 2017 and 2016, respectively,distributed solar to provide system reliabilityclean, local generation. See Item 7, Management's Discussion and offset the need for new generation.Analysis of Financial Condition and Results of Operations — Key Initiatives and Challenges — Ratemaking.
Other Renewable Energy Programs. TVA's GPS program is a voluntary REC program that supports the production ofSolutions. The Green Switch Program allows customers to support wind, solar, and biomass renewable energy by allowing consumers to purchase such energy blocks eitherresources through the LPCs or from TVA for directly servedcustomers. Supply for the retail portion of the program is sourced from within the TVA service area and sold in 150 kWh blocks. In addition to the GPS program, TVA continues to test a lower-priced bulk option under GPS, Southeastern RECs, that allows for larger customers located within certain portions of TVA's service area to purchase RECs. Supply for the bulk option is sourced from TVA-contracted purchased power outside of the TVA service area. In total, consumers participating in both GPS and Southeastern RECs purchased 67,550 MWh and 164,577 MWh of renewable energy, respectively, in CY 2016.
TVA continues to offer the Green Power Providers ("GPP") program for the purpose of encouraging the development of small-scale solar, wind, biomass, and hydroelectric generation systems across the Tennessee Valley that are 50 kW or less. As of September 30, 2017, the combined participation for the original Generation Partners ("GP") pilot program and the GPP program comprised 105 MW of installed operating capacity with nearly 4 MW of additional approved capacity in the GPP program that has yet to become operational.
The Renewable Standard Offer ("RSO") program was a voluntary program that began in 2011 to increase the amount ofpurchasing renewable energy generated in TVA's service territory. This program offers pre-set prices, terms, and conditions for power
generated by selected, commercially available renewable energy technologies. Solar, wind, biogas and specific biomass projects are included in the program. Projects must be greater than 50 kW, but no greater than 20 MW, in nameplate capacity. As of September 30, 2017, TVA had over 93 MW of installed operating capacity with nearly 104 MW of additional approved capacity under contract. The RSO offering ended in 2015, but the program remains open to projects that have existing capacity allocations and are in the process of being completed.
In an effort to continue to evaluate the value of small to medium scale renewable projects, TVA extended the Solar Solution Initiative ("SSI"), by transitioning the program to the Distributed Solar Solutions ("DSS") pilot at the beginning of 2016. SSI was a targeted incentive program that aimed to support the existing local solar industry while also serving as a recruitment tool for new industry in the Tennessee Valley, region by retainingsold in 200 kWh blocks. The Green Flex Program gives commercial and adding investmentindustrial customers the ability to meet sustainability goals and jobs. The program provided incentive payments for mid-sized (greater than 50 kW up to 1 MW) solar projects inmake renewable energy claims through RECs from wind generation located outside TVA's RSO program ifservice area.
Other DER Initiatives. TVA also offers various energy efficiency programs. Through the projects usedHome Uplift Program, TVA is partnering with LPCs, state and local certified installers ingovernments, non-profit agencies, energy efficiency advocates, third-party contributors, and the Tennessee Valley region. AsPublic Power Association ("TVPPA") to complete home evaluations and make high-impact home energy upgrades for qualifying homeowners. In addition, TVA and LPCs conduct workshops to educate homeowners about low and no-cost energy efficiency upgrades that improve their quality of September 30,life. Through the School Uplift Program pilot, TVA is partnering with LPCs as well as state and local governments to assist schools with adopting strategic energy management practices. The engagement with each school includes monthly virtual workshops and fosters performance through competitions for energy efficiency grants and grants for solar pavilions. Finally, through the Community Centered Growth Program, TVA is partnering with LPCs to assist small businesses located within underserved communities with energy evaluations and no-cost energy improvement investments.
In 2017, the TVA had over 36 MW of installed operating capacity under the SSI program with nearly 9 MW of additional approved capacity under contract. DSS is designed to encourage renewable energy projects that are directed by TVA’s LPCs. Projects can range in size from greater than 50 kWBoard authorized up to 2 MW$300 million to be spent over the next 10 years, subject to annual budget availability and necessary environmental reviews, to build an enhanced fiber optic networkthat will better connect TVA's operational assets. Fiber is a vital part of solar electric energy. For CY 2017, TVA awarded 10 MWTVA's modern communication infrastructure. The new fiber optic lines will improve the reliability and resiliency of renewable solar capacitythe generation and transmission system while enabling the system to seven projects, all in different LPC territories.better accommodate DER as they enter the market.
New energy management systems and energy storage technologies present opportunities for more sophisticated and integrated operation of the entire grid. The advent of electric vehicles and small-scale renewable generation has hastened the development of batteryenergy storage technologies that have the potential to mitigate the intermittent supply issues associated with many renewable generation options. Implementation of thethese technologies in conjunction with two-way communication to the site creates the potential for better managementmore efficient usage of other DER on the grid.
TVA continues to focus on utilizing more EVs and installing charging stations inside the Tennessee Valley. TVA's electric vehicle ("EV") strategy is a staged approach that will evolve as the local EV market matures. TVA partnered with over 30 organizations across the State of Tennessee (known as the "Drive Electric Tennessee" collaborative) to create a roadmap to outline local market needs for widespread adoption. This foundational information is crucial as more affordable, longer range EVs come to the market. TVA is partnering with LPCs and others to support the electrification of transportation in the Valley in a multi-year EV initiative. The initiative focuses on reducing or eliminating EV market barriers by setting EV policies, improving charging infrastructure availability, expanding EV availability and offerings, and spreading EV consumer awareness. In November 2020, the TVA Board approved new policies and an optional wholesale EV rate aimed at encouraging the development of charging infrastructure in the Valley. The updated policies enable LPC investment in public charging infrastructure and allow for the conditional resale of electricity, for transportation purposes only, by any charging developer on a kWh basis. The optional wholesale rate was developed with high power EV charging in mind and provides a stable option for those developing charging infrastructure.
Onsite energy management technologies and the proliferation of companies interested in providing services to support and aggregate the impacts of such systems provide another DER avenue.opportunity. Such systems can afford the consumer benefits through reduced consumption, increased comfort, detailed energy use data, and savings from time-sensitive rate structures. TVA and LPCs must consider the integration of the impacts from changes in energy usage patterns resulting from the applicationoperation of such systems.
Demand response systems that take advantage of the increasing communications sophistication in communication to homes, businesses, and distribution system assets also afford the opportunity for more granular control of system demand. Technologies can manage individual customer systems to shift usage from peak to off-peak periods and create significant reductions in the need for peak generation output.output or curtail usage for short periods to balance system demand. More sophisticated distribution control systems can also lower peak demand through control of excess voltage on the grid on either a dispatchable or continuous basis. Some large industrial customers also have the capacity to respond instantaneously and can augment operational flexibility by providing ancillary services.
TVA is leading an initiative to determine the value of DER for its system. Initial efforts are focused on small-scale distributed (rooftop) solar, but the method isefforts are general enough to allow for other distributed options. Work isThese efforts are ongoing, led by a team that includes technical support from the Electric Power Research Institute ("EPRI"), to develop a methodology to identify site preferences on the distribution systems of the LPCs. This work, along with locational analysis already completed by TVA, will help in placing utility-scale solar in furtherance of the IRP recommendations as well as distributed solar to meet the needs of LPCs. See Research and Developmentbelow. below.
Purchased Power Purchase and Other Agreements
TVA acquires power from a variety of power producers generally through long-term and short-term power purchase agreementsPPAs as well as through spot market purchases. During 2017,2021, TVA acquired approximately 1294 percent of the power that it purchased on the spot market, approximately two percent through short-term power purchase agreements, and approximately 86 percent through the long-term power purchase agreementsPPAs described below, including agreements for long-term renewable generation resources.resources, approximately one percent through short-term PPAs, and approximately five percent on the spot market.
In order to meet customer preferences and requirements for cleaner and greener energy, TVA has entered into certain PPAs with renewable resource providers. As of September 30, 2021, TVA had operating or contracted capacity totaling 4,313 MW of summer net capability under renewable PPAs. These agreements are part of progressive partnerships that align the core values of TVA and the public power model with the desire of TVA's customers for renewable energy. See Item 7, Management's Discussion and Analysis of Financial Condition and Results of Operations — Key Initiatives and Challenges — Changing Customer Preferences — Renewable Power Purchase Agreements.
A portion of TVA’s TVA's capability provided by power purchase agreementsPPAs is primarily provided under contracts that expire between 20232022 and 2038,2045, and the most significant of these contracts (excluding wind contracts) are described in the table below.
| Power Purchase Agreements At September 30, 2021 | | Power Purchase Agreements At September 30, 2021 |
| Type of Facility | | Type of Facility | | Location | | Number of Contracts | | Summer Net Capability
(MW) | | Contract Termination Date |
| Renewable PPAs | | Renewable PPAs | | | | | | |
| Operating | | Operating | | |
| Solar | | Solar | | Tennessee | | 2 | | 58 | | 2032 - 2039 |
Solar(1) | | Solar(1) | | Alabama | | 2 | | 302 | | 2037 - 2041 |
| Total Operating Solar | | Total Operating Solar | | 4 | | 360 | |
| Wind | | Wind | | Tennessee | | 1 | | 27 | | 2025 |
| Wind | | Wind | | Iowa | | 2 | | 299 | | 2030 - 2031 |
| Wind | | Wind | | Kansas | | 2 | | 366 | | 2032 - 2033 |
| Wind | | Wind | | Illinois | | 3 | | 550 | | 2032 - 2033 |
| Total Operating Wind | | Total Operating Wind | | 8 | | 1,242 | |
| Hydroelectric | | Hydroelectric | | Tennessee and Kentucky | | 1 | | 402 | | Upon three years' notice |
| Landfill Gas | | Landfill Gas | | Tennessee | | 1 | | 5 | | 2031 |
| Subtotal Operating | | Subtotal Operating | | 14 | | 2,009 | |
Contract Renewable Resources(2) | | Contract Renewable Resources(2) | | 326 | |
| Total Operating | | Total Operating | | 2,335 | |
| | Contracted | | Contracted | |
Solar(3) | | Solar(3) | | Tennessee | | 11 | | 1,186 | | 2038 - 2045 |
Solar(4) | | Solar(4) | | Kentucky | | 2 | | 242 | | 2038 - 2043 |
Solar(4) | | Solar(4) | | Mississippi | | 3 | | 550 | | 2043 |
| Total Contracted | | Total Contracted | | 16 | | 1,978 | |
| Total Renewable PPAs | | Total Renewable PPAs | | 30 | | 4,313 | |
| | Nonrenewable PPAs | | Nonrenewable PPAs | |
| Operating | | Operating | | |
| Diesel | | Diesel | | Tennessee | | 4 | | 59 | | 2023 - 2032 |
| Diesel | | Diesel | | Alabama | | 1 | | 10 | | 2035 |
| Diesel | | Diesel | | Mississippi | | 2 | | 46 | | 2023 - 2028 |
| Total Operating Diesel | | Total Operating Diesel | | 7 | | 115 | |
| Natural Gas | | Natural Gas | | Alabama | | 4 | | 2,573 | | 2022 - 2033 |
| Lignite | | Lignite | | Mississippi | | 1 | | 440 | | 2032 |
| Total Operating | | Total Operating | | 12 | | 3,128 | |
| Contracted | | Contracted | |
Battery Storage(5) | | Battery Storage(5) | | Tennessee | | 1 | | 66 | | 2045 |
Battery Storage(4) | | Battery Storage(4) | | Kentucky | | 1 | | 30 | | 2043 |
Battery Storage(4) | | Battery Storage(4) | | Mississippi | | 3 | | 150 | | 2043 |
| Total Contracted | | Total Contracted | | 5 | | 246 | |
| Total Nonrenewable PPAs | | Total Nonrenewable PPAs | | 17 | | 3,374 | |
| | Power Purchase Contracts (Excluding Wind Contracts) At September 30, 2017 | |
| Type of Facility | | Location | | Summer Net Capability (MW) | | Contract Termination Date | |
| Lignite | | Mississippi | | 440 | | 2032 | |
| Natural gas | | Alabama | | 720 | | 2023 | |
| Natural gas | | Alabama | | 615 | | 2026 | |
| Solar | | Alabama | | 75 | | 2037 | |
Solar(1) | | Tennessee | | 53 | | 2038 | |
Hydroelectric(2) | | Tennessee and Kentucky | | 347 | | Upon three years' notice | |
|
Notes
(1) 227 MW of power delivery commenced in 2021. See Item 7, Management's Discussion and Analysis of Financial Condition and Results of Operations — Key Initiatives — Changing Customer Preferences — Renewable Power Purchase Agreements.
(2) Contract Renewable Resources is capability from various historical renewable energy programs that consist of PPAs primarily with individuals and small businesses.
(3) Power delivery is expected to commence between 2022 - 2025.
(4) Power delivery is expected to commence in December 2018.2023.
(2) TVA’s contract with SEPA is for 405 MW of capacity; however, at September 30, 2017, TVA’s capacity under the contract was 347 MW because of repairs being completed by the USACE. TVA expects this period of reduced capacity to be in effect until 2019.
TVA executed a power purchase contract with a solar facility located in northwest Alabama and expanded its supply of renewable energy when the facility was commissioned in November 2016. A second solar facility under contract located in western Tennessee(5) Power delivery is expected to begin commercial operation during the first quartercommence in 2025.
Under federal law, TVA is required to purchase energy from qualifying facilities (cogenerators and small power producers) at TVA's avoided cost of either generating this energy itself or purchasing this energy from another source. TVA fulfills this requirement through the Dispersed Power Production Program. As ofAt September 30, 2017,2021, there were 30369 generation sources, with a combined qualifying capacity of 258270 MW, whose power TVA purchases under this law.program.
As of September 30, 2017, TVA was a party tocontracts with eight wind farms for the purchase of energy. TVA's most significant wind contracts are described in the table below.
|
| | | | | | |
Wind Contracts At September 30, 2017 |
| Location of Wind Farm | | Contracted Nameplate Capacity (in MW) | | Date Delivery Began | | Contract Termination Date |
| Iowa | | 198 | | 2010 | | 2031 |
| Iowa | | 101 | | 2012 | | 2030 |
| Kansas | | 201 | | 2012 | | 2032 |
| Kansas | | 165 | | 2013 | | 2033 |
| Illinois | | 150 | | 2012 | | 2032 |
| Illinois | | 200 | | 2012 | | 2032 |
| Illinois | | 200 | | 2013 | | 2033 |
In addition, TVA has contracted for 27 MW of nameplate renewable energy capacity from 15 wind turbine generators located on Buffalo Mountain near Oak Ridge, Tennessee, 4.8 MW of nameplate capacity from a landfill gas facility near Knoxville, Tennessee, and 4.5 MW of nameplate capacity from a solar farm in Haywood County, Tennessee.
Fuel Supply
General
TVA’sTVA's consumption of various types of fuel depends largely on the demand for electricity by TVA’sTVA's customers, the availability of various generating units, and the availability and cost of fuel. See Item 7, Management’sManagement's Discussion and Analysis of Financial Condition and Results of Operations — Results of Operations — Financial Results — Operating Expenses.
Nuclear Fuel
Current Fuel Supply. Converting uranium to nuclear fuel generally involves four stages: the mining and milling of uranium ore to produce uranium concentrates; the conversion of uranium concentrates to uranium hexafluoride gas; the
enrichment of uranium hexafluoride; and the fabrication of the enriched uranium hexafluoride into fuel assemblies. For its forward four-year (2018-2021) requirements, TVA currently has 100 percentplans to continue using contracts of various products, lengths, and terms as well as inventory to meet the projected nuclear fuel needs of its uranium miningnuclear fleet. The net book value of TVA's nuclear fuel was $1.6 billion and milling, conversion services, enrichment services,$1.5 billion at September 30, 2021 and fabrication services requirements either in inventory or under contract with various suppliers. TVA anticipates being able to fill its needs beyond this period by normal contracting processes as market forecasts indicate that the fuel cycle components will be readily available.2020, respectively. See Note 1516 — Risk Management Activities and Derivative Transactions — Counterparty Risk.
TVA, the DOE, and certain nuclear fuel contractors have entered into agreements, providingreferred to as the Down-blend Offering for Tritium ("DBOT"), that provide for the production, processing, and storage of low-enriched uranium that is to be made using surplus DOE highly enriched uranium (uranium that is too highly enrichedand other uranium. Low-enriched uranium can be fabricated into fuel for use in a nuclear power plant) to be blended with other uranium. The enriched uranium that results from this blending process, which is called blendedplant. Production of the low-enriched uranium ("BLEU"),began in 2019 and is fabricated into fuelcontracted to continue through September 2025. Beginning October 2025, contract activity will consist of storage and flag management. Flag management ensures that the uranium is free from foreign obligations, and unencumbered by policy restrictions, so that it can be used in a nuclear power plant. This blended nuclear fuel was first loaded in a Browns Ferry reactor in 2005 andconnection with the last reloadproduction of BLEU material was loaded in a Browns Ferry reactor in the spring of 2017. BLEU fuel was loaded into Sequoyah Unit 2 three times but is not expected to be used in the Sequoyah reactors in the future. There is a potential to receive additional BLEU fuel beginning in 2018, and it would be used in future Browns Ferry reloads.
tritium. Under the terms of anthe interagency agreement between the DOE and TVA, in exchangethe DOE will reimburse TVA for supplyinga portion of the costs of converting the highly enriched uranium materials for processing into usable BLEU fuel for TVA, the DOE participates in the savings generated by TVA’s use of this blended nuclear fuel.to low-enriched uranium. See Note 1 — Blended Low-Enriched Uranium ProgramSummary of Significant Accounting Policies — Down-blend Offering for Tritium for a more detailed discussion of the BLEUDBOT project.
Mixed Oxide Nuclear Fuel. Under the DOE Surplus Plutonium Disposition ("SPD") Program, mixed oxide ("MOX") fuel would be fabricated with surplus plutonium and depleted uranium as a replacement for commercial uranium fuel. In February 2010, the DOE and TVA entered into an interagency agreement to evaluate the potential use of MOX fuel in reactors at Browns Ferry and Sequoyah. As part of the evaluation of MOX fuel, TVA participated as a cooperating agency in the DOE's development of the April 2015 final supplemental environmental impact statement that addresses the potential use of MOX fuel in the TVA reactors. A decision to use MOX fuel is not required or expected for several years. At the earliest, based on the expected production rate of MOX fuel, TVA could start using a small number of MOX fuel assemblies in TVA reactors after 2020. TVA's three criteria for implementing MOX fuel are that it must be environmentally and operationally safe; it must be economical compared to other nuclear fuel used by TVA; and it must be licensed by the NRC for use. If TVA decides to use MOX fuel and the NRC approves its use, some changes in the operation of the reactors are expected, and additional equipment may be required. As TVA continues to evaluate fuel options, current fuel supply plans do not include MOX fuel.
Low-Level Radioactive Waste.Low-level radioactive waste ("radwaste") results from certain Certain materials and supplies used in the normal operation of nuclear electrical generation units.generating units are potentially exposed to low levels of radiation. TVA sends shipments of radwastelow-level radioactive waste to burial facilities in Clive, Utah and Andrews, Texas. TVA is capable of storing some radwastelow-level radioactive waste at its own facilities for an extended period of time, if necessary.
Spent Nuclear Fuel. All three nuclear sites have dry cask storage facilities. Sequoyah will need additional capacity by 2028.2029. Watts Bar will need additional capacity by 2041.2039. Browns Ferry will need additional storage capacity by the end of 2020. A project is underway at Browns Ferry to build another independent spent fuel storage installation pad, and is scheduled for completion by January 2020.2037. To recover the cost of providing long-term, onsite storage for spent nuclear fuel, TVA filed a breach of contract suit against the United StatesU.S. in the Court of Federal Claims in 2001. As a result of this lawsuit and related agreements, TVA has collected approximately $217$392 million through 2017.2021.
Tritium-Related Services. TVA and the DOE are engaged in a long-term interagency agreement under which TVA will, at the DOE’sDOE's request, irradiate tritium-producing burnable absorber rods ("TPBARs") to assist the DOE in producing tritium for the Department of Defense ("DOD"). This agreement, which ends in 2035, requires the DOE to reimburse TVA for the costs that TVA incurs in connection with providing irradiation services and to pay TVA an irradiation services fee at a specified rate per TPBAR over the period when irradiation occurs.
In general, TPBARs are irradiated for one operating cycle, which lasts about 18 months. At the end of the cycle, TVA removes the irradiated rods and loads them into a shipping cask. The DOE then ships them to its tritium-extraction facility. TVA loads a fresh set of TPBARs into the reactor during each refueling outage. Irradiating the TPBARs does not affect TVA’sTVA's ability to safely operate the reactors to produce electricity.
TVA has provided irradiation services using only Watts Bar Unit 1 since 2003. Although the interagency agreement provides for irradiation services to be performed at Watts Bar and Sequoyah, TVA expects the Watts Bar site to provide sufficient capacity to fulfill this agreement in the near term. In December 2015, theThe DOE notified TVA of future increased needs for tritium requiring the use of a second reactor. In 2019, TVA was a cooperating agency inreceived approval from the February 2016 DOE Final Supplemental Environmental Impact StatementNRC for the Production of Tritium in a Commercial Light Water Reactor. On April 5, 2017, due to an anticipated need for more TPBARs, the DOE announced its preferred alternative for irradiation services which included use of an additional reactor. As a result of TVA’s assessment and concurrence with the DOE’s alternative, TVA is planning to submit a license amendment to the NRC in CY 2017 to authorize the irradiation of TPBARs in Watts Bar Unit 2. Subject to approval of the license amendment,TVA began tritium production in Watts Bar Unit 2 is projected to start in the fall ofNovember 2020. The DOE's decision also allows for irradiation of TPBARs at the Sequoyah site in the future; however, TVA does not have plans to employ Sequoyah units for tritium production in the near term. TVA does intend to increase its production in Watts Bar Unit 1 beginning in November 2024, to align with a DOE request for increased tritium. TVA is currently working to submit a license amendment request with the NRC to fulfill this request.
Coal
Coal consumption at TVA’s coal-fired generating facilities during 2017 and 2016 was approximately 21 million tons and 24 million tons, respectively. At September 30, 2017, and September 30, 2016, TVA had 36 days and 31 days of system-wide coal supply at full burn rate, respectively, with net book values of $253 million and $252 million, respectively.
TVA utilizes both short-term and long-term (longer than one year) coal contracts. During 2017, long-term contracts made up 98 percent of coal purchases and short-term contracts accounted for the remaining two percent. TVA plans to continue using contracts of various lengths, terms, and coal quality to meet its expected consumption and inventory requirements. During 2017 and 2016, TVA purchased coal by basin as follows:
The following charts present the proportion of each delivery method TVA utilizes for its coal supply for the periods indicated:
Generally, total system coal inventories were at or below target levels for 2017 due to higher than planned coal-fired generation requirements to support less hydroelectric generation. However, some facilities were above the target levels as TVA began to adjust inventory levels for unit retirements.
Natural Gas and Fuel Oil
During 2017,2021, TVA purchased a significant amount of its natural gas requirements from a variety of suppliers under contracts with terms of up to three3 years and purchased substantially all of its fuel oil requirements on the spot market. See Note 15 — Derivatives Not Receiving Hedge Accounting Treatment — Derivatives Under FTP. The net book value of TVA’sTVA's natural gas inventory was $15$22 million and $7$19 million at September 30, 2017,2021 and 2016,2020, respectively. The net book value of TVA’sTVA's fuel oil inventory was $87$69 million and $86$82 million at September 30, 2017,2021 and 2016,2020, respectively. At September 30, 2017,2021, 80 of the combustion turbines that TVA operates were dual-fuel capable, and TVA has fuel oil stored on each of these sites as a backup to natural gas.
TVA purchases natural gas from multiple suppliers on a daily, monthly, seasonal, and annualterm basis. During 2017,2021, daily, monthly, seasonal, and annualterm contracts accounted for 3823 percent, 1114 percent, 2026 percent, and 3137 percent of purchases, respectively. TVA plans to continue using contracts of various lengths and terms to meet the projected natural gas needs of its natural gas fleet. During 2017,2021, TVA transportedarranged for the transportation of natural gas on eightnine separate pipelines, with approximately 3766 percent being transported on a single pipeline.two pipelines. During 2017,2021, TVA maintained a total of approximately 1,188,500 Million1,517,000 million British thermal unit(s) ("mmBtu") per day of firm transportation capacity on 7seven major pipelines, with approximately 3559 percent of total firm transportation capacity being maintained on a single pipeline.two pipelines.
TVA utilizes natural gas storage services at sixseven facilities with a total capacity of 8.83 billions7.25 billion per cubic feet ("Bcf") of firm service and 0.805.00 Bcf of interruptible service to manage the daily balancing requirements of the eightnine pipelines used by TVA, with approximately 3159 percent of the total storage capacity being maintained at a single facility.two facilities. During 2017,2021, storage levels were generally maintained at between 40 and 80 percent of the maximum contracted capacity at each facility. As TVA’sTVA's natural gas requirements grow, it is anticipated that additional storage capacity willmay need to be acquired to meet the needs of the generating assetsassets. In 2022, TVA expects to increase its storage portfolio by approximately 10 percent.
Coal
Coal consumption at TVA's coal-fired generating facilities during 2021 and 2020 was approximately 12 million tons and 11 million tons, respectively. At September 30, 2021 and 2020, TVA had 21 days and 30 days of system-wide coal supply at full burn rate, respectively, with net book values of $107 million and $152 million, respectively.
TVA utilizes both short-term and long-term coal contracts. During 2021, long-term contracts made up 82 percent of coal purchases, and short-term contracts accounted for the remaining 18 percent. TVA plans to continue using contracts of various lengths, terms, and coal quality to meet its expected consumption and inventory requirements. During 2021 and 2020, TVA purchased coal by basin as wellfollows:
The following charts present the proportion of each delivery method TVA utilizes for its coal supply for the periods indicated:
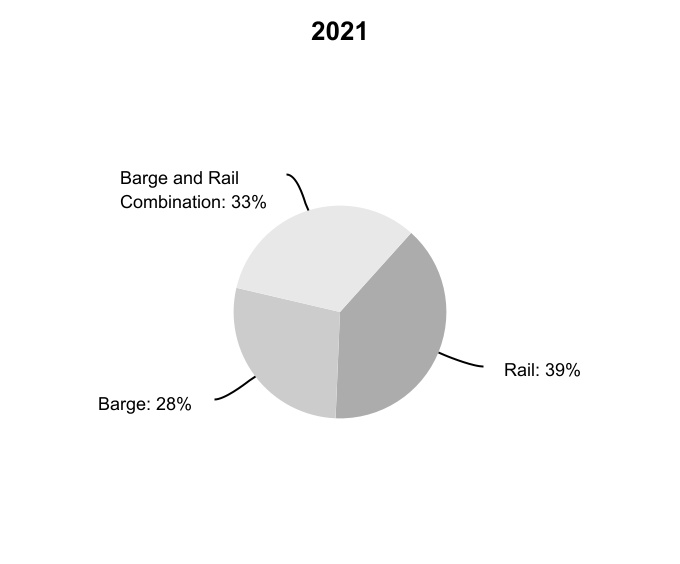
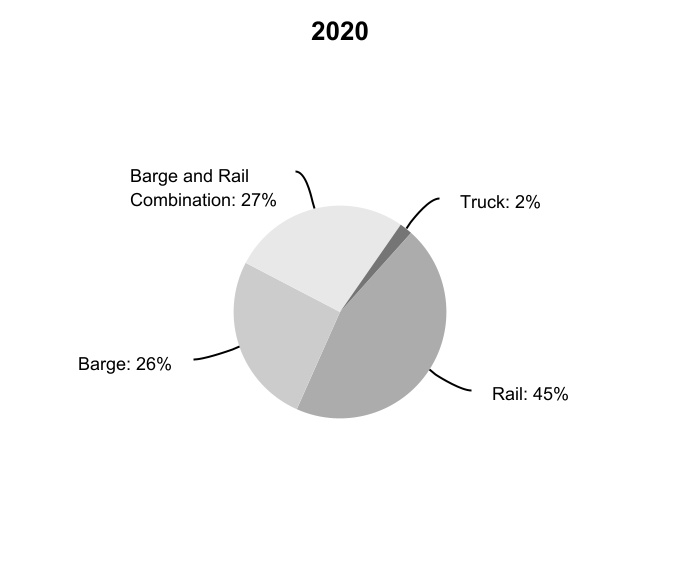
Total system coal inventories were lower than anticipated throughout 2021 primarily as their operating requirements. In 2018, TVA does not expecta result of higher than forecasted coal generation, coal supply limitations, and transportation challenges. Higher coal generation was primarily the result of higher demand than anticipated in 2021 after the lower energy sales in 2020 associated with the COVID-19 pandemic and an increase in natural gas prices making coal a more favorable economic fuel choice. Supply limitations and transportation challenges were due to addreduced mine production and/or mine closures, an increase in coal exports, and a significant amountreallocation of firmtransportation capacity to its storage portfolio.support export sales. TVA anticipates that these challenges will continue into 2022. See also Item 7, Management's Discussion and Analysis of Financial Condition and Results of Operations — Key Initiatives and Challenges — Generation Resources — Coal Supply.
Transmission
The TVA transmission system is one of the largest high-voltage transmission systems in North America. TVA’sTVA's transmission system has 69 interconnections with 13 neighboring electric systems and delivered nearly 155approximately 157 billion kWh of electricity to TVA customers in 2017.2021. In carrying out its responsibility for transmission grid reliability in the TVA service area, TVA has operated with 99.999 percent reliability since 2000 in delivering electricity to customers. See Item 2, Properties — Transmission Properties.
To the extent that federal law requires accessPursuant to the TVA transmission system,its Transmission Service Guidelines, TVA offers transmission services to otherseligible customers to transmit wholesale power in a manner that is comparable to TVA's own use of the transmission system. TVA has also adopted and operates in accordance with its published Transmission Standards of Conduct and separates its transmission function from its power marketing function.
TVA also is subject to federal reliability standards that are set forth by the North American Electric Reliability Corporation ("NERC") and approved by FERC. These standards are designed to maintain the reliability of the bulk electric system, including TVA’s generation and transmission system, and include areas such as maintenance, training, operations, planning, modeling, critical infrastructure, physical and cyber security, vegetation management, and facility ratings. TVA recognizes that reliability standards and expectations continue to become more complex and stringent for transmission systems. At present there are approximately 90 mandatory standards subject to enforcement containing approximately 1,300 requirements and sub-requirements that must be met. See Item 7, Management's Discussion and Analysis of Financial Condition and Results of Operations — Key Initiatives and Challenges — Regulatory Compliance — Transmission IssuesRegulation.
Additional transmission upgrades may be required to maintain reliability. TVA invested $404 million between 2011 and 2017 to maintain reliability as a result of retired coal-fired units, and estimates future expenditures to be approximately $30 million for 2018 to 2020. Upgrades may include enhancements to existing lines and substations or new installations as necessary to provide adequate power transmission capacity, maintain voltage support, and ensure generating plant and transmission system stability. In Mayaddition to upgrades to maintain reliability, TVA’s Grid of Tomorrow initiative aims to increase grid flexibility to enable greater use of renewable resources such as solar, wind, and other forms of distributed generation and includes making data and communications upgrades as demonstrated by the below initiatives. This initiative supports TVA’s decarbonization efforts while ensuring TVA continues to deliver reliable power at the lowest feasible rate. Investments in a modernized grid will enable enhanced monitoring and control of TVA’s transmission and generation portfolio.
In 2017, the TVA Board approvedauthorized a strategic fiber optic initiative of up to $300 million multi-year, strategic fiber initiativeto be spent over the next 10 years, subject to annual budget availability and necessary environmental reviews, that will expand TVA’sTVA's fiber capacity and improve the reliability and resiliency of the generation and transmission system. The network expansion is designed to help meet the power system’ssystem's growing need for bandwidth as well as accommodate the integration of new distributedDER. As of September 30, 2021, TVA had spent $151 million on installation of the fiber optic lines and expects to spend an additional $149 million.
A new system operations center has been approved for $289 million. The new secured facility is being built to accommodate a new energy resources. management system and adapt to new regulatory requirements, and will have improved physical security from the previous center. The facility is expected to be constructed by the third quarter of 2023 and fully operational in 2025. As of September 30, 2021, TVA had spent approximately $92 million on the project and expects to spend an additional $197 million. The new energy management system has been approved for $90 million. As the current energy management
system is nearing the end of its life cycle, this project will replace the existing analog system with a digital system. The new digital system will have higher capacity and speed, for communications with the TVA grid and for inputs from monitoring equipment, which will network the new control center with existing locations and enable better remote visibility and control. The system is expected to be complete in 2026. As of September 30, 2021, TVA had spent approximately $37 million on the project and expects to spend an additional $53 million.
In addition, TVA is working on various projects with universities, EPRI and others to help enable a dynamic and multi-directional grid. TVA is also working in partnership with LPCs to modernize their distribution systems by developing a shared vision and roadmap for transforming the Valley’s transmission and distribution systems into an integrated regional grid.
Weather and Seasonality
Weather affects both the demand for and the market prices of electricity. TVA’sTVA's power system is generally a dual-peaking system in which the demand for electricity peaks during the summer and winter months to meet cooling and heating needs. TVA uses degree days to measure the impact of weather on its power operations. Degree days measure the extent to which the TVA system 23-station average temperatures in the five largest cities in TVA's service area vary from 65 degrees Fahrenheit. See Environmental Matters — Climate Change — Physical Impacts of Climate Change below and Item 7, Management’sManagement's Discussion and Analysis of Financial Condition and Results of Operations — Results of Operations — Sales of Electricity.
The summer of 2016 was the hottest and driest in the Tennessee Valley since 2010 - a trend that continued into the first six months of 2017. Rainfall in the Upper Basin of the Tennessee Valley was 101 percent of normal for 2017 and 103 percent of normal in 2016. Also, runoff was 79 percent of normal in 2017 and 104 percent of normal in 2016. Runoff is the amount of rainfall that is not absorbed by vegetation or the ground and actually reaches the rivers and reservoirs that TVA manages. TVA’s conventional hydroelectric generation decreased 11 percent in 2017 as compared to 2016, and decreased eight percent in 2016 as compared to 2015. Conventional hydroelectric generation was approximately 82 percent of normal in 2017 and 93 percent of normal in 2016.
Competition
TVA provides electricity in a service area that is largely free of competition from other electric power providers. This service area is defined primarily by provisions of law and long-term contracts. The fence limits the region in which TVA or LPCs whichthat distribute TVA power may provide power. The anti-cherrypicking provisionpower is limited and is often referred to as "the fence." Under the FPA, the Anti-Cherrypicking Amendment ("ACPA") limits the ability of others to use the TVA transmission system for the purpose of serving customers within TVA’sTVA's service area. State service territory laws limit unregulated third parties' ability to sell electricity to consumers. All TVA wholesale power contracts and manyare all requirements contracts; however, Flexibility Agreements available to LPCs that have executed long-term contracts betweenwith TVA allow LPCs andto locally generate or purchase up to approximately five percent of average total hourly energy sales over 2015 - 2019 in order to meet their customers are requirements contracts. However,individual customers' needs. In addition, other utilities may use their own transmission lines to serve customers within TVA's service area, and third parties are able to avoid the restrictions on serving end-use customers by selling or leasing generating assets to a customer generating assets rather than selling electricity. These threats underscore the need for TVA to design rates and strategically price its products and services and design rates to be competitive. There have also been some efforts in the past to erode the anti-cherrypicking provision,ACPA, and the protection of the anti-cherrypicking provision could be limited and perhaps eliminated by congressionalfederal legislation at some time in the future. See Note 23 — Commitments and Contingencies — Legal Proceedings — Challenge to Anti-Cherrypicking Amendment for updates to this legal proceeding.
TVA also faces competition in the form of emerging technologies. Improvements in energy efficiency technologies, smart technologies, and energy storage technologies may reduce the demand for centrally provided power. The growing interest by customers in generating their own power through distributed generation (including solar power)DER has the potential to lead to a reduction in the load served by TVA as well as cause TVA to re-evaluate how it operates the overall grid system to continue to provide highly reliable power at affordable rates. See Item 7, Management’sManagement's Discussion and Analysis of Financial Condition and Results of Operations — Key Initiatives and Challenges — Distributed Energy Resources.
Finally, TVA and other utility companies are facing an evolving marketplace of increased competition driven by customer choice and behavior. As technology develops, consumers' demands for access to diverse products and services may increase, creating opportunities for growth with new products and services resulting from emerging technologies.customers could choose another utility to meet some or all of their power needs where available, pursue self-generation to meet some or all of their power needs, or move their operations outside of TVA's service territory.
Research and Development
TVA makes annual Investments in TVA's research portfolio are supported through partnership and collaboration with LPCs, EPRI, the DOE, federal agencies, national labs, peer utilities, universities, and industry vendors and through participation in professional societies and other research consortiums.
Annual investments made in science and technological innovation to help meet future business and operational
challenges. Each year, TVA’sTVA's annual research portfolio is updated based on a broad range of operational and industry drivers that helpto assess key technology gaps, performance issues, or other significant issues, that should be addressed through research and development. Core research activities directly support optimization of TVA's generation and transmission assets, air and water quality, energy utilization, and distributed/clean energy integration. TVA also provides research and development services on behalf of LPCs by helping optimize their distribution systems and helping minimize technology gaps in energy utilization and consumer technologies.
In 2020, TVA placed a high priority on providing research which aligns to and supports its five transformative initiatives: energy storage, electric vehicles, advanced nuclear, connected communities, and regional grid transformation. TVA has also placed a special emphasis on research leading to the areaunderstanding and application of clean resources to support the reduction of carbon emissions from its power supply. This research supports both TVA and national strategic interests to reduce carbon
emissions and will serve to both catalyze and support TVA’s sixth transformative initiative, decarbonization, which commenced in 2022.
At the forefront of the energy utilization,storage initiative is deploying grid-scale battery energy storage technology to optimize the existing TVA evaluates emerging energy efficiencygeneration assets and load management technologies for marketimprove the resiliency of the transmission system. In 2020, TVA launched its first TVA-owned, grid scale, lithium-ion demonstration battery project and program readiness. TVA's efforts are directed towards demonstrating and validatingin 2021, TVA awarded the performance, reliability, and consumer acceptance of new efficiency technology as well as the value of energy efficiency and load management technologiescontract for the consumer,battery project which will be located near Vonore, Tennessee. The system integration learnings from this project will guide future application of battery storage as part of the LPCs, and TVA.evolving bulk power system in the region.
TVA is also beginning the assessment ofcontinues to assess potential electrification programs that may improve resource utilizationuse and reduce environmental impacts (especially in the transportation sector). Assessments include a multi-stakeholder vision and roadmap effort aimed at identifying the path forward for electric vehicles in Tennessee. The approach provides for broad engagement from industry, government, and utilities that could be applied in other states in the TVA service territory. In addition, TVA is continuing its evaluation of potential electric vehicle adoption strategies through coordination of activities with EPRI and state and industry stakeholders related to operational fleet requirements. The needsAdditional areas of LPCs to provide guidancefocus include LPC engagement on matters of plug-in electric vehicle grid integration and readiness for various transportation electrification technologies are also areas of focus.
Researchtechnologies. In addition, research continues in this area of electrification applications includes compatibility ofsurrounding vehicle charging stations, to work efficiently with various types of electric vehicles, impact ofimpacts from charging stations onto the power grid, refinement of power-system control processes, to maximize energy efficiency, and development of smart charging strategies to maximize the potential of electricity to replace petroleum as the transportation fuel of choice. See Item 7, Management's Discussion and Analysis of Financial Condition and Results of Operations — Key Initiatives and Challenges — Distributed Energy Resources — Electric Vehicles.
TVA is committed to investing in the future of nuclear and continues to evaluate the licensing and design of emerging nuclear technologies, such as advanced light water SMRs and advanced non-light water reactors, as part of technology innovation efforts aimed at developing the energy system of the future. In December 2019, TVA became the first utility in the nation to successfully obtain approval for an early site permit from the NRC to potentially construct and operate SMRs at its Clinch River Site. Additionally, TVA is partnering with like-minded organizations to evaluate the economic feasibility of advanced nuclear reactors. TVA has entered into memorandums of understanding and agreements that allow for mutual collaboration to explore advanced reactor designs as a next-generation nuclear technology while leveraging the expertise of federally funded research and development centers, utilities, vendors, and academic institutions. These partnerships are important steps in the early stages of evaluation as TVA considers the prospect of new nuclear. See Item 7, Management's Discussion and Analysis of Financial Condition and Results of Operations — Key Initiatives and Challenges — Distributed Energy Resources — Small Modular Reactors.
TVA is working to establish connected communities pilot projects with stakeholders and has been engaging in advanced buildings research to support the initiative. Connected communities projects are aimed at addressing today’s challenges with community-driven information and technology solutions to improve the quality of life in the Tennessee Valley. Research will continue to identify best practices, better understand challenges in the Valley, and build a roadmap for the future.
TVA and its LPCs are engaged in several initiatives related to grid modernization, including research intomodernization. Research includes technologies and applications with the potential to advance anadvancement in intelligent transmission and distribution system.systems. Smart meter technology has the potential to shift usage patterns away from peak demand times which could change costs significantly. Additionally, an intelligent transmission systemsystems would give TVA the ability to nearly instantaneously diagnose problems, make corrections, and engage transmission and generation resources quickly so that power would keep flowing. This could promote reduced emissions, lower energy costs, and add greater flexibility to accommodate the new consumer-generated sources under TVA’sTVA's renewable energy programs. See Power Supply and Load Management Resources — Distributed Energy Resources.Resources.
Finally, TVA is evaluating smaller, clean power sources that can be aggregatedin the second year of a coalition of utilities and researchers, led by EPRI and Gas Technology Institute, whose purpose is to provide power necessaryengage, inform, and support global low-carbon resources initiatives to meet regular demand. Research efforts into thesedevelop the pathways for the advancement of carbon reducing technologies for large scale utility deployment. This is a five-year program and includes research to support creating resource options, such as alternative fuels (hydrogen, ammonia, and methanized derivatives), carbon capture, electrification, and utilization of clean DER seek to understandas part of the scope and impact of DER on operations and business economics and to develop strategies for adapting to the evolving electricity landscape in the Tennessee Valley. Of particular interest are investigations into the potential applications of battery storage and modeling existing and expected solar power deployments in the Tennessee Valley to evaluate the full extent of system impacts of those renewable resources. Initial economic analyses have been conducted to identify the value of DER (particularly photovoltaic solar generation) to both TVA and the LPC system. See Item 7, Management’s Discussion and Analysis of Financial Condition and Results of Operations — Key Initiatives and Challenges — Distributed Energy Resources.overall low-carbon resource mix.
Investments in TVA’s research portfolio are supported through partnership and collaboration with LPCs, EPRI and other research consortiums, the DOE and other federal agencies, national labs, peer utilities, universities, and industry vendors and participation in professional societies.
Flood Control Activities
The Tennessee River watershed has one of the highest annual rainfall totals of any watershed in the United States,U.S., averaging 51 inches per year. During 2017,2021, approximately 5462 inches of rain fell in the Tennessee Valley. TVA manages the Tennessee River system in an integrated manner, balancing hydroelectric generation with navigation, flood damage reduction, water quality and supply, and recreation. TVA spills or releases excess water through its dams in order to reduce flood damage to the Tennessee Valley. TVA typically spills only when all available hydroelectric generating turbines are operating at full capacity and additional water still needs to be moved downstream.
The Tennessee Valley experienced above normal rainfall during 2021 which included the second wettest August on record with nearly 10 inches of rainfall. Despite significant rainfall, runoff, and flooding during the period, TVA continued to generate low-cost hydroelectric power while meeting its river system commitments, including flood mitigation, which is estimated to have prevented approximately $170 million in damages across the Tennessee Valley.
Environmental Stewardship Activities
TVA’s TVA's mission includes managing the Tennessee River, its tributaries, and federal lands along the shoreline to provide, among other things, year-round navigation, flood damage reduction, affordable and reliable electricity, and, consistent with these primary purposes, recreational opportunities, adequate water supply, improved water quality, and natural resource protection. There are 49 dams that comprise TVA’sTVA's integrated reservoir system. Each dam may also have ancillary structures used to support or assist the main dam's function. The reservoir system provides approximately 800 miles of commercially navigable waterways and also provides significant flood reduction benefits both within the Tennessee River system and downstream on the lower Ohio and Mississippi Rivers. The reservoir system also provides a water supply for residential and industrial customers, as well as cooling water for TVA’sTVA's coal-fired plants, combined cycle plants, and nuclear power plants. TVA’s Environmental Policy, which was adopted byIn 2020, the TVA Board in 2008,approved a new Environmental Policy. TVA's updated policy provides objectives for an integrated approach related to providing cleaner, reliable, affordable, and low-cost energy,increasingly clean energy; engaging in proactive stewardship of the Tennessee River system and public lands; and supporting sustainable economic growth, and engaging in proactive environmental stewardship in a balanced and ecologically sound manner.growth. The Environmental Policy also provides additional direction in several environmental stewardship areas related to reducing environmental impacts on the Valley's natural resources, including reducing carbon intensity and air emissions; minimizing waste; and protecting water resource protectionresources, biodiversity, and improvements, sustainable land use, and natural resource management.cultural resources.
TVA serves the people of the TVA region through the integrated management of the Tennessee River system and public lands, which includesinclude approximately 11,000 miles of shoreline,shoreline; 650,000 surface acres of reservoir water,water; and 293,000 acres of reservoir lands. TVA accomplishes this mission and supports the objectives of the TVA Environmental Policy through implementation of its natural resources stewardship strategy. Within this strategy, TVA confirms a desire to remain agile, balance competing demands, and be a catalyst for collaboration in order to protect and enhance biological, cultural, and water resources as well as create and sustain destinations for recreation and opportunities for learning and research. As part of the strategy, TVA will alsointends to assist water-based community development with issuing permits, technical support, and land agreements and permitting using planning, clear regulations, meaningful guidelines, and consistent enforcement. Additional guidance for carrying out many of TVA's essential stewardship responsibilities is provided in TVA's Natural Resource Plan. The Natural Resource Plan will be reviewed("NRP"). In 2020, changes were made to TVA's NRP to support a more strategic, flexible, and comprehensive management approach to TVA's natural resource stewardship work. The updated as needed.plan enhances alignment with TVA's mission through economic development, energy, and environmental stewardship and guides business planning. In the newly published NRP, TVA expanded from six resource areas to ten focus areas, ensuring the NRP provides a more comprehensive view of resource stewardship efforts.
Economic Development Activities
Since its creation in 1933, TVA has promoted the development of the Tennessee Valley. Economic development, along with energy production and environmental stewardship, is one of the primary statutory purposes of TVA. TVA works with its LPCs, regional, state, and local agencies, and communities to showcase the advantages available to businesses locating or expanding in TVA's service area. TVA's primary economic development goals are to recruit companies to locate in the Tennessee Valley, encourage expansion of existing business and industry that provide quality jobs, and assist communities in the Tennessee Valley with economic growth opportunities. TVA seeks to meet these goals through a combination of initiatives and partnerships designed to provide financial assistance, technical services, industry expertise, and site-selection assistance to new and existing businesses.
Economic development programs developed by TVA include those which focus on supportingsupport all communities, including rural and economically distressed communities, across the Tennessee Valley. Through its economic development activities, TVA endeavors to recruit and retain companies in targeted business sectors, foster capital investment and job growth, and assist communities in the Tennessee Valley with economic growth opportunities.
TVA seeks to achieve these goals through a combination of initiatives and partnerships with LPCs, regional, state, and local agencies, and communities by workingproviding financial incentives, technical services, industry expertise, and site-selection assistance to new and existing businesses in close partnership with other federal and state organizations. TVA also jointly offersthe Tennessee Valley. TVA's economic development incentive programs with participating LPCs. These programs offer competitive incentives to existingnew and potentialexisting power customers in certain business sectors that make multi-year commitments to invest in the Tennessee Valley. In addition to providing financial support for these programs,to businesses, TVA offers resources to communities and economic
developers in the areas of recruitment, leadership development, industrial product preparedness (sites and buildings), planning,site selection services, technical and project assistance.development assistance, and leadership training services.
In 2021, TVA's economic development efforts helped recruit or expand over 200269 companies into the TVA service area during 2017.area. These companies announced capital investments of over $8.3$8.8 billion and the expected creationexpect to create and/or retention of over 70,000retain approximately 80,900 jobs.
Regulation
TVA is required to comply with comprehensive and complex laws, regulations, and orders. The costs of complying with these laws, regulations, and orders are expected to be substantial, and costs could be significantly more than TVA anticipates.
Congress
TVA exists pursuant to legislationthe TVA Act as enacted by Congress and carries on its operations in accordance with this legislation. Congress can enact legislation expanding or reducing TVA’sTVA's activities, change TVA’sTVA's structure, and even eliminate TVA. Congress can also enact legislation requiring the sale of some or all of the assets TVA operates or reduce the United States’sU.S.'s ownership in TVA. To allow TVA to operate more flexibly than a traditional government agency, Congress exempted TVA from all or parts of certain general federal laws that govern other agencies, such as federal labor relations laws and the laws related to the hiring of federal employees, the procurement of supplies and services, and the acquisition of land. Other federal laws enacted since the creation of TVA that are applicable to other agencies have been made applicable to TVA, including those related to paying employees overtime and protecting the environment, cultural resources, and civil rights.
Securities and Exchange Commission
Section 37 of the Securities Exchange Act of 1934 (the "Exchange Act") requires TVA to file with the SECSecurities and Exchange Commission ("SEC") such periodic, current, and supplementary information, documents, and reports as would be required pursuant to Section 13 of the Exchange Act if TVA were an issuer of a security registered pursuant to Section 12 of the Exchange Act. Section 37 of the Exchange Act exempts TVA from complying with Section 10A(m)(3) of the Exchange Act, which requires each member of a listed issuer’sissuer's audit committee to be an independent member of the board of directors of the issuer. Since TVA is an agency and instrumentality of the United States,U.S., securities issued or guaranteed by TVA are “exempted securities”"exempted securities" under the Securities Act of 1933, as amended (the “Securities Act”"Securities Act"), and may be offered and sold without registration under the Securities Act. In addition, securities issued or guaranteed by TVA are “exempted securities”"exempted securities" and “government securities”"government securities" under the Exchange Act. TVA is also exempt from Sections 14(a)-(d) and 14(f)-(h) of the Exchange Act (which address proxy solicitations) insofar as those sections relate to securities issued by TVA, and transactions in TVA securities are exempt from rules governing tender offers under Regulation 14E of the Exchange Act. Also, since TVA securities are exempted securities under the Securities Act, TVA is exempt from the Trust Indenture Act of 1939 insofar as it relates to securities issued by TVA, and no independent trustee is required for these securities.
Federal Energy Regulatory Commission
Under the FPA, TVA is not a “public"public utility,”" a term which primarily refers to investor-owned utilities. Therefore, TVA is not subject to the full jurisdiction that FERC exercises over public utilities under the FPA. TVA is, however, an “electric utility”"electric utility" and a “transmitting utility”"transmitting utility" as defined in the FPA and, thus, is directly subject to certain aspects of FERC’sFERC's jurisdiction.
Under Section 215 of the FPA, for example, TVA (1) must comply with certain standards designed to maintain transmission system reliability. These standards are approved by FERC and enforced by NERC.
Under Section 210 of the FPA, TVAreliability; (2) can be ordered to interconnect its transmission facilities with the electrical facilities of independent generators and of other electric utilities that meet certain requirements. It must be found that the requested interconnection is in the public interest and would encourage conservation of energy or capital, optimize efficiency of facilities or resources, or improve reliability. The requirements of Section 212 of the FPA concerning the terms and conditions of interconnection, including reimbursement of costs, must also be met.
Under Section 211 of the FPA, TVArequirements; (3) can be ordered to transmit wholesale power provided that the order (1)(a) does not impair the reliability of the TVA or surrounding systems, and (2)(b) meets the applicable requirements of Section 212 concerning terms, conditions, and rates for service, as well asand (c) does not implicate the anti-cherrypicking provision of Section 212, which precludes FERC from ordering TVA to wheel another supplier's power if the power wouldACPA; (4) could be consumed within TVA's defined service territory. Under Section 211A of the FPA, TVA is subject to FERC review of the transmission rates and the terms and conditions of service that TVA provides. The purpose of this reviewprovides; and (5) is to ensure comparability of treatment of such service with TVA's own use of its transmission system and that the terms and conditions of service are not unduly discriminatory or preferential.
Sections 221 and 222 of the FPA, applicable to all market participants, including TVA, prohibit (1)prohibited from (a) reporting false information on the price of electricity sold at wholesale or the availability of transmission capacity to a federal agency with intent to fraudulently affect the data being compiled by the agency and (2)(b) using manipulative or deceptive devices or contrivances in connection with the purchase or sale of power or transmission services subject to FERC’sFERC's jurisdiction.
Section 206(e) of In addition, the FPA provides FERC with authority (1) to order refunds of excessive prices on short-term sales (transactions lasting 31 days or less) by all market participants, including TVA, in price gouging situations if such sales are through an independent system operator or regional transmission organization under a FERC-approved tariff.
Section 220 of the FPA provides FERC with authoritytariff; (2) to issue regulations requiring the reporting, on a timely basis, of information about the availability and prices of wholesale power and transmission service by all market participants, including TVA.
Under Sections 306 and 307 of the FPA, FERC mayTVA; (3) to investigate electric industry practices, including TVA’sTVA's operations previously mentioned that are subject to FERC’s jurisdiction.
Under Sections 316FERC's jurisdiction; and 316A of the FPA, FERC has authority(4) to impose civil penalties of up to $1 million per day for each violation on entities subject toof the provisions of Part II of the FPA which includesdiscussed in the above provisionsprior paragraph that are applicable to TVA. Criminal penalties may also result from such violations.
Finally, while not required to do so, TVA has elected to implement various FERC orders and regulations pertaining to public utilities on a voluntary basis to the extent that they are consistent with TVA’sTVA's obligations under the TVA Act.
NERC Compliance
TVA is subject to federal reliability standards that are set forth by NERC and approved by FERC. These standards are designed to maintain the reliability of the bulk electric system, including TVA's generation and transmission system, and include areas such as maintenance, training, operations, planning, modeling, critical infrastructure, physical and cyber security, vegetation management, and facility ratings. TVA recognizes that reliability standards and expectations continue to become more complex and stringent for transmission systems.
Nuclear Regulatory Commission
TVA operates its nuclear facilities in a highly regulated environment and is subject to the oversight of the NRC, an independent federal agency whichthat sets the rules that users of radioactive materials must follow. The NRC has broad authority to impose requirements relating to the licensing, operation, and decommissioning of nuclear generating facilities. In addition, if TVA fails to comply with requirements promulgated by the NRC, the NRC has the authority to impose fines, shut down units, or modify, suspend, or revoke TVA’sTVA's operating licenses. See Item 7, Management's Discussion and Analysis of Financial Condition and Results of Operations — Key Initiatives and Challenges — Generation Resources.
Environmental Protection Agency
TVA is subject to regulation by the EPA in a variety of areas, including air quality control, water quality control, and management and disposal of solid and hazardous wastes. See Environmental Matters below. and Item 7, Management's Discussion and Analysis of Financial Condition and Results of Operations — Key Initiatives and Challenges.
States
The Supremacy Clause of the U.S. Constitution prohibits states, without congressionalfederal legislative consent, from regulating the manner in which the federal government conducts its activities. As a federal agency, TVA is exempt from regulation, control, and taxation by states except in certain areas where Congress has clearly made TVA subject to state regulation. See Environmental Matters below.
Other Federal Entities
TVA’sTVA's activities and records are also subject to review to varying degrees by other federal entities, including the Government Accountability Office and the Office of Management and Budget ("OMB"). There is also an Office of the Inspector General which reviews TVA’sTVA's activities and records.
Taxation and Tax Equivalents
TVA is not subject to federal income taxation. In addition, neither TVA nor its property, franchises, or income is subject to taxation by states or their subdivisions. Section 13 of theThe TVA Act, however, does require TVA to make tax equivalent payments to states and counties in which TVA conducts power operations or in which TVA has acquired properties previously subject to state and local taxation. The total amount of these payments is five percent of gross revenues from the sale of power during the preceding year excluding sales or deliveries to other federal agencies and off-system sales with other utilities, with a provision for minimum payments under certain circumstances. Except for certain direct payments TVA is required to make to counties, distribution of tax equivalent payments within a state is determined by individual state legislation.
Environmental Matters
TVA’s TVA's activities, particularly its power generation activities, are subject to comprehensive regulation under environmental laws and regulations relating to air pollution, water pollution, and management and disposal of solid and hazardous wastes, among other issues.matters. Emissions from all TVA-owned and operated units (including small combustion turbine units of less than 25 MWs whose emissions are not required to be reported to the EPA)MW) have been reduced from historic peaks. Emissions of nitrogen oxide ("NOx") have been reduced by 9297 percent below peak 1995 levels and emissions of sulfur dioxide ("SO2") have been reduced by 9799 percent below 1977 levels through CY 2016.2020. For CY 2016, TVA’s emission2020, TVA's emissions of carbon dioxide ("CO2") from its sources was 69owned and operated units, including purchased power and REC retirement adjustments which reduce the CO2 emissions, were 43 million tons, resulting in a 34TVA system average, as delivered, CO2 emission rate of 562 lbs/MWh. This represents a 63 percent reduction in mass carbon emissions from 2005 levels. This includes 1,829 tons from units rated at less than 25 MWs whose emissions are not required to be reported to the EPA. To remain consistent and provide clear
information and to align with the EPA’sEPA's reporting requirements, TVA intends to continue to reportreporting CO2 emissions on a calendar year basis.
Additional quantitative emissions data is as follows:
| | | | | | | | | | | | | | | | | |
|
Emissions and Intensity Rates (1) | | 2020 | | 2019 | | | |
Nitrogen Oxide (NOx)(2) | | | | | | | |
Total NOx Emissions (MT) | | 12,577 | | 19,430 | | | |
Total NOx Emissions Intensity (MT/Net MWh) | | 0.000094 | | 0.000140 | | | |
Sulfur Dioxide (SO2)(2) | | | | | | | |
Total SO2 Emissions (MT) | | 17,082 | | 26,972 | | | |
Total SO2 Emissions Intensity (MT/Net MWh) | | 0.000127 | | 0.000194 | | | |
| Mercury (Hg) | | | | | | | |
| Total Hg Emissions (kg) | | 17.5 | | 50.1 | | | |
| Total Hg Emissions Intensity (kg/Net MWh) | | 0.0000001 | | 0.0000004 | | | |
| | | | | | | |
| | | | | | | |
Notes
(1) Intensity rates are calculated based on generation from TVA's most recent fiscal year for years indicated and emissions data from the most recent calendar years.
(2) Emissions data is consistent with Edison Electric Institute Environmental, Social, Governance and Sustainability Report standards, which are based on metric tons ("MTs") whereas overall CO2 emission rates and baseline reductions from historical levels are based on short tons.
Clean Air Act
The CAA establishes a comprehensive program to protect and improve the nation’snation's air quality and control sources of air pollution. The major CAA programs that affect TVA’sTVA's power generation activities are described below.
National Ambient Air Quality Standards. The CAA requires the EPA to set National Ambient Air Quality Standards ("NAAQS") for certain air pollutants. The EPA has done this for ozone, particulate matter ("PM"), SO2, nitrogen dioxide, ("NO2"), carbon monoxide, and lead. Over the years, the EPA has made the NAAQS more stringent. Each state must develop a plan to be approved by the EPA for achieving and maintaining NAAQS within its borders. These plans impose limits on emissions from pollution sources, including TVA fossil fuel-fired plants. Areas meeting a NAAQS are designated as attainment areas. Areas not meeting a NAAQS are designated as non-attainment areas, and more stringent requirements apply in those areas, including stricter controls on industrial facilities and more complicated permitting processes. TVA fossil fuel-fired plants can be impacted by these requirements. All TVA generating units are located in areas designated as in attainment with NAAQS. EPA designated the Knoxville area as attainment with the 1997 annual fine PM NAAQS effective August 19, 2017, and in attainment with the 2006 24-hour fine PM NAAQS effective September 27, 2017.
All areas of the Tennessee Valley meet the 2008 ozone NAAQS. On October 1, 2015, the EPA issued a final rule to revise the ozone NAAQS to 70 parts per billion ("ppb") from the 2008 standard of 75 ppb. On November 6, 2017, the EPA Administrator signed a final rule establishing initial air quality designations for most areas in the United States with respect to the 2015 ozone standard. All areas within the Tennessee Valley were designated by the EPA as Attainment/Unclassifiable for the 70 ppb standard.
On March 2, 2015, the United States District Court for the Northern District of California approved a consent decree between the EPA and certain environmental petitioners in Sierra Club v. McCarthy. The consent decree set a schedule for the EPA to complete nationwide area designations with respect to the 2010 1-Hour SO2 NAAQS based on monitored air quality levels and SO2 source emission rates and amounts. Air quality modeling was required in 2016 to determine designation of areas around five TVA coal-fired plants. No areas around any TVA generating units were designated non-attainment. Lower SO2 permit limits well within the capability of existing control equipment are in place for Gallatin. The impacted Paradise coal Units 1 and 2 have been retired.
Cross-State Air Pollution Rule. The EPA issued the Cross-State Air Pollution Rule ("CSAPR") in July 2011 requiring several states in the eastern United StatesU.S. to improve air quality relative to the 1997 ozone NAAQS and the 1997 and 2006 fine particle NAAQS by reducing power plant emissions that contribute to pollution in other states. In 2016, the EPA issued an update to CSAPR replaced the Clean Air Interstate Ruleto address cross-state air pollution (the "CSAPR Update Rule"). The EPA subsequently issued an additional rule to resolve any remaining cross-state air pollutant issues ("CAIR"CSAPR Close-Out Rule"), a similar but less stringent rule.. The U.S. Court of Appeals for the District of Columbia Circuit ("D.C. Circuit") vacatedremanded a portion of the CSAPR before implementation began, butUpdate Rule back to the D.C. Circuit’s vacatur was reversedEPA to address its failure to require upwind states to eliminate substantial contributions to downwind non-attainment areas by the U.S. Supreme Court in April 2014. Upon further proceedings on remand,statutory deadline. The D.C. Circuit also vacated the CSAPR Close-Out Rule. On March 15, 2021, the EPA Administrator signed the final revisions to the CSAPR Update Rule. The revisions address the defects identified by the D.C. Circuit granted the EPA’s motion to restore CSAPR but delayed the compliance deadlines by three years. Under the revised compliance deadlines, Phase I emission reductions in SO2 and NOx became effectivetook effect on January 1, 2015, and were followed by Phase II reductions on May 1, 2017. TVA complies with CSAPR aided by significant prior reductions in SO2 and NOx emissions and planned future reductions.
On September 7, 2016,June 29, 2021. In this final action, the EPA issued an updatereduced ozone-season NOx allowances for a group of 12 states, including Kentucky, and required sources in those states to CSAPRsurrender most of their banked allowances.TVA's Shawnee Fossil Plant ("Shawnee") facility is affected by these revisions, and TVA is in the process of analyzing compliance strategies to address cross-state pollution relative todetermine how any shortage in allowances will be overcome for the 2008 ozone NAAQS,season in 2022 and also to respond to a July 2015 remand of the CSAPR emission budgets for certain states by the D.C. Circuit. In this update, the EPA implemented more stringent Phase II reductions for NOx that become effective on May 1, 2017. TVA has not had and does not currently anticipate significant changes to its operations based on the September 7, 2016, EPA Cross-State Air Pollution Update Rule ("CSAPR Update Rule").beyond.
Mercury and Air Toxics Standards for Electric Utility Units. In April 2020, the EPA issued a final rule which revokes the agency's earlier finding that regulation of hazardous air pollutants ("HAP") emitted from steam electric utilities is appropriate and necessary. The D.C. Circuit upheldrule does not remove electric generating units from the source categories listed under Section 112 of the CAA nor does it rescind the Mercury and Air Toxics Standards ("MATS") rule on April 15, 2014. In June 2015, however, the United States Supreme Court (“Supreme Court”) left the rule in place but remanded it back torequirements. Additionally, the EPA findingdetermined that further restrictions on HAP emissions are not warranted based on a residual risk and technology review ("RTR") for this source category. TVA does not anticipate that the EPA was required to consider cost before deciding whether the regulation of hazardous air pollutants emitted from steam electric utilities was appropriatefinal rule will change TVA's MATS compliance requirements or strategy. Certain states and necessary. In response to the Supreme Court's remand, the EPA published the final Supplemental Finding That It is Appropriate and Necessary to Regulate Hazardous Air Pollutants from Coal- and Oil-Fired Electric Utility Steam Generating Units in April 2016. Severalenvironmental groups have filed petitions within the D.C. Circuit challenging the EPA’s determination. The MATS rule remains in effect while these challenges are pending,"appropriate and TVA’s MATS compliance strategy will not be affected by these challenges. Also in April 2016, in response to a request from TVA,necessary" finding and the RTR finding. On February 16, 2021, the EPA issued an administrative orderfiled a motion requesting the D.C. Circuit to hold the cases in abeyance pending the agency's review of the final rule under Executive Order ("EO") 13990, which, among other things, requires the CAAEPA to allow operationreconsider the final rule by August 2021. The EPA did not meet the August 2021 deadline, but is expected to issue a proposed rule that reverses the findings of Paradise coal-fired Units 1 and 2 for a year beyond the original MATS compliance date of April 15, 2016. The additional year allowed these units to continue to operate while2020 final rule. TVA will evaluate the new natural gas-fired generation facility being built at the site became operational. The natural gas-fired generation facility reached commercial operation in the spring of 2017, and Paradise coal-fired Units 1 and 2 have been retired.proposal when it is issued.
The Environmental Agreements. See Note 21 23—Commitments and Contingencies —Legal Proceedings—Environmental Agreements for a discussion of two substantively similar agreements into which TVA entered in April 2011: one with the Environmental Agreements,EPA and the other with Alabama, Kentucky, North Carolina, Tennessee, and three environmental advocacy groups: the Sierra Club, the National Parks Conservation Association, and Our Children's Earth Foundation (collectively, the "Environmental Agreements"), which discussion is incorporated herein by reference.
Acid Rain Program. Congress established theThe Acid Rain Program is intended to achieve reductions inhelp reduce emissions of SO2 and NOx, which are the primary pollutants implicated in the formation of acid rain. The program includes a cap-and-trade emission reduction program for SO2 emissions from power plants. TVA continues to reduce SO2 and NOx emissions from its coal-fired plants, and the SO2 allowances allocated to TVA under the Acid Rain Program are sufficient to cover the operation of its coal-fired plants. In the TVA service area, the limitations imposed on SO2 and NOxemissions by the CSAPR program are more stringent than the Acid Rain Program. Therefore, TVA forecastsdoes not anticipate that the Acid Rain Program will have no impactimpose any additional material requirements on TVA other than administrative reporting.TVA.
Regional Haze Program. In June 2005, theThe EPA issued the Clean Air Visibility Rule, amending its CY 1999 regional haze rule, which had established timelines for states to improve visibility in national parks and wilderness areas throughout the United States with a target of reaching no anthropogenic impacts on visibility in these areas by 2064. One requirement under the amended rule is thatrequired certain types of older existing sources are required to install best available retrofit technology. No additional controls or lower operating limits are required for any TVA units to meet best available retrofit technology requirements. On January 10,In 2017, the EPA published the final rule "Protection of Visibility: Amendments to Requirements for State Plans." The rule would changethat changed some of the requirements for Regional Haze State Implementation Plans ("Regional Haze SIPs"). TVA does not expect significantSpecific impacts to its operations from these changes, but specific impacts are not possible to predictcannot be determined until the rule is final and future Regional Haze SIPs are submitteddeveloped for the next decennial review under the visibility haze provisions of the CAA. States were required to submit their Regional Haze SIPs to the EPA by July 31, 2021. In response to requests from state air pollution control agencies in Tennessee and approved.Kentucky, TVA submitted regional haze analyses for Cumberland Fossil Plant ("Cumberland") and Shawnee. The reports evaluate SO2 emission reduction options for these facilities and will be used by these state agencies in preparing their Regional Haze SIPs.
Opacity. Opacity, or visible emissions, measures the denseness (or color) of power plant plumes and has traditionally been used by states as a means of monitoring good maintenance and operation of particulate control equipment. Under some conditions, retrofitting a unit with additional equipment to better control SO2 and NOx emissions can adversely affect opacity performance, and TVA and other utilities are addressinghave addressed this issue. The evaluation of utilities' compliance with opacity requirements is coming under increased scrutiny, especially during periods of startup, shutdown, and malfunction. State implementation plansHistorically, SIPs developed under the CAA typically excludeexcluded periods of startup, shutdowns, and malfunctions, but onin June 12, 2015, the EPA finalized a rule to eliminate such exclusions.exclusions ("2015 Rule"). The EPA rule2015 Rule required states to modify their implementation plans
by November 12, 2016. Kentucky, Tennessee, and Mississippi submitted implementation plans, but Alabama has not. Environmental petitioners and several states filed petitions for judicial review of the EPA final rule2015 Rule before the D.C. Circuit. OnIn April 24, 2017, the D.C. Circuit, at the request of the new EPA Administrator, ordered this litigation to be held in abeyancesuspended pending the EPA's review to determine whether to reconsider all or part of the rule. TVA does not expect significant impacts from these rule changes.
2015 Rule. On October 1, 2017,9, 2020, the Kentucky Division for Air Quality published proposed revised startup/shutdown regulations for newEPA issued a guidance memorandum ("2020 Memorandum") that superseded and existing indirect heat exchangers. TVA’s Shawnee and Paradise plants have boilers whichreplaced policy statements outlined in the 2015 Rule. On September 30, 2021, the EPA withdrew the 2020 Memorandum, reinstating the agency's prior policy as set out in the 2015 Rule. The EPA's evaluation of state SIPs will be subject to these rules when finalized and incorporated into their air permits.undertaken in light of the considerations outlined in the September 30, 2021 memorandum. TVA cannot predict the outcome of future SIP evaluations.
New York Petition to ExpandAddress Impacts from Upwind High Emitting Sources. In 2018, the Ozone Transport Region. On December 9, 2013, eightState of the twelve states that make up the Ozone Transport Region ("OTR") submittedNew York filed a petition pursuant to section 176A(a)with the EPA under Section 126(b) of the CAA requestingto address ozone impacts on New York from the EPA to addNOx emissions from sources emitting at least 400 tons of NOx in CY 2017 from nine states including Kentucky and Tennessee, to the OTR.Kentucky. The EPA failed to act on the petition within the 180-day period provided under the CAA. On October 6, 2016, six of the eight states filing the petition sued the EPA in the U.S. District Court for the Southern District of New York asking the court to require the EPA to act on the petition by a date certain. In response to this lawsuit, the EPA published, on January 19, 2017, a notice in the Federal Register proposing to deny the petition on the basis that the CAA provides other options, such as the use of the “good neighbor provision” in Section 110, and Section 126, to address the impact of interstate air pollution. The EPA also states that its CSAPR Update Rule is a significant step to control states’ emission reduction obligations under Section 110 to meet the 2008 ozone NAAQS. The comment period on this proposal closed on May 15, 2017. On October 27, 2017, the EPA denied the petition.
Kentucky Federal Implementation Plan to Address Downwind Ozone Impacts. On June 2, 2016, the EPA missed its deadline to promulgate a federal implementation plan ("FIP") for Kentucky to address its obligation for ozone emissions originating in Kentucky that might be transported to New York and other downwind states and was sued by the Sierra Club for missing the deadline. On May 23, 2017, the U.S. District Court for the Northern District of California ruledrequests that the EPA must promulgate the Kentucky FIP by June 30, 2018, sooner than the EPA had proposed. Until the EPA developsrequire daily NOx limits for utility units with selective catalytic reduction systems ("SCRs") such as Shawnee Units 1 and releases a proposed FIP, expected impacts to TVA are not possible to determine.4 and emission reductions from utility units without SCRs such as Shawnee Units 2, 3, and 5-9. Kentucky utility unit NOxemissions that contribute to ozone are already limited by the CSAPR Update Rule and are declining. Further reductions maydeclining, and current EPA modeling projects no additional requirements to reduce Kentucky NOx emissions are necessary. In 2019, the EPA finalized its denial of New York's petition because the state did not be required bydemonstrate, and the FIP.
Maryland PetitionEPA could not independently establish, that sources in the states listed in the petition contribute to Address Impacts from Upwind Electric Generating Units. On September 27, 2017,exceedances of the 2008 and 2015 ozone NAAQS in New York. The State of MarylandNew York filed a lawsuit againstpetition in the D.C. Circuit for judicial review of the EPA's denial of the petition. In July 2020, the D.C. Circuit vacated the EPA's denial of the petition and remanded the petition to the EPA for failingreconsideration. In its recently published Unified Regulatory Agenda, the EPA indicated that it will respond to act within 60 daysthe D.C. Circuit's decision by providing a revised response to New York's Section 126(b) petition. Specific impacts to TVA cannot be determined until the EPA takes further action on Maryland’s petition under Section 126the petition.
Affordable Clean Energy Rule. In 2019, the EPA finalized the Affordable Clean Energy ("ACE") rule and repealed the EPA's previous regulation addressing greenhouse gas ("GHG") emissions from existing fossil fuel-fired units. The ACE rule established guidelines for GHG emissions from existing coal-fired units based on efficiency improvements that can be achieved at those units at reasonable cost. Several industry, environmental, and state and local petitioners filed for judicial review of the Clean Air Act to address ozone impacts on Maryland fromACE rule. On January 19, 2021, the NOx emissions of 36 electric generating units, including TVA’s Paradise coal-fired Unit 3. On October 4, 2017, a group of seven environmental advocacy groups filed a similar complaint againstD.C. Circuit vacated and remanded the EPA. AtACE rule, and specified that the court's mandate will not issue in Maryland’s Section 126 petition are alleged excessive NOx emissions from the 36 electric generating units as a result of SCR units not being operated continuously. Paradise coal-fired Unit 3 is equipped with a SCR unit that TVA continuously operatesregard to the greatest extent technically practicable in order to minimize NOx emissions. Until the EPA responds to Maryland’s Section 126 petition, it is not possible to determine the potential impactsportion of the petition on TVA.
Climate Change
Regulation. On August 3, 2015, the EPA issuedACE rule that repeals the Clean Power Plan ("CPP"), a rule under section 111(d) of the CAA, to reduce carbon emissions from existing power plants burning fossil fuels. The Clean Power Plan establishes state-specific emission goals to lower CO2 emissions from power plants, targeting a 32 percent nationwide reduction in CO2 emissions from 2005 levels by 2030. The EPA established an “interim goal” that states must meet on average over the eight-year period from 2022-2029 and a “final goal” that states must meet in 2030 and thereafter based on a two-year average. States were required to submit tountil after the EPA final plans, or “initial plans” withdevelops a requestreplacement for an extension, by September 6, 2016. States that received an extension are required to submit final plans by September 6, 2018.
Onthe ACE rule. In Congressional hearings in February 9, 2016, the U.S. Supreme Court granted a stay of the Clean Power Plan. The stay will remain in place while the D.C. Circuit reviews the rule and during any subsequent appeals to the U.S. Supreme Court that may occur after the D.C. Circuit issues its opinion. The stay means that the Clean Power Plan has no legal effect while courts are reviewing the rule to determine whether it is lawful. The D.C. Circuit, sitting en banc, heard oral arguments on the Clean Power Plan on September 27, 2016.
On April 28, 2017, the D.C. Circuit issued an order, at the request of2021, the EPA Administrator holding the case in abeyance pending the EPA's review of the Clean Power Plan to determine whether to repeal or modify it. On October 10, 2017, the EPA published a notice in the Federal Register proposing to repeal the Clean Power Plan. The notice providesstated that the EPA has not determined whether it will promulgatepropose a Section 111(d)new rule to regulate CO2 emissions from electric generating units. On April 29, 2021, a coalition of states asked the Supreme Court to reverse the D.C. Circuit's decision to vacate and if it will do so, when it will do so and what formremand the rule will take.
On August 3, 2015,ACE rule. TVA is unable to predict the future course of this litigation on appeal, nor the direction that the EPA also finalized may take in the future to regulate GHG emissions from fossil fuel-fired units.
New Source Performance Standards. In 2018, the EPA proposed revisions to the GHG emission standards for carbon emissions from new, modified, and reconstructed power plants. These standards apply to two types of fossil fuel-fired sources: (1) stationary combustion turbines, generally firing natural gas, and (2) electric utility steam generating units generally firing coal. Theserequired under Section 111(b) of the CAA. For coal-fired units, the EPA proposes to revise the current new source standards reflectsuch that carbon capture and sequestration technology is no longer necessary to meet the degreestandards of emission limitation achievable through the application ofperformance that reflect the best system of emission reduction ("BSER") thatreduction. The resulting limits are less stringent than limits under the EPA has determined tocurrent rule and can be adequately demonstrated for each type of source. These standards apply to the new TVA combined-cycle plants at the Paradise site, which is alreadymet by modern coal-fired units (e.g., supercritical steam generators) in combination with best operating practices, but without carbon capture and at Allen, which is under construction. The design of these plants enables them to comply with the new standards.
Executive Actions. To strengthen the Administration's efforts to increase government-wide energy efficiency and sustainability and implement goals in the President’s June 2013 Climate Action Plan, President Obama issued a memorandum on December 5, 2013, requiring that at least 20 percent of the total amount of energy consumed by each federal agency in any fiscal year, starting in 2020, be renewable energy. TVA is on track to achieve the aforementioned 2020 goal of the Presidential Memorandum. In addition, on March 25, 2015, President Obama issued Executive Order ("EO") 13693, which directed each federal agency to ensure that, starting in 2025 and continuing each year thereafter, no less than 30 percent of the total amount of building electric energy is renewable electric energy. TVA has submitted a climate adaptation plan as required by EO 13693, and TVA is aligning the federal climate adaption plan with climate resiliency planning. The Executive Order also established a clean energy target for federal agencies to achieve 25 percent of total building energy from renewable plus thermal energy by 2025.
On April 21, 2015, the Obama Administration released the initial installment of its Quadrennial Energy Review ("QER"). In the QER, the Obama Administration announced that the DOE is creating a partnership with 17 energy companies, including TVA, to improve infrastructure resilience against extreme weather and climate change. The first installment of the QER was published in April 2015, and the second installment was published in January 2017.
On March 28, 2017, President Trump issued EO 13783, “Promoting Energy Independence and Economic Growth.” The EO reversed or altered many actions taken by the federal government in the last four years to address climate change and mandates that federal agencies review existing regulations and actions that potentially burden energy development and use. Several EOs, policy statements, and reports that established climate change objectives were rescinded or revoked.sequestration. The EPA is requirednot proposing to reviewrevise the new source performance standard for GHG emission from gas-fired units. In January 2021, the EPA published criteria in the Federal Register for making a significant contribution finding for GHGs from a source category for the purpose of regulating those emissions under Section 111(b) of the CAA, and if appropriate, suspend or revise specific rules including the Clean Power Plan. The EPA throughdid not take final action on the Department of Justice, has already requested2018 proposed revisions in this rulemaking. On March 17, 2021, the EPA asked the D.C. Circuit to hold all litigation relatingvacate and remand the "significant contribution" finding since the rule was promulgated without public notice or opportunity to these rules in abeyance pending completion ofcomment. On April 5, 2021, the EPA’s review ofD.C. Circuit vacated and remanded the rules. The EOJanuary 2021 final rule. If finalized as proposed, the revisions are not expected to significantly impact TVA since TVA does not cover all relevant policies, orders,currently plan to construct, modify, or reconstruct any coal-fired units.
Climate Change
Executive Actions. On January 20, 2021, President Biden issued EO 13990, "Protecting Public Health and the Environment and Restoring Science To Tackle the Climate Crisis." EO 13990 directs federal agencies to review and revise regulations relatedconsistent with broad policy goals to climate change and did not rescind EO 13693, “Planning for Federal Sustainability in the Next Decade.” EO 13783 also did not mandate that the EPA reconsider its finding under the CAA that greenhouse gas emissions cause climate change and therefore endangerimprove public health and the environment. environment, reduce GHG emissions, and prioritize environmental justice. On March 8, 2021, a coalition of 12 states filed a lawsuit in the U.S. District Court for the Eastern District of Missouri challenging President Biden's authority to establish interim values for the social cost of GHGs under EO 13990. On August 31, 2021, the court dismissed the matter, but the plaintiffs have appealed the decision to the U.S. Court of Appeals for the Eighth Circuit. A similar lawsuit is pending in the U.S. District Court for the Western District of Louisiana. EO 13990 also requires the EPA to review several environmental regulations to determine their consistency with the goals and policies prescribed in the EO. Specific impacts to TVA of EO 13990 cannot be determined at this time.
WhileIn addition, on January 27, 2021, President Biden issued EO 13783 requires review14008, "Executive Order on Tackling the Climate Crisis at Home and Abroad." Among other things, EO 14008 expresses the following policies of the federal government: (1) to organize and deploy the full capacity of its agencies to combat the climate crisis to implement a government-wide approach that reduces climate pollution in every sector of the economy, (2) to align the management of federal procurement and real property, public lands and waters, and financial programs to support robust climate action, (3) to use all agency actionsavailable procurement authorities to achieve or facilitate (a) a carbon pollution-free electricity sector no later than 2035 and (b) clean and zero-emission vehicles for
federal, state, local, and tribal government fleets, (4) to put the U.S. on a path to achieve net-zero emissions, economy-wide, by no later than 2050, (5) to accelerate the deployment of clean energy and transmission projects in an environmentally stable manner, (6) to ensure that, potentially burdento the safe, efficientextent consistent with applicable law, federal funding is not directly subsidizing fossil fuels, (7) to promote the flow of capital toward climate-aligned investments and away from high-carbon investments, (8) improve air and water quality, and (9) secure an equitable economic future by making environmental justice part of an agency's mission. TVA is closely monitoring these developments, including the Justice40 Initiative, the Department of Treasury effort to establish a carbon market, establishment and development of domestic energy resources, the Civilian Climate Corps, and establishment of several White House comprehensive plans. In addition, EO 14008 created the Special Presidential Envoy for Climate and called for an early Leaders' Climate Summit aimed at raising climate ambition and making a positive contribution to the 26th United Nations Climate Change Conference of the Parties and beyond. EO 14008 also stated the U.S. would reconvene the Major Economies Forum on Energy and Climate, beginning with the Leader's Climate Summit. Federal agencies were directed to update their Climate Change Action Plans, and TVA submitted its draft plan in May 2021 and submitted its final plan in August 2021. Aside from the directive to update TVA’s Climate Change Action Plan, specific requirements and impacts from implementation of this EO are not possible to predict14008 on TVA cannot be determined at this time. It is likely that there will be some delay in
On May 20, 2021, President Biden also issued EO 14030, “Climate-Related Financial Risk,” which calls for a governmental-wide strategy on the disclosure of climate-related financial risk. EO 14030 requires the development of futuregovernment-wide strategy regarding the following: (1) the measurement, assessment, mitigation, and disclosure of climate-related financial risk to federal government programs, assets, and liabilities in order to increase the long-term stability of federal operations; (2) financing needs associated with achieving net-zero greenhouse gas ("GHG") reduction requirements. TVA’s historicalemissions for the U.S. economy by no later than 2050, limiting global average temperature rise to 1.5 degrees Celsius, and projected GHG reductions are expectedadapting to meet the requirementsacute and chronic impacts of climate change; and (3) areas in which private and public investments can play complementary roles in meeting these financing needs while advancing economic opportunity, worker empowerment, and environmental mitigation, especially in disadvantaged communities and communities of color. While TVA is subject to this EO, the currently stayed Clean Power Plan, and TVA’s new generating units are designed to meet the applicable GHG requirements for new units.specific impacts of EO 14030 cannot be determined at this time.
International Accords. OnIn September 3, 2016, the United StatesU.S. formally accepted the Paris agreement.Agreement. The agreement met the threshold of at least 55 countries that account for at least 55 percent of global greenhouse gas emissionGHG emissions and
formally entered into force onin November 2016. On November 4, 2016. The durability of2019, the Paris agreement commitments is uncertain afterU.S. formally notified the President’s announcement on June 1, 2017,United Nations that the U.S.it would withdraw from the agreement. Under the terms of the agreement, the earliest possible effective date for the withdrawal bywas November 4, 2020.
On January 20, 2021, President Biden formally rejoined the Paris Agreement on behalf of the U.S. is November 4, 2020, four years after the agreement came into effect. Future U.S. regulation on greenhouse gases designed to meetThe means for tracking emissions targets under the Paris agreement goals could impactAgreement are nationally determined contributions ("NDCs"). Each nation that is a party to the Paris Agreement is asked to prepare five-year, successive NDCs that it plans to achieve. On April 22, 2021, the Biden Administration announced its GHG NDCs for 2030 under the Paris Agreement, and these NDCs establish a new target for the U.S. to achieve a 50 to 52 percent reduction from 2005 levels in economy-wide net GHG pollution in 2030. Specific impacts to TVA in ways that cannot be determined at this time.
Litigation. In addition to legislative activity, climate change issues have been the subject of a number of lawsuits, including lawsuits against TVA. See Note 21 forTVA, and TVA may be subject to additional information.lawsuits in the future.
Indirect Consequences of Regulation or Business Trends. Legal, technological, political, and scientific developments regarding climate change may create new opportunities and risks. The potential indirect consequences could include an increase or decrease in electricity demand, increased demand for clean generation from alternative energy sources, and subsequent impacts to business reputation and public opinion. See Power Supply and Load Management Resources above.
Physical Impacts of Climate Change. TVA manages the potential effectsPhysical impacts of climate change onmay include, but not be limited to, changing weather patterns, extreme weather conditions, and other events such as flooding, droughts, wildfires, and snow or ice storms, and these events can impact TVA's system in terms of system operability, customer demand, and the health of regional economies. TVA has a Climate Change Action Plan which it updated in 2021 in accordance with EO 14008. TVA submitted its mission, programs,draft Climate Change Action Plan in May 2021 and operations within its environmental management processes.final plan in August 2021. The goal of the adaptationaction planning process is to ensure TVA continues to achieve its mission and program goals and to operate in a secure, effective, and efficient manner in a changing climate by integrating climate change adaptation efforts in coordination with other state and local partners, tribal governments, and private stakeholders. TVA's Climate Change Adaptation Plan was last updated in July 2017.TVA manages the potential effects of climate change on its mission, programs, and operations within its environmental management processes.
Actions Taken by TVA to Reduce GHG Emissions. TVA has reduced GHG emissions from both its generation stationsfacilities and its operations. As discussed earlier in this Item 1, Business, recent TVA Board actions have focused on TVA’sTVA's plan to balance its coal-fired generation by increasing its nuclear capacity, modernizing its hydroelectric generation system, increasing natural gas-fired generation, installing emission control equipment on certain of its coal-fired units, increasing its purchases of renewable energy, building solar facilities, and investing in energy efficiency initiatives to reduce energy use in the Tennessee Valley. Additionally, TVA has invested to reduceincrease energy useefficiency in its operations. The combination of more stringent environmental regulations, lower natural gas prices, and lower demand for energy across the Tennessee Valley has reduced the utilization of coal-fired generation. These factors have resulted in lower CO2 emissions from the TVA system.system, as previously discussed in this section. As TVA evolves its generation portfolio, and after appropriate environmental review under NEPA, the TVA Board could make decisions about the timing, retirement, and replacement of aging fossil units or other expiring capacity, which may further TVA’s CO2 and other emissions reductions. The Environmental Policy also provides additional direction in several environmental stewardship areas related to reducing environmental impacts on the Valley's natural resources, including reducing carbon intensity and air emissions.
Renewable/Clean Energy Standards
Twenty-nine Thirty states and the District of Columbia have established enforceable or mandatory requirements for electric utilities to generate a certain amount of electricity from renewable sources. One stateTwo states within the TVA service area, North Carolina has aand Virginia, have mandatory renewable standardstandards that, while not applying directly to TVA, doesdo apply to TVA’sTVA's LPCs serving retail customers in that state.those states. TVA's policy is to provide compliance assistance to any distributor of TVA power, and TVA is providing assistance to the covered LPCs that sell TVA power in North Carolina. In 2020, Virginia signed into law the Clean Economy Act. The Act establishes a mandatory requirement for utilities to generate a certain amount of electricity from renewable sources. At this time, TVA is not impacted by the legislation due to the relatively small amount of electricity that TVA provides in Virginia compared to other utilities. Likewise, the Mississippi Public Service Commission adopted an energy efficiency rule applying to electric and natural gas providers in the state, and TVA is supplying information on participation in ERS effortsTVA's energy efficiency programs to support the covered Mississippi LPCs.
Water Quality Control Developments
Waters of the United States. In 2015, the EPA and the USACE issued the Clean Water Rule, which redefined waters of the United States ("WOTUS") in the agencies' regulations for the first time since the 1980s and was intended to clarify the regulatory jurisdiction of the EPA and the USACE ("2015 WOTUS Rule"). In April 2020, the USACE and the EPA issued the Navigable Waters Protection Rule (“NWPR”), which established a new regulatory definition of WOTUS and replaced the definition set forth in the 2015 WOTUS Rule. The NWPR established four categories of waters considered jurisdictional under the CWA: (1) territorial seas and traditional navigable waters, (2) perennial and intermittent tributaries to those waters, (3) certain lakes and ponds, and impoundments of jurisdictional waters, and (4) wetlands adjacent to jurisdictional waters. The rule excluded twelve categories of waters, including ephemerals, groundwater, many ditches, and waste treatment systems. The NWPR reduced the jurisdictional reach of the CWA and could potentially reduce permitting and mitigation requirements for TVA projects that impact waters that were previously considered jurisdictional under the 2015 WOTUS Rule. The NWPR was challenged in multiple courts, and on August 30, 2021, it was vacated by the United States District Court for the District of Arizona. The United States District Court for the District of New Mexico also vacated it on September 27, 2021. Two other courts declined to vacate the rule, but remanded it to the EPA and the Army Corps of Engineers. Previously, on June 9, 2021, the EPA and the Department of the Army announced their intention to initiate a new rulemaking process to restore the definition of WOTUS that was in place prior to the 2015 WOTUS Rule and to develop a new rule to establish a new definition of WOTUS. The impact of the rulemaking process cannot be ascertained fully at this time. Pending the completion of the rulemaking process, the EPA and the USACE are interpreting WOTUS consistent with the pre-2015 definition.
Cooling Water Intake Structures. On May 19, In 2014, the EPA released a final rule under Section 316(b) of the Clean Water ActCWA relating to cooling water intake structures ("CWIS") for existing power generating facilities. The rule requires changes in cooling water intake structuresCWIS used to cool the vast majority of coal, gas, and nuclear steam-electric generating plants and a wide range of manufacturing and industrial facilities in the U.S. The final rule requires cooling water intake structuresCWIS to reflect the best technology available for minimizing adverse environmental impacts, primarily by reducing the amount of fish and shellfish that are impinged or entrained at a cooling water intake structure.CWIS. These new requirements will potentially affect a number of TVA’sTVA's fossil- and nuclear-fueled facilities and will likely require capital upgrades to ensure compliance. Most TVA facilities are projected to require retrofit of CWIS with “fish-friendly”"fish-friendly" screens and fish return systems to achieve compliance with the new rule. The rule is being implemented through permits issued under the National Pollutant Discharge Elimination System ("NPDES") in Section 402 of the Clean Water Act.CWA. State agencies administer the NPDES permit program in most states including those in which TVA’sTVA's facilities are located. In addition, the responsible state agencies must provide all permit applications to the U.S. Fish &and Wildlife Service for a 60-day review prior to public notice and an opportunity to comment during the public notice. As a result, the permit may include requirements for additional studies of threatened and endangered species arising from U.S. Fish &and Wildlife Service comments and may require additional measures be taken to protect threatened and endangered species and critical habitats directly or indirectly related to the plant cooling water intake. TVA’sTVA's review of the final rule indicates that the rule offers adequate flexibility for cost-effective compliance. The required compliance timeframe is linked to plant specificplant-specific NPDES permit renewal cycles (i.e., technology retrofits), and compliance is expected to be required beginning in the 2022-2024CY 2022 - 2024 timeframe.
The EPA has never previously applied the requirements under Section 316(b) to hydroelectric facilities. However, on September 30, 2021, EPA Region 10, which covers an area outside TVA’s service area, issued NPDES permits to four hydroelectric plants that include Section 316(b) requirements. In determining the best technology available (“BTA”) to minimize adverse impacts on the environment using best professional judgment, Region 10 analyzed the existing controls that the hydroelectric facilities were already implementing and concluded that those controls constitute BTA. It is not clear whether this approach will be adopted nationwide or how the BTA standard would be applied to TVA's hydroelectric facilities; accordingly, the specific impacts to TVA from the new Region 10 permits cannot be determined at this time.
Hydrothermal Discharges. The EPA and many states continue to focus regulatory attention on potential effects of hydrothermal discharges. Many TVA plants have variances from thermal standards under Section 316(a) of the Clean Water ActCWA that are subject to review as NPDES permits are renewed. Specific data requirements in the future will be determined based on negotiations between TVA and state regulators. If plant thermal limits are made more stringent, TVA may have to install cooling towers at some of its plants and operate installed cooling towers more often. This could result in a substantial cost to TVA.
Steam-Electric Effluent Guidelines. On November 3,In 2015, the EPA published a final rule to revise therevised existing steam- electricsteam-electric effluent limitation guidelines ("ELGs") that updates the existing technology-based, which regulate water discharge limitations for power plants nationwide.pollutants and require the application of certain pollutant control technologies. The new
2015 ELGs establishestablished more stringent performance standards for existing and new sources that will require power plants that generate more than 50 MWand required major upgrades to regulate discharges of toxic pollutants from seven primary wastewater treatment options at all coal-fired plants. Compliance with new requirements was originally required in the CYs 2018-2023 timeframe, but the EPA delayed the compliance dates for flue gas desulfurization ("FGD") wastewater and bottom ash transport water until CYs 2020 - 2023 to allow the EPA time to review and potentially revise the ELGs with regard to these waste streams.
In October 2020, the EPA issued final revised ELGs for bottom ash transport water and FGD wastewater. The primary impact for TVA is on the operation of existing and any potential new coal-fired generation facilities. The rule has the potential torevised ELGs could impact long-term investment decisions being made relative to the long-term compliance and operability of these plants. The revisions may require TVA coal-fired units. Compliance with new requirements is required in the 2018-2023 timeframe and will necessitate major upgrades to install additional wastewater treatment systems at all coal-fired plants. Dry fly ash handling is mandated by the rule. The rule also requires either dry bottom ash handling systems or “no discharge” recycle of bottom ash transport waters. In addition, new technology-based limits on flue gas desulfurizationfor FGD wastewater require primary physical or chemical treatment and secondary biological treatment to meet extremely low limits for arsenic, mercury, and selenium. On April 12, 2017, in response to Petitions for Reconsideration by the Utility Water Act Group and the Small Business Administration, the EPA Administrator announced his decision to reconsider the ELG rule. The EPA also proposed a rule to postpone the rule’s compliance deadlines pending the EPA’s reconsideration of the rule.
On August 11, 2017, the new EPA Administrator announced his decision to conduct a rulemaking to potentially revise the new, more stringent effluent limitations that apply to bottom ash transport water, and flue gas desulfurization ("FGD") wastewaterTVA could incur substantial costs to comply with the new rule. In addition, the revised ELGs could cause TVA to reduce utilization of its coal-fired generation facilities or even close such facilities. The revision also includes a subcategory for which Cumberland would qualify that provides TVA greater flexibility in meeting the ELGs. The revision includes two additional subcategories for low utilization units and units that cease coal combustion by the end of CY 2028. TVA is evaluating the applicability of those subcategories to its plants as appropriate. In October 2021, TVA filed Notices of Planned Participation preserving the option for TVA's Bull Run, Cumberland, and Kingston plants to participate in the 2015 rule. A legal challengesubcategory for units that cease coal combustion by the end of CY 2028.
Petitions for judicial review of the October 2020 ELG rule is currently pending beforewere filed in the D.C. Circuit and the U.S. Court of Appeals for the Fifth Circuit. AtFourth Circuit (the "Fourth Circuit") and have been consolidated in the EPA’s request,Fourth Circuit in the court oncase Appalachian Voices, et al. v. EPA. On August 22, 2017, entered an order severing3, 2021, the EPA announced a supplemental rulemaking to revise the Steam Electric Power Generating Effluent Limitations Guidelines and holding in abeyance the litigation related to the portionsStandards. As part of the 2015 rule concerning bottom ash transport water, FGD wastewater, and gasification wastewater (which is not applicable to TVA) pending further agency action. Thus, the litigation is indefinitely on hold as to the bottom ash transport water and FGD wastewater claims until the EPA’s further rulemaking has concluded. The litigation will continue as to the other claims.
On September 18, 2017,process, the EPA will determine whether more stringent limitations and standards are appropriate and consistent with the technology-forcing statutory scheme and the goals of the Clean Water Act. The impact of the proposed rulemaking cannot be fully determined at this time. Because this rulemaking could result in more stringent ELGs, the EPA has requested that the Appalachian Voices, et al. v. EPA litigation in the Fourth Circuit be held in abeyance.
Consistent with the 2020 rule, on January 8, 2021, TVA submitted requests to state regulatory authorities to modify NPDES permits for Kingston Fossil Plant ("Kingston"), Cumberland, Bull Run, Shawnee, and Gallatin Fossil Plant ("Gallatin") to incorporate into the permits limitations in the 2020 rule. The Kentucky Department for Environmental Protection released a final revised permit for Shawnee in the fourth quarter of 2021, and TVA anticipates the Tennessee Department of Environment and Conservation ("TDEC") will issue draft permits for Kingston, Cumberland, Bull Run, and Gallatin by December 2021.
Nationwide Permits for Dredge and Fill. On January 12, 2021, the USACE published notice of a final rule postponingthat reissued and modified Nationwide Permits (“NWPs”) that authorize discharges of dredge and fill material into waters of the U.S. The final rule limits applicability of NWP 12, which previously authorized discharges from all utility line activities, to oil and natural gas pipelines, creates new NWPs for certain compliance/applicability dates to provideutility line activities, including NWP 57 for electric utility line and telecommunication activities, and modifies certain pre-construction notification requirements. The new NWP 12 is being challenged in court on the EPA time to reviewsame grounds that were litigated in Northern Plains Resource Council v. U.S. Army Corps of Engineers, where the U.S. District Court for the District of Montana found the permit unlawful and revise, as necessary,vacated it. Although the new and stringent ELGs previously established for FGD wastewater and bottom ash transport water. The EPA pushed backlawsuit does not challenge NWP 57, the compliance dates for these two wastestreams from the 2018-2023 timeframe to 2020-2023. Other requirements and applicability dates of the rule for fly ash transport water, flue gas mercury control wastewater, and gasification wastewater remain in effect. As a result of these developments, it is not possible to predict the changes in the rule and TVA’s associated expenditures to attain compliance.
With regard to its Cumberland Fossil Plant ("Cumberland"), TVA contends the ELG rulemaking did not appropriately consider available data that could affect these national limits as they applied at Cumberland given its unique “once-through” scrubber design. TVA has been working with the State of Tennessee and the EPA in an effort to address this issue. Compliance with the rule at Cumberland without modification to address the unique design could cause TVA to incur disproportionately high costs at Cumberland or experience other operational outcomesNWP upon which TVA cannot predict at this time. The EPA’s reconsideration of the 2015 rule is most likely to rely for its utility line activities, the lawsuit raises claims that apply with equal force to NWP 57. However, the impact on TVA from this issue at Cumberland and could result in TVA’s request needing revision or being unnecessary.litigation cannot be evaluated fully until the legal challenge is resolved.
Other Clean Water Act Requirements. As is the case in other industrial sectors, TVA and other utilities are also facing more stringent requirements related to the protection of wetlands, reductions in storm water impacts from construction activities, new water quality criteria for nutrients and other pollutants, new wastewater analytical methods, and changes in regulation of pesticide discharges.application.
Recent Supreme Court Decision
On April 23, 2020, in County of Maui v. Hawaii Wildlife Fund, the Supreme Court held that the CWA requires a permit when there is a direct discharge of pollutants from a point source to waters of the U.S. and when there is "the functional equivalent" of a direct discharge to such waters. The Court suggested seven factors for determining when such a discharge is the functional equivalent of a direct discharge and acknowledged that the new test would be somewhat difficult to apply, potentially requiring evaluation of multiple factors. The Court noted that "time and distance" of pollutant migration often will be the most important factor but that other relevant factors may include, for example, the nature of the material through which the pollutant travels and the extent to which the pollutant is diluted or chemically changed as it travels. After evaluating the potential impact of the decision, TVA determined that this decision will not require TVA to change its operations.
Cleanup of Solid and Hazardous Wastes
Liability for releases and cleanup of hazardous substances is imposed under the federal Comprehensive Environmental Response, Compensation, and Liability Act ("CERCLA"), the RCRA, and other federal and parallel state statutes. In a manner similar to many other industries and power systems, TVA has generated or used hazardous substances over the years.
TVA Sites. TVA historical operations at some of itscertain facilities have resulted in contaminationreleases of contaminants that TVA is addressing, including at TVA's Environmental Research Center ("ERC") at Muscle Shoals, Alabama. TVA has completed several removal, remedial, and characterization actions at the site, as required by a permit issued by the Alabama Department of Environmental Management. At September 30, 2017, TVA’s2021, TVA's estimated liability for required cleanup and similar environmental
work for those sites for which sufficient information was available to develop a cost estimate iswas approximately $7$18 million and was included in Accounts payable and accrued liabilities and Other long-term liabilities on the consolidated balance sheet.Consolidated Balance Sheet. TVA must submit an application for renewal of the RCRA permit by September 27, 2022, and the renewal process may include additional mandates for further remedial activities. TVA has evaluated the potential impact that a permit renewal could have on its operations and does not believe that the renewal will have any adverse impacts at this time. In addition, the ERCEnvironmental Research Center has an active groundwater monitoring program as part of a Resource Conservation and Recovery Act ("RCRA") Corrective Action Permit.permitted corrective action plan.
Non-TVA Sites. TVA is aware of alleged hazardous-substance releases at certain non-TVA areas for which it may have some liability. See Note 2123 — Commitments and Contingencies — Environmental Matters.
Coal Combustion Residuals. The EPA published its final rule governing CCRs on April 17,CCR in 2015. The rule regulates CCRsCCR as nonhazardous waste under Subtitle D of the RCRA. While states may adopt the rule's requirements into their regulatory programs, the rule does not require states to adopt the requirements. AlthoughThe initial version of the rule became effective October 19, 2015, certain provisions have later effective dates. TVA’s review ofprovided for self-implementation by utilities and allows enforcement through citizen suits in federal court. The Water Infrastructure Improvements for the final rule indicates thatNation Act ("WIIN Act") subsequently allowed state or federal-based permitting to implement the rule offers adequate flexibility for compliance.CCR Rule as an alternative to self-implementation and citizen suits. See Item 7, Management's Discussion and Analysis of Financial Condition and Results of Operations —Key
Initiatives and Challenges— Generation Resources — Coal Combustion ResidualResiduals Facilities for a discussion of the impact on TVA’sTVA's operations, including the cost and timing estimates of related projects.
In July 2018, the EPA issued a final CCR rule which provided additional flexibility and an extension of certain deadlines. In March 2019, the D.C. Circuit granted the EPA's request to remand the final rule to allow the EPA to reconsider the amendments. The remand also allowed the EPA time to complete a new rulemaking to establish revised timelines for unlined impoundments to initiate closure and to reexamine the October 2020 deadline for closing some unlined impoundments. In August 2019, the EPA issued a proposed rule to amend portions of the CCR Rule regarding beneficial use, temporary piles, and public access to information.
On December 16, 2016, President Obama signedNovember 4, 2019, the Water Infrastructure Improvements forEPA announced a proposed rule that will revise portions of the Nation Act, whichCCR Rule requiring closure of unlined surface impoundments. The final Part A rule was published in the Federal Register on August 28, 2020, and became effective September 28, 2020. Among other things, the final Part A rule required all unlined CCR surface impoundments to stop receiving CCR and non-CCR wastestreams and to initiate closure or retrofit by no later than April 11, 2021, and TVA ceased doing so, and initiated closure, by the specified deadline. Additionally, the final rule provides a pathprocess for a utility to seek site-specific approval from the EPA to continue to use the unlined CCR regulation implementation through state or federal-based permitting as an alternativesurface impoundment until October 15, 2023, and possibly longer under certain circumstances. The final rule also includes requirements that enhance the public's access to self implementationgroundwater monitoring and enforcement through citizen suits in federal courts. Pending adoption of state permitting programs in states in TVA’s service area,corrective action reports. TVA does not currently anticipate the final rule will have a significant impact because TVA initiated closure of its unlined CCR surface impoundments by the regulatory deadline and already makes groundwater monitoring and corrective action reports publicly available. A separate final Part B rule was published in the Federal Register on November 12, 2020. This rule provides an alternative liner demonstration procedure for utilities with clay lined units which are being forced to close under the Part A rule. However, TVA does not have any impact on the design or implementation timeframeunits which qualify for TVA’s ongoing CCR activities at this time.demonstration.
In August 2015, the Tennessee Department of Environment and Conservation ("TDEC")TDEC issued an order that (1) allowedestablished a process for TDEC to oversee TVA’sTVA's implementation of the EPA’sEPA's CCR rule and to ensure coordination and compliance with Tennessee laws and regulations that govern the management of CCR and (2) required TVA to investigate and assess CCR contamination risks at seven of TVA’sTVA's eight coal-fired plants in Tennessee and to remediate any unacceptable risks. The TDEC order does not allege that TVA is violating any CCR regulatory requirements nor does it assess TVA penalties. The TDEC order sets out an iterative process through which TVA and TDEC will identify and evaluate any CCR contamination risks and, if necessary, respond to such risks.
On August 4, 2017,TVA submitted to TDEC an environmental assessment report (“EAR”) for Allen in the U.S. District Courtfourth quarter of 2021. TVA is currently conducting environmental investigations for the Middle District of Tennessee ordered TVAremaining six sites in accordance with the TDEC-approved Environmental Investigation Plans and will submit EARs to excavate the CCR materials from its CCR facilities at Gallatin and move them to a lined facility. See Note 8 — Background — Lawsuit Brought by TDEC and Lawsuit Brought by TSRA andTCWN and Note 21 — Legal Proceedings — Cases Involving Gallatin Fossil Plant CCR Facilities.
In May 2017, industry petitioners asked the EPA to reconsider the CCR rule and to incorporate new flexibility provided by the WIIN Act – specifically authority to make site-specific, risk-based decisions on implementing the federal criteria and to postpone upcoming regulatory deadlines during the new rulemaking. The EPA had previously agreed through settlement to revisit several elementsupon completion of the CCR rule, so it will already be re-opening the rule. On September 14, 2017, the EPA announced that it plans to address the request to revisit key parts of its 2015 CCR rule. In addition, on September 18, 2017, the EPA filed a motion to hold the CCR litigation in abeyance and to postpone oral argument in the case while it reconsiders the CCR rule. The D.C. Circuit denied the EPA's motion and has rescheduled oral argument on litigation over the 2015 rule for November 20, 2017. In addition, the EPA has been directed to file by November 15, 2017, a status report specifying which provisions of the CCR rule are, or are likely to be, subject to reconsideration and specifying a rulemaking timeline. As a result of these developments, it is not possible to predict changes to the CCR rule and potential impacts on TVA.relatedinvestigations.
Groundwater Contamination. Environmental groups and state regulatory agencies are increasing their attention on alleged groundwater contamination associated with CCR management activities. Seven of TVA’s coal-fired plants are in some level of state regulatory groundwater assessment. Four of those plants (Colbert, Gallatin, Cumberland, and Shawnee) have investigations beyond monitoring and reporting. Five of those (Gallatin, Shawnee, Paradise, Johnsonville, and Widows Creek) have groundwater remediation monitoring with state regulatory involvement. As a result, of these assessments and increased attention, TVA may have to change how it manages CCRsCCR at some of its plants, potentially resulting in higher costs. See Item 7, Management’sManagement's Discussion and Analysis of Financial Condition and Results of Operations — Key Initiatives and Challenges — Generation Resources — Coal Combustion ResidualResiduals Facilities Note 8and — Background — Lawsuit Brought by TDEC and Lawsuit Brought by TSRA andTCWNAllen Groundwater Investigation and Note 2113 — Legal Proceedings — Cases Involving Gallatin Fossil Plant CCR Facilities.Asset Retirement Obligations.
Environmental Investments
From the 1970s1970 to 2017,2021, TVA spent approximately $6.7$6.8 billion on controls to reduce emissions from its coal-fired power plants. In addition, TVA has reduced emissions by idling or retiring coal-fired units and relying more on cleaner energy resources including natural gas and nuclear generation.
TVA currently anticipates spending significant amounts on environmental projects in the future, including investments in new clean energy generation including renewables to reduce TVA's overall environmental footprint. TVA environmental project expenditures also result from coal-fired plant decommissioning and from effective ash management modernization. Based on TVA's decisions regarding certain coal-fired units, the amount and timing of expenditures could change. See Power Supplyand Load Management Resources — Coal-Fired above and Estimated Required Environmental Expenditures below.
SO2Emissions and NOx Emissions. To reduce SO2 emissions, TVA operates scrubbers on 1718 of its coal-fired units, with scrubbers currently under construction on two additional units and switched to lower-sulfur coal at 20certain coal-fired units. To reduce NOx emissions, TVA operates SCRs on 18 coal-fired units, with SCRs currently under construction on four additional units, operates selective non-catalytic reduction systems on four units, operates low-NOx burners or low-NOx combustion systems on 19 units, operates over-fire air on six cyclone21 units, optimized combustion on sixall 25 units, and operates NOx control equipment year round when units are operating (except during start-up, shutdown, and maintenance periods). TVA has also retired or announced plans to retire 3334 of 59 coal-fired units. Except for seven units at Shawnee, the remaining coal-fired units will eitherin the TVA fleet have scrubbers and SCRs or be retired.SCRs. See Power Supply and Load Management Resources — Coal-Firedabove. above.
Particulate Emissions. To reduce particulate emissions of air pollutants, TVA has equipped all of its coal-fired units with scrubbers, mechanical collectors, electrostatic precipitators, and/or bag houses.
Greenhouse Gas Emissions. The EPA may issue regulations establishing more stringent air, water, and waste requirements, and these requirements could result in significant changes in the structure of the U.S. power industry, especially in the eastern half of the country. There could be additional material costs if further reductions of GHGs, including CO2, are mandated by legislative, executive, regulatory, or judicial actions and if more stringent emission reduction requirements for conventional pollutants are established. These costs cannot reasonably be predicted at this time because of the uncertainty of these actions. A number of emerging EPA regulations establishing more stringent air, water, and waste requirements could result in significant changes in the structure of the U.S. power industry, especially in the eastern half of the country.
TVA currently anticipates spending significant amounts on environmental projects through 2025, including investments in new clean energy generation including natural gas, nuclear, and renewables to reduce TVA's overall environmental footprint. TVA environmental project expenditures also result from coal-fired plant decommissioning and from effective ash management modernization. Based on TVA's decisions regarding certain coal-fired units under the Environmental Agreements, the amount and timing of expenditures could change. See Power Supplyand Load Management Resources — Coal-Fired above and Estimated Required Environmental Expenditures below.
Estimated Required Environmental Expenditures
The following table contains information about TVA’sTVA's current estimates on projects related to environmental laws and regulations.
|
| | | | | |
Air, Water, and Waste Quality Estimated Potential Environmental Expenditures(1) At September 30, 2017 (in millions) |
| | Estimated Timetable | | Total Estimated Expenditures |
Coal combustion residual conversion program(2) | 2018-2022 | | $ | 1,100 |
|
Proposed clean air control projects(3) | 2018-2022 | | 200 |
|
Clean Water Act requirements(4) | 2018-2026 | | 500 |
|
| | | | | | | | | | | | | | | | | | | | | | | |
Estimated Potential Environmental Expenditures(1)(2) For the years ended September 30, 2021 (in millions) |
| | 2022 | | 2023 | | Thereafter(3)(4) | | Total |
Coal Combustion Residual Program(5) | $ | 232 | | | $ | 189 | | | $ | 368 | | | $ | 789 | |
Clean Air Act control projects(6) | 31 | | | 38 | | | 90 | | | 159 | |
Clean Water Act requirements(7) | 77 | | | 64 | | | 7 | | | 148 | |
Notes
(1) These estimates are subject to change as additional information becomes available and as laws or regulations change.
(2) These estimates include $134 million, $75 million, and $52 million for 2022, 2023, and thereafter, respectively, in capital expenditures.
(3) See Note 23 — Commitments and Contingencies.
(4) These estimates include expenditures expected to be incurred during 2024, 2025, and 2026.
(5) Includes costs associated with pond closures, conversionthe closure of wet to dry handling,facilities and landfill activities. TVA is continuing to evaluate the rules and their impact on its operations, including the cost and timing estimates of related projects. Includes approximately $140 million for Gallatin projects that are part of the original activities scheduled in TVA’s CCR Conversion Program and excludes costs resulting from any new requirements related to the Gallatin lawsuits.projects. See Item 7 Management's Discussion and Analysis of Financial Condition and Results of Operations — Key Initiatives and Challenges — Generation Resources — Coal Combustion Residual FacilitiesResiduals Facilities and Note 8.13 — Asset Retirement Obligations.
(3)(6) Includes air quality projects that TVA is currently planning to undertakeperforming to comply with existing and proposed air quality regulations, but does not include any
projects that may be required to comply with potential GHG regulations or transmission upgrades.
(4) (7) Includes projects that TVA is currently planning to comply with revised rules under the Clean Water Act (i.e., Section 316(b)regarding CWIS and effluent limitation guidelinesELGs for
steam electric power plants).plants.
EmployeesHuman Capital Management
On September 30, 2017, TVA had 10,092People Strategy and TVA's Values
As 2021 remained a challenge due to the continuation of the COVID-19 pandemic, the employees of whom 3,580 were tradesTVA kept its mission in focus and labor employees. Neithercontinued to create a culture that lives up to its values - Safety, Integrity, Inclusion, and Service. TVA employees collectively came together to address business needs and enable strong performance while serving the federal10 million people of the Tennessee Valley.
As part of its People Advantage strategic priority, TVA strives to create a work environment that supports and responds to the changing needs of the workforce. People Advantage is one of TVA's five strategic priorities and a multi-year commitment to evolve TVA's culture. The recent and on-going effects of the pandemic have brought the importance of employee health, well-being and retention into sharp focus. This importance centers around TVA's valuable human capital and putting its people first. The focus on People Advantage, along with the other four strategic priorities of Operational Excellence, Financial Strength, Powerful Partnerships, and Igniting Innovation, allows TVA to fulfill its daily mission of service to the people of the Tennessee Valley.
The three initiatives in People Advantage that influence the desired TVA culture impact to the communities that TVA serves are (1) Inclusion with Diversity ("IwD"), (2) Talent, and (3) Engagement. To help shape an inclusive work environment that values all voices, TVA has intensified its efforts over the past few years to integrate diversity and inclusion into its culture and make its efforts and progress sustainable and a part of TVA's daily operations. Similarly, TVA has promoted a people-focused organization that amplifies and harnesses the energy, power, and creativity of an experienced and talented workforce - one that continues to bring about the best from its people - manifesting itself as a "destination for difference makers" for highly-skilled candidates. TVA is working to cultivate a positive employee experience to heighten workforce engagement. This work is
focused on equipping leaders to champion engagement across the enterprise through the understanding and leveraging of employee surveys, workplace flexibility opportunities, and health, safety, and well-being programs.
Ethics
Ethics and integrity are highly valued at TVA. Since its establishment in 1933, a commitment to ethics has been a part of TVA's DNA. In 2021, TVA partnered with a third-party administrator to execute a survey that measured employees' perceptions of TVA's ethical culture. TVA is committed to leveraging the results from the survey to further strengthen TVA's strong ethical culture. TVA's Ethics & Compliance office aims to help employees make the right decisions for the right reasons and offers guidance when the right decisions may not be clear. The office is focused on educating and creating awareness while also assisting employees with ethical decision-making inside and outside of the TVA workplace. Further, TVA requires all employees and contractors to take its annual ethics training and attest to its Code of Conduct, which sets forth standards for adhering to TVA's core values and conducting its affairs with openness, honesty, and integrity every day.
TVA Board Governance and Oversight
The TVA Board’s People and Governance Committee assists the TVA Board in fulfilling its responsibilities under the TVA Act by overseeing policies and strategies that affect a wide array of people-related programs inclusive of leadership development, culture, engagement, labor relations, laws covering most private sector employers nor those covering most federal agencies apply to TVA. However,safety, communications, compensation, performance incentives, benefits, and well-being. Specifically, the Committee advises the TVA Board in areas of overall Board governance, CEO goals, performance, compensation, and succession planning. Emergent people issues are discussed by this Committee, or in TVA Board briefings, as appropriate.The TVA Board's Audit, Finance, Risk, and Cybersecurity Committee oversees TVA's compliance and ethics programs.
Inclusion with Diversity
In 2020, the company added Inclusion as one of its core values and adopted IwD as an enterprise-wide transformational strategic element. Since then, IwD has become increasingly integrated into TVA’s daily operations. To accelerate the impact of IwD within TVA and the communities it serves, TVA is working to recognize and sustain diversity as an imperative, leveraging the public power model to advance inclusion with diversity in TVA communities.
In 2021, TVA's initiatives and accomplishments in promoting diversity and inclusion included the following:
•Established an IwD Council, comprised of senior leadership from all six strategic business units with accountability directly to TVA’s CEO and his direct reports; the council advises, champions, and oversees all IwD strategies and actions across the enterprise;
•Established a Supplier Diversity Stakeholder Advisory Council and Supplier Mentoring Program;
•Established the reinforcement of IwD by the TVA Board as an enterprise priority and goal for TVA’s CEO, which is reflected in his individual performance assessment under the annual incentive compensation program; see Item 11, Executive Compensation — Compensation Discussion and Analysis — 2021 Performance Goals and Performance Achievement — Executive Annual Incentive Plan — Individual Performance Multiplier Reinforces Pay for Performance for additional information;
•Refreshed courses to ensure that existing learning and development programs have the right level of content and emphasis on inclusion with diversity and expanded accessibility to courses through partnership with an online platform;
•Maintained an inclusion score, which measures sense of belonging, above market median at 74%; and
•Created new virtual programs for safe and open conversations about diversity and inclusion.
TVA is also advancing IwD in the communities it serves.For example, TVA is enhancing its economic development program support for women-, minority- and veteran-owned businesses.
Employee Resource Groups. TVA is powered by its people and strengthened by its diversity.TVA supports nineEmployee Resource Groups ("ERGs") to help strengthen an inclusive culture and make life better for the people it serves:
•ABLED Events — allows TVA employees to bring unique perspectives and gifts together as a united team to celebrate commonalities and differences through “Awareness Benefitting Leaders & Employees about disAbilities” in the workplace.
•ACTion — celebrates and honors the many Asian cultures represented within TVA, from Japan to India, and to the Philippines and beyond. It regularly highlights social events and supports career-enriching workshops.
•African American Voices — provides an avenue for African American and others interested in fellowship and smart career connections within TVA. It promotes mentoring and development opportunities, as well as group workshop events on such topics as personal branding, personal finance, and networking and negotiation skills.
•IGNITE — provides TVA’s workforce with an opportunity to engage with others on various topics of interest about products, services, processes, and solutions provided by TVA; and in doing so, provides a more diverse and creative knowledge base for TVA and its employees.
•New Employee Network — makes life easier for new employees entering a large company. It provides organizational information and cross-functional connections not only on the front-end to new employees but throughout an employee’s tenure at the company.
•Spectrum — highlights the open, accepting, and safe work environment TVA provides for all employees and focuses increasing visibility on educational and social opportunities on LGBTQ+ issues by offering employees a variety of community and professional networking opportunities within the Tennessee Valley.
•TVA & Amigos — provides an avenue for TVA's Hispanic employees and those interested in Latin culture to be involved in professional, educational, and service-oriented events.
•TVA Veterans Association — allows employees unique camaraderie opportunities as they support a wide array of local and national ceremonies and events and is one of the oldest and most active resource groups at TVA, with all branches of the military represented.
•Women Empowered (WE) — supports women at all stages of their careers and advocates for the equal rights of all female employees across TVA. This extends externally as TVA supports inclusion, networking, and developmental opportunities for girls and young women in local communities.
Together, TVA and its employees collectively champion personal and professional growth through a network of professional, social, and volunteer opportunities made available by each ERG and TVA’s diverse mix of employees.
Talent
To bring out the best from its people, TVA utilizes a set of business functions that operate together to address the enterprise’s workforce needs around human capital talent selection, organization, development, engagement, and performance.
Attracting and Retaining Talent. TVA is enriched by the diversity of a talented, highly skilled workforce made up of people from all backgrounds. To achieve this, TVA endeavors to ensure that all qualified candidates receive fair consideration for open jobs at TVA and that all employees are encouraged, engaged, and empowered to contribute their talents and time while bringing their authentic selves to work each day. Recruiting efforts also support the strategic element of IwD to build a culture that lives up to TVA's values, as TVA actively recruits employees of all races, colors, sexual orientations, ethnicities, gender identities, abilities, religions, and ages. TVA continues to improve employment opportunities for underrepresented populations within TVA’s workforce, to partner with colleges and universities for internships and recent graduates, and to maintain its status as a top industry employer for military veterans.
While public reports have shown that employees in all sectors of the United States economy have been voluntarily leaving the workforce as a result of the COVID-19 pandemic at an historically high rate, TVA’s voluntary attrition rate has remained stable, and an area that TVA continues to monitor while also listening to workforce needs.TVA believes this is largely attributable to its People Advantage focus, which includes competitive compensation and comprehensive benefits programs, inclusion and well-being programs, flexible workplace practices, and an environment that promotes retention of its complex and valuable workforce.
Competitive Total Rewards. TVA’s total rewards package is a significant factor in attracting and retaining top talent. TVA’s competitive benefits portfolio supports the values and needs of its employees. TVA provides market-based and competitive compensation which includes an annual incentive plan that is designed to reward accomplishments against established business and individual goals within a given year. All eligible employees participate in TVA's annual incentive plan, including TVA's represented employee population.
Additionally, in support of its cultural commitment to IwD, TVA periodically reviews compensation practices to promote fairness and equity. TVA has engaged third party vendors to conduct independent pay equity analysis and continues to monitor its pay practices and to provide its leaders with tools to assist in making equitable pay decisions.
To support and care for the well-being of employees and their families, examples of comprehensive and competitive benefits TVA currently offers include:
| | | | | | | | |
•medical, vision, dental, life, accident, and disability insurance | •paid time-off
•leave donation | •health savings accounts
•flexible spending accounts |
•tuition reimbursement | •401(k) retirement | •dependent scholarships |
•flexible work schedules | •wellness incentives | •employee assistance programs |
Development and Training. As TVA continues to adapt to the evolving demands of the industry, it is imperative that it cultivate a work environment that motivates people to do their best work by aligning employee development, skills, and capabilities with what TVA needs to succeed now and in the future. TVA provides multiple training and development opportunities at all employee levels. Those opportunities include:
| | | | | | | | |
•individual learning-ability | •team learning | •mentoring |
•career pathing, including rotational development | •professional, technical, and leadership career pathways | •over 5,000 on-line learning courses |
TVA also invests in the development of its employees through tuition reimbursement for academic programs aligned with TVA’s business and workforce development needs. In 2021, employees and contractors engaged in over 915,000 hours of training.
Leadership and Development and Succession Planning. TVA encourages personal and professional development and has strategic leadership development programs designed to prepare employees to step into leadership positions, accepting the additional responsibilities, expectations, and challenges faced by each level of leadership. TVA also has advanced leadership programs designed to further prepare leaders for executive level positions, which require an extensive interview and assessment process for selection. Through TVA’s talent review and succession planning program, 97% of director and executive level roles have at least one succession candidate identified.
Continuous focus on and support of leadership development is maintained through means such as talent discussions at least annually at every level of the organization, which includes attention to developing a diverse leadership pipeline. TVA has established goals for female and people of color representation in leadership and plans to update these goals to continuously improve this representation.
Engagement
TVA's work in this key area is focused on equipping leaders to champion engagement across the enterprise, leveraging and understanding the employee voice to make informed decisions that drive engagement, and enhancing policies and resources that support holistic employee well-being and promote engagement. Strong engagement levels impact all of TVA’s strategic priorities.
Employee Engagement Survey. TVA’s Employee Engagement Survey is a key tool for understanding and leveraging the employee voice. The survey is administered a minimum of twice annually to all employees and measures overall engagement and drivers of engagement. The survey results provide real-time insights and analytics and are compared to a normative database comprised of other relative external benchmarks to identify strengths and opportunities for improvement. Results from the surveys are shared with employees and used by TVA leadership and business units to improve and monitor progress against People Advantage objectives. Two scores are used as key People Advantage metrics: Engagement, which measures the sense of commitment and involvement, and Inclusion, which measures the sense of belonging at work. In 2021, TVA’s engagement score of 82% places it at top decile among over 750 companies from various industries.
Workplace Flexibility. As part of its People Advantage strategic priority, TVA strives to create a work environment that is welcoming, supportive, and responsive to the changing needs of the workforce. Recognizing the changing work environment, largely fostered by the COVID-19 pandemic, and responding to employee appreciation of flexibility in work location in 2021, TVA established a workplace flexibility initiative called “Reimagining How We Work.” The objective of the initiative is to promote workplace flexibility guided by safety, performance, inclusion, and engagement. Instead of returning to what was, TVA is embracing a more flexible future that puts people at the center of all it does to maximize its performance and mission.
Safety, Employee Health, and Well-being. Safety is one of TVA’s core values. TVA's safety program is based on the fundamentals of a safety management system, which includes management commitment, employee engagement, hazard recognition and control, worksite analysis, contractor safety management, training, review, and continuous improvement. Employee engagement is critical to the success of the program. TVA's vital safety behaviors are employee-driven and developed with the collaboration of represented employees, union leadership, and management. As a federal agency, TVA is also required to complete regulatory compliance inspections of its facilities on an annual basis.
The COVID-19 pandemic has brought the importance of employee health, well-being, and retention into sharp focus. TVA has provided support for its employees throughout the pandemic to ensure the retention of valuable talent and to enhance well-being. This support includes establishing a mental health advocacy program, providing unlimited Employee Assistance Program sessions, enhancing paid leave, and providing tutoring resources, onsite vaccination clinics, and wellness incentives for vaccinations. In 2020, TVA established an Employee Relief Fund to support employees adversely affected by the COVID-19 pandemic and natural disasters and has continued those distributions in 2021 to assist employees.
TVA’s safety accomplishments in 2021 include:
•Consistent decline in recordable injuries and illnesses; and
•Industry top decile performance in recordable injury rate and top quartile performance in serious injury rate in 2021.
Partnerships with Unions. TVA has a long-standing policy of acknowledging and dealingworking with recognized representatives of its employees, and that policy is reflected in long-term agreements to recognize the unions (or their successors) that represent TVA employees. Federal law prohibitsTVA’s labor construct is complex and unique – different from private utility peers and with union influence that has the ability to reach national levels – primarily governed by the TVA Act. Neither the federal labor relations laws covering most private sector employers, nor those covering most federal agencies, apply to TVA.
TVA’s labor strategy is critical to the achievement of its strategic priorities as it prepares the workforce for the future. Its employees and contractors are represented by seven collective bargaining agreements and a total of 17 labor unions. This reflects 60% of TVA’s workforce, or approximately 6,000 employees. TVA’s partnerships with these unions go back more than 80 years and form the backbone of TVA and its ability to serve the people of the Tennessee Valley.
Recent accomplishments to strengthen the relationship between TVA and its labor unions include:
•Continued low-cost, reliable energy to residents across the Tennessee Valley:
–TVA and the Trades and Labor Council for Annual Employees announced a 10-year extension on their agreement in 2020.
–TVA and the North America’s Building Trades Unions announced a 10-year extension of their Project Labor Agreement in 2021, which provides stability for staffing of construction and maintenance projects throughout the Tennessee Valley and strengthens the relationship.
•Adoption of the Code of Excellence ("COE") — a union led partnership to promote the highest quality of work, best work practices, and the development of a highly skilled workforce – to drive business outcomes by applying the SPARQ principles of Safety, Professionalism, Accountability, Relationships, and Quality, including:
–During a year of unprecedented challenges, TVA set the industry benchmark for pandemic response and delivered strong operational excellence with one of the safest and most productive years on record, and TVA attributes this success in part to its strong union partnerships.
–Union-led labor management panel has partnered to reduce grievances (the number of grievances filed during 2017 was more than four times that of the grievances filed during 2021).
Awards
Awards and other recognition help TVA understand its strengths, identify opportunities for improvement, bolster employee pride, and better attract and retain diverse talent. Recognition in 2021 included:
| | | | | |
•Forbes America's Best Large Employers 2021 - #2 in Utilities industry •Forbes Best Employers by State 2021 - Top 5 in Tennessee for third consecutive year •2021 Diversity Impact AwardsTM Top 10 Diversity Action Award | •Ranked in Top 100 - 2021 America's Most Loved Workplaces® (Newsweek in partnership with Best Practice Institute) •2021 Military Friendly® Employer Top 10 •Best in Class 401(k) Plan •One of the largest U.S. Contributor to Helmets to Hardhats Program |
Key Metrics
TVA actively monitors internal metrics to remain aware of human capital trends and to ensure that it is making measurable progress on its People Advantage objectives. Through monitoring sources such as data and performance
dashboards, one-on-one engagements between leaders and employees, and engagement surveys, TVA obtains information that helps it understand its performance and make adjustments, if needed.
Key measures of success in TVA’s People Advantage strategic priority are set forth below:
| | | | | | | | | | | | | | | | | | | | | | |
| | Goal | | | | Actual |
| Performance Measure | | 2022 | | | | 2021 | | 2020 |
People of color representation in leadership (%) (1) | | 10.0 | % | | | | 9.6 | % | | 9.0 | % |
Female representation in leadership (%) (1) | | 20.0 | % | | | | 18.0 | % | | 18.0 | % |
Diverse external hires (%) (2) | | 33.0 | % | | | | 39.4 | % | | 34.8 | % |
Regrettable losses (%) (3) | | N/A | | | | 1.6 | % | | 1.0 | % |
Voluntary attrition (%) (3) | | 1.5 | % | | | | 1.5 | % | | 1.9 | % |
Engagement (100 point scale) (4) | | 82 | | | | 82 | | 80 |
Inclusion (100 point scale) (5) | | 76 | | | | 74 | | 72 |
Recordable injuries (#) (6) | | 0 | | | | 29 | | 39 |
Notes
(1) Defined as first line supervisors and above.
(2) Defined as external hires who are female, persons of color, and persons with disabilities.
(3) Regrettable Loss is generally defined as voluntary terminations by employees with acceptable performance ratings. For 2022, this measure will be replaced by Voluntary Attrition, which is a more inclusive measure and accounts for all employees who leave the business voluntarily during a fiscal year.
(4) Based on score from engaging in strikes againstEmployee Engagement Survey defined as degree to which employees invest their cognitive, emotional, and behavioral energies toward positive organizational outcomes.
(5) Based on score from Employee Engagement Survey defined as the degree to which employees sense they belong at work.
(6) Defined as the number of recordable injuries and illnesses per 100 full-time employees per year.
Workforce Demographics
| | | | | | | | | | | | | | |
| Employee Demographics | | 2021 | | 2020 |
| Number of employees on September 30 | | 10,192 | | 9,989 |
| Represented by collective bargaining unit | | 60% Represented, or approximately 6,000 employees | | 60% Represented, or approximately 6,000 employees |
| Trades and labor employees | | 3,261 | | 3,287 |
| Average tenure (years) | | 13 | | 13 |
| Average age | | 44.1 | | 45.2 |
| | | | |
| | | | |
| | | | |
| | | | |
In addition to the employees above, TVA also had approximately 15,500 and 13,800 contractors on September 30, 2021 and 2020, respectively, providing both intermittent or full-time services. The majority of these contractors are managed by TVA suppliers that are providing services to TVA.
| | | | | | | | | | | | | | | | | | | | | | | | | | | | | | | | | | | | | | | | | |
| | All Employees | | Leadership | | New Hires | |
| | 2021 | | 2020 | | 2021 | | 2020 | | 2021 | | 2020 | |
| Female | | 2,076 | | 2,006 | | 270 | | 254 | | 211 | | 156 | |
| People of Color | | 1,146 | | 1,098 | | 143 | | 133 | | 122 | | 83 | |
| Military, Veteran | | 1,822 | | 1,804 | | 318 | | 322 | | 107 | | 78 | |
ITEM 1A. RISK FACTORS
The risk factors described below, as well as the other information included in this Annual Report on Form 10-K for the fiscal year ended September 30, 2021 (the "Annual Report"), should be carefully considered. Risks and uncertainties described in these risk factors could cause future results to differ materially from historical results as well as from the results anticipated in forward-looking statements. Although the risk factors described below are the ones that TVA considers significant,material, additional risk factors that are not presently known to TVA or that TVA presently does not consider significantmaterial may also impact TVA's business operations. See See Forward Looking Information above for a description of some matters that could affect the below risks or generate new risks. Although the TVA Board has the authority to set TVA's own rates and may mitigate some risks by increasing rates, there may be instances in which TVA would be unable to partially or completely eliminate one or more of these risks through rate increases over a reasonable period of time or at all. Accordingly, theThe occurrence of any of the following could have a material adverse effect on TVA's cash flows, results of operations, andor financial condition.
For ease of reference, the risk factors are presented in fournine categories: (1) COVID-19 related risks; (2) cybersecurity risks; (3) regulatory, legislative, and legal risks; (4) operational risks; (5) risks (2) operational risks, (3)related to the environment and catastrophic events; (6) financial, economic, and market risks,risks; (7) human capital and (4)management risks; (8) accounting and financial reporting risks; and (9) general business risks.
COVID-19 RELATED RISKS
The COVID-19 pandemic has adversely affected, and may continue to adversely affect, TVA's business, financial condition, and results of operations.
The COVID-19 pandemic has adversely affected, and may continue to adversely affect, TVA's business, financial condition, and results of operations. To date, the COVID-19 pandemic has resulted in reduced revenues primarily due to economic conditions surrounding COVID-19, including customers curtailing operations to reduce the spread of the outbreak as a result of quarantines, closures, or reduced operations of businesses or other institutions, among other things. TVA's revenues also decreased due to the deferral of revenues under programs offered by TVA to its LPCs to offset the impact of customers' inability to pay during the outbreak. TVA estimates base revenues were reduced by approximately $185 million for the year ended September 30, 2020. Based on current internal models, TVA estimates that the COVID-19 pandemic had little impact on TVA's sales volume for the year ended September 30, 2021. At this time, TVA does not anticipate sales volume will be materially impacted due to the COVID-19 pandemic beyond 2021. See Item 7, Management's Discussion and Analysis of Financial Condition and Results of Operations — Results of Operations — Financial Results — Operating Revenues.
TVA could be further adversely affected by the impact of the COVID-19 pandemic on the economy and financial markets, including differences in the recovery of specific economic sectors or regions of the Tennessee Valley and continued volatility in interest rates, commodity prices, investment performance, and foreign currency exchange rates. An extended slowdown in the recovery of the United States’ economic growth, changes in the demand for commodities, or material changes in governmental policy could result in lower economic growth and lower demand for electricity in TVA’s key markets. In addition, contractual counterparties could be impaired in their ability to perform their obligations to TVA, which could result in more costly operation of TVA’s facilities. TVA has experienced fluctuations related to its pension plan assets and other investment portfolios during the years ended September 30, 2020 and 2021. The ultimate impact of the COVID-19 pandemic on the pension plan and other investments depends on factors beyond TVA's knowledge or control. A long-term recession could impact access to capital and have other long-term negative effects on TVA's business or results of operations.
In addition, TVA's results of operations could be impacted by, among other things, personnel who leave or forego employment to avoid vaccination requirements; social distancing to prevent illness from spreading within the workforce; remote work arrangements; travel restrictions; the availability of the workforce to perform essential functions; and the unavailability of fuel or critical parts, supplies, or services due to transportation restrictions or the shutdown, slowdown, or inability to meet contractual requirements of suppliers or other vendors in TVA's supply chain. In addition, the continued spread of the COVID-19 pandemic could adversely impact TVA's ability to develop, construct, and operate facilities; could delay or prevent the completion of projects; or could lead to impairments of TVA’s long-lived assets and accounts or loans receivable. Examples of potential impacts include delivery of force majeure notices from contractual counterparties, closure or reduced operation of global ports, or limitations on shipping key equipment as anticipated or at budgeted costs. These impacts could cause delays in construction projects or the performance of necessary maintenance to TVA’s generation or transmission facilities, which could impact the availability of TVA’s facilities for their intended operations.
To address specific aspects of the COVID-19 pandemic, TVA has implemented a company-wide pandemic plan, including limiting non-essential travel and mandatory telework for those who do not have to be physically present at a TVA facility or office building; implementing strong physical and cyber-security measures; actively monitoring generation, transmission, and distribution functions; and maintaining an increased cash reserve. However, it is possible that these measures will not be successful in mitigating the impacts of the pandemic. At this time, operations and delivery of energy to customers have not been materially impacted, but there is no guarantee that there will not be a material impact in the future.
The extent to which the COVID-19 pandemic will impact TVA's business, financial condition, cash flows, and results of operations is uncertain and will depend on numerous evolving factors beyond TVA's control including, among other things, the duration and severity of the pandemic, actions taken to contain its spread and mitigate its effects, including vaccination programs, and the broader impact of the COVID-19 pandemic on the country, the region's economy, and global trade. However, TVA reasonably anticipates that any of a prolonged outbreak, impacts of variants of COVID-19, and resulting commercial or social restrictions could have a material adverse impact on its business, financial condition, and results of operations, and could require TVA to change how it conducts certain operations, takes power under certain agreements, or dispatches its own facilities.
See Item 7, Management's Discussion and Analysis of Financial Condition and Results of Operations — Key Initiatives
and Challenges — COVID-19 Pandemic for an expanded discussion of the impact to TVA and related initiatives.
CYBERSECURITY RISKS
TVA’s facilities and information infrastructure may not operate as planned due to cyber threats to TVA’s assets
and operations.
TVA’s operations are heavily computerized and include assets such as information technology and networking systems.
As with all industries, the reliance on computerization and networking makes TVA a target for cyber attacks, and the risk
of such attacks may increase as individual devices and equipment become accessible via the internet. TVA has been
targeted by cyber attacks in the past and anticipates that it will be targeted in the future. These attacks may have been
carried out, or in the future could be carried out, by individuals, groups, or nation states. Although TVA has extensive
cyber safeguards and works with industry specialists and relevant governmental authorities to deter, stop, or mitigate
cyber attacks, it is possible that these measures might not prevent all attacks. Furthermore, there may be more attacks
in the future as technology becomes more prevalent in energy infrastructure. Cyber attacks could include viruses,
malicious or destructive code, phishing attacks, denial of service attacks, ransomware and other ransom-based attacks,
improper access by third parties, attacks on email systems, and ransom demands to not expose sensitive data,
gain operational control, or expose security vulnerabilities specific to TVA’s facilities, among various other security
breaches. In such a case, a cyber attack could compromise sensitive data; significantly disrupt operations; require
additional expenditures for cybersecurity; negatively affect TVA’s cash flows, results of operations, financial condition,
and reputation; and pose health and safety risks. Additionally, the theft, damage, or improper disclosure of sensitive
data may subject TVA to penalties and claims from third parties.
Cyber attacks on third parties could interfere with or harm TVA.
TVA relies on third parties for various services, including transferring funds to non-TVA entities and delivering
TVA’s products in the ordinary course of business. As with TVA, these third parties are heavily computerized and use
assets such as information technology and networking systems. If these third parties undergo cyber attacks, which
have occurred and may continue to occur, the services they provide TVA could be disrupted. This disruption could
interfere with TVA’s ability to perform its obligations to others, transfer funds, obtain fuel or critical parts, supplies, or
services, or make payments, which in turn could negatively affect TVA’s financial condition and reputation. Additionally,
the theft, damage, or improper disclosure of sensitive data held by these third parties may subject TVA to further harm.
See Item 7, Management's Discussion and Analysis of Financial Condition and Results of Operations — Key Initiativesand Challenges — Safeguarding Assets — Cybersecurity for a discussion of recent cyber attacks on third parties.
REGULATORY, LEGISLATIVE, AND LEGAL RISKS
New laws, regulations, or administrative orders, or congressional action or inaction, may negatively affect TVA's cash flows, results of operations, and financial condition, as well as the way TVA conducts its business.
Because TVA is a corporate agency and instrumentality established by federal law, it may be affected by a variety of laws, regulations, and administrative orders that do not affect other electric utilities. For example, Congress may enact legislation that expands or reduces TVA's activities, changes its governance structure, requires TVA to sell some or all of the assets that it operates, reduces or eliminates the United States' ownership of TVA, or even liquidates TVA. Additionally, Congress could act, or fail to take action, on various issues that may result in impacts to TVA, including but not limited to action or inaction related to the national debt ceiling or automatic spending cuts in government programs.
Although it is difficult to predict exactly how new laws, regulations, or administrative orders or congressional action or inaction may impact TVA, some of the possible effects are described below.
TVA may become subject to additional environmental regulation.
New environmental laws, regulations, or orders may become applicable to TVA or the facilities it operates, and existing environmental laws or regulations may be revised or reinterpreted in a way that adversely affects TVA. Possible areas of future laws or regulations include, but are not limited to, greenhouse gases, coal combustion residuals, water quality, renewable energy portfolio standards, and natural gas production and transmission.
TVA's ability to control or allocate funds could be restricted.
Other federal entities may attempt to restrict TVA's ability to access or control its funds that are on deposit in TVA’s account in the U.S. Treasury. For example, should the U.S. Treasury approach its debt ceiling, the U.S. Treasury might, as part of an effort to control cash disbursements, attempt to require TVA to receive approval before disbursement of funds from TVA’s U.S. Treasury account. Additionally, the OMB might, in the event that automatic spending cuts go into effect, attempt to require TVA to reduce its budget by a specified percentage (although the legal applicability of such a situation to TVA would depend upon the wording of the legislation making the automatic spending cuts). Such attempts to restrict TVA's ability to control or allocate funds in those specific types of situations could adversely affect its cash flows, results of operations, and financial condition, its relationships with creditors, vendors, and counterparties, the way it conducts its business, and its reputation.
TVA may lose its protected service territory.
TVA's service area is defined primarily by provisions of law and long-term contracts. The fence limits the region in which TVA or LPCs which distribute TVA power may provide power. The anti-cherrypicking provision limits the ability of others to use the TVA transmission system for the purpose of serving customers within TVA's service area. State service territory laws limit unregulated third parties' ability to sell electricity to consumers. All TVA wholesale power contracts and many contracts between LPCs and their customers are requirements contracts. However, other utilities may use their own transmission lines to serve customers within TVA's service area, and third parties are able to avoid the restrictions on serving end-use customers by selling or leasing a customer generating assets rather than selling electricity.
From time to time, there have been efforts to erode the protection of the anti-cherrypicking provision, and the protection of the anti-cherrypicking provision could be limited and perhaps eliminated by congressional legislation at some time in the future. If Congress were to eliminate or reduce the coverage of the anti-cherrypicking provision but retain the fence, TVA could more easily lose customers that it could not replace within its specified service area. The loss of these customers could adversely affect TVA's cash flows, results of operations, and financial condition.
The TVA Board may lose its sole authority to set rates for electricity.
Under the TVA Act, the TVA Board has the sole authority to set the rates that TVA charges for electricity, and these rates are not subject to further review. If the TVA Board loses this authority or if the rates become subject to outside review, there could be material adverse effects on TVA including, but not limited to, being unable to set rates at a level sufficient to generate adequate revenues to service TVA's financial obligations, properly operate and maintain its power assets, and provide for reinvestment in its power program and becoming subject to additional regulatory oversight that could impede its ability to adapt its business to changing circumstances.
TVA may lose responsibility for managing the Tennessee River system.
TVA's management of the Tennessee River system is important to effectively operate its power system. TVA's ability to integrate management of the Tennessee River system with power system operations increases power system reliability and reduces costs. Restrictions on how TVA manages the Tennessee River system could negatively affect its operations.
TVA may lose responsibility for managing real property currently under its control.
TVA's management of real property containing power generation and transmission structures as well as certain reservoir shorelines is important for navigation, flood control, and the effective operation of the power system. Restrictions on or the loss of the authority to manage these properties could negatively affect TVA's operations, change the way it conducts such operations, or increase costs.
Existing laws, regulations, and orders may negatively affect TVA's cash flows, results of operations, and financial condition, as well as the way TVA conducts its business.
TVA is required to comply with comprehensive and complex laws, regulations, and orders. The costs of complying with these laws, regulations, and orders are expected to be substantial, and costs could be significantly more than TVA anticipates, especially in thewith respect to environmental and nuclear and transmission reliability areas. To settle the EPA and other claims involving alleged NSR violations, TVA agreed to retire 18 coal-fired units and pay a civil penalty. The cost to install the necessary equipment to comply with existing environmental laws, regulations, settlement agreements, and orders at some other facilities has caused TVA to retire additional units and may render some other facilities uneconomical, which may cause TVA to retire or idle additional facilities.compliance. In addition, TVA is required to obtain numerous permits and approvals from governmental agencies that regulate its business, and TVA may be unable to obtain or maintain all requireddesired regulatory approvals. If there is a delay in obtaining requireddesired regulatory approvals or if TVA fails to obtain or maintain any approvals or to comply with any law, regulation, or order, TVA may have to change how it operates certain assets, may be unable to operate certain assets, or may have to pay fines or penalties if it continues to operate the assets.
Additional NRC requirementsNew laws, regulations, or administrative or executive orders, or congressional actions or inactions, may negatively affect TVA's cash flows, results of operations, and financial condition, as well as the way TVA conducts its business.
Because TVA is a corporate agency and instrumentality established by federal law, it may be affected by a variety of laws, regulations, and administrative or executive orders that do not affect other electric utilities. For example, federal
legislation may expand or reduce TVA's activities, change its governance structure, require TVA to sell some or all of the assets that it operates, require TVA to take certain other operational or regulatory actions, reduce or eliminate the U.S.'s ownership of TVA, or even liquidate TVA. Additionally, Congress could act, or fail to take action, on various issues that may result in impacts to TVA, including but not limited to action or inaction related to the national debt ceiling or automatic spending cuts in government programs. Furthermore, administrative or executive orders could cause TVA to change the way it conducts its business. See Item 1, Business — Environmental Matters — Climate Change — Executive Actions for a discussion of recent executive orders regarding climate change.
Although it is difficult to predict exactly how new laws, regulations, or administrative or executive orders or congressional action or inaction may impact TVA, some of the possible effects are described below.
TVA may lose its protected service territory.
TVA’s service area is defined primarily by provisions of law and long-term contracts. The fence limits the region in which TVA or LPCs which distribute TVA power may provide power. The anti-cherrypicking provision precludes FERC from ordering TVA to transmit power for others if that power would be consumed within the TVA service area. State service territory laws limit unregulated third parties’ ability to sell electricity to consumers. All current wholesale power contracts between TVA and LPCs are all requirements contracts; however, Flexibility Agreements available to LPCs that have executed long-term contracts with TVA allow LPCs to locally generate or purchase up to approximately five percent of average total hourly energy sales over 2015 - 2019 in order to meet their individual customers’ needs. In addition, other utilities may use their own transmission lines to serve customers within TVA’s service area, and third parties are able to avoid the restrictions on serving end-use customers by selling or leasing generating assets to a customer rather than selling electricity.
From time to time, there have been efforts to circumvent the protection of the anti-cherrypicking provision. For example, on January 11, 2021, four LPCs filed a complaint and petition with FERC asking FERC to order TVA to provide transmission and interconnection service to the LPCs or other suppliers that want to serve them, although one of the four LPCs subsequently withdrew from the complaint and petition. See Note 23 — Commitments and Contingencies — Legal Proceedings — Challenge to Anti-Cherrypicking Amendment. In addition, the protections afforded by the anti-cherrypicking provision could be affected by federal legislation at some time in the future. If FERC limited the application of the anti-cherrypicking provision or if federal legislation eliminated or limited the application of the anti-cherrypicking provision without corresponding legislative modifications to the territorial limitations imposed by the fence, TVA's ability to operatecompete fairly for customers would be adversely affected. Because TVA’s ability to expand its nuclear facilities.
Supplementary NRC rulemakingcustomer base is under development to mitigate beyond design basis flooding events and seismic events. Complying with these or other requirements adoptedconstrained by the NRC may require significant capital expenditures andfence, reductions in demand have to be offset by such actions as reducing TVA’s internal costs or increasing rates. Any failure of such measures to fully offset the reduced demand for power may negatively affect TVA'sTVA’s cash flows, results of operations, and financial condition. Should TVA be unable to comply with the requirements, TVA may not be able to operate its nuclear facilities as currently contemplated by TVA's generation plans.
TVA is involved in various legal and administrative proceedings whose outcomes may affect TVA's finances and operations.
TVA is involved in various legal and administrative proceedings and is likely to become involved in additional proceedings in the future in the ordinary course of business or as a result of, among other things, catastrophic events as a result ofor environmental conditions at TVA property or areas where TVA has disposed of materials or property, or otherwise.property. The additional proceedings could involve, among other things, challenges to TVA'sTVA’s CCR facilities, and nuisance suits involving TVA'sTVA’s coal-fired plants.plants, challenges to the anti-cherrypicking provision, and challenges to TVA’s authority to set rates and enter into contracts. Although TVA cannot predict the outcome of the individual matters in which TVA is involved or will become involved, the resolution of these matters could require TVA to make expenditures in excess of established reserves and in amounts that could have a material adverse effect on TVA'sTVA’s cash flows, results of operations, and financial condition. Similarly, resolution of any such proceedings may require TVA to change its business practices or procedures, change how it operates its coal-firedfossil-fueled units, reduce emissions to a greater extent than TVA had planned, close existing CCR facilities sooner than planned, build new CCR facilities sooner than planned, build new CCR facilities that were not planned, or even cease operation of some coal-fired units.
TVA is largely restricted tounits, adjust its rates, or terminate or modify contracts. These events could also have a defined service area.
TVA's ability to expand its customer base is constrained by its inability to pursue new customers outside its service area. Accordingly, reductions in demand have to be offset by such actions as reducing TVA's internal costs or increasing rates. Any failure of such measures to fully offset the reduced demand for power may negatively affect TVA'smaterial adverse effect on TVA’s cash flows, results of operations, and financial condition. For a discussion of certain current material legal proceedings, see Item 7, Management's Discussion and Analysis of Financial Condition and Results of Operations — Key Initiativesand Challenges and Note 23 — Commitments and Contingencies — Legal Proceedings.
TVA may become subject to additional environmental regulation.
New environmental laws, regulations, or orders may become applicable to TVA or the facilities it operates, and existing environmental laws or regulations may be revised or reinterpreted in a way that adversely affects TVA, including substantially increasing TVA's cost of operations, prompting the early retirement of generation facilities, or requiring significant capital expenditures. Possible areas of future laws or regulations include, but are not limited to, GHGs, CCR, ELGs, water quality, renewable energy portfolio standards, and natural gas production and transmission. See Item 1, Business — Environmental Matters — Water Quality Control Developments for a discussion of the EPA's new effluent limitation guidelines, Item 1, Business — Environmental Matters — Cleanup of Solid and Hazardous Wastes — Coal Combustion Residuals for a discussion of recent revisions to the EPA's CCR rule, and Item 1, Business — Environmental Matters — Climate Change — Executive Actions for a discussion of recent executive orders regarding
climate change. Litigation may affect the timing and requirements of new regulatory proposals, and may indirectly affect TVA, even if TVA is not involved.
TVA could be divested by the federal government or be required to sell some or all of its assets.
From time to time, U.S. administrations have suggested that the federal government should either divest TVA or require TVA to sell some or all of its assets, including its transmission system. Either event could trigger change of control provisions in certain material contracts or covenants in TVA’s bond documents that concern the sale or disposal of a substantial portion of TVA’s power properties. TVA may, among other things, be required to pay off debt more quickly than anticipated and be unable to access credit facilities. Additionally, the loss of the transmission system could interfere with TVA’s operations and require TVA to contract for the transmission of electricity to customers. These factors could negatively affect TVA’s operations, change the way it conducts such operations, and increase costs.
TVA's ability to control or allocate funds could be restricted.
Other federal entities may attempt to restrict TVA's ability to access or control its funds that are on deposit in TVA's account in the U.S. Treasury. For example, should the U.S. Treasury approach its debt ceiling, the U.S. Treasury might, as part of an effort to control cash disbursements, attempt to require TVA to receive approval before disbursement of funds from TVA's U.S. Treasury account. Additionally, the OMB might, in the event that automatic spending cuts go into effect, attempt to require TVA to reduce its budget by a specified percentage (although the legal applicability of such a situation to TVA would depend upon the specific legislation making the automatic spending cuts). Such attempts to restrict TVA's ability to control or allocate funds in those specific types of situations could adversely affect its cash flows, results of operations, and financial condition, its relationships with creditors, vendors, and counterparties, the way it conducts its business, and its reputation.
The TVA Board may lose its sole authority to set rates for electricity.
Under the TVA Act, the TVA Board has the sole authority to set the rates that TVA charges for electricity, and these rates are not subject to further regulation. If the TVA Board loses this authority or if the rates or the ratemaking process become subject to external review, there could be material adverse effects on TVA including, but not limited to, being unable to set rates at a level sufficient to generate adequate revenues to service TVA's financial obligations, properly operate and maintain its assets, and provide for reinvestment in its power program and becoming subject to additional regulatory oversight that could impede its ability to adapt its business to changing circumstances.
TVA may lose responsibility for managing the Tennessee River system.
TVA's management of the Tennessee River system helps TVA effectively operate its power system. TVA's ability to integrate management of the Tennessee River system with power system operations increases power system reliability and reduces costs. Restrictions on how TVA manages the Tennessee River system could negatively affect its operations or increase costs.
TVA may lose responsibility for managing real property currently under its control.
TVA's management of real property containing power generation and transmission structures as well as certain reservoir shorelines is important for navigation, flood control, and the effective operation of the power system. Restrictions on or the loss of the authority to manage these properties could negatively affect TVA's operations or increase costs.
TVA may become subject to additional NERC requirements.
TVA is subject to federal reliability standards that are set forth by NERC and approved by FERC. TVA recognizes that reliability standards and expectations continue to become more complex and stringent for transmission systems. At present there are approximately 90 mandatory standards subject to enforcement containing approximately 1,300 requirements and sub-requirements that must be met. Complying with these or additional requirements set forth by NERC may require significant capital expenditures and may negatively affect TVA's cash flows, results of operations, and financial condition.
TVA's governmental status may interfere in its ability to quickly respond to the needs of its current or potential customers or to act solely in the interest of its ratepayers.
As a quasi-governmental entity, TVA has certain legal requirements that prevent it from responding as quickly to potential changes in the market or requests from current or potential customers as might be desired or in comparison to other utilities. For example, TVA is required to comply with the National Environmental Policy Act ("NEPA"), which requires environmental reviews to be performed in connection with certain projects. The delay in responding to requests could damage relationships with current customers, deter potential customers from moving into TVA's service territory, or damage TVA's reputation.
In addition, TVA's nature as a quasi-governmental entity imposes additional pressures that most companies do not face, such as the requirement to support economic development; simultaneously manage a river system for commerce, recreation, and power generation; and promote recreational opportunities. TVA must balance these obligations with the requirement to provide power at the lowest feasible rates. If TVA does not adequately communicate how it fulfills its various missions and the value it provides, its reputation may be harmed, which may result in political pressure to change its nature or operations as well as in the loss of public support.
OPERATIONAL RISKS
TVA may incur delays and additional costs in its major projects andor may be unable to obtain necessary regulatory approval.
Among other projects, TVA is constructing a natural gas-fired plant, conductingimproving the extended power uprate project at Browns Ferry,reliability and resiliency of its transmission system, undertaking repairs at certain hydroelectric facilities and dams, and closing some coal-fired plants and their supporting infrastructure. These activities involve risks of overruns in the cost of labor and materials as well as risks of schedule delays, which may result from, among other things, changes in laws or regulations, lack of productivity, human error, supply chain challenges, and the failure to schedule activities properly. In addition, if TVA does not or cannot obtain the necessary regulatory approvals or licenses, is otherwise unable to complete the development or construction of a facility, decides to cancel construction of a facility, or incurs delays or cost overruns in connection with constructing a facility, or is required to change how it will conduct construction, repair, or closure activities, TVA's cash flows, financial condition, and results of operations could be negatively affected. Further, if projects are not completed according to specifications, TVA may suffer, among other things, delays in receiving licenses, reduced plant efficiency, reduced transmission system integrity and reliability, and higher operating costs.
TVA may not be able to operate one or more of its nuclear power units.
Should issues develop with TVA’sTVA's nuclear power units that TVA isare unable to correct,be corrected, TVA might voluntarily shut down one or more units or be ordered to do so by the NRC. Returning the unit(s) intoto operation could be a lengthy and expensive process, or might not be possible depending on circumstances. In either case, TVA's cash flows, results of operations, financial condition, and reputation may be negatively affected.
Operating nuclear units subjects TVA to nuclear risks and may result in significant costs that adversely affect its cash flows, results of operations, and financial condition.
TVA has seven operating nuclear units. Risks associated with these units include the following:
Nuclear Risks. AHazards exist with the use of radioactive material in energy production, including management, handling, storage, and disposal. Further, a nuclear incident at one of TVA's facilities could have significant consequences including loss of life, damage to the environment, damage to or loss of the facility, and damage to non-TVA property. Although TVA carries certain types of nuclear insurance, the amount that TVA is required to pay in connection with a nuclear incident could significantly exceed the amount of coverage provided by insurance. AnyThelicensee of each nuclear reactor has a contingent obligation to pay a retrospective premium, equal to its proportionate share of the loss in excess of the primary level, regardless of proximity to the incident inof fault, up to a maximum of approximately $138 million per reactor, per incident. With TVA's seven reactors, the United States, evenmaximum total contingent obligation per incident is $963 million. This retrospective premium is payable at a facility that is not operated by or licensed to TVA, has the potential to impact TVA adversely by obligating TVA to pay up to $133maximum rate currently set at approximately $20 million per year, and a total of $891 million per nuclear incident, under the Price-Anderson Act.per reactor. Any such nuclear incident could also negatively affect TVA by, among other things, obligating TVA to pay retrospective insurance premiums, reducing the availability and affordability of insurance, increasing the costs of operating nuclear units, or leading to increased regulation or restriction on the construction, operation, and decommissioning of nuclear facilities. Moreover, Congressfederal legislation could impose revenue-raising measures on the nuclear industry to pay claims exceeding the limit for a single incident under the Price-Anderson Act. Further, the availability or price of insurance may be impacted by TVA's acts or omissions, such as a failure to properly maintain a facility, or events outside of TVA's control, such as an equipment manufacturer's inability to meet a guideline, specification, or requirement.
Decommissioning Costs. TVA maintains a NDTNuclear Decommissioning Trust ("NDT") for the purpose of providing funds to decommission its nuclear facilities. The NDT is invested in securities generally designed to achieve a return in line with overall equity and debt market performance. See Note 17 — Fair Value Measurements — Investment Funds for the NDT balance atSeptember 30, 2021. TVA might have to make unplanned contributions to the NDT if, among other things:
•The value of the investments in the NDT declines significantly or the investments fail to achieve the assumed real rate of return;
•The decommissioning funding requirements are changed by law or regulation;
•The assumed real rate-of-returnrate of return on plan assets, which is currently five percent, is lowered by the TVA Board or is overly optimistic;
•The actual costs of decommissioning are more than planned;
•Changes in technology and experience related to decommissioning cause decommissioning cost estimates to increase significantly;
•TVA is required to decommission a nuclear plant sooner than it anticipates; or
•The NRC guidelines for calculating the minimum amount of funds necessary for decommissioning activities are significantly changed.
If TVA makes additional contributions to the NDT, the contributions may negatively affect TVA's cash flows, results of operations, and financial condition.
Increased Regulation. The NRC has broad authority to adopt requirementsregulations related to the licensing, operating, and decommissioning of nuclear generation facilities and may adopt regulations as a result of events that occur at nuclear facilities in the U.S. or throughout the world, such as the events that occurred at Fukushima. These regulations can result in significant restrictions or requirements on TVA. If theFor example, supplementary NRC modifiesrulemaking has been developed to mitigate beyond-design basis flooding and seismic events. To comply with existing, requirementsnew, or adopts new requirements,modified regulations, TVA may be required to make substantial capital expenditures at its nuclear plants or make substantial contributions to the NDT. In addition, if TVA fails to comply with requirements promulgated by the NRC, the NRC has the authority to impose fines, shut down units, or modify, suspend, or revoke TVA's operating licenses.
Waste Disposal. TVA’sDisposal. TVA's nuclear operations produce various types of nuclear waste materials, including spent fuel. TVA has been storing the spent fuel in accordance with NRC regulations in anticipation that a final storage site for all such waste will be developed and put in operation by the United StatesU.S. government. If no such site is forthcoming or if no alternative disposal or reuse plan is developed, then TVA might be required to arrange for the safe and permanent disposal of the spent fuel itself. Such a requirement would cause TVA to incur substantial expense, including substantial capital expenditures, and could cause TVA to change how it operates its nuclear plants.
Availability of Components. Nuclear facilities require specialized components and access to intellectual property for operation. As the number of reliable suppliers of such components and access to intellectual property is reduced, the availability of the components and access to the intellectual property will also likely decrease. If TVA is unable to secure either the original components, intellectual property, or replacements approved for use by the NRC, TVA might have to change how it conducts its operations. Further, limitations on global trade resulting from COVID-19 or limitations on global shipping could materially impact the availability or cost of desired equipment.
TVA’sTVA's management and operation of coal combustion residualCCR facilities exposes it to additional costs and risks.
TVA operates coal-fired units which produce CCR as byproducts of the power production process. The CCR is contained within dedicated facilities operated by TVA. TVA has closed some of these facilities in compliance with state and federal laws and is in the process of closing others. Some facilities are intended to remain open during the life of the associated generation unit. Many of these facilities were constructed prior to the requirement that such facilities be built with liners and thus do not contain such liners. TVA has been ordered by TDEC to undertake investigations at all CCR facilities in Tennessee. TVA has also been involved in litigation with regardrelated to certain of theseCCR facilities, and has been ordered to move allresolve one such lawsuit, TVA agreed to remove or beneficially reuse some CCR material from unlined facilities at Gallatin Fossil Plant to a lined facility that will have to be constructed for that purpose.("Gallatin"). TVA could be subject to similar litigation andor orders at other TVA facilities. TVA has also been ordered by TDEC to undertake investigations for all facilities in Tennessee. TVAthe future and could be required to restrict or stop the use of anysome or all CCR facilities or relocate CCR material to other lined facilities. Further, TVA has decided to move all CCR material at Allen Fossil Plant rather than closing the CCR facilities which do not currently exist. These measures would impact how TVA operates its facilities, causein place as originally planned, and moving the CCR material subjects TVA to incur greater expenses than currently anticipated for operatingadditional costs and risks. TVA may change its closure plans at other facilities depending on the particular facts of each situation and the completion of any required environmental investigations or closing existing CCR facilities, and impact TVA’s cash flow and results of operations. Additionally, the relocation of materials would result in a lengthy process with the potential for environmental and safety impacts, which could cause extensive monetary and reputational impacts to TVA.studies and/or approval by appropriate state regulators.
TVA’sTVA's facilities and operations may be damaged or interfered with by physical attacks, threats, or other interference.
TVA has an extensive generation and transmission system and supporting infrastructure that includes, among other things, TVA’sTVA's generation facilities and transmission infrastructure such as substations, towers, and towers.control centers. Some of TVA’sTVA's hydroelectric facilities include navigation locks which are necessary for commerce along the Tennessee River system. TVA also operates flood control dams and supporting infrastructure. Because of TVA’sTVA's status as a governmental corporation and TVA’sTVA's role as predominatelypredominantly the sole power provider for its service territory, TVA may be targeted by individuals, groups, or nation states for physical attacks or threats of such attacks. Although TVA’sTVA's operations are protected by automated monitoring systems, TVA Police and Emergency Management, TVA employees,
local law enforcement, or a combination thereof, it may not be possible to effectively deter or prevent attacks. Such attacks could pose health and safety risks, significantly disable or destroy TVA assets, interfere with TVA’sTVA's operations, result in additional regulatory or security requirements, and negatively affect TVA’sTVA's cash flows, results of operations, and financial condition.
TVA’s facilities and information infrastructure may not operate as planned due to cyber threats to TVA’s assets and operations.
TVA’s operations are heavily computerized and include assets such as information technology and networking systems. As with all industries, the reliance on computerization and networking makes TVA a target for cyber attacks, and the risk of such attacks may increase as individual devices and equipment become accessible via the internet. TVA has been targeted by cyber attacks in the past and anticipates that it will be targeted in the future. These attacks may have been carried out, or in the future could be carried out, by individuals, groups, or nation states. Although TVA has extensive cyber safeguards and works with industry specialists and relevant governmental authorities to deter, stop or mitigate cyber attacks, it is possible that these measures could fail. In such a case, a cyber attack could compromise sensitive data, significantly disrupt operations, require additional expenditures for cyber security, negatively affect TVA's cash flows, results of operations, financial condition, and reputation, and pose health and safety risks. Additionally, the theft, damage, or improper disclosure of sensitive data may also subject TVA to penalties and claims from third parties.
Cyber attacks on third parties could interfere with or harm TVA.
TVA relies on third parties for various services, including transferring funds to non-TVA entities in the ordinary course of business. As with TVA, these third parties are heavily computerized and include assets such as information technology and networking systems. If these third parties undergo cyber attacks, the services they provide TVA could be disrupted. This disruption could interfere with TVA’s abilities to transfer funds or make payments, which in turn could negatively affect TVA’s financial condition and reputation. Additionally, the theft, damage, or improper disclosure of sensitive data held by these third parties may also subject TVA to additional harm.
TVA's assets or their supporting infrastructure may not operate as planned.
Many of TVA's assets, including generation, transmission, navigation, and flood control assets, have been operating for several decades and have been in nearly constant service since they were completed. Additionally, certain of TVA's newer assets have experiencedutilize advanced technology which could experience technical or operating issues and manufacturing defects in essential equipment.issues. The failure of TVA's assets or their supporting infrastructure, including information technology systems, to perform as planned may cause health, safety, or environmental problems and may even result in events such as the failure of a dam, the inability to maintain a reservoir at the normal or expected level, or an incident at a coal-fired, gas-fired, or nuclear plant or a CCR facility. If these assets or their supporting infrastructure fail to operate as planned, if necessary repairs or upgrades are delayed or cannot be completed as quickly as anticipated, or if necessary spare parts are unavailable, TVA, among other things:
•May have to invest a significant amount of resources to repair or replace the assets or the supporting infrastructure;
•May have to remediate collateral damage caused by a failure of the assets or the supporting infrastructure;
•May not be able to maintain the integrity or reliability of the transmission system at normal levels;
•May have to operate less economical sources of power;
•May have to purchase replacement power on the open market at prices greater than its generation costs;
•May be required to invest substantially to meet more stringent reliability standards;
•May be unable to maintain insurance on affected facilities, or be required to pay higher premiums for coverage, unless necessary repairs or upgrades are made;
•May be unable to operate the assets for a significant period of time; andor
•May not be able to meet its contractual obligations to deliver power.
Any of these potential outcomes may negatively affect TVA's cash flows, results of operations, financial condition, and reputation.
TVA’sTVA's safety programprograms may not prevent accidents that could, among other things, impact TVA’sTVA's operations or financial condition.
TVA’sTVA's safety program, no matter how well designed and operated, may not completely prevent accidents. In addition to the potential human cost of accidents, which could include injury to employees or members of the public, significant accidents could impact TVA’sTVA's ability to carry out operations, cause it to shut down facilities, subject it to additional regulatory scrutiny, expose it to litigation, damage its reputation, interfere with its ability to attract or retain a skilled workforce, andor harm its financial condition.
TVA's service reliability could be affected by problems at other utilities or at TVA facilities, or by the increase in intermittent sources of power.
TVA's transmission facilities are directly interconnected with the transmission facilities of neighboring utilities and are thus part of the larger interstate power transmission grid. Certain of TVA's generation and transmission assets are critical to maintaining reliability of the transmission system. Additionally, TVA uses certain assets that belong to third parties to transmit power and maintain reliability. Accordingly, problems at other utilities as well as at TVA's facilities may cause interruptions in TVA's service to TVA's customers, increase congestion on the transmission grid, or reduce service reliability. In addition, the increasing contribution of intermittent sources of power, such as wind and solar, may place additional strain on TVA's system as well as on surrounding systems. If TVA suffers a service interruption, increased congestion, or reduced service reliability, TVA's cash flows, results of operations, financial condition, and reputation may be negatively affected.
TVA's supplies of fuel, purchased power, or other critical items may be disrupted or obtained at a higher cost than planned.
TVA purchases coal, uranium, natural gas, fuel oil, and electricity from a number of suppliers. Additionally, TVA contracts for conversion of uranium into nuclear fuel and purchases other items, such as anhydrous ammonia, liquid
oxygen, or replacement parts that are critical to the operation of certain generation assets. TVA also purchases power from other power producers when the purchase of such power is appropriate due to economic opportunities or operational concerns. Disruption or price volatility in the acquisition or delivery of fuel, purchased power, contracted services, or other critical supplies, such as the natural gas price spikes that occurred in 2021, may result from a variety of physical and commercial events, political developments, international trade restrictions or tariffs, legal actions, cyber attacks, mine closures or reduced mine production, increases in fuel exports, or environmental regulations affecting TVA's suppliers as well as from transportation or transmission constraints. If one of TVA's suppliers fails to perform under the terms of its contract with TVA, TVA might have to purchase replacement fuel, power, or other critical supplies, perhaps at a significantly higher price than TVA is entitled to pay under the contract. In some circumstances, TVA may not be able to recover this difference from the supplier. In addition, any disruption ofTVA's supplies could require TVA to operate higher cost generation assets, thereby negatively affecting TVA's cash flows, results of operations, and financial condition. Moreover, if TVA is unable to acquire enough replacement fuel, power, or supplies, or does not have sufficient reserves to offset the loss, TVA may not be able to operate certain assets or provide enough power to meet demand, resulting in power curtailments, brownouts, or even blackouts.
TVA's determination of the appropriate mix of generation assets may change.
TVA has determined that its power generation assets should consist of a mix of nuclear, coal-fired, natural gas-fired, and renewable power sources, including hydroelectric. In making this determination, TVA took various factors into consideration, including the anticipated availability of its nuclear units, the availability of non-nuclear facilities, the forecasted cost of natural gas and coal, the forecasted demand for electricity, and environmental compliance including the expense of adding air pollution controls to its coal-fired units. If any of these assumptions materially change or are impacted by subsequent events, TVA's generation mix may not address its operational needs in the most efficient manner. For example, efforts to electrify the transportation and building sectors to reduce GHG emissions may result in higher electric demand and lower natural gas demand over time. In addition, achieving TVA's carbon reduction goals may require TVA to make significant capital investments, including investments in new technologies, and may require TVA to retire coal-fired and natural-gas fired generation facilities sooner than planned. Resolving situations where results vary from assumptions may require significant capital expenditures or additional power purchases, and TVA's cash flows, results of operations, financial condition, and reputation may be negatively affected.
RISKS RELATED TO THE ENVIRONMENT AND CATASTROPHIC EVENTS
Weather conditions may influence TVA's ability to supply power and its customers' demands for power.
Extreme temperatures may increase the demand for power and require TVA to purchase power at high prices to meet the demand from customers, while unusually mild weather may result in decreased demand for power and lead to reduced electricity sales. Also, in periods of below normal rainfall or drought, TVA's low-cost hydroelectric generation may be reduced, requiring TVA to purchase power or use more costly means of producing power. Additionally, periods of either high or low levels of rainfall may impede river traffic, impacting barge deliveries of critical items such as coal and equipment for power facilities. Furthermore, high river water temperatures in the summer may limit TVA's ability to use water from the Tennessee or Cumberland River systems for cooling at certain of TVA's generating facilities, thereby limiting its ability to operate these generating facilities. This situation would be aggravated during periods of reduced rainfall or drought. If changes in the climate make such shifts in weather more common or extreme or cause catastrophic events, such as droughts, floods, wildfires, and snow or ice storms, to occur more frequently in the Tennessee Valley region, TVA may be required to, among other things, change its generation mix or change how it conducts its operations.operations, which could have a material adverse effect on TVA's cash flows, results of operations, and financial condition. Moreover, TVA's efforts to address the potential impacts of climate change may not be effective, as there are uncertainties with any new technology and operational development and deployment, and there are also potential financial, operational, and environmental impacts, including impacts to rates and reliability as well as siting and permitting challenges.
Events that affect the supply or quality of water in the Tennessee River system and Cumberland River system or elsewhere may interfere with TVA's ability to generate power.
An inadequate supply of water in the Tennessee River system and Cumberland River system could negatively impact TVA's cash flows, results of operations, and financial condition by reducing generation not only at TVA's hydroelectric plants but also at its coal-fired and nuclear plants, which depend on water from the river systems near which they are located for cooling and for use in boilers where water is converted into steam to drive turbines. Some of TVA's gas-fired facilities not located near a river require alternative sources of water, such as from wells or local utility companies. Further, the water must be of a particular quality for use in TVA's equipment. If the available water is not of sufficient quality for TVA's use, then TVA must either treat the water or obtain alternate sources. An inadequate supply of quality water could result, among other things, from periods of low rainfall or drought, the withdrawal of water from the river systems by governmental entities or others, incidents affecting bodies of water not managed by TVA, supply issues which affect water providers, or intrusive aquatic plants and animals such as eel grass, algae, and mussels that block cooling water intake pipes or otherwise interfere with the operation of TVA's generation facilities. While TVA manages
the Tennessee River and a large portion of its tributary system to provide much of the water necessary for the operation of its power plants, the USACE operates and manages other bodies of water upon which some of TVA's facilities rely. Events at these bodies of water or their associated hydroelectric facilities may interfere with the flow of water and may result in TVA's having insufficient water quality to meet the needs of its generating plants. If TVA has insufficient water supply of the quality necessary to meet the needs of its plants, TVA may be required to treat the water, reduce generation at its affected facilities to levels compatible with the available supply of water, or take additional steps that change how TVA conducts its operations or cause TVA to incur additional expense.
Catastrophic events may negatively affect TVA's cash flows, results of operations, and financial condition.
TVA's cash flows, results of operations, and financial condition may be adversely affected, either directly or indirectly, by catastrophic events such as fires, earthquakes, explosions, solar events, electromagnetic pulses ("EMPs"), geomagnetic disturbances, droughts, floods, hurricanes, tornadoes, polar vortexes, icing events, or other casualty events, wars, national emergencies, terrorist activities, pandemics, andor other similar destructive or disruptive events. These events, the frequency and severity of which are unpredictable, may, among other things, lead to legislative or regulatory changes that affect the construction, operation, and decommissioning of nuclear units and the storage of spent fuel; limit or disrupt TVA's ability to generate and transmit power; limit or disrupt TVA's ability to provide flood control and river management; reduce the demand for power; disrupt fuel or other supplies; require TVA to produce additional tritium; lead to an economic downturn; require TVA to make substantial capital investments for repairs, improvements, or modifications; and create instability in the financial markets. If public opposition to nuclear power makes operating nuclear plants less feasible as a result of any of these events, TVA may be forced to shut down its nuclear plants. This would make it substantially more difficult for TVA to obtain greater amounts of its power supply from low or zero carbon emitting resources and to replace its generation capacity when faced with retiring or idling certain coal-fired units. Additionally, some studies have predicted that climate change may cause catastrophic events, such as droughts and floods, to occur more frequently in the Tennessee Valley region, which could adversely impact TVA.
TVA's service reliability could be affected by problems at other utilities or at TVA facilities, or by the increase in intermittent sources of power.
TVA's transmission facilities are directly interconnected with the transmission facilities of neighboring utilities and are thus part of the larger interstate power transmission grid. Certain of TVA's generation and transmission assets are critical to maintaining reliability of the transmission system. Additionally, TVA uses certain assets that belong to third parties to transmit power and maintain reliability. Accordingly, problems at other utilities as well as at TVA's facilities may cause interruptions in TVA's service to TVA's customers, increase congestion on the transmission grid, or reduce service reliability. In addition, the increasing contribution of intermittent sources of power, such as wind and solar, may place additional strain on TVA's system as well as on surrounding systems. If TVA suffers a service interruption, increased congestion, or reduced service reliability, TVA's cash flows, results of operations, financial condition, and reputation may be negatively affected.
TVA's supplies of fuel, purchased power, or other critical items may be disrupted.
TVA purchases coal, uranium, natural gas, fuel oil, and electricity from a number of suppliers. Additionally, TVA contracts for conversion of uranium into nuclear fuel and purchases other items, such as anhydrous ammonia, liquid oxygen, or replacement parts that are critical to the operation of certain generation assets. TVA also purchases power from other power producers when the purchase of such power is appropriate due to economic opportunities or operational concerns. Disruption in the acquisition or delivery of fuel, purchased power, contracted services, or other critical supplies may result from a variety of physical and commercial events, political developments, legal actions, or environmental regulations affecting TVA's suppliers as well as from transportation or transmission constraints. If one of TVA's suppliers fails to perform under the terms of its contract with TVA, TVA might have to purchase replacement fuel, power, or other critical supplies, perhaps at a significantly higher price than TVA is entitled to pay under the contract. In some circumstances, TVA may not be able to recover this difference from the supplier. In addition, any disruption of
TVA's supplies could require TVA to operate higher cost generation assets, thereby adversely affecting TVA's cash flows, results of operations, and financial condition. Moreover, if TVA is unable to acquire enough replacement fuel, power, or supplies, or does not have sufficient reserves to offset the loss, TVA may not be able to operate certain assets or provide enough power to meet demand, resulting in power curtailments, brownouts, or even blackouts.
Events which affect the supply of water in the Tennessee River system and Cumberland River system may interfere with TVA's ability to generate power.
An inadequate supply of water in the Tennessee River system and Cumberland River system could negatively impact TVA's cash flows, results of operations, and financial condition by reducing generation not only at TVA's hydroelectric plants but also at its coal-fired and nuclear plants, which depend on water from the river systems near which they are located for cooling and for use in boilers where water is converted into steam to drive turbines. An inadequate supply of water could result, among other things, from periods of low rainfall or drought, the withdrawal of water from the river systems by governmental entities or others, and incidents affecting bodies of water not managed by TVA. While TVA manages the Tennessee River and a large portion of its tributary system to provide much of the water necessary for the operation of its power plants, the USACE operates and manages other bodies of water upon which some of TVA's facilities rely. Events at these bodies of water or their associated hydroelectric facilities may interfere with the flow of water and may result in TVA's having insufficient water to meet the needs of its plants. If TVA has insufficient water to meet the needs of its plants, TVA may be required to reduce generation at its affected facilities to levels compatible with the available supply of water.
TVA's determination of the appropriate mix of generation assets may change.
TVA has determined that its power generation assets should consist of a mix of nuclear, coal-fired, natural gas-fired, and renewable power sources, including hydroelectric. In making this determination, TVA took various factors into consideration, including the anticipated availability of its nuclear units, the availability of non-nuclear facilities, the forecasted cost of natural gas and coal, the forecasted demand for electricity, and environmental compliance including the expense of adding air pollution controls to its coal-fired units. If any of these assumptions materially change or are overtaken by subsequent events, then TVA's generation mix may not adequately address its operational needs. Resolving such a situation may require capital expenditures or additional power purchases, and TVA's cash flows, results of operations, financial condition, and reputation may be negatively affected.
FINANCIAL, ECONOMIC, AND MARKET RISKS
TVA’s cost reduction efforts may not be successful.
TVA is continuing to work to reduce operating expenses to offset reductions in power demand. The failure to achieve or maintain cost reductions could adversely affect TVA's rates, reputation, cash flows, results of operations, and financial condition.
TVA may have to make significant contributions in the future to fund its qualified pension plan.
At September 30, 2017,2021, TVA's qualified pension plan had assets of approximately $8.0$9.1 billion compared to liabilities of approximately $12.6$13.3 billion. The plan is mature with approximately 24,00023,000 retirees and beneficiaries receiving benefits of over $700 million per year. The costs of providing benefits depend upon a number of factors, including, but not limited to, provisions of the plan; changing experience and assumptions related to terminations, retirements, and mortality; rates of increase in compensation levels; rates of return on plan assets; discount rates used in determining future benefit obligations and required funding levels; optional forms of benefit payments selected; future government regulation; and levels of contributions made to the plan.
Although the plan is frozen to new participants, any of these factors or any number of these factors could keep at high levels, or even increase, the costs of providing benefits and require TVA to make contributions to the plan in amounts that significantly exceed TVA's planned contributions. Unfavorable financial market conditions, including conditions that may result from the COVID-19 pandemic, may result in lower expected rates of return on plan assets, loss in value of the investments, and lower discount rates used in determining future benefit obligations. These changes would negatively impact the funded status of the plan. Additional contributions to the plan and absorption of additional costs would negatively affect TVA's cash flows, results of operations, and financial condition.
TVA's debt ceiling could be made more restrictive. Additionally, approaching or reaching TVA's debt ceiling could limit TVA's ability to carry out its business.
The TVA Act provides that TVA can issue Bonds in an amount not to exceed $30.0 billion outstanding at any time. At September 30, 2017,2021, TVA had $24.2$19.4 billion of Bonds outstanding (not including noncashnon-cash items of foreign currency exchange gain of $125$58 million, unamortized debt issue costs of $59$43 million, and net discount on sale of Bonds of $93$72 million).
Approaching or reaching the debt ceiling may adverselynegatively affect TVA's business by limiting TVA's ability to access capital markets and increasing the amount of debt TVA must service. Also, Congressfederal legislation may lower TVA's debt ceiling or broaden the types of financial instruments that are covered by the ceiling. Either of these scenarios may also restrict TVA's ability to raise capital to acquire new power program assets or maintain existing ones, to carry out upgrades or improvements to existing assets or build new ones, to purchase power under long-term power purchase agreements, or to meet regulatory requirements. In addition, approaching or reaching the debt ceiling may lead to increased legislative or regulatory oversight of TVA's activities and could lead to negative rating actions by credit rating agencies.
TVA may be unable to meet its current cash requirements if TVA's access to the debt markets is limited.
TVA uses cash provided by operations together with proceeds from power program financings and other financing arrangements to fund its current cash requirements. It is critical that TVA continues to have access to the debt markets in order to meet its cash requirements. The importance of having access to the debt markets is underscored by the fact that TVA, unlike manymost utilities, relies almost entirely on debt capital since, as a governmental instrumentality, TVA cannot issue equity securities.
TVA's credit ratings may be impacted by congressional actions or by a downgrade of the United States' sovereign credit ratings.
TVA's current credit ratings are not based solely on its underlying business or financial condition but are based to a large extent on the legislation that defines TVA's business structure. Key characteristics of TVA's business defined by legislation include (1) the TVA Board's ratemaking authority, (2) the current competitive environment, which is defined by the fence and the anti-cherrypicking provision, and (3) TVA's status as a corporate agency and instrumentality of the United States. If Congress takes any action that effectively alters any of these characteristics, TVA's credit ratings could be downgraded.
Although TVA Bonds are not obligations of the United States, TVA, as a corporate agency and instrumentality of the United States, may be impacted if the sovereign credit ratings of the United States are downgraded. Such a downgrade of the United States' sovereign credit ratings could, among other things, result in a downgrade of TVA's credit rating. Additionally, the economy could be negatively impacted resulting in reduced demand for electricity, an increase in borrowing costs, and an increase in the cost of fuels, supplies, and other materials required for TVA's operations.
TVA, together with owners of TVA securities, may be impacted by downgrades of TVA's credit ratings.
Downgrades of TVA'sTVA’s credit ratings may have material adverse effects on TVA'sTVA’s cash flows, results of operations, and financial condition as well as on investors in TVA securities. Among other things, a downgrade could increase TVA'sTVA’s interest expense by increasing the interest rates that TVA pays on new securities that it issues. Such an increase may reduce the amount of cash available for other purposes, which may result in the need to increase borrowings, to reduce other expenses or capital investments, or to increase power rates. A downgrade may also result in TVA'sTVA’s having to post collateral under certain physical and financial contracts that contain ratings triggers. A downgrade below a contractual threshold may prevent TVA from borrowing under four credit facilities totaling $2.7 billion or posting letters of credit as collateral under these facilities. At September 30, 2017,2021, there were $1.2 billion of letters of credit outstanding under these facilities. If TVA were no longer able to post letters of credit as collateral, TVA would likely have to post cash as collateral, which would negatively affect TVA’s liquidity. Further, a downgrade may lower the price of TVA securities in the secondary market, thereby hurtingnegatively impacting investors who sell TVA securities after the downgrade and diminishing the attractiveness and marketability of TVA securities. The criteria used by credit rating agencies to assign ratings could also be changed at any time, which could result in changes to TVA's ratings.
TVA's credit ratings may be impacted by congressional actions or by a downgrade of the U.S.'s sovereign credit ratings.
TVA's current credit ratings are not based solely on its underlying business or financial condition but are based to a large extent on the legislation that defines TVA's business structure. Key characteristics of TVA's business defined by legislation include (1) the TVA Board's ratemaking authority; (2) the current competitive environment, which is defined by the fence and the anti-cherrypicking provision; and (3) TVA's status as a corporate agency and instrumentality of the U.S. If Congress takes any action that effectively alters any of these characteristics, TVA's credit ratings could be downgraded.
Although TVA Bonds are not obligations of the U.S., TVA, as a corporate agency and instrumentality of the U.S., may be impacted if the sovereign credit ratings of the U.S. are downgraded. Such a downgrade of the U.S.'s sovereign credit ratings could, among other things, result in a downgrade of TVA's credit rating. Additionally, the economy could be negatively impacted resulting in reduced demand for electricity, an increase in borrowing costs, and an increase in the cost of fuels, supplies, and other materials required for TVA's operations. Additionally, the criteria used by the credit rating agencies to assign ratings could be changed at any time, which could result in changes to TVA's ratings.
TVA's assumptions about the future may be inaccurate.
TVA uses certain assumptions in order to develop its plans for the future. Such assumptions include economic forecasts, anticipated energy and commodity prices, cost estimates, construction schedules, power demand forecasts, the appropriate generation mix to meet demand, and potential regulatory environments. Should these assumptions be inaccurate, or be superseded by subsequent events, TVA's plans may not be effective in achieving the intended results, which could negatively affect cash flows, results of operations, and financial condition, as well as TVA's ability to meet electricity demand and the way TVA conducts its business.
Demand for electricity may significantly decline or change, negatively affecting TVA's cash flows, results of operations, and financial condition.
Some of the factors that could reduce or change the demand for electricity include, but are not limited to, the following:
Economic downturnsDownturns or Recessions. Renewed economic downturns or a recession in TVA's service area or other parts of the United StatesU.S. could reduce overall demand for power and thus reduce TVA's power sales and cash flows, especially if TVA's industrial customers, which constitute a material portion of TVA’sTVA's demand, reduce their operations and thus their consumption of power.
Loss of customersCustomers. TVA could lose customers, particularly LPCs, if customers choose another utility to meet some or all of their power needs where available, pursue self-generation to meet some or all of their power needs, or move their operations outside of TVA’sTVA's service territory. As of November 12, 2021, TVA had wholesale power contracts with 153 LPCs, and 74 LPCs had entered into Flexibility Agreements with TVA that allow the LPCs to locally generate or purchase up to approximately five percent of average total hourly energy sales over 2015 - 2019
in order to meet their individual customers' needs. A significant portion of TVA's total operating revenues are concentrated in a small number of these LPCs. In May 2020, TVA's largest LPC which accounts for nine percent of total operating revenues, MLGW, published a draft Integrated Resource Plan to guide energy choices in the future, the outcome of which is uncertain. In addition, certain other LPCs are evaluating options for future energy choices. The loss of customers could have a material adverse effect on TVA's cash flows, results of operations, or financial condition, and could result in higher rates, especially because of the difficulty in replacing customers on account ofdue to the fence. A significant loss of customers could also impact investor confidence, resulting in TVA paying higher rates on its securities.
Change in demandsDemand for electricity generatedElectricity Generated from renewable sources. Renewable Sources. TVA has been adapting its generation mix to account for the growing preference for electricity generated by renewable sources, such as solar or wind. If demand by customers for power that is largely or exclusively generated from renewable sources exceeds TVA’sTVA's ability to produce such power, TVA might have to change how it operates and may incur additional expense in meeting this demand.
Increased Utilization of DER. As the amount of DER grows on the TVA system, the need for TVA's traditional generation resources may be reduced, and the ability of the system to reliably and economically operate in conjunction with these DER may become more challenging. If TVA is unable to compensate for the resulting decrease in demand for TVA electricity, TVA's cash flows, results of operations, and financial condition could be negatively impacted, resulting in higher rates and changes to TVA's operations.
Increased energy efficiencyEnergy Efficiency and conservationConservation. Increasingly efficient use of energy as well as conservation efforts and DER have reduced the demand for power.power supplied by TVA. Further reductions, if TVA is unable to compensate for them, could negatively affect TVA's cash flows, results of operations, and financial condition and could result in higher rates and changes to TVA’sTVA's operations, especially if the reductions occur during an economic downturn or a period of slow economic growth.
ChangeChanges in technology could require TVA to change how it conducts its operations, affect relationships with customers, or impact its financial condition.
TVA’sTVA's primary business is to sell power it produces, for the most part, from large facilities such as nuclear power plants, hydroelectric facilities, natural gas-fired facilities, and coal-fired units. TVA sells power to LPCs and directly served customers. Research and development activities are ongoing to improve existing and alternative technologies to produce or store electricity, including large-scale energy storage, gas or wind turbines, fuel cells, microturbines, solar cells, and distributed energy or storage resources, such as microgrids.resources. It is possible that advances in these or other alternative technologies could reduce the costs of such production methods to a level that will enable these technologies to compete effectively with traditional power plants such as TVA's. These technologies could be more appealing to customers and could lead them to bring pressure on TVA to modify the power contracts to allow customers to generate some of their own power requirements.requirements or purchase power from other suppliers. Other customers might also cease purchasing power from TVA altogether. To the extent that sales to such customers are reduced or eliminated, TVA's cash flows, results of operations, and financial condition could be negatively affected. TVA could also be required to modify how it operates its traditional plants or further modify its generation mix to reduce reliance on these facilities.
Additionally, demand could change in terms of amount or timing as devices and equipment become more connected to the internet and it becomes possible to adjust real-time consumption of power. Such increased control over power consumption could, among other things, affect how TVA operates its facilities or dispatches power, or require TVA to change its pricing structure or rates.
TVA is subject to a variety of market risks that may negatively affect TVA's cash flows, results of operations, and financial condition.
TVA is subject to a variety of market risks, including, but not limited to, commodity price risk, investment price risk, interest rate risk, counterparty credit and performance risk, and currency exchange rate risk.
Commodity Price Risk. IfTVA's rates may increase if prices of commodities critical to operations, including coal, uranium, natural gas, fuel oil, crude oil, construction materials, or emission allowances, increase, TVA's rates may increase.
Investment Price Risk. TVA is exposed to investment price risk in theits NDT, its ART, itsAsset Retirement Trust ("ART"), Supplemental Executive Retirement Plan ("SERP"), its Deferred Compensation Plan ("DCP"), and its pension plan. If the value of the investments held in the NDT or the pension fund either decreases or fails to increase in accordance with assumed rates of return, TVA may be required to make substantial contributions to these funds. In addition, although TVA is not required to make contributions to the ART, it may choose to do so, particularly if TVA's estimates of its non-nuclear asset retirement obligation liabilities increase. TVA may also choose to make contributions to the SERP and DCP from time to time.
Interest Rate Risk. Changes in interest rates may increase the amount of interest that TVA pays on new Bonds that it issues, decrease the return that TVA receives on short-term investments, decrease the value of the investments in the NDT, the ART, TVA's pension fund, the SERP, and the DCP, increase the amount of collateral that TVA is required to post in connection with certain of its derivative transactions, and increase the losses on the mark-to-market valuation of certain derivative transactions into which TVA has entered.
Counterparty Credit and Performance Risk. TVA is exposed to the risk that its counterparties will not be able to perform their contractual obligations. If TVA's counterparties fail to perform their obligations, TVA's cash flows, results of operations, and financial condition may be adversely affected. In addition, the failure of a counterparty to perform may make it difficult for TVA to perform its obligations, particularly if the counterparty is a supplier of electricity or fuel.
Currency Exchange Rate Risk. Over the next several years, TVA plansexpects to spend a significant amount of capital on various projects. A portion of this amount may be spent on contracts that are denominated in one or more foreign currencies. Additionally, TVA’s threeTVA's two issues of Bonds denominated in British pounds sterling are hedged by currency swap agreements. The value of the U.S. dollar compared with other currencies has fluctuated widely in recent years, including recent fluctuations in the U.S. dollar to British pound sterling exchange rate primarily driven by the “BREXIT”"BREXIT" vote for the United Kingdom to leave the European Union. If not effectively managed, foreign currency exposure could negatively impact TVA's counterparty risk, cash flows, results of operations, and financial condition.
Changes in an interest rate benchmark may impact certain TVA swaps and other financial arrangements.
TVA has four "fixed for floating" interest rate swaps related to outstanding Bonds and receives periodic payments under these swaps based on the floating London Interbank Offered Rate ("LIBOR") benchmark rate. TVA has limited other contracts that could be impacted. Various parts of the LIBOR market are expected to be substantially discontinued in the coming years. LIBOR rates will be phased out between the end of calendar year 2021 and June 2023. Various alternatives for LIBOR are being evaluated by market participants, with the Secured Overnight Financing Rate being the most widely-adopted alternative thus far. TVA may face risks related to the viability of an alternative benchmark over the remaining terms of its current contracts, or over the terms of any future contracts that rely on the benchmark rate.
TVA's ability to use derivatives to hedge certain risks may be limited.
Under the Dodd-Frank Wall Street Reform and Consumer Protection Act and its implementing regulations, TVA is subject to recordkeeping, reporting, and reconciliation requirements related to its derivative transactions. In addition, depending on how regulatory agencies interpret and implement the provisions of this act, TVA's hedging costs may increase, and TVA may have to post additional collateral and margin in connection with its derivative transactions. These occurrences may, among other things, negatively affect TVA's cash flows and cause TVA to reduce or modify its hedging activities, which could increase the risks to which TVA is exposed.
The market for TVA securitiesBonds might be limited.
Although many TVA Bonds are listed on stock exchanges, there can be no assurances that any market will develop or continue to exist for any Bonds. Additionally, no assurances can be made as to the ability of the holders to sell their Bonds or as to the price at which holders will be able to sell their Bonds. Future trading prices of Bonds will depend on many factors, including prevailing interest rates, the then-current ratings assigned to the Bonds, the amount of Bonds outstanding, the time remaining until the maturity of the Bonds, the redemption features of the Bonds, the market for similar securities, and the level, direction, and volatility of interest rates generally, as well as the liquidity of the markets for those securities.
If a particular series of Bonds is offered through underwriters, those underwriters may attempt to make a market in the Bonds. Dealers other than underwriters may also make a market in TVA securities.Bonds. However, the underwriters and dealers are not obligated to make a market in any TVA securitiesBonds and may terminate any market-making activities at any time without notice.
Further, certain investors use the environmental impact or sustainability of an industry as a criteria for deciding whether to invest in that industry. TVA’sTVA's use of fossil fuels or nuclear power could lead such investors to not purchase TVA securities.Bonds.
In addition, legal limitations may affect the ability of banks and others to invest in Bonds. For example, national banks may purchase TVA Bonds for their own accounts in an amount not to exceed 10 percent of unimpaired capital and surplus. Also, TVA Bonds are “obligations"obligations of a corporation which is an instrumentality of the United States”States" within the meaning of Section 7701(a)(19)(C)(ii) of the Internal Revenue Code for purposes of the 60 percent of assets limitation applicable to U.S. building and loan associations.
TVA may be unable to use regulatory accounting for some or all costs.
TVA uses regulatory accounting to defer certain costs. To qualify for regulatory accounting, costs must meet certain accounting criteria and be approved for regulatory accounting treatment by the TVA Board in its capacity as TVA’s regulator. If costs do not meet, or cease to meet, these criteria, or if the TVA Board disallows the treatment or ceases to be TVA’s sole regulator in such areas, TVA may not be able to defer those costs. Such an inability to defer costs would likely have a substantial impact on TVA’s financial condition and results of operations and could impact the timing and amounts of TVA's rate recovery. For a discussion of regulatory accounting, see Item 7, Management's Discussion and Analysis of Financial Condition and Results of Operations —Critical Accounting Policies and Estimates.
TVA's financial control system cannot guarantee that all control issues and instances of fraud or errors will be detected.
No financial control system, no matter how well designed and operated, can provide absolute assurance that the objectives of the control system are met, and no evaluation of financial controls can provide absolute assurance that all control issues and instances of fraud or errors can be detected. The design of any system of financial controls is based in part upon certain assumptions about the likelihood of future events, and there can be no assurance that any design will succeed in achieving its stated goals under all potential future conditions, regardless of how remote.
Payment of principal and interest on TVA securities is not guaranteed by the United States.U.S.
Although TVA is a corporate agency and instrumentality of the United StatesU.S. government, TVA securities are not backed by the full faith and credit of the United States.U.S. Principal and interest on TVA securities are payable solely from TVA's net power proceeds. Net power proceeds are the remainder of TVA's gross power revenues after deducting the costs of operating, maintaining, and administering its power properties and payments to states and counties in lieu of taxes, but before deducting depreciation accruals or other charges representing the amortization of capital expenditures, plus the net proceeds from the sale or other disposition of any power facility or interest therein. If TVA were to experience extreme financial difficulty and were unable to make payments of principal or interest on its Bonds, the federal government would not be legally obligated to prevent TVA from defaulting on its obligations. An inability to pay some or all of the principal or interest owed on a TVA security would likely have a negative impact on TVA's financial condition, reputation, orand relationship with the investment community, and could result in cross-defaults in other financial arrangements.
HUMAN CAPITAL AND MANAGEMENT RISKS
Failure to attract and retain an appropriately qualified workforce may negatively affect TVA's results of operations.
TVA's business depends on its ability to recruit and retain key executive officers as well as skilled professional and technical employees. The inability to attract and retain an appropriately qualified, diverse, and inclusive workforce could adversely affect TVA's ability to, among other things, operate and maintain generation and transmission facilities, complete large construction projects, and successfully implement its continuous improvement initiatives. If Congress reduces the salary of TVA's CEO or otherwise amends TVA's compensation philosophy, TVA's ability to attract and retain employees may be compromised.
Loss of a quorum of the TVA Board could limit TVA's ability to adapt to meet changing business conditions.
Under the TVA Act, a quorum of the TVA Board is five members. Becoming a member of the TVA Board requires confirmation by the U.S. Senate following appointment by the President. Further, the President may remove TVA Board members, and the TVA Board members may not continue in office indefinitely until a successor is appointed. As a result, a delay in the appointment or confirmation of directors, or the removal of directors by the President, can threaten the TVA Board's quorum. The TVA Board is responsible for, among other things, establishing the rates TVA charges for power as well as TVA's long-term objectives, policies, and plans. Accordingly, loss of a quorum for an extended period of time would impair TVA's ability to change rates and to modify these objectives, policies, and plans. Such an impairment would likely have a negative impact on TVA's ability to respond to significant changes in technology, the regulatory environment, or the industry overall and, in turn, negatively affect TVA's cash flows, results of operations, financial condition, and reputation.
Changes in the membership of the TVA Board and TVA senior management could impact how TVA operates.
The TVA Board is comprised of up to nine part-time members serving staggered, five-year terms. One to two Board members' terms typically expire each year. In addition, there is always the possibility that one or more members of TVA's senior management may retire or otherwise leave TVA. The individuals filling either the TVA Board or senior management positions may wish to change how TVA operates in whole or in part. If the changes are not successful or TVA is not able to adapt properly to such changes, TVA's financial condition, results of operations, reputation, and relationship with customers could be negatively affected.
ACCOUNTING AND FINANCIAL REPORTING RISKS
TVA may be unable to use regulatory accounting for some or all costs.
TVA uses regulatory accounting to defer certain costs. To qualify for regulatory accounting, costs must meet certain accounting criteria and be approved for regulatory accounting treatment by the TVA Board in its capacity as TVA's regulator. If costs do not meet, or cease to meet, these criteria, or if the TVA Board disallows the treatment or ceases to be TVA's sole regulator in such areas, TVA may not be able to defer those costs. Such an inability to defer costs would likely have a substantial impact on TVA's financial condition and results of operations and could impact the timing and amounts of TVA's rate recovery. For a discussion of regulatory accounting, see Item 7, Management's Discussion and Analysis of Financial Condition and Results of Operations — Critical Accounting Estimates.
TVA's financial control system cannot guarantee that all control issues and instances of fraud or errors will be detected.
No financial control system, no matter how well designed and operated, can provide absolute assurance that the objectives of the control system are met, and no evaluation of financial controls can provide absolute assurance that all control issues and instances of fraud or errors can be detected. The design of any system of financial controls is based
in part upon certain assumptions about the likelihood of future events, and there can be no assurance that any design will succeed in achieving its stated goals under all potential future conditions, regardless of how remote.
GENERAL BUSINESS RISKS
TVA may not be able to implement its business strategy successfully.
TVA's financial condition and results of operations are largely dependent on the extent to which it can implement its business strategy successfully. TVA's strategy includes maintaining low rates, aligning operations and maintenance spending with revenues, being responsible stewards, living within its means, meeting reliability expectations, and providing a balanced portfolio, in light of TVA's new strategic priorities: powerful partnerships, people advantage, operational excellence, igniting innovation, and financial strength. This strategy is subject to business, economic, and competitive uncertainties and contingencies, many of which are beyond TVA’s control. Such uncertainties include customer energy-efficiency programs that are designed to reduce energy demand; energy-efficiency efforts by customers not related to TVA’s energy-efficiency programs; increased customer use of DER, such as solar panels and other technologies, which have become more cost competitive, with decreasing costs expected in the future, as well as the use of energy storage technologies; and macroeconomic factors impacting economic growth or contraction within TVA’s service territory, which could affect energy demand. If TVA is unable to successfully implement its business strategy, TVA’s financial condition and results of operations could be negatively affected. See Item 1, Business — Environmental Matters and Human Capital Management, Item 7, Management's Discussion and Analysis of Financial Condition and Results of Operations — Key Initiatives and Challenges, and Item 11, Executive Compensation — Compensation Discussion and Analysis for additional information regarding TVA's strategic objectives.
TVA's cost management efforts may not be successful.
TVA is continuing to improve operating efficiencies to offset any potential future reductions in power demand and maintain its rates, reputation, cash flows, results of operations, and financial condition. The failure to achieve or maintain cost reductions could adversely affect TVA's rates, reputation, cash flows, results of operations, and financial condition.
TVA's organizational structure may not adequately support TVA's anticipated business needs or enable it to meet the needs of its current or potential customers.
TVA has been modifying its organizational structure to better adapt to the forecasted economic environment. If TVA’sTVA's assumptions about either its forecasts or the proper internal structure of the company to meet the expected environment are inaccurate or if this structure does not adequately support TVA’sTVA's needs, TVA could face operational or financial challenges that could adversely affect TVA'sits cash flows, results of operations, and financial condition as well as TVA’sTVA's ability to attract or retain a skilled workforce and to meet the needs of its current or potential customers.
TVA may have difficulty in adapting its business model to changes in the utility industry and customer preferences.
The traditional business model for power production, selling power from centrally located plants, is facing pressure from a variety of sources, including the potential for self-generation by current or potential customers, new technologies such as energy storage, and increased energy efficiency. These pressures may reduce the demand for TVA power. If TVA does not or cannot adapt to this pressure by adequately changing its business model, TVA’sTVA's financial condition and results of operations could be negatively affected.
TVA's quasi-governmental status may interfere in its ability to quickly respond to the needs of its current or potential customers or to act solely in the interest of its ratepayers.
As a quasi-governmental entity, TVA has certain legal requirements that prevent it from responding as quickly to potential changes in the market or requests from current or potential customers as might be desired. For example, TVA is required to comply with the National Environmental Policy Act ("NEPA"), which requires environmental reviews to be performed in connection with certain projects. The delay in responding to requests could damage relationships with current customers, deter potential customers from moving into TVA’s service territory, or damage TVA’s reputation.
In addition, TVA’s nature as a quasi-governmental entity imposes additional pressures that most companies do not face, such as the requirement to support economic development and promote recreational opportunities. TVA must balance these obligations with the requirement to provide power at the least system cost. If TVA does not adequately communicate how it fulfills its various missions and the value it provides, its reputation may be harmed, which may result in political pressure to change its nature or operations as well as in the loss of public support.
TVA's reputation may be negatively impacted.
As with any company, TVA's reputation is a vital element of its ability to effectively conduct its business. TVA's reputation could be harmed by a variety of factors, including the failure of a generating asset or supporting infrastructure, failure to effectively manage land and other natural resources entrusted to TVA, failure to meet its carbon reduction goals or other environmental, social, or governance goals, real or perceived violations of environmental regulations, including those related to climate change, real or perceived issues with TVA’sTVA's safety culture or work environment, inability to meet its human capital management goals, significant delays in construction projects, cyber attacks or security vulnerabilities, acts or omissions of TVA management, acts or omissions of a contractor or other third-party working with or for TVA, the perception of such acts or omissions, measures taken to offset reductions in demand, or a significant dispute with one of TVA's customers. Any deterioration in TVA's reputation may harm TVA's relationships with its customers and stakeholders, may increase TVA'sits cost of doing business, may interfere with its ability to attract and retain a skilled workforce, and may potentially lead to the enactment of new laws and regulations, or the modification of existing laws and regulations, that negatively affect the way TVA conducts its business.
Failure to attract and retain an appropriately qualified workforce may negatively affect TVA's results of operations.
TVA's business depends on its ability to recruit and retain key executive officers as well as skilled professional and technical employees. The inability to attract and retain an appropriately qualified workforce could adversely affect TVA's ability to, among other things, operate and maintain generation and transmission facilities, complete large construction projects, and successfully implement its continuous improvement initiatives.
Loss of a quorum of the TVA Board could limit TVA's ability to adapt to meet changing business conditions.
Under the TVA Act, a quorum of the TVA Board is five members. Becoming a member of the TVA Board requires confirmation by the U.S. Senate following appointment by the President. Further, TVA Board members may not continue in office indefinitely until a successor is appointed. The TVA Board is responsible for, among other things, establishing the rates TVA charges for power as well as TVA's long-term objectives, policies, and plans. Accordingly, loss of a quorum for an extended period of time would impair TVA's ability to change rates and to modify these objectives, policies, and plans. Such an impairment would likely have a negative impact on TVA's ability to respond to significant changes in technology, the regulatory environment, or the industry overall and, in turn, negatively affect TVA's cash flows, results of operations, and financial condition.
Changes in the membership of the TVA Board and TVA senior management could impact how TVA operates.
The TVA Board currently has three open positions and may have two more in the near future. In addition, there is always the possibility that one or more members of TVA’s senior management may retire or otherwise leave TVA. The individuals filling either the TVA Board or senior management positions may wish to change how TVA operates in whole or in part. If the changes are not successful or TVA is not able to adapt properly to such changes, TVA’s financial condition, results of operations, reputation, or relationship with customers could be harmed.
ITEM 1B. UNRESOLVED STAFF COMMENTS
Not applicable.
ITEM 2. PROPERTIES
TVA holds personal property in its own name but holds real property as agent for the United States.U.S. TVA may acquire real property as an agent of the United StatesU.S. by negotiated purchase or by eminent domain.
Generating Properties
At September 30, 2017,2021, TVA-operated generating assets consisted of 33seven nuclear units, 25 active coal-fired units, 7 nuclear86 simple-cycle units, one cogeneration unit, 14 combined-cycle power blocks, 109 conventional hydroelectric units, 4four pumped-storage hydroelectric units, 15 combined-cycle power blocks, 87 simple-cycle units, 5five diesel generator units, one wind energy site (out of service), and 1613 solar sites. See Note 13 — Lease/Leasebacks. In addition, TVA has biomass cofiring potential at its coal-fired sites.installations. As of September 30, 2017, 242021, eight of the simple-cycle combustion turbine units and four of the combined-cycle power blocks were leased to privatespecial purpose entities ("SPEs") and leased back to TVA under long-term leases. See Note 11 — Variable Interest Entities and Note 14 — Debt and Other Obligations — Lease/Leasebacks. In addition, TVA is leasing the three Caledonia combined-cycle power blocks under a long-term lease. TVA is in the process of constructing additional generating assets. For a discussion of these assets, see Item 1, Business —Power Supply and Load Management Resources.
Net Capability
The following table summarizes TVA's summer net capability in megawatts ("MW")MW at September 30, 2017:2021: | | SUMMER NET CAPABILITY(1) At September 30, 2017 | |
SUMMER NET CAPABILITY(1) At September 30, 2021 | | SUMMER NET CAPABILITY(1) At September 30, 2021 |
Source of Capability | Location | | Number of Units | | Summer Net Capability (MW) | | Date First Unit Placed in Service (CY) | | Date Last Unit Placed in Service (CY) | Source of Capability | Location | | Number
of Units | | Summer Net Capability (MW) | | Date First Unit Placed in Service (CY) | | Date Last Unit Placed in Service (CY) |
| TVA-Operated Generating Facilities | | | | | | | |
| | |
| TVA-Operated Generating Facilities | | | | | | | | | |
| Nuclear | | | |
| | |
| | |
| | |
| Nuclear | | | | | | | | | |
| Browns Ferry | Alabama | | 3 |
| | 3,309 |
| | 1974 |
| | 1977 |
| Browns Ferry | Alabama | | 3 | | | 3,662 | | | 1974 | | 1977 |
| Sequoyah | Tennessee | | 2 |
| | 2,292 |
| | 1981 |
| | 1982 |
| Sequoyah | Tennessee | | 2 | | | 2,292 | | | 1981 | | 1982 |
| Watts Bar | Tennessee | | 2 |
| | 2,122 |
| | 1996 |
| | 2016 |
| Watts Bar | Tennessee | | 2 | | | 2,321 | | | 1996 | | 2016 |
| Total Nuclear | | | 7 |
| | 7,723 |
| | |
| | |
| Total Nuclear | | | 7 | | | 8,275 | | | | | |
| Coal-Fired | | | | | | | |
| | |
| Coal-Fired | | | | | | | | | |
Allen(2) | Tennessee | | 3 |
| | 741 |
| | 1959 |
| | 1959 |
| |
| Bull Run | Tennessee | | 1 |
| | 865 |
| | 1967 |
| | 1967 |
| Bull Run | Tennessee | | 1 | | | 765 | | | 1967 | | 1967 |
| Cumberland | Tennessee | | 2 |
| | 2,470 |
| | 1973 |
| | 1973 |
| Cumberland | Tennessee | | 2 | | | 2,470 | | | 1973 | | 1973 |
| Gallatin | Tennessee | | 4 |
| | 976 |
| | 1956 |
| | 1959 |
| Gallatin | Tennessee | | 4 | | | 976 | | | 1956 | | 1959 |
| Johnsonville | Tennessee | | 4 |
| | 428 |
| | 1951 |
| | 1959 |
| |
| Kingston | Tennessee | | 9 |
| | 1,398 |
| | 1954 |
| | 1955 |
| Kingston | Tennessee | | 9 | | | 1,298 | | | 1954 | | 1955 |
| Paradise | Kentucky | | 1 |
| | 971 |
| | 1963 |
| | 1970 |
| |
| | Shawnee | Kentucky | | 9 |
| | 1,206 |
| | 1953 |
| | 1955 |
| Shawnee | Kentucky | | 9 | | | 1,071 | | | 1953 | | 1955 |
| Total Coal-Fired | | | 33 | | 9,055 |
| | |
| | |
| Total Coal-Fired | | | 25 | | 6,580 | | | | | |
Natural Gas and/or Oil-Fired(4)(5) | | | |
| | |
| | |
| | |
| |
Natural Gas and/or Oil-Fired(2)(3) | | Natural Gas and/or Oil-Fired(2)(3) | | | | | | | | | |
| Simple-Cycle Combustion Turbine | | | | | | | | | Simple-Cycle Combustion Turbine | |
| Allen | Tennessee | | 20 |
| | 456 |
| | 1971 |
| | 1972 |
| Allen | Tennessee | | 20 | | | 456 | | | 1971 | | 1972 |
| Brownsville | Tennessee | | 4 |
| | 468 |
| | 1999 |
| | 1999 |
| Brownsville | Tennessee | | 4 | | | 456 | | | 1999 | | 1999 |
| Colbert | Alabama | | 8 |
| | 392 |
| | 1972 |
| | 1972 |
| Colbert | Alabama | | 8 | | | 392 | | | 1972 | | 1972 |
| Gallatin | Tennessee | | 8 |
| | 642 |
| | 1975 |
| | 2000 |
| Gallatin | Tennessee | | 8 | | | 612 | | | 1975 | | 2000 |
| Gleason | Tennessee | | 3 |
| | 500 |
| | 2000 |
| | 2000 |
| Gleason | Tennessee | | 3 | | | 485 | | | 2000 | | 2000 |
| Johnsonville | Tennessee | | 20 |
| | 1,269 |
| | 1975 |
| | 2000 |
| Johnsonville | Tennessee | | 19 | | | 1,088 | | | 1975 | | 2000 |
| Kemper | Mississippi | | 4 |
| | 348 |
| | 2002 |
| | 2002 |
| Kemper | Mississippi | | 4 | | | 312 | | | 2002 | | 2002 |
| Lagoon Creek | Tennessee | | 12 |
| | 1,048 |
| | 2001 |
| | 2002 |
| Lagoon Creek | Tennessee | | 12 | | | 932 | | | 2001 | | 2002 |
| Marshall County | Kentucky | | 8 |
| | 608 |
| | 2002 |
| | 2002 |
| Marshall County | Kentucky | | 8 | | | 592 | | | 2002 | | 2002 |
| Subtotal Simple-Cycle Combustion Turbine | | | 87 |
| | 5,731 |
| | |
| | |
| Subtotal Simple-Cycle Combustion Turbine | | | 86 | | | 5,325 | | | | | |
| Combined-Cycle Combustion Turbine | | | | | | | | | Combined-Cycle Combustion Turbine | |
Ackerman(6) | Mississippi | | 1 |
| | 713 |
| | 2007 |
| | 2007 |
| |
Caledonia(7) | Mississippi | | 3 |
| | 765 |
| | 2003 |
| | 2003 |
| |
John Sevier(8) | Tennessee | | 1 |
| | 871 |
| | 2012 |
| | 2012 |
| |
Lagoon Creek(9) | Tennessee | | 1 |
| | 525 |
| | 2010 |
| | 2010 |
| |
Ackerman(4) | | Ackerman(4) | Mississippi | | 1 | | | 713 | | | 2007 | | 2007 |
Allen(5) | | Allen(5) | Tennessee | | 1 | | | 1,106 | | | 2018 | | 2018 |
Caledonia(6) | | Caledonia(6) | Mississippi | | 3 | | | 765 | | | 2003 | | 2003 |
John Sevier(7) | | John Sevier(7) | Tennessee | | 1 | | | 871 | | | 2012 | | | 2012 | |
Lagoon Creek(8) | | Lagoon Creek(8) | Tennessee | | 1 | | | 525 | | | 2010 | | 2010 |
| Magnolia | Mississippi | | 3 |
| | 918 |
| | 2003 |
| | 2003 |
| Magnolia | Mississippi | | 3 | | | 918 | | | 2003 | | 2003 |
| Paradise | Kentucky | | 3 |
| | 1,100 |
| | 2017 |
| | 2017 |
| |
Paradise(9) | | Paradise(9) | Kentucky | | 1 | | | 1,100 | | | 2017 | | 2017 |
| Southaven | Mississippi | | 3 |
| | 780 |
| | 2003 |
| | 2003 |
| Southaven | Mississippi | | 3 | | | 780 | | | 2003 | | 2003 |
| Subtotal Combined-Cycle Combustion Turbine | | 15 |
| | 5,672 |
| | | | | Subtotal Combined-Cycle Combustion Turbine | | 14 | | | 6,778 | | |
| Co-Generation | | Co-Generation | |
| Johnsonville | | Johnsonville | Tennessee | | 1 | | | 80 | | | 1975 | | 2000 |
| Total Natural Gas and/or Oil-Fired | | 102 |
| | 11,403 |
| | | | | Total Natural Gas and/or Oil-Fired | | 101 | | | 12,183 | | |
| Hydroelectric | | | |
| | |
| | |
| | |
| Hydroelectric | | | | | | | | | |
| Conventional Plants | Alabama | | 36 |
| | 1,176 |
| | 1925 |
| | 1962 |
| Conventional Plants | Alabama | | 36 | | | 1,176 | | | 1925 | | 1962 |
| | Georgia | | 2 |
| | 35 |
| | 1931 |
| | 1956 |
| | Georgia | | 2 | | | 35 | | | 1931 | | 1956 |
| | Kentucky | | 5 |
| | 223 |
| | 1944 |
| | 1948 |
| | Kentucky | | 5 | | | 223 | | | 1944 | | 1948 |
| | North Carolina | | 6 |
| | 492 |
| | 1940 |
| | 1956 |
| | North Carolina | | 6 | | | 492 | | | 1940 | | 1956 |
| | Tennessee | | 60 |
| | 1,851 |
| | 1912 |
| | 1972 |
| | Tennessee(10) | | 60 | | | 1,824 | | | 1912 | | 1972 |
Pumped-Storage(3) | Tennessee | | 4 |
| | 1,616 |
| | 1978 |
| | 1979 |
| |
Pumped-Storage(11) | | Pumped-Storage(11) | Tennessee | | 4 | | | 1,635 | | | 1978 | | 1979 |
| Total Hydroelectric | | | 113 |
| | 5,393 |
| | |
| | |
| Total Hydroelectric | | | 113 | | | 5,385 | | | | | |
| Diesel Generator | | | |
| | |
| | |
| | |
| Diesel Generator | | | | | | | | | |
| Meridian | Mississippi | | 5 |
| | 9 |
| | 1998 |
| | 1998 |
| Meridian | Mississippi | | 5 | | | 9 | | | 1998 | | 1998 |
| Total Diesel Generators | | | 5 |
| | 9 |
| | |
| | |
| |
TVA Renewable Resources (non-hydro)(10) | | | |
| | 1 |
| | |
| | |
| |
TVA Non-hydro Renewable Resources(12) | | TVA Non-hydro Renewable Resources(12) | | | | | 1 | | | | | |
| Total TVA-Operated Generating Facilities | | | |
| | 33,584 |
| | |
| | |
| Total TVA-Operated Generating Facilities | | | | 32,433 | | | | | |
Contract Renewable Resources(11)(12) | | | |
| | 217 |
| | |
| | |
| |
Power Purchase and Other Agreements(13) | | | |
| | 3,621 |
| | |
| | |
| |
Contract Renewable Resources(13) | | Contract Renewable Resources(13) | | | | | 326 | | | | | |
Power Purchase and Other Agreements - Renewable(14) | | Power Purchase and Other Agreements - Renewable(14) | | 2,009 | | |
Power Purchase and Other Agreements - Nonrenewable(14) | | Power Purchase and Other Agreements - Nonrenewable(14) | | | | 3,128 | | | | | |
| Total Summer Net Capability | | | |
| | 37,422 |
| | |
| | |
| Total Summer Net Capability | | | | | 37,896 | | | |
Notes
(1) Net capability is defined as the ability of an electric system, generating unit, or other system component to carry or generate power for a specified time period
and does not include operational limitations such as derates.
(2) Eight MW of cofired methane at Allen are presented as coal generation as opposed to TVA Renewable Resources.
(3) See Item 1, Business —Power Supply and Load Management Resources—Hydroelectric and Other Renewable Energy Resources —Conventional Hydroelectric Dams for a discussion of Hiwassee Hydro Unit 2.
(4) See Generating Properties above for a discussion of TVA-operated natural gas and/or oil-fired facilities subject to leaseback and long-term lease arrangements.
(5) Peak(3) As of September 30, 2021, 326 MW of peak firing short-term capability of simple-cycle combustion turbine units accountswas not operational and would require additional
investment for 326 MW ofdependable use; therefore, this short-term capability.capability is not presented in the table above.
(6)(4) Ackerman Combined Cycle Facility is a single steam cycle unit driven by two gas turbines (2x1 configuration).
(7)(5) Allen Combined Cycle Facility is a single steam cycle unit driven by two gas turbines (2x1 configuration).
(6) Caledonia Combined Cycle Plant ("Caledonia CC") is currently a leased facility operated by TVA.
(8)(7) John Sevier Combined Cycle Facility ("John Sevier CCF") is a single steam cycle unit driven by three gas turbines (3x1 configuration).
(9)(8) Lagoon Creek Combined Cycle Facility is a single steam cycle unit driven by two gas turbines (2x1 configuration).
(9) Paradise Combined Cycle Facility is a single steam cycle unit driven by three gas turbines (3x1 configuration).
(10) Includes 86 MW of summer net capability associated with Hiwassee Hydro Unit 2. See Item 1, Business — Power Supply and Load Management Resources — Conventional Hydroelectric Dams.
(11) See Item 1, Business —Power Supply and Load Management Resources—Raccoon Mountain Pumped-Storage Plant for a discussion of Raccoon Mountain Pumped-Storage Plant.
(12) TVA owns approximately 1 MW of solar installations at 16 sites.capability among 13 solar installations.
(11)(13) Contract Renewable Resources include Generation Partners, Green Power Providers, Renewable Standard Offer,is capability from various historical renewable energy programs that consist of PPAs primarily with individuals and Solar Solutions Initiative.small businesses.
(12) Solar and wind resources are listed at nameplate capacity.
(13) Power Purchase and Other Agreements includes renewable resources.(14) See Item 1, Business — Power Supply and Load Management Resources — Purchased Power Purchase and Other Agreements for information on renewable and non-renewable energy power purchase contracts.
Transmission Properties
TVA’sTVA's transmission system interconnects with systems of surrounding utilities and consisted primarily of the following assets at September 30, 2017:2021:
•Approximately 2,500 circuit miles of 500 kilovolt, 11,60011,900 circuit miles of 161 kilovolt, and 2,1002,000 circuit miles of other voltage transmission lines;
513•4,048 miles of fiber optic lines;
•522 transmission substations, power switchyards, and switching stations; and
1,304•1,325 customer connection points (customer, generation, and interconnection).
At September 30, 2017,2021, certain qualified technological equipment and other software ("QTE") related to TVA’sTVA's transmission system were leased to private entities and leased back to TVA under long-term leases. See Note 13 14 — Debt and Other Obligations — Lease/LeasebacksandNote 23 — Commitments and Contingencies — Commitments— Leasebacks.
Natural Resource Stewardship Properties
TVA operates and maintains 49 dams and manages the following natural resource stewardship properties:
•Approximately 11,000 miles of reservoir shoreline;
•Approximately 293,000 acres of reservoir land;
•Approximately 650,000 surface acres of reservoir water; and
•Approximately 80100 public recreation areas throughout the Tennessee Valley, including campgrounds, day-use areas, and boat launching ramps.
Additionally, TVA manages over 170 agreements for commercial recreation (such as campgrounds and marinas).
As part of its stewardship responsibilities, TVA approval is required to be obtained before any obstruction affecting navigation, flood control, or public lands can be constructed in or along the Tennessee River and its tributaries. These public lands and waters managed by TVA provide both conservation and responsible recreation.
Buildings
TVA has a variety of buildings and structures located throughout its service area including generation and transmission facilities, corporate offices, customer service centers, power service centers, warehouses, visitor centers, and crew quarters. The mostTwo significant of these buildings are its Knoxville Office Complex ("KOC") and the Chattanooga Office Complex in Tennessee as well as a significant number of buildings in Muscle Shoals, Alabama. In 2013, Tennessee.
TVA initiated acontinues to study of its real estateproperty portfolio foras part of the purpose ofStrategic Real Estate Plan, which is aimed at reducing
cost, right-sizing the portfolio, and aligning its real estate with TVA’s strategic direction over the next 10 to 20 years. As part of this effort, TVA plans to draft and implement a strategy to further reduce its Muscle Shoals property, including the disposition of 970 acres approved by the TVA Board, which it actively began marketing in 2017. TVA also completed a comprehensive assessment of its real estate holdings inwith TVA's strategic direction. In addition, as TVA continues to
implement mandatory telework for those who do not have to be physically present during the Knoxville region in 2016, includingCOVID-19 pandemic, it is also
assessing and reviewing the KOC and the adjacent Summer Place Complex ("SPC"). As a result of this study and a subsequent environmental assessment in 2017, TVA is planningpandemic's long-term impacts to consolidate most of its Knoxville area employees into one location in the West Tower of the KOC and plans to convey the SPC and the East Tower of the KOC. Evaluation of the real estate portfolio is continuing.estate.
Disposal of Property
Under the TVA Act, TVA has broad authority to dispose of personal property but only limited authority to dispose of real property. TheTVA's primary, but not exclusive, sources of TVA's authority to dispose of real property areis briefly described below:
Under Section 31 of the TVA Act, •TVA has authority to dispose of surplus real property at a public auction;
•TVA Act, TVA canmay dispose of real property for certain specified purposes, including providing replacement lands for certain entities whose lands were flooded or destroyed by dam or reservoir
construction, providing real property for recreational use, and to grantgranting easements and rights-of-way upon which are located transmission or distribution lines; and
Under Section 15d(g) of the TVA Act, •TVA can dispose of real property in connection with the construction of generating plants or other facilities under certain circumstances.circumstances; and
Additionally, under 40 U.S.C. § 1314, •TVA has authority to grant easements for rights-of-way and other purposes.
The Basic Tennessee Valley Authority Power Bond Resolution adopted by the TVA Board on October 6, 1960, as amended on September 28, 1976, October 17, 1989, and March 25, 1992 (the "Basic Resolution"), prohibits TVA from mortgaging any part of its power properties and from disposing of all or any substantial portion of these properties unless TVA provides for a continuance of the interest, principal, and sinking fund payments due and to become due on all outstanding Bonds, or for the retirement of such Bonds.
Bellefonte Nuclear Plant. On November 14,Knoxville Property. In 2016, followingTVA completed a public auction, TVA entered into a contract to sell substantially allcomprehensive assessment of its Bellefonte site to Nuclear Development, LLC for $111 million. Nuclear Development, LLC paid TVA $22
million on November 14, 2016, with the remaining $89 million due at closing. Nuclear Development, LLC has up to two years from November 14, 2016, to close on the property, and TVA will maintain the site until then. The closing is subject to, among other conditions, a determination by TVA's Chief Executive Officer that potential environmental impacts have been appropriately addressed or are acceptable. TVA's CEO made this determination in the affirmative on August 10, 2017. See Note 7 — Deferred Nuclear Generation Units.
Muscle Shoals Property. In alignment with its strategic direction of right-sizing its real estate portfolio, TVA has drafted a strategy to further reduce a significant number of buildings and propertyholdings in Muscle Shoals, Alabama,the Knoxville, Tennessee region including the dispositionKOC and adjacent Summer Place Complex ("SPC"). As a result of 900 acresthis study and a subsequent Environmental Assessment in 2017, TVA consolidated its Knoxville area employees into the West Tower of the 970 acres approved byKOC and the TVA BoardGreenway Drive Transmission Service Center in 2012. Active marketing efforts began2020. Consolidation of the centralized field offices in March 2017,Norris, Tennessee and TVA is receiving interestadditional consolidations from local groups with the abilityGreenway Area Office are expected to promote local economic growthbe completed in the area. Depending on interest, TVA plans to auction the 900 acres.early 2022.
ITEM 3. LEGAL PROCEEDINGS
From time to time, TVA is party to or otherwise involved in lawsuits, claims, proceedings, investigations, and other legal matters ("Legal Proceedings") that have arisen in the ordinary course of conducting TVA’sits activities, as a result of catastrophic events or otherwise. While the outcome of the Legal Proceedings to which TVA is a party cannot be predicted with certainty, any adverse outcome to a Legal Proceeding involving TVA may have a material adverse effect on TVA’s cash flows,TVA's financial condition, results of operations, and financial condition.cash flows.
For a discussion of Legal Proceedings involving TVA, see Note 823 — Commitments and Note 21Contingencies —Legal Proceedings, which discussions arediscussion is incorporated by reference into this Item 3.
ITEM 4. MINE SAFETY DISCLOSURES
Not applicable.
PART II
ITEM 5. MARKET FOR REGISTRANT’SREGISTRANT'S COMMON EQUITY, RELATED STOCKHOLDER MATTERS AND ISSUER PURCHASES OF EQUITY SECURITIES
Not applicable.
ITEM 6. SELECTED FINANCIAL DATA
The following selected financial data for the years 2013 through 2017 should be read in conjunction with the audited financial statements and notes thereto (collectively, the "Consolidated Financial Statements") presented in Item 8, Financial Statements and Supplementary Data. Certain reclassifications have been made to the 2013, 2014, and 2015 financial statement presentations to conform to the 2016 and 2017 presentations.
|
| | | | | | | | | | | | | | | | | | | |
Selected Financial Data(1)(2) For the years ended, or at, September 30 (dollars in millions) |
| | 2017 | | 2016 | | 2015 | | 2014 | | 2013 |
| Sales (millions of kWh) | 152,362 |
| | 155,855 |
| | 158,163 |
| | 158,057 |
| | 161,925 |
|
| | | | | | | | | | |
Peak load (MW)(3) | 29,899 |
| | 29,824 |
| | 32,751 |
| | 33,352 |
| | 28,726 |
|
| | | | | | | | | | |
| Operating revenues | $ | 10,739 |
| | $ | 10,616 |
| | $ | 11,003 |
| | $ | 11,137 |
| | $ | 10,956 |
|
| | | | | | | | | | |
| Fuel expense | $ | 2,169 |
| | $ | 2,126 |
| | $ | 2,444 |
| | $ | 2,730 |
| | $ | 2,820 |
|
| | | | | | | | | | |
| Purchased power expense | $ | 991 |
| | $ | 964 |
| | $ | 950 |
| | $ | 1,094 |
| | $ | 1,027 |
|
| | | | | | | | | | |
| Operating and maintenance expense | $ | 3,362 |
| | $ | 2,842 |
| | $ | 2,838 |
| | $ | 3,341 |
| | $ | 3,428 |
|
| | | | | | | | | | |
| Net interest expense | $ | 1,346 |
| | $ | 1,136 |
| | $ | 1,133 |
| | $ | 1,169 |
| | $ | 1,226 |
|
| | | | | | | | | | |
| Net income | $ | 685 |
| | $ | 1,233 |
| | $ | 1,111 |
| | $ | 469 |
| | $ | 271 |
|
| | | | | | | | | | |
| Construction expenditures | $ | 2,153 |
| | $ | 2,710 |
| | $ | 2,850 |
| | $ | 2,384 |
| | $ | 2,051 |
|
| | | | | | | | | | |
| Total assets | $ | 50,017 |
| | $ | 50,494 |
| | $ | 48,745 |
| | $ | 45,514 |
| | $ | 46,015 |
|
| | | | | | | | | | |
| Financial obligations | |
| | |
| | |
| | |
| | |
|
Long-term debt, net(4) | | | | | | | | | |
| Long-term power bonds, net | $ | 20,205 |
| | $ | 20,901 |
| | $ | 22,617 |
| | $ | 21,880 |
| | $ | 22,239 |
|
| Long-term debt of variable interest entities, net | $ | 1,164 |
| | $ | 1,199 |
| | $ | 1,233 |
| | $ | 1,265 |
| | $ | 1,296 |
|
| Long-term notes payable | $ | 69 |
| | $ | 48 |
| | $ | — |
| | $ | — |
| | $ | — |
|
| Total long-term debt, net | $ | 21,438 |
| | $ | 22,148 |
| | $ | 23,850 |
| | $ | 23,145 |
| | $ | 23,535 |
|
| | | | | | | | | | |
Current debt, net(4) | | | | | | | | | |
| Short-term debt, net | $ | 1,998 |
| | $ | 1,407 |
| | $ | 1,034 |
| | $ | 596 |
| | $ | 2,432 |
|
| Current maturities of power bonds | $ | 1,728 |
| | $ | 1,555 |
| | $ | 32 |
| | $ | 1,032 |
| | $ | 32 |
|
| Current maturities of long-term debt of variable interest entities | $ | 36 |
| | $ | 35 |
| | $ | 33 |
| | $ | 32 |
| | $ | 30 |
|
| Current maturities of notes payable | $ | 53 |
| | $ | 27 |
| | $ | — |
| | $ | — |
| | $ | — |
|
| Total current debt, net | $ | 3,815 |
| | $ | 3,024 |
| | $ | 1,099 |
| | $ | 1,660 |
| | $ | 2,494 |
|
| | | | | | | | | | |
Total debt(4) | $ | 25,253 |
| | $ | 25,172 |
| | $ | 24,949 |
| | $ | 24,805 |
| | $ | 26,029 |
|
| | | | | | | | | | |
Capital leases(5) | $ | 187 |
| | $ | 181 |
| | $ | 105 |
| | $ | 109 |
| | $ | 43 |
|
| | | | | | | | | | |
| Leaseback obligations | $ | 339 |
| | $ | 467 |
| | $ | 616 |
| | $ | 691 |
| | $ | 761 |
|
| | | | | | | | | | |
| Energy prepayment obligations | $ | 110 |
| | $ | 210 |
| | $ | 310 |
| | $ | 410 |
| | $ | 510 |
|
Notes
(1) See Item 7, Management’s Discussion and Analysis of Financial Condition and Results of Operations for a description of certain items in 2017, 2016, and 2015 affecting results in those years.
(2) See Item 1A, Risk Factors and Note 21 for a discussion of risks and contingencies that could affect TVA’s future financial results.
(3) TVA met an all-time summer peak demand of 33,482 MW on August 16, 2007, at 102 degrees Fahrenheit and an all-time winter peak demand of 33,352 MW on January 24, 2014, at 7.3 degrees Fahrenheit.
(4) See Note 10 and Note 13— Debt Outstanding.
(5) Included in Accounts payable and accrued liabilities and Other long-term liabilities on the consolidated balance sheets.
ITEM 7. MANAGEMENT’SMANAGEMENT'S DISCUSSION AND ANALYSIS OF FINANCIAL CONDITION AND RESULTS OF OPERATIONS
(Dollars in millions except where noted)
The following Management’sManagement's Discussion and Analysis of Financial Condition and Results of Operations ("MD&A") is intended to help the reader understand the Tennessee Valley Authority ("TVA"), its financial condition, results of operations, and cash flows, and its present business environment. The MD&A is provided as a supplement to, and should be read in conjunction with, TVA's consolidated financial statements and the accompanying notes thereto contained in Item 8, Financial Statements and Supplementary Data of this Annual Report on Form 10-K for the fiscal year ended September 30, 20172021 (the "Annual Report"). See Item 7, Management's Discussion and Analysis of Financial Condition and Results of Operations in TVA's Annual Report on Form 10-K for the year ended September 30, 2020, filed with the Securities and Exchange Commission ("SEC") on November 16, 2020, for a discussion of variance drivers for the year ended September 30, 2020, as compared to the year ended September 30, 2019. The MD&A includes the following sections:
•Business and Mission -— a general description of TVA's business, objectives, strategic priorities, and core capabilities;
•Executive Overview -— a general overview of TVA's activities and results of operations for 2017;2021;
•Results of Operations -— an analysis of TVA's consolidated results of operations for the three years presented in its consolidated financial statements;2020 and 2021;
•Liquidity and Capital Resources -— an analysis of cash flows, a description of aggregate contractual obligations, and an overview of financial position;
•Key Initiatives and Challenges -— an overview of current and future initiatives and challenges facing TVA;
•Critical Accounting Policies and Estimates -— a summary of accounting policiessignificant estimates, judgements, and assumptions that require critical judgmentseffect the amounts reported in the consolidated financial statements and estimates;accompanying notes;
Fair Value Measurements - a description of TVA's investments and derivative instruments and valuation considerations;
•Legislative and Regulatory Matters -— a summary of laws and regulations that may impact TVA; and
•Risk Management Activities -— a description of TVA's risk governance and exposure to various market risks.
Business and Mission
Business
TVA operates the nation's largest public power system. At September 30, 2017,2021, TVA provided electricity to approximately 50 large industrial57 directly served customers, which include seven federal agency customers, and 154153 local power company customers of TVA ("LPCs") that serve over nineapproximately 10 million people in parts of seven southeastern states. TVA generates nearly all of its revenues from the sale of electricity, and in 20172021 revenues from the sale of electricity totaled $10.6$10.4 billion. As a wholly-owned agency and instrumentality of the United States ("U.S."), however, TVA differs from other electric utilities in a number of ways:
•TVA is a government corporation.
•The area in which TVA sells power is limited by the Tennessee Valley Authority Act of 1933, as amended (the “TVA Act”"TVA Act"), under a provision known as the “fence”"fence"; however, another provision of federal law known as the “anti-cherrypicking” provisionAnti-Cherrypicking Amendment ("ACPA") generally protects TVA from being forced to provide access to its transmission lines to others for the purpose of delivering power to customers within substantially all of TVA's defined service area.
•The rates TVA charges for power are set solely by the TVA Board of Directors (the "TVA("TVA Board") and are not set or reviewed by another entity, such as a public utility commission. In setting rates, however, the TVA Board is charged by the TVA Act to have due regard for the primary objectives of the TVA Act, including the objective that power be sold at rates as low as feasible.
•TVA is not authorized to raise capital by issuing equity securities. TVA relies primarily on cash from operations and proceeds from power program borrowings to fund its operations and is authorized by the TVA Act to issue bonds, notes, or other evidences of indebtedness ("Bonds"(collectively, "Bonds") in an amount not to exceed $30.0 billion
outstanding at any given time. Although TVA's operations were originally funded primarily with appropriations from Congress, TVA has not received any appropriations from Congress for any activities since 1999 and, as directed by Congress, has funded essential stewardship activities primarily with power revenues.
TVA's Mission of Service
TVA was built for the people, created by Congress,federal legislation, and charged with a unique mission - to improve the quality of life in a seven-state region through the integrated management of the region’sregion's resources. TVA's mission focuses on three key areas:
|
| | | | | | | |
| ENERGY | ENVIRONMENT | ECONOMIC DEVELOPMENT |
•Energy -— Delivering affordable, reliable, power;low cost, clean energy;
•Environment -— Caring for the region's natural resources; and
•Economic Development -— Creating sustainable economic growth.
While TVA's mission has not changed since it was established in 1933, the climate in which TVA operates continues to evolve. The business and economic environment has become more challenging due to economic conditions,conditions; tougher environmental standards,standards; and the need to diversify its power supply and adapt to changing customer usage behaviors, new technologies, and emerging, non-traditional competition. To continue TVA’sto deliver its mission of service itwhile evolving for future success, TVA must realize fourfive strategic imperatives through people performance excellence:priorities, which are comprised of several strategic elements each:
Rates - Maintain low rates;
Stewardship - Be responsible stewards;
Debt - Live within its means;
Asset Portfolio - Meet reliability expectations and provide a balanced portfolio; and
People Performance Excellence - Continuously improve, empower, and engage employees.
| | | | | | | | | | | | | | | | | | | | | | | | | | |
| | | | | | | | |
| | | | | | | | |
| Enhance our Role as a Community Leader and Trusted Partner | | Create a Culture that Lives up to TVA's Values | | Nation’s Top Nuclear Fleet by 2025 | | Advance Energy Transformation in the Valley through Innovation | | Deliver Value to Enhance Prosperity in the Valley |
| Champion the Unique Value of the Valley Public Power Model | | Accelerate the Impact of Inclusion with Diversity within TVA and the Communities TVA Serves | | Evolve TVA's Reliable and Clean Energy Supply into the Energy System of the Future | | Establish a Focused Innovation Framework and Mindset | | Balance Commitments & Obligations |
| Region’s Top Choice for Business and Industry | | | | Lead the Industry in Cost-effective Carbon Reduction | | | | Develop Long-Term Business Model |
| Meet Resource and Environmental Stewardship Commitments | | | | Build the Integrated and Reliable Grid of Tomorrow | | | | Achieve Sustainable Debt Level |
TVA’s TVA's mission sets the stage for its strategic planning process that includes strategic objectives, initiatives, and scorecards for performance designed to provide clear direction for improving TVA's core business.
Linking the Mission to Performance
TVA has formulated key performance measures to support its strategic imperatives.priorities. The intent of these measures is to align employees to TVA’sTVA's mission by focusing its collective efforts on operational excellence, fiscal responsibility, and economic development, and environmental stewardship. The measures are designed to promote teamwork, encourage high performance behaviors, and motivate TVA employees to achieve goals aligned with TVA’sTVA's mission and values. The 20172021 corporate results compared with targets for these key measures are reflected in the chart below.below, in addition to the 2022 approved corporate measures. See Item 11, Executive Compensation — Compensation Discussion and Analysis for information regarding how the measures are calculated.
| | | | | | | | | | | | | | | | | |
| 2021 Corporate Measure | Weight | Actual | Threshold | Target | Stretch |
| TVA total spending ($ millions) | 40% | $ | 5,144 | | $ | 5,488 | | $ | 5,333 | | $ | 5,178 | |
| Load not served (system minutes) | 30% | 3.2 | | 4.6 | | 3.9 | | 3.4 | |
| Annualized nuclear unit capability factor (%) | 15% | 90.5 | % | 89.5 | % | 90.2 | % | 91.9 | % |
| Combined cycle equivalent availability factor (%) | 10% | 85.3 | % | 75.9 | % | 80.9 | % | 85.8 | % |
| Coal equivalent availability factor (%) | 5% | 71.6 | % | 59.0 | % | 64.0 | % | 82.1 | % |
|
| | | | | |
| Corporate Measure | Weight | Actual | Threshold | Target | Stretch |
| Load not served (system minutes) | 20% | 4.3% | 4.7% | 3.9% | 3.4% |
| TVA total spending ($ millions) | 25% | $4,917 | $5,675 | $5,508 | $5,341 |
| Nuclear unit capability factor (UCF) (%) | 25% | 90.7% | 89.8% | 90.3% | 90.8% |
| Coal seasonal equivalent forced outage rate (%) | 10% | 14.5% | 5.9% | 4.6% | 4.1% |
| Combined cycle seasonal equivalent forced outage rate (%) | 10% | 3.2% | 2.4% | 1.5% | 0.9% |
| Project Milestones (%) | 10% | 100.0% | 93% | 96% | 100% |
| | | | | | | | | | | | | | | | | |
| 2022 Corporate Measure | Weight | | Threshold | Target | Stretch |
| TVA total spending ($ millions) | 40% | | | Budget | |
| Load not served (system minutes) | 30% | | 4.5 | | 3.9 | | 3.2 | |
| Annualized nuclear online reliability loss factor (%) | 15% | | 3.73 | % | 2.71 | % | 1.69 | % |
| Combined cycle equivalent availability factor (%) | 10% | | 77.6 | % | 82.6 | % | 84.9 | % |
| Coal equivalent availability factor (%) | 5% | | 58.2 | % | 63.2 | % | 69.6 | % |
Executive Overview
TVA’s net incomeTVA's operating revenues were $10.5 billion and $10.2 billion for the years ended September 30, 20172021 and 2016, was $685 million and $1.2 billion,2020, respectively. Sales of electricity decreased slightlyOperating revenues increased for the year ended September 30, 2017,2021 as compared to the prior year, primarily as TVA experienced milder weather for mucha result of 2017. The decreasehigher energy sales and an increase in sales was drivenfuel cost recovery revenue attributable to higher fuel rates. These increases were partially offset by lower saleseffective rates primarily from the Pandemic Relief Credit that the TVA Board approved in 2020, which was in effect for 2021. The 2.5 percent monthly base rate credit, applied to service provided to TVA's local power company customers ("LPCs") who are more weather sensitive, their large commercial and was partially offset by sales to industrial customers, and TVA's directly served customers. For the year ended September 30, 2021, these credits accounted for $221 million of a decrease to operating revenue. In August 2021, the TVA Board approved a 2.5 percent monthly base rate credit, the Pandemic Recovery Credit, which will be effective for 2022. The credit, expected to approximate $220 million, will also apply to service provided to TVA's LPCs, their large commercial and industrial customers, and TVA directly served customers.
Total operating expenses increased for a second year. Revenue from the sales of electricity increased $125$120 million for the year ended September 30, 2017, as compared to the prior year, due to higher fuel cost recoveries and an increase in non-fuel base rates. Operating and maintenance costs increased $520 million for the year ended September 30, 2017,2021 as compared to the prior year, primarily as a result of a $257 million increase in fuel and purchased power expense and a $170 million increase in operating and maintenance expense. The increase in fuel and purchased power expense was primarily due to higher effective fuel rates from higher natural gas prices and higher market rates of purchased power, as well as an increase in volume due to higher demand. The increase in Operating and maintenance expense was primarily due to an additionalincrease in contract labor driven by operational needs and work to support the company's strategic priorities and an increase in payroll and benefit costs driven by labor escalation for cost of living increases. These increases were partially offset by a $293 million decrease in Depreciation and amortization expense for the year ended September 30, 2021 as compared to the same period of the prior year. This decrease was primarily driven by a decrease in depreciation expense as a result of the decision in 2019 to accelerate the retirements of Bull Run Fossil Plant ("Bull Run") and Paradise Fossil Plant ("Paradise"). Paradise was fully depreciated in the second quarter of 2020.
TVA continues to closely monitor developments associated with the Coronavirus Disease 2019 ("COVID-19") pandemic, including impacts from variants. Based on current internal models, TVA estimates that the COVID-19 pandemic had little impact on TVA's sales volume for the year ended September 30, 2021. At this time, TVA does not anticipate sales volume will be materially impacted due to the COVID-19 pandemic beyond 2021. In addition, operations and delivery of energy to customers have not been materially impacted by the COVID-19 pandemic at this time.
TVA issued its first green global power bond in September 2021. The $500 million contributionbond has a 10-year maturity and carries a coupon interest rate of 1.500%, which set a record for the lowest rate achieved by TVA on a 10-year financing since TVA began issuing debt in the public capital markets. TVA intends to TVA’s pension plan.use amounts equal to the proceeds from the sale for capital investments in renewable energy, energy efficiency, climate adaptation, and green innovation, including research and development expenditures related to the deployment of carbon-free and/or energy efficient solutions and other innovations.
During 2017,2021, TVA continued to move to a more balanced generating portfolio providing more clean, reliable, and affordable energy. Two generation projects, Watts Bar Nuclear Plant ("Watts Bar") Unit 2 and natural gas-fired Paradise Combined Cycle Plant (“Paradise CC”), were declared commercially operational, and a request for a 465 MW extended power uprate ("EPU") project at Browns Ferry Nuclear Plant ("Browns Ferry") was approved by the Nuclear Regulatory Commission ("NRC"). The natural gas-fired Allen Combined Cycle Plant (“Allen CC”) began pre-commercial operationachieve 99.999 percent reliability in September 2017 and is expected to be completed in the spring of 2018. With the completion of Paradise CC and Allen CC, coal-fired units at these plants are being retired except for one unit at Paradise. TVA also expanded its renewabledelivering energy supply by beginning to purchase power under a 75 MW contract for solar power from a facility in northern Alabama as well as developing TVA's first solar venture, a one MW, self-constructed solar energy facility at its Allen site. With the completion of these projects, TVA will have added over 3,700 MW of clean energy capacity and retired approximately 2,000 MW of coal-fired generation capability. TVA also plans to retire Units 1-4 of Johnsonville Fossil Plant by December 31, 2017, further reducing its coal-fired generation capacity by 428 MW. TVA does not foresee needing additional large, base-load generation units for at least the next decade.
In addition, the installation of two selective catalytic reduction systems ("SCRs") at the Gallatin Fossil Plant ("Gallatin") was completed during 2017, while work on two additional SCRs at Gallatin, as well as work on the emissions reduction equipment for Units 1 and 4 at the Shawnee Fossil Plant ("Shawnee"), is continuing. The scrubbers and SCRs are expected to be operational in 2018. Because of a strong financial position in 2017 helped by greater operating efficiencies, TVA was able to fund capital investments for these and other projects primarily from operating funds instead of increasing debt.
In May 2017, the TVA Board approved a $300 million multi-year, strategic fiber initiative that is expected to expand TVA’s fiber capacity and improve the reliability and resiliency of the transmission system. The network expansion is expected to help meet the power system’s growing need for bandwidth as well as accommodate the integration of new, distributed energy resources ("DER"). With these upgrades to its transmission system, TVA has the potential to make some fiber capacity available to help local communitiescustomers. TVA's reliability, competitive rates, and rural areas attract and retain jobs in support of economic development partnerships among TVA, the Tennessee Valley states, LPCs, and other service providers. During 2017, TVA’s economic development efforts attractedcontinued to attract and encouragedencourage the expansion of business and industries in the Tennessee Valley, with over $8.3$8.8 billion in investments and approximately 70,00080,900 jobs created or retained. TVA also continues to achieve 99.999 percent reliability in delivering energy to its customers.retained during the year.
In accordance with dam safety assurance initiatives, TVA completed the assessments of 49 dam structures which it began in 2013. Results of the assessments identified areas for further studies at several TVA dams, including Boone Dam and Pickwick Landing Dam ("Pickwick") where remediation work is in progress.
Environmental groups and state regulatory agencies are increasing their attention on alleged groundwater contamination associated with coal combustion residuals ("CCRs") management activities. As a result, TVA may have to change how it manages CCRs at some of its plants. This challenge is not unique to TVA, as others in the electric utility industry are facing the same issues.
Consistent with national trends, energy demand in the areas served by TVA and its LPCs has not been growing and has been essentially flat over the past five years. TVA anticipates this trend to continue as technological advances and consumer demand for energy efficiencies and distributed energy increase. To accommodate this trend, TVA is working with its LPC customers to adjust rate structures, pricing, and programs to ensure TVA’s continued strong financial health and its ability to meet customer needs. By making TVA more efficient and adapting to the changing marketplace through a diversified energy portfolio including DER, TVA can maintain low rates and provide reliable service to its customers and consumers.
Results of Operations
Sales of Electricity
Sales of electricity, which accounted for nearly all of TVA's operating revenues, in 2017, 2016,were 157,353 million and 2015.151,251 million kilowatt hours ("kWh") for 2021 and 2020, respectively. TVA sells power at wholesale rates to LPCs that then resell the power to their customers at retail rates. TVA also sells power to directly served customers, consisting primarily of federal agencies and customers with large or nonstandard loads. In addition, power that exceeds theexceeding TVA's system needs of the TVA system is sold under exchange power arrangements with certain other power systems.
The following chart compares TVA’s energyTVA's sales statisticsof electricity by customer type for the years ended September 30, 2017, 2016,2021 and 2015:
|
| | | | | | | |
| Sales of Electricity | |
| For the years ended September 30 |
| (millions of kWh) | |
Notes
(1) Includes approximately 857 million kWhThe following charts show a breakdown of pre-commercial generation at Watts Bar Unit 2, Paradise Combined Cycle Plant,TVA's energy load:
Note
Information included in the charts above was derived from energy usage of directly served customers and Allen Combined Cycle Plant. See Note 1 — Pre-Commercial Plant Operations.customers served by LPCs during calendar year 2020, and these graphs will continue to be updated on a calendar year basis.
(2) Includes approximately 579 million kWh of pre-commercial generation at Watts Bar Unit 2. See Note 1 — Pre-Commercial Plant Operations.
Weather affects both the demand for TVA power and the price for that power. TVA uses degree days to measure the impact of weather on its power operations. Degree days measure the extent to which the TVA system 23-station average temperatures in the five largest cities in TVA's service area vary from 65 degrees Fahrenheit.
|
| | |
Degree Day Variation from Normal |
For the years ended September 30 |
çççç Below Normal Above Normal èèèè
|

| | | | | | | | | | | | | | | | | | | | | | | | | | | | | | | | | | | | | | | | | | | | | | | | | | | | | |
| Degree Days |
| | 2021 | | Normal | | Percent Variation | | 2020 | | Normal | | Percent Variation | | 2021 | | 2020 | | Percent Change |
| Heating Degree Days | 3,216 | | | 3,360 | | | (4.3) | % | | 3,056 | | | 3,369 | | | (9.3) | % | | 3,216 | | | 3,056 | | | 5.2 | % |
| | | | | | | | | | | | | | | | | |
| Cooling Degree Days | 1,611 | | | 1,686 | | | (4.4) | % | | 1,688 | | | 1,691 | | | (0.2) | % | | 1,611 | | | 1,688 | | | (4.6) | % |
| | | | | | | | | | | | | | | | | |
| | | | | | | | | | | | | | | | | |
Notes
* Normal heating degree days for the years ended September 30, 2017, 2016, and 2015 were 3,360, 3,381, and 3,360, respectively. Actual heating degree days for the years ended September 30, 2017, 2016, and 2015 were 2,378, 2,634, and 3,555, respectively. The 2016 normal heating degree days differ from 2017 and 2015 due to the occurrence of a leap year in 2016.
** Normal cooling degree days for the years ended September 30, 2017, 2016, and 2015 were 1,863. Actual cooling degree days for the years ended September 30, 2017, 2016, and 2015 were 2,007, 2,360, and 2,032, respectively.
2017 Compared to 2016
Sales of electricity decreasedincreased approximately twofour percent for the year ended September 30, 2017,2021, as compared to the prior year primarily due to decreasedlower energy sales volume for LPCs driven primarily by a 12 percent decrease in total degree days. Additionally, a decrease in sales to federal agencies and other occurred primarily2020, associated with the COVID-19 pandemic. Sales of electricity from
industries directly served increased as a result of a decrease in off-system sales, as TVA had less excess generation available for salecertain customers shifting maintenance outages from December 2020 to the market as compared to the prior year. Partially offsetting these decreases was an increase in sales to industries directly served as a resultsummer of increased production of customers in the polysilicon, metal, and chemical sectors.
2016 Compared to 2015
Sales of electricity decreased 1.5 percent for the year ended September 30, 2016, as compared to the prior year, primarily on account of decreased sales volume for LPCs resulting from a 26 percent decrease in heating degree days2020, while businesses were closed due to the polar vortex in the winter of 2015. Additionally, a decrease in sales to federal agencies and other occurred primarily as a result of a decrease in off-system sales, as TVA had less excess generation available for sale to the market as compared to the prior year. Partially offsetting these decreases was an increase in sales to industries directly served as a result of two customers increasing production at their facilities.COVID-19 pandemic.
Financial Results
The following table compares operating results for 2017, 2016,2021 and 2015:2020:
| | | | | | | | | | | | | | | | | | | | | | | | | |
Summary Consolidated Statements of Operations (in millions) |
| | 2021 | | 2020 | | Change | | Percent Change | | |
| Operating revenues | $ | 10,503 | | | $ | 10,249 | | | $ | 254 | | | 2.5 | % | | |
| Operating expenses | 7,658 | | | 7,538 | | | 120 | | | 1.6 | % | | |
| Operating income | 2,845 | | | 2,711 | | | 134 | | | 4.9 | % | | |
| Other income (expense), net | 13 | | | 36 | | | (23) | | | (63.9) | % | | |
| Other net periodic benefit cost | 258 | | | 253 | | | 5 | | | 2.0 | % | | |
| Interest expense | 1,088 | | | 1,142 | | | (54) | | | (4.7) | % | | |
| Net income | $ | 1,512 | | | $ | 1,352 | | | $ | 160 | | | 11.8 | % | | |
|
| | | | | | | | | | | |
Summary Consolidated Statements of Operations |
| | 2017 | | 2016 | | 2015 |
| Operating revenues | $ | 10,739 |
| | $ | 10,616 |
| | $ | 11,003 |
|
| Operating expenses | 8,764 |
| | 8,290 |
| | 8,788 |
|
| Operating income | 1,975 |
| | 2,326 |
| | 2,215 |
|
| Other income, net | 56 |
| | 43 |
| | 29 |
|
| Net interest expense | 1,346 |
| | 1,136 |
| | 1,133 |
|
| Net income | $ | 685 |
| | $ | 1,233 |
| | $ | 1,111 |
|
Operating Revenues. Operating revenue components asrevenues for the years ended September 30, 2021 and 2020, were $10.5 billion and $10.2 billion, respectively. The following chart compares TVA's operating revenues for the periods indicated:
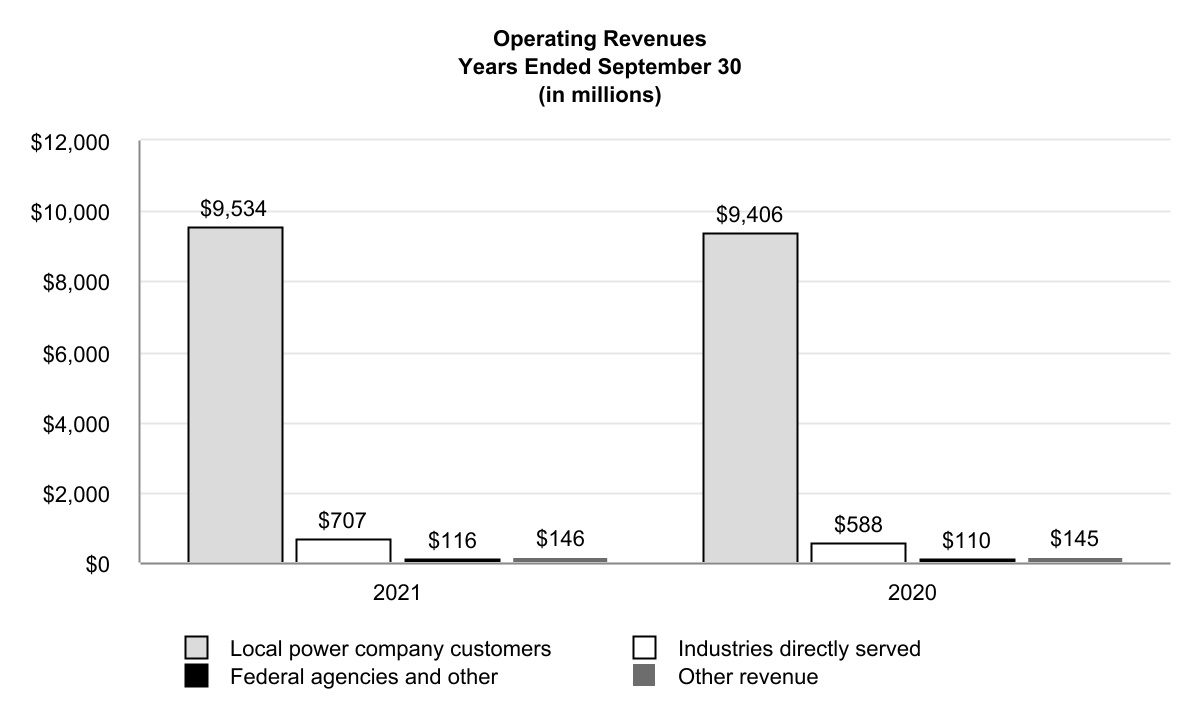
TVA's two largest LPCs — Memphis Light, Gas and Water Division ("MLGW") and Nashville Electric Service ("NES") — have contracts with a percentagefive-year and a 20-year termination notice period, respectively. Sales to MLGW and NES accounted for nine percent and eight percent, respectively, of TVA's total operating revenues during both the years ended September 30, 2021 and 2020. Certain LPCs, including MLGW, are evaluating options for future energy choices. In addition, in January 2021, four LPCs filed a complaint and petition with the Federal Energy Regulatory Commission ("FERC") asking FERC to order TVA to provide transmission and interconnection service to the LPCs or other suppliers that want to serve them. In August 2021, one of the LPCs notified FERC of its withdrawal from the complaint and petition. The remaining three LPCs accounted for three percent of TVA's total operating revenues for 2017, 2016, and 2015 consisted of the following:
|
| | |
| Operating Revenues | |
For the years ended September 30 |
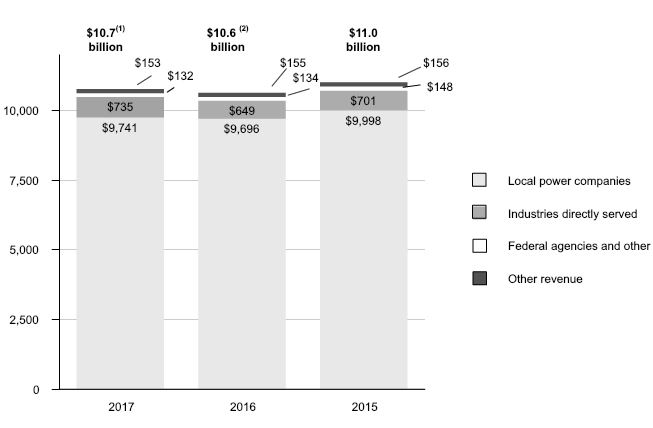
Notes
(1) Excludes a contra-revenue amount of approximately $22 million representing revenue capitalized during pre-commercial operations at Watts Bar Unit 2, Paradise Combined Cycle Plant, and Allen Combined Cycle Plant.year ended September 30, 2021. See Note 1 23 — Pre-Commercial Plant Operations.Commitments and Contingencies — Legal Proceedings — Challenge to Anti-Cherrypicking Amendment for updates to this legal proceeding.
(2) Excludes a contra-revenue amount of approximately $18 million representing revenue capitalized during pre-commercial operations at Watts Bar Unit 2. See Note 1 — Pre-Commercial Plant Operations.
The TVA's rate structure in effect provides priceuses pricing signals intended to reflectindicate seasons and hours of higher cost periods to serve LPCsits customers and their end-use customers. Under this structure, weather can positively or negatively impact both volume and effective rates. This is because the wholesaleto capture a portion of TVA's fixed costs in fixed charges. The structure includes twothree base revenue components: time of use demand charges, time of use energy charges, and a demandgrid access charge and an energy charge.("GAC"). The demand charge ischarges are based onupon the customer's peak monthly usage and increasesincrease as the peak increases. The energy charge ischarges are based on the kilowatt hours ("kWh")time differentiated kWh used by the customer. Both of these components can be significantly impacted by weather. The GAC captures a portion of fixed costs and is offset by a corresponding reduction to the energy rates. The GAC also reduces the impact of weather variability to the overall rate structure.
In 2019, the TVA Board approved a Partnership Agreement option that better aligns the length of LPC power contracts with TVA's long-term commitments. Under the partnership arrangement, the LPC power contracts automatically renew each year and have a 20-year termination notice. The partnership arrangements can be terminated under certain circumstances, including TVA's failure to limit rate increases as provided for in the agreements going forward. Participating LPCs receive benefits including a 3.1 percent wholesale bill credit in exchange for their long-term commitment, which enables TVA to recover its long-term financial commitments over a commensurate period. As of November 12, 2021, 145 LPCs had signed the 20-year Partnership Agreement with TVA.
In August 2020, the TVA Board approved a Pandemic Relief Credit that was effective for 2021. The 2.5 percent monthly base rate credit, which totaled $221 million for 2021, applied to service provided to TVA's LPCs, their large commercial and industrial customers, and TVA directly served customers through September 2021. In August 2021, the TVA Board approved a 2.5 percent monthly base rate credit, the Pandemic Recovery Credit, which will be effective for 2022. The credit, expected to approximate $220 million, will also apply to service provided to TVA's LPCs, their large commercial and industrial customers, and TVA directly served customers. In November 2021, the TVA Board approved a 1.5 percent monthly base rate credit, which is an extension of the Pandemic Recovery Credit, to be effective for 2023. The 2023 credit is expected to approximate $133 million, and it will be administered in a manner similar to the Pandemic Recovery Credit.
In addition to base revenues, the rate structure also includes a separate fuel rate that includes the costs of natural gas, fuel oil, purchased power, coal, emission allowances, nuclear fuel, and other fuel-related commodities; realized gains and losses on derivatives purchased to hedge the costs of such commodities; and payments to states and counties in lieu of taxes ("tax equivalentsequivalents") associated with the fuel cost adjustments. See Item 1, Business —Rates—Rate Methodology.
The changes in revenue components are summarized below:
| | | | | | | | | | | | | | | | | | | | | | |
Changes in Revenue Components For the years ended September 30 (in millions) |
| | 2021 | | 2020 | | Change | | | | | |
| Base revenue | | | | | | | | | | |
| Energy revenue | $ | 4,719 | | | $ | 4,546 | | | $ | 173 | | | | | | |
| Demand revenue | 3,478 | | | 3,426 | | | 52 | | | | | | |
| Grid access charge | 596 | | | 597 | | | (1) | | | | | | |
| Long-term partnership credits for LPCs | (189) | | | (163) | | | (26) | | | | | | |
| Pandemic relief credits | (221) | | | — | | | (221) | | | | | | |
Other charges and credits(1) | (631) | | | (616) | | | (15) | | | | | | |
| Total base revenue | 7,752 | | | 7,790 | | | (38) | | | | | | |
| Fuel cost recovery | 2,601 | | | 2,310 | | | 291 | | | | | | |
| Off-system sales | 4 | | | 4 | | | — | | | | | | |
| Revenue from sales of electricity | 10,357 | | | 10,104 | | | 253 | | | | | | |
| Other revenue | 146 | | | 145 | | | 1 | | | | | | |
| Total operating revenues | $ | 10,503 | | | $ | 10,249 | | | $ | 254 | | | | | | |
|
| | | | | | | | | | | | | | | | | | | |
| | 2017 | | Variance 2017 vs 2016 | | 2016 | | Variance 2016 vs 2015 | | 2015 |
| Base revenue | $ | 7,499 |
| (1) | $ | 31 |
| | $ | 7,468 |
| (2) | $ | (56 | ) | | $ | 7,524 |
|
| Fuel cost recovery | 3,081 |
| | 95 |
| | 2,986 |
| | (319 | ) | | 3,305 |
|
| Off-system sales | 6 |
| | (1 | ) | | 7 |
| | (11 | ) | | 18 |
|
| Revenue from sales of electricity | 10,586 |
| | 125 |
| | 10,461 |
| | (386 | ) | | 10,847 |
|
| Other revenue | 153 |
| | (2 | ) | | 155 |
| | (1 | ) | | 156 |
|
| Total operating revenues | $ | 10,739 |
| | $ | 123 |
| | $ | 10,616 |
| | $ | (387 | ) | | $ | 11,003 |
|
Notes(1) Includes economic development credits to promote growth in the Tennessee Valley, hydro preference credits for residential customers of LPCs, and demand response credits allowing TVA to reduce industrial customer usage in periods of peak demand to balance system demand. See Note 18 — Revenue.
(1) Includes the impact of revenue capitalized during pre-commercial operations of approximately $22
Operating revenues increased $254 million for the year ended September 30, 2017, at Watts Bar Unit 2, Paradise Combined Cycle Plant, and Allen Combined Cycle Plant. See Note 1 — Pre-Commercial Plant Operations.
(2) Includes the impact of revenue capitalized during pre-commercial operations of approximately $18 million for the year ended September 30, 2016, at Watts Bar Unit 2. See Note 1 — Pre-Commercial Plant Operations.
2017 Compared to 2016
Operating revenues increased $123 million for the year ended September 30, 2017,2021, as compared to the prior year, primarily due to a $95$291 million increase in fuel cost recovery revenuesrevenue, and partially offset by a $31$38 million increasedecrease in base revenue. The $95$291 million increase in fuel cost recovery revenues reflectsrevenue was driven by a $160$198 million increase attributable to higher fuel rates partially offset byand a $65$93 million decreaseincrease attributable to lowerhigher energy sales. The highersales during 2021. Higher fuel rates experienced were primarily driven by higher market prices forresulted from an increase in natural gas and a changecoal market prices in the mix of generation resources, including significantly less hydroelectric generation.2021. The $31$38 million increasedecrease in base revenue was predominantly driven by a decrease of $352 million attributable to lower effective rates and partially offset by an increase of $280$314 million attributable to higher sales volume. Lower effective rates duringresulted primarily from the year ended September 30, 2017, as compared to the prior year, due to the base rate adjustment that becamePandemic Relief Credit, which was effective October 1, 2016, partially offset by a decrease of $246 million resulting from lower sales volume. In addition, this increase in base revenue was partially offset by the capitalization of approximately $22 million of revenue resulting from pre-commercial generation at Watts Bar Unit 2 and Paradise and Allen Combined Cycle Plants. See Note 1 — Pre-Commercial Plant Operations.
2016 Compared to 2015
Operating revenues decreased $387for 2021, totaling $221 million for the year ended September 30, 2016, as compared to the prior year,2021. Higher sales volume was primarily due to a $319 million decrease in fuel cost recovery revenues and a $56 million decrease in base revenue. The $319 million decrease in fuel cost recovery revenues reflects a $279 million decrease attributable to lower fuel rates and a $40 million decrease attributable to lower energy sales. The lower fuel rates experienced were primarily driven by favorable market prices for natural gas and a changesales in 2020, associated with the mix of generation resources. The $56 million decrease in base revenue was predominantly driven by a decrease of $105 million resulting from lower sales volume during the year ended September 30, 2016, asCOVID-19 pandemic, compared to the prior year. In addition, the capitalization of approximately $18 million of revenue, resulting from pre-commercial generation at Watts Bar Unit 2, contributed to the decrease in base revenue. 2021.
See Note 1 — Pre-Commercial Plant Operations. These decreases in base revenue were partially offset by an increase of approximately $67 million attributable to higher effective rates resulting primarily from the base rate adjustment that became effective October 1, 2015. The increase attributable to the rate adjustment was partially offset by lower levels of peak customer usage due to the milder winter weather experienced during the year ended September 30, 2016, as compared to the prior year.
See Sales of Electricity above for further discussion of the change in the volume of sales of electricity and Operating Expenses below for further discussion of the change in fuel expense.
Operating Expenses. Operating expense components as a percentage of total operating expenses for 2017,2016,2021 and 20152020 consisted of the following:
| | | | | | | | | | | | | | | | | | | | | | | | | | | |
Operating Expenses (in millions) |
| 2021 | | 2020 | | Change | | Percent Change | | | | |
| Operating expenses | | | | | | | | | | | |
| Fuel | $ | 1,737 | | | $ | 1,584 | | | $ | 153 | | | 9.7 | % | | | | |
| Purchased power | 984 | | | 880 | | | 104 | | | 11.8 | % | | | | |
| Operating and maintenance | 2,890 | | | 2,720 | | | 170 | | | 6.3 | % | | | | |
| Depreciation and amortization | 1,533 | | | 1,826 | | | (293) | | | (16.0) | % | | | | |
| Tax equivalents | 514 | | | 528 | | | (14) | | | (2.7) | % | | | | |
| Total operating expenses | $ | 7,658 | | | $ | 7,538 | | | $ | 120 | | | 1.6 | % | | | | |
The following table summarizes TVA’sTVA's expenses for various fuels for the years indicated:
| | Fuel Expense for TVA-Owned Facilities(1) For the years ended September 30 | Fuel Expense for TVA-Owned Facilities(1) For the years ended September 30 | Fuel Expense for TVA-Owned Facilities(1) For the years ended September 30 |
| | Fuel Expense By Source | | Cost per kWh | | Fuel Expense By Source | | Cost per kWh(4) |
| | 2017 | | 2016 | | 2015 | | 2017 | | 2016 | | 2015 | | 2021 | | 2020 | | | 2021 | | 2020 | |
Coal(2) | $ | 1,060 |
| | $ | 1,275 |
| | $ | 1,564 |
| | 2.71 |
| | 2.77 |
| | 2.84 |
| Coal(2) | $ | 577 | | | $ | 533 | | | | $ | 2.46 | | | $ | 2.69 | | |
Natural gas and/or oil-fired(3) | 706 |
| | 632 |
| | 611 |
| | 2.78 |
| | 2.51 |
| | 3.25 |
| Natural gas and/or oil-fired(3) | 841 | | | 660 | | | | 2.52 | | | 1.96 | | |
| Nuclear fuel | 334 |
| | 277 |
| | 273 |
| | 0.57 |
| | 0.52 |
| | 0.50 |
| Nuclear fuel | 363 | | | 378 | | | | 0.55 | | | 0.58 | | |
Total fuel(4) | $ | 2,100 |
| | $ | 2,184 |
| | $ | 2,448 |
| | 1.70 |
| | 1.76 |
| | 1.91 |
| |
| Total fuel | | Total fuel | $ | 1,781 | | | $ | 1,571 | | | | $ | 1.44 | | | $ | 1.33 | | |
Notes
(1) Excludes effects of the fuel cost adjustment deferrals and amortization on fuel expense in the amounts of $69 million, $(58)$(44) million and $(4)$13 million for the years ended September 30, 2017, 2016,2021 and 2015,2020, respectively.
(2) Fuel expense related to oil consumed for startup at coal-fired facilities was $18 million $21 million, and $30$17 million for the years ended September 30, 2017, 2016,2021 and 2015,2020, respectively.
(3) Fuel expense related to oil consumed for generation at natural gas and/or oil-fired facilities was $2 million, $2$4 million and $6$2 million for the years ended September 30, 2017, 2016,2021 and 2015, respectively.2020.
(4) Total cost per kWh is based on a weighted average.
Fuel expense increased $153 million for the year ended September 30, 2021, as compared to the prior year. This increase was primarily due to higher effective fuel rates of $153 million resulting from higher natural gas prices, as well as an increase in fuel volume of $58 million due to higher demand primarily met by TVA-owned generation. Partially offsetting these increases was a decrease in fuel cost recovery of $58 million resulting from volatility in the natural gas and purchased power markets in the year ended September 30, 2021.
Purchased power expense increased $104 million for the year ended September 30, 2021, as compared to the prior year. This was primarily due to an increase in the effective rate of purchased power of $82 million resulting from higher market prices, as well as an increase in volume of $46 million. Partially offsetting these increases was a decrease in fuel cost recovery of $24 million resulting from volatility in the natural gas and purchased power markets in the year ended September 30, 2021.
Operating and maintenance expense increased $170 million for the year ended September 30, 2021, as compared to the prior year. This was primarily due to a $97 million increase in contract labor driven by operational needs and work to support the company's strategic priorities, a $60 million increase in payroll and benefit costs primarily due to labor escalation for cost of living increases, and an increase in outage expense of $30 million driven by an increase in nuclear outage days. Partially offsetting these increases was a decrease of other post-employment benefit expense of $32 million primarily due to the increase in the discount rate assumption used in the actuarial valuation of the liability related to workers’ compensation claims and a reduction related to TVA's capital spare program of $15 million.
Depreciation and amortization expense decreased $293 million for the year ended September 30, 2021, as compared to the prior year. This decrease was primarily driven by a net decrease in depreciation expense of $262 million related to the decision in 2019 to accelerate the retirements of Bull Run and Paradise. Paradise was fully depreciated in the second quarter of 2020. Additionally, amortization expense of decommissioning costs recovered in rates decreased $96 million. Partially offsetting these decreases was an increase due to depreciation of additions to completed plant.
Depreciation rates are determined based on an external depreciation study. See Note 1 — Summary of Significant Accounting Policies—Property, Plant, and Equipment, and Depreciation — Depreciation. TVA obtained and implemented a new depreciation study related to its completed plant during the first quarter of 2022. The new study includes a decline in the service life estimates of TVA’s coal-fired plants based on planning assumptions to potentially retire the remainder of the coal-fired fleet by 2035. Any decision to retire individual plants would include environmental review, public input, and TVA Board approval. Implementation of the new study is expected to result in an increase to depreciation and amortization expense of approximately $369 million during 2022. This estimate represents the impact of implementing the new study only and does not include any potential impact of other possible changes, including additions to or retirements of net completed plant, that may occur during 2022.
Tax equivalents expense decreased $14 million for the year ended September 30, 2021, as compared to the prior year. This change is primarily driven by a decrease in TVA's revenue from sales of electricity in 2020, which is used as the basis for calculating tax equivalent expense. Partially offsetting this decrease was an increase in tax equivalents collected in the fuel cost recovery.
Generating Sources.The following table shows TVA's generation and purchased power by generating source as a percentage of all electrical power generated and purchased (based on kWh) for the periods indicated:
|
| | | | | | | | | | | | | | | | | | |
Power Supply from TVA-Operated Generation Facilities and Purchased Power For the years ended September 30 (millions of kWh) |
| | 2017 | | 2016 | | 2015 | |
| Coal-fired | 39,019 |
| | 25 | % | | 46,028 |
| | 29 | % | | 56,017 |
| | 34 | % | |
Nuclear(1) | 58,742 |
| | 38 | % | | 52,897 |
| | 33 | % | | 54,543 |
| | 34 | % | |
| Hydroelectric | 10,967 |
| | 7 | % | | 12,618 |
| | 8 | % | | 13,812 |
| | 9 | % | |
Natural gas and/or oil-fired(2) | 25,485 |
| | 16 | % | | 25,221 |
| | 16 | % | | 17,893 |
| | 11 | % | |
| Renewable resources (non-hydro) | — |
| | — | % | | — |
| | — | % | | — |
| | — | % | |
| Total TVA-operated generation facilities | 134,213 |
| | 86 | % | | 136,764 |
| | 86 | % | | 142,265 |
| | 88 | % | |
Purchased power (non-renewable)(3) | 13,586 |
| | 9 | % | | 13,807 |
| | 9 | % | | 9,788 |
| | 6 | % | |
| Purchased power (renewable) | 7,127 |
| | 5 | % | | 8,300 |
| | 5 | % | | 9,049 |
| | 6 | % | |
| Total power supply | 154,926 |
| | 100 | % | | 158,871 |
| | 100 | % | | 161,102 |
| | 100 | % | |
| | | | | | | | | | | | | | | | | | | | | | | | | | | | |
Total Power Supply by Generating Source For the years ended September 30 (millions of kWh) |
| | 2021 | | 2020 | | | |
| | | | | | | | | | | | |
| Nuclear | 66,265 | | | 41 | % | | 64,531 | | | 42 | % | | | | | |
| Natural gas and/or oil-fired | 33,290 | | | 21 | % | | 33,479 | | | 22 | % | | | | | |
| Coal-fired | 23,391 | | | 15 | % | | 19,732 | | | 13 | % | | | | | |
| | | | | | | | | | | | |
| Hydroelectric | 16,354 | | | 10 | % | | 16,644 | | | 10 | % | | | | | |
Total TVA-operated generation facilities(1)(2) | 139,300 | | | 87 | % | | 134,386 | | | 87 | % | | | | | |
Purchased power (natural gas and/or oil-fired)(3) | 10,836 | | | 7 | % | | 9,343 | | | 6 | % | | | | | |
Purchased power (other renewables)(4) | 5,113 | | | 3 | % | | 4,784 | | | 3 | % | | | | | |
| | | | | | | | | | | | |
| Purchased power (hydroelectric) | 2,156 | | | 2 | % | | 2,899 | | | 2 | % | | | | | |
| Purchased power (coal-fired) | 2,373 | | | 1 | % | | 2,409 | | | 2 | % | | | | | |
Total purchased power(2) | 20,478 | | | 13 | % | | 19,435 | | | 13 | % | | | | | |
| Total power supply | 159,778 | | | 100 | % | | 153,821 | | | 100 | % | | | | | |
Notes
(1) The nuclearGeneration from TVA-owned renewable resources (non-hydroelectric) is less than one percent for all periods shown and therefore is not represented in the table above.
(2) Raccoon Mountain Pumped-Storage Plant net generation amountis allocated against each TVA-operated generation facility and purchased power type for the years ended September 30, 2017both 2021 and 2016 includes approximately 495 million kWh2020. See Item1, Business — Power Supply and 579 million kWh, respectively,Load Management Resources — Raccoon Mountain Pumped-Storage Plant for a discussion of pre-commercial generation at Watts Bar Unit 2. See Note 1 — Pre-Commercial Plant Operations.
(2) The natural gas and/or oil-fired generation amount for the year ended September 30, 2017, includes approximately 362 million kWh of pre-commercial generation at Paradise and Allen Combined Cycle Plants. See Note 1 — Pre-Commercial Plant Operations.Raccoon Mountain Pumped-Storage Plant.
(3) Purchased power amounts include(gas) includes generation from Caledonia Combined Cycle Plant ("Caledonia CC"), which is currently a leased facility operated by TVA. Generation from Caledonia Combined Cycle PlantCC was 4,276 million kWh, 4,5324,255 million kWh and 3,1734,229 million kWh for the years ended September 30, 2017, 20162021 and 2015,2020, respectively.
(4) Purchased power (other renewables) includes purchased power from the following renewable sources: solar, wind, biomass, and renewable cogeneration.
2017 Compared
In addition to 2016
|
|
Fuel |
Fuel expense increased $43 million for the year ended September 30, 2017, as compared to the prior year. The impact of higher effective fuel rates, driven by changes in the mix of generation resources, including less hydroelectric generation, and higher market prices for natural gas, contributed approximately $84 million to the increase. As an indication of the general market direction, the average Henry Hub natural gas spot price for the year ended September 30, 2017, was approximately 33 percent higher than the price for the same period of the prior year. Partially offsetting this increase was a $41 million decrease in fuel expense driven by a two percent decrease in generation from TVA-owned resources.
|
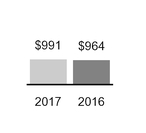
|
|
Purchased Power |
Purchased power expense increased $27 million for the year ended September 30, 2017, as compared to the same period of the prior year. This was primarily due to an increase of $80 million driven by changes in the mix of generation resources purchased, including solar and natural gas, and higher market prices for natural gas. Partially offsetting this increase was a decrease of $54 million primarily due to overall lower demand and therefore a decrease in the volume of purchased power. |
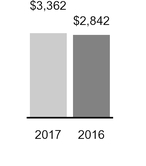
|
|
Operating and Maintenance |
Operating and maintenance expense increased $520 million for the year ended September 30, 2017, as compared to the prior year. This increase was primarily due to an additional discretionary $500 million contribution to TVA's pension plan in 2017, which was recognized as additional pension expense. See Note 20. Additionally, nuclear refueling outage expense increased $89 million, primarily from a significant increase in planned outage days, as compared to the prior year. These increases were partially offset by a $26 million decrease in coal outage expense primarily from planned outages, and a $43 million decrease due to a reduction in workforce related to identified efficiencies and staffing changes needed to support TVA's generating fleet. |
power supply sources included here, TVA offers energy efficiency programs that effectively reduced 2021 energy needs by about 2,300 GWh or 1.4%.
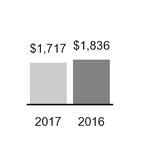
|
|
Depreciation and Amortization |
Depreciation and amortization expense decreased $119 million for the year ended September 30, 2017, as compared to the prior year. Implementation of a new depreciation study during the first quarter of 2017 resulted in approximately $224 million less depreciation expense. The decrease in depreciation expense as a result of the new depreciation rates is primarily attributable to changes in retirement date assumptions for coal-fired plants and changes in the estimated service lives for transmission assets. See Note 1 — Property, Plant, and Equipment, and Depreciation — Depreciation. In addition, the retirement of Colbert Fossil Plant ("Colbert") Units 1-4 in March 2016 and Paradise Fossil Plant Units 1 and 2 in April 2017 contributed $29 million and $50 million, respectively, to the decrease. Partially offsetting these decreases was an increase of approximately $184 million primarily from net additions to Completed plant, including $133 million associated with Watts Bar Unit 2 commencing commercial operations in October 2016 and $12 million associated with Paradise Combined Cycle Plant commencing commercial operations in April 2017.
|

|
|
Tax Equivalents |
Tax equivalents expense increased $3 million for the year ended September 30, 2017, as compared to the same period of the prior year. This change primarily reflects an increase in the accrued tax equivalent expense related to the fuel cost adjustment mechanism. The accrued tax equivalent expense is equal to five percent of the fuel cost adjustment mechanism revenues and increased for the year ended September 30, 2017, as compared to the same period of the prior year.
|
2016 Compared to 2015

|
|
Fuel |
Fuel expense decreased $318 million for the year ended September 30, 2016, as compared to the prior year. The decrease in fuel expense was due in part to favorable market prices for natural gas and a change in the mix of generation resources, including less hydroelectric generation, which collectively contributed approximately $169 million to the decrease. As an indication of general market direction, the average Henry Hub natural gas spot price for the year ended September 30, 2016, was approximately 26 percent lower than the prior year. Additionally, a three percent decrease in generation from TVA-owned resources contributed approximately $95 million to the decrease in fuel expense.
|
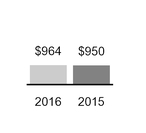
|
|
Purchased Power |
Purchased power expense increased $14 million for the year ended September 30, 2016, as compared to the prior year. An increase of 17 percent in the volume of power purchased for the year ended September 30, 2016, as compared to the prior year contributed approximately $165 million to the increase in purchased power expense. This increase in volume was driven primarily by the favorability of natural gas prices as compared to other sources of generation, as TVA’s primary source of purchased power is natural gas-fired generation. Partially offsetting this increase was a $130 million decrease in purchased power expense due to lower rates driven by lower market prices for natural gas.
|
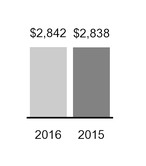
|
|
Operating and Maintenance |
Operating and maintenance expense remained essentially flat for the year ended September 30, 2016, as compared to the same period of the prior year. This was due in part to a $42 million increase in maintenance expenses related to major projects, including dam safety and remediation projects and projects relating to natural gas-fired facilities, in the year ended September 30, 2016, as compared to the same period of the prior year. Additionally, there was an increase of approximately $23 million in net write-offs during the year ended September 30, 2016, as compared to the same period of the prior year, primarily due to inventory and project write-offs. These increases in operating and maintenance expense were partially offset by a $48 million decrease in planned outage expense, primarily due to the timing and efficiencies of planned nuclear outages and decreased planned coal outages during the year ended September 30, 2016, as compared to the same period of the prior year. Additionally, there was a decrease of $12 million in fuel-related operating and maintenance expense primarily as a result of lower coal generation during the year ended September 30, 2016, as compared to the same period of the prior year. |
|
|
Depreciation and Amortization |
Depreciation and amortization expense decreased $195 million for the year ended September 30, 2016, as compared to the prior year. The decrease was primarily a result of approximately $294 million less depreciation expense driven by the retirement of Widows Creek Unit 7 in September 2015 and Colbert Units 1-4 in March 2016. In addition, there was a $79 million decrease in depreciation and amortization expense related to the 20-year license extension for Sequoyah Nuclear Plant ("Sequoyah"). Partially offsetting these decreases was an increase of $100 million in the amortization of the non-nuclear decommissioning regulatory asset and an increase of approximately $77 million primarily from net additions to Completed plant. See Note 1 — Property, Plant, and Equipment, and Depreciation — Depreciation.
|
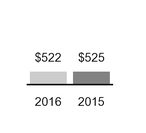
|
|
Tax Equivalents |
Tax equivalents expense decreased $3 million for the year ended September 30, 2016, as compared to the same period of the prior year. This change primarily reflects a decrease in the accrued tax equivalent expense related to the fuel cost adjustment mechanism. The accrued tax equivalent expense is equal to five percent of the fuel cost adjustment mechanism revenues and decreased for the year ended September 30, 2016, as compared to the same period of the prior year.
|
Interest Expense.Interest expense and interest rates for 2017, 2016,2021 and 20152020, were as follows:
| | | | | | | | | | | | | | | | | | | | | |
Interest Expense and Rates
For the years ended September 30 |
| | 2021 | | 2020 | | Percent Change | | | | |
Interest expense(1) | $ | 1,088 | | | $ | 1,142 | | | (4.7) | % | | | | |
| | | | | | | | | |
| | | | | | | | | |
| | | | | | | | | |
Average blended debt balance(2) | $ | 20,916 | | | $ | 21,978 | | | (4.8) | % | | | | |
| | | | | | | | | |
Average blended interest rate(3) | 5.06 | % | | 5.05 | % | | 0.2 | % | | | | |
|
| | | | | | | | | | | | | | | | | |
Interest Expense and Rates For the years ended September 30 |
| | 2017 | | Percent Change | | 2016 | | Percent Change | | 2015 |
Interest expense(1) | | | | | | | | | |
| Interest expense | $ | 1,346 |
| | (1.8 | )% | | $ | 1,371 |
| | 1.8 | % | | $ | 1,347 |
|
| Allowance for funds used during construction | — |
| | (100.0 | )% | | (235 | ) | | 9.8 | % | | (214 | ) |
| Net interest expense | $ | 1,346 |
| | 18.5 | % | | $ | 1,136 |
| | 0.3 | % | | $ | 1,133 |
|
| | | | | | | | | | |
| Average blended interest rate | 5.11 | % | | (0.8 | )% | | 5.15 | % | | (0.2 | )% | | 5.16 | % |
NoteNotes
(1) Interest expense includesIncludes amortization of debt discounts, issuance, and reacquisition costs, net.
(2) Includes average balances of long-term power bonds, debt of variable interest entities ("VIE"), and discount notes.
2017 Compared to 2016(3) Includes interest on long-term power bonds, debt of VIE, and discount notes.
Net Total interest expense increased $210decreased $54 million for the year ended September 30, 2017,2021, as compared to the prior year. This was primarily driven by a decrease of $56 million due to lower average debt balances and partially offset by an increase of $2 million due primarily to higher average long-term rates.
Other Income (Expense), Net
During the year ended September 30, 2016, TVA capitalized $2352021, Other income (expense), net decreased $23 million, in allowance for funds used during construction ("AFUDC")primarily driven by a $28 million court directed payment related to the Watts Bar Unit 2 construction project.sale of Bellefonte. In 2019, the purchaser, Nuclear Development, LLC ("Nuclear Development"), failed to fulfill the requirements of the sales contract with respect to obtaining Nuclear Regulatory Commission ("NRC") approval of the transfer of required nuclear licenses and payment of the remainder of the selling price before the November 30, 2018 closing date. In August 2021, the court found that, under the contract's termination provision, Nuclear Development was entitled to have TVA ceased capitalizing allowancereturn Nuclear Development's down payment and its payments of compensated costs, along with prejudgment interest, which was fully paid in 2021. Partially offsetting this expense was a $7 million increase in gains (losses) on investments driven by higher market returns in 2021. See Note 23 — Commitments and Contingencies — Legal Proceedings — Case Involving Bellefonte Nuclear Plant for funds used during construction after September 2016. Interest expense excluding AFUDC was $25 million lower fora discussion of the year ended September 30, 2017, as compared to the prior year, primarily due to lower interest rates on long-term debt.lawsuit filed by Nuclear Development.
2016 Compared to 2015Other Net Periodic Benefit Cost
Net interest expense Other net periodic benefit cost increased $3$5 million for the year ended September 30, 2016,2021, as compared to the prior year. This increase was attributableOther net periodic benefit cost is subject to an increasesignificant economic assumptions, such as changes in interest expense of $24 million primarily duethe discount rate used to interest associated with certainmeasure the benefit plans, that can materially impact TVA. However, TVA uses regulatory accounting to recognize other financing obligations. The increase was partially offset by an increase of $21 million in AFUDCnet periodic benefit cost as a result of ongoing construction activities at Watts Bar Unit 2. regulatory asset to the extent that the amount calculated under U.S. generally accepted accounting principles ("GAAP") as pension expense differs from the amount TVA contributes to the pension plan as pension plan contributions. See Note 22 — Benefit Plans.
Liquidity and Capital Resources
Sources of Liquidity
To meet cash needs and contingencies, TVA depends on various sources of liquidity. TVA’sliquidity to meet cash needs and contingencies. TVA's primary sources of liquidity
are cash from operations and proceeds from the issuance of short-term debt in the form of discount notes, along with periodic
issuances of long-term debt. TVA's balance of short-term debt typically changes frequently as TVA issues discount notes to
meet short-term cash needs and pay scheduled maturities of discount notes and long-term debt. Current liabilities may exceed current assets from time to time in part because TVA usesThe periodic amounts of short-term debt issued are determined by near-term expectations for cash receipts, cash expenditures, and funding needs, while
seeking to fund short-term cash needs, as well as to pay scheduled maturities and other redemptions of long-term debt. The daily balancemaintain a target range of cash and cash equivalents maintained is based on near-term expectations for cash expenditures and funding needs.hand.
In addition to cash from operations and proceeds from the issuance of short-term and long-term debt, TVA's sources of liquidity include a $150 million credit facility with the United States Department of the Treasury ("U.S. Treasury"), four long-term
revolving credit facilities totaling approximately $2.7 billion, and proceeds from other financings. See Note 1314 — Debt and Other Obligations—Credit Facility Agreements. Agreements. Other financing arrangements may include sales of receivables, loans, andor other assets.
The TVA Act authorizes TVA to issue Bonds in an amount not to exceed $30.0 billion outstanding at any time. In February 2017, TVA issued $1.0 billion of power bonds maturing in February 2027. See Note 13 — Debt Securities Activity. Power bonds outstanding, excluding unamortized discounts and premiums and net exchange lossesgains from foreign currency transactions, at September 30, 2017,2021 and 2016,2020, were $24.2$19.4 billion (including current maturities) and $24.1$20.1 billion (including current maturities), respectively. The balance of Bonds outstanding directly affects TVA’sTVA's capacity to meet operational liquidity needs and to strategically use Bonds to fund certain capital investments as management and the TVA Board may deem desirable. Other options for financing not subject to the limit on Bonds, including lease financings (see Lease Financings below and Note 10)11 — Variable Interest Entities), could provide supplementary funding if needed. Currently, TVA believes that it hasexpects to have adequate capability to
fund its ongoing operational liquidity needs and make planned capital investments over the next decadedecade. See Lease Financings below, Note 11 — Variable Interest Entities, and Note 14 — Debt and Other Obligations for additional information.
TVA may from time to time seek to retire or purchase its outstanding debt through a combinationcash purchases and/or exchanges for securities, in open market purchases, privately negotiated transactions, or otherwise. Such repurchases or exchanges, if any, will depend on prevailing market conditions, TVA's liquidity requirements, contractual restrictions, and other factors. The amounts involved may be material.
Due to higher volatility in the financial markets associated with the COVID-19 pandemic, TVA increased its balance of Bonds, additional power revenues through power rate increases, cost reductions,Cash and cash equivalents beginning in March 2020. TVA may hold higher cash balances from time to time in response to potential market volatility or other ways. See Lease Financings below, Note 10,business conditions. TVA has maintained continued debt market access since the outbreak of the pandemic. TVA successfully funded the maturity of $1.5 billion of power bonds in February 2021 and Note 13$331 million of power bonds in June 2021 with cash from operations and proceeds from the issuance of discount notes. In September 2021, TVA issued $500 million of green global power bonds at the lowest interest rate achieved by TVA on a 10-year maturity financing since TVA began issuing debt in the public capital markets. TVA intends to use amounts equal to the proceeds from the sale for additional information.capital investments in renewable energy, energy efficiency, climate change adaptation, and green innovation, including research and development expenditures related to the deployment of carbon-free and energy efficient solutions and other innovations. TVA’s next significant power bond maturity is $1.0 billion in August 2022.
Debt Securities. TVA’sTVA's Bonds are not obligations of the United States,U.S., and the United StatesU.S. does not guarantee the payments of principal or interest on Bonds. TVA’sTVA's Bonds consist of power bonds and discount notes. Power bonds have maturities of between one and 50 years. At September 30, 2017,2021, the average maturity of long-term power bonds was 16.615.69 years, and the weighted average interest rate was 4.67 percent. 4.51 percent. Discount notes have maturities of less than one year. Power bonds and discount notes have a first priority and equal claim of payment out of net power proceeds. Net power proceeds are defined as the remainder of TVA's gross power revenues after deducting the costs of operating, maintaining, and administering its power properties and payments to states and counties in lieu of taxes, but before deducting depreciation accruals or other charges representing the amortization of capital expenditures, plus the net proceeds from the sale or other disposition of any power facility or interest therein. In addition to power bonds and discount notes, TVA had long-term debt associated with certain VIEs outstanding at September 30, 2017.2021. See Lease FinancingsFinancing below, Note 10,11 — Variable Interest Entities, and Note 13 14 — Credit Facility Agreements Debt and Other Obligations for additional information. TVA also had secured notes outstanding at September 30, 2017, that were assumed in
business combinations in 2016 and asset acquisitions in 2017. See Note 13 — Secured Notes.
Power bonds and discount notes are both issued pursuant to Section 15d of the TVA Act and pursuant to the Basic Tennessee Valley Authority Power Bond Resolution adopted by the TVA Board on October 6, 1960, as amended on September 28, 1976, October 17, 1989, and March 25, 1992 (the "Basic Resolution"). The TVA Act and the Basic Resolution each contain two bond tests: the rate testand the bondholder protection test.
Under the rate test, TVA must charge rates for power which will produce gross revenues sufficient to provide funds for:
•Operation, maintenance, and administration of its power system;
Payments to states and counties in lieu of taxes;•Tax equivalents;
•Debt service on outstanding Bonds;
•Payments to the U.S. Treasury in repayment of and as a return on the government's appropriation investment in TVA's power facilities (the "Power Program Appropriation Investment"); and
•Such additional margin as the TVA Board may consider desirable for investment in power system assets, retirement of outstanding Bonds in advance of maturity, additional reduction of the Power Program Appropriation Investment, and other purposes connected with TVA’sTVA's power business, having due regard for the primary objectives of the TVA Act, including the objective that power shall be sold at rates as low as are feasible. See Note 1719 — Proprietary Capital —Appropriation Investment.
TVA fulfilled its requirement to repay $1.0 billion of the Power Program Appropriation Investment in 2014; therefore, the repayment of this amount is no longer a component of rate setting.
The rate test for the one-year period ended September 30, 2017,2021, was calculated after the end of 2017,2021, and TVA met the test’stest's requirements.
Under the bondholder protection test, TVA must, in successive five-year periods, use an amount of net power proceeds at least equal to the sum of the depreciation accruals and other charges representing the amortization of capital expenditures and the net proceeds from any disposition of power facilities, for either the reduction of its capital obligations (including Bonds and the Power Program Appropriation Investment), or investment in power assets.
The bondholder protection test for the five-year period ended September 30, 2015,2020, was calculated after the end of 2015,2020, and TVA met the test’stest's requirements. TVA must next meet the bondholder protection test for the five-year period ending September 30, 2020.2025, and expects to meet the test.
TVA uses proceeds from the issuance of discount notes, in addition to other sources of liquidity, to fund short-term cash needs and scheduled maturities of long-term debt.
The following table provides additional information regarding TVA's short-term borrowings.
| | | | | | | | | | | | | | | | | | | | | | | | | | | |
| Short-Term Borrowing Table |
| | At September 30, 2021 | | For the year ended September 30, 2021 | | At September 30, 2020 | | For the year ended September 30, 2020 | | | | |
| Gross Amount Outstanding (at End of Period) or Average Gross Amount Outstanding (During Period) | | | | | | | | | | | |
| Discount notes | $ | 780 | | | $ | 876 | | | $ | 57 | | | $ | 812 | | | | | |
| Maximum Month-End Gross Amount Outstanding (During Period) | | | | | | | | | | | |
| Discount notes | N/A | | $ | 1,598 | | | N/A | | $ | 1,875 | | | | | |
| Weighted Average Interest Rate | | | | | | | | | | | |
| Discount notes | 0.03 | % | | 0.03 | % | | 0.06 | % | | 0.77 | % | | | | |
|
| | | | | | | | | | | | | | | | | | | | | | | |
| Short-Term Borrowing Table |
| | At September 30 2017 | | For the year ended September 30 2017 | | At
September 30 2016 | | For the year ended September 30 2016 | | At September 30 2015 | | For the year ended September 30 2015 |
Amount Outstanding (at End of Period) or Average Amount Outstanding (During Period) | | | | | | | | | | | |
| Discount notes | $ | 1,998 |
| | $ | 1,280 |
| | $ | 1,407 |
| | $ | 1,323 |
| | $ | 1,034 |
| | $ | 1,357 |
|
| Weighted Average Interest Rate | | | | | | | | | | | |
| Discount notes | 1.000 | % | | 0.668 | % | | 0.203 | % | | 0.240 | % | | 0.055 | % | | 0.051 | % |
Maximum Month-End Amount Outstanding (During Period) | | | | | | | | | | | |
| Discount notes | N/A |
| | $ | 2,062 |
| | N/A |
| | $ | 1,561 |
| | N/A |
| | $ | 2,590 |
|
TVA ended the year at September 30, 2017,2021, with a higher balance offor both short-term debt than at September 30, 2016, due primarily to timing of cash flows and higher redemptions of long-term debt than in the prior year. The average balance of short-term debt as compared to 2020. The increase was lower in 2017 than 2016primarily due to timing of financing activities in both years. TVA held a higher balance of short-term debt at September 30, 2016, than at September 30, 2015, due primarily to the timing of cash flows and lower issuance of long-term debt. The average balance of short-term debt was lower in 20162021 than 2015 due to the timing of financing activities in both years. The variance in the average interest rate on discount notes is primarily due to changes in market conditions.2020.
TVA generally uses proceeds from the issuance of power bonds to refinance maturing power bonds or other financing obligations, as necessary, or for other power system purposes. The total balance of power bonds may decline in periods where redemptions of power bonds exceed issuance due to net positive cash flow from operating and investing activities. In 2020, TVA projects that it will reduceachieved and surpassed its strategic goal of reducing debt to $21.8 billion by 2023, and made even further reductions in debt in 2021. TVA anticipates the balance of Bonds and other financing obligations may increase slightly through 2022 due to less than $22.0 billion by 2023.an expected increase in capital expenditures, consistent with TVA's strategic financial plan.
TVA issued $500 million and $1.0 billion of power bonds during 20172021 and no power bonds during 2016.2020, respectively. TVA redeemed $1.6$1.9 billion and $76 million$1.5 billion of power bondsBonds during 20172021 and 2016,2020, respectively. For additional information about TVA debt issuance activity and debt instruments issued and outstanding at September 30, 2017,2021 and 2016,2020, including rates, maturities, outstanding principal amounts, and redemption features, see Note 1314 — Debt and Other Obligations—DebtSecurities Activity and Debt Outstanding.
TVA Bonds are traded in the public bond markets. TVA's Bondsmarkets and are listed on the New York Stock Exchange ("NYSE") except for TVA's discount notes, the 2009 Series A and B power bonds, and the power bonds issued under TVA's electronotes® program. TVA's Putable Automatic Rate Reset Securities ("PARRS") are traded on the NYSE under the exchange symbols “TVC”"TVC" and “TVE.”"TVE." Other NYSE-listed bonds listed on the NYSE are assigned various symbols by the exchange, which are noted on the NYSE's website. TVA has also listed certain bonds on foreign exchanges from time to time, including the Luxembourg, Hong Kong, and Singapore Stock Exchanges. See Item 1A, Risk Factors for additional information regarding the market for TVA's Bonds.
Although TVA Bonds are not obligations of the United States,U.S., TVA, as a corporate agency and instrumentality of the United StatesU.S. government, may be impacted if the sovereign credit ratings of the United StatesU.S. are downgraded. Additionally, TVA may be impacted by how the United StatesU.S. government addresses situations of approaching its statutory debt limit. According to statements made by nationally recognized credit rating agencies, downward pressure on the ratings of the United StatesU.S. could eventually develop if there are no changes in current policies and budget deficits and the trajectory of debt beginscontinues to increase; additionally, current ratings factor in the prospect that debates over raising the debt ceiling of the United StatesU.S. government could continue to be protracted and difficult. The outlook on the ratings of the United StatesU.S. government and TVA is currently stable with alltwo of the three agencies that provide ratings on TVA Bonds. TVA’sIn July 2020, Fitch Ratings downgraded the U.S.'s credit rating outlook to negative from stable reflecting the ongoing deterioration in U.S. public finances and the absence of a credible fiscal consolidation plan, worsened by the economic challenges from the COVID-19 pandemic. In August 2020, the outlook on the credit rating of TVA was subsequently changed by Fitch to negative from stable, reflecting the actions on the U.S. The outlook on the ratings of TVA is currently stable with two of three credit rating agencies. TVA's rated senior unsecured Bonds are currently rated Aaa, AAA, and AA+. TVA's short-term discount notes are not rated.
Lease Financings. TVA has entered into certain leasing transactions with special purpose entities ("SPEs") to obtain third-party financing for its facilities. These SPEs are sometimes identified as VIEs of which TVA is determined to be the primary beneficiary. TVA is required to account for these VIEs on a consolidated basis. See Note 1011 — Variable Interest Entities and Note 1314 — Debt and Other Obligations for information about TVA’sTVA's lease financing activities, and see Note 9 for information regarding TVA’s recent acquisition of equity interests in certain SPEs created for the purpose of facilitating lease financing.activities. During 2017 and 2016, TVA acquired 100 percent of the equity interests in certain SPEs created for the purpose of facilitating lease financing. TVA may seek to enter into similar lease transactionsarrangements in the future.
In 2019, TVA made final rent payments under lease/leaseback transactions involving eight combustion turbine units ("CTs"), and terminated these transactions. In 2020, TVA made final rent payments under lease/leaseback transactions involving eight additional CTs. In 2021, TVA made final rent payments under lease/leaseback transactions involving four additional CTs. TVA will continue making rent payments under the remaining lease/
leaseback transactions through 2022.
Summary Cash Flows
A major source of TVA's liquidity is operating cash flows resulting from the generationand sale of electricity. There was no net change in cash andCash, cash equivalents, in 2017 and 2016. The net change was a $200restricted cash totaled $518 million decrease for the year endedand $521 million at September 30, 2015.2021 and 2020, respectively. A summary of cash flow components for the years ended September 30 follows:
Cash provided by (used in):
Operating Activities. TVA’sTVA's cash flows from operations are primarily driven by sales of electricity, fuel costs,expense, and operating and maintenance costs.expense. The timing and level of cash flows from operations can be affected by the weather, changes in working capital, commodity price fluctuations, outages, and other project expenses.
2017 Compared to 2016
Net cash flows provided by operating activities decreased by $306$380 million for 2017the year ended September 30, 2021, as compared to 20162020. The decrease was primarily due primarily to increased fuel and purchased power payments as a result of higher natural gas and market prices, as well as increased electricity demand. Increases in payroll and benefit costs due to labor escalation for cost of living increases inand higher cash used for pension contributions, fuel costs, and outage costs.asset retirement obligation ("ARO") settlements also contributed to the decrease in cash flows from operations. These changesdecreases were partially offset by increases in revenue collections due to timing, the increase to the effective base rate,less cash paid for interest and additional fuel cost recovery.inventory purchases.
2016 Compared to 2015
Net cash flows provided by operating activities decreased $273 million in 2016 compared to 2015, primarily as a result of the timing of revenue collections, increases in decommissioning settlements, increases in purchase power due to favorability of natural gas prices, and decreases in receipts of Kingston Fossil Plant ("Kingston") ash spill insurance proceeds. These changes were partially offset by decreases in margin requirements due to lower volumes, decreases in fossil fuel inventory expenditures, and the timing of payments related to operating and maintenance activities.
Investing Activities. The majority of TVA’sTVA's investing cash flows are due to investments to acquire, upgrade, or maintain generating and transmission assets, including environmental projects and the purchase of nuclear fuel. Nuclear fuel expenditures vary depending on the number of outages and the prices and timing of purchases of uranium and enrichment services.
2017 Compared to 2016
Net cash flows used in investing activities decreased by $577increased $323 million in 2017for the year ended September 30, 2021, as compared to 2016, primarilythe prior year driven by the completion of Watts Bar Unit 2an increase in October 2016 and Paradise Combined Cycle Plant in April 2017.
2016 Compared to 2015
Net cash flows used in investing activities decreased by $472 million in 2016 compared to 2015,capacity expansion projects primarily driven by higher spending in 2015 related to the Ackerman Combined Cycletwo combustion turbine gas facilities at TVA's Paradise and Colbert Fossil Plant ("Ackerman"Colbert") acquisition, Watts Bar Unit 2 construction,sites, the Johnsonville aeroderivative combustion turbine project, and nuclear fuel expenditures. These decreases werefleet improvement projects. This increase was partially offset by increasesa decrease in 2016 in capacity expansion spendingexpenditures for the natural gas-fired generation facility at Allen Fossil Plant ("Allen") and other capital projects. Pickwick South Embankment remediation project nearing completion.
Financing Activities.TVA’sTVA's cash flows provided by or used in financing activities are primarily driven by the timing and level of cash flows provided by operating activities, cash flows used in investing activities, and net issuance and redemption of debt instruments to maintain a strategic balance of cash on hand.
2017 Compared to 2016
Net cash flows used in financing activities were $200decreased $501 million for 2017the year ended September 30, 2021, as compared to $712020. TVA had $678 million ofin net cash provided bydebt redemptions in 2021 compared to $1.4 billion in net debt redemptions in 2020. In addition, payments on leaseback transactions were $195 million higher in 2021 compared to 2020. TVA's financing activities continue to reflect an overall reduction in 2016. Increased cash flows from operationsdebt driven by strong financial performance.
Impact of COVID-19
Based on current internal models, TVA estimates that the COVID-19 pandemic had little impact on TVA's sales volume for the year ended September 30, 2021. At this time, TVA does not anticipate sales volume will be materially impacted due to the COVID-19 pandemic beyond 2021. To support LPCs and decreased investing expenditures reduced TVA’s borrowing needs. During 2017,strengthen the public power response to the COVID-19 pandemic, TVA created initiatives such as the Public Power Support and Stabilization Program, Back-to-Business Credit Program, Community Care Fund, and Pandemic Credits. TVA has also realized proceeds fromprovided regulatory flexibility for LPCs to halt disconnection of services. See Key Initiatives and Challenges—COVID-19 Pandemic for an expanded discussion of these initiatives and the issuance of a $1.0 billion power bond carrying an interest rate of 2.88 percent and a term of ten years. The proceeds from the bond issuance were used in partimpact to redeem $1.6 billion ofTVA.
other long-term debt, primarily power bonds. In addition, TVA had $583 million of short-term debt net issuances for 2017 as compared to $370 million in 2016. TVA generally uses short-term debt to meet working capital needs and other cash requirements while maintaining minimal cash balances.
2016 Compared to 2015
Net cash flows provided by financing activities were essentially flat in 2016 compared to 2015. Net proceeds from the issuance and redemption of debt were higher in 2016 compared to 2015 due to portfolio debt management decisions and timing of financing and investing activities. This was offset by an increase in payments on leases and leasebacks related to the settlement of lease/leaseback obligations. See Note 9.
Cash Requirements and Contractual Obligations
TheActual capital expenditures and future planned capital expenditures for property, plant, and equipment additions, including clean air projects and new generation, and nuclear fuel are estimated to be as follows:
|
| | | | | | | | | | | | | | | |
Capital Expenditures(1) For the year ended September 30 |
| | Actual | | Estimated Capital Expenditures |
| | 2017 | | 2018 | | 2019 | | 2020 |
| Capacity expansion expenditures | | | | | | | |
| Allen combined cycle plant | $ | 210 |
| | $ | 162 |
| | $ | — |
| | $ | — |
|
| Paradise combined cycle plant | 66 |
| | 5 |
| | — |
| | — |
|
| Other capacity expansion | 250 |
| | 230 |
| | 334 |
| | 209 |
|
| Environmental expenditures | | | | | | | |
| Clean air and waste water | 167 |
| | 128 |
| | 45 |
| | 11 |
|
Coal combustion residuals(2) | 110 |
| | 164 |
| | 177 |
| | 88 |
|
| Transmission expenditures | 385 |
| | 438 |
| | 457 |
| | 496 |
|
Other capital expenditures(3) | 888 |
| | 847 |
| | 872 |
| | 902 |
|
| Total capital expenditures | $ | 2,076 |
| (4) | $ | 1,974 |
| | $ | 1,885 |
| | $ | 1,706 |
|
| | | | | | | | | | | | | | | | | | | | | | | |
Capital Expenditures For the years ended September 30 |
| Actual | | Estimated Capital Expenditures(1) |
| | 2021 | | 2022 | | 2023 | | 2024 |
| Capacity expansion expenditures | $ | 588 | | | $ | 1,322 | | | $ | 1,102 | | | $ | 845 | |
| Environmental expenditures | 126 | | | 134 | | | 75 | | | 11 | |
| Nuclear fuel | 445 | | | 298 | | | 284 | | | 334 | |
| Transmission expenditures | 473 | | | 516 | | | 458 | | | 498 | |
Other capital expenditures(2) | 933 | | | 919 | | | 933 | | | 868 | |
| Total capital expenditures | $ | 2,565 | | (3) | $ | 3,189 | | | $ | 2,852 | | | $ | 2,556 | |
Notes
(1) TVA plans to fund these expenditures with cash from operations and proceeds from power program financings. This table showsEstimated capital expenditures only include expenditures that are currently planned. Additional expenditures may be required, among other things, for TVA to meet growth in demand for power in its service area or to comply with new environmental laws, regulations, or orders.
(2) Estimated capital expenditures include costs for Gallatin projects that are part of the original activities scheduled in TVA’s CCR Conversion Program of approximately $55 million, $45 million, and $18 million for 2018, 2019, and 2020, respectively. These amounts exclude costs related to any new requirements related to the Gallatin lawsuits. See Item 7, Management's Discussion and Analysis of Financial Condition and Results of Operations — Key Initiatives and Challenges — Coal Combustion Residual Facilities and Note 8.
(3) Other capital expenditures are primarily associated with short lead time construction projects aimed at the continued safe and reliable operation of generating assets.
(4)(3) The numbers above include construction in progress and nuclear fuel expenditures accruedincluded in Accounts payable and accrued liabilities of $77$240 million, nuclear fuel vendor credits of $6 million, and nuclear fuel prepayments made in prior years of $2 million.
TVA continually reviews its capital expenditures and financing programs. The amounts shown in the table above are forward-looking amounts based on a number of assumptions and are subject to various uncertainties. Amounts may differ materially based upon a number of factors, including, but not limited to, changes in assumptions about system load growth, environmental regulation, rates of inflation, total cost of major projects, and availability and cost of external sources of capital. See Forward-Looking Information and Item 1A, Risk Factors.
In the near term, TVA’s cash flows may be negatively impacted by investments in new generation, such as the combined cycle facility at the Allen site, that is not expected to contribute positively to cash flows until put into service.
TVA has certain obligations and commitments to make future payments under contracts, including contracts executed in connection with certain of the planned construction expenditures. The following table sets forth TVA’sTVA estimates total commitments and contingencies at September 30, 2021 are approximately $5.4 billion for the year ended September 30, 2022 and $45.9 billion for the years thereafter. See Note 8 — Leases,Note 11 — Variable Interest Entities, Note 14 — Debt and Other Obligations, and Note 22 — Benefit Plans for theobligations and commitments attributable to leases, VIEs and membership interests of VIEs subject to mandatory redemption, debt and leaseback obligations, and the retirement plan, respectively. TVA's estimate of future payments for other commitments and contingencies at September 30, 2017. See Note 10, Note 11, Note 13, Note 20, and Note 21 for a further description of these obligations and commitments.2021 are set forth in the table below.
|
| | | | | | | | | | | | | | | | | | | | | | | | | | | |
Commitments and Contingencies Payments due in the year ending September 30 |
| | 2018 | | 2019 | | 2020 | | 2021 | | 2022 | | Thereafter | | Total |
Debt(1) | $ | 3,726 |
| | $ | 1,032 |
| | $ | 30 |
| | $ | 1,860 |
| | $ | 1,028 |
| | $ | 16,532 |
| | $ | 24,208 |
|
Interest payments relating to debt(2) | 1,132 |
| | 1,057 |
| | 1,047 |
| | 1,017 |
| | 966 |
| | 16,146 |
| | 21,365 |
|
Debt of VIEs(3) | 36 |
| | 38 |
| | 40 |
| | 41 |
| | 43 |
| | 1,013 |
| | 1,211 |
|
| Interest payments relating to debt of VIEs | 56 |
| | 54 |
| | 52 |
| | 50 |
| | 49 |
| | 543 |
| | 804 |
|
| Notes payable | 53 |
| | 46 |
| | 23 |
| | — |
| | — |
| | — |
| | 122 |
|
| Interest payments relating to notes payable | 1 |
| | 1 |
| | — |
| | — |
| | — |
| | — |
| | 2 |
|
| Lease obligations | | | |
| | | | |
| | |
| | | | |
|
Capital(4) | 52 |
| | 51 |
| | 51 |
| | 51 |
| | 51 |
| | 519 |
| | 775 |
|
Non-cancelable operating(5) | 33 |
| | 26 |
| | 25 |
| | 25 |
| | 11 |
| | 3 |
| | 123 |
|
| Purchase obligations | |
| | |
| | |
| | |
| | |
| | |
| | |
|
Power(6) | 252 |
| | 275 |
| | 268 |
| | 253 |
| | 231 |
| | 1,351 |
| | 2,630 |
|
Fuel(7) | 1,431 |
| | 872 |
| | 498 |
| | 394 |
| | 212 |
| | 1,008 |
| | 4,415 |
|
Other(8) | 203 |
| | 102 |
| | 29 |
| | 40 |
| | 61 |
| | 299 |
| | 734 |
|
Gallatin coal combustion residual facilities(9) | 58 |
| | 56 |
| | 34 |
| | 7 |
| | 6 |
| | 829 |
| | 990 |
|
| Environmental Agreements | 2 |
| | 3 |
| | 1 |
| | 1 |
| | 1 |
| | 7 |
| | 15 |
|
| Membership interests of variable interest entity subject to mandatory redemption | 2 |
| | 2 |
| | 3 |
| | 3 |
| | 3 |
| | 20 |
| | 33 |
|
| Interest payments related to membership interests of variable interest entity subject to mandatory redemption | 2 |
| | 2 |
| | 2 |
| | 2 |
| | 2 |
| | 9 |
| | 19 |
|
| Flood response commitment to NRC | 8 |
| | 20 |
| | — |
| | — |
| | — |
| | — |
| | 28 |
|
| Unfunded loan commitments | 12 |
| | — |
| | — |
| | — |
| | — |
| | — |
| | 12 |
|
| Long-term monitoring costs - Kingston ash spill | 1 |
| | 1 |
| | 1 |
| | 1 |
| | 1 |
| | 14 |
| | 19 |
|
| Payments on other financings | 60 |
| | 59 |
| | 60 |
| | 217 |
| | 35 |
| | 244 |
| | 675 |
|
Retirement Plan(10) | 300 |
| | 300 |
| | 300 |
| | 300 |
| | 300 |
| | 4,200 |
| | 5,700 |
|
| Other contractual obligations | 3 |
| | — |
| | — |
| | — |
| | — |
| | — |
| | 3 |
|
| Total | $ | 7,423 |
| | $ | 3,997 |
| | $ | 2,464 |
| | $ | 4,262 |
| | $ | 3,000 |
| | $ | 42,737 |
| | $ | 63,883 |
|
| | | | | | | | | | | | | | | | | | | | | | | | | | | | | | | | | | | | | | | | | |
Other Commitments and Contingencies Payments due for the years ending September 30 |
| | 2022 | | 2023 | | 2024 | | 2025 | | 2026 | | Thereafter | | Total |
| | | | | | | | | | | | | |
Interest payments relating to debt(1) | $ | 958 | | | $ | 936 | | | $ | 935 | | | $ | 906 | | | $ | 852 | | | $ | 12,250 | | | $ | 16,837 | |
| | | | | | | | | | | | | |
| Interest payments relating to debt of VIEs | 49 | | | 47 | | | 45 | | | 44 | | | 42 | | | 363 | | | 590 | |
| Interest payments relating to membership interests of VIEs subject to mandatory redemption | 2 | | | 1 | | | 1 | | | 1 | | | 1 | | | 5 | | | 11 | |
| | | | | | | | | | | | | |
| | | | | | | | | | | | | |
| | | | | | | | | | | | | |
| | | | | | | | | | | | | |
| | | | | | | | | | | | | |
| Purchase obligations | | | | | | | | | | | | | |
Power(2) | 313 | | | 224 | | | 237 | | | 196 | | | 177 | | | 1,222 | | | 2,369 | |
Fuel(3) | 1,525 | | | 759 | | | 506 | | | 402 | | | 242 | | | 1,060 | | | 4,494 | |
Other(4) | 171 | | | 90 | | | 44 | | | 28 | | | 52 | | | 201 | | | 586 | |
| | | | | | | | | | | | | |
| | | | | | | | | | | | | |
| Flood response commitment to NRC | 27 | | | — | | | — | | | — | | | — | | | — | | | 27 | |
| | | | | | | | | | | | | |
| | | | | | | | | | | | | |
| | | | | | | | | | | | | |
| | | | | | | | | | | | | |
| | | | | | | | | | | | | |
| Total | $ | 3,045 | | | $ | 2,057 | | | $ | 1,768 | | | $ | 1,577 | | | $ | 1,366 | | | $ | 15,101 | | | $ | 24,914 | |
Notes
(1) Does not include noncash items of foreign currency exchange gain of $125 million, unamortized debt issue costs of $59 million, and net discount on sale of Bonds of $93 million.
(2) Includes the effects of interest rate derivatives employed to manage interest rate risk.
(3) Debt of VIEs does not include the noncash item of unamortized debt issue costs of $11 million.
(4) Includes the interest component of capital leases based on the interest rates stated in the lease agreements and excludes certain related executory costs. Minimum commitments related to executory costs are included in purchase obligations.
(5) Does not include purchased power agreements that are accounted for as operating leases and included in power purchase obligations.
(6)(2) Includes commitments for energy and/or capacity under power purchase agreements ("PPAs") from coal-fired, hydroelectric, diesel, renewable, and gas-fired facilities, as well as transmission service agreements to support purchases of power from the market. Certain PPAs are accounted for as leases and have lease and non-lease components. For these contracts, the lease component is included in lease obligations (see Note 8 — Leases) and the non-lease component is included in power, except for PPA contracts containing a lease component that have not commenced in which case the entire contract amount is included above.
(7)(3) Includes commitments to purchase nuclear fuel, coal, and natural gas, as well as related transportation and storage services.
(8)(4) Primarily includes long-term service contracts, contractscontracts that contain minimum purchase levels for the purchase of limestone along with related storage and transportation, and contractual obligations related toto TVA's load control programs.program.
(9) Includes $899 million long-term liability for costs of constructing a lined facility onsite and excavating and moving the ash and $91 million of estimated costs related to construction of a permanent bottom ash dewatering facility and wastewater process ponds. The estimated capital expenditures represent costs for Gallatin projects that are part of the original activities scheduled in TVA’s CCR Conversion
EnergyRight® Program. See Note 8.
(10) Pursuant to amendments to the TVA Retirement System ("TVARS") Rules and Regulations that became effective October 1, 2016, TVA will contribute to TVARS for a period of 20 years (2017-2036) or, if earlier, through the fiscal year in which it is determined by actuarial valuation that TVARS has reached and remained at a 100 percent funded status, an amount not less than the greater of (a) the minimum required TVARS actuarial valuation contribution or (b) $300 million. In 2017, TVA contributed a total of $800 million, which was $500 million more than required under the TVARS Rules and Regulations. Although this additional $500 million is allowed to be credited to future years to reduce future required contributions, TVA intends to continue contributing the greater of (a) the minimum required TVARS actuarial valuation contribution or (b) $300 million.
In addition to the obligations above, TVA has energy prepayment obligations in the form of revenue discounts. See Note 1 — Energy Prepayment Obligations.
|
| | | | | | | | | | | | | | | | | | | | | | | | | | | |
Energy Prepayment Obligations Obligations due in the year ending September 30 |
| | 2018 | | 2019 | | 2020 | | 2021 | | 2022 | | Thereafter | | Total |
| Energy prepayment obligations | $ | 100 |
| | $ | 10 |
| | $ | — |
| | $ | — |
| | $ | — |
| | $ | — |
| | $ | 110 |
|
| Interest payments relating to energy prepayment obligations | 46 |
| | 4 |
| | — |
| | — |
| | — |
| | — |
| | 50 |
|
| Total | $ | 146 |
| | $ | 14 |
| | $ | — |
| | $ | — |
| | $ | — |
| | $ | — |
| | $ | 160 |
|
EnergyRight® Solutions Program. TVA purchases certain loans receivable from its LPCs in association with the EnergyRight® Solutions program. Depending on the nature of the energy-efficiency project, loans may have a maximum term of five years or ten10 years.
The loans receivable are then transferred to a third-party bank with which TVA has agreed to repay in full any loan receivable that has been in default for 180 days or more or that TVA has determined is uncollectible. As of At September 30, 2017,2021, the total carrying amount of the loans receivable, net of discount, was approximately $125$72 million. Such amounts are not reflected in the Other Commitments and Contingencies table above. The total carrying amount of the financing obligation was approximately $144$82 million at September 30, 2017.2021. See Note 69 — Other Long-Term Assets and Note 1112 — Other Long-Term Liabilities for additional information.
Off-Balance Sheet Arrangements
At September 30, 2017,2021, TVA had no off-balance sheet arrangements.
Key Initiatives and Challenges
COVID-19 Pandemic
In 2020, in response to the spread of COVID-19, TVA implemented a company-wide pandemic plan to address specific aspects of the COVID-19 pandemic, and the pandemic plan continually evolves based on medical guidance and federal, regional, and local requirements and guidelines. The pandemic plan included mandatory telework for those employees who do not have to be physically present at a TVA facility or office building to provide mission-essential activities or produce safe, reliable power. Based on ongoing monitoring, COVID-19 continues to pose a significant risk in the U.S. and in the Tennessee Valley region, and as a result TVA has extended the timeframe for workforce reintegration and continues to limit non-essential travel for those not fully vaccinated. At this time, TVA does not anticipate that the telework restrictions will be lifted until January 2022. TVA has and will continue to monitor risk and potential impacts throughout the situation, including impacts from variants.
TVA continues to implement strong physical and cybersecurity measures to ensure that systems remain functional to keep employees, customers, and communities safe and enable TVA to continue achieving its mission to serve the people of the Valley. In addition to measures to protect its workforce, stakeholders, and critical operations, TVA is actively monitoring generation, transmission, and distribution functions. Operations and delivery of energy to customers have not been materially impacted by the COVID-19 pandemic at this time. All TVA recreation areas that had initially closed to slow the spread of the virus have now reopened. Visitor centers at TVA dams remain closed for public and staff safety.
Based on current internal models, TVA estimates that the COVID-19 pandemic had little impact on TVA's sales volume for the year ended September 30, 2021. At this time, TVA does not anticipate sales volume will be materially impacted due to the COVID-19 pandemic beyond 2021. The ultimate impact of the COVID-19 pandemic on TVA's financial condition depends on factors beyond TVA's knowledge or control, including the duration and severity, actions taken to contain its spread and mitigate its effects, and broader impacts of the COVID-19 pandemic on the country and region's economy. See Item 7, Management's Discussion and Analysis of Financial Condition and Results of Operations — Results of Operations — Financial Results — Operating Revenues.
TVA also continues to assess potential supplier performance risks, including procurement of fuel, parts, and services. If suppliers are unable to perform under TVA's existing contracts or if TVA is unable to obtain similar services from other vendors, TVA could experience delays, disruptions, additional costs, or other operational outcomes that may impact generation, maintenance, and capital programs. TVA has seen an increase in supplier impacts as a result of COVID-19, such as delays and price fluctuations, but has been able to manage these impacts through existing contracts and increased lead times and communications with suppliers; therefore, TVA has not experienced significant business disruptions at this time. TVA has also experienced minimal impacts due to force majeure events, with the exception of a manufacturing delay for a major turbine component. A mitigation strategy was developed by TVA and the vendor which reduced impacts to TVA's outage schedule. TVA will continue to monitor the supply base and remain in contact with suppliers to identify potential risks, including impacts on workforce availability due to recently announced special protocols for unvaccinated federal government employees and contractors.
Regulatory Actions. On January 20, 2021, President Biden issued Executive Order 13991, directing federal agencies to implement COVID-19 countermeasures consistent with CDC guidance and establishing a Safer Federal Workforce Task Force (“Task Force”) to develop model safety principles to which all federal agencies would subsequently align their pandemic countermeasures. TVA continues to implement these principles and remains in regular contact with the Office of Management and Budget (“OMB”), which chairs the Task Force. On September 9, 2021, President Biden issued two new executive orders in response to the COVID-19 pandemic. The first executive order required that all federal employees be vaccinated against COVID-19. Only employees entitled to certain accommodations under law would be exempt from this requirement. The Task Force has stated that all employees must be fully vaccinated by November 22, 2021. TVA is working with its union partners and workforce to meet this deadline. As part of the process to implement the vaccination requirement, TVA and its union partners have negotiated and implemented a standalone disciplinary process for employees who have neither been vaccinated by the deadline nor received an exemption allowed by law. This policy includes a progression of counseling for employees and, for those who do not get vaccinated after counseling, a testing program.
The second executive order required that federal agencies include clauses in contracts with federal contractors requiring the contractors to comply with guidance issued by the Task Force concerning contractors. This executive order does not apply to TVA, and therefore TVA is not requiring the clauses at this time.
On November 4, 2021, the Occupational Safety and Health Administration (“OSHA”) issued an Emergency Temporary Standard ("ETS") in response to the COVID-19 pandemic. The ETS, among other things, obligates employers with at least 100 employees to adopt a vaccination policy that requires employees to either be fully vaccinated or submit to at least weekly testing. The deadline for implementing the vaccination/testing program is January 4, 2022.
The ETS does not apply to any federal contractors that must comply with the Task Force contractor guidance. TVA has not required its contractors to comply with the Task Force guidance. Therefore, unless those contractors are required to follow Task Force guidance based on contractual relationships with other federal agencies, TVA's contractors would be covered by the ETS.
OSHA has also stated that the ETS does not apply to federal agencies; rather, federal agencies are covered by the vaccination requirement established by President Biden on September 9, 2021. The Task Force has stated that federal employees should be vaccinated by November 22, 2021, and has confirmed that this deadline remains in effect. Accordingly, TVA is continuing to work toward this deadline.
On November 5, 2021, the United States Court of Appeals for the Fifth Circuit issued an order staying the ETS pending further action by the court. Employers will not be required to comply with the ETS until the stay is lifted.
Customer Pandemic Initiatives. The COVID-19 pandemic created economic uncertainty for TVA's customers and the communities they serve. To support and strengthen the public power response to the COVID-19 pandemic, TVA announced the following initiatives:
Regulatory Flexibility. TVA continues to provide regulatory flexibility for LPCs to halt disconnection of services and respond to the local needs of their customers and communities.
Program Flexibility. In 2020, TVA established flexibility provisions for certain economic development programs for participating customers impacted by the COVID-19 pandemic. These provisions were made available through the December 2020 application period, which provided flexibility to customers through 2021. TVA also offered deferral options for EnergyRight® program loan payments, through October 31, 2020, for customers experiencing financial hardship. All EnergyRight® loans approved for the deferral period resumed payments in the second quarter of 2021. See Note 9 — Other Long-Term Assets, Note 12 — Other Long-Term Liabilities, and Note 18 — Revenue.
Financial Support. In 2020, the TVA Board approved the Public Power Support and Stabilization Program. Through this program, TVA offered up to $1.0 billion of credit support to LPCs that demonstrated the need for temporary financial relief, through the deferral of a portion of LPCs' wholesale power payments owed to TVA. The program ended December 31, 2020, with a total of $1 million of credit support approved under the program. The $1 million was fully repaid in the second quarter of 2021.
Back-to-Business Credit Program. TVA created the Back-to-Business Credit Program to enable TVA and LPCs to provide relief to certain large customers affected by the COVID-19 pandemic by providing certain credits when returning to operations. As of September 30, 2021, TVA had provided approximately $13 million in Back-to-Business credits under this program since its inception, with over $3 million provided for the year ended September 30, 2021. This program ended September 30, 2021.
Community Care Fund. TVA also continues to partner with LPCs through the Community Care Fund by making available over $9 million in TVA matching funds to support local initiatives that address hardships created by the COVID-19 pandemic. As of September 30, 2021, over $4 million in matching funds had been provided by TVA, with nearly $2 million provided for the year ended September 30, 2021.
Pandemic Credits. In August 2020, the TVA Board approved a Pandemic Relief Credit that was effective for 2021. The 2.5 percent monthly base rate credit, which totaled $221 million for 2021, applied to service provided to TVA's LPCs, their large commercial and industrial customers, and TVA directly served customers through September 2021. In August 2021, the TVA Board approved a 2.5 percent monthly base rate credit, the Pandemic Recovery Credit, which will be effective for 2022. The credit, expected to approximate $220 million, will also apply to service provided to TVA's LPCs, their large commercial and industrial customers, and TVA directly served customers. In November 2021, the TVA Board approved a 1.5 percent monthly base rate credit, which is an extension of the Pandemic Recovery Credit, to be effective for 2023. The 2023 credit is expected to approximate $133 million, and it will be administered in a manner similar to the Pandemic Recovery Credit.
These actions show TVA's commitment to support the financial integrity of LPCs along with communities and customers across the Tennessee Valley during these challenging economic conditions caused by the COVID-19 pandemic. The COVID-19 pandemic is an evolving situation that may lead to extended disruption of economic activity and an adverse impact on TVA's
results of operations. TVA continues to closely monitor developments and will adjust its response as necessary to ensure reliable service while protecting the safety and health of its workforce.
Distributed Energy Resources
The primary change Consumer desire for power generatorsenergy choice, among other things, is driving the expectation for flexible options in the coming years is expected to involve DER as they continue to play an increasingly strong role in the country’s energy future. As technologies for producing energy using distributed solar, micro turbines, and other types of smaller scale DER are evolving, they are becoming more cost-competitive. Absorbing the previous impact of electricity from the small number of distributed generation sites was well within the capacity of a system the size of TVA’s. As the amount of DER grows on the TVA system, the need for TVA’s traditional generation resources may be reduced, and the ability of the system to reliably and economically operate in conjunction with these DER sources may become more challenging. To meet this challenge, TVA is working with LPCs and others on long-term pricing and product development strategies that include DER and address the implementation and support of those resources.
As it transitions away from coal to other resources, TVA continues to identify significant impacts to its transmission system that include stress on its transmission equipment, such as lines and transformers. While TVA owns and operates its high-voltage transmission grid, the distribution system is a network of grids belonging to LPCs, each with its own characteristics and operational strengths and challenges. Integrating renewable generation (primarily photovoltaic solar and combined heat and power projects) presents a number of challenges, including grid balancing and reliability. The growth of renewable resources on the distribution grid necessitates the involvement of entities in addition to TVA, especially the LPCs. electric industry. TVA and LPCs are working together to leverage the strengths of the Tennessee Valley public power model to provide distributed energy solutions that are economical, sustainable, and flexible. TVA will need to focus on the safety and reliability impactimpacts of these resources as they are interconnected to the grid as well as ensuringand will ensure that the pricing of electricity remains as low as feasible. As generationAdditional regulatory considerations and analysis may be required as the distributed energy resources become more distributed("DER") market, technologies, and intermittent, the need to extend secure communication networks for visibility and control becomes even more important in maintaining grid reliability.programs evolve.
Moving towards a more diverse resource mix,Fiber Optic Network. In 2017, the TVA Board approved aauthorized up to $300 million strategic fiber initiative in May 2017 to be spent over the next 10 years, for upgradessubject to the transmission systemannual budget availability and necessary environmental reviews, to maintain reliability. By investing in these upgrades, TVA plans to be inbuild an enhanced fiber optic network that will better connect TVA's operational assets. Fiber is a position to move to more distributed power generation from many smaller sourcesvital part of generation and to begin to price its products at different rates during different times of the day and season.TVA's modern communication infrastructure. The new fiber optic lines will also giveimprove the reliability and resiliency of the generation and transmission system while enabling the system to better accommodate DER as they enter the market. As of September 30, 2021, TVA had spent $151 million on installation of the potentialfiber optic lines and expects to make fiber capacity available to help local communities in rural areas attract and retain jobs. Due to uncertainties related to the technology choices and market penetration rates for DER options, TVA cannot currently predict the potential financial impacts from the future growth in DER, but it is anticipated that future growth will be a part of TVA’s overall strategy to meet customer demand inspend an evolving marketplace. See Item 1, Business —Power Supply and Load Management Resources—Distributed Energy Resources.additional $149 million.
Electric Vehicles. TVA is partnering with LPCs and others to support the electrification of transportation in the Valley in a multi-year electric vehicle ("EV") initiative. The initiative focuses on reducing or eliminating EV market barriers by setting EV policies, improving charging infrastructure availability, expanding EV availability and offerings, and spreading EV consumer awareness. In November 2020, the TVA Board approved new policies and an optional wholesale EV rate aimed at encouraging the development of charging infrastructure in the Valley. The updated policies enable LPC investment in public charging infrastructure and allow for the conditional resale of electricity, for transportation purposes only, by any charging developer on a kWh basis. The optional wholesale rate was developed with high power EV charging in mind and provides a stable option for those developing charging infrastructure.
TVA is also working with state agencies, LPCs, and third-party charging developers to create a network of public fast charging stations along major travel corridors in its seven-state region, known as the Fast Charge Network program. In February 2021, TVA began a partnership with the State of Tennessee to develop funding programs for a statewide EV fast charging network with plans for fast charging stations every 50 miles along Tennessee's interstates and major highways. In March 2021, TVA and five other major utilities formed the Electric Highway Coalition to develop a network of fast charging stations along all major highway routes within their service territories. Since formation, the Electric Highway Coalition has gained additional members committed to coordination on the development of EV charging infrastructure across the central U.S.
Changing Customer Preferences
As more consumers and businesses are demanding cleaner and greener energy, the utility industry is evolving to meet those needs. As TVA also evolves, it will see impacts to the way it does business fromthrough the pricing of products, transmission of energy, and development of new products and services for its customers in support of changing customer preferences and its economic development efforts. End-use customers are becoming more technologically savvysophisticated and want greater control over their energy usage. LargerMany companies are focusing more on sustainability and requiring more energy efficiency and renewable energy options. In addition, TVA also seeks to obtain greater amounts of its power supply from clean resources to work towards carbon emission reductions. As a result, TVA is increasing its renewable energy portfolio by investing in existing assets and securing power purchase agreements from out-of-Valley wind and in-Valley solar generation facilities. New utility-scale solar is increasing, in part driven by customers’ demand. TVA also encourages renewable power and offers renewable solutions through various current programs and offerings.
Renewable Power Solutions. TVA encourages renewable power through various current programs and offerings. These solutions include:
Small-scale Solutions. The Green Connect Program, launched in January 2021, connects residential customers interested in on-site solar installations with qualified solar installers.
Mid-scale Solutions. The Flexibility Research Project was a joint pilot project with LPCs to enable solutions for situations where the end-use consumer needs onsite renewable or distributed generation. The Flexibility Research Project ceased accepting new applications in January 2021 as well as cleaner,TVA introduced other flexible programs and offerings discussed in this section.
Utility-scale Solutions. The Green Invest Program matches customer demand with renewable supply through a Green Invest Agreement. The goal of the Green Invest program is to meet the long-term sustainability needs of customers at scale. TVA will procure the needed renewable supply through a diversified approach, which could include a competitive procurement process, strategic partnerships, or construction of renewable facilities to meet these needs. In addition, Generation Flexibility is
a solution available to long-term LPC partners and supports the deployment of up to 2,000 MW of distributed solar to provide clean, local generation. See Ratemaking below.
greener,
Other Renewable Solutions. The Green Switch Program allows customers to support wind, solar, and biomass renewable resources through purchasing renewable energy options. generated in the Tennessee Valley, sold in 200 kWh blocks. The continuing challengeGreen Flex Program gives commercial and industrial customers the ability to meet sustainability goals and to make renewable energy claims through RECs from wind generation located outside TVA's service area.
Renewable Power Purchase Agreements. In recent years, TVA has issued request for proposals ("RFP") in order to meet customer preferences and requirements for cleaner energy. As a result of those RFPs, TVA entered into certain PPAs with renewable resource providers, which are summarized below:
Notes
(1) The 2017 RFP consists of four solar PPAs; however one of those projects is not moving forward, and the PPA for that project has been terminated. Of the remaining three projects, one came online in the fourth quarter of 2021, one is expected to come online in 2022, and one is expected to come online in 2023.
(2) The 2019 RFP consists of six solar PPAs, and the projects are expected to come online in 2023.
(3) The 2020 RFP consists of eight solar PPAs. Of these eight projects, six are expected to come online in 2023, one is expected to come online in 2024, and one is expected to come online in 2025.
(4) In addition, the 2019 RFP includes 50 MW of battery storage and the 2020 RFP includes 196 MW of battery storage that are not included in the chart above.
TVA issued an additional RFP during the third quarter of 2021 for up to 200 MW of new renewable energy and anticipates making selections in 2022. TVA will procure the renewable energy and sell the resulting Renewable Energy Certificates ("RECs") to specific customers, allowing TVA to increase its renewable energy portfolio without additional costs to other Tennessee Valley customers. These agreements help to align the core values of TVA and the public power model with the desire of TVA's customers for renewable energy. Of the renewable PPAs above, more than 2,000 MW has been matched to customers through TVA’s Green Invest Program to meet their needs for new-to-the-world renewable energy.
Self-Directed Solar. During 2019, the TVA Board approved the opportunity for TVA and others is finding ways to meetexplore being directly involved in the needs and preferencesdevelopment of customers while successfully developing flexible pricing models to accommodate the evolving markets.
TVA’s Integrated Resource Plan ("IRP") considered a wide range of supply-side generating resources, including modeling energy efficiency as an energy resource, as well as a broad range of feasible demand-side options. These options were assessed with respect to financial, economic, and environmental impacts. TVA is developing and managing demand-side energy resources in collaboration with LPCs and electric customers, particularly around deployment of additional energy efficiency resources. Previously mandated energy efficiency standards have been reducing the amount of electricity used by customers and have been factored into TVA’s long-range plans.
Generation Resources
Nuclear Response Capability. Since the events that occurred in 2011 at the Fukushima Daiichi Nuclear Power Plant ("Fukushima Events"), the NRC adopted additional detailed guidanceutility-scale solar project, contingent on the expected response capabilitysuccessful completion of environmental reviews under NEPA and other applicable laws. A project structure has been developed which will allow TVA to be developed by each nuclear plant site. The NRC issued orders that modified each plant’s license to require implementation of additional external event mitigation capabilities.work with financial partners for solar development, and in September 2021, TVA has implemented these strategies and physical plant modifications to address the actions outlined inpurchased land for this guidance at Sequoyah and Watts Bar. Implementation is in progress at Browns Ferry and is scheduled to be completed in 2019.planned 200 MW development. As of September 30, 2017,2021, TVA had spent $267approximately $24 million on modifications related to these actions at all of its nuclear plants, including Watts Bar Unit 2,the project and expects to spend an additional $16$293 million through 2024.
Low-Income Energy Efficiency Programs. Through the Home Uplift Program, TVA is partnering with LPCs, state and local governments, non-profit agencies, energy efficiency advocates, third-party contributors, and the Tennessee Valley Public Power Association ("TVPPA") to complete home evaluations and make high-impact home energy upgrades for qualifying homeowners. In addition, TVA and LPCs conduct workshops to educate homeowners about low and no-cost energy efficiency upgrades that improve their quality of life. Through the remaining modifications intendedSchool Uplift Program pilot, TVA is partnering with LPCs as well as state and local governments to addressassist schools with adopting strategic energy management practices. The engagement with each school includes monthly virtual workshops and fosters performance through competitions for energy efficiency grants and grants for solar pavilions. Finally, through the Community Centered Growth Program, TVA is partnering with LPCs to assist small businesses located within underserved communities with energy evaluations and no-cost energy improvement investments.
Automated Energy Exchange Platform
TVA and other utilities across the southeastern U.S. are exploring the creation of an automated energy exchange platform across the region, to facilitate more short-term power exchanges. The energy exchange would be an enhancement to the existing market. The creation of this guidance.energy exchange platform requires approval of the FERC, which regulates the transmission and wholesale sale of electricity in interstate commerce. The utilities under full FERC jurisdiction filed for approval of the energy exchange on February 12, 2021, and although not subject to FERC’s jurisdiction with respect to the energy exchange, TVA intervened in support of the FERC proceeding and joined with the other utilities in answering comments offered by interested parties. On May 4, 2021, FERC issued a deficiency letter in which it requested more detail on several aspects of the Southeast Energy Exchange Market ("SEEM"). The utilities under full jurisdiction filed a response on June 7, 2021, in which they provided the detail that FERC requested and also offered several improvements to SEEM. FERC issued a second deficiency letter on August 6, 2021, and the utilities under full jurisdiction filed a response on August 11, 2021. On October 12, 2021, SEEM took effect as a result of a tie vote by FERC commissioners. TVA’s participation will be subject to TVA Board approval and the completion of appropriate environmental reviews. These discussions demonstrate TVA's commitment to seeking new ways to continue to deliver low-cost power to the Tennessee Valley.
Sustainability Reports
Sustainability has been a critical part of TVA's mission since the TVA Act was signed in 1933 and continues to be a focus in TVA's mission to deliver affordable and reliable energy, steward the environment, and create sustainable economic growth. TVA issued its first Corporate Sustainability Report in 2020, which highlighted the energy, environmental, economic, and societal impacts of TVA's everyday activities. In 2021, TVA continued to highlight its sustainability efforts with issuances of its next Corporate Sustainability Report, a supplemental Carbon Report, and an Edison Electric Institute Environmental, Social, Governance and Sustainability Report, among others.
Strategic Financial Plan
In 2019, the TVA Board approved an annual budget that reflects the first year of a new Strategic Financial Plan. This Strategic Financial Plan, which extends from 2020 through 2030, is flexible in aligning customer preferences and TVA's mission while at the same time establishing a long-term forecast of financial results. Key focus areas of the Strategic Financial Plan include maintaining flat rates, stabilizing debt, establishing alignment between the length of LPC contracts and TVA's long-term commitments, driving efficiencies into the business, and advancing the public power model. As TVA executes the plan, key assumptions and focus areas may change.
In 2021, TVA retained Lazard Frères & Co. LLC ("Lazard"), an international financial advisory and asset management firm, to evaluate TVA’s financial performance from 2014 through 2020 against TVA’s 2014 long-range financial plan ("2014 Plan"). Further, Lazard also reassessed whether the public power model and TVA’s existing business structure are reasonable approaches to support TVA’s mission, consistent with the scope of analysis and findings from Lazard’s 2014 Strategic Assessment Report ("2014 Lazard Report"). In the 2021 report, Lazard concluded that TVA’s financial performance from 2014 through 2020 has been strong when measured against the financial performance objectives as set forth in TVA’s 2014 Plan and the performance of other large utility companies. Lazard also concluded that TVA’s performance in recent years and current positioning suggest that the public power model is a reasonable approach to support TVA’s mission. In addition, the 2021 report reaffirmed that Lazard’s previous conclusions from the 2014 Lazard Report with respect to the benefits and considerations of the public power model compared against alternative business models are still valid today.
Generation Resources
Extreme Flooding Preparedness. Updates to the TVA analytical hydrology model completed in 2009 indicated that under “probable"probable maximum flood”flood" conditions, some of TVA’sTVA's dams might not have been capable of regulating the higher flood waters. A “probable"probable maximum flood”flood" is an extremely unlikely event; however, TVA is obligatedhas a responsibility to provide protection for its nuclear plants against such events. As a result, TVA installed a series of modifications at three of the four dams, and work on the fourth, Fort Loudoun Dam, is continuing in parallel with a Tennessee Department of Transportation project. The work being done by the State of Tennessee to support the Fort Loudoun Dam modifications is estimated to be completed by the end of CY 2017. TVA's Fort Loudoun Dam modifications are estimated to be completed in 2018. TVA is taking steps to ensure that it complies with the NRC license requirements for Watts Bar related to the completion of the project.dams.
Since 2009, TVA has performed further hydrology modeling of portions of the TVA watershed using updated modeling tools. TVA also substantially completed a series of permanent modifications to several other dams identified through the more recent analytical work. The modifications addressed and rectified the potential for certain dams to be overtopped during a “probable maximum flood” event as well as the potential for certain other dams to become unstable under “probable maximum flood” conditions. TVA has also made various improvements to plant protection features at Watts Bar and Sequoyah.
The revised hydrology models were reviewed and approved by the NRC for Watts Bar Nuclear Plant ("Watts Bar") Units 1 and 2. However, TVA identified an error in the modeling that will require the models for Watts Bar Units 1 and 2 to be resubmitted. TVA plans to resubmit models for Watts Bar Units 1 and 2.2 in 2022. In addition, TVA plans to seek NRC approvalsubmitted models for similar modeling for Sequoyah Nuclear Plant ("Sequoyah") Units 1 and 2 andin 2020. As a result of the recently identified necessary changes to dam stability assumptions, TVA will submit a revision to the Sequoyah model in 2022. TVA will subsequently address conditions at Browns Ferry as needed. TVA has deferred some modifications until the updated Watts Bar and Sequoyah models are completed.
As of September 30, 2017,2021, TVA had spent $150$155 million on the modifications and improvements related to extreme flooding preparedness and expects to spend up to anpreparedness. TVA is deferring the decision on the need for additional $28 million to completemodifications until after the modifications.modeling work is complete.
NRC Seismic Assessments. On May 9, 2014, the NRC notified licensees of nuclear power reactors in the central and eastern United States of the results of seismic hazard screening and prioritization evaluations performed by unit owners and reviewed by the NRC staff. Because the seismic hazards for Browns Ferry, Sequoyah, and Watts Bar had increases in seismic parameters beyond the technical information available when the plants were designed and licensed, TVA must conduct seismic risk evaluations for these plants. TVA completed the risk evaluation for Watts Bar and submitted it to the NRC on June 30, 2017; the evaluation concluded that no additional actions were required. The evaluations for Browns Ferry and Sequoyah are due by December 31, 2019.
Mitigation of Beyond-Design-Basis Events. NRC rulemaking has been developed to codify the requirements promulgated by orders related to beyond-design-basis flooding and seismic events discussed above.events. The NRC staff submitted the draft final rule — Mitigation of Beyond-Design-Basis Events — to the NRC Commission on December 15, 2016, requesting approval to publish the final rule. The final rule is expected to be issued in late CY 2017 or early CY 2018. Minimal changes between the orders and final rule requirements are expected. Once issued, TVA will reviewCommissioners approved the final rule in 2019. TVA plans to identify any gaps to compliance. Gaps could result in TVA having to make modifications to one or more of its nuclear plants. Cost estimatesimplement the requirements for any required modifications cannot be developed until after the rule is finalized, but costs for modifications could be substantial. See Extreme Flooding Preparedness and NRC Seismic Assessments above.
Baffle-Former Bolt Degradation. In July 2016, Westinghouse Electric Co., LLC ("Westinghouse") issued a Nuclear Safety Advisory Letter (“NSAL”) 16-01 that addresses recently identified degradation of baffle-former bolts in some U.S. pressurized water reactors (“PWRs”). Baffle-former bolts help hold together a structure inside certain reactor vessels. Sequoyah Units 1 and 2, both PWRs, are referenced in the NSAL. Visual inspections of baffle-former bolts in Sequoyah Units 1
and 2 during 2017 refueling outages showed no degradation of baffle-former bolts. TVA is planning to complete ultrasonic inspections during the Sequoyah Unit 1 refueling outage in the spring of 2018 and the Sequoyah Unit 2 refueling outage in the fall of 2018.
Potential Issues Involving Nuclear Components. On January 10, 2017, the NRC released a list of nuclear units that are potentially impacted by AREVA components forged by Le Creusot Forge in France. Sequoyah Unit 1 and Watts Bar Unit 1 are included inby 2022 and for Browns Ferry by 2023. A gap review of the list because they received steam generator components from Le Creusot Forge. Two separate issues relatingrevised rule has been performed, and no new gaps to the AREVA componentscompliance were identified. One issue involves the level of carbon in some forgings, which may compromise the components’ structural integrity over time. Neither the NRC nor AREVA has found any safety concerns with the steam generator components produced by Le Creusot Forge. Additionally, Westinghouse, which supplied the components to TVA, has notified TVA that there are no known issues with the components Westinghouse received from Le Creusot Forge, and TVA is not aware of any issues with the components. TVA will participate with industry working groups investigating the forging issue. The other issue involves apparent documentation discrepancies which do not appear to have affected TVA.
Work Environment at Nuclear Plants. In March 2016, the NRC issued a Chilling Effect Letter ("CEL") to TVA regarding work environment concerns identified at Watts Bar. In subsequent inspections,the mid-cycle assessment letter issued in 2018, the NRC found that Watts Bar still faces challengesissued a Cross Cutting Issue in maintaining a safety conscious work environment. On April 12, 2017,environment ("CCI") and outlined the closure criteria for both the CEL and CCI. In October 2019, TVA providedinformed the NRC with an updated letter outlining focus areasof its CEL and metrics for monitoring performance at Watts Bar. In that letter, TVA made a formal commitment to
CCI closure criteria readiness, and the NRC to conduct a safety culture assessment atcompleted its inspection, resulting in no additional findings with progress noted as documented in its December 2019 inspection report. In March 2020, the NRC issued its Annual Assessment Letter for Watts Bar in CY 2017, which it has completed. On November 2, 2017, the NRC held a public meeting where TVA presented thenoting TVA's progress in addressing the issues.CEL and CCI while stating that the NRC continues to monitor TVA's activities as they deliberate on the appropriate time to close the CEL and CCI. In February 2021, the NRC issued a letter to TVA is working to implementclosing the fleet-wide actions as documented inCEL. In the Confirmatory Order issued on July 27, 2017, that will ensure sustainable improvements in safety culture.
March 2021 Annual Assessment Letter for Watts Bar, Unitthe NRC also closed the CCI.
Apparent Violations of NRC Regulations. On March 2, 2020, the NRC issued a letter to TVA identifying four apparent violations of NRC regulations that prohibit licensees from retaliating against employees for their having raised protected nuclear safety concerns. In June 2020, TVA participated in a pre-decisional enforcement conference before the NRC, and in August 2020, the NRC issued violations to TVA and a notice of proposed imposition of civil penalties in an amount less than $1 million.
TVA submitted a written response to the NRC that denied the violations and opposed the imposition of civil penalties. In October 2020, the NRC issued an order imposing civil penalties in an amount less than $1 million. In November 2020, TVA responded to the NRC, opposing the order and civil penalty and requesting an evidentiary hearing before the NRC's Atomic Safety and Licensing Board ("ASLB"). Watts Bar Unit 2 commenced commercial operationsIn August 2021, TVA filed two Motions for Summary Disposition with the ASLB seeking to have the four violations dismissed. In September 2021, the NRC Staff filed a response to TVA's Motions for Summary Disposition. The ASLB held oral argument on TVA's Motions for Summary Disposition on October 19, 2016. Project costs were $4.7 billion14, 2021. On November 3, 2021, the ASLB granted summary disposition on three of the four violations and were withinin part on the limit approved byfourth violation. On November 8, 2021, the NRC notified TVA Boardthat it was rescinding all four violations, and the NRC and TVA jointly filed a motion to terminate the enforcement proceeding. On November 10, 2021, the ASLB granted this motion.
On March 9, 2020, the NRC issued a letter to TVA identifying twelve apparent violations of NRC regulations: six relating to operational activities and six relating to NRC regulations governing the completeness and accuracy of information. TVA participated in January 2016.a pre-decisional enforcement conference before the NRC in July 2020, and in November 2020, the NRC issued five violations to TVA and a notice of proposed imposition of civil penalties in an amount less than $1 million. TVA submitted a written response to the NRC violations in December 2020, accepting the violations in part and denying them in part, and requesting a reduction of the civil penalties consistent with the denial. On July 23, 2021, the NRC issued final determinations imposing reduced civil penalties in an amount less than $1 million. In August 2021, TVA accepted this final result and paid the civil penalty.
Tritium-Producing Burnable Absorber Rods. TVA was a cooperating agency in the February 2016 Department of Energy ("DOE") Final Supplemental Environmental Impact Statement for the Production of Tritium in a Commercial Light Water Reactor. On April 5,In 2017, due to an anticipated need for more tritium-producing burnable absorber rods ("TPBARs"), the DOE announced its preferred alternative for irradiation services, which included use of an additional reactor. As a result of TVA’sTVA's assessment of and concurrence with the DOE’sDOE's alternative, TVA is planning to submitsubmitted a license amendment request ("LAR") to the NRC in CY 2017 to authorize the irradiation of TPBARs in Watts Bar Unit 2. Subject to approval ofThe NRC approved the license amendment,request in 2019, and TVA began tritium production in Watts Bar Unit 2 is projected to start in the fall ofNovember 2020. The DOE's decision also allows for irradiation of TPBARs at the Sequoyah site in the future; however, TVA does not have plans to employ Sequoyah units for tritium production in the near term. TVA does intend to increase its production in Watts Bar Unit 1, which has provided irradiation services since 2003, beginning in November 2024, to align with a DOE request for increased tritium. TVA is currently working to submit a LAR with the NRC to fulfill this request.
Extended Power Uprate. TVA is undertakinghas undertaken an EPUextended power uprate ("EPU") project at Browns Ferry that is expected to increase the amount of electrical generation capacity of its reactors. The license for each reactor was amended to allow reactor operation at the higher power level. The Browns Ferry EPU license amendments were approved by the NRC on August 14,in 2017, following a nearly two-year review.
TVA plans to begin implementing the EPU project during the plant refueling outages in the spring of 2018 for Unit 3, the fall of 2018 for Unit 1, and the spring of 2019 for Unit 2. Full EPU power is expected to be achieved following the noted outages for each unit. The project has involved and continues to involve extensive engineering analyses and modification and replacement of certain existing plant components to enable the units to produce the additional power requested by the license amendments. Physical work on all units was completed in 2019. The generating capacity was validated through operation of all units for four seasons, completion of additional testing, and issuance of related engineering memos. The project is estimated tohad a total cost approximately $475of $457 million and addincreased nuclear summer net capability by approximately 465 MW353 MW.
Watts Bar Unit 2. During the refueling outage in the first quarter of generating capacity.2021, TVA identified degraded steam generator conditions on Watts Bar Unit 2. Based on a continued operational assessment, TVA submitted a License Amendment Request that supported unit operation until September 2021, which was approved by the NRC in June 2021. A project team was put in place to ensure operational assessments, analysis work, and regulatory interface occurred to allow for a safe and efficient mid-cycle steam generator inspection. Watts Bar Unit 2 remained at 90 percent of rated output until assessments were complete and the mid-cycle outage began inSeptember 2021. The mid-cycle outage concluded in October 2021 and focused on an inspection protocol with multiple contingency repair strategies such that safe and reliable operation can be assured until the permanent steam generator replacement occurs. Watts Bar Unit 2 will remain below 95 percent of rated output until the permanent replacement occurs, which is projected for March 2022.
Plant Closures. Results of assessments performed at Paradise and Bull Run were presented to the TVA Board at its February 2019 meeting. The TVA Board approved the retirement of Paradise Unit 3 by December 2020 and Bull Run by December 2023. Subsequent to the TVA Board approval, TVA determined that Paradise would not be restarted after January 2020 due to the plant's material condition. Paradise Unit 3 was taken offline on February 1, 2020, effectively retiring the plant. See Note 21 —Legal Proceedings7 — Administrative Proceeding Regarding Browns Ferry Nuclear Plant Extended Power Uprate.Closures.
Performance of SuppliersOptimum Energy Portfolio. On March 29, 2017, Westinghouse, a subsidiary of Toshiba Corporation ("Toshiba"), filed for protection under Chapter 11TVA must continuously evaluate all generating assets to ensure an optimal energy portfolio that provides safe, clean, and reliable power while maintaining flexibility and fiscal responsibility to the people of the United States Bankruptcy Code. TVA currently has several contracts with Westinghouse and Toshiba, including contracts for the enrichment and fabrication of nuclear fuel and the manufacture of a steam generator, as well as several ongoing agreements for maintenance and outage support at its nuclear and coal-fired plants. TVA is assessing potential performance impacts, including procurement of parts and services as well as outage schedules. Westinghouse and Toshiba are currently performing under the TVA contracts; however, if either supplier is unable to perform under TVA's existing contracts and TVA is unable to obtain similar services or required intellectual property at similar terms from other vendors, TVA could experience delays, disruptions, additional costs, or other operational outcomes which TVA cannot predict at this time, but which could be material.
Clean Air Projects.Tennessee Valley. During 2011,2019, the TVA Board approved the additionIntegrated Resource Plan, which recommended an action to evaluate the engineering end-of-life of emission control equipment at Gallatin. TVA completedaging fossil units. TVA’s recent evaluation confirms that the addition of scrubbers onaging coal fleet is among the four Gallatin units during 2016oldest in the nation and is currently installing selective catalytic reductionexperiencing deterioration of material condition and performance challenges. The performance challenges are projected to increase due to the coal fleet’s advancing age and the difficulty of adapting the coal fleet’s generation within the changing generation profile. Additionally, the coal fleet is contributing to environmental, economic, and reliability risks. Therefore, TVA is evaluating the impact of retiring the balance of the coal-fired fleet by 2035. TVA is also considering plans for
additional generating facilities to replace retiring or expiring capacity and to support a low cost, reliable, flexible, and increasingly clean power system.
TVA will prepare environmental reviews pursuant to the National Environmental Policy Act ("SCR"NEPA") systems on these units. The first two SCRs were placed in service in June 2017prior to retiring or building a plant. Environmental reviews evaluating the potential retirement of the Cumberland Fossil Plant ("Cumberland") and July 2017. It is currently anticipated that the remaining two SCRs will be operational in the fall of 2017.Kingston Fossil Plant ("Kingston") and replacement with other generation are now underway. In addition, at its December 30, 2014 meeting,on November 10, 2021, the TVA Board authorized the installationCEO to evaluate, decide upon, and complete, if necessary, the retirements of SCRsCumberland and scrubbersKingston plants and replacement generation projects, subject to complying with all required environmental reviews, periodically updating the TVA Board on Units 1plans and 4actions, and notifying the TVA Board before making final decisions. The TVA Board approved a budget of up to $3.5 billion for these projects.
Decarbonization. TVA seeks to obtain greater amounts of its power supply from clean resources to work towards carbon emission reductions and is making investments in its generating portfolio to modernize the fleet while also allowing TVA to maintain competitive rates and high reliability. In addition, TVA's sixth transformative initiative, decarbonization, commenced in 2022 and is aimed at Shawnee. Itunderstanding and applying clean resources to support the reduction of carbon emissions from its power supply. Related to its carbon reduction efforts, TVA has established six guiding principles which are as follows:
•Prioritize the needs of Valley stakeholders as TVA works to achieve its goals by maintaining low rates and high reliability, and attracting new jobs in the Valley.
•Use best-available science and support research and policies that further carbon-free dispatchable technologies.
•Partner with long-term LPCs and other customers and communities to support economy-wide decarbonization efforts and the strategic electrification of other sectors, such as transportation.
•Maintain nuclear generation, hydro generation, and a strong transmission grid as key enabling assets.
•Be transparent with stakeholders in measuring and sharing TVA's progress, and listen and work effectively with all its stakeholders to understand their priorities and needs.
•Adapt to new technologies and changing policies, and be willing and open to changing TVA's plans and projects to achieve deep carbon reduction.
Natural Gas-Fired Units.During 2019, the TVA Board approved an expansion of approximately 1,500 MW of peaking gas replacement capacity at two combustion turbine gas facilities to coincide with the retirement of Allen combustion turbine units 1-20 and Johnsonville combustion turbine units 1-16, contingent on the successful completion of environmental reviews under NEPA and other applicable laws. In 2020, detailed design and engineering work began at TVA’s Paradise and Colbert sites to further scope out the projects and supply information needed for the NEPA review. In July 2021, environmental reviews under NEPA and other applicable laws were complete, and TVA received the air permits for the Paradise and Colbert facilities in August 2021 and September 2021, respectively. Each project is anticipatedexpected to increase combustion turbine generation capacity by 750 MW at a cost not to exceed approximately $503 million per project. As of September 30, 2021, TVA had spent approximately $325 million on these expansions for the design and engineering work and for long lead time equipment that could be used at any site. TVA expects to spend an additional $681 million on these systems willexpansions and expects both projects to enter commercial operations by the end of CY 2023.
During 2019, the TVA Board approved approximately 500 MW for an aeroderivative combustion turbine project, at a cost not to exceed $499 million, contingent on the successful completion of environmental reviews under NEPA and other applicable laws. In 2020, detailed design and engineering work began at TVA’s Johnsonville site to further scope out the project and supply information needed for the NEPA review. As of September 30, 2021, TVA had spent approximately $103 million on the design and engineering work and for long lead time equipment that could be operational duringused at any site. TVA expects to spend an additional $396 million on these expansions and expects the first quarterproject to enter commercial operations by the end of 2018.CY 2024.
Coal Combustion Residual Facilities. Residuals Facilities. TVA has committed to a programmatic approach tofor the elimination of wet storage of CCRscoal combustion residuals ("CCR") within the TVA service area. Under this program (the “CCR Conversion Program”("CCR Program"), TVA has committed to (1) convertperformed stability remediation, completed the conversion of all operational coal-fired plants to dry CCR storage, (2) closeand is now closing all remaining wet storage facilities, and (3) meet all applicable state and federal regulations. To carry out its CCR Conversion Program, TVA is undertaking the following actions:facilities.
Dry generation and dewatering projects. Conversion of coal plant CCR wet processes to dry generation or dewatering is complete at Bull Run, Shawnee Fossil Plant ("Shawnee"), and construction is underway at Kingston and Shawnee.Kingston. Construction is scheduled to begin at Gallatin in 2018 and at Paradise in 2019.
Landfills. Lined and permitted dry storage facilities have been constructed and are operational at Bull Run, Kingston, and Gallatin.Fossil Plant ("Gallatin") was completed during 2020. Construction of newdewatering and dry generation facilities at Cumberland was completed in the second quarter of 2021.
Landfills. TVA has made strategic decisions to build and maintain lined and permitted dry storage facilities on TVA-owned property at some TVA locations, allowing these facilities to operate beyond existing dry storage capacity. Lined and permitted landfills are scheduled to begin at Cumberland, Paradise,completed and Shawnee in 2018 andoperational at Bull Run, Kingston, Gallatin, and Shawnee; construction of a lined and
permitted landfill at Cumberland is expected to start in 2019.2022; and TVA is designing and permitting a new landfill at Gallatin. TVA has withdrawn its permit applications for a new lined landfill at Bull Run and has stopped construction of a permitted lined landfill expansion at Kingston until TVA can determine its need for these landfills with certainty. Construction of additional lined and dry storage facilities may occur to support future business requirements.
Wet CCR impoundment closures. TVA is planningworking to close wet CCR impoundments in accordance with federal and state requirements when (1) coal-fired plants are converted to dry CCR processes and dry storage landfills become operational or (2) plant operations cease.requirements. Closure project schedules and costs are driven by the selected closure technologymethodology (such as cap and close in placeclosure-in-place or closure-by-removal). Closure initiation dates are driven by environmental regulations. TVA's predominant closure by removal).methodology is closure-in-place, with exceptions at certain facilities. TVA issued an environmental impact statement ("EIS") in June 2016 that addresses the closure of CCR impoundments at TVA's coal-fired plants. TVA issued its associated Record of Decision in July 2016. Although the EIS was designed to be programmatic in order to address the mode of impoundment closures, it specifically addressed closure methods at 10 impoundments. TVA subsequently decided to close those impoundments, althoughimpoundments. The method of final closure plans are still subject tofor each of these facilities will depend on various factors, including approval by appropriate state regulators. Additional National Environmental Policy Act analysessite-specific NEPA studies will be conducted as other impoundmentsfacilities are designated for closure. As environmental studies are performed and closure methodologies are determined, detailed project schedules and estimates will be finalized.See Note 13 — Asset Retirement Obligations.
Groundwater monitoring. Compliance with the Environmental Protection Agency's ("EPA"EPA's") CCR rule as well as other requirements will require("CCR Rule") required implementation of a groundwater monitoring program, additional engineering, and analysis as well as implementation of a comprehensive groundwater monitoring program.ongoing analysis. As further analyses are performed, including evaluation of monitoring results, there is the potential for additional costs for investigation and/or remediation. TVA expects to continue to evaluate and update these cost estimates.These costs cannot reasonably be predicted until a final remedy is selected, if necessary.
The final Part A revision to the CCR Conversion Program is scheduled to be completed by 2022 with two exceptions. First, a new landfill at Shawnee will be required to accommodate the addition of air pollution controls, and the landfill is scheduled to be operational byRule became effective September 28, 2020. Once the new landfill is in service, the existing bottom ash impoundment and dry stack will be closed in accordance with federal and state requirements. Second, the impoundments at Gallatin are pending additional studies to determineAmong other things, the final Part A rule requires unlined CCR surface impoundments to stop receiving CCR and non-CCR wastestreams and to initiate closure methodologyor retrofit by no later than April 11, 2021. TVA ceased sending CCR and schedule. While plans are currently being formulated fornon-CCR wastestreams to, and initiated closure of, unlined CCR surface impoundments by the specified deadline.
In compliance with the CCR closure methodology for Gallatin,Rule, TVA is involved in two lawsuits relating to alleged releasespublished the results of waste materials from the2020 groundwater testing at its CCR facilities during the second quarter of 2021. The results included values above groundwater protection standards for some constituents at Gallatin. On August 4, 2017,certain CCR units. TVA previously identified several CCR units with constituents at statistically significant levels above site-specific groundwater protection standards. TVA has completed an assessment of corrective measures (“ACM”), which analyzes the court in one case ordered TVAeffectiveness of potential corrective actions, and has published ACM reports to move all materials fromits CCR Rule Compliance Data and Information website. Based on the existing impoundments to a lined facility but did not impose any monetary penalties. The costsresults of constructing a lined facility onsite and excavating and moving the ash is approximately $900 million. IfACM, TVA is required to useselect a facility offsite, thenremedy as soon as feasible. TVA continues to investigate and evaluate remedies and will continue posting semi-annual progress reports on the costs could be approximately $2.0 billion, plus an amountstatus of additional costs reflectingremedy selection until the expected impactsfinal remedy is selected.
As of inflation given the extended duration of an offsite relocation project. These amounts do not include costs or penalties associated with any order in the other case. These amounts cannot be estimated at this time, but could be material. See Note 8.
Through September 30, 2017,2021, TVA had spent approximately $1.2$2.3 billion on its CCR Conversion Program. TVA expects to spend approximately an additional $1.1 billion$789 million on the CCR Conversion Program through 2022, excluding new requirements related to2026. These estimates may change depending on the Gallatin lawsuits. Oncefinal closure method selected for each facility. While the conversion portion of the CCR Conversion Program is completed, TVA will continue to undertake certain CCR closure and storage projects, including building new landfill sectionscells under existing permits and closing existing sectionscells once they reach capacity. See Item 1, Business — Environmental Matters — Cleanup
TVA was involved in two lawsuits concerning the CCR facilities at Gallatin. One of Solidthese cases was decided in TVA's favor by the U.S. Court of Appeals for the Sixth Circuit, and Hazardous Wastes — Coal Combustion Residuals.
Natural Gas-Fired Units. During 2014, the other case was resolved by the entry of a consent order in Davidson County Chancery Court that became effective July 24, 2019. Under the consent order, TVA Board approvedagreed to close the construction of two natural gas-fired generation facilities — Paradise Combined Cycle Plant and Allen Combined Cycle Plant. The Paradise Combined Cycle Plant, with a cost of approximately $900 million and a generation capacity of approximately 1,100 megawatts ("MW"), began commercial operations on April 7, 2017. Paradise Units 1 and 2, which are coal-fired with a combined summer dependable capability of 1,230 MW, were retired on April 15, 2017. These units were previously idled in February 2017 and December 2016, respectively, in anticipationexisting wet ash impoundments by removal, either to an onsite landfill or to an offsite facility. TVA may also consider options for beneficial reuse of the natural gas-fired facility coming online.CCR. TVA has submitted the removal plan to the Tennessee Department of Environment and Conservation ("TDEC") and other applicable parties pursuant to the consent order. See Note 13 — Asset Retirement Obligations.
In October 2019, TDEC released amendments to its regulations which govern solid waste disposal facilities, including TVA's active CCR facilities covered by a solid waste disposal permit and those which closed pursuant to a TDEC approved closure plan. Such facilities are generally subject to a 30-year post-closure care period during which the owner or operator must undertake certain activities, including monitoring and maintaining the facility. The amendments, among other things, add an additional 50-year period after the end of the post-closure care period, require TVA to submit recommendations as to what activities must be performed during this 50-year period to protect human health and the environment, and require TVA to submit revised closure plans every 10 years.
Allen Groundwater Investigation. The CCR Rule required TVA to implement a comprehensive groundwater monitoring program at units subject to the rule. As a result of this groundwater monitoring program, TVA reported to TDEC in 2017 elevated levels of arsenic, lead, and fluoride in groundwater samples collected from two shallow-aquifer groundwater monitoring wells around the Allen East Ash Disposal Area. TVA, under the oversight of TDEC, conducted a remedial investigation into the nature and extent of the contamination. In 2018, TVA submitted a draft Remedial Investigation Report to TDEC which was revised after discussions with TDEC and additional investigation. TVA submitted the Final Updated Remedial Investigation Report to TDEC in 2019.
The remedial investigation confirmed that the high arsenic, fluoride, and lead concentrations are limited to the shallow alluvial aquifer in the north and south areas of the Allen East Ash Disposal Area. These areas are not adversely impacting the Memphis aquifer, which is continuing to operate coal-fired Paradise Unit 3the source of the public drinking water supply. All samples taken from the Memphis aquifer through TVA production wells were below the EPA drinking water standards. As the result of a pumping test conducted on TVA production wells at the Paradise site.
nearby Allen Combined Cycle Plant has an expected generation capacity of approximately 1,100 MW with a cost not to exceed $975 million. Pre-commercial operations on Units 1 and 2 began in September 2017,("Allen CC") by the United States Geological Survey and the plantUniversity of Memphis, TVA is expectedcommitted to benot operating these production wells until additional data supports safe use. TVA constructed water tanks on site and is purchasing cooling water from MLGW. The use of water tanks rather than the wells may impose some operational in 2018. Upon completionrestrictions on the Allen CC due to the lower availability of this facility,cooling water.
TVA is taking steps to remediate the existing coal-firedgroundwater at the East Ash Disposal Area. The Interim Response Action Plan includes a groundwater extraction system and a groundwater treatment system. TVA will also continue to dewater the East Ash Disposal Area and treat the water before it is discharged to the NPDES outfall. A feasibility study to evaluate remedial actions for the site was submitted to TDEC on September 4, 2020. A virtual public meeting to present the Interim Response Action as the Proposed Plan for the site was held on November 17, 2020. The public was invited to review the remediation documents and encouraged to comment on the Proposed Plan during the public comment period. TVA submitted the public comments along with responses to TDEC for consideration. After considering public comments, TDEC signed the Record of Decision on August 16, 2021. TVA has also prepared a Remedial Action Plan ("RAP") to move forward with the remediation at the site. The RAP has been submitted to TDEC for review and approval.
TVA's Remedial Investigation/Interim Response Action Groundwater Monitoring Plan is reviewed and modified annually. The 2021 Remedial Investigation/Interim Response Action Groundwater Monitoring Plan was submitted to TDEC on April 1, 2021. TVA continues to sample the monitoring wells at the site as described by the plan quarterly. TVA prepares a memorandum after each quarterly event and prepares an annual report to evaluate the sampling results. The 2020 Remedial Investigation/Interim Response Action Groundwater Monitoring Report was submitted to TDEC on March 31, 2021.
TVA has evaluated closure options for the Allen East Ash Disposal Area, as well as the nearby West Ash Impoundment, through an EIS pursuant to NEPA. In March 2019, TVA released its public scoping report, which eliminated closure-in-place as an alternative. TVA published the final EIS on March 13, 2020 and its Record of Decision on April 14, 2020, which documents the final decision regarding the closure method for the CCR units at the siteAllen Fossil Plant. TVA has decided to remove CCR from the above identified areas and transport the CCR to an existing permitted offsite landfill. TVA conducted two virtual public outreach meetings, one on September 22, 2021 and the other on September 30, 2021, to discuss the project and selected landfill.
Potential Liability Associated with Workers' Exposure to CCR Materials. In response to the 2008 ash spill at Kingston, TVA hired Jacobs Engineering Group, Inc. ("Jacobs") to oversee certain aspects of the cleanup. After the cleanup was completed, Jacobs was sued in the U.S. District Court for the Eastern District of Tennessee ("Eastern District") by employees of a contractor involved in the cleanup and family members of some of the employees. The plaintiffs alleged that Jacobs had failed to take or provide proper health precautions and misled workers about the health risks associated with exposure to coal fly ash, which is a CCR material. The plaintiffs alleged that exposure to the fly ash caused a variety of significant health issues and illnesses, including in some cases death. The case was split into two phases, with the first phase considering, among other issues, general causation and the second determining specific causation and damages. On November 7, 2018, a jury hearing the first phase returned a verdict in favor of the plaintiffs, including determinations that Jacobs failed to adhere to its contract with TVA or the Site Wide Safety and Health Plan; Jacobs failed to provide reasonable care to the plaintiffs; and Jacobs's failures were capable of causing a list of medical conditions, ranging from hypertension to cancer. On January 11, 2019, the Eastern District referred the parties to mediation. Mediation has concluded, but the parties did not resolve the matter. On August 24, 2021, the U.S. Court of Appeals for the Sixth Circuit accepted Jacobs's petition for interim appeal on issues relating to the availability of derivative governmental immunity as a defense to the plaintiffs' claims. On September 29, 2021, the Eastern District certified four questions to the Tennessee Supreme Court regarding the applicability of the Tennessee Silicosis Claims Priority Act to the plaintiffs' claims. The Eastern District's order also stayed all proceedings pending the Tennessee Supreme Court's decision. If the litigation proceeds to the second phase, the principal question for resolution will be retired. See Regulatory Compliance —Allen Groundwater Issues — Groundwater Investigations below.whether Jacobs's breaches were the specific medical cause of the plaintiffs' alleged injuries and damages. No trial date has been set for the second phase.
Renewable Energy Resources. On November 10, 2016, the River Bend Solar Energy Center located in northern Alabama began commercial operation. TVA has a 20-year power purchase agreement signed on February 23, 2015, with NextEra Energy Resources for power generated from the facility. The River Bend Solar Energy Center has more than 300,000 solar panels with trackers Other contractor employees and family members have filed lawsuits against Jacobs that are designedpending in the Eastern District. These pending lawsuits are stayed and raise similar claims to followthose being litigated in the sun from eastcase referenced above.
While TVA is not a party to west each dayany of these lawsuits, TVA may potentially have an indemnity obligation to maximize energy production withreimburse Jacobs for some amounts that Jacobs is required to pay. TVA will continue monitoring the litigation to determine whether these or similar cases could have broader implications for the utility industry. TVA does not expect any potential liability to have a material adverse impact on its results of operations or financial condition. See Note 23 —Commitments and Contingencies.
Coal Supply. TVA experienced challenges in 2021 related to coal supply, as a result of supply limitation and transportation challenges. In addition, in October 2021, one of TVA's coal handling service providers experienced an event that damaged a number of systems and resulted in the inability to unload trains for a period of time. This service provider is a transfer point for two of TVA's plants. TVA immediately identified and put in place mitigation actions, including shifting to
alternative terminals, to ensure the availability of supply; however, these alternative terminals could affect plant operations due to lower offsite coal blending options, available inventory capacity, and longer lead times as a result of location. TVA will continue to monitor the situation and respond to potential risks as the situation evolves.
generating capacity of 75 MW. The power purchase agreement supports TVA’s renewable energy portfolio and is helping TVA meet its commitment to provide low-cost, carbon-free electricity.
River Management. The summer of 2016 was the hottestRainfall and driestrunoff in the Tennessee Valley since 2010 — a trend thatin 2021 were 123 percent and 121 percent of normal, respectively. Above normal rainfall and runoff have continued into the first six months of 2017. During the third and fourth quarter of 2017, the Tennessee Valley region saw a return to more normal rainfall. However, because of lingering dry conditions during 2016 and the first half of 2017, runoff continues to lag behind normal. Increased rainfall during the third and fourth quarter has helpedhelp TVA meet its river system commitments, including maintainingmanaging minimum river flows and minimum depths for navigation;navigation, generating electricity;low-cost hydroelectric power, maintaining water quality,flows that support habitat for fish and other aquatic species, maintaining water supply, and recreationproviding recreational opportunities for the Tennessee Valley;Valley. In addition, having cool water available helps TVA to meet thermal compliance and enablingsupport normal operation of TVA's nuclear and fossil-fueled plants; generating low-cost hydroelectric power; andplants, while oxygenating water to helphelps fish species remain healthy. Despite
Aquatic Vegetation. In 2020, the increased rainfallunprecedented growth and breakaway of aquatic vegetation in Wheeler Lake challenged the Browns Ferry intake structures and impacted the source of cooling water for the plant. Two units were removed from operation and power was reduced on the third unit to accommodate the decreased capability of the cooling systems. Nuclear safety was not challenged during the third and fourth quartersevent. Breakaway of 2017, rainfall and runoff for 2017 were six percent and 15 percent below normal, respectively, which resulted in conventional hydroelectric generation being 18 percent below normal and 11 percent lower during 2017 as comparedaquatic vegetation will continue to 2016.be a concern until a permanent solution is finalized. However, mitigation solutions have been identified to eliminate marine biofouling of the plant intake system. A permanent design solution is expected to be implemented by the end of CY 2025.
Small Modular Reactors. In December 2019, TVA submittedbecame the first utility in the nation to successfully obtain approval for an Early Site Permit Application ("ESPA") for review byearly site permit from the NRC in May 2016. The NRC completed its acceptance review of the application on December 30, 2016,to potentially construct and began its detailed technical review of the application in January 2017. The ESPA is based on the potential future construction and operation of two or moreoperate small modular reactors ("SMR") units at TVA’s Clinch River site in Oak Ridge, Tennessee. TVA’s ESPANuclear Site. The permit is based upon information regarding the various SMR designs under development in the United States. Because a design has not been selected, the ESPA seeks approval of a Plant Parameter Envelope that encompasses any of the designs.valid through 2039 and therefore provides TVA and the DOE are working under an interagency agreement to jointly fund licensing activities for the Clinch River site with DOE reimbursement of up to 50 percent of TVA's eligible costs through 2020.
TVA is developing the Clinch River site on a schedule that supports submittal of a combined construction and operating license ("COL") application in 2020, in conjunction with supporting the NRC’s review of the ESPA. Submittal of a COL is subject to sufficient progress being made by the SMR vendor(s) with their design certification(s) and a TVA decision to select a specific SMR technology and proceed with development of a COL application in 2018. The project has a great deal of flexibility to make new nuclear decisions based on energy needs and economic factors. In 2021, TVA initiated a Programmatic Environmental Impact Statement that will evaluate a variety of alternatives for a proposed advanced nuclear technology park at the Clinch River Nuclear Site and will provide additional flexibility for future decision making. The decision to potentially build small modular reactors is an ongoing discussion as part of the asset strategy for TVA’s future generation portfolio.
TVA is committed to investing in the future of nuclear and is partnering with like-minded organizations to evaluate the economic feasibility of advanced nuclear reactors. To this early stageend, TVA has entered into memorandums of understanding with Oak Ridge National Laboratory and by moving forwardthe University of Tennessee that allow for mutual collaboration to explore advanced reactor designs as a next-generation nuclear technology while leveraging the expertise of federally funded research and development centers and academic institutions. Further, in 2021, TVA entered a cooperative development agreement with an ESPA, TVA will beKairos Power to provide defined engineering, operations, and licensing services in support of a positionlow-power demonstration reactor Kairos Power plans to build a SMR if and when additional power sources are needed. deploy at the East Tennessee Technology Park in Oak Ridge, TN.
Any future decision to construct a SMRan advanced reactor would require approval by the TVA Board.
Three environmental groups filed petitionsBoard and the NRC. As of September 30, 2021, TVA had spent $91 million on work regarding SMRs, including work to intervene incomplete the ESPA proceeding. On October 10, 2017,early site permit application for the Atomic Safety and Licensing Board issued a decision admitting two contentions proffered jointly by Southern Alliance for Clean Energy ("SACE") and Tennessee Environmental Council ("TEC") and dismissing a third. The decision also denied admission of one proffered contention by Blue Ridge Environmental Defense League ("BREDL"). See Note 21 — Legal Proceedings — Petitions to Intervene in the Proceeding Involving the Early Site Permit Application for Small Modular Reactors at TVA's Clinch River Nuclear Site,. of which the DOE had reimbursed TVA $29 million. Additional expenditures will be determined based on future project development.
System Operations Center. A new system operations center has been approved for $289 million. The new secured facility is being built to accommodate a new energy management system and adapt to new regulatory requirements, and will have improved physical security from the previous center. The facility is expected to be constructed by the third quarter of 2023 and fully operational in 2025. As of September 30, 2021, TVA had spent approximately $92 million on the project and expects to spend an additional $197 million.
Energy Management System. The new energy management system has been approved for $90 million. As the current energy management system is nearing the end of its life cycle, this project will replace the existing analog system with a digital system. The new digital system will have higher capacity and speed, for communications with the TVA grid and for inputs from monitoring equipment, which will also network the new control center with existing locations and enable better remote visibility and control. The system is expected to be complete in 2026. As of September 30, 2021, TVA had spent approximately $37 million on the project and expects to spend an additional $53 million.
Dam Safety and Remediation Initiatives
Assurance Initiatives. TVA has an established dam safety program, which includes procedures based on the Federal Guidelines for Dam Safety, with the objective of reducing the risk of a dam safety event. The program analyzes, evaluates, and manages risks through a systematic and thorough process that facilitates decision making for the safety of a structure, identifying necessary actions to reduce risk, including remediation projects, and prioritization of actions for TVA's river dams. Prioritization is comprised of various engineering activities for all of TVA’s dams including safety reassessments using modern industry criteriadriven by reducing risk to the public and the new probable maximum flood and site-specific seismic load cases.
One aspectasset preservation. TVA also continues to provide routine care of the guidelines is that dam structures will be periodically assessed to assure that TVA's dams meet current design criteria. These assessments include material samplingas part of the dam safety program through inspections, monitoring, and foundational structures and detailed engineering analysis. TVA has completed 49 assessments between 2013 and 2017. Results of the completed assessments identified areas for further studies at several TVA dams, including Boone and Pickwick (as discussed in more detail below). Going forward, TVA will continue its preventative and ongoing maintenance, as a part of this safety program. TVA has spent $82 million on dam safety assurance initiatives since 2012 and expects to spend an additional $210 million through 2021.among other activities.
Boone Dam Remediation. In October 2014,2015, a sinkhole was discovered near the base of the earthen embankment at Boone Dam, and a small amount of water and sediment was found seeping from the river bank below the dam. TVA identified underground pathways contributing to the seepage and prepared a plan to repair the dam, which consists of the construction of a composite seepage barrier wall in the dam’sdam's earthen embankment. TVA has completed grouting, construction of an upstream and downstream buttress, installation of the first part (low mobility grouting)concrete cut-off wall, and raising of its test grouting program onthe reservoir for fluctuation testing of the repair.
TVA is currently constructing a floodwall to return the embankment in September 2016 and is currently evaluating the effectiveness of that grouting phase. The second phaseto its original height. Construction of the grouting program (high mobility grouting) is on holdfloodwall as TVA continues to perform investigative drilling, testing, and other activities in support of the seepage barrier design. Based on preliminary findings, results are being incorporated into the design, and some plannedwell as site restoration activities are being re-sequenced.
As determined from the extensive analyses, TVA has decided that the overall remediation planplanned for Boone Dam remains the installation of a composite seepage barrier wall. As design and construction plans are finalized, the estimated cost and duration continue to be refined. At its August 23, 2017 meeting, the TVA Board approved funding of the plan based on current cost estimates, which are approximately $450 million with completion of the remediation targeted in 2022.
As of September 30, 2021, TVA had spent $300 million related to this project and expects to spend an additional $122 million through 2023. TVA expects the reservoir to return to normal operations in 2022 and is continuing to work with the community to help mitigate local impacts of the extended drawdown.
Pickwick South Embankment Remediation. Reassessments of Pickwick Landing Dam ("Pickwick") found low safety factors for post-earthquake stability indicating that the dam is at significant risk for slope stability failure following a seismic event in portions of the south embankment. Slope stability failure could lead to a breach of the south embankment and loss of the reservoir, resulting in loss of life and damage to property downstream, disruption to navigation, and loss of generation and recreation.
On September 30, 2016, TVA issued a final environmental assessment and finding of no significant impact for its proposed upgrades to the south embankment. Uponis nearing completion of the preliminary engineering study, TVA determined that remediation of the south embankment should be performed byon constructing berms on the upstream and downstream slopes. The design phaseslopes to upgrade the south embankment. TVA is also currently working on projects with the local water utility to relocate an affected water intake system, which will allow for completion of the project began during the first quarter of 2017, and the project is expected to be in full construction during 2018. The project is currently estimated to be completed in two years. However, the project may take longer than two years depending on successful construction sequencing. The total project costremaining berms. This work is estimated to be approximately $100 million.complete in 2022. As of September 30, 2021, TVA had spent $118 million related to this project and expects to spend an additional $10 million through 2022.
SurplusReal Property Portfolio
TVA continues to study its real estateproperty portfolio foras part of the purpose ofStrategic Real Estate Plan, which is aimed at reducing cost, right-sizing the portfolio, and aligning its real estate holdings with TVA's strategic direction. A comprehensive assessmentIn addition, as TVA continues to implement mandatory telework for those who do not have to be physically present during the COVID-19 pandemic, it is also assessing and reviewing the pandemic's long-term impacts to real estate.
Regional Consolidations. Consolidation of the centralized field offices in Norris, Tennessee and additional consolidations from the Greenway Area Office are currently being performed and are expected to be completed in early 2022.
Supply Chain
Federal Contracting and Hiring Practices. On August 3, 2020, the Trump Administration issued an "Executive Order ("EO") on Aligning Federal Contracting and Hiring Practices With the Interests of American Workers." Among other things, the EO directs federal agencies to review contracts awarded in 2018 and 2019 to assess (i) whether temporary foreign labor was used and impacts from such use, and (ii) whether any offshoring occurred and its impacts. The EO also directs agencies to review employment policies for compliance with specific laws. TVA conducted a review and reported a summary of its real estate holdings has been completed,findings to OMB in December 2020.
Buy American Executive Order. On January 25, 2021, President Biden issued EO 14005, "Ensuring the Future Is Made in All of America by All of America’s Workers." EO 14005 imposes new reporting and procedural requirements, as well as additional executive oversight, for federal agency purchases of foreign goods and services. OMB issued guidance in connection with EO 14005 on June 11, 2021. TVA is implementingevaluating and preparing for any anticipated impacts and continuing to monitor guidance regarding the new requirements. In July 2021, TVA submitted a strategy aimed at reducing cost and right-sizing its portfolio as part of the effort.report in response.
Bellefonte Nuclear PlantInflation. On November 14, 2016, following a public auction, TVA entered into a contract to sell substantially all of its Bellefonte site to Nuclear Development, LLC for $111 million. Nuclear Development, LLC paid TVA $22
million on November 14, 2016, and the remaining $89 million is due at closing. Nuclear Development, LLC has up to two years from November 14, 2016, to close on the property, and TVA will maintain the site until then. The closing is subject to, among other conditions, a determination by TVA's Chief Executive Officer that potential environmental impacts have been appropriately addressed or are acceptable. TVA's CEO made this determination in the affirmative on August 10, 2017. See Note 7 — Deferred Nuclear Generation Units.
Muscle Shoals Property. In alignment with its strategic direction of right-sizing its real estate portfolio, TVA has drafted a strategy to further reduce a significant number of buildings and propertyseen an increase in Muscle Shoals, Alabama, including the disposition of 900 acres of the 970 acres approved by the TVA Board in 2012. Active marketing efforts began in March 2017, and TVA is receiving interest from local groups with the ability to promote local economic growth in the area. Depending on interest, TVA plans to auction the 900 acres.
Knoxville Property. In 2016, TVA completed a comprehensive assessment of its real estate holdings in the Knoxville, Tennessee region including the Knoxville Office Complex (“KOC”) and adjacent Summer Place Complex ("SPC"). As a result of this study and subsequent environmental assessment in 2017, TVA is planning to consolidate most of its Knoxville area employees into one location in the West Tower of the KOC and plans to convey the SPC and the East Tower of the KOC. Evaluation of the real estate portfolio is continuing.
Regulatory Compliance
Transmission Issues. TVA anticipates expenditures related to transmission facilities to increasesupplier impacts as a result of both new and evolving regulatory requirements. The North American Electric Reliability Corporation ("NERC") approved revisions to the Transmission Planning ("TPL") Reliability Standards in 2013.COVID-19, including price fluctuations. TVA has spent $37 million since the approval of the standard through September 30, 2017, on existing transmission facilities and anticipates spending an additional $15 million through 2018actively managed spend to ensure compliance with the 2013 revision of the TPL standards. Total costs of compliance with the standard, including those beyond 2018, are estimated to be approximately $650 million.
Steam-Electric Effluent Guidelines. On November 3, 2015, the EPA published a final rule revising the existing steam electric effluent limitation guidelines ("ELGs"). The ELGs update the existing technology-based water discharge limitations for power plants. Compliance with new requirements is required in the 2018-2023 timeframe and will necessitate major upgrades to wastewater treatment systems at all coal-fired plants. Dry fly ash handling is mandated by the rule. The rule also requires either dry bottom ash handling systems or “no discharge” recycle of bottom ash transport waters, and new technology-based limits on flue gas desulfurization (scrubber) wastewater require primary physical/chemical treatment and secondary biological treatment to meet extremely low limits for arsenic, mercury, and selenium.
The EPA published a rule on September 18, 2017, postponing certain compliance/applicability dates to provide the EPA time to review and revise, as necessary, the new and stringent ELGs previously established for flue gas desulfurization wastewater and bottom ash transport water. The EPA pushed back the compliance dates for these two wastestreams from the 2018-2023 timeframe to 2020-2023. Other requirements and applicability dates of the rule for fly ash transport water, flue gas mercury control wastewater, and gasification wastewater remain in effect. See Item 1, Environmental Matters — Water Quality Control Developments — Steam-Electric Effluent Guidelines.
TVA currently has four plants with wet scrubbers that will have to comply with the scrubber-related limits, the largest being Cumberland. TVA is working to address future compliance with the ELGs at Cumberland given its unique “once-through” scrubber design. Compliance with the current rule at Cumberland without modification to address the unique design could cause
TVA to incur disproportionately high costs at Cumberland or experience other operational outcomes which TVA cannot predict at this time.
Allen Groundwater Issues. TVA is currently addressing two issues related to groundwater at its Allen Fossil Plant and Allen Combined Cycle Plant sites. Each is described below.
Challenges to Issuance to TVA of Well Permits. TVA initially intended to use wastewater for the Allen Combined Cycle Plant’s cooling system but determined such a method would be cost prohibitive and less reliable from both a capital and long-term operations and maintenance perspective. Due to the industrial nature of the wastewater, it would have required significantly more water treatment than initially anticipated. TVA evaluated several wastewater treatment alternatives (and other water supply options) and concluded the current plan to install five wells to obtain cooling water from an aquifer is the preferred method. Three of the five wells were permitted in the summer of 2016 and were installed by September 2016. The remaining two wells were permitted in September 2016. An administrative appeal to the issuance of the final two well permits was denied by the Groundwater Quality Control Board of Shelby County ("Groundwater Board") in November 2016. On February 1, 2017, the Sierra Club and a local non-profit organization, Protect Our Aquifer, filed a petition with the Shelby County chancery court seeking judicial review of the Groundwater Board’s decision. TVA removed that action to the U.S. District Court for the Western District of Tennessee and filed a motion to dismiss the petition. On August 18, 2017, the federal court granted TVA's motion and dismissed the case.
Groundwater Investigations. In May 2017, TVA reported elevated levels of arsenic, lead, and fluoride in water samples taken at a few shallow-aquifer groundwater monitoring wells at Allen Fossil Plant. TVA is working with the Tennessee Department of Environment and Conservation ("TDEC") to identify the source of the arsenic, lead, and fluoride and received a Remedial Site Investigation request from TDEC in July 2017, outlining the objectives of the investigation and asked TVA to provide a work plan. TVA submitted an initial version of the work plan in August 2017, and a revised work plan in September 2017 responding to TDEC comments. The plan includes more extensive groundwater sampling to identify the source and extent of the contamination. The plan also includes groundwater modeling to determine current groundwater flow conditions and likely future conditions that may develop as a result of pumping cooling water from the deeper aquifer to the Allen Combined Cycle Plant, including a pump test involving the cooling water withdrawal wells; TVA has contracted with the U.S. Geological Survey and the University of Memphis to conduct this portion of the work. A Remedial Investigation Report summarizing the results of the investigation will be submitted to TDEC in February 2018. Depending of the results of the monitoring and the determination of the source of the contamination, TVA may be required to take actions including remediation and/or altering its planned source of cooling water for the Allen Combined Cycle Plant.
Cybersecurity. On May 11, 2017, President Donald Trump signed EO 13800, "Strengthening the Cybersecurity of Federal Networks and Critical Infrastructure", that requires that all federal agencies adopt the Framework for Improving Critical Infrastructure Cybersecurity, developed by the National Institute of Standards and Technology ("NIST"). The executive order calls for many federal agencies to submit a risk management report in which agencies would describe their security measures and what are deemed to be significant risks. TVA submitted its risk management report to the Office of Management and Budget in July 2017 and received its cybersecurity assessment results in August 2017. TVA’s cybersecurity program was given an “effective” rating and is in alignment with NIST standards.
Pension Fund
As of September 30, 2017, TVA's qualified pension plan had assets of $8.0 billion compared with liabilities of $12.6 billion. The potential for the plan's funded status to improve in the near term is limited because of expected equity performance, the significant amount of benefits paid each year to plan beneficiaries, and historically low discount rates to measure the plan’s benefit obligation. The plan currently has approximately 33,000 participants, of which approximately 24,000 are retirees and beneficiaries currently receiving benefits. Benefits of over $700 millionmitigate inflationary pressures; however, broader inflationary pressures are expected to be paid in 2018. Per amendmentspersist into 2022. TVA will continue to the plan in 2016, TVA made a contribution of $300 millionmonitor these pressures and spend to the plan in 2017. In addition, at its August 23, 2017 meeting, the TVA Board approved an additional contribution of $500 million to the plan in 2017 to help improve the plan's funded status. See Note 20.lower TVA’s risk.
Ratemaking
At its August 23, 2017 meeting,TVA, LPCs, and directly served industries have worked collaboratively in recent years to develop changes to rates that focus on TVA's long-term pricing efforts and the changing needs of customers in the Tennessee Valley. These changes have improved pricing by better aligning rates with underlying cost drivers and by sending improved pricing signals, while maintaining competitive industrial rates and keeping residential rates affordable.
TVA and LPCs continue to work together to meet the changing needs of consumers around the Tennessee Valley. In 2019, the TVA Board approved a basePartnership Agreement option that better aligns the length of LPC power contracts with TVA's long-term commitments. Under the partnership arrangement, the LPC power contracts automatically renew each year and have a 20-year termination notice. The partnership arrangements can be terminated under certain circumstances, including TVA's failure to limit rate adjustmentincreases as provided for in the agreements going forward. Participating LPCs receive benefits including a 3.1 percent wholesale bill credit in exchange for their long-term commitment, which became effective on October 1, 2017. The base rate adjustment is expectedenables TVA to contributerecover its long-term financial commitments over a commensurate period. In June 2020, TVA provided participating LPCs a flexibility option that allows them to locally generate or purchase up to approximately $195 millionfive percent of average total hourly energy sales over 2015 - 2019 in order to 2018 revenues. See Distributed Energy Resources meet their individual customers' needs. As of November 12, 2021, 145 LPCs had signed the 20-year Partnership Agreement with TVA, andItem 1, Business — Rates — Rate Methodology. 74 LPCs had signed a Flexibility Agreement.
Safeguarding Assets
Physical Security — Non-Nuclear Asset Protection. TVA utilizes a variety of security technologies, security awareness activities, and security personnel to prevent sabotage, vandalism, and thefts. Any of these activities could negatively impact the ability of TVA to generate, transport,transmit, and deliver power to its customers. TVA's Police and Emergency Management personnel are active participants with numerous professional and peer physical security organizations in both the electric industry and law enforcement communities.
Physical attacks on transmission facilities across the country have heightened awareness of the need to physically protect facilities. TVA is workingcontinues to work with the NERC,North American Electric Reliability Corporation ("NERC"), the SERC Reliability Corporation, the North American Transmission Forum, and other utilities to implement industry approved recommendations and standards.
Nuclear Security. Nuclear security is carried out in accordance with federal regulations as set forth by the NRC. These regulations are designed for the protection of TVA's nuclear power plants, the public, and employees from the threat of radiological sabotage and other nuclear-related terrorist threats. TVA has security forces to guard against such threats.
Cybersecurity. TVA operates in a highly regulated environment.environment with respect to cybersecurity. TVA's cybersecurity program aligns or complies with the Federal Information Security Management Act, the NERC Critical Infrastructure Protection requirements, and the NRC requirements for cybersecurity, as well as industry best practices. As part of the U.S. government, TVA coordinates with and works closely with the U.S. Department of Homeland Security's Cybersecurity and Infrastructure Security Agency ("CISA") and the United StatesU.S. Computer Emergency Readiness Team ("US-CERT"). CISA serves as the agency assisting other federal entities in defending against threats and securing critical infrastructure. US-CERT functions as a liaison between the U.S. Department of Homeland Security and the public and private sectors to coordinate responses to security threatsthreats.
The risk of cybersecurity events such as malicious code attacks, unauthorized access attempts, and social engineering attempts continues to intensify across all industries, including the energy sector. Over the last few years, TVA has observed a significant increase in malicious activity including phishing campaigns, malicious websites, distributed denial of service attacks, and activity specific to the COVID-19 pandemic, among others. These types of malicious activity have also been observed by TVA's external vendors, stakeholders, and partners. This activity has caused the need for heightened awareness and preparedness.
In December 2020, TVA was notified of the SolarWinds breach by multiple sources including CISA. TVA cybersecurity personnel immediately responded to determine any impact and took measures intended to protect TVA from potential risks from the internet.compromised software. TVA evaluated all information received regarding the event and continues to take the necessary actions to protect the computing environment. This event did not have a significant or material impact on business or operations.
In May 2021, TVA was notified of the Colonial Pipeline ransomware attack. TVA cybersecurity personnel immediately began monitoring and evaluating the situation. There were no direct attacks to TVA related to this event. See Note 16 — Risk Management Activities and Derivative Transactions — Counterparty Risk — Suppliers for discussion of supply impact.
On May 12, 2021, President Biden signed EO 14028, "Improving the Nation's Cybersecurity." This EO is intended to improve the nation's cybersecurity posture and protect federal government networks by improving information-sharing between the U.S. government and the private sector on cyber issues and strengthening the United States' ability to respond to incidents when they occur. This EO is focused on specific goals and requirements including actions for zero trust architectures; cloud services; FedRAMP programs; supply chain and contracts; secure software development; endpoint detection and response, standardized vulnerability, and incident response operational plans; threat and vulnerability analysis; assessment and threat-hunting; event logging, monitoring, and retention; and information sharing. TVA continues to evaluate and respond to the EO, associated OMB memorandums, and other emerging requirements in alignment with the order. TVA has submitted all reports as required, established response teams and an oversight structure, and initiated projects as necessary to address the required actions.
TVA is also participating in studies funded through the DOE to identify, design,leveraging federal and test new solutions for protecting critical infrastructure from cyber attacks. See Key Initiatives and Challenges — Regulatory Compliance — Cybersecurity.
In recent months, TVA has seen an increase in ransomware-related activity, with much of it directed to electric utilities by means of malicious and targeted emails. Such activity has resulted in a heightened state of awareness and preparedness across the industry. Although TVA has not been compromised during these recent incidents, it is leveraging its federal intelligenceother partners to better predict,identify, detect, protect, and respond to these potential attacks.
The risk of these cybersecurity events continues to intensify, While TVA and while TVA hasits third-party vendors and service providers have been, and will likely continue to be, subjected to such attacks and attempts to disrupt operations, to date the attacks have not had a significant or material impact on business or operations and have not impacted TVA's ability to operate as planned or compromised data which could involve TVA in legal proceedings.planned. See Item 1A, Risk Factors — OperationalCybersecurity Risks — TVA's facilities and information infrastructure may not operate as planned due to cyber threats to TVA's assets and operations.
Transmission Assets. In addition to physical and cybersecurity attacks, TVA’sTVA's transmission assets are vulnerable to various types of electrically charged energy disruptions such as those from geomagnetic disturbances ("GMD") and electromagnetic pulses ("EMP"EMPs"). AlthoughIn September 2016, the effects of GMD and EMP are dissimilar, they are often considered together. On September 22, 2016, Federal Energy Regulatory Commission ("FERC")FERC approved the Phase 2 NERC Standard TPL-007a new standard to address GMD events.geomagnetic disturbances events, and in March 2020, FERC approved a revision to the standard. TVA has already met many of the requirements of the neworiginal standard with completion of a model of the 500 kV grid and evaluation ofsubsequent revisions, and has evaluated the effects of solar storms ranging from NERC’sNERC's reference case to possible extreme levels. Only a few items of equipment would exceed threshold levels even for the extreme cases and no damage would be expected. FERC's approval of NERC Standard TPL-007 included requirements for changes to this standard by May 2018. TVA iscontinues as an active participant with NERC in developing these changes.this field. The most serious threats from EMP are those caused by high-altitude
nuclear explosions. Like others in the industry, TVA is coordinating with federal and state authorities, NERC, Electric Power Research Institute ("EPRI"), and other grid owners and operators to address this re-emergent concern.
Bulk-Power System Assets. On May 1, 2020, the Trump Administration issued EO 13920, "Securing the United States Bulk-Power System." Among other things, the EO prohibits the acquisition or installation of any bulk-power system electric equipment where the transaction (1) involves any property in which any foreign country or a national thereof has any interest and (2) poses an undue risk to the bulk-power system in, or national security of, the U.S. On December 17, 2020, the DOE issued a Prohibition Order Securing Critical Defense Facilities, which was suspended and then revoked. EO 13920 has expired and is no longer in effect. EO 13990, "Protecting Public Health and the Environment and Restoring Science To Tackle the Climate Crisis," directs DOE and OMB to consider whether to recommend the issuance of a replacement EO to EO 13920. The DOE issued a Request for Information on April 22, 2021, to help inform any recommendation that it may make for a replacement EO. At this time, it is uncertain to what extent a future EO that may potentially address risks associated with the bulk-power system may impact TVA's operations.
Critical Accounting Policies and Estimates
TVA's consolidated financial statements are prepared in accordance with accounting principles generally accepted in the United States of America ("GAAP"), which require management to make estimates, judgments, and assumptions that affect the amounts reported in the consolidated financial statements and accompanying notes. Each of these estimates varies in regard to the level of judgment involved and its potential impact on TVA's financial results. Estimates are deemed critical either when a different estimate could have reasonably been used, or where changes in the estimate are reasonably likely to occur from period to period, and such use or change also would materially impact TVA's financial condition, results of operations, or cash flows. TVA's critical accounting policies are also discussed in Note 1— Summary of Significant Accounting Policies of the Notes to Consolidated Financial Statements in this Annual Report.Statements.
TVA believes that its most critical accounting policies and estimates relate to the following:
Regulatory Accounting;•AROs;
Gallatin Coal Combustion Residuals;•Fair Value Measurements; and
Asset Retirement Obligations; and
•Pension and Other Post-Retirement Benefits.
Management has discussed the development, selection, and disclosure of critical accounting policies and estimates with the Audit, Finance, Risk, and RegulationCybersecurity Committee of the TVA Board. While TVA's estimates and assumptions are based on its knowledge of current events and actions it may undertake in the future, actual results may ultimately differ from these estimates and assumptions.
Regulatory Accounting
The TVA Board is authorized by the TVA Act to set rates for power sold to customers; thus, TVA is "self-regulated." Additionally, TVA's regulated rates are designed to recover its costs of providing electricity. In view of demand for electricity and the level of competition, TVA has assumed that rates, set at levels that will recover TVA's costs, can be charged and collected. As a result of these factors, TVA records certain assets and liabilities that result from the regulated ratemaking process that would not be recorded under GAAP for non-regulated entities. Regulatory assets generally represent incurred costs that have been deferred because such costs are probable of future recovery in customer rates. Regulatory liabilities generally represent obligations to make refunds to customers for previous collections of costs that are not likely to be incurred or deferral of gains that will be credited to customers in future periods. The timeframe over which the regulatory assets are recovered from customers or regulatory liabilities are credited to customers is subject to annual TVA Board approval. At September 30, 2017, TVA had $9.1 billion of Regulatory assets and $188 million of Regulatory liabilities.
TVA assesses whether the regulatory assets are probable of future recovery by considering factors such as applicable regulatory changes, potential legislation, and changes in technology. Based on these assessments, TVA believes the existing regulatory assets are probable of recovery. This determination reflects the current regulatory and political environment and is subject to change in the future.
TVA made two changes in the accounting policy used to record regulatory assets and liabilities during 2017. TVA recorded the liability related to the Gallatin Coal Combustion Residual Facilities as a regulatory asset to be collected as amounts are collected in rates or paid out, starting October 1, 2018. The TVA Board also authorized management to accelerate amortization of certain regulatory assets to the extent actual net income in 2018 exceeds the budgeted amount, up to the aggregated amount of those certain regulatory assets. TVA does not believe there is a reasonable likelihood that there will be a material change in the estimates or assumptions used to record regulatory assets and liabilities. If future recovery of regulatory assets ceases to be probable, or any of the other factors described herein cease to be applicable, TVA would be required to write off these costs and recognize them in net income or other comprehensive income.
Gallatin Coal Combustion Residuals
TVA may incur significant environmental clean-up costs related to its CCR facilities at Gallatin. See Note 8. These costs are based upon estimates of the incremental direct costs of the remediation effort, including costs of compensation and benefits for those employees who are expected to devote a significant amount of time directly to the remediation effort. Such amounts are included in the estimate when it is probable that a liability has been incurred as of the financial statement date and the amount of loss can be reasonably estimated. When both of those recognition criteria are met and the estimated loss is a range, TVA accrues the amount that appears to be a better estimate than any other estimate within the range, or accrues the minimum amount in the range if no amount within the range is a better estimate than any other amount. If the actual costs materially differ from the estimate, TVA’s results of operations, financial condition, and cash flows could be affected materially.
At September 30, 2017, the costs include, among other things, environmental studies concerning the existing and new facilities, the licensing activities for the new facility, design and construction of the new facility, relocating the material from the existing facilities to the new facility, closing the existing facilities, monitoring activities, and the expected impacts of inflation given the anticipated duration of the project. At September 30, 2017, TVA has estimated these costs to be approximately $900 million. The TVA Board approved regulatory accounting treatment for certain costs associated with compliance with orders or settlements related to lawsuits involving CCR facilities. See Note 8 — Financial Impact.
The following categories could have a significant effect on estimates related to environmental clean-up costs of Gallatin coal combustion residuals:
Final Removal Method - It is reasonably possible that TVA will not be able to obtain the necessary permits to build the facility on the Gallatin site and will be required to move the CCR materials offsite. Offsite relocation for this or any other reason would materially increase TVA’s project cost estimate. If TVA is required to use a facility offsite, then the costs could be approximately $2.0 billion, plus an amount of additional costs reflecting the expected impacts of inflation given the extended duration of an offsite relocation project.
Uncertainty Inherent in Project Cost Estimates - The ultimate cost of the removal project will depend on actual timing and results of ongoing litigation, environmental studies, licensing, site subsurface conditions, contractor availability, weather, equipment, available material resources, and other contingency factors. These contingency factors could cause the project cost estimate to change materially in the near term. TVA updates its estimate for project costs as changes in these factors are determined to be probable of occurring.
Excluded Costs - The costs do not include such items as any additional order or penalty arising from the TDEC lawsuit, which cannot be reasonably estimated at this time. In the event that these costs become probable and reasonably estimable, they could materially increase TVA’s project cost estimate.
Asset Retirement Obligations
TVA recognizes legal obligations associated with the future retirement of certain tangible long-lived assets. These obligations relate to TVA’sTVA's generating facilities, including coal-fired, nuclear, hydroelectric, and natural gas and/or oil-fired. They also pertain to coal ash impoundments, transmission facilities, and other property-related assets. Activities involved with the retirement of these assets could include decontamination and demolition of structures, removal and disposal of wastes, and site restoration. TVA periodically reviews its estimated asset retirement obligation ("ARO")ARO liabilities. Revisions to the ARO estimates are made whenever factors indicate that the timing or amounts of estimated cash flows have changed. Any change to an ARO liability is recognized prospectively as an equivalent increase or decrease in the carrying value of the capitalized asset. Any accretion or depreciation expense related to these liabilities and assets is charged to a regulatory asset. See Note 710 — Regulatory Assets and Liabilities —Nuclear Decommissioning Costs and Non-Nuclear Decommissioning Costs and Note 12.13 — Asset Retirement Obligations.
Nuclear Decommissioning. Utilities that own and operate nuclear plants are required to recognize a liability for legal obligations related to nuclear decommissioning. An equivalent amount is recorded as an increase in the carrying value of the capitalized asset and allocated to a regulatory asset over the useful life of the capitalized asset. The initial obligation is measured at its estimated fair value using various judgments and assumptions. Fair value is developed using an expected present value technique that is based on assumptions of market participants and that considers estimated retirement costs in current period dollars that are inflated to the anticipated decommissioning date and then discounted back to the date the ARO was incurred. Decommissioning cost studies are updated for each of TVA's nuclear units long-lived assets at least every five years. Changes in assumptions and estimates included within the calculations of the fair value of the AROs could result in significantly different results than those identified and recorded in the financial statements.statements, including amortization of the regulatory assets.
Nuclear Decommissioning. At September 30, 2017,2021, the estimated future nuclear decommissioning cost recognized in the financial statements was $2.9$3.4 billion and was included in AROs, and the unamortized regulatory asset related to nuclear decommissioning ARO costs of $823$363 million was included in Regulatory assets.
The following key assumptions can have a significant effect on estimates related to the nuclear decommissioning costs reported in TVA's nuclear ARO liability:
Timing and Method – In projecting decommissioning costs, two assumptions must be made to estimate the timing of plant decommissioning. First, the date of the plant's retirement must be estimated. At Browns Ferry and Sequoyah, the estimated retirement date is based on the unit with the longest license period remaining. At Watts Bar, the estimated retirement
date is based on each unit's license period. Second, an assumption must be made on the timing of the decommissioning. TVA has ascribed probabilities to two different decommissioning methods related to its nuclear decommissioning obligation estimate: the DECON method and the SAFSTOR method. The DECON method requires that radioactive contamination be removed from a site and safely disposed of or decontaminated to a level that permits the site to be released for unrestricted use shortly after it ceases operation. The SAFSTOR method allows nuclear facilities to be placed and maintained in a condition that allows the
facilities to be safely stored and subsequently decontaminated to levels that permit release for unrestricted use. TVA bases its nuclear decommissioning estimates on site-specific cost studies, which are updated for each of TVA’sTVA's nuclear units at least every five years. TVA completedplans to complete new cost studies in 2017. The most recent study was approved and implemented in September 2017. An increase of $250 million was recorded to the nuclear AROs as a result of the updates.2022. Changes in probabilities ascribed to the assumptions or the timing of decommissioning can significantly change the present value of TVA's obligations.
Cost Estimates – There is limited experience with actual decommissioning of large nuclear facilities. Changes in technology and experience as well as changes in regulations regarding nuclear decommissioning could cause cost estimates to change significantly. TVA's cost studies assume current technology and regulations.
Cost Escalation Rate – TVA uses expected inflation rates over the remaining timeframe until the costs are expected to be incurred to estimate the amount of future cash flows required to satisfy TVA’sTVA's decommissioning obligations.
Discount Rate – TVA uses its incremental borrowing rate over a period consistent with the remaining timeframe until the costs are expected to be incurred to calculate the present value of the weighted estimated cash flows required to satisfy TVA’sTVA's decommissioning obligations.
The actual decommissioning costs may vary from the derived estimates because of changes in current assumptions, such as the assumed dates of decommissioning, changes in regulatory requirements, changes in technology, and changes in the cost of labor, materials, and equipment. A 10 percent change in TVA's ARO for nuclear decommissioning cost at September 30, 2017,2021, would have affected the liability by approximately $286$343 million.
Non-Nuclear Decommissioning. At September 30, 2017,2021, the estimated future non-nuclear decommissioning cost recognized in the financial statements was $1.4$3.6 billion and was included in AROs, and the unamortized regulatory asset related to non-nuclear decommissioning ARO costs of $703 million$2.7 billion was included in Regulatory assets.
This decommissioning cost estimate involves estimating the amount and timing of future expenditures and making judgments concerning whether or not such costs are considered a legal obligation. Estimating the amount and timing of future expenditures includes, among other things, making projections of the timing and duration of the asset retirement process and predicting how costs will escalate with inflation. These costs are predominantly CCR closure, CCR post-closure care and monitoring, and plant powerhouse asbestos removal. CCR closure estimates are primarily closure-in-place except for specific ponds located at Allen and Gallatin, which are closure-by-removal. CCR post-closure care and monitoring primarily includes costs for grounds maintenance, cover system and mechanical maintenance, inspections, and groundwater monitoring costs. Asbestos removal is based on cost per square foot to remove and dispose of asbestos-containing materials. TVA revises estimates of CCR closure on a project by project basis when updated cost information becomes available that causes management's expectation of cost to change materially. CCR post-closure care and monitoring costs and asbestos removal are studied for revision at least every five years, but revised more frequently if updated cost information becomes available that causes management's expectation of cost to change materially.
The following key assumptions can have a significant effect on estimates related to the non-nuclear decommissioning costs:
Timing and Method – In projecting non-nuclear decommissioning costs, the date of the asset’sasset's retirement must be estimated. In instances where the retirement of a specific asset will precede the retirement of the generating plant, the anticipated retirement date of the specific asset is used. Additionally, TVA expects to incur certain ongoing costs subsequent to the initial asset retirement. TVA develops its cost estimates based on likelihood of decommissioning method where options exist in fulfilling legal obligations (e.g., cap and close in place closure-in-place or clean closureclosure-by-removal for coal ash impoundments). The decommissioning method is determined based on several factors including available technologies, environmental studies, cost factors, resource availability, and timing requirements. As these factors are considered and decommissioning methods are determined, the detailed project schedules and estimates are adjusted. During 2016, See Note 10 — Regulatory Assets and Liabilities —Non-Nuclear Decommissioning Costs.
TVA management updatedimplemented revised depreciation rates during the first quarter of 2022 applicable to its completed plant as a result of the completion of a new depreciation study. The study includes a decline in the service life estimates of TVA’s coal-fired plants based on current planning assumptions to potentially retire the remainder of the coal-fired fleet by 2035. As a result of the accelerated retirements reflected in the depreciation study, TVA performed an assessment of the assumptions used in the timing of cash flows related to its non-nuclear plant closure method assumption from a maintain-in-place methodAROs. Based on the assessment, TVA identified changes to a plant demolition method.its projections of timing of certain asset retirement processes, that will be recorded in 2022.
Technology and Regulation – Changes in technology and experience as well as changes in regulations regarding non-nuclear decommissioning could cause cost estimates to change significantly. TVA’sTVA's cost estimates generally assume current
technology and regulations. In April 2015, the EPA published its final rule governing CCRs,CCR, which regulates landfill and impoundment location, design, and operations; dictates certain pond-closure conditions; and establishes groundwater monitoring and closure and post-closure standards. As a result of this ruling, in 2015 TVA made revisions to the assumptions and estimates used to calculate its CCR AROs. TVA continues to evaluate the impact of the rule on its operations, including cost and timing estimates of related projects. As a result, further adjustments to its ARO liabilities may be required as estimates are refined.
Cost Escalation Rate – TVA uses expected inflation rates over the remaining timeframe until the costs are expected to be incurred to estimate the amount of future cash flows required to satisfy TVA’sTVA's decommissioning obligations.
Discount Rate – TVA uses its incremental borrowing rate over a period consistent with the remaining timeframe until the costs are expected to be incurred to calculate the present value of the weighted estimated cash flows required to satisfy TVA’sTVA's decommissioning obligations.
The actual decommissioning costs may vary from the derived estimates because of changes in current assumptions, such as the assumed dates of decommissioning, changes in the discount or escalation rates, changes in regulatory requirements, changes in technology, and changes in the cost of labor, materials, and equipment. A 10 percent change in TVA's ARO for non-nuclear decommissioning costs at September 30, 2017,2021, would have affected the liability by approximately $145$357 million.
Fair Value Measurements
Investments. Investment funds are comprised of equity securities and debt securities and are classified as trading. These securities are held in the Nuclear Decommissioning Trust ("NDT"), Asset Retirement Trust ("ART"), SERP, Deferred Compensation Plan ("DCP"), and qualified benefit pension plan.
Investment Funds. The assets in the NDT, ART, SERP, and DCP are generally measured at fair value based on quoted market prices or other observable market data such as interest rate indices. These investments are primarily U.S. and international equities, real estate investment trusts, fixed income investments, high-yield fixed income investments, U.S. Treasury Inflation-Protected Securities ("TIPS"), treasuries, currencies, derivative instruments, and other investments. TVA has classified all of these trading securities as either Level 1, Level 2, or Investments measured at net asset value ("NAV"). TVA’s private equity limited partnerships, private real asset investments, and private credit investments may include holdings of investments in private real estate, venture capital, buyout, mezzanine or subordinated debt, restructuring or distressed debt, and special situations through funds managed by third-party investment managers. These investments are valued at NAV as a practical expedient for fair value. There are no readily available quoted exchange prices for these investments. The fair value of these investments is based on information provided by the investment managers. These investments are valued on a quarterly basis. See Note 17 — Fair Value Measurements —Valuation Techniques for a discussion of valuation levels of the investments.
Plan Investments. TVA's qualified benefit pension plan is funded with qualified plan assets. These investments are primarily global public equities, private equities, fixed income securities, public real assets, and private real assets. See Note 22 — Benefit Plans —Fair Value Measurements for disclosure of fair value measurements for investments held by TVARS that support TVA's qualified defined benefit pension plan.
Pricing. Prices provided by third-parties for the assets in investment funds and plan investments are subjected to automated tolerance checks by the investment portfolio trustee to identify and avoid, where possible, the use of inaccurate prices. Any such prices identified as outside the tolerance thresholds are reported to the vendor that provided the price. If the prices are validated, the primary pricing source is used. If not, a secondary source price that has passed the applicable tolerance check is used (or queried with the vendor if it is out of tolerance), resulting in either the use of a secondary price, where validated, or the last reported default price, as in the case of a missing price. For monthly valued accounts, where secondary price sources are available, an automated inter-source tolerance report identifies prices with an inter-vendor pricing variance of over two percent at an asset class level. For daily valued accounts, each security is assigned, where possible, an indicative major market index, against which daily price movements are automatically compared. Tolerance thresholds are established by asset class. Prices found to be outside of the applicable tolerance threshold are reported and queried with vendors as described above.
For investment funds, TVA additionally performs its own analytical testing on the change in fair value measurements each period to ensure the valuations are reasonable based on changes in general market assumptions. TVA also performs pricing tests on various portfolios comprised of securities classified in Levels 1 and 2 on a quarterly basis to confirm accuracy of the values received from the investment portfolio trustee. For plan investments, TVARS reviews the trustee's Service Organization Controls report and the pricing policies of the trustee's largest pricing vendor.
Derivatives. TVA has historically entered into various derivative transactions, including commodity option contracts, forward contracts, swaps, swaptions, futures, and options on futures, to manage various market risks. Other than certain derivative instruments included in investment funds, it is TVA's policy to enter into these derivative transactions solely for hedging purposes and not for speculative purposes.
Currency and Interest Rate Derivatives.TVA has two currency swaps and four "fixed for floating" interest rate swaps. The currency swaps protect against changes in cash flows caused by volatility in exchange rates related to outstanding Bonds
denominated in British pounds sterling. TVA uses interest rate swaps to fix variable short-term debt to a fixed rate. The currency and interest rate swaps are classified as Level 2 valuations as the rate curves and interest rates affecting the fair value of the contracts are based on observable data. The application of credit valuation adjustments ("CVAs") did not materially affect the fair value of these assets and liabilities at September 30, 2021.
Commodity Contracts. TVA enters into commodity contracts for coal and natural gas that require physical delivery of the contracted quantity of the commodity. During the fourth quarter of 2020, TVA discontinued derivative accounting for forward coal contracts because these contracts no longer met the criteria of net settlement. As a result, the associated net derivative liabilities and regulatory assets were derecognized. The natural gas derivative contracts are classified as Level 2 valuations based on market approaches which utilize short-term and mid-term market-quoted prices from an external industry brokerage firm. The application of CVAs did not materially affect the fair value of these assets and liabilities at September 30, 2021.
TVA maintains policies and procedures to value commodity contracts using what is believed to be the best and most relevant data available. In addition, TVA's risk management group reviews valuations and pricing data.
Fair Value Considerations. In determining the fair value of its financial instruments, TVA considers the source of observable market data inputs, liquidity of the instrument, credit risk, and risk of nonperformance of itself or the counterparty to the contract. The conditions and criteria used to assess these factors are described below.
Sources of Market Assumptions.TVA derives its financial instrument market assumptions from market data sources (e.g., Chicago Mercantile Exchange and Moody's Investors Service, Inc. ("Moody's")). In some cases, where market data is not readily available, TVA uses comparable market sources and empirical evidence to derive market assumptions and determine a financial instrument's fair value.
Market Liquidity.Market liquidity is assessed by TVA based on criteria as to whether the financial instrument trades in an active or inactive market. A financial instrument is considered to be in an active market if the prices are fully transparent to the market participants, the prices can be measured by market bid and ask quotes, the market has a relatively high trading volume, and the market has a significant number of market participants that will allow the market to rapidly absorb the quantity of the assets traded without significantly affecting the market price. Other factors TVA considers when determining whether a market is active or inactive include the presence of government or regulatory control over pricing that could make it difficult to establish a market-based price upon entering into a transaction.
Nonperformance Risk. In determining the potential impact of nonperformance risk, which includes credit risk, TVA considers changes in current market conditions, readily available information on nonperformance risk, letters of credit, collateral, other arrangements available, and the nature of master netting arrangements. TVA is a counterparty to derivative instruments that subject TVA to nonperformance risk. Nonperformance risk on the majority of investments and certain exchange-traded instruments held by TVA is incorporated into the exit price that is derived from quoted market data that is used to value the investment.
Nonperformance risk for most of TVA's derivative instruments is an adjustment to the initial asset/liability fair value. TVA adjusts for nonperformance risk, both of TVA (for liabilities) and the counterparty (for assets), by applying a CVA. TVA determines an appropriate CVA for each applicable financial instrument based on the term of the instrument and TVA's or the counterparty's credit rating as obtained from Moody's. For companies that do not have an observable credit rating, TVA uses internal analysis to assign a comparable rating to the company. TVA discounts each financial instrument using the historical default rate (as reported by Moody's for CY 1984 to CY 2020) for companies with a similar credit rating over a time period consistent with the remaining term of the contract.
All derivative instruments are analyzed individually and are subject to unique risk exposures. The application of CVAs resulted in a less than $1 million decrease in the fair value of assets and a $1 million decrease in the fair value of liabilities at September 30, 2021.
Collateral.TVA's interest rate swaps and currency swaps contain contract provisions that require a party to post collateral (in a form such as cash or a letter of credit) when the party's liability balance under the agreement exceeds a certain threshold. See Note 16 — Risk Management Activities and Derivative Transactions—Other Derivative Instruments — Collateral for a discussion of collateral related to TVA's derivative liabilities.
Pension and Other Post-Retirement Benefits
TVA sponsors a defined benefit pension plan that is qualified under section 401(a) of the Internal Revenue Code and covers substantially all of its full-time annual employees hired prior to July 1, 2014. TVARS,The TVA Retirement System ("TVARS"), a separate legal entity governed by its own board of directors (the "TVARS Board"), administers the qualified defined benefit pension plan. TVA also provides a Supplemental Executive Retirement Plan (“SERP”("SERP") to certain executives in critical positions, which provides supplemental pension benefits tied to compensation levels that exceed limits imposed by IRS rules applicable to the qualified defined benefit pension plan. Additionally, TVA provides post-retirement health care benefits for most of its full-time employees who reach retirement age while still working for TVA.
TVA's pension and other post-retirement benefits contain uncertainties because they require management to make certain assumptions related to TVA's cost to provide these benefits. Numerous factors are considered including the provisions of the plans, changing employee demographics, various actuarial calculations, assumptions, and accounting mechanisms. The mostEffects of the COVID-19 pandemic on the financial markets, regulations, and experience are uncertain and still evolving, creating an additional degree of complexity associated with the future occurrence or outcome of events and conditions underlying the significant of these factors areaccounting assumptions discussed below.
Key actuarial assumptions utilized include expected long-term rate of return on plan assets, discount rates, projected health care cost trend rates, cost of living adjustments ("COLA"), and mortality rates. Every five years, a formal actuarial experience study that compares assumptions to the actual experience is conducted. Additional ad-hoc experience studies are performed as needed to review recent experience and validate recommended changes to the actuarial assumptions used based upon TVA's last experience study in 2018.
Expected Return on Plan Assets.The qualified defined benefit pension plan is the only plan that is funded with qualified plan assets. In determining the expected long-term rate of return on pension plan assets, TVA uses a process that incorporates actual historical asset class returns and an assessment of expected future performance and takes into consideration external actuarial advice, the current outlook on capital markets, the asset allocation policy, and the anticipated impact of active management.
During 2017,2021, the TVARS Board decreased the expected long-term return on plan assets net of investment management fees,assumptions from 7.006.75 percent to 6.75 percent. Upon5.75 percent based upon review of the changes in the plan’scurrent plan's funding levels and asset target allocation mix,
capital market outlooks, and the most recent studies,studies. TVA management adopted the 6.755.75 percent expected long-term rate of return on plan assets assumption, which will be used to calculate the 20182022 net periodic pension cost.
TVA recognizes the impact of asset performance on pension expense over a three-year phase-in period through a "market-related"market-related value of assets ("MRVA") calculation. Since the "market-related" value of assetsThe MRVA recognizes investment gains and losses over a three-year period the future value of assetsand is used to calculatein calculating the expected rate of return on assets will be impacted as previously deferred gains or losses are recognized.
Forand the 2017recognized net actuarial loss components of pension net periodic benefit cost, TVA used an expected rate of return of 7.00 percent. The plan's actual rate of return for 2017 was 10.92 percent. The difference between the expected and actual return on plan assets resulted in an actuarial gain of $302 million that is recognized as a decrease in the related regulatory asset and the pension benefit obligation.cost.
A higher expected rate of return assumption decreases the net periodic pension benefit costs, whereas a lower expected rate of return assumption increases the net periodic pension benefit cost. The plan's actual rate of return for 2021 was 20.30 percent compared to the assumption of 6.75 percent. The difference between the expected and actual return on plan assets resulted in an actuarial gain of $1 billion that is recognized as a decrease in the related regulatory asset and a decrease in the pension benefit obligation at September 30, 2021.
Discount Rate.TVA’sRate.TVA's discount rates are derived by identifying a theoretical settlement portfolio of high quality corporate bonds of Aa quality or higher sufficient to provide for the projected benefit payments. The model matches the present value of the projected benefit payments to the market value of the theoretical settlement bond portfolio with any resulting excess funds presumed to be reinvested and used to meet successive year benefit payments. A single equivalent discount rate is determined to align the present value of the required cash flow with the value of the bond portfolio. The resulting discount rates are reflective of both the current interest rate and the distinct liability of the pension and post-retirement benefit plans.
The discount rate is somewhat volatile because it is determined based upon the prevailing rate of long-term corporate bonds as of the measurement date. A higher discount rate decreases the plan obligations and correspondingly decreases the net periodic pension and net post-retirement benefit costs for those plans where actuarial losses are being amortized. Alternatively, a lower discount rate increases net periodic pension and net periodic post-retirement benefit costs. The discount rates used to determine the pension and post-retirement benefit obligations were 3.852.90 percent and 3.953.05 percent, respectively, at September 30, 2017.2021.
Health Care Cost Trends.Trends. In establishing health care cost trend rates for the post-retirement obligation, TVA reviews actual recent cost trends and projected future trends considering health care inflation, changes in establishinghealth care utilization, and changes in plan benefits and premium experience. The pre-Medicare eligible per capita claims costs trend rate is 6.25 percent, declining 0.25 percent per year until it reaches the ultimate trend rate of 5.00 percent in 2027. The pre-Medicare eligible per capita contributions trend rate is 8.51 percent for years 2022 through 2024, and then assumed to realign back with the pre-Medicare eligible per capita claims costs trend rate in 2025 at 5.50 percent, reaching the ultimate rate of 5.00 percent in 2027. The post-Medicare current health care cost trend rates. In 2017,rate is zero percent for years 2022 through 2023, reaching the ultimate rate of 4.00 percent in 2024. TVA resetrecognized a $47 million actuarial gain primarily due to lower per capita claims costs than previously assumed net of the current trend rate assumption used to determineloss from the change in the pre-Medicare eligible postretirement obligation to 6.50 percent with the assumption to gradually decrease each successive year until it reaches a 5.00 percent annual increase in health care costs in 2024 and beyond. This reset of theper capita contributions trend rate assumption resulted in a $5 million increase of the post-retirement obligation at September 30, 2017. The assumed health care trend rate used to determine the post-Medicare eligible post-retirement benefit obligation remained consistent with the prior assumption that the health care cost trend would remain at zero percent through 2020 at which point it would increase to 4.00 percent in 2021 and beyond.assumption.
Cost of Living Adjustments. Adjustments.Cost of living adjustments (“COLAs”("COLAs") are an increase in the benefits for eligible retirees to help maintain the purchasing power of benefits as consumer prices increase. This assumption is based on the long-term expected future rate of inflation, which is based on the capital market outlooks, economic forecasts, and economic forecasts.the Federal Reserve policy. See Note 2022 — Benefit Plans — Plan Assumptions — Cost of Living Adjustment for further discussion on the calculation of the COLA. TVA’s 2016The actual COLA assumption was 1.25 percent for CY 20172021 was 1.13 percent. The CY 2022 COLA is assumed to be 3.15 percent, and for years thereafter is assumed to be 2.00 percent for CY 2018 and thereafter. TVA’s actual CY 2017 COLA was 0.99 percent. TVA’s 2017 COLA assumption remained at 2.00 percent for CY 2018 and thereafter to measure the pension benefit obligation.. A higher COLA increases the pension benefit obligation whereas a lower assumption decreases the obligation. The actual calendar year COLA and the long-term COLA assumption are used to determine the benefit obligationsobligation at September 30 are used to determineand the net periodic benefit costs for the following fiscal year adjusted for the actual COLA determined for the following calendar year.
Sensitivity to Changes in Key Assumptions. The following tables illustrate the estimated effects of changing certain of the critical actuarial assumptions discussed above, while holding all other assumptions constant and excluding any impact for unamortized actuarial gains and losses:
|
| | | | | | | | | |
Sensitivity to Certain Changes in Pension Assumptions At September 30, 2017 |
Actuarial Assumption | | Current Assumption | | Change in Assumption | | Impact |
| Effect on 2017 pension expense: | | | | | | |
| Discount rate | | 3.65 | % | | (0.25 | )% | | 17 |
|
| Expected return on assets | | 7.00 | % | | (0.25 | )% | | 16 |
|
| COLA | | 2.00 | % | | 0.25 | % | | 27 |
|
| | | | | | | |
| Effect on benefit obligation at September 30, 2017: | | | | | | |
| Discount rate | | 3.85 | % | | (0.25 | )% | | 367 |
|
| COLA | | 2.00 | % | | 0.25 | % | | 128 |
|
|
| | | | | | | |
Sensitivity to Changes in Assumed Health Care Cost Trend Rates At September 30, 2017 |
| | 1% Increase | | 1% Decrease |
| Effect on total of service and interest cost components for the year | $ | 5 |
| | $ | (5 | ) |
| Effect on end-of-year accumulated post-retirement benefit obligation | 70 |
| | (67 | ) |
Mortality.TVA’s TVA's mortality assumptions are based upon actuarial projections in combination with actuarial studies of the actual mortality experience of TVARS’sTVARS's pension and post-retirement benefit plan participants taking into consideration the Society of Actuaries ("SOA") mortality table and projection scales as of September 30, 2017.2021. TVA continues to monitor the availability of updates to mortality tables, longevity improvement scales, and mortality reviews and experience studies to consider whether these updates should be reflected in the current year mortality assumption.
In 2017,2020, based upon an updated review ofthe most recent mortality improvements,experience study, TVA adopted a modified version of the SOA MP-2016PRI-2012 table. For 2021, TVA has maintained the mortality table assumption adopted in 2020, and updated to the latest mortality improvement scale and maintained its adjusted version of the SOA RP-2014at September 30, 2021. The change in TVA's mortality table to measureassumptions resulted in a $28 million increase in the pension obligation and a $1 million increase in the post-retirement benefit obligation at September 30, 2017.2021.
The SOA MP-2016 scale decreased life expectancies more than had been previously anticipated infollowing tables illustrate the SOA MP-2015 and SOA MP-2014 scales. The change in TVA’s improvement scale resulted in a decrease inestimated effects of changing certain of the pension and post-retirement benefit obligations of $117 million and $6 million, respectively, as of September 30, 2017.
Contributions. The minimum pension contribution for 2017 was $300 million and was paid in twelve monthly installments. In September 2017, TVA also made an additional $500 million contribution to the pension plan. TVA made contributions of $5 million to the SERP and $30 million, net of rebates and subsidies received, to the unfunded other post-retirement benefit plans. TVA expects to contribute $300 million to TVARS, $4 million to the SERP, and $33 million to the other post-retirement benefit plans in 2018.
Accounting Mechanisms. In accordance with current accounting guidance, TVA utilizes a number of accounting mechanisms that reduce the volatility of reported pension expense. Differences betweencritical actuarial assumptions discussed above, while holding all other assumptions constant and actual plan results are deferredexcluding any impact for unamortized actuarial gains and amortized into period expense only when the accumulated differences exceed 10 percent of the greater of the projected benefit obligation or the market-relative value of plan assets. If necessary, the excess is amortized over thelosses:
average future expected working lifetime of participants expected to receive benefits, which is over 10 years, but will steadily decrease as the plan is closed to new entrants. Additionally, TVA recognizes pension costs as regulatory assets to the extent that the amount calculated under GAAP expenses differs from the amount TVA contributes to the pension plan. Furthermore, amortization of net prior service cost/(credit) resulting from a plan change is included as a component of period expense in the year first recognized and every year thereafter until it is fully amortized. The increase in the benefit obligation due to a plan change is amortized over the average remaining service period of participating employees expected to receive benefits under the plan, which is currently 10 years and will continue to decline since no new participants will be added to the plan. The pension and post-retirement benefit plans have prior service credits related to plan changes made in 2009, 2010, and 2016 with remaining amortization periods of three to ten years. | | | | | | | | | | | | | | | | | | | | |
Sensitivity to Certain Changes in Pension Assumptions At September 30, 2021 |
Actuarial Assumption | | Current Assumption | | Change in Assumption | | Impact |
| Effect on 2021 pension expense: | | | | | | |
| Discount rate | | 2.75 | % | | (0.25) | % | | $ | 16 | |
| Expected return on assets | | 6.75 | % | | (0.25) | % | | 18 | |
| COLA | | 2.00 | % | | 0.25 | % | | 29 | |
| | | | | | |
| Effect on benefit obligation | | | | | | |
| Discount rate | | 2.90 | % | | (0.25) | % | | 396 | |
| COLA | | 2.00 | % | | 0.25 | % | | 258 | |
| | | | | | | | | | | |
Sensitivity to Changes in Assumed Health Care Cost Trend Rates At September 30, 2021 |
| | 1% Increase | | 1% Decrease |
| Effect on total of service and interest cost components for the year | $ | 4 | | | $ | (4) | |
| Effect on end-of-year accumulated post-retirement benefit obligation | 71 | | | (69) | |
Fair Value Measurements
Investments
Investment Funds. Investments classified as trading consist of amounts held in the Nuclear Decommissioning Trust ("NDT"), Asset Retirement Trust ("ART"), SERP, and Deferred Compensation Plan ("DCP"). These assets are generally measured at fair value based on quoted market prices or other observable market data such as interest rate indices. These investments are primarily U.S. and international equities, real estate investment trusts, fixed income investments, high-yield fixed income investments, U.S. Treasury Inflation-Protected Securities, commodities, currencies, derivative instruments, and other investments. TVA has classified all of these trading securities as either Level 1, Level 2, or Investments measured at net asset value. See Note 16 — Valuation Techniques for a discussion of valuation levels of the investments.
Plan Investments. TVA’s qualified benefit pension plan is funded with qualified plan assets. These investments are primarily global public equities, private equities, fixed income securities, public real assets, and private real assets. See Note 20 — Fair Value Measurements for disclosure of fair value measurements for investments held by TVARS that support TVA’s qualified defined benefit pension plan.
Pricing. Prices provided by third-parties for the assets in investment funds and plan investments are subjected to automated tolerance checks by the investment portfolio trustee to identify and avoid, where possible, the use of inaccurate prices. Any such prices identified as outside the tolerance thresholds are reported to the vendor that provided the price. If the prices are validated, the primary pricing source is used. If not, a secondary source price that has passed the applicable tolerance check is used (or queried with the vendor if it is out of tolerance), resulting in either the use of a secondary price, where validated, or the last reported default price, as in the case of a missing price. For monthly valued accounts, where secondary price sources are available, an automated inter-source tolerance report identifies prices with an inter-vendor pricing
variance of over two percent at an asset class level. For daily valued accounts, each security is assigned, where possible, an indicative major market index, against which daily price movements are automatically compared. Tolerance thresholds are established by asset class. Prices found to be outside of the applicable tolerance threshold are reported and queried with vendors as described above.
For investment funds, TVA additionally performs its own analytical testing on the change in fair value measurements each period to ensure the valuations are reasonable based on changes in general market assumptions. TVA also performs pricing tests on various portfolios comprised of securities classified in Levels 1 and 2 on a quarterly basis to confirm accuracy of the values received from the investment portfolio trustee. For plan investments, TVARS reviews the trustee's Service Organization Controls report and the pricing policies of the trustee's largest pricing vendor.
Derivatives
TVA has entered into various derivative transactions, including commodity option contracts, forward contracts, swaps, swaptions, futures, and options on futures, to manage various market risks. Other than certain derivative instruments included in investment funds, it is TVA's policy to enter into these derivative transactions solely for hedging purposes and not for speculative purposes.
Currency and Interest Rate Derivatives. TVA has three currency swaps and four “fixed for floating” interest rate swaps. The currency swaps protect against changes in cash flows caused by volatility in exchange rates related to outstanding Bonds denominated in British pounds sterling. The currency and interest rate swaps are classified as Level 2 valuations as the rate curves and interest rates affecting the fair value of the contracts are based on observable data. The application of credit valuation adjustments ("CVAs") did not materially affect the fair value of these assets and liabilities at September 30, 2017.
Commodity Contracts. TVA enters into commodity derivatives for coal and natural gas that require physical delivery of the contracted quantity of the commodity. The fair values of these derivative contracts are determined using internal models based on income approaches. TVA develops an overall coal forecast based on widely-used short-term and mid-range market data from an external pricing specialist in addition to long-term internal estimates. To value the volume option component of applicable coal contracts, TVA uses a Black-Scholes pricing model which includes inputs from the overall coal price forecast, contract-specific terms, and other market inputs. Based on the use of certain significant unobservable inputs, these valuations are classified as Level 3 valuations. Additionally, any settlement fees related to early termination of coal supply contracts are included at the contractual amount. The application of CVAs did not materially affect the fair value of these assets and liabilities at September 30, 2017.
Commodity Derivatives under the Financial Trading Program. TVA established a Financial Trading Program ("FTP") under which it could purchase and sell futures, swaps, options, and similar derivative instruments to hedge its exposure to changes in prices of natural gas, fuel oil, coal, and other commodities. Although certain natural gas futures and swaps under the FTP remain at September 30, 2017, future purchases under the program have been suspended. TVA plans to continue to manage fuel price volatility through other methods and to periodically reevaluate its suspended FTP program for future use of financial instruments. TVA is prohibited from taking speculative positions in its FTP.
Financial instruments under the FTP are valued based on market approaches which utilize Chicago Mercantile Exchange ("CME") quoted prices and other observable inputs. Futures and options contracts settled on the CME are classified as Level 1 valuations. Swap contracts are valued using a pricing model based on CME inputs and are subject to nonperformance risk outside of the exit price. These contracts are classified as Level 2 valuations. The application of CVAs did not materially affect the fair value of these assets and liabilities at September 30, 2017.
TVA maintains policies and procedures to value commodity contracts using what is believed to be the best and most relevant data available. In addition, TVA’s risk management group reviews valuations and pricing data. TVA retains independent pricing vendors to assist in valuing certain instruments without market liquidity.
Fair Value Considerations
In determining the fair value of its financial instruments, TVA considers the source of observable market data inputs, liquidity of the instrument, credit risk, and risk of nonperformance of itself or the counterparty to the contract. The conditions and criteria used to assess these factors are described below.
Sources of Market Assumptions. TVA derives its financial instrument market assumptions from market data sources (e.g., CME and Moody's Investors Service, Inc. ("Moody's")). In some cases, where market data is not readily available, TVA uses comparable market sources and empirical evidence to derive market assumptions and determine a financial instrument's fair value.
Market Liquidity. Market liquidity is assessed by TVA based on criteria as to whether the financial instrument trades in an active or inactive market. A financial instrument is considered to be in an active market if the prices are fully transparent to the market participants, the prices can be measured by market bid and ask quotes, the market has a relatively high trading
volume, and the market has a significant number of market participants that will allow the market to rapidly absorb the quantity of the assets traded without significantly affecting the market price. Other factors TVA considers when determining whether a market is active or inactive include the presence of government or regulatory control over pricing that could make it difficult to establish a market-based price upon entering into a transaction.
Nonperformance Risk. In determining the potential impact of nonperformance risk, which includes credit risk, TVA considers changes in current market conditions, readily available information on nonperformance risk, letters of credit, collateral, other arrangements available, and the nature of master netting arrangements. TVA is a counterparty to derivative instruments that subject TVA to nonperformance risk. Nonperformance risk on the majority of investments and certain exchange-traded instruments held by TVA is incorporated into the exit price that is derived from quoted market data that is used to value the investment.
Nonperformance risk for most of TVA’s derivative instruments is an adjustment to the initial asset/liability fair value. TVA adjusts for nonperformance risk, both of TVA (for liabilities) and the counterparty (for assets), by applying a CVA. TVA determines an appropriate CVA for each applicable financial instrument based on the term of the instrument and TVA’s or the counterparty’s credit rating as obtained from Moody’s. For companies that do not have an observable credit rating, TVA uses internal analysis to assign a comparable rating to the company. TVA discounts each financial instrument using the historical default rate (as reported by Moody’s for CY 1983 to CY 2016) for companies with a similar credit rating over a time period consistent with the remaining term of the contract.
All derivative instruments are analyzed individually and are subject to unique risk exposures. The application of CVAs resulted in a less than $1 million decrease in the fair value of assets and a $1 million decrease in the fair value of liabilities at September 30, 2017.
Collateral. TVA’s interest rate swaps, currency swaps, and commodity derivatives under the FTP contain contract provisions that require a party to post collateral (in a form such as cash or a letter of credit) when the party’s liability balance under the agreement exceeds a certain threshold. See Note 15 — Other Derivative Instruments — Collateral for a discussion of collateral related to TVA’s derivative liabilities.
New Accounting Standards and Interpretations
See Note 2— Impact of New Accounting Standards and Interpretations for a discussion of recent accounting standards and pronouncements whichthat were issued by the Financial Accounting Standards Board ("FASB"), became effective for TVA, or were adopted by TVA during the presented periods.
Legislative and Regulatory Matters
TVA continues to monitor how regulatory agencies are interpreting and implementing the provisions of the Dodd-Frank Wall Street Reform and Consumer Protection Act, which was enacted in July 2010. As a result, of this act and its implementing regulations, TVA has become subject to recordkeeping, reporting, and reconciliation requirements related to its derivative transactions. In addition, depending on how regulatory agencies interpret and implement the provisions, of this act, TVA’sTVA's hedging costs may increase, and TVA may have to post additional collateral and margin in connection with its derivative transactions.
For additional discussion on legislative and regulatory matters, including a discussion of environmental legislation and regulation, see Item 1, Business — Environmental Matters.Matters, Item 1, Business — Regulation, and Item 7, Management's Discussion and Analysis of Financial Condition and Results of Operations —Key Initiatives and Challenges.
TVA does not engage, and does not control any entity that is engaged, in any activity listed under Section 13(r) of the Securities Exchange Act of 1934 (the "Exchange Act"), which requires certain issuers to disclose certain activities relating to Iran involving the issuer and its affiliates. Based on information supplied by each such person, none of TVA's directors and executive officers are involved in any such activities. While TVA is an agency and instrumentality of the United States of America,U.S., TVA does not believe its disclosure obligations, if any, under Section 13(r) extend to the activities of any other departments, divisions, or agencies of the United States.U.S.
Environmental Matters
See Item 1, Business — Environmental Matters, which discussion is incorporated by reference into this Item 7, Management’sManagement's Discussion and Analysis of Financial Condition and Results of Operations.
Legal Proceedings
From time to time, TVA is party to or otherwise involved in lawsuits, claims, proceedings, investigations, and other legal matters ("Legal Proceedings") that have arisen in the ordinary course of conducting its activities, as a result of catastrophic events or otherwise. As of September 30, 2017,2021, TVA had accrued approximately $22$13 million with respect to Legal Proceedings. No assurance can be given that TVA will not be subject to significant additional claims and liabilities. If actual liabilities significantly exceed the estimates made, TVA's results of operations, liquidity, and financial condition could be materially adversely affected.
For a discussion of certain current material Legal Proceedings, see Note 823 — Commitments and Note 21Contingencies —Legal Proceedings, which discussions are incorporated into this Item 7, Management's Discussion and Analysis of Financial Condition and Results of Operations.
Risk Management Activities
TVA is exposed to various market risks. These market risks include risks related to commodity prices, investment prices, interest rates, currency exchange rates, inflation, and counterparty credit and performance risk. To help manage certain of these risks, TVA has entered into various derivative transactions, including commodity option contracts, forward contracts, swaps, swaptions, futures, and options on futures. Other than certain derivative instruments in its trust investment funds, it is TVA’sTVA's policy to enter into these derivative transactions solely for hedging purposes and not for speculative purposes. TVA plans to continue to manage fuel price volatility through various methods, but is currently evaluating the future use of financial instruments. See Note 1516 — Risk Management Activities and Derivative Transactions.
Risk Governance
The Enterprise Risk Council ("ERC") is responsible for the highest level of risk oversight at TVA and is also responsible for communicating enterprise-wide risks with policy implications to the TVA Board or a designated TVA Board committee. The ERC is comprised of the Executive Management CommitteeEnterprise Leadership Team ("EMC"ELT") and the Chief Risk Officer ("CRO") who will actacts as Chair. ERC members may invite additional attendees to meetings as non-voting participants. The ERC has also established a subordinate Portfolio Risk Oversight Committee ("PROC"), which is comprisedcommittees, consisting of business unit leaders, with specific expertise. PROC is responsible forto assist in the evaluationoversight of TVA’s portfolio risk management processes and infrastructure for power, fuel and other commodities critical to TVA’s power supply. procurement, DER programs and products, and general risk management.
TVA has a designated Enterprise Risk Management ("ERM") organization within its Financial Services organization responsible for (1) establishing enterprise risk management policies and guidelines, (2) developing an enterprise risk profile aligned with TVA's strategic objectives, (3) performing annual risk assessments across all TVA business units, (4) monitoring and reporting on identified enterprise risks and emerging risks, (5) facilitating enterprise risk discussions with the risk subject matter experts across the organization and at the ERC and TVA Board levels, and (6) developing and improving TVA's risk awareness culture. TVA has cataloged major short-term and long-term enterprise level risks across the organization. A discussion of significant risks is presented in Item 1A, Risk Factors.
Commodity Price Risk
TVA is exposed to effects of market fluctuations in the price of commodities that are critical to its operations, including electricity, coal, and natural gas. The magnitude of exposure to these risks is influenced by many factors including contract terms and market liquidity. TVA’sTVA's commodity price risk is substantially mitigated by its cost-based rates, including its total fuel cost adjustment, and long-term fixed price commodity contracts.
TVA previously used its FTP to help manage cost volatility for its wholesale and directly served customers. Although management has suspended the use of financial instruments under the program, certain natural gas hedges remained in place at September 30, 2017, and 2016, for the mitigation of risks associated with the price of natural gas. A hypothetical 10 percent decline in the market price of natural gas on September 30, 2017, and 2016, would have resulted in decreases of approximately $1 million and $6 million, respectively, in the fair value of TVA’s natural gas trading derivative instruments at these dates.
Additionally, TVA manages risk with commodity contract derivativescontracts for both coal and natural gas that require physical delivery of the contracted quantity. A hypothetical 10 percent decline in the market price of coalnatural gas on September 30, 2017,2021 and 2016,2020, would have resulted in decreases of approximately $36$124 million and $41$84 million, respectively, in the fair value of TVA’s coalTVA's natural gas derivative instruments at these dates. ATVA discontinued derivative accounting for forward coal contracts during the fourth quarter of 2020; therefore, a hypothetical 10 percent decline in the market price of natural gas on September 30, 2017,coal is not presented.
In 2014, TVA suspended its Financial Trading Program. In anticipation of lifting the suspension in 2022, the TVA Board, in November 2021, approved the elimination of the Value at Risk aggregate transaction limit for the Financial Hedging Program (formerly, the Financial Trading Program) and 2016, would have resultedauthorized the use of tolerances and measures that will be reviewed annually by the TVA Board. The tolerances will address counterparty exposure, liquidity risk, and reduction in decreases of approximately $84 million and $45 million, respectively, infuel cost volatility. In addition, the fair value of TVA’s natural gas derivative instruments at these dates.TVA Board approved certain administrative changes to the Financial Hedging Program.
Investment Price Risk
TVA’sTVA's investment price risk relates primarily to investments in TVA’sTVA's NDT, ART, pension fund, SERP, and DCP.
Nuclear Decommissioning Trust. The NDT is generally designed to achieve a return in line with overall equity and debt market performance. The assets of the trust are invested in debt and equity securities, private partnerships, and limited liability companies, and certain derivative instruments including forwards, futures, options, and swaps, and through these investments the trust has exposure to
U.S. equities, international equities, real estate investment trusts, natural resource equities, high-yield debt, domestic debt, U.S. Treasury Inflation-Protected Securities ("TIPS"), commodities, andTIPS, treasuries, private real estate,assets, private equity, and absolute returnprivate credit strategies. At September 30, 2017,2021 and 2016,2020, an immediate 10 percent decrease in the price of the investments in the trust would have reduced the value of the trust by $188$281 million and $165$223 million, respectively.
Asset Retirement Trust. The ART is presently invested to achieve a return in line with overall equity and debt market performance. The assets of the trust are invested in debt and equity securities, directlyprivate partnerships, and indirectlycertain derivative instruments including options, and through commingled funds.these investments the trust has exposure to U.S. equities, real estate investment trusts, natural resource equities, high-yield debt, domestic debt, TIPS, treasuries, private real assets, private equity, and private credit strategies. At September 30, 2017,2021 and 2016,2020, an immediate 10 percent decrease in the price of the investments in the trust would have reduced the value of the trust by $63$113 million and $52$87 million, respectively.
Qualified Pension Plan. In August 2021, a new asset allocation plan was put in place to reduce risk and volatility in the TVARS investment portfolio. The TVARS Board's current asset allocation policy for the investment of qualified pension plan assets has targets of 4755 percent equity including global public and private equity investments, 30 percent fixed income securities, and 23 percent realgrowth assets, including publicdefensive growth assets, 20 percent defensive assets, and private real asset investments. TVARS has a long-term investment plan that contains a dynamic de-risking strategy which will allocate investments to assets that better match the liability, such as long duration fixed income securities, over time as improved funding status targets are met.25 percent inflation-sensitive assets. Pursuant to the TVARS Rules and Regulations, any proposed changes in asset allocation that would change the system’sTVARS's assumed rate of investment return are subject to TVA’sTVA's review and veto.
As set forth above, the qualified pension plan assets are invested across global public equity, private equity, safety oriented fixed income, opportunistic fixed income, public realgrowth assets, defensive growth assets, defensive assets, and private realinflation-sensitive assets. The TVARS asset allocation policy includes permissible deviations from these target allocations. The TVARS Boardallocations, and action can take action,be taken, as appropriate, to rebalance the system’splan's assets consistent with the asset allocation policy. At September 30, 2017,2021 and 2016,2020, an immediate 10 percent decrease in the value of the net assets of the fund would have reduced the value of the fund by approximately $799$911 million and $715$796 million, respectively.
Supplemental Executive Retirement Plan. The SERP is a non-qualified defined benefit pension plan similar to those typically found in other companies in TVA's peer group and is provided to selected employees of TVA. TVA's SERP was created to recruit and retain key executives. The plan is designed to provide a competitive level of retirement benefits in excess of the limitations on contributions and benefits imposed by TVA's qualified defined benefit plan and Internal Revenue Code Section 415 limits on qualified retirement plans. The SERP currently targets an asset allocation policy for its plan assets of 6564 percent equity securities, which includes U.S. and non-U.S. equities, and 3536 percent fixed income securities. The SERP plan assets are presently invested to achieve a return in line with overall equity and debt market performance. At September 30, 2017,2021 and 2016,2020, an immediate 10 percent decrease in the value of the SERP investments would have reduced the value of the investments by $6$8 million and $5$7 million, respectively.
Deferred Compensation Plan. The DCP is designed to provide participants with the ability to defer compensation until employment with TVA ends.to future periods. The plan assists in the recruitment of top executive talent for TVA. As in other corporations, deferred compensation can be an integral part of a total compensation package. Assets currently include deferral balances. The default return on investment of the accounts is interest calculated based on the composite rate of all marketable U.S. Treasury issues. Executives may alternatively choose to have their balances adjusted based on the return of certain mutual funds. At September 30, 2017,2021 and 2016,2020, an immediate 10 percent decrease in the value of the deferred compensation accounts would have reduced the value of the accounts by $2 million and $3 million, and $4 million, respectively.
Interest Rate Risk
TVA’sTVA's interest rate risk is related primarily to its short-term investments, short-term debt, long-term debt, and interest rate derivatives.
Investments. At September 30, 2017,2021, TVA had $300$499 million of cash and cash equivalents, and the average balance of cash and cash equivalents for 20172021 was $336$657 million. The average interest rate that TVA received on its short-term investments during 20172021 was lessonly slightly higher than one percent.zero percent, and, therefore, interest income related to short-term investments was minimal. If the rates of interest that TVA received on its short-term investments during 20172021 were exactly zero percent, TVA would have received approximately $2 milliona minimal amount less in interest from its short-term investments during 2017.investments. At September 30, 2016,2020, TVA had $300$500 million of cash and cash equivalents, and the average balance of cash and cash equivalents for 20162020 was $363$637 million. The average interest rate that TVA received on its short-term investments during 20162020 was less than one percent. If the rates that TVA received on its short-term investments during 20162020 were zero percent, TVA would have received approximately $1$4 million less in interest from its short-term investments during 2016.investments. In addition to affecting the amount of interest that TVA receives from its short-term investments, changes in interest rates could affect the value of the investments in its pension plan, ART, NDT, SERP, and DCP. See Risk Management Activities — Investment Price Risk above.
Short-Term Debt. At September 30, 2017, TVA’s2021, TVA's short-term borrowings were $2.0 billion,$780 million, and the current maturities of long-term debt were $1.8$1.1 billion. Based on TVA’sTVA's interest rate exposure at September 30, 2017,2021, an immediate one percentage point increase in interest rates would have resulted in an increase of $38$19 million in TVA’sTVA's short-term interest expense. At September 30, 2016, TVA’s2020, TVA's short-term borrowings were $1.4 billion,$57 million, and the current maturities of long-term debt were $1.6$1.8 billion. Based on TVA’sTVA's interest rate exposure at September 30, 2016,2020, an immediate one percentage point increase in interest rates would have resulted in an increase of $30$19 million in TVA’sTVA's short-term interest expense.
Long-Term Debt. At September 30, 2017,2021 and 2016,2020, the interest rates on all of TVA’sTVA's outstanding long-term debt were fixed (or subject only to downward adjustment under certain conditions). Accordingly, an immediate one percentage point increase in interest rates would not have affected TVA’sTVA's interest expense associated with its long-term debt. When TVA’s long-
termTVA's long-term debt matures or is redeemed, however, TVA typically refinances debt in whole or in part by issuing additional debt. Accordingly, if interest rates are high when TVA issues this additional debt, TVA’sTVA's cash flows, results of operations, and financial condition may be adversely affected. This risk is somewhat mitigated by the fact that TVA’sTVA's debt portfolio is diversified in terms of maturities and has a long average life. At September 30, 2017,2021 and 2016,2020, the average life of TVA’sTVA's debt portfolio was 16.615.69 years and 16.815.3 years, respectively. AAt September 30, 2021 and 2020, the average interest rate of TVA's debt portfolio was 4.51 percent and 4.56 percent, respectively. See Note 14 — Debt and Other Obligations — Debt Outstanding for a schedule of TVA’sTVA's debt maturities is contained in Note 13 — Debt Outstanding.maturities.
Interest Rate Derivatives. Changes in interest rates also affect the mark-to-market ("MtM") valuation of TVA’sTVA's interest rate derivatives. See Note 1516 — Risk Management Activities and Derivative Transactions — Derivatives Not Receiving Hedge Accounting Treatment — Interest Rate Derivatives. TVA had four interest rate swaps outstanding at September 30, 2017,2021 and September 30, 2016.2020. Net unrealized gains and losses on these instruments are reflected on TVA’s consolidated balance sheetsTVA's Consolidated Balance Sheets in a regulatory asset account, and realized gains and losses are reflected in earnings. Based on TVA’sTVA's interest rate exposure at September 30, 2017,2021 and 2020, an immediate one-half percentage point decrease in interest rates would have increased the interest rate swap liabilities by $233 million. Based on TVA’s$260 million and $270 million, respectively.
London Interbank Offered Rate. TVA has four "fixed for floating" interest rate exposure at September 30, 2016,swaps related to outstanding Bonds, and receives periodic payments under these swaps based on the floating London Interbank Offered Rate ("LIBOR") benchmark rate. TVA may also have additional contracts that could be impacted. LIBOR rates will be phased out between the end of calendar year 2021 and June 2023. Various alternatives for LIBOR are being evaluated by market participants, with the Secured Overnight Financing Rate being the most widely-adopted alternative thus far. TVA may face risks related to the viability of an immediate one-half percentage point decrease in interest rates would have increasedalternative benchmark over the interest rate swap liabilities by $294 million.remaining terms of its current contracts, or over the terms of any future contracts that rely on the benchmark rate.
Currency Exchange Rate Risk
Over the next several years, TVA plans to spend a significant amount of capital on clean air projects, capacity expansion, and other projects. A portion of this amount may be spent on contracts that are denominated in one or more foreign currencies. Additionally, TVA’s threeTVA's two issues of Bonds denominated in British pounds sterling are hedged by currency swap agreements. The value of the U.S. dollar compared with other currencies has fluctuated widely in recent years, including recent fluctuations in the U.S. dollar to British pound sterling exchange rate primarily driven by the “BREXIT”"BREXIT" vote for the United Kingdom to leave the European Union. If not effectively managed, foreign currency exposure could negatively impact TVA's counterparty risk, cash flows, results of operations, and financial condition.
ITEM 7A. QUANTITATIVE AND QUALITATIVE DISCLOSURES ABOUT MARKET RISK
Quantitative and qualitative disclosures about market risk are reported in Item 7, Management's Discussion and Analysis of Financial Condition and Results of Operations — Risk Management Activities, which discussion is incorporated by reference into this Item 7A, Quantitative and Qualitative Disclosures About Market Risk.
ITEM 8. FINANCIAL STATEMENTS AND SUPPLEMENTARY DATA
TENNESSEE VALLEY AUTHORITY
CONSOLIDATED STATEMENTS OF OPERATIONS
For the years ended September 30
(in millions)
| | | | | | | | | | | | | | | | | |
| | 2021 | | 2020 | | 2019 |
| Operating revenues | | | | | |
| Revenue from sales of electricity | $ | 10,357 | | | $ | 10,104 | | | $ | 11,159 | |
| Other revenue | 146 | | | 145 | | | 159 | |
| Total operating revenues | 10,503 | | | 10,249 | | | 11,318 | |
| Operating expenses | | | | | |
| Fuel | 1,737 | | | 1,584 | | | 1,896 | |
| Purchased power | 984 | | | 880 | | | 1,007 | |
| Operating and maintenance | 2,890 | | | 2,720 | | | 3,090 | |
| Depreciation and amortization | 1,533 | | | 1,826 | | | 1,973 | |
| Tax equivalents | 514 | | | 528 | | | 541 | |
| Total operating expenses | 7,658 | | | 7,538 | | | 8,507 | |
| Operating income | 2,845 | | | 2,711 | | | 2,811 | |
| Other income (expense), net | 13 | | | 36 | | | 62 | |
| Other net periodic benefit cost | 258 | | | 253 | | | 258 | |
| Interest expense | | | | | |
| Interest expense | 1,088 | | | 1,142 | | | 1,198 | |
| | | | | |
| | | | | |
| Net income (loss) | $ | 1,512 | | | $ | 1,352 | | | $ | 1,417 | |
| The accompanying notes are an integral part of these consolidated financial statements. |
|
| | | | | | | | | | | |
| | 2017 | | 2016 | | 2015 |
| Operating revenues | | | | | |
| Revenue from sales of electricity | $ | 10,586 |
| | $ | 10,461 |
| | $ | 10,847 |
|
| Other revenue | 153 |
| | 155 |
| | 156 |
|
| Total operating revenues | 10,739 |
| | 10,616 |
| | 11,003 |
|
| Operating expenses | |
| | |
| | |
|
| Fuel | 2,169 |
| | 2,126 |
| | 2,444 |
|
| Purchased power | 991 |
| | 964 |
| | 950 |
|
| Operating and maintenance | 3,362 |
| | 2,842 |
| | 2,838 |
|
| Depreciation and amortization | 1,717 |
| | 1,836 |
| | 2,031 |
|
| Tax equivalents | 525 |
| | 522 |
| | 525 |
|
| Total operating expenses | 8,764 |
| | 8,290 |
| | 8,788 |
|
| Operating income | 1,975 |
| | 2,326 |
| | 2,215 |
|
| Other income (expense), net | 56 |
| | 43 |
| | 29 |
|
| Interest expense | |
| | |
| | |
|
| Interest expense | 1,346 |
| | 1,371 |
| | 1,347 |
|
| Allowance for funds used during construction | — |
| | (235 | ) | | (214 | ) |
| Net interest expense | 1,346 |
| | 1,136 |
| | 1,133 |
|
| Net income (loss) | $ | 685 |
| | $ | 1,233 |
| | $ | 1,111 |
|
| The accompanying notes are an integral part of these consolidated financial statements. |
TENNESSEE VALLEY AUTHORITY
CONSOLIDATED BALANCE SHEETS
At September 30
(in millions)
| | | | | | | | | | | | |
| ASSETS |
| | 2021 | | 2020 |
| Current assets | | | |
| Cash and cash equivalents | $ | 499 | | | $ | 500 | |
| | | | |
| Accounts receivable, net | 1,566 | | | 1,529 | |
| Inventories, net | 950 | | | 1,003 | |
| Regulatory assets | 196 | | | 130 | |
| Other current assets | 287 | | | 84 | |
| Total current assets | 3,498 | | | 3,246 | |
| | | | |
| Property, plant, and equipment | | | |
| Completed plant | 66,411 | | | 64,970 | |
| Less accumulated depreciation | (34,663) | | | (33,550) | |
| Net completed plant | 31,748 | | | 31,420 | |
| Construction in progress | 2,458 | | | 2,139 | |
| Nuclear fuel | 1,566 | | | 1,504 | |
| Finance leases | 692 | | | 516 | |
| Total property, plant, and equipment, net | 36,464 | | | 35,579 | |
| | | | |
| Investment funds | 4,053 | | | 3,198 | |
| | | | |
| Regulatory and other long-term assets | | | |
| Regulatory assets | 7,956 | | | 10,245 | |
| Operating lease assets, net of amortization | 165 | | | 232 | |
| Other long-term assets | 320 | | | 325 | |
| Total regulatory and other long-term assets | 8,441 | | | 10,802 | |
| | | | |
| Total assets | $ | 52,456 | | | $ | 52,825 | |
| The accompanying notes are an integral part of these consolidated financial statements. |
TENNESSEE VALLEY AUTHORITY
CONSOLIDATED BALANCE SHEETS
At September 30
(in millions)
| | | | | | | | | | | |
| LIABILITIES AND PROPRIETARY CAPITAL |
| 2021 | | 2020 |
| Current liabilities | | | |
| Accounts payable and accrued liabilities | $ | 2,215 | | | $ | 1,844 | |
| | | |
| Accrued interest | 282 | | | 298 | |
| Asset retirement obligations | 266 | | | 345 | |
| Current portion of leaseback obligations | 25 | | | 198 | |
| | | |
| Regulatory liabilities | 340 | | | 141 | |
| Short-term debt, net | 780 | | | 57 | |
| Current maturities of power bonds | 1,028 | | | 1,787 | |
| Current maturities of long-term debt of variable interest entities | 43 | | | 41 | |
| | | |
| Total current liabilities | 4,979 | | | 4,711 | |
| | | |
| Other liabilities | | | |
| Post-retirement and post-employment benefit obligations | 5,045 | | | 6,617 | |
| Asset retirement obligations | 6,736 | | | 6,440 | |
| Finance lease liabilities | 687 | | | 525 | |
| Other long-term liabilities | 2,041 | | | 2,548 | |
| Leaseback obligations | — | | | 25 | |
| Regulatory liabilities | 40 | | | 23 | |
| Total other liabilities | 14,549 | | | 16,178 | |
| | | |
| Long-term debt, net | | | |
| Long-term power bonds, net | 17,457 | | | 17,956 | |
| Long-term debt of variable interest entities, net | 1,006 | | | 1,048 | |
| | | |
| Total long-term debt, net | 18,463 | | | 19,004 | |
| | | |
| Total liabilities | 37,991 | | | 39,893 | |
| | | |
| Commitments and contingencies (Note 23) | | | |
| | | |
| Proprietary capital | | | |
| Power program appropriation investment | 258 | | | 258 | |
| Power program retained earnings | 13,689 | | | 12,177 | |
| Total power program proprietary capital | 13,947 | | | 12,435 | |
| Nonpower programs appropriation investment, net | 540 | | | 548 | |
| Accumulated other comprehensive income (loss) | (22) | | | (51) | |
| Total proprietary capital | 14,465 | | | 12,932 | |
| | | |
| Total liabilities and proprietary capital | $ | 52,456 | | | $ | 52,825 | |
| The accompanying notes are an integral part of these consolidated financial statements. |
TENNESSEE VALLEY AUTHORITY
CONSOLIDATED STATEMENTS OF COMPREHENSIVE INCOME (LOSS)
For the years ended September 30
(in millions)
| | | | | | | | | | | | | | | | | |
| | 2021 | | 2020 | | 2019 |
| Net income (loss) | $ | 1,512 | | | $ | 1,352 | | | $ | 1,417 | |
| Other comprehensive income (loss) | | | | | |
| Net unrealized gain (loss) on cash flow hedges | 126 | | | (1) | | | (114) | |
| Net unrealized (gain) loss reclassified to earnings from cash flow hedges | (97) | | | (38) | | | 45 | |
| Total other comprehensive income (loss) | 29 | | | (39) | | | (69) | |
| Total comprehensive income (loss) | $ | 1,541 | | | $ | 1,313 | | | $ | 1,348 | |
| The accompanying notes are an integral part of these consolidated financial statements. |
|
| | | | | | | | | | | |
| | 2017 | | 2016 | | 2015 |
| Net income (loss) | $ | 685 |
| | $ | 1,233 |
| | $ | 1,111 |
|
| Other comprehensive income (loss) | | | | | |
| Net unrealized gain (loss) on cash flow hedges | 59 |
| | (139 | ) | | (72 | ) |
| Reclassification to earnings from cash flow hedges | (26 | ) | | 129 |
| | 65 |
|
| Total other comprehensive income (loss) | $ | 33 |
| | $ | (10 | ) | | $ | (7 | ) |
| Total comprehensive income (loss) | $ | 718 |
| | $ | 1,223 |
| | $ | 1,104 |
|
| The accompanying notes are an integral part of these consolidated financial statements. |
TENNESSEE VALLEY AUTHORITY
CONSOLIDATED BALANCE SHEETS
At September 30
(in millions)
|
| | | | | | | |
| ASSETS |
| | 2017 |
| 2016 |
| Current assets | |
| |
| Cash and cash equivalents | $ | 300 |
| | $ | 300 |
|
| Accounts receivable, net | 1,569 |
| | 1,747 |
|
| Inventories, net | 1,065 |
| | 993 |
|
| Regulatory assets | 447 |
| | 536 |
|
| Other current assets | 65 |
| | 68 |
|
| Total current assets | 3,446 |
| | 3,644 |
|
| | | | |
| Property, plant, and equipment | |
| | |
|
| Completed plant | 58,947 |
| | 51,564 |
|
| Less accumulated depreciation | (28,404 | ) | | (27,592 | ) |
| Net completed plant | 30,543 |
| | 23,972 |
|
| Construction in progress | 2,842 |
| | 8,458 |
|
| Nuclear fuel | 1,401 |
| | 1,450 |
|
| Capital leases | 161 |
| | 163 |
|
| Total property, plant, and equipment, net | 34,947 |
| | 34,043 |
|
| | | | |
| Investment funds | 2,603 |
| | 2,257 |
|
| | | | |
| Regulatory and other long-term assets | |
| | |
|
| Regulatory assets | 8,698 |
| | 10,164 |
|
| Other long-term assets | 323 |
| | 386 |
|
| Total regulatory and other long-term assets | 9,021 |
| | 10,550 |
|
| | | | |
| Total assets | $ | 50,017 |
| | $ | 50,494 |
|
| The accompanying notes are an integral part of these consolidated financial statements. |
TENNESSEE VALLEY AUTHORITY
CONSOLIDATED BALANCE SHEETS
At September 30
(in millions)
|
| | | | | | | |
| LIABILITIES AND PROPRIETARY CAPITAL |
| | 2017 | | 2016 |
| Current liabilities | | | |
| Accounts payable and accrued liabilities | $ | 1,940 |
| | $ | 2,163 |
|
| Accrued interest | 346 |
| | 363 |
|
| Current portion of leaseback obligations | 37 |
| | 58 |
|
| Current portion of energy prepayment obligations | 100 |
| | 100 |
|
| Regulatory liabilities | 163 |
| | 154 |
|
| Short-term debt, net | 1,998 |
| | 1,407 |
|
| Current maturities of power bonds | 1,728 |
| | 1,555 |
|
| Current maturities of long-term debt of variable interest entities | 36 |
| | 35 |
|
| Current maturities of notes payable | 53 |
| | 27 |
|
| Total current liabilities | 6,401 |
| | 5,862 |
|
| | | | |
| Other liabilities | | | |
| Post-retirement and post-employment benefit obligations | 5,477 |
| | 6,929 |
|
| Asset retirement obligations | 4,176 |
| | 3,840 |
|
| Other long-term liabilities | 3,055 |
| | 2,773 |
|
| Leaseback obligations | 302 |
| | 409 |
|
| Energy prepayment obligations | 10 |
| | 110 |
|
| Regulatory liabilities | 25 |
| | 3 |
|
| Total other liabilities | 13,045 |
| | 14,064 |
|
| | | | |
| Long-term debt, net | | | |
| Long-term power bonds, net | 20,205 |
| | 20,901 |
|
| Long-term debt of variable interest entities, net | 1,164 |
| | 1,199 |
|
| Long-term notes payable | 69 |
| | 48 |
|
| Total long-term debt, net | 21,438 |
| | 22,148 |
|
| | | | |
| Total liabilities | 40,884 |
| | 42,074 |
|
| | | | |
| Commitments and contingencies (Note 21) |
| |
|
| | | | |
| Proprietary capital | | | |
| Power program appropriation investment | 258 |
| | 258 |
|
| Power program retained earnings | 8,282 |
| | 7,594 |
|
| Total power program proprietary capital | 8,540 |
| | 7,852 |
|
| Nonpower programs appropriation investment, net | 572 |
| | 580 |
|
| Accumulated other comprehensive income (loss) | 21 |
| | (12 | ) |
| Total proprietary capital | 9,133 |
| | 8,420 |
|
| | | | |
| Total liabilities and proprietary capital | $ | 50,017 |
| | $ | 50,494 |
|
| The accompanying notes are an integral part of these consolidated financial statements. |
TENNESSEE VALLEY AUTHORITY
CONSOLIDATED STATEMENTS OF CASH FLOWS
For the years ended September 30
(in millions)
| | | | | | | | | | | | | | | | | |
| | 2021 | | 2020 | | 2019 |
| Cash flows from operating activities | | | | | |
| Net income (loss) | $ | 1,512 | | | $ | 1,352 | | | $ | 1,417 | |
| Adjustments to reconcile net income (loss) to net cash provided by operating activities | | | | | |
Depreciation and amortization(1) | 1,555 | | | 1,848 | | | 1,993 | |
| Amortization of nuclear fuel cost | 383 | | | 388 | | | 379 | |
| Non-cash retirement benefit expense | 333 | | | 324 | | | 314 | |
| Prepayment credits applied to revenue | — | | | — | | | (10) | |
| | | | | |
| | | | | |
| Other regulatory amortization and deferrals | (72) | | | (21) | | | 261 | |
| Changes in current assets and liabilities | | | | | |
| Accounts receivable, net | (18) | | | 259 | | | (40) | |
| Inventories and other current assets, net | 42 | | | (12) | | | (87) | |
| Accounts payable and accrued liabilities | 178 | | | (38) | | | (155) | |
| Accrued interest | (18) | | | 1 | | | (8) | |
| | | | | |
| Pension contributions | (306) | | | (305) | | | (307) | |
| | | | | |
| Settlements of asset retirement obligations | (242) | | | (114) | | | (89) | |
| Other, net | (91) | | | (46) | | | 52 | |
| Net cash provided by operating activities | 3,256 | | | 3,636 | | | 3,720 | |
| | | | | |
| Cash flows from investing activities | | | | | |
| Construction expenditures | (1,963) | | | (1,643) | | | (1,700) | |
| | | | | |
| Nuclear fuel expenditures | (354) | | | (342) | | | (474) | |
| | | | | |
| Purchases of investments | (50) | | | (49) | | | (48) | |
| Loans and other receivables | | | | | |
| Advances | (7) | | | (8) | | | (10) | |
| Repayments | 9 | | | 7 | | | 11 | |
| Other, net | 27 | | | 20 | | | (22) | |
| Net cash used in investing activities | (2,338) | | | (2,015) | | | (2,243) | |
| | | | | |
| Cash flows from financing activities | | | | | |
| Long-term debt | | | | | |
| Issues of power bonds | 500 | | | 997 | | | — | |
| | | | | |
| Redemptions and repurchases of power bonds | (1,860) | | | (1,427) | | | (1,035) | |
| Payments on debt of variable interest entities | (41) | | | (39) | | | (38) | |
| Redemptions of notes payable | — | | | (23) | | | (46) | |
| Short-term debt issues (redemptions), net | 723 | | | (865) | | | (294) | |
| Payments on leases and leasebacks | (250) | | | (55) | | | (43) | |
| | | | | |
| Financing costs, net | (2) | | | (4) | | | — | |
| | | | | |
| | | | | |
| Other, net | 9 | | | (6) | | | (21) | |
| Net cash (used in) provided by financing activities | (921) | | | (1,422) | | | (1,477) | |
| Net change in cash, cash equivalents, and restricted cash | (3) | | | 199 | | | — | |
| Cash, cash equivalents, and restricted cash at beginning of year | 521 | | | 322 | | | 322 | |
| Cash, cash equivalents, and restricted cash at end of year | $ | 518 | | | $ | 521 | | | $ | 322 | |
Note (1) Including amortization of debt issuance costs and premiums/discounts. |
| The accompanying notes are an integral part of these consolidated financial statements. |
|
| | | | | | | | | | | |
| | 2017 | | 2016 | | 2015 |
| Cash flows from operating activities | | | | | |
| Net income (loss) | $ | 685 |
| | $ | 1,233 |
| | $ | 1,111 |
|
| Adjustments to reconcile net income (loss) to net cash provided by operating activities | |
| | |
| | |
|
| Depreciation and amortization (including amortization of debt issuance costs and premiums/discounts) | 1,763 |
| | 1,882 |
| | 2,077 |
|
| Amortization of nuclear fuel cost | 341 |
| | 287 |
| | 277 |
|
| Non-cash retirement benefit expense | 837 |
| | 327 |
| | 332 |
|
| Prepayment credits applied to revenue | (100 | ) | | (100 | ) | | (100 | ) |
| Fuel cost adjustment deferral | 98 |
| | (83 | ) | | (6 | ) |
| Fuel cost tax equivalents | 5 |
| | (16 | ) | | (18 | ) |
| Changes in current assets and liabilities | |
| | |
| | |
| Accounts receivable, net | 230 |
| | (83 | ) | | 93 |
|
| Inventories and other current assets, net | 1 |
| | 50 |
| | (12 | ) |
| Accounts payable and accrued liabilities | (119 | ) | | (4 | ) | | (121 | ) |
| Accrued interest | (17 | ) | | (3 | ) | | (13 | ) |
| Regulatory asset costs | (50 | ) | | (31 | ) | | (23 | ) |
| Pension contributions | (805 | ) | | (281 | ) | | (282 | ) |
| Settlements of asset retirement obligations | (123 | ) | | (139 | ) | | (58 | ) |
| Other, net | (10 | ) | | 3 |
| | 58 |
|
| Net cash provided by operating activities | 2,736 |
| | 3,042 |
| | 3,315 |
|
| | | | | | |
| Cash flows from investing activities | |
| | |
| | |
|
| Construction expenditures | (2,153 | ) | | (2,710 | ) | | (2,850 | ) |
| Combustion turbine asset acquisition | — |
| | — |
| | (342 | ) |
| Nuclear fuel expenditures | (305 | ) | | (300 | ) | | (350 | ) |
| Purchases of investments | (49 | ) | | (50 | ) | | (52 | ) |
| Loans and other receivables | |
| | |
| | |
| Advances | (11 | ) | | (10 | ) | | (17 | ) |
| Repayments | 8 |
| | 7 |
| | 8 |
|
| Other, net | (26 | ) | | (50 | ) | | 18 |
|
| Net cash used in investing activities | (2,536 | ) | | (3,113 | ) | | (3,585 | ) |
| | | | | | |
| Cash flows from financing activities | |
| | |
| | |
|
| Long-term debt | |
| | |
| | |
|
| Issues of power bonds | 999 |
| | — |
| | 973 |
|
| Redemptions and repurchases of power bonds | (1,558 | ) | | (76 | ) | | (1,180 | ) |
| Redemptions of notes payable | (27 | ) | | — |
| | — |
|
| Payments on debt of variable interest entities | (35 | ) | | (33 | ) | | (32 | ) |
| Short-term debt issues (redemptions), net | 583 |
| | 370 |
| | 437 |
|
| Payments on leases and leasebacks | (136 | ) | | (159 | ) | | (80 | ) |
| Financing costs, net | (4 | ) | | — |
| | (7 | ) |
| Payments to U.S. Treasury | (5 | ) | | (6 | ) | | (5 | ) |
| Other, net | (17 | ) | | (25 | ) | | (36 | ) |
| Net cash (used in) provided by financing activities | (200 | ) | | 71 |
| | 70 |
|
| Net change in cash and cash equivalents | — |
| | — |
| | (200 | ) |
| Cash and cash equivalents at beginning of year | 300 |
| | 300 |
| | 500 |
|
| Cash and cash equivalents at end of year | $ | 300 |
| | $ | 300 |
| | $ | 300 |
|
| The accompanying notes are an integral part of these consolidated financial statements. |
TENNESSEE VALLEY AUTHORITY
CONSOLIDATED STATEMENTS OF CHANGES IN PROPRIETARY CAPITAL
For the years ended September 30
| | | | | | | | | | | | | | | | | | Power Program Appropriation Investment | |
Power Program Retained Earnings | | Nonpower Programs Appropriation Investment, Net | | Accumulated Other Comprehensive Income (Loss) | |
Total |
| | Power Program Appropriation Investment | | Power Program Retained Earnings | | Nonpower Programs Appropriation Investment, Net | | Accumulated Other Comprehensive Income (Loss) from Net Gains (Losses) on Cash Flow Hedges | | Total | |
| Balance at September 30, 2014 | $ | 258 |
| | $ | 5,240 |
| | $ | 601 |
| | $ | 5 |
| | $ | 6,104 |
| |
| Balance at September 30, 2018 | | Balance at September 30, 2018 | $ | 258 | | | $ | 9,404 | | | $ | 564 | | | $ | 57 | | | $ | 10,283 | |
| Net income (loss) | — |
| | 1,122 |
| | (11 | ) | | — |
| | 1,111 |
| Net income (loss) | — | | | 1,425 | | | (8) | | | — | | | 1,417 | |
| Total other comprehensive income (loss) | — |
| | — |
| | — |
| | (7 | ) | | (7 | ) | Total other comprehensive income (loss) | — | | | — | | | — | | | (69) | | | (69) | |
| Return on power program appropriation investment | — |
| | (5 | ) | | — |
| | — |
| | (5 | ) | Return on power program appropriation investment | — | | | (6) | | | — | | | — | | | (6) | |
| Balance at September 30, 2015 | $ | 258 |
| | $ | 6,357 |
| | $ | 590 |
| | $ | (2 | ) | | $ | 7,203 |
| |
| | Balance at September 30, 2019 | | Balance at September 30, 2019 | $ | 258 | | | $ | 10,823 | | | $ | 556 | | | $ | (12) | | | $ | 11,625 | |
| Net income (loss) | — |
| | 1,243 |
| | (10 | ) | | — |
| | 1,233 |
| Net income (loss) | — | | | 1,360 | | | (8) | | | — | | | 1,352 | |
| Total other comprehensive income (loss) | — |
| | — |
| | — |
| | (10 | ) | | (10 | ) | Total other comprehensive income (loss) | — | | | — | | | — | | | (39) | | | (39) | |
| Return on power program appropriation investment | — |
| | (6 | ) | | — |
| | — |
| | (6 | ) | Return on power program appropriation investment | — | | | (6) | | | — | | | — | | | (6) | |
| Balance at September 30, 2016 | $ | 258 |
| | $ | 7,594 |
| | $ | 580 |
| | $ | (12 | ) | | $ | 8,420 |
| |
| Balance at September 30, 2020 | | Balance at September 30, 2020 | $ | 258 | | | $ | 12,177 | | | $ | 548 | | | $ | (51) | | | $ | 12,932 | |
| Net income (loss) | — |
| | 693 |
| | (8 | ) | | — |
| | 685 |
| Net income (loss) | — | | | 1,520 | | | (8) | | | — | | | 1,512 | |
| Total other comprehensive income (loss) | — |
| | — |
| | — |
| | 33 |
| | 33 |
| Total other comprehensive income (loss) | — | | | — | | | — | | | 29 | | | 29 | |
| Return on power program appropriation investment | — |
| | (5 | ) | | — |
| | — |
| | (5 | ) | Return on power program appropriation investment | — | | | (4) | | | — | | | — | | | (4) | |
| Balance at September 30, 2017 | $ | 258 |
| | $ | 8,282 |
| | $ | 572 |
| | $ | 21 |
| | $ | 9,133 |
| |
Implementation of new accounting standard(1) | | Implementation of new accounting standard(1) | — | | | (4) | | | — | | | — | | | (4) | |
| Balance at September 30, 2021 | | Balance at September 30, 2021 | $ | 258 | | | $ | 13,689 | | | $ | 540 | | | $ | (22) | | | $ | 14,465 | |
Note (1) See Note 2 — Impact of New Accounting Standards and Interpretations. | | Note (1) See Note 2 — Impact of New Accounting Standards and Interpretations. |
| The accompanying notes are an integral part of these consolidated financial statements. | The accompanying notes are an integral part of these consolidated financial statements. | The accompanying notes are an integral part of these consolidated financial statements. |
NOTES TO CONSOLIDATED FINANCIAL STATEMENTS
(Dollars in millions except where noted)
| | | | | | | | | | | |
| Note | Page No. |
| 1 | | Summary of Significant Accounting Policies | |
| 2 | | Impact of New Accounting Standards and Interpretations | |
| 3 | | Accounts Receivable, Net | |
| 4 | | Inventories, Net | |
| 5 | | Other Current Assets | |
| 6 | | Net Completed Plant | |
| 7 | | Plant Closures | |
| 8 | | Leases | |
| 9 | | Other Long-Term Assets | |
| 10 | | Regulatory Assets and Liabilities | |
| 11 | | Variable Interest Entities | |
| 12 | | Other Long-Term Liabilities | |
| 13 | | Asset Retirement Obligations | |
| 14 | | Debt and Other Obligations | |
| 15 | | Accumulated Other Comprehensive Income (Loss) | |
| 16 | | Risk Management Activities and Derivative Transactions | |
| 17 | | Fair Value Measurements | |
| 18 | | Revenue | |
| 19 | | Proprietary Capital | |
| 20 | | Other Income (Expense), Net | |
| 21 | | Supplemental Cash Flow Information | |
| 22 | | Benefit Plans | |
| 23 | | Commitments and Contingencies | |
| 24 | | Related Parties | |
| | | |
| | | |
|
| | | |
| Note | Page No. |
| 1 | | Summary of Significant Accounting Policies | |
| 2 | | Impact of New Accounting Standards and Interpretations | |
| 3 | | Accounts Receivable, Net | |
| 4 | | Inventories, Net | |
| 5 | | Net Completed Plant | |
| 6 | | Other Long-Term Assets | |
| 7 | | Regulatory Assets and Liabilities | |
| 8 | | Gallatin Coal Combustion Residual Facilities | |
| 9 | | Asset Acquisitions and Business Combinations | |
| 10 | | Variable Interest Entities | |
| 11 | | Other Long-Term Liabilities | |
| 12 | | Asset Retirement Obligations | |
| 13 | | Debt and Other Obligations | |
| 14 | | Accumulated Other Comprehensive Income (Loss) | |
| 15 | | Risk Management Activities and Derivative Transactions | |
| 16 | | Fair Value Measurements | |
| 17 | | Proprietary Capital | |
| 18 | | Other Income (Expense), Net | |
| 19 | | Supplemental Cash Flow Information | |
| 20 | | Benefit Plans | |
| 21 | | Commitments and Contingencies | |
| 22 | | Related Parties | |
| 23 | | Unaudited Quarterly Financial Information | |
1. Summary of Significant Accounting Policies
General
The Tennessee Valley Authority ("TVA") is a corporate agency and instrumentality of the United States ("U.S.") that was created in 1933 by federal legislation enacted by the United States ("U.S.") Congress in response to a requestproposal by President Franklin D. Roosevelt. TVA was created to, among other things, improve navigation on the Tennessee River, reduce the damage from destructive flood waters within the Tennessee River system and downstream on the lower Ohio and Mississippi Rivers, further the economic development of TVA's service area in the southeastern United States,U.S., and sell the electricity generated at the facilities TVA operates.
Today, TVA operates the nation's largest public power system and supplies power in most of Tennessee, northern Alabama, northeastern Mississippi, and southwestern Kentucky and in portions of northern Georgia, western North Carolina, and southwestern Virginia to a population of over nineapproximately 10 million people.
TVA also manages the Tennessee River, its tributaries, and certain shorelines to provide, among other things, year-round navigation, flood damage reduction, and affordable and reliable electricity. Consistent with these primary purposes, TVA also manages the river system and public lands to provide recreational opportunities, adequate water supply, improved water quality, cultural and natural resource protection, and economic development.
The power program has historically been separate and distinct from the stewardship programs. It is required to be self-supporting from power revenues and proceeds from power financings, such as proceeds from the issuance of bonds, notes, or other evidences of indebtedness ("Bonds"(collectively, "Bonds"). Although TVA does not currently receive congressional appropriations, it is required to make annual payments to the United States Department of the Treasury ("U.S. Treasury") as a return on the government's appropriation investment in TVA's power facilities (the "Power Program Appropriation Investment"). In the 1998 Energy and Water Development Appropriations Act, Congress directed TVA to fund essential stewardship activities related to its management of the Tennessee River system and nonpower or stewardship properties with power revenues in the event that there were insufficient appropriations or other available funds to pay for such activities in any fiscal year. Congress has not
provided any appropriations to TVA to fund such activities since 1999. Consequently, during 2000, TVA began paying for
essential stewardship activities primarily with power revenues, with the remainder funded with user fees and other forms of revenues derived in connection with those activities. The activities related to stewardship properties do not meet the criteria of an operating segment under accounting principles generally accepted in the United States of America ("GAAP"). Accordingly, these assets and properties are included as part of the power program, TVA's only operating segment.
Power rates are established by the TVA Board of Directors (the "TVA Board") as authorized by the Tennessee Valley Authority Act of 1933, as amended 16 U.S.C. §§ 831-831ee (the “TVA Act”"TVA Act"). The TVA Act requires TVA to charge rates for power that will produce gross revenues sufficient to provide funds for operation, maintenance, and administration of its power system; payments to states and counties in lieu of taxes ("tax equivalents"); debt service on outstanding indebtedness; payments to the U.S. Treasury in repayment of and as a return on the Power Program Appropriation Investment; and such additional margin as the TVA Board may consider desirable for investment in power system assets, retirement of outstanding Bonds in advance of maturity, additional reduction of the Power Program Appropriation Investment, and other purposes connected with TVA's power business. TVA fulfilled its requirement to repay $1.0 billion of the Power Program Appropriation Investment with the 2014 payment; therefore, this item is no longer a component of rate setting. In setting TVA's rates, the TVA Board is charged by the TVA Act to have due regard for the primary objectives of the TVA Act, including the objective that power shall be sold at rates as low as are feasible. Rates set by the TVA Board are not subject to review or approval by any state or other federal regulatory body.
Fiscal Year
TVA's fiscal year ends September 30. Years (2017, 2016,(2021, 2020, etc.) refer to TVA's fiscal years unless they are preceded by “CY,”"CY," in which case the references are to calendar years.
Cost-Based Regulation
Since the TVA Board is authorized by the TVA Act to set rates for power sold to its customers, TVA is self-regulated. Additionally, TVA's regulated rates are designed to recover its costs. Based on current projections, TVA believes that rates, set at levels that will recover TVA's costs, can be charged and collected. As a result of these factors, TVA records certain assets and liabilities that result from the regulated ratemaking process that would not be recorded under GAAP for non-regulated entities. Regulatory assets generally represent incurred costs that have been deferred because such costs are probable of future recovery in customer rates. Regulatory liabilities generally represent obligations to make refunds to customers for previous collections for costs that are not likely to be incurred or deferral of gains that will be credited to customers in future periods. TVA assesses whether the regulatory assets are probable of future recovery by considering factors such as applicable regulatory changes, potential legislation, and changes in technology. Based on these assessments, TVA believes the existing regulatory assets are probable of recovery. This determination reflects the current regulatory and political environment and is subject to change in the future. If future recovery of regulatory assets ceases to be probable, or any of the other factors described above cease to be applicable, TVA wouldis no longer be considered to be a regulated entity, andthen costs would be required to write off these costs.be written off. All regulatory asset write offs would be required to be recognized in earnings in the period in which future recovery ceases to be probable.
Basis of Presentation
The accompanying consolidated financial statements, which have been prepared in accordance with GAAP, include the accounts of TVA wholly-owned direct subsidiaries, and variable interest entities ("VIE"VIEs") of which TVA is the primary beneficiary. See Note 9 and Note 1011 — Variable Interest Entities. Intercompany balances and transactions have been eliminated in consolidation.
Use of Estimates
The preparation of financial statements requires TVA to estimate the effects of various matters that are inherently uncertain as of the date of the consolidated financial statements. Although the consolidated financial statements are prepared in conformity with GAAP, TVA is required to make estimates and assumptions that affect the reported amounts of assets and liabilities, the disclosure of contingent assets and liabilities, and the amounts of revenues and expenses, including impacts from the Coronavirus Disease 2019 ("COVID-19") pandemic, reported during the reporting period. Each of these estimates varies in regard to the level of judgment involved and its potential impact on TVA's financial results. Estimates are considered critical either when a different estimate could have reasonably been used, or where changes in the estimate are reasonably likely to occur from period to period, and such use or change would materially impact TVA's financial condition, results of operations, or cash flows.
Reclassifications
Amounts previously presented in Cash flows from operating activities as Insurance recoveries of $7 million and $63 million for the years ended September 30, 2016 and 2015, respectively, are currently reported in Other, net.
Cash and0Cash, Cash Equivalents, and Restricted Cash
Cash includes cash on hand, and non-interest bearing cash, and deposit accounts. All highly liquid investments with original maturities of three months or less are considered cash equivalents. Cash and cash equivalents that are restricted, as to withdrawal or use under the terms of certain contractual agreements, are recorded in Other long-term assets on the Consolidated Balance Sheets. Restricted cash and cash equivalents include cash held in trusts that are currently restricted for TVA economic development loans and for certain TVA environmental programs in accordance with agreements related to
compliance with certain environmental regulations. See Note 23 — Commitments and Contingencies — Legal Proceedings — Environmental Agreements.
The following table provides a reconciliation of cash, cash equivalents, and restricted cash reported on the Consolidated Balance Sheets and Consolidated Statements of Cash Flows:
| | | | | | | | | | | |
Cash, Cash Equivalents, and Restricted Cash
At September 30 |
| | 2021 | | 2020 |
| Cash and cash equivalents | $ | 499 | | | $ | 500 | |
| Restricted cash and cash equivalents included in Other long-term assets | 19 | | | 21 | |
| Total cash, cash equivalents, and restricted cash | $ | 518 | | | $ | 521 | |
Due to higher volatility in the financial markets associated with the COVID-19 pandemic, TVA increased its balance of Cash and cash equivalents beginning in March 2020. TVA may hold higher cash balances from time to time in response to potential market volatility or other business conditions.
Allowance for Uncollectible Accounts
As described in Note 2 — Impact of New Accounting Standards and Interpretations, TVA adopted Financial Instruments - Credit Losses on October 1, 2020, using a modified retrospective method through a cumulative-effect adjustment to retained earnings. The standard, Current Expected Credit Losses ("CECL"), requires TVA to recognize an allowance that reflects the current estimate for uncollectible accounts reflects TVA'scredit losses expected to be incurred over the life of the financial assets based on historical experience, current conditions, and reasonable and supportable forecasts that affect the collectibility of the reported amounts. TVA has reviewed the current portfolio of financial receivables and developed a methodology to reasonably measure the estimate of probablecredit losses inherent in itsfor each major financial receivable type. The appropriateness of the allowance is evaluated at the end of each reporting period. TVA continues to monitor the impact of the COVID-19 pandemic on accounts and loans receivable balances. TVA determinesbalances to evaluate the allowance based on known accounts,for uncollectible accounts.
To determine the allowance for trade receivables, TVA considers historical experience and other currently available information, including events such as customer bankruptcy and/or a customer failing to fulfill payment arrangements after 90 days. It also reflectsby the due date. TVA's corporate credit department'sdepartment also performs an assessment of the financial condition of customers and the credit quality of the receivables. In addition, TVA reviews other reasonable and supportable forecasts to determine if the allowance for uncollectible amounts should be further adjusted in accordance with the accounting guidance for CECL.
To determine the allowance for loans receivables, TVA aggregates loans into the appropriate pools based on the existence of similar risk characteristics such as collateral types and internal assessed credit risks. In situations where a loan exhibits unique risk characteristics and is no longer expected to experience similar risks to the rest of its pool, the loan will be evaluated separately. TVA derives an annual loss rate based on historical loss and then adjusts the rate to reflect TVA's consideration of available information on current conditions and reasonable and supportable future forecasts. This information may include economic and business conditions, default trends, and other internal and external factors. For periods beyond the reasonable and supportable forecast period, TVA uses the current calculated long-term average historical loss rate for the remaining life of the loan portfolio.
The allowance for uncollectible accounts was less than $1 million and $1 million at both September 30, 2017,2021 and 2016,2020, for trade accounts receivable. Additionally, loans receivable of $118$99 million and $141$105 million at September 30, 2017,2021 and 2016,2020, respectively, are included in Accounts receivable, net and Other long-term assets, for the current and long-term portions, respectively, andrespectively. Loans receivables are reported net of allowances for uncollectible accounts of $4 million and less than $1 million and $8 million at September 30, 2017,2021 and 2016, 2020, respectively. The increase in allowances for uncollectible accounts is due to the adoption of CECL. See Note 2 — Impact of New Accounting Standards and Interpretations.
Revenues
RevenuesTVA recognizes revenue from contracts with customers to depict the transfer of goods or services to customers in an amount to which the entity expects to be entitled in exchange for those goods or services. For the generation and transmission of electricity, this is generally at the time the power is delivered to a metered customer delivery point for the customer's consumption or distribution. As a result, revenues from power sales are recorded as electricity is delivered to customers. In addition to power sales invoiced and recorded during the month, TVA accrues estimated unbilled revenues for power sales provided to sixfive customers whose billing date occurs prior to the end of the month. Exchange power sales are presented in the accompanying consolidated statementsConsolidated Statements of operationsOperations as a component of Salessales of electricity. Exchange power sales are sales of excess power after meeting TVA native load and directly served requirements. Native load refers to the customers on whose behalf a company, by statute, franchise, regulatory requirement, or contract, has undertaken an obligation to serve.
From time to time TVA transfers fiber optic capacity on TVA’s network to telecommunications service carriers and local power company customers of TVA ("LPCs"). These transactions are structured as indefeasible rights of use ("IRUs"), which are the exclusive right to use a specified amount of fiber optic capacity for a specified term. TVA accounts for the consideration received on transfers of fiber optic capacity for cash and on all of the other elements deliverable under an IRU as revenue ratably over the term of the agreement. TVA does not recognize revenue on any contemporaneous exchanges of its fiber optic capacity for an IRU of fiber optic capacity of the counterparty to the exchange.
TVA engages in a wide array ofother arrangements in addition to power sales. TVA recordsCertain other revenue when it is realized or realizable and earned when all of the following criteria are met: persuasive evidence of an arrangement exists; delivery has occurred or services have been rendered; the price or fee is fixed or determinable; and collectability is reasonably assured. Revenues from activities related to TVA’sTVA's overall mission areis recorded as other operating revenue versus thosein Other revenue. Revenues that are not related to the overall mission which are recorded in Other income (expense), net.
Pre-Commercial Plant Operations
demands of the electric system. TVA estimates revenue from such pre-commercial generation based on the guidance provided by Federal Energy Regulatory Commission ("FERC") regulations. Watts Bar Nuclear Plant ("Watts Bar") Unit 2 commenced pre-commercial plant operations on June 3, 2016, and commercial operations began on October 19, 2016. In addition, the Paradise Combined Cycle Plant commenced pre-commercial plant operations on October 10, 2016, and commercial operations began on April 7, 2017. The Allen Combined Cycle Plant began pre-commercial operations on September 9, 2017. Estimated revenue of $22 million and $18 million related to these projects was capitalized to offset project costs for the years ended September 30, 2017, and 2016, respectively. TVA also capitalized related fuel costs for these three construction projects of approximately $14 million and $6 million during the years ended September 30, 2017, and 2016, respectively.
Inventories
CertainFuel, Materials, and Supplies. Materials and supplies inventories are valued using an average unit cost method. A new average cost is computed after each inventory purchase transaction, and inventory issuances are priced at the latest moving weighted average unit cost. Coal, fuel oil, and natural gas inventories are valued using an average cost method. A new weighted average cost is computed monthly, and monthly issues are priced accordingly.
Allowance for Inventory Obsolescence. TVA reviews material and supplies inventories by category and usage on a periodic basis. Each category is assigned a probability of becoming obsolete based on the type of material and historical usage data. Based on the estimated value of the inventory, TVA adjusts its allowance for inventory obsolescence.
Emission Allowances. TVA has emission allowances for sulfur dioxide ("SO2")and nitrogen oxides ("NOx") which are accounted for as inventory. The average cost of allowances used each month is charged to operating expense based on tons of SO2 and NOx emitted during the respective compliance periods. Allowances granted to TVA by the Environmental Protection Agency ("EPA") are recorded at zero cost.
Renewable Energy Credits. TVA accounts for Renewable Energy CreditsCertificates ("RECs") using the specific identification cost method. RECs that are acquired through power purchases are recorded as inventory and charged to purchased power expense when the RECs are subsequently used or sold. TVA assigns a value to the RECs at the inception of the power purchase arrangement using a relative fair value approach. RECs created through TVA-owned asset generation are recorded at zero cost.
Emission Allowances. TVA has emission allowances for sulfur dioxide ("SO2")and nitrogen oxide ("NOx") which are accounted for as inventory. The cost of specific allowances used each month is charged to operating expense based on tons of SO2 and NOx emitted during the respective compliance periods. Allowances granted to TVA by the Environmental Protection Agency ("EPA") are recorded at zero cost.
Allowance for Inventory Obsolescence. TVA reviews materials and supplies inventories by category and usage on a periodic basis. Each category is assigned a probability of becoming obsolete based on the type of material and historical usage data. TVA has a fleet-wide inventory management policy for each generation type. Based on the estimated value of the inventory, TVA adjusts its allowance for inventory obsolescence.
Property, Plant, and Equipment, and Depreciation
Property, Plant, and Equipment. Additions to plant are recorded at cost, which includes direct and indirect costs and may include allowance for funds used during construction ("AFUDC"), if eligible.costs. The cost of current repairs and minor replacements is charged to operating expense. Nuclear fuel, inventories, which areis included in Property, plant, and equipment, areis valued using the average cost method for raw materials and the specific identification method for nuclear fuel in a reactor. Amortization of nuclear fuel in a reactor is calculated on a units-of-production basis and is included in fuel expense. When property, plant, and equipment is retired, accumulated depreciation is charged for the original cost of the assets. Gains or losses are only recognized upon the sale of land or an entire operating unit.
Depreciation. TVA accounts for depreciation of its properties using the composite depreciation convention of accounting. Accordingly,Under the original cost of property retired is charged to accumulated depreciation.composite method, assets with similar economic characteristics are grouped and depreciated as one asset. Depreciation is generally computed on a straight-line basis over the estimated service lives of the various classes of assets. The estimation of asset useful lives requires management judgment, supported by external depreciation studies of historical asset retirement experience. Depreciation rates are determined based on an external depreciation study.studies that are updated approximately every five years. During the first quarter of 2022, TVA concluded and implemented a new depreciation study effective October 1, 2016, resultingrelated to its completed plant. The new study includes a decline in the service life estimates of TVA’s coal-fired plants based on current planning assumptions to potentially retire the remainder of the coal-fired fleet by 2035. Implementation of the study is expected to result in an increase to depreciation and amortization expense of approximately $224$369 million less depreciation expense in 2017 comparedduring 2022. This estimate represents the impact of implementing the new study only and does not include any potential impact of other possible changes, including additions to the prior year. This study will be updated at least every five years. or retirements of net completed plant, that may occur during 2022.
Depreciation expense for the years ended September 30, 2017, 2016,2021, 2020, and 20152019 was $1.3 billion, $1.4 billion, $1.6 billion, and $1.7$1.8 billion, respectively. Depreciation expense expressed as a percentage of the average annual depreciable completed plant was 2.492.28 percent for 2017, 2.972021, 2.74 percent for 2016,2020, and 3.713.09 percent for 2015.2019. Average depreciation rates by asset class are as follows:
| | | | | | | | | | | | | | | | | |
Property, Plant, and Equipment Depreciation Rates
At September 30
(percent) |
| 2021 | | 2020 | | 2019 |
| Asset Class | | | | | |
| Nuclear | 2.38 | | | 2.38 | | | 2.38 | |
Coal-fired(1) | 1.95 | | | 3.62 | | | 4.96 | |
| Hydroelectric | 1.60 | | | 1.60 | | | 1.61 | |
| Gas and oil-fired | 2.98 | | | 3.04 | | | 3.00 | |
| Transmission | 1.34 | | | 1.34 | | | 1.34 | |
| Other | 7.12 | | | 7.26 | | | 7.16 | |
|
| | | | | | | | |
Property, Plant, and Equipment Depreciation Rates At September 30 (percent) |
| | 2017 | | 2016 | | 2015 |
| Asset Class | | | | | |
| Nuclear | 2.66 |
| | 2.37 |
| | 2.81 |
|
| Coal-fired | 2.33 |
| | 3.50 |
| | 5.50 |
|
| Hydroelectric | 1.58 |
| | 1.29 |
| | 1.30 |
|
| Gas and oil-fired | 3.27 |
| | 3.09 |
| | 3.18 |
|
| Transmission | 1.34 |
| | 2.80 |
| | 2.78 |
|
| Other | 6.12 |
| | 8.97 |
| | 8.65 |
|
Nuclear. In September 2015,(1) The rates include the Nuclear Regulatory Commission ("NRC") approved renewed licenses for Sequoyah Nuclear Plant ("Sequoyah") Units 1 and 2, which allow both unitsacceleration of depreciation related to operate for an additional 20 years, and TVA adjusted prospectively the Sequoyah depreciation rate.
Coal-Fired. In April 2011, TVA entered into two substantively similar agreements, one with the EPA and the other with Alabama, Kentucky, North Carolina, Tennessee, and three environmental advocacy groups (collectively, the "Environmental Agreements”). See Note 21 — Legal Proceedings — Environmental Agreements. Under the Environmental Agreements, TVA committed to retire 18 coal-fired units on a phased schedule, among other things.
Since its November 2013 meeting, the TVA Board has approved the retirement ofretiring certain coal-fired units. Units subsequently retired include: Widows Creek Fossil Plant ("Widows Creek") Units 7 and 8 on September 30, 2015; Colbert Fossil Plant ("Colbert") Units 1-5 on April 16, 2016; and Paradise Fossil Plant ("Paradise") Units 1 and 2 on April 15, 2017.
Other pending TVA Board actions at September 30, 2017 are the retirement
Depreciation rates are adjusted to reflect current assumptions so that the units will be fully depreciated by the applicable idle dates.Coal-Fired. As a result of TVA's decision to idle or retire certain units since the previous depreciation study, TVA recognized $104$136 million, $139$387 million, and $383$566 million in accelerated depreciation expense related to the units during the years ended September 30, 2017, 2016,2021, 2020, and 2015,2019, respectively. Accelerated depreciation is based on the rate in effectremaining useful life of the asset at the time the decision is made to idle or retire a unit.
Capital Lease Agreements.Reacquired Rights. Property, plant, and equipment also includes assets recorded under capital lease agreements. These primarily consistintangible reacquired rights, net of a natural gas lateral pipeline, power production facilities, water treatment assets, and landamortization, of $161$184 million and $163$192 million atas of September 30, 20172021 and 2016, respectively. Amortization expense related to capital leases is included in Depreciation and amortization in TVA’s statement of operations, excluding leases and other financing
obligations where regulatory accounting is applied. See Note 7 — Other Non-Current Regulatory Assets — Deferred Capital Leases and Other Financing Obligations.
On April 4, 2016, TVA entered into a letter agreement with Choctaw Generation Limited Partnership, LLLP (“CGLP”) for the reimbursement of certain capital costs and ongoing operating and maintenance costs related to assets recently constructed at the Red Hills lignite-fired power facility. These capital additions were required to comply with new Mercury and Air Toxics Standards. As a result of the new agreement, TVA was required to reassess a related 1997 power purchase and operating agreement (“PPOA”) with CGLP that was previously classified as an executory contract. This reassessment determined that the PPOA contained a capital lease and resulted in TVA recording a capital lease asset at the estimated fair value of $76 million with an offsetting capital lease liability included in Accounts payable and accrued liabilities and Other long-term liabilities.
Allowance for Funds Used During Construction. TVA may capitalize interest on eligible projects as allowance for funds used during construction ("AFUDC"), based on the average interest rate of TVA’s outstanding debt. The allowance is applicable to construction in progress related to eligible projects with (1) an expected total project cost of $1.0 billion or more, and (2) an estimated construction period of at least three years in duration. No AFUDC was capitalized for the year ended September 30, 2017, subsequent to the completion of Watts Bar Unit 2, which went into service in October 2016. TVA capitalized $235 million and $214 million of AFUDC for the years ended September 30, 2016, and 2015,2020, respectively, related to the Watts Bar Unit 2 project.purchase of residual interests from lease/leaseback agreements of certain combustion turbine units ("CTs"). Reacquired rights are amortized over the estimated useful life of the underlying CTs. Amortization expense was $8 million for all years 2021, 2020, and 2019.
Software Costs. TVA capitalizes certain costs incurred in connection with developing or obtaining internal-use software. Capitalized software costs are included in Property, plant, and equipment on the consolidated balance sheetsConsolidated Balance Sheets and are generally amortized over seven years. At September 30, 2017,2021 and 2016,2020, unamortized computer software costs totaled $42$27 million and $27$54 million, respectively. Amortization expense related to capitalized computer software costs was $26$38 million, $43$42 million, and $38 million for 2017, 2016,2021, 2020, and 2015,2019, respectively. Software costs that do not meet capitalization criteria are expensed as incurred.
Impairment of Assets. TVA evaluates long-lived assets for impairment when events or changes in circumstances indicate that the carrying value of such assets may not be recoverable. For long-lived assets, TVA bases its evaluation on impairment indicators such as the nature of the assets, the future economic benefit of the assets, any historical or future profitability measurements, its regulatory approval and ability to set rates at levels that allow for recoverability of the assets, and other external market conditions or factors that may be present. If such impairment indicators are present or other factors exist that indicate that the carrying amount of an asset may not be recoverable, TVA determines whether an impairment has occurred based on an estimate of undiscounted cash flows attributable to the asset as compared with the carrying value of the asset. If an impairment has occurred, the amount of the impairment recognized is measured as the excess of the asset’sasset's carrying value over its fair value. Additionally, TVA regularly evaluates construction projects. If the project is canceled or deemed to have no future economic benefit, the project is written off as an asset impairment or, upon TVA Board approval, reclassified as a regulatory asset. See Note 7 — Plant Closures.
Leases
TVA recognizes a lease asset and lease liability for leases with terms of greater than 12 months. Lease assets represent TVA's right to use an underlying asset for the lease term, and lease liabilities represent TVA's obligation to make lease payments arising from the lease, both of which are recognized based on the present value of the future minimum lease payments over the lease term at the commencement date. TVA has certain lease agreements that include variable lease payments that are based on energy production levels. These variable lease payments are not included in the measurement of the lease assets or lease liabilities but are recognized in the period in which the expenses are incurred.
While not specifically structured as leases, certain power purchase agreements ("PPAs") are deemed to contain a lease of the underlying generating units when the terms convey the right to control the use of the assets. Amounts recorded for these leases are generally based on the amount of the scheduled capacity payments due over the remaining terms of the PPAs, the terms of which vary. The total lease obligations included in Accounts payable and accrued liabilities and lease liabilities related to these agreements were $464 million and $143 million for finance and operating leases, respectively, at September 30, 2021.
TVA has agreements with lease and non-lease components and has elected to account for the components separately. Consideration is allocated to lease and non-lease components generally based on relative standalone selling prices.
TVA has lease agreements which include options for renewal and early termination. The intent to renew a lease varies depending on the lease type and asset. Renewal options that are reasonably certain to be exercised are included in the lease measurements. The decision to terminate a lease early is dependent on various economic factors. No termination options have been included in TVA's lease measurements.
Leases with an initial term of 12 months or less, which do not include an option to extend the initial term of the lease to greater than 12 months that TVA is reasonably certain to exercise, are not recorded on the Consolidated Balance Sheets at September 30, 2021.
Operating leases are recognized on a straight-line basis over the term of the lease agreement. Rent expense associated with short-term leases and variable leases is recorded in Operating and maintenance expense, Fuel expense, or Purchased power expense on the Consolidated Statements of Operations. Expenses associated with finance leases result in the separate presentation of interest expense on the lease liability and amortization expense of the related lease asset on the Consolidated Statements of Operations.
Decommissioning Costs
TVA recognizes legal obligations associated with the future retirement of certain tangible long-lived assets. These obligations relate to fossil fuel-fired generating plants, nuclear generating plants, hydroelectric generating plants/dams, transmission structures, and other property-related assets. These other property-related assets include, but are not limited to, easements and coal rights. Activities involved with retiring these assets could include decontamination and demolition of structures, removal and disposal of wastes, and site restoration. Revisions to the estimates of asset retirement obligations ("AROs") are made whenever factors indicate that the timing or amounts of estimated cash flows have changed materially. Any accretion or depreciation expense related to these liabilities and assets is charged to a regulatory asset. See Note 710 — Regulatory Assets and Liabilities — Nuclear Decommissioning Costs andNon-Nuclear Decommissioning CostsandNote 12.13 — Asset Retirement Obligations.
Blended Low-Enriched Uranium ProgramDown-blend Offering for Tritium
Under the blended low-enriched uranium ("BLEU") program, TVA, the U.S. Department of Energy ("DOE"), and certain nuclear fuel contractors have entered into agreements, providingreferred to as the Down-blend Offering for Tritium ("DBOT"), that provide for the DOE'sproduction, processing, and storage of low-enriched uranium that is to be made using surplus ofDOE highly enriched uranium to be blended withand other uranium. Low-enriched uranium down to a level that allows the blended uranium tocan be fabricated into fuel for use in a nuclear power plant. Production of the low-enriched uranium began in 2019 and is contracted to continue through October 2027. Beginning October 2027, contract activity will consist of storage and flag management. Flag management ensures that the uranium is of U.S. origin, free from foreign obligations, and unencumbered by policy restrictions, so that it can be used in nuclear power plants.connection with the production of tritium. Under the terms of anthe interagency agreement between TVA and the DOE in exchangeand TVA, the DOE will reimburse TVA for supplyinga portion of the costs of converting the highly enriched uranium materials to the appropriate third-party fuel processors for processing into usable BLEU fuel forlow-enriched uranium. Since 2019, TVA the DOE participates to a degreehas received $137 million in the savings generated by TVA’s use of this blended nuclear fuel. TVA accrues an obligation with each BLEU reload batch related to the portion of the ultimate future payments estimated to be attributable to the BLEU fuel currently in use. TVA estimated DOE's portion of the cost savingsreimbursements from the program to be $165 million. The last of the BLEU fuel was loaded in 2017.DOE. At September 30, 2017,2021, TVA had paid out approximately $164recorded $11 million for in Accounts receivable, net related to this program, and the obligation recorded was $1 million.agreement.
Investment Funds
Investment funds consist primarily of trust funds designated to fund decommissioning requirements (see Note 2123 — Commitments and Contingencies — Decommissioning Costs), the Supplemental Executive Retirement Plan ("SERP") (see Note 2022 — Benefit Plans— Overview of Plans and Benefits — Supplemental Executive Retirement Plan), and the Deferred Compensation Plan ("DCP"). The Nuclear Decommissioning Trust ("NDT") holds funds primarily for the ultimate decommissioning of TVA's nuclear power plants. The Asset Retirement Trust ("ART") holds funds primarily for the costs related to the future closure and retirement of TVA's other long-lived assets. The NDT, ART, SERP, and DCP funds are invested in portfolios of securities generally designed to achieve a return in line with overall equity and debt market performance. The NDT, ART, SERP, and DCP funds are all classified as trading.
Energy Prepayment Obligations
In 2004, TVA and its largest customer, Memphis Light, Gas and Water Division ("MLGW"), entered into an energy prepayment agreement under which MLGW prepaid TVA $1.5 billion for the future costs of electricity to be delivered by TVA to MLGW over a period of 180 months. TVA accounted for the prepayment as unearned revenue and is reporting the obligation to deliver power under this arrangement as Energy prepayment obligations and Current portion of energy prepayment obligations on the September 30, 2017 and 2016 Consolidated Balance Sheets. TVA expects to recognize approximately $100 million of noncash revenue in each year of the arrangement as electricity is delivered to MLGW based on the ratio of units of kilowatt hours delivered to total units of kilowatt hours under contract. At September 30, 2017, approximately $1.4 billion had been recognized as noncash revenue on a cumulative basis during the life of the agreement, $100 million of which was recognized as noncash revenue during each of 2017, 2016, and 2015.
Discounts to account for the time value of money, which are recorded as a reduction to electricity sales, amounted to $46 million for each of the years ended September 30, 2017, 2016, and 2015.
Insurance
Although TVA uses private companies to administer its healthcare plans for eligible active and retired employees not covered by Medicare, TVA does not purchase health insurance. Third-party actuarial specialists assist TVA in determining certain liabilities for self-insured claims. TVA recovers the costs of claims through power rates and through adjustments to the participants’participants' contributions to their benefit plans. These liabilities are included in Other liabilities on the balance sheets.Consolidated Balance Sheets.
TVA sponsors an Owner Controlled Insurance Program which provides workers' compensation and liability insurance for a select group of contractors performing maintenance, modifications, outage, and new construction activities at TVA facilities.
The Federal Employees' Compensation Act ("FECA") governs liability to employees for service-connected injuries. TVA purchases excess workers' compensation insurance above a self-insured retention.
In addition to excess workers' compensation insurance, TVA purchases the following types of insurance:
Nuclear liability insurance; nuclear property decommissioning, and decontamination insurance; and nuclear accidental outage insurance. See Note 21 — Contingencies — Nuclear Insurance.
Excess liability insurance for aviation, auto, marine,nuclear assets and generaloperations. See Note 23 — Commitments and Contingencies — Nuclear Insurance. TVA also purchases liability exposures.
Propertyinsurance and property insurance for certain conventional (non-nuclear) assets.assets, and other insurance policies when commercially feasible.
The insurance policies are subject to the terms and conditions of the specific policy, including deductibles or self-insured retentions. To the extent insurance would not provide either a partial or total recovery of the costs associated with a loss, TVA would have to recover any such costs through other means, including through power rates.
Research and Development Costs
Research and development costs are expensed when incurred. TVA’sTVA's research programs include those related to power delivery technologies, emerging technologies (clean energy, renewables, distributed resources, and energy efficiency), technologies related to generation (fossil fuel, nuclear, and hydroelectric), and environmental technologies.
Tax Equivalents
TVA is not subject to federal income taxation. In addition, neither TVA nor its property, franchises, or income is subject to taxation by states or their subdivisions. The TVA Act requires TVA to make payments to states and counties in which TVA
conducts its power operations and in which TVA has acquired power properties previously subject to state and local taxation. The total amount of these payments is five percent of gross revenues from sales of power during the preceding year, excluding sales or deliveries to other federal agencies and off-system sales with other utilities, with a provision for minimum payments under certain circumstances. TVA calculates tax equivalent expense by subtracting the prior year fuel cost-related tax equivalent regulatory asset or liability from the payments made to the states and counties during the current year and adding back the current year fuel cost-related tax equivalent regulatory asset or liability. Fuel cost-related tax equivalent expense is recognized in the same accounting period in which the fuel cost-related revenue is recognized.
Maintenance Costs
TVA records maintenance costs and repairs related to its property, plant, and equipment inon the consolidated statementsConsolidated Statements of operationsOperations as they are incurred except for the recording of certain regulatory assets for retirement and removal costs.
2. Impact of New Accounting Standards and Interpretations
The following are accounting standard updates issued by the Financial Accounting Standards Board ("FASB") that TVA adopted during 2017.
|
| | | | | | | | | | | | | |
ConsolidationFinancial Instruments - Credit Losses |
| Description | This guidance amendseliminates the consolidation analysisprobable initial recognition threshold in current GAAP and, instead, requires an allowance to be recorded for VIEs as well as voting interest entities. The standard reduces the number of consolidation models through the elimination of the indefinite deferralall expected credit losses for certain entitiesfinancial assets that was previously allowedare not measured at fair value. The allowance for credit losses is based on historical information, current conditions, and places more emphasis on risk of loss when determining a controlling financial interest. This guidance allowsreasonable and supportable forecasts. The new standard also makes revisions to the other than temporary impairment model for either a full retrospective or a modified retrospective application.
available-for-sale debt securities. |
| Effective Date for TVA | October 1, 20162020 |
| Effect on the Financial Statements or Other Significant Matters | TVA adopted this standard on a modified retrospective method through a cumulative-effect adjustment to retained earnings on October 1, 2020. TVA recorded an initial transition adjustment of $4 million to retained earnings. The adoption of thethis standard did not materially impact TVA's financial condition, results of operations, or cash flows. |
|
Business CombinationsFair Value Measurement Disclosure |
| Description | This guidance clarifieschanges certain disclosure requirements for fair value measurements. It removes certain disclosure requirements, such as the definitionamount of a business by providing guidelines to determine when a set of assets and activities constitutes a business. The standard says that when substantially allreasons for transfers between Level 1 and Level 2 of the fair value hierarchy; the policy for timing of the gross assets acquired (or disposed of) is concentratedtransfers between levels; and the valuation processes for Level 3 fair value measurements. Some disclosure requirements are added, such as the change in a single identifiable asset or a groupunrealized gains and losses included in other comprehensive income for recurring Level 3 fair value measurements and the range and weighted average of similar identifiable assets, the set of assets and activities is not a business. If this characteristic is not met, the amendments in this update (1) require thatsignificant unobservable inputs used to be considered a business, a set must include, at a minimum, an input and a substantive process that together significantly contribute to the ability to create output and (2) remove the evaluation of whether a market participant could replace missing elements. The amendments provide a framework to assist entities in evaluating whether both an input and a substantive process are present. The framework includes two sets of criteria to consider that depend on whether a set of assets and activities has outputs. Although outputs are not required for a set of assets and activities to be a business, outputs generally are a key element of a business; therefore, the FASB has developed more stringent criteria for sets of assets and activities without outputs. This standard also updates the definition of the term output so that the term is consistent with how outputs are described in the new Revenue Recognition guidance. develop Level 3 fair value measurements. |
| Effective Date for TVA | JulyOctober 1, 20172020 |
| Effect on the Financial Statements or Other Significant Matters | As a resultAdoption of adopting thethis standard TVA accounted for purchase of the equity interests in two special purpose entities in 2017 as asset acquisitions, and not business combinations, because the entities did not meet the definitionhave a material impact on TVA's financial condition, results of a business under the new accounting standard.operations, or cash flows. |
|
Going Concern |
Description | This amendment requires an entity’s management to assess an entity’s ability to continue as a going concern within one year after the date that the financial statements are issued or available to be issued. When management identifies conditions or events that raise substantial doubt about the entity’s ability to continue as a going concern, management should consider whether its plans that are intended to mitigate those relevant conditions or events will alleviate the substantial doubt. If the substantial doubt can be alleviated as a result of consideration of management’s plan, the entity should disclose certain information. If substantial doubt is not alleviated after consideration of management’s plan, an entity should indicate in the footnotes that there is substantial doubt about the entity’s ability to continue as a going concern within one year after the date that the final statements are issued or available to be issued. This assessment must be evaluated every reporting period including interim periods. |
Effective Date for TVA | September 30, 2017 |
Effect on the Financial Statements or Other Significant Matters | As a result of adopting the standard, management has assessed TVA’s ability to continue as a going concern within one year after the financial statements are available to be issued, and there were no conditions or events that raise substantial doubt about TVA’s ability to continue as a going concern. No additional disclosures are necessary. |
The following accounting standards have been issued but as of September 30, 2017,2021, were not effective and had not been adopted by TVA.TVA:
|
| | | | |
Derivatives and Hedging - Contingent Put and Call Options in Debt InstrumentsReference Rate Reform |
| Description | This guidance clarifiesprovides temporary optional expedients and exceptions to the requirements for assessing whether contingent call or put options that can accelerateguidance in GAAP on contract modifications and hedge accounting to ease the payment of principal on debt instruments are clearly and closelyfinancial reporting burdens related to their debt hosts. An entity performing the assessment underexpected market transition from the amendments in this update is requiredLondon Interbank Offered Rate ("LIBOR") and other interbank offered rates to assessalternative reference rates, such as the embedded call or put options solely in accordance with a four-step decision sequence. When the standard becomes effective, it will include interim periods within that fiscal year, and will be required to be applied using a modified retrospective transition.Secured Overnight Financing Rates. |
| Effective Date for TVA | The new standard wasis effective for TVA’s interimadoption at any time between March 12, 2020, and annual reporting periods beginning October 1, 2017. While early adoption was permitted, TVA did not adopt the standard early.December 31, 2022. |
| Effect on the Financial Statements or Other Significant Matters | TVA has two issues of Putable Automatic Rate Reset Securities (“PARRS”) outstanding. After a fixed-rate period of five years, the coupon rate on the PARRS may automatically be reset downward under certain market conditions on an annual basis. The coupon rate reset on the PARRS is based on a calculation. If the coupon rate is goingcontinues to be reset, holders may request, for a limited period of time, redemption of the PARRS at par value, with repayment of principal on the reset date. This put option is otherwise not available. For both series of PARRS, the coupon rate will reset downward on the reset date if the rate calculated is below the then-current coupon rate on the PARRS. TVA plans to assess whether these contingent put options that can accelerate the payment of principal on the PARRS continue to be clearly and closely related to their debt hosts under the new guidance. TVA plans to assess the put options in accordance with the four-step decision sequence clarified in the guidance. While a preliminary assessment indicates that TVA does not believe the new guidance will impact its current assessment, TVA will continue to evaluate the potential impact of the new guidance on its consolidated balance sheet. |
|
Inventory Valuation |
Description | This guidance changes the model used for the subsequent measurement of inventory from the previous lower of cost or market model to the lower of cost or net realizable value. The guidance applies only to inventory valued using methods other than last-in, first out or the retail inventory method (for example, first-in, first-out or average cost). This amendment is intended to simplify the subsequent measurement of inventory. When the standard becomes effective, it includes interim periods within the fiscal year that begins on that date and is required to be applied prospectively. |
Effective Date for TVA | The new standard was effective for TVA’s interim and annual reporting periods beginning October 1, 2017. While early adoption was permitted, TVA did not adopt the standard early. |
Effect on the Financial Statements or Other Significant Matters | The adoption ofreview this standard will not have a material impact on TVA’s financial condition, results of operations, and cash flows.
|
|
Defined Benefit Costs |
Description | This guidance changes how information about defined benefit costs for pension plans and other post-retirement benefit plans is presented in employer financial statements. The guidance requires employers that present a measure of operating income in their statement of income to include only the service cost component of net periodic pension cost and net periodic postretirement benefit cost in operating expenses (together with other employee compensation costs). The other components of net benefit cost, including amortization of prior service cost/credit and settlement and curtailment effects, are to be included in nonoperating expenses. Additionally, the guidance stipulates that only the service cost component of net benefit cost is eligible for capitalization in assets. |
Effective Date for TVA | The new standard is effective for TVA’s interim and annual reporting periods beginning October 1, 2018. While early adoption is permitted, TVA does not currently plan to adopt the standard early. |
Effect on the Financial Statements or Other Significant Matters | TVA has evaluatedevaluate the impact of adopting this guidance, and if the guidance had been effective for TVA for the years ended September 30, 2017, 2016, and 2015, TVA would have reclassified $758 million, $179 million, and $185 million, respectively,using an alternative reference rate instead of net periodic benefit costs from Operating and maintenance expense to Other income (expense), net on the consolidated statements of operations. |
|
Financial Instruments |
Description | This guidance applies to the recognition and measurement of financial assets and liabilities. The standard requires all equity investments to be measured at fair value with changesLIBOR in the fair value recognized through net income (other than those accounted for under the equity method of accounting or those that result in consolidation of the investee). The standard also amends presentation requirements related to certain changes in the fair value of a liability and eliminates certain disclosure requirements of significant assumptions for financial instruments measured at amortized cost on the balance sheet. Public entities must apply the amendments by means of a cumulative-effect adjustment to the balance sheet as of the beginning of the fiscal year of adoption. |
Effective Date for TVA | The new standard is effective for TVA’s interim and annual reporting periods beginning October 1, 2018. Early adoption is not permitted unless specific early adoption guidance is applied. TVA does not currently plan to adopt the standard early. |
Effect on the Financial Statements or Other Significant Matters | TVA currently measures all of its equity investments (other than those that result in the consolidation of the investee) at fair value, with changes in the fair value recognized through net income. The TVA Board has authorized the use of regulatory accounting for changes in fair value of certain equity investments, and as a result, those changes in fair value are deferred as regulatory assets or liabilities. TVA currently discloses significant assumptions around its estimates of fair value for financial instruments carried at amortized cost on its consolidated balance sheet. TVA is currently evaluating the potential impact of the changes in this new guidance on its consolidated financial statements and related disclosures. |
| |
| |
|
| |
| |
Revenue Recognition |
Description | In 2014, the FASB issued new guidance related to revenue from contracts with customers. The guidance, including subsequent amendments, replaces the existing accounting standard and industry specific guidance for revenue recognition with a five-step model for recognizing and measuring revenue from contracts with customers. The underlying principle of the guidance is to recognize revenue to depict the transfer of goods or services to customers at the amount expected to be collected. The objective of the new standard is to provide a single, comprehensive revenue recognition model for all contracts with customers to improve comparability within industries and across industries. The new standard also requires enhanced disclosures regarding the nature, amount, timing, and uncertainty of revenue and the related cash flows arising from contracts with customers. At adoption, companies must also select a transition method to be applied either retrospectively to each prior reporting period presented or retrospectively with a cumulative effect adjustment to retained earnings at the date of initial adoption. |
Effective Date for TVA | The new standard is effective for TVA’s interim and annual reporting periods beginning October 1, 2018. While early adoption is permitted, TVA will not adopt the standard early. |
Effect on the Financial Statements or Other Significant Matters | While TVA expects most of its revenue to be included in the scope of the new guidance, it has not completed its evaluation of all such arrangements. TVA’s current efforts in evaluating the impact of the standard are focused on scoping of revenue streams and evaluating contracts with LPCs, which represent the majority of TVA's revenues. TVA is also conducting ongoing evaluations of how the new guidance impacts other transactions, including sales to directly served industrial customers, sales to federal agencies, purchase power agreements, fuel cost adjustments, and other revenue streams. In addition, the power and utilities industry is currently addressing certain industry-specific issues which have not yet been finalized. As the ultimate impact of the new standard has not yet been determined, TVA has not yet elected its transition method. |
|
Statement of Cash Flows |
Description | This guidance requires that a statement of cash flows explain the change during the period in the total of cash, cash equivalents, and amounts generally described as restricted cash or restricted cash equivalents. Therefore, amounts generally described as restricted cash and restricted cash equivalents should be included with cash and cash equivalents when reconciling the beginning-of-period and end-of-period total amounts shown on the statement of cash flows. This guidance does not provide a definition of restricted cash or restricted cash equivalents. |
Effective Date for TVA | The new standard is effective for TVA’s interim and annual reporting periods beginning October 1, 2018. While early adoption is permitted, TVA does not currently plan to adopt the standard early. |
Effect on the Financial Statements or Other Significant Matters | interest rate swap contracts. TVA does not expect the adoption of this standard to have a material impact on TVA’sits financial condition, results of operations, or cash flows. |
|
Derivatives and Hedging - Improvements to Accounting for Hedging Activities |
Description | |
| |
| |
|
|
| |
| |
| |
|
|
| |
| |
| |
| | | | | |
| Lessor-Certain Leases with Variable Lease Payments |
| Description | This guidance better alignsamends the lessor lease classification for leases that have variable lease payments that are not based on an entity's risk management activitiesindex or rate. If the lease meets the criteria for classification as either (1) a sale-type or (2) direct finance lease, and financial reporting for hedging relationships through changes to bothapplication of the designation and measurementlease guidance would result in recognition of a day-one selling loss, then the lease should be classified as an operating lease.
There are two transition methods provided by the guidance for qualifying hedging relationships andentities that have adopted the presentation of hedge results. To meetstandard: •Retrospective application to leases that objective,commenced or were modified after the amendments expand and refine hedge accounting for both nonfinancial and financial risk components and align the recognition and presentationbeginning of the effects ofperiod in which the hedging instrument andstandard was adopted, or •Prospective application to leases that commence or are modified subsequent to the hedged itemdate that amendments in the financial statements.guidance are first applied. |
| Effective Date for TVA | TheThis new standard is effective for TVA’sTVA's interim and annual reporting periods beginning October 1, 2019. While early2022. Early adoption is permitted, and TVA does not currently plan to adopt theadopted this standard early.on October 1, 2021, on a prospective basis. |
| Effect on the Financial Statements or Other Significant Matters | TVA does not expect the adoptionAdoption of this standard todid not have a material impact on TVA’sTVA's financial condition, results of operations, or cash flows. |
|
Lease Accounting |
Description | This guidance changes the provisions of recognition in both the lessee and lessor accounting models. The standard requires entities that lease assets — referred to as "lessees" — to recognize on the balance sheet the assets and liabilities for the rights and obligations created by leases with terms of more than 12 months. The recognition, measurement, and presentation of expenses and cash flows arising from a lease by a lessee primarily will depend on its classification as a finance (similar to current capital leases) or operating lease. However, unlike current lease accounting rules — which require only capital leases to be recognized on the balance sheet — the new standard will require both types of leases to be recognized on the balance sheet. Operating leases will result in straight-line expense, while finance leases will result in recognition of interest on the lease liability separate from amortization expense. The accounting for the owner of the assets leased by the lessee — also known as lessor accounting — will remain largely unchanged from current lease accounting rules. The standard allows for certain practical expedients to be elected related to lease term determination, separation of lease and non-lease elements, reassessment of existing leases, and short-term leases. When the standard becomes effective, it will include interim periods within that fiscal year and will be required to be applied using a modified retrospective transition. |
Effective Date for TVA | The new standard is effective for TVA’s interim and annual reporting periods beginning October 1, 2019. While early adoption is permitted, TVA does not currently plan to adopt the standard early. |
Effect on the Financial Statements or Other Significant Matters | TVA is currently evaluating the potential impact of these changes on its consolidated financial statements and related disclosures. TVA expects the new standard to impact financial position as adoption is expected to increase the amount of assets and liabilities recognized on TVA’s consolidated balance sheets. TVA expects the new standard to have no material impact on results of operations or cash flows. TVA plans to elect certain of the practical expedients included in the new standard. TVA is also continuing to monitor unresolved industry implementation issues, including items related to renewables and purchased power agreements, easements, and rights-of-way, and will analyze the related impacts to lease accounting. |
|
|
| |
| |
| |
|
|
| |
| |
| |
3. Accounts Receivable, Net
Accounts receivable primarily consist of amounts due from customers for power sales. The table below summarizes the types and amounts of TVA’sTVA's accounts receivable:
| | | | | | | | | | | |
Accounts Receivable, Net At September 30 |
| | 2021 | | 2020 |
| Power receivables | $ | 1,480 | | | $ | 1,401 | |
| Other receivables | 86 | | | 128 | |
| | | |
Accounts receivable, net(1) | $ | 1,566 | | | $ | 1,529 | |
Note
(1) Allowance for uncollectible accounts was less than $1 million at September 30, 2021 and 2020, and therefore is not represented in the table above. The allowance at September 30, 2021 includes the impact from adopting CECL on October 1, 2020.
In response to the COVID-19 pandemic, the TVA Board approved the Public Power Support and Stabilization program in 2020. Through this program, TVA offered up to $1.0 billion of credit support to local power company customers ("LPCs") that demonstrated the need for temporary financial relief, through the deferral of a portion of LPCs' wholesale power payments owed to TVA. The program ended on December 31, 2020, with a total of $1 million of credit support approved under the program. The $1 million was fully repaid in the second quarter of 2021.
|
| | | | | | | |
Accounts Receivable, Net At September 30 |
| | 2017 | | 2016 |
| Power receivables | $ | 1,441 |
| | $ | 1,637 |
|
| Other receivables | 129 |
| | 111 |
|
| Allowance for uncollectible accounts | (1 | ) | | (1 | ) |
| Accounts receivable, net | $ | 1,569 |
| | $ | 1,747 |
|
4. Inventories, Net
The table below summarizes the types and amounts of TVA’sTVA's inventories:
| | | | | | | | | | | |
Inventories, Net At September 30 |
| | 2021 | | 2020 |
| Materials and supplies inventory | $ | 775 | | | $ | 770 | |
| Fuel inventory | 198 | | | 253 | |
| Renewable energy certificates inventory, net | 12 | | | 15 | |
| Allowance for inventory obsolescence | (35) | | | (35) | |
| Inventories, net | $ | 950 | | | $ | 1,003 | |
5. Other Current Assets
|
| | | | | | | |
Inventories, Net At September 30 |
| | 2017 | | 2016 |
| Materials and supplies inventory | $ | 734 |
| | $ | 673 |
|
| Fuel inventory | 355 |
| | 345 |
|
| RECs/emission allowance inventory, net | 15 |
| | 14 |
|
| Allowance for inventory obsolescence | (39 | ) | | (39 | ) |
| Inventories, net | $ | 1,065 |
| | $ | 993 |
|
Other current assets consisted of the following:
| | | | | | | | | | | |
Other Current Assets At September 30 |
| | 2021 | | 2020 |
| Commodity contract derivative assets | $ | 210 | | | $ | 26 | |
| Other | 77 | | | 58 | |
| Other current assets | $ | 287 | | | $ | 84 | |
5.Commodity Contract Derivative Assets. TVA enters into certain derivative contracts for natural gas that require physical delivery of the contracted quantity of the commodity. SeeNote 16 — Risk Management Activities and Derivative Transactions — Derivatives Not Receiving Hedge Accounting Treatment — Commodity Derivatives for adiscussion of TVA's commodity contract derivatives.
6. Net Completed Plant
Net completed plant consisted of the following:
| | | | | | | | | | | | | | | | | | | | | | | | | | | | | | | | | | | |
Net Completed Plant At September 30 |
| | 2021 | | 2020 |
| | Cost | | Accumulated Depreciation | |
Net | | Cost | | Accumulated Depreciation | | Net |
Coal-fired(1)(2) | $ | 19,319 | | | $ | 14,357 | | | $ | 4,962 | | | $ | 18,613 | | | $ | 13,944 | | | $ | 4,669 | |
| Gas and oil-fired | 6,076 | | | 1,824 | | | 4,252 | | | 6,010 | | | 1,696 | | | 4,314 | |
| Nuclear | 26,024 | | | 12,632 | | | 13,392 | | | 25,741 | | | 12,141 | | | 13,600 | |
| Transmission | 8,597 | | | 3,215 | | | 5,382 | | | 8,283 | | | 3,140 | | | 5,143 | |
| Hydroelectric | 3,525 | | | 1,135 | | | 2,390 | | | 3,410 | | | 1,090 | | | 2,320 | |
| Other electrical plant | 1,940 | | | 1,101 | | | 839 | | | 1,981 | | | 1,146 | | | 835 | |
| Intangible software | 3 | | | 2 | | | 1 | | | 3 | | | 2 | | | 1 | |
| Multipurpose dams | 900 | | | 388 | | | 512 | | | 900 | | | 381 | | | 519 | |
| Other stewardship | 27 | | | 9 | | | 18 | | | 29 | | | 10 | | | 19 | |
| | | | | | | | | | | |
| Total | $ | 66,411 | | | $ | 34,663 | | | $ | 31,748 | | | $ | 64,970 | | | $ | 33,550 | | | $ | 31,420 | |
Notes
(1) TVA recognized accelerated depreciation as a result of the decision to idle or retire certain units. See Note 7 — Plant Closures.
(2) In 2020, TVA recorded approximately $1.1 billion in upward revisions to asset retirement costs for coal-fired assets. See Note 13 —Asset Retirement Obligations.
|
| | | | | | | | | | | | | | | | | | | | | | | |
Net Completed Plant At September 30 |
| | 2017 | | 2016 |
| | Cost | | Accumulated Depreciation | | Net | | Cost | | Accumulated Depreciation | | Net |
| Coal-fired | $ | 15,937 |
| | $ | 10,791 |
| | $ | 5,146 |
| | $ | 15,587 |
| | $ | 10,473 |
| | $ | 5,114 |
|
| Gas and oil-fired | 4,995 |
| | 1,359 |
| | 3,636 |
| | 3,918 |
| | 1,267 |
| | 2,651 |
|
| Nuclear | 25,010 |
| | 10,834 |
| | 14,176 |
| | 19,280 |
| | 10,422 |
| | 8,858 |
|
| Transmission | 7,264 |
| | 3,039 |
| | 4,225 |
| | 7,061 |
| | 2,975 |
| | 4,086 |
|
| Hydroelectric | 3,015 |
| | 967 |
| | 2,048 |
| | 2,891 |
| | 932 |
| | 1,959 |
|
| Other electrical plant | 1,756 |
| | 1,008 |
| | 748 |
| | 1,857 |
| | 1,126 |
| | 731 |
|
| | 57,977 |
| | 27,998 |
| | 29,979 |
| | 50,594 |
| | 27,195 |
| | 23,399 |
|
| | | | | | | | | | | | |
| Multipurpose dams | 928 |
| | 387 |
| | 541 |
| | 928 |
| | 379 |
| | 549 |
|
| Other stewardship | 42 |
| | 19 |
| | 23 |
| | 42 |
| | 18 |
| | 24 |
|
| | 970 |
| | 406 |
| | 564 |
| | 970 |
| | 397 |
| | 573 |
|
| Total | $ | 58,947 |
| | $ | 28,404 |
| | $ | 30,543 |
| | $ | 51,564 |
| | $ | 27,592 |
| | $ | 23,972 |
|
7. Plant Closures
6.
Background
TVA must continuously evaluate all generating assets to ensure an optimal energy portfolio that provides safe, clean, and reliable power while maintaining flexibility and fiscal responsibility to the people of the Tennessee Valley. Based on results of assessments presented to the TVA Board in 2019, the retirement of Paradise Fossil Plant ("Paradise") Unit 3 by December 2020 and Bull Run Fossil Plant ("Bull Run") by December 2023 was approved. Subsequent to the TVA Board approval, TVA determined that Paradise would not be restarted after January 2020 due to the plant's material condition. Paradise Unit 3 was taken offline on February 1, 2020, effectively retiring the plant. In addition, TVA is evaluating the impact of retiring the balance of the coal-fired fleet by 2035, and that evaluation includes environmental review, public input, and TVA Board approval.
Financial Impact
As a result of TVA's decision to accelerate the retirements of Paradise and Bull Run, certain construction projects at these locations were identified as probable of abandonment or were no longer expected to be in service for greater than one year prior to the plants' retirement dates. The write-off of these projects resulted in $4 million, $11 million, and $151 million of Operating and maintenance expense during the years ended September 30, 2021, 2020, and 2019, respectively. TVA also recognized losses of $2 million and $19 million in Operating and maintenance expense related to additional materials and supplies inventory reserves and write-offs identified at Paradise during the years ended September 30, 2020 and 2019, respectively. Losses recognized during the year ended September 30, 2021, were less than $1 million.
TVA's policy is to adjust depreciation rates to reflect the most current assumptions, ensuring units will be fully depreciated by the applicable retirement dates. As a result of TVA's decision to accelerate the retirement of Paradise and Bull Run, TVA has recognized a cumulative $1.1 billion of accelerated depreciation. Of this amount, $136 million, $387 million, and $566 million were recognized for the years ended September 30, 2021, 2020, and 2019, respectively.
8. Leases
The following table provides information regarding the presentation of leases on the Consolidated Balance Sheets:
| | | | | | | | | | | | | | |
Amounts Recognized on TVA's Consolidated Balance Sheets
At September 30 |
| | 2021 | | 2020 |
| Assets | | | | |
| Operating | Operating lease assets, net of amortization | $ | 165 | | | $ | 232 | |
| Finance | Finance leases | 692 | | | 516 | |
| Total lease assets | | $ | 857 | | | $ | 748 | |
| | | | |
| Liabilities | | | | |
| Current | | | | |
| Operating | Accounts payable and accrued liabilities | $ | 40 | | | $ | 63 | |
| Finance | Accounts payable and accrued liabilities | 60 | | | 41 | |
| Non-current | | | | |
| Operating | Other long-term liabilities | 122 | | | 171 | |
| Finance | Finance lease liabilities | 687 | | | 525 | |
| Total lease liabilities | | $ | 909 | | | $ | 800 | |
TVA's leases consist primarily of railcars, equipment, real estate/land, power generating facilities, and gas pipelines. TVA's leases have various terms and expiration dates remaining from less than one year to approximately 25 years. The components of lease costs were as follows:
| | | | | | | | | | | | | |
Lease Costs For the years ended September 30 (in millions) |
| 2021 | | 2020 | | |
Operating lease costs(1) | $ | 52 | | | $ | 84 | | | |
Variable lease costs(1) | 75 | | | 75 | | | |
Short-term lease costs(1) | 12 | | | 7 | | | |
| Finance lease costs | | | | | |
Amortization of lease assets(2) | 51 | | | 15 | | | |
Interest on lease liabilities(3)(4) | 39 | | | 33 | | | |
| Total finance lease costs | 90 | | | 48 | | | |
| Total lease costs | $ | 229 | | | $ | 214 | | | |
Notes
(1) Costs are included in Operating and maintenance expense, Fuel expense, Purchased power expense, and Tax equivalents expense on the Consolidated Statements of Operations. TVA's rental expense for operating leases was approximately $97 million for the year ended September 30, 2019.
(2) Expense is included in Depreciation and amortization expense on the Consolidated Statements of Operations.
(3) Expense is included in Interest expense on the Consolidated Statements of Operations.
(4) Certain finance leases receive regulatory accounting treatment and are reclassified to Fuel expense and Purchased power expense.
TVA's variable lease costs are primarily related to renewable energy purchase agreements that require TVA to purchase all output from the underlying facility. Payments under those agreements are solely based on the actual output over the lease term. Certain TVA lease agreements contain renewal options. Those renewal options that are reasonably certain to be exercised are included in the lease measurements.
The following table contains additional information with respect to cash and non-cash activities related to leases:
| | | | | | | | | | | |
Amounts Recognized on TVA's Consolidated Statements of Cash Flows For the years ended September 30 (in millions) |
| 2021 | | 2020 |
| Operating cash flows for operating leases | $ | 53 | | | $ | 85 | |
| Operating cash flows for finance leases | 39 | | | 33 | |
| Financing cash flows for finance leases | 52 | | | 15 | |
| | | |
| Lease assets obtained in exchange for lease obligations (non-cash) | | | |
Operating leases(1) | $ | (22) | | | $ | 110 | |
| Finance leases | 233 | | | 394 | |
Note
(1) Amount for 2021 represents a non-cash reduction due to a lease that was amended during the fiscal year resulting in derecognition of the operating lease asset and obligation upon remeasurement. Amount for 2020 excludes operating lease assets recorded as a result of the adoption of the new lease standard.
TVA has certain finance leases under PPAs under which the present value of the minimum lease payments exceeds the fair value of the related lease asset at the date of measurement. This resulted in an interest rate that was higher than TVA's incremental borrowing rate. The weighted average remaining lease term in years and the weighted average discount rate for TVA's operating and financing leases were as follows:
| | | | | | | | | | | |
Weighted Averages At September 30 |
| 2021 | | 2020 |
| Weighted average remaining lease terms | | | |
| Operating leases | 5 years | | 5 years |
| Finance leases | 12 years | | 12 years |
| | | |
Weighted average discount rate(1) | | | |
| Operating leases | 1.5% | | 1.6% |
| Finance leases | 17.7% | | 21.8% |
Note
(1) The discount rate is calculated using the rate implicit in a lease if it is readily determinable. If the rate used by the lessor is not readily determinable, TVA uses its incremental borrowing rate as permitted by accounting guidance. The incremental borrowing rate is influenced by TVA's credit rating and lease term and as such may differ for individual leases, embedded leases, or portfolios of leased assets.
The following table presents maturities of lease liabilities and a reconciliation of the undiscounted cash flows to lease liabilities at September 30, 2021:
| | | | | |
Future Minimum Lease Payments Minimum Payments Due at September 30, 2021 |
| Operating leases | |
| 2022 | $ | 42 | |
| 2023 | 40 | |
| 2024 | 37 | |
| 2025 | 34 | |
| 2026 | 10 | |
| Thereafter | 5 | |
| Minimum annual payments | 168 | |
| Less: present value discount | (6) | |
| Operating present value of net minimum lease payments | $ | 162 | |
| |
| Finance leases | |
| 2022 | $ | 115 | |
| 2023 | 112 | |
| 2024 | 107 | |
| 2025 | 106 | |
| 2026 | 105 | |
| Thereafter | 656 | |
| Minimum annual payments | 1,201 | |
| Less: amount representing interest | (454) | |
| Finance present value of net minimum lease payments | $ | 747 | |
TVA has entered into five PPAs with renewable resource providers for solar generation and rights to charge and discharge battery energy storage systems. The systems are considered a lease component in these agreements. These PPAs have terms of 20 years, and are expected to commence between October 2022 and December 2024. Payments made over the term of these PPAs are expected to total approximately $413 million.
9. Other Long-Term Assets
The table below summarizes the types and amounts of TVA’sTVA's other long-term assets:
| | | | | | | | | | | |
Other Long-Term Assets At September 30 |
| | 2021 | | 2020(1) |
| Loans and other long-term receivables, net | $ | 96 | | | $ | 100 | |
EnergyRight® receivables, net | 57 | | | 69 | |
| Prepaid long-term service agreements | 44 | | | 42 | |
| Commodity contract derivative assets | 40 | | | 23 | |
| | | |
| | | |
| Other | 83 | | | 91 | |
| Total other long-term assets | $ | 320 | | | $ | 325 | |
|
| | | | | | | |
Other Long-Term Assets At September 30 |
| | 2017 | | 2016 |
EnergyRight® receivables | $ | 100 |
| | $ | 112 |
|
| Loans and other long-term receivables, net | 115 |
| | 136 |
|
| Commodity contract derivative assets | 2 |
| | 3 |
|
| Prepaid capacity payments | 34 |
| | 42 |
|
| Other | 72 |
| | 93 |
|
| Total other long-term assets | $ | 323 |
| | $ | 386 |
|
(1) At September 30, 2020, $21 million previously classified as Restricted cash and cash equivalents (a component of Other long-term assets) and $11 million previously classified as Prepaid capacity payments (a component of Other long-term assets) have been reclassified to Other (a component of Other long-term assets) to conform with current year presentation.
Loans and Other Long-Term Receivables. TVA's loans and other long-term receivables primarily consist of economic development loans for qualifying organizations and a receivable for reimbursements to recover the cost of providing long-term, on-site storage for spent nuclear fuel. The current and long-term portions of the loans receivable are reported in Accounts receivable, net and Other long-term assets, respectively, on TVA's Consolidated Balance Sheets. At September 30, 2021 and 2020, the carrying amount of the loans receivable, net of discount, reported in Accounts receivable, net was approximately $3 million and $5 million, respectively.
EnergyRight® Receivables. In association with the EnergyRight® Solutions program, TVA's LPCs offer financing to end-use customers for the purchase of energy-efficient equipment. Depending on the nature of the energy-efficiency project, loans may have a maximum term of five years or ten10 years. TVA purchases the resulting loans receivable from its LPCs. The loans receivable are then transferred to a third-party bank with which TVA has agreed to repay in full any loanloans receivable that hashave been in default for 180 days or more or that TVA has determined isare uncollectible. Given this continuing involvement, TVA accounts for the transfer of the loans receivable as secured borrowings. The current and long-term portions of the loans receivable are reported in Accounts receivable, net and Other long-term assets, respectively, on TVA’s consolidated balance sheets. As ofTVA's Consolidated Balance Sheets. At September 30, 20172021 and September 30, 2016,2020, the carrying amount of the loans receivable, net of discount, reported in Accounts receivable, net was approximately $25$15 million and $29$18 million, respectively. See Note 1112 — Other Long-Term Liabilities for information regarding the associated financing obligation.
In response to the COVID-19 pandemic, customers experiencing financial hardship could request a deferral of EnergyRight® loan payments for a period of up to six months. The deferral option began in April 2020 and ended October 31, 2020. All EnergyRight® loans approved for the deferral period resumed payments in the second quarter of 2021. The deferred loans did not accrue interest during the deferral months and totaled less than $1 million.
Allowance for Loan Losses. As described in Note 2 — Impact of New Accounting Standards and Interpretations, TVA adopted CECL on October 1, 2020, to determine its allowance for loan loss. The allowance for loan loss is an estimate of expected credit losses, measured over the estimated life of the loan receivables, that considers reasonable and supportable forecasts of future economic conditions in addition to information about historical experience and current conditions. See Note 1 — Summary of Significant Accounting Policies — Allowance for Uncollectible Accounts.
The allowance components, which consist of a collective allowance and specific loans allowance, are based on the risk characteristics of TVA's loans. Loans that share similar risk characteristics are evaluated on a collective basis in measuring credit losses, while loans that do not share similar risk characteristics with other loans are evaluated on an individual basis.
| | | | | |
Allowance Components At September 30, 2021 (in millions) |
EnergyRight® loan reserve | $ | 1 | |
| Economic development loan collective reserve | 1 | |
| Economic development loan specific loan reserve | 2 | |
| |
| Total allowance for loan losses | $ | 4 | |
Prepaid Long-Term Service Agreements. TVA has entered into various long-term service agreements for major
maintenance activities at certain of its combined cycle plants. TVA uses the direct expense method of accounting for these
arrangements. TVA accrues for parts when it takes ownership and for contractor services when they are rendered. Under
7.certain of these agreements, payments made exceed the value of parts received and services rendered. The current and long-term portions of the resulting prepayments are reported in Other current assets and Other long-term assets, respectively, on
TVA's Consolidated Balance Sheets. At September 30, 2021 and 2020, prepayments of $12 million and $3 million,
respectively, were recorded in Other current assets.
Commodity Contract Derivative Assets. TVA enters into certain derivative contracts for natural gas that require physical delivery of the contracted quantity of the commodity. SeeNote 16 — Risk Management Activities and Derivative Transactions — Derivatives Not Receiving Hedge Accounting Treatment — Commodity Derivatives for adiscussion of TVA's commodity contract derivatives.
10. Regulatory Assets and Liabilities
Regulatory assets generally represent incurred costs that have been deferred because such costs are probable of future recovery in customer rates. Regulatory liabilities generally represent obligations to make refunds to customers for previous collections for costs that are not likely to be incurred or deferral of gains that will be credited to customers in future periods. Components of regulatory assets and regulatory liabilities are summarized in the table below.
| | | | | | | | | | | |
Regulatory Assets and Liabilities At September 30 |
| | 2021 | | 2020 |
| Current regulatory assets | | | |
| Unrealized losses on interest rate derivatives | $ | 114 | | | $ | 114 | |
| Unrealized losses on commodity derivatives | 3 | | | 4 | |
| | | |
| | | |
| | | |
| | | |
| Fuel cost adjustment receivable | 79 | | | 12 | |
| | | |
| Total current regulatory assets | 196 | | | 130 | |
| | | |
| Non-current regulatory assets | | | |
| Deferred pension costs and other post-retirement benefits costs | 3,668 | | | 5,193 | |
| Non-nuclear decommissioning costs | 2,653 | | | 2,512 | |
| Unrealized losses on interest rate derivatives | 1,122 | | | 1,506 | |
| Nuclear decommissioning costs | 363 | | | 896 | |
| | | |
| | | |
| | | |
| | | |
| | | |
| Other non-current regulatory assets | 150 | | | 138 | |
| Total non-current regulatory assets | 7,956 | | | 10,245 | |
| Total regulatory assets | $ | 8,152 | | | $ | 10,375 | |
| | | |
| Current regulatory liabilities | | | |
| Fuel cost adjustment tax equivalents | $ | 130 | | | $ | 115 | |
| | | |
| Unrealized gains on commodity derivatives | 210 | | | 26 | |
| Total current regulatory liabilities | 340 | | | 141 | |
| | | |
| Non-current regulatory liabilities | | | |
| | | |
| Unrealized gains on commodity derivatives | 40 | | | 23 | |
| Total non-current regulatory liabilities | 40 | | | 23 | |
| Total regulatory liabilities | $ | 380 | | | $ | 164 | |
|
| | | | | | | |
Regulatory Assets and Liabilities At September 30 |
| | 2017 | | 2016 |
| Current regulatory assets | | | |
| Deferred nuclear generating units | $ | 237 |
| | $ | 237 |
|
Unrealized losses on interest rate derivatives
| 93 |
| | — |
|
| Unrealized losses on commodity derivatives | 68 |
| | 122 |
|
| Environmental agreements | 2 |
| | 34 |
|
| Environmental cleanup costs – Kingston ash spill | 44 |
| | 42 |
|
| Fuel cost adjustment receivable | 1 |
| | 98 |
|
| Other current regulatory assets | 2 |
| | 3 |
|
| Total current regulatory assets | 447 |
| | 536 |
|
| | | | |
| Non-current regulatory assets | |
| | |
|
| Deferred pension costs and other post-retirement benefits costs | 4,009 |
| | 5,385 |
|
| Unrealized losses on interest rate derivatives | 982 |
| | 1,547 |
|
| Gallatin coal combustion residual facilities | 899 |
| | — |
|
| Nuclear decommissioning costs | 823 |
| | 938 |
|
| Environmental cleanup costs - Kingston ash spill | 263 |
| | 299 |
|
| Non-nuclear decommissioning costs | 703 |
| | 819 |
|
| Deferred nuclear generating units | 759 |
| | 850 |
|
| Environmental agreements | 13 |
| | 18 |
|
| Unrealized losses on commodity derivatives | 9 |
| | 56 |
|
| Other non-current regulatory assets | 238 |
| | 252 |
|
| Total non-current regulatory assets | 8,698 |
| | 10,164 |
|
| Total regulatory assets | $ | 9,145 |
| | $ | 10,700 |
|
| | | | |
| Current regulatory liabilities | |
| | |
|
| Fuel cost adjustment tax equivalents | $ | 153 |
| | $ | 148 |
|
| Fuel cost adjustment | 2 |
| | — |
|
| Unrealized gains on commodity derivatives | 8 |
| | 6 |
|
| Total current regulatory liabilities | 163 |
| | 154 |
|
| Non-current regulatory liabilities | |
| | |
|
| Deferred other post-retirement benefits cost | 23 |
| | — |
|
| Unrealized gains on commodity derivatives | 2 |
| | 3 |
|
| Total non-current regulatory liabilities | 25 |
| | 3 |
|
| Total regulatory liabilities | $ | 188 |
| | $ | 157 |
|
Deferred Pension Costsand Other Post-retirement Benefit Costs. TVA measures the funded status of its benefit obligations related to pension and other post-retirement benefit ("OPEB") costsbenefit plans at each year-end balance sheet date. TVA recognizes theThe funded status is measured as the difference between the fair value of plan assets and the plansbenefit obligations at the measurement date for each plan. The changes in funded status are actuarial gains and losses that are recognized on TVA's consolidated balance sheets which inConsolidated Balance Sheets by adjusting the recognized pension and OPEB liabilities, with the offset deferred as a regulatory asset or a regulatory liability. In an unregulated environment, these deferred costs would result in a corresponding offsetbe recognized as an increase or decrease to accumulated other comprehensive income (loss) ("AOCI"). “Incurred cost”
"Incurred cost" is a cost arising from cash paid out or an obligation to pay for an acquired asset or service, and a loss from any cause that has been sustained and for which payment has been or must be made. In the cases of pension and OPEB
costs, the unfunded obligation represents a projected liability to the employee for services rendered, and thus it meets the definition of an incurred cost. Therefore, amounts that otherwise would be charged to AOCI for these costs are recorded as a regulatory asset or liability since TVA has historically recovered pension and OPEB expense in rates. Through historical and current year expense included in ratemaking, the TVA Board has demonstrated the ability and intent to include pension and OPEB costs in allowable costs and in rates for ratemaking
purposes. As a result, it is probable that future revenue will result from inclusion of the pension and OPEB regulatory assets or regulatory liability in allowable costs for ratemaking purposes.
These The regulatory assetsasset and liability are classified as long-term, which is consistent with the pension and post-retirementOPEB liabilities, and are not amortized to the consolidated statements of operations over a specified recovery period. They are adjusted either upward or downward each year in conjunction with the adjustments to the unfunded pension liability and OPEB liability, as calculated by the actuaries. Ultimately thisthe regulatory asset and liability will be recognized in the consolidated statements of operations in the form of pension and OPEB expense as the actuarial liability isliabilities are eliminated in future periods. See Note 2022 — Benefit Plans — Obligations and Funded Status.
Additionally on October 1, 2014, TVA began recognizing pension costs as a regulatory assetsasset to the extent that the amount calculated under GAAP as pension expense differs from the amount TVA contributes to the pension plan.
Unrealized Losses on Interest Rate Derivatives. TVA uses regulatory accounting treatment to defer the unrealized gains and losses on certain interest rate derivative contracts. When amounts in these contracts are realized, the resulting gains or losses are included in the ratemaking formula. The unrealized losses on these interest rate derivatives are recorded on TVA’s consolidated balance sheets as current and non-current regulatory assets, and the related realized gains or losses, if any, are recorded in TVA’s consolidated statements of operations. Unrealized gains and losses on interest rate derivatives with a maturity of less than one year are included as a current regulatory asset or liability on TVA's consolidated balance sheets.
Gallatin Coal Combustion Residual Facilities. In August 2017, TVA began using regulatory accounting treatment to defer expected future costs related to Gallatin Fossil Plant ("Gallatin") coal combustion residuals ("CCR"). The TVA Board approved a plan to amortize these costs over the anticipated duration of the Gallatin CCR project (excluding post-closure care), beginning October 1, 2018 as amounts are included in rates or paid out. Accordingly, there are no amounts included as a current regulatory asset on TVA's consolidated balance sheets. See Note 8.
Unrealized Gains (Losses) on Commodity Derivatives. Unrealized gains (losses) on coal purchase contracts, included as part of unrealized gains (losses) on commodity derivatives, relate to the mark-to-market ("MtM") valuation of coal purchase contracts. These contracts qualify as derivative contracts but do not qualify for cash flow hedge accounting treatment. As a result of previous plan design changes, future contributions are expected to exceed the expense calculated under U.S. GAAP. Accordingly, TVA recognizes the changes in the market value of these derivative contracts as awill discontinue this regulatory liability or asset. This treatment reflects TVA’s ability and intent to recover the cost of these commodity contracts on a settlement basis for ratemaking purposes through the fuel cost adjustment. TVA recognizes the actual cost of fuel received under these contracts in fuel expense at the time the fuel is used to generate electricity. These contracts expire at various times through 2019. Unrealized gains and losses on contracts with a maturity of less than one year are included as a current regulatory asset or liability on TVA's consolidated balance sheets. See Note 15.
Deferred gains and losses relating to TVA’s Financial Trading Program ("FTP") represent net unrealized gains and losses on swaps, which are also included as part of unrealized gains (losses) on commodity derivatives. Although currently suspended, the FTP was used to reduce TVA’s economic risk exposure associated with purchases and sales of commodities used in electricity generation, purchases, and sales. TVA defersaccounting practice once all FTP MtM unrealized gains or losses as regulatory liabilities or assets, respectively, and records realized gains or losses in fuel and purchased power expense to match the delivery period of the underlying commodity product. Net unrealized losses at September 30, 2017, and September 30, 2016, were approximately $5 million and $39 million, respectively. This accounting treatment reflects TVA’s ability and intent to recover the cost of these commodity contracts in future periods through the fuel cost adjustment. The current regulatory asset/liability for net unrealized gains and losses, included as part of the commodity derivatives, representssuch deferred gains and losses from contracts with a maturity of less than one year.
Deferred Nuclear Generating Units. In November 2013, the TVA Board approved the treatment of all amounts currently included in Construction in progress related to Bellefonte Nuclear Plant ("Bellefonte") as a regulatory asset. Additionally, the TVA Board approved combining (1) the amounts related to Bellefonte previously included in Construction in progress, (2) the $619 million in Regulatory asset-Construction costs and (3) the remaining amounts included in Regulatory asset-Deferred nuclear generating units into a single regulatory asset titled Deferred nuclear generating units. Furthermore, in August 2016 the TVA Board approved the recognition of a regulatory asset for (1) all costs attributable to (a) the expected disposition of Bellefonte assets, including preparing or preserving the Bellefonte site, and (b) associated liabilities directly related to those assets, (2) any related future operating and project costs until the assets are sold, (3) the amount by which the book value of Bellefonte exceeds its fair market value less cost to sell, if any, (4) any subsequent gains and losses resulting from the disposition or impairment of Bellefonte, and (5) any costs attributable to the steam generators for Bellefonte until TVA disposes of the generators.
Deferred costs related to Bellefonte totaled $1.0 billion at September 30, 2017. Such amounts have been classified as a Regulatory assetrecovered, at which time it will recognize pension costs in the September 30, 2017 Consolidated Balance Sheet. The TVA Board approved the recovery of this asset in future rates at an amount of $237 million per year until fully recovered. The amount to be amortized over the next year is included as a current regulatory asset on TVA's consolidated balance sheets.accordance with U.S. GAAP.
On November 14, 2016, following a public auction, TVA entered into a contract to sell substantially all of the Bellefonte Nuclear Plant ("Bellefonte") site for $111 million. The net book value of the Bellefonte assets to be sold and the related asset retirement costs are collectively $121 million and are included in Regulatory asset — Deferred nuclear generating units on TVA’s
Consolidated Balance Sheet at September 30, 2017, as approved by the TVA Board. TVA received $22 million on November 14, 2016, which is recorded as a long-term liability on TVA’s Consolidated Balance Sheet at September 30, 2017, with the remaining $89 million due at closing. The buyer has up to two years from November 14, 2016, to close on the property. The closing is subject to, among other conditions, a determination by TVA's Chief Executive Officer that potential environmental impacts have been appropriately addressed or are acceptable. Proceeds received from the sale will be recorded as a reduction to the regulatory asset upon closing and will reduce amounts collected in future rates.
Environmental Agreements. In conjunction with the Environmental Agreements (see Note 21 — Legal Proceedings — Environmental Agreements), TVA recorded certain liabilities totaling $360 million ($290 million investment in energy efficiency projects, demand response projects, renewable energy projects, and other TVA projects; $60 million to be provided to Alabama, Kentucky, North Carolina, and Tennessee to fund environmental projects with preference for projects in the Tennessee River watershed; and $10 million in civil penalties). The TVA Board determined that these costs would be collected in customer rates in the future, and, accordingly, the amounts were deferred as a regulatory asset. Through the end of 2017, $275 million has been paid with respect to environmental projects, $60 million has been paid to Alabama, Kentucky, North Carolina, and Tennessee, and $10 million has been paid with respect to civil penalties. The remaining deferred amounts will be charged to expense and recovered in rates over future periods as payments are made through 2027.
Environmental Cleanup Costs – Kingston Ash Spill. In August 2009, TVA began using regulatory accounting treatment
to defer all actual costs incurred and expected future costs related to the Kingston Fossil Plant ("Kingston") ash spill. The TVA
Board approved a plan to amortize these costs over 15 years beginning October 1, 2009. Insurance proceeds are recorded as reductions to the regulatory asset and will reduce amounts collected in future rates. Amounts included as a current regulatory asset on TVA's consolidated balance sheets represent the amount to be amortized in the next 12 months.
Fuel Cost Adjustment Receivable. The fuel cost adjustment provides a mechanism to alter rates monthly to reflect changing fuel and purchased power costs, including realized gains and losses relating to transactions under TVA’s FTP. There is typically a lag between the occurrence of a change in fuel and purchased power costs and the reflection of the change in fuel rates. Balances in the fuel cost adjustment regulatory accounts represent over-collected or under-collected revenues that offset fuel and purchased power costs, and the fuel rate is designed to recover or refund the balance in less than one year.
Nuclear Decommissioning Costs. Nuclear decommissioning costs include: (1) certain deferred charges related to the future closure and decommissioning of TVA’s nuclear generating units under the NRC requirements, (2) recognition of changes in the liability, (3) recognition of changes in the value of TVA's NDT, and (4) certain other deferred charges under the accounting rules for AROs. These future costs will be funded through a combination of the NDT, future earnings on the NDT, and, if necessary, additional TVA cash contributions to the NDT and future earnings thereon. See Note 1— Investment Funds. There is not a specified recovery period; therefore, the regulatory asset is classified as long-term consistent with the NDT investments and ARO liability.
Non-Nuclear Decommissioning Costs. Non-nuclear decommissioning costs include: (1) certain deferred charges related to the future closure and decommissioning of TVA’sTVA's non-nuclear long-lived assets, (2) recognition of changes in the liability, (3) recognition of changes in the value of TVA’sTVA's ART, and (4) certain other deferred charges under the accounting rules for AROs. TVA has established the ART to more effectively segregate, manage, and invest funds to help meet future non-nuclear AROs. The funds from the ART may be used, among other things, to pay the costs related to the future closure and retirement of non-nuclear long-lived assets under various legal requirements. These future costs can be funded through a combination of investment funds already set aside in the ART, future earnings on those investment funds, and future cash contributions to the ART and future earnings thereon. For 2018,ART. In 2021, TVA will recoverrecovered in rates a portionan amount determined by the average life of its estimated current yeardebt financed for non-nuclear decommissioning costsexpenditures, assuming a 20-year debt service period, and contributions to the ART. Deferred charges will be recovered in rates based on an analysis of the expected expenditures, contributions, and investment earnings required to recover the decommissioning costs. Recovery of future decommissioning costs is dependent upon the future earnings of the ART, timing of decommissioning activities, and changes in decommissioning estimates. The regulatory asset is classified as long-term as amounts recovered are used to service debt or to contribute to the ART, which is restricted for future decommissioning costs.
Unrealized Losses on Interest Rate Derivatives. TVA uses regulatory accounting treatment to defer the unrealized gains and losses on certain interest rate derivative contracts. When amounts in these contracts are realized, the resulting gains or losses are included in the ratemaking formula. The unrealized losses on these interest rate derivatives are recorded on TVA's Consolidated Balance Sheets as current and non-current regulatory assets, and the related realized gains or losses, if any, are recorded on TVA's Consolidated Statements of Operations when the contracts settle. A portion of certain unrealized gains and losses will be amortized into earnings over the remaining lives of the contracts. Gains and losses on interest rate derivatives that are expected to be realized within the next year are included as a current regulatory asset or liability on TVA's Consolidated Balance Sheet.
Due to changing interest rates in the financial markets associated with the COVID-19 pandemic, TVA experienced unrealized losses related to its derivative instruments for the year ended September 30, 2020. TVA does not recognize unrealized gains and losses from the investment portfolios and derivative instruments within earnings but rather defers all such gains and losses within a regulatory liability or asset in accordance with its accounting policy. See Note 16 — Risk Management Activities and Derivative Transactions and Note 17 — Fair Value Measurements.
Nuclear Decommissioning Costs. Nuclear decommissioning costs include: (1) certain deferred charges related to the future closure and decommissioning of TVA's nuclear generating units under the Nuclear Regulatory Commission ("NRC") requirements, (2) recognition of changes in the liability, (3) recognition of changes in the value of TVA's NDT, and (4) certain other deferred charges under the accounting rules for AROs. These future costs can be funded through a combination of investment funds set aside in the NDT and ART and future earnings on those investment funds. For 2021, TVA recovered in rates a portion of the contributions to the ART that are expected to settle liabilities included in the nuclear ARO. Deferred charges will be recovered in rates based on the analysis of expected expenditures, contributions, and investment earnings required to recover the decommissioning costs. See Note 1 — Summary of Significant Accounting Policies — Investment Funds. Recovery of future decommissioning costs is dependent upon the future earnings of the NDT and ART, timing of decommissioning activities, and changes in decommissioning estimates. The regulatory asset is classified as long-term as amounts recovered are contributed to the NDT or the ART, which are restricted for future decommissioning costs.
Unrealized Gains (Losses) on Commodity Derivatives. TVA enters into certain derivative contracts for natural gas that require the physical delivery of the contracted quantity of the commodity. Unrealized gains (losses) on natural gas purchase contracts, included as part of unrealized gains (losses) on commodity derivatives, relate to the mark-to-market ("MtM") valuation of natural gas purchase contracts. During the fourth quarter of 2020, TVA discontinued derivative accounting for forward coal contracts because these contracts no longer meet the criteria of net settlement. As a result, the associated net regulatory assets
were derecognized. The natural gas purchase contracts qualify as derivative contracts but do not qualify for cash flow hedge accounting treatment. As a result, TVA recognizes the changes in the market value of these derivative contracts as a regulatory liability or asset. This treatment reflects TVA's ability and intent to recover the cost of these commodity contracts on a settlement basis for ratemaking purposes through the fuel cost adjustment. TVA recognizes the actual cost of fuel received under these contracts in fuel expense at the time the fuel is used to generate electricity. These contracts expire at various times through 2024. Unrealized gains and losses on contracts with a maturity of less than one year are included as a current regulatory asset or liability on TVA's Consolidated Balance Sheets. See Note 16 — Risk Management Activities and Derivative Transactions.
Fuel Cost Adjustment Receivable. The fuel cost adjustment provides a mechanism to alter rates monthly to reflect changing fuel and purchased power costs. There is typically a lag between the occurrence of a change in fuel and purchased power costs and the reflection of the change in fuel rates. Balances in the fuel cost adjustment regulatory accounts represent over-collected or under-collected revenues that offset fuel and purchased power costs, and the fuel rate is designed to recover or refund the balance in less than one year.
Other Non-Current Regulatory Assets. Other non-current regulatory assets consist of the following:
Deferred Capital LeasesLease Asset and Other Financing Obligations. Deferred capital lease and other financing asset costs represent the difference between the FERC's Uniform System of Accounts Prescribed for Public Utilities and Licensees Subject to the Provisions of the Federal Power Act ("Uniform System of Accounts") model balances and the balances under GAAP guidance. Under the Uniform System of Accounts,For certain leases, TVA recognizesrecognized the initial capital lease and other financing asset and liability at inception of the lease or other obligation; however,obligation. However, the annual expense under the Uniform System of Accountsrecognized in rates is equal to the annual lease or other financing obligation payments, which differs from GAAP treatment. This practice results in TVA’sTVA's asset balances being higher than they otherwise would have been under GAAP, with the difference representing a regulatory asset related to each capitalthe lease or other financing obligation. These costs will be amortized over the respective lease or other financing obligation terms as lease or other financing obligation payments are made. As the costs associated with this regulatory asset are not currently being considered in rates and the asset is expected to increase over the next year, the regulatory asset has been classified as long-term.
Debt Reacquisition Costs. Reacquisition expenses, call premiums, and other related costs, such as unamortized debt issue costs associated with redeemed Bond issues, are deferred and amortized (accreted) on a straight-line basis over the weighted average life of TVA’sTVA's debt portfolio.
Nuclear Training Costs. As a result of refurbishingadditional reacquisition expenses and restarting Browns Ferry Unit 1 in 2007 and the construction and startup of Watts Bar Unit 2, nuclear training costs associated with these units have been deferred as a regulatory asset and will be amortized over a cost recovery period equivalentchanges to the expected usefulweighted average life of the operating nuclear units.debt are uncertain, the regulatory asset is classified as long-term.
Retirement Removal Costs. Retirement removal costs, net of salvage, that are not legally required are recognized as a regulatory asset. Prior to 2017, net removal costs were amortized over a recovery period consistent with the depreciable lives of related assets under the most recent depreciation study. In 2017 and thereafter, netNet removal costs are amortized over a one-year period subsequent to completion of the removal activities. TVA treats this regulatory asset as long-term in its entirety primarily because it relates to assets that are long-term in nature.
Fuel Cost Adjustment Tax Equivalents. The fuel cost adjustment includes a provision related to the current funding of the future payments TVA will make. As TVA records the fuel cost adjustment, thefive percent of the calculation that relates to a future asset or liability for tax equivalent payments is recorded as a current regulatory asset or liability and paid or refunded in the following year.
Accelerated Amortization of Certain Regulatory Assets.In August 2017, the TVA Board authorized management to accelerate amortization of certain regulatory assets to the extent that actual net income in 2018 exceeds the budgeted amount, up to the aggregate amount of those certain regulatory assets. Assets included in this Board action include: deferred nuclear generating units, environmental cleanup costs related to the Kingston ash spill, and nuclear training costs related to the refurbishing and restarting of Browns Ferry Unit 1 and the construction and startup of Watts Bar Unit 2. The amount of additional amortization expense, if any, will be determined at the end of the year upon calculation of the excess (if any) and recorded as an adjustment as of the end of the year.
8. Gallatin Coal Combustion Residual Facilities
Background
TVA is planning to close wet CCR impoundments in accordance with federal and applicable state requirements when (1) coal-fired plants are converted to dry CCR processes and dry storage landfills become operational or (2) plant operations cease. Closure project schedules and costs are driven by the selected closure technology. The impoundments at Gallatin are pending additional studies to determine the final closure methodology and schedule. While plans are currently being formulated for the CCR closure methodology for Gallatin, TVA is involved in two lawsuits relating to alleged discharges of pollutants from the CCR facilities at Gallatin.
Lawsuit Brought by TDEC. In January 2015, the Tennessee Department of Environment and Conservation (“TDEC”) filed a lawsuit against TVA in the Chancery Court for Davidson County, Tennessee. The lawsuit alleges that pollutants have been discharged into waters of the State from CCR facilities at Gallatin in violation of the Tennessee Water Quality Control Act and the Tennessee Solid Waste Disposal Act. TDEC seeks injunctive relief, which could include an order requiring TVA to relocate the CCR facilities. TDEC also requested civil penalties of up to $17,000 per day for each day TVA is found to have violated the statutes. In February 2015, the court issued an order allowing Tennessee Scenic Rivers Association ("TSRA") and Tennessee Clean Water Network ("TCWN") to intervene in the case, and in January 2016, the court ordered TVA, among other things, to develop and submit to TDEC an environmental investigation plan and an environmental assessment report (the “January 2016 Order”). On August 4, 2017, TDEC filed an amended complaint adding new facts, claims, and causes of action. Consequently, on August 10, 2017, TVA removed the case from state court to federal court. The case is now in the United States District Court for the Middle District of Tennessee. The plaintiffs have filed motions requesting that the case be remanded to state court. Briefing on the motions is expected to be completed in November 2017.
Lawsuit Brought by TSRA and TCWN. In April 2015, TSRA and the TCWN filed a lawsuit against TVA in the United States District Court for the Middle District of Tennessee alleging that pollutants have been discharged into the Cumberland River from CCR facilities at Gallatin in violation of the Clean Water Act (“CWA”). The plaintiffs are seeking injunctive relief, including an order requiring TVA to relocate the CCR facilities, civil penalties of up to $37,500 per violation per day, and attorneys’ fees.
Trial in this action began on January 30, 2017, and concluded February 2, 2017. On August 4, 2017, the court issued a decision largely in favor of the plaintiffs (the “August 2017 Order”), finding that TVA had discharged pollutants into the Cumberland River in the past and that the discharge was likely ongoing. The court ordered TVA to excavate the CCR materials and move them to a lined facility. The court further required TVA to file within 30 days a draft timetable for excavating and removing the material. The court did not assess any monetary penalties against TVA for the CWA violations, citing the fact that its order to relocate the CCR material would cause TVA to incur significant costs.
On September 5, 2017, TVA submitted the required draft timetable, which assumes that a new lined facility can be permitted and built on the Gallatin site. The process of obtaining the necessary permits, constructing the facility, and moving all of the CCR materials is estimated to take approximately 24 years. Under current regulations, TVA would be required to monitor the existing facilities and the new facility for thirty years after closure. The estimated cost of the potential Gallatin CCR project is approximately $900 million. At September 30, 2017, related liabilities of $880 million and $19 million were recorded in Other long-term liabilities and Accounts payable and accrued liabilities, respectively. Prior to the court’s decision, TVA had anticipated
spending approximately $200 million to cap and close the existing CCR facilities. On October 2, 2017, TVA appealed the court’s decision to the United States Court of Appeals for the Sixth Circuit ("Sixth Circuit").
Financial Impact
In August 2017, TVA began using regulatory accounting treatment to defer expected future costs of compliance with orders or settlements related to lawsuits involving the Gallatin CCR facilities. The TVA Board approved a plan to amortize these costs over the anticipated duration of the Gallatin CCR project (excluding post-closure care), beginning October 1, 2018 as amounts are included in rates or paid out. TVA has estimated these costs to be approximately $900 million. These costs include, among other things, environmental studies concerning the existing and new facilities, the licensing activities for the new facility, design and construction of the new facility, relocating the material from the existing facilities to the new facility, closing the existing facilities, monitoring activities, and an amount of additional costs reflecting the expected impacts of inflation given the anticipated duration of the project. The costs do not include such items as any additional order or penalty arising from the TDEC lawsuit, which cannot be reasonably estimated at this time. TVA has not discounted this environmental obligation to a present value amount. TVA also committed in its draft timetable to complete capital projects related to construction of a permanent bottom ash dewatering facility and wastewater process ponds. These capital projects, which are not included in the estimate for cleanup costs above, are estimated to cost approximately $91 million and be completed over 3 years.
It is reasonably possible that TVA will not be able to obtain the necessary permits to build the facility on the Gallatin site and will be required to move the CCR materials offsite. Offsite relocation would materially increase both the cost and the time to comply with the August 2017 Order. TVA has estimated that if it is required to relocate the materials to a facility off the Gallatin site, TVA may incur up to $2.0 billion in expenses, plus an amount of additional costs reflecting the expected impacts of inflation given the extended duration of an offsite relocation project. The process of obtaining the necessary permits for offsite disposal, locating or constructing an offsite facility, and moving all of the CCR materials offsite is estimated to take approximately 40 years. TVA would also be required to monitor the existing facilities and the offsite facility for 30 years after the facilities are closed, based on current regulations.
The ultimate cost of the removal project will depend on actual timing and results of ongoing litigation, environmental studies, licensing, permitting, site subsurface conditions, contractor availability, weather, equipment, available material resources, and other contingency factors. These contingency factors could cause the project cost estimate to change materially in the near term. TVA updates its estimate for project costs as changes in these factors are determined to be probable of occurring.
9. Asset Acquisitions and Business Combinations
Asset Acquisition
On September 20, 2017, TVA acquired 100 percent of the equity interests in two SPEs designed to administer rent payments TVA makes under certain of its lease/leaseback arrangements. Each entity holds residual interests in four of TVA's peaking combustion turbine units ("CTs"). TVA acquired these entities in order to reacquire the residual interests in eight CTs it had previously granted in the lease/leaseback arrangements.
TVA acquired the entities for total cash consideration of $36 million. The fair value of the assets acquired consisted of $110 million of reacquired rights, and the fair value of liabilities assumed consisted of $74 million in notes payable. Reacquired rights are an intangible asset included in TVA's Completed plant balance and are amortized over the estimated useful life of the underlying CTs. Notes payable assumed in the transaction are included in TVA's Long-term debt and require TVA to make semi-annual payments through May 2020. TVA recognized less than $1 million of amortization expense, related to reacquired rights, within TVA’s consolidated statements of operations. Transaction costs were not material.
TVA determined that its lease/leaseback obligations were preexisting relationships that were effectively settled in the asset acquisitions. TVA settled the preexisting relationships separately from the asset acquisitions, resulting in a loss on extinguishment of the obligations of $3 million. The carrying value of lease/leaseback obligations effectively settled was $71 million, including accrued interest, and the reacquisition price was $74 million, paid in cash, at the acquisition date.
Business Combination
On July 20, 2016, TVA acquired 100 percent of the equity interests in Johnsonville Generation, LLC and Gallatin Generation, LLC, two special purpose entities ("SPEs") designed to administer rent payments TVA makes under certain of its lease/leaseback arrangements. The SPEs also each hold residual interests in four of TVA's peaking combustion turbine units. TVA acquired these businesses in order to exercise its rights of first refusal under certain of its lease/leaseback arrangements and to reacquire the residual interests in eight combustion turbine units it had previously granted in the lease/leaseback arrangements.
TVA acquired the entities for total cash consideration of $33 million. The fair value of the assets acquired consisted of $111 million of reacquired rights, and the fair value of liabilities assumed consisted of $78 million in notes payable. Reacquired
rights are an intangible asset included in TVA's completed plant balance and are amortized over the estimated useful life of the underlying combustion turbine units. Notes payable assumed in the transaction are included in TVA's long-term debt and are subject to semi-annual payments through March 2019. The entities acquired by TVA had $1 million of amortization expense, related to reacquired rights, and this expense is included within TVA’s consolidated statements of operations. Transaction costs were expensed as incurred and were not material.
TVA determined that its lease/leaseback obligations were preexisting relationships that were effectively settled in the business combinations. TVA settled the preexisting relationships separately from the business combinations, resulting in a loss on extinguishment of the obligations of $6 million. The carrying value of lease/leaseback obligations effectively settled was $72 million, including accrued interest, and the reacquisition price was $78 million, paid in cash, at the acquisition date.
10.11. Variable Interest Entities
A VIE is an entity that either (i) has insufficient equity to permit the entity to finance its activities without additional subordinated financial support or (ii) has equity investors who lack the characteristics of owning a controlling financial interest. When TVA determines that it has a variable interest in a VIE, a qualitative evaluation is performed to assess which interest holders have the power to direct the activities that most significantly impact the economic performance of the entity and have the obligation to absorb losses or receive benefits that could be significant to the entity. The evaluation considers the purpose and design of the business, the risks that the business was designed to create and pass along to other entities, the activities of the business that can be directed and which party can direct them, and the expected relative impact of those activities on the economic performance of the business through its life. TVA has the power to direct the activities of an entity when it has the ability to make key operating and financing decisions, including, but not limited to, capital investment and the issuance of debt. Based on the evaluation of these criteria, TVA has determined it is the primary beneficiary of certain entities and as such is required to account for the VIEs on a consolidated basis.
John Sevier VIEs
In 2012, TVA entered into a $1.0 billion construction management agreement and lease financing arrangement with John Sevier Combined Cycle Generation LLC ("JSCCG") for the completion and lease by TVA of the John Sevier Combined Cycle Facility ("John Sevier CCF"). JSCCG is a special single-purpose limited liability company formed in January 2012 to finance the John Sevier CCF through a $900 million secured note issuance (the “JSCCG notes”"JSCCG notes") and the issuance of $100 million of membership interests subject to mandatory redemption. The membership interests were purchased by John Sevier Holdco LLC ("Holdco"). Holdco is a special single-purpose entity, also formed in January 2012, established to acquire and hold the membership interests in JSCCG. A non-controlling interest in Holdco is held by a third partythird-party through nominal membership interests, to which none of the income, expenses, and cash flows are allocated.
The membership interests held by Holdco in JSCCG were purchased with proceeds from the issuance of $100 million of secured notes (the “Holdco"Holdco notes") and are subject to mandatory redemption pursuant to a schedule of amortizing, semi-annual payments due each January 15 and July 15, with a final payment due in January 2042. The payment dates for the
mandatorily redeemable membership interests are the same as those of the Holdco notes. The sale of the JSCCG notes, the membership interests in JSCCG, and the Holdco notes closed in January 2012. The JSCCG notes are secured by TVA’sTVA's lease payments, and the Holdco notes are secured by Holdco's investment in, and amounts receivable from, JSCCG. TVA’sTVA's lease payments to JSCCG are equal to and payable on the same dates as JSCCG’sJSCCG's and Holdco’sHoldco's semi-annual debt service payments. In addition to the lease payments, TVA pays administrative and miscellaneous expenses incurred by JSCCG and Holdco. Certain agreements related to this transaction contain default and acceleration provisions.
Due to its participation in the design, business conduct, and credit and financial support of JSCCG and Holdco, TVA
has determined that it has a variable interest in each of these entities. Based on its analysis, TVA has concluded that it is the
primary beneficiary of JSCCG and Holdco and, as such, is required to account for the VIEs on a consolidated basis. Holdco's
membership interests in JSCCG are eliminated in consolidation.
Southaven VIE
In 2013, TVA entered into a $400 million lease financing arrangement with Southaven Combined Cycle Generation LLC ("SCCG") for the lease by TVA of the Southaven Combined Cycle Facility ("Southaven CCF"). SCCG is a special single-purpose limited liability company formed in June 2013 to finance the Southaven CCF through a $360 million secured notes issuance (the “SCCG notes”"SCCG notes") and the issuance of $40 million of membership interests subject to mandatory redemption. The membership interests were purchased by Southaven Holdco LLC ("SHLLC"). SHLLC is a special single-purpose entity, also formed in June 2013, established to acquire and hold the membership interests in SCCG. A non-controlling interest in SHLLC is held by a third partythird-party through nominal membership interests, to which none of the income, expenses, and cash flows of SHLLC are allocated.
The membership interests held by SHLLC were purchased with proceeds from the issuance of $40 million of secured notes (the "SHLLC notes") and are subject to mandatory redemption pursuant to a schedule of amortizing, semi-annual payments due each February 15 and August 15, with a final payment due on August 15, 2033. The payment dates for the mandatorily redeemable membership interests are the same as those of the SHLLC notes, and the payment amounts are
sufficient to provide returns on, as well as returns of, capital until the investment has been repaid to SHLLC in full. The rate of return on investment to SHLLC is 7.0 percent, which is reflected as interest expense in the consolidated statements of operations. SHLLC is required to pay a pre-determined portion of the return on investment to Seven States Southaven, LLC ("SSSL") on each lease payment date as agreed in SHLLC's formation documents (the "Seven States Return"). The current and long-term portions of the Membership interests of VIE subject to mandatory redemption are included in Accounts payable and accrued liabilities and Other long-term liabilities, respectively.
The payment dates for the mandatorily redeemable membership interests are the same as those of the SHLLC notes. The SCCG notes are secured by TVA’sTVA's lease payments, and the SHLLC notes are secured by SHLLC’sSHLLC's investment in, and amounts receivable from, SCCG. TVA’sTVA's lease payments to SCCG are payable on the same dates as SCCG’sSCCG's and SHLLC’sSHLLC's semi-annual debt service payments and are equal to the sum of (i) the amount of SCCG’sSCCG's semi-annual debt service payments, (ii) the amount of SHLLC’sSHLLC's semi-annual debt service payments, and (iii) the amount of the Seven States Return. In addition to the lease payments, TVA pays administrative and miscellaneous expenses incurred by SCCG and SHLLC. Certain agreements related to this transaction contain default and acceleration provisions.
In the event that TVA were to choose to exercise an early buy out feature of the Southaven facility lease, in part or in whole, TVA must pay to SCCG amounts sufficient for SCCG to repay or partially repay on a pro rata basis the membership interests held by SHLLC, including any outstanding investment amount plus accrued but unpaid return. TVA also has the right, at any time and without any early redemption of the other portions of the Southaven facility lease payments due to SCCG, to fully repay SHLLC's investment, upon which repayment SHLLC will transfer the membership interests to a designee of TVA.
TVA participated in the design, business conduct, and financial support of SCCG and has determined that it has a direct variable interest in SCCG resulting from risk associated with the value of the Southaven CCF at the end of the lease term. Based on its analysis, TVA has determined that it is the primary beneficiary of SCCG and, as such, is required to account for the VIE on a consolidated basis.
Impact on Consolidated Financial Statements
The financial statement items attributable to carrying amounts and classifications of JSCCG, Holdco, and SCCG as of September 30, 20172021 and 2016,2020, as reflected inon the Consolidated Balance Sheets, are as follows:
| | | | | | | | | | | |
Summary of Impact of VIEs on Consolidated Balance Sheets At September 30 |
| | 2021 | | 2020 |
| | | |
| | | |
| | | |
| | | |
| Current liabilities | | | |
| Accrued interest | $ | 10 | | | $ | 10 | |
| Accounts payable and accrued liabilities | 3 | | | 3 | |
| Current maturities of long-term debt of variable interest entities | 43 | | | 41 | |
| Total current liabilities | 56 | | | 54 | |
| Other liabilities | | | |
| Other long-term liabilities | 20 | | | 23 | |
| Long-term debt, net | | | |
| Long-term debt of variable interest entities, net | 1,006 | | | 1,048 | |
| Total liabilities | $ | 1,082 | | | $ | 1,125 | |
|
| | | | | | | |
Summary of Impact of VIEs on Consolidated Balance Sheets At September 30 |
| | 2017 | | 2016 |
| Current liabilities | | | |
|
| Accrued interest | $ | 11 |
| | $ | 11 |
|
| Accounts payable and accrued liabilities | 2 |
| | 2 |
|
| Current maturities of long-term debt of variable interest entities | 36 |
| | 35 |
|
| Total current liabilities | 49 |
| | 48 |
|
| Other liabilities | | | |
| Other long-term liabilities | 30 |
| | 33 |
|
| Long-term debt, net | | | |
| Long-term debt of variable interest entities, net | 1,164 |
| | 1,199 |
|
| Total liabilities | $ | 1,243 |
| | $ | 1,280 |
|
Interest expense of $59$52 million, $61$54 million, and $63$56 million related to debt of VIEs and membership interests of variable interest entity subject to mandatory redemption is included inon the Consolidated Statements of Operations for the years ended September 30, 2017, 2016,2021, 2020, and 2015,2019, respectively.
At September 30, 2021, TVA had outstanding debt of VIEs of $1.0 billion and outstanding membership interests subject to mandatory redemption (including current portion) of $23 million issued by one of its VIEs of which it is the primary beneficiary. The following table sets forth TVA's future payments at September 30, 2021:
| | | | | | | | | | | | | | | | | | | | | | | | | | | | | | | | | | | | | | |
| Maturities Due in the Year Ending September 30 |
| | | 2022 | | 2023 | | 2024 | | 2025 | | 2026 | | Thereafter |
Long-term debt of VIEs including current maturities(1) | | $ | 43 | | | $ | 40 | | | $ | 36 | | | $ | 37 | | | $ | 39 | | | $ | 861 | |
| Membership interests of variable interest entity subject to mandatory redemption | | 3 | | | 2 | | | 1 | | | 1 | | | 1 | | | 15 | |
| | | | | | | | | | | | |
Note
(1) Long-term debt of VIEs does not include non-cash item of unamortized debt issue costs of $7 million.
Creditors of the VIEs do not have any recourse to the general credit of TVA. TVA does not have any obligations to provide financial support to the VIEs other than as prescribed in the terms of the agreements related to these transactions.
11.12. Other Long-Term Liabilities
Other long-term liabilities consist primarily of liabilities related to certain derivative agreements as well as liabilities for environmental remediation liabilities and liabilities under agreements related to compliance with certain environmental regulations. See Note 8— Leases, Note 13— Asset Retirement Obligations, and Note 2116 — Legal ProceedingsRisk Management Activities and Derivative Transactions — Environmental AgreementsDerivatives Not Receiving Hedge Accounting Treatment — Interest Rate Derivatives. The table below summarizes the types and amounts of Other long-term liabilities:
| | | | | | | | | | | |
Other Long-Term Liabilities At September 30 |
| | 2021 | | 2020(1) |
| Interest rate swap liabilities | $ | 1,524 | | | $ | 1,927 | |
| Operating lease liabilities | 122 | | | 171 | |
| Currency swap liabilities | 76 | | | 123 | |
| EnergyRight® financing obligation | 66 | | | 78 | |
| Long-term deferred compensation | 42 | | | 38 | |
| Long-term deferred revenue | 42 | | | 38 | |
| Accrued long-term service agreements | 29 | | | 56 | |
| Other | 140 | | | 117 | |
| Total other long-term liabilities | $ | 2,041 | | | $ | 2,548 | |
Note
(1) At September 30, 2020, $38 million and $38 million previously classified as Other (a component of Other long-term liabilities) have been reclassified to Long-term deferred compensation (a component of Other long-term liabilities) and Long-term deferred revenue (a component of Other long-term liabilities), respectively, to conform with current year presentation.
Interest Rate Swap Liabilities. TVA uses interest rate swaps to fix variable short-term debt to a fixed rate. The values of these derivatives are included in Accounts payable and accrued liabilities, Accrued interest, and Other long-term liabilities on the Consolidated Balance Sheets. At September 30, 2021 and 2020, the carrying amount of the interest rate swap liabilities reported in Accounts payable and accrued liabilities and Accrued interest was $115 million and $114 million, respectively. See Note 16 — Risk Management Activities and Derivative Transactions — Derivatives Not Receiving Hedge Accounting Treatment — Interest Rate Derivatives for information regarding the interest rate swap liabilities. As of September 30, 2021, Interest rate swap liabilities decreased $402 million as compared to September 30, 2020, primarily due to an increase in market interest rates along with net settlement payments made during the year.
|
| | | | | | | |
Other Long-Term Liabilities At September 30 |
| | 2017 | | 2016 |
| Interest rate swap liabilities | $ | 1,418 |
| | $ | 1,938 |
|
| Gallatin coal combustion residual facilities liability | 880 |
| | — |
|
| Capital lease obligations | 182 |
| | 177 |
|
| Currency swap liabilities | 92 |
| | 162 |
|
| EnergyRight® financing obligation | 115 |
| | 130 |
|
| Environmental agreements liability | 13 |
| | 18 |
|
| Membership interests of VIE subject to mandatory redemption | 30 |
| | 33 |
|
| Commodity contract derivative liabilities | 9 |
| | 49 |
|
| Other | 316 |
| | 266 |
|
| Total other long-term liabilities | $ | 3,055 |
| | $ | 2,773 |
|
Operating Lease Liabilities. TVA's operating leases consist primarily of railcars, equipment, real estate/land, and power generating facilities. At September 30, 2021 and 2020, the current portion of TVA's operating leases reported in Accounts payable and accrued liabilities was $40 million and $63 million, respectively. See Note 8 — Leases for more information regarding leases.
Currency Swap Liabilities. To protect against exchange rate risk related to British pound sterling denominated Bond transactions, TVA entered into foreign currency hedges. The values of these derivatives are included in Accounts payable and accrued liabilities and Other long-term liabilities on the Consolidated Balance Sheets. At September 30, 2021 and 2020, the carrying amount of the currency swap liabilities reported in Accounts payable and accrued liabilities was $7 million and $86 million, respectively. See Note 16 — Risk Management Activities and Derivative Transactions — Cash Flow Hedging Strategy for Currency Swaps for more information regarding the currency swap liabilities.
EnergyRight® Financing Obligation. TVA purchases certain loans receivable from its LPCs in association with the EnergyRight® Solutions program. The current and long-term portions of the resulting financing obligation are reported in Accounts payable and accrued liabilities and Other long-term liabilities, respectively, on TVA’s consolidated balance sheets. As ofTVA's Consolidated Balance Sheets. At September 30, 20172021 and 2016,2020, the carrying amount of the financing obligation reported in Accounts payable and accrued liabilities was approximately $29$16 million and $33$19 million, respectively. See Note 69 — Other Long-Term Assets for information regarding the associated loans receivable.
In response to the COVID-19 pandemic, customers experiencing financial hardship could request a deferral of EnergyRight® loan payments for a period of up to six months. The deferral option began in April 2020 and ended October 31, 2020. All EnergyRight® loans approved for the deferral period resumed payments in the second quarter of 2021. The deferred loans did not accrue interest during the deferral months and totaled less than $1 million. 12.
Long-Term Deferred Compensation. TVA provides compensation arrangements to engage and retain certain employees, both executive and non-executive, which are designed to provide participants with the ability to defer compensation to future periods. The current and long-term portions are reported in Accounts payable and accrued liabilities and Other long-
term liabilities, respectively, on TVA’s Consolidated Balance Sheets. At September 30, 2021 and 2020, the current amount of deferred compensation reported in Accounts payable and accrued liabilities was $51 million and $47 million, respectively.
Long-Term Deferred Revenue. Long-term deferred revenue represents payments received that exceed services rendered resulting in the deferral of revenue. This long-term portion represents amounts that will not be recognized within the next 12 months primarily related to fiber and transmission agreements. The current and long-term portions of the deferral are reported in Accounts Payable and accrued liabilities and Other long-term liabilities, respectively, on TVA’s Consolidated Balance Sheets. At September 30, 2021 and 2020, the current amount of deferred revenue was $10 million and $11 million, respectively, and is included in Accounts payable and accrued liabilities.
Accrued Long-Term Service Agreement. TVA has entered into various long-term service agreements for major
maintenance activities at certain of its combined cycle plants. TVA uses the direct expense method of accounting for these
arrangements. TVA accrues for parts when it takes ownership and for contractor services when they are rendered. Under
certain of these agreements, parts received and services rendered exceed payments made. The current and long-term portions
of the resulting obligation are reported in Accounts payable and accrued liabilities and Other long-term liabilities, respectively, on
TVA's Consolidated Balance Sheets. At September 30, 2021 and 2020, related liabilities of $28 million and $15 million, respectively, were recorded in Accounts payable and accrued liabilities.
13. Asset Retirement Obligations
During the year ended September 30, 2017,2021, TVA's total ARO liability increased $252$217 million.
To estimate its decommissioning obligation related to its nuclear generating stations, TVA uses a probability-weighted, discounted cash flow model which, on a unit-by-unit basis, considers multiple outcome scenarios that include significant estimations and assumptions. Those assumptions include (1) estimates of the cost of decommissioning,decommissioning; (2) the method of decommissioning and the timing of the related cash flows,flows; (3) the license period of the nuclear plant, considering the probability of license extensions,extensions; (4) cost escalation factors,factors; and (5) the credit adjusted risk free rate to measure the obligation at the present value of the future estimated costs. TVA has ascribed probabilities to two different decommissioning methods related to its nuclear decommissioning obligation estimate: the DECON method and the SAFSTOR method. The DECON method requires radioactive contamination to be removed from a site and safely disposed of or decontaminated to a level that permits the site to be released for unrestricted use shortly after it ceases operation. The SAFSTOR method allows nuclear facilities to be placed and maintained in a condition that allows the facilities to be safely stored and subsequently decontaminated to levels that permit release for unrestricted use.
TVA bases its nuclear decommissioning estimates on site-specific cost studies. The most recent study was approved and implemented in September 2017. An increase of $250 million was recorded to the nuclear AROs as a result of the updates. Site-specificThese cost studies are updated for each of TVA’sTVA's nuclear units at least every five years. TVA plans to complete new cost studies for its nuclear units in 2022.
On May 23, 2016, Watts Bar Unit 2 achieved initial criticality. As a result, TVA revisedalso has decommissioning obligations related to its non-nuclear generating sites, ash impoundments, transmission substation and distribution assets, and certain general facilities. To estimate its decommissioning liability estimateobligation related to these assets, TVA uses estimations and assumptions for Watts Barthe amounts and recorded antiming of future expenditures and makes judgments concerning whether or not such costs are considered a legal obligation. Those assumptions include (1) estimates of the costs of decommissioning, (2) the method of decommissioning and the timing of the related cash flows, (3) the expected retirement date of each asset, (4) cost escalation factors, and (5) the credit adjusted risk free rate to measure the obligation at the present value of the future estimated costs. TVA bases its decommissioning estimates for each asset on its identified preferred closure method.
The revisions in non-nuclear estimates increased $191 million for the year ended September 30, 2021. This increase was primarily driven by revisions of $198 million.
During 2017, TVA recorded adjustmentsapproximately $122 million to non-nuclearcertain coal combustion residuals ("CCR") closure liabilities at Shawnee Fossil Plant ("Shawnee"), Paradise, Colbert Fossil Plant, Cumberland Fossil Plant, and Gallatin Fossil Plant ("Gallatin") resulting from revised engineering estimates for construction costs, new vendor bids, modified closure designs, and expected costs associated with post-closure care of the closed areas. CCR ARO liabilities associated with groundwater well monitoring also increased approximately $69 million due to expansion in the scope of recurring activities including measuring, modeling, and reporting. In addition, TVA's use of a new CCR landfill at Shawnee and expansion of landfill acreage used at Gallatin resulted in new obligations of $30 million and $13 million, respectively.
The revisions in non-nuclear estimates increased $1.1 billion for the year ended September 30, 2020. In November 2019, the Tennessee Department of Environment and Conservation ("TDEC") released amendments to its regulations that govern solid waste disposal facilities, including TVA's active CCR facilities covered by a solid waste disposal permit and those which closed pursuant to a TDEC approved closure plan. Such facilities are generally subject to a 30-year post-closure care period during which the owner or operator must undertake certain activities, including monitoring and maintaining the facility. The amendments, among other things, add an additional 50-year period after the end of the post-closure care period, require TVA to submit recommendations as a result of projects maturingto what activities must be performed during this 50-year period to protect human health and estimates being refined.the environment, and require TVA to submit revised closure plans every 10 years. This regulatory revision resulted in an increase of $161$129 million, of which $38 million was related to the non-nuclear AROs. This amountoperating CCR facilities and $91 million was offset by a decrease of $188 millionrelated to non-nuclear AROs due to the reversal of certain Gallatin AROs given that the retirement obligations for the Gallatin ash ponds are now recorded as part of environmental remediation obligations. See Note 8.
During 2016,inactive or closed CCR facilities. In June 2020, based on recent project cost data and estimates, TVA performed reassessments ofrevised its AROs for its non-nuclear plants and other buildings. The reassessments consistedclosure-by-removal of detailed studies of various TVA sites conducted to identify and update benchmarks and standards used in estimating decommissioning costs. Additionally, TVA management updated its non-nuclear plant closure method assumption from a maintain-in-place method to a plant demolition method. TVA's reassessments and change in its closurecertain
method assumption resultedCCR facilities at Allen Fossil Plant, resulting in an increase to AROs of $273 million. In September 2020, TVA completed an engineering review of its cost estimates to close the ash pond complex at Gallatin, resulting in an increase of $173 million due to expected cost increases for excavation, disposal, and other activities required in a net increaseclosure-by-removal project. Also in September 2020, TVA completed a study of $32its plant decommissioning obligations and CCR post-closure care and monitoring obligations. TVA increased its plant decommissioning obligations by $19 million, primarily due to TVA's liability for existing non-nuclearasbestos and hazardous material abatement costs. TVA increased its CCR post-closure care and monitoring AROs during the year ended September 30, 2016. Also during 2016, TVA recorded a decrease of $54 million to its non-nuclear AROsprimarily as a result of changesexpected cost increases to monitor groundwater and maintain CCR areas after closure as well as increases in estimates relatedexpected acreage to active decommissioning projects and recorded $15 million of new AROs related to coal ash areas. Further adjustments to TVA's non-nuclear ARO liabilities may be required as projects mature and estimates are refined.maintain after closure, totaling $460 million.
Additionally, during the years ended September 30, 20172021 and 2016,2020, both the nuclear and non-nuclear liabilities were increased by periodic accretion, partially offset by settlement projects that were conducted during these periods. The nuclear and non-nuclear accretion amounts were deferred as regulatory assets. During 2017, 2016,2021, 2020, and 2015, $1442019, $72 million, $144$169 million, and $44$144 million, respectively, of the related regulatory assets were amortized into expense as these amounts were collected in rates. See Note 7.10 — Regulatory Assets and Liabilities. TVA maintains investment trusts to help fund its decommissioning obligations. See Note 1617 — Fair Value Measurements — Investment Funds and Note 2123 — Commitments and Contingencies — Decommissioning Costs for a discussion of the trusts' objectives and the current balances of the trusts.
| | | | | | | | | | | | | | | | | | | | |
| Asset Retirement Obligation Activity |
| | Nuclear | | Non-Nuclear | | Total | |
| Balance at September 30, 2019 | $ | 3,136 | | | $ | 2,480 | | | $ | 5,616 | | |
| Settlements | (1) | | | (113) | | | (114) | | |
| Revisions in estimate | — | | | 1,077 | | | 1,077 | | |
| | | | | | |
| | | | | | |
| Accretion (recorded as regulatory asset) | 143 | | | 63 | | | 206 | | |
| | | | | | |
| Balance at September 30, 2020 | 3,278 | | | 3,507 | | | 6,785 | | (1) |
| | | | | | |
| Settlements | (11) | | | (231) | | | (242) | | |
| Revisions in estimate | 12 | | | 191 | | | 203 | | |
| Additional obligations | — | | | 43 | | | 43 | | |
| | | | | | |
| Accretion (recorded as regulatory asset) | 149 | | | 64 | | | 213 | | |
| | | | | | |
| Balance at September 30, 2021 | $ | 3,428 | | | $ | 3,574 | | | $ | 7,002 | | (1) |
|
| | | | | | | | | | | | |
| Asset Retirement Obligation Activity | |
| | Nuclear | | Non-Nuclear | | Total | |
| Balance at September 30, 2015 | $ | 2,187 |
| | $ | 1,656 |
| | $ | 3,843 |
| |
| Settlements | — |
| | (133 | ) | | (133 | ) | |
| Change in estimate | 198 |
| | (22 | ) | | 176 |
| |
| Additional obligations | — |
| | 15 |
| | 15 |
| |
| Accretion (recorded to regulatory asset) | 107 |
| | 44 |
| | 151 |
| |
| Balance at September 30, 2016 | $ | 2,492 |
| | $ | 1,560 |
| | $ | 4,052 |
| (1) |
| Settlements | — |
| | (123 | ) | | (123 | ) | |
| Change in estimate | 250 |
| | 161 |
| | 411 |
| |
| Additional obligations | — |
| | 1 |
| | 1 |
| |
Reclassification of Gallatin projects(2) | — |
| | (188 | ) | | (188 | ) | |
| Accretion (recorded to regulatory asset) | 117 |
| | 34 |
| | 151 |
| |
| Balance at September 30, 2017 | $ | 2,859 |
| | $ | 1,445 |
| | $ | 4,304 |
| (1) |
Notes(1) Includes $266 million and $345 million at September 30, 2021 and 2020, respectively, in Current liabilities.
(1) The current portions
TVA implemented revised depreciation rates during the first quarter of 2022 applicable to its completed plant as a result of the ARO liabilitycompletion of a new depreciation study. The study includes a decline in the amounts service life estimates of $128 millionTVA’s coal-fired plants based on current planning assumptions to potentially retire the remainder of the coal-fired fleet by 2035. As and $212 million as result of September��30, 2017 and 2016, respectively, are includedthe accelerated retirements reflected in Accounts payable and accrued liabilities.the depreciation study, TVA performed an assessment of the assumptions used in the timing of cash flows related to its non-nuclear AROs. Based on the assessment, TVA identified changes to its projections of timing of certain asset retirement processes, that will be recorded in 2022.
(2) See Note 8 for additional information.
13. 14. Debt and Other Obligations
General
The TVA Act authorizes TVA to issue Bonds in an amount not to exceed $30.0 billion at any time. At September 30, 2017,2021, TVA had only two types of Bonds outstanding: power bonds and discount notes. Power bonds have maturities between one year and 50 years, and discount notes have maturities of less than one year. Power bonds and discount notes are both issued pursuant to Section 15d of the TVA Act and pursuant to the Basic Tennessee Valley Authority Power Bond Resolution adopted by the TVA Board on October 6, 1960, as amended on September 28, 1976, October 17, 1989, and March 25, 1992 (the "Basic Resolution"). Bonds are not obligations of the United States,U.S., and the United StatesU.S. does not guarantee the payments of principal or interest on Bonds.
Power bonds and discount notes rank on parity and have first priority of payment from net power proceeds, which are defined as the remainder of TVA’sTVA's gross power revenues after deducting the costs of operating, maintaining, and administering its power properties and tax equivalent payments, but before deducting depreciation accruals or other charges representing the amortization of capital expenditures, plus the net proceeds from the sale or other disposition of any power facility or interest therein.
TVA considers its scheduled rent payments under its leaseback transactions, as well as its scheduled payments under its lease financing arrangements involving John Sevier CCF and Southaven CCF, as costs of operating, maintaining, and administering its power properties. Costs of operating, maintaining, and administering TVA's power properties have priority over TVA’s
TVA's payments on the Bonds. Once net power proceeds have been applied to payments on power bonds and discount notes as well as any other Bonds that TVA may issue in the future that rank on parity with or subordinate to power bonds and discount notes, Section 2.3 of the Basic Resolution provides that the remaining net power proceeds shall be used only for (1) minimum payments into the U.S. Treasury required by the TVA Act as repayment of, and as a return on, the Power Program Appropriation Investment,Investment; (2) investment in power assets,system assets; (3) additional reductions of TVA’sTVA's capital obligations,obligations; and (4) other lawful purposes related to TVA’sTVA's power program.business.
The TVA Act and the Basic Resolution each contain two bond tests: the rate testand the bondholder protection test. Under the rate test, TVA must charge rates for power which will produce gross revenues sufficient to provide funds for, among other things, debt service on outstanding Bonds. As of September 30, 2017,2021, TVA was in compliance with the rate test. See Note 1 — Summary of Significant Accounting Policies — General. Under the bondholder protection test, TVA must, in successive five-year periods, use an amount of net power proceeds at least equal to the sum of (1) the depreciation accruals and other charges representing the amortization of capital expenditures and (2) the net proceeds from any disposition of power facilities for either the reduction of its capital obligations (including Bonds and the Power Program Appropriation Investment) or investment in power assets. TVA met the bondholder protection test for the five-year period ended September 30, 2015,2020, and must next meet the bondholder protection test for the five-year period ending September 30, 20202025.
Secured Debt of VIEs
On August 9, 2013, SCCG issued secured notes totaling $360 million that bear interest at a rate of 3.846 percent. The SCCG notes require amortizing semi-annual payments on each February 15 and August 15, and mature on August 15, 2033. Also on August 9, 2013, SCCG issued $40 million of membership interests subject to mandatory redemption. The proceeds from the secured notes issuance and the issuance of the membership interests waswere paid to TVA in accordance with the terms of the Southaven head lease. See Note 1011 — Variable Interest Entities — Southaven VIE. TVA used the proceeds from the transaction primarily to fund the acquisition of the Southaven CCF from SSSL.
On January 17, 2012, JSCCG issued secured notes totaling $900 million in aggregate principal amount that bear interest at a rate of 4.626 percent. Also on January 17, 2012, Holdco issued secured notes totaling $100 million that bear interest at a rate of 7.1 percent. The JSCCG notes and the Holdco notes require amortizing semi-annual payments on each January 15 and July 15, and mature on January 15, 2042. The Holdco notes require a $10 million balloon payment upon maturity. See Note 1011 — Variable Interest Entities — John Sevier VIEs. TVA used the proceeds from the transaction to meet its requirements under the TVA Act.
Secured debt of VIEs, including current maturities, outstanding at September 30, 20172021 and 20162020 totaled approximately $1.2$1.0 billion each year.and $1.1 billion, respectively.
Secured Notes
On July 20, 2016, TVA acquired two entities, in a business combination, designed to administer rent payments TVA makes under certain of its lease/leaseback arrangements. See Note 9. On September 27, 2000, the entities issued secured notes totaling $255 million that had an interest rate of 7.299 percent and required amortizing semi-annual payments on each March 15 and September 15 with a maturity date of March 15, 2019. In 2016, TVA assumed these secured notes in the acquisition at a fair value of $78 million. The secured notes of the entities, including current maturities, outstanding at September 30, 2017, and 2016, totaled approximately $48 million and $75 million, respectively, and are included in Notes payable in TVA’s consolidated balance sheets.
On September 20, 2017, TVA acquired two entities, in an asset acquisition, designed to administer rent payments TVA makes under certain of its lease/leaseback arrangements. On November 14, 2001, the entities issued secured notes totaling $272 million that had an interest rate of 5.572 percent and required amortizing semi-annual payments on each May 1 and November 1 with a maturity date of May 1, 2020. In 2017, TVA assumed these secured notes in the acquisition at a fair value of $74 million. The secured notes of the entities including current maturities, outstanding at September 30, 2017, totaled approximately $74 million, and are includedwere paid in Notes payablefull in TVA’s consolidated balance sheets. See Note 9.2020.
Short-Term Debt
The following table provides information regarding TVA's short-term borrowings:
| | | | | | | | | | | | | | | | | |
Short-term Borrowings At September 30 |
| | 2021 | | 2020 | | 2019 |
| Gross amount outstanding - discount notes | $ | 780 | | | $ | 57 | | | $ | 922 | |
| | | | | |
| Weighted average interest rate - discount notes | 0.03 | % | | 0.06 | % | | 2.15 | % |
|
| | | | | | | | | | | |
Short-term Borrowings At September 30 |
| | |
| | 2017 | | 2016 | | 2015 |
| Amount outstanding - discount notes | $ | 1,998 |
| | $ | 1,407 |
| | $ | 1,034 |
|
| | | | | | |
| Weighted average interest rate - discount notes | 1.000 | % | | 0.203 | % | | 0.055 | % |
Put and Call Options
Bond issues of $408 million held by the public are redeemable in whole or in part, at TVA’s option, on call dates ranging from the present to 2020 and at call prices of 100 percent the principal amount. Ten Bond issues totaling $268 million, with maturity dates ranging from 2025 to 2043, include a “survivor’s option,” which allows for right of redemption upon the death of a beneficial owner in certain specified circumstances. The amount of these Bonds classified as short-term was $46 million, with the remaining balance of $222 million classified as long-term, as of September 30, 2017. These bonds were classified as long-term as of September 30, 2016.
Put Options
Additionally,
TVA has two issues of PARRSPutable Automatic Rate Reset Securities ("PARRS") outstanding. After a fixed-rate period of five years, the coupon rate on the PARRS may automatically be reset downward under certain market conditions on an annual basis. The coupon rate reset on the PARRS is based on a calculation. For both series of PARRS, the coupon rate will reset downward on the reset date if the rate calculated is below the then-current coupon rate on the Bond. The calculation dates, potential reset dates, and terms of the calculation are different for each series. The coupon rate on the 1998 Series D PARRS may be reset on June 1 (annually) if the sum of the five-day average of the 30-Year Constant Maturity Treasury ("CMT") rate for the week ending the last Friday in April, plus 94 basis points, is below the then-current coupon rate. The coupon rate on the 1999 Series A PARRS may be reset on May 1 (annually) if the sum of the five-day average of the 30-Year CMT rate for the week ending the last Friday in March, plus 84 basis points, is below the then-current coupon rate. The coupon rates may only be reset downward, but investors may request to redeem their Bonds at par value in conjunction with a coupon rate reset for a limited period of time prior to the reset dates under certain circumstances.
The coupon rate for the 1998 Series D PARRS, which mature in June 2028, has been reset seveneight times, from an initial rate of 6.750 percent to the current rate of 3.5502.134 percent. In connection with these resets, $301$318 million of the Bonds have been redeemed, so $274redeemed; therefore, $256 million of the Bonds were outstanding at September 30, 2017.2021. The coupon rate for the 1999 Series A PARRS, which mature in May 2029, has been reset sixseven times, from an initial rate of 6.50 percent to the current rate of 3.3602.216 percent. In connection with these resets, $293$316 million of the Bonds have been redeemed, so $232redeemed; therefore, $208 million of the Bonds were outstanding at September 30, 2017.2021.
Due to the contingent nature of the put option on the PARRS, TVA determines whether the PARRS should be classified as long-term debt or current maturities of long-term debt by calculating the expected reset rate for the Bonds on the calculation dates, described above. If the determination date for reset is before the balance sheet date of the reporting period and the expected reset rate is less than the then-current coupon rate on the PARRS, the PARRS are included in current maturities. Otherwise, the PARRS are included in long-term debt.
Debt Securities Activity
The table below summarizes the long-term debt securities activity for the period from October 1, 2015, to years ended September 30, 2017.2021 and 2020.
| | Debt Securities Activity For the years ended September 30 | Debt Securities Activity For the years ended September 30 | Debt Securities Activity For the years ended September 30 |
| | | 2017 | | 2016 | | | 2021 | | 2020 |
| Issues | | | |
| Issues | | | | |
2017 Series A (1) | | $ | 1,000 |
| | $ | — |
| |
| 2020 Series A(1) | | 2020 Series A(1) | | $ | — | | | $ | 1,000 | |
2021 Series A(2) | | 2021 Series A(2) | | 500 | | | — | |
| Discount on debt issues | | (1 | ) | | — |
| Discount on debt issues | | — | | | (3) | |
| Total | | $ | 999 |
| | $ | — |
| Total | | $ | 500 | | | $ | 997 | |
| | | |
| | | | |
| Acquisitions | | | |
| |
Notes payable(2) | | $ | 74 |
| | $ | 78 |
| |
|
| | | |
| |
Redemptions/Maturities(3) | | | | | Redemptions/Maturities(3) | | | |
electronotes® | | electronotes® | | $ | — | | | $ | 219 | |
| 2009 Series B | | 2009 Series B | | 29 | | | 28 | |
| 2018 Series A | | 2018 Series A | | — | | | 1,000 | |
| 1999 Series A PARRS (TVE) | | 1999 Series A PARRS (TVE) | | — | | | 23 | |
| 1998 Series D PARRS (TVC) | | 1998 Series D PARRS (TVC) | | — | | | 17 | |
| 1995 Series B | | 1995 Series B | | — | | | 140 | |
| 2011 Series A | | 2011 Series A | | 1,500 | | | — | |
| 1998 Series H | | 1998 Series H | | 331 | | | — | |
| Total redemptions/maturities of power bonds | | Total redemptions/maturities of power bonds | | 1,860 | | | 1,427 | |
| Notes payable | | Notes payable | | — | | | 23 | |
| Variable interest entities | | $ | 35 |
| | $ | 33 |
| Variable interest entities | | 41 | | | 39 | |
| Notes payable | | 27 |
| | 3 |
| |
electronotes® | | 5 |
| | 47 |
| |
| 2009 Series A | | — |
| | 2 |
| |
| 2009 Series B | | 28 |
| | 27 |
| |
| 2001 Series D | | 525 |
| | — |
| |
| 2007 Series A | | 1,000 |
| | — |
| |
| Total | | $ | 1,620 |
| | $ | 112 |
| Total | | $ | 1,901 | | | $ | 1,489 | |
Notes
(1) The 20172020 Series A bondsBonds were issued at 99.999.706 percent of par.
(2) The related leaseback obligations2021 Series A Bonds were issued at 99.982 percent of $70 million previously reported in Other liabilities in TVA's consolidated balance sheets were extinguished in the fourth quarters of both 2017 and 2016 as a result of each year's acquisition. See Note 9 for additional information.par.
(3) All redemptions were at 100 percent of par.
Debt Outstanding
Total debt outstanding at September 30, 2017,2021 and 2016,2020, consisted of the following:
| | | | | | | | | | | | | | | | | | | | | | | | | | | | | | | | | | | |
Short-Term Debt
At September 30 |
CUSIP or Other Identifier | | Maturity | | Call/(Put) Date | |
Coupon Rate | | 2021 | | 2020 | |
| Short-term debt, net of discounts | | | | | | | | $ | 780 | | | $ | 57 | | |
| Current maturities of long-term debt of VIEs issued at par | | | | | | | | 43 | | | 41 | | |
| Current maturities of notes payable | | | | | | | | — | | | — | | |
| Current maturities of power bonds issued at par | | | | | | | | | | | |
| | | | | | | | | | | |
| 880591EN8 | | 8/15/2022 | | | | 1.875% | | 1,000 | | | — | | |
| | | | | | | | | | | |
| 880591EF5 | | 12/15/2021 | | | | 3.770% | | 1 | | | 1 | | |
| 880591EF5 | | 6/15/2022 | | | | 3.770% | | 27 | | | 28 | | |
| | | | | | | | | | | |
| | | | | | | | | | | |
| | | | | | | | | | | |
| | | | | | | | | | | |
| | | | | | | | | | | |
| | | | | | | | | | | |
| 880591EL2 | | 2/15/2021 | | | | 3.875% | | — | | | 1,500 | | |
| 880591DC3 | | 6/7/2021 | | | | 5.805% | | — | | | 258 | | (1) |
| Total current maturities of power bonds issued at par | | | | | | | | 1,028 | | | 1,787 | | |
| Total current debt outstanding, net | | | | | | | | $ | 1,851 | | | $ | 1,885 | | |
Note
(1) Includes net exchange gain from currency transactions of $73 million at September 30, 2020.
|
| | | | | | | | | | | | | | |
Short-Term Debt At September 30 |
CUSIP or Other Identifier | | Maturity | | Call/(Put) Date | | Coupon Rate | | 2017 | | 2016 |
| Short-term debt, net of discounts | |
| |
| |
| | $ | 1,998 |
| | $ | 1,407 |
|
| Current maturities of long-term debt of variable interest entities issued at par | |
| |
| |
| | 36 |
| | 35 |
|
| Current maturities of notes payable | |
| |
| |
| | 53 |
| | 27 |
|
| Current maturities of power bonds issued at par | |
| |
| |
| |
| |
|
| 880591EF5 | | 12/15/2017 | | | | 3.770% | | 1 |
| | 1 |
|
| 880591EF5 | | 6/15/2018 | | | | 3.770% | | 28 |
| | 27 |
|
| 88059TEL1 | | 11/15/2017 | | | | 2.650% | | 1 |
| | 1 |
|
| 88059TEL1 | | 5/15/2018 | | | | 2.650% | | 2 |
| | 2 |
|
| 880591DS8 | | 12/15/2016 | | | | 4.875% | | — |
| | 524 |
|
| 880591EA6 | | 7/18/2017 | | | | 5.500% | | — |
| | 1,000 |
|
| 880591CU4 | | 12/15/2017 | | | | 6.250% | | 650 |
| | — |
|
| 880591EC2 | | 4/1/2018 | | | | 4.500% | | 1,000 |
| | — |
|
| 88059TFS5 | | 10/15/2017 | | | | 4.125% | | 46 |
| | — |
|
| Total current maturities of power bonds issued at par | | | | | | | | 1,728 |
| | 1,555 |
|
| Total current debt outstanding, net | | | | | | | | $ | 3,815 |
| | $ | 3,024 |
|
| Long-Term Debt At September 30 | | Long-Term Debt At September 30 |
CUSIP or Other Identifier | | CUSIP or Other Identifier | | Maturity | | Coupon
Rate | | Effective Call Date | | 2021 Par | | 2020 Par | | Stock Exchange Listings |
| | Long-Term Debt(1) At September 30 | |
CUSIP or Other Identifier | | Maturity | | Coupon Rate | | Call Date | | 2017 Par | | 2016 Par | | Stock Exchange Listings | |
electronotes®(2) | | 5/15/2020 - 2/15/2043 | | 2.375% - 3.625% | | 2/15/2015 - 2/15/2018 | | $ | 226 |
| | $ | 278 |
| | None | |
| 880591CU4 | | 12/15/2017 | | 6.250% | | — |
| | 650 |
| | New York | |
| 880591EC2 | | 4/1/2018 | | 4.500% | | — |
| | 1,000 |
| | New York, Luxembourg | |
| 880591EQ1 | | 10/15/2018 | | 1.750% | | 1,000 |
| | 1,000 |
| | New York | |
| 880591EL2 | | 2/15/2021 | | 3.875% | | 1,500 |
| | 1,500 |
| | New York | |
| 880591DC3 | | 6/7/2021 | | 5.805% | (3) | | 268 |
| | 260 |
| | New York, Luxembourg | |
| | 880591EN8 | | 8/15/2022 | | 1.875% | | 1,000 |
| | 1,000 |
| | New York | 880591EN8 | | 8/15/2022 | | 1.875% | | | | $ | — | | | $ | 1,000 | | | New York |
| 880591ER9 | | 9/15/2024 | | 2.875% | | 1,000 |
| | 1,000 |
| | New York | 880591ER9 | | 9/15/2024 | | 2.875% | | 1,000 | | | 1,000 | | | New York |
| 880591EW8 | | 880591EW8 | | 5/15/2025 | | 0.750% | | 1,000 | | | 1,000 | | | New York |
| 880591CJ9 | | 11/1/2025 | | 6.750% | | 1,350 |
| | 1,350 |
| | New York, Hong Kong, Luxembourg, Singapore | 880591CJ9 | | 11/1/2025 | | 6.750% | | 1,350 | | | 1,350 | | | New York, Hong Kong, Luxembourg, Singapore |
| 880591EU26 | | 2/1/2027 | | 2.875% | | 1,000 |
| | — |
| | New York | |
880591300(4) | | 6/1/2028 | | 3.550% | | 273 |
| | 273 |
| | New York | |
880591409(4) | | 5/1/2029 | | 3.360% | | 232 |
| | 232 |
| | New York | |
| 880591EU2 | | 880591EU2 | | 2/1/2027 | | 2.875% | | 1,000 | | | 1,000 | | | New York |
880591300(3) | | 880591300(3) | | 6/1/2028 | | 2.134% | | 256 | | | 256 | | | New York |
880591409(3) | | 880591409(3) | | 5/1/2029 | | 2.216% | | 208 | | | 208 | | | New York |
| 880591DM1 | | 5/1/2030 | | 7.125% | | 1,000 |
| | 1,000 |
| | New York, Luxembourg | 880591DM1 | | 5/1/2030 | | 7.125% | | 1,000 | | | 1,000 | | | New York, Luxembourg |
| 880591EX6 | | 880591EX6 | | 9/15/2031 | | 1.500% | | 500 | | | — | | | New York |
| 880591DP4 | | 6/7/2032 | | 6.587% | (3) | | 335 |
| | 324 |
| | New York, Luxembourg | 880591DP4 | | 6/7/2032 | | 6.587% | (2) | | 337 | | (1) | 323 | | (1) | New York, Luxembourg |
| 880591DV1 | | 7/15/2033 | | 4.700% | | 472 |
| | 472 |
| | New York, Luxembourg | 880591DV1 | | 7/15/2033 | | 4.700% | | 472 | | | 472 | | | New York, Luxembourg |
| 880591EF5 | | 6/15/2034 | | 3.770% | | 303 |
| | 332 |
| | None | 880591EF5 | | 6/15/2034 | | 3.770% | | 190 | | | 218 | | | None |
| 880591DX7 | | 6/15/2035 | | 4.650% | | 436 |
| | 436 |
| | New York | 880591DX7 | | 6/15/2035 | | 4.650% | | 436 | | | 436 | | | New York |
| 880591CK6 | | 4/1/2036 | | 5.980% | | 121 |
| | 121 |
| | New York | 880591CK6 | | 4/1/2036 | | 5.980% | | 121 | | | 121 | | | New York |
| 880591CS9 | | 4/1/2036 | | 5.880% | | 1,500 |
| | 1,500 |
| | New York | 880591CS9 | | 4/1/2036 | | 5.880% | | 1,500 | | | 1,500 | | | New York |
| 880591CP5 | | 1/15/2038 | | 6.150% | | 1,000 |
| | 1,000 |
| | New York | 880591CP5 | | 1/15/2038 | | 6.150% | | 1,000 | | | 1,000 | | | New York |
| 880591ED0 | | 6/15/2038 | | 5.500% | | 500 |
| | 500 |
| | New York | 880591ED0 | | 6/15/2038 | | 5.500% | | 500 | | | 500 | | | New York |
| 880591EH1 | | 9/15/2039 | | 5.250% | | 2,000 |
| | 2,000 |
| | New York | 880591EH1 | | 9/15/2039 | | 5.250% | | 2,000 | | | 2,000 | | | New York |
| 880591EP3 | | 12/15/2042 | | 3.500% | | 1,000 |
| | 1,000 |
| | New York | 880591EP3 | | 12/15/2042 | | 3.500% | | 1,000 | | | 1,000 | | | New York |
| 880591DU3 | | 6/7/2043 | | 4.962% | (3) | | 201 |
| | 195 |
| | New York, Luxembourg | 880591DU3 | | 6/7/2043 | | 4.962% | (2) | | 202 | | (1) | 194 | | (1) | New York, Luxembourg |
| 880591CF7 | | 7/15/2045 | | 6.235% | | 7/15/2020 | | 140 |
| | 140 |
| | New York | |
| | 880591EB4 | | 1/15/2048 | | 4.875% | | 500 |
| | 500 |
| | New York, Luxembourg | 880591EB4 | | 1/15/2048 | | 4.875% | | 500 | | | 500 | | | New York, Luxembourg |
| 880591DZ2 | | 4/1/2056 | | 5.375% | | 1,000 |
| | 1,000 |
| | New York | 880591DZ2 | | 4/1/2056 | | 5.375% | | 1,000 | | | 1,000 | | | New York |
| 880591EJ7 | | 9/15/2060 | | 4.625% | | 1,000 |
| | 1,000 |
| | New York | 880591EJ7 | | 9/15/2060 | | 4.625% | | 1,000 | | | 1,000 | | | New York |
| 880591ES7 | | 9/15/2065 | | 4.250% | | 1,000 |
| | 1,000 |
| | New York | 880591ES7 | | 9/15/2065 | | 4.250% | | 1,000 | | | 1,000 | | | New York |
| | Subtotal | | | | 20,357 |
| | 21,063 |
| | | Subtotal | | | | 17,572 | | | 18,078 | | | |
| Unamortized discounts, premiums, issue costs, and other | | | | | | (152 | ) | | (162 | ) | | | Unamortized discounts, premiums, issue costs, and other | | | | | | (115) | | | (122) | | | |
| Total long-term outstanding power bonds, net | | | | | | 20,205 |
| | 20,901 |
| | | Total long-term outstanding power bonds, net | | | | | | 17,457 | | | 17,956 | | | |
| Long-term debt of variable interest entities, net | | 1,164 |
| | 1,199 |
| | |
| Long-term notes payable | | 69 |
| | 48 |
| | |
| Long-term debt of VIEs, net | | Long-term debt of VIEs, net | | 1,006 | | | 1,048 | | |
| | Total long-term debt, net | | $ | 21,438 |
| | $ | 22,148 |
| | Total long-term debt, net | | $ | 18,463 | | | $ | 19,004 | | |
Notes
(1) Includes net exchange gain from currency transactions of $125$58 million and $80 million at September 30, 20172021 and $150 million at September 30, 2016.2020, respectively.
(2) Includes one electronotes® issue with partial maturities of principal for each required annual payment.
(3) The coupon rate represents TVA’sTVA's effective interest rate.
(4)(3) TVA PARRS, CUSIP numbers 880591300 and 880591409, may be redeemed under certain conditions. See Put and Call Optionsabove.
| | | | | | | | | | | | | | | | | | | | | | | | | | | | | | | | | | | | | | | | | |
| Maturities Due in the Year Ending September 30 |
| | 2022 | | 2023 | | 2024 | | 2025 | | 2026 | | Thereafter | | Total |
Long-term power bonds including current maturities(1) | $ | 1,028 | | | $ | 29 | | | $ | 1,022 | | | $ | 1,022 | | | $ | 1,370 | | | $ | 14,187 | | | $ | 18,658 | |
| | | | | | | | | | | | | |
| Short-term debt, net of discounts | 780 | | | — | | | — | | | — | | | — | | | — | | | 780 | |
|
| | | | | | | | | | | | | | | | | | | | | | | | | | | |
| Maturities Due in the Year Ending September 30 |
| | 2018 | | 2019 | | 2020 | | 2021 | | 2022 | | Thereafter | | Total |
Long-term power bonds, long-term debt of variable interest entities, and notes payable including current maturities(1) | $ | 1,817 |
| | $ | 1,116 |
| | $ | 93 |
| | $ | 1,901 |
| | $ | 1,071 |
| | $ | 17,545 |
| | $ | 23,543 |
|
| Short-term debt, net of discounts | 1,998 |
| | — |
| | — |
| | — |
| | — |
| | — |
| | 1,998 |
|
Note
(1) Long-term power bonds does not include noncashnon-cash items of foreign currency exchange gain of $125$58 million, unamortized debt issue costs of $59$43 million, and net discount on sale of Bonds of $93 million. Long-term debt of variable interest entities does not include noncash item of unamortized debt issue costs of $11$72 million.
Credit Facility Agreements
TVA has funding available under 4 long-term revolving credit facilities totaling approximately $2.7 billion: a $1.0 billion credit facility that matures on September 28, 2023, a $150 million credit facility that matures on February 9, 2024, a $500 million credit facility that matures on February 1, 2025, and a $1.0 billion credit facility that matures on September 21, 2026. The interest rate on any borrowing under these facilities varies based on market factors and the rating of TVA's senior unsecured, long-term, non-credit-enhanced debt. TVA is required to pay an unused facility fee on the portion of the total $2.7 billion that TVA has not borrowed or committed under letters of credit. This fee, along with letter of credit fees, may fluctuate depending on the rating of TVA's senior unsecured, long-term, non-credit-enhanced debt. At September 30, 2021 and 2020, there were approximately $1.2 billion of letters of credit outstanding under these facilities, and there were no borrowings outstanding. See Note 16 — Risk Management Activities and Derivative Transactions — Other Derivative Instruments — Collateral.
The following table provides additional information regarding TVA's funding available under the 4 long-term revolving credit facilities:
| | | | | | | | | | | | | | | | | | | | | | | | | | |
Summary of Long-Term Credit Facilities At September 30, 2021 |
| Maturity Date | | Facility Limit | | Letters of Credit Outstanding | | Cash Borrowings | | Availability |
| September 2023 | | $ | 1,000 | | | $ | 328 | | | $ | — | | | $ | 672 | |
| February 2024 | | 150 | | | 38 | | | — | | | 112 | |
| February 2025 | | 500 | | | 500 | | | — | | | — | |
| September 2026 | | 1,000 | | | 301 | | | — | | | 699 | |
| Total | | $ | 2,650 | | | $ | 1,167 | | | $ | — | | | $ | 1,483 | |
TVA and the U.S. Treasury, pursuant to the TVA Act, have entered into a memorandum of understanding under which the U.S. Treasury provides TVA with a $150 million credit facility. This credit facility was renewed for 20182022 with a maturity date of September 30, 2018.2022. Access to this credit facility or other similar financing arrangements with the U.S. Treasury has been available to TVA since the 1960s. TVA can borrow under the U.S. Treasury credit facility only if it cannot issue Bonds in the market on reasonable terms, and TVA considers the U.S. Treasury credit facility a secondary source of liquidity. The interest rate on any borrowing under this facility is based on the average rate on outstanding marketable obligations of the United StatesU.S. with maturities from date of issue of one year or less. There were no outstanding borrowings under the facility at September 30, 2017.2021. The availability of this credit facility may be impacted by how the U.S. government addresses the possibility of approaching its debt limit.
TVA also has funding available under the four long-term revolving credit facilities totaling $2.7 billion: a $150 million credit facility that matures on December 12, 2019, a $500 million credit facility that matures on February 1, 2021, a $1.0 billion credit facility that matures on June 2, 2020, and a $1.0 billion credit facility that matures on September 30, 2020. The interest rate on any borrowing under these facilities varies based on market factors and the rating of TVA's senior unsecured, long-term, non-credit-enhanced debt. TVA is required to pay an unused facility fee on the portion of the total $2.7 billion that TVA has not borrowed or committed under letters of credit. This fee, along with letter of credit fees, may fluctuate depending on the rating of TVA's senior unsecured, long-term, non-credit-enhanced debt. At September 30, 2017, and September 30, 2016, there were $1.2 billion and $1.4 billion, respectively, of letters of credit outstanding under the facilities, and there were no borrowings outstanding. See Note 15 — Other Derivative Instruments — Collateral.
The following table provides additional information regarding TVA's funding available under the four long-term revolving credit facilities:
|
| | | | | | | | | | | | | | | |
Summary of Long-Term Credit Facilities At September 30, 2017 |
| Maturity Date | Facility Limit | | Letters of Credit Outstanding | | Cash Borrowings | | Availability |
| December 2019 | $ | 150 |
| | $ | 38 |
| | $ | — |
| | $ | 112 |
|
| February 2021 | 500 |
| | 500 |
| | — |
| | — |
|
| June 2020 | 1,000 |
| | 278 |
| | — |
| | 722 |
|
| September 2020 | 1,000 |
| | 335 |
| | — |
| | 665 |
|
| Total | $ | 2,650 |
| | $ | 1,151 |
| | $ | — |
| | $ | 1,499 |
|
Lease/Leasebacks
PriorTVA previously entered into leasing transactions to 2004, TVA received approximately $945 million in proceeds by entering into lease/leaseback transactionsobtain third-party financing for24 new peaking CTs. TVA also received approximately $389 million in proceeds by entering into lease/leaseback transactions forCTs as well as certain qualified technological equipment and software ("QTE") in 2003..Due to TVA's continuing involvement in the operation and maintenance of the leased units and equipment and its control over the distribution of power produced bywith the combustion turbine facilities and the QTE during the leaseback term, TVA accounted for the lease proceeds as financing obligations. On September 20, 2017, TVA acquired100 percent of the equity interests in two SPEs created for the purpose of facilitating a portion of the leaseback arrangements. As a result of the acquisition, TVA effectively settled $70 million of its leaseback obligations related to eight CTs. On July 20, 2016, TVA acquired 100 percent of the equity interests in two SPEs created for the purpose of facilitating lease/leaseback arrangements. As a result of the acquisition, TVA effectively settled $70 million of its leaseback obligations related to eight CTs. See Note 9. At September 30, 2017,2021 and 2016,2020, the outstanding leaseback obligations related to the remaining CTs and QTE were $33825 million and $467$223 million, respectively.
In May 2020, TVA made final rent payments under lease/leaseback transactions involving eight CTs, and TVA had previously acquired the equity interest related to these transactions. Rent payments under the remaining CT lease/leaseback transactions are scheduled to be made through January 2022. TVA does have the option to acquire the equity interests related to transactions involving the remaining eight CTs for additional amounts. In addition, on October 30, 2019, TVA provided notice of its intent to purchase the ownership interest in certain QTE. Repurchase payments are being made through a series of installments in 2021 and 2022, after which the associated leases will be terminated.
14.15. Accumulated Other Comprehensive Income (Loss)
AOCI represents market valuation adjustments related to TVA’sTVA's currency swaps. The currency swaps are cash flow hedges and are the only derivatives in TVA’sTVA's portfolio that have been designated and qualify for hedge accounting treatment. TVA records exchange rate gains and losses on its foreign currency-denominated debt and any related accrued interest in net income and marks its currency swap assets and liabilities to fair valuemarket through other comprehensive income (loss) ("OCI"). TVA then reclassifies an amount out of AOCI into net income, offsetting the exchange gain/loss recorded on the debt. For the years ended September 30, 20172021 and 2016,2020, TVA reclassified $26$97 million and $38 million of gains, and $129 million of losses, respectively, related to its cash flow hedges from AOCI to Interest expense. See Note 15.16 — Risk Management Activities and Derivative Transactions.
TVA records certain assets and liabilities that result from the regulated ratemaking process that would not be recorded under GAAP for non-regulated entities. As such, certain items that would generally be reported in AOCI or that would impact the consolidated statements of operations are recorded as regulatory assets or regulatory liabilities. See Note 710— Regulatory Assets and Liabilities for a schedule of regulatory assets and liabilities. See Note 15 16 — Risk Management Activities and Derivative Transactions for a discussion of the recognition in AOCI of gains and losses associated with certain derivative contracts.instruments. See Note 16 17 — Fair Value Measurements for a discussion of the recognition of certain investment fund gains and losses as regulatory assets and liabilities. See Note 20 22 — Benefit Plans for a discussion of the regulatory accounting related to components of TVA’sTVA's benefit plans.
15.16. Risk Management Activities and Derivative Transactions
TVA is exposed to various risks. These include risks related to commodity prices, investment prices, interest rates, currency exchange rates, and inflation as well as counterparty credit and performance risks. To help manage certain of these risks, TVA has historically entered into various derivative transactions, principally commodity option contracts, forward contracts, swaps, swaptions, futures, and options on futures. Other than certain derivative instruments in its trust investment funds, it is TVA’sTVA's policy to enter into these derivative transactions solely for hedging purposes and not for speculative purposes. During the fourth quarter of 2020, TVA hasdiscontinued derivative accounting for forward coal contracts because these contracts no longer met the criteria of net settlement, and, as a result, the associated net derivative liabilities were derecognized at that time.
In 2014, TVA suspended its FTPFinancial Trading Program. In anticipation of lifting the suspension in 2022, the TVA Board, in November 2021, approved the elimination of the Value at Risk aggregate transaction limit for the Financial Hedging Program (formerly, the Financial Trading Program) and no longer uses financial instruments to hedge risks related to commodity prices; however, TVA plans to continue to manage fuel price volatility through other methods and to periodically reevaluate its suspended FTP program for futureauthorized the use of financial instruments.tolerances and measures that will be reviewed annually by the TVA Board. The tolerances will address counterparty exposure, liquidity risk, and reduction in fuel cost volatility. In addition, the TVA Board approved certain administrative changes to the Financial Hedging Program.
Overview of Accounting Treatment
TVA recognizes certain of its derivative instruments as either assets or liabilities on its consolidated balance sheetsConsolidated Balance Sheets at fair value. The accounting for changes in the fair value of these instruments depends on (1) whether TVA uses regulatory accounting to defer the derivative gains and losses, (2) whether the derivative instrument has been designated and qualifies for hedge accounting treatment, and (3) if so, the type of hedge relationship (for example, cash flow hedge).
The following tables summarize the accounting treatment that certain of TVA's financial derivative transactions receive:
| | | | | | | | | | | | | | | | | | | | | | | | | | |
Summary of Derivative Instruments That Receive Hedge Accounting Treatment (part 1) Amount of Mark-to-Market Gain (Loss) Recognized in Accumulated Other Comprehensive Income (Loss) For the years ended September 30 |
| Derivatives in Cash Flow Hedging Relationship | | Objective of Hedge Transaction | | Accounting for Derivative
Hedging Instrument | | 2021 | | 2020 |
| Currency swaps | | To protect against changes in cash flows caused by changes in foreign currency exchange rates (exchange rate risk) | | Unrealized gains and losses are recorded in AOCI and reclassified to Interest expense to the extent they are offset by gains and losses on the hedged transaction | | $ | 126 | | | $ | (1) | |
|
| | | | | | | | | | | | |
Summary of Derivative Instruments That Receive Hedge Accounting Treatment (part 1) Amount of Mark-to-Market Gain (Loss) Recognized in Other Comprehensive Income (Loss) For the years ended September 30 |
| Derivatives in Cash Flow Hedging Relationship | | Objective of Hedge Transaction | | Accounting for Derivative Hedging Instrument | | 2017 | | 2016 |
| Currency swaps | | To protect against changes in cash flows caused by changes in foreign currency exchange rates (exchange rate risk) | | Unrealized gains and losses are recorded in AOCI and reclassified to interest expense to the extent they are offset by gains and losses on the hedged transaction | | $ | 59 |
| | $ | (139 | ) |
| | Summary of Derivative Instruments That Receive Hedge Accounting Treatment (part 2)(1) Amount of Gain (Loss) Reclassified from OCI to Interest Expense For the years ended September 30 | |
Summary of Derivative Instruments That Receive Hedge Accounting Treatment (part 2)(1) Amount of Gain (Loss) Reclassified from Accumulated Other Comprehensive Income (Loss) to Interest Expense For the years ended September 30 | | Summary of Derivative Instruments That Receive Hedge Accounting Treatment (part 2)(1) Amount of Gain (Loss) Reclassified from Accumulated Other Comprehensive Income (Loss) to Interest Expense For the years ended September 30 |
| Derivatives in Cash Flow Hedging Relationship | | 2017 | | 2016 | Derivatives in Cash Flow Hedging Relationship | | 2021 | | 2020 |
| Currency swaps | | $ | 26 |
| | $ | (129 | ) | Currency swaps | | $ | 97 | | | $ | 38 | |
Note
(1) There were no ineffective portions or0 amounts excluded from effectiveness testing for any of the periods presented. Based on forecasted foreign currency
exchange rates, TVA expects to reclassify approximately $18$25 million of lossesgains from AOCI to interestInterest expense within the next twelve12 months to offset amounts
anticipated to be recorded in interestInterest expense related to exchange gain on the debt.
| | | | | | | | | | | | | | | | | | | | | | | | | | |
Summary of Derivative Instruments That Do Not Receive Hedge Accounting Treatment Amount of Gain (Loss) Recognized in Income on Derivatives(1) For the years ended September 30 |
| | | | | | |
| Derivative Type | | Objective of Derivative(2) | | Accounting for Derivative Instrument | | 2021 | | 2020 |
| Interest rate swaps | | To fix short-term debt variable rate to a fixed rate (interest rate risk) | | Mark-to-market gains and losses are recorded as regulatory assets or liabilities
Realized gains and losses are recognized in Interest expense when incurred during the settlement period and are presented in operating cash flow | | $ | (115) | | | $ | (97) | |
| | | | | | | | |
| Commodity contract derivatives | | To protect against fluctuations in market prices of purchased coal or natural gas (price risk) | | Mark-to-market gains and losses are recorded as regulatory assets or liabilities
Realized gains and losses due to contract settlements are recognized in Fuel expense as incurred | | — | | | (1) | |
| | | | | | | | |
| | | | | | | | |
|
| | | | | | | | | | | | |
Summary of Derivative Instruments That Do Not Receive Hedge Accounting Treatment Amount of Gain (Loss) Recognized in Income on Derivatives(1) For the years ended September 30 |
|
|
|
|
| | |
| Derivative Type | | Objective of Derivative | | Accounting for Derivative Instrument | | 2017 | | 2016 |
| Interest rate swaps | | To fix short-term debt variable rate to a fixed rate (interest rate risk) | | Mark-to-Market gains and losses are recorded as regulatory assets or liabilities. Realized gains and losses are recognized in interest expense when incurred during the settlement period. | | $ | (101 | ) | | $ | (109 | ) |
| | | | | | | | | |
Commodity derivatives under FTP | | To protect against fluctuations in market prices of purchased commodities (price risk) | | Mark-to-Market gains and losses are recorded as regulatory assets or liabilities. Realized gains and losses are recognized in fuel expense or purchased power expense when the related commodity is used in production. | | (36 | ) | | (94 | ) |
NoteNotes
(1) All of TVA's derivative instruments that do not receive hedge accounting treatment have unrealized gains (losses) that would otherwise be recognized in income but instead are deferred as regulatory assets and liabilities. As such, there was nowere 0 related gain (loss)gains (losses) recognized in income for these unrealized gains (losses) for the years ended September 30, 20172021 and 2016.2020.
(2) During the fourth quarter of 2020, TVA discontinued derivative accounting for forward coal contracts. | | Fair Values of TVA Derivatives At September 30 | Fair Values of TVA Derivatives At September 30 | Fair Values of TVA Derivatives At September 30 |
| | 2017 | | 2016 | | 2021 | | 2020 |
| Derivatives That Receive Hedge Accounting Treatment: | Derivatives That Receive Hedge Accounting Treatment: | Derivatives That Receive Hedge Accounting Treatment: |
| | Balance | | Balance Sheet Presentation | | Balance | | Balance Sheet Presentation | | Balance | | Balance Sheet Presentation | | Balance | | Balance Sheet Presentation |
| Currency swaps | | | | | | | | Currency swaps | | | | | | | |
| £200 million Sterling | $ | (67 | ) | | Accounts payable and accrued liabilities $(5); Other long-term liabilities $(62) | | $ | (82 | ) | | Other long-term liabilities | |
£200 million Sterling(1) | | £200 million Sterling(1) | $ | — | | | $— | | $ | (78) | | | Accounts payable and accrued liabilities $(78) |
| £250 million Sterling | (15 | ) | | Accounts payable and accrued liabilities $(4); Other long-term liabilities $(11) | | (41 | ) | | Other long-term liabilities | £250 million Sterling | (36) | | | Accounts payable and accrued liabilities $(4); Other long-term liabilities $(32) | | (63) | | | Accounts payable and accrued liabilities $(5); Other long-term liabilities $(58) |
| £150 million Sterling | (21 | ) | | Accounts payable and accrued liabilities $(2); Other long-term liabilities $(19) | | (39 | ) | | Other long-term liabilities | £150 million Sterling | (47) | | | Accounts payable and accrued liabilities $(3); Other long-term liabilities $(44) | | (68) | | | Accounts payable and accrued liabilities $(3); Other long-term liabilities $(65) |
| | | | | | |
| Derivatives That Do Not Receive Hedge Accounting Treatment: | Derivatives That Do Not Receive Hedge Accounting Treatment: | Derivatives That Do Not Receive Hedge Accounting Treatment: |
| | Balance | | Balance Sheet Presentation | | Balance | | Balance Sheet Presentation | | Balance | | Balance Sheet Presentation | | Balance | | Balance Sheet Presentation |
| Interest rate swaps | | | | | | | | Interest rate swaps | | | | | | | |
| $1.0 billion notional | $ | (1,093 | ) | | Accounts payable and accrued liabilities $(66); Other long-term liabilities $(1,027) | | $ | (1,387 | ) | | Other long-term liabilities | $1.0 billion notional | $ | (1,182) | | | Accounts payable and accrued liabilities $(44); Accrued interest $(37); Other long-term liabilities $(1,101) | | $ | (1,449) | | | Accounts payable and accrued liabilities $(43); Accrued interest $(37); Other long-term liabilities $(1,369) |
| $476 million notional | (410 | ) | | Accounts payable and accrued liabilities $(25); Other long-term liabilities $(385) | | (539 | ) | | Other long-term liabilities | $476 million notional | (455) | | | Accounts payable and accrued liabilities $(22); Accrued interest $(10); Other long-term liabilities $(423) | | (588) | | | Accounts payable and accrued liabilities $(22); Accrued interest $(10); Other long-term liabilities $(556) |
| $42 million notional | (8 | ) | | Accounts payable and accrued liabilities $(2); Other long-term liabilities $(6) | | (12 | ) | | Other long-term liabilities | |
$42 million notional(2) | | $42 million notional(2) | (2) | | | Accounts payable and accrued liabilities $(1); Accrued interest $(1) | | (4) | | | Accounts payable and accrued liabilities $(2); Other long-term liabilities $(2) |
| Commodity contract derivatives | (60 | ) | | Other current assets $8; Other long-term assets $2; Other long-term liabilities $(9); Accounts payable and accrued liabilities $(61) | | (125 | ) | | Other current assets $6; Other long-term assets $3; Other long-term liabilities $(49); Accounts payable and accrued liabilities $(85) | Commodity contract derivatives | 247 | | | Other current assets $210; Other long-term assets $40; Accounts payable and accrued liabilities $(3) | | 46 | | | Other current assets $26; Other long-term assets $23; Accounts payable and accrued liabilities $(3) |
| FTP | | | | | | | | |
Derivatives under FTP(1) | (5 | ) | | Other current assets $(4); Accounts payable and accrued liabilities $(1) | | (39 | ) | | Other current assets $(30); Other long-term liabilities $(2); Accounts payable and accrued liabilities $(7) | |
NoteNotes
(1) Fair valuesOn June 7, 2021, the 1998 Series H Sterling Global bond matured, and the final payment was made on the related currency swap.
(2) Represents two interest rate swaps with notional amounts of certain derivatives under the FTP that were in net liability positions totaling $4$28 million and $30 million at September 30, 2017 and 2016, respectively, are recorded in TVA's margin cash accounts in Other current assets. These derivatives are transacted with futures commission merchants, and cash deposits have been posted to the margin cash accounts held with each futures commission merchant to offset the net liability positions in full.$14 million.
Cash Flow Hedging Strategy for Currency Swaps
To protect against exchange rate risk related tothree British pound sterling denominated Bond transactions, TVA entered into foreign currency hedges at the time the Bond transactions occurred. TVA had the following currency swaps outstanding at September 30, 2017:2021:
| | | | | | | | | | | | | | | | | | | | |
| Currency Swaps Outstanding |
| Effective Date of Currency Swap Contract | | Associated TVA Bond Issues Currency Exposure | | Expiration Date of Swap | | Overall Effective
Cost to TVA |
| | | | | | |
| 2001 | | £250 million | | 2032 | | 6.59% |
| 2003 | | £150 million | | 2043 | | 4.96% |
|
| | | | | | |
Currency Swaps Outstanding At September 30, 2017 |
| Effective Date of Currency Swap Contract | | Associated TVA Bond Issues Currency Exposure | | Expiration Date of Swap | | Overall Effective Cost to TVA |
| 1999 | | £200 million | | 2021 | | 5.81% |
| 2001 | | £250 million | | 2032 | | 6.59% |
| 2003 | | £150 million | | 2043 | | 4.96% |
When the dollar strengthens against the British pound sterling, the exchange gain on the Bond liability and related accrued interest is offset by an equal amount of loss on the swap contract that is reclassified out of AOCI. Conversely, the exchange loss on the Bond liability and related accrued interest is offset by an equal amount of gain on the swap contract that is reclassified out of AOCI. All such exchange gains or losses on the Bond liability and related accrued interest are included in Long-term debt, net.net and Accrued interest, respectively. The offsetting exchange losses or gains on the swap contracts are recognized in AOCI. If any gain (loss) were to be incurred as a result of the early termination of the foreign currency swap contract, the resulting income (expense) would be amortized over the remaining life of the associated Bond as a component of Interest expense. The values of the currency swap liabilities are included in Accounts payable and accrued liabilities and Other long-term liabilities on the consolidated balance sheets.Consolidated Balance Sheets.
Derivatives Not Receiving Hedge Accounting Treatment
Interest Rate Derivatives. Generally TVA uses interest rate swaps to fix variable short-term debt to a fixed rate, and TVA uses regulatory accounting treatment to defer the MtM gains and losses on its interest rate swaps. The net deferred unrealized gains and losses are classified as regulatory assets or liabilities on TVA's consolidated balance sheetsConsolidated Balance Sheets and are included in the ratemaking formula when gains or losses are realized. The values of these derivatives are included in Accounts payable and accrued liabilities, Accrued interest, and Other long-term liabilities on the consolidated balance sheets,Consolidated Balance Sheets, and realized gains and losses, if any, are included inon TVA's consolidated statementsConsolidated Statements of operations.Operations. For the years ended September 30, 20172021 and 2016,2020, the changes in fair market value of the interest rate derivativesswaps resulted in deferredthe deferral of unrealized gains of $472$402 million and unrealized losses of $311$272 million, respectively. TVA may hold short-term debt balances lower than the notional amount of the interest rate swaps from time to time due to changes in business conditions and other factors. While actual balances vary, TVA generally plans to maintain average balances of short-term debt equal to or in excess of the combined notional amount of the interest rate swaps.
Commodity Derivatives. TVA enters into certain derivative contracts for coal and natural gas that require physical delivery of the contracted quantity of the commodity. TVA marks to market all suchnatural gas contracts and defers the fair market values as regulatory assets or liabilities on a gross basis. At September 30, 2017, TVA's coal contract derivatives had terms of up to two years and2021, TVA's natural gas contract derivatives had terms of up to fourthree years.
| | | | | | | | | | | | | | | | | | | | | | | | | | | | | | | | | | | |
Commodity Contract Derivatives At September 30 |
| | 2021 | | 2020 |
| | Number of Contracts | | Notional Amount | | Fair Value (MtM) | | Number of Contracts | | Notional Amount | | Fair Value (MtM) |
| | | | | | | | | | | |
| Natural gas contract derivatives | 40 | | 263 million mmBtu | | $ | 247 | | | 42 | | 302 million mmBtu | | $ | 46 | |
|
| | | | | | | | | | | | | | | |
Commodity Contract Derivatives At September 30 |
| | 2017 | | 2016 |
| | Number of Contracts | | Notional Amount | | Fair Value (MtM) | | Number of Contracts | | Notional Amount | | Fair Value (MtM) |
| Coal contract derivatives | 20 | | 17 million tons | | $ | (67 | ) | | 20 | | 20 million tons | | $ | (127 | ) |
| Natural gas contract derivatives | 53 | | 271 million mmBtu | | $ | 7 |
| | 39 | | 148 million mmBtu | | $ | 2 |
|
Derivatives Under FTP. While TVA has suspended its FTP and no longer uses financial instruments to hedge risks related to commodity prices, certain natural gas swaps with a maturity of one year or less remain as part of the suspended FTP. Under the FTP, TVA was authorized to purchase and sell futures, swaps, options, and combinations of these instruments (as long as they were standard in the industry) to hedge TVA’s exposure to (1) the price of natural gas, fuel oil, electricity, coal, emission allowances, nuclear fuel, and other commodities included in TVA’s fuel cost adjustment calculation, (2) the price of construction materials, and (3) contracts for goods priced in or indexed to foreign currencies. The combined transaction limit for the fuel cost adjustment and construction material transactions was $130 million (based on one-day value at risk). In addition, the maximum hedge volume for the construction material transactions was 75 percent of the underlying net notional volume of the material that TVA anticipated using in approved TVA projects, and the market value of all outstanding hedging transactions involving construction materials was limited to $100 million at the execution of any new transaction. The portfolio value at risk limit for the foreign currency transactions was $5 million and was separate and distinct from the $130 million transaction limit discussed above. TVA's policy prohibits trading financial instruments under the FTP for speculative purposes.
|
| | | | | | | | | | | | | |
Derivatives under Financial Trading Program (1) At September 30 |
| | 2017 | | 2016 |
| | Notional Amount (in mmBtu) | | Fair Value (MtM) (in millions) | | Notional Amount (in mmBtu) | | Fair Value (MtM) (in millions) |
| Natural gas | | | | | | | |
| Swap contracts | 2,800,000 |
| | $ | (5 | ) | | 21,052,500 |
| | $ | (39 | ) |
Note
(1) Fair value amounts presented are based on the net commodity position with the counterparty. Notional amounts disclosed represent the net value of contractual
amounts.
TVA defers all FTP unrealized gains (losses) as regulatory liabilities (assets) and records only realized gains or losses to match the delivery period of the underlying commodity. In addition to the open commodity derivatives disclosed above, TVA had closed derivative contracts with market values of $(3) million and $(5) million at September 30, 2017 and 2016, respectively. TVA experienced the following unrealized and realized gains and losses related to the FTP at the dates and during the periods, as applicable, set forth in the tables below:
|
| | | | | | | | |
Financial Trading Program Unrealized Gains (Losses) At September 30 |
| | | | | |
| FTP unrealized gains (losses) deferred as regulatory liabilities (assets) | | 2017 | | 2016 |
| Natural gas | | $ | (5 | ) | | $ | (39 | ) |
|
| | | | | | | | |
Financial Trading Program Realized Gains (Losses) At September 30 |
| Decrease (increase) in fuel expense | | 2017 | | 2016 |
| Natural gas | | $ | (29 | ) | | $ | (75 | ) |
|
| | | | | | | | |
| Decrease (increase) in purchased power expense | | | | |
| Natural gas | | $ | (7 | ) | | $ | (19 | ) |
Offsetting of Derivative Assets and Liabilities
The amounts of TVA's derivative instruments as reported inon the consolidated balance sheets as of September 30, 2017, and September 30, 2016,Consolidated Balance Sheets are shown in the table below.below:
| Derivative Assets and Liabilities(1) (in millions) | | Derivative Assets and Liabilities(1) (in millions) |
| | | | At September 30, 2021 | | | At September 30, 2020 |
| Assets | | Assets | | | | |
| | Commodity derivatives not subject to master netting or similar arrangement | | Commodity derivatives not subject to master netting or similar arrangement | $ | 250 | | | | $ | 49 | |
| | | | At September 30, 2017 | |
| | Gross Amounts of Recognized Assets/Liabilities | | Gross Amounts Offset in the Balance Sheet (1) | | Net Amounts of Assets/Liabilities Presented in the Balance Sheet (2) | |
| Assets | | | | | | |
| Commodity derivatives not subject to master netting or similar arrangement | $ | 10 |
| | $ | — |
| | $ | 10 |
| |
| | | | | | | | | | | |
| Liabilities | | | | | | Liabilities | | | |
Currency swap(s) (3) | $ | 103 |
| | $ | — |
| | $ | 103 |
| |
Interest rate swaps (3) | 1,511 |
| | — |
| | 1,511 |
| |
| Commodity derivatives under FTP | 5 |
| | (4 | ) | | 1 |
| |
Currency swaps(2) | | Currency swaps(2) | $ | 83 | | | | $ | 209 | |
Interest rate swaps(2) | | Interest rate swaps(2) | 1,639 | | | | 2,041 | |
| Total derivatives subject to master netting or similar arrangement | 1,619 |
| | (4 | ) | | 1,615 |
| Total derivatives subject to master netting or similar arrangement | 1,722 | | | | 2,250 | |
| Total derivatives not subject to master netting or similar arrangement | 70 |
| | — |
| | 70 |
| |
| Commodity derivatives not subject to master netting or similar arrangement | | Commodity derivatives not subject to master netting or similar arrangement | 3 | | | | 3 | |
| Total liabilities | $ | 1,689 |
| | $ | (4 | ) | | $ | 1,685 |
| Total liabilities | $ | 1,725 | | | | $ | 2,253 | |
| | | | | | | |
| | At September 30, 2016 | |
| | Gross Amounts of Recognized Assets/Liabilities | | Gross Amounts Offset in the Balance Sheet (1) | | Net Amounts of Assets/Liabilities Presented in the Balance Sheet (2) | |
| Assets | | | | | | |
| Commodity derivatives under FTP subject to master netting or similar agreement | $ | 6 |
| | $ | (6 | ) | | $ | — |
| |
| Commodity derivatives not subject to master netting or similar arrangement | 9 |
| | — |
| | 9 |
| |
| | | | | | | |
| Total assets | $ | 15 |
| | $ | (6 | ) | | $ | 9 |
| |
| | | | | | | |
| Liabilities | | | | | | |
Currency swap(s) (3) | $ | 162 |
| | $ | — |
| | $ | 162 |
| |
Interest rate swaps (3) | 1,938 |
| | — |
| | 1,938 |
| |
| Commodity derivatives under FTP | 45 |
| | (36 | ) | | 9 |
| |
| Total derivatives subject to master netting or similar arrangement | 2,145 |
| | (36 | ) | | 2,109 |
| |
| Total derivatives not subject to master netting or similar arrangement | 134 |
| | — |
| | 134 |
| |
| Total liabilities | $ | 2,279 |
| | $ | (36 | ) | | $ | 2,243 |
| |
|
Notes
(1) AmountsOffsetting amounts primarily include counterparty netting of derivative contracts, margin account deposits for futures commission merchants transactions, and cash collateral received or paid in accordance with the accounting guidance for derivatives and hedging transactions. There were no material offsetting amounts on TVA's Consolidated Balance Sheets at either September 30, 2021 or 2020.
(2) There are no derivative contracts subject to a master netting arrangement or similar agreement which are not offset in the balance sheets.
(3) Letters of credit of approximately $1.2 billion and $1.4$1.5 billion were posted as collateral at September 30, 20172021 and 2016,2020, respectively, to partially secure the liability positions of one of the currency swaps and one of the interest rate swaps in accordance with the collateral requirements for these derivatives.
Other Derivative Instruments
Investment Fund Derivatives. Investment funds consist primarily of funds held in the NDT, ART, SERP, and DCP. All securities in the trusts are classified as trading. See Note 1617 — InvestmentsFair Value Measurements — Investment Funds for a discussion of the trusts' objectivestrusts, plans, and the types of investments that they hold.investments. The NDT and ART may invest in derivative instruments which may include swaps, futures, options, forwards, and other instruments. At September 30, 20172021 and 2016,2020, the NDT held investments in forward contracts to purchase debt securities. The fair values of these derivatives were in net asset positions totaling $19$2 million and $13 million at September 30, 2017,2021 and asset positions totaling $15 million at September 30, 2016.2020, respectively.
Collateral. TVA's interest rate swaps and currency swaps contain contract provisions that require a party to post collateral (in a form such as cash or a letter of credit) when the party's liability balance under the agreement exceeds a certain threshold. At September 30, 2017,2021, the aggregate fair value of all derivative instruments with credit-risk related contingent features that were in a liability position was $1.6$1.7 billion. TVA's collateral obligations at September 30, 2017,2021, under these
arrangements were approximately $1.1 billion, for which TVA had posted approximately $1.2 billion in letters of credit. These letters of credit reduce the available balance under the related credit facilities. TVA's assessment of the risk of its nonperformance includes a reduction in its exposure under the contract as a result of this posted collateral.
For all of its derivative instruments with credit-risk related contingent features:
•If TVA remains a majority-owned U.S. government entity but Standard & Poor's Financial Services, LLC ("S&P") or Moody's Investors Service, Inc. ("Moody's") downgrades TVA's credit rating to AA or Aa2, respectively, TVA's collateral obligations would likely increase by $22 million;million, and
•If TVA ceases to be majority-owned by the U.S. government, TVA's credit rating would likely be downgraded and TVA would be required to post additional collateral.
Counterparty Risk
TVA may be exposed to certain risks when a counterparty has the potential to fail to meet its obligations in accordance with agreed terms. These risks may be related to credit, operational, or nonperformance matters. To mitigate certain counterparty risk, TVA analyzes the counterparty’scounterparty's financial condition prior to entering into an agreement, establishes credit limits, monitors the appropriateness of those limits, as well as any changes in the creditworthiness of the counterparty, on an ongoing basis, and when required, employs credit mitigation measures, such as collateral or prepayment arrangements and master purchase and sale agreements, to mitigate credit risk.agreements.
Customers. TVA is exposed to counterparty credit risk associated with trade accounts receivable from delivered power sales to LPCs, and from industries and federal agencies directly served, all located in the Tennessee Valley region. Of the $1.4$1.5 billion and $1.6$1.4 billion of receivables from power sales outstanding at September 30, 20172021 and 2016,2020, respectively, nearly all counterparties were rated investment grade. The obligations of customers that are not investment grade are secured by collateral. TVA is also exposed to risk from exchange power arrangements with a small number of investor-owned regional
utilities related to either delivered power or the replacement of open positions of longer-term purchased power or fuel agreements. TVA believes its policies and procedures for counterparty performance risk reviews have generally protected TVA against significant exposure related to market and economic conditions. See Note 1— Summary of Significant Accounting Policies — Allowance for Uncollectible Accounts, Note 3 — Accounts Receivable, Net, andNote 3.9 — Other Long-Term Assets.
TVA had revenue from six2 LPCs that collectively accounted for 3317 percent of total operating revenuerevenues for both the years ended both September 30, 20172021 and September 30, 2016.2020.
Suppliers.Suppliers. TVA assesses potential supplier performance risks, including procurement of fuel, parts, and services. If suppliers are unable to perform under TVA's existing contracts or if TVA is unable to obtain similar services from other vendors, TVA could experience delays, disruptions, additional costs, or other operational outcomes that may impact generation, maintenance, and capital programs. If one of TVA's fuel or purchased power suppliers fails to perform under the terms of its contract with TVA, TVA might lose the moneymoney that it paid to the supplier under the contract and have to purchase replacement fuel or power on the spot market, perhaps at a significantly higher price than TVA was entitled to pay under the contract. In addition, TVA might not be able to acquire replacement fuel or power in a timely manner and thus might be unable to satisfy its own obligations to deliver power. Nuclear fuel requirements, including uranium miningTVA has seen an increase in supplier impacts as a result of COVID-19, such as delays and milling, conversion services, enrichment services,price fluctuations, but has been able to manage these impacts through existing contracts and fabrication services, are met from various suppliers, depending on the type of service.increased lead times and communications with suppliers; therefore, TVA has not experienced significant business disruptions at this time.
Natural Gas. TVA purchases the majority of its natural gas requirements from a variety of suppliers and delivers to its gas fleet under short-term contracts.firm and non-firm transportation contracts on multiple interstate natural gas pipelines. TVA contracts for storage capacity that allows for operational flexibility and increased supply during peak gas demand scenarios or supply disruptions. TVA also maintains on-site, fuel oil backup to operate at a majority of the combustion turbine sites in the event of major supply disruptions. In the event of nonperformance by suppliers, TVA believes that it can obtain replacement natural gas.
Coal. To help ensure a reliable supply of coal, TVA had coal contracts with multiple suppliers at September 30, 2017. 2021. The contracted supplysupply of coal is sourced from multiple geographic regions of the United StatesU.S. and is to be delivered via various transportation methods (i.e.(e.g., barge, rail, and truck). EmergingAs a result of emerging technologies, environmental regulations, and low naturallower gas prices have contributed to weak demand for coal. As a result,on average over the past few years, coal suppliers are facing increased financial pressure, which has led to relatively poor credit ratings and bankruptcies. Continued difficulties bybankruptcies, restructuring, mine closures, or other scenarios. A continued decline in demand for coal suppliers could result in further consolidations, additional bankruptcies, restructurings, contract renegotiations,restructuring, mine closures, or other scenarios. Under these scenariosCurrent market conditions indicate limited availability of spot market coal due to increased exports, utility demand, and TVA’s potential available responses, TVA does not anticipatemine capacity capability.
Nuclear Fuel. Nuclear fuel is obtained predominantly through long-term uranium concentrate supply contracts, contracted conversion services, contracted enrichment services, or a significant financial impact in obtaining continuedcombination thereof, and contracted fuel fabrication services. The supply markets for its coal-fired generation.
On March 29, 2017, one of TVA’s suppliers filed for protection under Chapter 11 of the United States Bankruptcy Code. Certain subsidiaries of the parent company have entered into contracts to supply goodsuranium concentrates and services to TVA, including contracts for the enrichment and fabrication ofcertain nuclear fuel services are subject to price fluctuations and availability restrictions. Supply market conditions may make procurement contracts subject to credit risk related to the manufacturepotential nonperformance of counterparties. In the event of nonperformance by these or other suppliers, TVA believes that replacement uranium concentrate and nuclear fuel services can be obtained, although at prices that may be unfavorable when compared to the prices under the current supply agreements.
Purchased Power. TVA acquires power from a steam generator,variety of power producers through long-term and short-term PPAs as well as several ongoing agreementsthrough spot market purchases. In order to meet customer preferences and requirements for maintenancecleaner and outage support at its nuclear and coal-fired plants. TVA is assessing potential performance impacts, including procurement of parts and services as well as outage schedules. The suppliers are currently performing under the TVA contracts; however, if any supplier is unable to perform under TVA’s existing contracts and TVA is unable to obtain similar services at similar terms from other vendors, TVA could experience delays, disruptions, additional costs, or other operational outcomes which TVA cannot predict at this time, but which could be material.
greener energy, TVA has entered into certain PPAs with renewable resource providers. TVA also has a power purchase agreementPPA that expires on March 31, 2032, with a supplier of electricity for 440 megawatts ("MW") of summer net capability from a lignite-fired generating plant. TVA has determined that the supplier has the equivalent of a non-investment grade credit rating; therefore, the supplier has provided credit assurance to TVA under the terms of the agreement.
a manufacturing delay for a major turbine component. A mitigation strategy was developed by TVA and the vendor which reduced impacts to TVA's outage schedule. TVA will continue to monitor the supply base and remain in contact with suppliers to identify potential risks.
In May 2021, TVA was notified of the Colonial Pipeline ransomware attack that shut down the pipeline for a period of time. The Colonial Pipeline delivers a portion of TVA’s refined products, such as gasoline and diesel fuel, among others. This event did not have a material impact on TVA business or operations. No alternative fuel supply sources or dispatch of alternative generation sources were necessary during this time, primarily as a result of having sufficient existing inventory.
Derivative Counterparties. TVA has entered into physical and financial contracts that qualify as derivatives for hedging purposes, and TVA's NDT, fundART, and qualified defined benefit pension plan have entered into derivative contracts for investment purposes. If a counterparty to one of TVA's hedgingthe physical or financial derivative transactions defaults, TVA might incur substantial costs in connection with entering into a replacement hedging transaction. If a counterparty to the derivative contracts into which the NDT, fund andthe ART, or the qualified pension plan have entered for investment purposes defaults, the value of the investment could decline significantly or perhaps become worthless. TVA has concentrations of credit risk from the banking, coal, and coalgas industries because multiple companies in these industries serve as counterparties to TVA in various derivative transactions. At
September 30, 2017,2021, all of TVA's commodity derivatives under the FTP, currency swaps and interest rate swaps as well as all of the derivatives in the NDT and ART were with banking counterparties whose Moody's credit ratings were A3A2 or higher.
TVA classifies qualified forward coal and natural gas contracts as derivatives. See Derivatives Not Receiving Hedge Accounting Treatment above. At September 30, 2017, the coal contracts were with counterparties whose Moody's credit rating, or TVA’s internal analysis when such information was unavailable, ranged from Ca to Ba2. At September 30, 2017,2021, the natural gas contracts were with counterparties whose ratings ranged from B1 to A2. See Suppliers above for discussionAa2. TVA recognizes the slowdown in demand and the impacts on the oil and gas industry as a result of challenges facing the coal industry. TVA's total value for derivative contracts with coalCOVID-19 pandemic. TVA will continue to monitor the impacts and natural gas counterparties in an asset position as of September 30, 2017, was approximately $10 million.affected credit ratings and enforce contract performance assurance provisions when applicable.
TVA currently utilizes two futures commission merchants ("FCMs") to clear commodity contracts, including futures, options, and similar financial derivatives. These transactions are executed under the FTP by the FCMs on exchanges on behalf of TVA. TVA maintains margin cash accounts with the FCMs. TVA makes deposits to the margin cash accounts to adequately cover any net liability positions on its derivatives transacted with the FCMs. See the note to the Fair Values of TVA Derivatives table above.
16.17. Fair Value Measurements
Fair value is determined based on the exchange price that would be received for an asset or paid to transfer a liability (an exit price) in the asset or liability's principal market, or in the absence of a principal market, the most advantageous market for the asset or liability in an orderly transaction between market participants. TVA uses market or observable inputs as the preferred source of values, followed by assumptions based on hypothetical transactions in the absence of market inputs.
Valuation Techniques
The measurement of fair value results in classification into a hierarchy by the inputs used to determine the fair value as follows:
|
| | | | | | | | | | |
| Level 1 | —
| | Unadjusted quoted prices in active markets accessible by the reporting entity for identical assets or liabilities. Active markets are those in which transactions for the asset or liability occur with sufficient frequency and volume to provide pricing. |
Level 2
| —
| | Pricing inputs other than quoted market prices included in Level 1 that are based on observable market data and that are directly or indirectly observable for substantially the full term of the asset or liability. These include quoted market prices for similar assets or liabilities, quoted market prices for identical or similar assets in markets that are not active, adjusted quoted market prices, inputs from observable data such as interest rate and yield curves, volatilities and default rates observable at commonly quoted intervals, and inputs derived from observable market data by correlation or other means. |
| Level 3 | —
| | Pricing inputs that are unobservable, or less observable, from objective sources. Unobservable inputs are only to be used to the extent observable inputs are not available. These inputs maintain the concept of an exit price from the perspective of a market participant and should reflect assumptions of other market participants. An entity should consider all market participant assumptions that are available without unreasonable cost and effort. These are given the lowest priority and are generally used in internally developed methodologies to generate management's best estimate of the fair value when no observable market data is available. |
A financial instrument's level within the fair value hierarchy (where Level 1 is the highest and Level 3 is the lowest) is based on the lowest level of input significant to the fair value measurement.
The following sections describe the valuation methodologies TVA uses to measure different financial instruments at fair value. Except for gains and losses on SERP and DCP assets, all changes in fair value of these assets and liabilities have been recorded as changes in regulatory assets, regulatory liabilities, or AOCI on TVA's consolidated balance sheetsConsolidated Balance Sheets and consolidated statementsConsolidated Statements of comprehensive income (loss)Comprehensive Income (Loss). Except for gains and losses on SERP and DCP assets, there has been no impact to the consolidated statementsConsolidated Statements of operationsOperations or the consolidated statementsConsolidated Statements of cash flowsCash Flows related to these fair value measurements.
Investment Funds
At September 30, 2017,2021, Investment funds were composedcomprised of $2.6$4.1 billion of equity securities and debt securities classified as trading and measured at fair value. TradingEquity and trading debt securities are held in the NDT, ART, SERP, and DCP. The NDT holds funds for the ultimate decommissioning of TVA's nuclear power plants. The ART holds funds primarily for the costs related to the future closure and retirement of TVA's other long-lived assets. The balances in the NDT and ART were $1.9$2.8 billion and $632 million,$1.1 billion, respectively, at September 30, 2017.2021.
TVA established a SERP to provide benefits to selected employees of TVA whichthat are comparable to those provided by competing organizations. The DCP is designed to provide participants with the ability to defer compensation until employment with TVA ends.to future periods. The NDT, andART, SERP, funds are invested in portfolios of securities generally designed to achieve a return in line with overall equity market performance, and ART and DCP funds are invested in portfolios of securities generally designed to achieve a return in line with overall debtequity and equitydebt market performance.
The NDT, ART, SERP, and DCP are composed of multiple types of investments and are managed by external institutional investment managers. Most U.S. and international equities, U.S. Treasury inflation-protected securities ("TIPS"), real estate investment trust securities, and cash securities and certain derivative instruments are measured based on quoted exchange prices in active markets and are classified as Level 1 valuations. Fixed-income investments, high-yield fixed-income
investments, currencies, and most derivative instruments are non-exchange traded and are classified as Level 2 valuations. These measurements are based on market and income approaches with observable market inputs.
Private equity limited partnerships, private real asset investments, and private real estatecredit investments may include holdings of investments in private real estate, venture capital, buyout, mezzanine or subordinated debt, restructuring or distressed debt, and special situations through funds managed by third-party investment managers. These investments generally involve a three to four year3-to-4-year period where the investor contributes capital, followed by a period of distribution, typically over several years. The investment period is generally, at a minimum, 10 years or longer. The NDT had unfunded commitments related to private equity limited partnerships of $50$221 million, private real assets of $96 million, and private credit of $44 million at September 30, 2021. The ART had unfunded commitments related to limited partnerships in private equity of $123 million, private real estateassets of $5$65 million, and private credit of $21 million at September 30, 2017.2021. These investments have no redemption or limited redemption options and may also impose restrictions on the NDT’sNDT's and ART's ability to liquidate itstheir investments. There are no0 readily available quoted exchange prices for these investments. The fair value of thethese investments is based on TVA’s ownership percentage of the fair value of the underlying investments asinformation provided by the investment managers. These investments are typically valued on a quarterly basis. TVA’sTVA's private equity limited partnerships, private real asset investments, and private real estatecredit investments are valued at net asset values ("NAV") as a practical expedient for fair value. TVA classifies its interest in these types of investments as investments measured at net asset valueNAV in the fair value hierarchy.
Commingled funds represent investment funds comprising multiple individual financial instruments. The commingled funds held by the NDT, ART, SERP, and DCP consist of either a single class of securities, such as equity, debt, or foreign currency securities, or multiple classes of securities. All underlying positions in these commingled funds are either exchange traded or measured using observable inputs for similar instruments. The fair value of commingled funds is based on NAV per fund share (the unit of account), derived from the prices of the underlying securities in the funds. These commingled funds can be redeemed at the measurement date NAV and are classified as Commingled funds measured at net asset valueNAV in the fair value hierarchy.
Realized and unrealized gains and losses on equity and trading debt securities are recognized in current earnings and are based on average cost. The gains and losses of the NDT and ART are subsequently reclassified to a regulatory asset or liability account in accordance with TVA's regulatory accounting policy. See Note 1 — Summary of Significant Accounting Policies — Cost-Based RegulationandNote 10— Regulatory Assets and Liabilities. TVA recorded unrealized gains and losses related to its equity and trading debt securities held during each period as follows:
| | | | | | | | | | | | | | | | | |
Unrealized Investment Gains (Losses)
At or for the years ended September 30 |
| Fund | Financial Statement Presentation | | 2021 | | 2020 |
| NDT | Regulatory asset | | $ | 279 | | | $ | 37 | |
| ART | Regulatory asset | | 145 | | | 32 | |
| SERP | Other income (expense) | | 7 | | | 3 | |
| DCP | Other income (expense) | | 1 | | | 2 | |
|
| | | | | | | | | |
| | Unrealized Investment Gains (Losses) At September 30 |
| | Financial Statement Presentation | | 2017 | | 2016 |
| SERP | Other income (expense) | | $ | 4 |
| | $ | 2 |
|
| DCP | Other income (expense) | | 2 |
| | 1 |
|
| NDT | Regulatory asset | | 92 |
| | 89 |
|
| ART | Regulatory asset | | 43 |
| | 29 |
|
Currency and Interest Rate Swap Derivatives
See Note 1516 — Risk Management Activities and Derivative Transactions — Cash Flow Hedging Strategy for Currency Swaps and Derivatives Not Receiving Hedge Accounting Treatment for a discussion of the nature, purpose, and contingent features of TVA's currency swaps and interest rate swaps. These swaps are classified as Level 2 valuations and are valued based on income approaches using observable market inputs for similar instruments.
Commodity Contract Derivatives
See Note 16 — Risk Management Activities and Commodity Derivative Transactions — Derivatives Under FTP
Commodity Contract Derivatives. Not Receiving Hedge Accounting Treatment.Most of these contracts are valued based on market approaches which utilize short-short-term and mid-term market-quoted prices from an external industry brokerage service. A small number of these contracts are valued based on a pricing model using long-term price estimates from TVA's coal price forecast. To value the volume option component of applicable coal contracts, TVA uses a Black-Scholes pricing model which includes inputs from the forecast, contract-specific terms, and other market inputs. These contracts are classified as Level 3 valuations.
Commodity Derivatives Under FTP. These contracts are valued based on market approaches which utilize Chicago Mercantile Exchange ("CME") quoted prices and other observable inputs. Swap contracts are valued using a pricing model based on CME inputs and are subject to nonperformance risk outside of the exit price. These contracts are classified as Level 2 valuations.
See Note 15 — Derivatives Not Receiving Hedge Accounting Treatment — Commodity Derivatives and— Derivatives Under FTP for a discussion of the nature and purpose of coal contracts and derivatives under TVA's FTP.
Nonperformance Risk
The assessment of nonperformance risk, which includes credit risk, considers changes in current market conditions, readily available information on nonperformance risk, letters of credit, collateral, other arrangements available, and the nature of master netting arrangements. TVA is a counterparty to currency swaps, interest rate swaps, commodity contracts, and other derivatives which subject TVA to nonperformance risk. Nonperformance risk on the majority of investments and certain exchange-traded instruments held by TVA is incorporated into the exit price that is derived from quoted market data that is used to mark the investment to market.
Nonperformance risk for most of TVA's derivative instruments is an adjustment to the initial asset/liability fair value. TVA adjusts for nonperformance risk, both of TVA (for liabilities) and the counterparty (for assets), by applying credit valuation adjustments ("CVAs"). TVA determines an appropriate CVA for each applicable financial instrument based on the term of the
instrument and TVA's or the counterparty's credit rating as obtained from Moody's. For companies that do not have an observable credit rating, TVA uses internal analysis to assign a comparable rating to the counterparty. TVA discounts each financial instrument using the historical default rate (as reported by Moody’sMoody's for CY 19831984 to CY 2016)2020) for companies with a similar credit rating over a time period consistent with the remaining term of the contract. The application of CVAs resulted in a less than $1 million decrease in the fair value of assets and a $1 million decrease in the fair value of liabilities at September 30, 2017.2021.
Fair Value Measurements
The following tables set forth by level, within the fair value hierarchy, TVA's financial assets and liabilities that were measured at fair value on a recurring basis at September 30, 2017,2021 and 2016.2020. Financial assets and liabilities have been classified in their entirety based on the lowest level of input that is significant to the fair value measurement. TVA's assessment of the significance of a particular input to the fair value measurement requires judgment and may affect the determination of the fair value of the assets and liabilities and their classification in the fair value hierarchy levels.
| | Fair Value Measurements At September 30, 2017 | |
Fair Value Measurements At September 30, 2021 | | Fair Value Measurements At September 30, 2021 |
| | Quoted Prices in Active Markets for Identical Assets (Level 1) | | Significant Other Observable Inputs (Level 2) | | Significant Unobservable Inputs (Level 3) | | Total | | Quoted Prices in Active
Markets for
Identical Assets
(Level 1) | | Significant Other
Observable Inputs
(Level 2) | | Significant
Unobservable
Inputs
(Level 3) | | Total |
| Assets | | | | | | | | Assets | | | | | | | |
| Investments | | | | | | | | Investments | | | | | | | |
| Equity securities | $ | 226 |
| | $ | — |
| | $ | — |
| | $ | 226 |
| Equity securities | $ | 634 | | | $ | — | | | $ | — | | | $ | 634 | |
| Government debt securities | 100 |
| | 42 |
| | — |
| | 142 |
| |
| Corporate debt securities | — |
| | 373 |
| | — |
| | 373 |
| |
Government debt securities(1) | | Government debt securities(1) | 573 | | | 24 | | | — | | | 597 | |
Corporate debt securities(2) | | Corporate debt securities(2) | — | | | 411 | | | — | | | 411 | |
| Mortgage and asset-backed securities | — |
| | 49 |
| | — |
| | 49 |
| Mortgage and asset-backed securities | — | | | 63 | | | — | | | 63 | |
| Institutional mutual funds | 94 |
| | — |
| | — |
| | 94 |
| Institutional mutual funds | 225 | | | — | | | — | | | 225 | |
| Forward debt securities contracts | — |
| | 19 |
| | — |
| | 19 |
| Forward debt securities contracts | — | | | 2 | | | — | | | 2 | |
Private equity funds measured at net asset value(1) | — |
| | — |
| | — |
| | 136 |
| |
Private real estate funds measured at net asset value(1) | — |
| | — |
| | — |
| | 113 |
| |
Private equity funds measured at net asset value(3) | | Private equity funds measured at net asset value(3) | — | | | — | | | — | | | 357 | |
Private real asset funds measured at net asset value(3) | | Private real asset funds measured at net asset value(3) | — | | | — | | | — | | | 272 | |
Private credit measured at net asset value(3) | | Private credit measured at net asset value(3) | — | | | — | | | — | | | 71 | |
Commingled funds measured at net asset value(1)(3) | — |
| | — |
| | — |
| | 1,451 |
| — | | | — | | | — | | | 1,421 | |
| Total investments | 420 |
| | 483 |
| | — |
| | 2,603 |
| Total investments | 1,432 | | | 500 | | | — | | | 4,053 | |
| | Commodity contract derivatives | — |
| | 8 |
| | 2 |
| | 10 |
| Commodity contract derivatives | — | | | 250 | | | — | | | 250 | |
| | Total | $ | 420 |
| | $ | 491 |
| | $ | 2 |
| | $ | 2,613 |
| Total | $ | 1,432 | | | $ | 750 | | | $ | — | | | $ | 4,303 | |
| | | | | | | | | | | | | | | | |
| | Quoted Prices in Active Markets for Identical Liabilities (Level 1) | | Significant Other Observable Inputs (Level 2) | | Significant Unobservable Inputs (Level 3) | | Total | | Quoted Prices in Active Markets for Identical Liabilities
(Level 1) | | Significant Other
Observable Inputs
(Level 2) | | Significant
Unobservable
Inputs
(Level 3) | | Total |
| Liabilities | | | | | | | | Liabilities | | | | | | | |
Currency swap(s)(2) | $ | — |
| | $ | 103 |
| | $ | — |
| | $ | 103 |
| |
Currency swaps(4) | | Currency swaps(4) | $ | — | | | $ | 83 | | | $ | — | | | $ | 83 | |
| Interest rate swaps | — |
| | 1,511 |
| | — |
| | 1,511 |
| Interest rate swaps | — | | | 1,639 | | | — | | | 1,639 | |
| Commodity contract derivatives | — |
| | 1 |
| | 69 |
| | 70 |
| Commodity contract derivatives | — | | | 3 | | | — | | | 3 | |
Commodity derivatives under FTP(2) | | | | | | |
|
| |
| Swap contracts | — |
| | 1 |
| | — |
| | 1 |
| |
| | Total | $ | — |
| | $ | 1,616 |
| | $ | 69 |
| | $ | 1,685 |
| Total | $ | — | | | $ | 1,725 | | | $ | — | | | $ | 1,725 | |
Notes
(1) Includes government-sponsored entities, including $573 million of U.S. Treasury securities within Level 1 of the fair value hierarchy.
(2) Includes both U.S. and foreign debt.
(3) Certain investments that are measured at fair value using the net asset valueNAV per share (or its equivalent) practical expedient have not been categorized in the fair value hierarchy. The fair value amounts presented in this table are intended to permit reconciliation of the fair value hierarchy to the amounts presented inon the consolidated balance sheets.Consolidated Balance Sheets.
(2) Due to the right of setoff and method of settlement, TVA elects to record commodity derivatives under the FTP based on its net commodity position with the counterparty or FCM. Deposits are made to TVA's margin cash accounts held with each FCM to offset any net liability positions in full for derivatives that are transacted with FCMs.(4) TVA records currency swaps net of cash collateral received from or paid to the counterparty, to the extent such amount is not recorded in Accounts payable and accrued liabilities. See Note 15 16 — Risk Management Activities and Derivative Transactions — Offsetting of Derivative Assets and Liabilities.
| | Fair Value Measurements At September 30, 2016 | |
Fair Value Measurements
At September 30, 2020 | | Fair Value Measurements
At September 30, 2020 |
| | Quoted Prices in Active Markets for Identical Assets (Level 1) | | Significant Other Observable Inputs (Level 2) | | Significant Unobservable Inputs (Level 3) | | Total | | Quoted Prices in Active
Markets for
Identical Assets
(Level 1) | | Significant Other
Observable Inputs
(Level 2) | | Significant
Unobservable
Inputs
(Level 3) | | Total |
| Assets | | | | | | | | Assets | | | | | | | |
| Investments | | | | | | | | Investments | | | | | | | |
| Equity securities | $ | 196 |
| | $ | — |
| | $ | — |
| | $ | 196 |
| Equity securities | $ | 500 | | | $ | — | | | $ | — | | | $ | 500 | |
| Government debt securities | 88 |
| | 36 |
| | — |
| | 124 |
| |
| Corporate debt securities | — |
| | 393 |
| | — |
| | 393 |
| |
Government debt securities(1) | | Government debt securities(1) | 485 | | | 40 | | | — | | | 525 | |
Corporate debt securities(2) | | Corporate debt securities(2) | — | | | 356 | | | — | | | 356 | |
| Mortgage and asset-backed securities | — |
| | 50 |
| | — |
| | 50 |
| Mortgage and asset-backed securities | — | | | 27 | | | — | | | 27 | |
| Institutional mutual funds | 92 |
| | — |
| | — |
| | 92 |
| Institutional mutual funds | 188 | | | — | | | — | | | 188 | |
| Forward debt securities contracts | — |
| | 15 |
| | — |
| | 15 |
| Forward debt securities contracts | — | | | 13 | | | — | | | 13 | |
Private equity funds measured at net asset value(1) | — |
| | — |
| | — |
| | 132 |
| |
Private real estate funds measured at net asset value(1) | — |
| | — |
| | — |
| | 113 |
| |
Private equity funds measured at net asset value(3) | | Private equity funds measured at net asset value(3) | — | | | — | | | — | | | 194 | |
Private real asset funds measured at net asset value(3) | | Private real asset funds measured at net asset value(3) | — | | | — | | | — | | | 168 | |
Private credit measured at net asset value(3) | | Private credit measured at net asset value(3) | — | | | — | | | — | | | 53 | |
Commingled funds measured at net asset value(1)(3) | — |
| | — |
| | — |
| | 1,142 |
| — | | | — | | | — | | | 1,174 | |
| | Total investments | 376 |
| | 494 |
| | — |
| | 2,257 |
| Total investments | 1,173 | | | 436 | | | — | | | 3,198 | |
| | Commodity contract derivatives | — |
| | 5 |
| | 4 |
| | 9 |
| Commodity contract derivatives | — | | | 49 | | | — | | | 49 | |
| | Total | $ | 376 |
| | $ | 499 |
| | $ | 4 |
| | $ | 2,266 |
| Total | $ | 1,173 | | | $ | 485 | | | $ | — | | | $ | 3,247 | |
| | | | | | | | | | | | | | | | |
| | Quoted Prices in Active Markets for Identical Liabilities (Level 1) | | Significant Other Observable Inputs (Level 2) | | Significant Unobservable Inputs (Level 3) | | Total | | Quoted Prices in Active Markets for Identical Liabilities
(Level 1) | | Significant Other
Observable Inputs
(Level 2) | | Significant
Unobservable
Inputs
(Level 3) | | Total |
| Liabilities | | | | | | | | Liabilities | | | | | | | |
Currency swap(s)(2) | $ | — |
| | $ | 162 |
| | $ | — |
| | $ | 162 |
| |
Currency swaps(4) | | Currency swaps(4) | $ | — | | | $ | 209 | | | $ | — | | | $ | 209 | |
| Interest rate swaps | — |
| | 1,938 |
| | — |
| | 1,938 |
| Interest rate swaps | — | | | 2,041 | | | — | | | 2,041 | |
| Commodity contract derivatives | — |
| | 3 |
| | 131 |
| | 134 |
| Commodity contract derivatives | — | | | 3 | | | — | | | 3 | |
Commodity derivatives under FTP(2) | |
| | |
| | |
| | |
| |
| Swap contracts | — |
| | 9 |
| | — |
| | 9 |
| |
| Total | $ | — |
| | $ | 2,112 |
| | $ | 131 |
| | $ | 2,243 |
| Total | $ | — | | | $ | 2,253 | | | $ | — | | | $ | 2,253 | |
Notes
(1) Includes government-sponsored entities.
(2) Includes both U.S. and foreign debt.
(3) Certain investments that are measured at fair value using the net asset valueNAV per share (or its equivalent) practical expedient have not been categorized in the fair value hierarchy. The fair value amounts presented in this table are intended to permit reconciliation of the fair value hierarchy to the amounts presented inon the consolidated balance sheets.Consolidated Balance Sheets.
(2) Due to the right of setoff and method of settlement, TVA elects to record commodity derivatives under the FTP based on its net commodity position with the counterparty or FCM. Deposits are made to TVA's margin cash accounts held with each FCM to offset any net liability positions in full for derivatives that are transacted with FCMs.(4) TVA records currency swaps net of any cash collateral received from or paid to the counterparty, to the extent such amount is not recorded in Accounts payable and accrued liabilities. See Note 15 16 — Risk Management Activities and Derivative Transactions — Offsetting of Derivative Assets and Liabilities.
TVA uses internal valuation specialists for the calculation of its commodity contract derivatives fair value measurements classified as Level 3. Analytical testing is performed on the change in fair value measurements each period to ensure the valuation is reasonable based on changes in general market assumptions. Significant changes to the estimated data used for unobservable inputs, in isolation or combination, may result in significant variations to the fair value measurement reported.
The following table presents a reconciliation of all commodity contract derivatives measured at fair value on a recurring basis using significant unobservable inputs (Level 3):
| | | | | |
Fair Value Measurements Using Significant Unobservable Inputs (in millions) |
| Commodity Contract Derivatives(1) |
| Balance at October 1, 2019 | $ | (4) | |
| |
| |
| |
| Settlements | (1) | |
| Change in net unrealized gains (losses) deferred as regulatory assets and liabilities | 5 | |
| Balance at September 30, 2020 | $ | — | |
| |
| |
| |
| |
| |
| |
|
| | | |
| Fair Value Measurements Using Significant Unobservable Inputs |
| | Commodity Contract Derivatives |
| Balance at October 1, 2015 | $ | (98 | ) |
| Purchases | — |
|
| Issuances | — |
|
| Sales | — |
|
| Settlements | — |
|
| Change in net unrealized gains (losses) deferred as regulatory assets and liabilities | (29 | ) |
| Balance at September 30, 2016 | (127 | ) |
| | |
| Purchases | — |
|
| Issuances | — |
|
| Sales | — |
|
| Settlements | — |
|
| Change in net unrealized gains (losses) deferred as regulatory assets and liabilities | 60 |
|
| Balance at September 30, 2017 | $ | (67 | ) |
The following table presents quantitative information related to(1) During the fourth quarter of 2020, TVA discontinued derivative accounting for forward coal contracts. Therefore, the fair value measurement using significant unobservable inputs used in the measurement of fair value of TVA's assetswas 0 at September 30, 2020, and liabilities classified as Level 3 in the fair value hierarchy:September 30, 2021.
|
| | | | | | | | | |
Quantitative Information about Level 3 Fair Value Measurements |
| | Fair Value at September 30 2017 | | Valuation Technique(s) | | Unobservable Inputs | | Range |
| Assets | | | | | | | |
| Commodity contract derivatives | $ | 2 |
| | Pricing model | | Coal supply and demand | | 0.6 - 0.7 billion tons/year |
| | | | | | Long-term market prices | | $11.40 - $112.23/ton |
| | | | | | | | |
| Liabilities | | | | | | | |
| Commodity contract derivatives | $ | 69 |
| | Pricing model | | Coal supply and demand | | 0.6 - 0.7 billion tons/year |
| | | | | | Long-term market prices | | $11.40 - $112.23/ton |
|
| | | | | | | | | |
Quantitative Information about Level 3 Fair Value Measurements |
| | Fair Value at September 30 2016 | | Valuation Technique(s) | | Unobservable Inputs | | Range |
| Assets | | | | | | | |
| Commodity contract derivatives | $ | 4 |
| | Pricing model | | Coal supply and demand | | 0.7 - 0.8 billion tons/year |
| | | | | | Long-term market prices | | $11.80 - $85.02/ton |
| | | | | | | | |
| Liabilities | | | | | | | |
| Commodity contract derivatives | $ | 131 |
| | Pricing model | | Coal supply and demand | | 0.7 - 0.8 billion tons/year |
| | | | | | Long-term market prices | | $11.80 - $85.02/ton |
Other Financial Instruments Not Recorded at Fair Value
TVA uses the methods and assumptions described below to estimate the fair valuesvalue of each significant class of financial instrument.instruments. The fair value of the financial instruments held at September 30, 2017,2021 and 2016,2020, may not be representative of the actual gains or losses that will be recorded when these instruments mature or are called or presented for early redemption. The estimated values of TVA's financial instruments not recorded at fair value at September 30, 2017,2021 and 2016,2020, were as follows:
| | | | | | | | | | | | | | | | | | | | | | | | | | | | | |
Estimated Values of Financial Instruments Not Recorded at Fair Value (in millions) |
| | | | At September 30, 2021 | | At September 30, 2020 |
| | Valuation Classification | | Carrying
Amount | | Fair
Value | | Carrying
Amount | | Fair
Value |
EnergyRight® receivables, net (including current portion) | Level 2 | | $ | 72 | | | $ | 71 | | | $ | 87 | | | $ | 86 | |
| | | | | | | | | |
| Loans and other long-term receivables, net (including current portion) | Level 2 | | 99 | | | 94 | | | 105 | | | 93 | |
| | | | | | | | | |
EnergyRight® financing obligations (including current portion) | Level 2 | | 82 | | | 92 | | | 97 | | | 108 | |
| | | | | | | | | |
| Unfunded loan commitments | Level 2 | | — | | | 3 | | | — | | | 2 | |
| | | | | | | | | |
| Membership interests of VIEs subject to mandatory redemption (including current portion) | Level 2 | | 23 | | | 30 | | | 26 | | | 35 | |
| | | | | | | | | |
| Long-term outstanding power bonds, net (including current maturities) | Level 2 | | 18,485 | | | 24,309 | | | 19,743 | | | 26,630 | |
| | | | | | | | | |
| Long-term debt of VIEs, net (including current maturities) | Level 2 | | 1,049 | | | 1,307 | | | 1,089 | | | 1,419 | |
| | | | | | | | | |
| | | | | | | | | |
|
| | | | | | | | | | | | | | | | | |
| Estimated Values of Financial Instruments Not Recorded at Fair Value |
| | | | At September 30, 2017 | | At September 30, 2016 |
| | Valuation Classification | | Carrying Amount | | Fair Value | | Carrying Amount | | Fair Value |
EnergyRight® receivables (including current portion) | Level 2 | | $ | 125 |
| | $ | 127 |
| | $ | 141 |
| | $ | 144 |
|
| | | | | | | | | | |
| Loans and other long-term receivables, net (including current portion) | Level 2 | | $ | 118 |
| | $ | 107 |
| | $ | 141 |
| | $ | 130 |
|
| | | | | | | | | | |
EnergyRight® financing obligation (including current portion) | Level 2 | | $ | 144 |
| | $ | 161 |
| | $ | 163 |
| | $ | 183 |
|
| | | | | | | | | | |
| Unfunded loan commitments | Level 2 | | $ | — |
| | $ | 18 |
| | $ | — |
| | $ | 17 |
|
| | | | | | | | | | |
| Membership interests of variable interest entity subject to mandatory redemption (including current portion) | Level 2 | | $ | 32 |
| | $ | 41 |
| | $ | 35 |
| | $ | 46 |
|
| | | | | | | | | | |
| Long-term outstanding power bonds (including current maturities), net | Level 2 | | $ | 21,933 |
| | $ | 26,857 |
| | $ | 22,456 |
| | $ | 28,620 |
|
| | | | | | | | | | |
| Long-term debt of variable interest entities (including current maturities), net | Level 2 | | $ | 1,200 |
| | $ | 1,356 |
| | $ | 1,234 |
| | $ | 1,468 |
|
| | | | | | | | | | |
| Long-term notes payable (including current maturities) | Level 2 | | $ | 122 |
| | $ | 121 |
| | $ | 75 |
| | $ | 75 |
|
Due to the short-term maturityThe carrying value of Cash and cash equivalents, Restricted cash and investments,cash equivalents, Accounts receivable, net, and Short-term debt, net (each considered a Level 1 valuation classification), the carrying amounts of these instruments approximate their fair values.
The fair value for loans and other long-term receivables is estimated by determining the present value of future cash flows using a discount rate equal to lending rates for similar loans made to borrowers with similar credit ratings and for similar remaining maturities, where applicable.
The fair value of long-term debt traded in the public market is determined by multiplying the par value of the debt by the indicative market price at the balance sheet date. The fair value of other long-term debt and membership interests of variable interest entitiesVIEs subject to mandatory redemption is estimated by determining the present value of future cash flows using current market rates for similar obligations, giving effect to credit ratings and remaining maturities.
17.18. Revenue
Revenue from Sales of Electricity
TVA's revenue from contracts with customers is primarily derived from the generation and sale of electricity to its customers and is included in Revenue from sales of electricity on the Consolidated Statements of Operations. Electricity is sold primarily to LPCs for distribution to their end-use customers. In addition, TVA sells electricity to directly served industrial companies, federal agencies, and others.
| | | | | |
| LPC sales | Approximately 92 percent of TVA's revenue from sales of electricity for the year ended September 30, 2021 was to LPCs, which then distribute the power to their customers using their own distribution systems. Power is delivered to each LPC at delivery points within the LPC's service territory. TVA recognizes revenue when the customer takes possession of the power at the delivery point. For power sales, the performance obligation to deliver power is satisfied in a series over time because the sales of electricity over the term of the customer contract are a series of distinct goods that are substantially the same and have the same pattern of transfer to the customer. TVA has no continuing performance obligations subsequent to delivery. Using the output method for revenue recognition provides a faithful depiction of the transfer of electricity as customers obtain control of the power and benefit from its use at delivery. Additionally, TVA has an enforceable right to consideration for energy delivered at any discrete point in time and will recognize revenue at an amount that reflects the consideration to which TVA is entitled for the energy delivered.
The amount of revenue is based on contractual prices approved by the TVA Board. Customers are invoiced monthly for power delivered as measured by meters located at the delivery points. The net transaction price is offset by certain credits available to customers that are known at the time of billing. Credits are designed to achieve objectives of the TVA Act and include items such as hydro preference credits for residential customers of LPCs, economic development credits to promote growth in the Tennessee Valley, wholesale bill credits to maintain long-term partnerships with LPCs, pandemic credits created to support LPCs and strengthen the public power response to the COVID-19 pandemic, and demand response credits allowing TVA to reduce industrial customer usage in periods of peak demand to balance system demand. Payments are typically due within approximately one month of invoice issuance. |
|
| Directly served customers | Directly served customers, including industrial customers, federal agencies, and other customers, take power for their own consumption. Similar to LPCs, power is delivered to a delivery point, at which time the customer takes possession and TVA recognizes revenue. For all power sales, the performance obligation to deliver power is satisfied in a series over time since the sales of electricity over the term of the customer contract are a series of distinct goods that are substantially the same and have the same pattern of transfer to the customer. TVA has no continuing performance obligations subsequent to delivery. Using the output method for revenue recognition provides a faithful depiction of the transfer of electricity as customers obtain control of the power and benefit from its use at delivery. Additionally, TVA has an enforceable right to consideration for energy delivered at any discrete point in time and will recognize revenue at an amount that reflects the consideration to which TVA is entitled for the energy delivered.
The amount of revenue is based on contractual prices approved by the TVA Board. Customers are invoiced monthly for power delivered as measured by meters located at the delivery points. The net transaction price is offset by certain credits available to customers that are known at the time of billing. Examples of credits include items such as economic development credits to promote growth in the Tennessee Valley, pandemic credits created to support directly served customers in response to the COVID-19 pandemic, and demand response credits allowing TVA to reduce industrial customer usage in periods of peak demand to balance system demand. Payments are typically due within approximately one month of invoice issuance. |
Other Revenue
Other revenue consists primarily of wheeling and network transmission charges, sales of excess steam that is a by-product of power production, delivery point charges for interconnection points between TVA and the customer, and certain other ancillary goods or services.
Disaggregated Revenues
During 2021, revenues generated from TVA's electricity sales were $10.4 billion and accounted for virtually all of TVA's revenues. TVA's operating revenues by state for each of the last three years are detailed in the table below:
| | | | | | | | | | | | | | | | | |
Operating Revenues By State For the years ended September 30 (in millions) |
| | 2021 | | 2020 | | 2019 |
| Alabama | $ | 1,508 | | | $ | 1,439 | | | $ | 1,593 | |
| Georgia | 254 | | | 249 | | | 270 | |
| Kentucky | 655 | | | 624 | | | 691 | |
| Mississippi | 984 | | | 941 | | | 1,063 | |
| North Carolina | 66 | | | 65 | | | 74 | |
| Tennessee | 6,841 | | | 6,740 | | | 7,419 | |
| Virginia | 42 | | | 42 | | | 45 | |
| Subtotal | 10,350 | | | 10,100 | | | 11,155 | |
| Off-system sales | 7 | | | 4 | | | 4 | |
| | | | | |
| Revenue from sales of electricity | 10,357 | | | 10,104 | | | 11,159 | |
| Other revenue | 146 | | | 145 | | | 159 | |
| Total operating revenues | $ | 10,503 | | | $ | 10,249 | | | $ | 11,318 | |
TVA's operating revenues by customer type for each of the last three years are detailed in the table below:
| | | | | | | | | | | | | | | | | |
Operating Revenues by Customer Type For the years ended September 30 (in millions) |
| | 2021 | | 2020 | | 2019 |
| Revenue from sales of electricity | | | | | |
| Local power companies | $ | 9,534 | | | $ | 9,406 | | | $ | 10,351 | |
| Industries directly served | 707 | | | 588 | | | 686 | |
| Federal agencies and other | 116 | | | 110 | | | 122 | |
| | | | | |
| Revenue from sales of electricity | 10,357 | | | 10,104 | | | 11,159 | |
| Other revenue | 146 | | | 145 | | | 159 | |
| Total operating revenues | $ | 10,503 | | | $ | 10,249 | | | $ | 11,318 | |
TVA and LPCs continue to work together to meet the changing needs of consumers around the Tennessee Valley. In 2019, the TVA Board approved a Partnership Agreement option that better aligns the length of LPC power contracts with TVA's long-term commitments. Under the partnership arrangement, the LPC power contracts automatically renew each year and have a 20-year termination notice. The partnership arrangements can be terminated under certain circumstances, including TVA's failure to limit rate increases as provided for in the agreements going forward. Participating LPCs receive benefits including a 3.1 percent wholesale bill credit in exchange for their long-term commitment, which enables TVA to recover its long-term financial commitments over a commensurate period. The total wholesale bill credits to LPCs participating in the long-term Partnership Agreement were $189 million, $163 million, and $14 million, respectively, for the years ended September 30, 2021, 2020, and 2019. In June 2020, TVA provided participating LPCs a flexibility option that allows them to locally generate or purchase up to approximately five percent of average total hourly energy sales over 2015 - 2019 in order to meet their individual customers' needs. As of November 12, 2021, 145 LPCs had signed the 20-year Partnership Agreement with TVA, and 74 LPCs had signed a Flexibility Agreement.
In August 2020, the TVA Board approved a Pandemic Relief Credit that was effective for 2021. The 2.5 percent monthly base rate credit, which totaled $221 million for 2021, applied to service provided to TVA's LPCs, their large commercial and industrial customers, and TVA directly served customers through September 2021. In August 2021, the TVA Board approved a 2.5 percent monthly base rate credit, the Pandemic Recovery Credit, which will be effective for 2022. The credit, expected to approximate $220 million, will also apply to service provided to TVA's LPCs, their large commercial and industrial customers, and TVA directly served customers. In November 2021, the TVA Board approved a 1.5 percent monthly base rate credit, which is an extension of the Pandemic Recovery Credit, to be effective for 2023. The 2023 credit is expected to approximate $133 million, and it will be administered in a manner similar to the Pandemic Recovery Credit.
The number of LPCs by contract arrangement, the revenues derived from such arrangements for 2021, and the percentage those revenues comprised of TVA's total operating revenues for 2021, are summarized in the table below:
| | | | | | | | | | | | | | | | | |
TVA Local Power Company Contracts
At or for the year ended September 30, 2021 |
Contract Arrangements(1) | Number of LPCs | | Revenue from Sales of Electricity to LPCs
(in millions) | | Percentage of Total Operating Revenues |
| 20-year termination notice | 145 | | | $ | 7,987 | | | 76.0 | % |
| | | | | |
| | | | | |
| 5-year termination notice | 8 | | | 1,547 | | | 14.7 | % |
| Total | 153 | | | $ | 9,534 | | | 90.7 | % |
Note
(1) Ordinarily, the LPCs and TVA have the same termination notice period; however, in a contract with one of the LPCs with a five-year termination notice, TVA has a 10-year termination notice (which becomes a five-year termination notice if TVA loses its discretionary wholesale rate-setting authority). Certain LPCs have five-year termination notices or a shorter period if any act of Congress, court decision, or regulatory change requires or permits that election.
TVA's two largest LPCs — MLGW and Nashville Electric Service ("NES") — have contracts with a five-year and a 20-year termination notice period, respectively. Sales to MLGW and NES accounted for 9 percent and 8 percent, respectively, of TVA's total operating revenues in 2021, 2020, and 2019. Certain LPCs, including MLGW, are evaluating options for future energy choices. In addition, in January 2021, four LPCs filed a complaint and petition with the Federal Energy Regulatory Commission ("FERC") asking FERC to order TVA to provide transmission and interconnection service to the LPCs or other suppliers that want to serve them. In August 2021, one of the LPCs notified FERC of its withdrawal from the complaint and petition. The remaining three LPCs account for 3 percent of TVA's total operating revenues for the year ended September 30, 2021. See Note 23 — Commitments and Contingencies — Legal Proceedings — Challenge to Anti-Cherrypicking Amendment for updates to this legal proceeding.
Contract Balances
Contract assets represent an entity's right to consideration in exchange for goods and services that the entity has transferred to customers. TVA does not have any material contract assets at September 30, 2021.
Contract liabilities represent an entity's obligations to transfer goods or services to customers for which the entity has received consideration (or an amount of consideration is due) from the customers. These contract liabilities are primarily related to upfront consideration received prior to the satisfaction of the performance obligation. See Economic Development Incentives below.
Economic Development Incentives. Under certain economic development programs TVA offers incentives to existing and potential power customers in targeted business sectors that make multi-year commitments to invest in the Tennessee Valley. TVA records those incentives as reductions of revenue. Incentives recorded as a reduction to revenue were $315 million, $318 million, and $310 million for 2021, 2020, and 2019, respectively. Incentives that have been approved but have not been paid are recorded in Accounts payable and accrued liabilities and Other long-term liabilities on the Consolidated Balance Sheets. At September 30, 2021 and 2020, the outstanding unpaid incentives were $176 million and $172 million, respectively. Incentives that have been paid out may be subject to claw back if the customer fails to meet certain program requirements. In May 2020, TVA established flexibility provisions to support the continued operations and recovery of participating customers experiencing financial and operational hardships as a result of the COVID-19 pandemic and corresponding economic downturn. These provisions were made available through the December 2020 application period, which provided flexibility to customers through 2021. The provisions did not have a material impact to TVA.
19. Proprietary Capital
Appropriation Investment
TVA’sTVA's power program and stewardship (nonpower) programs were originally funded primarily by appropriations from Congress. In 1959, Congress passed an amendment to the TVA Act that required TVA’sTVA's power program to be self-financing from power revenues and proceeds from power program financings. While TVA’sTVA's power program did not directly receive appropriated funds after it became self-financing, TVA continued to receive appropriations for certain multipurpose and other nonpower mission-related activities as well as for its stewardship activities. TVA has not received any appropriations from Congress for any activities since 1999, and since that time, TVA has funded stewardship program activities primarily with power revenues.
The 1959 amendment to the TVA Act also required TVA, beginning in 1961, to make annual payments to the U.S. Treasury from net power proceeds as a repayment of and as a return on the Power Program Appropriation Investment until a total of $1.0$1.0 billion of the Power Program Appropriation Investment has been repaid in accordance with the 1959 amendment. TVA fulfilled its requirement to repay $1.0$1.0 billion of the Power Program Appropriation Investment in 2014. The TVA
Act requires TVA to continue making payments to the U.S. Treasury as a return on the remaining $258$258 million of the Power Program Appropriation Investment.
The table below summarizes TVA's activities related to appropriated funds and retained earnings.
| | | | | | | | | | | | | | | | | | | | | | | |
Summary of Proprietary Capital Activity At or for the years ended September 30 |
| | 2021 | | 2020 |
| Power Program | | Nonpower
Programs | | Power Program | | Nonpower
Programs |
| Appropriation Investment | $ | 258 | | | $ | 4,351 | | | $ | 258 | | | $ | 4,351 | |
| Proprietary Capital | | | | | | | |
| Balance at beginning of year | 12,177 | | | (3,803) | | | 10,823 | | | (3,795) | |
| Net income (loss) for year | 1,520 | | | (8) | | | 1,360 | | | (8) | |
| Return on power program appropriation investment | (4) | | | — | | | (6) | | | — | |
Implementation of new accounting standard(1) | (4) | | | — | | | — | | | — | |
| Balance at end of year | 13,689 | | | (3,811) | | | 12,177 | | | (3,803) | |
| Net proprietary capital at September 30 | $ | 13,947 | | | $ | 540 | | | $ | 12,435 | | | $ | 548 | |
|
| | | | | | | | | | | | | | | |
Summary of Proprietary Capital Activity At or for the years ended September 30 |
| | 2017 | | 2016 |
| | Power Program | | Nonpower Programs | | Power Program | | Nonpower Programs |
Appropriation Investment
| $ | 258 |
| | $ | 4,351 |
| | $ | 258 |
| | $ | 4,351 |
|
| Retained Earnings | |
| | |
| | |
| | |
|
| Balance at beginning of year | 7,594 |
| | (3,771 | ) | | 6,357 |
| | (3,761 | ) |
| Net income (expense) for year | 693 |
| | (8 | ) | | 1,243 |
| | (10 | ) |
| Return on power program appropriation investment | (5 | ) | | — |
| | (6 | ) | | — |
|
| Balance at end of year | 8,282 |
| | (3,779 | ) | | 7,594 |
| | (3,771 | ) |
| Net proprietary capital at September 30 | $ | 8,540 |
| | $ | 572 |
| | $ | 7,852 |
| | $ | 580 |
|
(1) See Note 2 — Impact of New Accounting Standards and Interpretations.
Payments to the U.S. Treasury
TVA paid the U.S. Treasury $5$4 million, in 2017,$6 million, and $6 million in 2016,2021, 2020, and $5 million in 20152019, respectively, as a return on the Power Program Appropriation Investment. The amount of the return on the Power Program Appropriation Investment is based on the Power Program Appropriation Investment balance at the beginning of that year and the computed average interest rate payable by the U.S. Treasury on its total marketable public obligations at the same date. The interest rates payable by TVA on the Power Program Appropriation Investment were 2.001.64 percent,, 2.04 2.44 percent,, and 2.042.37 percent for 2017, 2016,2021, 2020, and 2015,2019, respectively.
Accumulated Other Comprehensive Income (Loss)
The items included in AOCI consist of market valuation adjustments for certain derivative instruments. See Note 15.16 — Risk Management Activities and Derivative Transactions.
TVA records exchange rate gains and losses on debt and related accrued interest in net income and marks its currency swap assets and liabilities to market through OCI. TVA hadrecognized unrealized gains (losses) of $59$126 million and $(139)$(1) million in 20172021 and 2016,2020, respectively, into AOCI on the mark-to-marketMtM of currency swaps. TVA then reclassifiesreclassified an amount out of AOCI into net income, offsetting the gain/loss from recording the exchange gain/loss on the debt.debt and related accrued interest. The amounts reclassified from OCI into net income resulted in increases (decreases) to net income of $26$97 million, $(129)$38 million, and $(65)$(45) million in 2017, 2016,2021, 2020, and 2015,2019, respectively. These reclassifications, coupled with the recording of the exchange gain/loss on the debt and related accrued interest, did not have an impact on net income in 2017, 2016,2021, 2020, and 2015.2019. Based on forecasted foreign currency exchange rates, TVA expects to reclassify approximately $18$25 million of lossesgains from AOCI to interest expense within the next twelve12 months to offset amounts anticipated to be recorded in interest expense related to exchange gain on the debt.debt and related accrued interest.
18.20. Other Income (Expense), Net
Income and expenses not related to TVA’sTVA's operating activities are summarized in the following table:
| | | | | | | | | | | | | | | | | |
Other Income (Expense), Net For the years ended September 30 |
| | 2021 | | 2020 | | 2019 |
| Bellefonte | $ | (28) | | | $ | — | | | $ | 21 | |
| Interest income | 12 | | | 18 | | | 25 | |
| External services | 13 | | | 12 | | | 13 | |
| Gains (losses) on investments | 16 | | | 9 | | | 3 | |
| Miscellaneous | — | | | (3) | | | — | |
| Total other income (expense), net | $ | 13 | | | $ | 36 | | | $ | 62 | |
During 2021, TVA made a $28 million court directed payment related to the sale of Bellefonte. In 2019, the purchaser, Nuclear Development, LLC ("Nuclear Development"), failed to fulfill the requirements of the sales contract with respect to obtaining NRC approval of the transfer of required nuclear licenses and payment of the remainder of the selling price before the November 30, 2018 closing date. In August 2021, the court found that, under the contract's termination provision, Nuclear Development was entitled to have TVA return Nuclear Development's down payment and its payment of compensated costs, along with prejudgment interest, which was fully paid in 2021. See Note 23 — Commitments and Contingencies — Legal Proceedings — Case Involving Bellefonte Nuclear Plant for a discussion of the lawsuit filed by Nuclear Development.
|
| | | | | | | | | | | |
Other Income (Expense), Net For the years ended September 30 |
| | 2017 | | 2016 | | 2015 |
| Interest income | $ | 23 |
| | $ | 24 |
| | $ | 24 |
|
| External services | 14 |
| | 12 |
| | 12 |
|
| Gains (losses) on investments | 9 |
| | 7 |
| | (1 | ) |
| Miscellaneous | 10 |
| | — |
| | (6 | ) |
| Total other income (expense), net | $ | 56 |
| | $ | 43 |
| | $ | 29 |
|
19.21. Supplemental Cash Flow Information
Interest paid was $1.3$1.1 billion, $1.1 billion, and $1.2 billion for 2017,2016,2021, 2020, and 2015.2019, respectively. These amounts differ from interest expense in certain years due to the timing of payments andpayments. There was no interest capitalized of $235 million in 2016 and $214 million in 2015 as a part of major capital expenditures. 2021, 2020, or 2019.
Construction in progress and Nuclear fuel expenditures included in Accounts payable and accrued liabilities at September 30, 2017, 2016,2021, 2020, and 20152019 were $425$637 million, $526$398 million, and $530$324 million,, respectively, and are excluded from the Statements of Consolidated Cash Flows for the years ended September 30, 2017, 2016,2021, 2020, and 20152019 as non-cash investing activities.
Excluded from the Statements of Consolidated Cash Flows for the year ended September 30, 2021, were non-cash investing and financing activities of $233 million related primarily to an increase in lease assets and liabilities incurred for a finance lease that was amended in March 2021. Excluded from the Statement of Consolidated Cash Flows for the years ended September 30, 2017, 2016,2020 and 20152019, as non-cash financing activities were capital$394 million related to lease obligations incurred primarily in connection with a PPA and $10 million related to purchase power assets of $10 million, $81 million, and less than $1 million,lease obligations incurred for leased equipment, respectively. See Note 8 — Leases for further information regarding TVA's finance leases. Also excluded from the Statement of Consolidated Cash Flows for the yearsyear ended September 30, 2017 and 20162020, were $74$80 million and $78$73 million as non-cash financing and investing activities, respectively, due to derecognition of notes payable related to TVA's acquisition of equity interests in certain SPEs. See Note 9. the Paradise pipeline financing obligation and asset.
Cash flows from futures contracts, forward contracts, option contracts, and swap contracts that are accounted for as hedges are classified in the same category as the item being hedged or on a basis consistent with the nature of the instrument.
20.22. Benefit Plans
TVA sponsors a qualified defined benefit plan (“("pension plan”plan") that covers most of its full-time employees hired prior to July 1, 2014, a qualified defined contribution plan (“("401(k) plan”plan") that covers most of its full-time employees, two unfunded post-retirement health care plans that provide for non-vested contributions toward the cost of eligible retirees' medical coverage, other postemploymentpost-employment benefits such as workers' compensation, and the SERP. The pension plan and the 401(k) plan are administered by a separate legal entity, the TVA Retirement System (“TVARS”("TVARS"), which is governed by its own board of directors (the "TVARS Board").
Overview of Plans and Benefits
Retirement Plans. The participants in the pension plan receive either a traditional final average pay pension or a cash balance pension. The traditional pension benefit is based on the participant’sparticipant's creditable service, average monthly salary for their highest three consecutive years of eligible compensation, and a pension factor based on the participant’sparticipant's age and years of service, less a Social Security offset. The cash balance pension benefit is based on pay and interest credits accumulated in the participant’sparticipant's account and the participant’sparticipant's age.
Participants in the pension plan are also eligible to receive 401(k) plan matching contributions, may be eligible to receive 401(k) plan non-elective contributions, and may also be eligible to make after-tax contributions of up to $10,000 per year to TVARS,
the pension plan, which at the election of the participant are invested in either the fixed fund, which receives a fixed interest rate set forth in the plan, or the variable fund, which receives a rate of return based on an S&P 500 index fund. Participants in the pension plan may also become eligible for a supplemental pension benefit based on age and years of service at retirement, which is provided to help offset the cost of retiree medical insurance. Employees first hired on or after July 1, 2014, are participants in the 401(k) plan only and receive both nonelectivenon-elective and matching contributions to their accounts in the 401(k) plan.
On August 8, 2016, the TVARS Board approved amendments to the pension plan and 401(k) Plan. Under the 401(k) plan, and these amendments were also approved by the TVA Board on August 25, 2016. The amendments, which became effective on October 1, 2016, changed future retirement benefits for employees and retirees and made certain other changes regarding TVA's minimum funding requirements to the pension plan and plan governance. With respect to current cash balance participants in the pension plan, these amendments shift future benefit accruals from the cash balance pension to the 401(k) plan based on hire date and years of service as of October 1, 2016. For cash balance participants first hired on or after January 1, 1996, and
having more than 10 years of service as of October 1, 2016, participants will begin receiving nonelective contributions to their accounts in the 401(k) plan and reduced pay credits to their cash balance accounts in the pension plan. For cash balance participants first hired on or after January 1, 1996, and having less than 10 years of service as of October 1, 2016, participants will begin receiving nonelective contributions and higher matching contributions to their accounts in the 401(k) plan and will no longer receive pay credits to their cash balance accounts; however, their cash balance accounts will continue to receive interest credits.
The amendments also made the following additional benefit changes: reducing the future cash balance interest crediting rate and the fixed fund interest rate with a floor and ceiling based on the assumed rate of investment return on TVARS assets; closing the fixed and variable funds to new contributions from pension plan participants first hired on or after January 1, 1996; reducing the rate of future cost-of-living-adjustments (“COLAs”) while increasing the maximum eligible COLA; vesting COLAs; increasing the eligibility age for COLAs for pension plan participants under age 50; restricting COLAs to pension amounts based on compensation up to Executive Level IV; eliminating future COLAs to SERP participants with less than 10 years of service; and capping the maximum supplemental benefit amounts.
The amendments also changed the annual minimum contribution required by TVA to the pension plan to the greater of (a) the minimum contribution calculated by TVARS’s actuary according to the TVARS Rules and Regulations, or (b) $300 million, for a period of 20 years (from 2017 through 2036) or, if earlier, through the fiscal year in which the plan reaches and remains at a 100 percent funded status under the actuarial rules applicable to TVARS.
401(k) Plan Contributions. TVA made non-elective and matching contributions TVA makes to participant accounts depends on the employee's hire date, years of service, and individual elections. Non-elective employer contributions for eligible participants range from three percent to six percent and matching employer contributions range from 1.5 percent to six percent. TVA recognized 401(k) plancontribution costs of approximately $80$92 million, $88 million, and $84 million during 2017, $38 million during 2016,2021, 2020, and $36 million during 2015.2019, respectively. The 2022 plan contribution costs are estimated to be approximately $97 million.
Supplemental Executive Retirement Plan. TVA has established a SERP for certain executives in critical positions to provide supplemental pension benefits tied to compensation that exceeds limits imposed by IRS rules applicable to the qualified defined benefit pension plan.
Other Post-Retirement Benefits. TVA sponsors two unfunded post-retirement benefit plans that provide for non-vested contributions toward the cost of certain eligible retirees’retirees' medical coverage. The first plan covers only certain retirees and surviving dependents who do not qualify for TVARS benefits, including the supplemental pension benefit. The second plan is designed to place a limit on the out-of-pocket amount certain eligible retirees pay for medical coverage and provides a credit based on years of TVA service and monthly base pension amount, reduced by any TVARS supplemental pension benefits or any TVA contribution from the first plan, described above. Effective January 2017, all Medicare-eligible retirees and spouses were provided Medicare supplement coverage through a private exchange. Transition to the exchange does not affect any TVARS supplemental benefits for eligible retirees, and the credit will continue to be calculated in the same manner as before.
Other Post-Employment Benefits. TVA employees injured in work-related incidents are covered by the workers’workers' compensation program for federal employees administered through the Department of Labor by the Office of Workers’Workers' Compensation Programs in accordance with the provisions of Federal Employees' Compensation Act ("FECA").FECA. FECA provides compensation and medical benefits to federal employees for permanent and temporary disability due to employment-related injury or disease.
Accounting Mechanisms
Regulatory Accounting. TVA has classified all amounts related to unrecognized prior service costs,costs/(credits), net actuarial gains or losses, and the funded status as regulatory assets or liabilities as such amounts are probable of collection in future rates. Additionally, on October 1, 2014, TVA began recognizingrecognizes pension costs as regulatory assets or regulatory liabilities to the extent that the amount calculated under U.S. GAAP as pension expense differs from the amount TVA contributes to the pension plan.plan as pension plan contributions. As a result of plan design changes, future contributions are expected to exceed the expense calculated under U.S. GAAP. Accordingly, TVA will discontinue this regulatory accounting practice once all such deferred costs have been recovered, at which time it will recognize pension costs in accordance with U.S. GAAP.
Cost Method. TVA uses the projected unit credit cost method to determine the service cost and the projected benefit obligation for retirement, termination, and ancillary benefits. Under this method, a “projected"projected accrued benefit”benefit" is calculated at the beginning of the year and at the end of the year for each benefit that may be payable in the future. The “projected"projected accrued benefit”benefit" is based on the plan’splan's accrual formula and upon service at the beginning or end of the year, but it uses final average compensation, social security benefits, and other relevant factors projected to the age at which the employee is assumed to leave active service. The projected benefit obligation is the actuarial present value of the “projected"projected accrued benefits”benefits" at the beginning of the year for employed participants and is the actuarial present value of all benefits for other participants. The service cost is the actuarial present value of the difference between the “projected"projected accrued benefits”benefits" at the beginning and end of the year.
Amortization of Net Gain or Loss. TVA utilizes the corridor approach for gain/loss amortization. Differences between actuarial assumptions and actual plan results are deferred and amortized into periodic cost only when the accumulated differences exceed 10 percent of the greater of the projected benefit obligation or the market-related value of plan assets. If necessary, the excess is amortized over the average remaining service periodfuture expected working lifetime of participating employeesparticipants expected to receive benefits, under the plan, which is currently 10approximately 11 years for the pension plan and will continue to decline since no new participants will be added to12 years for the post-retirement plan.
Amortization of Prior Service Cost/(Credit). Amortization of net prior service cost/(credit) resulting from a plan change is included as a component of period expense in the year first recognized and every year thereafter until it is fully amortized. The increase or decrease in the benefit obligation due to the plan change is amortized over the average remaining service period of participating employees expected to receive benefits under the plan. The pension and post-retirement plans currently have prior service credits related tocosts/(credits) from plan changes made in 2009, 2010,2016, 2018, 2019, and 20162020 with remaining amortization periods of threeranging from one to teneight years. However, when a plan change reduces the benefit obligation, existing positive prior service costs are reduced or eliminated starting with the earliest established before a new prior service credit base is established.
Asset Method. TVA recognizes the impact ofMethod. TVA's asset performance on pension expense overmethod calculates a three-year phase-in period through a “market-related”market-related value of assets calculation. Since the “market-related” value of assets("MRVA") that recognizes realized and unrealized investment gains and losses over a three-yearthree-year smoothing period to decrease the future valuevolatility of assets will be impacted as previously deferred gains or losses are recognized.annual net periodic pension benefit costs. The “market-related” valueMRVA is used in calculatingto determine the expected return on plan assets, a component of net periodic pension benefit cost. The difference in the expected return on the MRVA and net gain or the actual return on the fair value on plan assets is recognized as an actuarial (gain)/loss forin the pension cost determination.benefit obligation at September 30. However, the MRVA has no impact on the fair value of plan assets measured at September 30.
Obligations and Funded Status
The actuarial results provided reflect data and assumptions appropriate for the purpose of the measurement of plan obligations and funded status for the year ended. Effects of COVID-19 on the financial markets, regulations, and experience are uncertain and still evolving. The ultimate impact of the COVID-19 pandemic on the pension plan and other post-retirement plans depends on factors beyond TVA's knowledge or control, including the duration and severity of this outbreak, actions taken to contain its spread and mitigate its effects, and broader impacts of the COVID-19 pandemic on the country and region's economy. Therefore, TVA cannot estimate the potential impact to the pension plan and other post-retirement plans at this time.
The changes in plan obligations, assets, and funded status for the years ended September 30, 20172021 and 2016,2020, were as follows:
| | | | | | | | | | | | | | | | | | | | | | | |
Obligations and Funded Status
For the years ended September 30 |
| 911,000,000 | | Pension Benefits | | Other Post-Retirement Benefits |
| | 2021 | | 2020 | | 2021 | | 2020 |
| Change in benefit obligation | | | | | | | |
| Benefit obligation at beginning of year | $ | 13,675 | | | $ | 13,312 | | | $ | 544 | | | $ | 499 | |
| Service cost | 57 | | | 55 | | | 18 | | | 16 | |
| Interest cost | 368 | | | 415 | | | 16 | | | 16 | |
| Plan participants' contributions | 5 | | | 6 | | | — | | | — | |
Collections(1) | — | | | — | | | 17 | | | 20 | |
| | | | | | | |
| Actuarial (gain) loss | (25) | | | 614 | | | (53) | | | 39 | |
| Plan change | — | | | 2 | | | — | | | — | |
| Net transfers (to) from variable fund/401(k) plan | 2 | | | 2 | | | — | | | — | |
| Expenses paid | (6) | | | (5) | | | — | | | — | |
| Benefits paid | (728) | | | (726) | | | (44) | | | (46) | |
| Benefit obligation at end of year | 13,348 | | | 13,675 | | | 498 | | | 544 | |
| | | | | | | |
| Change in plan assets | | | | | | | |
| Fair value of net plan assets at beginning of year | 7,959 | | | 7,980 | | | — | | | — | |
| Actual return on plan assets | 1,572 | | | 397 | | | — | | | — | |
| Plan participants' contributions | 5 | | | 6 | | | — | | | — | |
Collections(1) | — | | | — | | | 17 | | | 20 | |
| Net transfers (to) from variable fund/401(k) plan | 2 | | | 2 | | | — | | | — | |
| Employer contributions | 306 | | | 305 | | | 27 | | | 26 | |
| Expenses paid | (6) | | | (5) | | | — | | | — | |
| Benefits paid | (728) | | | (726) | | | (44) | | | (46) | |
| Fair value of net plan assets at end of year | 9,110 | | | 7,959 | | | — | | | — | |
| | | | | | | |
| Funded status | $ | (4,238) | | | $ | (5,716) | | | $ | (498) | | | $ | (544) | |
|
| | | | | | | | | | | | | | | |
Obligations and Funded Status For the years ended September 30 |
| | Pension Benefits | | Other Post-Retirement Benefits |
| | 2017 | | 2016 | | 2017 | | 2016 |
| Change in benefit obligation | | | | | | | |
| Benefit obligation at beginning of year | $ | 13,083 |
| | $ | 12,824 |
| | $ | 571 |
| | $ | 657 |
|
| Service cost | 60 |
| | 133 |
| | 18 |
| | 16 |
|
| Interest cost | 464 |
| | 564 |
| | 21 |
| | 29 |
|
| Plan participants’ contributions | 9 |
| | 25 |
| | — |
| | — |
|
Collections(1) | — |
| | — |
| | 47 |
| | 92 |
|
| Actuarial (gain) loss | (286 | ) | | 1,188 |
| | (80 | ) | | 68 |
|
| Plan change | — |
| | (960 | ) | | — |
| | (158 | ) |
| Net transfers (to) from variable fund/401(k) plan | (12 | ) | | 7 |
| | — |
| | — |
|
| Expenses paid | (5 | ) | | (6 | ) | | — |
| | — |
|
| Benefits paid | (712 | ) | | (692 | ) | | (83 | ) | | (133 | ) |
| Benefit obligation at end of year | 12,601 |
| | 13,083 |
| | 494 |
| | 571 |
|
| | | | | | | | |
| Change in plan assets | |
| | |
| | |
| | |
|
| Fair value of net plan assets at beginning of year | 7,145 |
| | 6,797 |
| | — |
| | — |
|
| Actual return on plan assets | 759 |
| | 733 |
| | — |
| | — |
|
| Plan participants’ contributions | 9 |
| | 25 |
| | — |
| | — |
|
Collections(1) | — |
| | — |
| | 47 |
| | 92 |
|
| Net transfers (to) from variable fund/401(k) plan | (12 | ) | | 7 |
| | — |
| | — |
|
Employer contributions(2) | 805 |
| | 281 |
| | 36 |
| | 41 |
|
| Expenses paid | (5 | ) | | (6 | ) | | — |
| | — |
|
| Benefits paid | (712 | ) | | (692 | ) | | (83 | ) | | (133 | ) |
| Fair value of net plan assets at end of year | 7,989 |
| | 7,145 |
| | — |
| | — |
|
| Funded status | $ | (4,612 | ) | | $ | (5,938 | ) | | $ | (494 | ) | | $ | (571 | ) |
NotesNote
(1) Collections include retiree contributions as well as federal reinsurance payments and provider discounts and rebates.
(2) Other Post-Retirement Benefits Employer contributions are reduced by federal reinsurance payments and provider discounts and rebates.
TheFor 2021, the $25 million pension benefit obligation actuarial gain for 2017is primarily reflects the impact ofdue to the increase in the discount rate from 3.652.75 percent to 3.852.90 percent, which decreased the liability by $292$248 million. In addition, gains of $117 million were due to mortality assumption changes. These gains wereThis gain was partially offset by $104 million of actuarial losses due to demographic and plan experience, and an actuarial loss of $91 million due to higher COLA and higher interest crediting rates than previously assumed for CY 2022, and a $119$28 million actuarial loss relateddue to a change inupdating to the assumption of participants’ benefit payment elections, based on recent plan experience.latest mortality improvement scale.
The 2016For 2020, the $614 million pension plan change was a result of the amendments to the TVA qualified defined benefit pension plan described above, which reduced the projected benefit obligation by $960 million and established an additional unrecognized prior service credit at September 30, 2016 to be amortized for approximately 11 years as a component of net periodic pension benefit cost.
The $1.2 billion pension actuarial loss for 2016 wasis primarily due to the decrease in the discount rate from 4.503.20 percent to 3.652.75 percent, which increased the projected benefit obligationliability by $1.4 billion. This$714 million. In addition, TVA recognized $74 million of actuarial losses due to demographic and plan experience, and an actuarial loss wasof $32 million due to the assumption change of elections for lump sum payments based upon an updated actuarial study. These actuarial losses were partially offset by a $137 million gain due to mortality assumption changes forand a $69 million gain due to a lower COLA than previously assumed. The 2020 plan change of $2 million was due to the COLA of $168 millionplan change in the interest rate and for mortality of $133 millionbasis used to better reflect anticipated future plan experience.determine SERP retirement payments.
The other post-retirement actuarial gain for 2017 was2021 decreased the benefit obligation by $53 million. TVA recognized a $47 million actuarial gain primarily due to lower per capita claims costs which decreasedthan previously assumed net of the liability by $66 million. In addition, gains of $18 million were due to an increase in the discount rate from 3.70 percent to 3.95 percent, and gains of $6 million resultedloss from the updated mortality assumption. These gains were slightly offset by a change in the pre-Medicare eligible per capita contributions trend rate primarily drivenassumption. In addition, TVA recognized a $7 million gain due to demographic and plan experience, partially offset by recent increases in prescription drug costs.a $1 million loss due to updating to the latest mortality improvement scale.
The 2016 post-retirement plan change was a result of transitioning all Medicare eligible retirees and spouses to a private exchange effective January 2017, which reduced the projected benefit obligation by $158 million.
The other post-retirement actuarial loss for 2016 was primarily2020 increased the benefit obligation by $39 million. TVA recognized a $30 million loss due to the updated plan assumptions related to the election rate for pre-Medicare retirees, assumed per capita claims costs, and expected retiree contributions to reflect observed and anticipated plan experience. In addition, TVA recognized a $20 million loss due to the decrease in the discount rate from 4.653.30 percent to 3.703.05 percent, which increased the liability by $91 million. Theand a $4 million loss wasdue to actual experience different from assumed. These losses were partially offset by a gain of $17$15 million due to demographic experience relatedthe updated post-Medicare trend rate assumption attributable to updated per capita costs and retiree contributions, and a gain of $7 million related to assumption changes for mortality to better reflect anticipated future plan experience.lower than expected premium increases on the private exchange.
Amounts related to these benefit plans recognized on TVA's consolidated balance sheetsConsolidated Balance Sheets consist of regulatory assets and liabilities that have not been recognized as components of net periodic benefit cost at September 30, 20172021 and 2016,2020, and the funded status of TVA’sTVA's benefit plans, which are included in Accounts payable and accrued liabilities and Post-retirement and post-employment benefit obligations:
| | Amounts Recognized on TVA's Consolidated Balance Sheets At September 30 | Amounts Recognized on TVA's Consolidated Balance Sheets At September 30 | Amounts Recognized on TVA's Consolidated Balance Sheets At September 30 |
| | Pension Benefits | | Other Post-Retirement Benefits | | Pension Benefits | | Other Post-Retirement Benefits |
| | 2017 | | 2016 | | 2017 | | 2016 | | 2021 | | 2020 | | 2021 | | 2020 |
| Regulatory assets (liabilities) | $ | 4,009 |
| | $ | 5,336 |
| | $ | (23 | ) | | $ | 49 |
| Regulatory assets (liabilities) | $ | 3,636 | | | $ | 5,115 | | | $ | 32 | | | $ | 78 | |
| Accounts payable and accrued liabilities | (4 | ) | | (5 | ) | | (33 | ) | | (35 | ) | Accounts payable and accrued liabilities | (7) | | | (5) | | | (24) | | | (28) | |
Pension and post-retirement benefit obligations(1) | (4,608 | ) | | (5,933 | ) | | (461 | ) | | (536 | ) | Pension and post-retirement benefit obligations(1) | (4,231) | | | (5,711) | | | (474) | | | (516) | |
Note
(1) The table above excludes $408$340 million and $460$390 million of post-employment benefit costs that are recorded in Post-retirement and post-employment benefit obligations on the Consolidated Balance Sheets at September 30, 20172021 and 2016,2020, respectively.
Unrecognized amounts included in regulatory assets or liabilities yet to be recognized as components of accrued benefit cost at September 30, 2021 and 2020, consisted of:of the following:
| | | | | | | | | | | | | | | | | | | | | | | |
Post-Retirement Benefit Costs Deferred as Regulatory Assets (Liabilities) At September 30 |
| | Pension Benefits | | Other Post-Retirement Benefits |
| | 2021 | | 2020 | | 2021 | | 2020 |
| Unrecognized prior service credit | $ | (517) | | | $ | (615) | | | $ | (93) | | | $ | (112) | |
| Unrecognized net loss | 4,062 | | | 5,620 | | | 125 | | | 190 | |
| Amount capitalized due to actions of regulator | 91 | | | 110 | | | — | | | — | |
| Total regulatory assets (liabilities) | $ | 3,636 | | | $ | 5,115 | | | $ | 32 | | | $ | 78 | |
|
| | | | | | | | | | | | | | | |
Post-Retirement Benefit Costs Deferred as Regulatory Assets At September 30 |
| | Pension Benefits | | Other Post-Retirement Benefits |
| | 2017 | | 2016 | | 2017 | | 2016 |
| Unrecognized prior service credit | $ | (918 | ) | | $ | (1,017 | ) | | $ | (163 | ) | | $ | (185 | ) |
| Unrecognized net loss | 4,885 |
| | 5,946 |
| | 140 |
| | 234 |
|
| Amount capitalized due to actions of regulator | 42 |
| | 407 |
| | — |
| | — |
|
| Total regulatory assets | $ | 4,009 |
| | $ | 5,336 |
| | $ | (23 | ) | | $ | 49 |
|
TheInformation for the pension projected benefit obligation ("PBO") in excess of plan assets and other post-retirement accumulated postretirement benefit obligation ("APBO") has been disclosed in the Obligations and Funded Status table above. The following table provides the pension plan accumulated benefit obligation and fair value("ABO") in excess of plan assets for the pensionassets. The other post-retirement plans are unfunded or have no plan at September 30, 2017, and 2016, were as follows:assets.
| | | | | | | | | | | |
Accumulated Benefit Obligations in Excess of Plan Assets At September 30 |
| | 2021 | | 2020 |
| | | |
| Accumulated benefit obligation | $ | 13,299 | | | $ | 13,613 | |
| Fair value of net plan assets | 9,110 | | | 7,959 | |
|
| | | | | | | |
Projected Benefit Obligations and Accumulated Benefit Obligations in Excess of Plan Assets At September 30 |
| | 2017 | | 2016 |
| Projected benefit obligation | $ | 12,601 |
| | $ | 13,083 |
|
| Accumulated benefit obligation | 12,461 |
| | 12,912 |
|
| Fair value of net plan assets | 7,989 |
| | 7,145 |
|
The components of net periodic benefit cost and other amounts recognized as changes in regulatory assets for the years ended September 30, 2017,2021, 2020, and 2016,2019 were as follows:
| | | | | | | | | | | | | | | | | | | | | | | | | | | | | | | | | | | |
Components of Net Periodic Benefit Cost For the years ended September 30 |
| | Pension Benefits | | Other Post-Retirement Benefits |
| | 2021 | | 2020 | | 2019 | | 2021 | | 2020 | | 2019 |
| Service cost | $ | 57 | | | $ | 55 | | | $ | 44 | | | $ | 18 | | | $ | 16 | | | $ | 11 | |
| Interest cost | 368 | | | 415 | | | 499 | | | 16 | | | 16 | | | 18 | |
| Expected return on plan assets | (493) | | | (488) | | | (477) | | | — | | | — | | | — | |
| Amortization of prior service credit | (97) | | | (97) | | | (99) | | | (18) | | | (24) | | | (24) | |
| Recognized net actuarial loss | 452 | | | 436 | | | 336 | | | 11 | | | 10 | | | 4 | |
| Total net periodic benefit cost as actuarially determined | 287 | | | 321 | | | 303 | | | 27 | | | 18 | | | 9 | |
| Amount expensed (capitalized) due to actions of regulator | 19 | | | (15) | | | 1 | | | — | | | — | | | — | |
| Net periodic benefit cost | $ | 306 | | | $ | 306 | | | $ | 304 | | | $ | 27 | | | $ | 18 | | | $ | 9 | |
|
| | | | | | | | | | | | | | | | | | | | | | | |
Components of Net Periodic Benefit Cost For the years ended September 30 |
| | Pension Benefits | | Other Post-Retirement Benefits |
| | 2017 | | 2016 | | 2015 | | 2017 | | 2016 | | 2015 |
| Service cost | $ | 60 |
| | $ | 133 |
| | $ | 130 |
| | $ | 18 |
| | $ | 16 |
| | $ | 16 |
|
| Interest cost | 464 |
| | 564 |
| | 540 |
| | 21 |
| | 29 |
| | 29 |
|
| Expected return on plan assets | (457 | ) | | (446 | ) | | (437 | ) | | — |
| | — |
| | — |
|
| Amortization of prior service credit | (99 | ) | | (23 | ) | | (21 | ) | | (22 | ) | | (6 | ) | | (6 | ) |
| Recognized net actuarial loss | 472 |
| | 310 |
| | 299 |
| | 14 |
| | 7 |
| | 9 |
|
| Curtailment | — |
| | (78 | ) | | — |
| | — |
| | — |
| | — |
|
| Total net periodic benefit cost as actuarially determined | 440 |
| | 460 |
| | 511 |
| | 31 |
| | 46 |
| | 48 |
|
| Amount expensed (capitalized) due to actions of regulator | 365 |
| | (179 | ) | | (228 | ) | | — |
| | — |
| | — |
|
| Total net period benefit cost | $ | 805 |
| | $ | 281 |
| | $ | 283 |
| | $ | 31 |
| | $ | 46 |
| | $ | 48 |
|
The amounts in the regulatory asset that are expected to be recognized as components of net periodic benefit cost during the next fiscal year are as follows:
|
| | | | | | | | | | | |
Expected Amortization of Regulatory Assets in 2018 At September 30, 2017 |
| | Pension Benefits | | Other Post-Retirement Benefits | | Total |
| Prior service credit | $ | (98 | ) | | $ | (22 | ) | | $ | (120 | ) |
| Net actuarial loss | 412 |
| | 7 |
| | 419 |
|
The amount in the components of net periodic benefit cost expected to be capitalized due to actions of the regulator in the next fiscal year is $57 million.
Plan Assumptions
TVA’s reportedPlan assumptions utilized to determine benefit obligations and net periodic benefit costs include discount rates, projected health care cost trend rates, expected long-term rate of providing thereturn on plan benefits are impacted by numerous factors including the provisionsassets, rate of the plans, changing employee demographics,increase in future compensation levels, retirement rates, expected timing and various assumptions,form of payments, and mortality rates, the most significant of which are noted below. Every five years, a formal actuarial experience study that compares assumptions to the actual experience is conducted. Additional ad-hoc experience studies are performed as needed to review recent experience and validate recommended changes to the actuarial assumptions used based upon TVA's last experience study in 2018.
| | | | | | | | | | | | | | | | | | | | | | | |
| Actuarial Assumptions Utilized to Determine Benefit Obligations at September 30 |
| | Pension Benefits | | Other Post-Retirement Benefits |
| | 2021 | | 2020 | | 2021 | | 2020 |
| Discount rate | 2.90% | | 2.75% | | 3.05% | | 3.05% |
| Rate of compensation increase | 3.37% | | 3.43% | | N/A | | N/A |
| Weighted average interest crediting rate | 5.15% | | 5.15% | | N/A | | N/A |
Cost of living adjustment (COLA)(1) | 2.00% | | 2.00% | | 2.00% | | 2.00% |
| Pre-Medicare eligible per capita claim costs | | | | | | | |
| Current health care cost trend rate | N/A | | N/A | | 6.25% | | 6.50% |
| Ultimate health care cost trend rate | N/A | | N/A | | 5.00% | | 5.00% |
| Year ultimate trend rate is reached | N/A | | N/A | | 2027 | | 2027 |
Pre-Medicare eligible per capita contributions(2) | | | | | | | |
| Current health care cost trend rate | N/A | | N/A | | 8.51% | | 11.93% |
| Ultimate health care cost trend rate | N/A | | N/A | | 5.00% | | 5.00% |
| Year ultimate trend rate is reached | N/A | | N/A | | 2027 | | 2027 |
| Post-Medicare eligible | | | | | | | |
| Current health care cost trend rate | N/A | | N/A | | —% | | —% |
| Ultimate health care cost trend rate | N/A | | N/A | | 4.00% | | 4.00% |
| Year ultimate trend rate is reached | N/A | | N/A | | 2024 | | 2024 |
Notes
(1) The COLA assumption is the ultimate long-term rate. The calendar year rate for 2022 is assumed to be 3.15 percent, and for years thereafter the ultimate is used.
(2) In 2021 and 2020, due to the COVID-19 pandemic and premium experience, TVA reset the pre-Medicare eligible per capita contributions. The 2021 current trend rate remains at 8.51 percent for years 2022 through 2024, is 5.50 percent in 2025, and reaches the ultimate rate of 5.00 percent in 2027.
|
| | | | | | | | | | | |
| Actuarial Assumptions Utilized to Determine Benefit Obligations at September 30 |
| | Pension Benefits | | Other Post-Retirement Benefits |
| | 2017 | | 2016 | | 2017 | | 2016 |
| Discount rate | 3.85 | % | | 3.65 | % | | 3.95 | % | | 3.70 | % |
| Rate of compensation increase | 5.43 | % | | 5.55 | % | | N/A |
| | N/A |
|
| Pre-Medicare eligible | | | | | | | |
| Initial health care cost trend rate | N/A |
| | N/A |
| | 6.50 | % | | 6.50 | % |
| Ultimate health care cost trend rate | N/A |
| | N/A |
| | 5.00 | % | | 5.00 | % |
| Year ultimate trend rate is reached | N/A |
| | N/A |
| | 2024 |
| | 2019 |
|
| Post-Medicare eligible | | | | | | | |
| Initial health care cost trend rate | N/A |
| | N/A |
| | — | % | | — | % |
| Ultimate health care cost trend rate | N/A |
| | N/A |
| | 4.00 | % | | 4.00 | % |
| Year ultimate trend rate is reached | N/A |
| | N/A |
| | 2021 |
| | 2021 |
|
| | | | | | | | | | | | | | | | | | | | | | | | | | | | | | | | | | | |
Actuarial Assumptions Utilized to Determine Net Periodic Benefit Cost for the Years Ended September 30(1) |
| | Pension Benefits | | Other Post-Retirement Benefits |
| | 2021 | | 2020 | | 2019 | | 2021 | | 2020 | | 2019 |
| Discount rate | 2.75% | | 3.20% | | 4.35% | | 3.05% | | 3.30% | | 4.40% |
Expected return on plan assets(2) | 6.75% | | 6.75% | | 6.75% | | N/A | | N/A | | N/A |
| Weighted average interest crediting rate | 5.15% | | 5.15% | | 5.16% | | N/A | | N/A | | N/A |
Cost of living adjustment (COLA)(3) | 2.00% | | 2.00% | | 2.00% | | 2.00% | | 2.00% | | 2.00% |
| Rate of compensation increase | 3.37% | | 3.43% | | 3.50% | | N/A | | N/A | | N/A |
| Pre-Medicare eligible per capita claims costs | | | | | | | | | | | |
| Current health care cost trend rate | N/A | | N/A | | N/A | | 6.50% | | 6.75% | | 6.25% |
| Ultimate health care cost trend rate | N/A | | N/A | | N/A | | 5.00% | | 5.00% | | 5.00% |
| Year ultimate trend rate is reached | N/A | | N/A | | N/A | | 2027 | | 2027 | | 2024 |
| Pre-Medicare eligible per capita contributions | | | | | | | | | | | |
Current health care cost trend rate(4) | N/A | | N/A | | N/A | | 11.93% | | 6.75% | | 6.25% |
| Ultimate health care cost trend rate | N/A | | N/A | | N/A | | 5.00% | | 5.00% | | 5.00% |
| Year ultimate trend rate is reached | N/A | | N/A | | N/A | | 2027 | | 2027 | | 2024 |
| Post-Medicare eligible | | | | | | | | | | | |
| Current health care cost trend rate | N/A | | N/A | | N/A | | —% | | —% | | —% |
| Ultimate health care cost trend rate | N/A | | N/A | | N/A | | 4.00% | | 4.00% | | 4.00% |
| Year ultimate trend rate is reached | N/A | | N/A | | N/A | | 2024 | | 2023 | | 2021 |
|
| | | | | | | | | | | | | | | | | |
Actuarial Assumptions Utilized to Determine Net Periodic Benefit Cost for the Years Ended September 30 (1) |
| | Pension Benefits | | Other Post-Retirement Benefits |
| | 2017 | | 2016 | | 2015 | | 2017 | | 2016 | | 2015 |
| Discount rate | 3.65 | % | | 4.50 | % | | 4.45 | % | | 3.70 | % | | 4.65 | % | | 4.50 | % |
| Expected return on plan assets | 7.00 | % | | 7.00 | % | | 7.00 | % | | N/A |
| | N/A |
| | N/A |
|
| Rate of compensation increase | 5.55 | % | | 5.70 | % | | 5.70 | % | | N/A |
| | N/A |
| | N/A |
|
| Pre-Medicare eligible | | | | | | | | | | | |
| Initial health care cost trend rate | N/A |
| | N/A |
| | N/A |
| | 6.50 | % | | 7.00 | % | | 7.50 | % |
| Ultimate health care cost trend rate | N/A |
| | N/A |
| | N/A |
| | 5.00 | % | | 5.00 | % | | 5.00 | % |
| Year ultimate trend rate is reached | N/A |
| | N/A |
| | N/A |
| | 2019 |
| | 2019 |
| | 2019 |
|
| Post-Medicare eligible | | | | | | | | | | | |
| Initial health care cost trend rate | N/A |
| | N/A |
| | N/A |
| | — | % | | 7.00 | % | | 7.50 | % |
| Ultimate health care cost trend rate | N/A |
| | N/A |
| | N/A |
| | 4.00 | % | | 5.00 | % | | 5.00 | % |
| Year ultimate trend rate is reached | N/A |
| | N/A |
| | N/A |
| | 2021 |
| | 2019 |
| | 2019 |
|
NoteNotes
(1) The actuarial assumptions used to determine the benefit obligations at September 30 of each year are subsequently used to determine net periodic benefit cost
for the following year.year except the rate of compensation increase assumption.
(2) The actual return on assets for 2021, 2020, and 2019 were 20.30 percent, 5.11 percent, and 4.99 percent, respectively.
(3) The COLA assumption is the ultimate rate. The actual calendar year rate is used in determining the expense, and for years thereafter the ultimate rate is used.
(4) Due to the COVID-19 pandemic and premium experience, TVA temporarily reset the pre-Medicare eligible per capita contributions current trend rate to measure 2021 other post-retirement cost.
Discount Rate. In selecting the assumed discount rate, TVA reviews market yields on high-quality corporate debt and long-term obligations of the U.S. Treasury and endeavors to match, through the use of a hypothetical bond portfolio, instrument maturities with the maturities of its pension obligations in accordance with the prevailing accounting standards. The selected bond portfolio is derived from a universe of high quality corporate bonds of Aa-rated quality or higher. After the bond portfolio is selected, a single interest rate is determined that equates the present value of the plan's projected benefit payments discounted at this rate with the market value of the bonds selected. Based
Expected Return on recent market trends and economic conditions, TVA increased its discount rate used to determine the pension benefit obligation and other post-retirement benefit obligation.
Rate of ReturnPlan Assets. The qualified defined benefit pension plan is the only plan that is funded with qualified plan assets. The expected rate of return is based on annual studies performed by third-party professional investment consultants. In determining the expected long-term rate of return on pension plan assets, TVA uses a process that incorporates actual historical asset class returns and an assessment of expected future performance and takes into consideration external actuarial advice, the current outlook on capital markets, the asset allocation policy, and the anticipated investment expenses and impact of active management. Asset allocations are periodically updated using the pension plan asset/liability studies and are part of the determination of the estimates of long-term rates of return. The currentTVARS asset allocation policy approved by the TVARS Board diversifies plan assets across multiple asset classes so as to minimize the risk of large losses. The asset allocation policy is designed to be dynamic in nature and responsive to changes in the funded status of TVARS. Changes inDuring 2021, the TVARS Board decreased the expected return rates areon plan assets assumption from 6.75 percent to 5.75 percent based on annual studies performed by third party professional investment consultants. In 2017, upon review of the changes in the plan’scurrent plan's funding levels, asset target allocation mix, capital market outlooks, and the most recent studies,studies. TVA management adopted a 6.75the 5.75 percent expected long-term rate of return on plan assets assumption, which will be used to calculate the 20182022 net periodic pension cost.
Compensation Increases. Assumptions related to compensation increases are based onupon the results obtained from an actual companylatest TVA compensation experience study performed during the most recent five years for plan participants. TVA obtained an updated study in 2013 and determined that future2018. Future compensation wouldis assumed to likely increase at rates between 3.502.50 percent and 13.0014.00 percent per year, depending upon the employee's age. The average assumed compensation increase used to determine benefit obligations and net periodic benefit cost is based upon the current active participants.
Mortality. The mortality assumption is comprised of a base table that represents the current future expectation of life expectancy adjusted by an improvement scale to project future improvements in life expectancy. TVA's mortality assumptions are based upon actuarial projections in combination with studies of the actual mortality experience of TVA's pension and post-retirement benefit plan participants while taking into consideration the published Society of Actuaries ("SOA") mortality table and projection scale at September 30. BasedIn 2020, based upon an updated review ofthe most recent mortality improvements,experience study, TVA adopted a modified version of the
SOA MP-2016PRI-2012 table. For 2021, TVA has maintained the mortality table assumption adopted in 2020, and updated to the latest mortality improvement scale and maintained its adjusted version of the SOA RP-2014 mortality table to measure the pension and post-retirement benefit obligation at September 30, 2017.2021.
The following mortality assumptions were used to determine the benefit obligations for the pension and other post-retirement benefit plans at September 30, 2017, 2016,2021, 2020, and 2015.2019. Assumptions used to determine year-end benefit obligations are the assumptions used to determine the subsequent year’syear's net periodic benefit costs.
| | | | | | | | | | | | | | | | | |
Mortality Assumptions At September 30 |
| | 2021 | | 2020 | | 2019 |
| Mortality table | PRI-2012 table (adjusted) | | PRI-2012 table (adjusted) | | RP-2014 table (adjusted) |
| Improvement scale | MP-2020 (modified) | | MP-2019 (modified) | | MP-2018 (modified) |
|
| | | | | |
Mortality Assumptions At September 30 |
| | 2017 | | 2016 | | 2015 |
| Mortality table | RP-2014 table (adjusted) | | RP-2014 table (adjusted) | | RP-2014 table (adjusted) |
| Improvement scale | MP-2016 (modified) | | RP-2015 scale (modified) | | MP-2014 (modified) |
Health Care Cost Trends. The health care cost trend rates are assumptions about the annual rate of changes in the cost of health care benefits currently provided by the post-retirement benefit plan. In establishing health care cost trend rates, TVA reviews actual recent cost trends and projected future trends in establishingconsidering health care cost trend rates. In 2017, TVA reset the current trend rate assumption used to determine the pre-Medicare eligible post-retirement obligation to 6.50 percent with the assumption to gradually decrease each successive year until it reaches a 5.00 percent annual increaseinflation, changes in health care costsutilization, and changes in 2024plan benefits and beyond. TVA maintained the post-Medicare eligible health care cost trend assumption at 0.00 percent through 2020 at which point it increases to 4.00 percent in 2021 and beyond as a result of the move of Medicare eligible retirees to a private exchange beginning January 2017.premium experience.
Cost of Living Adjustment. COLAs are an increase in the benefits for eligible retirees to help maintain the purchasing power of benefits as consumer prices increase. Eligible retirees receive a COLA on the base pension portion of the monthly pension benefitand supplemental benefits in January equal to the percentage change in the Consumer Price Index for All Urban Consumers (“CPI-U”("CPI-U") in January following any year in which the 12-month average CPI-U exceeded by as much as one percent the 12-month average of the CPI-U for the preceding year in which a COLA was given. Increases in the COLA will be the percent increase in CPI-U over the preceding year less 0.25 percent, with a 6.00 percent cap for any one year.
TVA's COLA assumption is derived from long-term expectations of the expected future rate of inflation, based upon capital market assumptions, economic forecasts, and the Federal Reserve policy. TVA’s 2017The actual calendar year COLA and the long- term COLA assumption remained at 2.00 percent for CY 2018 and thereafter to measure the benefit obligations. TVA’s 2016 COLA assumption was 1.25 percent for CY 2017 and 2.00 percent for CY 2018 and thereafter. The COLA assumptionare used to determine the benefit obligationsobligation at September 30 are used to determineand the net periodic benefit costs for the following fiscal year adjusted for the actual COLA determined for the following calendar year. The actual 2017, 2016,calendar year COLAs for 2021, 2020, and 2015 COLAs2019 were 0.991.13 percent, 0.001.54 percent, and 1.682.21 percent, respectively. The assumed COLAs for 2018 and beyond are based on the underlying CPI assumption of 2.25 percent, less 0.25 percent. The actual 2018 COLA will not be determined until December 2017.
Sensitivity of Costs to Changes in Assumptions. The following chart reflects the sensitivity of pension cost to changes in certain actuarial assumptions:
| | | | | | | | | | | | | | | | | | | | |
Sensitivity to Certain Changes in Pension Assumptions At September 30, 2021 |
Actuarial Assumption | | Change in Assumption | | Impact on 2021 Pension Cost | | Impact on 2021 Projected Benefit Obligation |
| Discount rate | | (0.25) | % | | $ | 16 | | | $ | 396 | |
| Rate of return on plan assets | | (0.25) | % | | 18 | | | N/A |
| Cost of living adjustments | | 0.25 | % | | 29 | | | 258 | |
|
| | | | | | | | | | | |
Sensitivity to Certain Changes in Pension Assumptions At September 30, 2017 |
Actuarial Assumption | | Change in Assumption | | Impact on 2017 Pension Cost | | Impact on 2017 Projected Benefit Obligation |
| Discount rate | | (0.25 | )% | | $ | 17 |
| | $ | 367 |
|
| Rate of return on plan assets | | (0.25 | )% | | 16 |
| | N/A |
|
Each fluctuation above assumes that the other components of the calculation are held constant and excludes any impact for unamortized actuarial gains or losses.
The following chart reflects the sensitivity of post-retirement benefit cost to changes in the health care trend rate:
|
| | | | | | | |
Sensitivity to Changes in Assumed Health Care Cost Trend Rates At September 30, 2017 |
| | 1% Increase | | 1% Decrease |
| Effect on total of service and interest cost components for the year | $ | 5 |
| | $ | (5 | ) |
| Effect on end-of-year accumulated post-retirement benefit obligation | 70 |
| | (67 | ) |
Each fluctuation above assumes that the other components of the calculation are held constant and excludes any impact for unamortized actuarial gains or losses.
Plan Investments
The qualified defined benefit pension plan (the "Plan"), which includes the Original Benefit Structure and the Cash Balance Benefit Structure, is the only plan that includes qualified plan assets.
The TVARS Board’s current In August 2021, a new asset allocation policy forplan was put in place to reduce risk and volatility in the TVARS investment of qualified pension plan assets has targets of 47 percent equity including global public and private equity investments, 30 percent fixed income securities, and 23 percent real assets including public and private real assets. TVARS has a long-term investment plan that contains a dynamic de-risking
strategy which will allocate investments to assets that better match the liability, such as long duration fixed income securities, over time as improved funding status targets are met.portfolio. Pursuant to the TVARS Rules and Regulations, any proposed changes in asset allocation that would change the system’sTVARS's assumed rate of investment return are subject to TVA’sTVA's review and veto.
As set forth above, the The qualified pension plan assets are invested across global public equity, private equity, safety oriented fixed income, opportunistic fixed income, public real assets,growth, defensive-growth, defensive, and private realinflation-sensitive assets. The TVARS asset allocation policy includes permissible deviations from target allocations. The TVARS Boardallocations, and action can take action,be taken, as appropriate, to rebalance the system’splan's assets consistent with the asset allocation policy. At September 30, 20172021 and 2016,2020, the asset holdings of the systemTVARS included the following:
|
| | | | | | | | | |
Asset Holdings of TVARS At September 30 |
| | | | | Plan Assets at September 30 |
| Asset Category | | Target Allocation | | 2017 | | 2016 |
| Global public equity | | 39 | % | | 44 | % | | 44 | % |
| Private equity | | 8 | % | | 5 | % | | 4 | % |
| Safety oriented fixed income | | 15 | % | | 21 | % | | 18 | % |
| Opportunistic fixed income | | 15 | % | | 10 | % | | 10 | % |
| Public real assets | | 15 | % | | 13 | % | | 15 | % |
| Private real assets | | 8 | % | | 7 | % | | 9 | % |
| Total | | 100 | % | | 100 | % | | 100 | % |
| | | | | | | | | | | | | | | | | | | | |
Asset Holdings of TVARS At September 30 |
| | | | | Plan Assets at September 30 |
| Asset Category | | Target Allocation | | 2021 | | 2020 |
| Growth assets | | 17 | % | | 18 | % | | 44 | % |
| Defensive growth assets | | 38 | % | | 35 | % | | 20 | % |
| Defensive assets | | 20 | % | | 20 | % | | 18 | % |
| Inflation-sensitive assets | | 25 | % | | 27 | % | | 18 | % |
| Total | | 100 | % | | 100 | % | | 100 | % |
Fair Value Measurements
The following table provides the fair value measurement amounts for assets held by TVARS at September 30, 2017:2021:
| | TVA Retirement System At September 30, 2017 | |
TVA Retirement System At September 30, 2021 | | TVA Retirement System At September 30, 2021 |
| | Total(1) (2) | | Quoted Prices in Active Markets for Identical Assets/Liabilities (Level 1) | | Significant Other Observable Inputs (Level 2) | | Significant Unobservable Inputs (Level 3) | | Total(1)(2) | | Quoted Prices in Active Markets for Identical
Assets/Liabilities
(Level 1) | | Significant Other
Observable Inputs
(Level 2) | | Significant
Unobservable
Inputs
(Level 3) |
| Assets | | | | | | | | Assets | | | | | | | |
| Equity securities | $ | 1,771 |
| | $ | 1,770 |
| | $ | — |
| | $ | 1 |
| Equity securities | $ | 992 | | | $ | 990 | | | $ | — | | | $ | 2 | |
| |
|
| | | | | | | |
| Preferred securities | 14 |
| | 3 |
| | 11 |
| | — |
| Preferred securities | 9 | | | 2 | | | 6 | | | 1 | |
| | | | | | | | | |
| Debt securities | | | |
| | |
| | |
| Debt securities | | | | | | |
| Corporate debt securities | 1,100 |
| | — |
| | 1,088 |
| | 12 |
| Corporate debt securities | 1,360 | | | — | | | 1,359 | | | 1 | |
| Residential mortgage-backed securities | 325 |
| | — |
| | 317 |
| | 8 |
| Residential mortgage-backed securities | 275 | | | — | | | 267 | | | 8 | |
| Debt securities issued by U.S. Treasury and other U.S. government agencies | 193 |
| | 193 |
| | — |
| | — |
| |
| Debt securities issued by U.S. Treasury | | Debt securities issued by U.S. Treasury | 741 | | | 741 | | | — | | | — | |
| Debt securities issued by foreign governments | 331 |
| | — |
| | 307 |
| | 24 |
| Debt securities issued by foreign governments | 204 | | | — | | | 200 | | | 4 | |
| Asset-backed securities | 146 |
| | — |
| | 109 |
| | 37 |
| Asset-backed securities | 151 | | | — | | | 110 | | | 41 | |
| Debt securities issued by state/local governments | 19 |
| | — |
| | 17 |
| | 2 |
| Debt securities issued by state/local governments | 28 | | | — | | | 28 | | | — | |
| Commercial mortgage-backed securities | 68 |
| | — |
| | 62 |
| | 6 |
| Commercial mortgage-backed securities | 168 | | | — | | | 151 | | | 17 | |
| | | | | | | | | |
Commingled funds measured at net asset value(3) |
|
| | | | | | | Commingled funds measured at net asset value(3) | |
| Equity | 1,134 |
| | — |
| | — |
| | — |
| Equity | 619 | | | — | | | — | | | — | |
| Debt | 709 |
| | — |
| | — |
| | — |
| Debt | 881 | | | — | | | — | | | — | |
| Commodities | 224 |
| | — |
| | — |
| | — |
| |
| | Blended | | Blended | 105 | | | — | | | — | | | — | |
| | | | | | | | | |
| Institutional mutual funds | 155 |
| | 155 |
| | — |
| | — |
| Institutional mutual funds | 841 | | | 841 | | | — | | | — | |
| Cash equivalents and other short-term investments | 916 |
| | — |
| | 916 |
| | — |
| Cash equivalents and other short-term investments | 710 | | | 323 | | | 387 | | | — | |
| Certificates of deposit | 6 |
| | — |
| | 6 |
| | — |
| |
| Private credit measured at net asset value(3) | | Private credit measured at net asset value(3) | 324 | | | — | | | — | | | — | |
Private equity measured at net asset value(3) | 500 |
| | — |
| | — |
| | — |
| Private equity measured at net asset value(3) | 1,333 | | | — | | | — | | | — | |
Private real estate measured at net asset value(3) | 533 |
| | — |
| | — |
| | — |
| |
Private real assets measured at net asset value(3) | | Private real assets measured at net asset value(3) | 760 | | | — | | | — | | | — | |
| | | | | | | | | | |
| Securities lending collateral | 369 |
| | — |
| | 369 |
| | — |
| Securities lending collateral | 240 | | | — | | | 240 | | | — | |
| | | | | | | | | |
| Derivatives | |
| | |
| | |
| | |
| Derivatives | | | | | | | |
| Futures | 18 |
| | 18 |
| | — |
| | — |
| Futures | 1 | | | 1 | | | — | | | — | |
| Swaps | 1 |
| | — |
| | 1 |
| | — |
| Swaps | 6 | | | — | | | 6 | | | — | |
| | Foreign currency forward receivable | 4 |
| | — |
| | 4 |
| | — |
| Foreign currency forward receivable | 1 | | | — | | | 1 | | | — | |
| | | | | | | | | | | | | | | | |
| Total assets | $ | 8,536 |
| | $ | 2,139 |
| | $ | 3,207 |
| | $ | 90 |
| Total assets | $ | 9,749 | | | $ | 2,898 | | | $ | 2,755 | | | $ | 74 | |
| | | | | | | | | | | | | | | | |
| Liabilities | |
| | |
| | |
| | |
| Liabilities | | | | | | | |
| Derivatives | | Derivatives | |
| Futures | $ | 3 |
| | $ | 2 |
| | $ | — |
| | $ | 1 |
| Futures | $ | 4 | | | $ | 4 | | | $ | — | | | $ | — | |
| Foreign currency forward payable | 6 |
| | — |
| | 6 |
| | — |
| Foreign currency forward payable | 1 | | | — | | | 1 | | | — | |
| Credit default swaps | 1 |
| | — |
| | — |
| | 1 |
| |
| | Swaps | | Swaps | 23 | | | — | | | 23 | | | — | |
| | | Securities sold under agreements to repurchase | | Securities sold under agreements to repurchase | 108 | | | — | | | 108 | | | — | |
| | | | | | | | | | | | | | | | |
| Total liabilities | $ | 10 |
| | $ | 2 |
| | $ | 6 |
| | $ | 2 |
| Total liabilities | $ | 136 | | | $ | 4 | | | $ | 132 | | | $ | — | |
Notes
(1) Excludes approximately $168$263 million in net payables associated with security purchases and sales and various other payables.
(2) Excludes a $369$240 million payable for collateral on loaned securities in connection with TVARS’sTVARS's participation in securities lending programs.
(3) CertainIn accordance with Subtopic 820-10, certain investments that are measured at fair value using the net asset valueNAV per share (or its equivalent) practical expedient have not been classified in the fair value hierarchy.
The following table provides the fair value measurement amounts for assets held by TVARS at September 30, 2016:2020:
| | TVA Retirement System At September 30, 2016 | |
TVA Retirement System At September 30, 2020 | | TVA Retirement System At September 30, 2020 |
| | Total(1) (2) | | Quoted Prices in Active Markets for Identical Assets/Liabilities (Level 1) | | Significant Other Observable Inputs (Level 2) | | Significant Unobservable Inputs (Level 3) | | Total(1)(2) | | Quoted Prices in Active Markets for Identical
Assets/Liabilities
(Level 1) | | Significant Other
Observable Inputs
(Level 2) | | Significant
Unobservable
Inputs
(Level 3) |
| Assets | | | | | | | | Assets | | | | | | | |
| Equity securities | $ | 1,847 |
| | $ | 1,846 |
| | $ | — |
| | $ | 1 |
| Equity securities | $ | 1,624 | | | $ | 1,621 | | | $ | — | | | $ | 3 | |
| |
| | | | | | | |
| Preferred securities | 20 |
| | 3 |
| | 17 |
| | — |
| Preferred securities | 11 | | | — | | | 11 | | | — | |
| | | | | | | | | |
| Debt securities | | | |
| | |
| | |
| Debt securities | | | | | | |
| Corporate debt securities | 1,145 |
| | — |
| | 1,135 |
| | 10 |
| Corporate debt securities | 1,421 | | | — | | | 1,418 | | | 3 | |
| Residential mortgage-backed securities | 181 |
| | — |
| | 165 |
| | 16 |
| Residential mortgage-backed securities | 317 | | | — | | | 314 | | | 3 | |
| Debt securities issued by U.S. Treasury and other U.S. government agencies | 117 |
| | 117 |
| | — |
| | — |
| |
| Debt securities issued by U.S. Treasury | | Debt securities issued by U.S. Treasury | 701 | | | 701 | | | — | | | — | |
| Debt securities issued by foreign governments | 332 |
| | — |
| | 299 |
| | 33 |
| Debt securities issued by foreign governments | 231 | | | — | | | 179 | | | 52 | |
| Asset-backed securities | 118 |
| | — |
| | 87 |
| | 31 |
| Asset-backed securities | 116 | | | — | | | 88 | | | 28 | |
| Debt securities issued by state/local governments | 16 |
| | — |
| | 16 |
| | — |
| Debt securities issued by state/local governments | 23 | | | — | | | 23 | | | — | |
| Commercial mortgage-backed securities | 44 |
| | — |
| | 38 |
| | 6 |
| Commercial mortgage-backed securities | 91 | | | — | | | 86 | | | 5 | |
| | | | | | | | | |
Commingled funds measured at net asset value(3) |
|
| | | | | | | Commingled funds measured at net asset value(3) | |
| Equity | 682 |
| | — |
| | — |
| | — |
| Equity | 931 | | | — | | | — | | | — | |
| Debt | 653 |
| | — |
| | — |
| | — |
| Debt | 203 | | | — | | | — | | | — | |
| Commodities | 302 |
| | — |
| | — |
| | — |
| |
| | Blended | 225 |
| | — |
| | — |
| | — |
| Blended | 102 | | | — | | | — | | | — | |
| |
|
| |
|
| |
|
| |
|
| |
| Institutional mutual funds | 10 |
| | 10 |
| | — |
| | — |
| Institutional mutual funds | 277 | | | 277 | | | — | | | — | |
| Cash equivalents and other short-term investments | 621 |
| | 41 |
| | 580 |
| | — |
| Cash equivalents and other short-term investments | 338 | | | 77 | | | 261 | | | — | |
| Certificates of deposit | 16 |
| | — |
| | 16 |
| | — |
| |
| Private credit measured at net asset value(3) | | Private credit measured at net asset value(3) | 166 | | | — | | | — | | | — | |
Private equity measured at net asset value(3) | 385 |
| | — |
| | — |
| | — |
| Private equity measured at net asset value(3) | 1,003 | | | — | | | — | | | — | |
Private real estate measured at net asset value(3) | 568 |
| | — |
| | — |
| | — |
| |
Private real assets measured at net asset value(3) | | Private real assets measured at net asset value(3) | 629 | | | — | | | — | | | — | |
| | | |
|
| |
|
| |
|
| |
|
| |
| Securities lending collateral | 3 |
| | — |
| | 3 |
| | — |
| Securities lending collateral | 167 | | | — | | | 167 | | | — | |
| | | | | | | | | |
| Derivatives | | | | | | | | Derivatives | |
| Futures | 2 |
| | 2 |
| | — |
| | — |
| Futures | 3 | | | 3 | | | — | | | — | |
| Swaps | 1 |
| | — |
| | 1 |
| | — |
| Swaps | 10 | | | — | | | 10 | | | — | |
| Options | | Options | 2 | | | — | | | 2 | | | — | |
| Foreign currency forward receivable | 5 |
| | — |
| | 5 |
| | — |
| Foreign currency forward receivable | 2 | | | — | | | 2 | | | — | |
| | | | | | | | | | | | | | | | |
| Total assets | $ | 7,293 |
| | $ | 2,019 |
| | $ | 2,362 |
| | $ | 97 |
| Total assets | $ | 8,368 | | | $ | 2,679 | | | $ | 2,561 | | | $ | 94 | |
| | | | | | | | | | | | | | | | |
| Liabilities | |
| | |
| | |
| | |
| Liabilities | | | | | | | |
| Derivatives | | Derivatives | |
| Futures | $ | 2 |
| | $ | 2 |
| | $ | — |
| | $ | — |
| Futures | $ | 1 | | | $ | 1 | | | $ | — | | | $ | — | |
| Foreign currency forward payable | 9 |
| | — |
| | 9 |
| | — |
| Foreign currency forward payable | 3 | | | — | | | 3 | | | — | |
| Written options | 1 |
| | — |
| | 1 |
| | — |
| |
| Interest rate swaps | 3 |
| | — |
| | 3 |
| | — |
| |
| Credit default swaps | 1 |
| | — |
| | 1 |
| | — |
| |
| | Swaps | | Swaps | 6 | | | — | | | 6 | | | — | |
| Options | | Options | 2 | | | — | | | 2 | | | — | |
| | Securities sold under agreements to repurchase | | Securities sold under agreements to repurchase | 123 | | | — | | | 123 | | | — | |
| | | | | | | | | | | | | | | | |
| Total liabilities | $ | 16 |
| | $ | 2 |
| | $ | 14 |
| | $ | — |
| Total liabilities | $ | 135 | | | $ | 1 | | | $ | 134 | | | $ | — | |
Notes
(1) Excludes approximately $129$107 million in net payables associated with security purchases and sales and various other payables.
(2) Excludes a $3$167 million payable for collateral on loaned securities in connection with TVARS’sTVARS's participation in securities lending programs.
(3) CertainIn accordance with Subtopic 820-10, certain investments that are measured at fair value using the net asset valueNAV per share (or its equivalent) practical expedient have not been classified in the fair value hierarchy.
The following table provides a reconciliation of beginning and ending balances of pension plan assets measured at fair value on a recurring basis where the determination of fair value includes significant unobservable inputs (Level 3):
| | | | | |
| Fair Value Measurements Using Significant Unobservable Inputs |
| Fair Value Measurements Using Significant Unobservable Inputs (Level 3) |
| Balance at October 1, 2019 | $ | 42 | |
| Net realized/unrealized gains (losses) | 46 | |
| Purchases, sales, issuances, and settlements (net) | 11 | |
| Transfers in and/or out of Level 3 | (5) | |
| |
| Balance at September 30, 2020 | 94 | |
| Net realized/unrealized gains (losses) | (48) | |
| Purchases, sales, issuances, and settlements (net) | 32 | |
| Transfers in and/or out of Level 3 | (4) | |
| |
| Balance at September 30, 2021 | $ | 74 | |
|
| | | |
| Fair Value Measurements Using Significant Unobservable Inputs |
| | Fair Value Measurements Using Significant Unobservable Inputs (Level 3) |
| Balance at October 1, 2015 | $ | 91 |
|
| Net realized/unrealized gains (losses) | 18 |
|
| Purchases, sales, issuances, and settlements (net) | (12 | ) |
| Transfers in and/or out of Level 3 | — |
|
| Balance at September 30, 2016 | 97 |
|
| Net realized/unrealized gains (losses) | 2 |
|
| Purchases, sales, issuances, and settlements (net) | (6 | ) |
| Transfers in and/or out of Level 3 | (5 | ) |
| Balance at September 30, 2017 | $ | 88 |
|
The following descriptions of the valuation methods and assumptions used by the Planpension plan to estimate the fair value of investments apply to investments held directly by the Plan.pension plan. Third-party pricing vendors provide valuations for investments held by the Planpension plan in most instances, except for commingled, private credit, private equity, and private real estateasset funds which are priced at net asset valuesNAVs established by the investment managers. In instances where pricing is determined to be based on unobservable inputs, a Level 3 classification has been assigned. Certain securities priced by the investment manager using a proprietary fair value model with unobservable inputs have been classified as Level 3.
Equity and Preferred Securities. Investments listed on either a national or foreign securities exchange or traded in the over-the-counter National Market System are generally valued each business day at the official closing price (typically the last reported sale price) on the exchange on which the security is primarily traded and are classified as Level 1. Equity securities, including common stocks and preferred securities, classified as Level 2 may have been priced by dealer quote or using assumptions based on observable market data, such as yields on bonds from the same issuer or industry. Certain securities priced by the investment manager using unobservable inputs have been classified as Level 3.
Corporate Debt Securities. Corporate bonds are valued based upon recent bid prices or the average of recent bid and asked prices when available (Level 2 inputs) and, if not available, they are valued through matrix pricing models. Matrix pricing, which is a mathematical technique commonly used to price debt securities that are not actively traded, values debt securities without relying exclusively on quoted prices for the specific securities but rather by relying on the securities’securities' relationship to other benchmark quoted securities (Level 2 inputs). Certain securities priced by the investment manager using broker pricing or unobservable inputs have been classified as Level 3.
Mortgage and Asset-Backed Securities. Residential mortgage-backed securities consist of collateralized mortgage obligations ("CMOs") and U.S. pass-through security pools related to government-sponsored enterprises ("GSEs").enterprises. CMO pricing is typically based on either a volatility-driven, multidimensional, single-cash-flow stream model or an option-adjusted spread model. These models incorporate available market data such as trade information, dealer quotes, market color, spreads, bids, and offers. Pricing for GSEgovernment-sponsored enterprise securities, including the Federal Home Loan Mortgage Corporation, the Federal National Mortgage Association, and the Government National Mortgage Association, is typically based on quotes from the To Be Announced ("TBA") market, which is highly liquid with multiple electronic platforms that facilitate the execution of trading between investors and broker/dealers. Prices from the TBA market are then compared against other live data feeds as well as input obtained directly from the dealer community. Most residential mortgage-backed securities are considered to be priced using Level 2 inputs because of the nature of their market-data-based pricing models. Certain securities priced by vendorvendors using a single broker quote or unobservable inputs have been classified as Level 3.
Debt Securities Issued by U.S. Treasury. For U.S. Treasury securities, fair values reflect the closing price reported in the active market in which the security is traded (Level 1 inputs).
Debt Securities Issued by Foreign Governments. Foreign government bonds and foreign government inflation-linked securities are typically priced based on proprietary discounted cash flow models, incorporating option-adjusted spread features as appropriate. Debt securities issued by foreign governments are classified as Level 2 because of the nature of their market-data-based pricing models. Certain securities priced by the investment manager using broker quotes or unobservable input have been classified as Level 3.
Debt Securities Issued by State and Local Governments. Debt securities issued by state and local governments are typically priced using market-data-based pricing models, and are therefore classified as Level 2. These pricing models incorporate market data such as quotes, trading levels, spread relationships, and yield curves, as applicable.
Commercial Mortgage-Backed and Asset-Backed Securities. Commercial mortgage-backed and asset-backed securities are typically priced based on a single-cash-flow stream model, which incorporates available market data such as trade information, dealer quotes, market color, spreads, bids, and offers. Because of the market-data-based nature of such pricing models, these securities are typically classified as Level 2. Certain securities priced by investment managermanagers using broker pricing or unobservable inputs have been classified as Level 3.
Commingled Funds. The pension plan invests in commingled funds, which include collective trusts, unit investment trusts, and similar investment funds that predominantly hold debt and/or equity securities as underlying assets. The pension plan's ownership consists of a pro rata share and not a direct ownership of an underlying investment. These commingled funds are valued at their closing NAVs (or unit value) per share as reported by the managers of the commingled funds and as supported by the unit prices of actual purchases and sale transactions occurring as of or close to the financial statement date. These funds have not been classified in the fair value hierarchy in accordance with FASB guidance issued in May 2015.
Debt Securities Issued The pension plan is invested in equity commingled funds, which can be categorized as either passively managed index funds or actively managed funds. The equity index funds seek to track the performance of a particular index by replicating its capitalization and characteristics. Passive fund benchmark indices include the Russell 1000 index and MSCI ACWI ex-U.S. index. The actively managed equity funds seek to outperform certain equity benchmarks through a combination of fundamental and technical analysis. Active funds select portfolio positions based upon their research.
The pension plan is invested in debt commingled funds, which can be categorized as either passively managed index funds or actively managed funds. The pension plan's debt index fund invests in a diversified portfolio of fixed-income securities and derivatives of varying maturities to replicate the characteristics of the Bloomberg Barclays Capital TIPS. The fund seeks to track the total return of the Bloomberg Barclays Capital U.S. TIPS index. The actively managed debt funds seek to outperform certain fixed-income benchmarks through fundamental research and analysis. The funds invest in a diversified portfolio of fixed income securities and derivatives of varying maturities. Varying by strategy, fund objectives include achieving a positive relative total return through active credit selection and providing risk management through desired strategic exposures.
The pension plan is invested in commingled funds, which invest across multiple asset classes that can be categorized as blended. These funds seek to outperform a passive benchmark through active security selection. The funds invest in securities across equity, fixed income, currency, and commodities. The portfolios employ fundamental, quantitative, and technical analysis.
The pension plan's investments in equity, debt, blended, and commodity commingled funds can generally be redeemed upon notification of the investment managers, with required notice periods varying from same-day to monthly. These investments do not have unfunded commitments.
Institutional Mutual Funds. Investments in institutional mutual funds are valued at prices based on their NAV. Institutional mutual funds have daily published market prices that represent their NAV (or unit value) per share and are classified as Level 1.
Cash Equivalents and Other Short-Term Investments and Certificates of Deposit. Cash equivalents and other short-term investments are highly liquid securities with maturities of less than three months and 12 months, respectively. These consist primarily of discount securities such as commercial paper, repurchase agreements, U.S. Treasury bills, and Other U.S. Government Agencies. For U.S. Treasurycertain agency securities. These securities, as well as certificates of deposit, may be priced at cost, which approximates fair values reflectvalue due to the closing price reported inshort-term nature of the active market ininstruments. Model based pricing which the security is traded (Level 1 inputs). Agency securities are typically priced using evaluated pricing applications and models incorporating U.S. Treasury yield curves. Agencyincorporates observable inputs may also be utilized. These securities are classified as Level 2 because of the nature of their market-data-based2. Active market pricing models.
Debt Securities Issued by State and Local Governments. Debt securities issued by state and local governments are typically priced using market-data-based pricing models, and are therefore classified as Level 2. These pricing models incorporate market data such as quotes, trading levels, spread relationships, and yield curves, as applicable. Certain securities priced using an unobservable input have been classified as Level 3.
Debt Securities Issued by Foreign Governments. Foreign government bonds and foreign government inflation-linked securities are typically priced based on proprietary discounted cash flow models, incorporating option-adjusted spread features as appropriate. Debt securities issued by foreign governmentsmay be utilized for U.S. Treasury bills, which are classified as Level 2 because of the nature of their market-data-based pricing models. Certain securities priced by the investment manager using broker quote or unobservable input have been classified as Level 3.1.
Private Equity Funds.Credit Funds. Private equitycredit limited partnerships are reported at net asset valuesNAVs provided by the fund managers. These funds have not been classified in the fair value hierarchy in accordance with FASB guidance issued in May 2015.
The private credit limited partnerships invest across direct lending, opportunistic credit, and distressed debt strategies. The limited partnerships generally make investments of senior secured first-lien loans, second-lien secured loans, asset-based loans, unitranche loans, and distressed debt opportunities to middle market private companies. The limited partnerships generally seek to obtain financial returns through high income potential and occasional equity upside. The limited partnerships generally have a term life of five to eight years and are diversified by sector and industry.
Private Equity Funds. Private equity limited partnerships are reported at NAVs provided by the fund managers. These funds have not been classified in the fair value hierarchy in accordance with FASB guidance issued in May 2015.
The private equity limited partnerships typically make longer-term investments in private companies and seek to obtain financial returns through long-term appreciation based on corporate stewardship, improved operating processes, and financial restructuring which may involve a merger or acquisition. Significant investment strategies include venture capital; buyout;capital, buyout, mezzanine or subordinated debt;debt, restructuring or distressed debt;debt, energy infrastructure, and special situations. Venture capital partnerships consist of two main groupings. Early-stage venture capital partnerships invest in businesses still in the conceptual stage where products may not be fully developed and where revenues and/or profits may be several years away. Later-stage venture capital partnerships invest in more mature companies in need of growth or expansion capital. Buyout partnerships provide the equity capital for acquisition transactions either from a private seller or the public, which may represent the purchase of the entire company or a refinancing or recapitalization transaction where equity is invested. Mezzanine or subordinated debt partnerships provide the intermediate capital between equity and senior debt in a buyout or refinancing transaction and typically own a security in the company that carries current interest payments as well as a potential equity interest in the company. Restructuring or distressed debt partnerships purchase opportunities generated by overleveraged or poorly managed companies. Special situation partnerships include organizations with a specific industry focus not covered by the other private equity subclasses or unique opportunities that fall outside the regular subclasses.
The private equity funds have no investment withdrawal provisions prior to the termination of the partnership. Partnerships generally continue 10 to 1214 years after the inception of the fund. The partnerships are generally subject to two2 to three3 one-year extensions at the discretion of the General Partner. Partnerships can generally be dissolved by an 80 percent vote in interest by all limited partners, with some funds requiring the occurrence of a specific event.
Private Real EstateAsset Investments. The Plan’spension plan's ownership in private real estateasset investments consists of a pro rata share and not a direct ownership of the underlying investments. The fair values of the Plan’spension plan's private real estateasset investments are estimated utilizing net asset valuesNAVs provided by the investment managers. These investments have not been classified in the fair value hierarchy in accordance with FASB guidance issued in May 2015. The investment strategies and methodologies utilized by the investment managers to calculate their net asset valuesNAVs are summarized as follows:
The Planpension plan is invested in limited partnerships that invest in real estate securities, real estate partnerships, and direct real estate properties. This includes investments in office, multifamily, industrial, and retail investment properties in the U.S. and international markets. The investment strategy focuses on distressed, opportunistic, and value-added opportunities. Partnership investments also include mortgage and/or real estate-related fixed-income instruments and related securities. Investments are diversified by property type and geographic location.
The Planpension plan is invested in a commingled fund that develops, renovates, and re-leases real estate properties to create value. Investments are predominantly in top tier real estate markets that offer deep liquidity. Property types include residential, office, industrial, hotel, retail, and land. Properties are diversified by geographic region within the U.S. domestic market. The Planplan is invested in a second commingled fund that invests primarily in core, well-leased, operating real estate properties with a focus on income generation. Investments are diversified by property type with a focus on office, industrial, apartment, and retail. Properties are diversified within the U.S. with an overweight to major market and coastal regions.
Fair value estimates of the underlying investments in these limited partnerships and commingled fund investments are primarily based upon property appraisal reports prepared by independent real estate appraisers within a reasonable amount of time following acquisition of the real estate and no less frequently than annually thereafter. The appraisals are based on one or a combination of three methodologies: cost of reproduction analysis, discounted cash flow analysis, and sales comparison analysis. Pricing for certain investments in mortgage-backed and asset-backed securities is typically based on models that incorporate observable inputs.
The pension plan is invested in energy infrastructure partnerships which acquire essential, long-lived real assets in three main groupings. Upstream assets include oil and gas exploration, drilling, and acquisition. Midstream assets include storage, pipelines, gathering, processing, and transportation of energy commodities. Downstream assets include generation, distribution, and transmission facilities. Additionally, the pension plan is invested in infrastructure partnerships that target mid-sized operating infrastructure companies and/or assets with limited development and construction risk primarily in the energy, transportation and logistics, environmental, telecommunications, and social industries. The partnerships use one or more valuation techniques (e.g., the market approach, the income approach, or the cost approach) for which sufficient and reliable data is available. The use of the market approach generally consists of using comparable market transactions, while the use of the income approach generally consists of the net present value of estimated future cash flows, adjusted as appropriate for liquidity, credit, market, and/or other risk factors.
The Planpension plan is invested in a private real estateasset investment trust formed to make direct or indirect investments in commercial timberland properties. Pricing for these types of investments is based on comprehensive appraisals that are conducted shortly after initial purchase of properties and at three-year intervals thereafter. All appraisals are conducted by third-party timberland appraisal firms. Appraisals are based on either a sales comparison analysis or a discounted cash flow analysis.
Securities Lending Collateral. Collateral held under securities lending arrangements are invested in highly liquid short-term securities, primarily repurchase agreements. The securities are often priced at cost, which approximates fair value due to the short-term nature of the instruments. These securities are classified as Level 2.
Derivatives. The Planpension plan invests in a variety of derivative instruments. The valuation methodologies for these instruments are as follows:
Futures. The Planpension plan enters into futures. The futures contracts are listed on either a national or foreign securities exchange and are generally valued each business day at the official closing price (typically the last reported sales price) on the exchange on which the security is primarily traded. The pricing is performed by third-party vendors. Since futures are priced by an exchange in an active market, they are classified as Level 1. Certain securities priced using a stale vendor price have been classified as Level 3.
Options. The Planpension plan enters into purchased and written options. Options that are listed on either a national or foreign securities exchange are generally valued each business day at the official closing price (typically the last reported sales price) on the exchange on which the security is primarily traded. These options are classified as Level 1. Options traded over the counter and not on exchanges are priced by third-party vendors and are classified as Level 2.
Swaps. The Planpension plan enters into various types of swaps. Credit default swaps are priced at market using models that consider cash flows, credit curves, recovery rates, and other factors. The pricing is performed by third-party vendors, and in some cases by clearing exchanges. Interest rate swap contracts are priced at market using forward rates derived from the swap curve, and the pricing is also performed by third-party vendors, and in some cases by clearing exchanges. Other swaps such as equity index swaps and variance swaps are priced by third-party vendors using market inputs such as spot rates, yield curves, and volatility. The Plan'spension plan's swaps are generally classified as Level 2 based on the observable nature of their pricing inputs.
Foreign currency forwards. The Planpension plan enters into foreign currency forwards. All commitments are marked to market daily at the applicable translation rates, and any resulting unrealized gains or losses are recorded. Foreign currency forwards are priced by third-party vendors and are classified as Level 2.
Commingled FundsSecurities Sold Under Agreements to Repurchase. The Plan invests in commingled funds, which include collective trusts, unit investment trusts, and similar investment funds that predominantly hold debt and/pension plan enters into contracts to sell securities to a counterparty at a specified price with an agreement to purchase the same or equity securities as underlying assets. The Plan’s ownership consists ofsubstantially the same security from the same counterparty at a pro rata share and notfixed or determinable price at a direct ownership of an underlying investment. These commingled fundsfuture date. Securities sold under agreements to repurchase are valuedpresented at their closing net asset values (or unit value) per share as reported by the managers of the commingled funds and as supported by the unit prices of actual purchases and sale transactions occurring as of or close to the financial statement date. These funds have not been classified in the fair value hierarchy in accordance with FASB guidance issued in May 2015.
The Plan is invested in equity commingled funds, which can be categorized as either passively managed index funds or actively managed funds. The equity index funds seek to track the performance of a particular index by replicating its capitalization and characteristics. Passive fund benchmark indices include the Russell 1000 index, the S&P 500 index, the MSCI ACWI ex-U.S. index, the MSCI ACWI ex-U.S. Small-Cap index, and the Dow Jones U.S. Select REIT Index. The actively managed equity funds seek to outperform certain equity benchmarks through a combination of fundamental and technical analysis. Active funds select portfolio positions based upon their research.
The Plan is invested in debt commingled funds, which can be categorized as either passively managed index funds or actively managed funds. The Plan’s debt index fund invests in a diversified portfolio of fixed-income securities and derivatives of varying maturities to replicate the characteristics of the Bloomberg Barclays Capital U.S. Treasury Inflation-Protected Securities ("TIPS") index. The fund seeks to track the total return of the Bloomberg Barclays Capital U.S. TIPS index. The actively managed debt funds seek to outperform certain fixed-income benchmarks through fundamental research and analysis. The funds invest in a diversified portfolio of fixed income securities and derivatives of varying maturities. The objective is to achieve a positive relative total return through active credit selection.
The Plan is invested in commodity commingled funds, which can be categorized as actively managed funds. The funds seek to outperform certain commodity benchmarks through fundamental research and analysis. The funds invest in a diversified portfolio of commodity securities and derivatives of varying maturities. The objective is to achieve a positive relative return through active security selection.
The Plan is invested in commingled funds, which invest across multiple asset classes that can be categorized as blended. These funds seek to outperform a passive benchmark through active security selection. The funds invest in securities across equity, fixed income, currency, and commodities. The portfolios employ fundamental, quantitative, and technical analysis.
The Plan’s investments in equity, debt, blended, and commodity commingled funds can generally be redeemed upon notification of the investment managers, with required notice periods varying from same-day to monthly. These investments do not have unfunded commitments.
Institutional Mutual Funds. Investments in institutional mutual funds are valued at prices based on their net asset value. Institutional mutual funds have daily published market prices that represent their net asset value (or unit value) per share and are classified as Level 1.
Cash Equivalents and Other Short-Term Investments and Certificates of Deposit. Cash equivalents and other short-term investments are highly liquid securities with maturities of less than three months and 12 months, respectively. These consist primarily of discount securities such as commercial paper, repurchase agreements, U.S. Treasury bills, and certain agency securities. These securities, as well as certificates of deposit, may be priced at cost,contract price which approximates fair value due to thetheir short-term nature of the instruments. Model based pricing which incorporates observable inputs may also be utilized.nature. These securities are classified as Level 2. Active market pricing may be utilized for U.S. Treasury bills, which are classified as Level 1.
Securities Lending Collateral. Collateral heldIn connection with sales of securities under agreements to repurchase, the counterparties require the pension plan to maintain collateral securities lending arrangements are invested in highly liquid short-term securities, primarily repurchase agreements. The securities are often priced at cost, which approximateswith a fair value due tothat approximates or exceeds the short-term naturecontract amount of the instruments.repurchase agreement. These securities are held in government inflation-linked bonds and classified as Level 2.government debt securities.
The valuation methods described above may produce a fair value calculation that may not be indicative of net realizable value or reflective of future fair values. Furthermore, while the Planpension plan believes its valuation methods are appropriate and consistent with other market participants, the use of different methodologies or assumptions to determine the fair value of certain financial instruments could result in a different fair value measurement at the reporting date.
Reclassification. In the September 30, 2016, fair value measurement table, securities lending collateral has been reclassified into Level 2. The collateral is invested in highly liquid short-term securities, primarily repurchase agreements priced at cost, which approximates fair value due to the short-term nature of the instruments.
Cash Flows
Estimated Future Benefit Payments. The following table sets forth the estimated future benefit payments under the benefit plans.
|
| | | | | | | |
Estimated Future Benefits Payments At September 30, 2017 |
| | Pension Benefits(1) | | Other Post-Retirement Benefits |
| 2018 | $ | 768 |
| | $ | 33 |
|
| 2019 | 769 |
| | 31 |
|
| 2020 | 773 |
| | 29 |
|
| 2021 | 774 |
| | 27 |
|
| 2022 | 774 |
| | 25 |
|
| 2023 - 2027 | 3,821 |
| | 115 |
|
| | | | | | | | | | | |
Estimated Future Benefits Payments At September 30, 2021 |
| | Pension Benefits(1) | | Other Post-Retirement Benefits |
| 2022 | $ | 790 | | | $ | 24 | |
| 2023 | 786 | | | 23 | |
| 2024 | 782 | | | 21 | |
| 2025 | 781 | | | 20 | |
| 2026 | 776 | | | 20 | |
| 2027 - 2031 | 3,772 | | | 107 | |
Note
(1) Participants are assumed to receive the Fixed Fund in a lump sum in lieu of available annuity options allowed for certain grandfathered participants resulting in higher estimated pension benefits payments.
Contributions. The minimum contribution for 2017 was $300 million; however, TVA made a $800 million contribution to TVARS in 2017. The 2016 minimum contribution was $209 million; however, TVA made a $275 million contribution to TVARS in 2016. In 2017, TVA made contributions of $5 million to the pension plan of $300 million for 2021 and 2020. TVA has committed to make a minimum contribution of $300 million per year through 2036 or until the plan has reached and remained at 100 percent funded status under the actuarial rules applicable to TVARS. TVA made SERP contributions of $6 millionand $30$5 million net of rebates for 2021 and subsidies received,2020, respectively. TVA made cash contributions to the other post-retirement benefit plans. In 2016,plans of $25 million (net of $5 million in rebates) for both 2021 and 2020. TVA made contributions of $6expects to contribute $300 million to TVARS, $7 millionto the SERP, and $47$24 million, net of rebates and subsidies received, to the other post-retirement benefit plans. TVA expects to contribute $300 million to TVARS, $4 million to the SERP, and $33 million to the other post-retirement benefit plans in 2018.2022.
Other Post-Employment Benefits
Post-employment benefit cost estimates are revised to properly reflect changes in actuarial assumptions made at the end of each year. TVA utilizes a discount rate determined by reference to the U.S. Treasury Constant Maturities corresponding to the calculated average durations of TVA’sTVA's future estimated post-employment claims payments. The use of a 2.331.52 percent discount rate resulted in the recognition of $20 million in expenses in 2021 and an unpaid benefit obligation of $340 million at September 30, 2021. The use of a 0.69 percent discount rate resulted in the recognition of approximately $(12)$45 million in expenses in 20172020 and an unpaid benefit obligation of $447$390 million at September 30, 2017.2020. The use of a 1.601.68 percent discount rate resulted in the recognition of approximately $35$59 million in expenses in 20162019 and an unpaid benefit obligation of $501$419 million at September 30, 2016.2019. The useU.S. Department of a 2.05 percent discount rate resulted in the recognition of approximately $39 million in expenses in 2015Labor ("DOL") administers TVA's worker compensation program and an unpaid benefit obligation of $511 million at September 30, 2015.invoices TVA annually for claims processed.
The decrease in the unpaid benefit obligation when comparing 2017at September 30, 2021, compared to 2016the prior year is due primarily to the increase ofin the discount rate from 1.600.69 percent in 20162020 to 2.331.52 percent in 2017. 2021, decreases in loss experience, and fewer claims partially attributable to delayed medical treatments as a result of the COVID-19 pandemic. TVA paid $31 million for 2021 claims to the DOL in September 2021. TVA estimated losses for 2022 are $31 million.
The decrease in the unpaid benefit obligation when comparing 20162020 to 20152019 is due to the timing of the payment of workers compensation claims to the DOL in September 2020 compared to the prior year claims paid in October 2019. TVA paid $74 million in claims during 2020 (for both 2020 and 2019 claims experience) compared to $39 million in 2019 (for 2018 claims experience). Overall, the decrease in the discount rate from 1.68 percent in 2019 to 0.69 percent in 2020 increased the long-term portion of the unpaid benefit obligation. This increase was due primarily to demographic experience gains fromoffset by a decrease in loss experience and fewer claimants. These gains wereclaims partially offset by the decreaseattributable to delayed medical treatments as a result of the discount rate from 2.05 percent in 2015 to 1.60 percent in 2016.COVID-19 pandemic.
Amounts related to otherthe COVID-19 pandemic on post-employment benefit obligations are recognizedcosts and claims experience depends on factors beyond TVA's consolidated balance sheets. knowledge or control, including the duration and severity of this outbreak, actions taken to contain its spread and mitigate its effects, and broader impacts of the COVID-19 pandemic on the country and region's economy.
The current portion which represents unpaid losses and administrative fees due are in Accounts payable and accrued liabilities. The long-term portion is recognized in Post-retirement and post-employment benefit obligations.
| | | | | | | | | | | |
Amounts Recognized on TVA's Consolidated Balance Sheets At September 30 |
| | 2021 | | 2020 |
Accounts payable and accrued liabilities(1) | $ | — | | | $ | — | |
| Post-retirement and post-employment benefit obligations | 340 | | | 390 | |
Note
(1) DOL invoices were paid prior to year end in both 2021 and 2020.
|
| | | | | | | |
Amounts Recognized on TVA's Consolidated Balance Sheets At September 30 |
| | 2017 | | 2016 |
| Accounts payable and accrued liabilities | $ | 39 |
| | $ | 41 |
|
| Post-employment benefit obligations | 408 |
| | 460 |
|
21.23. Commitments and Contingencies
Commitments
Power Purchase Obligations. TVA has contracted with various independent power producers and LPCs for additional capacity to be made available to TVA. Several of these agreements have contractual minimum payments and are accounted for as either capitalfinance or operating leases. In total, these agreements provide 2,2302,455 MW of summer net capability. The remaining terms of the agreements range up to fifteen years14 years. Additionally, TVA has contracted with regional transmission organizations to reserve 1,4502,450 MW of transmission service to support purchases from the market and wind power purchase agreements.PPAs. The remaining terms of these agreements range up to fifteen4 years. Excluding lease-related costs, TVA incurred $178$202 million, $218$202 million, and $218$195 million of expense under these power purchase and transmission service agreements during 2017, 2016,2021, 2020, and 2015,2019, respectively. Lease-related costs under TVA’s
TVA has one power purchase agreements not accountedagreement that meets the definition of an unconditional purchase obligation. At September 30, 2021, the non-lease portion of the commitment for as capital leaseseach of the next five years are included in TVA's consolidated statements of operations as purchased power expense and are expensed as incurred.shown below:
| | | | | | | | | | | | | | | | | | | | | | | | | | | | | | | | | | | | | | |
| | | 2022 | | 2023 | | 2024 | | 2025 | | 2026 | | Thereafter |
| Unconditional purchase obligation | | $ | 138 | | | $ | 138 | | | $ | 138 | | | $ | 138 | | | $ | 137 | | | $ | 754 | |
| | | | | | | | | | | | |
Under federal law, TVA is obligated to purchase power from qualifying facilities (cogenerators and small power producers). As of September 30, 2017,2021, there was a combined qualifying facility capacity of 258270 MW from 30369 different generation sources, from which TVA purchased power under this law.
Membership Interests of VIE Subject to Mandatory RedemptionUnfunded Loan Commitments. At September 30, 2017, TVA had outstanding membership interests subject to mandatory redemption (including current portion) of $32 million issued by one of its VIEs of which it is the primary beneficiary. See Note 10 for additional information. At September 30, 2017, the mandatory redemptions for each of the next five years are shown below:
|
| | | | | | | | | | | | | | | | | | | | |
| | | 2018 | | 2019 | | 2020 | | 2021 | | 2022 |
| Membership interests of variable interest entity subject to mandatory redemption | | $ | 2 |
| | $ | 2 |
| | $ | 3 |
| | $ | 3 |
| | $ | 3 |
|
Leases. TVA leases certain property, plant, and equipment under agreements with terms ranging from one to 38 years. TVA’s rental expense for operating leases, including power purchase agreement operating leases, was $90 million in 2017, $86 million in 2016, and $88 million in 2015. At September 30, 2017, the future minimum lease payments under operating leases, including purchased power agreements that are accounted for as operating leases, are shown below.
|
| | | | |
Operating Leases
Minimum payments due in years ending September 30 |
| 2018 | | $ | 67 |
|
| 2019 | | 60 |
|
| 2020 | | 59 |
|
| 2021 | | 59 |
|
| 2022 | | 45 |
|
| Thereafter | | 13 |
|
| Total | | $ | 303 |
|
At September 30, 2017, the future minimum lease payments under capital leases are shown below.
|
| | | | |
Capital Leases Minimum payments due in years ending September 30 |
| 2018 | | $ | 52 |
|
| 2019 | | 51 |
|
| 2020 | | 51 |
|
| 2021 | | 51 |
|
| 2022 | | 51 |
|
| Thereafter | | 519 |
|
| Minimum annual payments | | 775 |
|
| Less: amount representing interest | | (588 | ) |
| Total | | $ | 187 |
|
Leasebacks. At September 30, 2017, and 2016, the outstanding leaseback obligations related to CTs and QTE were $338 million and $467 million, respectively. See Note 13 — Lease/Leasebacks. At September 30, 2017, the future minimum payments under leaseback obligations are shown below.
|
| | | | |
Lease/Leasebacks Minimum payments due in years ending September 30 |
| 2018 | | $ | 50 |
|
| 2019 | | 49 |
|
| 2020 | | 50 |
|
| 2021 | | 207 |
|
| 2022 | | 25 |
|
| Thereafter | | — |
|
| Total | | $ | 381 |
|
Unfunded Loan Commitments. At September 30, 2017,2021, TVA's commitments under unfunded loan commitments were $4 million for each of the next five years are shown below:
|
| | | | | | | | | | | | | | | | | | | | |
Unfunded Loan Commitments Payments due in the years ending September 30 |
| | | 2018 | | 2019 | | 2020 | | 2021 | | 2022 |
| Unfunded loan commitments | | $ | 12 |
| | $ | — |
| | $ | — |
| | $ | — |
| | $ | — |
|
In addition to the commitments above,2022. TVA has contractual obligations in the form of revenue discounts related to energy prepayments. See Note 1 — Energy Prepayment Obligations.no commitments under unfunded loan commitments for 2023 through 2026.
|
| | | | | | | | | | | | | | | | | | | | | | | | | | | | |
Energy Prepayment Obligations Payments due in the years ending September 30 |
| | | 2018 | | 2019 | | 2020 | | 2021 | | 2022 | | Thereafter | | Total |
| Energy prepayment obligations | | $ | 100 |
| | $ | 10 |
| | $ | — |
| | $ | — |
| | $ | — |
| | $ | — |
| | $ | 110 |
|
| Interest payments relating to energy prepayment obligations | | 46 |
| | 4 |
| | — |
| | — |
| | — |
| | — |
| | 50 |
|
| Total | | $ | 146 |
| | $ | 14 |
| | $ | — |
| | $ | — |
| | $ | — |
| | $ | — |
| | $ | 160 |
|
Other Commitments. See Note 8 — Leases,Note 11 — Variable Interest Entities, Note 14 — Debt and Other Obligations, and Note 22 — Benefit Plans for theobligations and commitments attributable to leases, VIEs and membership interests of VIEs subject to mandatory redemption, leaseback obligations, and the retirement plan, respectively.
Contingencies
Nuclear Insurance. Section 170 of the Atomic Energy Act, commonly known as the Price-Anderson Act, provides a layered framework of financial protection to compensate for liability claims of members of the public for personal injury and property damages arising from a nuclear eventincident in the United States. For the first layer, allU.S. This financial protection consists of the NRC nuclear plant licensees, including TVA, purchase $450 million2 layers of nuclear liabilitycoverage:
•The primary level is private insurance fromunderwritten by American Nuclear Insurers ("ANI") and provides public liability insurance coverage of $450 million for each nuclear power plant with an operating license. Funds forlicensed to operate. If this amount is not sufficient to cover claims arising from a nuclear incident, the second layer,level, Secondary Financial Protection, applies.
•Within the Secondary Financial Program, would come from an assessmentProtection level, the licensee of each nuclear reactor has a contingent obligation to pay a retrospective premium, equal to its proportionate share of the loss in excess of the primary level, regardless of proximity to the incident of fault, up to $127a maximum of approximately $138 million fromper reactor per incident. With TVA's 7 reactors, the licensees of each of the 102 NRC licensed reactors in the United States. The assessment for any nuclear accident would be limited to $19maximum total contingent obligation per incident is $963 million. This retrospective premium is payable at a maximum rate currently set at approximately $20 million per year per unit. American Nuclear Insurers, under a contract with the NRC, administersincident per reactor. Currently, 95 reactors are participating in the Secondary Financial Program. With its seven licensed units, TVA could be required to payProtection program.
In the event that a maximum of $891 million per nuclear incident but it would haveresults in public liability claims, the primary level provided by ANI combined with the Secondary Financial Protection should provide up to pay no more than $133 million per incidentapproximately $13.5 billion in any one year. When the contributions of thecoverage.
nuclear plant licensees are added to the insurance proceeds of $450 million, over $13.0 billion, including a five percent surcharge for legal expenses, would be available. Under the Price-Anderson Act, if the first two layers are exhausted, the U.S. Congress is required to take action to provide additional funds to cover the additional losses.
Federal law requires that each NRC power reactor licensee obtain property insurance from private sources to cover the cost of stabilizing or shutting downand decontaminating a reactor and its station site after an accident. TVA carries property, decommissioning liability, and decontamination liability insurance from Nuclear Electric Insurance Limited ("NEIL"), totaling $5.1 billion and European Mutual Association for its licensed nuclear plants withNuclear Insurance. The limits for each site vary depending on the site and range from up to $2.1 billion to $2.8 billion available for a loss at any one site.TVA's three sites. Some of this insurance may require the payment of retrospective premiums up to a maximum of approximately $126$128 million.
TVA purchases accidental outage (business interruption) insurance for TVA’sTVA's nuclear sites from NEIL. In the event that an accident covered by this policy takes a nuclear unit offline or keeps a nuclear unit offline, NEIL will pay TVA, after a waiting period, an indemnity (a set dollar amount per week) up towith a maximum indemnity of $490 million per unit. This insurance policy may require the payment of retrospective premiums up to a maximum of approximately $43 million.million, but only to the extent the retrospective premium is deemed necessary by the NEIL Board of Directors to pay losses unable to be covered by NEIL's surplus.
Decommissioning Costs. TVA recognizes legal obligations associated with the future retirement of certain tangible long-lived assets related primarily to nuclear generating plants, coal-fired generating plants, hydroelectric generating plants/dams, transmission structures, and other property-related assets. See Note 12.13 — Asset Retirement Obligations.
Nuclear Decommissioning. Provision for decommissioning costs of nuclear generating units is based on options prescribed by the NRC procedures to dismantle and decontaminate the facilities to meet the NRC criteria for license termination. At September 30, 2017,2021, $3.4 billion, representing the discounted value of future estimated future decommissioning cost of $2.9 billioncosts, was included in AROs. The actual decommissioning costs may vary from the derived estimates because of, among other things, changes in current assumptions, such as the assumed dates of decommissioning, changes in regulatory requirements, changes in technology, and changes in the cost of labor, materials, and equipment. Utilities that own and operate nuclear plants are required to use different procedures in calculating nuclear decommissioning costs under GAAP than those that are used in calculating nuclear decommissioning costs when reporting to the NRC. The two2 sets of procedures produce different estimates for the costs of decommissioning primarily because of differences in the underlying assumptions. Decommissioning costs studies are updated for each of TVA's nuclear units at least every five years.
TVA maintains aan NDT to provide funding for the ultimate decommissioning of its nuclear power plants. See Note 16.17 — Fair Value Measurements — Investment Funds. TVA monitors the value of its NDT and believes that, over the long term and before cessation of nuclear plant operations and commencement of decommissioning activities, adequate funds from investments and additional contributions, if necessary, will be available to support decommissioning. TVA’sTVA's operating nuclear power units are licensed through various dates between 2033 - 2055, depending on the unit. It may be possible to extend the operating life of some of the units with approval from the NRC. See Note 710 — Regulatory Assets and Liabilities — Nuclear Decommissioning Costs and Note 12.13 — Asset Retirement Obligations.
Non-Nuclear Decommissioning. The estimated future non-nuclear decommissioning ARO was $1.4 billion atAt September 30, 2017.2021, $3.6 billion, representing the discounted value of future estimated decommissioning costs, was included in AROs. This decommissioning cost estimate involves estimating the amount and timing of future expenditures and making judgments concerning whether or not such costs are considered a legal
obligation. Estimating the amount and timing of future expenditures includes, among other things, making projections of the timing and duration of the asset retirement process and how costs will escalate with inflation. The actual decommissioning costs may vary from the derived estimates because of changes in current assumptions, such as the assumed dates of decommissioning, changes in regulatory requirements, changes in technology, and changes in the cost of labor, materials, and equipment. TVA updates its underlying assumptions for non-nuclear decommissioning AROs at least every five years. However, material changes in underlying assumptions that impact the amount and timing of undiscounted cash flows are continuously monitored and incorporated into ARO balances in the period identified.
TVA maintains an ART to help fund the ultimate decommissioning of its non-nuclear power assets. See Note 16.17 — Fair Value Measurements — Investment Funds. Estimates involved in determining if additional funding will be made to the ART include inflation rate, rate of return projections on the fund investments, and the planned use of other sources to fund decommissioning costs. See Note 710 — Regulatory Assets and Liabilities — Non-Nuclear Decommissioning Costs and Note 12.13 — Asset Retirement Obligations.
Environmental Matters. TVA’s TVA's power generation activities, like those across the utility industry and in other industrial sectors, are subject to federal, state, and local environmental laws and regulations. Major areas of regulation affecting TVA’sTVA's activities include air quality control, greenhouse gas ("GHG") emissions, water quality control, and management and disposal of solid and hazardous wastes. In the future, regulations in all of these areas are expected to become more stringent. Regulations are also expected to apply to new emissions and sources, withhave a particular emphasis on climate change, renewable generation, and energy efficiency.
TVA has incurred, and expects to continue to incur, substantial capital and operating and maintenance costs to comply with evolving environmental requirements primarily associated with, but not limited to, the operation of TVA’sTVA's coal-fired and natural gas-fired generating units.units in general. Environmental requirements placed on the operation of TVA’sTVA's coal-fired and other generating units will likely continue to become more restrictive over time. Litigation over emissions or discharges from coal-fired generating units is also occurring, including litigation against TVA. Failure to comply with environmental and safety lawsrequirements can result in TVA being subject to enforcement actions, which can lead to the imposition of significant civil liability, including fines and penalties, criminal sanctions, and/or the shutting down of non-compliant facilities.
From the 1970s1970 to 2017,2021, TVA spent approximately $6.7$6.8 billion to reduce emissions from its power plants, including $206$17 million, $259$19 million, and $315$17 million in 2017, 2016,2021, 2020, and 2015,2019, respectively, on clean air controls. TVA estimates that
compliance with existing and future Clean Air Act ("CAA") requirements (excluding greenhouse gas ("GHG")GHG requirements) could lead to costs of $200$159 million from 20182022 to 2022,2026, which include future clean air controls, existing controls capital projects and air operations and maintenance projects. The majority of the $200 million is expected to be spent by 2018 on new controls at Gallatin and Shawnee Fossil Plants. TVA also estimates additional expenditures of approximately $1.1 billion$789 million from 20182022 to 20222026 relating to TVA’sTVA's CCR conversion program, not including costs related to any new requirements related to the Gallatin lawsuits,Conversion Program, as well as expenditures of approximately $500$148 million from 20182022 to 20262024 relating to compliance with Clean Water Act ("CWA") requirements. Future costs could differ from these estimates if new environmental laws or regulations become applicable to TVA or the facilities it operates, or if existing environmental laws or regulations are revised or reinterpreted. There could also be costs that cannot reasonably be predicted at this time, due to uncertainty of actions, that could increase these estimates.
Compliance with the EPA's CCR rule required implementation of a groundwater monitoring program, additional engineering, and ongoing analysis. As further analyses are performed, including evaluation of monitoring results, there is the potential for additional costs for investigation and/or remediation. These costs cannot reasonably be predicted until a final remedy is selected, if necessary.
Liability for releases and cleanup of hazardous substances is primarily regulated by the federal Comprehensive Environmental Response, Compensation, and Liability Act ("CERCLA"), the Resource Conservation and Recovery Act ("RCRA"), and other federal and parallel state statutes. In a manner similar to many other industries and power systems, TVA has generated or used hazardous substances over the years.
TVA operations at some facilities have resulted in contaminationreleases of contaminants that TVA has addressed or is addressing.addressing consistent with state and federal requirements. At September 30, 2017,2021 and September 30, 2016, TVA’s2020, TVA's estimated liability for required cleanup and similar environmental work for those sites for which sufficient information is available to develop a cost estimate was approximately $7$18 million and $23$14 million, respectively, on a non-discounted basis, and was included in Accounts payable and accrued liabilities and Other long-term liabilities on the Consolidated Balance Sheets. Additionally, the potential inclusion of new hazardous substances under CERCLA and RCRA jurisdiction may significantly affect TVA's future liability for remediating historical releases.
Potential Liability Associated with Workers' Exposure to CCR Materials. In response to the 2008 ash spill at Kingston Fossil Plant ("Kingston"), TVA hired Jacobs Engineering Group, Inc. ("Jacobs") to oversee certain aspects of the cleanup. After the cleanup was completed, Jacobs was sued in the U.S. District Court for the Eastern District of Tennessee ("Eastern District") by employees of a contractor involved in the cleanup and family members of some of the employees. The plaintiffs alleged that Jacobs had failed to take or provide proper health precautions and misled workers about the health risks associated with exposure to coal fly ash, which is a CCR material. The plaintiffs alleged that exposure to the fly ash caused a variety of significant health issues and illnesses, including in some cases death. The case was split into two phases, with the first phase considering, among other issues, general causation and the second determining specific causation and damages. On November 7, 2018, a jury hearing the first phase returned a verdict in favor of the plaintiffs, including determinations that Jacobs failed to adhere to its contract with TVA or the Site Wide Safety and Health Plan; Jacobs failed to provide reasonable care to the plaintiffs; and Jacobs's failures were capable of causing a list of medical conditions, ranging from hypertension to cancer. On January 11, 2019, the Eastern District referred the parties to mediation. Mediation has concluded, but the parties did not resolve the matter.
On August 24, 2021, the U.S. Court of Appeals for the Sixth Circuit accepted Jacobs’s petition for interim appeal on issues relating to the availability of derivative governmental immunity as a defense to the plaintiffs’ claims. On September 29, 2021, the Eastern District certified four questions to the Tennessee Supreme Court regarding the applicability of the Tennessee Silicosis Claims Priority Act to the plaintiffs’ claims. The Eastern District’s order also stayed all proceedings pending the Tennessee Supreme Court’s decision. If the litigation proceeds to the second phase, the principal question for resolution will be whether Jacobs's breaches were the specific medical cause of the plaintiffs' alleged injuries and damages. No trial date has been set for the second phase.
Other contractor employees and family members have filed lawsuits against Jacobs that are pending in the Eastern District. These pending lawsuits are stayed and raise similar claims to those being litigated in the case referenced above.
While TVA is not a party to any of these lawsuits, TVA may potentially have an indemnity obligation to reimburse Jacobs for some amounts that Jacobs is required to pay. TVA will continue monitoring the litigation to determine whether these or similar cases could have broader implications for the utility industry. TVA does not expect any potential liability to have a material adverse impact on its results of operations or financial condition.
Legal Proceedings
From time to time, TVA is party to or otherwise involved in lawsuits, claims, proceedings, investigations, and other legal matters ("Legal Proceedings") that have arisen in the ordinary course of conducting TVA's activities, as a result of a catastrophic event or otherwise.
General. At September 30, 2017,2021, TVA had accrued $22$13 million of probable losses with respect to Legal Proceedings. Of the accrued amount, $13$12 million is included in Other long-term liabilities and $9$1 million is included in Accounts payable and accrued liabilities. No assurance can be given that TVA will not be subject to significant additional claims and liabilities. If actual liabilities significantly exceed the estimates made, TVA's results of operations, liquidity, and financial condition could be materially adversely affected.
Environmental Agreements. In April 2011, TVA entered into two2 substantively similar agreements, one1 with the EPA and the other with Alabama, Kentucky, North Carolina, Tennessee, and three environmental advocacy groups: the Sierra Club, the National Parks Conservation Association, and Our Children's Earth Foundation (collectively, the "Environmental Agreements”Agreements"). They became effective in June 2011. Under the Environmental Agreements, TVA committed to, (1) retire on a phased schedule 18 coal-firedamong other things, take actions regarding coal units with a combined summer net dependable capability of 2,200 MW, (2) control, convert, or retire additional coal-fired units with a combined summer net dependable capability of 3,500 MW, (3) comply with annual, declining emission caps for SO2 and NOx, (4)that have been completed. TVA also agreed to invest $290$290 million in certain TVA environmental projects (ofof which TVA had spent approximately $275$281 million as of September 30, 2017), (5) provide $60 million to Alabama, Kentucky, North Carolina, and Tennessee2021. Additionally, TVA holds restricted cash in an interest earning trust to fund the remaining project commitments. Any interest earned through the trust must also be spent on agreed upon environmental projects, and (6) pay civil penaltiesprojects. The total remaining committed spend, including interest earned through the trust, was approximately $10 million as of $10 million. September 30, 2021. In exchange for these commitments, most past claims against TVA based on alleged New Source Review ("NSR") and associated violations were waived and cannot be brought against TVA. Future claims, including those for sulfuric acid mist and GHG emissions, can still be brought against TVA, and claims for increases in particulates can also be pursued at many of TVA’s coal-fired units. Additionally, the Environmental Agreements do not address compliance with new laws and regulations or the cost associated with such compliance.TVA.
The liabilities related to the Environmental Agreements are included in Accounts payable and accrued liabilities and Other long-term liabilities on the September 30, 20172021, Consolidated Balance Sheet.Sheets. In conjunction with the approval of the Environmental Agreements, the TVA Board determined that it was appropriate to record TVA's obligations under the Environmental Agreements as regulatory assets, and they are included as such on the September 30, 20172021, Consolidated Balance SheetSheets and will be recovered in rates in future periods.
Case Involving Kingston Fossil Plant. On August 12, 2021, an individual landowner and resident of Roane County, Tennessee, filed a lawsuit against TVA and Jacobs in the U.S. District Court for the Eastern District of Tennessee. The complaint asserts claims for damage to property and personal injuries as a result of the 2008 ash spill at Kingston Fossil Plant and the resulting cleanup activities and from continuing operations at Kingston Fossil Plant. The complaint seeks compensatory damages of $8 million and punitive damages of $10 million. It also requests the court to order TVA to release certain information, to remediate alleged damages to the plaintiff's property, and to stop alleged migration of coal ash onto the plaintiff's property.
Case Involving Bull Run Fossil Plant. On August 3, 2021, four residents of Anderson County, Tennessee filed a lawsuit against TVA in the U.S. District Court for the Eastern District of Tennessee. The complaint alleges that the plaintiffs live near Bull Run Fossil Plant ("Bull Run") and asserts claims for personal injuries resulting from exposures to coal combustion residuals ("CCR") that migrated from Bull Run to their home and from second-hand exposures to CCR from a family member who worked with CCR. The complaint also asserts claims for damage to property resulting from the migration of CCR from Bull Run to their home. Plaintiffs seek monetary damages in an unspecified amount as compensation for their injuries and an award of punitive damages in an unspecified amount. The plaintiffs previously filed a similar lawsuit in the U.S. District Court for the Eastern District of Tennessee that had been dismissed without prejudice on August 4, 2020.
Case Involving Tennessee Valley Authority Retirement SystemRiver Boat Accident. In March 2010, eight current and former participants in and beneficiaries of TVARSJuly 2015, plaintiffs filed suit in the U.S. District Court for the MiddleNorthern District of Alabama ("Northern District"), seeking recovery for personal injuries sustained when the plaintiffs' boat struck a TVA transmission line that was being raised from the Tennessee challenging the TVARS Board's 2009 decision to amend the TVARS Rules and Regulations (“Rules”) in exchange forRiver during a $1.0 billion contribution from TVA.repair operation. The changes approved by the TVARS Board (1) suspended the TVA contribution requirements for 2010 through 2013, (2) reduced the calculation for COLAs for CY 2010 through CY 2013, (3) reduced the interest crediting rate for the fixed fund accounts, and (4) increased the eligibility age to receive COLAs from age 55 to 60. The plaintiffs alleged that these changes violated their constitutional rights (due process, equal protection, and property rights), violated the Administrative Procedure Act, and violated the substantive and procedural componentsNorthern District
dismissed the case, with prejudice.finding that TVA's exercise of its discretion as a governmental entity in deciding how to carry out the operation barred any liability for negligence. In September 2015,August 2017, the U.S. Court of Appeals for the Eleventh Circuit ("Eleventh Circuit") affirmed the decision. The plaintiffs appealed thispetitioned the Supreme Court for review of the decision, arguing that the provision of the TVA Act that allows suit to be brought against TVA does not allow TVA to claim immunity for discretionary actions. In April 2019, the Supreme Court issued its opinion reversing the judgment of the Eleventh Circuit and remanding the case to the SixthEleventh Circuit. On August 12, 2016,In July 2019, the SixthEleventh Circuit held thatremanded the plaintiffs’ rights were not violated because COLAs are not vested benefits. A few other issues were remandedcase to the district court for further proceedings. On March 2, 2017,proceedings consistent with the district court granted TVA'sSupreme Court's opinion. TVA filed a motion for summary judgment on all of the plaintiffs’ claims on November 23, 2020, and the plaintiffs filed a judgment
motion for partial summary judgment. The court cancelled the trial scheduled for February 16, 2021, and stated that the trial would be rescheduled, if necessary, following the court’s ruling on the administrative recordparties’ summary judgment motions. On April 9, 2021, the court issued a memorandum opinion and dismissed allorder granting in part and denying in part TVA’s summary judgment motion. The court denied in full the plaintiffs’ summary judgment motion. On June 15, 2021, through judicially hosted mediation, the parties agreed to settle the remaining claimsclaims. The parties filed a stipulation of dismissal on July 2, 2021, and on July 7, 2021, the court dismissed the case with prejudice.
Case Involving Bellefonte Nuclear Plant. In November 2018, Nuclear Development filed suit against TVA in this case.the U.S. District Court for the Northern District of Alabama. Nuclear Development alleged that TVA breached its agreement to sell Bellefonte Nuclear Plant ("Bellefonte"). As a remedy, Nuclear Development sought, among other things, (1) an injunction requiring TVA to maintain Bellefonte and the associated NRC permits until the case concluded; (2) an order compelling TVA to complete the sale of Bellefonte; and (3) if the court does not order TVA to complete the sale, monetary damages in excess of $30 million. On September 23, 2020, the parties filed competing motions for summary judgment. On March 31, 2017,2021, the plaintiffscourt denied both parties' summary judgment motions; however, the court ruled as a matter of law that it would have been illegal under Section 101 of the Atomic Energy Act for TVA to close the sale, relying on past NRC precedent to reach that conclusion. Notwithstanding the legal rulings, the court held that there were disputed issues of material fact as to whether TVA satisfied its contractual obligations to use commercially reasonable best efforts and to cooperate with Nuclear Development in effectuating the close of the sale. Trial took place in May 2021, and the parties filed post-trial briefs on June 9, 2021. Nuclear Development also filed a motion for judgment on partial findings and to reconsider the court's March 31 ruling. The court held closing arguments on July 1, 2021, and on August 26, 2021, the court issued its decision and final judgment. The court held that TVA did not breach its obligations to use commercially reasonable best efforts and to cooperate with Nuclear Development in effectuating the close of the sale. As a result, Nuclear Development is not entitled to specific performance or damages on that claim, and TVA retains full possession and control of the Bellefonte site; however, the court found that, under the contract's termination provision, Nuclear Development was entitled to have TVA return Nuclear Development's $22 million down payment and pay approximately $1 million of compensated costs, along with 7.5% prejudgment interest. Including post-judgment interest, TVA paid approximately $28 million to the court in September 2021 to satisfy the judgment. Post-trial motions have been filed by both parties and are currently pending.
Case Involving Rate Changes. On June 9, 2020, a proposed class action lawsuit was filed against TVA and one of its LPCs, Bristol Virginia Utilities Authority ("BVUA"), in federal court in Abingdon, Virginia, by a LPC customer, asserting claims for breach of contract and violation of the Administrative Procedure Act. The lawsuit alleges that the customers of TVA's LPCs are third-party beneficiaries under TVA's wholesale power contracts with its LPCs and that TVA’s rate changes dating back to 2010 violate Section 11 of the TVA Act. Section 11 of the TVA Act establishes the broad policy that TVA power projects shall be considered primarily for the benefit of the people of the Tennessee Valley and that service to industry is a secondary purpose to be used principally to secure a sufficiently high load factor and revenue returns to permit domestic and rural use at the lowest possible rates. The remedies requested include an injunction prohibiting TVA rate changes that violate Section 11, monetary damages, and repayment of rates charged in violation of Section 11. TVA and BVUA filed motions to dismiss the case on November 9, 2020, and filed supplemental motions to dismiss on December 21, 2020, in response to an amended complaint filed by the plaintiff. Oral argument on the motions was held on February 18, 2021, and on March 19, 2021, the court granted TVA’s and BVUA's motions to dismiss. The plaintiff appealed the district court's decisionjudgment to the Sixth Circuit.U.S. Court of Appeals for the Fourth Circuit ("Fourth Circuit") on April 15, 2021. The parties filed their briefs with the Fourth Circuit and are waiting for the court to inform them whether it will request oral argument or will decide the appeal based on the briefs.
CasesCase Involving Gallatin Fossil Plant CCR Facilities. TVA is a party in two lawsuits relating to alleged releases of waste materials from the CCR facilities at Gallatin. See Note 8 — Background — Lawsuit Brought by TSRA and TCWN and Lawsuit Brought by TDEC.
Administrative Proceeding Regarding Browns Ferry Nuclear Plant Extended Power Uprate. In September 2016, the Bellefonte Efficiency and Sustainability Team and Mothers Against Tennessee River Radiation requested a hearing and sought to intervene in TVA’s license amendment request for extended power uprates at Browns Ferry Nuclear Plant. The petitioners contend that TVA's application did not correctly report the potential risk from operating at increased power levels. TVA and the NRC staff filed answers opposing the petition to intervene in October 2016. The Atomic Safety and Licensing Board ("ASLB") rejected the petition to intervene in November 2016. In April 2017, the NRC affirmed the ASLB's decision to deny the petition, which terminated the administrative proceeding.
Petitions to Intervene in the Proceeding Involving the Early Site Permit Application for Small Modular Reactors at TVA's Clinch River SiteLong-Term Agreements. Three environmental groupsOn August 17, 2020, the Southern Alliance for Clean EnergyEnvironmental Law Center ("SACE"SELC"), Tennessee Environmental Council ("TEC"), and Blue Ridge Environmental Defense League ("BREDL") filed petitions to intervene in the proceeding regarding the Early Site Permit Application that TVA submitted for review by the NRC in May 2016 relating to the potential future construction and operation of two or more small modular reactor units at TVA’s Clinch River site in Oak Ridge, Tennessee. On October 10, 2017, the Atomic Safety and Licensing Board issued a decision admitting two contentions proffered jointly by SACE and TEC and dismissing a third. The decision also denied admission of BREDL’s one proffered contention.
Bull Run Fossil Plant Clean Air Act Permit. In September 2015, the Sierra Club and Environmental Integrity Project filed a petition with the EPA requesting that the EPA object to the CAA renewal permit issued by TDEC to TVA for operations at Bull Run. The petitioners alleged that the permit contained impermissibly lax monitoring requirements for opacity. In February 2016, the petitioners sued the EPA for not responding to the petition in a timely manner. In August 2016, the United States District Court for the District of Columbia entered a consent decree requiring the EPA to respond to the petition by November 10, 2016. On November 10, 2016, the EPA granted the petition and ordered TDEC to revise the permit to assure compliance with the opacity limits. TDEC revised the permit in accordance with the EPA's order and released it for public comment on February 7, 2017. No comments were received and TDEC issued a final permit, which became effective on April 10, 2017. The final permit provides that compliance with the particulate matter ("PM") limit is deemed sufficient to demonstrate compliance with the opacity limit. TVA plans to continue to meet the PM limit in the permit.
Gallatin Fossil Plant Clean Air Act Permit. In August 2016, the Sierra Club filed a petition with the EPA requesting that the EPA object to the CAA renewal permit issued by TDEC to TVA for operations at Gallatin. The petition alleges that the permit (1) contains compliance evaluation requirements for opacity, particulate matter, and fugitive dust that are not as stringent as required, (2) includes allowances for startup, shutdown, and malfunctions that are inconsistent with the CAA, (3) fails to include reporting requirements to ensure compliance with the Environmental Agreements, and (4) contains impermissibly high SO2 emission limits. The EPA has not yet acted on the petition. On May 15, 2017, the Sierra Club filed a lawsuit in the United States District Court for the Western District of Columbia seekingTennessee on behalf of three environmental groups alleging that, beginning in August 2019, TVA violated the National Environmental Policy Act ("NEPA") and Section 10 of the TVA Act by offering a Long-Term Agreement ("LTA") to compelits LPCs. The environmental groups represented by SELC are Protect Our Aquifer, Energy Alabama, and Appalachian Voices.
The environmental groups claim that TVA violated NEPA because (1) TVA failed to perform an environmental review of the EPALTAs, which harmed the groups' advocacy efforts and their ability to actparticipate in and to inform TVA's decision, and (2) the LTAs will have a negative effect on the petition. TDEC issuedenvironment by increasing TVA's reliance on coal and gas and impeding TVA's customers' efforts to institute renewable energy options. The groups also claim that the LTAs violate Section 10 of the TVA Act, which authorizes TVA to enter into power contracts "for a publicterm not exceeding twenty years," because, the groups allege, the twenty-year rolling contract with a twenty-year notice of termination requirement makes the LTAs effectively "never ending."
The environmental groups request the federal court to (1) declare that TVA's entry into long-term power agreements without preparing an environmental review violated NEPA and the TVA Act, (2) vacate the long-term contracts, and (3) enjoin TVA
from implementing "system-wide energy contract programs that significantly affect the environment." TVA filed a motion to dismiss the case on July 3, 2017, proposingOctober 20, 2020, and filed a supplemental motion to revisedismiss on December 4, 2020, in response to an amended complaint filed by the CAA renewal permit. The periodplaintiffs. Oral argument on the motion was held on February 26, 2021, and the court denied TVA's motion to submit comments on this draft permit closeddismiss on August 9, 2017. TDEC will review12, 2021. TVA filed the commentsadministrative record of the challenged decisions, and the plaintiffs filed a motion to complete the administrative record. Oral argument on that motion was held on August 13, 2021.
Challenge to Anti-Cherrypicking Amendment. On January 11, 2021, Athens Utilities Board, Gibson Electric Membership Corporation, Joe Wheeler EMC, and Volunteer Energy Cooperative filed a complaint and petition with FERC asking FERC to order TVA to provide any revisionstransmission and interconnection service to the EPA,LPCs or other suppliers that want to serve them. The petitioners seek to avoid the limitations of the Anti-Cherrypicking Amendment ("ACPA") to the Federal Power Act ("FPA"), which has 45prohibits FERC from ordering TVA to wheel power from another supplier if the power will be consumed within the TVA service territory. The petitioners argue that section 211A of the FPA, which gives FERC limited jurisdiction over the rates, terms, and conditions of transmission service provided by unregulated transmitting utilities such as TVA, provides an alternate grant of authority to enable FERC to order TVA to wheel power inside its service area unrestricted by the application of the ACPA. The petitioners also argue that the public power model is antiquated and TVA’s refusal to wheel power is not in the public interest because it stifles competition. On August 31, 2021, Joe Wheeler EMC notified FERC of its withdrawal from the complaint and petition. On October 21, 2021, FERC denied the petition. Any aggrieved party will have 30 days to review the revisions before the permit becomes final. Gallatin can still operate under the existing permit while the renewal permit is being revised.request a rehearing.
22.24. Related Parties
TVA is a wholly-owned corporate agency of the federal government, and because of this relationship, TVA’sTVA's revenues and expenses are included as part of the federal budget as a revolving fund. TVA’sTVA's purpose and responsibilities as an agency are described under the “Other Agencies”"Other Agencies" section of the federal budget.
TVA currently receives no appropriations from Congress and funds its business using power system revenues, power financings, and other revenues. TVA is a source of cash to the federal government. TVA will indefinitely continue to pay the U.S. Treasury a return on the outstanding $258 million power program appropriation investment.of the Power Program Appropriation Investment. See Note 1719 —Proprietary Capital — Appropriation Investment.
TVA also has access to a financing arrangement with the U.S. Treasury pursuant to the TVA Act. TVA and the U.S. Treasury entered into a memorandum of understanding under which the U.S. Treasury provides TVA with a $150 million credit facility. This credit facility was renewed and has a maturity date of September 30, 2018.2022, and is typically renewed annually. Access to this credit facility or other similar financing arrangements has been available to TVA since the 1960s. See Note 1314 — Debt and Other Obligations — Credit Facility Agreements.
In the normal course of business, TVA contracts with other federal agencies for sales of electricity and other services. Transactions with agencies of the federal government were as follows:
| | | | | | | | | | | | | | | | | |
Related Party Transactions At or for the years ended September 30 |
| | 2021 | | 2020 | | 2019 |
| Revenue from sales of electricity | $ | 109 | | | $ | 105 | | | $ | 118 | |
| Other income | 280 | | | 260 | | | 258 | |
| | | | | |
| Expenditures | | | | | |
| Operating expenses | 214 | | | 224 | | | 222 | |
| Additions to property, plant, and equipment | 10 | | | 9 | | | 10 | |
| Cash and cash equivalents | 30 | | | 31 | | | 45 | |
| Accounts receivable, net | 65 | | | 94 | | | 76 | |
| Investment funds | 573 | | | 485 | | | 279 | |
| Long-term accounts receivable | 31 | | | 27 | | | 53 | |
| Accounts payable and accrued liabilities | 15 | | | 39 | | | 69 | |
| Long-term power bonds, net | 1 | | | 1 | | | — | |
| Return on power program appropriation investment | 4 | | | 6 | | | 6 | |
| | | | | |
|
| | | | | | | | | | | |
Related Party Transactions For the years ended, or at, September 30 |
| | 2017 | | 2016 | | 2015 |
| Revenue from sales of electricity | $ | 126 |
| | $ | 126 |
| | $ | 130 |
|
| Other income | 136 |
| | 161 |
| | 167 |
|
| Expenditures |
|
| |
|
| |
|
|
| Operating expenses | 216 |
| | 216 |
| | 227 |
|
| Additions to property, plant, and equipment | 16 |
| | 32 |
| | 37 |
|
| Cash and cash equivalents | 46 |
| | 54 |
| | 45 |
|
| Accounts receivable, net | 119 |
| | 129 |
| | 106 |
|
| Accounts payable and accrued liabilities | 71 |
| | 77 |
| | 98 |
|
| Long-term power bonds, net | 1 |
| | 4 |
| | 5 |
|
| Return on Power Program Appropriation Investment | 5 |
| | 6 |
| | 5 |
|
23. Unaudited Quarterly Financial Information
A summary of the unaudited quarterly results of operations for the years 2017 and 2016 follows. This summary should be read in conjunction with the audited consolidated financial statements appearing herein. Results for interim periods may fluctuate as a result of seasonal weather conditions, changes in rates, and other factors.
|
| | | | | | | | | | | | | | | | | | | |
Unaudited Quarterly Financial Information
|
| 2017 |
| | First | | Second | | Third | | Fourth | | Total |
| Operating revenues | $ | 2,546 |
| | $ | 2,547 |
| | $ | 2,571 |
| | $ | 3,075 |
| | $ | 10,739 |
|
| Operating expenses | 2,117 |
| | 2,013 |
| | 2,010 |
| | 2,624 |
| | 8,764 |
|
| Operating income | 429 |
| | 534 |
| | 561 |
| | 451 |
| | 1,975 |
|
| Net income (loss) | 102 |
| | 211 |
| | 233 |
| | 139 |
| | 685 |
|
|
| | | | | | | | | | | | | | | | | | | |
Unaudited Quarterly Financial Information
|
| 2016 |
| | First | | Second | | Third | | Fourth | | Total |
| Operating revenues | $ | 2,280 |
| | $ | 2,571 |
| | $ | 2,479 |
| | $ | 3,286 |
| | $ | 10,616 |
|
| Operating expenses | 2,052 |
| | 1,982 |
| | 1,913 |
| | 2,343 |
| | 8,290 |
|
| Operating income | 228 |
| | 589 |
| | 566 |
| | 943 |
| | 2,326 |
|
| Net income (loss) | (37 | ) | | 318 |
| | 291 |
| | 661 |
| | 1,233 |
|
Report of Independent Registered Public Accounting Firm
To the Board of Directors of Tennessee Valley Authority
Opinion on the Financial Statements
We have audited the accompanying consolidated balance sheets of Tennessee Valley Authority (the Company) as of September 30, 20172021 and 2016, and2020, the related consolidated statements of operations, comprehensive income (loss), changes in proprietary capital and cash flows for each of the three years in the period ended September 30, 2017. 2021, and the related notes (collectively referred to as the consolidated financial statements). In our opinion, the consolidated financial statements present fairly, in all material respects, the financial position of the Company at September 30, 2021 and 2020, and the results of its operations and its cash flows for each of the three years in the period ended September 30, 2021, in conformity with U.S. generally accepted accounting principles.
We also have audited, in accordance with the standards of the Public Company Accounting Oversight Board (United States) (PCAOB), the Company's internal control over financial reporting as of September 30, 2021, based on criteria established in Internal Control-Integrated Framework issued by the Committee of Sponsoring Organizations of the Treadway Commission (2013 framework), and our report dated November 12, 2021 expressed an unqualified opinion thereon.
Basis for Opinion
These financial statements are the responsibility of the Company's management. Our responsibility is to express an opinion on thesethe Company’s financial statements based on our audits. We are a public accounting firm registered with the PCAOB and are required to be independent with respect to the Company in accordance with the U.S. federal securities laws and the applicable rules and regulations of the Securities and Exchange Commission and the PCAOB.
We conducted our audits in accordance with the standards of the Public Company Accounting Oversight Board (United States).PCAOB. Those standards require that we plan and perform the audit to obtain reasonable assurance about whether the financial statements are free of material misstatement. An audit includesmisstatement, whether due to error or fraud. Our audits included performing procedures to assess the risks of material misstatement of the financial statements, whether due to error or fraud, and performing procedures that respond to those risks. Such procedures included examining, on a test basis, evidence supportingregarding the amounts and disclosures in the financial statements. An auditOur audits also includes assessingincluded evaluating the accounting principles used and significant estimates made by management, as well as evaluating the overall presentation of the financial statement presentation.statements. We believe that our audits provide a reasonable basis for our opinion.
In our opinion, the financial statements referred to above present fairly, in all material respects, the consolidated financial position
| | | | | | | | |
Critical Audit Matters
The critical audit matters communicated below are matters arising from the current period audit of the financial statements that were communicated or required to be communicated to the Audit, Finance, Risk, and Cybersecurity Committee and that: (1) relate to accounts or disclosures that are material to the financial statements and (2) involved our especially challenging, subjective or complex judgments. The communication of critical audit matters does not alter in any way our opinion on the consolidated financial statements, taken as a whole, and we are not, by communicating the critical audit matters below, providing separate opinions on the critical audit matters or on the accounts or disclosures to which they relate. |
| | Valuation of Pension and Other Post-Retirement Benefit Obligations |
| Description of the Matter | | At September 30, 2021, the Company’s pension benefit obligation was $4.2 billion and the Company’s other post-retirement benefit obligation was $498 million. The Company updates certain actuarial assumptions used to measure the pension benefit and other post-retirement benefit obligations at September 30 or upon a remeasurement event, as more fully described in Note 22 to the consolidated financial statements.
Auditing the pension benefit and other post-retirement benefit obligations was complex due to the judgmental nature of the assumptions, including the discount rates, future compensation levels, mortality rates, healthcare cost trends, and cost of living adjustment, used in the Company’s measurement process. These assumptions have a significant effect on the projected benefit obligations. |
We also have audited, in accordance with the standards of the Public Company Accounting Oversight Board (United States), Tennessee Valley Authority's internal control over financial reporting as of September 30, 2017, based on criteria established in Internal Control-Integrated Framework issued by the Committee of Sponsoring Organizations of the Treadway Commission (2013 framework) and our report dated November 14, 2017 expressed an unqualified opinion thereon. | | | | | | | | |
| | |
| How We Addressed the Matter in Our Audit | | We obtained an understanding, evaluated the design and tested the operating effectiveness of controls over the Company’s accounting for the measurement of pension benefit and other post-retirement benefit obligations. For example, we tested controls over management’s review of the pension benefit obligation and other post-retirement benefit obligation calculations, the relevant data inputs and the significant actuarial assumptions described above.
To test the pension benefit and other post-retirement benefit obligations, our audit procedures included, among others, evaluating the methodologies used, the significant actuarial assumptions described above, and the underlying data used by the Company. We compared the actuarial assumptions used by the Company to historical trends and evaluated the pension benefit and other post-retirement benefit obligations. In addition, we involved an actuarial specialist to assist with our procedures. We evaluated the Company’s methodology for determining the discount rates that reflect the maturity and duration of the benefit payments and used to measure the pension benefit and other post-retirement benefit obligations. To evaluate the future compensation levels, mortality rates, healthcare cost trends and cost of living adjustment, we assessed whether the information is consistent with publicly available information, and whether any market data adjusted for entity-specific adjustments was applied. We also tested the completeness and accuracy of the underlying data, including the participant data, used in the determination of the projected benefit obligations. |
| | | | | | | | |
| | Composite Depreciation Rates |
| Description of the Matter | | At September 30, 2021, the net book value of the Company’s completed plant was $31.7 billion and depreciation expense for the year then ended was $1.4 billion. As discussed in Note 1 of the consolidated financial statements, the composite method aggregates assets with similar economic characteristics into groups and depreciates each of these groups as one asset. When using the composite method, an underlying assumption is that each group of assets, as a whole, is used and depreciated to the end of the group’s recoverable life.
Under the composite method, a depreciation study is completed to review an asset’s service life, salvage value, accumulated depreciation and other factors. A depreciation study is performed at least every five years, with the most recent study performed in 2021. These rates will be the basis of depreciation expense, and therefore will have a significant effect on depreciation expense beginning on October 1, 2021.
Auditing the 2021 depreciation study rates for assets subject to the composite method was complex due to the nature of the methods used in the depreciation study to determine the useful service lives and salvage values of the Company’s assets. |
| How We Addressed the Matter in Our Audit | | We obtained an understanding, evaluated the design and tested the operating effectiveness of controls over the Company’s process related to the depreciation study, including controls over management’s review of the inputs and methods used in the depreciation study.
To test the estimated service lives and salvage values of the Company’s group-life assets, we performed audit procedures that included, among others, obtaining the depreciation study provided by the Company’s third-party engineers and assessing the completeness and accuracy of the data provided to and used by the third-party. We also involved our specialist to evaluate the study. Specifically, our specialist assessed the adequacy and relevance of the data; the nature and basis for the adjustments and calculations used in the study; and the methods and assumptions used by the Company’s third-party specialist and management in determining the service lives and salvage values of assets to perform the depreciation study. |
/s/ Ernst & Young LLP
We have served as the Company’s auditor since 2007
Chattanooga, Tennessee
November 14, 2017
12, 2021
ITEM 9. CHANGES IN AND DISAGREEMENTS WITH ACCOUNTANTS ON ACCOUNTING AND FINANCIAL DISCLOSURE
Not applicable.
ITEM 9A. CONTROLS AND PROCEDURES
Disclosure Controls and Procedures
TVA’sTVA's management, including the President and Chief Executive Officer, the Executive Vice President and Chief Financial and Strategy Officer, and members of the Disclosure Control Committee, including the Vice President and Controller (Principal Accounting Officer) ("management"), evaluated the effectiveness of TVA’sTVA's disclosure controls and procedures (as defined in Rule 13a-15(e) under the Securities Exchange Act of 1934 (the "Exchange Act"))Act) as of September 30, 2017.2021. Based on this evaluation, TVA’sTVA's management, including the President and Chief Executive Officer, the Executive Vice President and Chief Financial Officer, and members of the Disclosure Control Committee, including the Vice President and Controller (Principal Accounting Officer), concluded that TVA’sTVA's disclosure controls and procedures were effective as of September 30, 2017,2021, to ensure that information required to be disclosed by TVA in reports that it files or submits under the Exchange Act, is recorded, processed, summarized, and reported, within the time periods specified in the Securities and Exchange Commission’sCommission's rules and forms, and include controls and procedures designed to ensure that information required to be disclosed by TVA in such reports is accumulated and communicated to TVA’sTVA's management, including the President and Chief Executive Officer, the Executive Vice President and Chief Financial Officer, and members of the Disclosure Control Committee, including the Vice President and Controller (Principal Accounting Officer), as appropriate, to allow timely decisions regarding required disclosure.
Internal Control over Financial Reporting
(a)Management’sManagement's Annual Report on Internal Control over Financial Reporting
TVA’sTVA's management is responsible for establishing and maintaining adequate internal control over financial reporting as defined in Exchange Act Rule 13a-15(f) and required by Section 404 of the Sarbanes-Oxley Act. TVA’sTVA's internal control over financial reporting is designed to provide reasonable, but not absolute, assurance regarding the reliability of financial reporting and the preparation of financial statements in accordance with generally accepted accounting principles. Because of the inherent limitations in all control systems, internal controlscontrol over financial reporting and systems may not prevent or detect misstatements.
TVA’sTVA's management, including the President and Chief Executive Officer, the Executive Vice President and Chief Financial and Strategy Officer, and members of the Disclosure Control Committee, including the Vice President and Controller (Principal Accounting Officer), evaluated the design and effectiveness of TVA’sTVA's internal control over financial reporting as of September 30, 2017,2021, based on the framework in Internal Control — Integrated Framework (2013) issued by the Committee of Sponsoring Organizations of the Treadway Commission. Based on this evaluation, TVA’sTVA's management concluded that TVA’sTVA's internal control over financial reporting was effective as of September 30, 2017.2021.
Although the effectiveness of internal control over financial reporting was not required to be subject to attestation by TVA’sTVA's independent registered public accounting firm, TVA has chosen to obtain such a report. Ernst & Young LLP, the independent registered public accounting firm that audited the financial statements included in this Annual Report, has issued an attestation report on TVA’sTVA's internal control over financial reporting.
(b)Changes in Internal Control over Financial Reporting
During the quarter ended September 30, 2017,2021, there were no changes in TVA’sTVA's internal control over financial reporting that materially affected, or are reasonably likely to materially affect, TVA’sTVA's internal control over financial reporting.
Report of Independent Registered Public Accounting Firm
TheTo the Board of Directors of Tennessee Valley Authority
Opinion on Internal Control over Financial Reporting
We have audited Tennessee Valley Authority’s internal control over financial reporting as of September 30, 2017,2021, based on criteria established in Internal Control-IntegratedControl— Integrated Framework issued by the Committee of Sponsoring Organizations of the Treadway Commission (2013 framework) (the COSO criteria)Criteria). In our opinion, Tennessee Valley Authority’sAuthority (the Company) maintained, in all material respects, effective internal control over financial reporting as of September 30, 2021, based onthe COSO criteria.
We also have audited, in accordance with the standards of the Public Company Accounting Oversight Board (United States) (PCAOB), the consolidated balance sheets of the Companyas of September 30, 2021 and 2020, the related consolidated statements of operations, comprehensive income (loss), changes in proprietary capital and cash flows for each of the three years in the period ended September 30, 2021, and the related notes and our report dated November 12, 2021 expressed an unqualified opinion thereon.
Basis for Opinion
The Company’s management is responsible for maintaining effective internal control over financial reporting and for its assessment of the effectiveness of internal control over financial reporting included in the accompanying Management’s Annual Report on Internal Control over Financial Reporting. Our responsibility is to express an opinion on the company’sCompany’s internal control over financial reporting based on our audit. We are a public accounting firm registered with the PCAOB and are required to be independent with respect to the Company in accordance with the U.S. federal securities laws and the applicable rules and regulations of the Securities and Exchange Commission and the PCAOB.
We conducted our audit in accordance with the standards of the Public Company Accounting Oversight Board (United States).PCAOB. Those standards require that we plan and perform the audit to obtain reasonable assurance about whether effective internal control over financial reporting was maintained in all material respects.
Our audit included obtaining an understanding of internal control over financial reporting, assessing the risk that a material weakness exists, testing and evaluating the design and operating effectiveness of internal control based on the assessed risk, and performing such other procedures as we considered necessary in the circumstances. We believe that our audit provides a reasonable basis for our opinion.
Definition and Limitations of Internal Control Over Financial Reporting
A company’s internal control over financial reporting is a process designed to provide reasonable assurance regarding the reliability of financial reporting and the preparation of financial statements for external purposes in accordance with generally accepted accounting principles. A company’s internal control over financial reporting includes those policies and procedures that (1) pertain to the maintenance of records that, in reasonable detail, accurately and fairly reflect the transactions and dispositions of the assets of the company; (2) provide reasonable assurance that transactions are recorded as necessary to permit preparation of financial statements in accordance with generally accepted accounting principles, and that receipts and expenditures of the company are being made only in accordance with authorizations of management and directors of the company; and (3) provide reasonable assurance regarding prevention or timely detection of unauthorized acquisition, use, or disposition of the company’s assets that could have a material effect on the financial statements.
Because of its inherent limitations, internal control over financial reporting may not prevent or detect misstatements. Also, projections of any evaluation of effectiveness to future periods are subject to the risk that controls may become inadequate because of changes in conditions, or that the degree of compliance with the policies or procedures may deteriorate.
In our opinion, Tennessee Valley Authority maintained, in all material respects, effective internal control over financial reporting as of September 30, 2017, based on the COSO criteria.
We also have audited, in accordance with the standards of the Public Company Accounting Oversight Board (United States), the consolidated balance sheets of Tennessee Valley Authority as of September 30, 2017 and 2016, and the related consolidated statements of operations, comprehensive income (loss), changes in proprietary capital, and cash flows for each of the three years in the period ended September 30, 2017, and our report dated November 14, 2017 expressed an unqualified opinion thereon.
/s/ Ernst & Young LLP
Chattanooga, Tennessee
November 14, 201712, 2021
ITEM 9B. OTHER INFORMATION
2022 CEO Compensation
On November 9, 2017,10, 2021, the TVA Board of Directors approved adjustments to the compensation of Chief Executive Officer William D. Johnson("CEO") Jeffrey J. Lyash for 2018.2022.
The following sets forth the components of Mr. Johnson’s base salary will increase from $995,000 to $1,050,000. Mr. Johnson was awarded a performance grantLyash's 2022 target total direct compensation ("LTP"TDC") of $2,315,250 under TVA’s Long-Term Incentive Plan ("LTIP"), effective October 1, 2017,2021:
•Salary increased from $1,100,000 to $1,152,250.
•Long-term performance ("LTP") grant of $3,556,000, which will vest on September 30, 2020. Mr. Johnson was also awarded a2024.
•Long-term retention grant ("LTR") grant of $992,250 under TVA’s LTIP effective October 1, 2017,$1,524,000, which will vest in three equal increments on September 30, 2018,2022, September 30, 2019,2023, and September 30, 2020, subject2024.
No adjustments were made to his being employed through such dates.any other existing elements of compensation for Mr. Lyash for 2022.
Compensation Adjustments for Other NEOs
On November 9, 2017, Mr. Johnson10, 2021, CEO Jeffrey J. Lyash approved compensation adjustments for the following Named Executive Officers ("NEOs") for 2018:2022. (Biographical information for each is set out in Item 10, Directors, Executive Officers, and Corporate Governance.) The following sets forth salary increases and incentive awards granted for 2022, effective October 1, 2021:
The salary for Mr.John M. Thomas, will increaseIII
•Salary increased from $610,018$765,000 to $628,319. Additionally, Mr. Thomas was awarded a $795,600.
•LTP grant of $850,000 effective October 1, 2017,$1,395,000, which will vest on September 30, 2020. Mr. Thomas also received a 2024.
•LTR grant of $350,000 effective October 1, 2017,$585,000, which will vest in three equal increments on September 30, 2018,2022, September 30, 2019,2023, and September 30, 2020, subject2024.
Donald A. Moul
•Salary remained the same at $765,000.
•Executive Annual Incentive Plan ("EAIP") target increased from 70 percent of base salary to his being employed through such dates.80 percent of base salary.
The salary for Mr. Grimes will increase from $650,000 to $669,500. Additionally, Mr. Grimes was awarded a •LTP grant of $825,000 effective October 1, 2017,$1,175,000, which will vest on September 30, 2020. Mr. Grimes also received a 2024.
•LTR grant of $325,000 effective October 1, 2017,$785,000, which will vest in three equal increments on September 30, 2018,2022, September 30, 2019,2023, and September 30, 2020, subject to his being employed through such dates.2024.
The salary for Mr.Michael D. Skaggs will increase from $495,285 to $520,000. Additionally, Mr. Skaggs was awarded a
•Salary remained the same at $689,936.
•LTP grant of $750,000 effective October 1, 2017,$1,225,000, which will vest on September 30, 2020. Mr. Skaggs also received a 2024.
•LTR grant of $300,000 effective October 1, 2017,$525,000, which will vest in three equal increments on September 30, 2018,2022, September 30, 2019,2023, and September 30, 2020, subject2024.
David Fountain
•Salary increased from $540,000 to his being employed through such dates.$577,800.
The salary for Ms. Quirk will increase from $477,405 to $510,000. Additionally, Ms. Quirk was awarded a •LTP grant of $675,000 effective October 1, 2017,$770,000, which will vest on September 30, 2020. Ms. Quirk also received a 2024.
•LTR grant of $285,000 effective October 1, 2017,$330,000, which will vest in three equal increments on September 30, 2018,2022, September 30, 2019,2023, and September 30, 2020, subject2024.
Timothy S. Rausch
•Salary increased from $551,668 to her being employed through such dates.$569,321.
•LTP grant of $596,000, which will vest on September 30, 2024.
The salary adjustments described above became effective as•LTR grant of October 1, 2017. $330,000, which will vest in three equal increments on September 30, 2022, September 30, 2023, and September 30, 2024.
No adjustments were made to any other existing elements of compensation for these Named Executive OfficersNEOs for 2018.2022.
PART III
ITEM 10. DIRECTORS, EXECUTIVE OFFICERS, AND CORPORATE GOVERNANCE
Directors
The Tennessee Valley Authority Act of 1933, as amended 16 U.S.C. §§ 831-831ee (the “TVA Act”"TVA Act") provides that TVA shallthe Tennessee Valley Authority ("TVA") will be administered by a board of nine part-time members appointed by the President of the United States ("U.S.") with the advice and consent of the United StatesU.S. Senate. The Chair of the TVA Board of Directors ("TVA Board") is selected by the members of the TVA Board. Under the TVA Act, to be eligible to be appointed as a member of the TVA Board, an individual (i) must be a United StatesU.S. citizen; (ii) must have management expertise relative to a large for-profit or nonprofit corporate, government, or academic structure; (iii) cannot be a TVA employee; (iv) must make a full disclosure to Congress of any investment or other financial interest that the individual holds in the energy industry; and (v) must affirm support for the objectives and missions of TVA, including being a national leader in technological innovation, low-cost power, and environmental stewardship. In addition, the President of the United States,U.S., in appointing members of the TVA Board, must (i) consider recommendations from other public officials such as the Governors of the states in TVA’sTVA's service area; individual citizens; business, industrial, labor, electric power distribution, environmental, civic, and service organizations; and the congressional delegations of the states in TVA’sTVA's service area; and (ii) seek qualified members from among persons who reflect the diversity, including geographical diversity, and needs of TVA’sTVA's service area. At least seven of the nine TVA Board members must be legal residents of the TVA service area. Currently, TVA has sixseven active TVA Board members. Additional nominations have been made, but none have been confirmed.
TVA Board members serve five-year terms, and at least one member’smember's term ends each year. After a member's term ends, the member is permitted under the TVA Act to remain in office until the earlier of the end of the then-current session of Congress or the date a successor takes office. The TVA Board, among other things, establishes broad goals, objectives, and policies for TVA; develops long-range plans to guide TVA in achieving these goals, objectives, and policies; approves annual budgets; and establishes a compensation plan for employees.
The TVA Board as of November 14, 2017,12, 2021, consisted of the following sixseven individuals with their ages and terms of office provided:
| | | | | | | | | | | | |
| Directors | Age | Year Current Term Began | Year Term Expires | |
William B. Kilbride, Chair(1) | 70 | 2019 | 2023 | |
Kenneth E. Allen(2) | 75 | 2018 | 2021 | |
| A.D. Frazier | 77 | 2018 | 2022 | |
| Beth Harwell | 64 | 2021 | 2024 | |
| Brian Noland | 53 | 2020 | 2024 | |
John L. Ryder(2) | 72 | 2019 | 2021 | |
| Jeff W. Smith | 62 | 2018 | 2022 | |
|
| | | |
| Directors | Age | Year Current Term Began | Year Term Expires |
| Richard C. Howorth, Chair | 66 | 2015 | 2020 |
| Marilyn A. Brown | 68 | 2013 | 2017 (1) |
| V. Lynn Evans | 64 | 2013 | 2017 (1) |
| Virginia T. Lodge | 67 | 2014 | 2019 |
| Ronald A. Walter | 68 | 2014 | 2019 |
| Eric M. Satz | 48 | 2015 | 2018 |
Note(1) Mr. Kilbride assumed the Board Chair role on August 19, 2021.
(1)(2) Although the terms of Director BrownAllen and Director EvansRyder expired in May 2017, each director is2021, they are permitted under the TVA Act to remain in office until the earlier of the end of the current session of Congress or the date a successor takes office.
Mr. HoworthKilbride of Oxford, Mississippi,Chattanooga, Tennessee, joined the TVA Board in August 2019 and assumed the Board Chair role in August 2021. He served as the president and CEO of the Chattanooga Area Chamber of Commerce from July 20112014 until his retirement in January 2017, where he led multiple initiatives to attract and beganretain business to southeast Tennessee. He previously served as the president of the Mohawk Home, a second term ondivision of Mohawk Industries, Inc. from 1992 to 2014 after earlier holding positions with Chemical Bank, Dean Witter Reynolds Financial Services, and the New York Stock Exchange.
Mr. Allen of White Plains, Kentucky, joined the TVA Board in January 2018. He spent more than 50 years in the coal industry and held a number of executive management positions prior to his retirement in June 2017. Most recently, he served as Executive Vice President and Chief Operating Officer ("COO") of Armstrong Energy, Inc. from July 2014 to June 2017, as Executive Vice President of Operations for Armstrong Energy, Inc. from 2011 to July 2014, and as COO of Armstrong Coal Company, Inc. from December 2015.2013 until June 2017. He is the owner of Square Books, an Oxford independent bookstore he founded in 1979. Mr. Howorth served two terms as the mayor of Oxford, from 2001 to 2009, during which time he was chair of the authority overseeing the Oxford Electric Department. From 2001 to 2009, he also served as a director and officer of the North Mississippi Industrial Development Association, an economic development consortium made up of power association directors and mayors of cities in 29 Mississippi counties in the TVA service area.
Dr. Brown of Atlanta, Georgia, served on the TVA Board from October 2010 to January 2013 and began a second term on the TVA Board in September 2013. Dr. Brown has been a Professor in the School of Public Policy at Georgia Institute of Technology in Atlanta, Georgia, since August 2006. From 1984 to August 2006, Dr. Brown worked at the Oak Ridge National Laboratory ("ORNL") in Oak Ridge, Tennessee. At ORNL, she was Deputy Director and Acting Director of the Engineering Science and Technology Division from 2005 to 2006 and Program Director of the Energy Efficiency and Renewable Energy Program from 2000 to 2005. Dr. Brown served from 2006 until 2009 ascurrently a member of the Board of Directors for the First United Bank in Madisonville, Kentucky.
Mr. Frazier of Mineral Bluff, Georgia, joined the TVA Board in January 2018. Since July 2012, he has served as President Emeritus of Georgia Oak Partners, LLC, a private equity company. Mr. Frazier previously held a number of other executive management positions, including chair and Chief Financial Officer ("CFO") of the Southeast Energy Efficiency Alliance, serving asChicago Stock Exchange, chair and Chief Executive Officer ("CEO") of Danka Business Systems, a reseller of high-end photocopying equipment, president of Caremark, a pharmacy benefit management company, and COO of the Atlanta Committee for the 1996 Olympic Games.
Dr. Harwell of Nashville, Tennessee, joined the TVA Board Chair from 2006 until 2008.in January 2021. She has served as a memberdistinguished visiting professor at Middle Tennessee State University since the fall of 2019. She previously served as the speaker of the Tennessee House of Representatives, from 2011 until 2019, while serving as a state representative for the 56th District of Tennessee for nearly 30 years. She has also chaired the Tennessee Republican Party and served as an assistant professor of political science at Belmont University, as well as in a variety of additional roles in both education and public service.
Dr. Noland of Johnson City, Tennessee, joined the TVA Board in December 2020. Since January 2012, he has served as the ninth president of DirectorsEast Tennessee State University. He previously served as Chancellor of the West Virginia Higher Education System for six years. In 2018, he was elected to the board of the American Council for an Energy-Efficient Economy from 2002 until 2009. From 2002 until 2009, Dr. Brown was a commissioneron Education and also serves on the National Commission on Energy Policy. She servedboards of a number of other educational and civic organizations, as a memberwell as an Institute of Higher Education fellow at the BoardUniversity of Directors of the Alliance to Save Energy from 2000 through 2009.Georgia.
Ms. EvansMr. Ryder of Memphis, Tennessee, joined the TVA Board in January 2013. SheMarch 2019. He has been the owner of V. Lynn Evans, CPA, a certified public accounting and consulting firm in Memphis, Tennessee, since 1983. Ms. Evans was a board member of Memphis Light, Gas and Water Division, a TVA local power company customer, from 2004 to January 2013, and served as Chair from January 2008 to December 2009. She has been a director of community-based First Alliance Bank in Memphis,
Tennessee,bankruptcy and election law attorney with Harris Shelton Hanover Walsh, PLLC, since its inception in 1998, holding various positions, including chair of the audit committee and loan committee member. Ms. Evans2000. He has also served in leadership positions in a numberas an adjunct professor of community organizations, includinglaw at Belmont University since August 2021 and previously served as a board memberan adjunct professor of ArtsMemphislaw at Vanderbilt University. In addition, he served as General Counsel to the Republican National Committee from 19952013 to 2008, Community Foundation of Greater Memphis from 1995 to 20042017 and from 2006 to present, the RISE Foundation from 1997 to 2007, and the Women's Foundation for a Greater Memphis from 1999 to 2001. Ms. Evans is a memberas Chairman of the American InstituteRepublican National Lawyers Association from 2017 to 2018.
Mr. Smith of Certified Public Accountants and the Tennessee Society of Certified Public Accountants (Memphis Chapter).
Ms. Lodge of Nashville,Knoxville, Tennessee, joined the TVA Board in December 2014. She hasJanuary 2018. From April 2000 to his retirement in April 2021, Mr. Smith served as the Chief Executive Officerdeputy for operations at Oak Ridge National Laboratory ("CEO"ORNL") of FSI Inc., a fulfillment and supply chain company based in Nashville, Tennessee, since March 2012. She. From April 2001 to April 2021, he also served as Commissionerthe President of UT-Battelle Development Corporation, an entity established to develop privately constructed facilities at ORNL. During a six-month special assignment in 2002, he assisted with the creation of the TennesseeU.S. Department of Human Services from 2003 to 2011. From 2002 to 2003, she worked on Tennessee Governor Phil Bredesen’s campaign and transition team. Ms. Lodge was National Director of GoreCorps for the Gore for President Campaign in 2000 and served as Executive Director for Kids Voting of Middle Tennessee from 1994 to 1999.Homeland Security.
Mr. Walter of Memphis, Tennessee, joined the TVA Board in December 2014. He is currently the President and General Manager of WREG-TV, a Memphis-based television station. Mr. Walter has been employed by WREG-TV since 1987, and assumed his current position in 2004. Mr. Walter was Vice President of Customer Relations for the Memphis Light, Gas and Water Division from 1982 to 1987. From 1980 to 1982, he served as Assistant to the President at Memphis Light, Gas and Water Division.
Mr. Satz of Nashville, Tennessee, joined the TVA Board in August 2015. He is a Managing Member of the Tennessee Community Ventures Fund, LLC ("TNCV"), a company he co-founded in 2009, and is Executive Chairman of one of the TNCV portfolio companies. From 2010 to 2014, he served as Investor, Advisor, and Vice President of Business Development for Panopto, Inc., a software company based in Seattle, Washington. Mr. Satz co-founded and was CEO of Plumgood Food, LLC from 2004 to 2008. Earlier in his career, Mr. Satz served in various investment banking roles, including as Vice President in the Technology Investment Banking Groups at Credit Suisse First Boston and Donaldson, Lufkin & Jenrette. In 1999, Mr. Satz co-founded Currenex, an online global foreign currency exchange company.
Executive Officers
TVA’sTVA's executive officers as of November 14, 2017,12, 2021, their titles, their ages, and the date their employment with TVA commenced are as follows:
| | | | | | | | | | | |
| Executive Officers | Title | Age | Employment Commenced |
| Jeffrey J. Lyash | President and Chief Executive Officer | 60 | 2019 |
| John M. Thomas, III | Executive Vice President and Chief Financial and Strategy Officer | 57 | 2005 |
| Donald A. Moul | Executive Vice President and Chief Operating Officer(1) | 56 | 2021 |
| Timothy S. Rausch | Executive Vice President and Chief Nuclear Officer | 57 | 2018 |
| David Fountain | Executive Vice President and General Counsel | 54 | 2020 |
| | | |
| Susan E. Collins | Executive Vice President and Chief People and Communications Officer | 55 | 2014 |
| Jeannette Mills | Executive Vice President and Chief External Relations Officer | 54 | 2020 |
| | | |
| Diane T. Wear | Vice President and Controller (Principal Accounting Officer) | 53 | 2008 |
|
| | | |
| Executive Officers | Title | Age | Employment Commenced |
| William D. Johnson | President and Chief Executive Officer | 63 | 2013 |
| Joseph P. Grimes, Jr. | Executive Vice President, Generation | 61 | 2013 |
| Sherry A. Quirk | Executive Vice President and General Counsel | 63 | 2015 |
| Michael D. Skaggs | Executive Vice President, Operations | 57 | 1994 |
| John M. Thomas, III | Executive Vice President and Chief Financial Officer | 53 | 2005 |
| Van M. Wardlaw | Executive Vice President and Chief External Relations Officer | 57 | 1982 |
| Michael A. Balduzzi | Senior Vice President and Chief Nuclear Officer | 59 | 2014 |
| Janet J. Brewer | Senior Vice President and Chief Communications and Marketing Officer | 58 | 2012 |
| Susan E. Collins | Senior Vice President and Chief Human Resource Officer | 51 | 2014 |
| Diane T. Wear | Vice President and Controller (Principal Accounting Officer) | 49 | 2008 |
(1) Mr. Moul commenced employment with TVA on June 21, 2021
Mr. JohnsonLyash has served as TVA's President and CEO since January 2013. Mr. JohnsonApril 2019. He previously served as Chairthe President and Chief Executive Officer of Ontario Power Generation Inc. ("OPG"), an electric utility, from August 2015 until April 2019. Prior to joining OPG, Mr. Lyash served as the President of the Board,Power Business Unit of Chicago Bridge & Iron Company N.V., an engineering, procurement, and construction company, from July 2013 to August 2015, as Executive Vice President of Energy Supply for Duke Energy Corporation, an electric utility, from July 2012 to December 2012, and CEOas Executive Vice President of Energy Supply for Progress Energy, Inc. ("Progress Energy"), an electric utility, based in Raleigh, North Carolina, from October 2007June 2010 to July 2012. During this time, Mr. Johnson also served as the Chair ofLyash joined Progress Energy Carolinas, Inc.,(formerly Carolina Power & Light Company) in 1993 and Progress Energy Florida, Inc., both of which are subsidiaries of Progress Energy. Mr. Johnson held a number of other positions before he became Chairassuming the role of Executive Vice President of Energy Supply, including Executive Vice President of Corporate Development from July 2009 to June 2010, President and CEOChief Executive Officer of Progress Energy Florida, Inc., from June 2006 to July 2009, Senior Vice President of Energy Delivery for Progress Energy Florida, Inc., from November 2003 to June 2006, and Vice President of Transmission for Progress Energy Carolinas, Inc., from January 2002 to October 2003. He also held a wide range of management and executive roles in Progress Energy's nuclear program, including Operations Manager, Engineering Manager, Plant Manager, and Director of Site Operations. Mr. Lyash began his career in the utility industry in 1981 and worked for Pennsylvania Power & Light before joining the U.S. Nuclear Regulatory Commission ("NRC"), where he worked from 1984 to 1993. While at the NRC, Mr. Lyash held a number of senior technical and management positions and also worked from June 1984 to May 1985 as an engineer at Browns Ferry Nuclear Plant while on loan to TVA. Mr. Lyash has served as a director for the Electric Power Research Institute ("EPRI") since 2015 and is currently Chair of the EPRI Board, and he has served as a director for Granite Construction Inc. since June 2018.
Mr. Thomas was named Executive Vice President and Chief OperatingFinancial and Strategy Officer of Progress Energy; Group President for Energy Delivery; President and CEO for Progress Energy Service Company, LLC; and General Counsel and Corporate Secretary for Progress Energy.("CFSO") in June 2021. Mr. Johnson joined Carolina Power & Light Company ("CP&L"), a predecessor to Progress Energy, in 1992. Before joining CP&L, Mr. Johnson was a partner with the Raleigh, North Carolina, law office of Hunton & Williams LLP, where he specialized in the representation of utilities.
Mr. Grimes joined TVA in July 2013Thomas served as Executive Vice President and Chief Nuclear Officer. He was named Executive Vice President, Generation, and Chief Nuclear Officer effective October 2016, and Executive Vice President, Generation effective January 2017. Before joining TVA, Mr. Grimes worked at Exelon Nuclear and held a variety of positions there, including Senior Vice President, Engineering and Technical Services, Exelon Nuclear Fleet from 2011 to 2013, Senior Vice President, Mid-Atlantic Operations from 2009 to 2011, and Site Vice President at Peach Bottom Nuclear Station from 2007 to 2008. Mr. Grimes joined Exelon Nuclear in 1979.
Ms. Quirk has served as TVA’s Executive Vice President and General Counsel since February 2015. From October 2010 to February 2015, Ms. Quirk was an equity partner in the law firm of Schiff Hardin LLP, which specializes in federal energy regulation, legislation, and power supply transactions. Prior to joining Schiff Hardin, Ms. Quirk was a partner in the Energy Group of Sullivan & Worcester LLP, and a partner in the Energy Group of Verner, Liipfert, Bernhard, McPherson and Hand, specializing in federal energy regulation, legislation, power supply transactions, and state proceedings.
Mr. Skaggs was named Executive Vice President, Operations effective October 2016. Since joining TVA in 1994 as Manager of Projects at Watts Bar Nuclear Plant, Mr. Skaggs has held several management positions, including Senior Vice President, Watts Bar Operations and Construction from September 2013 to October 2016, Senior Vice President, Nuclear ConstructionCFO from February 2012 to September 2013, Senior Vice President of Nuclear Generation Development and ConstructionJune 2021, as CFO from October 2011 to February 2012, Site Vice President of Sequoyah Nuclear Plant from NovemberJune 2010 to October 2011, Vice PresidentFebruary
Mr. Thomas has served as TVA's Chief Financial Officer since June 2010 and was also named Executive Vice President in February 2012. He served2012, as Executive Vice President of People and Performance from January 2010 to June 2010, as Senior Vice President, Corporate Governance and Compliance from July 2009 to January 2010, as Controller and Chief Accounting Officer from January 2008 to September 2009, and as the General Manager, Operations Business Services from November 2005 to January 2008. Prior to joining TVA, Mr. Thomas was Chief Financial OfficerCFO during 2005 for Benson Security Systems. He was also the Controller of Progress Fuels Corporation from 2003 to 2005 and Controller of Progress Ventures, Inc. from 2001 to 2002, both subsidiaries of Progress Energy.
Mr. WardlawMoul was named Executive Vice President and Chief External RelationsOperating Officer in July 2014.June 2021. Before joining TVA, Mr. WardlawMoul served as the Executive Vice President, Nuclear Division and Chief Nuclear Officer at NextEra Energy Inc. from January 2020 to May 2021 and as the Vice President and Chief Nuclear Officer of NextEra Energy Inc. from May 2019 to December 2019. He previously held various roles at several subsidiaries of FirstEnergy Corp. Mr. Moul served as Executive on Special Assignment of FirstEnergy Solutions Corp. from March 2019 to May 2019, President and Chief Nuclear Officer of FirstEnergy Generation Companies from March 2018 to March 2019, President of FirstEnergy Generation LLC from April 2017 to March 2018, and Senior Vice President, Fossil Operations and Environmental of FirstEnergy Solutions from August 2015 to April 2017.
Mr. Rausch was named Executive Vice President and Chief Nuclear Officer in November 2020. Mr. Rausch joined TVA in October 2018 as Senior Vice President Customer Relations, from September 2013 to July 2014,and Chief Nuclear Officer. Before joining TVA, Mr. Rausch served as Executive Vice President, Customer Relations, from June 2011 to September 2013, as Executive Vice President, Enterprise Relations, from October 2010 to June 2011, as Acting Executive Vice President of Strategy and Planning from January 2010 until September 2010, as Executive Vice President of Power Supply and Fuels from July 2008 to August 2010, as Senior Vice President, Commercial Operations and Fuels from January 2007 to June 2008, as Vice President, Bulk Power Trading from September 2006 to December 2006, and as Vice President of Transmission and Reliability from December 2000 to September 2006. Mr. Wardlaw began his career with TVA in January 1982 as an electrical engineer, and has also worked in customer service, marketing, and field services.
Mr. Balduzzi was namedthe Senior Vice President and Chief Nuclear Officer in January 2017. Mr. Balduzzi was formerly TVA’sof Talen Energy Corporation from June 2015 until September 2018 and as the Senior Vice President and Chief Nuclear Officer of Nuclear Operations, a position he had held sincePPL Generation, LLC from July 2009 to June 2015. Mr. Rausch has 25 years of experience in virtually all the disciplines of the nuclear power industry, including roles as Site Vice President, Plant General Manager, and Director of Engineering.
Mr. Fountain was named Executive Vice President and General Counsel in March 2021. Mr. Fountain joined TVA in June 2020 as the Senior Vice President and Vice General Counsel. Prior to joining TVA, Mr. Fountain served in January 2014. Prior to coming to TVA ,various leadership roles for more than 20 years with Duke Energy and predecessor companies Progress Energy and Carolina Power & Light. Most recently, Mr. BalduzziFountain served as Senior Vice President, Legal, Corporate Secretary, and Chief Ethics and Compliance Officer at Duke Energy from November 2018 to May 2020 and as President of Engineering and Technical Services for Entergy NuclearDuke Energy North Carolina from August 20112015 to January 2014. Mr. Balduzzi has more than 34 years of experience in the nuclear industry, having held numerous leadership roles in operations, maintenance, and oversight activities at a number of nuclear facilities, including Vermont Yankee, Nine Mile Point, and Pilgrim nuclear stations.November 2018.
Ms. Brewer joined TVA in 2012 as Vice President of Communications, and sheCollins was named SeniorExecutive Vice President and Chief CommunicationsPeople and MarketingCommunications Officer in May 2016. Before joining TVA, Ms. Brewer worked at NCR Corporation, a global technology company based in Duluth, Georgia, and held a number of positions there, including Vice President of Corporate Communications from 2010 to 2012 and from 2006 to 2008, Vice President of Change Management and Communications for Continuous Improvement from 2008 to 2010, and Director of Community Relations from 2005 to 2006.
November 2020. Ms. Collins joined TVA in May 2014 as Vice President of Human Resources, and she was named Senior Vice President and Chief Human Resources Officer in February 2016.2016, and she was named Senior Vice President, Chief Human Resources and Communications Officer in June 2019. Before joining TVA, Ms. Collins served as Senior Vice President of Human Resources for Constellation Energy Nuclear Group, LLC from 2009 to 2014 and as Vice President of Human Resources for Constellation Energy from 2008 to 2009.
Ms. Mills was named TVA's Executive Vice President and Chief External Relations Officer in February 2020. Most recently, from 2017 until arriving at TVA, Ms. Mills served as the Senior Vice President of Safety, Health, Environmental and Assurance for the U.S. region at National Grid Group, the United Kingdom's largest investor-owned utility. Beginning in June 2015, she served as a Commissioner on the Maryland Public Service Commission, providing regulatory oversight of gas, electric, telephone, water, sewage disposal, and transportation companies. Ms. Mills spent 25 years of her career at Baltimore Gas and Electric, starting as an associate engineer and steadily progressing through positions of increasing responsibility to ultimately serve as Vice President, Customer Operations and Chief Customer Officer from 2008 to 2013.
Ms. Wear has served as TVA's Vice President and Controller since March 2012. Ms. Wear was the Assistant Controller from February 2010 to March 2012. Between April 2008, when she joined TVA, and February 2010, Ms. Wear was the General Manager, External Reporting/Accounting Policy and Research. Prior to joining TVA, Ms. Wear was a Managing Director at PricewaterhouseCoopers LLP. Ms. Wear joined a predecessor firm to PricewaterhouseCoopers LLP in January 1992.
Disclosure and Financial Code of Ethics
TVA has a Disclosure and Financial Ethics Code ("Financial Ethics Code") that applies to all executive officers (including the CEO, Chief Financial Officer,CFO, and Controller) and directors of TVA as well as to all employees who certify information contained in quarterly reports or annual reports or who have responsibility for internal control self-assessments. The Financial Ethics Code includes provisions covering conflicts of interest, ethical conduct, compliance with applicable laws, rules, and regulations, responsibility for full, fair, accurate, timely, and understandable disclosures, and accountability for adherence to the Financial Ethics Code. TVA will provide a current copy of the Financial Ethics Code to any person, without charge, upon request. Requests may be made by calling 888-882-4975 or by sending an e-mail to: investor@tva.com. Any waivers of or
changes to provisions of the Financial Ethics Code that require disclosure pursuant to applicable Securities and Exchange Commission requirements will be promptly disclosed to the public, subject to limitations imposed by law, on TVA’sTVA's website at: www.tva.gov. Information contained on TVA’sTVA's website shall not be deemed to be incorporated into, or to be a part of, this Annual Report.
Committees of the TVA Board
The TVA Board has an Audit, Finance, Risk, and RegulationCybersecurity Committee established in accordance with the TVA Act. TVA’sTVA's Audit, Finance, Risk, and RegulationCybersecurity Committee consists of V. Lynn Evans, Richard Howorth,A.D. Frazier, William B. Kilbride, and Virginia Lodge. Beth Harwell.
Director Evans and Director Lodge are eachKilbride is an "audit committee financial expert" as defined in Item 407(d)(5) of Regulation S-K under the Securities Exchange Act.Act of 1934 (the "Exchange Act").
TVA is exempted by Section 37 of the Exchange Act from complying with Section 10A(m)(3) of the Exchange Act, which requires each member of a listed issuer’sissuer's audit committee to be an independent member of the board of directors of the issuer. The TVA Act contains certain provisions that are similar to the considerations for independence under Section 10A(m)(3) of the Exchange Act, including that to be eligible for appointment to the TVA Board, an individual shall not be an employee of TVA and shall make full disclosure to Congress of any investment or other financial interest that the individual holds in the energy industry.
Under Section 10A(m)(2) of the Exchange Act, which applies to TVA, the audit committee is directly responsible for the appointment, compensation, and oversight of the external auditor; however, the TVA Act assigns the responsibility for engaging the services of the external auditor to the TVA Board.
The TVA Board has also established the following committees in addition to the Audit, Finance, Risk, and RegulationCybersecurity Committee:
Finance, Rates,•External Stakeholders and PortfolioRegulation Committee,
External Relations Committee
•People and PerformanceGovernance Committee, and
•Operations and Nuclear Oversight Committee.
ITEM 11. EXECUTIVE COMPENSATION
Compensation Discussion and Analysis
The purpose of theThis Compensation Discussion and Analysis is to describe("CD&A") provides information on the objectives, goals, and structure of TVA's executive compensation philosophyprogram and the policies2021 compensation awarded to TVA's CEO, CFSO, three other most highly compensated executive officers serving at the end of 2021, and decisions that guided compensation for TVA’s Named Executive Officers in 2017. The 2017one additional individual who was no longer serving as an executive officer at September 30, 2021. Collectively, these officers are TVA's 2021 Named Executive Officers ("NEOs") are as follows::
William D. Johnson, President and Chief Executive Officer ("CEO");
| | | | | | | | |
| Name | Title | Employed with TVA since |
| Jeffrey J. Lyash | President and CEO | 2019 |
| John M. Thomas, III | Executive Vice President and Chief Financial and Strategy Officer(1) | 2005 |
| Timothy S. Rausch | Executive Vice President and Chief Nuclear Officer(2) | 2018 |
| David B. Fountain | Executive Vice President and General Counsel(3) | 2020 |
| Donald A. Moul | Executive Vice President and Chief Operating Officer(4) | 2021 |
| Michael D. Skaggs | Executive Vice President and Advisor to the CEO(5) | 1994 |
Notes
(1)Effective June 7, 2021; former Executive Vice President and Chief Financial Officer ("CFO");
Joseph P. Grimes, Jr.,(2)Effective November 13, 2020; former Senior Vice President and Chief Nuclear Officer
(3)Effective March 5, 2021; former Senior Vice President, Vice General Counsel
(4)Effective June 21, 2021, employed as Executive Vice President Generation;and Chief Operating Officer
Michael D. Skaggs,(5)Effective June 21, 2021; former Executive Vice President Operations; and Chief Operating Officer
Sherry A. Quirk,In May 2021, Mr. Skaggs announced his intention to retire from TVA in January 2022. Effective June 21, 2021, Mr. Skaggs was appointed to serve as Executive Vice President and Advisor to the CEO until his retirement in January 2022. Mr. Moul was employed as Executive Vice President and Chief Operating Officer effective June 21, 2021.
Former Executive Vice President and General Counsel.Counsel Sherry A. Quirk retired from TVA on March 5, 2021, as previously announced. Upon Ms. Quirk’s retirement, Mr. Fountain was promoted to Executive Vice President and General Counsel effective March 5, 2021.
Compensation granted in connection with the above-referenced NEO changes is set forth below in Notable 2021 Actions.
Executive SummaryTVA's Unique Public Power Mission of Service
The Tennessee Valley Authority ("TVA")TVA is a corporate agency and instrumentality of the United States ("U.S.") that was created in 1933 by federal legislation enacted byto provide integrated resource management of the U.S. CongressTennessee Valley while improving the lives of the people in responsethe region. This congressional statute mandates a primary objective of providing reliable energy at rates that are as low as feasible; managing natural resources responsibly; and promoting economic development. Under federal law, TVA is aligned with other corporate entities as it is required to follow Securities and Exchange Commission reporting requirements, and compensation must be based on prevailing compensation for similar positions in investor-owned companies as well as governmental entities.
| | | | | |
TVA PUBLIC POWER MISSION - TO SERVE THE PEOPLE OF THE TENNESSEE VALLEY TO MAKE LIFE BETTER | Today, TVA operates the nation's largest public power system and is one of the largest U.S. electric utilities in terms of generating capacity. TVA's "Public Power" mission sets it apart from its investor-owned peers. As an instrumentality of the federal government, TVA’s mission is to serve the people of the Tennessee Valley. Profits do not go to shareholders, but rather are reinvested back into the Tennessee Valley community and the energy infrastructure that powers it. In doing so, TVA uses no appropriated tax dollars. TVA is self-funded, with virtually all its operations funded through revenue and power system financings. |
Complexity and Scale Comparable to Investor-Owned Utilities
TVA supplies reliable power over more than 16,000 miles of transmission lines to a request by President Franklin D. Roosevelt.population of approximately 10 million people over nearly 80,000 square miles in seven states, employs approximately 10,200 people, and helps recruit and retain billions of dollars in economic development projects annually. The complexity, scale, and scope of its utility operations rival those of the largest U.S. utility companies. Unlike most of its peers, TVA was created to, among other things, improve navigation onis also responsible for managing and caring for many of the natural resources, including public lands and waters, in the Tennessee River, reduceValley region.
| | | | | | | | |
Energy Delivering reliable, low cost, clean energy | |
| | |
| | |
Largest Public Power System In the United States | 37,896 MW Summer Net Capacity |
One of the Largest Transmission Systems In high voltage lines among United States utilities More than 16,000 miles of high voltage lines and 69 interconnections with neighboring electric systems | 3rd Largest Electricity Generator In the United States, based on 2020 Total Electric Generation |
3rd Largest Nuclear Fleet In the United States, providing over 40 percent of the energy produced by TVA |
|
29 Power-Generating Dams Hydroelectric providing 3,750 megawatts of net summer capability |
|
3rd Largest Pumped-Storage Hydro Plant In the United States, capable of producing 1,635 megawatts of net summer capability on demand |
|
| | |
Generating Assets –Three nuclear sites –Five coal-fired sites –29 hydroelectric sites –One pumped-storage hydroelectric site –Nine combustion turbine gas sites –Eight combined cycle gas sites –13 solar energy sites –One diesel generator site
| Partnering with 153 Local Power Companies, Every Day We Serve |
Approximately 10 Million People | Over 775,000 Businesses Including 57 corporations and federal installations |
| Across Seven States |
Managing Large, Complex Operations Safely Continued Strong Safety Performance |
| | | | | | | | | | | |
|
| Carbon Reduction Leadership |
|
63% reduction in mass carbon emissions fromgeneration from CY 2005 to CY2020 |
| | | | | |
Environment Caring for our region's natural resources |
| |
| |
| Managing |
49 Dams Hydroelectric and non-power | Approximately 100 Public Recreation Areas |
| |
The Tennessee River to provide year-round navigation, flood damage reduction, and affordable and reliable electricity |
| |
Caring for
| | | | | |
Over 40,000 Miles of Rivers, Streams, and Tributaries | 11,000 Miles of reservoir shoreline 293,000 Acres of reservoir land 650,000Surface Acres of reservoir water |
| Approximately 800 Miles of Commercially Navigable Waterways |
| | | | | |
Economic Development Creating sustainable economic growth |
| |
| |
Attracting Over $8.8 Billion Investments in Tennessee Valley creating and retaining approximately 80,900 jobs | Approximately 10,200 Employees 15,500 Contractors |
| |
TVA Programs
| | | | | |
Rural Development Rural Leadership Institute / Customized Training Technical Services Site evaluations and master planning, 3D renderings, video, photography, and virtual reality Workforce Analytics Company Research Support communities in fulfillment of information for company prospects | Telework Technology Grant Assistance for rural or economically distressed communities to enhance technology capabilities that support remote work opportunities Product Development Financial support for communities to make sites and buildings more marketable for companies to locate and grow Training and Development Training & development, facilitation services, leadership training, workforce training, and talent development |
| |
Top Utility in Economic Development 16 Consecutive Years By Site Selection Magazine |
Attracting Experienced Talent Requires Competitive Pay
Talent matters because of its value contribution and scarcity. Attraction and retention of talent is paramount to TVA given its complex operations and high performance expectations. This important component of TVA's strategy was incorporated in the damage from destructive flood waters withinTVA Act through the requirement of competitive compensation in the Consolidated Appropriations Act of 2005. In order to fulfill its public power mission in the most effective way possible, TVA must provide market-based, competitive compensation levels to deliver superior performance and execute ambitious multi-year objectives aligned with TVA's public power mission.
TVA is one of the largest and most complex organizations in the energy services industry, with generating capacity and assets that surpass most of its peers. While TVA's revenue is below the median of its peer group, this is reflective of TVA's success with regard to its public service mission, as one of its primary objectives is to maintain the lowest feasible rates. As noted in "Delivering Value Through Superior Performance" below, TVA's rates are below the rates of the vast majority of the top U.S. utilities. Unique to TVA, the company is also responsible for managing the Tennessee River system to provide flood control, navigation, hydroelectric generation, recreation, water quality and downstream onsupply, and other benefits. Further, TVA plays the lower Ohiocritical role of attracting and Mississippi Rivers, furtherallocating a significant amount of capital back into the economic development of TVA’s service areathe Tennessee Valley. TVA successfully manages all of this with an employee count below the median employee count of its peers, demonstrating a comparatively greater efficiency.
| | | | | | | | |
| TVA POSITIONING AGAINST PEERS* | |
| | |
| *For information on peer group, see "Compensation Setting Process Demonstrates Strong Governance - TVA Competes with Peers for Talent" below. (1)Based on data from the consecutive four quarters ended June 30, 2020 (data source S&P's Capital IQ) (2)Based on data from the consecutive four quarters ended June 30, 2020 (data source S&P's Capital IQ) (3)Based on fiscal year end as of October 2020 (data source S&P's Capital IQ) (4)Based on data reported by SNL Energy in March 2020 (5)Based on data reported by SNL Energy in March 2020 | |
Given the nature and scale of its operations, TVA competes with large investor-owned utilities ("IOUs") to attract and retain talent. Five of TVA's six NEOs were formerly employed by IOUs. Additionally, over 70 percent of TVA executives who were externally recruited over the last five years are former employees of IOUs. TVA's ability to compete with these organizations for talent has yielded success for TVA and its stakeholders.
Delivering Value Through Superior Performance
TVA's success is measured in terms of value delivered to the businesses, customers, and residents of the Tennessee Valley by providing low-cost energy, maintaining reliable, safe, and efficient infrastructure, investing in the southeastern United States,community's economy, and sellmanaging and protecting its environmental assets. Executing on its strategic priorities, TVA continues to make a positive impact on all of its stakeholders, as shown below. Under the electricityleadership of TVA's NEOs, TVA's employees delivered another year of performance improvements – and achieved or exceeded nearly all 2021 key performance objectives – despite the continuation of challenges arising from the COVID-19 pandemic.
| | | | | |
| Safety-Focused Operations •Top decile performance for TVA's Recordable Injury Rate and top quartile performance for TVA's Serious Injury Rate in 2021 –Continued Strong Safety Performance –Consistent decline in recordable injuries and illnesses Pay for Performance •Above target at-risk incentive payouts awarded to employees for achieving company performance goals in 2021 Inclusive Culture •Ranked in Top 100 - 2021 America's Most Loved Workplaces® (Newsweek in partnership with Best Practice Institute) •Established Inclusion with Diversity ("IwD") Council - advises, champions, and oversees all IwD strategies and actions •Supports nine Employee Resource Groups ("ERGs") •2021 Military Friendly® Employer - Top 10 designation. Military veterans comprise approximately 18 percent of the TVA workforce •2021 Military Friendly® Supplier Diversity - Top 10 •2021 Military Friendly® Spouse Employer •VETS Indexes 5-Star Employer •2021 Diversity Impact Award - Top 10 Diversity Action Award (Association of ERGs and Councils) •Ranked in Top 5 in Tennessee for third consecutive year on Forbes list of America's Best-in-State Employers in 2021 •Ranked No. 2 in Utilities Industry on Forbes America's Best Large Employers in 2021 Benefits and Well Being •Recognized by Plan Sponsor - 2021 Best in Class 401(k) Plans Training and Education •Continued investing in TVA's employees through training and performance improvement programs COVID-19 Pandemic Support •Continued TVA Employee Relief Fund established in 2020 to support employees adversely impacted by the COVID-19 pandemic and natural disasters •Provided support for employees including: ◦establishing a mental health advocacy program ◦providing unlimited Employee Assistance Program sessions ◦enhancing paid leave ◦providing tutoring resources ◦providing vaccination clinics and wellness incentive for vaccinations Strong Labor Partnerships •Employees and contractors are represented by 17 different labor union groups •One of the largest U.S. contributors to Helmets to Hardhats program
|
| |
| Reliable and Clean Energy •99.999 percent transmission reliability since 2000 •$17.1 billion invested in a cleaner and more diverse energy generation mix since 2013 •Cleanest power system in the Southeast, as a percent of total generation Effective Resource Management •Over $9.7 billion in flood damage averted in the Tennessee Valley and along the Ohio and Mississippi Rivers over TVA's recorded history, with $170 million in flood damage averted in the Tennessee Valley in 2021 •Operates River Forecast Center around the clock, monitoring weather conditions and forecasts, and constantly watching and adjusting the Tennessee River system •Manages the Tennessee River system in an integrated manner, balancing hydroelectric generation, navigation, flood-damage reduction, water quality and supply, and recreation |
| | | | | |
| TVA Strength and Stability •Organization and operations entirely self-funded since 1999 •In 2020, TVA achieved and surpassed its strategic goal of reducing debt to $21.8 billion by 2023, and made even further reductions in debt in 2021 •TFO of $20.5 billion – lowest in over 30 years •Issued Green Bond offering - with lowest interest rate on a 10-year financing in TVA history •$54 million lower interest expense in 2021 compared to 2020 mainly due to lower debt levels Low, Stable Rates •Residential rates lower than 80 percent of the top 100 U.S. utilities (based on June 2021 12-month rolling average from U.S. Energy Information Administration ("EIA")) •Industrial rates lower than more than 95 percent of the top 100 U.S. utilities (based on June 2021 12-month rolling average from EIA) •Effective wholesale rates held stable and low for past eight years |
| |
| Strong Partnerships •COVID-19 Pandemic Support •Made $1.0 billion of credit support available to local power companies ("LPCs") which was available through December 31, 2020 •Provided regulatory relief and flexibility to LPCs •Provided a 2.5 percent Pandemic Relief Credit to TVA's LPCs, their large commercial and industrial customers, and TVA's directly served customers totaling $221 million for 2021 •Approved a 2.5 percent Pandemic Recovery Credit that will apply to service provided to TVA's LPCs, their large commercial and industrial customers, and TVA's directly served customers, expected to approximate $220 million for 2022 •Provided approximately $13 million through the Back-to-Business Credit Program, since its 2020 inception, to help large customers return to work at pre-pandemic levels •Continued support through the Community Care Fund established in 2020 that has already provided over $4 million, with nearly $2 million provided in 2021, and an additional $5 million available, to support local initiatives that address hardships created by the COVID-19 pandemic. •Returned $189 million in bill credits to local power companies participating in Long-Term Partnership Agreements in 2021 Economic Development •Named Top Utility in Economic Development by Site Selection Magazine for 16th year in a row •Efforts continued to attract and encourage the expansion of business and industries in the Tennessee Valley in 2021 contributing to: ◦Over $8.8 billion in investments, and ◦Approximately 80,900 jobs created or retained •Supported rural communities with TVA economic development programs tailored to meet the needs of these areas •Contributed nearly $500 million in tax equivalent payments to states and local governments in 2021 (excluding impacts from tax equivalents related to fuel cost adjustments) Community Support •Nearly $3 million donated to organizations across the Valley in addition to the Community Care Fund •Distributed over 1 million meals to families in need in 2021 through TVA's partnership with Feeding America •Continued support through the Home Uplift program - Valley wide |
| | | | | |
| Sustainability •Carbon-free power supply mix was 56 percent for the year ended September 30, 2021 •For CY 2020, TVA's mass emissions of carbon dioxide were at a 63 percent reduction from 2005 levels –Chart depicts both generated and purchased power within respective resource types. In addition to power supply sources included here, TVA offers energy efficiency programs that effectively reduced 2021 energy needs by about 2,300 GWh or 1.4%. •Contracted over 1,000 MW of additional solar and 196 MW of battery storage in 2021, as a result of TVA’s 2020 request for proposals •Top quartile utility in renewable energy production in the Southeast •Issued second annual TVA Sustainability Report; supplemental Carbon Report; and Edison Electric Institute Environmental, Social, Governance and Sustainability Report •Ranked in Global Top 100 in Green Utilities 2021 Report by Energy Intelligence
Programs and Partnerships •TVA offers renewable energy programs, in partnership with LPCs, which allow businesses and individuals to purchase renewable energy certificates to meet their renewable energy and sustainability goals •Launched Green Connect (small-scale solar option) to connect residential customers interested in onsite solar installations with qualified solar installers •Launched the Fast-Charge Network for electric vehicles, in collaboration with state agencies, LPCs, and third-party charging developers and in partnership with the State of Tennessee, with plans for fast charging stations every 50 miles along Tennessee’s interstates and major highways •Founding member of the Electric Highway Coalition, an alliance of utility companies committed to enabling long-distance electric vehicle travel through a network of DC charging stations connecting major highway systems •In partnership with Oak Ridge National Laboratory ("ORNL"), the University of Tennessee, and Techstars, created a regional innovation program in Knoxville, aimed at inspiring innovation and entrepreneurship •Approved new policies and an optional wholesale EV rate intended to support the expansion of electric vehicle charging infrastructure across the region •In 2020, launched first TVA-owned, grid scale, lithium-ion demonstration battery project; awarded the contract for the project in 2021 National Defense •Proudly supports national defense efforts and partners with ORNL on cutting-edge research
|
| | |
|
Public Power Mission Means Exceptional Performance with Conservative CEO Compensation Despite the continued headwinds created by the COVID-19 pandemic, TVA's workforce performed at a high level in 2021 in managing TVA's extensive, complex operations and delivering on its public power mission. As a result of its high level of performance, TVA achieved its performance objectives above the target goals for both its annual and long-term incentives for 2021 - at 142 percent and 132 percent, respectively. TVA is a utility company that competes with other utilities - including investor-owned utilities - for talent, but since TVA is a mission-based organization, TVA compensates its CEO conservatively relative to its compensation peers. In particular, TVA's CEO is currently compensated below the 50th percentile of 2021 compensation peers. TVA's performance along with its compensation structure results in differentiated value delivered directly to the residents of the Tennessee Valley and reflects a keen focus on TVA's mission of serving those residents. |
|
Notable 2021 Actions
The following are key actions during 2021:
Independent Study Confirms CEO Compensation Benchmarking Remains Competitive
In January 2021, FW Cook concluded its independent study of CEO compensation commissioned by the Committee. FW Cook concluded that TVA’s historical approach to benchmarking, which blends data from IOUs, government agencies, and non-profit entities, remains relevant, and captures the intent of the TVA Act to develop an annual salary survey based on market data of relevant peers.
Named Executive Officer Appointments and Promotions
| | | | | | | | |
| NEO | Event | Compensation Arising Out of Event |
| John M. Thomas, III | Effective June 7, 2021, TVA’s CEO approved a title change, reflective of additional scope and responsibilities, from Executive Vice President and Chief Financial Officer to Executive Vice President and Chief Financial and Strategy Officer. | •Annual salary increased from $686,582 to $765,000. •Prorated 2021-2023 long-term performance ("LTP") grant of $1,039,000, which replaced the 2021-2023 LTP grant of $1,000,000 made on October 1, 2020. See 2021–2023 Outstanding LTP Performance Cycle for vesting and other terms. •Prorated 2021 long-term retention ("LTR") grant of $441,000, which replaced the 2021 LTR grant of $432,000 made on October 1, 2020. See 2021 Long-Term Retention Award Grant for vesting terms. |
| David B. Fountain | Effective March 5, 2021, TVA’s CEO approved the selection and compensation as Executive Vice President and General Counsel. | •Annual salary increased from $465,750 to $540,000. •Annual incentive opportunity increased from 55% to 70%. •Prorated 2021-2023 LTP grant of $562,500, which replaced the 2021-2023 LTP grant of $375,000 made on October 1, 2020.See 2021–2023 Outstanding LTP Performance Cycle for vesting and other terms. •Prorated 2021 LTR grant of $316,500, which replaced the 2021 LTR grant of $249,000 made on October 1, 2020.See 2021 Long-Term Retention Award Grant for vesting terms. •Tier 1 participant in Supplemental Executive Retirement Plan. |
| Donald A. Moul | Appointment as Executive Vice President and Chief Operating Officer effective June 21, 2021 | •Annual salary of $765,000. •Annual Incentive opportunity of 70% of annual salary. 2021 annual incentive award will be prorated based on number of days Mr. Moul participates in performance period ending September 30, 2021. See Executive Annual Incentive Plan for vesting and other terms. Long-term incentive opportunity of 205% of annual salary beginning with performance cycle ending on September 30, 2021. •Long-term incentive awards for performance cycles ending September 30, 2021, 2022, and 2023 will be prorated based on number of full months Mr. Moul participates in these performance cycles. See Long-Term Incentive Compensation for vesting and other terms. •Tier 1 participant in Supplemental Executive Retirement Plan. •Reimbursement of actual and reasonable travel and moving expenses. •Deferred cash recruitment and relocation incentive of $1,200,000 paid in three installments of $650,000, $450,000 and $100,000, all of which must be repaid to TVA if, within two years of the effective date of each payment, (1) he voluntarily terminates his employment, unless the separation is for reasons beyond his control and acceptable to TVA, or (2) he is terminated for cause. |
Changes to Compensation Plan to Enhance Governance
On April 29, 2021, the Board of Directors approved revisions to the TVA Compensation Plan to enhance Plan governance and provide clarification of current practices in the following areas:
•Compensation may be targeted below the median of the relevant labor market for certain positions, for certain business reasons;
•A majority of long-term compensation is typically targeted as at-risk, performance-based compensation; and
•The Board retains the right to change goals and measures for incentive performance awards during or at the facilitiesconclusion of the performance period if necessary to ensure a fair and balanced outcome.
Supplemental Compensation Plan Changes to Better Align to Market
Long-Term Incentive Plan Amended
On November 12, 2020, the CEO approved an amended and restated Long-Term Incentive Plan ("LTIP") that allows TVA operates. Today,to make off-cycle performance-based grants and retention grants on a pro-rated basis. This change better aligns TVA’s plan to market practices and accommodates mid-cycle promotions and new hires.
Executive Severance Plan Adopted
On February 10, 2021, TVA’s CEO established the TVA operatesExecutive Severance Plan (the “Severance Plan”), including the nation’s largest public power systemeligibility of TVA’s named executive officers (other than the CEO) to participate in the Severance Plan. The Severance Plan was designed and supplies powerestablished following a market study of executive severance arrangements of TVA’s peers. On February 11, 2021, the Board approved the CEO’s participation in the Severance Plan as part of the overall market review of CEO compensation.
See Executive Compensation Tables and Narrative Disclosures - Executive Severance Plan for more information about the Severance Plan.
Changes to a populationPerformance Goals to Account for External Factors and Impacts Beyond Management Control
Performance Goals - 2021 Annual Incentive Award
On April 30, 2021, pursuant to the authority delegated under the TVA Compensation Plan, the CEO approved revised performance goals for the Annualized Nuclear Unit Capability Factor measure of over nine million people.
2017 Compensation Highlights
2017 At-Risk Compensation. Basedthe TVA Enterprise Scorecard, which the CEO believed was consistent with TVA’s compensation philosophy focus on its annualpay for performance, to account for the steam generator degradation at Watts Bar Nuclear Plant Unit 2, which was beyond the control of management. See Item 7, Management’s Discussion and productivity,Analysis of Financial Condition and Results of Operation – Key Initiatives and Challenges – Generation Resources – Watts Bar Unit 2. The TVA rewards employees through itsEnterprise Scorecard sets forth the performance goals applicable to the Winning Performance Team Incentive Plan ("WPTIP") and the Executive Annual Incentive Plan ("EAIP"). The revised goals are set forth below. No changes were made to the goals for the other measures.
| | | | | | | | | | | | | | | | | | | | | | | | | | |
| Threshold | | Target | | Stretch |
| Measure | Original | Revised | | Original | Revised | | Original | Revised |
Annualized Nuclear
Unit Capability Factor | 91.3 | 89.5 | | 92.0 | 90.2 | | 93.7 | 91.9 |
See Executive Annual Incentive Plan below for more information about the 2021 Annual Incentive Award.
Performance Goals - 2019-2021 LTP Awards
On April 29, 2021, the Board exercised its discretion under the TVA Compensation Plan to approve a revised performance goal for the 2021 External Performance Indicators for the TVA Nuclear Fleet measure for the 2019-2021 LTP performance cycle. The revision, which the CEO believed was consistent with TVA’s compensation philosophy focus on pay for performance, was made to account for the impacts of eelgrass intrusion at Browns Ferry Nuclear Plant and steam generator degradation at Watts Bar Nuclear Plant Unit 2, both of which were beyond the control of management. See Item 7, Management’s Discussion and Analysis of Financial Condition and Results of Operation – Key Initiatives and Challenges – Generation Resources – Watts Bar Unit 2 and Aquatic Vegetation. The revised External Performance Indicators for the TVA Nuclear Fleet impacted the calculation of the External Measures composite metric, and the Board accordingly approved a corresponding change to the goals for that metric. The revised performance goals are set forth in the table below. The other performance measures and goals were not changed.
| | | | | | | | | | | | | | | | | | | | | | | | | | | | | | | | |
| | | Threshold | | Target | | Stretch |
| Measure | Weighting | | Original | Revised | | Original | Revised | | Original | Revised |
External Measures (1) | 30% | | 82.0 | 81.5 | | 89.8 | 89.4 | | 97.5 | 97.1 |
External Performance Indicators
for the TVA Nuclear Fleet (2) | 25% of
External
Measures | | 92.5 | 90.7 | | 95.0 | 93.2 | | 97.0 | 95.2 |
Notes
(1)For the 2019-2021 performance cycle, the External Measures metric is a composite of five performance measures: External Performance Indicators for the TVA Nuclear Fleet, Media Tone, Stakeholder Survey, Customer Loyalty, and Board Level Significant Events. The original goals for the Media Tone, Stakeholder Survey, Customer Loyalty, and Board Level Significant Events measures have not been changed.
(2)The External Performance Indicators for the TVA Nuclear Fleet measure is calculated using a weighted combination of key performance metrics established by an external nuclear industry organization based on standard nuclear industry definitions for station performance.
Performance Goals - 2020-2022 LTP and 2021-2023 LTP Awards
On August 18, 2021, the Board exercised its discretion under the TVA Compensation Plan to approve revised goals for the External Performance Indicators for the TVA Nuclear Fleet measure for the 2020-2022 and 2021-2023 LTP performance cycles to reflect new industry performance indicator goals established by an external organization, as well as impacts from the Watts Bar Unit 2 steam generator mid-cycle outage (2020-2022 LTP performance cycle), both of which were beyond the control of management. See Item 7, Management’s Discussion and Analysis of Financial Condition and Results of Operation – Key Initiatives and Challenges – Generation Resources – Watts Bar Unit 2.
The revised performance goals are set forth in the table below. The other performance measures and goals were not changed.
| | | | | | | | | | | | | | | | | | | | | | | | | | |
| Threshold | | Target | | Stretch |
| Measure | Original | Revised | | Original | Revised | | Original | Revised |
2020-2022 LTP award - External Performance
Indicators for the TVA Nuclear Fleet(1) | 94.3 | 87.4 | | 96.2 | 91.0 | | 97.7 | 93.6 |
2021-2023 LTP award - External Performance
Indicators for the TVA Nuclear Fleet(1) | 95.3 | 92.1 | | 96.8 | 94.9 | | 98.3 | 97.7 |
Note
(1)The External Performance Indicators for the TVA Nuclear Fleet measure is calculated using a weighted combination of key performance metrics established by an external nuclear industry organization based on standard nuclear industry definitions for station performance. The external index used for the External Performance Indicators for the TVA Nuclear Fleet measure for the 2020-2022 and 2021-2023 performance cycles was the 2020 Index. In addition, certain executives2021, the external organization established new performance indicators resulting in critical positions, including the NEOs, participate in long-term compensation plans (the Executivea new index.
See Long-Term Incentive Plan (“ELTIP”)Compensation below for more information about the 2020-2022 LTP awards and 2021-2023 LTP awards.
There were no compliance issues under Section 409A of the Long-Term Incentive Plan (“LTIP”), which replacedInternal Revenue Code associated with the ELTIP effective October 1, 2015). The LTIP provideschanges in the performance goals for long-termthe 2021 EAIP performance (“LTP”) grants and long-term retention (“LTR”) grants. Similar to incentive programs at other utilities,cycle or the 2019-2021, 2020-2022, or 2021-2023 LTP performance cycles since no amounts were deferred in connection with any awards under these performance cycles.
Updates to 2021-2023 LTP Award Metrics
The metrics and weightings under the WPTIP, EAIP, ELTIP,2021-2023 LTP Award were updated to support TVA's long-term financial strength, strengthen its customer loyalty and stakeholder relationships, and streamline the performance-based component ofmetrics as follows:
| | | | | | | | |
| Metric | 2020-2022 LTP Award – Weight | 2021-2023 LTP Award – Weight |
| Non-Fuel Delivered Cost of Power | 40% | 45% |
| Load Not Served | 30% | 30% |
External Performance Indicators for
TVA Nuclear Fleet | 15% | 15% |
Customer Survey(1) | 5% | 5% |
Stakeholder Survey(1) | 5% | 5% |
Media Tone(1) | 5% | Eliminated |
Note
(1)For the LTIP are not part of base pay but are “at risk”2020-2022 LTP, Customer Survey, Stakeholder Survey, and require employees to reach or exceed specific performance targets in order for payments to be earned.
For 2017, TVA transitioned from multiple organizational scorecards to a single scorecard, andMedia Tone were combined under an External Measures composite metric. The External Measures composite metric, as well as the scorecard resultsMedia Tone submetric, have been eliminated for the EAIP were 103 percent of the target opportunity. The following factors contributed to overall performance:
Lowest recordable injury rate since tracking began in 1985;
Maintained strong financial health measures while contributing an extra $500 million to the pension plan;
Improved overall operational performance of TVA’s nuclear fleet; and
Helped to retain and attract over 70,000 jobs and over $8.3 billion in capital investment to the TVA service area.
In addition, for the three-year period ended September 30, 2017, awards to NEOs under the ELTIP were 103 percent of the target opportunity primarily because of overall good performance and financial discipline. Throughout the 2015 - 2017 performance period, TVA accomplished the following objectives:
Reduced fuel cost $600 million over period with a balanced portfolio;
Maintained excellent reliability; and
Maintained favorable stakeholder perception and improved customer satisfaction and loyalty.
2017 Compensation Adjustments. On November 10, 2016, the TVA Board approved the compensation of CEO William Johnson for 2017. Mr. Johnson was awarded a2021-2023 LTP grant of $2,427,800 under the LTIP effective October 1, 2016, which will vest on September 30, 2019, provided certain performance targets are achieved and he is still employed on this date. Mr. Johnson also received a LTR grant under the LTIP of $606,950 effective October 1, 2016, which will vest in three equal increments on September 30, 2017, 2018, and 2019, subject to his being employed through such dates. On December 12, 2016, the TVA Board approved a cash award opportunity for Mr. Johnson of up to $200,000 per year, commencing in fiscal year 2017, based on the evaluation of his performance.
On November 10, 2016, Mr. Johnson approved compensation adjustments and grants for the following NEOs for 2017:
The salary for Mr. Thomas increased from $592,250 to $610,018. Additionally, Mr. Thomas was awarded a LTP grant of $750,000 effective October 1, 2016, which will vest on September 30, 2019, provided certain performance targets are achieved and he is still employed on this date. Mr. Thomas also received a LTR grant of $250,000 effective October 1, 2016, which will vest in three equal increments on September 30, 2017, 2018, and 2019, subject to his being employed through such dates.award.
The salary for Mr. Grimes increased from $600,000 to $650,000. Additionally, Mr. Grimes was awarded aSee 2021–2023 Outstanding LTP grant of $750,000 effective October 1, 2016, which will vest on September 30, 2019, provided certain performance targets are achieved and he is still employed on this date. Mr. Grimes also received a LTR grant of $260,000 effective October 1, 2016, which will vest in three equal increments on September 30, 2017, 2018, and 2019, subject to his being employed through such dates.
The salary for Mr. Skaggs increased from $471,700 to $495,285, and his EAIP opportunity increased from 70 percent of his salary to 80 percent of his salary. Additionally, Mr. Skaggs was awarded a LTP grant of $750,000 effective October 1, 2016, which will vest on September 30, 2019, provided certain performance targets are achieved and he is still employed on this date. Mr. Skaggs also received a LTR grant of $250,000 effective October 1, 2016, which will vest in three equal increments on September 30, 2017, 2018, and 2019, subject to his being employed through such dates.
The salary for Ms. Quirk increased from $463,500 to $477,405, and her EAIP opportunity increased from 65 percent of her salary to 70 percent of her salary. Additionally, Ms. Quirk was awarded a LTP grant of $675,000 effective October 1, 2016, which will vest on September 30, 2019, provided certain performance targets are achieved and she is still employed on this date. Ms. Quirk also received a LTR grant of $225,000 effective October 1, 2016, which will vest in three equal increments on September 30, 2017, 2018, and 2019, subject to her being employed through such dates.
Anticipated Termination of Certain Compensation Plans. On October 1, 2015, TVA adopted the LTIP, which, among other things, provides retention incentives that are similar in nature to the incentives provided under the LTDCP and LTRIP and performance incentives that are similar in nature to the incentives provided under the ELTIP. All previous credits issued under the LTDCP have vested, all awards granted under the LTRIP will vest by December 31, 2017, and the last performance cyclePerformance Cycle for the ELTIP ended on September 30, 2017; accordingly, TVA plans to terminategoals for each measure and for more information about the LTDCP, LTRIP, and ELTIP in CY 2018.2021-2023 LTP Award.
TVA's Executive Compensation Philosophy
TVATVA's mission is committed to achieving its mission to serve the people of the Tennessee Valley to make life better. It does this through a focus on three core areas: Energy, Environment and Economic Development. The compensation structure of TVA is developed to reinforce TVA’s mission and strategic imperatives.
TVA aims to achieve its mission by attracting, retaining, and motivating highly qualified and committed executives to guide the organization’sorganization's strategy, performance, and performance.public power mission. TVA follows a compensation plan ("Compensation Plan")Plan as adopted by the TVA Board in accordance with the guidance of the TVA Act.
The Compensation Plan is designed to:
Provide market-based, competitive compensation levels so TVA can attract, retain, and motivate highly competent employees. Total direct compensation generally targets the 50th percentile of the relevant labor market, although some positions are targeted up to the 75th percentile based on labor market scarcity and other issues.
Reward employees for performance. A substantial portion of executive pay, including pay for the Named Executive Officers, is tied to performance improvement. As illustrated in the charts below, at least half of each NEO’s target total direct compensation opportunity is delivered through performance-based incentive programs.
Align the organization’s short-term and long-term goals and objectives with compensation opportunity by providing a mix of salary and performance-based short-term and long-term incentives.
Align performance and productivity improvement at all levels by setting consistent performance goals and objectives for all levels of the organization.
| | | | | | | | |
| | |
| •Provide market-based, competitive compensation levels so TVA can attract, retain, and motivate highly competent employees. Target total direct compensation generally is determined by reference to the median (50th percentile) of the relevant labor market. Executives may be positioned above or below the median based on labor market scarcity and other factors such as tenure in the role. •Set performance goals that are aligned with TVA's strategic priorities. •Incentivize and reward short-term and long-term performance by providing a mix of salary and performance-based short-term and long-term incentives, typically targeting a majority portion of long-term compensation in the form of at-risk, performance-based compensation. •Align performance and productivity improvement at all levels by setting consistent performance goals and objectives for all levels of the organization. | |
| | |
The TVA Board follows these requirements of the TVA Act in designing and implementing its Compensation Plan:
•Compensation will be based on an annual survey of prevailingbenchmark compensation for similar positions in private industry, including engineering and electric utilityenergy companies, publicly-owned electric utilities,companies, and federal, state, and local governments; and
•Compensation will take into account education, experience, level of responsibility, geographic differences, and retention and recruitment needs.
TVA's Executive Compensation Program Aligns Pay with Performance
AuthorityNearly two-thirds of the CEO's target total direct compensation (“TDC”) is performance-based and at risk, based on achievement of performance goals that further advance TVA's mission and strategic objectives. More than half of the other NEO's target TDC opportunity is performance-based and at risk. This alignment of compensation with performance also results in compensation being aligned with value delivered to TVA's stakeholders, including LPCs, businesses, and communities, and to the economy of the Tennessee Valley.
| | | | | |
CEO TARGET TDC
COMPENSATION MIX | OTHER NEO TARGET TDC
COMPENSATION MIX |
| |
|
2021 CEO Target Total Direct Compensation Is Below the Peer Median
The TVA Act requires competitive, market-based executive compensation. Many of TVA's peers, with similarly complex and large-scale operations, are investor-owned utilities. The TVA Board considers TVA's federal agency status in setting compensation components and pay levels, both directly – by incorporating government agencies into the executive compensation survey sample used to develop benchmarks, as required by the TVA Act – and indirectly by targeting TDC below the 50th percentile median of the market composite data.
The TVA Board increased Mr. Lyash's pay for 2021 to reflect his leadership and experience. While the change moved Mr. Lyash's pay closer to the median in 2021, his target TDC is below the 25th percentile of the 2021 market composite.
The use of benchmarking data is described in detail under Compensation Setting Process Demonstrates Strong Governance – TVA Competes With Peers For Talent below.
The graphics below illustrate 2021 target TDC for the ExecutiveCEO and the average 2021 target TDC for the other NEOs as compared to the 2021 market composite 25th and 50th (median) percentiles.
Note
Target market assessment effective October 2020 and included market composite of Willis Towers Watson (“WTW”) database and proxy peer group.
CEO Compensation Programat a Glance
ACTUAL 2021 TOTAL DIRECT COMPENSATION ("TDC") EARNED
| | | | | | | | | | | | | | | | | | | | |
| | | | | | |
$1,100,000
BASE SALARY | | $2,928,750
ANNUAL PERFORMANCE AWARD At risk, performance based Under the Executive Annual Incentive Plan ("EAIP"), 142 percent of target enterprise performance achieved, 125 percent Individual Multiplier applied | | $2,671,680
LONG-TERM PERFORMANCE ("LTP") AWARD(1) At risk, performance based Under the Long-Term Incentive Plan ("LTIP"), 132 percent of LTP achieved for the three-year performance cycle ended September 30, 2021 | | $754,300
LONG-TERM RETENTION
("LTR") AWARD(2) Under LTIP, award amount consists of two 2021 tranches - 2020 LTR award and 2021 LTR award |
Notes
(1)Mr. Lyash was granted an LTP award with a target amount $2,024,000 effective October 1, 2019, for the 2019-2021 performance cycle that was part of his employment offer. Since Mr. Lyash joined TVA in 2019, this is the first LTP award he earned under the LTIP.
(2)Mr. Lyash's long-term incentives earned in 2021 reflect a partial long-term incentive award. While executives typically have three overlapping retention awards (typically granted annually with ratable vesting over-three years subject to continued employment), since Mr. Lyash joined TVA in 2019, he had only two such awards outstanding in 2021.
TDC earned reflects the decisions made by the Committee at the end of 2021 to reward the CEO for his past performance. Under Mr. Lyash's leadership as CEO, TVA has made meaningful progress on improving its Public Power mission. The company's outperformance under key operational metrics strengthened TVA's ability to deliver low-cost and reliable energy to the Tennessee Valley.
2021 TARGET TOTAL DIRECT COMPENSATION OPPORTUNITY GRANTED BELOW MARKET MEDIAN
| | | | | | | | |
| | Target TDC opportunity is forward-looking – it represents potential compensation set by the Committee, effective at the beginning of 2021, to incentivize superior performance. Some of the $6,913,000 opportunity was earned in 2021 (salary, annual performance award and 1/3 of the LTR award) while most will not be earned until future satisfaction of performance or employment conditions: Mr. Lyash will earn the LTP award component only upon achievement of certain performance targets at the end of the three-year performance period (September 30, 2023), and he will receive the second and third tranches of the LTR award opportunity only upon his continued employment on each of September 30, 2022 and September 30, 2023. See "2021 Performance Goals and Performance Achievement" below for more information on annual and long-term incentive plans. There is no minimum payment guaranteed under the annual and long-term performance awards. The amount that he will receive upon the vesting of those awards will be determined at the end of the performance periods and depends on the level of performance against preset performance goals. |
OTHER COMPENSATION
Mr. Lyash was paid $292,000 in 2021 as the third and final tranche of a deferred cash recruitment and relocation incentive award under his employment offer letter. This deferred cash incentive award was intended to compensate him for amounts he forfeited from his previous employer in order to join TVA, as well as to provide some measure of substitute compensation in light of his not being eligible to receive any LTP incentive payments until September 2021.
KEY COMPANY PERFORMANCE METRICS
The 2021 annual key performance metrics objectives were established in 2020 and, despite challenges presented by the COVID-19 pandemic, TVA exceeded all targeted objectives, delivering high operational, safety, and financial strength performance for 2021. The LTP performance metrics below were for the 2019-2021 performance cycle. Organizational performance under the 2019-2021 LTP program was stronger than expected in key operational measures.
| | | | | | | | | | | | | | | | | |
Annual Metric(1) | Target
Performance | Actual
Performance | | Weight | Performance Against Target |
| TVA Total Spend ($M) | $5,333 | $5,144 | | 40 | % | Exceeded stretch goal |
| Load Not Served (System Minutes) | 3.9 | 3.2 | | 30 | % | Exceeded stretch goal |
| Annualized Nuclear Unit Capability Factor | 90.2 | % | 90.5 | % | | 15 | % | Exceeded target goal |
| Combined Cycle Equivalent Availability Factor | 80.9 | % | 85.3 | % | | 10 | % | Exceeded target goal |
| Coal Equivalent Availability Factor | 64.0 | % | 71.6 | % | | 5 | % | Exceeded target goal |
| | | | | | | | | | | | | | | | | |
LTP Metric(1) | Target
Performance | Actual
Performance | | Weight | Performance Against Target |
| Non-Fuel Delivered Cost of Power | 3.44 | 3.22 | | 40% | Exceeded stretch goal |
| Load Not Served (System Minutes) | 4.0 | 3.2 | | 30% | Exceeded stretch goal |
| External Measures | 89.4 | | 87.9 | | | 30% | Above threshold goal |
Note
(1)See 2021 Performance Goals and Performance Achievement below for further information on each performance metric and 2021 results.
Compensation Setting Process Demonstrates Strong Governance
Who Is Involved In Setting Compensation
The TVA Board, under the authority of the TVA Act, has responsibility for establishing compensation for TVA employees, including the NEOs. The TVA Board is directed under Section 2 of the TVA Act to establish a plan that specifies all compensation (such as salary and any other pay, benefits, incentives, or other form of remuneration) for the CEO and TVA employees.
The TVA Act also provides that:
•The TVA Board will annually approve all compensation (such as salary and any other pay, benefits, incentives, or other form of remuneration) for all managers and technical personnel who report directly to the CEO (including any adjustment(s) to compensation);
•On the recommendation of the CEO, the TVA Board will approve the salaries of employees whose salaries would be in excess of Level IV of the Executive Schedule of the United StatesU.S. Government ($161,900172,500 in 2017)2021); and
•The CEO will determine the salary and benefits of employees whose annual salary is not greater than Level IV of the Executive Schedule ($161,900172,500 in 2017)2021).
Under the authority of the TVA Act, the TVA Board, its People and PerformanceGovernance Committee (the “Committee”"Committee"), and individual TVA Board members are involved in compensation matters. The TVA Board has delegated to the CEO the authority to approve, or delegate to others the authority to approve, all personnel and compensation actions for which the TVA Board is responsible but has not reserved for itself. In addition, the TVA Board has taken the following actions to delegate authority with respect to executive compensation:
•The TVA Board has delegated to the TVA Board Chair, in consultation with the Committee and with input from individual members of the TVA Board, the authority to evaluate and rate the CEO's performance during the year, and the authority to approve any payout to the CEO under the EAIP, based on, among other things, the CEO's evaluated performance during the year.
•The TVA Board has authorized the CEO to set or adjust compensation for present or future direct reports within a compensation rangesrange of 80 percent to 110 percent of the targeted total direct compensation for comparable positions,target TDC, as well as to approve the parameters under which such executives may participate in certain supplemental benefit plans such as TVA’sTVA's Supplemental Executive Retirement Plan ("SERP"), provided that the CEO may not finally set or adjust such compensation until the TVA Board members have been notified of the proposed compensation and given the opportunity to ask the Committee, or the full TVA Board, to review the proposed compensation before it becomes effective.
The TVA Board has delegated to the Board Chair, in consultation with the Committee and with input from individual members of the TVA Board, the authority to evaluate and rate the CEO’s performance during the year, and the authority to approve any payout to the CEO under the EAIP, based on, among other things, the CEO's evaluated performance during the year.
•The TVA Board has delegated to the CEO, in consultation with the Committee and with input from individual members of the TVA Board, the authority to approve the individual performance goals for the CEO's direct reports and the authority to evaluate and rate the performance of the CEO's direct reports during the year.year against such performance goals.
•The TVA Board Committee Oversighthas delegated to the CEO the authority to approve, or delegate to others the authority to approve, all personnel and compensation actions for which the TVA Board is responsible but has not reserved for itself.
•The Committee wasis responsible for oversight of executive compensation pursuant to the Compensation Plan and review of this Compensation Discussion and Analysis, and reviewAnalysis.
Role of the CEO’s performance during the year and about the proposed payout to the CEO under the EAIP, and (3) consulted with the CEO on the proposed individual performance goals and evaluation and performance ratings for the CEO's direct reports for the year. Compensation Consultant
The Committee usedengaged the independent consulting firm Frederic W. Cook & Co., Inc. (“("FW Cook”Cook") in 20172021 to determine the peer group and the benchmarking process, and to help evaluate competitive compensation. The Committee assessed certain independence factors and determined the firm’sfirm's work raised no potential conflict of interest.
Compensation Setting – Annual Roles and Responsibilities
The following chart sets forth the roles of the TVA Board, Board Chair, Committee, and CEO, and typical timeframe, in setting compensation for the NEOs.
| | | | | | | | |
| What | When | How |
| Compensation Governance | January | –Committee reviews and evaluates independent compensation consultant. |
| April - May | –Committee reviews TVA Compensation Plan, peer group, and benchmarking process and recommends any changes to the TVA Board. –TVA Board reviews and approves any changes. |
| Incentive Plans Goals and Measures | April | –Committee reviews proposed performance targets for next fiscal year. |
| July - August | –Committee finalizes recommendation on goals for next fiscal year. –CEO and TVA Board approve incentive plan pay goals for upcoming cycles. |
| Corporate Multiplier (WPTIP/EAIP) | October - November | –CEO evaluates and assesses performance results compared to target goals. –CEO recommends corporate multiplier (reviewed by the Committee) for TVA Board approval. –Committee reviews and recommends to the TVA Board. –TVA Board reviews and approves. |
Long-Term
Incentive Plan -Long-Term Performance ("LTP") | October - November | –CEO evaluates performance and recommends LTP payout percentage (reviewed by Committee) for TVA Board approval. –Committee reviews and recommends LTP payout percentage. –TVA Board reviews and approves the LTP payout percentage. –The TVA Board has the discretionary authority to review the results of performance measures and goals and to approve any adjustments to payouts in appropriate circumstances. |
| Executive Schedule ("ES") Level IV | October - November | –The list of employees (excluding CEO and Inspector General ("IG")) whose salaries would be above ES Level IV ($172,500 for 2021) is made available to the Committee and other TVA Board members. –Proposed delegation for the CEO to approve the list is reviewed prior to presentation for TVA Board approval. –TVA Board approves, on recommendation of CEO, the salaries of employees (excluding CEO and IG) whose annual salary would be above ES Level IV. –Approval of employee list has been delegated annually to CEO (2008 – 2021). |
CEO
Performance
Evaluation | September - November | –Individual TVA Board members complete CEO performance assessment and return to Compensation. –Compensation summarizes comments and information and presents to the Board Chair. –Board Chair consults with Committee. –Board Chair informs EVP, Chief People and Communications Officer, he/she has: •Evaluated the CEO's performance •Determined the EAIP award –Board Chair and Committee Chair jointly inform CEO of his/her performance evaluation. |
CEO
Compensation
Adjustment | October - November | –Committee reviews the compensation consultant's benchmarking and market analysis report. –Committee decides whether to recommend compensation adjustments for the CEO (recommends to the full TVA Board, if applicable). –TVA Board reviews and approves at the November Board meeting, if applicable. |
| CEO Executive Annual Incentive Plan ("EAIP") Award | October - November | –Board Chair obtains input from TVA Board members, consults with Committee, and approves any payout, or adjustments to payout, to the CEO under the EAIP. –Informs EVP, Chief People and Communications Officer, via memo. |
CEO Annual
Performance
Goals | October - November | –Board Chair reviews and discusses with CEO performance goals for the next fiscal year. –Board Chair consults with appropriate TVA Board committee. –Board Chair solicits input from individual TVA Board members. –Board Chair informs CEO of approved goals. |
CEO Direct Report
Compensation | October - November | –CEO determines compensation adjustments for CEO direct reports. The TVA Board has delegated this responsibility to the CEO for the CEO direct reports within an approved range (80-110 percent of market TDC). –CEO reviews CEO direct reports' performance with Committee and informs TVA Board members of compensation adjustments under consideration prior to approving the compensation adjustments. –CEO notifies EVP, Chief People and Communications Officer, of approved compensation adjustments via memo. |
Compensation Discussion
and Analysis ("CD&A") | October - November | –Committee reviews and recommends inclusion in TVA's Annual Report on Form 10-K. |
TVA Competes with Peers for Talent
A fundamental goal of TVA's executive compensation program is to attract, retain, and motivate the highly competent talent necessary to manage TVA's complex operations and achieve superior performance. TVA competes for this talent with large investor-owned energy companies, and thus TVA needs to offer compensation programs that are competitive with those peers.
Use of Market Data and Benchmarking
TVA generally determines target TDC for executives based on the relevant labor market. After compiling market compensation for the positions at the beginning of 2021, the Committee, with assistance from FW Cook, used the information to:
•Assess target compensation level and incentive opportunity competitiveness; and
•Determine appropriate target compensation levels and incentive opportunities to maintain the desired degree of market competitiveness taking into consideration other factors such as experience, skill set, performance, and internal parity.
The relevant labor market for most of TVA's executives, including the NEOs, consists of both private and publicly-owned companies in the energy services industry that have similar revenue and scope as TVA. Each year, the Committee's compensation consultant recommends a peer group for approval by the Committee. For 2021 compensation opportunities, TVA's market data was determined based on a review of executive compensation survey data and proxy peer group data. For the survey-based analysis, TVA referenced a sample from the 2020 Willis Towers Watson Energy Services Executive Compensation Database consisting of (i) 36 IOUs with revenues greater than or equal to $3.0 billion plus (ii) 10 additional government entities with revenue greater or equal to $1.0 billion. Data from this sample were further regressed to TVA's size based on revenue. For NEO roles, the survey analysis was supplemented with public compensation data from a separate proxy peer group of IOUs. The Committee reviews the proxy peers annually to ensure continued appropriateness, including comparable business content and model, company size measured primarily by revenue and assets, and other refining factors such as generating capacity, number of employees, and number of customers. When making compensation decisions for 2021, the Committee reviewed peer group size data, which is shown below. At that time, TVA was centrally-positioned within the current peer group; the primary financial metrics, revenue and assets, are positioned near the median, while secondary metrics are balanced, with generating capacity above the 85th percentile, customers above the 75th percentile, and employee count at the 30th percentile.
| | | | | | | | | | | | | | |
TVA REVENUE VS
PEERS(1) ($MMs) | TVA ASSETS VS
PEERS(2) ($MMs) | GEN CAPACITY VS
PEERS(3) (000s MW) | TVA EMPLOYEE
COUNT VS PEERS(4) | TVA CUSTOMER COUNT VS PEERS(5) (000s) |
| | | | |
| | | | |
Notes
(1)Based on data from the consecutive four quarters ended June 30, 2020 (data source S&P's Capital IQ)
(2)Based on data from the consecutive four quarters ended June 30, 2020 (data source S&P's Capital IQ)
(3)Based on fiscal year end as of October 2020 (data source S&P's Capital IQ)
(4)Based on data reported by SNL Energy in March 2020
(5)Based on data reported by SNL Energy in March 2020
For executives with both proxy and survey benchmarks, competitive comparisons were made relative to a "market composite" or an average of the survey and proxy data.
List of Compensation Peer Companies
The following chart outlines the companies that constituted the survey sample and proxy peer group used to benchmark NEO compensation for 2021:
| | | | | | | | | | | |
| Company | Investor Owned Utilities
with Revenue Greater
than or Equal to $3.0 Billion
Which Participated in
2020 Willis Towers
Watson Energy Services
Survey | Government Entities
Which Participated in
2020 Willis Towers
Watson Energy Services
Survey | Proxy Peer Group
of Investor Owned
Utilities |
| AES Corp. | | | |
| Alliant Energy | | | |
| Ameren | | | |
| American Electric Power Co., Inc. | | | |
| AVANGRID | | | |
| Berkshire Hathaway Energy | | | |
| Calpine | | | |
| CenterPoint Energy, Inc. | | | |
| CMS Energy Corp. | | | |
| Consolidated Edison | | | |
| CPS Energy | | | |
| Dominion Energy | | | |
| Dominion Energy Southeast | | | |
| DTE Energy Co. | | | |
| Duke Energy Corp. | | | |
| Edison International | | | |
| Entergy Corp. | | | |
| Evergy | | | |
| Eversource Energy | | | |
| Exelon Corp. | | | |
| FirstEnergy Corp. | | | |
| JEA | | | |
| LG&E and KU Energy | | | |
| Lower Colorado River Authority | | | |
| National Grid USA | | | |
| Nebraska Public Power | | | |
| NextEra Energy, Inc. | | | |
| NiSource | | | |
| New York Power Authority | | | |
| NRG Energy | | | |
| Oak Ridge National Lab | | | |
| Oglethorpe Power | | | |
| Oncor Electric | | | |
| Omaha Public Power | | | |
| Pacific Gas and Electric Co. | | | |
| Pinnacle West Capital | | | |
| PPL Corp. | | | |
| Public Service Enterprise Group Inc. | | | |
| Puget Sound Energy | | | |
| Salt River Project | | | |
| Santee Cooper | | | |
| Sempra Energy | | | |
| Southern Company | | | |
| Vistra Energy | | | |
| WEC Energy | | | |
| Xcel Energy | | | |
Assessment of Risk
TVA’sTVA's Enterprise Risk Management Organization, in coordination with other members of TVA’sTVA's management, including Human ResourcesTotal Rewards and Compensation and Benefits,Strategic Performance, conducts an annual assessment of enterprise level risks that considersincluding risks arising from TVA's compensation policies and practices, in order to identify any risks that are reasonably likely to have a material adverse effect on the organization and its achievement of its strategic goals and objectives.
practices.
Based on the results of this assessment, no risks were identified with the compensation policies and practices that are reasonably likely to have a material adverse effect on TVA’sthe organization and its achievement of its strategic goals and objectives.
2021 Executive Compensation Program Components
UseTotal Direct Compensation
In setting executive compensation each year, the Committee focuses on TDC, which includes those compensation elements that incentivize future performance or reward past performance. TDC is comprised of Market Dataannual salary, annual incentive award under the EAIP, LTP award under the LTIP, and BenchmarkingLTR award under the LTIP.
TVA generally targets total directEach year, two key compensation for executives at a competitive level based ondecisions are made with respect to NEO compensation: (1) the relevant labor market. After compiling market compensation foramount of the positions atTDC opportunity to grant, which is forward-looking, incentivizes the NEO to perform, and is determined towards the beginning of 2017, the Committee, with assistance from FW Cook, usedfiscal year, and (2) the information to:
Test target compensation levelamount of TDC earned, which rewards the NEO for prior performance and incentive opportunity competitiveness;(other than salary) is determined at the end of the year. The TDC components and
Determine appropriate target compensation levels and incentive weightings for TDC opportunities granted to maintain the desired degree of market competitiveness.
The relevant labor market for most of TVA's executives, including the NEOs consisted of both privatein 2021 are summarized below and publicly-owned companiesdescribed in the energy services industry of similar revenuesections that follow. Since TVA is a governmental entity that issues no equity, all direct compensation is denominated and scope to TVA. TVA's peer group is reviewed on an annual basis. For the survey-based analysis, TVA used the 2016 Willis Towers Watson Energy Services Executive Compensation Database and targeted 28 investor owned utilities with revenues greater than or equal to $3 billion. This positions TVA near the middle of the revenue based peer group of multiple large utilities. Six additional government entities participatedpaid out in the 2016 Willis Towers Watson Energy Services Executive Compensation Survey and were considered by the Committee on the basis of industry similarity, although their annual revenue was $3 billion or less.
Survey data is supplemented with proxy data to provide additional market reference points for NEO functional roles. When conducting proxy analysis, competitive comparisons are made relative to a "market composite" or an average of the survey and proxy data as recommended by FW Cook. Several companies were considered in the proxy analysis because they are energy services firms with annual revenue between approximately one-half and two times TVA's revenue.cash.
The following chart outlines the companies that constitute the 2016 Willis Towers Watson Energy Services survey sample and the proxy peer group, which together formed the competitive market reference for benchmarking NEO compensation for 2017:
|
| | | |
Company | Investor Owned Utilities with Revenue Greater than or Equal to $3 Billion Which Participated in 2016 Willis Towers Watson Energy Services Survey | Government Entities Which Participated in 2016 Willis Towers Watson Energy Services Survey | Proxy Peer Group of Investor Owned Utilities |
AES Corp. | þ | | þ |
Alliant Energy | þ | | |
Ameren | þ | | þ |
American Electric Power Co., Inc. | þ | | þ |
Calpine Corp. | þ | | þ |
CenterPoint Energy, Inc. | þ | | þ |
CMS Energy Corp. | þ | | þ |
Colorado Springs Utility | | þ | |
Consolidated Edison | | | þ |
Dominion Resources, Inc. | þ | | þ |
DTE Energy Co. | þ | | þ |
Duke Energy Corp. | þ | | þ |
Edison International | þ | | þ |
Energy Northwest | | þ | |
Entergy Corp. | þ | | þ |
Eversource Energy | | | þ |
Exelon Corp. | þ | | þ |
FirstEnergy Corp. | þ | | þ |
JEA | | þ | |
MDU Resources | þ | | |
New York Power Authority | | þ | |
NextEra Energy, Inc. | þ | | þ |
NiSource | | | þ |
NRG Energy | | | þ |
OGE Energy, Inc. | þ | | |
Omaha Public Power | | þ | |
Pacific Gas and Electic Co. | þ | | þ |
Pinnacle West Capital | þ | | |
PPL Corp. | þ | | þ |
Public Service Enterprise Group Inc. | þ | | þ |
Puget Sound Energy | þ | | |
Salt River Project | | þ | |
SCANA | þ | | |
Sempra Energy | þ | | þ |
Southern Company | þ | | þ |
TECO Energy | þ | | |
Wisconsin Energy | þ | | |
Xcel Energy | þ | | þ |
Executive Compensation Program Components
The primary compensation program components for 2017 for the NEOs are summarized in the diagram below and are briefly described in the table and the narrative that follow the diagram.

|
| | | | |
Primary Compensation Program Components for Named Executive Officers in 2017Component
And % of Target TDC | Objective | Key Features |
Compensation Component | | Objective | | Key Features |
Annual Salary | | Provides fixed base level of compensation to executives to encourage hiring and retention of qualified individuals | | - •Annual salary is targeted at thetypically determined by reference to median (50th percentile) for similar positions at other companies in TVA’sTVA's peer group orgroup; above the median (50th to 75th percentile) for positions affected by market scarcity, recruitment and retention issues, and other business reasons; or below median due to incumbent experience, position scope, or other business reasons.
- •Typically reviewed annually to consider changes in benchmark salaries and/or exceptional individual merit performances. |
| | | | |
Executive Annual Incentive Plan ("EAIP") | (EAIP) | Incentivizes performance by providing at-risk compensation tied to attainment of pre-established performance goals for the fiscal year | | - •Annual incentive payouts are based on the results of establishedenterprise goals of an enterprise scorecard, as determined from year to year by the TVA Board or the CEO, as applicable. Annual incentive payouts may be impacted by a corporate multiplier or adjusted by the TVA Board or CEO, as applicable, based on the evaluation of performance during the year.
- •Target annual incentive opportunities increase with position and responsibility and are based in part on the opportunities other companies in TVA’sTVA's peer group provide to those in similar positions.
- •Typically reviewed annually to consider changes in benchmark annual incentives. |
| | | | |
Long-Term Incentive Plan (“LTIP”)(LTIP) | | Incentivizes performance and retention by providing performance-based and retention-based grants that are tied to a vesting schedule | | - •Participation is limited to key positions that have the ability to significantly impact the long-term financial and/or operational objectives critical to TVA's overall success.
- •LTP awards are granted annually with a three-year vesting cycle. Awards are variable at-risk opportunities based on achieved levelachievement against performance goals established at the beginning of performance (i.e., scorecard results for the three-year performance period).
- period. •The Committee's policy is for a majority of each executive's total long-term incentive opportunity to be in the form of performance-based awards, with the remaining percent to be retention oriented. •LTR awards may be granted annually and will vest and pay out in three equal increments annually over three years, subject to the participant being employed through such dates.
- Effective October 1, 2015, this plan replaceddates, but are payable upon death or disability if earlier on a pro-rated basis. •Since TVA issues no equity, TVA offers retention awards to be competitive with the ELTIP and LTRIP. |
| | | | |
Pension Plans
(Qualified Plans and Supplemental Executive Retirement Plan) | | Provides compensation beginning with retirementindustry marketplace for talent, providing a retention incentive similar to restricted stock or termination of employment (if vesting requirementsrestricted stock units. These grants are satisfied) with enhanced compensation for certainintended to encourage executives to remain with TVA and to provide, an additional incentive for hiringin combination with salary, EAIP, and retentionLTP grants, a competitive level of qualified individuals | | - Broad-based plans available to full-time employees of TVA that are qualified under Internal Revenue Service ("IRS") rules and are similar to the qualified plans provided by other companies in TVA's peer group.
- Certain executives in critical positions also participate in a non-qualified pension plan that provides supplemental pension benefits at compensation levels that are higher than the limits specified by IRS regulations for qualified pension plans. These supplemental benefits are comparable to those provided by other companies in TVA's peer group. |
| | | | TDC. |
Executive Long-Term Incentive Plan ("ELTIP")(1)Performance Award (LTP)
| | Incentivizes performance by providing at-risk compensation tied to attainment of pre-established performance goals forover a performance cycle, typically three years | | - Participation includes executives and select managers in critical positions who make decisions that significantly influence developing and attaining TVA’s long-term strategic objectives.
- Long-term incentive payouts are based on achievement of performance goals established for a specific, three-year performance cycle and may be adjusted by the TVA Board, based on the evaluation of performance during the cycle.
- Effective October 1, 2015, this plan was replaced by the LTIP but will continue to pay out through 2017, subject to the attainment of goals. |
| | | | period |
Long-Term Retention Incentive Plan ("LTRIP")(1)Award (LTR) | | Incentivizes retention by providing retention-based grants that are tied to a fixed award at the end of a set period of time, typically three years, if the executive remains employed at the end of the period | | - Awarded to provide retention incentives to executives similar to those provided by restricted stock or restricted stock units in publicly traded companies.
- Grants will vest after a specified period of time, usually no longer than three years.
- Effective October 1, 2015, this plan was replaced by the LTIP but will continue to pay out into 2018. |
| | | | |
Long-Term Deferred Compensation Plan ("LTDCP")(1)
| | Incentivizes retention by providing a fixed award at the end of a set period of time, typically three to five years, if the executive remains employed at the end of the period | | - Awarded to provide retention incentives to executives similar to those provided by restricted stock or restricted stock units in publicly traded companies.
- Executives generally must remain at TVA for the entire length of the agreement to receive compensation credits.
- Long-term deferred compensation has been replaced by other long-term compensation programs, and the last LTDCP credits vested in December 2016.three-year vesting schedule |
NoteSetting Competitive Compensation Amounts and Opportunities Relevant to Labor Market
(1) These plans are being phased out.Salary
Salary. Annual salary is targeted at the median (50th percentile) for similar positions at other companies in TVA's peer group or above the median (50th to 75th percentile) for positions affected by market scarcity, recruitment and retention issues, and other business reasons. In general, salary isconsidered a "fixed" compensation component. Salary levels are typically reviewed annually with increases awarded based on prior year performance and to bringconsider changes in benchmark salaries into alignment with the market.and/or exceptional individual merit performances.
The 2021 salaries offor the NEOs for 2017are described under each executive's compensation scorecard under 2021 Pay Decisions - 2021 NEO Pay Decisions and 2016 were as follows:
|
| | | |
| Executive | 2017(1) | 2016 | % change |
| Mr. Johnson | $995,000 | $995,000 | 0.0% |
| Mr. Thomas | 610,018 | 592,250 | 3.0% |
| Mr. Grimes | 650,000 | 600,000 | 8.3% |
| Mr. Skaggs | 495,285 | 471,700 | 5.0% |
| Ms. Quirk | 477,405 | 463,500 | 3.0% |
Note
(1) All 2017 salary changes were effective on October 1, 2016.
Annual Incentive Compensation. All executives, including the NEOs, participateCompensation Scorecards below and reported in the EAIP. The EAIP is designed to encourageExecutive Compensation Tables and reward executives for successfully achieving annual financial and operational goals. For 2017, an executive's annual incentive payment under the EAIP was calculated as follows:Narrative Disclosures - Summary Compensation Table.
|
| | | | | | | | | | |
EAIP
Amount
| = | Annual
Salary
| X | Annual Target
Incentive
Opportunity
| X | Percent of
Opportunity
Achieved
(0% to 150%)
| X | Corporate
Multiplier
(0 to 1.00)
| X | Individual Performance Multiplier
(0% to 125%)
|
Each component of this calculation is discussed below (except for annual salary, which is discussed above).
Annual Target Incentive Opportunity. AnnualThe incentive opportunities for participants in the EAIP generally increase with position and responsibility. For 2017, the TVA Board set Mr. Johnson's target EAIP award opportunity at 150 percent of salary. See Considerations Specific to Mr. Johnson. In October 2016, Mr. Johnson evaluated the appropriateness of the EAIP award opportunities for the other NEOs and made changes as appropriate in order to ensure market competitiveness. Accordingly, target EAIP award opportunities of the NEOs for 2017 were as follows:
|
| | |
| Named Executive Officers | 2017 Target Annual Incentive Opportunity(1) | 2016 Target Annual Incentive Opportunity(1) |
| Mr. Johnson | 150% | 150% |
| Mr. Thomas | 80% | 80% |
| Mr. Grimes | 80% | 80% |
| Mr. Skaggs | 80% | 70% |
| Ms. Quirk | 70% | 65% |
Note
(1) Represents a percent of each NEO’s salary.
Percent of Opportunity Achieved. The TVA Board and CEO worked together to establish one organizational scorecard for the 2017 EAIP (TVA Enterprise Scorecard). The scorecard was also used to determine annual incentive payouts for all non-executive TVA employees who participated in TVA's 2017 Winning Performance Team Incentive Plan ("WPTIP").
Once scorecard results were calculated, the CEO, after consulting with the TVA Board, rounded the scorecard results and recommended payout at 103 percent. The Chair of the TVA Board, in consultation with the committee and with input from the individual members of the TVA Board, then recommended and approved an identical rounded payout of 103 percent for the CEO.
The goals and associated weightings for the scorecard and the adjusted results achieved follows:
TVA 2017 Enterprise Scorecard
Notes
(1) Load Not Served (“LNS”) is equal to the product of (i) the percentage of total load not served (the amount of load that would have been delivered had the interruption not occurred is estimated in MWhs) and (ii) the number of minutes in the period during which load was not served (excluding interruptions because of declared major events). Value is expressed in system minutes. One system minute is in effect the total amount of load that TVA serves during an average minute during the fiscal year.
(2) TVA Total Spending is defined as non-fuel operating & maintenance ("O&M") expense plus capital expense plus non-fuel inventory expense for corporate and operational organizations.
(3) Nuclear Unit Capability Factor ("UCF") is the ratio of available energy generation during 2017 to the reference energy generation over the same time period.
(4) Coal Seasonal Equivalent Forced Outage Rate measures the generation lost because of forced events as a percentage of time a unit would have been scheduled to run. This indicator is for the months of December to March and June to September for 2017 and includes all coal-fired plants.
(5) Combined Cycle Seasonal Equivalent Forced Outage Rate measures the generation lost because of forced events as a percentage of time a unit would have been scheduled to run. This indicator is for the months of December to March and June to September for 2017 and includes Caledonia, John Sevier, Lagoon Creek, Magnolia, and Southaven Combined Cycle Plants.
(6) Projects Milestones are defined for projects considered critical to achieving the TVA mission (capacity expansion, major regulatory projects, major maintenance projects, and coal combustion residuals projects).
Corporate Multiplier. The TVA Board approved the use of a corporate multiplier for the WPTIP and EAIP. The corporate multiplier ranges between 0 and 1.0 and can be used only for purposes of reducing the amount of the award. For 2017, the TVA Board determined that the corporate multiplier should be 1.0 based on the following:
Safety better than top decile and best in last ten years;
Strong financial performance, including an additional $500 million contribution to TVA's qualified pension plan;
Solid economic development and capital investment; and
Zero Board level significant events.
Notes
(1) Recordable Incident Rate is defined as the number of recordable injuries (as defined by TVA’s safety program) per 200,000 employee-hours worked by TVA employees and staff augmentation contractors (excluding hearing events).
(2) Total Financing Obligations and Liabilities is calculated by subtracting contributions to unfunded liabilities from the sum of (1) long-term debt, net (including unamortized premiums/discounts), (2) short-term debt, net, (3) leaseback obligations, (4) energy prepayment obligations, and (5) variable interest entities.
(3) Operating Cash Flow is the amount of cash generated from power production and other mission-related activities. It is generally defined as operating revenues received less cash payments made for operating expenses.
(4) Net Income consists of the organization’s net earnings derived by adjusting revenues for the cost of doing business, including the cost of sales, depreciation, interest, taxes, and other expenses.
(5) Jobs Created and Retained measures the number of new or retained jobs in the Tennessee Valley for which TVA has played a role in the recruitment or retention of the economic development project.
(6) Board Level Significant Events include items deemed materially significant to the TVA Board and that affect TVA’s reputation with its customers and its stakeholders, the organizational health of the workforce, or TVA’s impact on the public at large.
Individual Performance Multiplier. The 2017 EAIP maintained the CEO's discretion to adjust individual incentive awards based on subjective assessments of individual performance during 2017. Once all other preliminary 2017 EAIP payouts were calculated and the corporate multiplier was applied, Mr. Johnson, as CEO, and in consultation with the Committee, evaluated each NEO’s performance (except his own) to determine whether any upward or downward adjustment should be made to the final annual incentive award of the participants. No additional adjustments were made to these awards.
In addition, the Board Chair, in consultation with the Committee and with input from individual members of the TVA Board, evaluated Mr. Johnson’s performance as CEO during 2017 to determine whether any adjustment should be made to his incentive award under the EAIP. Based on this review, the Board Chair decided that Mr. Johnson’s final annual incentive award should be adjusted 110 percent based on TVA’s 2017 performance, including strong financial results, improvement in broad-based worker safety performance, progress on rates and O&M spending, improvement in customer loyalty and stakeholder relationships, economic development, and investment in the Tennessee Valley. Additionally, there was improved overall operational performance of TVA's nuclear fleet.
EAIP Payouts. As a result of the above process, the NEOs were awarded the following EAIP payouts for 2017 in comparison to the 2017 target payouts:
|
| | | | | | | | | | | | | | | |
| 2017 EAIP Payouts |
| Named Executive Officers | | Salary | | Target EAIP Incentive Opportunity (% of Salary) | | Target EAIP Payout | | Scorecard Results After Application of Corporate Multiplier | | Individual Performance Multiplier | | Actual EAIP Payment |
| William D. Johnson | | $995,000 | | 150% | | $1,492,500 | | 103% | | 110% | | $1,691,003 |
| John M. Thomas, III | | 610,018 |
| | 80% | | 488,014 |
| | 103% | | 100% | | 502,654 |
|
| Joseph P. Grimes, Jr. | | 650,000 |
| | 80% | | 520,000 |
| | 103% | | 100% | | 535,600 |
|
| Michael D. Skaggs | | 495,285 |
| | 80% | | 396,228 |
| | 103% | | 100% | | 408,115 |
|
| Sherry A. Quirk | | 477,405 |
| | 70% | | 334,184 |
| | 103% | | 100% | | 344,210 |
|
Awards to the NEOs under the EAIP for 2017 are reported in the “Non-Equity Incentive Plan Compensation” column in the Summary Compensation Table.
Long-Term Incentive Compensation. In addition to the EAIP, certain executives in critical positions, including the Named Executive Officers, participate in the company's long-term compensation plans. These individuals make decisions that significantly influence the development and execution of TVA's long-term strategic objectives. As such, the long-term compensation plans are designed to reward executives for helping TVA improve in areas directly related to TVA's long-term success by:
Using enterprise-wide performance criteria that are directly aligned with TVA's mission;
Using a “cumulative” performance approach to measure performance achieved over a three-year period with a new three-year performance cycle beginning each year;
Using a potential payment range of 50 percent to 150 percent of target incentive opportunity to enable awards that are commensurate with performance achievements; and
Targeting award opportunities for each performance cycleset at levels that approximate median levels(i) are competitive with the relevant labor market, with target total direct compensation generally determined by reference to the 50th percentile of competitiveness with TVA's peer groupthe relevant labor market, and incorporating(ii) result in a majority of each executive's total long-term incentive opportunity in the Committee's policy that (i) approximately 70 to 80form of performance-based awards and the remaining percent of each executive's total long-term incentive opportunity be performance-based (under the ELTIP and performance-based awards under the LTIP) and (ii) approximately 20 to 30 percent of each executive's total long-term incentive opportunity be retention-oriented under the LTRIP or retention awards under the LTIP as described below under the heading "Long-Term Retention Arrangements."
LTIP. Effective October 1, 2015, TVA adopted the LTIP. The LTIP combines and replaces both the ELTIP, which provides for performance-based awards, and the LTRIP, which provides for time-based retention awards. The purpose of the LTIP is to provide a cohesive total long-term compensation opportunity through the granting of (1) variable, at-risk long-term performance-based awards and (2) long-term retention awards. Participants may receive both types of awards. For participants who have been granted both types of awards, the retention awards will typically be targeted at 20 percent to 30 percent of each participant’s total targeted long-term compensation. The remaining 70 percent to 80 percent of long-term compensation will be in the form of performance-basedretention awards.
Long-term incentive awards are intended to provide a similar pay component as equity-based compensation at peer IOUs. Since TVA does not issue equity, the compensation program cannot provide a component similar to equity awards that capture long-term value, reflect the continuing efforts of executives, and have the potential for significant appreciation. As a result, TVA's long-term incentives are not necessarily intended to match market pay levels.
Effective October 1, 2016, TVA grantedTarget incentive opportunities increase with position scope and responsibility to hold management accountable for delivery of results and are based in part on the following LTP awards:
|
| |
Named Executive Officers | LTP/Long-Term Performance Grant (1)
|
Mr. Johnson | $2,427,800 |
Mr. Thomas | 750,000 |
Mr. Grimes | 750,000 |
Mr. Skaggs | 750,000 |
Ms. Quirk | 675,000 |
Note
(1) All awards vest September 30, 2019,opportunities other companies in TVA's peer group provide to those in similar positions. Incentive opportunities are typically reviewed annually to consider changes in benchmark annual and the actual amount the executives receive upon payout may vary based
on organizational performance under the LTIP.
LTP awards will be included in the "Non-Equity Incentive Plan Compensation" column in the Summary Compensation Table in the year in which they vest. See “Long-Term Retention Arrangements - LTIP” below for a discussion of the LTR awards that TVA granted under the LTIP effective October 1, 2016.
ELTIP. Although TVA’s LTIP replaced the ELTIP, the ELTIP still covered the 2015 - 2017 performance period. Under the ELTIP, an executive's incentive payment is calculated as follows:
|
| | | | | | |
ELTIP
Payout
| = | Salary | X | Target ELTIP Incentive
Opportunity
| X | Percent of Opportunity
Achieved
|
For the 2015-2017 performance period, the target ELTIP incentive opportunitylong-term incentives. The Committee reviews peer benchmark information by position for each component of the Named Executive Officers waspay as follows.well as for overall TDC.
Non-Direct Compensation Elements |
| |
Named Executive Officers | Target Long-Term Incentive Opportunity (1)
|
Mr. Johnson | 175% |
Mr. Thomas | 120% |
Mr. Grimes | 110% |
Mr. Skaggs | 90% |
Ms. Quirk | 120% |
Other CompensationNote
(1) Represents a percent of each Named Executive Officer’s salary.
In November 2016, theorder to recruit high-quality talent, TVA Board reviewed the market competitiveness of Mr. Johnson’s ELTIP opportunity and determined that no changes were necessary. See Considerations Specific to Mr. Johnson. Mr. Johnson evaluated the appropriateness of the ELTIP award opportunities for Mr. Thomas, Mr. Grimes, Mr. Skaggs, and Ms. Quirk and made no changes as the opportunities were competitive with regard to the market.
2015 - 2017 Performance Cycle
For the three-year cycle ended September 30, 2017, the TVA Board approved three overall long-term incentive measures of TVA performance to be applied to all participants in the ELTIP:
Wholesale Rate Excluding Fuel;
Load Not Served (the product of the percentage of total load-not-served multiplied by the number of minutes in the period); and
External Measures (including external nuclear performance indicators, stakeholder survey, media tone, customer loyalty, and Board level significant events).
The Wholesale Rate Excluding Fuel performance measure reflects TVA's annual non-fuel electric revenues divided by TVA's annual power sales. These targets are based upon TVA's revenue requirements and sales projections with the ultimate goal of keeping customer rates as low as feasible, with a threshold goal of 4.84, a target goal of 4.74, and a stretch goal of 4.65.
The Load Not Served performance measure reflects the percentage of total load not served multiplied by the number of minutes in the period (with the value expressed in system minutes and excluding events during declared major storms) during the three-year cycle ended September 30, 2017, with a threshold goal of 7.9 (99.999 percent reliability), a target goal of 5.5 (75th
percentile), and a stretch goal of 4.0 (90th percentile). Load Not Served events caused by TVA on a distributor system will also count as a TVA event even if TVA’s system remains energized.
The External Measures represent TVA's performance in areas including external nuclear performance indicators, stakeholder survey, media tone, customer loyalty, and Board level significant events. Targets for the External Measures are based on making incremental improvements in external perceptions of TVA's performance and brand. The nuclear performance measure was based on 2017 results, with a threshold goal of 86.4 (bottom quartile), a target goal of 89.4 (between bottom quartile and median), and a stretch goal of 92.4 (between median and top quartile). The media tone, stakeholder survey, customer survey, and Board level significant events measures were calculated using an average of the 2015, 2016, and 2017 results. The media tone measure had a threshold goal of 83, a target goal of 87, and a stretch goal of 88. The stakeholder survey measure had a threshold goal of 81.5, a target goal of 82.3, and a stretch goal of 83.2. The customer survey measure had a threshold goal of 51.3, a target goal of 52.3, and a stretch goal of 53.3. The Board level significant events measure had a threshold goal of two unfavorable events, a target goal of zero events, and a stretch goal of two favorable events.
The following table shows the performance goals and weighting and percent of opportunity achieved for the ELTIP for the three-year cycle ended September 30, 2017:
Note
(1) On August 25, 2016, the TVA Board revised (1) the method for calculating the external nuclear performance indicators measure and (2) the goals related to this measure. The changes were adopted because the external party that rates the performance of TVA’s nuclear fleet revised the industry standard metric for its rating index and provided new guidance on reporting requirements related to the addition of Watts Bar Unit 2 into TVA’s nuclear fleet.
Highlights of the 2015 - 2017 performance period include:
Wholesale rate impacted by the pattern of weather peaks in 2015 and 2016 and lower than plan sales in 2017;
Load not served better than top quartile; and
Favorable external measures (reputation and perception of TVA).
As a result, the NEOs were awarded the following ELTIP payouts for the 2015 - 2017 performance cycle in comparison to the 2015 - 2017 performance cycle target payouts:
|
| | | | | | | | | |
2015 - 2017 Performance Cycle ELTIP Payouts |
| Named Executive Officers | Salary | Target ELTIP Incentive Opportunity | Target ELTIP Payout | Percent of Opportunity Achieved | ELTIP Payout |
| William D. Johnson | $995,000 | 175% | $1,741,250 | | 103% | $1,793,488 |
| John M. Thomas, III | 610,018 |
| 120% | 732,022 |
| | 103% | 753,983 |
|
| Joseph P. Grimes, Jr. | 650,000 |
| 110% | 715,000 |
| | 103% | 736,450 |
|
| Michael D. Skaggs | 495,285 |
| 90% | 445,757 |
| | 103% | 459,130 |
|
| Sherry A. Quirk | 477,405 |
| 120% | 509,238 |
| (1) | 103% | 524,515 |
|
Note
(1) Amount prorated based on the number of months participating in the performance period. Ms. Quirk participated in 32 out of 36 months in the performance period as a result of her hire date.
Awards to the NEOs under the ELTIP for the performance cycle that ended September 30, 2017, are reported in the “Non-Equity Incentive Plan Compensation” column in the Summary Compensation Table.
2016 - 2018 Performance Cycle
The TVA Board approved the following overall measures of TVA performance for all participants in the LTIP for the three-year cycle ending September 30, 2018 (awards to be paid in November 2018):
|
| | | | |
Performance Measure | Weight | Threshold (50%) | Target (100%) | Stretch (150%) |
Wholesale Rate Excluding Fuel(1) | 40% | Target + 2% | 2016 - 2018 average rate based on business plans
| Target - 2% |
Load Not Served(2) | 30% | 99.999% reliability or better | Top quartile | Better than top quartile |
External Measures(3) | 30% | 80.0 | 88.0 | 95.5 |
Notes
(1) The Wholesale Rate Excluding Fuel measure represents TVA's electric sales revenue excluding fuel divided by electric power sales. For the 2016-2018 LTIP performance cycle, the Wholesale Rate Excluding Fuel measure will be calculated using an average of the 2016, 2017, and 2018 results. The target Wholesale Rate Excluding Fuel measure is the average of the rates for 2016, 2017, and 2018 that were set forth in the approved business plans for 2014, 2015, and 2016, respectively.
(2) Load Not Served is equal to the product of (i) the percentage of total load not served and (ii) the number of minutes in the period (excluding events during declared major storms). Value is expressed in system minutes and is the average of the three years within the LTIP performance cycle. Load Not Served events caused by TVA on a distributor system will also count as a TVA event even if TVA’s system remains energized. For the 2016-2018 LTIP performance cycle, the Load Not Served measure will be calculated using an average of the 2016, 2017, and 2018 results.
(3) For the 2016-2018 LTIP performance cycle, the External Measures metric will be calculated using an average of the 2016, 2017, and 2018 results, except for the external performance indicators for the TVA nuclear fleet, which will be based only on 2018 results. On August 25, 2016, the TVA Board revised (1) the method for calculating the external performance indicators for the TVA nuclear fleet measure and (2) the goals related to this measure. The changes were adopted because the external party that rates the performance of TVA’s nuclear fleet revised the industry standard metric for its rating index and provided new guidance on reporting requirements related to the addition of Watts Bar Unit 2 into TVA’s nuclear fleet.
2017 - 2019 Performance Cycle
The TVA Board approved the following overall measures of TVA performance for all participants in the LTIP for the three-year cycle ending September 30, 2019 (awards to be paid in November 2019):
|
| | | | |
Performance Measure | Weight | Threshold (50%) | Target (100%) | Stretch (150%) |
Wholesale Rate Excluding Fuel(1) | 40% | Target + 2% | 2017 - 2019 average rate based on business plans | Target - 2% |
Load Not Served(2) | 30% | 4.8
Between top quartile and top decile | 4.0
2017 - 2019 average rate based on business plans | 3.5
Better than top decile |
External Measures(3) | 30% | 80.6 | 88.4 | 96.1 |
Notes
(1) The Wholesale Rate Excluding Fuel measure represents TVA's electric sales revenue excluding fuel divided by electric power sales. For the 2017-2019 LTIP performance cycle, the Wholesale Rate Excluding Fuel measure will be calculated using an average of the 2017, 2018, and 2019 results. The target Wholesale
Rate Excluding Fuel measure is the average of the rates for 2017, 2018, and 2019 that were set forth in the approved business plans for 2015, 2016, and 2017, respectively.
(2) Load Not Served is equal to the product of (i) the percentage of total load not served and (ii) the number of minutes in the period (excluding events during declared major storms). Value is expressed in system minutes and is the average of the three years within the LTIP performance cycle. Load Not Served events caused by TVA on a distributor system will also count as a TVA event even if TVA’s system remains energized. For the 2017-2019 LTIP performance cycle, the Load Not Served measure will be calculated using an average of the 2017, 2018, and 2019 results. The target Load Not Served measure is the average of the rates for 2017, 2018, and 2019 that were set forth in the approved business plans for 2015, 2016, and 2017, respectively.
(3) For the 2017-2019 LTIP performance cycle, the External Measures metric will be calculated using an average of the 2017, 2018, and 2019 results. On August 25, 2016, the TVA Board revised (1) the method for calculating the external performance indicators for the TVA nuclear fleet measure and (2) the goals related to this measure. The changes were adopted because the external party that rates the performance of TVA’s nuclear fleet revised the industry standard metric for its rating index and provided new guidance on reporting requirements related to the addition of Watts Bar Unit 2 into TVA’s nuclear fleet.
Long-Term Retention Arrangements. As a corporate agency of the United States, TVA does not have equity securities that it can use to provide stock awards, options, or other equity-basedmay offer recruitment awards as compensation for its employees. To help retain leaders, TVA enters into long-term retention arrangements with certain executives, including the NEOs. In recent years, these arrangements were administered under either the LTDCP or the LTRIP. As discussed previously, however, effective October 1, 2015, TVA adopted the LTIP, which provides for retentionwell as relocation assistance and reimbursement. These types of deferred cash incentive awards in addition to performance-based awards and replaces the LTRIP and the LTDCP. The purpose of the LTDCP, the LTRIP, and the retention awards under the LTIP is to provide a retention incentive similar to restricted stock or restricted stock units. The arrangements are intended to encourage executives to remain with TVA and to provide, in combination with salary, EAIP, and long-term incentive compensation (ELTIP incentive awards or LTP grants), a competitive level of total direct compensation. Awards undercompensate the arrangements are designed to constitute approximately 20 to 30 percent of each NEOs total long-term compensation.
LTDCP. Under the LTDCP, credits were made to an account in an executive's name (typically on an annual basis)individuals for a predetermined period. If the executive remained employed at TVA until the end of the period (typically three to five years), the executive became vested in the balance of the account, including any return on investment on the credits in the account, and received a distribution in accordance with a deferral election made at the time the LTDCP agreement was made. The default return on investment on the credits in executives' accounts was interest calculated based on the composite rate of all marketable U.S. Treasury issues and credited daily to the balance reflected in the executives' accounts. Executives could alternatively choose toamounts they may have forfeited from their balances adjusted based on the return on certain mutual funds.
LTRIP. Under the LTRIP, awards were granted to participants, and each award represented the right of a participant to receive a lump sum cash payment. On the grant date, the award set forth a specified date on which the award would become fully vested. The period from the grant date to the vesting date was typically three years, although it might be as short as two years. Each award will be paid in a lump sum as soon as practical after the vesting date, and no interest will accrue on the award during the vesting period. Although the LTIP replaced the LTRIP, awards previously granted under the LTRIP are scheduled to vest through December 31, 2017.
LTIP. The LTIP is designed to provide officers and other participants with time-based incentive opportunities designed to encourage them to remain with TVA over an extended period of time. Retention awards granted under the LTIP have a vesting period covering three years. Awards are generally granted on October 1 and will become one-third vested on each subsequent September 30, provided the participant remains employed through that date. Each award will be paid in a lump sum within two months of vesting.
Following the market assessment conducted by FW Cook, effective October 1, 2016, TVA granted the following retention-based awards under the LTIPprevious employer in order to maintain competitive long-term compensation:
|
| |
Named Executive Officers | LTR/Long-Term Retention Grant (1)
|
Mr. Johnson | $606,950 |
Mr. Thomas | 250,000 |
Mr. Grimes | 260,000 |
Mr. Skaggs | 250,000 |
Ms. Quirk | 225,000 |
Note
(1) All awards vested 1/3 September 30, 2017, and will vest 1/3 September 30, 2018, and 1/3 September 30, 2019,
subjectjoin TVA and/or provide substitute compensation when the individual is not eligible to the participant being employed through each suchreceive certain incentive payments until a future date.
In 2021, Mr. Lyash received the third of three annual installments of a deferred cash recruitment and relocation incentive that was part of his employment offer. The portionthird installment of the LTR grants that vested in 2017 are reported in the "Non-Equity Incentive Plan Compensation" column in the Summary Compensation Table.
Considerations Specific$292,000 was paid to Mr. Johnson. AtLyash in September 2021.
In 2021, Mr. Fountain received the beginningsecond of 2017, the Committee, in consultation with its independent executive compensation consultant, FW Cook, evaluated Mr. Johnson’s overall performance and compensation opportunity relative to TVA’s peer group to determine whether to recommend adjustmentstwo annual installments of a deferred cash relocation incentive that was part of his employment offer. The second installment of $100,000 was paid to Mr. Johnson’sFountain in June 2021. Mr. Fountain also received the second of three annual installments of a deferred cash recruitment incentive that was part of his employment offer. The second installment of $350,000 was paid to Mr. Fountain in June 2021.
In 2021, Mr. Moul received the first of three annual installments of a deferred cash recruitment and relocation incentive that was part of his employment offer. The first installment of $650,000 was paid to Mr. Moul in June 2021.
Retirement Benefits
TVA provides its NEOs with retirement benefits through its qualified plans as well as through a non-qualified supplemental executive retirement plan ("SERP") in order to provide compensation beginning with retirement or termination of employment (if vesting requirements are satisfied), with enhanced compensation for certain executives to the provide an additional incentive for hiring and retention of qualified individuals.
TVA Board for 2017. Aftersponsors a thorough review, including the consideration of CEO median compensation data, the Committee recommended that the TVA Board approve compensation and incentive opportunity changes for Mr. Johnson for 2017. The 2017 compensation
package for Mr. Johnson consisted of the following components: annual salary of $995,000, a target EAIP incentive opportunity of 150 percent of salary, a target ELTIP incentive opportunity of 175 percent of salary, a LTP grant of $2,427,800,qualified defined benefit plan ("pension plan") and a LTR grant of $606,950. The ELTIP target opportunity of 175 percent will apply to the 2015 - 2017 performance cycle. The LTP grant was effective October 1, 2016 and vests September 30, 2019, provided certain performance targetsqualified defined contribution plan ("401(k) plan"), which are achieved and he is still employed on this date. The LTR grant was effective October 1, 2016, and vests in three equal increments on September 30, 2017, 2018 and 2019. The Committee made its recommendation based on the special place and mission of TVA and the belief that the structure of Mr. Johnson's compensation opportunity should have a larger component of “at risk” compensation than any other TVA executive (approximately 72 percent of overall target total direct compensation).
Additionally, on December 12, 2016, the Board approved a performance incentive arrangement ("PIA") under which Mr. Johnson is entitled to receive a cash award of up to $200,000 per year based on the evaluation of his performance commencing in 2017.
The chart below compares (i) the total direct compensation earnedadministered by Mr. Johnson for 2017; (ii) the 2017 compensation opportunity approved by the TVA Board for Mr. Johnson; and (iii) the CEO median compensation data provided to the Committee by FW Cook, based on TVA's peer group as discussed above.
|
| | | | | | | | |
| CEO Peer Group Compensation Comparison |
| Compensation Component | TVA CEO Johnson Actual Compensation for 2017 | | TVA CEO Johnson Target Compensation Opportunity for 2017 | | Willis Towers Watson Chief Executive Officer Median Market Data
(TVA Peer Group)(1) |
| Base Salary | $995,000 | | $995,000 | | $1,221,000 |
| | |
| | | | |
| Total Annual Incentive | 190 | % | (2) | 170 | % | (2) | 115 | % |
| | | | | | |
| Total Cash Compensation ("TCC") | $2,886,003 | | $2,687,500 | | $2,692,000 |
| | | | | | |
| Total Long-Term Incentive Compensation | 220 | % | (3) | 214 | % | (3) | 471 | % |
| | |
| | | | |
| Total Direct Compensation ("TDC") | $5,070,857 | | $4,820,116 | | $8,391,000 |
Notes
(1) Market assessment effective October 2016 and included market composite of Willis Towers Watson database and proxy peer group.
(2) Mr. Johnson's target EAIP award for 2017 was 150 percent of $995,000, and he was eligible for an additional $200,000 under a PIA. TVA's Enterprise Scorecard result was 103 percent, and he had an Individual Performance Multiplier of 110 percent of his award. Additionally, he was awarded the full $200,000 under the PIA.
(3) For the 2015-2017 ELTIP performance cycle, Mr. Johnson's target ELTIP award was 175 percent of $995,000, and his actual award was 103 percent of this amount. Mr. Johnson also had two tranches of LTR grants vest ($189,050 and $202,316) on September 30, 2017, for a total of $391,366.
Retirement Benefits. During 2017, the TVA Retirement System administered three retirement benefit structures for eligible employees:
Original Benefit Structure ("OBS"TVARS") for employees covered under the plan prior to January 1, 1996, with a pension based on a final average pay formula.
Cash Balance Benefit Structure ("CBBS") for employees first hired on or after January 1, 1996, and prior to July 1, 2014, with a pension based on an account that consists of pay credits and interest on such credits. Certain participants no longer receive pay credits, but all participants still receive interest on their pay credits. See the discussion following the Pension Benefits Table for additional information regarding pay credits and interest on pay credits.
Employer Automatic Benefit Structure ("EABS") for employees who were first hired on or after July 1, 2014, or who were rehired on or after July 1, 2014, but who were previously not vested or who previously received their pension benefit in a lump-sum distribution. EABS members are eligible for a defined contribution retirement benefit in the 401(k) plan only and are not eligible to participate in the defined benefit plan.
In addition to these plans, TVA also offered during 2017 a 401(k) plan which provided the following benefits:
For OBS members, TVA provides matching contributions of 25 cents on every dollar up to 1.5 percent of eligible compensation.
For CBBS members, TVA provides matching contributions for all members and automatic, non-elective contributions for certain members. See the discussion following the Pension Benefits Table for additional information regarding these contributions.
For EABS members, TVA provides an automatic, non-elective contribution of 4.5 percent of eligible compensation and matching contributions of 75 cents on every dollar up to 4.5 percent of eligible compensation.
. The availability of, and level of benefits provided by, these qualified plans are comparable to similar qualified plans provided by companies in TVA's peer group.
In addition to its qualified retirement plans, TVA has a Supplemental Executive Retirement Plan ("SERP")SERP for selected executives who are critical to the ongoing success of the enterprise. TVA's SERP is a non-qualified plan similarthat provides supplemental pension benefits at compensation levels that are higher than the limits specified by IRS regulations for qualified pension plans. The provision of such non-qualified plans to those used by most otherexecutives is a common practice among companies in itsTVA's peer group. The purpose of the SERP is to:
•Provide a competitive retirement benefit level that cannot be delivered solely through TVA's qualified retirement plans due to IRS limitations.Internal Revenue Service ("IRS") limitations, and
•Provide a benefit level (as a percentage replacement of pre-retirement pay) that is more comparable to that of employees who are not subject to the IRS limitations.
Because “compensation” as calculated for purposes of the SERP benefit includes EAIP awards earned by the participants, the SERP benefits are somewhat sensitive to TVA's performance achievements. Also, discretionary actions by the TVA Board or the CEO to reduce EAIP payouts could reduce SERP benefits.
More information regarding these retirement and pension plansbenefits is found following the Pension Benefits Table.
Health and Other Benefits. Benefits
TVA offers a group of health and other benefits (medical, dental, vision, life and accidental death and disability insurance, and long-term disability insurance) that are available to a broad group of employees. The NEOs are eligible to participate in TVA's health benefit plans and other non-retirement benefit plans on the same terms and at the same contribution rates as other TVA employees.
2021 Performance Goals and Performance Achievement
| | | | | | | | | | | | | | |
| | Strategic Priorities | | Incentive Compensation Metrics |
A significant portion of each NEO's compensation is based on company performance and influenced by individual performance achievements. As a result, a majority of NEO compensation is at-risk, providing incentive for the executive to achieve superior performance for TVA and for the businesses, communities, and residents it serves, both in the short term and in the years to come. Incentive compensation is provided to NEOs under the EAIP and LTIP. Each incentive award is described below. | | People
Advantage Amplifying the energy, passion and creativity within each TVA employee | | Safety- Serious Injury Incident Rate |
| Operational Excellence Building on TVA's best-in-class reputation for reliable service and competitively priced power | | External Performance Indicators for the TVA Nuclear Fleet Nuclear Unit Capability Factor Combined Cycle Equivalent Availability Factor Coal Equivalent Availability Factor Load Not Served |
| Financial Strength Investing in the future, while keeping energy costs as low as possible | | Total Financing Obligations Cash Flow from Operating Activities Total Spend Net Income Non-Fuel Delivered Cost of Power |
| Powerful Partnerships Promoting progress through the shared success of TVA's customers and stakeholders | | Jobs Created and Retained Stakeholder Survey Customer Survey Media Tone (awards granted before 2021) |
| Igniting Innovation Pursuing innovative solutions for TVA and its customers and communities | | |
Executive Annual Incentive Plan
All TVA employees participate in an annual incentive program (subject to eligibility requirements), since every employee contributes to the success of TVA and the execution of its Public Power mission. While the metrics used for annual incentives are the same for all employees, they are provided under two plans: the WPTIP provides for annual incentive awards for eligible non-executives, and the EAIP provides for annual incentive awards for eligible executives, including the NEOs. The EAIP is designed to encourage and reward executives for successfully achieving annual financial and operational goals. For 2021, each NEO's annual incentive payment was calculated as follows:
| | | | | | | | | | | | | | | | | | | | | | | | | | | | | | | | |
EAIP
Amount | = | Annual
Salary | × | Annual Target
Incentive
Opportunity | × | Percent of
Scorecard
Opportunity
Achieved
(0% to 150%) | × | Corporate
Multiplier
(0 to 1.00) | × | Individual
Performance
Multiplier
(0% to 150%) |
Each component of this calculation is discussed below (except for annual salary, which is discussed above). The award for certain participants in the WPTIP and the EAIP may be adjusted by the participant's supervisor based on an evaluation of the participant's individual achievements and performance during the year. In addition, pursuant to discretion granted under the TVA Compensation Plan, awards may be further adjusted by the TVA Board or the CEO (1) as a result of any unusual or nonrecurring event affecting TVA or the financial statements of TVA or (2) as a result of changes in business conditions or the business strategy of TVA.
Annual Target Incentive Opportunity
The TVA Board evaluated the appropriateness of the EAIP award opportunities for the CEO and made no changes for 2021. Similarly, the CEO evaluated the appropriateness of the EAIP award opportunities for the other NEOs (except for Mr. Fountain and Mr. Moul, who were not NEOs at the end of 2020), and made no changes for 2021. Accordingly, target EAIP award opportunities of the NEOs for 2021 were as follows:
| | | | | |
| Named Executive Officers | 2021 Target Annual Incentive Opportunity(1) |
| Mr. Lyash | 150 | % |
| Mr. Thomas | 80 | % |
| Mr. Rausch | 70 | % |
| Mr. Fountain | 70 | % |
| Mr. Moul | 70 | % |
| Mr. Skaggs | 80 | % |
Note
(1)Represents a percent of each NEO's annual salary.
2021 Incentive Plan Performance Metrics
The metrics used to measure performance under the WPTIP and EAIP are the same for all TVA employees. These metrics tie directly to key enterprise metrics used by senior management in its annual budget and strategic planning process, which in turn tie directly to the achievement of TVA's strategic objectives and mission. The 2021 WPTIP and EAIP metrics and goals were set out in an organizational scorecard ("TVA Enterprise Scorecard") applicable to all employees. The 2021 performance measures, along with the weighting ascribed to each, are shown below as a percentage of the total WPTIP/EAIP award opportunity at target-level performance.
| | | | | | | | | | | | | | | | | |
| | | | | |
2021 WPTIP/EAIP METRICS | | | The 2021 WPTIP/EAIP metrics are described in detail below. |
| | | TVA Total Spend What this measures: TVA's ability to keep costs low Total Non-Fuel Operating and Maintenance, Capital, Non-Fuel Inventory, and Cloud Implementation expenses for corporate and operational Strategic Business Unit organizations (excludes Board of Directors). | Why Is This Metric Used? Supports the overall TVA goal of maintaining costs and managing rates based on spending levels approved by TVA management and the TVA Board. |
| | | | |
| | | | |
| | | Load Not Served What this measures: Transmission system outages that affect TVA customers Load Not Served ("LNS") is a measure of the magnitude and duration of transmission system outages that affect TVA customers expressed in System Minutes. An automatic customer interruption with a duration of one minute or greater is tracked as a LNS event. LNS events caused by TVA on a distributor system will also count as a TVA event even if the TVA system remains energized. LNS excludes interruptions due to declared major events, variances, gunfire, vandalism, and verified tornadoes. | Why Is This Metric Used? TVA manages this critical indicator to reduce the impact of customer outages. |
| | | | |
| | | | |
| | | Annualized Nuclear Unit Capability Factor What this measures: Nuclear plant availability Annualized Nuclear Unit Capability Factor is the ratio of available energy generation, which excludes events outside of management control, over a given period of time to the reference energy generation over the same time period. | Why Is This Metric Used? Monitors progress in attaining high unit and energy production reliability. |
| | | | |
| | | | |
| | | Combined Cycle Equivalent Availability Factor What this measures: Combined cycle plant reliability Combined Cycle Equivalent Availability Factor ("EAF") reflects the percentage of time over a given period that a generating unit was available to generate power for TVA combined cycle generating assets, based on Generating Availability Data System ("GADS") event reporting guidelines for megawatt hour losses. Combined Cycle EAF excludes events classified as outside management control and variances. | Why Is This Metric Used? Combined Cycle EAF focuses on ensuring TVA combined cycle generating assets are available and reliable to meet system demand. |
| | | | |
| | | | |
| | | Coal Equivalent Availability Factor What this measures: Coal plant reliability Coal EAF reflects the percentage of time over a given period that a generating unit was available to generate power for TVA coal-fired generating assets, based on GADS event reporting guidelines for megawatt hour losses. Coal EAF excludes events classified as outside management control and variances. | Why Is This Metric Used? Coal EAF focuses on ensuring TVA coal generating assets are available and reliable to meet system demand. |
| | | | | |
| | | | | |
In setting the goal for each metric, consideration is given to TVA's historic performance, its strategic business plan priorities and strategic benchmarking goals, customer and stakeholder feedback, environmental and regulatory concerns and goals, and the competitive environment. Achievement of the target goal would result in a 100 percent payout with respect to that goal. A threshold goal is also set for each metric, so that no payout would occur with respect to metrics that fail to achieve that threshold. Additionally, a stretch goal for each metric is set to incentivize and reward exceptional performance. Linear interpolation is used for results between threshold and stretch goals.
2021 Executive Annual Incentive Plan Results
The performance results on the 2021 TVA Enterprise Scorecard are set forth below. Performance resulted in a 142 percent payout (on a scale from 0 percent – 150 percent payout).
TVA'S 2021 ENTERPRISE SCORECARD PERFORMANCE
Note
(1)On April 30, 2021, the CEO approved a revision to the performance goals for the Annualized Nuclear Unit Capability Factor measure. The revision is described above in Notable 2021 Actions – Changes to Performance Goals to Account for External Factors and Impacts Beyond Management Control – Performance Goals – 2021 Annual Incentive Award.
Corporate Multiplier Allows TVA Board to Adjust for Overall Performance
| | | | | | | | | | | | | | |
As in previous years, the TVA Board approved the use of a corporate multiplier for the 2021 WPTIP/EAIP program. The corporate multiplier ranges between 0 and 1.0 and can be used only for purposes of reducing the amount of the award. The multiplier was based on performance in 2021 against goals set in November 2020 for six organizational metrics. For 2021, the TVA Board determined that the corporate multiplier should be 1.0 based on the following: •Continued strong safety performance – top quartile in SIIR •Strong financial health and performance •Efforts continued to attract and encourage the expansion of business and industries in 2021 •Over $8.8 billion in investments, and •Approximately 80,900 jobs created or retained •Achieved outstanding results despite the challenges associated with the continued COVID-19 | | | | |
| | Why does the TVA Board use a multiplier? | |
| | | |
| | The multiplier allows the TVA Board to qualitatively assess the organization's performance, emphasizing the importance of safety, financial health, reputation, and economic development. | |
|
|
|
Corporate Multiplier Factors
| | | | | | | | | | | |
| Metric | Definition | Why Is This Metric Used? |
Safety – Serious
Injury Incident Rate
(SIIR) | A mathematical calculation used by Edison Electric Institute that quantifies the extent of injury for serious injuries and fatalities from events within the control of the employee and/or the employer. | TVA shares a professional and personal commitment to protect the safety of its employees, its contractors, its customers, and those in communities that TVA serves. |
| Total Financing Obligations (TFO) and Liabilities | All statutory debt and other financing obligations. TFO and Liabilities is calculated by subtracting contributions to unfunded liabilities from the sum of (1) long-term debt, net (including unamortized premiums/discounts), (2) short-term debt, net, (3) leaseback obligations, (4) energy prepayment obligations, and (5) variable interest entities. | TVA's TFOs are driven by its business plan and reflect the application of financial guiding principles. Focusing on this measure will improve TVA's fiscal performance and strengthen TVA's balance sheet. |
| Cash Flow from Operating Activities | Amount of cash generated from power production and other mission-related activities and generally defined as operating revenues received less cash payments made for operating expenses. See Item 8, Financial Statements and Supplementary Data – Consolidated Statements of Cash Flows for additional information. | Cash Flow from Operating Activities is considered a key indicator of overall financial health as it measures TVA's ability to use cash received from customers to sufficiently fund outgoing cash expenditures. |
| Net Income | Consists of the organization’s net earnings derived by adjusting revenues for the cost of doing business, including the cost of sales, depreciation, interest, taxes, and other expenses. See Item 8, Financial Statements and Supplementary Data – Consolidated Statements of Operations for additional information. | Standard accounting measure that provides a view of TVA's financial performance position. |
| Jobs Created and Retained | Measures the number of new or retained jobs in the Tennessee Valley for which TVA has played a role in the recruitment or retention of the economic development project. | Tracks its progress using an industry standard measure. Jobs Created and Retained is a measure that economic developers can speak to and easily understand, and an established tracking mechanism is in place to measure TVA's economic development efforts. |
| Board Level Significant Events | Includes items deemed significant by the TVA Board of Directors. These items may affect TVA's reputation with its customers and its stakeholders, the organizational health of the workforce, or its impact on the public at large. Both favorable and unfavorable events will be considered. | An incentive pay program, by design, cannot cover the entire scope of activities that could occur during a given cycle. This measure allows the TVA Board to deem certain reputational, environmental, or other items as significant impacts to TVA's business. Items that may be considered significant (either favorably or unfavorably) include customer survey results, stakeholder survey results, key indicators of organizational health, environmental events, or other major events not covered in other performance measures. |
The TVA Board and the CEO jointly qualitatively assessed TVA’s performance at the end of the 2021 performance period. Based on the performance of the 2021 corporate multiplier measures, the TVA Board determined to apply a 1.0 multiplier, or no reduction to the calculated WPTIP/EAIP payout.
CORPORATE MULTIPLIER MEASURES (0.0 – 1.0 MULTIPLIER)
Note
(1)Includes impact of partnership credits. Partnership credits are wholesale bill credits provided to local power company customers who are party to 20-year Partnership Agreements with TVA. For more information, see Item 1, Business — Rates.
Individual Performance Multiplier Reinforces Pay for Performance
Annually, individual goals for the NEOs are established at the beginning of each performance cycle. These goals tie to the achievement of TVA's mission and strategic objectives. A 50 percent weighting is assigned to business goals, and a 50 percent weighting is assigned to leadership competencies. No numerical measures are assigned to the goals. Rather, at the end of the performance period, the CEO assesses the performance of the other NEOs and informs the Committee of his decision on a multiplier for each NEO. For the CEO Individual Performance Multiplier, each TVA Board member assesses the CEO's performance at the end of a performance period on a scale of 1–5, with "5" representing superior performance. Results of the assessment are provided to the TVA Board Chair who, after consultation with the Committee, determines the multiplier to be applied to the CEO. For each NEO, the individual performance multiplier can range between 0% to 150% of the calculated payout and can be used to reduce (multiplier below 100%) or increase (multiplier above 100%) the amount of the award.
For 2021, the NEOs were evaluated on individual performance goals and the following leadership competencies:
Leadership Competencies
| | | | | | | | | | | | | | |
| Inspiring Trust and Engagement | Continuous Improvement | Vision, Innovation, & Strategic Execution | Leadership Courage | Building Organizational Talent |
| Accountability and Driving Results | Adaptability | Business Acumen | Effective Communication | Leveraging Diversity |
The 2021 individual multipliers and award payouts to the NEOs under the 2021 EAIP are described under each executive's compensation scorecard under 2021 Pay Decisions - 2021 NEO Pay Decisions and Compensation Scorecards below. Award payouts are also reported in the "Non-Equity Incentive Plan Compensation" column in the Executive Compensation Tables and Narrative Disclosures - Summary Compensation Table.
Long-Term Incentive Plan Compensation
Certain executives in critical positions, including the NEOs, participate in the company's long-term incentive plan. These individuals make decisions that significantly influence the development and execution of TVA's long-term strategic objectives. As such, awards under TVA's LTIP are designed to reward executives for sustainable success. Since long-term success is supported by a commitment to continued employment, the NEOs are incentivized to remain with the company through the cliff vesting feature of the long-term performance awards and through long-term retention awards.
| | | | | | | | | | | |
| | | |
| LONG-TERM AWARDS REWARD LONG-TERM SUCCESS | | | LONG-TERM INCENTIVE AWARDS |
| | | |
•Enterprise-wide performance criteria that are directly aligned with TVA's mission •"Cumulative" performance approach to measure performance achieved over a three-year period with a new three-year performance cycle beginning each year •Potential payment range of 0 percent to 150 percent of target incentive opportunity to enable awards that are commensurate with performance achievements •Award opportunities established for each performance cycle at or below median levels of competitiveness with TVA's peer group •LTP awards vest upon the completion of the three-year performance period, contingent upon continued employment through vesting date and subject to achievement of performance goals •LTR awards vest in one-third increments over three years, contingent upon continued employment on each vesting date | | | |
The TVA Board and Mr. Lyash evaluated the appropriateness of the long-term incentive award opportunities for the CEO and other NEOs, respectively. For 2021, the value of both the long-term performance award (at target) and the long-term retention awards were increased from 2020 levels, for Mr. Lyash, Mr. Thomas, and Mr. Skaggs, so that TDC moved closer to market median, following a review of benchmarking and individual performance and reflective of increased tenure. Accordingly, target long-term incentive award opportunities of the NEOs for 2021 were as follows:
| | | | | | | | | | | | | | | | | | | | | | | | | | |
Named Executive
Officers | 2021–2023
LTP(1) | Value at target(2) | % Increase from
2020–2022 LTP
target value | 2021 LTR(1) | Value(2) | % Increase from
2020 LTR award
value |
| Mr. Lyash | 264.9 | % | $ | 2,914,100 | | 24.5 | % | 113.5 | % | $ | 1,248,900 | | 23.2 | % |
Mr. Thomas(3) | 135.8 | % | $ | 1,039,000 | | 6.0 | % | 57.6 | % | $ | 441,000 | | 5.0 | % |
| Mr. Rausch | 90.6 | % | $ | 500,000 | | — | % | 59.8 | % | $ | 330,000 | | — | % |
Mr. Fountain(4) | 104.2 | % | $ | 562,500 | | 50.0 | % | 58.6 | % | $ | 316,500 | | N/A |
Mr. Moul(5) | 77.0 | % | $ | 588,750 | | — | % | 77.0 | % | $ | 588,750 | | — | % |
| Mr. Skaggs | 170.3 | % | $ | 1,175,000 | | 18.7 | % | 73.1 | % | $ | 504,000 | | 17.5 | % |
Notes
(1)Represents a percent of each NEO's salary.
(2)Amount may be prorated based on time in role.
(3)Effective June 7, 2021, in connection with job title change and additional scope and responsibilities, Mr. Thomas was awarded a prorated grant of $1,039,000, which replaced the 2021-2023 LTP grant of $1,000,000 made on October 1, 2020, and a prorated LTR grant of $441,000, which replaced the 2021-2023 LTR grant of $432,000 made on October 1, 2020.
(4)Effective March 5, 2021, in connection with selection to his position, Mr. Fountain was awarded a prorated grant of $562,500, which replaced the 2021-2023 LTP grant of $375,000 made on October 1, 2020, and a prorated LTR grant of $316,500, which replaced the 2021-2023 LTR grant of $249,000 made on October 1, 2020.Mr. Fountain joined TVA in 2020 and was not eligible for a LTR award in 2020.
(5)Effective June 21, 2021, in connection with his employment with TVA, Mr. Moul was awarded three prorated LTP grants:$588,750 for the 2021-2023 LTP cycle, $327,083 for the 2020-2022 LTP cycle, and $65,417 for the 2019-2021 LTP cycle; and three prorated LTR grants:$588,750 for 2021-2023, $218,056 for 2020-2022, and $21,806 for 2019-2021.All of these grants were based on a target grant amount of $785,000 and prorated based on time in role during each performance cycle.
Long-Term Performance Awards
TVA's executive compensation program provides for an annual grant of a LTP award with a three-year performance period. During 2021, there were three overlapping LTP awards:
| | | | | | | | |
| 2019–2021 LTP Award | Vested September 30, 2021 |
| 2020–2022 LTP Award | Vesting September 30, 2022 |
| 2021–2023 LTP Award | Vesting September 30, 2023 |
The performance metrics and threshold, target, and stretch goals for each metric are determined annually by the TVA Board. Following the TVA Board's approval of performance achievement at the end of each three-year performance period, awards are paid out in cash early in the subsequent fiscal year. Target performance provides for a 100 percent payout opportunity, performance below threshold provides for no payout, performance at threshold provides for a 50 percent payout opportunity, and performance at stretch provides for a 150 percent payout opportunity. Linear interpolation is used for results between threshold and stretch goals. The TVA Board can use its discretion to adjust the final payout for LTP awards based on achievements, peer group comparisons, and performance over the performance cycle.
| | | | | | | | | | | | | | |
LTP
Incentive
Amount | = | Target
Value | × | Percent of Opportunity Achieved
(0% to 150%) |
For the three-year performance period ended September 30, 2021, the TVA Board previously approved three overall long-term incentive measures of TVA performance to be applied to all participants in the LTP. The 2019–2021 performance measures, along with the weighting ascribed to each, are shown below as a percentage of the total LTP award opportunity at target-level performance.
| | | | | | | | | | | | | | | | | |
| | | | | |
2019-2021 LTP PERFORMANCE METRICS | | | The 2019–2021 LTP metrics are described in detail below. |
| | | Non-Fuel Delivered Cost of Power What this measures: Non-fuel expenses (cents/kWh) The Non-Fuel Delivered Cost of Power performance measure is a financial measure. The Non-Fuel Delivered Cost of Power measure is equal to the sum of (i) non-fuel operating and maintenance ("O&M") expense, (ii) base capital expense, (iii) interest expense, and (iv) other expense divided by budgeted electric power sales. | Why Is This Metric Used? This measure drives performance through activities that management can control. It aligns with TVA's strategic objective of maintaining low rates and focuses on aligning TVA’s non-fuel costs associated with generation, transmission, statutory mission services, and additional customer services with revenue. Non-Fuel Delivered Cost of Power supports retail rate objectives and aligns to the Business Plan commitment. |
| | | | |
| | | | |
| | | Load Not Served What this measures: Transmission system outages that affect TVA customers Load Not Served ("LNS") is a measure of the magnitude and duration of transmission system outages that affect TVA customers expressed in system minutes. An automatic customer interruption with a duration of one minute or greater is tracked as an LNS event. LNS events caused by TVA on a distributor system will also count as a TVA event even if the TVA system remains energized. LNS excludes interruptions due to declared major events, variances, gunfire, vandalism, and verified tornadoes. | Why Is This Metric Used? An automatic customer interruption with a duration of one minute or greater is tracked as an LNS event. TVA manages this critical indicator to reduce the impact of customer outages. |
| | | | |
| | | | |
| | | External Measures What this measures: External perception and reputational events External Performance Indicators for the TVA Nuclear Fleet – Weighted combination of key nuclear performance indicators based on standard nuclear industry definitions for station performance. Media Tone – Measures the percent of positive and balanced media coverage out of total TVA news coverage. Stakeholder Survey – Conducted among the general public, public officials, economic development leaders, and business/community leaders in the TVA service area to assess public opinion of TVA. Customer Survey – Annual survey of LPCs and Direct-Serve Customers focused on better understanding customer loyalty and related performance drivers. Board Level Significant Events – Items (both favorable and unfavorable) that the Board deems significant and that affect TVA's reputation, organizational health, or the public at large | Why Is This Metric Used? Targets for these measures represent incremental improvement in external perceptions of TVA's performance and brand. |
| | | | |
Consistent with its public power mission, TVA's long-term performance metrics include the results of surveys that assess the external reputation and perception of TVA and TVA's effectiveness in carrying out its mission and strategic objectives. These metrics reflect TVA's focus on meeting or exceeding customer expectations and identifying areas for continuous improvement.
In setting the goal for each metric, the TVA Board considers budgeted amounts in the company's approved business plans, actual performance in recent years, and level of achievability. The TVA Board also considers TVA's strategic business plan priorities and strategic benchmarking goals, customer and stakeholder feedback, environmental and regulatory concerns and goals, and the competitive environment. Achievement of the target goal would result in a 100 percent payout opportunity with respect to that goal. A threshold goal is also set for each metric, so that no payout would occur with respect to metrics that fail to achieve that threshold. Additionally, a stretch goal for each metric is set to incentivize and reward exceptional performance. Linear interpolation is used for results between threshold and stretch goals.
2019–2021 LTP Award Performance Results
The performance results on the 2021 TVA Enterprise Scorecard are set forth below. Performance resulted in a payout of 132 percent of target opportunity.
2019–2021 Long-Term Performance Scorecard
Notes
(1)For the 2019–2021 performance cycle, the Non-Fuel Delivered Cost of Power measure was calculated using an average of the 2019, 2020, and 2021 results.
(2)For the 2019–2021 performance cycle, the Load Not Served measure was calculated using an average of the 2019, 2020, and 2021 results.
(3)For the 2019–2021 performance cycle, the External Measures metrics were calculated using an average of the 2019, 2020, and 2021 results (except for the External Performance Indicators for the TVA Nuclear Fleet measure, which was based on 2021 results).
(4)For the 2019-2021 performance cycle, the External Performance Indicators for the Nuclear Fleet measure was calculated using 2021 results. On April 29, 2021, the Board approved a revision to the External Performance Indicators for the Nuclear Fleet measure. The revision is described above in Notable 2021 Actions – Changes to Performance Goals to Account for External Factors and Impacts Beyond Management Control –Performance Goals – 2019-2021 LTP Awards.
In reviewing the 2019–2021 performance period, the TVA Board considered strong performance in several areas, including key areas where performance exceeded target expectations:
ü Achieved record-setting safety rates in 2020 and 2021
•Top decile performance for TVA’s Recordable Injury Rate in 2021
•Top quartile performance for TVA’s Serious Injury Rate in 2021
ü Strong transmission system reliability performance – 2020 and 2021 were the two best years on record
ü Strong financial performance
•In 2020, TVA achieved and surpassed its strategic goal of reducing debt to $21.8 billion by 2023, and made even further reductions in debt in 2021
•TFOs of $20.5 billion are the lowest in over 30 years
•Lower interest expense in 2021 compared to 2020 mainly due to lower debt levels
•Issued Green Bond offering, with lowest interest rate on a 10-year financing in TVA history
ü Strengthened customer relationships:
•95% of 153 LPCs have signed with TVA under 20-year Partnership Agreement
•Made $1 billion of credit available to LPCs and offered regulatory relief and flexibility so LPCs could help their communities
•Continued Back-to-Business Credit Program established in 2020
•Continued to partner with LPCs through the Community Care Fund established in 2020
•Strong Media Tone results in 2021 show significant improvement over 2020 performance
•Three-year Stakeholder Survey results approached level considered “outstanding” by survey provider; strong 2021 results show improvement over performance period
•Customer Survey reflects high commitment levels and improved scores from 2020 to 2021
ü Continued efforts in 2019-2021 to attract and encourage the expansion of business and industries, resulting in $26.4 billion in investments and approximately 215,000 jobs created or retained
ü Launched enterprise IwD Council
The TVA Board determined that the calculated payout appropriately reflected executive performance in executing on TVA's long-term priorities and did not exercise its discretion to adjust the calculated payout. Payouts to the NEOs for the 2019–2021 LTP Award are described under each executive's compensation scorecard under 2021 Pay Decisions – 2021 NEO Pay Decisions and Compensation Scorecards below and reported in the Executive Compensation Tables and Narrative Disclosures -Summary Compensation Table under "Non-Equity Incentive Plan Compensation."
2020–2022 Outstanding LTP Performance Cycle
The TVA Board previously approved the following overall LTP measures of TVA performance for all participants for the three-year cycle ending September 30, 2022 (awards to be paid in November 2022):
Notes
(1)Metric has same definition as for the 2019-2021 LTP awards. For the 2020-2022 performance cycle, the Non-Fuel Delivered Cost of Power measure will be calculated using an average of the results for each of 2020, 2021, and 2022.
(2)Metric has same definition as for the 2019-2021 LTP awards. For the 2020-2022 performance cycle, the Load Not Served measure will be calculated using an average of the results for each of 2020, 2021, and 2022.
(3)Metric has same definition as for the 2019-2021 LTP awards. For the 2020-2022 performance cycle, the External Performance Indicators for the TVA Nuclear Fleet measure will be calculated based on 2022 results.
(4)For the 2020-2022 performance cycle, the External Performance Indicators for the Nuclear Fleet measure will be calculated using 2022 results. On August 18, 2021, the Board approved a revision to the External Performance Indicators for the Nuclear Fleet measure. The
revision is described above in Notable 2021 Actions – Changes to Performance Goals to Account for External Factors and Impacts Beyond Management Control – Performance Goals – 2020-2022 LTP and 2021-2023 LTP Awards.
(5)Comprised of Media Tone, Stakeholder Survey and Customer Survey, which have the same definitions as for the 2019-2021 LTP awards. Board Level Significant Events was removed as a metric. For the 2020-2022 performance cycle, the External Measures metrics will be calculated using an average of results for each of 2020, 2021, and 2022.
2021–2023 Outstanding LTP Performance Cycle
In November 2020, the TVA Board approved the following overall LTP measures of TVA performance for all participants for the three-year cycle ending September 30, 2023 (awards to be paid in November 2023):
Notes
(1)Non-Fuel Delivered Cost of Power = (Operating and Maintenance Expense + Base Capital Expense + Interest Expense + Other Expense) / Budgeted Electric Power Sales. For the 2021-2023 performance cycle, the Non-Fuel Delivered Cost of Power measure will be calculated using an average of the 2021, 2022, and 2023 results.
(2)Load Not Served = (Percentage of Total Load Not Served) x (Number of Minutes in the Period). The Load Not Served measure excludes events during declared major events, variances, gunfire, vandalism, and verified tornadoes and includes distributor provided load not served estimates for distributor connection point interruptions caused by TVA. For the 2021-2023 performance cycle, the Load Not Served measure will be calculated using an average of the 2021, 2022, and 2023 results.
(3)The External Performance Indicators for TVA Nuclear Fleet measure is calculated using a weighted combination of key performance indicators based on standard nuclear industry definitions for station performance, with the maximum obtainable being 100 points.
(4)For the 2021-2023 performance cycle, the External Performance Indicators for the Nuclear Fleet measure will be calculated using 2023 results. On August 18, 2021, the Board approved a revision to the External Performance Indicators for the Nuclear Fleet measure. The revision is described above in Notable 2021 Actions – Changes to Performance Goals to Account for External Factors and Impacts Beyond Management Control – Performance Goals – 2020-2022 LTP and 2021-2023 LTP Awards.
(5)For the 2021-2023 performance cycle, the Stakeholder Survey metric will be the average score of a survey conducted among the general public, public officials, economic development leaders, and business and community leaders in the TVA service area to assess public opinion of TVA. This measure will be calculated using an average of the 2021, 2022, and 2023 results.
(6)For the 2021-2023 performance cycle, the Customer Survey metric will be a composite score of customer survey results based on responses to key survey questions related to the impact of customer experience on loyalty to TVA. This measure will be calculated using an average of the 2021, 2022, and 2023 results.
External Performance Indicators for the TVA Nuclear Fleet, Customer Survey, and Stakeholder Survey remain measures but are no longer components of External Measures, which has been removed as a composite metric. Additionally, Media Tone has been removed as a metric, and the weighting for Non-Fuel Delivered Cost of Power has been increased to 45%.
Long-Term Retention Awards
As a corporate agency of the U.S., TVA does not have equity securities that it can use to provide stock awards, options, or other equity-based awards as compensation for its employees. The purpose of the retention awards under the LTIP is to provide a retention incentive similar to restricted stock or restricted stock units. These grants are intended to encourage executives to remain with TVA and to provide, in combination with salary, EAIP, and LTP grants, a competitive level of TDC. Grants are generally effective as of October 1 and will become one-third vested on each subsequent September 30 or upon death, disability, or retirement if earlier on a pro-rated basis. Each award will be paid in a lump sum within two months of vesting.
2021 Long-Term Retention Award Grant
Following the market assessment conducted by FW Cook, effective October 1, 2020, TVA granted LTR awards to the NEOs. These awards vest in three equal tranches on September 30, 2021, September 30, 2022, and September 30, 2023, contingent upon continued employment on each vesting date. The amounts of these awards are set forth under "Long-Term Incentive Compensation" above.
2021 Vesting of Outstanding Retention Awards
LTR awards that vested in 2021 are described under 2021 Pay Decisions - 2021 NEO Pay Decisions and Compensation Scorecards below and are reported in the Executive Compensation Tables and Narrative Disclosures - Summary Compensation Table under "Non-Equity Incentive Plan Compensation." The vesting schedule for the three LTR awards outstanding in 2021 is set forth below.
2021 VESTING OF OUTSTANDING RETENTION AWARDS
Notes
(1)Mr. Lyash did not receive a 2019 LTR grant.
(2)Mr. Fountain did not receive a 2020 LTR grant
2021 Pay Decisions
2021 CEO Pay Decisions Overview
CEO PAY EARNED IN 2021
| | | | | | | | | | | | | | |
| Base Salary | $ | 1,100,000 | | | |
Annual Performance Incentive under
Executive Annual Incentive Plan | $ | 2,928,750 | | | 142 percent of target enterprise performance achieved Reflects Individual Performance Multiplier of 125 percent |
| Long-Term Performance Incentive | $ | 2,671,680 | | | 132 percent of long-term performance achieved for the three-year performance cycle ended September 30, 2021 |
| Long-Term Retention Incentive | $ | 754,300 | | 2021 tranche of 2020 LTR and 2021 LTR awards |
Each year, the Committee makes two key compensation decisions with respect to CEO compensation: the amount of TDC opportunity (which is forward-looking and incentivizes the CEO to perform), and the amount of TDC earned (which rewards the CEO for his prior performance).
2021 CEO Total Direct Compensation Opportunity
On February 11, 2021, the TVA Board approved compensation adjustments for Mr. Lyash for 2021, increasing each component of Mr. Lyash's TDC over 2020 levels. The adjustments were made following FW Cook’s independent study and market analysis of CEO compensation, Mr. Lyash's increased tenure with TVA, his 2020 performance, and an intent to narrow the gap to the 50th percentile of CEO market compensation while being mindful of TVA’s federal agency status. The target TDC opportunity granted to Mr. Lyash in 2021 is illustrated below.
CEO 2021 TARGET TOTAL DIRECT COMPENSATION OPPORTUNITY
2021 CEO TARGET TOTAL DIRECT COMPENSATION OPPORTUNITY BELOW MARKET(1)
Note
(1)Target market assessment effective October 2020 and included market composite of WTW database and proxy peer group.
2021 CEO Total Direct Compensation Earned
The TDC that Mr. Lyash earned for 2021 reflected company and individual performance that exceeded targets.
CEO 2021 TOTAL DIRECT COMPENSATION EARNED
Note
(1)Since Mr. Lyash joined TVA during 2019, payout under the 2019-2021 LTP award was prorated two-thirds to reflect his service during two of the three performance years.
The annual incentive award that Mr. Lyash received reflected an Individual Performance Multiplier of 125 percent. The Committee and TVA Board were extremely pleased with Mr. Lyash's performance for 2021. See 2021 Pay Decisions - 2021 NEO Pay Decisions and Compensation Scorecards below for more information.
In addition to TDC Earned (as shown in the table above), Mr. Lyash was paid $292,000 in 2021 as the third and final tranche of a recruitment and relocation incentive under his employment offer letter. This incentive was intended to compensate him for amounts he forfeited from his previous employer in order to join TVA, as well as to provide some measure of substitute compensation in light of his not being eligible to receive any LTP incentive payments until September 2021.
Why Total Compensation Earned Differs From Compensation Reported
2021 CEO TOTAL COMPENSATION COMPONENTS
•Amounts are estimates of the pension/SERP benefits earned for service during the prior year, determined using assumptions consistent with those used in the financial statements in this Annual Report, set forth in Note 22 - Benefit Plans.
Unlike the amounts reported in the Summary Compensation Table, Mr. Lyash's TDC Earned represents the annual pay decisions by the Committee that specifically reflect its assessment of the company's performance and individual performance and reward the employee for satisfaction of incentive award conditions (enterprise performance and continued employment). Other elements included in the Summary Compensation Table, such as changes in pension values and vesting of recruitment and relocation incentives, are excluded from TDC Earned because they do not relate to performance and are outside the scope of the Committee's annual pay decisions. The Committee therefore believes that TDC Earned renders a more accurate and up-to-date reflection of its assessment of performance.
CEO Pay Ratio Disclosure
As required by Section 953(b) of the Dodd-Frank Wall Street Reform and Consumer Protection Act of 2010 and Item 402(u) of Regulation S-K, TVA is providing the following information regarding the annual total compensation of TVA's CEO position and the annual total compensation of the median employee of the company:
•The total compensation for the CEO position for 2021 was $9,882,680.
•For 2021, the median employee's annual total compensation was $139,953.
Based on this information, the pay ratio of the total compensation for the CEO position to the median employee was approximately 71 to 1.
To identify the median employee and to determine the annual total compensation of the median employee, TVA took the following steps:
•TVA selected September 30, 2021, as the date on which to identify its median employee. On September 30, 2021, TVA's employee population (including full-time, part-time, and temporary employees) consisted of 10,129 individuals located in the U.S.
•In order to identify the median employee from its employee population, TVA compared the compensation that would be included in Box 5 (Medicare Wages and Tips) of Form W-2, which includes salary, overtime, and incentive compensation, for the period from October 1, 2020 to September 30, 2021. Box 5 compensation was used as it is representative of the compensation received by all employees and is readily available and objective.
•After identifying its median employee, TVA calculated that employee's compensation for 2021 as though that compensation was being calculated for purposes of the Summary Compensation Table, resulting in annual total compensation of $139,953.
The above pay ratio is a reasonable estimate calculated in a manner consistent with Item 402(u) of Regulation S-K. Because Item 402(u) provides companies with flexibility to select the methodology and assumptions used to identify the median employee and to calculate the pay ratio, the pay ratio reported by TVA may not be comparable to the pay ratios reported by other companies.
2021 CEO Pay Ratio Below Median Among Peers
As reflected above, TVA's CEO target TDC is low compared to its 2021 compensation peer group on an absolute basis but is also low compared to its peers in the context of organizational pay ratios. As discussed fully under "CEO Pay Ratio Disclosure", the pay ratio of the total compensation for Mr. Lyash to the median TVA employee was approximately 71 to 1 for 2021. Based on TVA's 2021 pay ratio and the pay ratio disclosed in its peers' most recent public disclosures, TVA's pay ratio is below the 50th percentile. Peers used are those shown under Proxy Peer Group of Investor-Owned Utilities in the List of Compensation Peer Companies.
2021 CEO PAY RATIO VS. PEERS
2021 NEO Pay Decisions and Compensation Scorecards
The following pages show each NEO's 2021 Total Direct Compensation earned, 2021 TDC opportunities granted, and the Committee's (or the CEO's in the case of NEOs other than the CEO) rationale for those pay decisions.
| | | | | | | | | | | |
| | | |
JEFFREY J. LYASH President and CEO Joined TVA April 2019 | | | 2021 TOTAL DIRECT COMPENSATION EARNED $7,454,730 Base Salary. Mr. Lyash's salary was increased 3.97 percent to $1,100,000 for 2021, reflecting superior performance and positioning to a more competitive base salary. This amount is below the 2021 compensation peer group median. EAIP Payment Earned. Organizational performance under the TVA EAIP Scorecard exceeded target for all measures, resulting in a 142 percent payout percentage. Company performance under the TVA Corporate Multiplier measures was strong for nearly all measures despite the continued challenges presented by COVID-19. As a result, the TVA Board approved a 1.0 Corporate Multiplier. The TVA Board approved an Individual Performance Multiplier of 125 percent for Mr. Lyash for 2021 given his superior performance, including those considerations noted under 2021 Individual Performance Highlights. Long-Term Incentives Earned Long-Term Performance Awards Earned. Organizational performance under the 2019–2021 LTP program was stronger than expected in key operational measures, resulting in significantly lower than expected Non-Fuel Delivered Cost of Power and Load Not Served. However, several external measures were below target. In light of strong safety, reliability, and financial performance, the TVA Board determined that the 132 percent calculated payout appropriately reflected executive performance in executing on TVA's long-term priorities and did not exercise its discretion to adjust the payout. Long-Term Retention Award Earned. Mr. Lyash earned $754,300 in 2021 upon the vesting of the 2021 tranches of his 2020 and 2021 LTR program awards. The LTR awards vest ratably over a three-year period, subject to continued employment on each vesting date. Long-Term Incentive Opportunities Granted 2021–2023 Long-Term Performance Award Opportunity. Effective October 1, 2020, Mr. Lyash was granted a 2021–2023 LTP program award with a target opportunity of $2,914,100, which will vest on September 30, 2023. Actual payout will depend on performance against targets at the end of the three-year performance period. 2021 Long-Term Retention Award Opportunity. Effective October 1, 2020, Mr. Lyash was granted a 2021 LTR program award of $1,248,900 that vests ratably over a three-year period, subject to continued employment on each vesting date. The first tranche was earned in 2021 as described above. Other Compensation Recruitment and Relocation Incentive. Mr. Lyash was paid $292,000 in 2021 as the third tranche of a deferred cash recruitment and relocation incentive under his employment offer letter. This incentive was intended to compensate him for amounts he forfeited from his previous employer in order to join TVA, as well as to provide some measure of substitute compensation in light of his not being eligible to earn any long-term performance incentive payments until September 2021. |
| | |
2021 INDIVIDUAL PERFORMANCE HIGHLIGHTS •TVA has maintained its high level of service and employees continued to deliver outstanding performance in all strategic areas of the company through the COVID-19 pandemic. •Outstanding system performance experienced during the record winter storm and summer heat wave. •Effective planning and response to COVID-19 through Pandemic Response Team and union partnerships focused on enhanced safety, well-being, and communications to support the workforce. •Established an enterprise IwD to advise, champion, and oversee IwD strategies across TVA and the communities it serves. Increased diversity in leadership positions. •Developed TVA's Strategic Intent document to support internal alignment related to TVA's efforts around decarbonization and advanced innovation in energy supply. •Achieved 63% reduction in mass carbon emissions from 2005 baseline and working to obtain greater amounts of power supply from clean resources for further reductions. •Successfully facilitated the FY22 Budget Power Supply Plan. •Financial performance was strong, with debt reduced to the lowest level in 30 years, effective wholesale rates lowest in a decade, and lower interest expense in 2021 compared to 2020 mainly due to lower debt levels. •Strengthened customer relationships: 95% (145) of 153 LPCs have signed with TVA under 20-year Partnership Agreement. •The aggregate impact of these achievements was that TVA not only held rates stable and low, but returned $189 million in bill credits to LPCs participating in the long-term Partnership Agreement during 2021. •These achievements also enabled TVA to deliver a wide range of pandemic support programs to LPCs, businesses, and communities that lessened their burden and helped businesses across the Tennessee Valley recover. •Mr. Lyash's highest rated competencies were vision, innovation, and strategic direction, effective communication, and accountability and driving for results. | | |
| | | | | | | | | | | |
| | | |
JOHN M. THOMAS, III Executive Vice President and Chief Financial and Strategy Officer Joined TVA November 2005 | | | 2021 TOTAL DIRECT COMPENSATION EARNED $3,133,714 Base Salary. Mr. Thomas' salary was increased three percent to $686,582 at the beginning of 2021, reflecting strong performance and positioning to maintain a competitive base salary. Mr. Thomas’ salary was also increased 11.4 percent to $765,000 in June 2021 reflecting additional scope and responsibilities with his job title change to Executive Vice President and Chief Financial and Strategy Officer. EAIP Payment Earned. Organizational performance under the TVA EAIP Scorecard exceeded target for all measures, resulting in a 142 percent payout percentage. Company performance under the TVA Corporate Multiplier measures was strong for nearly all measures despite the continued challenges presented by COVID-19. As a result, the TVA Board approved a 1.0 Corporate Multiplier. The CEO approved an Individual Performance Multiplier of 105 percent for Mr. Thomas for 2021 given his strong performance, including those considerations noted under 2021 Individual Performance Highlights. Long-Term Incentives Earned Long-Term Performance Awards Earned. Organizational performance under the 2019–2021 LTP program was stronger than expected in key operational measures, resulting in significantly lower than expected Non-Fuel Delivered Cost of Power and Load Not Served. However, several external measures were below target. In light of strong safety, reliability, and financial performance, the TVA Board determined that the 132 percent calculated payout appropriately reflected executive performance in executing on TVA's long-term priorities and did not exercise its discretion to adjust the payout. Long-Term Retention Awards Earned. Mr. Thomas earned $413,667 in 2021 upon the vesting of the 2021 tranches of his 2019, 2020, and 2021 LTR program awards. The LTR awards vest ratably over a three-year period, subject to continued employment on each vesting date. Long-Term Incentive Opportunities Granted 2021–2023 Long-Term Performance Award Opportunity. Effective October 1, 2020, Mr. Thomas was granted a 2021–2023 LTP program award with a target opportunity of $1,000,000. Effective June 7, 2021, Mr. Thomas was awarded a prorated 2021-2023 LTP grant of $1,039,000, which will vest on September 30, 2023, and replaced the 2021-2023 LTP grant of $1,000,000 made on October 1, 2020. The actual payout of the award will depend on performance against targets at the end of the three-year performance period. 2021 Long-Term Retention Award Opportunity. Effective October 1, 2020, Mr. Thomas was granted a 2021 LTR program award of $432,000. Effective June 7, 2021, Mr. Thomas was awarded a prorated 2021 LTR award of $441,000 which replaced the 2021 LTR program award of $432,000 made on October 1, 2020, that vests ratably over a three-year period, subject to continued employment on each vesting date. The first tranche was earned in 2021 as described above. |
| | |
2021 INDIVIDUAL PERFORMANCE HIGHLIGHTS •Executed CFO, strategic planning, and business planning functions at an exceptionally high level, delivering results that exceeded enterprise goals in O&M expense, debt reduction, net income, and cash flow. •After assuming leadership for the Technology and Innovation units in 2020, quickly developed a comprehensive technology strategy including initiatives focused on transportation electrification, regional grid transformation, and expansion of TVA's solar power program, producing excellent 2021 results. For example, the industry-leading Green Invest Program resulted in more than 2,000 MWs of solar development across the Valley. •Continued to effectively manage revenue loss risk presented by the COVID-19 pandemic by working across the organization to manage O&M expense, adjust capital spending, and develop and extend a range of LPC and community support programs. These programs included direct fund matching to communities through the Community Care Fund and support through the Back-to-Business Credit program. •Effectively managed TVA liquidity, access to debt markets, and liability management activities to maintain TVA's strong financial position and lower interest expense. •Continued to successfully build TVA's ESG programs and communicate them effectively to stakeholders, including the financial community, executing TVA's first Investor ESG day. •Executed major bond issuance, including TVA's first ever Green Bonds that garnered the lowest 10-year rate in TVA history. •Continued to reduce TVA debt, achieving the lowest level in 30 years. •Total number of Long-Term Partnership Agreements increased in 2021, which returned $189 million to participating LPCs in 2021. •A key leader in delivering organizational financial performance that was the foundation for providing TVA customers with a 2.5% Pandemic Relief Credit on their monthly bills in 2021, and creating a Pandemic Recovery Credit of 2.5% for application throughout 2022. •Continued to mature the TVA Enterprise Risk Management Program, delivering superior risk insights contributing to material risk reduction. •In partnership with a range of internal organizations, developed and brought to the TVA Board a Carbon-informed Asset plan and a Strategic Intent and Guiding Principles Document that lay the foundation of TVA's greenhouse gas reduction glide path while maintaining low cost and high reliability. | | |
| | | | | | | | | | | |
| | | |
TIMOTHY S. RAUSCH Executive Vice President and Chief Nuclear Officer Joined TVA October 2018 | | | 2021 TOTAL DIRECT COMPENSATION EARNED $1,938,804 Base Salary. Mr. Rausch's salary was increased three percent to $551,668 for 2021, reflecting solid performance and positioning to maintain a competitive base salary. EAIP Payment Earned. Organizational performance under the TVA EAIP Scorecard exceeded target for all measures, resulting in a 142 percent payout percentage. Company performance under the TVA Corporate Multiplier measures was strong for nearly all measures despite the continued challenges presented by COVID-19. As a result, the TVA Board approved a 1.0 Corporate Multiplier. The CEO approved an Individual Performance Multiplier of 105 percent for Mr. Rausch for 2021 given his solid performance and notable achievements, including those considerations noted under 2021 Individual Performance Highlights. Long-Term Incentives Earned Long-Term Performance Awards Earned. Organizational performance under the 2019–2021 LTP program was stronger than expected in key operational measures, resulting in significantly lower than expected Non-Fuel Delivered Cost of Power and Load Not Served. However, several external measures were below target. In light of strong safety, reliability, and financial performance, the TVA Board determined that the 132 percent calculated payout appropriately reflected executive performance in executing on TVA's long-term priorities and did not exercise its discretion to adjust the payout. Long-Term Retention Award Payments Earned. Mr. Rausch earned $277,750 in 2021 upon the vesting of the 2021 tranches of his 2019, 2020, and 2021 LTR program award. The LTR program award vests ratably over a three-year period, subject to continued employment on each vesting date. Long-Term Incentive Opportunities Granted 2021–2023 Long-Term Performance Award Opportunity. Effective October 1, 2020, Mr. Rausch was granted a 2021–2023 LTP program award with a target opportunity of $500,000, which will vest on September 30, 2023. Actual payout will depend on performance against targets at the end of the three-year performance period. 2021 Long-Term Retention Award Opportunity. Effective October 1, 2020, Mr. Rausch was granted a 2021 LTR program award of $330,000 that vests ratably over a three-year period, subject to continued employment on each vesting date. The first tranche was earned in 2021 as described above. |
| | |
2021 INDIVIDUAL PERFORMANCE HIGHLIGHTS •Effectively led strong TVA nuclear fleet progress towards best-in-class operation, substantially improving nuclear fleet performance metrics and making solid progress toward the enterprise objective that all nuclear units achieve top quartile performance in 2022. •Completed 2021 with zero recordable injuries to TVA nuclear employees, effective with October 8, 2021 recorded data. •Substantially strengthened nuclear safety culture and safety conscious work environment, including improvement of Employee Concerns Program effectiveness, leadership timeliness in addressing employee issues and workforce communication that were recognized by the NRC with the closure of work environment related open concerns. •Completed the Extended Power Uprate program at Browns Ferry Nuclear Plant that increased cost effective power output by 11 percent and received nuclear industry recognition for project excellence. •Completed a broad portfolio of investments that significantly improved nuclear fleet safety and reliability. •Demonstrated nuclear value by delivering high reliability of the nuclear fleet through extreme winter weather and during the high load summer season. •Completed a series of major nuclear plant refueling outages involving thousands of workers, largely on budget and on schedule despite challenges presented by the COVID-19 pandemic. •Led a team that continued to advance the company's new nuclear program focused on deployment of light water Small Modular Reactors, which is a critical milestone in the development of this zero carbon generating resource. In addition, formed a partnership focused on development of next generation reactors including construction of a molten fluoride salt test reactor at Oak Ridge. •Championed the enterprise IwD Initiative, increasing diversity in the nuclear organization and mentoring the enterprise IwD Leadership Council. | | |
| | | | | | | | | | | |
| | | |
DAVID B. FOUNTAIN Executive Vice President and General Counsel (effective March 2021; former Senior Vice President, Vice General Counsel) Joined TVA June 2020 | | | 2021 TOTAL DIRECT COMPENSATION EARNED $1,074,607 Base Salary. Mr. Fountain’s salary was increased 3.5 percent to $465,750 at the beginning of 2021 reflecting his superior performance and positioning to maintain a competitive base salary. Mr. Fountain’s salary was also increased 15.9 percent to $540,000 in March 2021, with his selection as Executive Vice President and General Counsel. EAIP Payment Earned. Organizational performance under the TVA EAIP Scorecard exceeded target for all measures, resulting in a 142 percent payout percentage. Company performance under the TVA Corporate Multiplier measures was strong for nearly all measures despite the continued challenges presented by COVID-19. As a result, the TVA Board approved a 1.0 Corporate Multiplier. The CEO approved an Individual Performance Multiplier of 100 percent for Mr. Fountain for 2021 given his solid performance, including those considerations noted under 2021 Individual Performance Highlights. Long-Term Incentives Earned Long-Term Performance Award Payments Earned. Mr. Fountain did not participate in the 2019-2021 LTP program, and thus did not receive any LTP payout in 2021. Long-Term Retention Award Payments Earned. Mr. Fountain earned $105,500 in 2021 as the first tranche of his 2021 LTR program. The 2021 LTR award vests ratably over a three-year period, subject to continued employment on each vesting date. Long-Term Incentive Opportunities Granted 2021–2023 Long-Term Performance Award Opportunity. Effective October 1, 2020, Mr. Fountain was granted a 2021-2023 LTP program award with a target opportunity of $375,000. Effective March 5, 2021, Mr. Fountain was awarded a prorated 2021-2023 LTP grant of $562,500, which will vest on September 30, 2023, and replaced the 2021-2023 LTP grant of $375,000. The actual payout of the award will depend on performance against targets at the end of a three-year performance period. 2021 Long-Term Retention Award Opportunity. Effective October 1, 2020, Mr. Fountain was granted a 2021 LTR program award of $249,000. Effective with the March 5, 2021 selection, Mr. Fountain was awarded a prorated 2021 LTR award of $316,500 which replaced the 2021 LTR program award of $249,000 made on October 1, 2020, and vests ratably over a three-year period, subject to continued employment on each vesting date. The first tranche was earned in 2021 as described above. Other Compensation Recruitment and Relocation Incentive. Mr. Fountain was paid $100,000 in 2021 as the second installment of a deferred cash relocation incentive under his employment offer letter and $350,000 as the second installment of a deferred cash recruitment incentive under his employment offer letter. |
| | |
2021 INDIVIDUAL PERFORMANCE HIGHLIGHTS •Effectively led the activities of the Office of the General Counsel ("OGC) across multiple areas of law, including nuclear, regulatory, commercial, environmental, litigation, employment, natural resources, and others. •Served a critical role as an insightful, strategic, and trusted advisor to the Enterprise Leadership Team and to the TVA Board. •Counseled the enterprise through a variety of novel legal challenges including challenges to the public power model established by the TVA Act and a favorable decision in the Nuclear Development lawsuit related to the disposition of the Bellefonte Nuclear Plant site. •As Corporate Secretary supported the TVA Board in developing and implementing changes intended to strengthen the company's governance and improve transparency, including restructuring Board Committees. •As Vice General Counsel, led TVA's response to Executive Orders and interactions with other federal offices that successfully resolved significant issues and built confidence and trust. •Continued to successfully support the organization in developing the basis and structure of the portfolio of COVID-19 pandemic-related programs delivered across the TVA service area. •Took significant steps to strengthen the TVA Ethics Program, including completion of a comprehensive program assessment and development of a long-term improvement plan •Successfully completed the transition of the OGC organization from the prior General Counsel, building employee confidence and engagement. •Expanded the OGC's pro-bono legal support initiative that is positively impacting lives in support of TVA's mission of service.
| | |
| | | | | | | | | | | |
| | | |
DONALD A. MOUL Executive Vice President and Chief Operating Officer Joined TVA June 2021 | | | 2021 TOTAL DIRECT COMPENSATION EARNED $854,831 Base Salary. Mr. Moul’s salary was approved as $765,000 commensurate with his employment on June 21, 2021 as Executive Vice President and Chief Operating Officer. Salary earned in 2021 was $205,962. EAIP Payment Earned. Organizational performance under the TVA EAIP Scorecard exceeded target for all measures, resulting in a 142 percent payout percentage. Company performance under the TVA Corporate Multiplier measures was strong for nearly all measures despite the continued challenges presented by COVID-19. As a result, the TVA Board approved a 1.0 Corporate Multiplier. The CEO approved an Individual Performance Multiplier of 115 percent for Mr. Moul for 2021 given his strong performance, including those considerations noted under 2021 Individual Performance Highlights. Long-Term Incentives Earned Long-Term Performance Award Payments Earned. Organizational performance under the 2019–2021 LTP program was stronger than expected in key operational measures, resulting in significantly lower than expected Non-Fuel Delivered Cost of Power and Load Not Served. However, several external measures were below target. In light of strong safety, reliability, and financial performance, the TVA Board determined that the 132 percent calculated payout appropriately reflected executive performance in executing on TVA's long-term priorities and did not exercise its discretion to adjust the payout. Long-Term Retention Award Payments Earned. Mr. Moul earned $327,084 in 2021 upon the vesting of the 2021 tranches of his 2019, 2020 and 2021 LTR program awards. The LTR awards vest ratably over a three-year period, subject to continued employment on each vesting date. Long-Term Incentive Opportunities Granted 2021–2023 Long-Term Performance Award Opportunity. Effective with his hire, Mr. Moul was granted a prorated 2021-2023 LTP program award with a target opportunity of $588,750 which will vest on September 30, 2023. The actual payout of the award will depend on performance against targets at the end of the three-year performance period. 2021 Long-Term Retention Award Opportunity. Effective with his hire, Mr. Moul was granted a prorated 2021-2023 LTR program award of $588,750 that vests ratably over a three-year period, subject to continued employment on each vesting date. The first tranche was earned in 2021 as described above. Other Compensation Recruitment and Relocation Incentive. Mr. Moul was paid $650,000 in 2021 as the first installment of a deferred cash recruitment and relocation incentive under his employment offer letter. |
| | |
2021 INDIVIDUAL PERFORMANCE HIGHLIGHTS •Completed a highly successful 100-day Chief Operating Officer transition plan that maintained operational quality, built employee confidence, and effectively completed the turnover of the Chief Operating Officer position with Mr. Skaggs coincident with the end of the fiscal year. •Effectively engaged with the staff and coordinated system and river operations activities through a significant rainfall year and the highest load period in nearly a decade without customer interruption or price instability. •Quickly acclimated to the TVA organization, culture, and operation and established himself as an effective senior executive. •Completed an extensive program of customer and stakeholder outreach to establish the constructive relationships needed to effectively lead the enterprise, receiving strong positive stakeholder feedback on this critical executive turnover. •Effectively led organizational response to a series of COVID-related Executive Orders in a manner that satisfied these directives without disrupting performance. •Led the organizational response to a tragic contract employee fatality, supporting the responsible contract partner company in their investigation and ensuring that TVA learned all appropriate lessons and took timely improvement actions.
| | |
| | | | | | | | | | | |
| | | |
MICHAEL D. SKAGGS Executive Vice President and Advisor to the Chief Operating Officer (effective June 2021; former Executive Vice President and Chief Operating Officer) Joined TVA February 1994 | | | 2021 TOTAL DIRECT COMPENSATION EARNED $3,335,868 Base Salary. Mr. Skaggs's salary was increased four percent to $689,936 for 2021, reflecting strong performance and positioning to maintain a competitive base salary. EAIP Payment Earned. Organizational performance under the TVA EAIP Scorecard exceeded target for all measures, resulting in a 142 percent payout percentage. Company performance under the TVA Corporate Multiplier measures was strong for nearly all measures despite the continued challenges presented by COVID-19. As a result, the TVABoard approved a 1.0 Corporate Multiplier. The CEO approved an Individual Performance Multiplier of 115 percent for Mr. Skaggs for 2021 given his strong performance, including those considerations noted under 2021 Individual Performance Highlights. Long-Term Incentives Earned Long-Term Performance Awards Earned. Organizational performance under the 2019-2021 LTP program was stronger than expected in key operational measures, resulting in significantly lower than expected Non-Fuel Delivered Cost of Power and Load Not Served. However, several external measures were below target. In light of strong safety, reliability, and financial performance, the TVA Board determined that the 132 percent calculated payout appropriately reflected executive performance in executing on TVA's long-term priorities and did not exercise its discretion to adjust the payout. Long-Term Retention Awards Earned. Mr. Skaggs earned $451,000 in 2021 upon the vesting of the 2021 tranches of his 2019, 2020, and 2021 LTR program awards, respectively. The LTR program awards vest ratably over a three-year period, subject to continued employment on each vesting date. Long-Term Incentive Opportunities Granted 2021–2023 Long-Term Performance Award Opportunity. Effective October 1, 2020, Mr. Skaggs was granted a 2021–2023 LTP program award with a target opportunity of $1,175,000 which will vest on September 30, 2023. Actual payout will depend on performance against targets at the end of the three-year performance period. 2021 Long-Term Retention Award Opportunity. Effective October 1, 2020, Mr. Skaggs was granted a 2021 LTR program award of $504,000 that vests ratably over a three-year period, subject to continued employment on each vesting date. The first tranche was earned in 2021 as described above. |
| | |
2021 INDIVIDUAL PERFORMANCE HIGHLIGHTS •Led the operational teams to the best industrial safety performance in TVA history for the second consecutive year, with top quartile Serious Injury Rate and top decile OSHA Injury Rate. •Provided exceptional reliability during two extreme cold and heat-related weather events, delivering high generating station performance, strong transmission system performance, and outstanding system management. •In partnership with a range of internal organizations, developed and brought to the TVA Board a Carbon-informed Asset plan and a Strategic Intent and Guiding Principles Document that lay the foundation of TVA's greenhouse gas reduction glide path while maintaining low cost and high reliability. •Continuously improved transmission reliability in 2021, again setting industry performance standards, and resulting in more reliable and higher-quality power delivery to industrial customers, LPCs, and communities. •Led significant improvement of non- nuclear generation fleet performance in 2021, exceeding aggressive goals and contributing to lower fuel costs and considerable savings to customers. •Progressed the Grid of Tomorrow program, which is focused on building the integrated energy system of the future, on schedule and on budget. •Continued to build TVA's ESG program and issued TVA's second Sustainability Report, clearly communicating TVA's leadership position in this important dimension of corporate stewardship. •Led improvement efforts for critical support functions of supply chain, environmental programs, and security. •Evaluated, assisted in lessons learned incorporation, and provided meaningful mentorship for the Watts Bar Unit 2 Nuclear Plant Steam Generator Project. •Advised the TVA nuclear team in developing the Small Modular Reactor program, a key to achieving future carbon reduction goals. | | |
Executive Compensation Tables and Narrative Disclosures
Summary Compensation and Grants of Plan-Based Awards
The following table provides information on compensation earned by each of the Named Executive OfficersNEOs in 20172021 (and 20162020 and 2015,2019, as applicable).
|
| | | | | | | | | | | | | | | | | | | |
Summary Compensation Table |
| Name and Principal Position | Year | Salary ($) | Bonus ($) | Stock Awards ($) | Option Awards ($) | Non-Equity Incentive Plan Compensation ($) (1) | | Change in Pension Value and Nonqualified Deferred Compensation Earnings ($) (2) | | All Other Compensation ($) (3) | Total ($) |
| William D. Johnson | 2017 | 995,000 |
| — |
| — |
| — |
| 4,075,857 |
| | 1,556,084 |
| | 31,800 |
| 6,658,741 |
|
| President and Chief | 2016 | 1,002,654 |
| — |
| — |
| — |
| 3,906,619 |
| (4) | 1,529,186 |
| (5) | 11,925 |
| 6,450,384 |
|
| Executive Officer | 2015 | 998,827 |
| — |
| — |
| — |
| 3,573,178 |
| (6) | 1,068,264 |
| (7) | 761,700 |
| 6,401,969 |
|
| | | | | | | | | | | | |
| John M. Thomas, III | 2017 | 610,018 |
| — |
| — |
| — |
| 1,406,637 |
| | 294,108 |
| | 19,875 |
| 2,330,638 |
|
| Executive Vice President | 2016 | 596,806 |
| — |
| — |
| — |
| 1,645,425 |
| (8) | 631,252 |
| (9) | 11,925 |
| 2,885,408 |
|
| and Chief Financial Officer | 2015 | 577,212 |
| — |
| — |
| — |
| 1,317,900 |
| (10) | 306,185 |
| (11) | 411,700 |
| 2,612,997 |
|
| | | | | | | | | | | | |
| Joseph P. Grimes, Jr. | 2017 | 650,000 |
| — |
| — |
| — |
| 1,445,383 |
| | 311,406 |
| | 31,800 |
| 2,438,589 |
|
| Executive Vice President | 2016 | 604,615 |
| — |
| — |
| — |
| 1,254,987 |
| (12) | 320,593 |
| (13) | 11,925 |
| 2,192,120 |
|
| Generation | 2015 | 557,135 |
| — |
| — |
| — |
| 954,122 |
| (14) | 268,994 |
| (15) | 311,700 |
| 2,091,951 |
|
| | | | | | | | | | | | |
| Michael D. Skaggs | 2017 | 495,285 |
| — |
| — |
| — |
| 1,000,578 |
| | 352,167 |
| | 11,925 |
| 1,859,955 |
|
| Executive Vice President | 2016 | 475,328 |
| — |
| — |
| — |
| 853,282 |
| (16) | 864,973 |
| (17) | 161,925 |
| 2,355,508 |
|
| Operations | 2015 | 446,712 |
| — |
| — |
| — |
| 785,870 |
| (18) | 503,274 |
| (19) | 311,700 |
| 2,047,556 |
|
| | | | | | | | | | | | |
| Sherry A. Quirk | 2017 | 477,405 |
| — |
| — |
| — |
| 993,725 |
| | 138,629 |
| | 23,850 |
| 1,633,609 |
|
| Executive Vice President and | 2016 | — |
| — |
| — |
| — |
| — |
| | — |
| | — |
| — |
|
| General Counsel | 2015 | — |
| — |
| — |
| — |
| — |
| | — |
| | — |
| — |
|
Note | | | | | | | | | | | | | | | | | | | | | | | | | | | | | | | | | | | | | | | | | | | | | | | | | |
| Name and Principal Position | | Year | | Salary | | Bonus(1) | | | | Non-Equity Incentive Plan Compensation(2) | | Change in Pension Value and
Nonqualified Deferred Compensation Earnings(3) | | All Other Compensation(4) | | Total | |
| Jeffrey J. Lyash | | 2021 | | $ | 1,100,000 | | | $ | — | | | | | $ | 6,354,730 | | | | $ | 2,110,300 | | | | $ | 317,650 | | | $ | 9,882,680 | | |
| President and Chief | | 2020 | | 1,058,000 | | | — | | | | | 2,729,609 | | (5) | | 2,271,647 | | (6) | | 1,237,977 | | | 7,297,233 | | |
| Executive Officer | | 2019 | | 445,846 | | | 380,000 | | | | | 861,969 | | (7) | | 5,970,873 | | (8) | | 504,835 | | | 8,163,523 | | |
| John M. Thomas, III | | 2021 | | $ | 710,711 | | | $ | — | | | | | $ | 2,423,003 | | | | $ | 767,504 | | | | $ | 21,375 | | | $ | 3,922,593 | | |
| Executive Vice President and | | 2020 | | 666,584 | | | — | | | | | 2,210,410 | | (9) | | 980,220 | | (10) | | 21,000 | | | 3,878,214 | | |
| Chief Financial and Strategy Officer | | 2019 | | 648,208 | | | 52,500 | | | | | 1,804,797 | | (11) | | 1,076,752 | | (12) | | 20,625 | | | 3,602,882 | | |
| Timothy Rausch | | 2021 | | $ | 551,668 | | | $ | — | | | | | $ | 1,387,136 | | | | $ | 237,895 | | | | $ | 25,650 | | | $ | 2,202,349 | | |
| Senior Vice President | | 2020 | | 535,600 | | | — | | | | | 1,031,390 | | (13) | | 106,428 | | (14) | | 159,794 | | | 1,833,212 | | |
| and Chief Nuclear Officer | | 2019 | | 502,000 | | | — | | | | | 713,750 | | (15) | | 72,784 | | (16) | | 255,735 | | | 1,544,269 | | |
| David Fountain | | 2021 | | $ | 507,444 | | | $ | — | | | | | $ | 567,163 | | | | $ | 4,167 | | | | $ | 479,295 | | | $ | 1,558,069 | | |
| Executive Vice President | | 2020 | | — | | | — | | | | | — | | | | — | | | | — | | | — | | |
| and General Counsel | | 2019 | | — | | | — | | | | | — | | | | — | | | | — | | | — | | |
| Donald Moul | | 2021 | | $ | 205,962 | | | $ | — | | | | | $ | 648,869 | | | | $ | — | | | | $ | 678,098 | | | $ | 1,532,929 | | |
| Executive Vice President | | 2020 | | — | | | — | | | | | — | | | | — | | | | — | | | — | | |
| and Chief Operating Officer | | 2019 | | — | | | — | | | | | — | | | | — | | | | — | | | — | | |
| Mike D. Skaggs | | 2021 | | $ | 689,936 | | | $ | — | | | | | $ | 2,645,932 | | | | $ | 1,223,557 | | | | $ | 12,825 | | | $ | 4,572,250 | | |
| Executive Vice President | | 2020 | | 663,400 | | | — | | | | | 2,150,295 | | (17) | | 1,609,999 | | (18) | | 12,600 | | | 4,436,294 | | |
| and Advisor to the CEO | | 2019 | | 614,692 | | | 52,500 | | | | | 1,716,194 | | (19) | | 2,017,130 | | (20) | | 12,375 | | | 4,412,891 | | |
Notes
(1) There were no bonus awards in 2021.
(2) The 20172021 data is outlined in the table below.
|
| | | | | | | | | | | | | | | | | | | |
| Non-Equity Incentive Plan Compensation |
| | | | | | | | | | |
| | William D. Johnson | | John M. Thomas, III | | Joseph P. Grimes, Jr. | | Michael D. Skaggs | | Sherry A. Quirk |
| EAIP | $ | 1,691,003 |
| | $ | 502,654 |
| | $ | 535,600 |
| | $ | 408,115 |
| | $ | 344,210 |
|
| ELTIP | 1,793,488 |
| | 753,983 |
| | 736,450 |
| | 459,130 |
| | 524,515 |
|
LTR 2015-02(A) | 189,050 |
| | 66,667 |
| | 86,666 |
| | 50,000 |
| | 50,000 |
|
LTR 2016-01(B) | 202,316 |
| | 83,333 |
| | 86,667 |
| | 83,333 |
| | 75,000 |
|
| PIA | 200,000 |
| | — |
| | — |
| | — |
| | — |
|
| Total | $ | 4,075,857 |
| | $ | 1,406,637 |
| | $ | 1,445,383 |
| | $ | 1,000,578 |
| | $ | 993,725 |
|
| | | | | | | | | | | | | | | | | | | | | | | | | | | | | | | | | | | | | |
| Jeffrey J.
Lyash | | | | John M. Thomas, III | | Timothy
Rausch | | David Fountain | | Donald Moul | | Michael D. Skaggs |
| EAIP | $ | 2,928,750 | | | | | $ | 847,736 | | | $ | 575,776 | | | $ | 461,663 | | | $ | 235,435 | | | $ | 901,332 | |
| LTP | 2,671,680 | | | | | 1,161,600 | | | 533,610 | | | — | | | 86,350 | | | 1,293,600 | |
LTR 2019-03(A) | — | | | | | 126,667 | | | 57,750 | | | — | | | 21,806 | | | 140,000 | |
LTR 2020-02(B) | 338,000 | | | | | 140,000 | | | 110,000 | | | — | | | 109,028 | | | 143,000 | |
LTR 2021-01(C) | 416,300 | | | | | 147,000 | | | 110,000 | | | 105,500 | | | 196,250 | | | 168,000 | |
| | | | | | | | | | | | | |
| Total | $ | 6,354,730 | | | | | $ | 2,423,003 | | | $ | 1,387,136 | | | $ | 567,163 | | | $ | 648,869 | | | $ | 2,645,932 | |
Notes
(A) LTR grant representing the third tranche of the LTR award effective October 1, 2018.
(B) LTR grant representing the second tranche of the LTR award effective October 1, 2015.2019.
(B)(C) LTR grant representing the first tranche of the LTR award effective October 1, 2016.2020.
(2)
(3) The 20172021 data is outlined in the table below.
|
| | | | | | | | | | | | | | | | | | | |
| Change in Pension Value and Nonqualified Deferred Compensation Earnings |
| | | | | | | | | | |
| | William D. Johnson | | John M. Thomas, III | | Joseph P. Grimes, Jr. | | Michael D. Skaggs | | Sherry A. Quirk |
| Increase under CBBS | $ | 3,588 |
| | $ | 15,312 |
| | $ | 2,105 |
| | $ | 37,091 |
| | $ | — |
|
| Increase under SERP | 1,552,496 |
| | 278,796 |
| | 309,301 |
| | 315,076 |
| | 138,629 |
|
| Total | $ | 1,556,084 |
| | $ | 294,108 |
| | $ | 311,406 |
| | $ | 352,167 |
| | $ | 138,629 |
|
| | | | | | | | | | | | | | | | | | | | | | | | | | | | | | | | | | | | | |
| Jeffrey J.
Lyash | | | | John M. Thomas, III | | Timothy
Rausch | | David Fountain | | Donald Moul | | Michael D. Skaggs |
| Increase under TVARS Plans | $ | — | | | | | $ | 17,652 | | | $ | — | | | $ | — | | | $ | — | | | $ | 41,797 | |
| Increase under SERP | 2,110,300 | | | | | 749,852 | | | 237,895 | | | 4,167 | | | — | | | 1,181,760 | |
| Total | $ | 2,110,300 | | | | | $ | 767,504 | | | $ | 237,895 | | | $ | 4,167 | | | $ | — | | | $ | 1,223,557 | |
(3) (4) The 20172021 data is outlined in the table below.
|
| | | | | | | | | | | | | | | | | | | |
| All Other Compensation |
| | | | | | | | | | |
| | William D. Johnson | | John M. Thomas, III | | Joseph P. Grimes, Jr. | | Michael D. Skaggs | | Sherry A. Quirk |
| 401(k) Matching Contribution | $ | 15,900 |
| | $ | 11,925 |
| | $ | 15,900 |
| | $ | 11,925 |
| | $ | 11,925 |
|
| Non-Elective Contribution | 15,900 |
| | 7,950 |
| | 15,900 |
| | — |
| | 11,925 |
|
| Total | $ | 31,800 |
| | $ | 19,875 |
| | $ | 31,800 |
| | $ | 11,925 |
| | $ | 23,850 |
|
| | | | | | | | | | | | | | | | | | | | | | | | | | | | | | | | | | | | | |
| Jeffrey J.
Lyash | | | | John M. Thomas, III | | Timothy
Rausch | | David Fountain | | Donald Moul | | Michael D. Skaggs |
| 401(k) Matching Contribution | $ | 12,825 | | | | | $ | 12,825 | | | $ | 12,825 | | | $ | 12,825 | | | $ | 7,944 | | | $ | 12,825 | |
| Non-Elective 401(k) Contribution | 12,825 | | | | | 8,550 | | | 12,825 | | | 12,825 | | | 9,268 | | | — | |
| Deferred Cash Recruitment/Relocation Incentive | 292,000 | | | | | — | | | — | | | 450,000 | | (A) | 650,000 | | (B) | — | |
| Relocation Benefits | — | | | | | — | | | — | | | 3,645 | | | 10,886 | | | — | |
| Total | $ | 317,650 | | | | | $ | 21,375 | | | $ | 25,650 | | | $ | 479,295 | | | $ | 678,098 | | | $ | 12,825 | |
(4)Notes
(A) Under the terms of his offer letter, Mr. Fountain is required to repay to TVA deferred cash relocation incentive payments in the amount of $150,000 if, prior to June 1, 2022, he (1) voluntarily terminates employment unless the separation is for reasons beyond his control and acceptable to TVA, or (2) he is terminated for cause. In addition, Mr. Fountain is required to repay to TVA deferred cash relocation incentive payments in the amount of $100,000 if, prior to June 1, 2023, he (1) voluntarily terminates employment unless the separation is for reasons beyond his control and acceptable to TVA, or (2) he is terminated for cause.
(B) Under the terms of his offer letter, Mr. Moul is required to repay to TVA deferred cash recruitment and relocation incentive payments in the amount of $650,000 if, prior to June 21, 2023, he (1) voluntarily terminates employment unless the separation is for reasons beyond his control and acceptable to TVA, or (2) he is terminated for cause.
(5) Represents $1,802,194$2,391,609 awarded under the EAIP $1,915,375 awarded under the ELTIP, and $189,050$338,000 awarded under the LTR.
(5)(6) Reflects increasesincrease of $19,235 under the CBBS and $1,509,951$2,271,647 under the SERP.
(6)(7) Represents $1,280,565$861,969 awarded under the EAIP.
(8) Reflects increase of $5,970,873 under the SERP.
(9) Represents $730,576 awarded under the EAIP, $1,967,613$1,096,500 awarded under the ELTIP,LTP, and $325,000$383,334 awarded under a performance incentive arrangement.the LTR.
(7)(10) Reflects increases of $17,844$34,401 under the CBBSCash Balance Pension and $1,050,420$945,819 under the SERP.
(8)(11) Represents $596,988$660,630 awarded under the EAIP, $781,770$817,500 awarded under the ELTIP, $66,667LTP, and $326,667 awarded under the LTR.
(12) Reflects increases of $60,304 under the Cash Balance Pension and $1,016,448 under the SERP.
(13) Represents $513,640 awarded under the EAIP, $167,750 awarded under the LTR, and $200,000$350,000 awarded under a retention incentive arrangement ("RIA").Performance Incentive Arrangement.
(9)(14) Reflects increasesincrease of $35,189 under the CBBS and $596,063$106,428 under the SERP.
(10)(15) Represents $538,200$406,000 awarded under the EAIP, and $779,700$57,750 awarded under the ELTIP.LTR, and $250,000 awarded under a Performance Incentive Arrangement.
(11)(16) Reflects increasesincrease of $28,797 under the CBBS and $277,388$72,784 under the SERP.
(12)(17) Represents $442,320$799,795 awarded under the EAIP, $726,000$967,500 awarded under the ELTIP,LTP, and $86,667$383,000 awarded under the LTR.
(13)(18) Reflects increases of $18,646$55,129 under the CBBSCash Balance Pension and $301,947$1,554,870 under the SERP.
(14)(19) Represents $475,080$575,360 awarded under the EAIP, and $479,042$817,500 awarded under the ELTIP.
(15) Reflects increases of $17,865 under the CBBSLTP, and $251,129 under the SERP.
(16) Represents $336,299 awarded under the EAIP, $466,983 awarded under the ELTIP, and $50,000$323,334 awarded under the LTR.
(17)(20) Reflects increases of $48,505$91,600 under the CBBSCash Balance Pension and $816,468$1,925,530 under the SERP.
(18) Represents $333,305 awarded under the EAIP and $452,565 awarded under the ELTIP.
(19) Reflects increases of $38,269 under the CBBS and $465,005 under the SERP.
The following table provides information on non-equity incentive plan awardsopportunities and grants provided to NEOs and the possible range of payouts associated with incentives the Named Executive Officers were eligible to receive as of September 30, 2017, in the performance cycles ending on September 30, 2017, 2018,opportunities and 2019.grants. Awards under the EAIP, ELTIP,LTP, and LTR and PIA that vested as of September 30, 2017,2021, will be paid in cash during the first quarter of 2018.2022.
|
| | | | | | | | | | | | | | | | | | | | | | |
Grants of Plan-Based Awards Table as of September 30, 2017 |
| | | Estimated Possible Payouts Under Non-Equity Incentive Plan Awards (1) | | Estimated Future Payouts Under
Non-Equity Incentive Plan Awards (1) | | |
Name | Plan | Threshold (2) ($) | Target (2) ($) | Maximum (2) ($) | | Threshold (2) ($) | Target (2) ($) | Maximum (2) ($) | | Performance Period Ending/Vesting Date |
| | | | | | | | | | | |
| William D. Johnson | EAIP(3) | $ | 746,250 |
| $ | 1,492,500 |
| $ | 2,238,750 |
| | | | | | 09/30/2017 |
| | ELTIP(4) | $ | 870,625 |
| $ | 1,741,250 |
| $ | 2,611,875 |
| | | | | | 09/30/2017 |
| | LTR 2015-02(5) | | $ | 189,050 |
| $ | 189,050 |
| | | | | | 09/30/2017 |
| | LTR 2016-01(5) | | $ | 202,316 |
| $ | 202,316 |
| | | | | | 09/30/2017 |
| | PIA(6) | | | $ | 200,000 |
| | | | | | 09/30/2017 |
| | LTP(7) | | | | | $ | 1,134,300 |
| $ | 2,268,600 |
| $ | 3,402,900 |
| | 09/30/2018 |
| | LTR 2015-03(5) | | | | | | $ | 189,050 |
| $ | 189,050 |
| | 09/30/2018 |
| | LTR 2016-02(5) | | | | | | $ | 202,317 |
| $ | 202,317 |
| | 09/30/2018 |
| | PIA(6) | | | | | | | $ | 200,000 |
| | 09/30/2018 |
| | LTP(8) | | | | | $ | 1,213,900 |
| $ | 2,427,800 |
| $ | 3,641,700 |
| | 09/30/2019 |
| | LTR 2016-03(5) | | | | | | $ | 202,317 |
| $ | 202,317 |
| | 09/30/2019 |
| | PIA(6) | | | | | | | $ | 200,000 |
| | 09/30/2019 |
| | | |
| |
| |
| | | | | | |
| John M. Thomas, III | EAIP(3) | $ | 244,007 |
| $ | 488,014 |
| $ | 732,021 |
| | | | | | 09/30/2017 |
| | ELTIP(4) | $ | 366,011 |
| $ | 732,022 |
| $ | 1,098,033 |
| | | | | | 09/30/2017 |
| | LTR 2015-02(5) | | $ | 66,667 |
| $ | 66,667 |
| | | | | | 09/30/2017 |
| | LTR 2016-01(5) | | $ | 83,333 |
| $ | 83,333 |
| | | | | | 09/30/2017 |
| | LTP(7) | | | | | $ | 357,500 |
| $ | 715,000 |
| $ | 1,072,500 |
| | 09/30/2018 |
| | LTR 2015-03(5) | | | | | | $ | 66,667 |
| $ | 66,667 |
| | 09/30/2018 |
| | LTR 2016-02(5) | | | | | | $ | 83,333 |
| $ | 83,333 |
| | 09/30/2018 |
| | LTP(8) | | | | | $ | 375,000 |
| $ | 750,000 |
| $ | 1,125,000 |
| | 09/30/2019 |
| | LTR 2016-03(5) | | | | | | $ | 83,334 |
| $ | 83,334 |
| | 09/30/2019 |
| | | | | | | | | | | |
| Joseph P. Grimes, Jr. | EAIP(3) | $ | 260,000 |
| $ | 520,000 |
| $ | 780,000 |
| | | | | | 09/30/2017 |
| | ELTIP(4) | $ | 357,500 |
| $ | 715,000 |
| $ | 1,072,500 |
| | | | | | 09/30/2017 |
| | LTR 2015-02(5) | | $ | 86,666 |
| $ | 86,666 |
| | | | | | 09/30/2017 |
| | LTR 2016-01(5) | | $ | 86,667 |
| $ | 86,667 |
| | | | | | 09/30/2017 |
| | LTP(7) | | | | | $ | 375,000 |
| $ | 750,000 |
| $ | 1,125,000 |
| | 09/30/2018 |
| | LTR 2015-03(5) | | | | | | $ | 86,666 |
| $ | 86,666 |
| | 09/30/2018 |
| | LTR 2016-02(5) | | | | | | $ | 86,667 |
| $ | 86,667 |
| | 09/30/2018 |
| | LTP(8) | | | | | $ | 375,000 |
| $ | 750,000 |
| $ | 1,125,000 |
| | 09/30/2019 |
| | LTR 2016-03(5) | | | | | | $ | 86,667 |
| $ | 86,667 |
| | 09/30/2019 |
| | | |
| |
| |
| | | | | | |
| Michael D. Skaggs | EAIP(3) | $ | 198,114 |
| $ | 396,228 |
| $ | 594,342 |
| | | | | | 09/30/2017 |
| | ELTIP(4) | $ | 222,879 |
| $ | 445,757 |
| $ | 668,636 |
| | | | | | 09/30/2017 |
| | LTR 2015-02(5) | | $ | 50,000 |
| $ | 50,000 |
| | | | | | 09/30/2017 |
| | LTR 2016-01(5) | | $ | 83,333 |
| $ | 83,333 |
| | | | | | 09/30/2017 |
| | LTP(7) | | | | | $ | 300,000 |
| $ | 600,000 |
| $ | 900,000 |
| | 09/30/2018 |
| | LTR 2015-03(5) | | | | | | $ | 50,000 |
| $ | 50,000 |
| | 09/30/2018 |
| | LTR 2016-02(5) | | | | | | $ | 83,333 |
| $ | 83,333 |
| | 09/30/2018 |
| | LTP(8) | | | | | $ | 375,000 |
| $ | 750,000 |
| $ | 1,125,000 |
| | 09/30/2019 |
| | LTR 2016-03(5) | | | | | | $ | 83,334 |
| $ | 83,334 |
| | 09/30/2019 |
| | | |
| |
| |
| | | | | | |
| Sherry A. Quirk | EAIP(3) | $ | 167,092 |
| $ | 334,184 |
| $ | 501,276 |
| | | | | | 09/30/2017 |
| | ELTIP(9) | $ | 254,619 |
| $ | 509,238 |
| $ | 763,857 |
| | | | | | 09/30/2017 |
| | LTR 2015-02(5) | | $ | 50,000 |
| $ | 50,000 |
| | | | | | 09/30/2017 |
| | LTR 2016-01(5) | | $ | 75,000 |
| $ | 75,000 |
| | | | | | 09/30/2017 |
| | LTP(7) | | | | | $ | 280,000 |
| $ | 560,000 |
| $ | 840,000 |
| | 09/30/2018 |
| | LTR 2015-03(5) | | | | | | $ | 50,000 |
| $ | 50,000 |
| | 09/30/2018 |
| | LTR 2016-02(5) | | | | | | $ | 75,000 |
| $ | 75,000 |
| | 09/30/2018 |
| | LTP(8) | | | | | $ | 337,500 |
| $ | 675,000 |
| $ | 1,012,500 |
| | 09/30/2019 |
| | LTR 2016-03(5) | | | | | | $ | 75,000 |
| $ | 75,000 |
| | 09/30/2019 |
| | | | | | | | | | | |
GRANTS OF PLAN-BASED AWARDS TABLE
as of September 30, 2021
| | | | | | | | | | | | | | | | | | | | | | | | | | | | | | | | | | | | | | |
| | | | | Estimated Possible Payouts Under Non-Equity Incentive Plan Awards(1) | | Estimated Future Payouts Under
Non-Equity Incentive Plan Awards(1) | | | | |
| | | | Current Year | | Future Years | | | | |
| Name | Plan | | | Threshold(2) | Target(2) | Maximum(2) | | Threshold(2) | Target(2) | Maximum(2) | | Performance Period Ending/Vesting Date | | |
| Jeffrey J. Lyash | EAIP | | (3) | $ | 825,000 | | $ | 1,650,000 | | $ | 2,475,000 | | | | | | | 9/30/2021 | | |
| LTP 2019 | | (4) | 1,012,000 | | 2,024,000 | | 3,036,000 | | | | | | | 9/30/2021 | | |
| LTR 2020-02 | | (5) | | 338,000 | | 338,000 | | | | | | | 9/30/2021 | | |
| LTR 2021-01 | | (5) | | 416,300 | | 416,300 | | | | | | | 9/30/2021 | | |
| LTP 2020 | | (6) | | | | | $ | 1,170,500 | | $ | 2,341,000 | | $ | 3,511,500 | | | 9/30/2022 | | |
| LTR 2020-03 | | (5) | | | | | | 338,000 | | 338,000 | | | 9/30/2022 | | |
| LTR 2021-02 | | (5) | | | | | | 416,300 | | 416,300 | | | 9/30/2022 | | |
| LTP 2021 | | (7) | | | | | 1,457,050 | | 2,914,100 | | 4,371,150 | | | 9/30/2023 | | |
| LTR 2021-03 | | (5) | | | | | | 416,300 | | 416,300 | | | 9/30/2023 | | |
| | | | | | | | | | | | | | | |
| John M. Thomas, III | EAIP | | (3) | $ | 284,284 | | $ | 568,568 | | $ | 852,852 | | | | | | | 9/30/2021 | | |
| LTP 2019 | | (4) | 440,000 | 880,000 | 1,320,000 | | | | | | 9/30/2021 | | |
| LTR 2019-03 | | (5) | | 126,667 | 126,667 | | | | | | 9/30/2021 | | |
| LTR 2020-02 | | (5) | | 140,000 | 140,000 | | | | | | 9/30/2021 | | |
| LTR 2021-01 | | (5) | | 147,000 | 147,000 | | | | | | 9/30/2021 | | |
| LTP 2020 | | (6) | | | | | $ | 490,000 | | $ | 980,000 | | $ | 1,470,000 | | | 9/30/2022 | | |
| LTR 2020-03 | | (5) | | | | | | 140,000 | 140,000 | | 9/30/2022 | | |
| LTR 2021-02 | | (5) | | | | | | 147,000 | 147,000 | | 9/30/2022 | | |
| LTP 2021 | | (7) | | | | | 519,500 | 1,039,000 | 1,558,500 | | 9/30/2023 | | |
| LTR 2021-03 | | (5) | | | | | | 147,000 | 147,000 | | 9/30/2023 | | |
| | | | | | | | | | | | | | |
| | | | | | | | | | | | | | |
| Timothy Rausch | EAIP | | (3) | $ | 193,084 | | $ | 386,168 | | $ | 579,252 | | | | | | | 9/30/2021 | | |
| LTP 2019 | | (4) | 202,125 | 404,250 | 606,375 | | | | | | 9/30/2021 | | |
| LTR 2019-03 | | (5) | | 57,750 | 57,750 | | | | | | 9/30/2021 | | |
| LTR 2020-02 | | (5) | | 110,000 | 110,000 | | | | | | 9/30/2021 | | |
| LTR 2021-01 | | (5) | | 110,000 | 110,000 | | | | | | 9/30/2021 | | |
| LTP 2020 | | (6) | | | | | $ | 250,000 | | $ | 500,000 | | $ | 750,000 | | | 9/30/2022 | | |
| LTR 2020-03 | | (5) | | | | | | 110,000 | 110,000 | | 9/30/2022 | | |
| LTR 2021-02 | | (5) | | | | | | 110,000 | 110,000 | | 9/30/2022 | | |
| LTP 2021 | | (7) | | | | | 250,000 | 500,000 | 750,000 | | 9/30/2023 | | |
| LTR 2021-03 | | (5) | | | | | | 110,000 | 110,000 | | 9/30/2023 | | |
| | | | | | | | | | | | | | |
| | | | | | | | | | | | | | |
| David Fountain | EAIP | | (3) | $ | 162,557 | | $ | 325,114 | | $ | 487,672 | | | | | | | 9/30/2021 | | |
| LTR 2021-01 | | (5) | | 105,500 | 105,500 | | | | | | 9/30/2021 | | |
| LTP 2020 | | (6) | | | | | $ | 187,500 | | $ | 375,000 | | $ | 562,500 | | | 9/30/2022 | | |
| LTR 2021-02 | | (5) | | | | | | 105,500 | | 105,500 | | | 9/30/2022 | | |
| LTP 2021 | | (7) | | | | | 281,250 | | 562,500 | | 843,750 | | | 9/30/2023 | | |
| LTR 2021-03 | | (5) | | | | | | 105,500 | | 105,500 | | | 9/30/2023 | | |
| | | | | | | | | | | | | | |
| | | | | | | | | | | | | | |
| | | | | | | | | | | | | | |
| | | | | | | | | | | | | | |
| | | | | | | | | | | | | | |
| | | | | | | | | | | | | | |
| Donald Moul | EAIP | | (3) | $ | 72,087 | | $ | 144,173 | | $ | 216,260 | | | | | | | 9/30/2021 | | |
| LTP 2019 | | (4) | 32,709 | 65,417 | 98,126 | (8) | | | | | 9/30/2021 | | |
| LTR 2019-03 | | (5) | | 21,806 | 21,806 | (9) | | | | | 9/30/2021 | | |
| LTR 2020-02 | | (5) | | 109,028 | 109,028 | (10) | | | | | 9/30/2021 | | |
| LTR 2021-01 | | (5) | | 196,250 | 196,250 | | (11) | | | | | 9/30/2021 | | |
| LTP 2020 | | (6) | | | | | $ | 163,542 | | $ | 327,083 | | $ | 490,625 | | (12) | 9/30/2022 | | |
| LTR 2020-03 | | (5) | | | | | | 109,028 | 109,028 | (10) | 9/30/2022 | | |
| LTR 2021-02 | | (5) | | | | | | 196,250 | 196,250 | (11) | 9/30/2022 | | |
| LTP 2021 | | (7) | | | | | 294,375 | 588,750 | 883,125 | (13) | 9/30/2023 | | |
| LTR 2021-03 | | (5) | | | | | | 196,250 | 196,250 | (11) | 9/30/2023 | | |
| | | | | | | | | | | | | | |
| | | | | | | | | | | | | | | | | | | | | | | | | | | | | | | | | | | | | | |
| Michael D. Skaggs | EAIP | | (3) | $ | 275,975 | | $ | 551,949 | | $ | 827,924 | | | | | | | 9/30/2021 | | |
| LTP 2019 | | (4) | 490,000 | 980,000 | 1,470,000 | | | | | | 9/30/2021 | | |
| LTR 2019-03 | | (5) | | 140,000 | 140,000 | | | | | | 9/30/2021 | | |
| LTR 2020-02 | | (5) | | 143,000 | 143,000 | | | | | | 9/30/2021 | | |
| LTR 2021-01 | | (5) | | 168,000 | 168,000 | | | | | | 9/30/2021 | | |
| LTP 2020 | | (6) | | | | | $ | 495,000 | | $ | 990,000 | | $ | 1,485,000 | | | 9/30/2022 | | |
| LTR 2020-03 | | (5) | | | | | | 143,000 | 143,000 | | 9/30/2022 | | |
| LTR 2021-02 | | (5) | | | | | | 168,000 | 168,000 | | 9/30/2022 | | |
| LTP 2021 | | (7) | | | | | 587,500 | 1,175,000 | 1,762,500 | | 9/30/2023 | | |
| LTR 2021-03 | | (5) | | | | | | 168,000 | 168,000 | | 9/30/2023 | | |
Notes
(1) TVA does not have any equity securities and therefore has no equity-based awards.
(2) Threshold, Target, and Maximum represent amounts that could be earned by a Named Executive Officeran NEO based on performance during the applicable performance cycle. Threshold, Target, and Maximum targets for EAIP ELTIP, and LTIP are 50 percent, 100 percent, and 150 percent.
(3) Target incentive opportunities as a percentage of salaries were as follows: Mr. Johnson,Lyash, 150 percent; Mr. Thomas, 80 percent; Mr. Grimes, 80Rausch, 70 percent; Mr. Skaggs, 80Fountain, 70 percent; Mr. Moul, 70 percent; and Ms. Quirk, 70Mr. Skaggs, 80 percent. Additionally, a corporate multiplier ranging between 0.00 and 1.00 may be applied which can reduce the award to $0. An individual performance multiplier of up to 125150 percent may also be applied which may increase the award to 187.5225 percent of target. Actual EAIP awards earned for performance in 20172021 are reported for each of the Named Executive OfficersNEOs under the “Non-Equity"Non-Equity Incentive Plan Compensation”Compensation" column in the Summary Compensation Table. See Compensation Discussion and Analysis for a discussion of how each award was determined.
(4) Target Mr. Thomas and Mr. Fountain's target incentive opportunities forare prorated based on the three-yearnumber of days worked in each position during the performance cycle endedcycle. Mr. Moul did not work a full year, and his target incentive opportunity is prorated based on the numbers of days worked in the performance cycle.
(4) Mr. Lyash's LTP award was granted October 1, 2019, and vested September 30, 2017,2021. Mr. Moul's LTP award was granted as a percentagepart of salary are as follows: Mr. Johnson, 175 percent; Mr. Thomas, 120 percent; Mr. Grimes, 110 percent; Mr. Skaggs, 90 percent;his employment offer and Ms. Quirk, 120 percent. ELTIP performance measures forvested September 30, 2021. All other LTP awards were granted October 1, 2018, and vested September 30, 2021. At the end of the performance cycle were Wholesale Rate Excluding Fuel, Load Not Served, and External Measures. Actual ELTIP awards earned forperiod, TVA's LTIP Scorecard was applied to the performance cycle ended on September 30, 2017,grants in order to determine award payouts. Award payouts are reported for each of the Named Executive OfficersNEOs under the “Non-Equity"Non-Equity Incentive Plan Compensation”Compensation" column in the Summary Compensation Table. See Compensation Discussion and Analysis for a discussion of how each award was determined.Mr. Fountain did not participate in the 2019-2021 LTP program.
(5) All LTR awards will be paid in a lump sum within two months of the September 30th vesting date. The awards will be paid in cash after deducting applicable federal, state, and local withholding taxes. In the case of death, the beneficiary will be paid as soon as administratively practicable but in no event later than the last day of the second full calendar month following the participant’sparticipant's death. Disability awards will be paid as soon as administratively practicable but in no event later than the last day of the second full calendar month following the participant’sparticipant's separation from service due to disability. Actual LTR awards earned in 20172021 are reported for each of the Named Executive OfficersNEOs under the "Non-Equity Incentive Plan Compensation" column in the Summary Compensation Table.
(6) Reflects the maximum Mr. Fountain's LTP award amount Mr. Johnson was eligible to receive under a performance incentive arrangement ("PIA") described in Compensation Discussion and Analysis — Executive Compensation Program Components — Considerations Specific to Mr. Johnson. The actual award to be paid to Mr. Johnson is reported under the "Non-Equity Incentive Plan Compensation" column in the Summary Compensation Table.
(7) LTP awards were granted October 1, 2015,as part of his employment offer and will vest September 30, 2018.2022. Mr. Moul's LTP award was granted as part of his employment offer and will vest September 30, 2022. All other LTP awards were granted effective October 1, 2019 and will vest September 30, 2022. At the end of the performance period, TVA's Long-Term Incentive PlanLTIP Scorecard will be applied to the grants in order to determine award payouts. The final award may be adjusted by the TVA Board based on the evaluation of the participant's individual achievements, peer group comparisons, and performance results over the performance cycle.
(8)(7) Mr. Moul's LTP awards wereaward was granted October 1, 2016,as part of his employment offer and will vest September 30, 2019.2023. All other LTP awards were originally granted October 1, 2020, and will vest September 30, 2023. Effective March 5, 2021, Mr. Fountain was awarded a prorated 2021-2023 LTP grant of $562,500, which will vest on September 30, 2023, and replaced the 2021-2023 LTP grant of $375,000 made on October 1, 2020. In addition, effective June 7, 2021, Mr. Thomas was awarded a prorated 2021-2023 LTP grant of $1,039,000, which will vest on September 30, 2023, and replaced the 2021-2023 LTP grant of $1,000,000 made on October 1, 2020. At the end of the performance period, TVA's Long-Term Incentive PlanLTIP Scorecard will be applied to the grants in order to determine award payouts. The final award may be adjusted by the TVA Board based on the evaluation of the participant's individual achievements, peer group comparisons, and performance results over the performance cycle.
(8) Reflects prorated amount of 3/36th of the target grant amount of $785,000 for the 2019-2021 LTP performance cycle.
(9) AmountReflects prorated based onamount of 3/36th of the numberLTR grant of months participating in$785,000 for the 2019-2021 retention cycle.
(10) Reflects prorated amount of 15/36th of the LTR grant of $785,000 for the 2020-2022 retention cycle.
(11) Reflects prorated amount of 27/36th of the LTR grant of $785,000 for the 2021-2023 retention cycle.
(12) Reflects prorated amount of 15/36th of the target grant amount of $785,000 for the 2020-2022 LTP performance period. Ms. Quirk participated in 32 outcycle.
(13) Reflects prorated amount of 36 months in27/36th of the target grant amount of $785,000 for the 2021-2023 LTP performance period as a result of her hire date.cycle.
Long-Term Retention Arrangements218
The following table summarizes the LTDCP, LTRIP, and RIA arrangements with the NEOs. See also the Nonqualified Deferred Compensation Table below for additional information regarding the amounts credited under LTDCP agreements and the Grants of Plan-Based Awards Table for information regarding LTR grants. |
| | | | |
Long-Term Retention Agreements |
Name | Plan | Amount | Date of Grant or Credit | Vesting Date |
| | | | |
William D. Johnson | LTDCP | $300,000(1)
| October 1, 2014 | September 30, 2015 |
| LTRIP | $450,000(2)
| November 10, 2014 | December 31, 2016 |
| | | | |
John M. Thomas, III | LTDCP | $200,000(3)
| March 1, 2014 | December 31, 2014 |
| RIA | $200,000(4)
| January 1, 2015 | December 31, 2015 |
| LTRIP | $200,000(2)
| January 1, 2015 | December 31, 2016 |
| LTRIP | $200,000(2)
| January 1, 2015 | December 31, 2017 |
| | | | |
Joseph P. Grimes, Jr. | LTDCP | $250,000(5)
| September 1, 2013 | December 31, 2015 |
| LTDCP | $150,000(5)
| January 1, 2014 | December 31, 2015 |
| LTDCP | $150,000(5)
| January 1, 2015 | December 31, 2015 |
| LTRIP | $150,000(2)
| June 1, 2014 | December 31, 2016 |
| LTRIP | $150,000(2)
| January 1, 2015 | December 31, 2017 |
| | | | |
Michael D. Skaggs | LTDCP | $50,000(6)
| March 1, 2013 | December 31, 2016 |
| LTDCP | $50,000(6)
| January 1, 2014 | December 31, 2016 |
| LTDCP | $150,000(6)
| January 1, 2015 | December 31, 2016 |
| LTDCP | $150,000(6)
| January 1, 2016 | December 31, 2016 |
| LTRIP | $150,000(2)
| January 1, 2015 | December 31, 2017 |
| | | | |
Sherry A. Quirk | LTRIP | $150,000(2)
| February 2, 2015 | December 31, 2017 |
| | | | |
Notes
(1) Each credit, and earnings on such credit, were distributed to Mr. Johnson in a lump sum at the time of vesting.
(2) All LTRIP awards shall be paid in a lump sum as soon as practical following the earliest to occur: (a) the normal vesting date, (b) the participant’s death, (c) the participant’s disability, or (d) the participant’s involuntary termination from TVA for reason other than for cause, but in no event shall such payment be made later
than March 15 of the calendar year following the vesting date. The award shall be paid in cash after deducting the applicable federal, state, and local withholding taxes.
(3) The LTDCP credit and earnings on the credit were paid out in a lump sum upon vesting.
(4) TVA entered into a retention incentive arrangement with Mr. Thomas as of January 1, 2015. Under this arrangement, Mr. Thomas was eligible to receive $200,000 as long as he remained employed with TVA on December 31, 2015, performed all duties in a highly effective manner, and maintained satisfactory performance through the end of the retention period. These conditions were satisfied, and the retention incentive award was paid to Mr. Thomas within 30 days following the end of the retention period.
(5) Mr. Grimes vested in these credits on December 31, 2015. All vested credits, and earnings on such credits, will be distributed to him in a lump sum following his separation from service with TVA.
(6) Mr. Skaggs vested in these credits on December 31, 2016. All vested credits, and earnings on such credits, will be distributed to him in ten annual installments following his separation from service with TVA.
Retirement and Pension Plans
The table below provides the actuarial present value of the Named Executive Officers'NEOs' accumulated benefits, including the number of years of credited service, under TVA's retirement and pension plans as of September 30, 2017,2021, determined using a methodology and interest rate and mortality rate assumptions consistent with those used in the financial statements in this Annual Report, set forth in Note 20.22 —Benefit Plans.
|
| | | | | | | | |
Pension Benefits Table |
Name | Plan Name | Number of Years of Credited Service(1) (#) | | Present Value of Accumulated Benefit ($) | | Payments During Last Year ($) |
| William D. Johnson | Qualified Plan – CBBS | 4.750 | (2) | 74,952 |
| | — |
|
| | Non-Qualified – SERP Tier 1 | 10.750 | (2) | 6,577,807 |
| | — |
|
| John M. Thomas, III | Qualified Plan – CBBS | 11.833 | | 289,640 |
| | — |
|
| | Non-Qualified – SERP Tier 1 | 11.833 | | 2,526,473 |
| | — |
|
| Joseph P. Grimes, Jr. | Qualified Plan – CBBS | 4.083 | | 58,798 |
| | — |
|
| | Non-Qualified – SERP Tier 1 | 4.083 | | 881,404 |
| | — |
|
| Michael D. Skaggs | Qualified Plan – CBBS | 23.583 | | 576,342 |
| | — |
|
| | Non-Qualified – SERP Tier 1 | 23.583 | | 4,142,526 |
| | — |
|
| Sherry A. Quirk | Qualified Plan – EABS | 2.583 | | — |
| (3) | — |
|
| | Non-Qualified – SERP Tier 1 | 2.583 | | 138,629 |
| | — |
|
| | | | | | | | | | | | | | | | | | | | |
| Name | Plan Name | Number of Years of Credited Service(1) | | Present Value of Accumulated Benefit | | Payments During Last Year |
| Jeffrey J. Lyash | TVARS | N/A | | N/A | (3) | $ | — | |
| SERP Tier 1 | 12.417 | (2) | $ | 10,352,820 | | | — | |
| John M. Thomas, III | TVARS | 15.833 | | 429,601 | | | — | |
| SERP Tier 1 | 15.833 | | 5,384,711 | | | — | |
| Timothy Rausch | TVARS | N/A | | N/A | (3) | — | |
| SERP Tier 1 | 2.917 | | 417,107 | | | — | |
| David Fountain | TVARS | N/A | | N/A | (3) | — | |
| SERP Tier 1 | 1.333 | | 4,167 | | | — | |
| Donald Moul | TVARS | N/A | | N/A | (3) | — | |
| SERP Tier 1 | 0.250 | | — | | | — | |
| Michael D. Skaggs | TVARS | 27.583 | | 814,475 | | | — | |
| SERP Tier 1 | 24.000 | (4) | 9,075,757 | | | — | |
Notes
(1) Limited to 24 years when determining supplemental benefits available under SERP Tier 1, described below.
(2) Mr. JohnsonLyash was granted five years of credited service for calculating his SERP benefit. In the event of involuntary termination except for cause prior to five years of actual service, the vesting requirement will be waived, and he will be entitled to the additional five years of granted credited service plus his actual years of service for calculating his SERP benefit. In the event of termination for cause or voluntary termination for any reason prior to five years of actual service, the vesting requirement will be waived and his SERP benefit will be calculated based on a total of five years of credited service. After five years of actual service with TVA, he will be granted five additional years of credited service for pre-TVA employment if he remains employed with TVA for at least five years and satisfies the minimum five-year vesting requirement, and the offset for prior employer pension benefits associated with the additional fivea total of 15 years of credited service will be waived. In addition,for calculating his SERP benefit. As of September 30, 2021, Mr. Lyash had 2.417 years of service. The present value of the offset for benefits provided under TVA's definedaccumulated SERP benefit plan will be calculated based onwith 7.417 years of credited services is $6,156,339. The present value of the accumulated SERP benefit he would be eligible to receive as a participant in the CBBS taking into account the additionalwith 12.417 years of credited service being used for SERP benefit calculation purposes. In December 2016, the TVA Board approved amendments tois $10,352,820.
(3) Mr. Johnson's compensation arrangements that provide, among other things, that ifLyash, Mr. Johnson remains with TVA through calendar year 2018, his SERP benefit will be based on 12 years of credited service (six credited yearsRausch, Mr. Fountain, and six actual years). As of September 30, 2017, the present value of the SERP benefit was $6,577,807. Without the additional years of credited service, the present value of Mr. Johnson's accumulated benefit would be $2,936,103.
(3) Ms. Quirk isMoul are not eligible to participate in the TVARS Pension Plan since she wasthey were hired by TVA after June 30, 2014.
(4) Mr. Skaggs has reached the 24-year service cap allowed under the SERP.
Qualified Retirement Plans
TVA sponsors a qualified defined benefit plan (“pension plan”) and a qualified defined contribution plan (“401(k) plan”), which are administered by the TVA Retirement System ("TVARS"). The retirement benefits for which employees are eligible and receive under the TVARS pension plan and 401(k) plan depend on the employee’semployee's hire date, and years of service, and individual elections, as follows:
•Employees who were first hired prior to January 1, 1996, receive (i) a traditional pension benefit calculated based on the employee’semployee's creditable service, the employee’semployee's average monthly salary for the highest three consecutive years of eligible compensation, and a pension factor based on the employee’semployee's age and years of service, less a Social Security offset, and (ii) 401(k) plan matching contributions from TVA. The 401(k) plan matching contribution is $0.25 on every dollar contributed by the employee up to six percent of eligible compensation, for a maximum matching contribution of 1.5 percent of eligible compensation. None of the Named Executive Officers isNEOs are in this group.
•Employees who were first hired prior to January 1, 1996, and who elected to switch pension structures from traditional to cash balance, receive (i) a cash balance pension benefit calculated based on (a) pay-based credits and interest that accrue over time in the employee’semployee's account and (b) the employee’semployee's age at the time of retirement, and (ii) 401(k) plan matching contributions from TVA. The monthly pay credits are equal to 6six percent of eligible compensation, and monthly interest is credited at an annual interest rate equal to the change in the CPI-U plus 3three percent (with a minimum of 6six percent and maximum of 10 percent). The interest rate during 20172021 was 6six percent. The 401(k) plan matching contribution is $0.75 on every dollar contributed by the employee up to six percent of eligible compensation, for a maximum matching contribution of 4.5 percent of eligible compensation. Mr. Skaggs is in this group.
•Employees who were first hired on or after January 1, 1996, and who had 10 or more years of service as of October 1, 2016, receive (i) a cash balance pension benefit calculated based on (a) pay-based credits and interest that accrue over time in the employee’semployee's account and (b) the employee’semployee's age at the time of retirement, and (ii) 401(k) plan non-elective and matching contributions from TVA. The monthly pay credits are equal to 3three percent of eligible compensation, and monthly interest is credited at an annual interest rate equal to the change in the CPI-U plus 2two percent (with a minimum of 54.75 percent and a
maximum of 6.56.25 percent). The interest rate during 20172021 was 54.75 percent. The 401(k) plan automatic, non-elective contribution is equal to 3three percent of eligible compensation, and the matching contribution is $0.75 on every dollar contributed by the employee up to six percent of eligible compensation, for a maximum matching contribution of 4.5 percent of eligible compensation. Mr. Thomas is in this group.
•Employees who were first hired on or after January 1, 1996, and who had less than 10 years of service as of October 1, 2016, receive (i) a cash balance pension benefit calculated based on pay-based credits and interest that accrue over time in the employee’semployee's account and the employee’semployee's age at the time of retirement, and (ii) 401(k) plan non-elective and matching contributions from TVA. As of October 1, 2016, the cash balance accounts of these employees receive no additional pay-based credits; however, the accounts continue to receive monthly interest credits at an annual interest rate equal to the change in the CPI-U plus 2two percent (with a minimum of 54.75 percent and a maximum of 6.56.25 percent). The interest rate during 20172021 was 54.75 percent. The 401(k) plan automatic, non-elective contribution is equal to 6six percent of eligible compensation, and the matching contribution is dollar-for-dollar on employee contributions up to 6six percent of eligible compensation, for a maximum matching contribution of six percent of eligible compensation. Mr. Johnson and Mr. GrimesNone of the NEOs are in this group.
•Employees who were hired prior to July 1, 2014, and who elected to waive their cash balance retirement benefit and transfer their cash balance account to the 401(k) plan effective October 1, 2018, receive a retirement benefit in the 401(k) plan only. The 401(k) plan is an automatic, non-elective contribution that is equal to six percent of eligible compensation, and the matching contribution is dollar-for-dollar on employee contributions up to six percent of the eligible compensation, for a maximum matching contribution of six percent of eligible compensation. None of the NEOs are in this group.
•Employees who were first hired on or after July 1, 2014 (or who arewere rehired and were either previously not vested in the pension plan or cashed out their pension benefit) receive a retirement benefit in the 401(k) plan only. The 401(k) plan automatic, non-elective contribution is equal to 4.5 percent of eligible compensation, and the matching contribution is $0.75 on every dollar contributed by the employee up to six percent of eligible compensation, for a maximum matching contribution of 4.5 percent of eligible compensation. Ms. Quirk isMr. Lyash, Mr. Rausch, Mr. Fountain, and Mr. Moul are in this group.
Cash Balance Pension Plan. For Named Executive OfficersNEOs who are eligible for retirement benefits under the pension plan, which includes Mr. Johnson, Mr. Thomas Mr. Skaggs and Mr. Grimes,Skaggs, eligible compensation is defined as annual salary only for benefit calculation purposes and is shown under the column titled “Salary”"Salary" in the Summary Compensation Table. The eligible compensation in 20172021 could not exceed $265,000$285,000 pursuant to the IRS annual compensation limit applicable to qualified plans. Employees with cash balance benefits who have at least 5five years of cash balance service are eligible at retirement or termination of employment to receive an immediate benefit in the form of a monthly pension with survivor benefit options or in a lump-sum payment with cash out or rollover options. The pension plan does not provide for early retirement benefits to any Named Executive OfficerNEO or any other employee eligible for cash balance benefits.
401(k) Plan. All employees eligible to participate in the 401(k) plan, including the Named Executive Officers,NEOs, may elect to contribute to the 401(k) plan on a before-tax, Roth, and/or after-tax basis. For purposes of matching and non-elective contributions from TVA to the 401(k) accounts of the Named Executive Officers,NEOs, eligible compensation is defined as annual salary only for benefit calculation purposes and is shown under the column titled “Salary”"Salary" in the Summary Compensation Table. The eligible compensation in 20172021 could not exceed $265,000$285,000 pursuant to the IRS annual compensation limit applicable to qualified plans. Any participant in the 401(k) plan must have 3three years of TVA service to be vested in matching and non-elective contributions from TVA.
Supplemental Executive Retirement Plan
All NEOs are participants in the SERP. The SERP is a non-qualified defined benefit pension plan similar to those typically found in other companies in TVA's peer group and is provided to a limited number of executives, including the Named Executive Officers.NEOs. TVA's SERP was created to recruit and retain key executives. The plan is designed to provide a competitive level of retirement benefits in excess of the limitations on contributions and benefits imposed by TVA's qualified defined benefit plan and Internal Revenue Code Section 415 limits on qualified retirement plans.
The SERP provides two distinct levels of participation, Tier 1 and Tier 2. Each participant is assigned to one of the two tiers at the time he or she is approved to participate in the SERP. The level of participation ("Tier") defines the level of retirement benefits under the SERP at the time of retirement.
Under the SERP, normal retirement eligibility is age 62 with five years of vesting service. No vested and accrued benefits are payable prior to age 55, and benefits are reduced for retirements prior to age 62. The level of reduction in benefits for retirements prior to age 62 depends on whether a participant's termination is “approved”"approved" or “unapproved.”"unapproved." In the event of an approved termination of TVA employment, any vested and accrued benefits are reduced by 5/12 percent for each month that the date of benefit commencement precedes the participant's 62nd birthday, up to a maximum reduction of 35 percent. In the event of an unapproved termination of TVA employment, the participant's accrued benefits are first subject to a reduced percentage of vesting if the participant's years of service are between five and ten.10. At five years of vesting service, the vested percentage of retirement benefits is 50 percent and increases thereafter by 10 percent for each full additional year of service, reaching 100 percent vesting for ten10 or more years of vesting service. Thereafter, any vested and accrued benefits are reduced by 10/12
percent for each month that the date of benefit commencement precedes the participant's 62nd birthday up to a maximum reduction of 70 percent.
For purposes of the SERP, an “approved”"approved" termination means termination of employment with TVA due to (i) retirement on or after the participant's 62nd birthday, (ii) retirement on or after attainment of actual age 55, if such retirement has the approval of the TVA Board or its delegate, (iii) death in service as an employee, (iv) disability (as defined under the Rules and Regulations of the TVA Retirement System)TVARS) as determined by the Retirement Committee, or (v) any other circumstance approved by the TVA Board or its delegate. For purposes of the SERP, an “unapproved”"unapproved" termination means a termination of employment with TVA when such termination does not constitute an “approved”"approved" termination as defined in the preceding sentence.
SERP Tier 1. All of the Named Executive Officers are participants in Tier 1. The Tier 1 structure is designed to replace 60 percent of the amount of a participant's compensation at the time the participant reaches age 62 and has accrued 24 years of TVA service.
Tier 1 benefits are based on a participant's highest average compensation during three consecutive SERP years and a pension multiple of 2.5 percent for each year of credited service up to a maximum of 24 years. Compensation is defined as salary and EAIP for benefit calculation purposes. Tier 1 benefits are offset by Social Security benefits, benefits provided under TVA's qualified defined benefit pension plan, and prior employer pension benefits when applicable.
SERP Tier 2. The purpose of this restoration plan is to adjust qualified plan benefits to executives when benefits are lost due to IRS limits. Pension benefits are based on a participant's average compensation over three consecutive fiscal years and a pension multiplier of 1.3 percent for each year of service. For benefit calculation, pension includes salary and annual incentives.
Nonqualified Deferred Compensation
The following table provides information regarding deferred contributions, earnings, and balances for each of the Named Executive Officers.NEOs. The amounts reported under this table do not represent compensation in addition to the compensation that was earned in 20172021 and already reported in the Summary Compensation Table, but rather the amounts of compensation earned by the Named Executive OfficersNEOs in 20172021 or prior years that were or have been deferred.
NONQUALIFIED DEFERRED COMPENSATION TABLE |
| | | | | | | | | | | | | |
| Nonqualified Deferred Compensation Table | |
Name | Executive Contributions in 2017 ($) | Registrant Contributions in 2017 ($) | | Aggregate Earnings in 2017(1) ($) | Aggregate Withdrawals/ Distributions ($) | | Aggregate Balance at September 30 2017(2) ($) | |
| William D. Johnson | — |
| — |
| | — |
| — |
| | — |
| |
| John M. Thomas, III | — |
| — |
| | — |
| — |
| | — |
| |
| Joseph P. Grimes, Jr. | — |
| — |
| | 39,800 |
| — |
| | 625,441 |
| |
| Michael D. Skaggs | — |
| — |
| | 322,480 |
| — |
| | 4,502,305 |
| |
| Sherry A. Quirk | — |
| — |
| | — |
| — |
| | — |
| |
| | | | | | | | | | | | | | | | | | | | | | | | | | | | | | | | |
| Name | Executive
Contributions
in 2021 | | Registrant
Contributions
in 2021 | | Aggregate
Earnings in
2021 | | Aggregate
Withdrawals/
Distributions | | Aggregate
Balance at
September 30, 2021 | |
| Jeffrey J. Lyash | $ | — | | | $ | — | | | $ | — | | | $ | — | | | $ | — | | |
| John M. Thomas, III | — | | | — | | | — | | | — | | | — | | |
| Timothy Rausch | — | | | — | | | — | | | — | | | — | | |
| David Fountain | — | | | — | | | — | | | — | | | — | | |
| Donald Moul | — | | | — | | | — | | | — | | | | |
| Michael D. Skaggs | — | | | — | | | 694,097 | | (1) | — | | | 6,041,126 | | (2) |
Notes
(1) Includes vested earnings. Because none of the amounts isare above market or preferential earnings under SEC rules, none of these amounts are included in the Summary Compensation Table.
(2) Includes vested contributions and earnings. The following amounts included in$600,000 of this column also haveamount has been reported in the Summary Compensation Table as compensation for a prior fiscal year: Mr. Grimes, $300,000 and Mr. Skaggs, $600,000.year.
TVATVA's compensation plans may allow participants in the EAIP, ELTIP, the LTDCP, and the performance-based component of the LTIP to defer all or a portion of the compensation earned under thosethe plans and eligible for deferral underas defined by plan terms and IRS regulations. All deferrals are credited to each participant in a deferred compensation account, and the deferral amounts are then funded into a rabbi trust. Each participant may elect one or more investment options made available by TVA or allow some or all funds to accrue interest at the rate established by the beginning of each fiscal year equal to the composite rate of all Treasury issues. Participants may elect to change from either one notional investment option or the TVA interest bearing option to another at any time. Upon termination of employment, funds are distributed pursuant to elections made in accordance with applicable IRS regulations.
Participants in the EAIP, ELTIP, LTDCP, and LTIP, including the Named Executive Officers, were not allowed to elect to defer any portion of their awards received under the plans for 2017.
Executive Severance Plan
On February 10, 2021, TVA’s CEO established the TVA Executive Severance Plan (the “Severance Plan”), including the eligibility of TVA’s NEOs (other than the CEO) to participate in the Severance Plan. On February 11, 2021, the TVA Board approved the CEO’s participation in the Severance Plan as part of the overall market review of CEO compensation. The Severance Plan provides that if TVA terminates an NEO’s employment other than for Gross Misconduct (as defined below) or such participant terminates employment for Good Reason (as defined below), such participant will be eligible to receive the following benefits in addition to his or her accrued compensation:
•A lump sum severance payment equal to the applicable multiplier times the sum of the employee’s annual base salary and target annual incentive, and continued healthcare benefits for a number of complete or partial years equal to such multiplier. The applicable multiplier is 1.5 for the CEO and 1.0 for the other NEOs, or, if the qualifying separation occurs within 24 months following a Change in Control (as defined below) of TVA, then the applicable multiplier is 3.0 for the CEO and 2.0 for the other NEOs.
•Any earned but unpaid incentive payments, and a prorated annual incentive payment for the year of termination based on actual (or, if the qualifying separation occurs within 24 months following a Change in Control of TVA, based on target) achievement of performance goals.
•If the qualifying separation occurs within 24 months following a Change in Control of TVA, then a lump sum cash payment equal to the sum of (a) any LTIP performance awards the performance cycle of which is in progress on the participant's separation date, non-prorated and calculated based on target achievement of performance goals, and (b) any LTIP retention awards the retention cycle of which is in progress on the participant's separation date, non-prorated and calculated as if all such awards are fully vested.
•If the qualifying separation occurs within 24 months following a Change in Control of TVA, a waiver of the five-year vesting requirement set forth in Section 4.1(a) of the TVA Supplemental Executive Retirement Plan pursuant to its terms.
In order to receive severance benefits under the Severance Plan, participants must timely execute (and not revoke) a release of claims in favor of TVA and comply with all applicable post-separation restrictive covenants. The terms of the Severance Plan will supersede rights and obligations with respect to severance under existing agreements to which Severance Plan participants are a party.
Under the Severance Plan, a Change in Control shall be deemed to have occurred on the earliest of the following dates:
•the date when the United States ceases to have an ownership interest of at least fifty percent (50%) of TVA;
•the date one or more entities acquire (or have acquired during the 12-month period ending on the date of the most recent acquisition by such entity or entities) assets from TVA that have a total gross fair market value (without regard to any debt) equal to or more than thirty percent (30%) of the total gross fair market value of all of the assets of TVA immediately before such most recent acquisition;
•the date that a majority of the members of the TVA Board is no longer appointed and confirmed in accordance with the provisions of Section 2(a)(1) of the TVA Act;
•the date a complete liquidation or winding-up of TVA is consummated;
•the date that an entity such as an organization, board, commission, authority, department, or agency succeeds to the principal functions of, or powers and duties granted to, TVA; or
•the date of enactment or effectiveness of any applicable law, statute, rule, regulation, order, decree, ruling, or writ of a governmental or regulatory agency, entity, or official of competent jurisdiction that materially limits the TVA Board’s authority to establish or renew a participant’s total direct compensation.
Under the Severance Plan, Good Reason shall mean the occurrence of any of the following:
•a material adverse change in the participant’s authority, duties, or responsibilities (excluding during any period of participant’s physical or mental incapacity) with respect to his or her employment with TVA without the participant’s prior written consent;
•a material reduction in the participant’s base salary without the participant’s prior written consent (other than any reduction applicable to management employees generally);
•an actual change in the participant’s principal work location by more than 50 miles and more than 50 miles from the participant’s principal place of abode as of the date of such change in job location without the participant’s prior written consent; or
•a material breach by TVA of any term or provision of the Severance Plan without the participant’s prior written consent.
A participant may be considered to have Good Reason to terminate employment for purposes of the Severance Plan only if the participant provides written notice to TVA of termination within 30 days of the occurrence of the applicable event(s) or, if later, within 30 days of the date the participant has knowledge that such event(s) occurred. An event constituting Good Reason shall no longer constitute Good Reason if the circumstances described in the Good Reason notice are cured by TVA within 30 days following receipt of the Good Reason notice.
Under the Severance Plan, Gross Misconduct shall mean any of the following:
•misconduct involving dishonesty, fraud, or gross negligence that directly results in significant economic or reputational harm to TVA;
•insubordination, intentional neglect of duties, or refusal to cooperate with investigations of TVA’s business practices;
•conviction of a crime amounting to a felony under the laws of the United States or any of the several states, or a crime of moral turpitude;
•a significant violation of TVA’s Code of Ethics or Code of Conduct; or
•disclosure without authorization of proprietary or confidential information of TVA.
Potential Payments on Account of Retirement/Resignation, Retirement, Termination without Cause, Termination with Cause, Death, or Disability
The tables below show certain potential payments that would have been made to each Named Executive OfficerNEO if his or her employment had been terminated on September 30, 2017,2021, under various scenarios. All of the Named Executive OfficersNEOs would also be entitled to payments from plans generally available to TVA employees under the specific circumstances of termination of employment, including the health and welfare and pension plans and amounts in the 401(k) plan.
| | | William D. Johnson | Retirement/Resignation | | Termination without Cause | | Termination with Cause | |
Death
| | Disability | | |
Severance Agreement(1) | $ | — |
| | $ | 2,487,500 |
| | $ | — |
| | $ | — |
| | $ | — |
| | |
| SERP | $ | 3,015,708 |
| (2) | $ | 6,555,775 |
| (3) | $ | 3,015,708 |
| (2) | $ | 6,555,775 |
| (3) (4) | $ | 6,555,775 |
| (3) | |
| LTRIP | $ | — |
| | $ | — |
| | $ | — |
| | $ | — |
| | $ | — |
| | |
| Jeffrey J. Lyash | | Jeffrey J. Lyash | Resignation(1) | | Retirement | | Termination without Cause or Resignation for Good Reason (Non-CIC)(2) | | Termination without Cause or Resignation for Good Reason (CIC)(2) | | Termination
with Cause | | Death/Disability | | |
| Severance Agreement | | Severance Agreement | $ | — | | | $ | — | | | $ | 4,125,000 | | | $ | 8,250,000 | | | $ | — | | | $ | — | | | |
SERP(3) | | SERP(3) | 4,046,300 | | | 4,046,300 | | | 6,156,339 | | | 6,156,339 | | | 4,046,300 | | | 6,156,339 | | (4) | |
| EAIP | | EAIP | 2,928,750 | | | 2,928,750 | | | 2,928,750 | | | 2,928,750 | | | 2,928,750 | | | 2,928,750 | | | |
Deferred Cash Recruitment/Relocation Incentive(5) | | Deferred Cash Recruitment/Relocation Incentive(5) | 292,000 | | | 292,000 | | | 292,000 | | | 292,000 | | | 292,000 | | | 292,000 | | | |
| LTR | $ | 391,366 |
| | $ | 391,366 |
| | $ | 391,366 |
| | $ | 685,997 |
| (5) | $ | 685,997 |
| (6) | LTR | 754,300 | | | 754,300 | | | 754,300 | | | 1,924,900 | | | 754,300 | | | 1,270,217 | | (6) (7) | |
| LTP | $ | — |
| | $ | — |
| | $ | — |
| | $ | 2,321,667 |
| (7) | $ | 2,321,667 |
| (8) | LTP | 2,671,680 | | | 2,671,680 | | (8) | 2,671,680 | | | 7,926,780 | | | 2,671,680 | | | 5,203,713 | | (9) (10) | |
| Deferred Compensation | $ | — |
| | $ | — |
| | $ | — |
| | $ | — |
| | $ | — |
| | Deferred Compensation | — | | | — | | | — | | | — | | | — | | | — | | | |
| Total Value of Potential Payments | $ | 3,407,074 |
| | $ | 9,434,641 |
| | $ | 3,407,074 |
| | $ | 9,563,439 |
| | $ | 9,563,439 |
| | Total Value of Potential Payments | $ | 10,693,030 | | | $ | 10,693,030 | | | $ | 16,928,069 | | | $ | 27,478,769 | | | $ | 10,693,030 | | | $ | 15,851,019 | | | |
Notes
(1) The Resignation column covers resignations that do not qualify as resignations for Good Reason under TVA's Severance Plan. See Executive Compensation Tables and Narrative Disclosures - Executive Severance Plan for definition of Good Reason.
(2) The Severance Plan provides that if TVA terminates an NEO's employment other than for Gross Misconduct or such participant terminates employment for Good Reason, such participant will be eligible to receive certain benefits in addition to his or her accrued compensation. The amount of additional benefits will vary depending on whether the qualifying separation from service occurs within 24 months following a Change in Control. See Executive Compensation Tables and Narrative Disclosures - Executive Severance Plan for definitions of Gross Misconduct, Good Reason, and Change in Control and for a discussion of the benefits provided to NEOs under the Severance Plan.
(3)In October 2012,February 2019, TVA entered into an arrangement with Mr. JohnsonLyash that provides a lump-sum payment equal to one year's annual salary and one year's executive annual incentive based on 100 percent target payout inthat at the commencement of his employment with TVA, he will be granted five years of credited service for calculating his SERP benefit. In the event TVA terminates his employment without cause. For purposes of this provision,involuntary termination without cause includes constructive termination which will be deemed to occur if Mr. Johnson terminates his employment because he is asked to take a new position with TVA with a material reduction in level of authority, duties, compensation, and benefits. This provision will not apply, and no lump-sum payment will be made, in the event Mr. Johnson voluntarily terminates his employment or voluntarily retires, or his employment is terminated “for cause” as defined in the agreement.
(2) In December 2016, the Board approved amendments to Mr. Johnson’s compensation arrangements that, among other things, provide that in the event that Mr. Johnson retires or is terminatedexcept for cause prior to five years of actual service, the five-year vesting requirement will be waived, and he will be entitled to a SERP benefit base onthe additional five years of granted credited service.
(3) The December 2016 amendments to Mr. Johnson’s compensation arrangements provide that inservice plus his actual years of service for calculating his SERP benefit. In the event that Mr. Johnson is terminated withoutof termination for cause or voluntary termination for any reason prior to five years of actual service, the five-year vesting requirement will be waived and hehis SERP benefit will be entitled to a SERP benefitcalculated based on tena total of five years of credited service.
(4) In the event of death while employed by TVA, the beneficiary will receive a lump sum payment equal to the actuarial equivalent of the benefit that would have been paid had the participant terminated employment on the date of death and elected a joint and 50 percent survivor benefit. Survivor will receive 50%50 percent of the reported value.
(5) Mr. Lyash received a deferred cash recruitment/relocation Incentive of $1,784,000 upon employment, and $292,000 of this amount vested on September 30, 2021.
(6) The LTIP provides that in the event of the death of a participant, the participant’sparticipant's beneficiary is entitled to any portion of a LTR award that had vested at the time of the participant’sparticipant's death but not been paid as well as anya prorated portion of aany LTR awardgrant that would havehad not vested at the endtime of the fiscal year during which the participant died or at the end of either of the two subsequent fiscal years,participant's separation from service, provided that the LTR award for each such fiscal yearvesting period will be prorated based on the number of whole months the participant was employed by TVA during the fiscal yearvesting period in which the participant separated from service as compared to (a) 12 months for the vesting period that includes the day that the participant separated from service, (b) 24 months for the vesting period that immediately follows the vesting period during which he or she died.the participant separated from service, and (c) 36 months for the second vesting period that follows the vesting period during which the participant separated from service.
(6)(7) The LTIP provides that if a participant separates from service due to a disability, the participant is entitled to any portion of a LTR award that had vested at the time of the separation from service but not been paid as well as anya prorated portion of aany LTR awardgrant that would havehad not vested at the endtime of the fiscal year during which the participant separatedparticipant's separation from service, or at the end of either of the two subsequent fiscal years, provided that the LTR award for each such fiscal year will be prorated based on the number of whole months the participant was employed by TVA during the fiscal yearvesting period in which the participant separated from service as compared to (a) 12 months for the vesting period that includes the day that the participant separated from service, (b) 24 months for the vesting period that immediately follows the vesting period during which he or shethe participant separated from service, and (c) 36 months for the second vesting period that follows the vesting period during which the participant separated from service.
(7)(8) Is not eligible to retire based on definition in the LTIP plan.
(9) The LTIP provides that in the event of the death of a participant, the participant’sparticipant's beneficiary is entitled to (1) any portion of a LTP award that had vested at the time of the participant’sparticipant's death but not been paid and (2) any LTP awards that had not vested at the time of the participant’sparticipant's death and that covered a performance cycle for which the participant had received a LTP grant, provided that the amount of any such LTP award (a) will be calculated assuming that the percent of opportunity achieved is 100 percent of target and (b) will be prorated based on the number of whole months the participant was participating in the plan during the applicable performance cycle.
(8)(10) The LTIP provides that if a participant separates from service due to a disability, the participant is entitled to (1) any portion of a LTP award that had vested at the time of the participant’sparticipant's separation from service but not been paid and (2) any LTP awards that had not vested at the time of the participant’sparticipant's separation from service and that covered a performance cycle for which the participant had received a LTP grant, provided that the amount of any such LTP award (a) will be calculated assuming that the percent of opportunity achieved is 100 percent of target and (b) will be prorated based on the number of whole months the participant was employed by TVA during the applicable performance cycle.
| | John M. Thomas, III | Retirement/Resignation | | Termination without Cause | | Termination with Cause | | Death | |
Disability | | John M. Thomas, III | Resignation(1) | | Retirement | | Termination without Cause or Resignation for Good Reason (Non-CIC)(2) | | Termination without Cause or Resignation for Good Reason (CIC)(2) | | Termination with Cause | | Death/Disability | |
Severance Agreement(1) | $ | — |
| | $ | — |
| | $ | — |
| | $ | — |
| | $ | — |
| | Severance Agreement(1) | $ | — | | | $ | — | | | $ | 1,377,000 | | | $ | 2,754,000 | | | $ | — | | | $ | — | | |
| SERP | $ | 2,526,473 |
| (2) (3) (4) | $ | 2,526,473 |
| (2) (3) (4) | $ | 2,526,473 |
| (2) (3) (4) | $ | 2,526,473 |
| (2) (5) | $ | 2,526,473 |
| (2)(3) | SERP | 5,384,711 | | (3)(4)(5) | 5,384,711 | | (3) (4) (5) | 5,384,711 | | (3) (4) (5) | 5,384,711 | | (3) (4) (5) | 5,384,711 | | (3) (4) (5) | 5,384,711 | | (3) (4) (6) |
| LTRIP | $ | — |
| | $ | 200,000 |
| | $ | — |
| | $ | 200,000 |
| | $ | 200,000 |
| | |
| EAIP | | EAIP | 847,736 | | | 847,736 | | | 847,736 | | | 847,736 | | | 847,736 | | | 847,736 | | |
| LTR | $ | 150,000 |
| | $ | 150,000 |
| | $ | 150,000 |
| | $ | 263,889 |
| (6) | $ | 263,889 |
| (7) | LTR | 413,667 | | | 413,667 | | | 413,667 | | | 847,667 | | | 413,667 | | | 606,167 | | (7) (8) |
| LTP | $ | — |
| | $ | — |
| | $ | — |
| | $ | 726,667 |
| (8) | $ | 726,667 |
| (9) | LTP | 1,161,600 | | | 2,161,267 | | (9) | 2,161,267 | | | 3,180,600 | | | 1,161,600 | | | 2,161,267 | | (10) (11) |
| Deferred Compensation | $ | — |
| | $ | — |
| | $ | — |
| | $ | — |
| | $ | — |
| | Deferred Compensation | — | | | — | | | — | | | — | | | — | | | — | | |
| Total Value of Potential Payments | $ | 2,676,473 |
| | $ | 2,876,473 |
| | $ | 2,676,473 |
| | $ | 3,717,029 |
| | $ | 3,717,029 |
| | Total Value of Potential Payments | $ | 7,807,714 | | | $ | 8,807,381 | | | $ | 10,184,381 | | | $ | 13,014,714 | | | $ | 7,807,714 | | | $ | 8,999,881 | | |
| |
Notes
(1) Mr. Thomas does The Resignation column covers resignations that do not havequalify as resignations for Good Reason under TVA's Severance Plan. See Executive Compensation Tables and Narrative Disclosures - Executive SeverancePlan for definition of Good Reason.
(2) The Severance Plan provides that if TVA terminates an NEO's employment other than for Gross Misconduct or such participant terminates employment for Good Reason, such participant will be eligible to receive certain benefits in addition to his or her accrued compensation. The amount of additional benefits will vary depending on whether the qualifying separation from service occurs within 24 months following a severance agreement with TVA.Change in Control. See Executive Compensation Tables and Narrative Disclosures - Executive Severance Plan for definitions of Gross Misconduct, Good Reason, and Change in Control and for a discussion of the benefits provided to NEOs under the Severance Plan.
(2)(3) Represents the present value of the accumulated benefit.
(3)(4) Actual benefit would be paid in five annual installments beginning at age 55.
(4)(5) Assumes that the TVA Board or its delegate determines that the termination is an approved termination under SERP. See Executive Compensation Tables and Narrative Disclosures — Retirement and Pension Plans — Supplemental Executive Retirement Plan above for a discussion of approved and unapproved terminations under SERP.
(5)(6) In the event of death while employed by TVA, the beneficiary would receive a lump sum payment equal to the actuarial equivalent of the benefit that would have been paid had the participant terminated employment on the date of death and elected a joint and 50 percent survivor benefit. Survivor will receive 50%50 percent of the reported value.
(6)(7) The LTIP provides that in the event of the death of a participant, the participant’sparticipant's beneficiary is entitled to any portion of a LTR award that had vested at the time of the participant’sparticipant's death but not been paid as well as anya prorated portion of aany LTR awardgrant that would havehad not vested at the endtime of the fiscal year during which the participant died or at the end of either of the two subsequent fiscal years,participant's separation from service, provided that the LTR award for each such fiscal yearvesting period will be prorated based on the number of whole months the participant was employed by TVA during the fiscal yearvesting period in which the participant separated from service as compared to (a) 12 months for the vesting period that includes the day that the participant separated from service, (b) 24 months for the vesting period that immediately follows the vesting period during which he or she died.the participant separated from service, and (c) 36 months for the second vesting period that follows the vesting period during which the participant separated from service.
(7)(8) The LTIP provides that if a participant separates from service due to a disability, the participant is entitled to any portion of a LTR award that had vested at the time of the separation from service but not been paid as well as anya prorated portion of aany LTR awardgrant that would havehad not vested at the endtime of the fiscal year during which the participant separatedparticipant's separation from service, or at the end of either of the two subsequent fiscal years, provided that the LTR award for each such fiscal year will be prorated based on the number of whole months the participant was employed by TVA during the fiscal yearvesting period in which the participant separated from service as compared to (a) 12 months for the vesting period that includes the day that the participant separated from service, (b) 24 months for the vesting period that immediately follows the vesting period during which he or shethe participant separated from service, and (c) 36 months for the second vesting period that follows the vesting period during which the participant separated from service.
(8)(9) The LTIP provides that in the event of the retirement of a participant, the participant is entitled to (1) any LTP award that had vested at the time of the participant's separation from service but not been paid and (2) any LTP awards that had not vested at the time of the participant's separation from service and that covered a performance cycle for which the participant had received a LTP grant, provided that the amount of any such LTP award (a) will be calculated using the actual percent of opportunity achieved and (b) will be prorated based on the number of whole months the participant was employed by TVA during the applicable performance cycle. The amount included in the table assumes that the percent of opportunity achieved will be 100 percent of target for the performance cycles ending on September 30, 2022 and September 30, 2023.
(10) The LTIP provides that in the event of the death of a participant, the participant’sparticipant's beneficiary is entitled to (1) any portion of a LTP award that had vested at the time of the participant’sparticipant's death but not been paid and (2) any LTP awards that had not vested at the time of the participant’sparticipant's death and that covered a performance cycle for which the participant had received a LTP grant, provided that the amount of any such LTP award (a) will be calculated assuming that the percent of opportunity achieved is 100 percent of target and (b) will be prorated based on the number of whole months the participant was participating in the plan during the applicable performance cycle.
(9)(11) The LTIP provides that if a participant separates from service due to a disability, the participant is entitled to (1) any portion of a LTP award that had vested at the time of the participant’sparticipant's separation from service but not been paid and (2) any LTP awards that had not vested at the time of the participant’sparticipant's separation from service and that covered a performance cycle for which the participant had received a LTP grant, provided that the amount of any such LTP award (a) will be calculated assuming that the percent of opportunity achieved is 100 percent of target and (b) will be prorated based on the number of whole months the participant was employed by TVA during the applicable performance cycle.
| | | Joseph P. Grimes, Jr. | Retirement/Resignation | | Termination without Cause | | Termination with Cause | | Death | |
Disability | | |
Severance Agreement(1) | $ | — |
| | $ | 650,000 |
| | $ | — |
| | $ | — |
| | $ | — |
| | |
| Timothy Rausch | | Timothy Rausch | Resignation(1) | | Retirement | | Termination without Cause or Resignation for Good Reason (Non-CIC)(2) | | Termination without Cause or Resignation for Good Reason (CIC)(2) | | Termination with Cause | | Death/Disability | | |
| Severance Agreement | | Severance Agreement | $ | — | | | $ | — | | | $ | 937,836 | | | $ | 1,875,671 | | | $ | — | | | $ | — | | | |
| SERP | $ | — |
| (2) | $ | — |
| (2) | $ | — |
| (2) | $ | 881,404 |
| (3) (4) | $ | 881,404 |
| (3) | SERP | — | | (3) | — | | (3) | — | | (3) | 417,107 | | (4) | — | | (3) | 417,107 | | (5) (6) | |
| LTRIP | $ | — |
| | $ | 150,000 |
| | $ | — |
| | $ | 150,000 |
| | $ | 150,000 |
| | |
| EAIP | | EAIP | 575,776 | | | 575,776 | | | 575,776 | | | 575,776 | | | 575,776 | | | 575,776 | | | |
| LTR | $ | 173,333 |
| | $ | 173,333 |
| | $ | 173,333 |
| | $ | 303,333 |
| (5) | $ | 303,333 |
| (6) | LTR | 277,750 | | | 277,750 | | | 277,750 | | | 607,750 | | | 277,750 | | | 424,417 | | (8) (9) | |
| LTP | $ | — |
| | $ | — |
| | $ | — |
| | $ | 750,000 |
| (7) | $ | 750,000 |
| (8) | LTP | 533,610 | | | 533,610 | | (7) | 533,610 | | | 1,533,610 | | | 533,610 | | | 1,033,610 | | (10) (11) | |
Deferred Compensation(9) | $ | 625,441 |
| | $ | 625,441 |
| | $ | 625,441 |
| | $ | 625,441 |
| | $ | 625,441 |
| | |
| Deferred Compensation | | Deferred Compensation | — | | | — | | | — | | | — | | | — | | | — | | | |
| Total Value of Potential Payments | $ | 798,774 |
| | $ | 1,598,774 |
| | $ | 798,774 |
| | $ | 2,710,178 |
| | $ | 2,710,178 |
| | Total Value of Potential Payments | $ | 1,387,136 | | | $ | 1,387,136 | | | $ | 2,324,972 | | | $ | 5,009,914 | | | $ | 1,387,136 | | | $ | 2,450,910 | | | |
Notes
(1) In June 2013, TVA entered into an arrangement with Mr. Grimes The Resignation column covers resignations that do not qualify as resignations for Good Reason under TVA's Severance Plan. See Executive Compensation Tables and Narrative Disclosures - Executive SeverancePlan for definition of Good Reason.
(2) The Severance Plan provides a lump sum payment equal to one year's annual salary in the eventthat if TVA terminates Mr. Grimes'san NEO's employment without cause.other than for Gross Misconduct or such participant terminates employment for Good Reason, such participant will be eligible to receive certain benefits in addition to his or her accrued compensation. The amount of additional benefits will vary depending on whether the qualifying separation from service occurs within 24 months following a Change in Control. See Executive Compensation Tables and Narrative Disclosures - Executive Severance Plan for definitions of Gross Misconduct, Good Reason, and Change in Control and for a discussion of the benefits provided to NEOs under the Severance Plan.
(2)(3) The five-year vesting requirement has not been met.
(3)(4) The Severance Plan provides that the five-year vesting requirement set forth in Section 4.1(a) of the SERP will be waved pursuant to the terms of such section with respect to each participant whose termination date occurs within 24 months following a Change in Control.
(5) Represents the present value of the accumulated benefit.
(4)(6) In the event of death while employed by TVA, the beneficiary wouldwill receive a lump sum payment equal to the actuarial equivalent of the benefit that would have been paid had the participant terminated employment on the date of death and elected a joint and 50 percent survivor benefit. Survivor will receive 50%50 percent of the reported value.
(5)(7) Is not eligible to retire based on definition in the LTIP plan.
(8) The LTIP provides that in the event of the death of a participant, the participant’sparticipant's beneficiary is entitled to any portion of a LTR award that had vested at the time of the participant’sparticipant's death but not been paid as well as anya prorated portion of aany LTR awardgrant that would havehad not vested at the endtime of the fiscal year during which the participant died or at the end of either of the two subsequent fiscal years,participant's separation from service, provided that the LTR award for each such fiscal yearvesting period will be prorated based on the number of whole months the participant was employed by TVA during the fiscal yearvesting period in which the participant separated from service as compared to (a) 12 months for the vesting period that includes the day that the participant separated from service, (b) 24 months for the vesting period that immediately follows the vesting period during which he or she died.the participant separated from service, and (c) 36 months for the second vesting period that follows the vesting period during which the participant separated from service.
(6)(9) The LTIP provides that if a participant separates from service due to a disability, the participant is entitled to any portion of a LTR award that had vested at the time of the separation from service but not been paid as well as anya prorated portion of aany LTR awardgrant that would havehad not vested at the endtime of the fiscal year during which the participant separatedparticipant's separation from service, or at the end of either of the two subsequent fiscal years, provided that the LTR award for each such fiscal year will be prorated based on the number of whole months the participant was employed by TVA during the fiscal yearvesting period in which the participant separated from service as compared to (a) 12 months for the vesting period that includes the day that the participant separated from service, (b) 24 months for the vesting period that immediately follows the vesting period during which he or shethe participant separated from service, and (c) 36 months for the second vesting period that follows the vesting period during which the participant separated from service.
(7)(10) The LTIP provides that in the event of the death of a participant, the participant’sparticipant's beneficiary is entitled to (1) any portion of a LTP award that had vested at the time of the participant’sparticipant's death but not been paid and (2) any LTP awards that had not vested at the time of the participant’sparticipant's death and that covered a performance cycle for which the participant had received a LTP grant, provided that the amount of any such LTP award (a) will be calculated assuming that the percent of opportunity achieved is 100 percent of target and (b) will be prorated based on the number of whole months the participant was participating in the plan during the applicable performance cycle.
(8)(11) The LTIP provides that if a participant separates from service due to a disability, the participant is entitled to (1) any portion of a LTP award that had vested at the time of the participant’sparticipant's separation from service but not been paid and (2) any LTP awards that had not vested at the time of the participant’sparticipant's separation from service and that covered a performance cycle for which the participant had received a LTP grant, provided that the amount of any such LTP award (a) will be calculated assuming that the percent of opportunity achieved is 100 percent of target and (b) will be prorated based on the number of whole months the participant was employed by TVA during the applicable performance cycle.
(9) Amounts that Mr. Grimes earned in past years but elected to defer, which are payable pursuant to elections he made and applicable IRS rules.
| | | Michael D. Skaggs | Retirement/Resignation | | Termination without Cause | | Termination with Cause | | Death | |
Disability | | |
Severance Agreement(1) | $ | — |
| | $ | — |
| | $ | — |
| | $ | — |
| | $ | — |
| | |
| David Fountain | | David Fountain | Resignation(1) | | Retirement | | Termination without Cause or Resignation for Good Reason (Non-CIC)(2) | | Termination without Cause or Resignation for Good Reason (CIC)(2) | | Termination with Cause | | Death/Disability | |
| Severance Agreement | | Severance Agreement | $ | — | | | $ | — | | | $ | 918,000 | | | $ | 1,836,000 | | | $ | — | | | $ | — | | |
| SERP | $ | 4,142,526 |
| (2) (3) (4) | $ | 4,142,526 |
| (2) (3) (4) | $ | 4,142,526 |
| (2)
(3)
(4) | $ | 4,142,526 |
| (2) (5) | $ | 4,142,526 |
| (2) (3)
| SERP | — | | (3) | — | | (3) | — | | (3) | 4,167 | | (4) | — | | (3) | 4,167 | | (5) (6) |
| LTRIP | $ | — |
| | $ | 150,000 |
| | $ | — |
| | $ | 150,000 |
| | $ | 150,000 |
| | |
| EAIP | | EAIP | 461,663 | | | 461,663 | | | 461,663 | | | 461,663 | | | 461,663 | | | 461,663 | | |
| Deferred Cash Recruitment/Relocation Incentive | | Deferred Cash Recruitment/Relocation Incentive | — | | (7) | — | | (7) | — | | | — | | | — | | (7) | — | | |
| LTR | $ | 133,333 |
| | $ | 133,333 |
| | $ | 133,333 |
| | $ | 236,111 |
| (6)
| $ | 236,111 |
| (7)
| LTR | 105,500 | | | 105,500 | | | 105,500 | | | 316,500 | | | 105,500 | | | 193,417 | | (8) (9) |
| LTP | $ | — |
| | $ | — |
| | $ | — |
| | $ | 650,000 |
| (8) | $ | 650,000 |
| (9) | LTP | — | | | — | | (10) | — | | | 937,500 | | | — | | | 437,500 | | (11) (12) |
Deferred Compensation(10) | $ | 4,502,305 |
| | $ | 4,502,305 |
| | $ | 4,502,305 |
| | $ | 4,502,305 |
| | $ | 4,502,305 |
| | |
| Deferred Compensation | | Deferred Compensation | — | | | — | | | — | | | — | | | — | | | — | | |
| Total Value of Potential Payments | $ | 8,778,164 |
| | $ | 8,928,164 |
| | $ | 8,778,164 |
| | $ | 9,680,942 |
| | $ | 9,680,942 |
| | Total Value of Potential Payments | $ | 567,163 | | | $ | 567,163 | | | $ | 1,485,163 | | | $ | 3,555,830 | | | $ | 567,163 | | | $ | 1,096,747 | | |
Notes
(1) Mr. Skaggs does The Resignation column covers resignations that do not havequalify as resignations for Good Reason under TVA's Severance Plan. See Executive Compensation Tables and Narrative Disclosures - Executive SeverancePlan for definition of Good Reason.
(2) The Severance Plan provides that if TVA terminates an NEO's employment other than for Gross Misconduct or such participant terminates employment for Good Reason, such participant will be eligible to receive certain benefits in addition to his or her accrued compensation. The amount of additional benefits will vary depending on whether the qualifying separation from service occurs within 24 months following a severance agreementChange in Control. See Executive Compensation Tables and Narrative Disclosures - Executive Severance Plan for definitions of Gross Misconduct, Good Reason, and Change in Control and for a discussion of the benefits provided to NEOs under the Severance Plan.
(3) The five-year vesting requirement has not been met.
(4) The Severance Plan provides that the five-year vesting requirement set forth in Section 4.1(a) of the SERP will be waved pursuant to the terms of such section with TVA.respect to each participant whose termination date occurs within 24 months following a Change in Control.
(2)(5) Represents the present value of the accumulated benefit.
(3) Actual benefit would be paid in ten annual installments beginning on the date of Mr. Skaggs's separation from service.
(4) Assumes that the TVA Board or its delegate determines that the termination is an approved termination under SERP. See Retirement and Pension Plans — Supplemental Executive Retirement Plan above for a discussion of approved and unapproved terminations under SERP.
(5)(6) In the event of death while employed by TVA, the beneficiary would receive a lump sum payment equal to the actuarial equivalent of the benefit that would have been paid had the participant terminated employment on the date of death and elected a joint and 50 percent survivor benefit. Survivor will receive 50%50 percent of the reported value.
(6)(7) Under the terms of his offer letter, Mr. Fountain is required to repay to TVA deferred cash relocation incentive payments in the amount of $150,000 if, prior to June 1, 2022, he (1) voluntarily terminates employment unless the separation is for reasons beyond his control and acceptable to TVA, or (2) is terminated for cause. Mr. Fountain is required to repay to TVA deferred cash relocation incentive payments in the amount of $100,000 if, prior to June 1, 2023, he (1) voluntarily terminates employment unless the separation is for reasons beyond his control and acceptable to TVA, or (2) is terminated for cause.
(8) The LTIP provides that in the event of the death of a participant, the participant’sparticipant's beneficiary is entitled to any portion of a LTR award that had vested at the time of the participant’sparticipant's death but not been paid as well as anya prorated portion of aany LTR awardgrant that would havehad not vested at the endtime of the fiscal year during which the participant died or at the end of either of the two subsequent fiscal years,participant's separation from service, provided that the LTR award for each such fiscal yearvesting period will be prorated based on the number of whole months the participant was employed by TVA during the fiscal yearvesting period in which the participant separated from service as compared to (a) 12 months for the vesting period that includes the day that the participant separated from service, (b) 24 months for the vesting period that immediately follows the vesting period during which he or she died.the participant separated from service, and (c) 36 months for the second vesting period that follows the vesting period during which the participant separated from service.
(7)(9) The LTIP provides that if a participant separates from service due to a disability, the participant is entitled to any portion of a LTR award that had vested at the time of the separation from service but not been paid as well as anya prorated portion of aany LTR awardgrant that would havehad not vested at the endtime of the fiscal year during which the participant separatedparticipant's separation from service, or at the end of either of the two subsequent fiscal years, provided that the LTR award for each such fiscal year will be prorated based on the number of whole months the participant was employed by TVA during the fiscal yearvesting period in which the participant separated from service as compared to (a) 12 months for the vesting period that includes the day that the participant separated from service, (b) 24 months for the vesting period that immediately follows the vesting period during which he or shethe participant separated from service, and (c) 36 months for the second vesting period that follows the vesting period during which the participant separated from service.
(8)(10) Is not eligible to retire based on definition in the LTIP plan.
(11) The LTIP provides that in the event of the death of a participant, the participant’sparticipant's beneficiary is entitled to (1) any portion of a LTP award that had vested at the time of the participant’sparticipant's death but not been paid and (2) any LTP awards that had not vested at the time of the participant’sparticipant's death and that covered a performance cycle for which the participant had received a LTP grant, provided that the amount of any such LTP award (a) will be calculated assuming that the percent of opportunity achieved is 100 percent of target and (b) will be prorated based on the number of whole months the participant was participating in the plan during the applicable performance cycle.
(9)(12) The LTIP provides that if a participant separates from service due to a disability, the participant is entitled to (1) any portion of a LTP award that had vested at the time of the participant’sparticipant's separation from service but not been paid and (2) any LTP awards that had not vested at the time of the participant’sparticipant's separation from service and that covered a performance cycle for which the participant had received a LTP grant, provided that the amount of any such LTP award (a) will be calculated assuming that the percent of opportunity achieved is 100 percent of target and (b) will be prorated based on the number of whole months the participant was employed by TVA during the applicable performance cycle.
(10) Amounts that Mr. Skaggs earned in past years but elected to defer, which are payable pursuant to elections he made and applicable IRS rules.
| | | Sherry A. Quirk | Retirement/Resignation | | Termination without Cause | | Termination with Cause | | Death | | Disability | | |
Severance Agreement(1) | $ | — |
| | $ | 477,405 |
| | $ | — |
| | $ | — |
| | $ | — |
| | |
| LTDCP | $ | — |
| | $ | — |
| | $ | — |
| | $ | — |
| | $ | — |
| | |
| Donald Moul | | Donald Moul | Resignation(1) | | Retirement | | Termination without Cause or Resignation for Good Reason (Non-CIC)(2) | | Termination without Cause or Resignation for Good Reason (CIC)(2) | | Termination with Cause | | Death/Disability | |
| Severance Agreement | | Severance Agreement | $ | — | | | $ | — | | | $ | 1,300,500 | | | $ | 2,601,000 | | | $ | — | | | $ | — | | |
| SERP | $ | — |
| (2) | $ | — |
| (2) | $ | — |
| (2) | $ | 138,629 |
| (3) (4) | $ | 138,629 |
| (3) | SERP | — | | (3) | — | | (3) | — | | | — | | | — | | (3) | — | | (4) (5) |
| LTRIP | $ | — |
| | $ | 150,000 |
| | $ | — |
| | $ | 150,000 |
| | $ | 150,000 |
| | |
| EAIP | | EAIP | 235,435 | | | 235,435 | | | 235,435 | | | 235,435 | | | 235,435 | | | 235,435 | | |
| Deferred Cash Recruitment/Relocation Incentive | | Deferred Cash Recruitment/Relocation Incentive | — | | (6) | — | | (6) | — | | | — | | | — | | (6) | — | | |
| LTR | $ | 125,000 |
| | $ | 125,000 |
| | $ | 125,000 |
| | $ | 220,833 |
| (5) | $ | 220,833 |
| (6) | LTR | 327,084 | | | 327,084 | | | 327,084 | | | 828,612 | | | 327,084 | | | 545,140 | | (8) (9) |
| LTP | $ | — |
| | $ | — |
| | $ | — |
| | $ | 598,333 |
| (7) | $ | 598,333 |
| (8) | LTP | 86,350 | | | 86,350 | | (7) | 86,350 | | | 1,002,183 | | | 86,350 | | | 500,656 | | (10) (11) |
| Deferred Compensation | $ | — |
| | $ | — |
| | $ | — |
| | $ | — |
| | $ | — |
| | Deferred Compensation | — | | | — | | | — | | | — | | | — | | | — | | |
| Total Value of Potential Payments | $ | 125,000 |
| | $ | 752,405 |
| | $ | 125,000 |
| | $ | 1,107,795 |
| | $ | 1,107,795 |
| | Total Value of Potential Payments | $ | 648,869 | | | $ | 648,869 | | | $ | 1,949,369 | | | $ | 4,667,230 | | | $ | 648,869 | | | $ | 1,281,231 | | |
Notes
(1) In December 2014, TVA entered into an arrangement with Ms. Quirk The Resignation column covers resignations that do not qualify as resignations for Good Reason under TVA's Severance Plan. See Executive Compensation Tables and Narrative Disclosures - Executive SeverancePlan for definition of Good Reason.
(2) The Severance Plan provides a lump-sum payment equal to one year's annual salary in the eventthat if TVA terminates an NEO's employment other than for Gross Misconduct or such participant terminates employment for Good Reason, such participant will be eligible to receive certain benefits in addition to his or her employment without cause.accrued compensation. The amount of additional benefits will vary depending on whether the qualifying separation from service occurs within 24 months following a Change in Control. See Executive Compensation Tables and Narrative Disclosures - Executive Severance Plan for definitions of Gross Misconduct, Good Reason, and Change in Control and for a discussion of the benefits provided to NEOs under the Severance Plan.
(2)(3) The five-year vesting requirement has not been met.
(3)(4) Represents the present value of the accumulated benefit.
(4)(5) In the event of death while employed by TVA, the beneficiary wouldwill receive a lump sum payment equal to the actuarial equivalent of the benefit that would have been paid had the participant terminated employment on the date of death and elected a joint and 50 percent survivor benefit. Survivor will receive 50%50 percent of the reported value.
(5)(6) Under the terms of his offer letter, Mr. Moul is required to repay to TVA deferred cash recruitment and relocation incentive payments in the amount of $650,000 if, prior to June 21, 2023, he (1) voluntarily terminates employment unless the separation is for reasons beyond his control and acceptable to TVA, or (2) is terminated for cause.
(7) Is not eligible to retire based on definition in the LTIP plan.
(8) The LTIP provides that in the event of the death of a participant, the participant’sparticipant's beneficiary is entitled to any portion of a LTR award that had vested at the time of the participant’sparticipant's death but not been paid as well as anya prorated portion of aany LTR awardgrant that would havehad not vested at the endtime of the fiscal year during which the participant died or at the end of either of the two subsequent fiscal years,participant's separation from service, provided that the LTR award for each such fiscal yearvesting period will be prorated based on the number of whole months the participant was employed by TVA during the fiscal yearvesting period in which the participant separated from service as compared to (a) 12 months for the vesting period that includes the day that the participant separated from service, (b) 24 months for the vesting period that immediately follows the vesting period during which he or she died.the participant separated from service, and (c) 36 months for the second vesting period that follows the vesting period during which the participant separated from service.
(6)(9) The LTIP provides that if a participant separates from service due to a disability, the participant is entitled to any portion of a LTR award that had vested at the time of the separation from service but not been paid as well as anya prorated portion of aany LTR awardgrant that would havehad not vested at the endtime of the fiscal year during which the participant separatedparticipant's separation from service, or at the end of either of the two subsequent fiscal years, provided that the LTR award for each such fiscal year will be prorated based on the number of whole months the participant was employed by TVA during the fiscal yearvesting period in which the participant separated from service as compared to (a) 12 months for the vesting period that includes the day that the participant separated from service, (b) 24 months for the vesting period that immediately follows the vesting period during which he or shethe participant separated from service, and (c) 36 months for the second vesting period that follows the vesting period during which the participant separated from service.
(7)(10) The LTIP provides that in the event of the death of a participant, the participant’sparticipant's beneficiary is entitled to (1) any portion of a LTP award that had vested at the time of the participant’sparticipant's death but not been paid and (2) any LTP awards that had not vested at the time of the participant’sparticipant's death and that covered a performance cycle for which the participant had received a LTP grant, provided that the amount of any such LTP award (a) will be calculated assuming that the percent of opportunity achieved is 100 percent of target and (b) will be prorated based on the number of whole months the participant was participating in the plan during the applicable performance cycle.
(8)(11) The LTIP provides that if a participant separates from service due to a disability, the participant is entitled to (1) any portion of a LTP award that had vested at the time of the participant’sparticipant's separation from service but not been paid and (2) any LTP awards that had not vested at the time of the participant’sparticipant's separation from service and that covered a performance cycle for which the participant had received a LTP grant, provided that the amount of any such LTP award (a) will be calculated assuming that the percent of opportunity achieved is 100 percent of target and (b) will be prorated based on the number of whole months the participant was employed by TVA during the applicable performance cycle.
| | | | | | | | | | | | | | | | | | | | | | | | | | | | | | | | | | | | | | |
| Michael D. Skaggs | Resignation(1) | | Retirement | | Termination without Cause or Resignation for Good Reason (Non-CIC)(2) | | Termination without Cause or Resignation for Good Reason (CIC)(2) | | Termination with Cause | | Death/Disability | |
| Severance Agreement | $ | — | | | $ | — | | | $ | 1,241,885 | | | $ | 2,483,770 | | | $ | — | | | $ | — | | |
| SERP | 9,075,757 | | (3) (4) (5) | 9,075,757 | | (3) (4) (5) | 9,075,757 | | (3) (4) (5) | 9,075,757 | | (3) (4) (5) | 9,075,757 | | (3) (4) (5) | 9,075,757 | | (3) (4) (6) |
| EAIP | 901,332 | | | 901,332 | | | 901,332 | | | 901,332 | | | 901,332 | | | 901,332 | | |
| LTR | 451,000 | | | 451,000 | | | 451,000 | | | 930,000 | | | 451,000 | | | 662,500 | | (7) (8) |
| LTP | 1,293,600 | | | 2,345,267 | | (9) | 2,345,267 | | | 3,458,600 | | | 1,293,600 | | | 2,345,267 | | (10) (11) |
Deferred Compensation(12) | 6,041,126 | | | 6,041,126 | | | 6,041,126 | | | 6,041,126 | | | 6,041,126 | | | 6,041,126 | | |
| Total Value of Potential Payments | $ | 17,762,815 | | | $ | 18,814,482 | | | $ | 20,056,367 | | | $ | 22,890,585 | | | $ | 17,762,815 | | | $ | 19,025,982 | | |
Notes
(1) The Resignation column covers resignations that do not qualify as resignations for Good Reason under TVA's Severance Plan. See Executive Compensation Tables and Narrative Disclosures - Executive Severance Plan for definition of Good Reason.
(2) The Severance Plan provides that if TVA terminates an NEO's employment other than for Gross Misconduct or such participant terminates employment for Good Reason, such participant will be eligible to receive certain benefits in addition to his or her accrued compensation. The amount of additional benefits will vary depending on whether the qualifying separation from service occurs within 24 months following a Change in Control. See Executive Compensation Tables and Narrative Disclosures - Executive Severance Plan for definitions of Gross Misconduct, Good Reason, and Change in Control and for a discussion of the benefits provided to NEOs under the Severance Plan.
(3) Represents the present value of the accumulated benefit.
(4) Actual benefit would be paid in ten annual installments beginning on the date of Mr. Skaggs's separation from service.
(5) Assumes that the TVA Board or its delegate determines that the termination is an approved termination under SERP. See Executive Compensation Tables and Narrative Disclosures — Retirement and Pension Plans — Supplemental Executive Retirement Plan above for a discussion of approved and unapproved terminations under SERP.
(6) In the event of death while employed by TVA, the beneficiary would receive a lump sum payment equal to the actuarial equivalent of the benefit that would have been paid had the participant terminated employment on the date of death and elected a joint and 50 percent survivor benefit. Survivor will receive 50 percent of the reported value.
(7) The LTIP provides that in the event of the death of a participant, the participant's beneficiary is entitled to any portion of a LTR award that had vested at the time of the participant's death but not been paid as well as a prorated portion of any LTR grant that had not vested at the time of the participant's separation from service, provided that the LTR award for each vesting period will be prorated based on the number of whole months the participant was employed by TVA during the vesting period in which the participant separated from service as compared to (a) 12 months for the vesting period that includes the day that the participant separated from service, (b) 24 months for the vesting period that immediately follows the vesting period during which the participant separated from service, and (c) 36 months for the second vesting period that follows the vesting period during which the participant separated from service.
(8) The LTIP provides that if a participant separates from service due to a disability, the participant is entitled to any portion of a LTR award that had vested at the time of the separation from service but not been paid as well as a prorated portion of any LTR grant that had not vested at the time of the participant's separation from service, provided that the LTR award will be prorated based on the number of whole months the participant was employed by TVA during the vesting period in which the participant separated from service as compared to (a) 12 months for the vesting period that includes the day that the participant separated from service, (b) 24 months for the vesting period that immediately follows the vesting period during which the participant separated from service, and (c) 36 months for the second vesting period that follows the vesting period during which the participant separated from service.
(9) The LTIP provides that in the event of the retirement of a participant, the participant is entitled to (1) any LTP award that had vested at the time of the participant's separation from service but not been paid and (2) any LTP awards that had not vested at the time of the participant's separation from service and that covered a performance cycle for which the participant had received a LTP grant, provided that the amount of any such LTP award (a) will be calculated using the actual percent of opportunity achieved and (b) will be prorated based on the number of whole months the participant was employed by TVA during the applicable performance cycle. The amount included in the table assumes that the percent of opportunity achieved will be 100 percent of target for the performance cycles ending on September 30, 2022 and September 30, 2023.
(10) The LTIP provides that in the event of the death of a participant, the participant's beneficiary is entitled to (1) any LTP award that had vested at the time of the participant's death but not been paid and (2) any LTP awards that had not vested at the time of the participant's death and that covered a performance cycle for which the participant had received a LTP grant, provided that the amount of any such LTP award (a) will be calculated assuming that the percent of opportunity achieved is 100 percent of target and (b) will be prorated based on the number of whole months the participant was participating in the plan during the applicable performance cycle.
(11) The LTIP provides that if a participant separates from service due to a disability, the participant is entitled to (1) any LTP award that had vested at the time of the participant's separation from service but not been paid and (2) any LTP awards that had not vested at the time of the participant's separation from service and that covered a performance cycle for which the participant had received a LTP grant, provided that the amount of any such LTP award (a) will be calculated assuming that the percent of opportunity achieved is 100 percent of target and (b) will be prorated based on the number of whole months the participant was employed by TVA during the applicable performance cycle.
(12) Amounts that Mr. Skaggs earned in past years but elected to defer, which are payable pursuant to elections he made and applicable IRS rules.
Other Agreements
Except as described above and in the Compensation Discussion and Analysis, there are no other agreements between TVA and any of the Named Executive Officers.
Director Compensation
The TVA Act provides for up to nine directors on the TVA Board. As of November 12, 2021, the TVA Board consisted of seven members. Under the TVA Act, each director receives certain stipends that are increased annually by the same percentage increase applicable to adjustments under 5 U.S.C. § 5318, which adjusts the annual rates of pay of employees on the Executive Schedule of the United StatesU.S. Government. OnEffective January 1, 2017,2021, the annual stipend for TVA directors was increased from $54,072 to $51,005$54,613 per year unless (1) the director chairs a TVA Board committee, in which case the stipend was increased from $55,142 to $52,015$55,693 per year, or (2) the director is the Chair of the TVA Board, in which case the stipend was increased from $60,175 to $56,762$60,777 per year. Directors are also reimbursed under federal law for travel, lodging, and related expenses while attending meetings and for other official TVA business.
The annual stipends provided by the TVA Act for each director and for the Chair of the TVA Board as of November 14, 2017,12, 2021, are listed below:
TVA BOARD ANNUAL STIPENDS |
| | | | | | | |
TVA Board
Name | | Annual StipendsStipend |
Name
William Kilbride | | Annual Stipend
($)
$ | 60,777 | |
| Kenneth E. Allen | | 55,693 | |
Marilyn A. BrownD. Frazier | | 52,01555,693 | |
V. Lynn EvansBeth Harwell | | 52,01555,693 | |
Richard C. HoworthBrian Noland | | 56,76254,613 | |
Virginia T. LodgeJohn L. Ryder | | 52,01554,613 | |
Eric M. SatzJeff W. Smith | | 52,015 |
Ronald A. Walter55,693 | | 52,015 |
The following table provides information on the compensation received by TVA’sTVA's directors during 2017:2021:
|
| | | | | | | | | | |
Director Compensation |
Name | Fees Earned or Paid in Cash ($) | Stock Awards ($) | Option Awards ($) | Non-Equity Incentive Plan Compensation ($) | Change in Pension Value and Nonqualified Deferred Compensation Earnings(1) ($) | All Other Compensation(2) ($) | Total ($) |
| Marilyn A. Brown | 51,906 |
| — | — | — | — | 519 |
| 52,425 |
|
| V. Lynn Evans | 53,549 |
| — | — | — | — | 2,596 |
| 56,145 |
|
| Richard C. Howorth | 53,841 |
| — | — | — | — | 2,672 |
| 56,513 |
|
| Virginia T. Lodge | 51,566 |
| — | — | — | — | 2,572 |
| 54,138 |
|
| Eric M. Satz | 51,566 |
| — | — | — | — | 2,572 |
| 54,138 |
|
| Ronald A. Walter | 51,566 |
| — | — | — | — | 515 |
| 52,081 |
|
Note
| | | | | | | | | | | | | | | | | | | | | | | |
| Name | Fees Earned or Paid in Cash | Stock
Awards | Option
Awards | Non-Equity
Incentive Plan
Compensation | Change in
Pension Value
and
Nonqualified
Deferred
Compensation
Earnings(1) | All Other
Compensation(2) | Total |
| William B. Kilbride | $ | 55,997 | | — | | — | | — | | — | | $ | 560 | | $ | 56,557 | |
| Kenneth E. Allen | 55,528 | | — | | — | | — | | — | | 555 | | 56,083 | |
| A. D. Frazier | 55,528 | | — | | — | | — | | — | | 2,776 | | 58,304 | |
| Beth Harwell | 40,447 | | — | | — | | — | | — | | 2,022 | | 42,469 | |
| Brian Noland | 39,910 | | — | | — | | — | | — | | 1,995 | | 41,905 | |
| John L. Ryder | 60,027 | | — | | — | | — | | — | | 2,401 | | 62,428 | |
| Jeff W. Smith | 55,528 | | — | | — | | — | | — | | 2,499 | | 58,027 | |
Notes
(1) TVA directors do not participate in the TVATVARS Retirement System,Plans, TVA's SERP, or any non-qualified deferred compensation plan available to TVA employees. However, as appointed officers of the United StatesU.S. government, the directors are members of FERS. FERS is administered by the federal Office of Personnel Management, and information regarding the value of FERS pension benefits is not available to TVA.
(2) These amounts include TVA's non-elective and matching contributions to the TSP.
Thrift Savings Plan.
The directors are not eligible to participate in any incentive programs available to TVA employees. The directors do not participate in the TVATVARS Retirement SystemPlans and do not participate in TVA's SERP. However, as appointed officers of the United StatesU.S. government, the directors are members of the Federal Employees Retirement System ("FERS"). FERS is a tiered retirement plan that includes three components: (1) Social Security benefits, (2) the Basic Benefit Plan, and (3) the Thrift Savings Plan ("TSP"). As members of FERS, each director is required to make a mandatory small percentage contribution of his or her stipend to
the Basic Benefit Plan in the amount of 0.8 percent for those directors appointed prior to January 1, 2013, 3.1 percent for those directors appointed between January 1, 2013, and December 31, 2013, and 4.4 percent for those directors appointed on or after January 1, 2014.
The FERS Basic Benefit Plan is a qualified defined benefit plan that provides a retirement benefit based on a final average pay formula that includes age, highest average salary during any three consecutive years of service, and years of creditable service. A director must have at least five years of creditable service to be eligible to receive retirement benefits. Directors are eligible for immediate, unreduced retirement benefits once (1) they reach age 62 and have five years of FERS creditable service, (2) they reach age 60 and have 20 years of FERS creditable service, or (3) they attain the minimum retirement age and accumulate the specified years of service as set forth in the FERS regulations. Generally, benefits are calculated by multiplying 1.0 percent of the highest average salary during any three consecutive years of service by the number
of years of creditable service. Directors who retire at age 62 or later with at least 20 years of FERS creditable service receive an enhanced benefit (a factor of 1.1 percent is used rather than 1.0 percent).
Directors may also retire with an immediate benefit under FERS if they reach their minimum retirement age based on type of retirement and years of service and have accumulated at least 10 years of FERS creditable service. For directors who reach the minimum retirement age and have at least 10 years of FERS creditable service, the annuity will be reduced by five percent for each year the director is under age 62.
Each director is also eligible to participate in the TSP. The TSP is a tax-deferred retirement savings and investment plan that offers the same type of savings and tax benefits offered under 401(k) plans. Once a director becomes eligible, TVA contributes an amount equal to one percent of the director's stipend into a TSP account for the director. These contributions are made automatically every two weeks regardless of whether the director makes a contribution of his or her own money. Directors are eligible to contribute up to the IRSTSP elective deferral limit. Directors receive matching contributions of 100 percent of each dollar for the first three percent of the director's stipend and 50 percent of each dollar for the next two percent of the director's stipend.
TVA offers a group of health and other benefits (medical, dental, vision, life and accidental death and disability insurance, and long-term disability insurance) that are available to a broad group of employees. Directors are eligible to participate in TVA's health benefit plans and other non-retirement benefit plans on the same terms and at the same contribution rates as other TVA employees.
Compensation Committee Interlocks and Insider Participation
The People and PerformanceGovernance Committee of the TVA Board currently consists of the following three directors: Richard C. Howorth, Virginia T. LodgeKenneth Allen, A.D. Frazier, and Ronald A. Walter.Brian Noland.
No member of this Committee was at any time during 2021 or at any other time an officer or employee of TVA, and no member of this committee had any relationship with TVA requiring disclosure under Item 404 of Regulation S-K. No executive officer of TVA serveshas served on the board of andirectors or compensation committee of any other entity that has anor has had one or more executive officer servingofficers who served as a directormember of TVA.the People and Governance Committee during 2021.
Compensation Committee Report
The People and PerformanceGovernance Committee has reviewed and discussed the Compensation Discussion and Analysis with management, and based on the review and discussions, the Committee recommended to the TVA Board that the Compensation Discussion and Analysis be included in this Annual Report.
PEOPLE AND PERFORMANCEGOVERNANCE COMMITTEE
Richard C. Howorth,Kenneth Allen, Chair
Virginia T. LodgeA.D. Frazier
Ronald A. WalterBrian Noland
ITEM 12. SECURITY OWNERSHIP OF CERTAIN BENEFICIAL OWNERS AND MANAGEMENT AND RELATED STOCKHOLDER MATTERS
Not applicable.
ITEM 13. CERTAIN RELATIONSHIPS AND RELATED TRANSACTIONS, AND DIRECTOR INDEPENDENCE
Director Independence
The composition of the TVA Board is governed by the TVA Act. The TVA Act contains certain provisions that are similar to the considerations for independence under section 10A(m)(3) of the Exchange Act, including that to be eligible for appointment to the TVA Board, an individual shall not be an employee of TVA and shall make full disclosure to Congress of any investment or other financial interest that the individual holds in the energy industry.
Related Party Transactions
Conflict of Interest Provisions
All TVA employees, including directors and executive officers, are subject to the conflict of interest laws and regulations applicable to employees of the federal government. Accordingly, the general federal conflict of interest statute (18 U.S.C. § 208) and the Standards of Ethical Conduct for Employees of the Executive Branch (5 C.F.R. part 2635) ("Standards of Ethical Conduct") form the basis of TVA’sTVA's policies and procedures for the review, approval, or ratification of related party transactions. The general federal conflict of interest statute, subject to certain exceptions, prohibits each government employee, including TVA’sTVA's directors and executive officers, from participating personally and substantially (by advice, decision, or otherwise) as a government employee in any contract, controversy, proceeding, request for determination, or other particular matter in which, to his or her knowledge, he or she (or his or her spouse, minor child, general partner, organization with which he or she serves as officer, director, employee, trustee, or general partner, or any person or organization with which he or she is negotiating, or has an arrangement, for future employment) has a financial interest. Exceptions to the statutory prohibition relevant to TVA employees are (1) financial interests which have been deemed by the U.S. Office of Government Ethics, in published regulations, to be too remote or inconsequential to affect the integrity of the employee’semployee's services, or (2) interests which are determined in writing, after full disclosure and on a case-by-case basis, to be not so substantial as to be deemed likely to affect the integrity of the employee’semployee's services for TVA. In accordance with the statute, individual waiver determinations are made by the official responsible for the employee’semployee's appointment. In the case of TVA directors, the determination may be made by the Chair of the TVA Board, and in the case of the Chair of the TVA Board, the determination may be made by the Counsel to the President of the United States.U.S.
More broadly, Subpart E of the Standards of Ethical Conduct provides that where an employee (1) knows that a particular matter involving specific parties is likely to have a direct and predictable effect on the financial interests of a member of his or her household, or that a person with whom the employee has a “covered relationship”"covered relationship" (which includes, but is not limited to, persons with whom the employee has a close family relationship and organizations in which the employee is an active participant) is or represents a party to the matter, and (2) determines that the circumstances would cause a reasonable person with knowledge of relevant facts to question his or her impartiality in the matter, the employee should not participate in the matter absent agency authorization. This authorization may be given by the employee’semployee's supervising officer, as agency designee, in consultation with the TVA Designated Agency Ethics Official, upon the determination that TVA’sTVA's interest in the employee’semployee's participation in the matter outweighs the concern that a reasonable person may question the integrity of TVA’sTVA's programs and operations.
The previously described restrictions are reflected in TVA’s Standard Programs and Processes 11.8.1, Business Ethics,TVA's policies which requiresrequire employees, including TVA’s directors and executive officers, to comply with the guidelines outlined in the Standards of Ethical Conduct and which restatesrestate the standard of the conflict of interest statute.
Additionally, the TVA Board approved a written conflict of interest policy that applies to all TVA employees, including TVA’sTVA's directors and executive officers. The conflict of interest policy reaffirms the requirement that all TVA employees must comply with applicable federal conflict of interest laws, regulations, and policies. It also establishes an additional policy that is applicable to TVA's directors and CEO. This additional policy provides that TVA's directors and CEO shall not hold a financial interest in (1) any distributor of TVA power,power; (2) any entity engaged primarily in the wholesale or retail generation, transmission, or sale of electricity, except where substantially all such business is conducted outside of North America,America; or (3) any entity that may reasonably be perceived as likely to be adversely affected by the success of TVA as a producer or transmitter of electric power. Any waiver of this additional policy may be made only by the TVA Board and will be disclosed promptly to the public, subject to the limitations on disclosure imposed by law.
TVA also has a protocol titled the "Obtaining Things of Value from TVA Protocol" (the “Protocol”"Protocol"). The Protocol describes what a TVA employee should do if a person covered by the Protocol asks for assistance in obtaining a specified thing of value from TVA. Similarly, the TVA Board Practice on External Inquiries describes what a member of the TVA Board should do if a person covered by the practice asks for assistance in obtaining a specified thing of value from TVA.
TVA relies on the policies, practices, laws, and regulations discussed above to regulate conflicts of interest involving employees, including directors and executive officers. TVA has no other written or unwritten policy for the approval or ratification of any transactions in which TVA was or is to be a participant and in which any director or executive officer of TVA (or any child, stepchild, parent, stepparent, spouse, sibling, mother-in-law, father-in-law, son-in-law, daughter-in-law, brother-in-law, or sister-in-law of any director or executive officer of TVA) had or will have a direct or indirect material interest.
Other Relationships
TVA is engaged in a number of transactions with other agencies of the U.S. government, although such agencies do not fall within the definition of “related parties”"related parties" for purposes of Item 404(a) of Regulation S-K. These include, among other things, supplying electricity to other federal agencies, purchasing electricity from the Southeastern Power Administration, and engaging in various arrangements involving nuclear materials with the DOE.Department of Energy ("DOE"). See Item 1, Business and Note 22.24 — Related Parties.
TVA also has access to a financing arrangement with the United States Department of the Treasury ("U.S. Treasury").Treasury. TVA and the U.S. Treasury have a memorandum of understanding under which the U.S. Treasury provides TVA with a $150 million credit facility. There were no outstanding borrowings under the facility at September 30, 2017.2021. This credit facility matures onhas a maturity date of September 30, 2018,2022, and is expected to be renewed.typically renewed annually. This arrangement is pursuant to the TVA Act. Access to this credit facility or other similar financing arrangements with the U.S. Treasury has been available to TVA since the 1960s. See Note 1314 — Debt and Other Obligations — Credit Facility Agreements.
In addition, TVA is required by the 1959 amendment to the TVA Act to make annual payments to the U.S. Treasury from net power proceeds as a repayment of and as a return on the Powerpayments to the U.S. Treasury in repayment of and as a return on the government's appropriation investment in TVA's power facilities (the "Power Program Appropriation InvestmentInvestment") until $1.0 billion of the Power Program Appropriation Investment has been repaid. With the 2014 payment, TVA fulfilled its requirement to repay $1.0 billion of the Power Program Appropriation Investment. The TVA Act requires TVA to continue to make payments to the U.S. Treasury indefinitely as a return on the remaining $258 million of the Power Program Appropriation Investment. See Note 1719 — Proprietary Capital — Appropriation Investment.
The TVA Act requires the proceeds for each fiscal year derived from the sale of power or any other activities to be paid into the U.S. Treasury on March 31 of each year, except for the portion of such proceeds as in the opinion of the TVA Board shall be necessary for TVA in the operation of dams and reservoirs and in conducting its business in generating, transmitting, and distributing electric energy. For each fiscal year, the TVA Board adopts a resolution retaining for use in the operation of the TVA power system the entire margin of net power proceeds remaining at the conclusion of such fiscal year.
ITEM 14. PRINCIPAL ACCOUNTANT FEES AND SERVICES
The following table shows the fees of Ernst & Young LLP for audit, audit-related, and other services for the years ended September 30, 20172021 and 2016.2020.
| | | | | | | | | | | | | | | | | | | | | | | | | | | | | | | | | | | |
Principal Accountant Fees and Services (in actual dollars) |
| Year | | Principal Accountant | | Audit Fees(1) | | Audit-Related Fees | | Tax Fees | All Other Fees(2) | | Total |
| 2021 | | Ernst & Young LLP | | $ | 3,115,531 | | | $ | — | | | $ | — | | $ | 3,060 | | | $ | 3,118,591 | |
| 2020 | | Ernst & Young LLP | | 3,007,830 | | | — | | | — | | 5,930 | | | 3,013,760 | |
|
| | | | | | | | | | | | | | | | | |
Principal Accountant Fees and Services (in actual dollars) |
| Year | | Principal Accountant | | Audit Fees(1) | | Audit-Related Fees | | All Other Fees | | Total |
| 2017 | | Ernst & Young LLP | | $ | 2,688,826 |
| | $ | — |
| | — |
| | $ | 2,688,826 |
|
| 2016 | | Ernst & Young LLP | | 2,700,896 |
| | — |
| | — |
| | 2,700,896 |
|
NoteNotes
(1) Audit fees consist of payments for professional services rendered in connection with the audit of TVA's annual financial statements, including the annual attestation on internal control over financial reporting and thereporting; review of interim financial statements included in TVA's quarterly reports; audit of TVA's fuel cost adjustment; audit of TVA's federal closing packagefinancial reporting responsibilities for the preparation and audit of the 20162021 and 20172020 federal consolidated financial statements of which TVA is a component; and Bond offering and other financing comfort letters;letters.
(2) All other fees reflect accounting and accounting consultations related to TVA's adoption of the new revenue recognition standard.financial reporting research software license costs.
The TVA Board has an Audit, Finance, Risk, and Regulation Committee.Cybersecurity Committee ("Audit Committee"). Under the TVA Act, the Audit Risk, and Regulation Committee, in consultation with the Inspector General, recommends to the TVA Board the selection of an external auditor. TVA’sTVA's Audit Risk, and Regulation Committee, in consultation with the Inspector General, recommended that the TVA Board select Ernst & Young LLP as TVA’sTVA's external auditor for the 20162021 and 20172020 audits and other related services, and the TVA Board approved these recommendations.
TVA has a policy (the “Policy”"Policy") that requires all auditing services and permissible non-audit services provided by the external auditor to be pre-approved by the Audit Risk, and Regulation Committee. The Policy also lists the following services as ones the external auditor is not permitted to perform:
•Bookkeeping or other services related to the accounting records or financial statements of TVA;
•Financial information system design and implementation;
•Appraisal or valuation services, fairness opinions, and contribution-in-kind reports;
•Actuarial services;
•Internal audit outsourcing services;
•Management functions or human resources;
•Broker or dealer, investment adviser, or investment banking services;
•Legal services and expert services unrelated to the audit; and
•Any other services that the Public Company Accounting Oversight Board determines, by regulation, are impermissible.
The Policy also delegates to the Chair of the Audit Risk, and Regulation Committee the authority to pre-approve a permissible service so long as the amount of the service does not exceed $100,000 and the total amount of services pre-approved during the year by the Chair does not exceed $200,000. The Chair must report for informational purposes the services pre-approved under this provision at the Audit Risk, and Regulation Committee’sCommittee's next meeting.
The Audit Risk, and Regulation Committee pre-approved all audit services for 20162021 and 2017.2020.
PART IV
ITEM 15. EXHIBITS, FINANCIAL STATEMENT SCHEDULES
(a) The following documents have been filed as part of this Annual Report:Report on Form 10-K for the fiscal year ended September 30, 2021 ("Annual Report"):
| |
(1) | Consolidated Financial Statements. The following documents are provided in Item 8, Financial Statements and |
(1) Consolidated Financial Statements. The following documents are provided in Item 8, Financial Statements and
Supplementary Data herein:
Consolidated Statements of Operations
Consolidated Statements of Comprehensive Income (Loss)
Consolidated Balance Sheets
Consolidated Statements of Cash Flows
Consolidated Statements of Changes in Proprietary Capital
Notes to Consolidated Financial Statements
Report of Independent Registered Public Accounting Firm (Ernst and& Young LLP)
(2) Consolidated Financial Statement Schedules.
Schedules not included are omitted because they are not required or because the required information is provided in the consolidated financial statements, including the notes thereto.
(3) List of Exhibits
|
| | | | |
| Exhibit No. | Description |
| 3.1 | Tennessee Valley Authority Act of 1933, as amended, 16 U.S.C. §§ 831-831ee (Incorporated by reference to Exhibit 3.1 to TVA’sTVA's Quarterly Report on Form 10-Q for the quarter ended December 31, 2016, File No. 000-52313) |
| |
| 3.2 | Bylaws of the Tennessee Valley Authority Adopted by the TVA Board of Directors on May 18, 2006, as amended on April 3, 2008, May 19, 2008, June 10, 2010, February 13, 2014, August 21, 2014, and November 6, 2014 (Incorporated by reference to Exhibit 3.2 to TVA’sTVA's Annual Report on Form 10-K for the year ended September 30, 2014, File No. 000-52313) |
| |
| 4.1 | |
| |
| 10.1 | $1,000,000,000 SpringAmended and Restated September Maturity Credit Agreement Dated as of June 25, 2012,September 28, 2018, Among TVA,Tennessee Valley Authority, as the Borrower, Toronto Dominion (Texas) LLC, as Administrative Agent, The Toronto-Dominion Bank, of New York MellonBranch, as Administrative Agent, Letter of Credit Issuer and a Lender, Bank of America, N.A., Canadian Imperial Bank of Commerce, New York Agency,Branch, First Tennessee Bank National Association, Morgan Stanley Bank, N.A., and Toronto Dominion (New York) LLCThe Bank of New York Mellon (Incorporated by reference to Exhibit 10.1 to TVA's Current Report on Form 8-K filed on June 28, 2012,October 3, 2018, File No. 000-52313) |
| |
| 10.2 | Amendment Dated as of December 12, 2012, to $1,000,000,000 SpringAmended and Restated June Maturity Credit Agreement Dated as of June 25, 2012,13, 2018, Among TVA, The Bank of New York MellonTennessee Valley Authority, as Administrative Agent, Letter of Credit Issuer, and a Lender, Bank of America, N.A., Canadian Imperial Bank of Commerce, New York Agency, First Tennessee Bank National Association, Morgan Stanley Bank, N.A., and Toronto Dominion (New York) LLC (Incorporated by reference to Exhibit 10.2 to TVA's Current Report on Form 8-K filed on December 17, 2012, File No. 000-52313) |
| |
10.3 | Second Amendment Dated as of June 2, 2015, to $1,000,000,000 Spring Maturity Credit Agreement Dated as of June 25, 2012, and amended as of December 12, 2012, Among TVA, The Bank of New York Mellon as Administrative Agent, Letter of Credit Issuer, and a Lender, Bank of America, N.A., Canadian Imperial Bank of Commerce, New York Agency, First Tennessee Bank National Association, Morgan Stanley Bank, N.A., and Toronto Dominion (New York) LLC (Incorporated by reference to Exhibit 10.1 to TVA's Current Report on Form 8-K filed on June 5, 2015, File No. 000-52313) |
| |
10.4 | $1,000,000,000 September 2020 Maturity Credit Agreement Dated as of September 30, 2015, Among TVA,the Borrower, Royal Bank of Canada, as Administrative Agent, Letter of Credit Issuer, and a Lender, Barclays Bank PLC, BNP Paribas, Branch Banking and Trust Company, Mizuho Bank Ltd, Regions Bank, SunTrust Bank, and Wells Fargo Bank, National Association (Incorporated by reference to Exhibit 10.1 to TVA's Current Report on Form 8-K filed on October 5, 2015,June 18, 2018, File No. 000-52313) |
| |
10.510.3 | Second Amended and Restated September Maturity Credit Agreement Dated as of September 21, 2021, Among Tennessee Valley Authority, as the Borrower, Royal Bank of Canada, as Administrative Agent, Letter of Credit Issuer, and a Lender, and the Other Lenders Party Thereto (Incorporated by reference to Exhibit 10.1 to TVA's Current Report on Form 8-K filed on September 24, 2021, File No. 000-52313) |
| |
| 10.4 | $500,000,000 February 2020 Maturity Credit Agreement Dated as of August 7, 2015, Among TVA, Bank of America, N.A., as Administrative Agent, Letter of Credit Issuer, and a Lender, and the Other Lenders Party Thereto (Incorporated by reference to Exhibit 10.1 to TVA's Current Report on Form 8-K filed on August 7, 2015, File No. 000-52313) |
| |
10.610.5 | First Amendment Dated as of February 28, 2017, to the $500,000,000 February 2020 Maturity Credit Agreement Dated as of August 7, 2015, Among TVA, Bank of America, N.A., as Administrative Agent, Letter of Credit Issuer, and a Lender, and the Other Lenders Party Thereto (Incorporated by Reference to Exhibit 10.1 to TVA's Current Report on Form 8-K filed on March 3, 2017, File No. 000-52313) |
|
| |
| |
10.7 | December 2019 Maturity Community Bank Credit Agreement Dated as of December 12, 2016, with SunTrust Bank as Administrative Agent and a Lender, Branch Banking and Trust Company as Letter of Credit Issuer and a Lender, First National Bank, First Tennessee Bank National Association, HomeTrust Bank, Pinnacle Bank, Regions Bank, Trustmark National Bank, and United Community Bank (Incorporated by Reference to Exhibit 10.1 to TVA's Current Report on Form 8-K filed on December 15, 2016, File No. 000-52313) |
| |
10.8 | TVA Discount Notes Selling Group Agreement (Incorporated by reference to Exhibit 10.2 to TVA’s Quarterly Report on Form 10-Q for the quarter ended June 30, 2008, File No. 000-52313) |
| |
10.9 | Electronotes® Selling Agent Agreement Dated as of June 1, 2006, Among TVA, LaSalle Financial Services, Inc., A.G. Edwards & Sons, Inc., Citigroup Global Markets Inc., Edward D. Jones & Co., L.P., First Tennessee Bank National Association, J.J.B. Hilliard, W.L. Lyons, Inc., Merrill Lynch, Pierce, Fenner & Smith Incorporated, Morgan Stanley & Co. Incorporated, and Wachovia Securities, LLC (Incorporated by reference to Exhibit 10.4 to TVA’s Annual Report on Form 10-K for the year ended September 30, 2006, File No. 000-52313) |
| |
10.10 | Amendment Dated as of December 4, 2013, to Electronotes® Selling Agent Agreement Dated as of June 1, 2006, Among TVA, LaSalle Financial Services, Inc., A.G. Edwards & Sons, Inc., Citigroup Global Markets Inc., Edward D. Jones & Co., L.P., First Tennessee Bank National Association, J.J.B. Hilliard, W.L. Lyons, Inc., Merrill Lynch, Pierce, Fenner & Smith Incorporated, Morgan Stanley & Co. Incorporated, and Wachovia Securities, LLC (Incorporated by reference to Exhibit 10.3 to TVA’s Quarterly Report on Form 10-Q for the quarter ended March 31, 2014, File No. 000-52313) |
|
10.11 | Second Amendment Dated as of August 28, 2015, to Electronotes® Selling Agent Agreement Dated as of June 1, 2006, and Amended as of December 4, 2013, Among TVA, LaSalle Financial Services, Inc., A.G. Edwards & Sons, Inc., Citigroup Global Markets Inc., Edward D. Jones & Co., L.P., First Tennessee Bank National Association, J.J.B. Hilliard, W.L. Lyons, Inc., Merrill Lynch, Pierce, Fenner & Smith Incorporated, Morgan Stanley & Co. Incorporated, and Wachovia Securities, LLC (Incorporated by reference to Exhibit 10.9 to TVA's Annual Report on Form 10-K for the year ended September 30, 2015, File No. 000-52313) |
| |
10.12 | Assumption Agreement Between TVA and Incapital LLC Dated as of February 29, 2008, Relating to the Electronotes® Selling Agent Agreement Dated as of June 1, 2006, Among TVA, LaSalle Financial Services, Inc., A.G. Edwards & Sons, Inc., Citigroup Global Markets Inc., Edward D. Jones & Co., L.P., First Tennessee Bank National Association, J.J.B. Hilliard, W.L. Lyons, Inc., Merrill Lynch, Pierce, Fenner & Smith Incorporated, Morgan Stanley & Co. Incorporated, and Wachovia Securities, LLC (Incorporated by reference to Exhibit 10.1 to TVA’s Quarterly Report on Form 10-Q for the quarter ended March 31, 2008, File No. 000-52313) |
| |
10.13 | Commitment Agreement Among Memphis Light, Gas and Water Division, the City of Memphis, Tennessee, and TVA Dated as of November 19, 2003 (Incorporated by reference to Exhibit 10.5 to TVA’s Annual Report on Form 10-K for the year ended September 30, 2006, File No. 000-52313) |
| |
10.14 | Power Contract Supplement No. 95 Among Memphis Light, Gas and Water Division, the City of Memphis, Tennessee, and TVA Dated as of November 19, 2003 (Incorporated by reference to Exhibit 10.6 to TVA’s Annual Report on Form 10-K for the year ended September 30, 2006, File No. 000-52313) |
| |
10.15 | Void Walk Away Agreement Among Memphis Light, Gas and Water Division, the City of Memphis, Tennessee, and TVA Dated as of November 20, 2003 (Incorporated by reference to Exhibit 10.7 to TVA’s Annual Report on Form 10-K for the year ended September 30, 2006, File No. 000-52313) |
| |
10.16 | Power Contract Supplement No. 96 Among Memphis Light, Gas and Water Division, the City of Memphis, Tennessee, and TVA Dated as of November 20, 2003 (Incorporated by reference to Exhibit 10.8 to TVA’s Annual Report on Form 10-K for the year ended September 30, 2006, File No. 000-52313) |
| |
10.17 | Overview of TVA's September 26, 2003, Lease and Leaseback of Control, Monitoring, and Data Analysis Network with Respect to TVA's Transmission System in Tennessee, Kentucky, Georgia, and Mississippi (Incorporated by reference to Exhibit 10.9 to TVA's Annual Report on Form 10-K for the year ended September 30, 2006, File No. 000-52313) |
| |
10.18 | Participation Agreement Dated as of September 22, 2003, Among (1) TVA, (2) NVG Network I Statutory Trust, (3) Wells Fargo Delaware Trust Company, Not in Its Individual Capacity, Except to the Extent Expressly Provided in the Participation Agreement, But as Owner Trustee, (4) Wachovia Mortgage Corporation, (5) Wilmington Trust Company, Not in Its Individual Capacity, Except to the Extent Expressly Provided in the Participation Agreement, But as Lease Indenture Trustee, and (6) Wilmington Trust Company, Not in Its Individual Capacity, Except to the Extent Expressly Provided in the Participation Agreement, But as Pass Through Trustee (Incorporated by reference to Exhibit 10.10 to TVA's Annual Report on Form 10-K for the year ended September 30, 2006, File No. 000-52313) |
| |
10.19* | Network Lease Agreement Dated as of September 26, 2003, Between NVG Network I Statutory Trust, as Owner Lessor, and TVA, as Lessee (Incorporated by reference to Exhibit 10.11 to TVA's Annual Report on Form 10-K for the year ended September 30, 2006, File No. 000-52313) |
| |
|
| |
10.20* | Head Lease Agreement Dated as of September 26, 2003, Between TVA, as Head Lessor, and NVG Network I Statutory Trust, as Head Lessee (Incorporated by reference to Exhibit 10.12 to TVA's Annual Report on Form 10-K for the year ended September 30, 2006, File No. 000-52313) |
| |
10.21* | Leasehold Security Agreement Dated as of September 26, 2003, Made by NVG Network I Statutory Trust to TVA (Incorporated by reference to Exhibit 10.13 to TVA's Annual Report on Form 10-K for the year ended September 30, 2006, File No. 000-52313) |
| |
10.22 | Facility Lease-Purchase Agreement Dated as of January 17, 2012, Between John Sevier Combined Cycle Generation LLC and TVA (Incorporated by reference to Exhibit 10.1 to TVA's Quarterly Report on Form 10-Q for the quarter ended December 31, 2011, File No. 000-52313) |
| |
10.23 | Head Lease Agreement Dated as of January 17, 2012, Among the United States of America, TVA, and John Sevier Combined Cycle Generation LLC (Incorporated by reference to Exhibit 10.2 to TVA's Quarterly Report on Form 10-Q for the quarter ended December 31, 2011, File No. 000-52313) |
| |
10.24* | Asset Purchase Agreement Dated as of August 6, 2013, Between TVA and Seven States Southaven, LLC (Incorporated by reference to Exhibit 10.33 to TVA's Annual Report on Form 10-K for the year ended September 30, 2013, File No. 000-52313) |
| |
10.25 | Facility Lease-Purchase Agreement Dated as of August 9, 2013, Between Southaven Combined Cycle Generation LLC and TVA (Incorporated by reference to Exhibit 10.34 to TVA's Annual Report on Form 10-K for the year ended September 30, 2013, File No. 000-52313) |
| |
10.26 | Head Lease Agreement Dated as of August 9, 2013, Among the United States of America, TVA, and Southaven Combined Cycle Generation LLC (Incorporated by reference to Exhibit 10.35 to TVA's Annual Report on Form 10-K for the year ended September 30, 2013, File No. 000-52313) |
| |
10.27* | Federal Facilities Compliance Agreement Between the United States Environmental Protection Agency and TVA (Incorporated by reference to Exhibit 10.2 to TVA's Quarterly Report on Form 10-Q for the quarter ended June 30, 2011, File No. 000-52313) |
| |
10.28* | Consent Decree Among Alabama, Kentucky, North Carolina, Tennessee, the Alabama Department of Environmental Management, the National Parks Conservation Association, Inc., the Sierra Club, Our Children's Earth Foundation, and TVA (Incorporated by reference to Exhibit 10.3 to TVA's Quarterly Report on Form 10-Q for the quarter ended June 30, 2011, File No. 000-52313) |
| |
10.29† | TVA Compensation Plan Approved by the TVA Board on May 31, 2007, as Amended on August 25, 2016 (Incorporated by Reference to Exhibit 10.28 to TVA's Annual Report on Form 10-K for the year ended September 30, 2016, File No. 000-52313) |
| |
10.30† | Amended and Restated Supplemental Executive Retirement Plan Effective as of May 1, 2015 (Incorporated by reference to Exhibit 10.1 to TVA's Quarterly Report on Form 10-Q for the quarter ended June 30, 2015, File No. 000-52313) |
| |
10.31† | Amended and Restated Executive Annual Incentive Plan Effective as of October 1, 2015 (Incorporated by reference to Exhibit 10.1 to TVA's Current Report on Form 8-K filed on October 1, 2015, File No. 000-52313) |
| |
10.32† | Executive Long-Term Incentive Plan (Incorporated by reference to Exhibit 10.4 to TVA’s Current Report on Form 8-K filed on January 6, 2009, File No. 000-52313) |
| |
10.33† | Long-Term Deferred Compensation Plan (Incorporated by reference to Exhibit 10.5 to TVA’s Current Report on Form 8-K filed on January 6, 2009, File No. 000-52313) |
| |
10.34† | Deferred Compensation Plan (Incorporated by reference to Exhibit 10.2 to TVA’s Current Report on Form 8-K filed on January 6, 2009, File No. 000-52313) |
| |
10.35† | Long-Term Retention Incentive Plan (Incorporated by reference to Exhibit 10.1 to TVA’s Quarterly Report on Form 10-Q for the quarter ended March 31, 2014, File No. 000-52313) |
| |
10.36† | Long-Term Incentive Plan Effective as of October 1, 2015 (Incorporated by reference to Exhibit 10.3 to TVA's Current Report on Form 8-K filed on October 1, 2015, File No. 000-52313) |
| |
10.37† | Retention Incentive Plan Effective as of October 1, 2015 (Incorporated by reference to Exhibit 10.2 to TVA's Current Report on Form 8-K filed on October 1, 2015, File No. 000-52313) |
| |
|
| |
10.38† | Offer Letter to William D. Johnson Approved as of November 1, 2012 (Incorporated by reference to Exhibit 99.1 to TVA's Current Report on Form 8-K filed on November 7, 2012, File No. 000-52313) |
| |
10.39† | Offer Letter to Joseph P. Grimes, Jr., Accepted as of June 18, 2013 (Incorporated by reference to Exhibit 10.37 to TVA’s Annual Report on Form 10-K for the year ended September 30, 2014, File No. 000-52313) |
| |
10.40† | Offer Letter to Sherry A. Quirk Accepted as of December 29, 2014 |
| |
10.41† | Deferral Agreement Between TVA and William D. Johnson Dated as of January 1, 2013 (Incorporated by reference to Exhibit 10.38 to TVA’s Annual Report on Form 10-K for the year ended September 30, 2014, File No. 000-52313) |
| |
10.42† | Deferral Agreement Between TVA and John M. Thomas, III, Dated as of September 27, 2010 (Incorporated by reference to Exhibit 10.40 to TVA’s Annual Report on Form 10-K for the year ended September 30, 2010, File No. 000-52313) |
| |
10.43† | Deferral Agreement Between TVA and John M. Thomas, III, Dated as of January 4, 2012 (Incorporated by reference to Exhibit 10.45 to TVA's Annual Report on Form 10-K for the year ended September 30, 2012, File No. 000-52313) |
| |
10.44† | Deferral Agreement Between TVA and John M. Thomas, III, Dated as of April 22, 2013 (Incorporated by reference to Exhibit 10.4 to TVA's Quarterly Report on Form 10-Q for the quarter ended June 30, 2013, File No. 000-52313) |
| |
10.45† | Deferral Agreement Between TVA and John M. Thomas, III, Dated as of February 27, 2014 (Incorporated by reference to Exhibit 10.43 to TVA’s Annual Report on Form 10-K for the year ended September 30, 2014, File No. 000-52313) |
| |
10.46† | Deferral Agreement Between TVA and Joseph P. Grimes, Jr., Dated as of September 5, 2013 (Incorporated by reference to Exhibit 10.45 to TVA’s Annual Report on Form 10-K for the year ended September 30, 2014, File No. 000-52313) |
| |
10.47† | Deferral Agreement Between TVA and Michael D. Skaggs Dated as of March 1, 2010 (Incorporated by reference to Exhibit 10.61 to TVA's Annual Report on Form 10-K for the year ended September 30, 2013, File No. 000-52313) |
| |
10.48† | Deferral Agreement Between TVA and Michael D. Skaggs Dated as of March 20, 2013 (Incorporated by reference to Exhibit 10.62 to TVA's Annual Report on Form 10-K for the year ended September 30, 2013, File No. 000-52313) |
| |
10.49† | Long-Term Retention Incentive Plan Award Notice for William D. Johnson for Award Granted as of November 10, 2014 (Incorporated by reference to Exhibit 10.1 to TVA's Quarterly Report on Form 10-Q for the quarter ended December 31, 2014, File No. 000-52313) |
| |
10.50† | Long-Term Retention Incentive Plan Award Notice for John M. Thomas, III, for First Award Granted as of January 1, 2015 (Incorporated by reference to Exhibit 10.2 to TVA's Quarterly Report on Form 10-Q for the quarter ended December 31, 2014, File No. 000-52313) |
| |
10.51† | Long-Term Retention Incentive Plan Award Notice for John M. Thomas, III, for Second Award Granted as of January 1, 2015 (Incorporated by reference to Exhibit 10.3 to TVA's Quarterly Report on Form 10-Q for the quarter ended December 31, 2014, File No. 000-52313) |
| |
10.52† | Long-Term Retention Incentive Plan Award Notice for Joseph P. Grimes, Jr., for Award Granted as of June 1, 2014 (Incorporated by reference to Exhibit 10.56 to TVA's Annual Report on Form 10-K for the year ended September 30, 2015, File No. 000-52313) |
| |
10.53† | Long-Term Retention Incentive Plan Award Notice for Joseph P. Grimes, Jr., for Award Granted as of January 1, 2015 (Incorporated by reference to Exhibit 10.5 to TVA's Quarterly Report on Form 10-Q for the quarter ended December 31, 2014, File No. 000-52313) |
| |
10.54† | Long-Term Retention Incentive Plan Award Notice for Michael D. Skaggs for Award Granted as of January 1, 2015 (Incorporated by reference to Exhibit 10.6 to TVA's Quarterly Report on Form 10-Q for the quarter ended December 31, 2014, File No. 000-52313) |
| |
10.55† | Retention Incentive Arrangement Between TVA and John M. Thomas, III, Dated as of January 1, 2015 (Incorporated by reference to Exhibit 10.7 to TVA's Quarterly Report on Form 10-Q for the quarter ended December 31, 2014, File No. 000-52313) |
| |
|
| |
14.1 | Disclosure and Financial Ethics Code (Incorporated by reference to Exhibit 14 to TVA’s Annual Report on Form 10-K for the year ended September 30, 2006, File No. 000-52313) |
| |
14.2 | TVA Conflict of Interest Policy, as amended (Incorporated by reference to Exhibit 14.2 to TVA’s Annual Report on Form 10-K for the year ended September 30, 2014, File No. 000-52313)
|
| |
31.1 | Rule 13a-14(a)/15d-14(a) Certification Executed by the Chief Executive Officer |
| |
31.2 | Rule 13a-14(a)/15d-14(a) Certification Executed by the Chief Financial Officer |
| |
32.1 | Section 1350 Certification Executed by the Chief Executive Officer |
| |
32.2 | Section 1350 Certification Executed by the Chief Financial Officer |
| |
101.INS | TVA XBRL Instance Document |
| |
101.SCH | TVA XBRL Taxonomy Extension Schema |
| |
101.CAL | TVA XBRL Taxonomy Extension Calculation Linkbase |
| |
101.DEF | TVA XBRL Taxonomy Extension Definition Linkbase |
| |
101.LAB | TVA XBRL Taxonomy Extension Label Linkbase |
| |
101.PRE | TVA XBRL Taxonomy Extension Presentation Linkbase |
| |
† Management contract or compensatory arrangement.
* Certain schedule(s) and/or exhibit(s) have been omitted. TVA hereby undertakes to furnish supplementally copies of any of the omitted schedules and/or exhibits upon request by the Securities and Exchange Commission.
|
SIGNATURES
Pursuant to the requirements of Section 13, 15(d), or 37 of the Securities Exchange Act of 1934, the registrant has duly caused this report to be signed on its behalf by the undersigned, thereunto duly authorized.
|
| | | |
Date: | November 14, 2017 | | TENNESSEE VALLEY AUTHORITY |
| | | (Registrant) |
| | By: | /s/ William D. Johnson |
| | | William D. Johnson |
| | | President and Chief Executive Officer |
SIGNATURES
Pursuant to the requirements of the Securities Exchange Act of 1934, this report has been signed below by the following persons on behalf of the registrant and in the capacities and on the dates indicated.
|
| | |
Signature | Title | Date |
| | |
| | |
| | |
/s/ William D. Johnson | President and Chief Executive Officer | November 14, 2017 |
William D. Johnson | (Principal Executive Officer) | |
| | |
| | |
/s/ John M. Thomas, III | Executive Vice President and | November 14, 2017 |
John M. Thomas, III | Chief Financial Officer | |
| (Principal Financial Officer) | |
| | |
/s/ Diane Wear | Vice President and Controller | November 14, 2017 |
Diane Wear | (Principal Accounting Officer) | |
| | |
| | |
/s/ Marilyn A. Brown | Director | November 14, 2017 |
Marilyn A. Brown | | |
| | |
| | |
/s/ V. Lynn Evans | Director | November 14, 2017 |
V. Lynn Evans | | |
| | |
| | |
/s/ Richard C. Howorth | Director | November 14, 2017 |
Richard C. Howorth | | |
| | |
| | |
/s/ Virginia T. Lodge | Director | November 14, 2017 |
Virginia T. Lodge | | |
| | |
| | |
/s/ Eric M. Satz | Director | November 14, 2017 |
Eric M. Satz | | |
| | |
| | |
/s/ Ronald A. Walter | Director | November 14, 2017 |
Ronald A. Walter | | |
EXHIBIT INDEX
|
| |
Exhibit No. | Description |
3.1 | |
| |
3.2 | Bylaws of the Tennessee Valley Authority Adopted by the TVA Board of Directors on May 18, 2006, as amended on April 3, 2008, May 19, 2008, June 10, 2010, February 13, 2014, August 21, 2014, and November 6, 2014 (Incorporated by reference to Exhibit 3.2 to TVA’s Annual Report on Form 10-K for the year ended September 30, 2014, File No. 000-52313) |
| |
4.1 | |
| |
10.1 | $1,000,000,000 Spring Maturity Credit Agreement Dated as of June 25, 2012, Among TVA, The Bank of New York Mellon as Administrative Agent, Letter of Credit Issuer, and a Lender, Bank of America, N.A., Canadian Imperial Bank of Commerce, New York Agency, First Tennessee Bank National Association, Morgan Stanley Bank, N.A., and Toronto Dominion (New York) LLC (Incorporated by reference to Exhibit 10.1 to TVA's Current Report on Form 8-K filed on June 28, 2012, File No. 000-52313) |
| |
10.2 | Amendment Dated as of December 12, 2012, to $1,000,000,000 Spring Maturity Credit Agreement Dated as of June 25, 2012, Among TVA, The Bank of New York Mellon as Administrative Agent, Letter of Credit Issuer, and a Lender, Bank of America, N.A., Canadian Imperial Bank of Commerce, New York Agency, First Tennessee Bank National Association, Morgan Stanley Bank, N.A., and Toronto Dominion (New York) LLC (Incorporated by reference to Exhibit 10.2 to TVA's Current Report on Form 8-K filed on December 17, 2012, File No. 000-52313) |
| |
10.3 | Second Amendment Dated as of June 2, 2015, to $1,000,000,000 Spring Maturity Credit Agreement Dated as of June 25, 2012, and amended as of December 12, 2012, Among TVA, The Bank of New York Mellon as Administrative Agent, Letter of Credit Issuer, and a Lender, Bank of America, N.A., Canadian Imperial Bank of Commerce, New York Agency, First Tennessee Bank National Association, Morgan Stanley Bank, N.A., and Toronto Dominion (New York) LLC (Incorporated by reference to Exhibit 10.1 to TVA's Current Report on Form 8-K filed on June 5, 2015, File No. 000-52313) |
| |
10.4 | $1,000,000,000 September 2020 Maturity Credit Agreement Dated as of September 30, 2015, Among TVA, Royal Bank of Canada, as Administrative Agent, Letter of Credit Issuer, and a Lender, Barclays Bank PLC, BNP Paribas, Branch Banking and Trust Company, Mizuho Bank Ltd, Regions Bank, SunTrust Bank, and Wells Fargo Bank, National Association (Incorporated by reference to Exhibit 10.1 to TVA's Current Report on Form 8-K filed on October 5, 2015, File No. 000-52313) |
| |
10.5 | $500,000,000 February 2020 Maturity Credit Agreement Dated as of August 7, 2015, Among TVA, Bank of America, N.A., as Administrative Agent, Letter of Credit Issuer, and a Lender, and the Other Lenders Party Thereto (Incorporated by reference to Exhibit 10.1 to TVA's Current Report on Form 8-K filed on August 7, 2015,March 3, 2017, File No. 000-52313) |
| |
| 10.6 | FirstSecond Amendment Dated as of February 28, 2017,21, 2018, to the $500,000,000 February 2020 Maturity Credit Agreement Dated as of August 7, 2015, Amongand Amended as of February 28, 2017, among TVA, Bank of America, N.A., as Administrative Agent, Letter of Credit Issuer, and a Lender, and the Other Lenders Party Thereto (Incorporated by Referencereference to Exhibit 10.1 to TVA's Current Report on Form 8-K filed on February 26, 2018, File No. 000-52313) |
| |
| | | | | |
| 10.7 | Third Amendment Dated as of February 27, 2020, to the $500,000,000 February Maturity Credit Agreement Dated as of August 7, 2015, and Amended as of February 28, 2017, and February 21, 2018, among TVA, Bank of America, N.A., as Administrative Agent, Letter of Credit Issuer, and a Lender, and the Other Lenders Party Thereto (Incorporated by reference to Exhibit 10.1 to TVA's Current Report on Form 8-K filed on March 3, 2017,2020, File No. 000-52313) |
| |
10.710.8 | December 2019 Maturity Community Bank Credit Agreement Dated as of December 12, 2016, with SunTrust Bank as Administrative Agent and a Lender, Branch Banking and Trust Company as Letter of Credit Issuer and a Lender, First National Bank, First Tennessee Bank National Association, HomeTrust Bank, Pinnacle Bank, Regions Bank, Trustmark National Bank, and United Community Bank (Incorporated by Referencereference to Exhibit 10.1 to TVA's Current Report on Form 8-K filed on December 15, 2016, File No. 000-52313) |
| |
10.810.9 | |
| |
| 10.10 | |
| |
| 10.11 | |
|
10.910.12 | Electronotes® Selling Agent Agreement Dated as of June 1, 2006, Among TVA, LaSalle Financial Services, Inc., A.G. Edwards & Sons, Inc., Citigroup Global Markets Inc., Edward D. Jones & Co., L.P., First Tennessee Bank National Association, J.J.B. Hilliard, W.L. Lyons, Inc., Merrill Lynch, Pierce, Fenner & Smith Incorporated, Morgan Stanley & Co. Incorporated, and Wachovia Securities, LLC (Incorporated by reference to Exhibit 10.4 to TVA’sTVA's Annual Report on Form 10-K for the year ended September 30, 2006, File No. 000-52313) |
| |
10.1010.13 | Amendment Dated as of December 4, 2013, to Electronotes® Selling Agent Agreement Dated as of June 1, 2006, Among TVA, LaSalle Financial Services, Inc., A.G. Edwards & Sons, Inc., Citigroup Global Markets Inc., Edward D. Jones & Co., L.P., First Tennessee Bank National Association, J.J.B. Hilliard, W.L. Lyons, Inc., Merrill Lynch, Pierce, Fenner & Smith Incorporated, Morgan Stanley & Co. Incorporated, and Wachovia Securities, LLC (Incorporated by reference to Exhibit 10.3 to TVA’sTVA's Quarterly Report on Form 10-Q for the quarter ended March 31, 2014, File No. 000-52313) |
| |
|
| |
10.1110.14 | Second Amendment Dated as of August 28, 2015, to Electronotes® Selling Agent Agreement Dated as of June 1, 2006, and Amended as of December 4, 2013, Among TVA, LaSalle Financial Services, Inc., A.G. Edwards & Sons, Inc., Citigroup Global Markets Inc., Edward D. Jones & Co., L.P., First Tennessee Bank National Association, J.J.B. Hilliard, W.L. Lyons, Inc., Merrill Lynch, Pierce, Fenner & Smith Incorporated, Morgan Stanley & Co. Incorporated, and Wachovia Securities, LLC (Incorporated by reference to Exhibit 10.9 to TVA's Annual Report on Form 10-K for the year ended September 30, 2015, File No. 000-52313) |
| |
10.1210.15 | Assumption Agreement Between TVA and Incapital LLC Dated as of February 29, 2008, Relating to the Electronotes® Selling Agent Agreement Dated as of June 1, 2006, Among TVA, LaSalle Financial Services, Inc., A.G. Edwards & Sons, Inc., Citigroup Global Markets Inc., Edward D. Jones & Co., L.P., First Tennessee Bank National Association, J.J.B. Hilliard, W.L. Lyons, Inc., Merrill Lynch, Pierce, Fenner & Smith Incorporated, Morgan Stanley & Co. Incorporated, and Wachovia Securities, LLC (Incorporated by reference to Exhibit 10.1 to TVA’sTVA's Quarterly Report on Form 10-Q for the quarter ended March 31, 2008, File No. 000-52313) |
| |
10.1310.16 | |
| |
10.1410.17 | |
| |
10.1510.18 | |
| |
10.1610.19 | |
| |
10.1710.20 | |
| |
| | | | | |
10.1810.21* | Participation Agreement Dated as of September 22, 2003, Among (1) TVA, (2) NVG Network I Statutory Trust, (3) Wells Fargo Delaware Trust Company, Not in Its Individual Capacity, Except to the Extent Expressly Provided in the Participation Agreement, But as Owner Trustee, (4) Wachovia Mortgage Corporation, (5) Wilmington Trust Company, Not in Its Individual Capacity, Except to the Extent Expressly Provided in the Participation Agreement, But as Lease Indenture Trustee, and (6) Wilmington Trust Company, Not in Its Individual Capacity, Except to the Extent Expressly Provided in the Participation Agreement, But as Pass Through Trustee (Incorporated by reference to Exhibit 10.10 to TVA's Annual Report on Form 10-K for the year ended September 30, 2006, File No. 000-52313) |
| |
10.19*10.22* | |
| |
10.20*10.23* | |
| |
10.21*10.24* | |
| |
10.2210.25 | |
| |
10.2310.26 | |
| |
10.24*10.27* | |
| |
10.2510.28 | |
|
| |
| |
10.2610.29 | |
| |
10.27*10.30* | |
| |
10.28*10.31* | Consent Decree Among Alabama, Kentucky, North Carolina, Tennessee, the Alabama Department of Environmental Management, the National Parks Conservation Association, Inc., the Sierra Club, Our Children's Earth Foundation, and TVA (Incorporated by reference to Exhibit 10.3 to TVA's Quarterly Report on Form 10-Q for the quarter ended June 30, 2011, File No. 000-52313) |
| |
10.29† | |
| |
| 10.32† | |
| |
10.30†10.33† | |
| |
10.31†10.34† | |
| |
10.32†10.35† | |
| |
10.33† | |
| |
10.34† | |
| |
10.35† | |
| |
| 10.36† | |
| |
| 10.37† | |
| |
| | | | | |
| 10.38† | |
| |
10.38†10.39† | |
| |
10.39† | |
| |
10.40† | |
| |
10.41† | |
| |
10.42† | |
| |
10.43† | |
| |
10.44† | |
| |
|
| |
10.45†10.40† | |
| |
10.46† | |
| |
10.47† | |
| |
10.48† | |
| |
10.49† | |
| |
10.50† | |
| |
10.51†10.41† | |
| |
| 10.42† | |
| |
| 10.43† | |
| |
10.52†14.1 | |
| |
10.53† | |
| |
10.54† | |
| |
10.55† | |
| |
14.1 | |
| |
| 14.2 | |
| |
| 31.1 | |
| |
| 31.2 | |
| |
| 32.1 | |
| |
| 32.2 | |
| |
| 101.INS | TVAInline XBRL Instance Document - the instance document does not appear in the Interactive Data File because its XBRL tags are embedded within the Inline XBRL document |
| |
| 101.SCH | TVAInline XBRL Taxonomy Extension Schema |
| |
101.CAL | TVA XBRL Taxonomy Extension Calculation Linkbase |
| |
|
| |
101.DEF101.CAL | TVAInline XBRL Taxonomy Extension Calculation Linkbase |
| |
| 101.DEF | Inline XBRL Taxonomy Extension Definition Linkbase |
| |
| 101.LAB | TVAInline XBRL Taxonomy Extension Label Linkbase |
| |
| 101.PRE | TVAInline XBRL Taxonomy Extension Presentation Linkbase |
| |
| 104 | Cover Page Interactive Data File - formatted in Inline XBRL and contained in Exhibit 101 |
† Management contract or compensatory arrangement. * Certain schedule(s) and/or exhibit(s) have been omitted. TVA hereby undertakes to furnish supplementally copies of any of the omitted schedules and/or exhibits upon request by the Securities and Exchange Commission. |
ITEM 16. FORM 10-K SUMMARY
Not applicable.
SIGNATURES
Pursuant to the requirements of Section 13, 15(d), or 37 of the Securities Exchange Act of 1934, the registrant has duly caused this report to be signed on its behalf by the undersigned, thereunto duly authorized.
| | | | | | | | | | | |
| Date: | November 12, 2021 | | TENNESSEE VALLEY AUTHORITY |
| | | (Registrant) |
| | By: | /s/ Jeffrey J. Lyash |
| | | Jeffrey J. Lyash |
| | | President and Chief Executive Officer |
SIGNATURES
Pursuant to the requirements of the Securities Exchange Act of 1934, this report has been signed below by the following persons on behalf of the registrant and in the capacities and on the dates indicated.
| | | | | | | | |
| Signature | Title | Date |
| | |
| | |
| | |
| /s/ Jeffrey J. Lyash | President and Chief Executive Officer | November 12, 2021 |
| Jeffrey J. Lyash | (Principal Executive Officer) | |
| | |
| | |
| /s/ John M. Thomas, III | Executive Vice President and | November 12, 2021 |
| John M. Thomas, III | Chief Financial and Strategy Officer | |
| (Principal Financial Officer) | |
| | |
| /s/ Diane Wear | Vice President and Controller | November 12, 2021 |
| Diane Wear | (Principal Accounting Officer) | |
| | |
| | |
| /s/ William B. Kilbride | Chair | November 12, 2021 |
| William B. Kilbride | | |
| | |
| | |
| /s/ Kenneth E. Allen | Director | November 12, 2021 |
| Kenneth E. Allen | | |
| | |
| | |
| /s/ A.D. Frazier | Director | November 12, 2021 |
| A. D. Frazier | | |
| | |
| | |
| /s/ Beth Harwell | Director | November 12, 2021 |
| Beth Harwell | | |
| | |
| | |
| /s/ Brian Noland | Director | November 12, 2021 |
| Brian Noland | | |
| | |
| | |
| /s/ John L. Ryder | Director | November 12, 2021 |
| John L. Ryder | | |
| | |
| | |
| /s/ Jeff W. Smith | Director | November 12, 2021 |
| Jeff W. Smith | | |
| | |
| | |
| | |
| | |
| | |
| | |
| | |
| | |
| | |
| | |
| | |
| | |
| | |